Attached files
| file | filename |
|---|---|
| EX-99.1 - EXHIBIT 99.1 - PETROQUEST ENERGY INC | exhibit991123117.htm |
| EX-32.2 - EXHIBIT 32.2 - PETROQUEST ENERGY INC | exhibit322123117.htm |
| EX-32.1 - EXHIBIT 32.1 - PETROQUEST ENERGY INC | exhibit321123117.htm |
| EX-31.2 - EXHIBIT 31.2 - PETROQUEST ENERGY INC | exhibit312123117.htm |
| EX-31.1 - EXHIBIT 31.1 - PETROQUEST ENERGY INC | exhibit311123117.htm |
| EX-23.2 - EXHIBIT 23.2 - PETROQUEST ENERGY INC | exhibit232123117.htm |
| EX-23.1 - EXHIBIT 23.1 - PETROQUEST ENERGY INC | exhibit231123117.htm |
| EX-21.1 - EXHIBIT 21.1 - PETROQUEST ENERGY INC | exhibit211123117.htm |
| EX-14.1 - EXHIBIT 14.1 - PETROQUEST ENERGY INC | exhibit141codeofbusinessco.htm |
| EX-10.28 - EXHIBIT 10.28 - PETROQUEST ENERGY INC | exhibit1028leaseacquisitio.htm |
UNITED STATES
SECURITIES AND EXCHANGE COMMISSION
Washington, D.C. 20549
FORM 10-K
(Mark One)
ý | Annual Report Pursuant to Section 13 or 15(d) of the Securities Exchange Act of 1934 |
For the fiscal year ended December 31, 2017
or
Transition Report Pursuant to Section 13 or 15(d) of the Securities Exchange Act of 1934 | |
For the transition period from to
Commission File Number: 001-32681
PETROQUEST ENERGY, INC.
(Exact name of registrant as specified in its charter)
Delaware | 72-1440714 | |
State of incorporation: | I.R.S. Employer Identification No. | |
400 E. Kaliste Saloom Road, Suite 6000
Lafayette, Louisiana 70508
(Address of principal executive offices) (Zip Code)
Registrant’s telephone number, including area code: (337) 232-7028
Securities registered pursuant to Section 12(b) of the Act:
Title of each class | Name of each exchange on which registered | |
Common Stock, par value $.001 per share | New York Stock Exchange | |
Securities registered pursuant to Section 12 (g) of the Act:
None
Indicate by check mark if the registrant is a well-known seasoned issuer, as defined in Rule 405 of the Securities Act.
¨ Yes ý No
Indicate by check mark if the registrant is not required to file reports pursuant to Section 13 or Section 15(d) of the Act.
¨ Yes ý No
Indicate by check mark whether the registrant: (1) has filed all reports required to be filed by Section 13 or 15(d) of the Securities Exchange Act of 1934 during the preceding 12 months (or for such shorter period that the registrant was required to file such reports), and (2) has been subject to such filing requirements for the past 90 days.
ý Yes ¨ No
Indicate by check mark whether the registrant has submitted electronically and posted on its corporate Web site, if any, every Interactive Data File required to be submitted and posted pursuant to Rule 405 of Regulation S-T (§ 232.405 of this chapter) during the preceding 12 months (or for such shorter period that the registrant was required to submit and post such files).
ý Yes ¨ No
Indicate by check mark if disclosure of delinquent filers pursuant to Item 405 of Regulation S-K is not contained herein, and will not be contained, to the best of registrant’s knowledge, in definitive proxy or information statements incorporated by reference in Part III of this Form 10-K or any amendment to this Form 10-K. x
Indicate by check mark whether the registrant is a large accelerated filer, an accelerated filer, a non-accelerated filer, a smaller reporting company, or emerging growth company. See the definitions of “large accelerated filer”, “accelerated filer” and “smaller reporting company” and "emerging growth company" in Rule 12b-2 of the Exchange Act.
Large accelerated filer | ¨¨ | Accelerated filer | ¨ | |||
Non-accelerated filer | ¨ | (Do not check if a smaller reporting company) | Smaller reporting company | x | ||
Emerging growth company | ¨ | |||||
If an emerging growth company, indicate by check mark if the registrant has elected not to use the extended transition period for complying with any new or revised financial accounting standards provided pursuant to Section 13(a) of the Exchange Act. ¨
Indicate by check mark whether the registrant is a shell company (as defined in Rule 12b-2 of the Act).
¨ Yes ý No
The aggregate market value of the voting common equity held by non-affiliates of the registrant as of June 30, 2017, based on the $1.98 per share closing price for the registrant's Common Stock, par value $.001 per share, as quoted on the New York Stock Exchange, was approximately $38,595,000 (for purposes of this disclosure, the registrant assumed its directors and executive officers were affiliates).
As of February 28, 2018, the registrant had outstanding 25,587,441 shares of Common Stock, par value $.001 per share.
Document incorporated by reference: portions of the definitive Proxy Statement of PetroQuest Energy, Inc. to be filed pursuant to Regulation 14A under the Securities Exchange Act of 1934 with respect to the Annual Meeting of Stockholders to be held on May16, 2018, which are incorporated by reference into Part III of this Form 10-K.
Table of Contents
Page No. | |
PART I | |
PART II | |
PART III | |
PART IV | |
#2#
CAUTIONARY NOTE REGARDING FORWARD-LOOKING STATEMENTS
This Annual Report on Form 10-K (this "Form 10-K") contains “forward-looking statements” within the meaning of Section 27A of the Securities Act of 1933, as amended (the “Securities Act”), and Section 21E of the Securities Exchange Act of 1934, as amended (the “Exchange Act”). All statements other than statements of historical facts included in and incorporated by reference into this Form 10-K are forward looking statements. These forward-looking statements are subject to certain risks, trends and uncertainties that could cause actual results to differ materially from those projected.
Among those risks, trends and uncertainties are:
• | the volatility of oil and natural gas prices; |
• | our indebtedness and the significant amount of cash required to service our indebtedness; |
• | our ability to obtain adequate financing when the need arises to execute our long-term strategy and to fund our planned capital expenditures; |
• | limits on our growth and our ability to finance our operations, fund our capital needs and respond to changing conditions imposed by the Multidraw Term Loan Agreement (as defined below) and restrictive debt covenants; |
• | the effects of a financial downturn or negative credit market conditions on our liquidity, business and financial condition; |
• | losses or limits on potential gains resulting from hedging production; |
• | our responsibility for offshore decommissioning liabilities for offshore interests we no longer own; |
• | our ability to receive a refund of our cash deposits posted as collateral to support certain of the bonds that satisfy our offshore decommissioning obligations; |
• | our ability to find, develop, produce and acquire additional oil and natural gas reserves that are economically recoverable; |
• | approximately 51% of our production being exposed to the additional risk of severe weather, including hurricanes and tropical storms, as well as flooding, coastal erosion and sea level rise; |
• | our ability to successfully develop our inventory of undeveloped acreage; |
• | the possibility of a substantial lease renewal cost or the loss of our leases and prospective drilling opportunities that could result from a failure to drill sufficient wells to hold our undeveloped acreage; |
• | Securities and Exchange Commission (sometimes referred to herein as the "SEC") rules that could limit our ability to book proved undeveloped reserves in the future; |
• | the likelihood that our actual production, revenues and expenditures related to our reserves will differ from our estimates of proved reserves; |
• | our ability to identify, execute or efficiently integrate future acquisitions; |
• | the loss of key management or technical personnel; |
• | losses and liabilities from uninsured or underinsured drilling and operating activities; |
• | ceiling test write-downs resulting, and that could result in the future, from lower oil and natural gas prices; |
• | our ability to market our oil and natural gas production; |
• | changes in laws and governmental regulations and increases in insurance costs or decreases in insurance availability directed toward our business; |
#3#
• | regulatory initiatives relating to oil and natural gas development, hydraulic fracturing, and derivatives; |
• | proposed changes to U.S. tax laws; |
• | competition from larger oil and natural gas companies; |
• | the operating hazards attendant to the oil and gas business; |
• | governmental regulation relating to environmental compliance costs and environmental liabilities; |
• | the operation and profitability of non-operated properties; |
• | potential conflicts of interest resulting from ownership of working interests and overriding royalty interests in certain of our properties by our officers and directors; |
• | the impact of potential cybersecurity threats: |
• | the loss of our information and computer systems; |
• | the impact of terrorist activities on global economies; |
• | putative class action lawsuits that may result in substantial expenditures and divert management's attention; |
• | the volatility of our stock price; |
• | our ability to meet the continued listing standards of the New York Stock Exchange with respect to our common stock or to cure any deficiency with respect thereto; and |
• | the restrictions on our ability to pay dividends with respect to our Series B Preferred Stock and the resulting right of the holders of our Series B Preferred Stock with respect to our management. |
Although we believe that the expectations reflected in these forward-looking statements are reasonable, we cannot assure you that such expectations reflected in these forward looking statements will prove to have been correct.
When used in this Form 10-K, the words “expect,” “anticipate,” “intend,” “plan,” “believe,” “seek,” “estimate” and similar expressions are intended to identify forward-looking statements, although not all forward-looking statements contain these identifying words. Because these forward-looking statements involve risks and uncertainties, actual results could differ materially from those expressed or implied by these forward-looking statements for a number of important reasons, including those discussed under “Management’s Discussion and Analysis of Financial Condition and Results of Operations,” “Risk Factors” and elsewhere in this Form 10-K.
You should read these statements carefully because they discuss our expectations about our future performance, contain projections of our future operating results or our future financial condition, or state other “forward-looking” information. You should be aware that the occurrence of any of the events described under “Management’s Discussion and Analysis of Financial Condition and Results of Operations,” “Risk Factors” and elsewhere in this Form 10-K could substantially harm our business, results of operations and financial condition and that upon the occurrence of any of these events, the trading price of our common stock could decline, and you could lose all or part of your investment.
We cannot guarantee any future results, levels of activity, performance or achievements. Except as required by law, we undertake no obligation to update any of the forward-looking statements in this Form 10-K after the date of this Form 10-K.
As used in this Form 10-K, the words “we,” “our,” “us,” “PetroQuest” and the “Company” refer to PetroQuest Energy, Inc., its predecessors and subsidiaries, except as otherwise specified. We have provided definitions for some of the oil and natural gas industry terms used in this Form 10-K in “Glossary of Certain Oil and Natural Gas Terms” beginning on page 56.
#4#
Part I
Item 1 and 2. | Business and Properties Items |
Overview
PetroQuest Energy, Inc. is an independent oil and gas company incorporated in the State of Delaware with primary operations in Texas and Louisiana. We seek to grow our production, proved reserves, cash flow and earnings at low finding and development costs through a balanced mix of exploration, development and acquisition activities. From the commencement of our operations through 2002, we were focused exclusively in the Gulf Coast Basin with onshore properties principally in southern Louisiana and offshore properties in the shallow waters of the Gulf of Mexico shelf. During 2003, we began the implementation of our strategic goal of diversifying our reserves and production into longer life and lower risk onshore properties with our acquisition of the Carthage Field in East Texas. From 2005 through 2015, we further implemented this strategy by focusing our efforts in the Woodford Shale play in Oklahoma. In response to lower commodity prices and to strengthen our balance sheet, we sold all of our Oklahoma assets in three transactions that closed in June 2015, April 2016 and October 2016 (the "Oklahoma Divestitures"). See Note 2 - Acquisitions and Divestitures. In December 2017, we acquired approximately 24,600 gross acres in central Louisiana targeting the Austin Chalk to attempt to increase our oil production and reserves. During January 2018, we sold all of our Gulf of Mexico assets to further reduce our liabilities and strengthen our liquidity position.
Our liquidity position has been negatively impacted by the prolonged decline in commodity prices that began in late 2014. In response, we executed the following actions aimed at preserving liquidity, reducing overall debt levels and extending debt maturities:
• | Completed the Oklahoma Divestitures for $292.6 million; |
• | Completed two debt exchanges to extend maturities on a significant portion of debt; |
• | Reduced total debt 29% from $425 million at December 31, 2014 to $302.6 million at December 31, 2017; |
• | Entered into a new $50 million Multidraw Term Loan Agreement (as defined below) maturing in 2020; and |
• | Significantly reduced our capital expenditures in 2016 and secured a new drilling joint venture in East Texas to facilitate the restart of drilling operations at the end of 2016. |
In addition to extending the maturity on approximately $113.0 million of debt due in 2017 to 2021, our September 2016 debt exchange permitted us to reduce our cash interest expense on our 2021 PIK Notes (as defined below) from 10% cash to 1% cash and 9% payment-in-kind for the first three semi-annual interest payments ending with the February 2018 interest payment, which provided us with approximately $31.6 million of cash interest savings during 2017 and 2018. To enhance our liquidity and provide capital to address the 10% Senior Notes due 2017 (the "2017 Notes") remaining outstanding after our debt exchanges, in October 2016, we entered into a new $50 million Multidraw Term Loan Agreement (the "Multidraw Term Loan Agreement") maturing in 2020, replacing our prior bank credit facility, which had no borrowing base on the date of termination. In March 2017, we utilized borrowings under this Multidraw Term Loan Agreement and cash on hand to redeem the remaining 2017 Notes.
Oil and gas prices realized in 2017 were more favorable than those realized in 2016. Stated on an Mcfe basis, unit prices received during the year ended December 31, 2017 were 38% higher than the prices received during the year ended December 31, 2016. During the first quarter of 2017, we recompleted our Thunder Bayou well in South Louisiana into a larger sand package and continued drilling under our East Texas joint venture drilling program, which commenced at the end of 2016. Under the drilling program, we drilled ten gross wells during 2017 of which eight were completed as of December 31, 2017. The remaining two wells were completed during the first quarter of 2018. As a result of our successful recompletion and drilling operations during 2017, we grew production and estimated proved reserves significantly during 2017 as compared to 2016. Our average daily production during the year ended December 31, 2017 increased 17% over average daily production during the year ended December 31, 2016 and our estimated proved reserves at December 31, 2017 grew 35% from 2016.
Business Strategy
Preserve Our Liquidity and Strengthen Our Balance Sheet. In response to lower commodity prices we have executed various transactions, as highlighted above, aimed at preserving liquidity and improving our balance sheet. We strive to consistently fund our capital expenditures with a combination of cash flow from operations, proceeds from asset sales and joint venture arrangements rather than increasing our total debt. Because we operate approximately 82% of our total estimated proved reserves
#5#
and manage the drilling and completion activities on an additional 3% of such reserves, we expect to be able to control the timing of a substantial portion of our capital investments. As we did during 2017, we plan to continue to monetize non-core assets to provide incremental liquidity and to utilize certain joint venture arrangements to reduce our share of drilling capital. Additionally, we plan to maintain our commodity hedging program, as in prior years, to reduce our exposure to commodity price volatility.
Pursue Balanced Growth and Portfolio Mix. We plan to pursue a risk-balanced approach to the growth and stability of our reserves, production, cash flows and earnings. Our goal is to weight our capital allocation to lower risk development activities and reduce the capital allocated to higher risk exploration activities. Through our ongoing portfolio diversification efforts, at December 31, 2017, approximately 84% of our estimated proved reserves were located in longer life and lower risk basins in East Texas and 16% were located in the shorter life, but higher flow rate reservoirs in the Gulf Coast Basin. In terms of production diversification, during 2017, 37% of our production was derived from longer life basins. Our 2017 production was comprised of 71% natural gas, 13% oil and 16% natural gas liquids. We believe that the development of our recently acquired Austin Chalk acreage in central Louisiana, will allow us to meet our goal of having a more balanced commodity profile as these assets are believed to have a greater percentage of oil production than our East Texas assets.
Focus Capital Toward More Predictable Onshore Assets. As a result of the sale of our Gulf of Mexico assets in January 2018, our asset base is now exclusively comprised of onshore assets in Texas and Louisiana. We plan to continue to focus the majority of our capital spending developing our lower-risk Cotton Valley acreage in East Texas where we believe the less complex geology, combined with the large inventory of offsetting vertical and horizontal well data, offers greater predictability in increasing production and proved reserves. Since beginning horizontal drilling operations in the Carthage Field, we have a 100% five year drilling success rate on 22 gross wells drilled. Additionally, our East Texas acreage position provides a significant inventory of future drilling locations, which we expect to develop over a long-term drilling campaign. We also expect to drill our initial well in our recently acquired Austin Chalk acreage in 2018, where we have substantial geologic and reservoir data from a multitude of vertical and horizontal wells in the area. We plan to apply our latest drilling and completion techniques to consistently improve the economic development of our resource potential.
Concentrate in Core Operating Areas and Build Scale. With the sale of our Gulf of Mexico assets, we have substantially reduced our operational footprint allowing us to concentrate our efforts in fewer areas. We plan to focus on our operations in East Texas and our recently acquired Austin Chalk acreage. We also expect to continue to harvest cash flow from our Gulf Coast producing assets as they are expected to require minimal capital expenditures. Operating in concentrated areas helps to better control our overhead by enabling us to manage a greater amount of acreage with fewer employees and minimize incremental costs of increased drilling and production. We have substantial geological and reservoir data, operating experience and partner relationships in these regions. We believe that these factors, combined with the existing infrastructure and favorable geologic conditions with multiple known oil and gas producing reservoirs in these regions, will provide us with attractive investment opportunities.
2017 Financial and Operational Summary
During 2017, we invested $59.4 million in exploratory, development and acquisition activities. We drilled 6 gross development wells and 2 gross exploratory wells, realizing an overall success rate of 100%. These activities were financed through cash on hand, asset sale proceeds and our cash flow from operations. Additionally, we acquired approximately 24,600 gross acres in central Louisiana targeting the Austin Chalk formation for approximately $9.3 million and the issuance of 2.0 million shares of common stock. During 2017, our production increased 17% to 27.6 Bcfe as a result of the recompletion of our Thunder Bayou well in South Louisiana into a larger sand package and continued drilling under our East Texas joint venture drilling program. Our estimated proved reserves at December 31, 2017 increased 35% from 2016 as discussed in greater detail below.
Oil and Gas Reserves
Our estimated proved reserves at December 31, 2017 increased 35% from 2016 totaling 1.8 MMBbls of oil, 19.4 Bcfe of natural gas liquids (Ngls) and 125.4 Bcf of natural gas. At December 31, 2017, our standardized measure of our discounted cash flows, which includes the estimated impact of future income taxes, totaled $127.3 million. We had a pre-tax present value, discounted at 10%, of the estimated future net revenues based on 12-month, first day of month, average prices during 2017 (“PV-10”) of $127.3 million. The increase in reserves was the result of 73.9 Bcfe added due to our drilling program in East Texas where we drilled eight gross wells during 2017. In response to low ethane prices, during 2017 we elected to bypass ethane processing on a portion of our East Texas production. As a result, we reduced our estimated proved Ngl reserves to reflect the assumption that ethane would continue to not be recovered as natural gas liquids. Overall, we had a 100% drilling success rate during 2017.
#6#
See the reconciliation of standardized measure of discounted cash flows to PV-10 below. Our standardized measure of discounted cash flows and PV-10 utilized prices (adjusted for field differentials) for the years ended December 31, 2017 and 2016 as follows:
12/31/2017 | 12/31/2016 | |
Oil per Bbl | $52.46 | $40.85 |
Natural gas per Mcf | $3.03 | $2.40 |
Ngl per Mcfe | $3.23 | $1.82 |
Ryder Scott Company, L.P., a nationally recognized independent petroleum engineering firm, prepared the estimates of our proved reserves and future net cash flows (and present value thereof) attributable to such proved reserves at December 31, 2017. Our internal reservoir engineering staff is managed by an individual with over 35 years of industry experience as a reservoir and production engineer, including fifteen years as a reservoir engineering manager with PetroQuest. This individual is responsible for overseeing the estimates prepared by Ryder Scott.
Our internal controls that are used in our reserve estimation process are designed to provide reasonable assurance that our reserve estimates are computed and reported in accordance with SEC rules and regulations and generally accepted accounting principles ("GAAP"). These internal controls are regularly tested in connection with our annual assessment of internal controls over financial reporting and include:
•Utilizing documented process workflows;
•Employing qualified professional engineering, geological, land, financial and marketing personnel; and
•Providing continuing education and training for all personnel involved in our reserve estimation process.
Each quarter, our Reservoir Engineering Manager presents the status of the changes to our reserve estimates to our executive team, including our Chief Executive Officer. These reserve estimates are then presented to our Board of Directors in connection with quarterly meetings. In addition, our reserve booking policies and procedures are reviewed annually by one of the members of our Board of Directors with technical experience, acting on behalf of our Audit Committee.
With respect to proved undeveloped reserves (“PUD reserves”), we maintain a five year development plan that is updated and approved annually by our PUD Review Committee (as described below) with input from our executive team and asset managers and reviewed quarterly by our executive team and asset managers. Our development plan includes only PUDs that we are reasonably certain will be drilled within five years of booking based upon qualitative and quantitative factors including estimated risk-based returns, current pricing forecasts, recent drilling results, availability of services, equipment and personnel, seasonal weather patterns and changes in drilling and completion techniques and technology. Our PUD reserves are based upon our substantial basin-specific technical and operating experience relative to the location of the reserves. Over the last five years, we have realized a 100% drilling success rate on 22 gross wells drilled in East Texas where 100% of our PUD reserves are currently booked. Furthermore, because all of our PUD reserves are direct offsetting locations to producing wells, we have comprehensive data available, which enables us to forecast economic results, including drilling and operating costs, with reasonable certainty.
Our PUD Review Committee (the “Committee”) is comprised of our Executive Vice President of Operations, Chief Financial Officer and Reservoir Engineering Manager and meets annually in connection with each year-end reserve report. The Committee is responsible for reviewing all PUD locations, not only in terms of technical and financial merits as reviewed by our independent petroleum engineering firm, but also to apply a robust evaluation of the timing and reasonable certainty of the development plan in light of all known circumstances including our budget, the outlook for commodity prices and the location of ongoing drilling programs. The Committee’s evaluation of reasonable certainty of the development plan includes a thorough assessment of near term drilling plans to develop PUDs, a review of adherence to previously adopted development plans and a review of historical PUD conversion rates.
The following table sets forth certain information about our estimated proved reserves as of December 31, 2017:
Oil (MBbls) | NGL (Mmcfe) | Natural Gas (Mmcf) | Total Mmcfe* | |||||||||
Proved Developed | 1,078 | 12,564 | 57,409 | 76,441 | ||||||||
Proved Undeveloped | 770 | 6,857 | 68,029 | 79,506 | ||||||||
Total Proved | 1,848 | 19,421 | 125,438 | 155,947 | ||||||||
* | Oil conversion to Mcfe at one Bbl of crude oil, condensate or natural gas liquids to six Mcf of natural gas. |
#7#
As of December 31, 2017, our PUD reserves totaled 79.5 Bcfe, a 66% increase from our PUD reserves at December 31, 2016. During 2017, we spent $9.8 million converting 13.8 Bcfe of PUD reserves at December 31, 2016 to proved developed reserves at December 31, 2017.
The following table presents an analysis of the change in our PUD reserves from December 31, 2016 to December 31, 2017:
MMcfe | ||
PUD reserve balance at December 31, 2016 | 47,787 | |
Conversions to proved developed | (13,778 | ) |
Additions from extensions, discoveries and revisions | 46,784 | |
Divestitures | (1,287 | ) |
PUD reserve balance at December 31, 2017 | 79,506 | |
During 2017, we added 46.8 Bcfe of PUD reserves as a result of the success of our 2017 East Texas drilling program. Our 2017 drilling program was concentrated in a particular area of our acreage, which enabled us to book multiple PUD locations as offsets to producing horizontal wells. All of our PUD reserves at December 31, 2017 were associated with the future development of our East Texas properties. We expect all of our PUD reserves at December 31, 2017 to be developed over the next five years. However, our PUD reserve inventory does not encompass all drilling activities over the next five years. For example, during 2017 we converted 17.6 Bcfe of reserves that were classified as probable reserves at December 31, 2016 to proved developed producing at December 31, 2017. These properties are not included in the above table. We expect to continue to allocate capital to projects that do not have proved reserves ascribed to them. At December 31, 2017, we had no PUD reserves booked for longer than five years. Estimated future costs related to the development of PUD reserves are expected to total $4.2 million in 2018, $14.2 million in 2019, $11.3 million in 2020 and $58.4 million in 2022. During 2018, we expect to convert approximately 6.5 Bcfe of PUDs at December 31, 2017 to proved developed reserves.
The estimated cash flows from our proved reserves at December 31, 2017 were as follows:
Proved Developed (M$) | Proved Undeveloped (M$) | Total Proved (M$) | ||||||||||
Estimated pre-tax future net cash flows (1) | $ | 124,313 | $ | 102,313 | $ | 226,626 | ||||||
Discounted pre-tax future net cash flows (PV-10) (1) | $ | 95,794 | $ | 31,503 | $ | 127,297 | ||||||
Total standardized measure of discounted future net cash flows | $ | 127,297 | ||||||||||
(1) | Estimated pre-tax future net cash flows and discounted pre-tax future net cash flows (PV-10) are non-GAAP measures because they exclude income tax effects. Management believes these non-GAAP measures are useful to investors as they are based on prices, costs and discount factors that are consistent from company to company, while the standardized measure of discounted future net cash flows is dependent on the unique tax situation of each individual company. As a result, the Company believes that investors can use these non-GAAP measures as a basis for comparison of the relative size and value of the Company’s reserves to other companies. The Company also understands that securities analysts and rating agencies use these non-GAAP measures in similar ways. |
The following table reconciles undiscounted and discounted future net cash flows to standardized measure of discounted cash flows as of December 31, 2017:
Total Proved (M$) | |||
Estimated pre-tax future net cash flows | $ | 226,626 | |
10% annual discount | 99,329 | ||
Discounted pre-tax future net cash flows | 127,297 | ||
Future income taxes discounted at 10% | — | ||
Standardized Measure of discounted future net cash flows | $ | 127,297 | |
We have not filed any reports with other federal agencies that contain an estimate of total proved net oil and gas reserves.
#8#
Core Areas
The following table sets forth estimated proved reserves and annual production from each of our core areas (in Bcfe) for the years ended December 31, 2017 and 2016.
2017 | 2016 | |||||||||||
Reserves | Production | Reserves | Production | |||||||||
Gulf Coast | 13.8 | 10.6 | 16.3 | 6.9 | ||||||||
Gulf of Mexico (1) | 10.5 | 6.9 | 16.6 | 5.9 | ||||||||
East Texas | 131.6 | 10.1 | 82.6 | 9.0 | ||||||||
Oklahoma Woodford (2) | — | — | — | 1.7 | ||||||||
155.9 | 27.6 | 115.5 | 23.5 | |||||||||
(1) In January 2018, we sold all of our Gulf of Mexico assets.
(2) In April and October 2016, we sold the remainder of our Oklahoma assets.
East Texas
During 2017, we invested $36.4 million in our East Texas properties where we drilled eight gross wells, achieving a 100% success rate. Net production from our East Texas assets averaged 27.7 MMcfe per day during 2017, a 12% increase from 2016 average daily production, and our estimated proved reserves increased 59% from 2016 due to our drilling program.
Gulf Coast
During 2017, we invested $16.1 million in this core area, including the acquisition of Austin Chalk acreage in central Louisiana. Production from this area increased 54% from 2016 totaling 28.9 MMcfe per day in 2017 due to the recompletion of our Thunder Bayou well into a larger sand package partially offset by normal production declines in the Gulf Coast area. Our estimated proved reserves in this area at year end 2017 decreased 15% from 2016 primarily as a result of the 10.6 Bcfe of production in 2017.
Gulf of Mexico
During 2017, we invested $7.1 million in this area. Production from this area increased 18% from 2016 totaling 19.0 MMcfe per day in 2017 due primarily to the recompletion of a well in our Ship Shoal 72 field. Our estimated proved reserves in this area at year end 2017 decreased 37% from 2016 primarily as a result of the 6.9 Bcfe of production in 2017. We sold our Gulf of Mexico assets in January of 2018 (See Note 2 - Acquisitions and Divestitures).
Markets and Customers
We sell our oil and natural gas production under fixed or floating market contracts. Customers purchase all of our oil and natural gas production at current market prices. The terms of the arrangements generally require customers to pay us within 30 days after the production month ends. As a result, if the customers were to default on their payment obligations to us, near-term earnings and cash flows would be adversely affected. However, due to the availability of other markets and pipeline connections, we do not believe that the loss of these customers or any other single customer would adversely affect our ability to market production. Our ability to market oil and natural gas from our wells depends upon numerous factors beyond our control, including:
• | the extent of domestic production and imports of oil and natural gas; |
• | the proximity of the natural gas production to pipelines; |
• | the availability of capacity in such pipelines; |
• | the demand for oil and natural gas by utilities and other end users; |
• | the availability of alternative fuel sources; |
• | the effects of inclement weather; |
• | state and federal regulation of oil and natural gas production; and |
• | federal regulation of gas sold or transported in interstate commerce. |
#9#
We cannot assure you that we will be able to market all of the oil or natural gas we produce or that favorable prices can be obtained for the oil and natural gas we produce.
A portion of the natural gas production that we operate in East Texas is committed to a minimum volumetric delivery contract with a third party pipeline company. Under the terms of the agreement, we are required to deliver 8.0 Bcf of natural gas during 2018 and 11.0 Bcf in each of the twelve-month periods ended December 31, 2019, 2020 and 2021, respectively. Based upon our projected drilling plans, current estimated proved developed reserves and production, we expect that this commitment will be met.
In view of the many uncertainties affecting the supply and demand for oil, natural gas and refined petroleum products, we are unable to predict future oil and natural gas prices and demand or the overall effect such prices and demand will have on the Company. During 2017, one customer accounted for 29% and one accounted for 24% of our oil and natural gas revenue. During 2016, one customer accounted for 23%, one accounted for 17%, one accounted for 14% and one accounted for 10% of our oil and natural gas revenue. During 2015, one customer accounted for 21%, one accounted for 18%, one accounted for 17% and one accounted for 10% of our oil and natural gas revenue. These percentages do not consider the effects of commodity hedges. We do not believe that the loss of any of our oil or natural gas purchasers would have a material adverse effect on our operations due to the availability of other purchasers.
#10#
Production, Pricing and Production Cost Data
The following table sets forth our production, pricing and production cost data during the periods indicated. Our core area of East Texas represented approximately 84% of our total estimated proved reserves at December 31, 2017. The Gulf Coast and Gulf of Mexico areas each represented less than 10% of our total estimated proved reserves at December 31, 2017, but each represented 25% or more of our total production for the year ended December 31, 2017.
Year Ended December 31, | ||||||||||||
2017 | 2016 | 2015 | ||||||||||
Production: | ||||||||||||
Oil (Bbls): | ||||||||||||
Gulf Coast | 235,639 | 127,344 | 158,867 | |||||||||
Gulf of Mexico | 304,384 | 336,559 | 314,979 | |||||||||
East Texas | 51,529 | 38,154 | 50,739 | |||||||||
Other (3) | 6 | 144 | 3,944 | |||||||||
Total Oil (Bbls) | 591,558 | 502,201 | 528,529 | |||||||||
Gas (Mcf): | ||||||||||||
Gulf Coast | 7,352,273 | 5,075,444 | 5,237,692 | |||||||||
Gulf of Mexico | 4,644,749 | 3,521,044 | 4,183,339 | |||||||||
East Texas | 7,617,452 | 6,350,712 | 7,838,144 | |||||||||
Other (3) | (3,510 | ) | 1,669,378 | 8,242,676 | ||||||||
Total Gas (Mcf) | 19,610,964 | 16,616,578 | 25,501,851 | |||||||||
NGL (Mcfe): | ||||||||||||
Gulf Coast | 1,787,950 | 1,039,368 | 1,051,312 | |||||||||
Gulf of Mexico | 466,608 | 356,245 | 496,916 | |||||||||
East Texas | 2,198,165 | 2,471,936 | 2,946,185 | |||||||||
Other (3) | 94 | 3,398 | 992,826 | |||||||||
Total NGL (Mcfe) | 4,452,817 | 3,870,947 | 5,487,239 | |||||||||
Total Production (Mcfe): | ||||||||||||
Gulf Coast | 10,554,057 | 6,878,876 | 7,242,206 | |||||||||
Gulf of Mexico | 6,937,661 | 5,896,643 | 6,570,129 | |||||||||
East Texas | 10,124,791 | 9,051,572 | 11,088,763 | |||||||||
Other (3) | (3,380 | ) | 1,673,640 | 9,259,166 | ||||||||
Total Production (Mcfe) | 27,613,129 | 23,500,731 | 34,160,264 | |||||||||
Average sales prices (1): | ||||||||||||
Oil (per Bbl): | ||||||||||||
Gulf Coast | $ | 53.19 | $ | 40.91 | $ | 47.32 | ||||||
Gulf of Mexico | 52.63 | 41.41 | 49.75 | |||||||||
East Texas | 52.47 | 38.35 | 48.28 | |||||||||
Other (3) | 46.38 | 37.85 | 50.88 | |||||||||
Total Oil (per Bbl) | 52.84 | 41.05 | 48.89 | |||||||||
Gas (per Mcf) | ||||||||||||
Gulf Coast | 3.09 | 2.40 | 2.68 | |||||||||
Gulf of Mexico | 3.04 | 2.09 | 2.40 | |||||||||
East Texas | 2.97 | 2.31 | 2.63 | |||||||||
Other (3) | 2.29 | 1.17 | 1.75 | |||||||||
Total Gas (per Mcf) | 3.03 | 2.18 | 2.32 | |||||||||
NGL (per Mcfe) | ||||||||||||
Gulf Coast | 4.45 | 3.18 | 3.21 | |||||||||
Gulf of Mexico | 3.90 | 2.97 | 2.66 | |||||||||
East Texas | 2.88 | 1.50 | 1.94 | |||||||||
Other (3) | 3.63 | 5.22 | 3.49 | |||||||||
Total NGL (per Mcfe) | 3.62 | 2.09 | 2.53 | |||||||||
Total Per Mcfe: | ||||||||||||
Gulf Coast | 4.09 | 3.01 | 3.44 | |||||||||
Gulf of Mexico | 4.61 | 3.79 | 4.11 | |||||||||
East Texas | 3.12 | 2.19 | 2.60 | |||||||||
Other (3) | 2.20 | 1.18 | 1.96 | |||||||||
Total Per Mcfe | 3.87 | 2.76 | 2.89 | |||||||||
#11#
Average Production Cost per Mcfe (2): | ||||||||||||
Gulf Coast | 0.67 | 0.70 | 0.75 | |||||||||
Gulf of Mexico | 2.20 | 2.43 | 3.08 | |||||||||
East Texas | 1.08 | 0.89 | 0.90 | |||||||||
Other (3) | 11.55 | 0.80 | 0.48 | |||||||||
Total Average Production Cost per Mcfe | 1.20 | 1.21 | 1.17 | |||||||||
(1) | Does not include the effect of hedges. |
(2) | Production costs do not include production taxes. |
(3) | Includes Oklahoma-Woodford. |
Oil and Gas Producing Wells
The following table details the productive wells in which we owned an interest as of December 31, 2017:
Gross | Net | ||||
Productive Wells: | |||||
Oil: | |||||
Gulf Coast | 2 | 0.16 | |||
Gulf of Mexico | 12 | 8.15 | |||
East Texas | — | — | |||
14 | 8.31 | ||||
Gas: | |||||
Gulf Coast | 4 | 1.41 | |||
Gulf of Mexico | 10 | 7.23 | |||
East Texas | 84 | 52.57 | |||
98 | 61.21 | ||||
Total | 112 | 69.52 | |||
Of the 112 gross productive wells at December 31, 2017, one had a dual completion. All of the productive wells in the Gulf of Mexico were sold in January 2018.
#12#
Oil and Gas Drilling Activity
The following table sets forth the wells drilled and completed by us during the periods indicated. All wells were drilled in the continental United States.
2017 | 2016 | 2015 | ||||||||||||||||
Gross | Net | Gross | Net | Gross | Net | |||||||||||||
Exploration: | ||||||||||||||||||
Productive: | ||||||||||||||||||
Gulf Coast Basin | — | — | — | — | — | — | ||||||||||||
East Texas | 2 | 1.53 | — | — | 4 | 3.31 | ||||||||||||
Other (1) | — | — | — | — | 22 | 5.05 | ||||||||||||
2 | 1.53 | — | — | 26 | 8.36 | |||||||||||||
Non-productive: | ||||||||||||||||||
Gulf Coast Basin | — | — | — | — | 3 | 1.22 | ||||||||||||
East Texas | — | — | — | — | — | — | ||||||||||||
Other (1) | — | — | — | — | — | — | ||||||||||||
— | — | — | — | 3 | 1.22 | |||||||||||||
Total | 2 | 1.53 | — | — | 29 | 9.58 | ||||||||||||
Development: | ||||||||||||||||||
Productive: | ||||||||||||||||||
Gulf Coast Basin | — | — | — | — | — | — | ||||||||||||
East Texas | 6 | 4.33 | 1 | 0.81 | — | — | ||||||||||||
Other (1) | — | — | 4 | 0.02 | 27 | 4.30 | ||||||||||||
6 | 4.33 | 5 | 0.83 | 27 | 4.30 | |||||||||||||
Non-productive: | ||||||||||||||||||
Gulf Coast Basin | — | — | — | — | — | — | ||||||||||||
East Texas | — | — | — | — | — | — | ||||||||||||
Other (1) | — | — | — | — | — | — | ||||||||||||
— | — | — | — | — | — | |||||||||||||
Total | 6 | 4.33 | 5 | 0.83 | 27 | 4.30 | ||||||||||||
(1) Includes Oklahoma-Woodford.
At December 31, 2017, we had 2 gross (1.46 net) wells in progress.
Leasehold Acreage
The following table shows our approximate developed and undeveloped (gross and net) leasehold acreage as of December 31, 2017:
Leasehold Acreage | ||||||||||||
Developed | Undeveloped | |||||||||||
Gross | Net | Gross | Net | |||||||||
Louisiana | 4,378 | 1,462 | 24,724 | 19,752 | ||||||||
Texas | 41,442 | 21,380 | 11,371 | 7,337 | ||||||||
Federal Waters | 26,859 | 16,813 | 6,420 | 6,420 | ||||||||
Total | 72,679 | 39,655 | 42,515 | 33,509 | ||||||||
Leases covering 4% of our net undeveloped acreage are scheduled to expire in 2018, 4% in 2019, 60% in 2020 and 32% thereafter. At December 31, 2017, we do not have any PUD reserves attributed to acreage that has an expiration date preceding the scheduled date for initial development. Of the acreage subject to leases scheduled to expire during 2018, 99% relates to undeveloped acreage in the Carthage area in East Texas.
#13#
Title to Properties
Title to properties is subject to contractual arrangements customary in the oil and gas industry, liens for taxes not yet due and, in some instances, other encumbrances. We believe that such burdens do not materially detract from the value of properties or from the respective interests therein or materially interfere with their use in the operation of the business.
As is customary in the industry, other than a preliminary review of local records, little investigation of record title is made at the time of acquisitions of undeveloped properties. Investigations, which generally include a title opinion of outside counsel, are made prior to the consummation of an acquisition of producing properties and before commencement of drilling operations on undeveloped properties. Our properties are typically subject, in one degree or another, to one or more of the following:
• | royalties and other burdens and obligations, express or implied, under oil and gas leases; |
• | overriding royalties and other burdens created by us or our predecessors in title; |
• | a variety of contractual obligations (including, in some cases, development obligations) arising under operating agreements, farmout agreements, production sales contracts and other agreements that may affect the properties or their titles; |
• | back-ins and reversionary interests existing under purchase agreements and leasehold assignments; |
• | liens that arise in the normal course of operations, such as those for unpaid taxes, statutory liens securing obligations to unpaid suppliers and contractors and contractual liens under operating agreements; pooling, unitization and communitization agreements, declarations and orders; and |
• | easements, restrictions, rights-of-way and other matters that commonly affect property. |
To the extent that such burdens and obligations affect our rights to production revenues, they have been taken into account in calculating our net revenue interests and in estimating the size and value of our reserves. We believe that the burdens and obligations affecting our properties are conventional in the industry for properties of the kind that we own.
Federal Regulations
Sales and Transportation of Natural Gas. Historically, the transportation and sales for resale of natural gas in interstate commerce have been regulated pursuant to the Natural Gas Act of 1938 (“NGA”), the Natural Gas Policy Act of 1978 and the Federal Energy Regulatory Commission (“FERC”) regulations. Effective January 1, 1993, the Natural Gas Wellhead Decontrol Act deregulated the price for all “first sales” of natural gas. Thus, all of our sales of gas may be made at market prices, subject to applicable contract provisions. Sales of natural gas are affected by the availability, terms and cost of pipeline transportation. Since 1985, the FERC has implemented regulations intended to make natural gas transportation more accessible to gas buyers and sellers on an open-access, non-discriminatory basis. We cannot predict what further action the FERC will take on these matters. Some of the FERC's more recent proposals may, however, adversely affect the availability and reliability of interruptible transportation service on interstate pipelines. We do not believe that we will be affected by any action taken materially differently than other natural gas producers, gatherers and marketers with which we compete.
The Outer Continental Shelf Lands Act (the “OCSLA”), which was administered by the Bureau of Ocean Energy Management, Regulation and Enforcement (the “BOEMRE”) and, after October 1, 2011, its successors, the Bureau of Ocean Energy Management (the “BOEM”) the Bureau of Safety and Environmental Enforcement (the “BSEE”), and the FERC, requires that all pipelines operating on or across the shelf provide open-access, non-discriminatory service. There are currently no regulations implemented by the FERC under its OCSLA authority on gatherers and other entities outside the reach of its NGA jurisdiction. Therefore, we do not believe that any FERC, BOEM or BSEE action taken under OCSLA will affect us in a way that materially differs from the way it affects other natural gas producers, gatherers and marketers with which we compete.
Our natural gas sales are generally made at the prevailing market price at the time of sale. Therefore, even though we sell significant volumes to major purchasers, we believe that other purchasers would be willing to buy our natural gas at comparable market prices.
On August 8, 2005, the Energy Policy Act of 2005 (the “2005 EPA”) was signed into law. This comprehensive act contains many provisions that are intended to encourage oil and gas exploration and development in the U.S. The 2005 EPA directs the FERC, BOEM and other federal agencies to issue regulations that will further the goals set out in the 2005 EPA. The 2005 EPA amends the NGA to make it unlawful for “any entity”, including otherwise non-jurisdictional producers such as us, to use any deceptive or manipulative device or contrivance in connection with the purchase or sale of natural gas or the purchase or sale of
#14#
transportation services subject to regulation by the FERC, in contravention of rules prescribed by the FERC. On January 20, 2006, the FERC issued rules implementing this provision. The rules make it unlawful in connection with the purchase or sale of natural gas subject to the jurisdiction of the FERC, or the purchase or sale of transportation services subject to the jurisdiction of the FERC, for any entity, directly or indirectly, to use or employ any device, scheme or artifice to defraud; to make any untrue statement of material fact or omit to make any such statement necessary to make the statements made not misleading; or to engage in any act or practice that operates as a fraud or deceit upon any person. The new anti-manipulation rule does not apply to activities that relate only to intrastate or other non-jurisdictional sales or gathering, but does apply to activities of otherwise non-jurisdictional entities to the extent the activities are conducted “in connection with” gas sales, purchases or transportation subject to FERC jurisdiction. It therefore reflects a significant expansion of the FERC's enforcement authority. To date, we do not believe we have been, nor do we anticipate we will be affected any differently than other producers of natural gas.
In 2007, the FERC issued a final rule on annual natural gas transaction reporting requirements, as amended by subsequent orders on rehearing (“Order 704”). Under Order 704, wholesale buyers and sellers of more than 2.2 million MMBtu of physical natural gas in the previous calendar year, including interstate and intrastate natural gas pipelines, natural gas gatherers, natural gas processors and natural gas marketers are now required to report, on May 1 of each year, beginning in 2009, aggregate volumes of natural gas purchased or sold at wholesale in the prior calendar year to the extent such transactions utilize, contribute to, or may contribute to the formation of price indices. It is the responsibility of the reporting entity to determine which individual transactions should be reported based on the guidance of Order 704. The monitoring and reporting required by these rules have increased our administrative costs. To date, we do not believe we have been, nor do we anticipate that we will be affected any differently than other producers of natural gas.
Sales and Transportation of Crude Oil. The spot markets for oil, gas and natural gas liquids ("NGLs") are subject to volatility and supply and demand factors fluctuations. Our sales of crude oil, condensate and natural gas liquids are not currently regulated, and are subject to applicable contract provisions made at market prices and typically under short term agreements with third parties. Additionally, we may periodically enter into financial hedging arrangements or fixed-price contracts associated with a portion of our oil, gas or natural gas liquids production. In a number of instances, however, the ability to transport and sell such products is dependent on pipelines whose rates, terms and conditions of service are subject to the FERC's jurisdiction under the Interstate Commerce Act. In other instances, the ability to transport and sell such products is dependent on pipelines whose rates, terms and conditions of service are subject to regulation by state regulatory bodies under state statutes.
The regulation of pipelines that transport crude oil, condensate and natural gas liquids is generally more light-handed than the FERC's regulation of gas pipelines under the NGA. Regulated pipelines that transport crude oil, condensate, and natural gas liquids are subject to common carrier obligations that generally ensure non-discriminatory access. With respect to interstate pipeline transportation subject to regulation of the FERC under the Interstate Commerce Act, rates generally must be cost-based, although market-based rates or negotiated settlement rates are permitted in certain circumstances. Pursuant to FERC Order No. 561, pipeline rates are subject to an indexing methodology. Under this indexing methodology, pipeline rates are subject to changes in the Producer Price Index for Finished Goods, minus one percent. A pipeline can seek to increase its rates above index levels provided that the pipeline can establish that there is a substantial divergence between the actual costs experienced by the pipeline and the rate resulting from application of the index. A pipeline can seek to charge market based rates if it establishes that it lacks significant market power. In addition, a pipeline can establish rates pursuant to settlement if agreed upon by all current shippers. A pipeline can seek to establish initial rates for new services through a cost-of-service proceeding, a market-based rate proceeding, or through an agreement between the pipeline and at least one shipper not affiliated with the pipeline.
Federal Leases. We maintain operations located on federal oil and natural gas leases, which are administered by the BOEM or the BSEE, pursuant to the OCSLA. The BOEM handles offshore leasing, resource evaluation, review and administration of oil and gas exploration and development plans, renewable energy development, National Environmental Policy Act analysis and environmental studies, and the BSEE is responsible for the safety and enforcement functions of offshore oil and gas operations, including the development and enforcement of safety and environmental regulations, permitting of offshore exploration, development and production activities, inspections, offshore regulatory programs, oil spill response and newly formed training and environmental compliance programs. We are currently subject to regulations governing the plugging and abandonment of wells located offshore and the installation and removal of all production facilities, structures and pipelines, and the BOEM or the BSEE may in the future amend these regulations.
To cover the various obligations of lessees on the Outer Continental Shelf (the “OCS”), the BOEM generally requires that lessees have substantial net worth or post bonds or other acceptable assurances that such obligations will be satisfied. While we were exempt from such supplemental bonding requirements in the past, beginning in 2014 we were required to post supplemental bonding or alternate form of collateral for certain of our offshore properties. As a result, we engaged a number of surety companies to post the requisite bonds. Pursuant to the terms of our agreements with these surety companies, we have provided cash deposits of $10.7 million as collateral to support certain of the bonds that are issued on our behalf. As a result of the sale of our Gulf of
#15#
Mexico assets in January 2018, we expect to receive a refund of these cash deposits following the assumption of operatorship and the posting of bonds or other acceptable assurances with respect to these assets by the purchaser of the assets.
The Office of Natural Resources Revenue (the “ONRR”) in the U.S. Department of the Interior administers the collection of royalties under the terms of the OCSLA and the oil and natural gas leases issued thereunder. The amount of royalties due is based upon the terms of the oil and natural gas leases as well as the regulations promulgated by the ONRR.
Federal, State or American Indian Leases. In the event we conduct operations on federal, state or American Indian oil and gas leases, such operations must comply with numerous regulatory restrictions, including various nondiscrimination statutes, and certain of such operations must be conducted pursuant to certain on-site security regulations and other appropriate permits issued by the Bureau of Land Management (“BLM”) or the BOEM or other appropriate federal or state agencies.
The Mineral Leasing Act of 1920 (“Mineral Act”) prohibits direct or indirect ownership of any interest in federal onshore oil and gas leases by a foreign citizen of a country that denies “similar or like privileges” to citizens of the United States. Such restrictions on citizens of a “non-reciprocal” country include ownership of holding or controlling stock in a corporation that holds a federal onshore oil and gas lease. If this restriction is violated, the corporation's lease can be cancelled in a proceeding instituted by the United States Attorney General. Although the regulations of the BLM (which administers the Mineral Act) provide for agency designations of non-reciprocal countries, there are presently no such designations in effect. We own an interest in one federal onshore oil and gas lease. It is possible that holders of our equity interests may be citizens of foreign countries, which at some time in the future might be determined to be non-reciprocal under the Mineral Act.
State Regulations
Most states regulate the production and sale of oil and natural gas, including:
• | requirements for obtaining drilling permits; |
• | the method of developing new fields; |
• | the spacing and operation of wells; |
• | the prevention of waste of oil and gas resources; and |
• | the plugging and abandonment of wells. |
The rate of production may be regulated and the maximum daily production allowable from both oil and gas wells may be established on a market demand or conservation basis or both.
We may enter into agreements relating to the construction or operation of a pipeline system for the transportation of natural gas. To the extent that such gas is produced, transported and consumed wholly within one state, such operations may, in certain instances, be subject to the jurisdiction of such state’s administrative authority charged with the responsibility of regulating intrastate pipelines. In such event, the rates that we could charge for gas, the transportation of gas, and the construction and operation of such pipeline would be subject to the rules and regulations governing such matters, if any, of such administrative authority.
Legislative Proposals
In the past, Congress has been very active in the area of natural gas regulation. New legislative proposals in Congress and the various state legislatures, if enacted, could significantly affect the petroleum industry. At the present time it is impossible to predict what proposals, if any, might actually be enacted by Congress or the various state legislatures and what effect, if any, such proposals might have on our operations.
Environmental Regulations
General. Our activities are subject to existing federal, state and local laws and regulations governing environmental quality and pollution control. Although no assurances can be made, we believe that, absent the occurrence of an extraordinary event, compliance with existing federal, state and local laws and rules regulating the release of materials into the environment or otherwise relating to the protection of human health, safety and the environment will not have a material effect upon our capital expenditures, earnings or competitive position with respect to our existing assets and operations. We cannot predict what effect additional regulation or legislation, enforcement policies, and claims for damages to property, employees, other persons and the environment resulting from our operations could have on our activities.
#16#
Our activities with respect to exploration and production of oil and natural gas, including the drilling of wells and the operation and construction of pipelines and other facilities for extracting, transporting or storing natural gas and other petroleum products, are subject to stringent environmental regulation by state and federal authorities, including the United States Environmental Protection Agency (the “USEPA”). Such regulation can increase the cost of planning, designing, installing and operating such facilities. Although we believe that compliance with environmental regulations will not have a material adverse effect on us, risks of substantial costs and liabilities are inherent in oil and gas production operations, and there can be no assurance that significant costs and liabilities will not be incurred. Moreover it is possible that other developments, such as spills or other unanticipated releases, stricter environmental laws and regulations, and claims for damages to property or persons resulting from oil and gas production, would result in substantial costs and liabilities to us.
Solid and Hazardous Waste. We own or lease numerous properties that have been used for production of oil and gas for many years. Although we have utilized operating and disposal practices standard in the industry at the time, hydrocarbons or solid wastes may have been disposed or released on or under these properties. In addition, many of these properties have been operated by third parties that controlled the treatment of hydrocarbons or solid wastes and the manner in which such substances may have been disposed or released. State and federal laws applicable to oil and gas wastes and properties have gradually become stricter over time. Under these laws, we could be required to remove or remediate previously disposed wastes (including wastes disposed or released by prior owners or operators) or property contamination (including groundwater contamination by prior owners or operators) or to perform remedial plugging operations to prevent future contamination.
Wastes, including hazardous wastes, are subject to regulation under the federal Resource Conservation and Recovery Act (“RCRA”) and state statutes. Much of the waste we generate in our operations at exploration and production sites, including hazardous waste, is exempt from regulation under RCRA, but generally remains subject to state storage, treatment and disposal requirements. We also generate wastes exempt from RCRA requirements. The USEPA has limited the disposal options for certain hazardous wastes. It is possible that certain wastes generated by our oil and gas operations which are currently exempt from regulation under RCRA as “hazardous wastes” may in the future be designated as “hazardous wastes” under RCRA or other applicable statutes, and therefore be subject to more rigorous and costly disposal requirements.
Naturally Occurring Radioactive Materials (“NORM”) are radioactive materials which precipitate on production equipment or area soils during oil and natural gas extraction or processing. NORM wastes are regulated under the RCRA framework, although such wastes may qualify for the oil and gas hazardous waste exclusion. Primary responsibility for NORM regulation has been a state function. Standards have been developed for worker protection; treatment, storage and disposal of NORM waste; management of waste piles, containers and tanks; and limitations upon the release of NORM-contaminated land for unrestricted use. We believe that our operations are in material compliance with all applicable NORM standards.
Superfund. The Comprehensive Environmental Response, Compensation and Liability Act (“CERCLA”), also known as the “Superfund” law, imposes liability, without regard to fault or the legality of the original conduct, on certain persons with respect to the release or threatened release of a “hazardous substance” into the environment. Liable persons under CERCLA include the owner and operator of a site and persons that disposed or arranged for the disposal of hazardous substances at a site. CERCLA also authorizes the USEPA and, in some cases, third parties to take actions in response to threats to the public health or the environment and to seek to recover from the responsible persons the costs of such action. State statutes impose similar liability.
Under CERCLA, the term “hazardous substance” does not include “petroleum, including crude oil or any fraction thereof,” unless specifically listed or designated and the term does not include natural gas, natural gas liquids, liquefied natural gas, or synthetic gas usable for fuel. While this “petroleum exclusion” lessens the significance of CERCLA to our operations, we may generate waste that may fall within CERCLA's definition of a “hazardous substance” in the course of our ordinary operations. We also currently own or lease properties that for many years have been used for the exploration and production of oil and natural gas. Although we and, to our knowledge, our predecessors have used operating and disposal practices that were standard in the industry at the time, “hazardous substances” may have been disposed or released on, under or from the properties owned or leased by us or on, under or from other locations where these wastes have been taken for disposal. At this time, we do not believe that we have any liability associated with any Superfund site, and we have not been notified of any claim, liability or damages under CERCLA.
Endangered Species Act. Federal and state legislation including, in particular, the federal Endangered Species Act of 1973 (“ESA”), impose requirements to protect imperiled species from extinction by conserving and protecting threatened and endangered species and the habitat upon which they depend. With specified exceptions, the ESA prohibits the “taking,” including killing, harassing or harming, of any listed threatened or endangered species, as well as any degradation or destruction of its habitat. In addition, the ESA mandates that federal agencies carry out programs for conservation of listed species. Many state laws similarly protect threatened and endangered species and their habitat. We operate in areas in which listed species may be present. As a result, we may be required to adopt protective measures, obtain incidental take permits, and otherwise adjust our drilling plans to comply with ESA requirements.
#17#
Oil Pollution Act. The Oil Pollution Act of 1990 (the “OPA”) and regulations thereunder impose a variety of requirements on “responsible parties” related to the prevention of oil spills and liability for damages resulting from such spills in United States waters. A “responsible party” includes the owner or operator of a facility or vessel, or the lessee or permittee of the area in which an offshore facility is located. The OPA assigns liability to each responsible party for oil removal costs and a variety of public and private damages. While liability limits apply in some circumstances, a party cannot take advantage of liability limits if the spill was caused by gross negligence or willful misconduct or resulted from violation of federal safety, construction or operating regulations. If the party fails to report a spill or to cooperate fully in the cleanup, liability limits likewise do not apply. Few defenses exist to the liability imposed by the OPA.
The OPA establishes a liability limit for onshore facilities of $633.85 million and for offshore facilities of all removal costs plus $133.65 million, and lesser limits for some vessels depending upon their size. The regulations promulgated under OPA impose proof of financial responsibility requirements that can be satisfied through insurance, guarantee, indemnity, surety bond, letter of credit, qualification as a self-insurer, or a combination thereof. The amount of financial responsibility required depends upon a variety of factors including the type of facility or vessel, its size, storage capacity, oil throughput, proximity to sensitive areas, type of oil handled, history of discharges and other factors. We carry insurance coverage to meet these obligations, which we believe is customary for comparable companies in our industry. A failure to comply with OPA's requirements or inadequate cooperation during a spill response action may subject a responsible party to civil or criminal enforcement actions.
We are not aware of the occurrence of any action or event that would subject us to liability under OPA, and we believe that compliance with OPA's financial responsibility and other operating requirements will not have a material adverse effect on us.
Discharges. The Clean Water Act (“CWA”) regulates the discharge of pollutants to waters of the United States, including wetlands, and requires a permit for the discharge of pollutants, including petroleum, to such waters. The CWA also requires a permit for the discharge of dredged or fill material into wetlands. A revised regulatory definition of “Waters of the United States” ("WOTUS") that would expand requirements for CWA permitting, was promulgated in 2015, but these regulations were stayed pending the outcome of judicial challenges. A delay in implementation of the 2015 definition of WOTUS to February 2020 was finalized in a February 2018 rulemaking to provide time for the federal agencies to reconsider the regulatory definition of WOTUS and whether that definition should be expanded or modified. Certain facilities that store or otherwise handle oil are required to prepare and implement Spill Prevention, Control and Countermeasure Plans and Facility Response Plans relating to the possible discharge of oil to surface waters. We are required to prepare and comply with such plans and to obtain and comply with discharge permits. We believe we are in substantial compliance with these requirements and that any noncompliance would not have a material adverse effect on us. The CWA also prohibits spills of oil and hazardous substances to waters of the United States in excess of levels set by regulations and imposes liability in the event of a spill. State laws further provide civil and criminal penalties and liabilities for spills to both surface and groundwaters and require permits that set limits on discharges to such waters.
Hydraulic Fracturing. Our exploration and production activities may involve the use of hydraulic fracturing techniques to stimulate wells and maximize natural gas production. Citing concerns over the potential for hydraulic fracturing to impact drinking water, human health and the environment, and in response to a Congressional directive, the USEPA commissioned a study to identify potential risks associated with hydraulic fracturing and to improve scientific understanding to guide USEPA’s regulatory oversight, guidance and, where appropriate, rulemaking related to hydraulic fracturing. A final report for this study was released in December 2016 and provided information regarding potential vulnerability of drinking water resources to hydraulic fracturing, but did not reach conclusions regarding the frequency or severity of impacts due to data gaps and uncertainties. Some states now regulate utilization of hydraulic fracturing and others are in the process of developing, or are considering development of, such rules to address the potential for drinking water impacts, induced seismicity, and other concerns. In several localities and in New York, use of hydraulic fracturing has been banned, although local fracking bans are prohibited in Texas and Louisiana, which currently address hydraulic fracturing concerns by requiring disclosures of the content of fluids used in the process. Our drilling activities could be subjected to new or enhanced federal, state and/or local requirements governing hydraulic fracturing.
Air Emissions. Our operations are subject to local, state and federal regulations for the control of emissions from sources of air pollution. Administrative enforcement actions for failure to comply strictly with air regulations or permits may be resolved by payment of monetary fines and correction of any identified deficiencies. Alternatively, regulatory agencies could impose civil or criminal liability for non-compliance. An agency could require us to forego construction or operation of certain air emission sources. We believe that we are in substantial compliance with air pollution control requirements.
According to certain scientific studies, emissions of carbon dioxide, methane, nitrous oxide and other gases commonly known as greenhouse gases (“GHG”) may be contributing to global warming of the earth's atmosphere and to global climate change. In response to the scientific studies, legislative and regulatory initiatives have been underway to limit GHG emissions. The U.S. Supreme Court determined that GHG emissions fall within the federal Clean Air Act (“CAA”) definition of an “air pollutant”, and in response the USEPA promulgated an endangerment finding paving the way for regulation of GHG emissions under the CAA. The USEPA has also promulgated rules requiring large sources to report their GHG emissions. Sources subject
#18#
to these reporting requirements include on- and offshore petroleum and natural gas production and onshore natural gas processing and distribution facilities that emit 25,000 metric tons or more of carbon dioxide equivalent per year in aggregate emissions from all site sources. We are not subject to GHG reporting requirements. In addition, the USEPA promulgated rules that significantly increase the GHG emission threshold that would identify major stationary sources of GHG subject to CAA permitting programs. As currently written and based on current Company operations, we are not subject to federal GHG permitting requirements. Regulation of GHG emissions is developing and highly controversial, and further regulatory, legislative and judicial developments may occur and may affect how these GHG initiatives will impact the Company. Due to the uncertainties surrounding the regulation of and other risks associated with GHG emissions, the Company cannot predict the financial impact of related developments on the Company.
The USEPA has promulgated rules to limit air emissions from many hydraulically fractured natural gas wells. These regulations require use of equipment to capture gases that come from the well during the drilling process, mandate tighter standards for emissions associated with gas production, storage and transport, and seek to limit flaring. Such regulations have been highly controversial, have been challenged, and their future is uncertain. While such requirements would be expected to increase the cost of natural gas production, we do not anticipate that we will be affected any differently than other producers of natural gas.
Coastal Coordination. There are various federal and state programs that regulate the conservation and development of coastal resources. The federal Coastal Zone Management Act (“CZMA”) was passed to preserve and, where possible, restore the natural resources of the Nation's coastal zone. The CZMA provides for federal grants for state management programs that regulate land use, water use and coastal development.
The Louisiana Coastal Zone Management Program (“LCZMP”) was established to protect, develop and, where feasible, restore and enhance coastal resources of the state. Under the LCZMP, coastal use permits are required for certain activities, even if the activity only partially infringes on the coastal zone. Among other things, projects involving use of state lands and water bottoms, dredge or fill activities that intersect with more than one body of water, mineral activities, including the exploration and production of oil and gas, and pipelines for the gathering, transportation or transmission of oil, gas and other minerals require such permits. General permits, which entail a reduced administrative burden, are available for a number of routine oil and gas activities. The LCZMP and its requirement to obtain coastal use permits may result in additional permitting requirements and associated project schedule constraints.
The Texas Coastal Coordination Act (“CCA”) provides for coordination among local and state authorities to protect coastal resources through regulating land use, water, and coastal development and establishes the Texas Coastal Management Program that applies in the nineteen counties that border the Gulf of Mexico and its tidal bays. The CCA provides for the review of state and federal agency rules and agency actions for consistency with the goals and policies of the Coastal Management Plan. This review may affect agency permitting and may add a further regulatory layer to some of our projects.
OSHA. We are subject to the requirements of the federal Occupational Safety and Health Act (“OSHA”) and comparable state statutes. The OSHA hazard communication standard, the USEPA community right-to-know regulations under Title III of the federal Superfund Amendments and Reauthorization Act, and similar state statutes require us to organize and/or disclose information about hazardous materials used or produced in our operations. Certain of this information must be provided to employees, state and local governmental authorities and local citizens.
Management believes that we are in substantial compliance with current applicable environmental laws and regulations described above and that continued compliance with existing requirements will not have a material adverse impact on us.
Corporate Offices
Our headquarters are located in Lafayette, Louisiana, in approximately 46,600 square feet of leased space, with an exploration office in The Woodlands, Texas in approximately 13,100 square feet of leased space. We also maintain owned or leased field offices in the areas of the major fields in which we operate properties or have a significant interest. Replacement of any of our leased offices would not result in material expenditures by us as alternative locations to our leased space are anticipated to be readily available.
Employees
We had 65 full-time employees as of February 20, 2018. In addition to our full time employees, we utilize the services of independent contractors to perform certain functions. We believe that our relationships with our employees are satisfactory. None of our employees are covered by a collective bargaining agreement.
Available Information
We make available free of charge, or through the “Investors—SEC Documents” section of our website at www.petroquest.com, access to our annual reports on Form 10-K, quarterly reports on Form 10-Q, current reports on Form 8-K,
#19#
and amendments to those reports filed or furnished pursuant to Section 13(a) or 15(d) of the Exchange Act as soon as reasonably practicable after such material is filed or furnished to the Securities and Exchange Commission. Our Code of Business Conduct and Ethics, our Corporate Governance Guidelines and the charters of our Audit, Compensation and Nominating and Corporate Governance Committees are also available through the “Investors—Corporate Governance” section of our website or in print to any stockholder who requests them.
Item 1A. | Risk Factors |
Risks Related to Our Business, Industry and Strategy
Oil and natural gas prices are volatile and an extended decline in the prices of oil and natural gas would likely have a material adverse effect on our financial condition, liquidity, ability to meet our financial obligations and results of operations.
Our future financial condition, revenues, results of operations, profitability and future growth, and the carrying value of our oil and natural gas properties depend primarily on the prices we receive for our oil and natural gas production. Our ability to maintain or increase our borrowing capacity and to obtain additional capital on attractive terms also substantially depends upon oil and natural gas prices. These markets will likely continue to be volatile in the future. The prices we will receive for our production, and the levels of our production, will depend on numerous factors beyond our control.
These factors include:
• | relatively minor changes in the supply of or the demand for oil and natural gas; |
• | the condition of the United States and worldwide economies; |
• | the level of global exploration and production; |
• | the level of global inventories; |
• | market uncertainty; |
• | the level of consumer product demand; |
• | prevailing prices on local price indices in the areas in which we operate; |
• | the proximity, capacity, cost and availability of gathering and transportation facilities; |
• | weather conditions in the United States, such as hurricanes; |
• | technological advances affecting energy companies; |
• | the actions of the Organization of Petroleum Exporting Countries; |
• | domestic and foreign governmental regulation and taxes, including price controls adopted by the FERC; |
• | political conditions or hostilities in oil and natural gas producing regions, including the Middle East, Africa, South America and Russia; |
• | the effect of worldwide energy conservation and environmental protection efforts; |
• | shareholder activism and activities by non-governmental organizations to restrict the exploration, development and production of oil and natural gas so as to minimize emissions of greenhouse gas; |
• | the price and level of foreign imports of oil and natural gas; and |
• | the price and availability of alternate energy sources. |
We cannot predict future oil and natural gas prices and such prices may decline further. The extended decline in oil and natural gas prices has, and may continue to, adversely affect our financial condition, liquidity, ability to meet our financial obligations and results of operations. Lower prices have reduced and may further reduce the amount of oil and natural gas that we can produce
#20#
economically and has required and may require us to record additional ceiling test write-downs and may cause our estimated proved reserves at December 31, 2018 to decline compared to our estimated proved reserves at December 31, 2017. Substantially all of our oil and natural gas sales are made in the spot market or pursuant to contracts based on spot market prices.
Our sales are not made pursuant to long-term fixed price contracts. To attempt to reduce our price risk, we periodically enter into hedging transactions with respect to a portion of our expected future production; however in the current commodity price market, our ability to enter into effective hedging transactions may be limited. We cannot assure you that we can enter into effective hedging transactions in the future or that such transactions will reduce the risk or minimize the effect of any decline in oil or natural gas prices. Any substantial or extended decline in the prices of or demand for oil or natural gas would have a material adverse effect on our financial condition, liquidity, ability to meet our financial obligations and results of operations.
Our outstanding indebtedness may adversely affect our cash flow and our ability to operate our business, remain in compliance with debt covenants and make payments on our debt.
The aggregate principal amount of our outstanding indebtedness, net of cash on hand, as of December 31, 2017 was $293.7 million. We currently have $20 million of additional availability under the Multidraw Term Loan Agreement, subject to compliance with the covenants contained therein. We may also incur additional indebtedness in the future. Our high level of debt could have important consequences for you, including the following:
• | it may be more difficult for us to satisfy our obligations with respect to our outstanding indebtedness, including our 10% Second Lien Senior Secured Notes due 2021 (the "2021 Notes"), our 10% Second Lien Senior Secured PIK Notes due 2021 (the "2021 PIK Notes") and amounts borrowed under the Multidraw Term Loan Agreement, and any failure to comply with the obligations of any of our debt agreements, including financial and other restrictive covenants, could result in an event of default under the agreements governing such indebtedness; |
• | the covenants contained in our debt agreements limit our ability to borrow money in the future for acquisitions, capital expenditures or to meet our operating expenses or other general corporate obligations and may limit our flexibility in operating our business; |
• | we will need to use a substantial portion of our cash flows to pay interest on our debt, including approximately $16.0 million in 2018 for interest on our 2021 Notes and 2021 PIK Notes alone, and to pay quarterly dividends (which we suspended beginning with the dividend payment due in April 2016), if permissible under the terms of our debt agreements and declared by our Board of Directors, on our 6.875% Series B Cumulative Convertible Perpetual Preferred Stock (the "Series B Preferred Stock") of approximately $5.1 million per year, which will reduce the amount of money we have for operations, capital expenditures, expansion, acquisitions or general corporate or other business activities; |
• | we may have a higher level of debt than some of our competitors, which may put us at a competitive disadvantage; |
• | we may be more vulnerable to economic downturns and adverse developments in our industry or the economy in general, especially extended or further declines in oil and natural gas prices; and |
• | our debt level could limit our flexibility in planning for, or reacting to, changes in our business and the industry in which we operate. |
Our ability to meet our expenses and debt obligations will depend on our future performance, which will be affected by financial, business, economic, regulatory and other factors. We will not be able to control many of these factors, such as economic conditions and governmental regulation. We cannot be certain that our cash flow from operations will be sufficient to allow us to pay the principal and interest on our debt, including our 2021 Notes, 2021 PIK Notes and amounts borrowed under the Multidraw Term Loan Agreement, and meet our other obligations. If we do not have enough cash to service our debt, we may be required to refinance all or part of our existing debt, including our 2021 Notes, 2021 PIK Notes and the Multidraw Term Loan Agreement, sell assets, borrow more money or raise equity. We may not be able to refinance our debt, sell assets, borrow more money or raise equity on terms acceptable to us, if at all.
To service our indebtedness, we will require a significant amount of cash. Our ability to generate cash depends on many factors beyond our control, and any failure to meet our debt obligations could harm our business, financial condition and results of operations.
Our ability to make payments on and to refinance our indebtedness, including our 2021 Notes, 2021 PIK Notes and amounts borrowed under the Multidraw Term Loan Agreement, and to fund planned capital expenditures will depend on our ability to generate sufficient cash flow from operations in the future. To a certain extent, this is subject to general economic, financial,
#21#
competitive, legislative and regulatory conditions and other factors that are beyond our control, including the prices that we receive for our oil and natural gas production.
We cannot assure you that our business will generate sufficient cash flow from operations or that future borrowings will be available to us under the Multidraw Term Loan Agreement in an amount sufficient to enable us to pay principal and interest on our indebtedness, including our 2021 Notes and 2021 PIK Notes, or to fund our other liquidity needs. If our cash flow and capital resources are insufficient to fund our debt obligations, we may be forced to reduce our planned capital expenditures, sell assets, seek additional equity or debt capital or restructure our debt. We cannot assure you that any of these remedies could, if necessary, be affected on commercially reasonable terms, or at all. In addition, any failure to make scheduled payments of interest and principal on our outstanding indebtedness would likely result in a reduction of our credit rating, which could harm our ability to incur additional indebtedness on acceptable terms. Our cash flow and capital resources may be insufficient for payment of interest on and principal of our debt in the future, including payments on our 2021 Notes, 2021 PIK Notes and amounts borrowed under the Multidraw Term Loan Agreement, and any such alternative measures may be unsuccessful or may not permit us to meet scheduled debt service obligations, which could cause us to default on our obligations and could impair our liquidity.
We may not be able to obtain adequate financing when the need arises to execute our long-term operating strategy.
Our ability to execute our long-term operating strategy is highly dependent on having access to capital when the need arises. We historically have addressed our long-term liquidity needs through bank credit facilities, second lien term credit facilities, issuances of equity and debt securities, sales of assets, joint ventures and cash provided by operating activities. We will examine the following alternative sources of long-term capital as dictated by current economic conditions:
• | borrowings from banks or other lenders; |
• | the sale of certain assets; |
• | the issuance of debt securities; |
• | the sale of common stock, preferred stock or other equity securities; |
• | joint venture financing; and |
• | production payments. |
The availability of these sources of capital when the need arises will depend upon a number of factors, some of which are beyond our control. These factors include general economic and financial market conditions, oil and natural gas prices, our credit ratings, interest rates, market perceptions of us or the oil and gas industry, our market value and our operating performance. We may be unable to execute our long-term operating strategy if we cannot obtain capital from these sources when the need arises.
Borrowings under the Multidraw Term Loan Agreement are subject to our compliance with a significant financial ratio.
Under the terms of the Multidraw Term Loan Agreement, our ability to borrow is based on our maintaining a ratio of (i) the present value, discounted at 10% per annum, of the estimated future net revenues in respect of our oil and gas properties, before any state, federal, foreign or other income taxes, attributable to proved developed reserves, using three-year strip prices in effect at the end of each calendar quarter, including swap agreements in place at the end of each quarter, to (ii) the sum of the outstanding term loans thereunder and the then outstanding commitments to provide term loans, that shall not be less than 2.0 to 1.0 as measured on the last day of each calendar quarter. We may not be able to comply with this restrictive financial ratio in the future and, as a result, our ability to borrow money under the Multidraw Term Loan Agreement could be limited, in which case we would need to find other sources of liquidity including, but not limited to, negotiated renewals of our borrowings, arranging new financing or selling a portion of our assets.
Restrictive debt covenants could limit our growth and our ability to finance our operations, fund our capital needs, respond to changing conditions and engage in other business activities that may be in our best interests.
The Multidraw Term Loan Agreement and the indentures governing our 2021 Notes and 2021 PIK Notes contain a number of significant covenants that, among other things, restrict or limit our ability to:
• | pay dividends or distributions on our capital stock or issue preferred stock; |
• | repurchase, redeem or retire our capital stock or subordinated debt; |
• | make certain loans and investments; |
#22#
• | place restrictions on the ability of subsidiaries to make distributions; |
• | sell assets, including the capital stock of subsidiaries; |
• | enter into certain transactions with affiliates; |
• | create or assume certain liens on our assets; |
• | enter into sale and leaseback transactions; |
• | merge or enter into other business combination transactions; |
• | enter into transactions that would result in a change of control of us; or |
• | engage in other corporate activities. |
Also, the Multidraw Term Loan Agreement requires us to maintain compliance with specified financial ratios and satisfy certain financial condition tests. Our ability to comply with these ratios and financial condition tests may be affected by events beyond our control, and we cannot assure you that we will meet these ratios and financial condition tests.
Further, these financial ratio restrictions and financial condition tests could limit our ability to obtain future financings, make needed capital expenditures, withstand a future downturn in our business or the economy in general or otherwise conduct necessary corporate activities. We may also be prevented from taking advantage of business opportunities that arise because of the limitations that the restrictive covenants under the Multidraw Term Loan Agreement and the indentures governing our 2021 Notes and 2021 PIK Notes impose on us.
A breach of any of these covenants or our inability to comply with the required financial ratios or financial condition tests could result in a default under the Multidraw Term Loan Agreement, the 2021 Notes and the 2021 PIK Notes. A default, if not cured or waived, could result in all indebtedness outstanding under the Multidraw Term Loan Agreement, the 2021 Notes and the 2021 PIK Notes to become immediately due and payable. If that should occur, we may not be able to pay all such debt or borrow sufficient funds to refinance it. Even if new financing were then available, it may not be on terms that are acceptable to us. If we were unable to repay those amounts, the lenders could accelerate the maturity of the debt or proceed against any collateral granted to them to secure such defaulted debt.
We may be able to incur substantially more debt, which could exacerbate the risks associated with our indebtedness.
We and our subsidiaries may be able to incur substantial additional indebtedness in the future. Although covenants under the Multidraw Term Loan Agreement and the indentures governing our 2021 Notes and 2021 PIK Notes will limit our ability to incur additional indebtedness, these restrictions are subject to a number of qualifications and exceptions, and indebtedness incurred in compliance with these restrictions could be significant.
If new debt is added to our current debt levels, the related risks that we and our subsidiaries now face could intensify. Any of these risks could result in a material adverse effect on our business, financial condition, results of operations, business prospects and ability to satisfy our obligations under our outstanding indebtedness.
A financial downturn or negative credit market conditions may have lasting effects on our liquidity, business and financial condition that we cannot predict.
Liquidity is essential to our business. Our liquidity could be substantially negatively affected by an inability to obtain capital in the long-term or short-term debt capital markets or equity capital markets or an inability to access bank or other financing. A prolonged credit crisis or turmoil in the domestic or global financial systems could materially affect our liquidity, business and financial condition. These conditions have adversely impacted financial markets previously and created substantial volatility and uncertainty, and could do so again, with the related negative impact on global economic activity and the financial markets. Negative credit market conditions could materially affect our liquidity and may inhibit our lender from fully funding our Multidraw Term Loan Agreement or cause our lender to make the terms of our Multidraw Term Loan Agreement costlier and more restrictive. A weak economic environment could also adversely affect the collectability of our trade receivables or performance by our suppliers and cause our commodity derivative arrangements to be ineffective if our counterparties are unable to perform their obligations or seek bankruptcy protection. Additionally, negative economic conditions could lead to reduced demand for oil, natural gas and NGLs or lower prices for oil, natural gas and NGLs, which could have a negative impact on our revenues.
#23#
Our hedging program may limit potential gains from increases in commodity prices or may result in losses or may be inadequate to protect us against continuing and prolonged declines in commodity prices.
We enter into hedging arrangements from time to time to reduce our exposure to fluctuations in oil and natural gas prices and to achieve more predictable cash flow. Our hedges at December 31, 2017 and as of the date of this report are in the form of swaps placed with Shell Trading Risk Management LLC and Koch Supply and Trading LP. We cannot assure you that these or future counterparties will not become credit risks in the future. Hedging arrangements expose us to risks in some circumstances, including situations when the counterparty to the hedging contract defaults on the contractual obligations or there is a change in the expected differential between the underlying price in the hedging agreement and actual prices received. These hedging arrangements may also limit the benefit we could receive from increases in the market or spot prices for oil and natural gas.
For the year ended December 31, 2017, our total oil and gas sales included additions related to the settlement of gas hedges of $1.5 million, which in total represented 1% of our total oil and gas sales for the year. We cannot assure you that the hedging transactions we have entered into, or will enter into, will adequately protect us from fluctuations in oil and natural gas prices. In addition, as of the date of this report, we had approximately 3.2 Bcf of gas volumes and 91,250 barrels of oil volumes hedged for 2018. These hedges may be inadequate to protect us from continuing and prolonged declines in oil and natural gas prices. To the extent that oil and natural gas prices remain at current levels or decline further, we will not be able to hedge future production at the same pricing level as our current hedges and our results of operations and financial condition would be negatively impacted.
We may be responsible for offshore decommissioning liabilities for offshore interests we no longer own.
Under state and federal law, oil and gas companies are obligated to plug and abandon a well and restore the lease to pre-operating conditions after operations cease. State and federal regulations allow the government to call upon predecessors in interest of oil and gas leases to pay for plugging and abandonment, restoration and decommissioning obligations if the current operator fails to fulfill those obligations, which can be very significant. In January 2018, we completed a strategic shift from offshore Gulf of Mexico operations to onshore operations when we sold our remaining Gulf of Mexico assets. In connection with the divestiture of our Gulf of Mexico assets, we entered into various arrangements with the purchasers whereby the purchasers assumed our plugging and abandonment liabilities and other liabilities related to decommissioning such Gulf of Mexico assets. If purchasers of our former Gulf of Mexico assets, or any successor owners of those assets, are unable to meet their plugging and abandonment and other decommissioning obligations due to bankruptcy, dissolution or other related liquidity issues, we may be unable to rely on our arrangements with them to fulfill (or provide reimbursement for) those obligations. In those circumstances, the government may seek to impose the purchasers' or other successors' plugging and abandonment obligations on us and any other predecessors in interest. Such payments could be significant and adversely affect our business, results of operations, financial condition and cash flows.
Moreover, recent changes to the BOEM’s supplemental bonding requirements have the potential to adversely impact the financial condition of operators in the Gulf of Mexico and increase the number of operators seeking bankruptcy protection, given the current pricing of commodities. In July 2016, BOEM issued a Notice to Lessees and Operators (NTL) that augments requirements for the posting of additional financial assurance by offshore lessees, among others, to assure that sufficient funds are available to perform decommissioning obligations with respect to offshore wells, platforms, pipelines and other facilities. The NTL, which became effective in September 2016, eliminates the agency’s past practice of waiving supplemental bonding obligations where a company could demonstrate a certain level of financial strength. Instead, BOEM will allow companies to "self-insure," but only up to 10% of a company’s "tangible net worth," which is defined as the difference between a company’s total assets and the value of all liabilities and intangible assets.
The NTL provides new procedures for how BOEM determines a lessee’s decommissioning obligations, and the agency continues to negotiate with offshore operators to post additional financial assurance and develop tailored plans to meet BOEM’s revised estimates for offshore decommissioning obligations. Projected decommissioning costs of operations in the Gulf of Mexico continue to increase, and the volatile price of oil and gas has adversely affected the net worth of many operators. BOEM’s revisions to its supplemental bonding process could result in demands for the posting of increased financial assurance by the entities to whom we divested our Gulf of Mexico assets as well as other operators in the Gulf of Mexico. This will force operators to obtain surety bonds or other forms of financial assurance, the costs of which could be significant. Moreover, BOEM’s NTL is likely to result in the loss of supplemental bonding waivers for a large number of operators on the OCS, which will in turn force these operators to seek additional surety bonds and could, consequently, exceed the surety bond market’s ability to provide such additional financial assurance. Operators who have already leveraged their assets as a result of the volatile commodities market could face difficulty obtaining surety bonds because of concerns the surety may have about the priority of their lien on the operators' collateral. Consequently, BOEM’s changes could result in additional operators in the Gulf of Mexico initiating bankruptcy proceedings, which in turn could result in the government seeking to impose plugging and abandonment costs on predecessors in interest in the event that the current operator cannot meet its plugging and abandonment obligations. As a result, we could find ourselves
#24#
liable to pay for the plugging and abandonment costs of any entity we divested our Gulf of Mexico assets to, which payments could be significant and adversely affect our business, results of operations, financial condition and cash flows.
Our ability to receive a refund of our cash deposits posted as collateral to support certain bonds that satisfy our offshore decommissioning obligations with respect to our recently sold Gulf of Mexico assets is dependent on the successful assumption of operatorship and the posting of bonds or other acceptable assurances with respect to these assets by the purchaser of the assets.
To cover the costs for various obligations of lessees on the OCS, including costs for such decommissioning obligations as the plugging of wells, the removal of platforms and other facilities, the decommissioning of pipelines and the clearing of the seafloor of obstructions typically performed at the end of production, the BOEM generally requires that the lessees post substantial bonds or other acceptable financial assurances that such obligations will be met.
Because we were not exempt from the BOEM’s supplemental bonding requirements, we engaged surety companies to post the requisite bonds. Pursuant to the terms of our agreements with these surety companies, we have provided cash deposits totaling $10.7 million as collateral to support certain of the bonds that are issued on our behalf with respect to the Gulf of Mexico assets that we sold in January 2018. We expect to receive a refund of these cash deposits (subject to our obligation to pay approximately $3.8 million to the purchaser of these assets) following the successful assumption of operatorship and the posting of bonds or other acceptable assurances with respect to these assets by the purchaser of the assets. While the purchaser of the assets has agreed to assume the operatorship of, and to post bonds or other acceptable assurances with respect to, the assets, this may not occur and we may not receive a refund of these cash deposits.
Our future success depends upon our ability to find, develop, produce and acquire additional oil and natural gas reserves that are economically recoverable.
As is generally the case in the Gulf Coast Basin where approximately 51% of our current production is located after the sale of our Gulf of Mexico assets in January 2018, many of our producing properties are characterized by a high initial production rate, followed by a steep decline in production. In order to maintain or increase our reserves, we must constantly locate and develop or acquire new oil and natural gas reserves to replace those being depleted by production. We must do this even during periods of low oil and natural gas prices when it is difficult to raise the capital necessary to finance our exploration, development and acquisition activities. Without successful exploration, development or acquisition activities, our reserves and revenues will decline rapidly. We may not be able to find and develop or acquire additional reserves at an acceptable cost or have access to necessary financing for these activities, either of which would have a material adverse effect on our financial condition.
Approximately 51% of our production is exposed to the additional risk of severe weather, including hurricanes and tropical storms, as well as flooding, coastal erosion and sea level rise.
At December 31, 2017 after giving effect to the sale of our Gulf of Mexico assets in January 2018, approximately 51% of our production and approximately 10% of our estimated proved reserves are located along the Gulf Coast Basin. Operations in this area are subject to severe weather, including hurricanes and tropical storms, as well as flooding, coastal erosion and sea level rise. Some of these adverse conditions can be severe enough to cause substantial damage to facilities and possibly interrupt production. For example, certain of our Gulf Coast Basin properties have experienced damages and production downtime as a result of storms including Hurricanes Katrina and Rita, and more recently Hurricanes Gustav and Ike. In addition, according to certain scientific studies, emissions of carbon dioxide, methane, nitrous oxide and other gases commonly known as greenhouse gases may be contributing to global warming of the earth's atmosphere and to global climate change, which may exacerbate the severity of these adverse conditions. As a result, such conditions may pose increased climate-related risks to our assets and operations.
In accordance with customary industry practices, we maintain insurance against some, but not all, of these risks; however, losses could occur for uninsured risks or in amounts in excess of existing insurance coverage. We cannot assure you that we will be able to maintain adequate insurance in the future at rates we consider reasonable or that any particular types of coverage will be available. An event that is not fully covered by insurance could have a material adverse effect on our financial position and results of operations.
#25#
Our development and exploratory drilling efforts and our well operations may not be profitable or achieve our targeted returns.
We have acquired significant amounts of unproved property in order to further our development efforts and expect to continue to undertake acquisitions in the future. Development and exploratory drilling and production activities are subject to many risks, including the risk that no commercially productive reservoirs will be discovered. We acquire unproved properties and lease undeveloped acreage that we believe will enhance our growth potential and increase our results of operations over time. However, we cannot assure you that all prospects will be economically viable or that we will not abandon our investments. Additionally, we cannot assure you that unproved property acquired by us or undeveloped acreage leased by us will be profitably developed, that wells drilled by us in prospects that we pursue will be productive or that we will recover all or any portion of our investment in such unproved property or wells.
Approximately 46% of our net leasehold acreage is undeveloped, and that acreage may not ultimately be developed or become commercially productive, which could cause us to lose rights under our leases as well as have a material adverse effect on our oil and natural gas reserves and future production and, therefor, our future cash flow and income.
As of December 31, 2017, approximately 46% of our net leasehold acreage was undeveloped, or acreage on which wells have not been drilled or completed to a point that would permit the production of commercial quantities of oil and natural gas regardless of whether such acreage contains proved reserves. Unless production is established on the undeveloped acreage covered by our leases, such leases will expire. Our future oil and natural gas reserves and production and, therefore, our future cash flow and income are highly dependent on successfully developing our undeveloped leasehold acreage.
SEC rules could limit our ability to book additional proved undeveloped reserves or require us to write down our proved undeveloped reserves.
SEC rules require that, subject to limited exceptions, proved undeveloped reserves may only be booked if they relate to wells scheduled to be drilled within five years of the date of booking. This requirement may limit our potential to book additional proved undeveloped reserves as we pursue our drilling program. Moreover, we may be required to write down our proved undeveloped reserves if we do not develop those reserves within the required five-year time frame.
Our actual production, revenues and expenditures related to our reserves are likely to differ from our estimates of proved reserves. We may experience production that is less than estimated and drilling costs that are greater than estimated in our reserve report. These differences may be material.
Although the estimates of our oil and natural gas reserves and future net cash flows attributable to those reserves were prepared by Ryder Scott Company, L.P., our independent petroleum and geological engineers, we are ultimately responsible for the disclosure of those estimates. Reserve engineering is a complex and subjective process of estimating underground accumulations of oil and natural gas that cannot be measured in an exact manner. Estimates of economically recoverable oil and natural gas reserves and of future net cash flows necessarily depend upon a number of variable factors and assumptions, including:
• | historical production from the area compared with production from other similar producing wells; |
• | the assumed effects of regulations by governmental agencies; |
• | assumptions concerning future oil and natural gas prices; and |
• | assumptions concerning future operating costs, severance and excise taxes, development costs and work-over and remedial costs. |
Because all reserve estimates are to some degree subjective, each of the following items may differ materially from those assumed in estimating proved reserves:
• | the quantities of oil and natural gas that are ultimately recovered; |
• | the production and operating costs incurred; |
• | the amount and timing of future development expenditures; and |
• | future oil and natural gas sales prices. |
Furthermore, different reserve engineers may make different estimates of reserves and cash flows based on the same available data. Historically, the difference between our actual production and the production estimated in a prior year's reserve report has not been material. Our 2017 production, excluding the impact of asset sales and the results from successful exploration
#26#
wells which are not included in the prior year reserve report, was approximately 5% lower than amounts projected in our 2016 reserve report. We cannot assure you that these differences will not be material in the future.
Approximately 51% of our estimated proved reserves at December 31, 2017 are undeveloped and 5% were developed, non-producing. Recovery of undeveloped reserves requires significant capital expenditures and successful drilling operations. The reserve data assumes that we will make significant capital expenditures to develop and produce our reserves. Although we have prepared estimates of our oil and natural gas reserves and the costs associated with these reserves in accordance with industry standards, we cannot assure you that the estimated costs are accurate, that the development will occur as scheduled or that the actual results will be as estimated. In addition, the recovery of certain developed non-producing reserves is generally subject to the approval of development plans and related activities by applicable state and/or federal agencies. Statutes and regulations may affect both the timing and quantity of recovery of estimated reserves. Such statutes and regulations, and their enforcement, have changed in the past and may change in the future, and may result in upward or downward revisions to current estimated proved reserves.
You should not assume that the standardized measure of discounted cash flows is the current market value of our estimated oil and natural gas reserves. In accordance with SEC requirements, the standardized measure of discounted cash flows from proved reserves at December 31, 2017 are based on twelve-month, first day of month, average prices and costs as of the date of the estimate. These prices and costs will change and may be materially higher or lower than the prices and costs as of the date of the estimate. Any changes in consumption by oil and natural gas purchasers or in governmental regulations or taxation may also affect actual future net cash flows. The actual timing of development activities, including related production and expenses, will affect the timing of future net cash flows and any differences between estimated development timing and actual could have a material effect on standardized measure. In addition, the 10% discount factor we use when calculating standardized measure of discounted cash flows for reporting requirements in compliance with accounting requirements is not necessarily the most appropriate discount factor. The effective interest rate at various times and the risks associated with our operations or the oil and natural gas industry in general will affect the accuracy of the 10% discount factor.
We may be unable to successfully identify, execute or effectively integrate future acquisitions, which may negatively affect our results of operations.
Acquisitions of oil and gas businesses and properties have been an important element of our business, and we will continue to pursue acquisitions in the future. In the last several years, we have pursued and consummated acquisitions that have provided us opportunities to grow our production and reserves. Although we regularly engage in discussions with, and submit proposals to, acquisition candidates, suitable acquisitions may not be available in the future on reasonable terms. If we do identify an appropriate acquisition candidate, we may be unable to successfully negotiate the terms of an acquisition, finance the acquisition or, if the acquisition occurs, effectively integrate the acquired business into our existing business. Negotiations of potential acquisitions and the integration of acquired business operations may require a disproportionate amount of management's attention and our resources. Even if we complete additional acquisitions, continued acquisition financing may not be available or available on reasonable terms, any new businesses may not generate revenues comparable to our existing business, the anticipated cost efficiencies or synergies may not be realized and these businesses may not be integrated successfully or operated profitably. The success of any acquisition will depend on a number of factors, including the ability to estimate accurately the recoverable volumes of reserves, rates of future production and future net revenues attainable from the reserves and to assess possible environmental liabilities. Our inability to successfully identify, execute or effectively integrate future acquisitions may negatively affect our results of operations.
Even though we perform due diligence reviews (including a review of title and other records) of the major properties we seek to acquire that we believe is consistent with industry practices, these reviews are inherently incomplete. It is generally not feasible for us to perform an in-depth review of every individual property and all records involved in each acquisition. However, even an in-depth review of records and properties may not necessarily reveal existing or potential problems or permit us to become familiar enough with the properties to assess fully their deficiencies and potential. Even when problems are identified, we may assume certain environmental and other risks and liabilities in connection with the acquired businesses and properties. The discovery of any material liabilities associated with our acquisitions could harm our results of operations.
In addition, acquisitions of businesses may require additional debt or equity financing, resulting in additional leverage or dilution of ownership. Our Multidraw Term Loan Agreement and the indentures governing our 2021 Notes and 2021 PIK Notes contain certain covenants that limit, or which may have the effect of limiting, among other things acquisitions, capital expenditures, the sale of assets and the incurrence of additional indebtedness.
The loss of key management or technical personnel could adversely affect our ability to operate.
Our operations are dependent upon a diverse group of key senior management. In addition, we employ numerous other skilled technical personnel, including geologists, geophysicists and engineers that are essential to our operations. We cannot assure
#27#
you that such individuals will remain with us for the immediate or foreseeable future. The unexpected loss of the services of one or more of any of these key management or technical personnel could have an adverse effect on our operations.
Losses and liabilities from uninsured or underinsured drilling and operating activities could have a material adverse effect on our financial condition and operations.
We maintain several types of insurance to cover our operations, including worker's compensation, maritime employer's liability and comprehensive general liability. Amounts over base coverages are provided by primary and excess umbrella liability policies. We also maintain operator's extra expense coverage, which covers the control of drilling or producing wells as well as redrilling expenses and pollution coverage for wells out of control.
We may not be able to maintain adequate insurance in the future at rates we consider reasonable, or we could experience losses that are not insured or that exceed the maximum limits under our insurance policies. If a significant event that is not fully insured or indemnified occurs, it could materially and adversely affect our financial condition and results of operations.
Lower oil and natural gas prices may cause us to record ceiling test write-downs, which could negatively impact our results of operations.
We use the full cost method of accounting to account for our oil and natural gas operations. Accordingly, we capitalize the cost to acquire, explore for and develop oil and natural gas properties. Under full cost accounting rules, the net capitalized costs of oil and natural gas properties may not exceed a “full cost ceiling” which is based upon the present value of estimated future net cash flows from proved reserves, including the effect of hedges in place, discounted at 10%, plus the lower of cost or fair market value of unproved properties. If at the end of any fiscal period we determine that the net capitalized costs of oil and natural gas properties exceed the full cost ceiling, we must charge the amount of the excess to earnings in the period then ended. This is called a “ceiling test write-down.” This charge does not impact cash flow from operating activities, but does reduce our net income and stockholders' equity. Once incurred, a write-down of oil and natural gas properties is not reversible at a later date.
We review the net capitalized costs of our properties quarterly, using a single price based on the twelve-month, first day of month, average price of oil and natural gas for the prior 12 months. We also assess investments in unevaluated properties periodically to determine whether impairment has occurred. The risk that we will be required to recognize further write downs of the carrying value of our oil and gas properties increases when oil and natural gas prices are low or volatile. In addition, write-downs may occur if we experience substantial downward adjustments to our estimated proved reserves or our unevaluated property values, or if estimated future development costs increase. As a result of the decline in commodity prices, we recognized ceiling test write-downs totaling $40.3 million during the year ended December 31, 2016. We did not incur a ceiling test write-down during the year ended December 31, 2017. Utilizing current strip prices for oil and natural gas prices for the first quarter of 2018 and projecting the effect on the estimated future net cash flows from our estimated proved reserves as of March 31, 2018, we do not expect to recognize a ceiling test write-down in the first quarter of 2018.
Factors beyond our control affect our ability to market oil and natural gas.
The availability of markets and the volatility of product prices are beyond our control and represent a significant risk. The marketability of our production depends upon the availability and capacity of natural gas gathering systems, pipelines and processing facilities. The unavailability or lack of capacity of these systems and facilities could result in the shut-in of producing wells or the delay or discontinuance of development plans for properties. Our ability to market oil and natural gas also depends on other factors beyond our control. These factors include:
• | the level of domestic production and imports of oil and natural gas; |
• | the proximity of natural gas production to natural gas pipelines; |
• | the availability of pipeline capacity; |
• | the demand for oil and natural gas by utilities and other end users; |
• | the availability of alternate energy sources; |
• | the effect of inclement weather, such as hurricanes; |
• | state and federal regulation of oil and natural gas marketing; and |
• | federal regulation of natural gas sold or transported in interstate commerce. |
#28#
If these factors were to change dramatically, our ability to market oil and natural gas or obtain favorable prices for our oil and natural gas could be adversely affected.
Federal and state legislation and regulatory initiatives relating to oil and natural gas development and hydraulic fracturing could result in increased costs and additional operating restrictions or delays.
Hydraulic fracturing involves the injection of water, sand and chemicals under pressure into rock formations to enhance oil and natural gas production. Hydraulic fracturing using fluids other than diesel is currently exempt from regulation under the federal Safe Drinking Water Act, but opponents of hydraulic fracturing have called for further study of the technique's environmental effects and, in some cases, further regulation of the technique under various federal and state authorities. A number of states, including Louisiana and Texas, have required operators or service companies to disclose chemical components in fluids used for hydraulic fracturing and some states have imposed bans or moratoria on new natural gas development or the use of hydraulic fracturing. Further regulation may include, among other things, additional permitting requirements, enhanced reporting obligations, and stricter standards for discharges and emissions associated with gas production, storage and transport. The future of such regulation is controversial and uncertain. Such requirements, if imposed, would be expected to increase the cost of natural gas production.
Recent seismic events have been observed in some areas (including Texas) where hydraulic fracturing has taken place. Some scientists believe the increased seismic activity may result from deep well fluid injection associated with use of hydraulic fracturing. Additional regulatory measures designed to minimize or avoid damage to geologic formations have been imposed in states, including Texas, to address such concerns.
Concerns regarding climate change have led the Congress, various states and environmental agencies to consider a number of initiatives to restrict or regulate emissions of greenhouse gases, such as carbon dioxide and methane. Stricter regulations of greenhouse gases could require us to incur costs to reduce emissions of greenhouse gases associated with our operations, or could adversely affect demand for the oil and natural gas we produce. In addition, climate change that results in physical effects such as increased frequency and severity of storms, floods and other climatic events, could disrupt our exploration and production operations and cause us to incur significant costs in preparing for and responding to those effects.
Although it is not possible at this time to predict any additional federal, state or local legislation or regulation regarding hydraulic fracturing, management of drilling fluids, stricter emission standards, well integrity requirements or climate change, federal or state restrictions imposed on oil and gas exploration and production activities in areas in which we conduct business could significantly increase our operating, capital and compliance costs as well as delay our ability to develop oil and natural gas reserves. In addition to increased regulation of our business, we may also experience an increase in litigation seeking damages as a result of heightened public concerns related to air quality, water quality, and other environmental impacts.
The adoption of derivatives legislation by Congress, and implementation of that legislation by federal agencies, could have an adverse impact on our ability to mitigate risks associated with our business.
The Dodd-Frank Wall Street Reform and Consumer Protection Act (the “Dodd-Frank Act”), which was passed by the U.S. Congress and signed into law in July 2010, provides for statutory and regulatory requirements for derivative transactions, including crude oil and natural gas derivative transactions. Among other things, the Dodd-Frank Act provides for the creation of position limits for certain derivatives transactions, as well as requiring certain transactions to be cleared on exchanges for which cash collateral will be required. The Dodd-Frank Act requires Commodities Futures and Trading Commission, (the “CFTC”), and the SEC and other regulators to promulgate rules and regulations implementing the Dodd-Frank Act. The CFTC has re-proposed rules that would place limits on positions in certain core futures and equivalent swaps contracts for or linked to certain physical commodities, subject to exceptions for certain bona fide hedging transactions. As these new position limit rules are not yet final, the impact of those provisions on us is uncertain at this time.
It is not possible at this time to predict with certainty the full effect of the Dodd-Frank Act and CFTC rules on us and the timing of such effects. The Dodd-Frank Act may require us to comply with margin requirements and with certain clearing and trade-execution requirements if we do not satisfy certain specific exceptions. Although we expect to qualify for the end-user exception to the clearing, trade execution and margin requirements for swaps entered to hedge our commodity risks, the application of the requirements to other market participants, such as swap dealers, may change the cost and availability of our derivatives. Depending on the rules adopted by the CFTC or similar rules that may be adopted by other regulatory bodies, we might in the future be required to provide cash collateral for our commodities derivative transactions under circumstances in which we do not currently post cash collateral. Posting of such additional cash collateral could therefore reduce our ability to execute transactions to reduce commodity price risk and thus protect cash flows.
The full impact of the Dodd-Frank Act and related regulatory requirements upon our business will not be known until all of the regulations are implemented. If we reduce our use of derivatives as a result of the Dodd-Frank Act and regulations, our
#29#
results of operations may become more volatile and our cash flows may be less predictable. In addition, the Dodd-Frank Act was intended, in part, to reduce the volatility of crude oil and natural gas prices, which some legislators attributed to speculative trading in derivatives and commodity instruments related to crude oil and natural gas. Our revenues could therefore be adversely affected if a consequence of the Dodd-Frank Act and regulations is to lower commodity prices.
In addition, the European Union and other non-U.S. jurisdictions are implementing regulations with respect to the derivatives market. To the extent we transact with counterparties in foreign jurisdictions, we may become subject to such regulations. At this time, the impact of such regulations is not clear.
Recent changes in United States federal income tax law may have an adverse effect on our cash flows, results of operations or financial condition overall.
The final version of the tax reform bill commonly known as the Tax Cuts and Jobs Act signed into law on December 22, 2017 (the "Tax Cuts and Jobs Act") may affect our cash flows, results of operations and financial condition. Among other items, the Tax Cuts and Jobs Act repealed the deduction for certain U.S. production activities and provided for a new limitation on the deduction for interest expense. Given the scope of this law and the potential interdependency of its changes, it is difficult at this time to assess whether the overall effect of the Tax Cuts and Jobs Act will be cumulatively positive or negative for our earnings and cash flow, but such changes may adversely impact our financial results.
Certain federal income tax deductions currently available with respect to oil and natural gas exploration and development may be eliminated as a result of future legislation.
In past years, legislation has been proposed that would, if enacted into law, make significant changes to U.S. tax laws, including to certain key U.S. federal income tax provisions currently available to oil and gas companies. Although none of these changes were included in the Tax Cuts and Jobs Act, future adverse changes could include, but are not limited to, (i) the repeal of the percentage depletion allowance for oil and gas properties, (ii) the elimination of current deductions for intangible drilling and development costs, and (iii) an extension of the amortization period for certain geological and geophysical expenditures. Congress could consider, and could include, some or all of these proposals as part of future tax reform legislation. The passage of any legislation as a result of these proposals or any similar changes in U.S. federal income tax laws could eliminate or postpone certain tax deductions that currently are available with respect to oil and gas development, or increase costs, and any such changes could have an adverse effect on our financial position, results of operations and cash flows.
We face strong competition from larger oil and natural gas companies that may negatively affect our ability to carry on operations.
We operate in the highly competitive areas of oil and natural gas exploration, development and production. Factors that affect our ability to compete successfully in the marketplace include:
• | the availability of funds and information relating to a property; |
• | the standards established by us for the minimum projected return on investment; and |
• | the transportation of natural gas. |
Our competitors include major integrated oil companies, substantial independent energy companies, affiliates of major interstate and intrastate pipelines and national and local natural gas gatherers, many of which possess greater financial and other resources than we do. If we are unable to successfully compete against our competitors, our business, prospects, financial condition and results of operations may be adversely affected.
#30#
Operating hazards may adversely affect our ability to conduct business.
Our operations are subject to risks inherent in the oil and natural gas industry, such as:
• | unexpected drilling conditions including blowouts, cratering and explosions; |
• | uncontrollable flows of oil, natural gas or well fluids; |
• | equipment failures, fires or accidents; |
• | pollution and other environmental risks; and |
• | shortages in experienced labor or shortages or delays in the delivery of equipment. |
These risks could result in substantial losses to us from injury and loss of life, damage to and destruction of property and equipment, pollution and other environmental damage and suspension of operations. Our Gulf Coast Basin operations are also subject to a variety of operating risks peculiar to the marine environment, such as hurricanes or other adverse weather conditions and more extensive governmental regulation.
Environmental compliance costs and environmental liabilities could have a material adverse effect on our financial condition and operations.
Our operations are subject to numerous federal, state and local laws and regulations governing the discharge of materials into the environment or otherwise relating to environmental protection. These laws and regulations may:
• | require the acquisition of permits before drilling commences; |
• | restrict the types, quantities and concentration of various substances that can be released into the environment from drilling and production activities; |
• | limit or prohibit drilling activities on certain lands lying within wilderness, wetlands and other protected areas; |
• | require remedial measures to mitigate pollution from former operations, such as plugging abandoned wells; and |
• | impose substantial liabilities for pollution resulting from our operations. |
Stricter requirements and standards may be imposed in future environmental legislation and regulation. Our drilling plans may be affected as a result of new or modified environmental requirements. The enactment of stricter legislation or the adoption of stricter regulations could have a significant impact on our operating costs, as well as on the oil and natural gas industry in general.
Our operations could result in liability for personal injuries, property damage, oil spills, discharge of hazardous materials, remediation and clean-up costs and other environmental damages. We could also be liable for environmental damages caused by previous property owners. As a result, substantial liabilities to third parties or governmental entities may be incurred which could have a material adverse effect on our financial condition and results of operations. We maintain insurance coverage for our operations, including limited coverage for sudden and accidental environmental damages, but this insurance may not extend to the full potential liability that could be caused by sudden and accidental environmental damages nor continue to be available in the future, and if available, may not cover environmental damages that occur over time. Accordingly, we may be subject to liability or may lose the ability to continue exploration or production activities upon substantial portions of our properties if certain environmental damages occur.
We cannot control the activities on properties we do not operate and we are unable to ensure the proper operation and profitability of these non-operated properties.
We do not operate all of the properties in which we have an interest. As a result, we have limited ability to exercise influence over, and control the risks associated with, the operation of these properties. The success and timing of drilling and development activities on our partially owned properties operated by others therefore will depend upon a number of factors outside of our control, including the operator's:
• | timing and amount of capital expenditures; |
• | expertise and diligence in adequately performing operations and complying with applicable agreements; |
#31#
• | financial resources; |
• | inclusion of other participants in drilling wells; and |
• | use of technology. |
As a result of any of the above or an operator's failure to act in ways that are in our best interest, our allocated production revenues and results of operations could be adversely affected.
Ownership of working interests and overriding royalty interests in certain of our properties by certain of our officers and directors potentially creates conflicts of interest.
Certain of our executive officers and directors or their respective affiliates are working interest owners or overriding royalty interest owners in certain properties. In their capacity as working interest owners, they are required to pay their proportionate share of all costs and are entitled to receive their proportionate share of revenues in the normal course of business. As overriding royalty interest owners they are entitled to receive their proportionate share of revenues in the normal course of business. There is a potential conflict of interest between us and such officers and directors with respect to the drilling of additional wells or other development operations with respect to these properties.
Our business could be negatively affected by security threats, including cybersecurity threats, destructive forms of protest and opposition by activists and other disruptions.
As an oil and natural gas producer, we face various security threats, including cybersecurity threats to gain unauthorized access to sensitive information, to misappropriate financial assets or to render data or systems unusable; threats to the security of our facilities and infrastructure or third party facilities and infrastructure, such as processing plants and pipelines; and threats from terrorist acts. The potential for such security threats has subjected our operations to increased risks that could have a material adverse effect on our business. In particular, our implementation of various procedures and controls to monitor and mitigate security threats and to increase security for our information, facilities and infrastructure may result in increased capital and operating costs. Moreover, there can be no assurance that such procedures and controls will be sufficient to prevent security breaches from occurring. If any of these security breaches were to occur, they could lead to losses of financial assets, sensitive information, critical infrastructure or capabilities essential to our operations and could have a material adverse effect on our reputation, financial position, results of operations or cash flows. Cybersecurity attacks in particular are becoming more sophisticated and include, but are not limited to, malicious software, attempts to gain unauthorized access to data and systems, and other electronic security breaches that could lead to disruptions in critical systems, unauthorized release of confidential or otherwise protected information, and corruption of data. These events could lead to financial losses from remedial actions, loss of business or potential liability. In addition, destructive forms of protest and opposition by activists and other disruptions, including acts of sabotage or eco-terrorism, against oil and gas production and activities could potentially result in damage or injury to people, property or the environment or lead to extended interruptions of our operations, adversely affecting our financial condition and results of operations.
Loss of our information and computer systems could adversely affect our business.
We are heavily dependent on our information systems and computer based programs, including our well operations information, seismic data, electronic data processing and accounting data. If any of such programs or systems were to fail or create erroneous information in our hardware or software network infrastructure, possible consequences include our loss of communication links, inability to find, produce, process and sell oil and natural gas and inability to automatically process commercial transactions or engage in similar automated or computerized business activities. Any such consequence could have a material adverse effect on our business.
A terrorist attack or armed conflict could harm our business.
Terrorist activities, anti-terrorist efforts and other armed conflicts involving the United States or other countries may adversely affect the United States and global economies and could prevent us from meeting our financial and other obligations. If any of these events occur, the resulting political instability and societal disruption could reduce overall demand for oil and natural gas, potentially putting downward pressure on demand for our production and causing a reduction in our revenues. Oil and natural gas related facilities could be direct targets of terrorist attacks, and our operations could be adversely impacted if infrastructure integral to our customers' operations is destroyed or damaged. Costs for insurance and other security may increase as a result of these threats, and some insurance coverage may become more difficult to obtain, if available at all.
#32#
We are and may in the future be involved in legal proceedings that could result in substantial liabilities.
Like many oil and gas companies, we are from time to time involved in various legal and other proceedings, such as title, royalty or contractual disputes, regulatory compliance matters and personal injury or property damage matters, in the ordinary course of our business. For example, see Part II - Item 1. Legal Proceedings in this Form 10-K. Such legal proceedings are inherently uncertain and their results cannot be predicted. Regardless of the outcome, such proceedings could have an adverse impact on us because of legal costs, diversion of management and other personnel and other factors. In addition, it is possible that a resolution of one or more such proceedings could result in liability, penalties or sanctions, as well as judgments, consent decrees or orders requiring a change in our business practices, which could materially and adversely affect our business, operating results and financial condition. Accruals for such liability, penalties or sanctions may be insufficient. Judgments and estimates to determine accruals or range of losses related to legal and other proceedings could change from one period to the next, and such changes could be material.
Risks Relating to Our Outstanding Common Stock
Our stock price could be volatile, which could cause you to lose part or all of your investment.
The stock market has from time to time experienced significant price and volume fluctuations that may be unrelated to the operating performance of particular companies. In particular, the market price of our common stock, like that of the securities of many other energy companies, has been and may continue to be highly volatile. During 2017, the sales price of our stock ranged from a low of $1.50 per share (on December 21, 2017) to a high of $4.75 per share (on February 17, 2017). Factors such as announcements concerning changes in prices of oil and natural gas, our ability to service our indebtedness, changes to the level of our indebtedness, the success of our acquisition, exploration and development activities, the availability of capital, and economic and other external factors, as well as period-to-period fluctuations and financial results, may have a significant effect on the market price of our common stock.
From time to time, there has been limited trading volume in our common stock. In addition, there can be no assurance that there will continue to be a trading market or that any securities research analysts will continue to provide research coverage with respect to our common stock. It is possible that such factors will adversely affect the market for our common stock.
If we cannot meet the New York Stock Exchange’s continuing listing requirements and rules, the New York Stock Exchange may delist our securities, which could negatively affect our company, the price of our securities and your ability to sell our securities.
On June 12, 2017, we received notice from NYSE Regulation informing us that we were not in compliance with the continued listing standards set forth in Section 802.01B of the Listed Company Manual because our average global market capitalization fell below $50 million over a trailing consecutive 30 trading-day period and our last reported stockholders’ equity was less than $50 million.
We have submitted a business plan to the New York Stock Exchange demonstrating how we intend to regain compliance with the continued listing standards set forth in Section 802.01B of the Listed Company Manual. On August 24, 2017, we received notice from the NYSE that our business plan had been accepted. As a result, our common stock will continue to be listed on the NYSE, subject to our providing quarterly reviews to the New York Stock Exchanges Listings and Compliance Committee to ensure our progress toward our plan to restore compliance with continued listing standards by achieving an average market capitalization over a consecutive 30-day period of $50 million or total stockholders' equity of $50 million by June 12, 2018.
If our common stock ultimately were to be delisted for any reason, trading of our securities would thereafter be conducted in the over-the-counter market or on the National Association of Securities Dealers Inc.’s “electronic bulletin board.” As a consequence, our stockholders would likely find it more difficult to dispose of, or to obtain accurate quotations as to the prices of our securities. Such a delisting could negatively impact us by (i) reducing the liquidity and market price of our common stock; (ii) reducing the number of investors willing to hold or acquire our common stock, which could negatively impact our ability to raise equity financing; (iii) limiting our ability to use a registration statement to offer and sell freely tradable securities, thereby preventing us from accessing the public capital markets; and (iv) impairing our ability to provide equity incentives to our employees.
The terms of our debt agreements currently restrict, and Delaware law may restrict, us from making cash payments with respect to our Series B Preferred Stock, and as a result the holders of our Series B Preferred Stock are entitled to additional rights with respect to the management of the Company.
Quarterly dividends and cash payments upon conversion or repurchase of our Series B preferred stock will be paid only if payment of such amounts is not prohibited by our debt agreements, such as the Multidraw Term Loan Agreement, and assets are legally available to pay such amounts. Quarterly dividends will only be paid if such dividends are declared by our board of
#33#
directors. The board of directors is not obligated or required to declare quarterly dividends even if we have funds available for such purposes.
In connection with an amendment to our prior bank credit facility (which was replaced by the Multidraw Term Loan Agreement in October 2016) restricting us from declaring or paying dividends on our Series B preferred stock, we suspended the cash dividend on our Series B preferred stock beginning with the dividend payment due on April 15, 2016. The terms of the Multidraw Term Loan Agreement also restrict us from declaring and paying cash dividends on our Series B preferred stock. Under the terms of the Series B preferred stock, any unpaid dividends will accumulate. As of December 31, 2017, we have deferred seven dividend payments and have accrued a $10.3 million payable related to the seven deferred payments and the payment that was due on January 15, 2018, which is included in other long-term liabilities on the Consolidated Balance Sheet. As a result of the restrictions in the Multidraw Term Loan Agreement and our failure to pay six quarterly dividends on the Series B preferred stock as of the date hereof, holders of the Series B preferred stock, voting as a single class, currently have the right to elect two additional directors to our board of directors until all accumulated and unpaid dividends on the Series B preferred stock are paid in full. On August 23, 2017, our board received written notice from two affiliated holders of the Series B preferred stock exercising this right by requesting that our board call a special meeting of the holders of the Series B preferred stock for the purposes of electing the additional directors. However, on October 20, 2017, as a result of discussions between our management and certain holders of the Series B preferred stock, the request to call the special meeting was withdrawn, and our board determined not to call the special meeting at that time. We are committed to working with holders of the Series B preferred stock as they identify and evaluate potential candidates to add to the existing board of directors in 2018.
If in the future we are permitted to pay such cash dividends under the terms of our existing debt agreements, including the Multidraw Term Loan Agreement, and any debt agreements that we enter into in the future, we may continue to be limited in our ability to pay cash dividends on our Series B preferred stock and our ability to make any cash payment upon conversion or repurchase of our Series B preferred stock by the terms of such debt agreements. Furthermore, if we are in default under the Multidraw Term Loan Agreement or the indentures governing the 2021 Notes or the 2021 PIK Notes, we will not be permitted to pay any cash dividends on our Series B preferred stock or make any cash payment upon conversion or repurchase of our Series B preferred stock in the absence of a waiver of such default or an amendment or refinancing of such debt agreements.
Delaware law provides that we may pay dividends on our Series B preferred stock only to the extent that assets are legally available to pay such dividends. Cash payments we may make upon repurchase or conversion of our Series B preferred stock would be generally subject to the same restrictions under Delaware law. Legally available assets is defined as the amount of surplus. Our surplus is the amount by which the fair value of total assets exceeds the sum of:
•the fair value of our total liabilities, including our contingent liabilities; and
•the amount of our capital.
If there is no surplus, legally available assets will mean, in the case of a dividend, our net profits for the fiscal year in which the dividend payment occurs and/or the preceding fiscal year.
Issuance of shares in connection with financing transactions or under stock incentive plans will dilute current stockholders.
We have issued 1.5 million shares of Series B preferred stock, which are presently convertible into 1.3 million shares of our common stock. In addition, pursuant to our stock incentive plan, our management is authorized to grant stock awards to our employees, directors and consultants. You will incur dilution upon the conversion of the Series B preferred stock, the exercise of any outstanding stock awards or the grant of any restricted stock. In addition, if we raise additional funds by issuing additional common stock, or securities convertible into or exchangeable or exercisable for common stock, further dilution to our existing stockholders will result, and new investors could have rights superior to existing stockholders.
The number of shares of our common stock eligible for future sale could adversely affect the market price of our stock.
At December 31, 2017, we had reserved approximately 1.6 million shares of common stock for issuance under outstanding options and approximately 1.3 million shares issuable upon conversion of the Series B preferred stock. All of these shares of common stock are registered for sale or resale on currently effective registration statements. In addition, we recently issued approximately 2.0 million shares of common stock as a portion of the consideration for our acquisition of certain oil and gas interests that will be eligible for future sale under Rule 144 of the Securities Act and approximately 2.2 million shares of common stock in a privately negotiated debt exchange that are currently eligible for sale. We may issue additional restricted securities or register additional shares of common stock under the Securities Act in the future. The issuance of a significant number of shares of common stock upon the exercise of stock options, the granting of restricted stock or the conversion of the Series B preferred stock, or the availability for sale, or sale, of a substantial number of the shares of our common stock eligible for future sale under effective registration statements, under Rule 144 or otherwise, could adversely affect the market price of the common stock.
#34#
Provisions in our certificate of incorporation and bylaws could delay or prevent a change in control of our company, even if that change would be beneficial to our stockholders.
Certain provisions of our certificate of incorporation and bylaws may delay, discourage, prevent or render more difficult an attempt to obtain control of our company, whether through a tender offer, business combination, proxy contest or otherwise. These provisions include:
• | the charter authorization of “blank check” preferred stock; |
• | a restriction on the ability of stockholders to call a special meeting and take actions by written consent; and |
• | provisions regulating the ability of our stockholders to nominate directors for election or to bring matters for action at annual meetings of our stockholders. |
We do not intend to pay dividends on our common stock and our ability to pay dividends on our common stock is restricted.
We have not paid dividends on our common stock, in cash or otherwise, and intend to retain our cash flow from operations for the future operation and development of our business. We are currently restricted from paying dividends on our common stock by our Multidraw Term Loan Agreement, the indentures governing the 2021 Notes and 2021 PIK Notes and, in some circumstances, by the terms of our Series B Preferred Stock. Any future dividends also may be restricted by our then-existing debt agreements.
Item 1B Unresolved Staff Comments
None
Item 3. | Legal Proceedings |
The Company is involved in litigation relating to claims arising out of its operations in the normal course of business, including worker’s compensation claims, tort claims and contractual disputes. Some of the existing known claims against us are covered by insurance subject to the limits of such policies and the payment of deductible amounts by us. Although we cannot predict the outcome of these proceedings with certainty, management believes that the ultimate disposition of all uninsured or unindemnified matters resulting from existing litigation will not have a material adverse effect on the Company's business or financial position.
On March 23, 2015, BCR Holdings, Inc. filed suit in state district court in Lafourche Parish, Louisiana against PetroQuest Energy L.L.C. ("PQ LLC") and seven other defendant companies claiming damages arising from oilfield and sulfur mining operations conducted pursuant to a November 14, 1941 oil, gas and mineral lease (the "Lease") on certain lands located in Lafourche Parish, Louisiana commonly known as "Bully Camp Field". The alleged damages include releases of pollutants on and under the surface of the property and damages to the surface of the property. The lawsuit seeks actual, consequential and punitive damages, remediation and restoration of the property and attorney's fees and costs. PQ LLC owned working interests in only a portion of the Lease limited to the time period from 1995-2002.
On October 11, 2016, PQ LLC and another exploration and production company were named as defendants in a putative class action lawsuit filed on behalf of royalty owners in the state district court in Hughes County, Oklahoma. The lawsuit alleges that PQ LLC and the other defendant failed to pay interest with respect to untimely royalty payments. The lawsuit seeks actual and punitive damages, an accounting, disgorgement, injunctive relief and attorney's fees. On November 28, 2016, the Company removed the lawsuit to the U.S. District Court for the Eastern District of Oklahoma.
On October 25, 2016, PQ LLC and another exploration and production company were named as defendants in a putative class action lawsuit filed on behalf of royalty owners in the U.S. District Court for the Eastern District of Oklahoma. The lawsuit alleges that PQ LLC and the other defendant underpaid royalties or did not pay royalties by various means. The lawsuit seeks actual, compensatory and punitive damages, and attorney's fees.
We continue to vigorously defend against each of the pending claims. At this time we are unable to express an opinion with respect to the likelihood of an unfavorable outcome or provide an estimate of potential losses, if any.
Item 4. | Mine Safety Disclosures |
Not applicable.
#35#
PART II
Market for Registrant's Common Equity, Related Stockholder Matters and Issuer Purchases of Equity Securities
The following graph illustrates the yearly percentage change in the cumulative stockholder return on our common stock, compared with the cumulative total return on the NYSE/AMEX/NASDAQ Stock Market (U.S. Companies) Index, the NYSE Stocks—Crude Petroleum and Natural Gas Index and the Morningstar Oil and Gas E&P Index, for the five years ended December 31, 2017.
Comparison of 5 Year Cumulative Total Return
Assumes Initial Investment of $100
December 31, 2017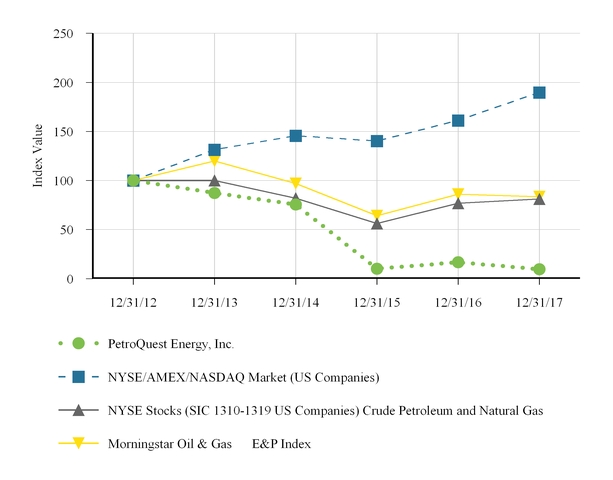
PetroQuest Energy, Inc. | NYSE/AMEX/NASDAQ Market (US Companies) | NYSE Stocks (SIC 1310-1319 US Companies) Crude Petroleum and Natural Gas | Morningstar Oil & Gas E&P Index | |||||
12/31/2012 | $100.00 | $100.00 | $100.00 | $100.00 | ||||
12/31/2013 | 87.27 | 131.47 | 100.04 | 119.84 | ||||
12/31/2014 | 75.56 | 145.70 | 81.89 | 96.93 | ||||
12/31/2015 | 10.10 | 140.27 | 56.28 | 63.99 | ||||
12/31/2016 | 16.72 | 161.27 | 76.88 | 86.14 | ||||
12/31/2017 | 9.55 | 189.83 | 81.26 | 83.51 | ||||
#36#
Market Price of and Dividends on Common Stock
Our common stock trades on the New York Stock Exchange under the symbol “PQ.” The following table lists high and low sales prices per share for the periods indicated. The prices per share of our common stock prior to the 1 for 4 reverse stock split effective for trading purposes on May 19, 2016 have been adjusted to reflect this stock split on a retroactive basis and may not represent actual transactions.
2016 | High | Low | |||||
1st Quarter | $ | 2.96 | $ | 1.32 | |||
2nd Quarter | 3.79 | 1.77 | |||||
3rd Quarter | 3.64 | 1.71 | |||||
4th Quarter | 4.51 | 2.83 | |||||
2017 | |||||||
1st Quarter | $ | 4.75 | $ | 2.56 | |||
2nd Quarter | 2.96 | 1.66 | |||||
3rd Quarter | 2.40 | 1.66 | |||||
4th Quarter | 2.36 | 1.50 | |||||
As of February 28, 2018, there were 132 common stockholders of record.
We have never paid a dividend on our common stock, cash or otherwise, and intend to retain our cash flow from operations for the future operation and development of our business. In addition, under our Multidraw Term Loan Agreement and the indentures governing the 2021 Notes and 2021 PIK Notes, and, in some circumstances, the terms of our Series B preferred stock, we are restricted from paying cash dividends on our common stock. The payment of future dividends, if any, will be determined by our Board of Directors in light of conditions then existing, including our earnings, financial condition, capital requirements, restrictions in financing agreements, business conditions and other factors. See Item 1A. “Risk Factors – Risks Relating to our Outstanding Common Stock – We do not intend to pay dividends on our common stock and our ability to pay dividends on our common stock is restricted.”
The following table sets forth certain information with respect to repurchases of our common stock during the quarter ended December 31, 2017.
Total Number of Shares Purchased (1) | Average Price Paid Per Share | Total Number of Shares Purchased as Part of Publicly Announced Plan or Program | Maximum Number (or Approximate Dollar Value) of Shares that May be Purchased Under the Plans or Programs | |||||||
October 1—October 31, 2017 | 241 | $ | 1.88 | — | — | |||||
November 1—November 30, 2017 | 22,229 | $ | 1.81 | — | — | |||||
December 1—December 31, 2017 | — | $ | — | — | — | |||||
(1) | All shares repurchased were surrendered by employees to pay tax withholding upon the vesting of restricted stock awards. |
#37#
Item 6. | Selected Financial Data |
The following table sets forth, as of the dates and for the periods indicated, selected financial information for the Company. The financial information for each of the five years in the period ended December 31, 2017 has been derived from the audited Consolidated Financial Statements of the Company for such periods. The information should be read in conjunction with “Management’s Discussion and Analysis of Financial Condition and Results of Operations” and the Consolidated Financial Statements and notes thereto. The following information is not necessarily indicative of future results of the Company. All amounts are stated in U.S. dollars unless otherwise indicated.
Year Ended December 31, | ||||||||||||||||||||
2017 | 2016 (1) | 2015 (2) | 2014 | 2013 | ||||||||||||||||
(in thousands except per share and per Mcfe data) | ||||||||||||||||||||
Average sales price per Mcfe | $ | 3.92 | $ | 2.84 | $ | 3.39 | $ | 5.19 | $ | 4.80 | ||||||||||
Revenues | 108,287 | 66,667 | 115,969 | 225,021 | 182,804 | |||||||||||||||
Net income (loss) available to common stockholders | (11,776 | ) | (96,245 | ) | (299,929 | ) | 26,051 | 8,943 | ||||||||||||
Net income (loss) available to common stockholders per share: | ||||||||||||||||||||
Basic | (0.55 | ) | (5.24 | ) | (18.45 | ) | 1.57 | 0.56 | ||||||||||||
Diluted | (0.55 | ) | (5.24 | ) | (18.45 | ) | 1.57 | 0.56 | ||||||||||||
Oil and gas properties, net | 106,055 | 89,062 | 165,952 | 683,812 | 581,242 | |||||||||||||||
Total assets | 164,298 | 144,860 | 379,319 | 786,108 | 660,018 | |||||||||||||||
Long-term debt, including current portion | 309,361 | 293,645 | 347,008 | 420,213 | 417,828 | |||||||||||||||
Stockholders’ equity | (248,935 | ) | (251,095 | ) | (163,067 | ) | 136,909 | 99,095 | ||||||||||||
(1) | The year ended December 31, 2016 includes a pre-tax ceiling test write-down of $40.3 million. |
(2) | The year ended December 31, 2015 includes a pre-tax ceiling test write-down of $266.6 million. |
Item 7.
MANAGEMENT’S DISCUSSION AND ANALYSIS OF
FINANCIAL CONDITION AND RESULTS OF OPERATIONS
Overview
PetroQuest Energy, Inc. is an independent oil and gas company incorporated in the State of Delaware with primary operations in Texas and Louisiana. We seek to grow our production, proved reserves, cash flow and earnings at low finding and development costs through a balanced mix of exploration, development and acquisition activities. From the commencement of our operations through 2002, we were focused exclusively in the Gulf Coast Basin with onshore properties principally in southern Louisiana and offshore properties in the shallow waters of the Gulf of Mexico shelf. During 2003, we began the implementation of our strategic goal of diversifying our reserves and production into longer life and lower risk onshore properties with our acquisition of the Carthage Field in East Texas. From 2005 through 2015, we further implemented this strategy by focusing our efforts in the Woodford Shale play in Oklahoma. In response to lower commodity prices and to strengthen our balance sheet, we sold all of our Oklahoma assets in three transactions that closed in June 2015, April 2016 and October 2016 (the "Oklahoma Divestitures"). See Note 2 - Acquisitions and Divestitures. In December 2017, we acquired approximately 24,600 gross acres in central Louisiana targeting the Austin Chalk to attempt to increase our oil production and reserves. During January 2018, we sold all of our Gulf of Mexico assets to further reduce our liabilities and strengthen our liquidity position.
Our liquidity position has been negatively impacted by the prolonged decline in commodity prices that began in late 2014. In response, we executed the following actions aimed at preserving liquidity, reducing overall debt levels and extending debt maturities:
• | Completed the Oklahoma Divestitures for $292.6 million; |
• | Completed two debt exchanges to extend maturities on a significant portion of debt; |
• | Reduced total debt 29% from $425 million at December 31, 2014 to $302.6 million at December 31, 2017; |
• | Entered into a new $50 million Multidraw Term Loan Agreement (as defined below) maturing in 2020; and |
#38#
• | Significantly reduced our capital expenditures in 2016 and secured a new drilling joint venture in East Texas to facilitate the restart of drilling operations at the end of 2016. |
In addition to extending the maturity on approximately $113.0 million of debt due in 2017 to 2021, our September 2016 debt exchange permitted us to reduce our cash interest expense on our 2021 PIK Notes (as defined below) from 10% cash to 1% cash and 9% payment-in-kind for the first three semi-annual interest payments ending with the February 2018 interest payment, which has provided us with approximately $31.6 million of cash interest savings during 2017 and 2018. To enhance our liquidity and provide capital to address the 10% Senior Notes due 2017 (the "2017 Notes") remaining outstanding after our debt exchanges, in October 2016, we entered into a new $50 million Multidraw Term Loan Agreement (the "Multidraw Term Loan Agreement") maturing in 2020, replacing our prior bank credit facility, which had no borrowing base on the date of termination. In March 2017, we utilized borrowings under the Multidraw Term Loan Agreement and cash on hand to redeem the remaining 2017 Notes.
Oil and gas prices realized in 2017 were more favorable than those realized in 2016. Stated on an Mcfe basis, unit prices received during the year ended December 31, 2017 were 38% higher than the prices received during the year ended December 31, 2016. During the first quarter of 2017, we recompleted our Thunder Bayou well in South Louisiana into a larger sand package and continued drilling under our East Texas joint venture drilling program, which commenced at the end of 2016. Under the drilling program, we drilled ten gross wells during 2017 of which eight were completed as of December 31, 2017. The remaining two wells were completed during the first quarter of 2018. As a result of our successful recompletion and drilling operations during 2017, we grew production and estimated proved reserves significantly during 2017 as compared to 2016. Our average daily production during the year ended December 31, 2017 increased 17% over average daily production during the year ended December 31, 2016 and our estimated proved reserves at December 31, 2017 grew 35% from 2016.
Critical Accounting Policies
Reserve Estimates
Our estimates of proved oil and gas reserves constitute those quantities of oil and gas, which, by analysis of geoscience and engineering data, can be estimated with reasonable certainty to be economically producible from a given date forward, from known reservoirs, and under existing economic conditions, operating methods, and government regulations prior to the time at which contracts providing the right to operate expire, unless evidence indicates that renewal is reasonably certain, regardless of whether deterministic or probabilistic methods are used for the estimation. At the end of each year, our proved reserves are estimated by independent petroleum engineers in accordance with guidelines established by the SEC. These estimates, however, represent projections based on geologic and engineering data. Reserve engineering is a subjective process of estimating underground accumulations of oil and gas that are difficult to measure. The accuracy of any reserve estimate is a function of the quantity and quality of available data, engineering and geological interpretation and professional judgment. Estimates of economically recoverable oil and gas reserves and future net cash flows necessarily depend upon a number of variable factors and assumptions, such as historical production from the area compared with production from other producing areas, the assumed effect of regulations by governmental agencies, and assumptions governing future oil and gas prices, future operating costs, severance taxes, development costs and workover costs. The future drilling costs associated with reserves assigned to proved undeveloped locations may ultimately increase to the extent that these reserves may be later determined to be uneconomic. Any significant variance in the assumptions could materially affect the estimated quantity and value of the reserves, which could affect the carrying value of our oil and gas properties and/or the rate of depletion of such oil and gas properties.
Disclosure requirements under Staff Accounting Bulletin No. 113 (“SAB 113”) include provisions that permit the use of new technologies to determine proved reserves if those technologies have been demonstrated empirically to lead to reliable conclusions about reserve volumes. The rules also allow companies the option to disclose probable and possible reserves in addition to the existing requirement to disclose proved reserves. The disclosure requirements also require companies to report the independence and qualifications of third party preparers of reserves and file reports when a third party is relied upon to prepare reserves estimates. Pricing is based on a 12-month, first day of month, average price during the 12-month period prior to the ending date of the balance sheet to report oil and natural gas reserves. In addition, the 12-month average is also used in the ceiling test calculation and to compute depreciation, depletion and amortization.
Full Cost Method of Accounting
We use the full cost method of accounting for our investments in oil and gas properties. Under this method, all acquisition, exploration and development costs, including certain related employee costs, incurred for the purpose of exploring for and developing oil and natural gas are capitalized. Acquisition costs include costs incurred to purchase, lease or otherwise acquire property. Exploration costs include the costs of drilling exploratory wells, including those in progress and geological and geophysical service costs in exploration activities. Development costs include the costs of drilling development wells and costs of completions, platforms, facilities and pipelines. Costs associated with production and general corporate activities are expensed
#39#
in the period incurred. Sales of oil and gas properties, whether or not being amortized currently, are accounted for as adjustments of capitalized costs, with no gain or loss recognized, unless such adjustments would significantly alter the relationship between capitalized costs and proved reserves of oil and gas.
The costs associated with unevaluated properties are not initially included in the amortization base and primarily relate to ongoing exploration activities, unevaluated leasehold acreage and delay rentals, seismic data and capitalized interest. These costs are either transferred to the amortization base with the costs of drilling the related well or are assessed quarterly for possible impairment or reduction in value.
We compute the provision for depletion of oil and gas properties using the unit-of-production method based upon production and estimates of proved reserve quantities. Unevaluated costs and related carrying costs are excluded from the amortization base until the properties associated with these costs are evaluated. In addition to costs associated with evaluated properties, the amortization base includes estimated future development costs related to non-producing reserves. Our depletion expense is affected by the estimates of future development costs, unevaluated costs and proved reserves, and changes in these estimates could have an impact on our future earnings.
We capitalize certain internal costs that are directly identified with acquisition, exploration and development activities. The capitalized internal costs include salaries, employee benefits, costs of consulting services and other related expenses and do not include costs related to production, general corporate overhead or similar activities. We also capitalize a portion of the interest costs incurred on our debt. Capitalized interest is calculated using the amount of our unevaluated properties and our effective borrowing rate.
Capitalized costs of oil and gas properties, net of accumulated depreciation, depletion and amortization ("DD&A") and related deferred taxes, are limited to the estimated future net cash flows from proved oil and gas reserves, including the effect of cash flow hedges in place, discounted at 10 percent, plus the lower of cost or fair value of unevaluated properties, as adjusted for related income tax effects (the full cost ceiling). If capitalized costs exceed the full cost ceiling, the excess is charged to write-down of oil and gas properties in the quarter in which the excess occurs.
Given the volatility of oil and gas prices, it is probable that our estimate of discounted future net cash flows from estimated proved oil and gas reserves will change in the near term. If oil or gas prices remain at current levels or decline further, even for only a short period of time, or if we have downward revisions to our estimated proved reserves, it is possible that further write-downs of oil and gas properties could occur in the future.
Future Abandonment Costs
Future abandonment costs include costs to dismantle and relocate or dispose of our production platforms, gathering systems, wells and related structures and restoration costs of land and seabed. We develop estimates of these costs for each of our properties based upon the type of production structure, depth of water, reservoir characteristics, depth of the reservoir, market demand for equipment, currently available procedures and consultations with construction and engineering consultants. Because these costs typically extend many years into the future, estimating these future costs is difficult and requires management to make estimates and judgments that are subject to future revisions based upon numerous factors, including changing technology, the timing of estimated costs, the impact of future inflation on current cost estimates and the political and regulatory environment.
Derivative Instruments
We seek to reduce our exposure to commodity price volatility by hedging a portion of our production through commodity derivative instruments. The estimated fair values of our commodity derivative instruments are recorded in the consolidated balance sheet. The changes in fair value of those derivative instruments that qualify for hedge accounting treatment are recorded in other comprehensive income (loss) until the hedged oil or natural gas quantities are produced. If a hedge becomes ineffective because the hedged production does not occur, or the hedge otherwise does not qualify for hedge accounting treatment, the changes in the fair value of the derivative are recorded in the income statement as derivative income (expense).
Our hedges are specifically referenced to NYMEX prices for oil and natural gas. We evaluate the effectiveness of our hedges at the time we enter the contracts, and periodically over the life of the contracts, by analyzing the correlation between NYMEX and the posted prices we receive from our designated production. Through this analysis, we are able to determine if a high correlation exists between the prices received for the designated production and the NYMEX price at which the hedges will be settled. At December 31, 2017, our derivative instruments were designated effective cash flow hedges.
Estimating the fair value of derivative instruments requires valuation calculations incorporating estimates of future NYMEX prices, discount rates and price movements. As a result, we calculate the fair value of our commodity derivatives using an independent third-party’s valuation model that utilizes market-corroborated inputs that are observable over the term of the
#40#
derivative contract. Our fair value calculations also incorporate an estimate of the counterparties’ default risk for derivative assets and an estimate of our default risk for derivative liabilities.
Results of Operations
The following table sets forth certain information with respect to our oil and gas operations for the periods noted. These historical results are not necessarily indicative of results to be expected in future periods.
Year Ended December 31, | |||||||||||
2017 | 2016 | 2015 | |||||||||
Production: | |||||||||||
Oil (Bbls) | 591,558 | 502,201 | 528,529 | ||||||||
Gas (Mcf) | 19,610,964 | 16,616,578 | 25,501,851 | ||||||||
Ngl (Mcfe) | 4,452,817 | 3,870,947 | 5,487,239 | ||||||||
Total Production (Mcfe) | 27,613,129 | 23,500,731 | 34,160,264 | ||||||||
Sales: | |||||||||||
Total oil sales | $ | 31,258,109 | $ | 20,613,964 | $ | 26,532,240 | |||||
Total gas sales | 60,922,072 | 37,962,622 | 75,070,130 | ||||||||
Total ngl sales | 16,107,068 | 8,090,292 | 14,367,024 | ||||||||
Total oil and gas sales | $ | 108,287,249 | $ | 66,666,878 | $ | 115,969,394 | |||||
Average sales prices: | |||||||||||
Oil (per Bbl) | $ | 52.84 | $ | 41.05 | $ | 50.20 | |||||
Gas (per Mcf) | 3.11 | 2.28 | 2.94 | ||||||||
Ngl (per Mcfe) | 3.62 | 2.09 | 2.62 | ||||||||
Per Mcfe | 3.92 | 2.84 | 3.39 | ||||||||
The above sales and average sales prices include increases to revenue related to the settlement of gas hedges of $1,461,000, $1,811,000 and $15,940,000, for the year ended December 31, 2017, 2016 and 2015, respectively. There were no settlements of Ngl or oil hedges for the years ended December 31, 2017 and 2016. The above sales and average sales prices include $530,000 and $644,000 related to settlements of Ngl and oil hedges, respectively, for the year ended December 31, 2015.
Comparison of Results of Operations for the Years Ended December 31, 2017 and 2016
Net loss available to common stockholders totaled $11,776,000 and $96,245,000 for the years ended December 31, 2017 and 2016, respectively. The primary fluctuations were as follows:
Production Total production increased 17% during the year ended December 31, 2017 as compared to the 2016 period. The increase in total production was due primarily to the successful drilling of eight East Texas wells and the successful recompletions of our Thunder Bayou well in the first quarter of 2017 and our Tokay well during the third quarter of 2017. Partially offsetting these increases were decreases due to the 2016 Oklahoma Divestitures and normal production declines at our legacy Gulf Coast and East Texas fields as a result of the reduction in capital expenditures during 2016. During January 2018, we sold our Gulf of Mexico assets, which accounted for approximately 25% of our total 2017 production, including 51%, 24% and 10% of our oil, gas and Ngl production, respectively. Excluding the Gulf of Mexico production during 2017, we expect our total production during 2018 to approximate production during 2017.
Gas production during the year ended December 31, 2017 increased 18% from the 2016 period. The increase in gas production was primarily the result of our successful East Texas drilling program and the successful recompletions of our Thunder Bayou and Tokay wells. Partially offsetting these increases were decreases due to the 2016 Oklahoma Divestitures and normal production declines at our legacy Gulf Coast and East Texas fields. Excluding the Gulf of Mexico production during 2017, we expect our 2018 average daily gas production to approximate the average daily gas production realized during 2017.
Oil production during the year ended December 31, 2017 increased 18% as compared to the 2016 period as a result of the successful recompletions of our Thunder Bayou and Tokay wells as well as our successful East Texas drilling program. Partially offsetting these increases was a decrease as a result of the sale of our E. Lake Verret field during the second quarter of 2017. Excluding the Gulf of Mexico production during 2017, we expect our 2018 average daily oil production to approximate the average daily oil production realized during 2017.
Ngl production during the year ended December 31, 2017 increased 15% from the 2016 period primarily due to the successful recompletion of our Thunder Bayou well during the first quarter of 2017 and our successful drilling program in East Texas. These
#41#
increases were partially offset by normal production declines at our legacy Gulf Coast and East Texas fields. Excluding the Gulf of Mexico production during 2017, we expect our 2018 average daily Ngl production to approximate the average daily Ngl production realized during 2017.
Prices Including the effects of our hedges, average gas prices per Mcf for the year ended December 31, 2017 were $3.11 as compared to $2.28 for the 2016 period. Average oil prices per Bbl for the year ended December 31, 2017 were $52.84 as compared to $41.05 for the 2016 period and average Ngl prices per Mcfe were $3.62 for the year ended December 31, 2017, as compared to $2.09 for the 2016 period. Stated on an Mcfe basis, unit prices received during the year ended December 31, 2017 were 38% higher than the prices received during the 2016 period.
Revenue Including the effects of hedges, oil and gas sales during the twelve months ended December 31, 2017 increased 62% to $108,287,000, as compared to oil and gas sales of $66,667,000 during the 2016 period. This increase was primarily the result of higher average realized prices for our production during 2017 as well as the production increases noted above.
Expenses Lease operating expenses for the year ended December 31, 2017 totaled $33,162,000, or $1.20 per Mcfe, as compared to $28,508,000, or $1.21 per Mcfe, during the 2016 period. The increase in total lease operating expenses for the year ended December 31, 2017 is primarily a result of the increases in production noted above. We expect lease operating expenses during 2018 to decrease on an absolute value basis and a per unit basis as compared to 2017 as a result of the Gulf of Mexico sale.
Production taxes for the year ended December 31, 2017 totaled $3,302,000, or $0.12 per Mcfe, as compared to $354,000, or $0.02 per Mcfe, during the 2016 period. The increase in total and per unit production taxes during 2017 was primarily due to the receipt in 2016 of $1,292,000 of production tax refunds on certain of our East Texas wells that qualified for a gas tax credit. No such refunds were received during 2017. Additionally, as severance taxes for the majority of our properties that are subject to severance taxes are assessed on the value of oil and gas sales, the amount also increased as a result of the increase in revenue noted above. Additionally, the expiration of the two-year severance tax exemption on our Thunder Bayou well in June 2017 contributed to the increase.
General and administrative expenses during the year ended December 31, 2017 totaled $15,860,000 as compared to $26,040,000 during the 2016 period. General and administrative expenses decreased 39% during the year ended December 31, 2017 primarily due to the inclusion of $10,139,000 of costs related to the issuance of the 2021 Notes and 2021 PIK Notes during 2016. ASC Topic 470-60 "Troubled Debt Restructurings by Debtors" requires financing costs related to a troubled debt restructuring to be expensed in the period incurred. Included in general and administrative expenses for 2017 are share-based compensation costs, net of amounts capitalized, of $1,546,000, compared to $1,582,000 during the 2016 period. We capitalized $7,011,000 of general and administrative costs during the year ended December 31, 2017 as compared to $6,623,000 during the comparable 2016 period.
Depreciation, depletion and amortization ("DD&A") expense on oil and gas properties for the year ended December 31, 2017 totaled $31,667,000, or $1.15 per Mcfe, as compared to $27,962,000, or $1.19 per Mcfe, during the comparable 2016 period. The decrease in the per unit DD&A rate is primarily the result of the impact of prior year ceiling test write-downs as well as the success of our East Texas drilling program.
At December 31, 2016, the prices used in computing the estimated future net cash flows from our estimated proved reserves, including the effect of hedges in place at that date, averaged $2.51 per Mcf of natural gas, $40.85 per barrel of oil and $1.82 per Mcfe of natural gas liquids, respectively. As a result of lower commodity prices and their negative impact on our estimated proved reserves and estimated future net cash flows, we recognized a ceiling test write-down of approximately $40,304,000 during the year ended December 31, 2016. No such write-down was recognized during 2017. See Note 11, "Ceiling Test" for further discussion of the ceiling test write-down. Utilizing current strip prices for oil and gas prices for the first quarter of 2018 and projecting the effect on the estimated future net cash flows from our estimated proved reserves as of March 31, 2018, we do not expect to recognize a ceiling test write-down during the first quarter of 2018.
Interest expense, net of amounts capitalized on unevaluated properties, totaled $28,836,000 during the year ended December 31, 2017, as compared to $30,019,000 during 2016. During the year ended December 31, 2017, our capitalized interest totaled $1,571,000 as compared to $935,000 during the 2016 period. The terms of our 2021 PIK Notes allowed us the option to pay interest on the 2021 PIK Notes at 1% cash and 9% payment in kind through the payment due February 15, 2018. Starting with the interest payment due on August 15, 2018, we will be required to pay the entire 10% interest in cash. Therefore, although our total interest expense for the year ended 2018 is expected to approximate interest expense during 2017, we expect our cash interest expense to be significantly higher during 2018 as compared to 2017.
Income tax (benefit) expense during the year ended December 31, 2017 totaled ($949,000), as compared to $543,000 during the 2016 period. We typically provide for income taxes at the statutory federal income tax rate adjusted for permanent differences expected to be realized, primarily statutory depletion, non-deductible stock compensation expenses and state income taxes.
#42#
As a result of the ceiling test write-downs recognized in 2016 and prior years, we have incurred a three-year cumulative loss. Because of the impact the cumulative loss has on the determination of the recoverability of deferred tax assets through future earnings, we assessed the realizability of our deferred tax assets based on the future reversals of existing deferred tax liabilities. Accordingly, we established a valuation allowance for a portion of our deferred tax asset. The valuation allowance was $115,906,000 as of December 31, 2017.
The Tax Cuts and Jobs Act (the “Act”) was enacted on December 22, 2017. We have not yet completed our accounting for the tax effects of enactment of the Act. However, we have made a reasonable estimate of the effects on existing deferred tax balances and recognized a provisional amount of approximately $64.9 million to remeasure deferred tax assets and liabilities based on the rates at which they are expected to reverse in the future, which is generally 21%. This amount is included as a component of income tax expense (benefit) from continuing operations and is fully offset by the related adjustment to the valuation allowance. We are still analyzing certain aspects of the Act and refining our calculations, which could potentially affect the measurement of these balances or potentially give rise to new deferred tax amounts. See Note 13, “Income Taxes” for further discussion.
Comparison of Results of Operations for the Years Ended December 31, 2016 and 2015
Net loss available to common stockholders totaled $96,245,000 and $299,929,000 for the years ended December 31, 2016 and 2015, respectively. The primary fluctuations were as follows:
Production Total production decreased 31% during the year ended December 31, 2016 as compared to the 2015 period. The decrease in total production was due primarily to the Oklahoma Divestitures and normal production declines at our Gulf Coast and East Texas fields as a result of the reduction in capital expenditures during 2016.
Gas production during the year ended December 31, 2016 decreased 35% from the 2015 period. The decrease in gas production was primarily the result of the Oklahoma Divestitures and normal production declines at our Gulf Coast and East Texas fields.
Oil production during the year ended December 31, 2016 decreased 5% as compared to the 2015 period due primarily to normal production declines at our Gulf Coast and East Texas fields and downtime due to pipeline constraints at one of our Gulf of Mexico properties.
Ngl production during the year ended December 31, 2016 decreased 29% from the 2015 period primarily due to the Oklahoma Divestitures and normal production declines at certain of our Gulf Coast and East Texas fields.
Prices Including the effects of our hedges, average gas prices per Mcf for the year ended December 31, 2016 were $2.28 as compared to $2.94 for the 2015 period. Average oil prices per Bbl for the year ended December 31, 2016 were $41.05 as compared to $50.20 for the 2015 period and average Ngl prices per Mcfe were $2.09 for the year ended December 31, 2016, as compared to $2.62 for the 2015 period. Stated on an Mcfe basis, unit prices received during the year ended December 31, 2016 were 16% lower than the prices received during the 2015 period.
Revenue Including the effects of hedges, oil and gas sales during the twelve months ended December 31, 2016 decreased 43% to $66,667,000, as compared to oil and gas sales of $115,969,000 during the 2015 period. The decreased revenue during 2016 was primarily the result of the decreased production during 2016 as discussed above, as well as lower average realized prices.
Expenses Lease operating expenses for the year ended December 31, 2016 totaled $28,508,000, or $1.21 per Mcfe, as compared to $40,130,000, or $1.17 per Mcfe, during the 2015 period. The decrease in total lease operating expenses for the year ended December 31, 2016 is primarily a result of the Oklahoma Divestitures. Additionally, lease operating expenses decreased overall at our Gulf Coast and East Texas fields as a result of certain cost saving measures put in place during 2016.
Production taxes for the year ended December 31, 2016 totaled $354,000, or $0.02 per Mcfe, as compared to $2,470,000, or $0.07 per Mcfe, during the 2015 period. The decrease in total production taxes was primarily due to the receipt in 2016 of $1,292,000 of production tax refunds on certain of our East Texas wells that qualified for a gas tax credit. Additionally, production taxes decreased as a result of lower commodity prices for our production during the 2016 period as compared to the 2015 period. The majority of our properties that are subject to severance taxes are assessed on the oil and gas sales value.
General and administrative expenses during the year ended December 31, 2016 totaled $26,040,000 as compared to $20,777,000 during the 2015 period. General and administrative expenses increased 25% during the year ended December 31, 2016 primarily due to the inclusion of $10,139,000 of costs related to the issuance of the 2021 Notes and 2021 PIK Notes. ASC Topic 470-60 "Troubled Debt Restructurings by Debtors" requires financing costs related to a troubled debt restructuring to be expensed in the period incurred. Offsetting this increase were lower employee related costs, including share-based compensation. Included in general and administrative expenses for 2016 are share-based compensation costs, net of amounts capitalized, of $1,582,000, compared to $4,388,000 during the 2015 period. We capitalized $6,623,000 of general and administrative costs during the year ended December 31, 2016 as compared to $8,210,000 during the comparable 2015 period.
#43#
Depreciation, depletion and amortization ("DD&A") expense on oil and gas properties for the year ended December 31, 2016 totaled $27,962,000, or $1.19 per Mcfe, as compared to $62,138,000, or $1.82 per Mcfe, during the comparable 2015 period. The decrease in the per unit DD&A rate is primarily the result of a ceiling test write-down.
At December 31, 2016, the prices used in computing the estimated future net cash flows from our estimated proved reserves, including the effect of hedges in place at that date, averaged $2.51 per Mcf of natural gas, $40.85 per barrel of oil and $1.82 per Mcfe of natural gas liquids, respectively. As a result of lower commodity prices and their negative impact on our estimated proved reserves and estimated future net cash flows, we recognized a ceiling test write-down of approximately $40,304,000 during the year ended December 31, 2016. At December 31, 2015, the prices used in computing the estimated future net cash flows from our estimated proved reserves, including the effect of hedges in place at that date, averaged $2.42 per Mcf of natural gas, $50.29 per barrel of oil and $2.21 per Mcfe of natural gas liquids, respectively. As a result of lower commodity prices and their negative impact on our estimated proved reserves and estimated future net cash flows, we recognized a ceiling test write-down of approximately $266,562,000 during the year ended December 31, 2015. See Note 11, "Ceiling Test" for further discussion of the ceiling test writedown.
Interest expense, net of amounts capitalized on unevaluated properties, totaled $30,019,000 during the year ended December 31, 2016, as compared to $33,766,000 during 2015. During the year ended December 31, 2016, our capitalized interest totaled $935,000 as compared to $4,671,000 during the 2015 period. The decrease in interest expense was a result of the February 2016 debt exchange, including a $1,479,000 non-cash reduction related to the amortization of the excess carrying value of the 2017 Notes tendered in the February 2016 debt exchange and the 2021 Notes tendered in the September 2016 debt exchange (see Note 9 - Long-Term Debt). In addition, during the February 2016 debt exchange, we redeemed $53,627,000 of 2017 Notes with cash on hand. Partially offsetting this decrease in interest expense was the decrease in capitalized interest as a result of lower unevaluated oil and gas properties.
Income tax expense during the year ended December 31, 2016 totaled $543,000, as compared to $2,626,000 during the 2015 period. We typically provide for income taxes at the statutory federal income tax rate adjusted for permanent differences expected to be realized, primarily statutory depletion, non-deductible stock compensation expenses and state income taxes.
As a result of the ceiling test write-downs recognized, we have incurred a three-year cumulative loss. Because of the impact the cumulative loss has on the determination of the recoverability of deferred tax assets through future earnings, we assessed the realizability of our deferred tax assets based on the future reversals of existing deferred tax liabilities. Accordingly, we established a valuation allowance for a portion of our deferred tax asset. The valuation allowance was $177,405,000 as of December 31, 2016.
Liquidity and Capital Resources
We have historically financed our acquisition, exploration and development activities principally through cash flow from operations, borrowings from banks and other lenders, issuances of equity and debt securities, joint ventures and sales of assets. However, our liquidity position has been negatively impacted by the prolonged decline in commodity prices that began in late 2014. In response to lower commodity prices, we executed a number of transactions aimed at preserving liquidity, reducing overall debt levels and extending debt maturities. Through these transactions, which included two debt exchanges, we refinanced or repaid all debt that was scheduled to mature in 2017 and reduced total debt 29% from $425 million at December 31, 2014 to $302.6 million at December 31, 2017. In addition to extending the maturity on the majority of our debt that was due in 2017, our September 2016 debt exchange permitted us to reduce our cash interest expense on our 2021 PIK Notes from 10% cash to 1% cash and 9% payment-in-kind for the first three semi-annual interest payments ending with the February 2018 interest payment, which provided us with approximately $31.6 million of total cash interest savings during 2017 and 2018. However, beginning with the interest payment for the 2021 PIK Notes due on August 15, 2018, we will be required to pay the entire 10% interest payment in cash. As a result, we expect our cash interest expense to be significantly higher during 2018 as compared to 2017. For additional information, see "Source of Capital: Debt" below.
At December 31, 2017 we had a working capital deficit of $5.9 million compared to a working capital deficit of $37.8 million at December 31, 2016. The increase in our working capital is primarily due to the redemption on March 31, 2017 of our remaining 2017 Notes as discussed in "Source of Capital: Debt" below. Additionally, our working capital was positively impacted by the reclassification to Current Assets of the $8.3 million of cash collateral provided to support the surety bonds that secure our offshore decommissioning obligations that we expect to receive during 2018, as a result of the sale of our Gulf of Mexico assets in January 2018. See "Source of Capital: Divestitures" below.
Source of Capital: Operations
Net cash flow provided by (used in) operations increased from $(56.6) million during the year ended December 31, 2016 to $44.2 million during the 2017 period. The increase in operating cash flow during 2017 as compared to 2016 was primarily
#44#
attributable to increases in oil and gas revenues as well as the timing of payment of payables based on operational activity. Our operating cash flow during 2018 is expected to be negatively impacted by higher cash interest expense related to our 2021 PIK Notes.
Source of Capital: Divestitures
We do not budget property divestitures; however, we are continuously evaluating our property base to determine if there are assets in our portfolio that no longer meet our strategic objectives. From time to time we may divest certain assets in order to provide liquidity to strengthen our balance sheet or provide capital to be reinvested in higher rate of return projects. We cannot assure you that we will be able to sell any of our assets in the future.
On January 31, 2018, we sold our Gulf of Mexico properties effective December 1, 2017. Although we received no cash proceeds from the sale of these properties and are required to contribute approximately $3.8 million toward future abandonment costs, we will no longer have an obligation for $35.4 million of estimated undiscounted future abandonment costs related to the properties sold effective December 31, 2017. Additionally, we expect to receive a refund of $10.7 million related to a depositary account that served to collateralize a portion of our offshore bonds related to these properties (subject to our obligation to pay approximately $3.8 million to the purchaser of these properties). The depositary account is comprised of $8.3 million we had paid as of December 31, 2017 plus an additional $2.4 million that we paid in January 2018 and February 2018. See "Item 1A Risk Factors - Risks Related to Our Business, Industry and Strategy - Our ability to receive a refund of our cash deposits posted as collateral to support certain bonds that satisfy our offshore decommissioning obligations with respect to our recently sold Gulf of Mexico assets is dependent on the successful assumption of operatorship and the posting of bonds or other acceptable assurances with respect to these assets by the purchaser of the assets".
In 2016, we sold our remaining assets in Oklahoma for approximately $18.5 million.
Source of Capital: Debt
On August 19, 2010, we issued $150 million in principal amount of our 10% Senior Notes due 2017. On July 3, 2013, we issued an additional $200 million in principal amount of our 10% Senior Notes due 2017 (collectively, the "2017 Notes").
On February 17, 2016, we closed a private exchange offer (the "February Exchange") and consent solicitation (the "February Consent Solicitation") to certain eligible holders of our outstanding 2017 Notes. In satisfaction of the tender of $214.4 million in aggregate principal amount of the 2017 Notes, representing approximately 61% of the then outstanding aggregate principal amount of 2017 Notes, we (i) paid approximately $53.6 million of cash, (ii) issued $144.7 million aggregate principal amount of our new 10% Second Lien Senior Secured Notes due 2021 (the "2021 Notes") and (iii) issued approximately 1.1 million shares of common stock. Following the completion of the February Exchange, $135.6 million in aggregate principal amount of the 2017 Notes remained outstanding. The February Consent Solicitation eliminated or waived substantially all of the restrictive covenants contained in the indenture governing the 2017 Notes.
On September 27, 2016, we closed private exchange offers (the "September Exchange") and a consent solicitation (the "September Consent Solicitation") to certain eligible holders of our outstanding 2017 Notes and 2021 Notes. In satisfaction of the consideration of $113.0 million in aggregate principal amount of the 2017 Notes, representing approximately 83% of the then outstanding aggregate principal amount of 2017 Notes, and $130.5 million in aggregate principal amount of the 2021 Notes, representing approximately 90% of the then outstanding aggregate principal amount of 2021 Notes, we issued (i) $243.5 million in aggregate principal amount of our new 10% Second Lien Senior Secured PIK Notes due 2021 (the "2021 PIK Notes") and (ii) approximately 3.5 million shares of common stock. We also paid, in cash, accrued and unpaid interest on the 2017 Notes and 2021 Notes accepted in the September Exchange from the last applicable interest payment date to, but not including, September 27, 2016. Following the consummation of the September Exchange, there were $22.7 million in aggregate principal amount of the 2017 Notes outstanding and $14.2 million in aggregate principal amount of the 2021 Notes outstanding. The September Consent Solicitation amended certain provisions of the indenture governing the 2021 Notes and amended the registration rights agreement with respect to the 2021 Notes.
On March 31, 2017, we redeemed our remaining outstanding 2017 Notes at a redemption price of $22.8 million. The redemption was funded by cash on hand and $20 million borrowed under the Multidraw Term Loan Agreement described below. On December 28, 2017, we issued 2.2 million shares of common stock to extinguish $4.8 million of outstanding principal amount of 2021 Notes.
The 2021 PIK Notes bear interest at a rate of 10% per annum on the principal amount and interest is payable semi-annually in arrears on February 15 and August 15 of each year. We were permitted, at our option, for one or more of the first three interest payment dates of the 2021 PIK Notes ending with the February 2018 interest payment, to instead pay interest at (i) the annual rate of 1% in cash plus (ii) the annual rate of 9% PIK (the "PIK Interest") payable by increasing the principal amount outstanding of the 2021 PIK Notes or by issuing additional 2021 PIK Notes in certificated form. We exercised this PIK option in connection with the interest payments due on February 15, 2017, August 15, 2017 and February 15, 2018. As of the date hereof, we are in compliance with all of the covenants under the 2021 PIK Notes.
#45#
The 2021 Notes bear interest at a rate of 10% per annum on the principal amount and interest is payable semi-annually in arrears on February 15 and August 15 of each year. As of the date hereof, we are in compliance with all of the covenants under the 2021 Notes.
The February Exchange and September Exchange were accounted for as troubled debt restructurings pursuant to Accounting Standards Codification ("ASC") Topic 470-60 "Troubled Debt Restructurings by Debtors." We determined that the future undiscounted cash flows from the 2021 PIK Notes issued in the September Exchange through the maturity date exceeded the adjusted carrying amount of the 2017 Notes and the 2021 Notes tendered in the September Exchange. Accordingly, no gain or loss on extinguishment of debt was recognized in connection with the September Exchange. The net shortfall of the remaining carrying value of the 2017 Notes and 2021 Notes tendered as compared to the principal amount of the 2021 PIK Notes issued in the September Exchange of $0.6 million is reflected as part of the carrying value of the 2021 PIK Notes. Such shortfall is being amortized under the effective interest method as an addition to interest expense over the term of the 2021 PIK Notes. At December 31, 2017, $0.5 million of the shortfall remained as part of the carrying value of the 2021 PIK Notes and we recognized $0.1 million of amortization expense as an increase to interest expense during the year ended December 31, 2017.
We previously determined that the future undiscounted cash flows from the 2021 Notes issued in the February Exchange through the maturity date exceeded the adjusted carrying amount of the 2017 Notes tendered in the February Exchange. Accordingly, no gain on extinguishment of debt was recognized in connection with the February Exchange. The excess of the remaining carrying value of the 2017 Notes tendered over the principal amount of the 2021 Notes issued in the February Exchange of $13.9 million was reflected as part of the carrying value of the 2021 Notes. The amount of the excess carrying value attributable to the 2021 Notes tendered in the September Exchange is now reflected as part of the carrying value of the 2021 PIK Notes. The excess carrying value attributable to the remaining 2021 Notes is being amortized under the effective interest method over the term of the 2021 Notes. At December 31, 2017, $0.6 million of the excess remained as part of the carrying value of the 2021 Notes and we recognized $0.6 million of amortization expense as a reduction to interest expense during the year ended December 31, 2017.
The indentures governing the 2021 PIK Notes and the 2021 Notes contain affirmative and negative covenants that, among other things, limit our ability and the ability of the subsidiary guarantors of the 2021 PIK Notes and the 2021 Notes to incur indebtedness; purchase or redeem stock; make certain investments; create liens that secure debt; enter into transactions with affiliates; sell assets; refinance certain indebtedness; merge with or into other companies or transfer substantially all of our assets; and, in certain circumstances, to pay dividends or make other distributions on stock. The 2021 PIK Notes and the 2021 Notes are fully and unconditionally guaranteed on a senior basis by certain of our wholly-owned subsidiaries.
The 2021 PIK Notes and the 2021 Notes are equally and ratably secured by second-priority liens on substantially all of our and the subsidiary guarantors' oil and gas properties and substantially all of our other assets to the extent such properties and assets secure the Multidraw Term Loan Agreement (as defined below), except for certain excluded assets. Pursuant to the terms of an intercreditor agreement, the security interest in those properties and assets that secure the 2021 PIK Notes and the 2021 Notes and the guarantees are contractually subordinated to liens that secure the Multidraw Term Loan Agreement and certain other permitted indebtedness. Consequently, the 2021 PIK Notes and the 2021 Notes and the guarantees will be effectively subordinated to the Multidraw Term Loan Agreement and such other indebtedness to the extent of the value of such assets.
On October 17, 2016, we entered into the Multidraw Term Loan Agreement (the "Multidraw Term Loan Agreement") with Franklin Custodian Funds - Franklin Income Fund ("Franklin"), as a lender, and Wells Fargo Bank, National Association, as administrative agent, replacing the credit agreement with JPMorgan Chase Bank, N.A. The Multidraw Term Loan Agreement provides a multi-advance term loan facility, with borrowing availability for three years, in a principal amount of up to $50.0 million. The loans drawn under the Multidraw Term Loan Agreement (collectively, the “Term Loans”) may be used to repay existing debt, including the 2017 Notes, to pay transaction fees and expenses, to provide working capital for exploration and production operations and for general corporate purposes. The Term Loans mature on October 17, 2020. As of the date hereof, we have $30.0 million of borrowings outstanding under the Term Loans.
Our obligations under the Multidraw Term Loan Agreement and the Term Loans are secured by a first priority lien on substantially all of our assets, including a lien on all equipment and at least 90% of the aggregate total value of our oil and gas properties, a pledge of the equity interests of PetroQuest Energy, L.L.C. (the "Borrower") and certain of our other subsidiaries, and corporate guarantees by us and certain of our other subsidiaries of the indebtedness of the Borrower. Term Loans under the Multidraw Term Loan Agreement bear interest at the rate of 10% per annum.
We are subject to a restrictive financial covenant under the Multidraw Term Loan Agreement, consisting of maintaining a ratio of (i) the present value, discounted at 10% per annum, of the estimated future net revenues in respect of our oil and gas properties, before any state, federal, foreign or other income taxes, attributable to proved developed reserves, using three-year strip prices in effect at the end of each calendar quarter, including swap agreements in place at the end of each quarter, to (ii) the sum of the outstanding Term Loans and the then outstanding commitments to provide Term Loans, that shall not be less than 2.0 to 1.0 as measured on the last day of each calendar quarter (the "Coverage Ratio").
#46#
Sales of our oil and gas properties outside the ordinary course of business are limited under the terms of the Multidraw Term Loan Agreement. In addition, the Multidraw Term Loan Agreement prohibits us from declaring and paying dividends on our Series B Preferred Stock.
The Multidraw Term Loan Agreement also includes customary restrictions with respect to debt, liens, dividends, distributions and redemptions, investments, loans and advances, nature of business, international operations and foreign subsidiaries, leases, sale or discount of receivables, mergers or consolidations, sales of properties, transactions with affiliates, negative pledge agreements, gas imbalances and swap agreements. As of the date hereof, no default or event of default exists under the Multidraw Term Loan Agreement and we were in compliance with all covenants contained in the Multidraw Term Loan Agreement including the Coverage Ratio.
The following table reconciles the face value of the 2017 Notes, 2021 Notes, 2021 PIK Notes and Term Loans to the carrying value included in our Consolidated Balance Sheet as of December 31, 2017 and 2016 (in thousands):
December 31, 2017 | December 31, 2016 | ||||||||||||||||||||||||
2017 Notes | 2021 Notes | 2021 PIK Notes | Term Loans | 2017 Notes | 2021 Notes | 2021 PIK Notes | Term Loans | ||||||||||||||||||
Face Value | $ | — | $ | 9,427 | $ | 263,202 | $ | 30,000 | $ | 22,650 | $ | 14,177 | $ | 243,468 | $ | 10,000 | |||||||||
Unamortized Deferred Financing Costs | — | (212 | ) | — | (2,037 | ) | (82 | ) | (108 | ) | — | (2,751 | ) | ||||||||||||
Excess (shortfall) Carrying Value | — | 606 | (508 | ) | — | — | 1,159 | (590 | ) | — | |||||||||||||||
Accrued PIK Interest | — | — | 8,883 | — | — | — | 5,722 | — | |||||||||||||||||
Carrying Value | $ | — | $ | 9,821 | $ | 271,577 | $ | 27,963 | $ | 22,568 | $ | 15,228 | $ | 248,600 | $ | 7,249 | |||||||||
Use of Capital: Exploration and Development
Our 2018 capital budget is expected to be substantially reduced as compared to 2017 as a result of the expected increase in our cash interest expense during 2018. Because we operate the majority of our drilling activities, we expect to be able to control the timing of a substantial portion of our capital investments. We plan to fund our capital expenditures with cash flow from operations and cash on hand. To the extent additional capital is required, we may utilize our Multidraw Term Loan Agreement, sales of equity or debt securities, evaluate the sale of additional assets, enter into joint venture arrangements or we may reduce our capital expenditures to manage our liquidity position.
Use of Capital: Acquisitions
On December 20, 2017, we entered into an oil focused play in central Louisiana targeting the Austin Chalk formation through the execution of agreements to acquire interests in approximately 24,600 gross acres for a purchase price of approximately $9.3 million and the issuance of 2.0 million shares of common stock. We plan to drill our initial horizontal test well during the second quarter of 2018 utilizing data from existing vertical and unfracked horizontal wells that have been drilled in the area.
We do not budget acquisitions; however, we are continuously evaluating opportunities to expand our existing asset base or establish positions in new core areas.
We expect to finance our future acquisition activities, if consummated, with cash on hand, sales of equity or debt securities, borrowings under our Multidraw Term Loan Agreement, sales of properties or assets or joint venture arrangements with industry partners, if necessary. We cannot assure you that such additional financings will be available on acceptable terms, if at all.
#47#
Contractual Obligations
The following table summarizes our contractual obligations as of December 31, 2017 (in thousands):
Total | 2018 | 2019 | 2020 | 2021 | 2022 | After 2022 | |||||||||||||||||||||
10% senior secured notes due 2021 (1) | $ | 12,727 | $ | 943 | $ | 943 | $ | 943 | $ | 9,898 | $ | — | $ | — | |||||||||||||
10% senior secured PIK Notes due 2021 (1) | 358,876 | 15,068 | 27,505 | 27,505 | 288,798 | — | — | ||||||||||||||||||||
Multidraw Term Loan (1) | 39,126 | 3,042 | 3,042 | 33,042 | — | — | — | ||||||||||||||||||||
Operating leases (2) | 4,967 | 1,278 | 1,242 | 1,175 | 447 | 433 | 392 | ||||||||||||||||||||
Asset retirement obligations (3) | 46,906 | 674 | 1,089 | 6,597 | 21,794 | 3,773 | 12,979 | ||||||||||||||||||||
Other commitments (4) | 20,679 | 5,504 | 4,725 | 4,100 | 3,850 | 1,250 | 1,250 | ||||||||||||||||||||
Total | $ | 483,281 | $ | 26,509 | $ | 38,546 | $ | 73,362 | $ | 324,787 | $ | 5,456 | $ | 14,621 | |||||||||||||
(1) Includes principal and estimated interest.
(2) Consists primarily of leases for office space and office equipment.
(3) Consists of estimated undiscounted future obligations to abandon our oil and gas properties. As a result of the sale of our Gulf of Mexico assets in January 2018, $35.4 million of this undiscounted obligation was eliminated (see Note 6).
(4) Consists of volumetric commitments in East Texas.
Item 7A Quantitative and Qualitative Disclosures About Market Risk
We experience market risks primarily in commodity prices. Because all of our properties are located within the United States, we believe that our business operations are not exposed to significant market risks relating to foreign currency exchange risk.
Our revenues are derived from the sale of our crude oil, natural gas, and natural gas liquids production. Based on projected annual sales volumes for 2018, a 10% decline in the estimated average prices we expect to receive for our crude oil, natural gas and natural gas liquids production would result in an approximate $5.2 million decline in our revenues for 2018.
We periodically seek to reduce our exposure to commodity price volatility by hedging a portion of our production through commodity derivative instruments. In the settlement of a typical hedge transaction, we will have the right to receive from the counterparties to the hedge the excess of the fixed price specified in the hedge over a floating price based on a market index, multiplied by the quantity hedged. If the floating price exceeds the fixed price, we are required to pay the counterparties this difference multiplied by the quantity hedged. During the year ended December 31, 2017, we received approximately $1.5 million from the counterparties to our derivative instruments in connection with net hedge settlements.
We are required to pay the difference between the floating price and the fixed price (when the floating price exceeds the fixed price) regardless of whether we have sufficient production to cover the quantities specified in the hedge. Significant reductions in production at times when the floating price exceeds the fixed price could require us to make payments under the hedge agreements even though such payments are not offset by sales of production. Hedging will also prevent us from receiving the full advantage of increases in oil or gas prices above the fixed amount specified in the hedge.
Our Multidraw Term Loan Agreement requires that the counterparties to our hedge contracts be rated A-/A3 or higher by S&P or Moody’s. Currently, the counterparties to our existing hedge contracts are Shell Trading Risk Management LLC and Koch Supply and Trading LP.
As of December 31, 2017, we had entered into the following oil and gas hedge contracts:
Production Period | Instrument Type | Daily Volumes | Weighted Average Price |
Natural Gas: | |||
January 2018 - March 2018 | Swap | 35,000 Mmbtu | $3.24 |
Crude Oil: | |||
January 2018 - December 2018 | Swap | 250 Bbl | $55.00 |
#48#
The Company has approximately 3.2 Bcf of gas volumes, at an average price of $3.24 per Mcf hedged for 2018 and 91,250 Bbls of oil volumes, at an average price of $55.00 per Bbl hedged for 2018.
Item 8. | Financial Statements and Supplementary Data |
Information concerning this Item begins on page F-1.
Item 9. | Changes in and Disagreements with Accountants on Accounting and Financial Disclosure |
None.
Item 9A. | Controls and Procedures |
Evaluation of Disclosure Controls and Procedures
As of the end of the period covered by this report, the Company’s management, including its Chief Executive Officer and Chief Financial Officer, carried out an evaluation of the effectiveness of the Company’s disclosure controls and procedures pursuant to Rule 13a-15 of the Exchange Act. Based on that evaluation, the Chief Executive Officer and Chief Financial Officer concluded the following:
i. | that the Company’s disclosure controls and procedures are designed to ensure (a) that information required to be disclosed by the Company in the reports it files or submits under the Exchange Act is recorded, processed, summarized and reported, within the time periods specified in the SEC’s rules and forms, and (b) that such information is accumulated and communicated to the Company’s management, including the Chief Executive Officer and Chief Financial Officer, as appropriate to allow timely decisions regarding required disclosure; and | |
ii. | that the Company’s disclosure controls and procedures are effective. | |
Notwithstanding the foregoing, there can be no assurance that the Company’s disclosure controls and procedures will detect or uncover all failures of persons within the Company and its consolidated subsidiaries to disclose material information otherwise required to be set forth in the Company’s periodic reports. There are inherent limitations to the effectiveness of any system of disclosure controls and procedures, including the possibility of human error and the circumvention or overriding of the controls and procedures.
Changes in Internal Control Over Financial Reporting
There have been no changes in the Company’s internal control over financial reporting during the quarter ended December 31, 2017 that have materially affected, or that are reasonably likely to materially affect, the Company’s internal control over financial reporting.
Management’s Report on Internal Control Over Financial Reporting
Management is responsible for establishing and maintaining adequate internal control over financial reporting, and for performing an assessment of the effectiveness of internal control over financial reporting as of December 31, 2017. Internal control over financial reporting is a process designed to provide reasonable assurance regarding the reliability of financial reporting and the preparation of financial statements for external purposes in accordance with generally accepted accounting principles. Our system of internal control over financial reporting includes those policies and procedures that (i) pertain to the maintenance of records that, in reasonable detail, accurately and fairly reflect the transactions and dispositions of the assets of the Company; (ii) provide reasonable assurance that transactions are recorded as necessary to permit preparation of financial statements in accordance with generally accepted accounting principles, and that receipts and expenditures of the Company are being made only in accordance with authorizations of management and directors of the Company; and (iii) provide reasonable assurance regarding prevention or timely detection of unauthorized acquisition, use, or disposition of the Company's assets that could have a material effect on the financial statements.
Because of its inherent limitations, internal control over financial reporting may not prevent or detect misstatements. Projections of any evaluation of effectiveness to future periods are subject to risk that controls may become inadequate because of changes in conditions, or that the degree of compliance with the policies or procedures may deteriorate.
Management performed an assessment of the effectiveness of our internal control over financial reporting as of December 31, 2017 based upon criteria in Internal Control – Integrated Framework issued by the Committee of Sponsoring Organizations of the Treadway Commission (2013 framework). Based on our assessment, management believes that our internal control over financial reporting was effective as of December 31, 2017 based on these criteria.
#49#
March 8, 2018
/s/ Charles T. Goodson
Charles T. Goodson
Chairman and
Chief Executive Officer
/s/ J. Bond Clement
J. Bond Clement
Executive Vice President-
Chief Financial Officer
Item 9B. | Other Information |
NONE
PART III
Items 10, 11, 12, 13, & 14.
Pursuant to General Instruction G of Form 10-K, the information concerning Item 10. Directors, Executive Officers and Corporate Governance, Item 11. Executive Compensation, Item 12. Security Ownership of Certain Beneficial Owners and Management and Related Stockholder Matters, Item 13. Certain Relationships and Related Transactions, and Director Independence and Item 14. Principal Accounting Fees and Services, is incorporated by reference to the information set forth in the definitive Proxy Statement of PetroQuest Energy, Inc. relating to the Annual Meeting of Stockholders to be held May 16, 2018, to be filed pursuant to Regulation 14A under the Securities Exchange Act of 1934 with the Securities and Exchange Commission.
PART IV
Item 15. | Exhibits, Financial Statement Schedules |
(a) | 1. FINANCIAL STATEMENTS |
The following financial statements of the Company and the Report of the Company’s Independent Registered Public Accounting Firm thereon are included on pages F-1 through F-29 of this Form 10-K:
Report of Independent Registered Public Accounting Firm
Consolidated Balance Sheets as of December 31, 2017 and 2016
Consolidated Statements of Operations for the three years ended December 31, 2017
Consolidated Statements of Comprehensive Loss for the three years ended December 31, 2017
Consolidated Statements of Cash Flows for the three years ended December 31, 2017
Consolidated Statements of Stockholders’ Equity for the three years ended December 31, 2017
Notes to Consolidated Financial Statements
2. FINANCIAL STATEMENT SCHEDULES: | |
All schedules are omitted because the required information is inapplicable or the information is presented in the Financial Statements or the notes thereto.
#50#
3. | EXHIBITS: |
** 2.1 | Plan and Agreement of Merger by and among Optima Petroleum Corporation, Optima Energy (U.S.) Corporation, its wholly-owned subsidiary, and Goodson Exploration Company, NAB Financial L.L.C., Dexco Energy, Inc., American Explorer, L.L.C. (incorporated herein by reference to Appendix G of the Proxy Statement on Schedule 14A filed July 22, 1998). | ||
** 2.2 | Purchase and Sale Agreement dated as of June 19, 2013, between PetroQuest Energy, L.L.C. and Hall-Houston Exploration II, L.P. (incorporated herein by reference to Exhibit 2.1 to Form 8-K filed on June 20, 2013). | ||
** 2.3 | Purchase and Sale Agreement dated as of June 19, 2013, between PetroQuest Energy, L.L.C. and Hall-Houston Exploration III, L.P. (incorporated herein by reference to Exhibit 2.2 to Form 8-K filed on June 20, 2013). | ||
** 2.4 | Purchase and Sale Agreement dated as of June 19, 2013, between PetroQuest Energy, L.L.C. and Hall-Houston Exploration IV, L.P. (incorporated herein by reference to Exhibit 2.3 to Form 8-K filed on June 20, 2013). | ||
** 2.5 | Purchase and Sale Agreement dated as of June 19, 2013, between PetroQuest Energy, L.L.C. and GOM-H Exploration, LLC (incorporated herein by reference to Exhibit 2.4 to Form 8-K filed on June 20, 2013). | ||
**#2.6 | Purchase and Sale Agreement dated as of June 4, 2015, by and between PetroQuest Energy, L.L.C. and WSGP Gas Producing, LLC (incorporated herein by reference to Exhibit 2.1 to Form 10-Q filed on August 5, 2015). | ||
**#2.7 | Purchase and Sale Agreement dated as of April 20, 2016, by and between PetroQuest Energy, L.L.C. and GR Woodford Properties, LLC (incorporated herein by reference to Exhibit 2.1 to Form 10-Q filed on August 3, 2016). | ||
3.1 | Certificate of Incorporation of PetroQuest Energy, Inc. (incorporated herein by reference to Exhibit 4.1 to Form 8-K filed September 16, 1998). | ||
3.2 | Certificate of Domestication of Optima Petroleum Corporation (incorporated herein by reference to Exhibit 4.4 to Form 8-K filed September 16, 1998). | ||
3.3 | Certificate of Designations, Preferences, Limitations and Relative Rights of The Series a Junior Participating Preferred Stock of PetroQuest Energy, Inc. (incorporated herein by reference to Exhibit A of the Rights Agreement attached as Exhibit 1 to Form 8-A filed November 9, 2001). | ||
3.4 | Certificate of Designations establishing the 6.875% Series B Cumulative Convertible Perpetual Preferred Stock, dated September 24, 2007 (incorporated herein by reference to Exhibit 3.1 to Form 8-K filed on September 24, 2007). | ||
3.5 | Certificate of Amendment to Certificate of Incorporation dated May 14, 2008 (incorporated herein by reference to Exhibit 3.1 to Form 8-K filed June 23, 2009). | ||
3.6 | Certificate of Amendment to Certificate of Incorporation dated May 18, 2016 (incorporated herein by reference to Exhibit 3.1 to Form 8-K filed on May 20, 2016). | ||
3.7 | Certificate of Amendment to Certificate of Incorporation dated May 18, 2016 (incorporated herein by reference to Exhibit 3.2 to From 8-K filed on May 20, 2016). | ||
3.8 | Bylaws of PetroQuest Energy, Inc., as amended of February 19, 2016 (incorporated herein by reference to Exhibit 3.1 to Form 8-K filed February 22, 2016). | ||
4.1 | Indenture, dated August 19, 2010, between PetroQuest Energy, Inc. and The Bank of New York Mellon Trust Company, N.A. (incorporated herein by reference to Exhibit 4.2 to Form 8-K filed on August 19, 2010). | ||
#51#
4.2 | First Supplemental Indenture, dated August 19, 2010, among PetroQuest Energy, Inc., the Subsidiary Guarantors identified therein, and The Bank of New York Mellon Trust Company, N.A. (incorporated herein by reference to Exhibit 4.3 to Form 8-K filed on August 19, 2010). | ||
4.3 | Second Supplemental Indenture, dated July 3, 2013, among PetroQuest Energy, Inc., the Subsidiary Guarantors identified therein, and The Bank of New York Mellon Trust Company, N.A. (incorporated herein by reference to Exhibit 4.2 to Form 8-K filed on July 3, 2013). | ||
4.4 | Third Supplemental Indenture, dated October 23, 2013, among PetroQuest Energy, Inc., the Subsidiary Guarantors identified therein, and The Bank of New York Mellon Trust Company, N.A.(incorporated herein by reference to Exhibit 4.7 to Form 10-K filed on March 6, 2015) | ||
4.5 | Fourth Supplemental Indenture, dated February 1, 2015, among PetroQuest Energy, Inc., the Subsidiary Guarantors identified therein, and U.S. Bank National Association, as successor trustee to The Bank of New York Mellon Trust Company, N.A. (incorporated herein by reference to Exhibit 4.1 to Form 8-K filed on February 3, 2016). | ||
4.6 | Registration Rights Agreement, dated February 17, 2016, among PetroQuest Energy, Inc., the Subsidiary Guarantors identified therein, and Seaport Global Securities LLC, as representative of the several investors named therein (incorporated herein by reference to Exhibit 4.2 to Form 8-K filed on February 18, 2016). | ||
4.7 | Indenture, dated February 17, 2016, between PetroQuest Energy, Inc., the Subsidiary Guarantors identified therein, and Wilmington Trust, National Association (incorporated herein by reference to Exhibit 4.1 to Form 8-K filed on February 18, 2016). | ||
4.8 | First Supplemental Indenture, dated as of September 13, 2016, among PetroQuest Energy, Inc., the Subsidiary Guarantors identified therein, and Wilmington Trust, National Association (incorporated herein by reference to Exhibit 4.1 to Form 8-K filed on September 14, 2016). | ||
4.9 | Registration Rights Agreement, dated July 3, 2013, among PetroQuest Energy, Inc., the Subsidiary Guarantors identified therein, and J.P. Morgan Securities LLC, as representative of the several initial purchasers named therein (incorporated herein by reference to Exhibit 4.3 to Form 8-K filed on July 3, 2013). | ||
4.10 | Waiver of Registration Rights, dated as of September 13, 2016, among PetroQuest Energy, Inc., the Subsidiary Guarantors and Seaport Global Securities LLC (incorporated herein by reference to Exhibit 4.2 to Form 8-K filed on September 14, 2016). | ||
4.11 | Indenture, dated September 27, 2016, among PetroQuest Energy, Inc., the Subsidiary Guarantors identified therein, and Wilmington Trust, National Association (incorporated herein by reference to Exhibit 4.1 to Form 8-K filed on September 27, 2016). | ||
4.12 | Registration Rights Agreement, dated September 27, 2016, among PetroQuest Energy, Inc., the Subsidiary Guarantors identified therein, Jefferies LLC and Seaport Global Securities LLC (incorporated herein by reference to Exhibit 4.2 to Form 8-K filed on September 27, 2016). | ||
†10.1 | PetroQuest Energy, Inc. 1998 Incentive Plan, as amended and restated effective May 14, 2008 (the “Incentive Plan”) (incorporated herein by reference to Appendix A of the Proxy Statement on Schedule 14A filed April 9, 2008). | ||
†10.2 | Form of Incentive Stock Option Agreement for executive officers (including Charles T. Goodson, Arthur M. Mixon, III, J. Bond Clement and Edward E. Abels, Jr.) under the PetroQuest Energy, Inc. 1998 Incentive Plan (incorporated herein by reference to Exhibit 10.2 to Form 10-K filed February 27, 2009). | ||
†10.3 | Form of Nonstatutory Stock Option Agreement under the PetroQuest Energy, Inc. 1998 Incentive Plan (incorporated herein by reference to Exhibit 10.3 to Form 10-K filed February 27, 2009). | ||
#52#
†10.4 | Form of Restricted Stock Agreement for executive officers (including Charles T. Goodson, Arthur M. Mixon, III, J. Bond Clement and Edward E. Abels, Jr.) under the PetroQuest Energy, Inc. 1998 Incentive Plan (incorporated herein by reference to Exhibit 10.4 to Form 10-K filed February 27, 2009). | ||
†10.5 | PetroQuest Energy, Inc. Annual Incentive Plan (incorporated herein by reference to Exhibit 10.1 to Form 8-K filed on May 13, 2010). | ||
†10.6 | PetroQuest Energy, Inc. Annual Incentive Plan, as amended and restated (incorporated herein by reference to Exhibit 10.1 to Form 8-K filed on June 8, 2010). | ||
†10.7 | PetroQuest Energy, Inc. 2012 Employee Stock Purchase Plan (incorporated herein by reference to Appendix A to Schedule 14A filed March 28, 2012). | ||
†10.8 | PetroQuest Energy, Inc. Long-Term Cash Incentive Plan (incorporated herein by reference to Exhibit 10.1 to Form 8-K filed November 15, 2012). | ||
†10.9 | PetroQuest Energy, Inc. 2013 Incentive Plan (incorporated herein by reference to Appendix A to the Company’s Definitive Proxy Statement on Schedule 14A filed on April 9, 2013). | ||
†10.10 | Form of Award Notice of Restricted Stock Units - Employees (including Charles T. Goodson, Arthur M. Mixon, III, J. Bond Clement and Edward E. Abels, Jr.) under the PetroQuest Energy, Inc. Long-Term Cash Incentive Plan (incorporated herein by reference to Exhibit 10.2 to Form 8-K filed November 15, 2012). | ||
†10.11 | Form of Award Notice of Restricted Stock Units - Outside Director/Consultant under the PetroQuest Energy, Inc. Long-Term Cash Incentive Plan (incorporated herein by reference to Exhibit 10.3 to Form 8-K filed November 15, 2012). | ||
†10.12 | Form of Restricted Stock Agreement - Executive Officers (including Charles T. Goodson, Arthur M. Mixon, III, J. Bond Clement and Edward E. Abels, Jr.) under the PetroQuest Energy, Inc. 1998 Incentive Plan (incorporated herein by reference to Exhibit 10.4 to Form 8-K filed November 15, 2012). | ||
†10.13 | Form of Restricted Stock Units Agreement - Employees (including Charles T. Goodson, Arthur M. Mixon, III, J. Bond Clement and Edward E. Abels, Jr.) under the PetroQuest Energy, Inc. 2013 Incentive Plan (incorporated herein by reference to Exhibit 10.1 to Form 8-K filed November 19, 2014). | ||
†10.14 | Form of Award Notice of Phantom Stock Units - Employees (including Charles T. Goodson, Arthur M. Mixon, III, J. Bond Clement and Edward E. Abels, Jr.) under the PetroQuest Energy, Inc. Long-Term Cash Incentive Plan (incorporated herein by reference to Exhibit 10.2 to Form 8-K filed November 19, 2014). | ||
†10.15 | Form of Performance Unit Notice and Award- Employees (including Charles T. Goodson, Arthur M. Mixon, III, J. Bond Clement and Edward E. Abels, Jr.) under the PetroQuest Energy, Inc. Long-Term Cash Incentive Plan (incorporated herein by reference to Exhibit 10.1 to Form 8-K filed November 21, 2014). | ||
†10.16 | Amended Executive Employment Agreement dated effective as of December 31, 2008, between Charles T. Goodson and PetroQuest Energy, Inc. (incorporated herein by reference to Exhibit 10.1 to Form 8-K filed January 6, 2009). | ||
†10.17 | Amended Executive Employment Agreement dated effective as of December 31, 2008, between Arthur M. Mixon, III and PetroQuest Energy, Inc. (incorporated herein by reference to Exhibit 10.3 to Form 8-K filed January 6, 2009). | ||
†10.18 | Amended Executive Employment Agreement dated effective as of December 31, 2008, between J. Bond Clement and PetroQuest Energy, Inc. (incorporated herein by reference to Exhibit 10.20 to Form 10-K filed February 27, 2009). | |
#53#
†10.19 | Executive Employment Agreement dated February 1, 2014 between PetroQuest Energy, Inc. and Edward E. Abels, Jr. (incorporated herein by reference to Exhibit 10.1 to Form 8-K filed February 5, 2014). | |
†10.20 | Form of Amended Termination Agreement between the Company and each of its executive officers, including Charles T. Goodson, Arthur M. Mixon, III, and J. Bond Clement (incorporated herein by reference to Exhibit 10.6 to Form 8-K filed January 6, 2009). | |
†10.21 | Termination Agreement dated February 1, 2014 between PetroQuest Energy, Inc. and Edward E. Abels, Jr. (incorporated herein by reference to Exhibit 10.2 to Form 8-K filed February 5, 2014). | |
†10.22 | Form of Indemnification Agreement between PetroQuest Energy, Inc. and each of its directors and executive officers, including Charles T. Goodson, Arthur M. Mixon, III, , J. Bond Clement, Edward E. Abels, Jr., William W. Rucks, IV, E. Wayne Nordberg, J. Gerard Jolly, W.J. Gordon, III and Charles F. Mitchell, II (incorporated herein by reference to Exhibit 10.21 to Form 10-K filed March 13, 2002). | |
†10.23 | Form of Surrender and Cancellation Agreement for Directors and Executive Officers (incorporated herein by reference to Exhibit 10.1 to Form 8-K filed on September 16, 2010). | |
†10.24 | PetroQuest Energy, Inc. 2016 Long Term Incentive Plan (incorporated herein by reference to Appendix A to the Company's Definitive Proxy Statement on Schedule 14A filed on April 7, 2016). | |
10.25 | Collateral Trust Agreement, dated February 17, 2016, among PetroQuest Energy, Inc., the guarantors from time to time party thereto, Wilmington Trust, National Association, as Trustee, the other Parity Lien Debt Representatives from time to time party thereto and Wilmington Trust, National Association, as Collateral Trustee (incorporated herein by reference to Exhibit 10.1 to Form 8-K filed on February 18, 2016). | |
10.26 | Intercreditor Agreement, dated February 17, 2016, by and between JPMorgan Chase Bank, N.A., as Priority Lien Agent, and Wilmington Trust, National Association, as Second Lien Collateral Trustee (incorporated herein by reference to Exhibit 10.2 to Form 8-K filed on February 18, 2016). | |
10.27 | Multidraw Term Loan Agreement, dated as of October 17, 2016, among PetroQuest Energy, Inc., PetroQuest Energy, L.L.C., Franklin Custodian Funds - Franklin Income Fund, and Wells Fargo Bank, National Association, as administrative agent (incorporated herein by reference to Exhibit 10.1 to Form 8-K filed on October 17, 2016). | |
## *10.28 | ||
*14.1 | ||
*21.1 | ||
*23.1 | ||
*23.2 | ||
*31.1 | ||
*31.2 | ||
*32.1 | ||
*32.2 | ||
#54#
101.INS | ||
101.SCH | ||
101.CAL | ||
101.DEF | ||
101.LAB | ||
101.PRE | ||
* | Filed herewith. |
** | The registrant agrees to furnish supplementally a copy of any omitted schedule to the Agreements to the SEC upon request. |
† | Management contract or compensatory plan or arrangement |
# | Confidential treatment has been granted for portions of this exhibit. Omissions are designated with brackets containing asterisks. As part of our confidential treatment request, a complete version of this exhibit was filed separately with the SEC. |
## | Confidential treatment has been requested for portions of this exhibit. Omissions are designated with brackets containing asterisks. As part of our confidential treatment request, a complete version of this exhibit has been filed separately with th SEC. |
(b) | Exhibits. See Item 15 (a) (3) above. |
(c) | Financial Statement Schedules. None |
Item 16. | Form 10-K Summary |
NONE
#55#
GLOSSARY OF CERTAIN OIL AND NATURAL GAS TERMS
The following is a description of the meanings of some of the oil and natural gas used in this Form 10-K.
Bbl. One stock tank barrel, or 42 U.S. gallons liquid volume, of crude oil or other liquid hydrocarbons.
Bcf. Billion cubic feet of natural gas.
Bcfe. Billion cubic feet equivalent, determined using the ratio of six Mcf of natural gas to one Bbl of crude oil, condensate or natural gas liquids.
Block. A block depicted on the Outer Continental Shelf Leasing and Official Protraction Diagrams issued by the U.S. Minerals Management Service or a similar depiction on official protraction or similar diagrams issued by a state bordering on the Gulf of Mexico.
Btu or British Thermal Unit. The quantity of heat required to raise the temperature of one pound of water by one degree Fahrenheit.
Completion. The installation of permanent equipment for the production of natural gas or oil, or in the case of a dry hole, the reporting of abandonment to the appropriate agency.
Condensate. A mixture of hydrocarbons that exists in the gaseous phase at original reservoir temperature and pressure, but that, when produced, is in the liquid phase at surface pressure and temperature.
Deterministic estimate. The method of estimating reserves or resources is called deterministic when a single value for each parameter (from the geoscience, engineering, or economic data) in the reserves calculation is used in the reserves estimation procedure.
Developed acreage. The number of acres that are allocated or assignable to productive wells or wells capable of production.
Development well. A well drilled within the proved area of an oil or gas reservoir to the depth of a stratigraphic horizon known to be productive.
Dry hole. A well found to be incapable of producing hydrocarbons in sufficient quantities such that proceeds from the sale of such production exceed production expenses and taxes.
Exploratory well. A well drilled to find a new field or to find a new reservoir in a field previously found to be productive of oil or gas in another reservoir. Generally, an exploratory well is any well that is not a development well, an extension well, a service well, or a stratigraphic test well as those items are defined in this section.
Extension well. A well drilled to extend the limits of a known reservoir.
Farm-in or farm-out. An agreement under which the owner of a working interest in a natural gas and oil lease assigns the working interest or a portion of the working interest to another party who desires to drill on the leased acreage. Generally, the assignee is required to drill one or more wells in order to earn its interest in the acreage. The assignor usually retains a royalty or reversionary interest in the lease. The interest received by an assignee is a "farm-in" while the interest transferred by the assignor is a "farm-out."
Field. An area consisting of a single reservoir or multiple reservoirs all grouped on or related to the same individual geological structural feature and/or stratigraphic condition.
Gross acres or gross wells. The total acres or wells, as the case may be, in which a working interest is owned.
Lead. A specific geographic area which, based on supporting geological, geophysical or other data, is deemed to have potential for the discovery of commercial hydrocarbons.
MBbls. Thousand barrels of crude oil or other liquid hydrocarbons.
Mcf. Thousand cubic feet of natural gas.
Mcfe. Thousand cubic feet equivalent, determined using the ratio of six Mcf of natural gas to one Bbl of crude oil, condensate or natural gas liquids.
MMBls. Million barrels of crude oil or other liquid hydrocarbons.
MMBtu. Million British Thermal Units.
#56#
MMcf. Million cubic feet of natural gas.
MMcfe. Million cubic feet equivalent, determined using the ratio of six Mcf of natural gas to one Bbl of crude oil, condensate or natural gas liquids.
Ngl. Natural gas liquid.
Net acres or net wells. The sum of the fractional working interest owned in gross acres or wells, as the case may be.
Possible reserves. Those additional reserves that are less certain to be recovered than probable reserves.
Probabilistic estimate. The method of estimation of reserves or resources is called probabilistic when the full range of values that could reasonably occur for each unknown parameter (from the geoscience and engineering data) is used to generate a full range of possible outcomes and their associated probabilities of occurrence.
Probable reserves. Those additional reserves that are less certain to be recovered than proved reserves but which, together with proved reserves, are as likely as not to be recovered.
Productive well. A well that is found to be capable of producing hydrocarbons in sufficient quantities such that proceeds from the sale of such production exceed production expenses and taxes.
Prospect. A specific geographic area which, based on supporting geological, geophysical or other data and also preliminary economic analysis using reasonably anticipated prices and costs, is deemed to have potential for the discovery of commercial hydrocarbons.
Proved area. The part of a property to which proved reserves have been specifically attributed.
Proved oil and gas reserves. Those quantities of oil and gas, which, by analysis of geoscience and engineering data, can be estimated with reasonable certainty to be economically producible—from a given date forward, from known reservoirs, and under existing economic conditions, operating methods, and government regulations—prior to the time at which contracts providing the right to operate expire, unless evidence indicates that renewal is reasonably certain, regardless of whether deterministic or probabilistic methods are used for the estimation.
Proved properties. Properties with proved reserves.
Reasonable certainty. If deterministic methods are used, reasonable certainty means a high degree of confidence that the quantities will be recovered. If probabilistic methods are used, there should be at least a 90% probability that the quantities actually recovered will equal or exceed the estimate. A high degree of confidence exists if the quantity is much more likely to be achieved than not, and, as changes due to increased availability of geoscience (geological, geophysical, and geochemical), engineering, and economic data are made to estimated ultimate recovery (EUR) with time, reasonably certain EUR is much more likely to increase or remain constant than to decrease.
Reliable technology. A grouping of one or more technologies (including computational methods) that has been field tested and has been demonstrated to provide reasonably certain results with consistency and repeatability in the formation being evaluated or in an analogous formation.
Reserves. Estimated remaining quantities of oil and gas and related substances anticipated to be economically producible, as of a given date, by application of development projects to known accumulations.
Reservoir. A porous and permeable underground formation containing a natural accumulation of producible oil and/or gas that is confined by impermeable rock or water barriers and is individual and separate from other reservoirs.
Resources. Quantities of oil and gas estimated to exist in naturally occurring accumulations. A portion of the resources may be estimated to be recoverable, and another portion may be considered to be unrecoverable. Resources include both discovered and undiscovered accumulations.
Service well. A well drilled or completed for the purpose of supporting production in an existing field. Specific purposes of service wells include gas injection, water injection, steam injection, air injection, salt-water disposal, water supply for injection, observation, or injection for in-situ combustion.
Stratigraphic test well. A drilling effort, geologically directed, to obtain information pertaining to a specific geologic condition. Such wells customarily are drilled without the intent of being completed for hydrocarbon production.
#57#
Undeveloped oil and gas reserves. Undeveloped oil and gas reserves are reserves of any category that are expected to be recovered from new wells on undrilled acreage, or from existing wells where a relatively major expenditure is required for recompletion.
Undeveloped acreage. Lease acreage on which wells have not been drilled or completed to a point that would permit the production of commercial quantities of natural gas and oil regardless of whether such acreage contains proved reserves.
Unproved properties. Properties with no proved reserves
Working interest. The operating interest that gives the owner the right to drill, produce and conduct operating activities on the property and receive a share of production.
#58#
SIGNATURES
Pursuant to the requirements of Section 13 or 15(d) of the Securities Exchange Act of 1934, the registrant has duly caused this report to be signed on its behalf by the undersigned, thereunto duly authorized, on March 8, 2018.
PETROQUEST ENERGY, INC. | |||
By: | /s/ Charles T. Goodson | ||
CHARLES T. GOODSON | |||
Chairman of the Board, President and Chief Executive Officer | |||
Pursuant to the requirements of the Securities Exchange Act of 1934, this report has been signed below by the following persons on behalf of the registrant and in the capacities indicated on March 8, 2018.
By: | /s/ Charles T. Goodson | Chairman of the Board, President, Chief Executive Officer and Director | ||
CHARLES T. GOODSON | (Principal Executive Officer) | |||
By: | /s/ J. Bond Clement | Executive Vice President, Chief Financial Officer, Treasurer | ||
J. BOND CLEMENT | (Principal Financial and Accounting Officer) | |||
By: | /s/ W.J. Gordon, III | Director | ||
W.J. GORDON, III | ||||
By: | /s/ J. Gerard Jolly | Director | ||
J. GERARD JOLLY | ||||
By: | /s/ Charles F. Mitchell, II, M.D. | Director | ||
CHARLES F. MITCHELL, II, M.D. | ||||
By: | /s/ E. Wayne Nordberg | Director | ||
E. WAYNE NORDBERG | ||||
By: | /s/ William W. Rucks, IV | Director | ||
WILLIAM W. RUCKS, IV | ||||
#59#
INDEX TO FINANCIAL STATEMENTS
#60#
Report of Independent Registered Public Accounting Firm
The Board of Directors and Stockholders
PetroQuest Energy, Inc.
Opinion on the Financial Statements
We have audited the accompanying consolidated balance sheets of PetroQuest Energy, Inc. (the Company) as of December 31, 2017 and 2016, and the related consolidated statements of operations, comprehensive loss, cash flows and stockholders’ equity for each of the three years in the period ended December 31, 2017, and the related notes (collectively referred to as the "consolidated financial statements"). In our opinion, the consolidated financial statements present fairly, in all material respects, the financial position of the Company at December 31, 2017 and 2016, and the results of its operations and its cash flows for each of the three years in the period ended December 31, 2017, in conformity with U.S. generally accepted accounting principles.
Basis of Opinion
These financial statements are the responsibility of the Company's management. Our responsibility is to express an opinion on the Company’s financial statements based on our audits. We are a public accounting firm registered with the PCAOB and are required to be independent with respect to the Company in accordance with the U.S. federal securities laws and the applicable rules and regulations of the Securities and Exchange Commission and the PCAOB.
We conducted our audits in accordance with the standards of the PCAOB. Those standards require that we plan and perform the audit to obtain reasonable assurance about whether the financial statements are free of material misstatement, whether due to error or fraud. Our audits included performing procedures to assess the risks of material misstatement of the financial statements, whether due to error or fraud, and performing procedures that respond to those risks. Such procedures included examining, on a test basis, evidence regarding the amounts and disclosures in the financial statements. Our audits also included evaluating the accounting principles used and significant estimates made by management, as well as evaluating the overall presentation of the financial statements. We believe that our audits provide a reasonable basis for our opinion.
/s/ Ernst & Young LLP
We have served as the Company's auditor since 2002.
New Orleans, Louisiana
March 8, 2018
F-1
PETROQUEST ENERGY, INC.
Consolidated Balance Sheets
(Amounts in Thousands)
December 31, 2017 | December 31, 2016 | ||||||
ASSETS | |||||||
Current assets: | |||||||
Cash and cash equivalents | $ | 15,655 | $ | 28,312 | |||
Revenue receivable | 15,340 | 10,294 | |||||
Joint interest billing receivable | 6,597 | 7,632 | |||||
Other receivable | 7,750 | — | |||||
Derivative asset | 1,174 | — | |||||
Deposit for surety bonds | 8,300 | — | |||||
Other current assets | 2,125 | 2,353 | |||||
Total current assets | 56,941 | 48,591 | |||||
Property and equipment: | |||||||
Oil and gas properties: | |||||||
Oil and gas properties, full cost method | 1,369,861 | 1,323,333 | |||||
Unevaluated oil and gas properties | 21,854 | 9,015 | |||||
Accumulated depreciation, depletion and amortization | (1,285,660 | ) | (1,243,286 | ) | |||
Oil and gas properties, net | 106,055 | 89,062 | |||||
Other property and equipment | 9,353 | 10,951 | |||||
Accumulated depreciation of other property and equipment | (8,843 | ) | (10,109 | ) | |||
Total property and equipment | 106,565 | 89,904 | |||||
Other assets, net of accumulated amortization of $0 and $4,385, respectively | 792 | 6,365 | |||||
Total assets | $ | 164,298 | $ | 144,860 | |||
LIABILITIES AND STOCKHOLDERS’ EQUITY | |||||||
Current liabilities: | |||||||
Accounts payable to vendors | $ | 36,179 | $ | 25,265 | |||
Advances from co-owners | 1,730 | 2,330 | |||||
Oil and gas revenue payable | 19,344 | 22,146 | |||||
Accrued interest | 1,724 | 2,047 | |||||
Asset retirement obligation | 687 | 4,160 | |||||
Derivative liability | 731 | 3,947 | |||||
10% Senior Unsecured Notes due 2017 | — | 22,568 | |||||
Other accrued liabilities | 2,445 | 3,938 | |||||
Total current liabilities | 62,840 | 86,401 | |||||
Multi-draw Term Loan | 27,963 | 7,249 | |||||
10% Senior Secured Notes due 2021 | 9,821 | 15,228 | |||||
10% Senior Secured PIK Notes due 2021 | 271,577 | 248,600 | |||||
Asset retirement obligation | 30,623 | 32,450 | |||||
Other long-term liabilities | 10,409 | 6,027 | |||||
Commitments and contingencies | |||||||
Stockholders’ equity: | |||||||
Preferred stock, $.001 par value; authorized 5,000 shares; issued and outstanding 1,495 shares | 1 | 1 | |||||
Common stock, $.001 par value; authorized 150,000 shares; issued and outstanding 25,521 and 21,197 shares, respectively | 26 | 21 | |||||
Paid-in capital | 313,244 | 304,341 | |||||
Accumulated other comprehensive income (loss) | 278 | (4,750 | ) | ||||
Accumulated deficit | (562,484 | ) | (550,708 | ) | |||
Total stockholders’ equity | (248,935 | ) | (251,095 | ) | |||
Total liabilities and stockholders’ equity | $ | 164,298 | $ | 144,860 | |||
See accompanying Notes to Consolidated Financial Statements.
F-2
PETROQUEST ENERGY, INC.
Consolidated Statements of Operations
(Amounts in Thousands, Except Per Share Data)
Year Ended | ||||||||||||
December 31, | ||||||||||||
2017 | 2016 | 2015 | ||||||||||
Revenues: | ||||||||||||
Oil and gas sales | $ | 108,287 | $ | 66,667 | $ | 115,969 | ||||||
Expenses: | ||||||||||||
Lease operating expenses | 33,162 | 28,508 | 40,130 | |||||||||
Production taxes | 3,302 | 354 | 2,470 | |||||||||
Depreciation, depletion and amortization | 32,053 | 28,720 | 63,497 | |||||||||
Ceiling test write-down | — | 40,304 | 266,562 | |||||||||
General and administrative | 15,860 | 26,040 | 20,777 | |||||||||
Accretion of asset retirement obligation | 2,252 | 2,515 | 3,259 | |||||||||
Interest expense | 28,836 | 30,019 | 33,766 | |||||||||
115,465 | 156,460 | 430,461 | ||||||||||
Other income (expense): | ||||||||||||
Gain on sale of assets | — | — | 21,937 | |||||||||
Other income (expense) | (408 | ) | (560 | ) | 391 | |||||||
(408 | ) | (560 | ) | 22,328 | ||||||||
Loss from operations | (7,586 | ) | (90,353 | ) | (292,164 | ) | ||||||
Income tax expense (benefit) | (949 | ) | 543 | 2,626 | ||||||||
Net loss | (6,637 | ) | (90,896 | ) | (294,790 | ) | ||||||
Preferred stock dividend | 5,139 | 5,349 | 5,139 | |||||||||
Net loss available to common stockholders | $ | (11,776 | ) | $ | (96,245 | ) | $ | (299,929 | ) | |||
Loss per common share: | ||||||||||||
Basic | ||||||||||||
Net loss per share | $ | (0.55 | ) | $ | (5.24 | ) | $ | (18.45 | ) | |||
Diluted | ||||||||||||
Net loss per share | $ | (0.55 | ) | $ | (5.24 | ) | $ | (18.45 | ) | |||
Weighted average number of common shares: | ||||||||||||
Basic | 21,330 | 18,354 | 16,256 | |||||||||
Diluted | 21,330 | 18,354 | 16,256 | |||||||||
See accompanying Notes to Consolidated Financial Statements.
F-3
PETROQUEST ENERGY, INC.
Consolidated Statements of Comprehensive Loss
(Amounts in Thousands)
Year Ended | ||||||||||||
December 31, | ||||||||||||
2017 | 2016 | 2015 | ||||||||||
Net loss | $ | (6,637 | ) | $ | (90,896 | ) | $ | (294,790 | ) | |||
Change in fair value of derivatives, net of income tax (expense) benefit of ($165), $561 and $2,650, respectively | 5,028 | (5,697 | ) | (4,473 | ) | |||||||
Comprehensive loss | $ | (1,609 | ) | $ | (96,593 | ) | $ | (299,263 | ) | |||
See accompanying Notes to Consolidated Financial Statements.
F-4
PETROQUEST ENERGY, INC.
Consolidated Statements of Cash Flows
(Amounts in Thousands)
Year Ended | |||||||||||
December 31, | |||||||||||
2017 | 2016 | 2015 | |||||||||
Cash flows provided by (used in) operating activities: | |||||||||||
Net loss | $ | (6,637 | ) | $ | (90,896 | ) | $ | (294,790 | ) | ||
Adjustments to reconcile net loss to net cash provided by (used in) operating activities: | |||||||||||
Deferred tax (benefit) expense | (949 | ) | 543 | 2,626 | |||||||
Depreciation, depletion and amortization | 32,053 | 28,720 | 63,497 | ||||||||
Ceiling test writedown | — | 40,304 | 266,562 | ||||||||
Accretion of asset retirement obligation | 2,252 | 2,515 | 3,259 | ||||||||
Share based compensation expense | 1,447 | 1,444 | 4,617 | ||||||||
Gain on sale of assets | — | — | (21,937 | ) | |||||||
Amortization costs and other | 554 | 2,106 | 2,259 | ||||||||
Non-cash PIK interest | 22,895 | 5,722 | — | ||||||||
Payments to settle asset retirement obligations | (3,364 | ) | (3,169 | ) | (2,776 | ) | |||||
Costs incurred to issue 2021 Notes and 2021 PIK Notes | — | 10,139 | — | ||||||||
Gain on extinguishment of debt | (403 | ) | — | — | |||||||
Changes in working capital accounts: | |||||||||||
Revenue receivable | (5,046 | ) | (3,818 | ) | 10,009 | ||||||
Joint interest billing receivable | 610 | 41,400 | 223 | ||||||||
Accounts payable and accrued liabilities | 2,970 | (72,760 | ) | (9,400 | ) | ||||||
Advances from co-owners | (600 | ) | (13,788 | ) | 3,299 | ||||||
Other | (1,629 | ) | (5,060 | ) | 2,657 | ||||||
Net cash provided by (used in) operating activities | 44,153 | (56,598 | ) | 30,105 | |||||||
Cash flows (used in) provided by investing activities: | |||||||||||
Investment in oil and gas properties | (64,613 | ) | (30,366 | ) | (90,218 | ) | |||||
Investment in other property and equipment | (54 | ) | (24 | ) | (454 | ) | |||||
Sale of oil and gas properties | 10,707 | 25,482 | 271,769 | ||||||||
Net cash (used in) provided by investing activities | (53,960 | ) | (4,908 | ) | 181,097 | ||||||
Cash flows used in financing activities: | |||||||||||
Net payments for share based compensation | (26 | ) | 11 | (199 | ) | ||||||
Deferred financing costs | (174 | ) | (3,156 | ) | (1,094 | ) | |||||
Payment of preferred stock dividend | — | (1,285 | ) | (5,139 | ) | ||||||
Proceeds from borrowings | 20,000 | 10,000 | 70,000 | ||||||||
Repayment of borrowings | — | — | (145,000 | ) | |||||||
Redemption of 2017 Notes | (22,650 | ) | (53,626 | ) | — | ||||||
Costs incurred to issue 2021 Notes and 2021 PIK Notes | — | (10,139 | ) | — | |||||||
Net cash used in financing activities | (2,850 | ) | (58,195 | ) | (81,432 | ) | |||||
Net (decrease) increase in cash and cash equivalents | (12,657 | ) | (119,701 | ) | 129,770 | ||||||
Cash and cash equivalents, beginning of period | 28,312 | 148,013 | 18,243 | ||||||||
Cash and cash equivalents, end of period | $ | 15,655 | $ | 28,312 | $ | 148,013 | |||||
Supplemental disclosure of cash flow information: | |||||||||||
Cash paid (received) during the period for: | |||||||||||
Interest | $ | 7,432 | $ | 33,206 | $ | 36,217 | |||||
Income taxes | $ | (94 | ) | $ | (18 | ) | $ | — | |||
See accompanying Notes to Consolidated Financial Statements.
F-5
PetroQuest Energy Inc.
Consolidated Statements of Stockholders’ Equity
(Amounts in Thousands)
Common Stock | Preferred Stock | Paid-In Capital | Other Comprehensive Income (Loss) | Accumulated Deficit | Total Stockholders’ Equity | ||||||||||||||||||
December 31, 2014 | $ | 16 | $ | 1 | $ | 286,006 | $ | 5,420 | $ | (154,534 | ) | $ | 136,909 | ||||||||||
Options exercised | — | — | 61 | — | — | 61 | |||||||||||||||||
Retirement of shares upon vesting of restricted stock | — | — | (451 | ) | — | — | (451 | ) | |||||||||||||||
Share-based compensation expense | — | — | 4,617 | — | — | 4,617 | |||||||||||||||||
Issuance of shares under employee stock purchase plan | — | — | 199 | — | — | 199 | |||||||||||||||||
Derivative fair value adjustment, net of tax | — | — | — | (4,473 | ) | — | (4,473 | ) | |||||||||||||||
Preferred stock dividend | — | — | — | — | (5,139 | ) | (5,139 | ) | |||||||||||||||
Net loss | — | — | — | — | (294,790 | ) | (294,790 | ) | |||||||||||||||
December 31, 2015 | $ | 16 | $ | 1 | $ | 290,432 | $ | 947 | $ | (454,463 | ) | $ | (163,067 | ) | |||||||||
Issuance of shares in debt exchange | 5 | — | 12,520 | — | — | 12,525 | |||||||||||||||||
Retirement of shares upon vesting of restricted stock | — | — | (200 | ) | — | — | (200 | ) | |||||||||||||||
Share-based compensation expense | — | — | 1,444 | — | — | 1,444 | |||||||||||||||||
Issuance of shares under employee stock purchase plan | — | — | 145 | — | — | 145 | |||||||||||||||||
Derivative fair value adjustment, net of tax | — | — | — | (5,697 | ) | — | (5,697 | ) | |||||||||||||||
Preferred stock dividend | — | — | — | — | (5,349 | ) | (5,349 | ) | |||||||||||||||
Net loss | — | — | — | — | (90,896 | ) | (90,896 | ) | |||||||||||||||
December 31, 2016 | $ | 21 | $ | 1 | $ | 304,341 | $ | (4,750 | ) | $ | (550,708 | ) | $ | (251,095 | ) | ||||||||
Issuance of shares | 5 | — | 7,441 | — | — | 7,446 | |||||||||||||||||
Retirement of shares upon vesting of restricted stock | — | — | (10 | ) | — | — | (10 | ) | |||||||||||||||
Share-based compensation expense | — | — | 1,447 | — | — | 1,447 | |||||||||||||||||
Issuance of shares under employee stock purchase plan | — | — | 25 | — | — | 25 | |||||||||||||||||
Derivative fair value adjustment, net of tax | — | — | — | 5,028 | — | 5,028 | |||||||||||||||||
Preferred stock dividend | — | — | — | — | (5,139 | ) | (5,139 | ) | |||||||||||||||
Net loss | — | — | — | — | (6,637 | ) | (6,637 | ) | |||||||||||||||
December 31, 2017 | $ | 26 | $ | 1 | $ | 313,244 | $ | 278 | $ | (562,484 | ) | $ | (248,935 | ) | |||||||||
See accompanying Notes to Consolidated Financial Statements.
F-6
PETROQUEST ENERGY, INC.
NOTES TO CONSOLIDATED FINANCIAL STATEMENTS
Note 1—Organization and Summary of Significant Accounting Policies
PetroQuest Energy, Inc. (a Delaware Corporation) (“PetroQuest”) is an independent oil and gas company headquartered in Lafayette, Louisiana with an exploration office in The Woodlands, Texas. It is engaged in the exploration, development, acquisition and operation of oil and gas properties in Texas and Louisiana.
Principles of Consolidation
The consolidated financial statements include the accounts of PetroQuest and its subsidiaries, PetroQuest Energy, L.L.C., PetroQuest Oil & Gas, L.L.C, Pittrans, Inc. and TDC Energy LLC (collectively, the "Company"). All intercompany accounts and transactions have been eliminated.
Use of Estimates
The preparation of financial statements in conformity with accounting principles generally accepted in the United States requires management to make estimates and assumptions that affect the reported amounts of assets and liabilities and disclosure of contingent assets and liabilities at the date of the financial statements and the reported amounts of revenues and expenses during the reporting period. Actual results could differ from those estimates. Estimates of proved oil and gas reserves and future net cash flows from estimated proved reserves are based on geological and engineering data and depend upon a number of variable factors and assumptions. Changes in estimated proved oil and gas reserves used in the calculation of depreciation, depletion and amortization of oil and gas properties or the present value of the estimated future net cash flows from estimated proved reserves used in the ceiling test could have a material impact on future results of operations.
Oil and Gas Properties
The Company utilizes the full cost method of accounting, which involves capitalizing all acquisition, exploration and development costs incurred for the purpose of finding oil and gas reserves including the costs of drilling and equipping productive wells, dry hole costs, lease acquisition costs and delay rentals. The Company also capitalizes the portion of general and administrative costs that can be directly identified with acquisition, exploration or development of oil and gas properties. Unevaluated property costs are transferred to evaluated property costs at such time as wells are completed on the properties, the properties are sold, or management determines these costs to have been impaired. Interest is capitalized on unevaluated property costs. Transactions involving sales of reserves in place are recorded as adjustments to accumulated depreciation, depletion and amortization with no gain or loss recognized, unless such adjustments would cause a significant alteration in the relationship between capitalized costs and proved reserves.
Depreciation, depletion and amortization of oil and gas properties is computed using the unit-of-production method based on estimated proved reserves. All costs associated with evaluated oil and gas properties, including an estimate of future development costs associated therewith, are included in the depreciable base. The costs of investments in unevaluated properties are excluded from this calculation until the related properties are evaluated, proved reserves are established or the properties are determined to be impaired. Proved oil and gas reserves are estimated annually by independent petroleum engineers.
The capitalized costs of proved oil and gas properties cannot exceed the present value of the estimated net future cash flows from proved reserves based on historical twelve-month, first day of the month, average oil, gas and natural gas liquid prices, including the effect of hedges in place (the full cost ceiling). If the capitalized costs of proved oil and gas properties exceed the full cost ceiling, the Company is required to write-down the value of its oil and gas properties to the full cost ceiling amount. The Company follows the provisions of Staff Accounting Bulletin (“SAB”) No. 106, regarding the application of Accounting Standards Codification ("ASC") Topic 410-20 by companies following the full cost accounting method. SAB No. 106 indicates that estimated future dismantlement and abandonment costs that are recorded on the balance sheet are to be included in the costs subject to the full cost ceiling limitation. The estimated future cash outflows associated with settling the recorded asset retirement obligations are excluded from the computation of the present value of estimated future net revenues used in applying the ceiling test.
Cash and Cash Equivalents
The Company considers all highly liquid investments with a stated maturity of three months or less to be cash and cash equivalents. The majority of the Company’s cash and cash equivalents are in overnight securities made through its commercial bank accounts, which result in available funds the next business day.
F-7
Accounts Receivable
In its capacity as operator, the Company incurs drilling and operating costs that are billed to its partners based on their respective working interests.
Other Property and Equipment
The costs related to other furniture and fixtures are depreciated on a straight line basis over estimated useful lives ranging from three to five years.
Deposit For Surety Bonds
The deposit for surety bonds of $8.3 million at December 31, 2017 represents cash collateral paid with respect to the Company's surety bonds which secure its offshore decommissioning obligations. As a result of the sale of the Company's Gulf of Mexico assets in January 2018, the Company expects these deposits will be refunded during 2018 (subject to the Company's obligation to pay approximately $3.8 million to the purchaser of these assets). At December 31, 2016, deposits for surety bonds totaled $6.2 million and were included in other assets in the Company's consolidated financial statements.
Income Taxes
The Company accounts for income taxes in accordance with ASC Topic 740. Provisions for income taxes include deferred taxes resulting primarily from temporary differences due to different reporting methods for oil and gas properties for financial reporting purposes and income tax purposes. For financial reporting purposes, all exploratory and development expenditures are capitalized and depreciated, depleted and amortized on the unit-of-production method. For income tax purposes, only the equipment and leasehold costs relative to successful wells are capitalized and recovered through depreciation or depletion. Generally, most other exploratory and development costs are charged to expense as incurred; however, the Company may use certain provisions of the Internal Revenue Code that allow capitalization of intangible drilling costs. Other financial and income tax reporting differences occur primarily as a result of statutory depletion. Deferred tax assets are assessed for realizability and a valuation allowance is established for any portion of the asset for which it is more likely than not will not be realized.
Revenue Recognition
The Company records natural gas and oil revenue under the sales method of accounting. Under the sales method, the Company recognizes revenues based on the amount of natural gas or oil sold to purchasers, which may differ from the amounts to which the Company is entitled based on its interest in the properties. See "Recently Issued Accounting Standards" below for discussion of the adoption of the new revenue recognition standard.
Concentrations
The Company’s production is sold on month to month contracts at prevailing prices. The Company attempts to diversify its sales among multiple purchasers and obtain credit protection such as letters of credit and parental guarantees when necessary.
The following table identifies customers from whom the Company derived 10% or more of its oil and gas revenues during the years presented. Based on the availability of other customers, the Company does not believe the loss of any of these customers would have a significant effect on its business or financial condition.
Year Ended December 31, | |||
2017 | 2016 | 2015 | |
Superior Natural Gas | 29% | 14% | (a) |
Shell Trading Company | 24% | 23% | 18% |
Laclede Energy Resources | (a) | 17% | 21% |
BG Group | (a) | 10% | 10% |
Unimark, LLC | (a) | (a) | 17% |
(a) | Less than 10 percent |
F-8
Derivative Instruments
Under ASC Topic 815, the nature of a derivative instrument must be evaluated to determine if it qualifies for hedge accounting treatment. Instruments qualifying for hedge accounting treatment are recorded as an asset or liability measured at fair value and subsequent changes in fair value are recognized in stockholders’ equity through other comprehensive income (loss), net of related taxes, to the extent the hedge is effective. If a hedge becomes ineffective because the hedged production does not occur, or the hedge otherwise does not qualify for hedge accounting treatment, the changes in the fair value of the derivative are recorded in the statement of operations as derivative income (expense). The Company does not offset fair value amounts recognized for derivative instruments.
The Company’s hedges are specifically referenced to NYMEX prices for oil and natural gas. The effectiveness of hedges is evaluated at the time the contracts are entered into, as well as periodically over the life of the contracts, by analyzing the correlation between NYMEX prices and the posted prices received from the designated production. Through this analysis, the Company is able to determine if a high correlation exists between the prices received for its designated production and the NYMEX prices at which the hedges will be settled. At December 31, 2017, the Company’s derivative instruments were designated as effective cash flow hedges. See Note 7 for further discussion of the Company’s derivative instruments.
Recently Issued Accounting Standards
In May 2014, the Financial Accounting Standards Board (“FASB”) issued Accounting Standards Update (“ASU”) 2014-09, “Revenue from Contracts with Customers,” to clarify the principles for recognizing revenue and to develop a common revenue standard and disclosure requirements. The core principle of ASU 2014-09 is that an entity will recognize revenue when it transfers control of goods or services to customers at an amount that reflects the consideration to which it expects to be entitled in exchange for those goods and or services. In August 2015, the FASB issued ASU 2015-14 deferring the effective date of ASU 2014-09 by one year to interim and annual periods beginning on or after December 31, 2017. Entities can choose to apply the standard using either a full retrospective approach or a modified retrospective approach, with the cumulative effect of initially applying ASU 2014-09 recognized at the date of initial application. The Company adopted the new standard effective January 1, 2018 using the modified retrospective approach. The adoption of the standard did not have a material impact on the Company's consolidated financial statements, but will result in increased disclosures related to revenue recognition policies and disaggregation of revenues.
In February 2016, the FASB issued ASU 2016-02, "Leases (Topic 842)," to increase transparency and comparability among organizations by recognizing lease assets and lease liabilities on the balance sheet and disclosing key information about leasing arrangements. The standard is effective for public entities for fiscal years beginning after December 15, 2018, and for interim periods within those fiscal years, with earlier application permitted. Upon adoption the lessee will apply the new standard retrospectively to all periods presented or retrospectively using a cumulative effect adjustment in the year of adoption. The Company is currently evaluating the effect that this new standard may have on its consolidated financial statements.
In March 2016, the FASB issued ASU 2016-09, "Compensation - Stock Compensation (Topic 718)," to simplify several aspects of the accounting for share-based payment transactions, including the income tax consequences, classification of awards as either equity or liabilities, and forfeitures, as well as classification in the statement of cash flows. The Company adopted ASU 2016-09 on January 1, 2017, and the adoption of the standard did not have a material impact on the Company's consolidated financial statements.
In August 2017, the FASB issued ASU 2017-12, "Derivative and Hedging," to improve the financial reporting of hedging relationships to better portray the economic results of an entity's risk management activities in its consolidated financial statements and make certain targeted improvements to simplify the application of the hedge accounting guidance in current US GAAP. ASU 2017-12 is effective for public entities for fiscal years beginning after December 15, 2018, and interim periods within those fiscal years, with earlier application permitted. The Company is currently evaluating the effect that this new standard may have on its consolidated financial statements.
Note 2—Acquisitions and Divestitures
Divestitures:
On June 4, 2015, the Company completed the sale of a majority of its interests in the Woodford Shale and Mississippian Lime for $280 million, subject to customary post-closing purchase price adjustments, effective January 1, 2015. At closing, the Company received $257.7 million in cash and recognized a receivable of $13.9 million, which was received in full during the third quarter of 2015.
At December 31, 2014, the estimated proved reserves attributable to the assets sold totaled approximately 227.2 Bcfe (unaudited), which represented approximately 57% (unaudited) of the Company's estimated proved reserves. Under the full cost
F-9
method of accounting, sales of oil and gas properties are accounted for as adjustments of capitalized costs with no gain or loss recognized, unless the adjustment significantly alters the relationship between capitalized costs and proved reserves. A significant alteration is generally not expected to occur for sales involving less than 25% of the total proved reserves. If the sale was accounted for as an adjustment of capitalized costs with no gain or loss recognized, the adjustment would have significantly altered the relationship between capitalized costs and proved reserves. Accordingly, the Company recognized a gain on the sale of $23.2 million during 2015. The carrying value of the properties sold was determined by allocating total capitalized costs within the full cost pool between properties sold and properties retained based on their relative fair values.
In March 2016, the Company sold certain non-producing assets in East Texas for $7 million to a potential joint venture partner. This sale was accounted for as an adjustment to the capitalized costs of oil and gas properties. After determining it would not pursue a joint venture with this party, the Company repurchased the non-producing assets for $5 million in December, 2016 as per the terms of the purchase and sale agreement. The Company subsequently entered into a new drilling joint venture in East Texas with another group of partners.
On April 20, 2016, the Company completed the sale of a majority of its remaining Woodford Shale assets in the East Hoss field for approximately $18 million, subject to customary post-closing purchase price adjustments, effective April 1, 2016. This sale was accounted for as an adjustment to the capitalized costs of oil and gas properties.
On October 31, 2016, the Company completed the sale of its remaining Oklahoma assets for approximately $0.7 million, subject to customary post-closing purchase-price adjustments, effective November 1, 2016. This sale was accounted for as an adjustment to the capitalized costs of oil and gas properties.
On April 17, 2017, the Company completed the sale of its interest in the East Lake Verret field in Louisiana for approximately $2.2 million. This sale was accounted for as an adjustment to the capitalized costs of oil and gas properties.
On December 15, 2017, the Company completed the sale of its saltwater disposal assets in East Texas for approximately $8.5 million. This sale was accounted for as an adjustment to the capitalized costs of oil and gas properties.
Acquisitions:
On December 20, 2017, the Company entered into an oil focused play in central Louisiana targeting the Austin Chalk formation through the execution of agreements to acquire interests in approximately 24,600 gross acres for a purchase price of approximately $9.3 million and the issuance of 2.0 million shares of common stock.
Subsequent Event:
On January 31, 2018, the Company sold its Gulf of Mexico properties (the "Sold Assets"). The Company received no consideration from the sale of these properties and is required to contribute approximately $3.8 million towards the future abandonment costs for the properties. As a result of the sale, the Company extinguished approximately $28.4 million of its discounted asset retirement obligation subsequent to December 31, 2017 (see Note 6). In connection with the sale, the Company expects to receive a cash refund of approximately $10.7 million related to a depositary account that served to collateralize a portion of the Company's offshore bonds related to these properties (subject to the Company's obligation to pay approximately $3.8 million to the purchaser of these properties), $8.3 million of which is included in deposits for surety bonds on the Company's Consolidated Balance Sheet as of December 31, 2017.
Note 3—Equity
Common Stock
On May 18, 2016, the Company effected a reverse split of its common stock at a ratio of one share of newly issued common stock for each four shares of issued and outstanding common stock (the "Reverse Split"). The purpose of the Reverse Split was to increase the per share trading price of the Company's common stock in order to regain compliance with the New York Stock Exchange continued listing standards. The Reverse Split proportionately reduced the total number of outstanding shares of common stock from approximately 70.5 million shares to approximately 17.6 million shares. All references in the consolidated financial statements and notes to consolidated financial statements to the number of shares, per share data, restricted stock and stock option data have been retroactively adjusted to give effect to the Reverse Split.
During December 2017, the Company issued 2.0 million shares of common stock in connection with the acquisition of Austin Chalk acreage. Additionally, during December 2017, the Company issued appoximately 2.2 million shares of common stock related to the extinguishment of a portion of the outstanding 2021 Notes (see Note 9).
F-10
Convertible Preferred Stock
The Company has 1,495,000 shares of 6.875% Series B Cumulative Convertible Perpetual Preferred Stock (the “Series B Preferred Stock”) outstanding.
The following is a summary of certain terms of the Series B Preferred Stock:
Dividends. The Series B Preferred Stock accumulates dividends at an annual rate of 6.875% for each share of Series B Preferred Stock. Dividends are cumulative from the date of first issuance and, to the extent payment of dividends is not prohibited by the Company’s debt agreements, assets are legally available to pay dividends and the Company’s board of directors or an authorized committee of the board declares a dividend payable, the Company pays dividends in cash, every quarter.
In connection with an amendment to the Company's bank credit facility (which was terminated and replaced by the Multidraw Term Loan Agreement with Franklin Custodian Funds in October 2016) prohibiting the Company from declaring or paying dividends on the Series B Preferred Stock, the Company suspended the quarterly cash dividend on it Series B Preferred Stock beginning with the dividend payment due on April 15, 2016. The Multidraw Term Loan Agreement also prohibits the Company from declaring and paying cash dividends on the Series B Preferred Stock. Under the terms of the Series B Preferred Stock, any unpaid dividends will accumulate. As of December 31, 2017, the Company has deferred seven quarterly dividend payments and has accrued a $10.3 million payable related to the seven deferred quarterly dividends and the quarterly dividend that was payable on January 15, 2018, which is included in other long-term liabilities on the Consolidated Balance Sheet. As a result of the restrictions under the Multidraw Term Loan Agreement, the Company did not pay the dividend that was payable on July 15, 2017, which represented the sixth deferred dividend payment. As a result, the holders of the Series B Preferred Stock, voting as a single class, currently have the right to elect two additional directors to the Company's Board of Directors (the "Board") until all accumulated and unpaid dividends on the Series B Preferred Stock are paid in full. On August 23, 2017, the Board received written notice from two affiliated holders of the Series B Preferred Stock (the "Requesting Holders") exercising this right by requesting that the Board call a special meeting of the holders of the Preferred Stock for the purposes of electing the additional directors, as set forth in Section 4(ii) of the Certificate of Designations establishing the Preferred Stock, dated September 24, 2007. However, on October 20, 2017, as a result of discussions between the Company's management and certain holders of the Series B Preferred Stock, the Requesting Holders withdrew their request that the Board call the special meeting of the holders of the Series B Preferred Stock, and the Board determined not to call a special meeting of the holders of the Series B Preferred Stock at that time. The Company is committed to working with holders of the Series B Preferred Stock as they identify and evaluate potential candidates to add to the existing Board in 2018.
Mandatory conversion. The Company may, at its option, cause shares of the Series B Preferred Stock to be automatically converted at the applicable conversion rate, but only if the closing sale price of the Company’s common stock for 20 trading days within a period of 30 consecutive trading days ending on the trading day immediately preceding the date the Company gives the conversion notice equals or exceeds 130% of the conversion price in effect on each such trading day.
Conversion rights. Each share of Series B Preferred Stock may be converted at any time, at the option of the holder, into 0.8608 shares of the Company’s common stock (which is based on an initial conversion price of approximately $58.08 per share of common stock, subject to further adjustment) plus cash in lieu of fractional shares, subject to the Company’s right to settle all or a portion of any such conversion in cash or shares of the Company’s common stock. If the Company elects to settle all or any portion of its conversion obligation in cash, the conversion value and the number of shares of the Company’s common stock it will deliver upon conversion (if any) will be based upon a 20 trading day averaging period.
Upon any conversion, the holder will not receive any cash payment representing accumulated and unpaid dividends on the Series B Preferred Stock, whether or not in arrears, except in limited circumstances. The conversion rate is equal to $50 divided by the conversion price at the time. The conversion price is subject to adjustment upon the occurrence of certain events. The conversion price on the conversion date and the number of shares of the Company’s common stock, as applicable, to be delivered upon conversion may be adjusted if certain events occur.
F-11
Note 4—Earnings Per Share
A reconciliation between the basic and diluted earnings per share computations (in thousands, except per share amounts) is as follows:
For the Year Ended December 31, 2017 | Loss(Numerator) | Shares (Denominator) | Per Share Amount | |||||||
BASIC EPS | ||||||||||
Net loss available to common stockholders | $ | (11,776 | ) | 21,330 | $ | (0.55 | ) | |||
Stock options | — | — | ||||||||
Attributable to participating securities | — | — | ||||||||
DILUTED EPS | $ | (11,776 | ) | 21,330 | $ | (0.55 | ) | |||
For the Year Ended December 31, 2016 | Loss(Numerator) | Shares (Denominator) | Per Share Amount | |||||||
BASIC EPS | ||||||||||
Net loss available to common stockholders | $ | (96,245 | ) | 18,354 | $ | (5.24 | ) | |||
Stock options | — | — | ||||||||
Attributable to participating securities | — | — | ||||||||
DILUTED EPS | $ | (96,245 | ) | 18,354 | $ | (5.24 | ) | |||
For the Year Ended December 31, 2015 | Loss(Numerator) | Shares (Denominator) | Per Share Amount | |||||||
BASIC EPS | ||||||||||
Net loss available to common stockholders | $ | (299,929 | ) | 16,256 | $ | (18.45 | ) | |||
Stock options | — | — | ||||||||
Attributable to participating securities | — | — | ||||||||
DILUTED EPS | $ | (299,929 | ) | 16,256 | $ | (18.45 | ) | |||
An aggregate of 1.6 million shares of common stock representing options to purchase common stock and unvested shares of restricted common stock and common shares issuable upon the assumed conversion of the Series B Preferred Stock totaling 1.3 million shares were not included in the computation of diluted earnings per share for the year ended December 31, 2017, because the inclusion would have been anti-dilutive as a result of the net loss reported for the year.
An aggregate of 0.9 million shares of common stock representing options to purchase common stock and unvested shares of restricted common stock and common shares issuable upon the assumed conversion of the Series B Preferred Stock totaling 1.3 million shares were not included in the computation of diluted earnings per share during the year ended December 31, 2016, because the inclusion would have been anti-dilutive as a result of the net loss reported for the year.
An aggregate of 0.1 million shares of common stock representing options to purchase common stock and unvested shares of restricted common stock and common shares issuable upon the assumed conversion of the Series B Preferred Stock totaling 1.3 million shares were not included in the computation of diluted earnings per share during the year ended December 31, 2015, because the inclusion would have been anti-dilutive as a result of the net loss reported for the year.
F-12
Note 5—Share-Based Compensation
The Company accounts for share-based compensation in accordance with ASC Topic 718. Share-based compensation cost is recognized over the requisite service period. Compensation cost for awards with graded vesting is recognized using the accelerated attribution method. Share-based compensation cost is reflected as a component of general and administrative expenses. A detail of share-based compensation cost for the years ended December 31, 2017, 2016 and 2015 is as follows (in thousands):
Year Ended December 31, | ||||||||||||
2017 | 2016 | 2015 | ||||||||||
Stock options: | ||||||||||||
Incentive Stock Options (share settled) | $ | 820 | $ | 206 | $ | 243 | ||||||
Non-Qualified Stock Options (share settled) | 387 | 164 | 71 | |||||||||
Restricted stock (share settled) | 197 | 1,073 | 4,303 | |||||||||
Cash settled stock units | 245 | 244 | (439 | ) | ||||||||
Share-based compensation | $ | 1,649 | $ | 1,687 | $ | 4,178 | ||||||
During each of the years ended December 31, 2017 and 2016, the Company capitalized $0.1 million of compensation cost related to cash settled restricted stock units to oil and gas properties. No such amounts were capitalized during the year ended December 31, 2015. During the years ended December 31, 2017, 2016 and 2015, the Company recorded income tax benefits of approximately $0.3 million, $0.5 million and $1.5 million, respectively, related to share-based compensation expense recognized during those periods. As a result of the Company’s net operating loss position, no excess tax benefits have been recognized for any periods presented.
Share-Based compensation settled in shares
At December 31, 2017, the Company had $3.9 million of unrecognized compensation cost related to unvested restricted stock and stock options. This amount will be recognized as compensation expense over a weighted average period of approximately three years.
Stock Options
Stock options may be granted to employees and consultants and generally vest ratably over a three-year period. Stock options may also be granted to directors and generally vest one year or less from the date of grant to align with their term on the board. Stock options must be exercised within 10 years of the grant date. The exercise price of each option may not be less than the fair market value of a share of common stock on the date of grant. Upon a change in control of the Company, all outstanding options become immediately exercisable.
The Company computes the fair value of its stock options using the Black-Scholes option-pricing model assuming an expected term based on historical activity and expected volatility computed using historical stock price fluctuations on a weekly basis for a period of time equal to the expected term of the option. Periodically, the Company adjusts compensation expense based on the difference between actual and estimated forfeitures.
There were no stock options granted in 2015. The following table outlines the assumptions used in computing the fair value of stock options granted during 2017 and 2016:
Years Ended December 31, | |||
2017 | 2016 | ||
Dividend yield | —% | —% | |
Expected volatility | 80.44% | 62.0%-79.99% | |
Risk-free rate | 1.925% | 1.255%-2.09% | |
Expected term | 6 years | 6 years | |
Stock options granted | 219,130 | 1,168,754 | |
Wgtd. avg. grant date fair value per share | $1.28 | $1.96 | |
Fair value of grants | $280,000 | $2,293,000 | |
F-13
The following table details stock option activity during the year ended December 31, 2017:
Number of Options | Wgtd. Avg. Exercise Price | Wgtd. Avg. Remaining Life | Aggregate Intrinsic Value (000’s) | ||||||||||
Outstanding at beginning of year | 1,412,940 | $ | 7.13 | ||||||||||
Granted | 219,130 | 1.85 | |||||||||||
Expired/cancelled/forfeited | (23,424 | ) | 21.49 | ||||||||||
Exercised | — | ||||||||||||
Outstanding at end of year | 1,608,646 | 6.20 | 8.08 | $ | 9 | ||||||||
Options exercisable at end of year | 705,594 | $ | 10.34 | 7.00 | $ | — | |||||||
Options expected to vest | 1,563,493 | 6.29 | 8.06 | $ | 8 | ||||||||
The total fair value of stock options that vested during the years ended December 31, 2017, 2016 and 2015 was $1.6 million, $0.4 million and $0.8 million, respectively. The intrinsic value of stock options exercised was immaterial for all periods presented.
The following table summarizes information regarding stock options outstanding at December 31, 2017:
Range of | Options | Wgtd. Avg. | Wgtd. Avg. | Options | Wgtd. Avg. | |||||||
Exercise | Outstanding | Remaining | Exercise | Exercisable | Exercise | |||||||
Price | 12/31/2017 | Contractual Life | Price | 12/31/2017 | Price | |||||||
$0.00-$2.49 | 285,503 | 9.48 | $1.97 | 22,150 | $2.37 | |||||||
$2.50-$3.49 | 878,833 | 8.74 | $3.17 | 362,973 | $3.17 | |||||||
$3.50-$4.99 | 206,769 | 8.38 | $4.26 | 82,930 | $4.23 | |||||||
$15.00-$30.32 | 237,541 | 3.71 | $24.18 | 237,541 | $24.18 | |||||||
1,608,646 | 705,594 | $10.34 | ||||||||||
Restricted Stock
The Company computes the fair value of its service based restricted stock using the closing price of the Company’s stock at the date of grant. Restricted stock granted to employees generally vests ratably over a three-year period. Restricted stock granted to directors vests one year or less from the date of grant to align with their term on the board. Upon a change in control of the Company, all outstanding shares of restricted stock will become immediately vested.
The following table details restricted stock activity during the year ended December 31, 2017:
Number of Shares | Wgtd. Avg. Fair Value per Share | ||||
Outstanding at beginning of year | 78,557 | $16.57 | |||
Granted | 487,502 | $1.87 | |||
Lapse of restrictions | (78,557 | ) | $16.57 | ||
Outstanding at December 31, 2017 | 487,502 | $1.87 | |||
The weighted average grant date fair value of restricted stock granted during the years ended December 31, 2017 and 2015 was $1.87 and $5.08, respectively, per share. No restricted stock was granted in 2016. The total fair value of restricted stock that vested during the years ended December 31, 2017, 2016 and 2015 was $1.3 million, $2.4 million and $4.7 million, respectively.
Share-Based compensation settled in cash
Restricted Stock Units
The Company may grant restricted stock units ("RSUs") to employees that vest ratably over a three-year period. Cash payment will be made to employees on each vesting date based upon the Company's closing stock price on that date. Upon change in control of the Company, all of the RSUs will immediately vest. The Company computes the fair value of the RSUs using the closing price of the Company's stock at the end of each period and records a liability based on the percentage of requisite service
F-14
rendered at the reporting date. During 2017 and 2016, the Company paid $0.1 million and $0.3 million, respectively, to settle 31,703 and 111,461 RSUs, respectively, that vested during the period.
Market Based Restricted Stock Units
The Company granted 60,767 market based restricted stock units ("MRSUs") to executive officers during November 2014. The executive officers can earn between 0-200% of the MRSUs granted based on the Company's performance versus a defined peer group. The 2014 MRSUs vest in one-third increments on each of the first, second and third annual anniversaries starting January 1, 2016. Upon change in control of the Company, all of the MRSUs will immediately vest. The number of MRSUs that ultimately vest is based on the Company's total shareholder return in the last 20 days of the fiscal year in relation to the last 20 days of the previous fiscal year in comparison to a group of 12 selected peer stocks of similar sized companies which operate within the same sector. The performance period ended on December 31, 2015 and executive officers earned 50% of the MRSUs. The MRSUs are cash settled on each vesting date based on the number of MRSUs that vest multiplied by the Company's closing stock price. In November 2017, the Company granted an additional 270,269 MRSUs. The performance period is scheduled to end on December 31, 2018 for these grants. The Company estimates the fair value of the outstanding MRSUs using a Monte Carlo valuation model and records a liability based on the percentage of requisite service rendered at the reporting date. The Monte Carlo valuation model considers such inputs as the stock prices of the Company and its peer group, a risk-free interest rate, and an estimated volatility for the Company and its peer group. As of December 31, 2017 and December 31, 2016, the Company had a liability for RSUs and MRSUs outstanding in the amount of $0.3 million and $0.1 million, respectively, based upon the closing stock price at December 31, 2017 and December 31, 2016.
The following table details MRSU and RSU activity during the year ended December 31, 2017:
MRSU | RSU | Total | ||||
Outstanding at beginning of year | 14,929 | 31,979 | 46,908 | |||
Granted | 270,269 | 889,587 | 1,159,856 | |||
Expired/Cancelled/Forfeited | — | (276 | ) | (276 | ) | |
Vested/Paid | (7,465 | ) | (31,703 | ) | (39,168 | ) |
Outstanding at December 31, 2017 | 277,733 | 889,587 | 1,167,320 | |||
Note 6—Asset Retirement Obligation
The Company accounts for asset retirement obligations in accordance with ASC Topic 410-20, which requires recording the fair value of an asset retirement obligation associated with tangible long-lived assets in the period incurred. Asset retirement obligations associated with long-lived assets included within the scope of ASC Topic 410-20 are those for which there is a legal obligation to settle under existing or enacted law, statute, written or oral contract or by legal construction under the doctrine of promissory estoppel. The Company has legal obligations to plug, abandon and dismantle existing wells and facilities that it has acquired and constructed.
The following table summarizes the changes to the Company’s asset retirement obligation (in thousands):
Year Ended December 31, | |||||||
2017 | 2016 | ||||||
Asset retirement obligation, beginning of period | $ | 36,610 | $ | 42,556 | |||
Liabilities incurred | 574 | — | |||||
Liabilities settled | (3,364 | ) | (3,296 | ) | |||
Accretion expense | 2,252 | 2,515 | |||||
Revisions in estimated cash flows | (4,514 | ) | (1,746 | ) | |||
Divestiture of oil and gas properties | (248 | ) | (3,419 | ) | |||
Asset retirement obligation, end of period | 31,310 | 36,610 | |||||
Less: current portion of asset retirement obligation | (687 | ) | (4,160 | ) | |||
Long-term asset retirement obligation | $ | 30,623 | $ | 32,450 | |||
Divestitures of oil and gas properties during 2016 included $3.3 million as a result of the sale of our remaining Oklahoma assets. The liabilities incurred, revisions in estimated cash flows and divestitures represent non-cash investing activities for purposes
F-15
of the statement of cash flows. In January 2018, the Company completed the sale of the Sold Assets, which resulted in a reduction of $28.4 million to our discounted asset retirement obligation subsequent to December 31, 2017.
Note 7—Derivative Instruments
The Company seeks to reduce its exposure to commodity price volatility by hedging a portion of its production through commodity derivative instruments. When the conditions for hedge accounting are met, the Company may designate its commodity derivatives as cash flow hedges. The changes in fair value of derivative instruments that qualify for hedge accounting treatment are recorded in other comprehensive income (loss) until the hedged oil or natural gas quantities are produced. If a derivative does not qualify for hedge accounting treatment, the changes in the fair value of the derivative are recorded in the statement of operations as derivative income (expense). At December 31, 2017 and 2016, all of the Company's outstanding derivative instruments were designated as cash flow hedges.
Oil and gas sales include additions related to the settlement of gas hedges of $1.5 million, $1.8 million and $15.9 million, for the years ended December 31, 2017, 2016 and 2015, respectively. There were no settlements of Ngl or oil hedges for the years ended December 31, 2017 and 2016. Oil and gas sales include $0.5 million and $0.6 million related to settlements of Ngl and oil hedges, respectively, for the year ended December 31, 2015.
As of December 31, 2017, the Company had entered into the following gas and oil hedge contracts:
Production Period | Instrument Type | Daily Volumes | Weighted Average Price | |||
Natural Gas: | ||||||
January 2018 - March 2018 | Swap | 35,000 Mmbtu | $3.24 | |||
Crude Oil: | ||||||
January 2018 - December 2018 | Swap | 250 Bbl | $55.00 | |||
At December 31, 2017, the Company had recognized a net asset of approximately $0.4 million related to the estimated fair value of these derivative contracts. Based on estimated future commodity prices as of December 31, 2017, the Company would realize a $0.3 million gain, net of taxes, during the next 12 months. This gain is expected to be reclassified to oil and gas sales based on the schedule of volumes stipulated in the derivative contracts.
Derivatives designated as hedging instruments:
The following tables reflect the fair value of the Company’s effective cash flow hedges in the consolidated financial statements (in thousands):
Effect of Cash Flow Hedges on the Consolidated Balance Sheet at December 31, 2017 and December 31, 2016:
Commodity Derivatives | ||||
Period | Balance Sheet Location | Fair Value | ||
December 31, 2017 | Derivative asset | $ | 1,174 | |
December 31, 2017 | Derivative liability | $ | (731 | ) |
December 31, 2016 | Derivative liability | $ | (3,947 | ) |
December 31, 2016 | Other long-term liabilities | $ | (803 | ) |
Effect of Cash Flow Hedges on the Consolidated Statement of Operations for years ended December 31, 2017, 2016 and 2015:
Instrument | Amount of Gain (Loss) Recognized in Other Comprehensive Income | Location of Gain Reclassified into Income | Amount of Gain Reclassified into Income | ||||||
Commodity Derivatives at December 31, 2017 | $ | 6,654 | Oil and gas sales | $ | 1,461 | ||||
Commodity Derivatives at December 31, 2016 | $ | (4,447 | ) | Oil and gas sales | $ | 1,811 | |||
Commodity Derivatives at December 31, 2015 | $ | 9,991 | Oil and gas sales | $ | 17,114 | ||||
F-16
Note 8 - Fair Value Measurements
ASC Topic 820 defines fair value as the price that would be received to sell an asset or paid to transfer a liability in an orderly transaction between market participants at the measurement date and establishes a fair value hierarchy that prioritizes the inputs to valuation techniques used to measure fair value. As presented in the tables below, this hierarchy consists of three broad levels:
• | Level 1: valuations consist of unadjusted quoted prices in active markets for identical assets and liabilities and has the highest priority; |
• | Level 2: valuations rely on quoted prices in markets that are not active or observable inputs over the full term of the asset or liability; |
• | Level 3: valuations are based on prices or third party or internal valuation models that require inputs that are significant to the fair value measurement and are less observable and thus have the lowest priority. |
The Company classifies its commodity derivatives based upon the data used to determine fair value. The Company's derivative instruments at December 31, 2017 and 2016 were in the form of swaps based on NYMEX pricing for oil and natural gas. The fair value of these derivatives is derived using an independent third-party’s valuation model that utilizes market-corroborated inputs that are observable over the term of the derivative contract. The Company’s fair value calculations also incorporate an estimate of the counterparties’ default risk for derivative assets and an estimate of the Company’s default risk for derivative liabilities. As a result, the Company designates its commodity derivatives as Level 2 in the fair value hierarchy.
The following table summarizes the Company’s assets (liabilities) that are subject to fair value measurement on a recurring basis as of December 31, 2017 and December 31, 2016 (in thousands):
Fair Value Measurements Using | |||||||||||
Instrument | Quoted Prices in Active Markets (Level 1) | Significant Other Observable Inputs (Level 2) | Significant Unobservable Inputs (Level 3) | ||||||||
Commodity Derivatives: | |||||||||||
At December 31, 2017 | $ | — | $ | 443 | $ | — | |||||
At December 31, 2016 | $ | — | $ | (4,750 | ) | $ | — | ||||
The fair value of the Company's cash and cash equivalents approximated book value at December 31, 2017 and 2016. The fair value of the Multidraw Term Loan Agreement approximated face value as of December 31, 2017 and 2016. The fair value of the Company's 2017 Notes, 2021 Notes and 2021 PIK Notes was determined based upon market quotes provided by an independent broker, which represents a Level 2 input. The following table summarizes the fair value of the 2017 Notes, 2021 Notes and 2021 PIK Notes as of December 31, 2017 and 2016, respectively (in thousands).
Fair Value at 12/31/17 | Face Value at 12/31/17 | Carrying value at 12/31/17 | Fair Value at 12/31/16 | Face Value at 12/31/16 | Carrying value at 12/31/16 | ||||||||||||||
2017 Notes | $ | — | $ | — | $ | — | $ | 21,970 | $ | 22,650 | $ | 22,568 | |||||||
2021 Notes | 7,306 | 9,427 | 9,821 | 12,192 | 14,177 | 15,228 | |||||||||||||
2021 PIK Notes | 198,717 | 263,202 | 271,577 | 177,732 | 243,468 | 248,600 | |||||||||||||
$ | 206,023 | $ | 272,629 | $ | 281,398 | $ | 211,894 | $ | 280,295 | $ | 286,396 | ||||||||
Note 9—Long-Term Debt
On August 19, 2010, the Company issued $150 million in principal amount of its 10% Senior Notes due 2017. On July 3, 2013, the Company issued an additional $200 million in principal amount of its 10% Senior Notes due 2017 (collectively, the "2017 Notes").
On February 17, 2016, the Company closed a private exchange offer (the "February Exchange") and consent solicitation (the "February Consent Solicitation") to certain eligible holders of its outstanding 2017 Notes. In satisfaction of the tender of $214.4 million in aggregate principal amount of the 2017 Notes, representing approximately 61% of the then outstanding aggregate principal amount of 2017 Notes, the Company (i) paid approximately $53.6 million of cash, (ii) issued $144.7 million aggregate principal amount of its new 10% Second Lien Senior Secured Notes due 2021 (the "2021 Notes") and (iii) issued approximately 1.1 million shares of common stock. Following the completion of the February Exchange, $135.6 million in aggregate principal
F-17
amount of the 2017 Notes remained outstanding. The February Consent Solicitation eliminated or waived substantially all of the restrictive covenants contained in the indenture governing the 2017 Notes.
On September 27, 2016, the Company closed private exchange offers (the "September Exchange") and a consent solicitation (the "September Consent Solicitation") to certain eligible holders of its outstanding 2017 Notes and 2021 Notes. In satisfaction of the consideration of $113.0 million in aggregate principal amount of the 2017 Notes, representing approximately 83% of the then outstanding aggregate principal amount of 2017 Notes, and $130.5 million in aggregate principal amount of the 2021 Notes, representing approximately 90% of the then outstanding aggregate principal amount of 2021 Notes, the Company issued (i) $243.5 million in aggregate principal amount of its new 10% Second Lien Senior Secured PIK Notes due 2021 (the "2021 PIK Notes") and (ii) approximately 3.5 million shares of common stock. The Company also paid, in cash, accrued and unpaid interest on the 2017 Notes and 2021 Notes accepted in the September Exchange from the last applicable interest payment date to, but not including, September 27, 2016. Following the consummation of the September Exchange, there were $22.7 million in aggregate principal amount of the 2017 Notes outstanding and $14.2 million in aggregate principal amount of the 2021 Notes outstanding. The September Consent Solicitation amended certain provisions of the indenture governing the 2021 Notes and amended the registration rights agreement with respect to the 2021 Notes.
On March 31, 2017, the Company redeemed its remaining outstanding 2017 Notes at a redemption price of $22.8 million. The redemption was funded by cash on hand and amounts borrowed under the Multidraw Term Loan Agreement described below. On December 28, 2017, the Company issued 2.2 million shares of common stock to extinguish approximately $4.8 million of outstanding principal amount of 2021 Notes.
The 2021 PIK Notes bear interest at a rate of 10% per annum on the principal amount and interest is payable semi-annually in arrears on February 15 and August 15 of each year, starting on February 15, 2017. The Company was permitted, at its option, for one or more of the first three interest payment dates of the 2021 PIK Notes, to instead pay interest at (i) the annual rate of 1% in cash plus (ii) the annual rate of 9% PIK (the "PIK Interest") payable by increasing the principal amount outstanding of the 2021 PIK Notes or by issuing additional 2021 PIK Notes in certificated form. The Company exercised this PIK option in connection with the interest payments due on February 15, 2017, August 15, 2017 and February 15, 2018. As of December 31, 2017, the Company was in compliance with all of the covenants under the 2021 PIK Notes.
The 2021 Notes bear interest at a rate of 10% per annum on the principal amount and interest is payable semi-annually in arrears on February 15 and August 15 of each year. As of December 31, 2017, the Company was in compliance with all of the covenants under the 2021 Notes.
The February Exchange and September Exchange were accounted for as troubled debt restructurings pursuant to ASC Topic 470-60 "Troubled Debt Restructurings by Debtors." The Company determined that the future undiscounted cash flows from the 2021 PIK Notes issued in the September Exchange through the maturity date exceeded the adjusted carrying amount of the 2017 Notes and the 2021 Notes tendered in the September Exchange. Accordingly, no gain or loss on extinguishment of debt was recognized in connection with the September Exchange. The net shortfall of the remaining carrying value of the 2017 Notes and 2021 Notes tendered as compared to the principal amount of the 2021 PIK Notes issued in the September Exchange of $0.6 million is reflected as part of the carrying value of the 2021 PIK Notes. Such shortfall is being amortized under the effective interest method over the term of the 2021 PIK Notes. At December 31, 2017, $0.5 million of the excess remained as part of the carrying value of the 2021 PIK Notes and the Company recognized $0.1 million of amortization expense as a increase to interest expense during the year ended December 31, 2017.
The Company previously determined that the future undiscounted cash flows from the 2021 Notes issued in the February Exchange through the maturity date exceeded the adjusted carrying amount of the 2017 Notes tendered in the February Exchange. Accordingly, no gain on extinguishment of debt was recognized in connection with the February Exchange. The excess of the remaining carrying value of the 2017 Notes tendered over the principal amount of the 2021 Notes issued in the February Exchange of $13.9 million was reflected as part of the carrying value of the 2021 Notes. The amount of the excess carrying value attributable to the 2021 Notes tendered in the September Exchange is now reflected as part of the carrying value of the 2021 PIK Notes. The excess carrying value attributable to the remaining 2021 Notes is being amortized under the effective interest method over the term of the 2021 Notes. At December 31, 2017, $0.6 million of the excess remained as part of the carrying value of the 2021 Notes and the Company recognized $0.6 million of amortization expense as a reduction to interest expense during the year ended December 31, 2017.
The issuance of the 2021 Notes, 2021 PIK Notes and shares of common stock, as wells as the exchange of the 2017 Notes and 2021 Notes in the February Exchange and September Exchange, represent non-cash financing activities for purposes of the statement of cash flows.
The indentures governing the 2021 PIK Notes and the 2021 Notes contain affirmative and negative covenants that, among other things, limit the ability of the Company and the subsidiary guarantors of the 2021 PIK Notes and the 2021 Notes to incur indebtedness; purchase or redeem stock; make certain investments; create liens that secure debt; enter into transactions with affiliates; sell assets; refinance certain indebtedness; merge with or into other companies or transfer substantially all of their assets;
F-18
and, in certain circumstances, to pay dividends or make other distributions on stock. The 2021 PIK Notes and the 2021 Notes are fully and unconditionally guaranteed on a senior basis, jointly and severally, by certain wholly-owned subsidiaries of the Company.
The 2021 PIK Notes and the 2021 Notes are secured equally and ratably by second-priority liens on substantially all of the Company's and the subsidiary guarantors' oil and gas properties and substantially all of their other assets to the extent such properties and assets secure the Multidraw Term Loan Agreement (as defined below), except for certain excluded assets. Pursuant to the terms of an intercreditor agreement, the security interest in those properties and assets that secure the 2021 PIK Notes and the 2021 Notes and the guarantees are contractually subordinated to liens that secure the Multidraw Term Loan Agreement and certain other permitted indebtedness. Consequently, the 2021 PIK Notes and the 2021 Notes and the guarantees will be effectively subordinated to the Multidraw Term Loan Agreement and such other indebtedness to the extent of the value of such assets.
On October 17, 2016, the Company entered into the Multidraw Term Loan Agreement (the "Multidraw Term Loan Agreement") with Franklin Custodian Funds - Franklin Income Fund ("Franklin"), as a lender, and Wells Fargo Bank, National Association, as administrative agent, replacing the credit agreement with JPMorgan Chase Bank, N.A. The Multidraw Term Loan Agreement provides a multi-advance term loan facility, with borrowing availability for three years, in a principal amount of up to $50.0 million. The loans drawn under the Multidraw Term Loan Agreement (collectively, the “Term Loans”) may be used to repay existing debt, to pay transaction fees and expenses, to provide working capital for exploration and production operations and for general corporate purposes. The Term Loans mature on October 17, 2020. As of December 31, 2017, the Company has $30.0 million of borrowings outstanding under the Term Loans.
The Company’s obligations under the Multidraw Term Loan Agreement and the Term Loans are secured by a first priority lien on substantially all of the assets of the Company and certain of its subsidiaries, including a lien on all equipment and at least 90% of the aggregate total value of the oil and gas properties of the Company and its subsidiaries, a pledge of the equity interests of PetroQuest Energy, L.L.C. (the "Borrower") and certain of the Company’s other subsidiaries, and corporate guarantees of the Company and certain of the Company’s other subsidiaries of the indebtedness of the Borrower. Term Loans under the Multidraw Term Loan Agreement bear interest at the rate of 10% per annum.
The Company and its subsidiaries are subject to a restrictive financial covenant under the Multidraw Term Loan Agreement, consisting of maintaining a ratio of (i) the present value, discounted at 10% per annum, of the estimated future net revenues in respect of the Company’s and its subsidiaries’ oil and gas properties, before any state, federal, foreign or other income taxes, attributable to proved developed reserves, using three-year strip prices in effect at the end of each calendar quarter, including swap agreements in place at the end of each quarter, to (ii) the sum of the outstanding Term Loans and the then outstanding commitments to provide Term Loans, that shall not be less than 2.0 to 1.0 as measured on the last day of each calendar quarter (the "Coverage Ratio").
Sales of the Company’s and its subsidiaries’ oil and gas properties outside the ordinary course of business are limited under the terms of the Multidraw Term Loan Agreement. In addition, the Multidraw Term Loan Agreement prohibits the Company from declaring and paying dividends on its Series B Preferred Stock.
The Multidraw Term Loan Agreement also includes customary restrictions with respect to debt, liens, dividends, distributions and redemptions, investments, loans and advances, nature of business, international operations and foreign subsidiaries, leases, sale or discount of receivables, mergers or consolidations, sales of properties, transactions with affiliates, negative pledge agreements, gas imbalances and swap agreements. As of December 31, 2017, no default or event of default existed under the Multidraw Term Loan Agreement and the Company was in compliance with all covenants contained in the Multidraw Term Loan Agreement, including the Coverage Ratio.
The 2017 Notes are reflected net of $0.1 million of related unamortized financing costs at December 31, 2016. The 2021 Notes are reflected net of $0.2 million and $0.1 million of related unamortized financing costs as of December 31, 2017 and 2016, respectively, and the Term Loans are reflected net of $2.0 million and $2.8 million of related unamortized financing costs as of December 31, 2017 and 2016, respectively.
F-19
The following table reconciles the face value of the 2017 Notes, 2021 Notes, 2021 PIK Notes and Term Loans to the carrying value included in the consolidated balance sheet as of December 31, 2017 and 2016 (in thousands):
December 31, 2017 | December 31, 2016 | ||||||||||||||||||||||||
2017 Notes | 2021 Notes | 2021 PIK Notes | Term Loans | 2017 Notes | 2021 Notes | 2021 PIK Notes | Term Loans | ||||||||||||||||||
Face Value | $ | — | $ | 9,427 | $ | 263,202 | $ | 30,000 | $ | 22,650 | $ | 14,177 | $ | 243,468 | $ | 10,000 | |||||||||
Unamortized Deferred Financing Costs | — | (212 | ) | — | (2,037 | ) | (82 | ) | (108 | ) | — | (2,751 | ) | ||||||||||||
Excess (shortfall) Carrying Value | — | 606 | (508 | ) | — | — | 1,159 | (590 | ) | — | |||||||||||||||
Accrued PIK Interest | — | — | 8,883 | — | — | — | 5,722 | — | |||||||||||||||||
Carrying Value | $ | — | $ | 9,821 | $ | 271,577 | $ | 27,963 | $ | 22,568 | $ | 15,228 | $ | 248,600 | $ | 7,249 | |||||||||
Note 10—Related Party Transactions
Two of the Company’s senior officers, Charles T. Goodson and Stephen H. Green, or their affiliates, are working interest owners and overriding royalty interest owners in certain properties operated by the Company or in which the Company also holds a working interest. As working interest owners, they are required to pay their proportionate share of all costs and are entitled to receive their proportionate share of revenues in the normal course of business. As overriding royalty interest owners, they are entitled to receive their proportionate share of revenues in the normal course of business.
During 2017, in their capacities as working interest owners or overriding royalty interest owners, revenues, net of costs, were disbursed to (received from) Messrs. Goodson and Green, or their affiliates, in the amounts of $(107,000) and $41,000, respectively. During 2016, in their capacities as working interest owners or overriding royalty interest owners, revenues, net of costs, were disbursed to (received from) Messrs. Goodson and Green, or their affiliates, in the amounts of $(15,000) and $25,000, respectively. During 2015, in their capacities as working interest owners or overriding royalty interest owners, revenues, net of costs, were disbursed to (received from) Messrs. Goodson and Green, or their affiliates, in the amounts of $(45,000) and $30,000, respectively. With respect to Mr. Goodson, gross revenues attributable to interests, properties or participation rights held by him prior to joining the Company as an officer and director on September 1, 1998 represent all of the gross revenue received by him during these periods.
In its capacity as operator, the Company incurs drilling and operating costs that are billed to its partners based on their respective working interests. At December 31, 2017, the Company’s joint interest billing receivable included approximately $89,000 from the related parties discussed above or their affiliates, attributable to their share of costs. This represents 1% of the Company’s total joint interest billing receivable at December 31, 2017.
In December 2017, the Company sold certain saltwater disposal assets in East Texas to a third party purchaser. In connection with the sale, the Company also entered into a volumetric commitment to deliver saltwater volumes to the purchaser of the saltwater disposal assets over a six year period. One of the minority owners of the purchaser is the son of Dr. Charles Mitchell, II, a member of our board of directors. The transactions were approved by the Audit Committee.
Note 11—Ceiling Test Write-down
The Company uses the full cost method to account for its oil and gas properties. Accordingly, the costs to acquire, explore for and develop oil and gas properties are capitalized. Capitalized costs of oil and gas properties, net of accumulated DD&A and related deferred taxes, are limited to the estimated future net cash flows from estimated proved oil and gas reserves, including the effects of cash flow hedges in place, discounted at 10%, plus the lower of cost or fair value of unproved properties, as adjusted for related income tax effects (the full cost ceiling). If capitalized costs exceed the full cost ceiling, the excess is charged to ceiling test write-down of oil and gas properties in the quarter in which the excess occurs.
In accordance with SEC requirements, the estimated future net cash flows from estimated proved reserves are based on an average of the first day of the month spot price for a historical 12-month period, adjusted for quality, transportation fees and market differentials. At December 31, 2016 and 2015, the prices used in computing the estimated future net cash flows from the Company’s estimated proved reserves, including the effect of hedges in place at that date, averaged $2.51 and $2.42, respectively, per Mcf of natural gas, $40.85 and $50.29, respectively, per barrel of oil and $1.82 and $2.21, respectively, per Mcfe of Ngl. As a result of lower commodity prices and their negative impact on the Company's estimated proved reserves and estimated future net cash flows, the Company recognized ceiling test write-downs of approximately $40.3 million and $266.6 million, respectively, during the years ended December 31, 2016 and 2015. The Company’s cash flow hedges in place decreased these ceiling test write-
F-20
downs by approximately $8 million and $1.1 million for the years ended December 31, 2016 and 2015, respectively. The Company did not recognize a ceiling test write-down during the year ended December 31, 2017.
Note 12—Other Comprehensive Income (Loss)
The following table represents the changes in accumulated other comprehensive income (loss), net of tax, for the year ended December 31, 2015 (in thousands):
Gains and Losses on Cash Flow Hedges | ||
Balance as of December 31, 2014 | $5,420 | |
Other comprehensive income before reclassifications: | ||
Change in fair value of derivatives | 9,991 | |
Income tax effect | (3,716 | ) |
Net of tax | 6,275 | |
Amounts reclassified from accumulated other comprehensive income: | ||
Oil and gas sales | (17,114 | ) |
Income tax effect | 6,366 | |
Net of tax | (10,748 | ) |
Net other comprehensive loss | (4,473 | ) |
Balance as of December 31, 2015 | $947 | |
The following table represents the changes in accumulated other comprehensive income (loss), net of tax, for the year ended December 31, 2016 (in thousands):
Gains and Losses on Cash Flow Hedges | Change in Valuation Allowance | Total | |||||||||
Balance as of December 31, 2015 | $ | 947 | $ | — | $ | 947 | |||||
Other comprehensive income before reclassifications: | |||||||||||
Change in fair value of derivatives | (4,447 | ) | — | (4,447 | ) | ||||||
Income tax effect | 1,654 | (1,654 | ) | — | |||||||
Net of tax | (2,793 | ) | (1,654 | ) | (4,447 | ) | |||||
Amounts reclassified from accumulated other comprehensive income: | |||||||||||
Oil and gas sales | (1,811 | ) | — | (1,811 | ) | ||||||
Income tax effect | 674 | (113 | ) | 561 | |||||||
Net of tax | (1,137 | ) | (113 | ) | (1,250 | ) | |||||
Net other comprehensive loss | (3,930 | ) | (1,767 | ) | (5,697 | ) | |||||
Balance as of December 31, 2016 | $ | (2,983 | ) | $ | (1,767 | ) | $ | (4,750 | ) | ||
F-21
The following table represents the changes in accumulated other comprehensive income (loss), net of tax, for the year ended December 31, 2017 (in thousands):
Gains and Losses on Cash Flow Hedges | Change in Valuation Allowance | Total | |||||||||
Balance as of December 31, 2016 | $ | (2,983 | ) | $ | (1,767 | ) | $ | (4,750 | ) | ||
Other comprehensive income before reclassifications: | |||||||||||
Change in fair value of derivatives | 6,654 | — | 6,654 | ||||||||
Income tax effect | (2,475 | ) | 1,767 | (708 | ) | ||||||
Net of tax | 4,179 | 1,767 | 5,946 | ||||||||
Amounts reclassified from accumulated other comprehensive income: | |||||||||||
Oil and gas sales | (1,461 | ) | — | (1,461 | ) | ||||||
Income tax effect | 543 | — | 543 | ||||||||
Net of tax | (918 | ) | — | (918 | ) | ||||||
Net other comprehensive loss | 3,261 | 1,767 | 5,028 | ||||||||
Balance as of December 31, 2017 | $ | 278 | $ | — | $ | 278 | |||||
Note 13—Income Taxes
The Company typically provides for income taxes at the statutory federal income tax rate adjusted for permanent differences expected to be realized, primarily statutory depletion, non-deductible stock compensation expenses and state income taxes. As a result of ceiling test write-downs, the Company has incurred a three-year cumulative loss. Because of the impact the cumulative loss had on the determination of the recoverability of deferred tax assets through future earnings, the Company assessed the realizability of its deferred tax assets based on the future reversals of existing deferred tax liabilities. The Company had a valuation allowance of $115.9 million as of December 31, 2017 and $177.4 million as of December 31, 2016.
The Tax Cuts and Jobs Act (the “Act”) was enacted on December 22, 2017. The Act, among other things, reduces the U.S. federal corporate tax rate from 35% to 21%, eliminates the corporate alternative minimum tax and changes how existing alternative minimum tax credits are realized, creates a new limitation on deductible interest expense and changes the rules related to uses and limitations of net operating loss carryforwards generated in tax years beginning after December 31, 2017. As of December 31, 2017, the Company has not completed its accounting for the tax effects of enactment of the Act. However, the Company has made a reasonable estimate of the effects on its existing deferred tax balances and recognized a provisional amount of $64.9 million to remeasure deferred tax assets and liabilities based on the rates at which they are expected to reverse in the future, which is generally 21%. This amount is included as a component of income tax expense (benefit) from continuing operations and is fully offset by the related adjustment to the Company’s valuation allowance. The Company is still analyzing certain aspects of the Act and refining its calculations, which could potentially affect the measurement of these balances or potentially give rise to new deferred tax amounts.
As a result of the adoption of ASU 2016-09, the Company recognized an additional deferred tax asset of $4.7 million related to net operating loss carryforwards for excess tax benefits on share-based compensation that did not meet the criteria for recognition under previous guidance. This additional deferred tax asset was fully offset by the related adjustment to the Company's valuation allowance. The cumulative effect adjustment to record the previously unrecognized excess tax benefits and the related adjustment to the valuation allowance, were recorded in retained earnings on the date of adoption.
F-22
An analysis of the Company’s deferred tax assets and liabilities follows (amounts in thousands):
December 31, | |||||||
2017 | 2016 | ||||||
Net operating loss carryforwards | $ | 78,541 | $ | 92,072 | |||
Percentage depletion carryforward | 5,701 | 9,372 | |||||
Alternative minimum tax credits | — | 784 | |||||
Contributions carryforward and other | 192 | 282 | |||||
Temporary differences: | |||||||
Oil and gas properties | 8,279 | 27,992 | |||||
Asset retirement obligation | 7,602 | 13,620 | |||||
Derivatives | (107 | ) | 1,767 | ||||
Share-based compensation | 1,269 | 1,870 | |||||
Original issue discount on debt exchanges | 14,429 | 29,646 | |||||
Valuation allowance | (115,906 | ) | (177,405 | ) | |||
Deferred tax asset (liability) | $ | — | $ | — | |||
At December 31, 2017, the Company had approximately $332.1 million of federal net operating loss carryforwards. If not utilized, approximately $6.9 million of such carryforwards would expire in 2025 and the remainder would expire by the year 2037. The Company also had approximately $139.4 million of Louisiana state net operating loss carryforwards as of December 31, 2017. If not utilized, approximately $3.2 million of such carryforwards would expire during 2018 and the remainder would expire by the year 2036. The Company has available for tax reporting purposes $26.9 million in statutory depletion deductions that may be carried forward indefinitely.
Income tax expense (benefit) for each of the years ended December 31, 2017, 2016 and 2015 was different than the amount computed using the federal statutory rate (35%) for the following reasons (amounts in thousands):
For the Year Ended December 31, | |||||||||||
2017 | 2016 | 2015 | |||||||||
Amount computed using the statutory rate | $ | (2,655 | ) | $ | (31,623 | ) | $ | (102,257 | ) | ||
Increase (reduction) in taxes resulting from: | |||||||||||
Impact of rate change on deferred tax | 64,915 | — | — | ||||||||
State & local taxes | (368 | ) | (2,000 | ) | (6,477 | ) | |||||
Percentage depletion carryforward | (66 | ) | (163 | ) | (404 | ) | |||||
Non-deductible stock option expense (1) | 305 | 77 | 90 | ||||||||
Share-based compensation (2) | 64 | 707 | 1,317 | ||||||||
Other | (21 | ) | 1,415 | 113 | |||||||
Change in valuation allowance | (63,123 | ) | 32,130 | 110,244 | |||||||
Income tax expense (benefit) | $ | (949 | ) | $ | 543 | $ | 2,626 | ||||
(1) | Relates to compensation expense related to Incentive Stock Options. |
(2) | Relates to the write-off of deferred tax assets associated with share-based compensation that will not be deductible for tax purposes. |
F-23
Note 14—Commitments and Contingencies
The Company is involved in litigation relating to claims arising out of its operations in the normal course of business, including worker's compensation claims, tort claims and contractual disputes. Some of the existing known claims against us are covered by insurance subject to the limits of such policies and the payment of deductible amounts by us. Although we cannot predict the outcome of these proceedings with certainty, management believes that the ultimate disposition of all uninsured or unindemnified matters resulting from existing litigation will not have a material adverse effect on the Company's business or financial position.
Lease Commitments
The Company has operating leases for office space and equipment, which expire on various dates through 2023. Future minimum lease commitments as of December 31, 2017 under these operating leases are as follows (in thousands):
2018 | $ | 1,278 | |
2019 | 1,242 | ||
2020 | 1,175 | ||
2021 | 447 | ||
2022 | 433 | ||
Thereafter | 392 | ||
$ | 4,967 | ||
Total rent expense under operating leases was approximately $1.5 million, $1.5 million and $1.7 million in 2017, 2016 and 2015, respectively.
F-24
Note 15—Supplementary Information on Oil and Gas Operations—Unaudited
The following tables disclose certain financial data relative to the Company’s oil and gas producing activities, which are located onshore and offshore in the continental United States:
Costs Incurred in Oil and Gas Property Acquisition, Exploration and Development Activities
(amounts in thousands)
For the Year-Ended December 31, | |||||||||||
2017 | 2016 | 2015 | |||||||||
Acquisition costs: | |||||||||||
Proved | $ | 1,330 | $ | 3,346 | $ | 2,287 | |||||
Unproved (1) | 12,762 | 2,197 | 2,550 | ||||||||
Divestiture of proved leasehold | (4,795 | ) | (7,000 | ) | — | ||||||
Exploration costs: | |||||||||||
Proved | 9,466 | 715 | 29,322 | ||||||||
Unproved | (287 | ) | 603 | 7,677 | |||||||
Development costs | 32,622 | 1,522 | 9,888 | ||||||||
Capitalized general and administrative and interest costs | 8,269 | 7,558 | 12,881 | ||||||||
Total costs incurred | $ | 59,367 | $ | 8,941 | $ | 64,605 | |||||
For the Year-Ended December 31, | |||||||||||
2017 | 2016 | 2015 | |||||||||
Accumulated depreciation, depletion and amortization (DD&A) | |||||||||||
Balance, beginning of year | $ | (1,243,286 | ) | $ | (1,157,455 | ) | $ | (1,648,060 | ) | ||
Provision for DD&A | (31,667 | ) | (27,962 | ) | (62,138 | ) | |||||
Ceiling test writedown | — | (40,304 | ) | (266,562 | ) | ||||||
Sale of proved properties and other (2) (3) | (10,707 | ) | (17,565 | ) | 819,305 | ||||||
Balance, end of year | $ | (1,285,660 | ) | $ | (1,243,286 | ) | $ | (1,157,455 | ) | ||
DD&A per Mcfe | $ | 1.15 | $ | 1.19 | $ | 1.82 | |||||
(1) | During 2017, the Company acquired approximately 24,600 gross acres for approximately $9.3 million of cash and 2.0 million shares of common stock. |
(2) | During 2015, the Company sold its Woodford Shale and Mississippian Lime assets for an aggregate cash purchase price of $274.1 million (see Note 2). |
(3) | During 2017, the Company sold its East Lake Verret assets for net proceeds of approximately $2.2 million and its East Texas saltwater disposal assets for net proceeds of $8.5 million. During 2016, the Company sold its remaining Oklahoma producing assets for an aggregate purchase price of $17.6 million. During 2015, the Company sold its Fort Trinidad assets for net proceeds of approximately $0.5 million and its East Haynesville assets for net proceeds of approximately $0.1 million. |
At December 31, 2017 and 2016, unevaluated oil and gas properties totaled $21.9 million and $9.0 million, respectively, and were not subject to depletion. Unevaluated costs at December 31, 2017 included $0.7 million related to two facilities in progress at year-end. At December 31, 2016, unevaluated costs included $0.4 million related to one development well in progress at year-end, which were transferred to evaluated oil and gas properties during 2017. The Company capitalized $1.6 million, $0.9 million and $4.7 million of interest during 2017, 2016 and 2015, respectively. Of the total unevaluated oil and gas property costs of $21.9 million at December 31, 2017, $14.6 million, or 67%, was incurred in 2017, $2.0 million, or 9%, was incurred in 2016 and $5.2 million, or 24%, was incurred in prior years. In connection with the sale of the Company's Gulf of Mexico assets, approximately $5.5 million, or 25% of the total unevaluated balance at December 31, 2017, was transferred to evaluated oil and
F-25
gas properties in 2018. Of the remaining unevaluated balance at December 31, 2017, the Company expects the majority of the costs will be evaluated within the next three years, including $4.1 million expected to be evaluated during 2018.
Oil and Gas Reserve Information
The Company’s net proved oil and gas reserves at December 31, 2017 have been estimated by independent petroleum engineers in accordance with guidelines established by the SEC using a historical 12-month, first of month, average pricing assumption.
The estimates of proved oil and gas reserves constitute those quantities of oil, gas,and natural gas liquids, which, by analysis of geoscience and engineering data, can be estimated with reasonable certainty to be economically producible—from a given date forward, from known reservoirs, and under existing economic conditions, operating methods, and government regulations—prior to the time at which contracts providing the right to operate expire, unless evidence indicates that renewal is reasonably certain, regardless of whether deterministic or probabilistic methods are used for the estimation. However, there are numerous uncertainties inherent in estimating quantities of proved reserves and in providing the future rates of production and timing of development expenditures. The following reserve data represents estimates only and should not be construed as being exact. In addition, the present values should not be construed as the current market value of the Company’s oil and gas properties or the cost that would be incurred to obtain equivalent reserves.
F-26
The following table sets forth an analysis of the Company’s estimated quantities of net proved and proved developed oil (including condensate), gas and natural gas liquid reserves, all located onshore and offshore in the continental United States:
Oil in MBbls | NGL in MMcfe | Natural Gas in MMcf | Total Reserves in MMcfe | ||||||||
Proved reserves as of December 31, 2014 | 2,437 | 73,498 | 309,025 | 397,148 | |||||||
Revisions of previous estimates | (211 | ) | (3,571 | ) | (9,852 | ) | (14,698 | ) | |||
Extensions, discoveries and other additions | 163 | 16,078 | 45,645 | 62,702 | |||||||
Sale of reserves in place | (54 | ) | (45,692 | ) | (186,972 | ) | (232,988 | ) | |||
Production | (529 | ) | (5,487 | ) | (25,502 | ) | (34,160 | ) | |||
Proved reserves as of December 31, 2015 | 1,806 | 34,826 | 132,344 | 178,004 | |||||||
Revisions of previous estimates | 247 | (4,380 | ) | (11,854 | ) | (14,748 | ) | ||||
Extensions, discoveries and other additions | — | — | 1,485 | 1,485 | |||||||
Sale of reserves in place | (154 | ) | — | (24,834 | ) | (25,759 | ) | ||||
Production | (502 | ) | (3,871 | ) | (16,617 | ) | (23,501 | ) | |||
Proved reserves as of December 31, 2016 | 1,397 | 26,575 | 80,524 | 115,481 | |||||||
Revisions of previous estimates | 308 | (7,269 | ) | 381 | (5,040 | ) | |||||
Extensions, discoveries and other additions | 777 | 4,565 | 64,704 | 73,931 | |||||||
Purchase of producing properties | 48 | — | 473 | 761 | |||||||
Sale of reserves in place | (90 | ) | — | (1,033 | ) | (1,573 | ) | ||||
Production | (592 | ) | (4,450 | ) | (19,611 | ) | (27,613 | ) | |||
Proved reserves as of December 31, 2017 | 1,848 | 19,421 | 125,438 | 155,947 | |||||||
Proved developed reserves | |||||||||||
As of December 31, 2015 | 1,549 | 15,792 | 78,533 | 103,615 | |||||||
As of December 31, 2016 | 1,212 | 13,073 | 47,349 | 67,694 | |||||||
As of December 31, 2017 | 1,078 | 12,564 | 57,409 | 76,441 | |||||||
Proved undeveloped reserves | |||||||||||
As of December 31, 2015 | 257 | 19,034 | 53,811 | 74,389 | |||||||
As of December 31, 2016 | 185 | 13,502 | 33,175 | 47,787 | |||||||
As of December 31, 2017 | 770 | 6,857 | 68,029 | 79,506 | |||||||
Year Ended December 31, 2017
During 2017, the Company’s estimated proved reserves increased by 35%. The increase in reserves was the result of 73.9 Bcfe added due to the Company's drilling program in East Texas where it drilled eight gross wells during 2017. In response to low ethane prices, during 2017 the Company elected to bypass ethane processing on a portion of its East Texas production. As a result, the Company reduced its estimated proved ngl reserves to reflect the assumption that ethane would continue to not be recovered as natural gas liquids. Overall, the Company had a 100% drilling success rate during 2017.
F-27
Year Ended December 31, 2016
During 2016, the Company’s estimated proved reserves decreased by 35% primarily due to the divestiture of the Company's remaining Oklahoma assets and significant reductions in capital spending during 2016 . Extensions, discoveries and other additions of 1.5 Bcfe were primarily due to the successful completion of the Company's final Oklahoma wells. Revisions of previous estimates included the reclassification of certain PUD reserves to probable reserves as a result of the Company's assessment of the timing of development. Overall, the Company had a 100% drilling success rate during 2016 on 5 gross wells drilled.
Year Ended December 31, 2015
During 2015, the Company's estimated proved reserves decreased by 55% primarily due to the divestiture of the majority of the Company's Woodford Shale and Mississippian Lime assets. Extensions, discoveries and other additions of 63 Bcfe were primarily due to successful drilling programs in the Company's Oklahoma and East Texas fields. The Company added approximately 17 Bcfe of proved reserves in Oklahoma and 44 Bcfe in Texas. Overall, the Company had a 95% drilling success rate during 2015 on 56 gross wells drilled.
The following tables (amounts in thousands) present the standardized measure of future net cash flows related to proved oil and gas reserves together with changes therein, as defined by ASC Topic 932. Future production and development costs are based on current costs with no escalations. Estimated future cash flows have been discounted to their present values based on a 10% annual discount rate.
Standardized Measure
December 31, | |||||||||||
2017 | 2016 | 2015 | |||||||||
Future cash flows | $ | 539,244 | $ | 299,035 | $ | 487,834 | |||||
Future production costs | (184,171 | ) | (117,283 | ) | (171,678 | ) | |||||
Future development costs | (128,447 | ) | (83,720 | ) | (116,591 | ) | |||||
Future income taxes | — | — | — | ||||||||
Future net cash flows | 226,626 | 98,032 | 199,565 | ||||||||
10% annual discount | (99,329 | ) | (30,763 | ) | (71,880 | ) | |||||
Standardized measure of discounted future net cash flows | $ | 127,297 | $ | 67,269 | $ | 127,685 | |||||
Changes in Standardized Measure
Year Ended December 31, | |||||||||||
2017 | 2016 | 2015 | |||||||||
Standardized measure at beginning of year | $ | 67,269 | $ | 127,685 | $ | 548,562 | |||||
Sales and transfers of oil and gas produced, net of production costs | (70,362 | ) | (35,993 | ) | (55,849 | ) | |||||
Changes in price, net of future production costs | 53,516 | (30,427 | ) | (267,710 | ) | ||||||
Extensions and discoveries, net of future production and development costs | 50,977 | 864 | 70,928 | ||||||||
Changes in estimated future development costs, net of development costs incurred during this period | 17,144 | 26,356 | 31,007 | ||||||||
Revisions of quantity estimates | (7,482 | ) | (14,889 | ) | (14,427 | ) | |||||
Accretion of discount | 6,727 | 12,769 | 60,071 | ||||||||
Net change in income taxes | — | — | 52,149 | ||||||||
Purchase of reserves in place | 549 | — | — | ||||||||
Sale of reserves in place | (1,305 | ) | (16,701 | ) | (194,454 | ) | |||||
Changes in production rates (timing) and other | 10,264 | (2,395 | ) | (102,592 | ) | ||||||
Net increase (decrease) in standardized measure | 60,028 | (60,416 | ) | (420,877 | ) | ||||||
Standardized measure at end of year | $ | 127,297 | $ | 67,269 | $ | 127,685 | |||||
F-28
The historical twelve-month, first day of the month, average prices of oil, gas and natural gas liquids used in determining standardized measure were:
2017 | 2016 | 2015 | ||||||
Oil, $/Bbl | $52.49 | $40.85 | $50.29 | |||||
Ngls, $/Mcfe | 3.23 | 2.40 | 2.24 | |||||
Natural Gas, $/Mcf | 3.03 | 1.82 | 2.41 | |||||
Note 16 - Summarized Quarterly Financial Information - Unaudited
Summarized quarterly financial information is as follows (amounts in thousands except per share data):
Quarter Ended | ||||||||||||
March 31 | June 30 | September 30 | December 31 | |||||||||
2017 | ||||||||||||
Revenues | $ | 20,772 | $ | 24,251 | $ | 28,184 | $ | 35,080 | ||||
Income (loss) from operations | (3,633 | ) | (2,289 | ) | (1,885 | ) | 221 | |||||
Loss available to common stockholders | (4,918 | ) | (3,385 | ) | (3,085 | ) | $ | (389 | ) | |||
Loss per share: | ||||||||||||
Basic | $ | (0.23 | ) | $ | (0.16 | ) | $ | (0.15 | ) | $ | (0.02 | ) |
Diluted | $ | (0.23 | ) | $ | (0.16 | ) | $ | (0.15 | ) | $ | (0.02 | ) |
2016: | ||||||||||||
Revenues | $ | 17,320 | $ | 15,824 | $ | 17,094 | $ | 16,429 | ||||
Loss from operations (1) | (37,557 | ) | (22,383 | ) | (22,039 | ) | (8,374 | ) | ||||
Loss available to common stockholders (1) | (39,137 | ) | (24,143 | ) | (23,306 | ) | (9,659 | ) | ||||
Loss per share: | ||||||||||||
Basic | $ | (2.09 | ) | $ | (1.38 | ) | $ | (1.31 | ) | $ | (0.46 | ) |
Diluted | $ | (2.09 | ) | $ | (1.38 | ) | $ | (1.31 | ) | $ | (0.46 | ) |
(1) Loss from operations and loss available to common stockholders reported during the three months ended March 31, June 30 and September 30, 2016 included pretax ceiling test write-downs of $18.9 million, $12.8 million and $8.7 million, respectively.
F-29