Attached files
| file | filename |
|---|---|
| EX-10.3 - EXHIBIT 10.3 - ZAGG Inc | a201703078kex103.htm |
| EX-99.5 - EXHIBIT 99.5 - ZAGG Inc | a201703078kex995.htm |
| EX-99.4 - EXHIBIT 99.4 - ZAGG Inc | a201703078kex994.htm |
| EX-99.2 - EXHIBIT 99.2 - ZAGG Inc | a201703078kex992.htm |
| EX-99.1 - EXHIBIT 99.1 - ZAGG Inc | a201703078kex991.htm |
| EX-10.4 - EXHIBIT 10.4 - ZAGG Inc | a201703078kex104.htm |
| EX-10.2 - EXHIBIT 10.2 - ZAGG Inc | a201703078kex102.htm |
| EX-10.1 - EXHIBIT 10.1 - ZAGG Inc | a201703078kex101.htm |
| 8-K - ZAGG Inc | a201703078kcover.htm |

Supplemental Financial Information - CFO Commentary
March 7, 2018
Document reference information
The commentary in this document can be referenced in the financial information found in the earnings release issued earlier today. The release can be found at investors.ZAGG.com, or in the Form 8-K furnished to the Securities and Exchange Commission website at sec.gov. The URLs included here are inactive textual references.
2017 Summary Results
(2017 reflects a full year contribution from mophie, though 2016 only reflects approximately 10 months of contribution from mophie as the acquisition occurred on March 3, 2016. In millions, except per share amounts.)
Full Year and Fourth Quarter Results
Three Months Ended | Year Ended | ||||||
Q417 | Q416 | 2017 | 2016 | ||||
Net Sales | $176.9 | $114.9 | $519.5 | $401.9 | |||
Gross Margin | $56.2 | $29.9 | $169.0 | $127.6 | |||
Gross Margin % | 32% | 26% | 33% | 32% | |||
Net Income (Loss) | $8.1 | $(4.1) | $15.1 | $(15.6) | |||
Diluted EPS (Loss) | $0.28 | $(0.15) | $0.53 | $(0.56) | |||
Adjusted EBITDA | $35.8 | $3.8 | $73.0 | $37.2 | |||
Adjusted EBITDA % | 20% | 3% | 14% | 9% | |||
Net Sales by Category
Three Months Ended | Year Ended | ||||||||||
Q417 | Q416 | 2017 | 2016 | ||||||||
Screen Protection | $69.8 | 39% | $60.9 | 53% | $247.6 | 48% | $213.9 | 54% | |||
Power Management | $73.6 | 42% | $18.0 | 16% | $134.3 | 26% | $60.5 | 15% | |||
Power Cases | $15.5 | 9% | $18.5 | 16% | $75.6 | 15% | $61.7 | 15% | |||
Audio | $8.0 | 5% | $5.3 | 4% | $29.5 | 5% | $24.3 | 6% | |||
Keyboards | $7.8 | 4% | $11.2 | 10% | $27.5 | 5% | $36.8 | 9% | |||
Other | $2.2 | 1% | $1.0 | 1% | $5.0 | 1% | $4.7 | 1% | |||
Net Sales by Region
Three Months Ended | Year Ended | ||||||||||
Q417 | Q416 | 2017 | 2016 | ||||||||
Domestic | $144.6 | 82% | $99.7 | 87% | $437.3 | 84% | $353.6 | 88% | |||
International | $32.3 | 18% | $15.2 | 13% | $82.2 | 16% | $48.3 | 12% | |||
Net Sales by Channel
Three Months Ended | Year Ended | ||||||||||
Q417 | Q416 | 2017 | 2016 | ||||||||
Indirect | $159.5 | 90% | $98.7 | 86% | $463.4 | 89% | $350.7 | 87% | |||
Website | $12.1 | 7% | $11.5 | 10% | $39.6 | 8% | $34.2 | 9% | |||
Franchise | $5.3 | 3% | $4.7 | 4% | $16.5 | 3% | $17.0 | 4% | |||
2017 Fourth Quarter Results Discussion
(All comparisons are 2017 consolidated versus 2016 consolidated, unless otherwise noted)
Net sales
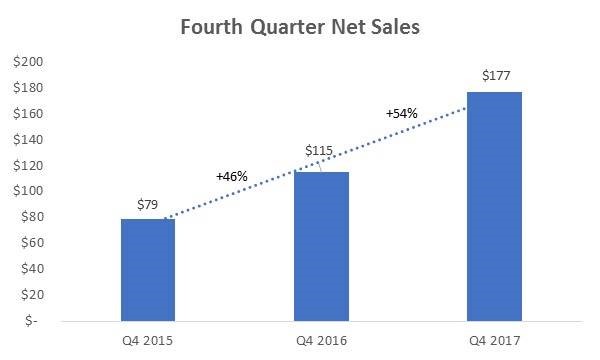
Net sales increased 54% to $176.9 million compared to $114.9 million due primarily to (1) the increase in sales of our power management products, particularly accessories supporting the wireless charging ecosystem, and (2) increased sales of screen protection products in key wireless and retail accounts, particularly in international markets. During the fourth quarter of 2016, the Company launched the juice pack power cases for the iPhone 7 and 7+, however, there was no similar juice pack load-in during the fourth quarter of 2017 resulting in a decline in overall power case sales quarter over quarter.
Gross Profit/Margin (% of Net Sales)
Gross profit increased to $56.2 million (32%), compared to $29.9 million (26%). The increase in gross profit margin was primarily due to improvements in margins of mophie branded product, partially offset by an increase in freight costs.
Operating Expense/Margin (% of Net Sales)
Operating expense decreased 22% to $26.2 million (15%) compared to $33.4 million (29%). The decrease in operating expense was primarily attributable to a $7.0 million gain recorded during the period associated with the settlement of litigation related to the disputed mophie purchase price.
Net Income (Loss)
Net income was $8.1 million compared to net loss of $(4.1) million. Diluted earnings per share was $0.28 (on 28.8 million shares) compared to diluted loss per share of $(0.15) (on 28.1 million shares).
Adjusted EBITDA
Adjusted EBITDA improved to $35.8 million compared to $3.8 million.
2017 Full Year Results
(All comparisons are 2017 consolidated versus 2016, unless otherwise noted.)
Net Sales
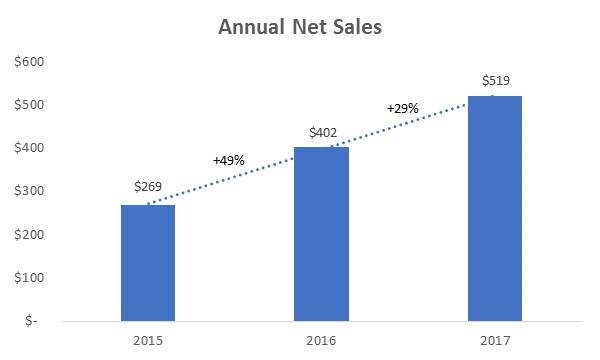
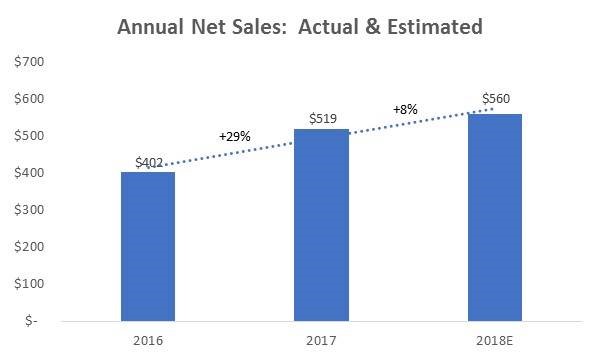
Net sales increased 29% to $519.5 million, compared to $401.9 million due primarily to (1) the increase in sales of our power management products, particularly accessories supporting the wireless charging ecosystem, (2) increased sales of screen protection products in key wireless and retail accounts, particularly in international markets, and (3) the inclusion of 12 months of mophie sales during 2017 versus only 10 months in 2016. Prior to the acquisition in 2016, mophie recorded sales of $17.3 million, which if added to the full year 2016 sales total of $401.9 million, the Company would still have realized an increase in sales compared to 2016 of $100.3 million or 24%.
Gross Profit/Margin (% of Net Sales)
Gross profit increased to $169.0 million (33%), compared to $127.6 million (32%). The increase in gross profit margin was primarily due to improvements in margins of mophie branded product and a $2.6 million charge incurred during 2016 related to the impact of the fair value write-up of mophie inventory that did not recur in 2017. This increase was partially offset by an increase in freight costs and a shift in the product mix whereby 2017 screen protection sales were a smaller percentage of overall sales compared to the prior year (although overall screen protection sales increased by $33.6 million or 16%).
Operating Expense/Margin (% of Net Sales)
Operating expense decreased to $124.3 million (24%) compared to $149.0 million (37%). The decrease in operating expenses was primarily attributable to (1) a $24.3 million loss related to the disputed mophie purchase price in 2016 that did not recur in 2017, (2) a $7.0 million gain recorded in 2017 related to the settlement of litigation associated with the disputed mophie purchase price, (3) synergies from cost reduction initiatives, (4) lower transaction-related costs, (5) a reduction in advertising and marketing spend, and (6) an overall reduction in amortization expense. These decreases were partially offset by the following increases in operating expense: (1) the inclusion of 12 months of mophie-related expenses for 2017 compared with 10 months in 2016, (2) the $2.0 million impairment of an intangible asset in 2017, and (3) an increase in operating expense related to the launch of certain wireless charging accessories.
Net Income (Loss)
Net income increased to $15.1 million compared to net loss of $(15.6) million. Diluted earnings per share was $0.53 (on 28.4 million shares) compared to diluted loss per share of $(0.56) (on 28.0 million shares)
Adjusted EBITDA
Adjusted EBITDA increased 96% to $73.0 million compared to $37.2 million.
Impact of 2017 Tax Reform Bill
During the fourth quarter of 2017, the United States Government passed the Tax Cuts and Jobs Act (the “Act”), which enacted significant changes to the United States’ federal tax code, including a reduction in the federal income tax rate for corporations from 35% to 21%. As of December 31, 2017, Management recorded a primarily non-cash charge of $12.4 million to income tax expense primarily to reflect (1) the re-measurement of deferred tax assets utilizing the lower federal income tax rate and (2) the tax on mandatory deemed repatriation of foreign earnings.
The impact of this $12.4 million charge on the income tax rate, net income, and earnings per share for the three and twelve months ended December 31, 2017, is illustrated in the table below:
(in millions, except per share amounts) | Three Months Ended December 31, 2017 | Twelve Months Ended December 31, 2017 | |
Income before provision for income taxes | $30.0 | $43.4 | |
Tax provision before impact of tax reform | $(9.5) | $(15.9) | |
Net income before impact of tax reform | $20.5 | $27.5 | |
Diluted earnings per share before impact of tax reform | $0.71 | $0.97 | |
Effective income tax rate before impact of tax reform | 32% | 37% | |
Tax provision attributable to tax reform | $(12.4) | $(12.4) | |
Net income | $8.1 | $15.1 | |
Diluted earnings per share | $0.28 | $0.53 | |
Effective income tax rate | 73% | 65% | |
Balance Sheet Highlights (as of December 31, 2017)
(In millions, excluding DSOs and Inventory turns) | December 31, 2017 | December 31, 2016 | |
Cash and Cash Equivalents | $25.0 | $11.6 | |
Account Receivables | $123.2 | $83.8 | |
Inventory | $75.0 | $72.8 | |
Total Debt | $37.4 | $51.4 | |
Line of Credit | $23.5 | $31.3 | |
Term Loan | $13.9 | $20.1 | |
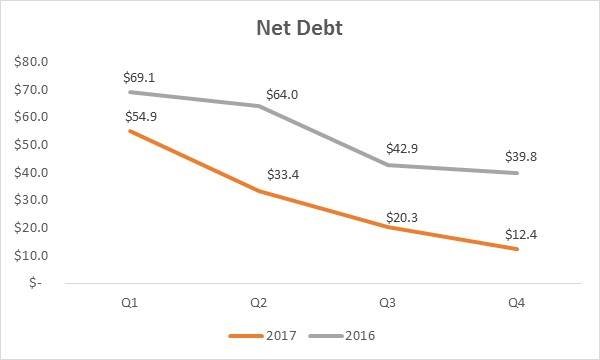
Net Debt (Total Debt less Cash) | $12.4 | $39.8 | |
DSOs | 64 | 67 | |
Inventory Turns* | 6.9x | 5.8x | |
* | Inventory turns defined as trailing 12-month sales divided by period-end inventory. In the 2016 calculation, the Company included $17.3 million in mophie pre-acquisition sales (from January 1, 2016 – March 3, 2016) so that the calculation is a comparable with 2017. |
Debt
The Company has effectively managed its outstanding debt balance. At December 31, 2017, the net debt balance (total debt less cash) decreased to $12.4 million from $39.8 million at December 31, 2016.
Market Share Information
Screen Protection
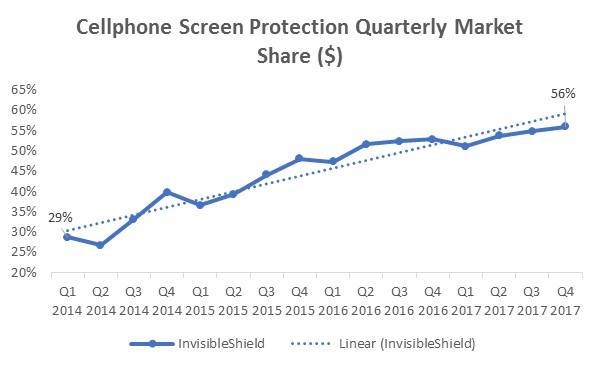
The Company continues to see strong and consistent growth in cellphone screen protection market share. From the first quarter of 2014 to the fourth quarter of 2017, InvisibleShield cellphone screen protection quarterly dollar market share has increased from 29% to a record 56%.
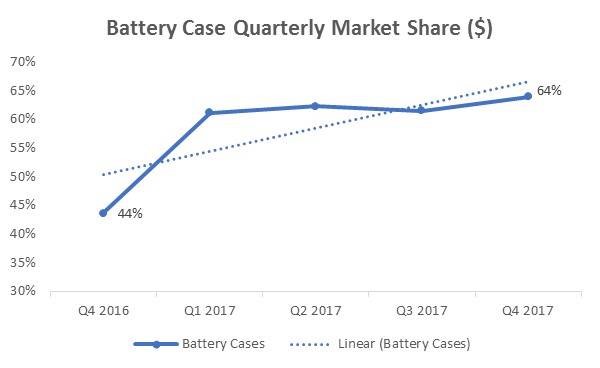
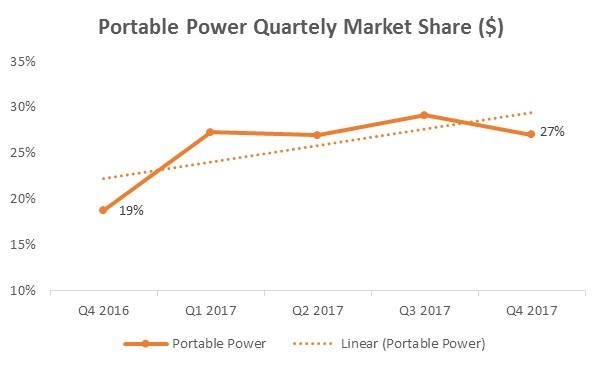
Battery Cases & Power Management
Since the fourth quarter of 2016, mophie branded battery cases and portable power packs have experienced significant growth in dollar market share due to a combination of (1) new and innovative product launches and (2) an unconstrained mophie supply chain. Quarterly battery case dollar market share increased from 44% to a record 64% from October 2016 to December 2017.
Quarterly portable power dollar market share increased from 19% to 27% from October 2016 to December 2017.
2018 Business Outlook
The Company provided annual guidance for 2018 as follows:
• | Net sales of $550 million - $570 million |
• | Gross profit margin as a percentage of net sales in the low to mid 30’s range |
• | Adjusted EBITDA of $77 million - $80 million |
• | Diluted earnings per share of $1.30 - $1.50 |
• | Annual effective tax rate of approximately 27% |
* | Represents the midpoint of guidance of $550 million to $570 million |
Non-GAAP Financial Disclosure
ZAGG regularly discloses Adjusted EBITDA, a non-GAAP metric, in its financial releases. Readers should refer to the non-GAAP financial disclosures at the end of this document for information on the limitations of non-GAAP financial measures. An explanation of ZAGG's use of this non-GAAP financial measure and the reconciliation between GAAP and non-GAAP measures required by SEC Regulation G is included in ZAGG's press release today, which can be found at investors.ZAGG.com.
Readers are cautioned that Adjusted EBITDA (earnings before interest, taxes, depreciation, amortization, stock-based compensation expense, other income (expense), mophie transaction expenses, mophie fair value inventory write-up related to acquisition, mophie restructuring charges, mophie employee retention bonus, loss on disputed mophie purchase price (2016 only), and impairment of intangible asset) is not a financial measure under US generally accepted accounting principles (GAAP). In addition, this financial information should not be construed as an alternative to any other measure of performance determined in accordance with GAAP, or as an indicator of operating performance, liquidity or cash flows generated by operating, investing and financing activities, is as there may be significant factors or trends that it fails to address. We present Adjusted EBITDA because we believe that it is helpful to some investors as a measure of performance. We caution readers that non-GAAP financial information, by its nature, departs from traditional accounting conventions. Accordingly, its use can make it difficult to compare current results with results from other reporting periods and with the financial results of other companies.
Cautionary Note Regarding Forward-Looking Statements
This press release contains (and oral communications made by us may contain) ”forward-looking statements” within the meaning of the safe harbor provisions of the U.S. Private Securities Litigation Reform Act of 1995. Forward-looking statements can be identified by words such as "anticipate," "believe," "estimate," "expect," "intend," "plan," "predict," "project," "target," “future,” “seek,” “likely,” “strategy,” “may,” “should,” “will” and similar references to future periods. Examples of forward-looking statements include, among others, statements we make regarding our outlook for the Company and statements that estimate or project future results of operations or the performance of the Company.
Forward-looking statements are neither historical facts nor assurances of future performance. Instead, they are based only on our current beliefs, expectations and assumptions regarding the future of our business, future plans and strategies, projections, anticipated events and trends, the economy and other future conditions. Because forward-looking statements relate to the future, they are subject to inherent uncertainties, risks and changes in circumstances that are difficult to predict and many of which are outside of our control. Our actual results and financial condition may differ materially from those indicated in the forward-looking statements. Therefore, you should not rely on any of these forward-looking statements. Important factors that could cause our actual results and financial condition to differ materially from those indicated in the forward-looking statements include, among others, the following: (a) the ability to design, produce, and distribute the creative product solutions required to retain existing customers and to attract new customers; (b) building and maintaining marketing and distribution functions sufficient to gain meaningful international market share for ours products; (c) the ability to respond quickly with appropriate products after the adoption and introduction of new mobile devices by major manufacturers like Apple, Samsung, and Google; (d) changes or delays in announced launch schedules for (or recalls or withdrawals of) new mobile devices by major manufacturers like Apple, Samsung, and Google; (e) the ability to successfully integrate new operations or acquisitions, (f) the impact of inconsistent quality or reliability of new product offerings; (g) the impact of lower profit margins in certain new and existing product categories, including certain mophie products; (h) the impacts of changes in economic conditions, including on customer demand; (i) managing inventory in light of constantly shifting consumer demand; (j) the failure of information systems or technology solutions or the failure to secure information system data, failure to comply with privacy laws, security breaches, or the effect on the company from cyber-attacks, terrorist incidents, or the threat of terrorist incidents; and (k) adoption of or changes in accounting policies, principles, or estimates. Any forward-looking statement made by us in this press release speaks only as of the date on which such statement is made. New factors emerge from time to time and it is not possible for management to predict all such factors, nor can it assess the impact of any such factor on the business or the extent to which any factor, or combination of factors, may cause results to differ materially from those contained in any forward-looking statement. Readers should also review the risks and uncertainties listed in our most recent Annual Report on Form 10-K and other reports we file with the U.S. Securities and Exchange Commission, including (but not limited to) Item 1A - "Risk Factors" in the Form 10-K and Management's Discussion and Analysis of Financial Condition and Results of Operations and the risks described therein from time to time. We undertake no obligation to publicly update any forward-looking statement, whether written or oral, that may be made from time to time, whether as a result of new information, future developments or otherwise.
1