Attached files
| file | filename |
|---|---|
| EX-31.2 - EXHIBIT 31.2 - SAFEGUARD SCIENTIFICS INC | sfe201710kex312.htm |
| EX-32.2 - EXHIBIT 32.2 - SAFEGUARD SCIENTIFICS INC | sfe201710kex322.htm |
| EX-32.1 - EXHIBIT 32.1 - SAFEGUARD SCIENTIFICS INC | sfe201710kex321.htm |
| EX-31.1 - EXHIBIT 31.1 - SAFEGUARD SCIENTIFICS INC | sfe201710kex311.htm |
| EX-23.1 - EXHIBIT 23.1 - SAFEGUARD SCIENTIFICS INC | sfe201710kex231.htm |
| EX-21.1 - EXHIBIT 21.1 - SAFEGUARD SCIENTIFICS INC | sfe201710kex211.htm |
| EX-14.1 - EXHIBIT 14.1 - SAFEGUARD SCIENTIFICS INC | sfe201710kex141.htm |
UNITED STATES
SECURITIES AND EXCHANGE COMMISSION
Washington, D.C. 20549
Form 10-K
(Mark One)
þ ANNUAL REPORT PURSUANT TO SECTION 13 OR 15(d) OF THE SECURITIES EXCHANGE ACT OF 1934
For the fiscal year ended December 31, 2017
or
¨ TRANSITION REPORT PURSUANT TO SECTION 13 OR 15(d) OF THE SECURITIES EXCHANGE ACT OF 1934
For the transition period from ____________ to ___________
Commission File Number 1-5620
Safeguard Scientifics, Inc.
(Exact name of registrant as specified in its charter)
Pennsylvania | 23-1609753 | |
(State or other jurisdiction of incorporation or organization) | (I.R.S. Employer Identification No.) | |
170 North Radnor-Chester Road Suite 200 Radnor, PA | 19087 | |
(Address of principal executive offices) | (Zip Code) | |
(610) 293-0600
(Registrant’s telephone number, including area code)
Securities registered pursuant to Section 12(b) of the Act:
Title of each class | Name of each exchange on which registered | |
Common Stock ($.10 par value) | New York Stock Exchange | |
Securities registered pursuant to Section 12(g) of the Act: None
Indicate by check mark if the registrant is a well-known seasoned issuer, as defined in Rule 405 of the Securities Act. Yes ¨ No ý
Indicate by check mark if the registrant is not required to file reports pursuant to Section 13 or Section 15(d) of the Act. Yes ¨ No ý
Indicate by check mark whether the registrant (1) has filed all reports required to be filed by Section 13 or 15(d) of the Securities Exchange Act of 1934 during the preceding 12 months (or for such shorter period that the registrant was required to file such reports), and (2) has been subject to such filing requirements for the past 90 days. Yes ý No ¨
Indicate by check mark whether the registrant has submitted electronically and posted on its corporate Website, if any, every Interactive Data File required to be submitted and posted pursuant to Rule 405 of Regulation S-T (§232.405 of this chapter) during the preceding 12 months (or for such shorter period that the registrant was required to submit and post such files). Yes ý No ¨
Indicate by check mark if disclosure of delinquent filers pursuant to Item 405 of Regulation S-K (§229.405 of this chapter) is not contained herein, and will not be contained, to the best of registrant’s knowledge, in definitive proxy or information statements incorporated by reference in Part III of this Form 10-K or any amendment to this Form 10-K. ý
Indicate by check mark whether the registrant is a large accelerated filer, an accelerated filer, a non-accelerated filer, or a smaller reporting company. See the definitions of “large accelerated filer,” “accelerated filer” and “smaller reporting company” in Rule 12b-2 of the Exchange Act. (Check one):
Large accelerated filer £ | Accelerated filer þ | Smaller reporting company £ | |
Non-accelerated filer £ | (Do not check if a smaller reporting company) | Emerging growth company £ | |
If an emerging growth company, indicate by check mark if the registrant has elected not to use the extended transition period for complying with any new or revised financial accounting standards provided pursuant to Section 13(a) of the Exchange Act. ¨
Indicate by check mark whether the registrant is a shell company (as defined in Rule 12b-2 of the Act). Yes ¨ No ý
As of June 30, 2017, the aggregate market value of the registrant’s common stock held by non-affiliates of the registrant was $237,111,560 based on the closing sale price as reported on the New York Stock Exchange.
The number of shares outstanding of the registrant’s common stock as of March 2, 2018 was 20,566,680.
DOCUMENTS INCORPORATED BY REFERENCE
Portions of the definitive proxy statement (the “Definitive Proxy Statement”) to be filed with the Securities and Exchange Commission for the Company’s 2018 Annual Meeting of Shareholders are incorporated by reference into Part III of this report.
SAFEGUARD SCIENTIFICS, INC.
FORM 10-K
December 31, 2017
Page | |
2
PART I
Cautionary Note Concerning Forward-Looking Statements
This Annual Report on Form 10-K contains forward-looking statements that are based on current expectations, estimates, forecasts and projections about Safeguard Scientifics, Inc. (“Safeguard” or “we”), the industries in which we operate and other matters, as well as management's beliefs and assumptions and other statements regarding matters that are not historical facts. These statements include, in particular, statements about our plans, strategies and prospects. For example, when we use words such as “projects,” “expects,” “anticipates,” “intends,” “plans,” “believes,” “seeks,” “estimates,” “should,” “would,” “could,” “will,” “opportunity,” “potential” or “may,” variations of such words or other words that convey uncertainty of future events or outcomes, we are making forward-looking statements within the meaning of Section 27A of the Securities Act of 1933 and Section 21E of the Securities Exchange Act of 1934. Our forward-looking statements are subject to risks and uncertainties. Factors that could cause actual results to differ materially include, among others, our ability to make good decisions about the deployment of capital, the fact that our partner companies may vary from period to period, our substantial capital requirements and absence of liquidity from our partner company holdings, our ability to service the indebtedness under and remain in compliance with the terms of our credit facility, a fluctuations in the market prices of our publicly traded partner company holdings, competition, our inability to obtain maximum value for our partner company holdings, our ability to attract and retain qualified employees, our ability to execute our strategy, market valuations in sectors in which our partner companies operate, our inability to control our partner companies, our need to manage our assets to avoid registration under the Investment Company Act of 1940, and risks associated with our partner companies and their performance, including the fact that most of our partner companies have a limited history and a history of operating losses, face intense competition and may never be profitable, the effect of economic conditions in the business sectors in which our partner companies operate, compliance with government regulation and legal liabilities, all of which are discussed in Item 1A. “Risk Factors.” Many of these factors are beyond our ability to predict or control. In addition, as a result of these and other factors, our past financial performance should not be relied on as an indication of future performance. All forward-looking statements attributable to us, or to persons acting on our behalf, are expressly qualified in their entirety by this cautionary statement. We undertake no obligation to publicly update or revise any forward-looking statements, whether as a result of new information, future events or otherwise, except as required by law. In light of these risks and uncertainties, the forward-looking events and circumstances discussed in this report might not occur.
Item 1. Business
Business Overview
Over the recent past, Safeguard has provided capital and relevant expertise to fuel the growth of technology-driven businesses in healthcare, financial services and digital media. Throughout this document, we use the term “partner company” to generally refer to those companies in which we have an equity interest and in which we are actively involved, influencing development through board representation and management support, in addition to the influence we exert through our equity ownership. From time to time, in addition to these partner companies, we also hold relatively small equity interests in other enterprises where we do not exert significant influence and do not participate in management activities. In some cases, these interests relate to former partner companies.
In January 2018, Safeguard announced that, from that date forward, we will not deploy any capital into new partner company opportunities and will focus on supporting our existing partner companies and maximizing monetization opportunities for partner company interests to enable distributions of net proceeds to shareholders. In that context, we will consider initiatives including, among others: the sale of individual partner companies, the sale of certain partner company interests in secondary market transactions, or a combination thereof, as well as other opportunities to maximize shareholder value. We anticipate distributing to shareholders net proceeds from the sale of partner companies or partner company interests, as applicable, after satisfying our debt obligations and working capital needs.
Safeguard's existing group of partner companies consist of technology-driven businesses in healthcare, financial services and digital media that are capitalizing on the next wave of enabling technologies with a particular focus on the Internet of Everything, enhanced security and predictive analytics. We strive to create long-term value for our shareholders by helping our partner companies to increase their market penetration, grow revenue and improve cash flow. Safeguard typically deploys up to $25 million in a company.
In 2017, our management team focused on the following objectives:
• | Deploy follow-on capital to support our existing partner companies; |
• | Build value in partner companies by developing strong management teams, growing the companies organically and through acquisitions, and positioning the companies for liquidity at premium valuations; |
• | Realize the value of partner companies through selective, well-timed exits to maximize risk-adjusted value; and |
3
• | Provide the tools needed for investors to fully recognize the shareholder value that has been created by our efforts. |
To meet our strategic objectives during 2018, Safeguard will continue to focus on:
• | Deploying follow-on capital to support only our existing partner companies; |
• | Helping partner companies achieve additional market penetration, revenue growth, cash flow improvement and growth in long-term value; and |
• | Maximizing monetization opportunities for our partner company interests. |
We incorporated in the Commonwealth of Pennsylvania in 1953. Our corporate headquarters are located at 170 North Radnor-Chester Road, Suite 200, Radnor, Pennsylvania 19087.
Our Strategy
Founded in 1953, Safeguard has a distinguished track record of building market leaders by providing capital and operational support to entrepreneurs across an evolving and innovative spectrum of industries. Over the recent past, Safeguard has provided capital and relevant expertise to fuel the growth of technology-driven businesses in healthcare, financial services and digital media. Safeguard's existing group of partner companies consist of companies that are capitalizing on the next wave of enabling technologies with a particular focus on the Internet of Everything, enhanced security and predictive analytics. In January 2018, Safeguard announced that we will not deploy any capital into new partner company opportunities and will focus on supporting our existing partner companies and maximizing monetization opportunities for our partner company interests to enable distributions of net proceeds to shareholders.
Helping Our Partner Companies Build Value
We offer operational and management support to each of our partner companies through our deep domain expertise from our management team's careers as entrepreneurs, board members, financiers and operators. Our employees have expertise in business strategy, sales and marketing, operations, finance, legal and transactional support. We provide hands-on assistance to the management teams of our partner companies to support their growth. We believe our strengths include:
• | applying our expertise to support a partner company’s introduction of new products and services; |
• | leveraging our market knowledge to generate additional growth opportunities; |
• | leveraging our business contacts and relationships; and |
• | identifying and evaluating potential acquisitions and providing capital to pursue potential acquisitions to accelerate growth. |
Strategic Support. By helping our partner companies’ management teams remain focused on critical objectives through the provision of human, financial and strategic resources, we believe we are able to accelerate their development and success. We play an active role in developing the strategic direction of our partner companies, which include:
• | defining short and long-term strategic goals; |
• | identifying and planning for the critical success factors to reach these goals; |
• | identifying and addressing the challenges and operational improvements required to achieve the critical success factors and, ultimately, the strategic goals; |
• | identifying and implementing the business measurements that we and others will apply to measure a company’s success; and |
• | providing capital to drive growth. |
Management and Operational Support. We provide management and operational support, as well as ongoing planning and development assessment. Our executives serve on the boards of directors of our partner companies, working with them to develop and implement strategic and operating plans. We measure and monitor achievement of these plans through regular review of operational and financial performance measurements. We believe these services provide our partner companies with significant competitive advantages within their respective markets.
Realizing Value
In January 2018, Safeguard announced that we will focus on maximizing monetization opportunities for partner company interests to enable distributions of net proceeds to shareholders. We will consider initiatives including, among others: the sale of individual partner companies, the sale of certain partner company interests in secondary market transactions, or a combination thereof, as well as other opportunities to maximize shareholder value. We anticipate distributing to shareholders net proceeds from the sale of partner companies or partner company interests, as applicable, after satisfying our debt obligations and working capital needs.
In general, we will hold our position in a partner company as long as we believe the risk-adjusted value of that position is maximized by our continued ownership and effort. From time to time, we engage in discussions with other companies
4
interested in our partner companies, either in response to inquiries or as part of a process we initiate. To the extent we believe that a partner company’s further growth and development can best be supported by a different ownership structure or if we otherwise believe it is in our shareholders’ best interests, we may seek to sell some or all of our position in the partner company. These sales may take the form of privately negotiated sales of stock or assets, mergers and acquisitions, public offerings of the partner company’s securities and, in the case of publicly traded partner companies, sales of their securities in the open market. In the past, we have taken partner companies public through rights offerings and directed share subscription programs. We will continue to consider these (or similar) programs and the sale of certain partner company interests in secondary market transactions to maximize partner company value for our shareholders.
Given our recent change in strategy, the value of Safeguard is now virtually wholly dependent upon the value of our existing partner companies and our ability to translate that value into cash as efficiently as possible and to deliver that cash, net of our obligations and operating cash needs, to our shareholders. As we have in the past, we will utilize the service of professional advisers from time to time to explore the various alternatives for returning capital to our balance sheet and ultimately to our shareholders.
Our Partner Companies
An understanding of our partner companies is important to understanding Safeguard and its value-building strategy. Following are descriptions of our partner companies in which we own interests at March 7, 2018.
We categorize our partner companies into four stages based upon revenue generation—Development Stage, Initial Revenue Stage, Expansion Stage, and High Traction Stage. The Development Stage is made up of those companies that are pre-revenue businesses. The Initial Revenue Stage is made up of businesses that have revenues of $5 million or less. The Expansion Stage is made up of companies that have revenue in the range of $5 million to $20 million. The High Traction Stage is made up of companies that have revenue in excess of $20 million per year.
The ownership percentages indicated below are presented as of December 31, 2017 for partner companies in which we owned interests at March 7, 2018 and reflects the percentage of the vote we were entitled to cast at that date based on issued and outstanding voting securities (on a common stock equivalent basis), excluding the effect of options, warrants and convertible debt (primary ownership).
AdvantEdge Healthcare Solutions, Inc. | High Traction | (Safeguard Ownership: 40.1%) |
Headquartered in Salem, New Hampshire, AdvantEdge Healthcare Solutions is a technology-enabled provider of healthcare revenue cycle and business management solutions that improve decision-making, maximize financial performance, streamline operations and mitigate compliance risks for healthcare providers. www.ahsrcm.com
Aktana, Inc. | Expansion | (Safeguard Ownership: 24.5%) |
Headquartered in San Francisco, California, Aktana is a pioneer in decision support for global life science sales teams. Aktana helps its customers improve their commercial effectiveness by delivering data-driven insights and suggestions directly to sales reps, coordinating multi-channel actions and providing insight regarding which strategies work best for which customers under which conditions. www.aktana.com
Apprenda, Inc. | Expansion | (Safeguard Ownership: 29.3%) |
Headquartered in Troy, New York, Apprenda powers the next generation of enterprise software development in public, private and hybrid clouds. As a foundational software layer and application run-time environment, Apprenda abstracts away the complexities of building and delivering modern software applications, enabling enterprises to turn ideas into innovations more quickly. With Apprenda, enterprises can securely deliver an entire ecosystem of data, services, applications and application programming interfaces to both internal and external customers across any infrastructure. www.apprenda.com
Brickwork | Initial Revenue | (Safeguard Ownership: 20.3%) |
Headquartered in New York, New York, Brickwork helps retailers inform, target, convert and prepare for store shoppers online as the first scalable software-as-a-service platform powering a seamless customer path between online and in-store shopping. www.brickworksoftware.com
5
Cask Data, Inc. | Initial Revenue | (Safeguard Ownership: 31.2%) |
Headquartered in Palo Alto, California, Cask Data is an open source software company that helps developers deliver enterprise-class Apache Hadoop™ solutions more quickly and effectively. Cask’s flagship offering, the Cask Data Application Platform, provides an open source layer on top of the Hadoop ecosystem that adds enterprise-class governance, portability, security, scalability and transactional consistency. www.cask.com
CloudMine, Inc. | Initial Revenue | (Safeguard Ownership: 47.3%) |
Headquartered in Philadelphia, Pennsylvania, CloudMine is a leading HIPAA-compliance Enterprise Health Cloud platform. CloudMine empowers healthcare organizations to rapidly and confidently develop connected digital health experiences by reducing complexity, enabling data mobility, and ensuring compliance. www.cloudmineinc.com
Clutch Holdings, Inc. | Expansion | (Safeguard Ownership: 42.7%) |
Headquartered in Ambler, Pennsylvania, Clutch has revolutionized how marketing teams for premier brands develop and foster relationships with their customers. Clutch’s advanced marketing platform serves as a customer hub, delivering deep intelligence derived from real-time behaviors and transactions across in-store, online, mobile and social channels. www.clutch.com
Flashtalking | High Traction | (Safeguard Ownership: 10.3%) |
Headquartered in New York, New York, Flashtalking is a data-driven ad management and analytics technology company that uses data to personalize advertising in real-time, analyze its effectiveness and enable optimization that drives better engagement and ROI for sophisticated global brands. Our former partner company, Spongecell, Inc. merged into Flashtalking in January 2018. www.flashtalking.com
Hoopla Software, Inc. | Initial Revenue | (Safeguard Ownership: 25.5%) |
Headquartered in San Jose, California, Hoopla provides cloud-based software that helps sales organizations inspire and motivate sales team performance. Hoopla's Sales Motivation Platform combines modern game mechanics, data analytics and broadcast-quality video in a cloud application that makes it easy for managers to motivate team performance and score more wins. www.hoopla.net
InfoBionic, Inc. | Initial Revenue | (Safeguard Ownership: 39.5%) |
Headquartered in Lowell, Massachusetts, InfoBionic is an emerging digital health company focused on creating patient monitoring solutions for chronic disease management with an initial market focus on cardiac arrhythmias. InfoBionic’s MoMe® Kardia cloud-based, remote patient monitoring platform delivers on-demand, actionable monitoring data and analytics directly to the physicians themselves. www.infobionic.com
Lumesis, Inc. | Expansion | (Safeguard Ownership: 43.8%) |
Headquartered in Stamford, Connecticut, Lumesis is a financial technology company focused on providing business efficiency, data and regulatory solutions to the municipal bond marketplace. Lumesis’ DIVER platform helps more than 500 firms with more than 43,000 users efficiently meet credit, regulatory and risk needs. www.lumesis.com
MediaMath, Inc. | High Traction | (Safeguard Ownership: 20.5%) |
Headquartered in New York, New York, MediaMath is a global technology company that is leading the movement to revolutionize traditional marketing and drive transformative results for marketers through its TerminalOne Marketing Operating System®. MediaMath empowers marketers with an extensible, open platform that activates data, automates execution and optimizes interactions across all addressable media, delivering superior performance, transparency and control to all marketers and better, more individualized experiences for consumers. www.mediamath.com
6
meQuilibrium | Initial Revenue | (Safeguard Ownership: 36.2%) |
Headquartered in Boston, Massachusetts, meQuilibrium is a digital coaching platform that delivers clinically validated and highly personalized resilience solutions to employers, health plans, wellness providers and consumers increasing engagement, productivity and performance, as well as improving outcomes in managing stress, health and well-being. www.mequilibrium.com
Moxe Health Corporation | Initial Revenue | (Safeguard Ownership: 32.4%) |
Headquartered in Madison, Wisconsin, Moxe Health was founded with a vision to enable bi-directional data exchange through its key products, Substrate and Convergence, directly linking payers and their provider networks. By integrating insurer data using industry standard processes, Moxe Health allows providers to incorporate claims, risk and other payer data into their own analytic efforts, allowing clinicians to better understand patient risks and deliver value-based care. www.moxehealth.com
NovaSom, Inc. | High Traction | (Safeguard Ownership: 31.7%) |
Headquartered in Glen Burnie, Maryland, NovaSom is a medical device company that markets an FDA-cleared wireless home sleep test for Obstructive Sleep Apnea (“OSA”) called AccuSom® Home Sleep Test. The NovaSom home sleep test provides in-home, clinically equivalent diagnosis of OSA at a significantly reduced cost compared to in-facility testing for uncomplicated adult OSA. www.novasom.com
Prognos | Expansion | (Safeguard Ownership: 28.7%) |
Headquartered in New York, New York, Prognos is a healthcare AI company that’s striving to improve health by tracking and predicting disease earlier in partnership with Life Sciences brands, payers, and clinical diagnostics organizations. Prognos’ innovations enhance the value of laboratory results and clinical diagnostic data through advanced analytics and artificial intelligence techniques. www.prognos.ai
Propeller Health, Inc. | Initial Revenue | (Safeguard Ownership: 24.0%) |
Headquartered in Madison, Wisconsin, Propeller Health provides digital solutions to measurably improve respiratory health by combining sensors, mobile apps and predictive analytics to monitor and engage patients, increase adherence and encourage effective self-management. www.propellerhealth.com
QuanticMind, Inc. | Expansion | (Safeguard Ownership: 24.7%) |
Headquartered in Redwood City, California, QuanticMind provides enterprise-level, predictive advertising management software for paid search, social and mobile. QuanticMind brings together machine learning, distributed cloud and in-memory processing technologies to provide the most intelligent, most scalable and fastest platform available. www.quanticmind.com
Sonobi, Inc. | Expansion | (Safeguard Ownership: 21.6%) |
Headquartered in New York, New York, Sonobi is an advertising technology developer that creates data-driven tools and solutions to meet the evolving needs of demand- and sell-side organizations within the digital media marketplace. Sonobi helps its clients and strategic partners to forecast new market opportunities, enhance value delivery to clients, and create more profitable businesses through integration of progressive data procurement and user-centric sales management technologies. www.sonobi.com
Syapse, Inc. | Expansion | (Safeguard Ownership: 20.1%) |
Headquartered in Palo Alto, California, Syapse is on a mission to deliver the best care for every cancer patient through precision medicine. Syapse’s software platform, data sharing network, and industry partnerships enable healthcare providers to bring precision cancer care to every patient who needs it. www.syapse.com
7
T-REX Group, Inc. | Initial Revenue | (Safeguard Ownership: 21.1%) |
Headquartered in New York, New York, T-REX is a software solutions provider for the complex financing of esoteric asset backed securities (“ABS”) and energy project finance. T-REX’s SaaS platform supplants manually-generated financial models, driving transparency, standardization, collaboration, efficiency and access in energy project finance and asset backed securitization. www.trexgroup.com
Transactis, Inc. | Expansion | (Safeguard Ownership: 23.8%) |
Headquartered in New York, New York, Transactis transforms traditional paper billing and payment processing by enabling businesses of all sizes to replace paper bills, statements, invoices, payments and documents with efficient and cost effective digital alternatives. Transactis goes to market exclusively with resellers - financial institutions, technology companies, printers and business process outsourcers - to provide their customers with secure, configurable, white-label, industry-leading SaaS solutions. www.transactis.com
Trice Medical, Inc. | Initial Revenue | (Safeguard Ownership: 24.8%) |
Headquartered in King of Prussia, Pennsylvania, Trice Medical was founded to fundamentally improve orthopedic diagnostics for the patient, physician and payor by providing instant, eyes-on, answers. Trice has pioneered fully integrated camera-enabled technologies that provide a clinical solution that is optimized for the physician's office. Trice's mission is to provide more immediate and definitive patient care, eliminating the false reads associated with current indirect modalities and significantly reduce the overall cost to the healthcare system. www.tricemedical.com
WebLinc, Inc. | Expansion | (Safeguard Ownership: 38.0%) |
Headquartered in Philadelphia, Pennsylvania, WebLinc is a commerce platform and services provider for fast growing online retailers. WebLinc's modern, agile technologies and strategic expertise empower companies running global, omnichannel commerce operations, and enable retailers to consistently outpace the competition. www.weblinc.com
Zipnosis, Inc. | Initial Revenue | (Safeguard Ownership: 25.4%) |
Headquartered in Minneapolis, Minnesota, Zipnosis provides health systems with a white-labeled, fully integrated virtual care platform. Through Zipnosis’ tech-enabled treatment and triage tools, clients can offer convenient access to care while improving clinician efficiency. Currently, patients may be treated for more than 90 conditions via such treatment and triage tools. www.zipnosis.com
FINANCIAL INFORMATION ABOUT OPERATING SEGMENTS
We operate as one operating segment based upon the similar nature of our technology-driven partner companies, the functional alignment of the organizational structure and the reports that are regularly reviewed by the chief operating decision maker for the purpose of assessing performance and allocating resources.
OTHER INFORMATION
The operations of Safeguard and its partner companies are subject to environmental laws and regulations. Safeguard does not believe that expenditures relating to those laws and regulations will have a material adverse effect on the business, financial condition or results of operations of Safeguard.
AVAILABLE INFORMATION
Safeguard is subject to the informational requirements of the Securities Exchange Act of 1934, as amended. Therefore, we file our annual report on Form 10-K, quarterly reports on Form 10-Q, current reports on Form 8-K and proxy statements and other information with, and furnish other reports to, the Securities and Exchange Commission (“SEC”). You can read and copy such documents at the SEC’s public reference facilities in Washington, D.C., New York, New York and Chicago, Illinois. You may obtain information on the operation of the SEC’s public reference facilities by calling the SEC at 1-800-SEC-0330. Such material may also be accessed electronically by means of the SEC’s home page on the Internet at www.sec.gov or through
8
Safeguard’s website at www.safeguard.com. Such documents are available as soon as reasonably practicable after electronic filing of the material with the SEC. Copies of these reports (excluding exhibits) also may be obtained free of charge, upon written request to: Investor Relations, Safeguard Scientifics, Inc., 170 North Radnor-Chester Road, Suite 200, Radnor, Pennsylvania 19087.
The Internet website addresses for Safeguard and its partner companies are included in this report for identification purposes. The information contained therein or connected thereto is not intended to be incorporated into this Annual Report on Form 10-K.
The following corporate governance documents are available free of charge on Safeguard’s website: the charters of our Audit, Compensation and Nominating & Corporate Governance Committees, our Corporate Governance Guidelines and our Code of Business Conduct and Ethics. We also will post on our website any amendments to or waivers of our Code of Business Conduct and Ethics that relate to our directors and executive officers.
9
Item 1A. Risk Factors
You should carefully consider the information set forth below. The following risk factors describe situations in which our business, financial condition and/or results of operations could be materially harmed, and the value of our securities may be adversely affected. You should also refer to other information included or incorporated by reference in this report.
The intended monetization of our partner company interests and distribution of net proceeds to shareholders are subject to factors beyond our control.
In January 2018, we announced that we will not deploy any capital into new partner companies. We will instead focus on supporting, and maximizing monetization opportunities for our existing partner company interests to enable distributions of net proceeds to shareholders. However, this strategic plan may require providing significant additional capital and operational support to such existing partner companies and we may not be able to sell our partner company interests during any specific time frame or otherwise on desirable terms, if at all, and there can be no assurance as to how long this process will take or the results that this process will yield. There can be no assurance as to whether we will realize the value of escrowed proceeds, holdbacks or other contingent consideration, if any, associated with the sale of partner company interests. Additionally, there can be no assurance that we will be able to satisfy our liabilities during this process. Further, the method, timing and amount of any distributions resulting from the monetization of existing partner companies will be at the discretion of our Board of Directors and will depend on market and business conditions and our overall liabilities, capital structure and liquidity position.
The continuing costs and burdens associated with being a public company will constitute a much larger percentage of our expenses and we may in the future delist our Common Stock with the New York Stock Exchange and seek to deregister our Common Stock with the SEC.
We will remain a public company and will continue to be subject to the listing standards of the New York Stock Exchange and SEC rules and regulations, including the Dodd-Frank Wall Street Reform and Consumer Protection Act and the Sarbanes-Oxley Act of 2002. The costs and burdens of being a public company will be a significant and continually increasing portion of our expenses if we are able to monetize partner company interests. As part of such monetization efforts, we will likely in the future, once the majority of our partner company interests have been monetized and proceeds therefrom distributed, delist our Common Stock from the New York Stock Exchange and seek to deregister our Common Stock with the SEC. However, there can be no assurance as to the timing of such transactions, or whether such transactions will be completed at all, and we will continue to face the costs and burdens of being a public company until such time as our Common Stock is delisted with the New York Stock Exchange and deregistered with the SEC.
Our principal business strategy depends upon our ability to make good decisions regarding the deployment of capital into, and subsequent disposition of, existing partner company interests and, ultimately, the performance of our partner companies, which is uncertain.
If we make poor decisions regarding the deployment of capital into, and subsequent disposition of, existing partner companies, our business strategy will not succeed. If our partner companies do not succeed, the value of our assets could be significantly reduced and require substantial impairments or write-offs and our results of operations and the price of our common stock would be adversely affected. The risks relating to our partner companies include:
• | most of our partner companies have a history of operating losses and/or limited operating history; |
• | the intense competition affecting the products and services our partner companies offer could adversely affect their businesses, financial condition, results of operations and prospects for growth; |
• | the inability to adapt to changing marketplaces; |
• | the inability to manage growth; |
• | the need for additional capital to fund their operations, which we may not be able to fund or which may not be available from third parties on acceptable terms, if at all; |
• | the inability to protect their proprietary rights and/or infringing on the proprietary rights of others; |
• | that our partner companies could face legal liabilities from claims made against them based upon their operations, products or work; |
• | the impact of economic downturns on their operations, results and growth prospects; |
• | the inability to attract and retain qualified personnel; |
• | the existence of government regulations and legal uncertainties may place financial burdens on the businesses of our partner companies; and |
• | the inability to plan for and manage catastrophic events. |
These and other risks are discussed in detail under the caption “Risks Related to Our Partner Companies” below.
10
Our Credit Facility subjects us to interest rate risk.
In May 2017, we entered into a $75.0 million secured, revolving credit facility (“Credit Facility”) with HPS Investment Partners, LLC (“Lender”). Debt service costs under the Credit Facility are subject to interest rate changes. Interest rates could rise from time to time and significantly increase our cost of borrowing. If that were to occur, replacing the Credit Facility with alternative credit arrangements having a lower cost of borrowing would likely not be possible and no assurance can be given that we would be able to refinance the Credit Facility on attractive terms or at all.
Servicing the indebtedness under the Credit Facility will require a significant amount of cash and our ability to generate cash depends on many factors beyond our control.
Our ability to make payments on the indebtedness under the Credit Facility will depend on our ability to generate cash in the future. We generate cash from proceeds we receive in connection with the sales of our interests in our partner companies. Due to the nature of the mergers and acquisitions market, and the developmental cycle of companies like our partner companies, our ability to generate specific amounts of liquidity from sales of our partner company interests in any given period of time cannot be assured. Our ability to generate cash is also, to a certain extent, subject to general economic, financial, competitive, legislative, regulatory and other factors that are beyond our control. The risk exists that our business will be unable to generate sufficient cash flow to service our indebtedness under the Credit Facility.
Covenants in the agreements governing the Credit Facility could adversely affect our business and/or result in the operation of our business in a way other than as desired by management; our ability to comply with such covenants may be affected by events beyond our control; and a breach of any of these covenants could result in a default under the agreements governing the Credit Facility, which, if not cured or waived, could result in the acceleration of the indebtedness under the Credit Facility.
The Credit Facility contains various covenants that prohibit or limit, subject to certain exceptions, our ability to, among other things:
• | Sell, transfer, lease, convey or otherwise dispose of all or any part of our business or property; |
• | Exceed concentration limits with respect to the amount of capital deployed to any single partner company; |
• | Exceed concentration limits with respect to the amount of capital deployed to one or more partner companies operating in the same or similar industries; |
• | Deploy capital to partner companies operating outside of certain specified industries; |
• | Incur or assume liens or additional debt or provide guarantees in respect of obligations of other persons; |
• | Pay any dividends or make any distribution (in cash or in kind) or payment in respect of, or redeem, retire or purchase any capital stock; |
• | Enter into, or permit any of our subsidiaries to enter into, any sale and leaseback transaction; |
• | Wind-up, liquidate or dissolve, or merge, consolidate or amalgamate with any person, or permit any of our subsidiaries to do (or agree to do) so; |
• | Enter into certain transactions with affiliates; and |
• | Amend, modify or otherwise change any of our governing documents. |
In addition, the Credit Facility requires us to among other things, maintain (i) a liquidity threshold of at least $20 million of unrestricted cash; (ii) a tangible net worth, plus unrestricted cash, of at least 1.75x the amount then outstanding under the Credit Facility; and (iii) a minimum aggregate appraised value of the Company’s ownership interests in its partner companies, plus unrestricted cash in excess of the liquidity threshold, of at least $350 million.
The foregoing covenants could adversely affect our ability to finance our operations, engage in business activities that may be in our interest and plan for or react to market conditions or otherwise execute our business strategies.
Our ability to comply with these covenants may be affected by events beyond our control, including prevailing economic, financial and industry conditions.
Our failure to comply with any of these covenants could result in a default under the Credit Facility. If that were to occur, the Lender could choose to accelerate the maturity of the indebtedness. If the Lender were to accelerate the maturity of the indebtedness, we may not have sufficient liquidity to repay the entire balance of the outstanding borrowings and other obligations under the Credit Facility.
11
A significant amount of our deployed capital may be concentrated in partner companies operating in the same or similar industries, limiting the diversification of our capital deployments.
Except as may be agreed to with our debt providers, we do not have fixed guidelines for diversification of capital deployments, and our capital deployments could be concentrated in several partner companies that operate in the same or similar industries. This may cause us to be more susceptible to any single economic, regulatory or other occurrence affecting those particular industries than we would otherwise be if our partner companies operated in more diversified industries.
Our business model does not rely upon, or plan for, the receipt of operating cash flows from our partner companies. Our partner companies generally provide us with no cash flow from their operations. We rely on cash on hand, liquidity events and our ability to generate cash from capital raising activities to finance our operations.
We need capital to fund the capital needs of our existing partner companies. We also need cash to service and repay our outstanding debt, finance our corporate overhead and meet our existing funding commitments. As a result, we have substantial cash requirements. Our partner companies generally provide us with no cash flow from their operations. To the extent our partner companies generate any cash from operations, they generally retain the funds to develop their own businesses. As a result, we must rely on cash on hand, partner company liquidity events and new capital raising activities to meet our cash needs. If we are unable to find ways of monetizing our holdings or raising additional capital on attractive terms, we may face liquidity issues that will require us to constrain our ability to execute our business strategy and limit our ability to provide financial support to our existing partner companies.
Fluctuations in the price of the common stock of our publicly traded holdings may affect the price of our common stock.
From time to time, we may hold equity interests in companies that are publicly traded. Fluctuations in the market prices of the common stock of publicly traded holdings may affect the price of our common stock. Historically, the market prices of our publicly traded holdings have been highly volatile and subject to fluctuations unrelated or disproportionate to operating performance.
We may be unable to obtain maximum value for our holdings or to sell our holdings on a timely basis.
We hold significant positions in our partner companies. Consequently, if we were to divest all or part of our holdings in a partner company, we may have to sell our interests at a relative discount to a price which may be received by a seller of a smaller portion. For partner companies with publicly traded stock, we may be unable to sell our holdings at then-quoted market prices. The trading volume and public float in the common stock of a publicly traded partner company may be small relative to our holdings. As a result, any significant open-market divestiture by us of our holdings in such a partner company, if possible at all, would likely have a material adverse effect on the market price of its common stock and on our proceeds from such a divestiture. Additionally, we may not be able to take our partner companies public as a means of monetizing our position or creating shareholder value.
Registration and other requirements under applicable securities laws and contractual restrictions also may adversely affect our ability to dispose of our partner company holdings on a timely basis.
Our success is dependent on our senior management.
Our success is dependent on our senior management team’s ability to execute our strategy. In January 2018, we announced our intent to reduce overhead costs, which included a reduction in certain members of senior management. A loss of one or more of the remaining members of our senior management team without adequate replacement could have a material adverse effect on us.
Our business strategy may not be successful if valuations in the market sectors in which our partner companies participate decline.
Our strategy involves creating value for our shareholders by helping our partner companies build value and, if appropriate, accessing the public and private capital markets. Therefore, our success is dependent on the value of our partner companies as determined by the public and private capital markets. Many factors, including reduced market interest, may cause the market value of our partner companies to decline. If valuations in the market sectors in which our partner companies participate decline, their access to the public and private capital markets on terms acceptable to them may be limited.
12
Our partner companies could make business decisions that are not in our best interests or with which we do not agree, which could impair the value of our holdings.
Although we currently own a significant, influential interest in some of our partner companies, we do not maintain a controlling interest in any of our partner companies. Acquisitions of interests in partner companies in which we share or have no control, and the dilution of our interests in or loss of control of partner companies, will involve additional risks that could cause the performance of our interests and our operating results to suffer, including:
• | the management of a partner company having economic or business interests or objectives that are different from ours; and |
• | the partner companies not taking our advice with respect to the financial or operating issues they may encounter. |
Our inability to control our partner companies also could prevent us from assisting them, financially or otherwise, or could prevent us from liquidating our interests in them at a time or at a price that is favorable to us. Additionally, our partner companies may not act in ways that are consistent with our business strategy. These factors could hamper our ability to maximize returns on our interests and cause us to incur losses on our interests in these partner companies.
We may have to buy, sell or retain assets when we would otherwise not wish to do so in order to avoid registration under the Investment Company Act.
The Investment Company Act of 1940 regulates companies which are engaged primarily in the business of investing, reinvesting, owning, holding or trading in securities. Under the Investment Company Act, a company may be deemed to be an investment company if it owns investment securities with a value exceeding 40% of the value of its total assets (excluding government securities and cash items) on an unconsolidated basis, unless an exemption or safe harbor applies. We refer to this test as the “40% Test.” Securities issued by companies other than consolidated partner companies are generally considered “investment securities” for purposes of the Investment Company Act, unless other circumstances exist which actively involve the company holding such interests in the management of the underlying company. We are a company that partners with growth-stage companies to build value; we are not engaged primarily in the business of investing, reinvesting or trading in securities. We are in compliance with the 40% Test. Consequently, we do not believe that we are an investment company under the Investment Company Act.
We monitor our compliance with the 40% Test and seek to conduct our business activities to comply with this test. It is not feasible for us to be regulated as an investment company because the Investment Company Act rules are inconsistent with our strategy of actively helping our partner companies in their efforts to build value. In order to continue to comply with the 40% Test, we may need to take various actions which we would otherwise not pursue. For example, we may need to retain a controlling interest in a partner company that we no longer consider strategic, we may not be able to acquire an interest in a company unless we are able to obtain a controlling ownership interest in the company, or we may be limited in the manner or timing in which we sell our interests in a partner company. Our ownership levels also may be affected if our partner companies are acquired by third parties or if our partner companies issue stock which dilutes our ownership interest. The actions we may need to take to address these issues while maintaining compliance with the 40% Test could adversely affect our ability to create and realize value at our partner companies.
Economic disruptions and downturns may have negative repercussions for us.
Events in the United States and international capital markets, debt markets and economies may negatively impact our stock price and our ability to pursue certain tactical and strategic initiatives, such as accessing additional public or private equity or debt financing for us or for our partner companies and selling our interests in partner companies on terms acceptable to us and in time frames consistent with our expectations.
We cannot provide assurance that material weaknesses in our internal control over financial reporting will not be identified in the future.
We cannot assure you that material weaknesses in our internal control over financial reporting will not be identified in the future. Any failure to maintain or implement required new or improved controls, or any difficulties we encounter in their implementation, could result in a material weakness, or could result in material misstatements in our Consolidated Financial Statements. These misstatements could result in a restatement of our Consolidated Financial Statements, cause us to fail to meet our reporting obligations and/or cause investors to lose confidence in our reported financial information, leading to a decline in our stock price.
13
Risks Related to Our Partner Companies
Most of our partner companies have a history of operating losses and/or limited operating history and may never be profitable.
Most of our partner companies have a history of operating losses and/or limited operating history, have significant historical losses and may never be profitable. Many have incurred substantial costs to develop and market their products, have incurred net losses and cannot fund their cash needs from operations. We expect that the operating expenses of certain of our partner companies will increase substantially in the foreseeable future as they continue to develop products and services, increase sales and marketing efforts, and expand operations.
Our partner companies face intense competition, which could adversely affect their business, financial condition, results of operations and prospects for growth.
There is intense competition in the technology marketplaces, and we expect competition to intensify in the future. Our business, financial condition, and results of operations will be materially adversely affected if our partner companies are not able to compete successfully. Many of the present and potential competitors may have greater financial, technical, marketing and other resources than those of our partner companies. This may place our partner companies at a disadvantage in responding to the offerings of their competitors, technological changes or changes in client requirements. Also, our partner companies may be at a competitive disadvantage because many of their competitors have greater name recognition, more extensive client bases and a broader range of product offerings. In addition, our partner companies may compete against one another.
The success or failure of many of our partner companies is dependent upon the ultimate effectiveness of newly-created technologies, medical devices, financial services, healthcare diagnostics, etc.
Our partner companies’ business strategies are often highly dependent upon the successful launch and commercialization of an innovative technology or device, including, without limitation, technologies or devices used in healthcare, financial services or digital media. Despite all of our efforts to understand the research and development underlying the innovation or creation of such technologies and devices before we deploy capital into a partner company, sometimes the performance of the technology or device does not match our expectations or those of our partner company. In those situations, it is likely that we will incur a partial or total loss of the capital which we deployed in such partner company.
Our partner companies may fail if they do not adapt to changing marketplaces.
If our partner companies fail to adapt to changes in technology and customer and supplier demands, they may not become or remain profitable. There is no assurance that the products and services of our partner companies will achieve or maintain market penetration or commercial success, or that the businesses of our partner companies will be successful.
The technology marketplaces are characterized by:
• | rapidly changing technology; |
• | evolving industry standards; |
• | frequent introduction of new products and services; |
• | shifting distribution channels; |
• | evolving government regulation; |
• | frequently changing intellectual property landscapes; and |
• | changing customer demands. |
Our future success will depend on our partner companies’ ability to adapt to these evolving marketplaces. They may not be able to adequately or economically adapt their products and services, develop new products and services or establish and maintain effective distribution channels for their products and services. If our partner companies are unable to offer competitive products and services or maintain effective distribution channels, they will sell fewer products and services and forego potential revenue, possibly causing them to lose money. In addition, we and our partner companies may not be able to respond to the marketplace changes in an economically efficient manner, and our partner companies may become or remain unprofitable.
Our partner companies may grow rapidly and may be unable to manage their growth.
We expect some of our partner companies to grow rapidly. Rapid growth often places considerable operational, managerial and financial strain on a business. To successfully manage rapid growth, our partner companies must, among other things:
• | improve, upgrade and expand their business infrastructures; |
• | scale up production operations; |
• | develop appropriate financial reporting controls; |
14
• | attract and retain qualified personnel; and |
• | maintain appropriate levels of liquidity. |
If our partner companies are unable to manage their growth successfully, their ability to respond effectively to competition and to achieve or maintain profitability will be adversely affected.
Based on our business model, some or all of our partner companies will need to raise additional capital to fund their operations at any given time. We may not be able to fund some or all of such amounts and such amounts may not be available from third parties on acceptable terms, if at all. Further, if our partner companies do raise additional capital, either debt or equity, such capital may rank senior to our interests in such companies.
We cannot be certain that our partner companies will be able to obtain additional financing on favorable terms when needed, if at all. Because our resources and our ability to raise capital are not unlimited, we may not be able to provide partner companies with sufficient capital resources to enable them to reach a cash-flow positive position or a sale of the company, even if we wish to do so. General economic disruptions and downturns may also negatively affect the ability of some of our partner companies to fund their operations from other stockholders and capital sources. We also may fail to accurately project the capital needs of partner companies. If partner companies need capital but are not able to raise capital from us or other outside sources, then they may need to cease or scale back operations. In such event, our interest in any such partner company will become less valuable. If our partner companies raise additional capital, either debt or equity, that ranks senior to the capital we have deployed, such capital may entitle its holders to receive returns of capital before the dates on which we are entitled to receive any return of our deployed capital. Also, in the event of any insolvency, liquidation, dissolution, reorganization or bankruptcy of a partner company, holders of such partner company’s instruments that rank senior to our deployed capital will typically be entitled to receive payment in full before we receive any return of our deployed capital. After returning such senior capital, such partner company may not have any remaining assets to use for returning capital to us, causing us to lose some or all of our deployed capital in such partner company.
Economic disruptions and downturns may negatively affect our partner companies’ plans and their results of operations.
Many of our partner companies are largely dependent upon outside sources of capital to fund their operations. Disruptions in the availability of capital from such sources will negatively affect the ability of such partner companies to pursue their business models and will force such companies to revise their growth and development plans accordingly. Any such changes will, in turn, negatively affect our ability to realize the value of our capital deployments in such partner companies.
In addition, downturns in the economy as well as possible governmental responses to such downturns and/or to specific situations in the economy could affect the business prospects of certain of our partner companies, including, but not limited to, in the following ways: weaknesses in the financial services industries; reduced business and/or consumer spending; and/or systemic changes in the ways the healthcare system operates in the United States.
Some of our partner companies may be unable to protect their proprietary rights and may infringe on the proprietary rights of others.
Our partner companies assert various forms of intellectual property protection. Intellectual property may constitute an important part of partner company assets and competitive strengths. Federal law, most typically copyright, patent, trademark and trade secret laws, generally protects intellectual property rights. Although we expect that our partner companies will take reasonable efforts to protect the rights to their intellectual property, third parties may develop similar intellectual property independently. Moreover, the complexity of international trade secret, copyright, trademark and patent law, coupled with the limited resources of our partner companies and the demands of quick delivery of products and services to market, create a risk that partner company efforts to prevent misappropriation of their technology will prove inadequate.
Some of our partner companies also license intellectual property from third parties and it is possible that they could become subject to infringement actions based upon their use of the intellectual property licensed from those third parties. Our partner companies generally obtain representations as to the origin and ownership of such licensed intellectual property. However, this may not adequately protect them. Any claims against our partner companies’ proprietary rights, with or without merit, could subject the companies to costly litigation and divert their technical and management personnel from other business concerns. If our partner companies incur costly litigation and their personnel are not effectively deployed, the expenses and losses incurred by our partner companies will increase and their profits, if any, will decrease.
Third parties have and may assert infringement or other intellectual property claims against our partner companies based on their patents or other intellectual property claims. Even though we believe our partner companies’ products do not infringe any third party’s patents, they may have to pay substantial damages, possibly including treble damages, if it is ultimately determined that they do. They may have to obtain a license to sell their products if it is determined that their products infringe
15
on another person’s intellectual property. Our partner companies might be prohibited from selling their products before they obtain a license, which, if available at all, may require them to pay substantial royalties. Even if infringement claims against our partner companies are without merit, defending these types of lawsuits takes significant time, is expensive and may divert management attention from other business concerns.
Certain of our partner companies could face legal liabilities from claims made against their operations, products or work.
Because manufacture and sale of certain partner company products entail an inherent risk of product liability, certain partner companies maintain product liability insurance. Although none of our current partner companies have experienced any material losses in this regard, there can be no assurance that they will be able to maintain or acquire adequate product liability insurance in the future and any product liability claim could have a material adverse effect on a partner company’s financial stability, revenues and results of operations. In addition, many of the engagements of our partner companies involve projects that are critical to the operation of their clients’ businesses. If our partner companies fail to meet their contractual obligations, they could be subject to legal liability, which could adversely affect their business, operating results and financial condition. Partner company contracts typically include provisions designed to limit their exposure to legal claims relating to their services and products. However, these provisions may not protect our partner companies or may not be enforceable. Also, some of our partner companies depend on their relationships with their clients and their reputation for high-quality services and integrity to retain and attract clients. As a result, claims made against our partner companies’ work may damage their reputation, which in turn could impact their ability to compete for new work and negatively impact their revenue and profitability.
Our partner companies’ success depends on their ability to attract and retain qualified personnel.
Our partner companies depend upon their ability to attract and retain senior management and key personnel, including trained technical and marketing personnel. Our partner companies also will need to continue to hire additional personnel as they expand. Although our current partner companies have not been the subject of a work stoppage, any future work stoppage could have a material adverse effect on their respective operations. A shortage in the availability of the requisite qualified personnel or work stoppage would limit the ability of our partner companies to grow, to increase sales of their existing products and services, and to launch new products and services.
Government regulations and legal uncertainties may place financial burdens on the businesses of our partner companies.
Failure to comply with applicable requirements of the FDA or comparable regulation in foreign countries can result in fines, recall or seizure of products, total or partial suspension of production, withdrawal of existing product approvals or clearances, refusal to approve or clear new applications or notices and criminal prosecution. Manufacturers of pharmaceuticals and medical diagnostic devices and operators of laboratory facilities are subject to strict federal and state regulation regarding validation and the quality of manufacturing and laboratory facilities. Failure to comply with these quality regulation systems requirements could result in civil or criminal penalties or enforcement proceedings, including the recall of a product or a “cease distribution” order. The enactment of any additional laws or regulations that affect healthcare insurance policy and reimbursement (including Medicare reimbursement) could negatively affect some of our partner companies. If Medicare or private payers change the rates at which our partner companies or their customers are reimbursed by insurance providers for their products, such changes could adversely impact our partner companies.
Some of our partner companies may be subject to significant environmental, health and safety regulation.
Some of our partner companies may be subject to licensing and regulation under federal, state and local laws and regulations relating to the protection of the environment and human health and safety, including laws and regulations relating to the handling, transportation and disposal of medical specimens, infectious and hazardous waste and radioactive materials, as well as to the safety and health of manufacturing and laboratory employees. In addition, the federal Occupational Safety and Health Administration has established extensive requirements relating to workplace safety. Compliance with such regulations could increase operating costs at certain of our partner companies, and the failure to comply could negatively affect the operations and results of some of our partner companies.
Catastrophic events may disrupt our partner companies’ businesses.
Some of our partner companies are highly automated businesses and rely on their network infrastructure, various software applications and many internal technology systems and data networks for their customer support, development, sales and marketing and accounting and finance functions. Further, some of our partner companies provide services to their customers from data center facilities in multiple locations. Some of these data centers are operated by third parties, and the partner companies have limited control over those facilities. A disruption or failure of these systems or data centers in the event of a natural disaster, telecommunications failure, power outage, cyber-attack, war, terrorist attack or other catastrophic event could cause system interruptions, reputational harm, delays in product development, breaches of data security and loss of
16
critical data. Such an event could also prevent the partner companies from fulfilling customer orders or maintaining certain service level requirements, particularly in respect of their SaaS offerings. While certain of our partner companies have developed certain disaster recovery plans and maintain backup systems to reduce the potentially adverse effect of such events, a catastrophic event that resulted in the destruction or disruption of any of their data centers or their critical business or information technology systems could severely affect their ability to conduct normal business operations and, as a result, their business, operating results and financial condition could be adversely affected.
We cannot provide assurance that our partner companies’ disaster recovery plans will address all of the issues they may encounter in the event of a disaster or other unanticipated issue, and their business interruption insurance may not adequately compensate them for losses that may occur from any of the foregoing. In the event that a natural disaster, terrorist attack or other catastrophic event were to destroy any part of their facilities or interrupt their operations for any extended period of time, or if harsh weather or health conditions prevent them from delivering products in a timely manner, their business, financial condition and operating results could be adversely affected.
Item 1B. Unresolved Staff Comments
None.
Item 2. Properties
Our corporate headquarters and administrative offices in Radnor, Pennsylvania contain approximately 15,600 square feet of office space in one building. We currently lease our corporate headquarters under a lease expiring in April 2026.
Item 3. Legal Proceedings
We, as well as our partner companies, are involved in various claims and legal actions arising in the ordinary course of business. While in the current opinion of management, the ultimate disposition of these matters will not have a material adverse effect on our consolidated financial position or results of operations, no assurance can be given as to the outcome of these lawsuits, and one or more adverse dispositions could have a material adverse effect on our consolidated financial position and results of operations, or that of our partner companies. See Note 12 to the Consolidated Financial Statements for a discussion of ongoing claims and legal actions.
Item 4. Mine Safety Disclosures
Not applicable.
ANNEX TO PART I — EXECUTIVE OFFICERS OF THE REGISTRANT
Name | Age | Position | Executive Officer Since | ||
Stephen T. Zarrilli | 56 | President, Chief Executive Officer and Director | 2008 | ||
Jeffrey B. McGroarty | 48 | Senior Vice President and Chief Financial Officer | 2012 | ||
Brian J. Sisko | 57 | Chief Operating Officer, Executive Vice President and Managing Director | 2007 | ||
Mr. Zarrilli joined Safeguard as Senior Vice President and Chief Financial Officer in June 2008 and became President and Chief Executive Officer in November 2012. Prior to joining Safeguard, Mr. Zarrilli co-founded, in 2004, the Penn Valley Group, a middle-market management advisory and private equity firm, and served as a Managing Director there until June 2008. Mr. Zarrilli also served as Acting Senior Vice President, Acting Chief Administrative Officer and Acting Chief Financial Officer of Safeguard from December 2006 to June 2007. Mr. Zarrilli also served as the Chief Financial Officer, from 2001 to 2004, of Fiberlink Communications Corporation, a provider of mobile access solutions for large enterprises; as the Chief Executive Officer, from 2000 to 2001, of Concellera Software, Inc., a developer of content management software; as the Chief Executive Officer, from 1999 to 2000, and Chief Financial Officer, from 1994 to 1998, of US Interactive, Inc. (at the time a public company), a provider of Internet strategy consulting, marketing and technology services; and, previously, with Deloitte & Touche from 1983 to 1994. Mr. Zarrilli is a director of Virtus Investment Partners, Inc. and currently serves as Chair of the Audit Committee and, until June 2015, was a director and Chairman of the Audit Committee of NutriSystem, Inc.
Mr. McGroarty joined Safeguard as Vice President and Corporate Controller in December 2005, subsequently became Vice President - Finance and Corporate Controller, and served as Senior Vice President - Finance from November 2012 until
17
his promotion to Senior Vice President and Chief Financial Officer in April 2013. Prior to joining Safeguard, Mr. McGroarty served as Interim Controller of Cephalon, Inc. from October 2005 to December 2005; Vice President-Financial Planning & Analysis and previously Assistant Controller at Exide Technologies from March 2002 to September 2005; and, previously, with PricewaterhouseCoopers from 1991 to 2001.
Mr. Sisko joined Safeguard as Senior Vice President and General Counsel in August 2007 and served as Executive Vice President and Managing Director from November 2012 until his promotion to Chief Operating Officer, Executive Vice President and Managing Director in January 2014. Prior to joining Safeguard, Mr. Sisko served as Chief Legal Officer, Senior Vice President and General Counsel of Traffic.com (at the time, a public company), a former partner company of Safeguard, from February 2006 until June 2007 (following its acquisition by NAVTEQ Corporation in March 2007); Chief Operating Officer from February 2005 to January 2006 of Halo Technology Holdings, Inc., a public holding company for enterprise software businesses (Halo Technology Holdings filed for bankruptcy protection under Chapter 11 of the United States Bankruptcy Code in August 2007); ran B/T Business and Technology, an advisor and strategic management consultant to a variety of public and private companies, from January 2002 to February 2005; and was a Managing Director from April 2000 to January 2002, of Katalyst, LLC, a venture capital and consulting firm. Mr. Sisko also previously served as Senior Vice President-Corporate Development and General Counsel of National Media Corporation, at the time a New York Stock Exchange-listed multi-media marketing company with operations in 70 countries, and as a partner in the corporate finance, mergers and acquisitions practice group of the Philadelphia-based law firm, Klehr, Harrison, Harvey, Branzburg LLP.
18
PART II
Item 5. Market for Registrant’s Common Equity, Related Stockholder Matters and Issuer Purchases of Equity Securities
Our common stock is listed on the New York Stock Exchange (Symbol: SFE). The high and low sale prices reported within each quarter of 2017 and 2016 were as follows:
High | Low | ||||||
Fiscal year 2017: | |||||||
First quarter | $ | 13.97 | $ | 11.80 | |||
Second quarter | 12.95 | 10.65 | |||||
Third quarter | 13.70 | 11.35 | |||||
Fourth quarter | 14.40 | 10.75 | |||||
Fiscal year 2016: | |||||||
First quarter | $ | 14.23 | $ | 11.40 | |||
Second quarter | 14.75 | 11.55 | |||||
Third quarter | 14.38 | 12.01 | |||||
Fourth quarter | 14.10 | 10.60 | |||||
The high and low sale prices reported in the first quarter of 2018 through March 2, 2018 were $12.85 and $10.83 respectively, and the last sale price reported on March 2, 2018, was $12.60. No cash dividends have been declared in any of the years presented. As of February 21, 2018, there were approximately 13,518 beneficial holders of our common stock.
Issuer Purchases of Equity Securities
The following table provides information about our purchases of equity securities during the quarter ended December 31, 2016 registered pursuant to Section 12 of the Securities Exchange Act of 1934, as amended (the "Exchange Act"):
Period | Total Number of Shares Purchased (a) | Average Price Paid Per Share | Total Number of Shares Purchased as Part of Publicly Announced Plan (b) | Maximum Number (or Approximate Dollar Value) of Shares that May Yet Be Purchased Under the Plan (b) | |||||||||
October 1, 2017 - October 31, 2017 | 1,247 | $ | 14.1500 | — | $ | 14,636,135 | |||||||
November 1, 2017 - November 30, 2017 | 163 | $ | 12.2250 | — | $ | 14,636,135 | |||||||
December 1, 2017 - December 31, 2017 | 2,132 | $ | 11.4000 | — | $ | 14,636,135 | |||||||
Total | 3,542 | $ | 12.4061 | — | |||||||||
(a) During the fourth quarter of 2017, we repurchased an aggregate of approximately 4 thousand shares of our common stock initially issued as restricted stock awards to employees and subsequently withheld from employees to satisfy the statutory withholding tax liability upon the vesting of such restricted stock awards.
(b) In July 2015, our Board of Directors authorized us to repurchase shares of our outstanding common stock with an aggregate value of up to $25.0 million. These repurchases may be made in open market or privately negotiated transactions, including under plans complying with Rule 10b5-1 of the Exchange Act, based on market conditions, stock price, and other factors. The share repurchase program does not obligate us to acquire any specific number of shares.
19
The following graph compares the cumulative total return on $100 invested in our common stock for the period from December 31, 2012 through December 31, 2017 with the cumulative total return on $100 invested for the same period in the Russell 2000 Index and the Wilshire 4500 Index. In light of the diverse nature of Safeguard’s business and based on our assessment of available published industry or line-of-business indexes, we determined that no single industry or line-of-business index would provide a meaningful comparison to Safeguard. Further, we did not believe that we could readily identify an appropriate group of industry peer companies for this comparison. Accordingly, under SEC rules, we selected the Wilshire 4500 Index, a published market index in which the median market capitalization of the included companies is similar to our own. Safeguard’s common stock is included as a component of the Russell 2000 and Wilshire 4500 indexes.
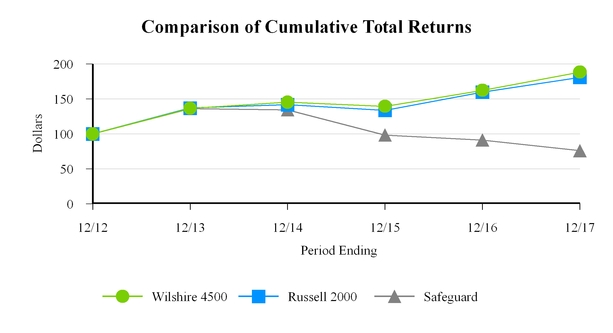
• | Assumes reinvestment of dividends. We have not distributed cash dividends during this period. |
• | Assumes an investment of $100 on December 31, 2012. |
20
Item 6. Selected Consolidated Financial Data
The following table sets forth our selected consolidated financial data for the five-year period ended December 31, 2017. The selected consolidated financial data presented below should be read in conjunction with Item 7. Management’s Discussion and Analysis of Financial Condition and Results of Operations and Item 8. Financial Statements and Supplementary Data included in this report. The historical results presented herein may not be indicative of future results.
December 31, | |||||||||||||||||||
2017 | 2016 | 2015 | 2014 | 2013 | |||||||||||||||
(In thousands) | |||||||||||||||||||
Consolidated Balance Sheet Data: | |||||||||||||||||||
Cash and cash equivalents | $ | 20,751 | $ | 22,058 | $ | 32,838 | $ | 111,897 | $ | 139,318 | |||||||||
Short-term marketable securities | 4,452 | 8,384 | 31,020 | 25,263 | 38,250 | ||||||||||||||
Long-term marketable securities | — | 7,302 | 9,743 | 19,365 | 6,088 | ||||||||||||||
Long-term restricted cash equivalents | 6,336 | 6,336 | — | — | — | ||||||||||||||
Working capital (deficit) | (12,204 | ) | 26,690 | 63,251 | 132,287 | 170,956 | |||||||||||||
Total assets | 176,464 | 231,828 | 256,843 | 317,375 | 344,653 | ||||||||||||||
Convertible senior debentures - current | 40,485 | — | — | — | — | ||||||||||||||
Convertible senior debentures - non-current | — | 52,560 | 50,956 | 49,484 | 48,135 | ||||||||||||||
Credit facility - non-current | 45,321 | — | — | — | — | ||||||||||||||
Other long-term liabilities | 3,535 | 3,630 | 3,965 | 3,507 | 3,683 | ||||||||||||||
Total equity | 81,796 | 169,777 | 195,505 | 257,827 | 284,661 | ||||||||||||||
Year Ended December 31, | |||||||||||||||||||
2017 | 2016 | 2015 | 2014 | 2013 | |||||||||||||||
(In thousands, except per share amounts) | |||||||||||||||||||
Consolidated Statements of Operations Data: | |||||||||||||||||||
General and administrative expense | $ | 17,131 | $ | 18,692 | $ | 17,554 | $ | 18,970 | $ | 21,644 | |||||||||
Operating loss | (17,131 | ) | (18,692 | ) | (17,554 | ) | (18,970 | ) | (21,644 | ) | |||||||||
Other income (loss), net | (339 | ) | (1,682 | ) | 217 | 31,657 | 383 | ||||||||||||
Interest income | 3,876 | 2,075 | 1,935 | 1,901 | 2,646 | ||||||||||||||
Interest expense | (8,620 | ) | (4,634 | ) | (4,523 | ) | (4,402 | ) | (4,303 | ) | |||||||||
Equity income (loss) | (66,358 | ) | 671 | (39,599 | ) | (15,335 | ) | (12,607 | ) | ||||||||||
Net loss before income taxes | (88,572 | ) | (22,262 | ) | (59,524 | ) | (5,149 | ) | (35,525 | ) | |||||||||
Income tax benefit (expense) | — | — | — | — | — | ||||||||||||||
Net loss | $ | (88,572 | ) | $ | (22,262 | ) | $ | (59,524 | ) | $ | (5,149 | ) | $ | (35,525 | ) | ||||
Net loss per share: | |||||||||||||||||||
Basic | $ | (4.34 | ) | $ | (1.09 | ) | $ | (2.85 | ) | $ | (0.25 | ) | $ | (1.66 | ) | ||||
Diluted | $ | (4.34 | ) | $ | (1.09 | ) | $ | (2.85 | ) | $ | (0.25 | ) | $ | (1.66 | ) | ||||
Weighted average shares used in computing net loss per share: | |||||||||||||||||||
Basic | 20,430 | 20,343 | 20,874 | 20,975 | 21,362 | ||||||||||||||
Diluted | 20,430 | 20,343 | 20,874 | 20,975 | 21,362 | ||||||||||||||
21
Item 7. Management’s Discussion and Analysis of Financial Condition and Results of Operations
Cautionary Note Concerning Forward-Looking Statements
This Annual Report on Form 10-K contains forward-looking statements that are based on current expectations, estimates, forecasts and projections about Safeguard Scientifics, Inc. (“Safeguard” or “we”), the industries in which we operate and other matters, as well as management's beliefs and assumptions and other statements regarding matters that are not historical facts. These statements include, in particular, statements about our plans, strategies and prospects. For example, when we use words such as “projects,” “expects,” “anticipates,” “intends,” “plans,” “believes,” “seeks,” “estimates,” “should,” “would,” “could,” “will,” “opportunity,” “potential” or “may,” variations of such words or other words that convey uncertainty of future events or outcomes, we are making forward-looking statements within the meaning of Section 27A of the Securities Act of 1933 and Section 21E of the Securities Exchange Act of 1934. Our forward-looking statements are subject to risks and uncertainties. Factors that could cause actual results to differ materially include, among others, our ability to make good decisions about the deployment of capital, the fact that our partner companies may vary from period to period, our substantial capital requirements and absence of liquidity from our partner company holdings, our ability to service the indebtedness under and remain in compliance with the terms of our credit facility, a fluctuations in the market prices of our publicly traded partner company holdings, competition, our inability to obtain maximum value for our partner company holdings, our ability to attract and retain qualified employees, our ability to execute our strategy, market valuations in sectors in which our partner companies operate, our inability to control our partner companies, our need to manage our assets to avoid registration under the Investment Company Act of 1940, and risks associated with our partner companies and their performance, including the fact that most of our partner companies have a limited history and a history of operating losses, face intense competition and may never be profitable, the effect of economic conditions in the business sectors in which our partner companies operate, compliance with government regulation and legal liabilities, all of which are discussed in Item 1A. “Risk Factors.” Many of these factors are beyond our ability to predict or control. In addition, as a result of these and other factors, our past financial performance should not be relied on as an indication of future performance. All forward-looking statements attributable to us, or to persons acting on our behalf, are expressly qualified in their entirety by this cautionary statement. We undertake no obligation to publicly update or revise any forward-looking statements, whether as a result of new information, future events or otherwise, except as required by law. In light of these risks and uncertainties, the forward-looking events and circumstances discussed in this report might not occur.
Overview
Over the recent past, Safeguard has provided capital and relevant expertise to fuel the growth of technology-driven businesses in healthcare, financial services and digital media. Throughout this document, we use the term “partner company” to generally refer to those companies in which we have an equity interest and in which we are actively involved, influencing development through board representation and management support, in addition to the influence we exert through our equity ownership. From time to time, in addition to these partner companies, we also hold relatively small equity interests in other enterprises where we do not exert significant influence and do not participate in management activities. In some cases, these interests relate to former partner companies.
In January 2018, Safeguard announced that, from that date forward, we will not deploy any capital into new partner company opportunities and will focus on supporting our existing partner companies and maximizing monetization opportunities for partner company interests to enable distributions of net proceeds to shareholders. In that context, we will consider initiatives including, among others: the sale of individual partner companies, the sale of certain partner company interests in secondary market transactions, or a combination thereof, as well as other opportunities to maximize shareholder value. We anticipate distributing to shareholders net proceeds from the sale of partner companies or partner company interests, as applicable, after satisfying our debt obligations and working capital needs.
Safeguard's existing group of partner companies consist of technology-driven businesses in healthcare, financial services and digital media that are capitalizing on the next wave of enabling technologies with a particular focus on the Internet of Everything, enhanced security and predictive analytics. We strive to create long-term value for our shareholders by helping our partner companies to increase their market penetration, grow revenue and improve cash flow. Safeguard typically deploys up to $25 million in a company.
Principles of Accounting for Ownership Interests in Partner Companies
We account for our interests in our partner companies using one of the following methods: consolidation, fair value, equity or cost. The accounting method applied is generally determined by the degree of our influence over the entity, primarily determined by our voting interest in the entity.
22
Consolidation Method. We account for partner companies in which we maintain a controlling financial interest, generally those in which we directly or indirectly own more than 50% of the outstanding voting securities, using the consolidation method of accounting. Upon consolidation of our partner companies, we reflect the portion of equity (net assets) in a subsidiary not attributable, directly or indirectly, to the parent company as a non-controlling interest in the Consolidated Balance Sheet. The non-controlling interest is presented within equity, separately from the equity of the parent company. Losses attributable to the parent company and the non-controlling interest may exceed their interest in the subsidiary’s equity. As a result, the non-controlling interest shall continue to be attributed its share of losses even if that attribution results in a deficit non-controlling interest balance as of each balance sheet date. Revenue, expenses, gains, losses, net income or loss are reported in the Consolidated Statements of Operations at the consolidated amounts, which include the amounts attributable to the parent company’s common shareholders and the non-controlling interest. As of December 31, 2017, we did not hold a controlling interest in any of our partner companies.
Fair Value Method. Unrealized gains and losses on the mark-to-market of our holdings in fair value method companies and realized gains and losses on the sale of any holdings in fair value method companies are recognized in Other income (loss), net in the Consolidated Statements of Operations. As of December 31, 2017, we did not account for any of our partner companies under the fair value method.
Equity Method. We account for partner companies whose results are not consolidated, but over whom we exercise significant influence, using the equity method of accounting. We also account for our interests in some private equity funds under the equity method of accounting, based on our non-controlling general and limited partner interests. Under the equity method of accounting, our share of the income or loss of the partner company is reflected in Equity income (loss) in the Consolidated Statements of Operations. We report our share of the income or loss of the equity method partner companies on a one quarter lag. We include the carrying value of equity method partner companies in Ownership interests in and advances to partner companies on the Consolidated Balance Sheets.
When the carrying value of our holdings in an equity method partner company is reduced to zero, no further losses are recorded in our Consolidated Statements of Operations unless we have outstanding guarantee obligations or have committed additional funding to the equity method partner company. When the equity method partner company subsequently reports income, we will not record our share of such income until it equals the amount of our share of losses not previously recognized.
Cost Method. We account for partner companies which are not consolidated or accounted for under the equity method or fair value method under the cost method of accounting. Under the cost method, our share of the income or losses of such partner companies is not included in our Consolidated Statements of Operations. We include the carrying value of cost method partner companies in Ownership interests in and advances to partner companies on the Consolidated Balance Sheets.
Critical Accounting Policies and Estimates
Accounting policies, methods and estimates are an integral part of the Consolidated Financial Statements prepared by management and are based upon management’s current judgments. These judgments are normally based on knowledge and experience with regard to past and current events and assumptions about future events. Certain accounting policies, methods and estimates are particularly important because of their significance to the financial statements and because of the possibility that future events affecting them may differ from management’s current judgments. While there are a number of accounting policies, methods and estimates affecting our financial statements as described in Note 1 to our Consolidated Financial Statements, the most significant relate to impairment of ownership interests in and advances to partner companies.
Impairment of Ownership Interests In and Advances to Partner Companies
On a periodic basis, but no less frequently than at the end of each quarter, we evaluate the carrying value of our equity and cost method partner companies for possible impairment based on achievement of business plan objectives and milestones, the financial condition and prospects of the company, market conditions and other relevant factors. The business plan objectives and milestones we consider include, among others, those related to financial performance, such as achievement of planned financial results or completion of capital raising activities, and those that are not primarily financial in nature, such as hiring of key employees or the establishment of strategic relationships. We then determine whether there has been an other than temporary decline in the value of our ownership interest in the company. For our equity and cost method partner companies, impairment to be recognized is measured as the amount by which the carrying value of an asset exceeds its fair value. The adjusted carrying value of a partner company is not increased if circumstances suggest the value of the partner company has subsequently recovered.
23
The fair value of privately held partner companies is generally determined based on the value at which independent third parties have invested or have committed to invest in these companies, or based on other valuation methods including discounted cash flows, valuations of comparable public companies and valuations of acquisitions of comparable companies.
Our partner companies operate in industries which are rapidly evolving and extremely competitive. It is reasonably possible that our accounting estimates with respect to the ultimate recoverability of the carrying value of ownership interests in and advances to partner companies could change in the near term and that the effect of such changes on our Consolidated Financial Statements could be material. While we believe that the current recorded carrying values of our equity and cost method companies are not impaired, there can be no assurance that our future results will confirm this assessment or that a significant write-down or write-off will not be required in the future.
Total impairment charges related to ownership interests in and advances to our equity and cost method partner companies were as follows:
Year Ended December 31, | ||||||||||||
Accounting Method | 2017 | 2016 | 2015 | |||||||||
(In thousands) | ||||||||||||
Equity | $ | 15,993 | $ | 5,357 | $ | 9,690 | ||||||
Cost | 216 | 45 | 2,754 | |||||||||
Total | $ | 16,209 | $ | 5,402 | $ | 12,444 | ||||||
Impairment charges related to equity method partner companies are included in Equity income (loss) in the Consolidated Statements of Operations. Impairment charges related to cost method partner companies are included in Other income (loss), net in the Consolidated Statements of Operations.
In addition to ownership interests in our partner companies, we also maintain an interest in the management company and general partner of Penn Mezzanine, a mezzanine lender focused on lower middle-market, Mid-Atlantic companies. Through our relationship with Penn Mezzanine, we acquired participating interests in mezzanine loans and related equity interests of the borrowers. Penn Mezzanine is not making any new loans and we have no remaining loans in which we have participating interests. The carrying value of our remaining participating interests in debt and equity securities associated with Penn Mezzanine was zero as of December 31, 2017. During the years ended December 31, 2017 and 2016, we recognized a $0.4 million gain and a $2.4 million loss on impairment of our Penn Mezzanine debt and equity participations, which are included in Other income (loss), net in the Consolidated Statements of Operations.
Results of Operations
We operate as one operating segment based upon the similar nature of our technology-driven partner companies, the functional alignment of the organizational structure, and the reports that are regularly reviewed by the chief operating decision maker for the purpose of assessing performance and allocating resources.
There is intense competition in the markets in which our partner companies operate. Additionally, the markets in which these companies operate are characterized by rapidly changing technology, evolving industry standards, frequent introduction of new products and services, shifting distribution channels, evolving government regulation, frequently changing intellectual property landscapes and changing customer demands. Their future success depends on each company’s ability to execute its business plan and to adapt to its respective rapidly changing market.
As previously stated, throughout this document, we use the term “partner company” to generally refer to those companies in which we have an economic interest and in which we are actively involved influencing their development, usually through board representation in addition to our equity ownership.
The following listing of our partner companies only include entities which were considered partner companies as of December 31, 2017. Certain entities which may have been partner companies in previous periods are omitted if, as of December 31, 2017, they had been sold or are no longer considered a partner company.
24
Safeguard Primary Ownership as of December 31, | |||||||
Partner Company | 2017 | 2016 | 2015 | Accounting Method | |||
AdvantEdge Healthcare Solutions, Inc. | 40.1% | 40.1% | 40.1% | Equity | |||
Aktana, Inc. | 24.5% | 31.2% | NA | Equity | |||
Apprenda, Inc. | 29.3% | 29.4% | 29.5% | Equity | |||
Brickwork | 20.3% | 20.3% | NA | Equity | |||
Cask Data, Inc. | 31.2% | 31.3% | 34.2% | Equity | |||
CloudMine, Inc. | 47.3% | 30.1% | 30.1% | Equity | |||
Clutch Holdings, Inc. | 42.7% | 42.8% | 39.3% | Equity | |||
Hoopla Software, Inc. | 25.5% | 25.5% | 25.6% | Equity | |||
InfoBionic, Inc. | 39.5% | 39.7% | 38.5% | Equity | |||
Lumesis, Inc. | 43.8% | 44.1% | 44.7% | Equity | |||
MediaMath, Inc. | 20.5% | 20.5% | 20.6% | Equity | |||
meQuilibrium | 36.2% | 31.5% | 31.5% | Equity | |||
Moxe Health Corporation | 32.4% | 32.4% | NA | Equity | |||
NovaSom, Inc. | 31.7% | 31.7% | 31.7% | Equity | |||
Prognos (formerly Medivo) | 28.7% | 35.2% | 34.5% | Equity | |||
Propeller Health, Inc. | 24.0% | 24.0% | 24.6% | Equity | |||
QuanticMind, Inc. | 24.7% | 23.2% | 23.6% | Equity | |||
Sonobi, Inc. | 21.6% | 21.6% | 22.6% | Equity | |||
Spongecell, Inc. * | 23.0% | 23.0% | 23.0% | Equity | |||
Syapse, Inc. | 20.1% | 26.2% | 24.4% | Equity | |||
T-REX Group, Inc. | 21.1% | 23.6% | NA | Equity | |||
Transactis, Inc. | 23.8% | 24.2% | 24.5% | Equity | |||
Trice Medical, Inc. | 24.8% | 27.6% | 27.7% | Equity | |||
WebLinc, Inc. | 38.0% | 38.0% | 29.2% | Equity | |||
Zipnosis, Inc | 25.4% | 25.4% | 26.3% | Equity | |||
* Spongecell, Inc. merged into Flashtalking in January 2018.
Year ended December 31, 2017 versus year ended December 31, 2016
Year Ended December 31, | |||||||||||
2017 | 2016 | Variance | |||||||||
(In thousands) | |||||||||||
General and administrative expense | $ | (17,131 | ) | $ | (18,692 | ) | $ | 1,561 | |||
Other income (loss), net | (339 | ) | (1,682 | ) | 1,343 | ||||||
Interest income | 3,876 | 2,075 | 1,801 | ||||||||
Interest expense | (8,620 | ) | (4,634 | ) | (3,986 | ) | |||||
Equity income (loss) | (66,358 | ) | 671 | (67,029 | ) | ||||||
Net loss | $ | (88,572 | ) | $ | (22,262 | ) | $ | (66,310 | ) | ||
General and Administrative Expense. Our general and administrative expenses consist primarily of employee compensation, insurance, travel-related costs, depreciation, office rent and professional services such as consulting, legal, and accounting. General and administrative expense also includes stock-based compensation expense which consists primarily of expense related to grants of stock options, restricted stock and deferred stock units to our employees and directors. General and administrative expense decreased $1.6 million for the year ended December 31, 2017 compared to the prior year primarily due to a decrease of $1.2 million in stock-based compensation mostly related to performance-based awards and a $0.4 million decrease in professional fees.
Other Income (Loss), Net. Other income (loss), net decreased $1.3 million for the year ended December 31, 2017, compared to the prior year. The components of other income (loss) for the years ended December 31, 2017 and 2016 were as
25
follows:
Year ended December 31, 2017: | |||
Decrease in fair value of shares of Invitae Corporation | $ | (493 | ) |
Impairment of interest in legacy private equity fund | (216 | ) | |
Gain on legacy Penn Mezzanine debt and equity participations | 399 | ||
Loss on extinguishment of 2018 Debentures | (29 | ) | |
$ | (339 | ) | |
Year ended December 31, 2016: | |||
Loss on impairment of Penn Mezzanine debt and equity participations | $ | (2,360 | ) |
Gain on sale of Bridgevine | 424 | ||
Other | 254 | ||
$ | (1,682 | ) | |
Interest Income. Interest income includes all interest earned on available cash and marketable security balances as well as interest earned on notes receivable from our partner companies. Interest income increased $1.8 million compared to the prior year due to higher average notes receivable from our partner companies.
Interest Expense. Interest expense is primarily related to our credit facility and convertible senior debentures. Interest expense increased $4.0 million compared to the prior year primarily due to $4.4 million of interest expense related to borrowings under the new credit facility we entered into in May 2017, partially offset by a $0.4 million decrease in interest expense due to the repurchase of $14.0 million face value of convertible senior debentures in June and July 2017.
Equity Income (Loss). Equity income (loss) fluctuates with the number of partner companies accounted for under the equity method, our voting ownership percentage in these partner companies and the net results of operations of these partner companies. We recognize our share of losses to the extent we have cost basis in the equity of the partner company or we have outstanding commitments or guarantees. Certain amounts recorded to reflect our share of the income or losses of our partner companies accounted for under the equity method are based on estimates and on unaudited results of operations of those partner companies and may require adjustments in the future when audits of these entities are made final. We report our share of the results of our equity method partner companies on a one quarter lag basis.
Equity income (loss) decreased $67.0 million for the year ended December 31, 2017 compared to the prior year. The components of equity income (loss) for the years ended December 31, 2017 and 2016 were as follows:
Year ended December 31, 2017: | |||
Gain on sale of Good Start Genetics | $ | 4,250 | |
Gain on proceeds received from escrow related to sale of Putney | 704 | ||
Gain on proceeds received from escrow related to sale of Quantia | 600 | ||
Gain on proceeds received from escrow related to the sale of AppFirst assets | 141 | ||
Gain on sale of Nexxt (fka Beyond.com) | 108 | ||
Unrealized dilution gain on the decrease of our percentage ownership in partner companies | 5,877 | ||
Loss on impairment of Spongecell | (3,550 | ) | |
Loss on impairment of Pneuron | (5,189 | ) | |
Loss on impairment of Full Measure | (7,000 | ) | |
Share of loss of our equity method partner companies | (62,299 | ) | |
$ | (66,358 | ) | |
26
Year ended December 31, 2016: | |||
Gain on sale of Putney | $ | 55,638 | |
Gain on performance milestone proceeds related to sale of Thingworx | 3,264 | ||
Unrealized dilution gain on the decrease of our ownership percentage in partner companies | 2,038 | ||
Gain on proceeds received from escrow related to sale of DriveFactor | 1,100 | ||
Gain on proceeds received from escrow related to sale of Quantia | 600 | ||
Loss on impairment of AppFirst | (1,731 | ) | |
Loss on impairment of Aventura | (3,626 | ) | |
Share of net loss of our equity method partner companies | (56,612 | ) | |
$ | 671 | ||
The change in our share of net loss of our equity method partner companies for the year ended December 31, 2017 compared to the prior year was due to an increase in losses associated with our partner companies.
Year ended December 31, 2016 versus year ended December 31, 2015
Year Ended December 31, | |||||||||||
2016 | 2015 | Variance | |||||||||
(In thousands) | |||||||||||
General and administrative expense | $ | (18,692 | ) | $ | (17,554 | ) | $ | (1,138 | ) | ||
Other income (loss), net | (1,682 | ) | 217 | (1,899 | ) | ||||||
Interest income | 2,075 | 1,935 | 140 | ||||||||
Interest expense | (4,634 | ) | (4,523 | ) | (111 | ) | |||||
Equity loss | 671 | (39,599 | ) | 40,270 | |||||||
Net loss | $ | (22,262 | ) | $ | (59,524 | ) | $ | 37,262 | |||
General and Administrative Expense. General and administrative expense increased $1.1 million for the year ended December 31, 2016, compared to the prior year primarily due to an increase of $0.8 million in stock-based compensation for performance-based awards and an increase of $0.3 million in employee costs.
Other Income (Loss), Net. Other income (loss), net decreased $1.9 million for the year ended December 31, 2016, compared to the prior year. The components of other income (loss) for the years ended December 31, 2016 and 2015 were as follows:
Year ended December 31, 2016: | |||
Loss on impairment of Penn Mezzanine debt and equity participations | $ | (2,360 | ) |
Gain on sale of Bridgevine | 424 | ||
Other | 254 | ||
$ | (1,682 | ) | |
Year ended December 31, 2015: | |||
Gain on proceeds received from escrow related to sale of Crescendo | $ | 2,914 | |
Loss on impairment of Dabo Health | (2,356 | ) | |
Loss on impairment of legacy private equity fund | (398 | ) | |
Other | 57 | ||
$ | 217 | ||
Interest Income. Interest income remained relatively consistent compared to the prior year.
Interest Expense. Interest expense remained relatively consistent compared to the prior year.
27
Equity Income (Loss). Equity income (loss) increased $40.3 million for the year ended December 31, 2016 compared to the prior year. The components of equity income (loss) for the years ended December 31, 2016 and 2015 were as follows:
Year ended December 31, 2016: | |||
Gain on sale of Putney | $ | 55,638 | |
Gain on performance milestone proceeds related to sale of Thingworx | 3,264 | ||
Unrealized dilution gain on the decrease of our ownership percentage in partner companies | 2,038 | ||
Gain on proceeds received from escrow related to sale of DriveFactor | 1,100 | ||
Gain on proceeds received from escrow related to sale of Quantia | 600 | ||
Loss on impairment of AppFirst | (1,731 | ) | |
Loss on impairment of Aventura | (3,626 | ) | |
Share of net loss of our equity method partner companies | (56,612 | ) | |
$ | 671 | ||
Year ended December 31, 2015: | |||
Gain on sale of DriveFactor | $ | 6,095 | |
Gain on proceeds from escrow related to sale of Thingworx | 4,080 | ||
Gain on performance milestone proceeds related to sale of Thingworx | 3,264 | ||
Gain on proceeds received from escrow related to sale of Alverix | 1,741 | ||
Unrealized dilution loss on the decrease of our percentage ownership in partner companies | (492 | ) | |
Loss on impairment of Quantia | (2,920 | ) | |
Loss on impairment of InfoBionic | (3,162 | ) | |
Loss on impairment of AppFirst | (3,608 | ) | |
Share of net loss of our equity method partner companies | (44,597 | ) | |
$ | (39,599 | ) | |
The change in our share of net loss of our equity method partner companies for the year ended December 31, 2016 compared to the prior year was due to an increase in losses associated with our partner companies.
Income Tax Benefit (Expense)
Income tax benefit (expense) was $0.0 million for the three years ended December 31, 2017, 2016 and 2015. We have recorded a valuation allowance to reduce our net deferred tax asset to an amount that is more likely than not to be realized in future years. Accordingly, the benefit of the net operating loss that would have been recognized in each year was offset by changes in the valuation allowance.
Liquidity And Capital Resources
As of December 31, 2017, we had $20.7 million of cash and cash equivalents and $4.5 million of marketable securities for a total of $25.2 million. As of December 31, 2017, we had $41.0 million of principal outstanding on our 2018 Debentures, which we anticipate repaying or refinancing by the maturity date of May 15, 2018, and $50.0 million of principal outstanding on our Credit Facility due in May 2020. We currently have $25.0 million of availability under the Credit Facility.
In January 2018, Safeguard announced that, from that date forward, we will not deploy any capital into new partner company opportunities and will focus on supporting our existing partner companies and maximizing monetization opportunities for partner company interests to enable distributions of net proceeds to shareholders. In that context, we will consider initiatives including, among others: the sale of individual partner companies, the sale of certain partner company interests in secondary market transactions, or a combination thereof, as well as other opportunities to maximize shareholder value. We anticipate distributing to shareholders net proceeds from the sale of partner companies or partner company interests, as applicable, after satisfying our debt obligations and working capital needs. In connection with our change in strategy, in January 2018, we implemented an initiative to generate annual cost savings of between $5 million and $6 million, which reflect changes in our personnel and operating cost requirements under the new strategy. We will recognize a charge of approximately $1.3 million in the first quarter of 2018 for severance payments to terminated employees that will be paid over approximately twelve months.
28
In May 2017, the Company entered into a $75.0 million secured, revolving credit facility (“Credit Facility”) with HPS Investment Partners, LLC (“Lender”). As of December 31, 2017, we had $50.0 million of principal outstanding on the Credit Facility due in May 2020. The Credit Facility requires us to maintain (i) a liquidity threshold of at least $20 million of unrestricted cash; (ii) a tangible net worth, plus unrestricted cash, of at least 1.75x the amount then outstanding under the Credit Facility; (iii) a minimum aggregate appraised value of ownership interests in its partner companies, plus unrestricted cash in excess of the liquidity threshold, of at least $350 million; and (iv) certain diversification requirements and concentration limits with respect to its capital deployments to its partner companies. As of the date these consolidated financial statements were issued, we were in compliance with all of these covenants.
We fund our operations with cash and marketable securities on hand as well as proceeds from the sales of its interests in its partner companies. Due to the nature of the mergers and acquisitions market, and the developmental cycle of companies like our partner companies, our ability to generate specific amounts of liquidity from sales of its partner company interests in any given period of time cannot be assured. Accordingly, the forecasts which we utilize for projecting future compliance with covenants related to our Credit Facility include significantly discounted probability-weighted proceeds from the sales of our interests in our partner companies. Based on these forecasts, it is probable that we will not be able to remain in compliance with certain of our debt covenants over the next twelve months. Non-compliance with any of the covenants would constitute an event of default under the Credit Facility, and the Lender could choose to accelerate the maturity of the indebtedness. If the Lender chose not to provide a waiver and were to accelerate the maturity of the indebtedness, we would not have sufficient liquidity to repay the entire balance of our outstanding borrowings and other obligations under the Credit Facility. The uncertainty associated with our ability to repay our outstanding debt obligations in such a scenario raises substantial doubt about our ability to continue as a going concern for one year after the issuance date of the financial statements.
In order for us to maintain compliance with these covenants, our plan includes selling certain of our partner company interests in the ordinary course of our business, limiting capital deployments to existing partner companies, and refinancing all or a portion of our 2018 Debentures that mature on May 15, 2018. Should we not be in compliance with any of our debt covenants and be unable to obtain waivers for such events of default, management would pursue one of a number of potential alternatives to satisfy the obligations, including completing an equity offering or obtaining a new debt facility to refinance our existing debt.
In November 2012, we issued $55.0 million in face amount of our 5.25% convertible senior debentures due on May 15, 2018 (the "2018 Debentures"). Interest on the 2018 Debentures is payable semi-annually. At the debentures holders’ option, the 2018 Debentures are convertible into our common stock prior to November 15, 2017 subject to certain conditions, and at any time after November 15, 2017. The conversion rate of the 2018 Debentures is 55.17 shares of common stock per $1,000 principal amount of debentures, equivalent to a conversion price of approximately $18.13 per share of common stock. The closing price per share of our common stock at December 31, 2017 was $11.20. The 2018 Debentures holders have the right to require us to repurchase the 2018 Debentures if we undergo a fundamental change as defined in the debenture agreement, including the sale of all or substantially all of our common stock or assets, liquidation, or dissolution; a change in control; the delisting of our common stock from the New York Stock Exchange or the NASDAQ Global Market (or any of their respective successors); or a substantial change in the composition of our board of directors as defined in the agreement. On or after November 15, 2016, we may redeem for cash some or all of the debentures, subject to certain conditions. Upon any such redemption of the 2018 Debentures, we will pay a redemption price of 100% of their principal amount, plus accrued and unpaid interest. Upon the conversion of the 2018 Debentures we have the right to settle the conversion in stock, cash or a combination thereof.
In July and June 2017, we repurchased on the open market, and retired, an aggregate of $14.0 million face value of 2018 Debentures at a cost of $14.5 million, including transaction fees. In connection with the repurchase of these 2018 Debentures, we recognized a $0.8 million reduction in equity which is included in Accumulated Paid-In Capital in the Consolidated Balance Sheet as of December 31, 2017 and a $29 thousand loss on extinguishment of the liability which is included in Other income (loss), net in the Consolidated Statements of Operations for the twelve months ended December 31, 2017. We had $41.0 million face value of 2018 Debentures outstanding at December 31, 2017 due on May 15, 2018.
We have provided a $6.3 million letter of credit that is scheduled to expire on March 31, 2019 to the landlord of CompuCom Systems, Inc.’s Dallas headquarters which was required in connection with the sale of CompuCom Systems in 2004. The letter of credit is secured by cash which is classified as Long-term restricted cash equivalents on the Consolidated Balance Sheet. The restriction on the cash will lapse when the related letter of credit is terminated or expires on March 31, 2019.
In July 2015, the Company's Board of Directors authorized us, from time to time and depending on market conditions, to repurchase up to $25.0 million of the Company's outstanding common stock. During the years ended December 31, 2016 and 2015, we repurchased an aggregate of 0.7 million shares at an aggregate cost of $10.4 million with $14.6 million remaining for repurchase under the existing authorization.
29
We are required to return a portion or all the distributions we received as a general partner of a private equity fund for further distribution to such fund's limited partners (“clawback”). Our ownership in the fund is 19%. The clawback liability is joint and several, such that we may be required to fund the clawback for other general partners should they default. We believe our potential liability due to the possibility of default by other general partners is remote. We were notified by the fund's manager that the fund is being dissolved and $1.0 million of our clawback liability was paid in the first quarter of 2017. The maximum additional clawback liability is $0.3 million which was reflected in Other long-term liabilities on the Consolidated Balance Sheet at December 31, 2017.
Our ability to generate liquidity from sales of partner companies, sales of marketable securities and from equity and debt issuances has been adversely affected from time to time by adverse circumstances in the U.S. capital markets and other factors. The transactions we enter into in pursuit of our strategy could increase or decrease our liquidity at any point in time. As we seek to provide additional funding to existing partner companies or commit capital to other initiatives, we may be required to expend our cash or incur debt, which will decrease our liquidity. Conversely, as we dispose of our interests in partner companies from time to time, we may receive proceeds from such sales, which could increase our liquidity. From time to time, we are engaged in discussions concerning acquisitions and dispositions which, if consummated, could impact our liquidity, perhaps significantly.
Analysis of Consolidated Cash Flows
Cash flow activity was as follows:
Year Ended December 31, | |||||||||||
2017 | 2016 | 2015 | |||||||||
(In thousands) | |||||||||||
Net cash used in operating activities | $ | (20,805 | ) | $ | (18,661 | ) | $ | (17,749 | ) | ||
Net cash provided by (used in) investing activities | (10,127 | ) | 20,061 | (56,989 | ) | ||||||
Net cash provided by (used in) financing activities | 29,625 | (5,844 | ) | (4,321 | ) | ||||||
$ | (1,307 | ) | $ | (4,444 | ) | $ | (79,059 | ) | |||
Net Cash Used In Operating Activities
Year ended December 31, 2017 versus year ended December 31, 2016. Net cash used in operating activities increased by $2.1 million for the year ended December 31, 2017 compared to the prior year. The increase was primarily due to $2.5 million of cash interest payments related to our credit facility we entered into in May 2017, partially offset by a $0.4 million decrease in cash used in professional fees.
Year ended December 31, 2016 versus year ended December 31, 2015. Net cash used in operating activities increased $0.9 million in 2016 compared to the prior year. The increase was primarily related to an increase of $0.4 million in employee costs, an increase of $0.2 million in cash used for professional fees, and an increase of $0.1 million in cash paid for office rent.
Net Cash Provided by (Used In) Investing Activities
Year ended December 31, 2017 versus year ended December 31, 2016. Net cash provided by (used in) investing activities decreased by $30.2 million for the year ended December 31, 2017 compared to the prior year. The decrease primarily related to a $57.4 million decrease in proceeds from the sales of and distributions from companies and a $13.9 million decrease in cash proceeds from the net change in marketable securities, partially offset by a $37.3 million decrease in acquisitions of ownership interests in companies and a $3.4 million decrease in advances and loans to companies.
Cash proceeds from the sales of and distributions from companies were $16.6 million for the year ended December 31, 2017 which related primarily to:
• | In March 2017, we sold our interest in partner company Nexxt, Inc., formerly Beyond.com, back to Nexxt, Inc. for $26.0 million. We received $15.5 million in cash and a three-year, $10.5 million note for the balance due. In February 2018, Nexxt,Inc. repaid the $10.5 million note in full. |
• | In April 2017, we received $0.7 million in connection with the expiration of the final escrow period related to the 2016 sale of Putney, Inc. |
• | In March 2017, we received $0.6 million of proceeds from the sale of our participating interests in Penn Mezzanine. |
30
• | In January 2017, we received $0.6 million in connection with the expiration of the final escrow period related to the 2015 sale of Quantia. |
• | These cash proceeds were partially offset by payment of a $1.0 million clawback liability in the first quarter of 2017. |
Year ended December 31, 2016 versus year ended December 31, 2015. Net cash provided by (used in) investing activities increased by $77.1 million for the year ended December 31, 2016 compared to the prior year. The increase primarily related to a $48.9 million increase in proceeds from the sales of and distributions from companies. Cash proceeds from the sale of and distributions from companies was $74.0 million for the year ended December 31, 2016 which related to the sale of our interests in Putney and Bridgevine, proceeds received from AppFirst from the sale of its assets, cash received from escrow associated with the sale of our interests in DriveFactor, Thingworx, and Quantia and cash received associated with the achievement of performance milestones related to the sale of our interest in Thingworx. Cash proceeds from the sale of and distributions from companies was $25.1 million for the year ended December 31, 2015 which related to the sale of our interests in DriveFactor and Quantia, cash received from escrow associated with the sale of our interests in Crescendo Bioscience and Alverix, and cash received associated with the achievement of performance milestones related to the sale of our interest in Thingworx. The increase in cash provided by (used in) investing activities also related to a $21.2 million increase in cash proceeds from the net change in marketable securities, a $17.8 million decrease in acquisitions of ownership interests in companies, a $1.4 million decrease in capital expenditures, and a $0.4 million increase in repayments of advances and loans to companies which were partially offset by $12.8 million increase in advances and loans to companies.
Net Cash Provided by (Used In) Financing Activities
Year ended December 31, 2017 versus year ended December 31, 2016. Net cash provided by (used in) financing activities increased by $35.5 million for the year ended December 31, 2017 compared to the prior year. The increase was primarily related to $44.3 million of net proceeds from borrowings under the Credit Facility and a decrease of $5.4 million in repurchases of our common stock, which were partially offset by $14.5 million paid to repurchase and retire $14.0 million face value of the 2018 Debentures, including transaction fees.
Year ended December 31, 2016 versus year ended December 31, 2015. Net cash used in financing activities increased $1.5 million in 2016 compared to the prior year. The increase related to a decrease of $0.7 million in proceeds received from the exercise of stock options, an increase of $0.5 million in tax withholdings related to share-based payment awards and an increase of $0.4 million in repurchases of our common stock.
Contractual Cash Obligations and Other Commercial Commitments
The following table summarizes our contractual obligations and other commercial commitments as of December 31, 2017, by period due or expiration of the commitment.
Payments Due by Period | |||||||||||||||||||
Total | 2018 | 2019 and 2020 | 2021 and 2022 | After 2022 | |||||||||||||||
(In millions) | |||||||||||||||||||
Contractual Cash Obligations: | |||||||||||||||||||
Convertible senior debentures (a) | $ | 41.0 | $ | 41.0 | $ | — | $ | — | $ | — | |||||||||
Credit facility | 50.0 | — | 50.0 | — | — | ||||||||||||||
Interest payments on debt | 14.4 | 6.4 | 8.0 | — | — | ||||||||||||||
Operating leases (b) | 5.0 | 0.6 | 1.2 | 1.2 | 2.0 | ||||||||||||||
Potential clawback liabilities (c) | 0.3 | — | 0.3 | — | — | ||||||||||||||
Other long-term obligations (d) | 2.6 | 0.8 | 1.6 | 0.2 | — | ||||||||||||||
Total Contractual Cash Obligations | $ | 113.3 | $ | 48.8 | $ | 61.1 | $ | 1.4 | $ | 2.0 | |||||||||
Amount of Commitment Expiration by Period | |||||||||||||||||||
Total | 2018 | 2019 and 2020 | 2021 and 2022 | After 2022 | |||||||||||||||
(In millions) | |||||||||||||||||||
Other Commitments: | |||||||||||||||||||
Letters of credit (e) | $ | 6.3 | $ | — | $ | 6.3 | $ | — | $ | — | |||||||||
31
(a) | We have outstanding $41.0 million of our 5.25% convertible senior debentures due May 15, 2018. |
(b) | In 2015, we entered into an agreement for the lease of our principal executive offices which expires in April 2026. |
(c) | We are required to return a portion or all the distributions we received as a general partner of a private equity fund for further distribution to such fund's limited partners (“clawback”). Our ownership in the fund is 19%. The clawback liability is joint and several, such that we may be required to fund the clawback for other general partners should they default. We believe our potential liability due to the possibility of default by other general partners is remote. We were notified by the fund's manager that the fund is being dissolved and $1.0 million of our clawback liability was paid in the first quarter of 2017. The maximum clawback liability is $0.3 million which was reflected in Other long-term liabilities on the Consolidated Balance Sheets at December 31, 2017. |
(d) | Reflects the estimated amount payable to a former Chairman and CEO under an ongoing agreement. |
(e) | A $6.3 million letter of credit is provided to the landlord of CompuCom Systems' Dallas headquarters lease as required in connection with our sale of CompuCom Systems in 2004. The letter of credit is now secured by cash which is classified as Long-term restricted cash equivalents on the Consolidated Balance Sheet. |
In January 2018, we announced a change in strategy and we implemented an initiative to generate annual cost savings of between $5 million and $6 million. We will incur approximately $1.3 million of severance payments to terminated employees that will be paid over approximately twelve months. We have agreements with certain employees that provide for severance payments to the employee in the event the employee is terminated without cause or if the employee terminates his employment for “good reason.” The maximum aggregate cash exposure under severance agreements for employees who were not terminated in January 2018 in connection with the change in strategy was approximately $2.9 million at December 31, 2017.
We are involved in various claims and legal actions arising in the ordinary course of business. In the opinion of management, the ultimate disposition of these matters will not have a material adverse effect on our consolidated financial position or results of operations.
32
Item 7A. Quantitative and Qualitative Disclosures About Market Risk
Convertible Senior Debentures
At December 31, 2017, we had $41.0 million outstanding of our 5.25% convertible senior debentures due May 15, 2018.
Liabilities | 2018 | 2019 | 2020 | 2021 | 2022 | Thereafter | Total | Fair Value at December 31, 2017 | ||||||||||||||||||||||||
2018 Debentures due by year (in millions) | $ | 41.0 | $ | — | $ | — | $ | — | $ | — | $ | — | $ | 41.0 | $ | 41.6 | ||||||||||||||||
Fixed interest rate | 5.25 | % | 5.25 | % | ||||||||||||||||||||||||||||
Credit Facility
At December 31, 2017, we had $50.0 million outstanding on a $75.0 million secured, revolving Credit Facility with HPS Investment Partners, LLC. The Credit Facility bears interest at a rate of either: (A) LIBOR plus 8.5% (subject to a LIBOR floor of 1%), payable on the last day of the one, two or three month interest period applicable to the LIBOR rate advance, or (B) 7.5% plus the greater of: 2%; the Federal Funds Rate plus 0.5%; LIBOR plus 1%; or the U.S. Prime Rate, payable monthly in arrears. The Credit Facility is scheduled to mature on May 11, 2020.
33
Item 8. Financial Statements and Supplementary Data
The following Consolidated Financial Statements, and the related Notes thereto, of Safeguard Scientifics, Inc. and the Reports of Independent Registered Public Accounting Firm are filed as a part of this Form 10-K.
Page | |
34
Report of Independent Registered Public Accounting Firm
To the Shareholders and Board of Directors
Safeguard Scientifics, Inc.:
Opinion on Internal Control Over Financial Reporting
We have audited Safeguard Scientifics, Inc. and subsidiaries’ (the Company) internal control over financial reporting as of December 31, 2017, based on criteria established in Internal Control - Integrated Framework (2013) issued by the Committee of Sponsoring Organizations of the Treadway Commission. In our opinion, the Company maintained, in all material respects, effective internal control over financial reporting as of December 31, 2017, based on criteria established in Internal Control - Integrated Framework (2013) issued by the Committee of Sponsoring Organizations of the Treadway Commission.
We also have audited, in accordance with the standards of the Public Company Accounting Oversight Board (United States) (PCAOB), the consolidated balance sheets of the Company as of December 31, 2017 and 2016, the related consolidated statements of operations, comprehensive loss, changes in equity, and cash flows for each of the years in the three-year period ended December 31, 2017, and the related notes (collectively, the consolidated financial statements), and our report dated March 7, 2018 expressed an unqualified opinion on those consolidated financial statements.
Basis for Opinion
The Company’s management is responsible for maintaining effective internal control over financial reporting and for its assessment of the effectiveness of internal control over financial reporting, included in the accompanying Management’s Report on Internal Control Over Financial Reporting (Item 9A.(b)). Our responsibility is to express an opinion on the Company’s internal control over financial reporting based on our audit. We are a public accounting firm registered with the PCAOB and are required to be independent with respect to the Company in accordance with the U.S. federal securities laws and the applicable rules and regulations of the Securities and Exchange Commission and the PCAOB.
We conducted our audit in accordance with the standards of the PCAOB. Those standards require that we plan and perform the audit to obtain reasonable assurance about whether effective internal control over financial reporting was maintained in all material respects. Our audit of internal control over financial reporting included obtaining an understanding of internal control over financial reporting, assessing the risk that a material weakness exists, and testing and evaluating the design and operating effectiveness of internal control based on the assessed risk. Our audit also included performing such other procedures as we considered necessary in the circumstances. We believe that our audit provides a reasonable basis for our opinion.
Definition and Limitations of Internal Control Over Financial Reporting
A company’s internal control over financial reporting is a process designed to provide reasonable assurance regarding the reliability of financial reporting and the preparation of financial statements for external purposes in accordance with generally accepted accounting principles. A company’s internal control over financial reporting includes those policies and procedures that (1) pertain to the maintenance of records that, in reasonable detail, accurately and fairly reflect the transactions and dispositions of the assets of the company; (2) provide reasonable assurance that transactions are recorded as necessary to permit preparation of financial statements in accordance with generally accepted accounting principles, and that receipts and expenditures of the company are being made only in accordance with authorizations of management and directors of the company; and (3) provide reasonable assurance regarding prevention or timely detection of unauthorized acquisition, use, or disposition of the company’s assets that could have a material effect on the financial statements.
Because of its inherent limitations, internal control over financial reporting may not prevent or detect misstatements. Also, projections of any evaluation of effectiveness to future periods are subject to the risk that controls may become inadequate because of changes in conditions, or that the degree of compliance with the policies or procedures may deteriorate.
/s/ KPMG LLP
Philadelphia, Pennsylvania
March 7, 2018
35
Report of Independent Registered Public Accounting Firm
To the Shareholders and Board of Directors
Safeguard Scientifics, Inc.:
Opinion on the Consolidated Financial Statements
We have audited the accompanying consolidated balance sheets of Safeguard Scientifics, Inc. and subsidiaries (the Company) as of December 31, 2017 and 2016, the related consolidated statements of operations, comprehensive loss, changes in equity, and cash flows for each of the years in the three‑year period ended December 31, 2017, and the related notes (collectively, the consolidated financial statements). In our opinion, the consolidated financial statements present fairly, in all material respects, the financial position of the Company as of December 31, 2017 and 2016, and the results of its operations and its cash flows for each of the years in the three‑year period ended December 31, 2017, in conformity with U.S. generally accepted accounting principles.
We also have audited, in accordance with the standards of the Public Company Accounting Oversight Board (United States) (PCAOB), the Company’s internal control over financial reporting as of December 31, 2017, based on criteria established in Internal Control - Integrated Framework (2013) issued by the Committee of Sponsoring Organizations of the Treadway Commission, and our report dated March 7, 2018 expressed an unqualified opinion on the effectiveness of the Company’s internal control over financial reporting.
Going Concern
The accompanying consolidated financial statements have been prepared assuming that the Company will continue as a going concern. As discussed in Note 1 to the consolidated financial statements, based upon its projections, the Company will not be able to maintain compliance with certain of its debt covenants over the next twelve months. If the lender were to accelerate the maturity of the debt as a result of such non-compliance, the Company would not have sufficient liquidity to repay the entire balance of its outstanding debt. This raises substantial doubt about its ability to continue as a going concern. Management's plans in regard to these matters are also described in Note 1. The consolidated financial statements do not include any adjustments that might result from the outcome of this uncertainty.
Basis for Opinion
These consolidated financial statements are the responsibility of the Company’s management. Our responsibility is to express an opinion on these consolidated financial statements based on our audits. We are a public accounting firm registered with the PCAOB and are required to be independent with respect to the Company in accordance with the U.S. federal securities laws and the applicable rules and regulations of the Securities and Exchange Commission and the PCAOB.
We conducted our audits in accordance with the standards of the PCAOB. Those standards require that we plan and perform the audit to obtain reasonable assurance about whether the consolidated financial statements are free of material misstatement, whether due to error or fraud. Our audits included performing procedures to assess the risks of material misstatement of the consolidated financial statements, whether due to error or fraud, and performing procedures that respond to those risks. Such procedures included examining, on a test basis, evidence regarding the amounts and disclosures in the consolidated financial statements. Our audits also included evaluating the accounting principles used and significant estimates made by management, as well as evaluating the overall presentation of the consolidated financial statements. We believe that our audits provide a reasonable basis for our opinion.
/s/ KPMG LLP
We have served as the Company’s auditor since 1986.
Philadelphia, Pennsylvania
March 7, 2018
36
SAFEGUARD SCIENTIFICS, INC.
CONSOLIDATED BALANCE SHEETS
(In thousands, except per share data)
As of December 31, | |||||||
2017 | 2016 | ||||||
ASSETS | |||||||
Current Assets: | |||||||
Cash and cash equivalents | $ | 20,751 | $ | 22,058 | |||
Marketable securities | 4,452 | 8,384 | |||||
Trading securities | 3,761 | — | |||||
Prepaid expenses and other current assets | 4,644 | 2,109 | |||||
Total current assets | 33,608 | 32,551 | |||||
Property and equipment, net | 1,513 | 1,873 | |||||
Ownership interests in and advances to partner companies | 134,691 | 183,470 | |||||
Long-term marketable securities | — | 7,302 | |||||
Long-term restricted cash equivalents | 6,336 | 6,336 | |||||
Other assets | 316 | 296 | |||||
Total Assets | $ | 176,464 | $ | 231,828 | |||
LIABILITIES AND EQUITY | |||||||
Current Liabilities: | |||||||
Accounts payable | $ | 155 | $ | 140 | |||
Accrued compensation and benefits | 3,321 | 3,498 | |||||
Accrued expenses and other current liabilities | 1,851 | 2,223 | |||||
Convertible senior debentures - current | 40,485 | — | |||||
Total current liabilities | 45,812 | 5,861 | |||||
Other long-term liabilities | 3,535 | 3,630 | |||||
Credit facility | 45,321 | — | |||||
Convertible senior debentures - non-current | — | 52,560 | |||||
Total Liabilities | 94,668 | 62,051 | |||||
Commitments and contingencies | |||||||
Equity: | |||||||
Preferred stock, $0.10 par value; 1,000 shares authorized | — | — | |||||
Common stock, $0.10 par value; 83,333 shares authorized; 21,573 issued at December 31, 2017 and 2016, respectively | 2,157 | 2,157 | |||||
Additional paid-in capital | 812,536 | 816,016 | |||||
Treasury stock, at cost; 999 and 1,209 shares at December 31, 2017 and 2016, respectively | (17,308 | ) | (21,061 | ) | |||
Accumulated deficit | (715,476 | ) | (626,904 | ) | |||
Accumulated other comprehensive loss | (113 | ) | (431 | ) | |||
Total Equity | 81,796 | 169,777 | |||||
Total Liabilities and Equity | $ | 176,464 | $ | 231,828 | |||
See Notes to Consolidated Financial Statements.
37
SAFEGUARD SCIENTIFICS, INC.
CONSOLIDATED STATEMENTS OF OPERATIONS
(In thousands, except per share data)
Year Ended December 31, | |||||||||||
2017 | 2016 | 2015 | |||||||||
General and administrative expense | $ | 17,131 | $ | 18,692 | $ | 17,554 | |||||
Operating loss | (17,131 | ) | (18,692 | ) | (17,554 | ) | |||||
Other income (loss), net | (339 | ) | (1,682 | ) | 217 | ||||||
Interest income | 3,876 | 2,075 | 1,935 | ||||||||
Interest expense | (8,620 | ) | (4,634 | ) | (4,523 | ) | |||||
Equity income (loss) | (66,358 | ) | 671 | (39,599 | ) | ||||||
Net loss before income taxes | (88,572 | ) | (22,262 | ) | (59,524 | ) | |||||
Income tax benefit (expense) | — | — | — | ||||||||
Net loss | $ | (88,572 | ) | $ | (22,262 | ) | $ | (59,524 | ) | ||
Net loss per share: | |||||||||||
Basic | $ | (4.34 | ) | $ | (1.09 | ) | $ | (2.85 | ) | ||
Diluted | $ | (4.34 | ) | $ | (1.09 | ) | $ | (2.85 | ) | ||
Weighted average shares used in computing net loss per share: | |||||||||||
Basic | 20,430 | 20,343 | 20,874 | ||||||||
Diluted | 20,430 | 20,343 | 20,874 | ||||||||
See Notes to Consolidated Financial Statements.
38
SAFEGUARD SCIENTIFICS, INC.
CONSOLIDATED STATEMENTS OF COMPREHENSIVE LOSS
(In thousands)
Year Ended December 31, | |||||||||||
2017 | 2016 | 2015 | |||||||||
Net loss | $ | (88,572 | ) | $ | (22,262 | ) | $ | (59,524 | ) | ||
Other comprehensive income (loss): | |||||||||||
Share of other comprehensive income (loss) of equity method investments | 318 | (185 | ) | (246 | ) | ||||||
Total comprehensive loss | $ | (88,254 | ) | $ | (22,447 | ) | $ | (59,770 | ) | ||
See Notes to Consolidated Financial Statements.
39
SAFEGUARD SCIENTIFICS, INC.
CONSOLIDATED STATEMENTS OF CHANGES IN EQUITY
(In thousands)
Accumulated Other Comprehensive Loss | |||||||||||||||||||||||||||||
Accumulated Deficit | Common Stock | Additional Paid-In Capital | Treasury Stock | ||||||||||||||||||||||||||
Total | Shares | Amount | Shares | Amount | |||||||||||||||||||||||||
Balance — December 31, 2014 | $ | 257,827 | $ | (544,746 | ) | $ | — | 21,573 | $ | 2,157 | $ | 819,757 | 921 | $ | (19,341 | ) | |||||||||||||
Net loss | (59,524 | ) | (59,524 | ) | — | — | — | — | — | — | |||||||||||||||||||
Stock options exercised, net | 676 | — | — | — | — | (1,051 | ) | (83 | ) | 1,727 | |||||||||||||||||||
Issuance of restricted stock, net | 158 | — | — | — | — | (2,883 | ) | (149 | ) | 3,041 | |||||||||||||||||||
Stock-based compensation expense | 1,611 | — | — | — | — | 1,611 | — | — | |||||||||||||||||||||
Repurchase of common stock | (4,997 | ) | — | — | — | — | — | 304 | (4,997 | ) | |||||||||||||||||||
Other comprehensive loss | (246 | ) | — | (246 | ) | — | — | — | — | — | |||||||||||||||||||
Balance — December 31, 2015 | 195,505 | (604,270 | ) | (246 | ) | 21,573 | 2,157 | 817,434 | 993 | (19,570 | ) | ||||||||||||||||||
Net loss | (22,262 | ) | (22,262 | ) | — | — | — | — | — | — | |||||||||||||||||||
Stock options exercised, net of tax withholdings | (318 | ) | — | — | — | — | (1,117 | ) | (46 | ) | 799 | ||||||||||||||||||
Issuance of restricted stock, net of tax withholdings | 32 | — | — | — | — | (3,067 | ) | (162 | ) | 3,099 | |||||||||||||||||||
Stock-based compensation expense | 2,394 | — | — | — | — | 2,394 | — | — | |||||||||||||||||||||
Repurchase of common stock | (5,389 | ) | — | — | — | — | — | 424 | (5,389 | ) | |||||||||||||||||||
Cumulative effect adjustment (1) | — | (372 | ) | 372 | |||||||||||||||||||||||||
Other comprehensive loss | (185 | ) | — | (185 | ) | — | — | — | — | — | |||||||||||||||||||
Balance — December 31, 2016 | 169,777 | (626,904 | ) | (431 | ) | 21,573 | 2,157 | 816,016 | 1,209 | (21,061 | ) | ||||||||||||||||||
Net loss | (88,572 | ) | (88,572 | ) | — | — | — | — | — | — | |||||||||||||||||||
Stock options exercised, net of tax withholdings | (1 | ) | — | — | — | — | (97 | ) | (6 | ) | 96 | ||||||||||||||||||
Issuance of restricted stock, net of tax withholdings | (38 | ) | — | — | — | — | (3,695 | ) | (204 | ) | 3,657 | ||||||||||||||||||
Stock-based compensation expense | 1,138 | — | — | — | — | 1,138 | — | — | |||||||||||||||||||||
Repurchase of convertible senior debentures | (826 | ) | — | — | — | — | (826 | ) | — | — | |||||||||||||||||||
Other comprehensive income (loss) | 318 | — | 318 | — | — | — | — | — | |||||||||||||||||||||
Balance — December 31, 2017 | $ | 81,796 | $ | (715,476 | ) | $ | (113 | ) | 21,573 | $ | 2,157 | $ | 812,536 | 999 | $ | (17,308 | ) | ||||||||||||
(1) Cumulative effect adjustment reflects adoption of ASU 2016-09 as of January 1, 2016. | |||||||||||||||||||||||||||||
See Notes to Consolidated Financial Statements.
40
SAFEGUARD SCIENTIFICS, INC.
CONSOLIDATED STATEMENTS OF CASH FLOWS
(In thousands)
Year Ended December 31, | |||||||||||
2017 | 2016 | 2015 | |||||||||
Cash Flows from Operating Activities: | |||||||||||
Net loss | $ | (88,572 | ) | $ | (22,262 | ) | $ | (59,524 | ) | ||
Adjustments to reconcile to net cash used in operating activities: | |||||||||||
Depreciation | 322 | 328 | 190 | ||||||||
Amortization of debt discount | 2,542 | 1,604 | 1,472 | ||||||||
Equity (income) loss | 66,358 | (671 | ) | 39,599 | |||||||
Other (income) loss, net | 339 | 1,682 | (217 | ) | |||||||
Stock-based compensation expense | 1,138 | 2,394 | 1,611 | ||||||||
Changes in assets and liabilities: | |||||||||||
Accounts receivable, net | (3,560 | ) | (1,521 | ) | (923 | ) | |||||
Accounts payable, accrued expenses, and other | 628 | (215 | ) | 43 | |||||||
Net cash used in operating activities | (20,805 | ) | (18,661 | ) | (17,749 | ) | |||||
Cash Flows from Investing Activities: | |||||||||||
Acquisitions of ownership interests in companies | (15,101 | ) | (52,431 | ) | (70,186 | ) | |||||
Proceeds from sales of and distributions from companies | 16,604 | 73,965 | 25,058 | ||||||||
Advances and loans to companies | (22,867 | ) | (27,967 | ) | (15,208 | ) | |||||
Repayment of advances and loans to companies | — | 1,741 | 1,318 | ||||||||
Increase in marketable securities | — | (21,194 | ) | (29,755 | ) | ||||||
Decrease in marketable securities | 11,237 | 46,315 | 33,640 | ||||||||
Capital expenditures | — | (432 | ) | (1,856 | ) | ||||||
Other, net | — | 64 | — | ||||||||
Net cash provided by (used in) investing activities | (10,127 | ) | 20,061 | (56,989 | ) | ||||||
Cash Flows from Financing Activities: | |||||||||||
Proceeds from credit facility | 50,000 | — | — | ||||||||
Issuance costs of credit facility | (5,696 | ) | — | — | |||||||
Repurchase of convertible senior debentures | (14,455 | ) | — | — | |||||||
Tax withholdings related to equity-based awards | (223 | ) | (460 | ) | — | ||||||
Issuance of Company common stock, net | (1 | ) | 5 | 676 | |||||||
Repurchase of Company common stock | — | (5,389 | ) | (4,997 | ) | ||||||
Net cash provided by (used in) financing activities | 29,625 | (5,844 | ) | (4,321 | ) | ||||||
Net change in cash, cash equivalents and restricted cash equivalents | (1,307 | ) | (4,444 | ) | (79,059 | ) | |||||
Cash, cash equivalents and restricted cash equivalents at beginning of period | 28,394 | 32,838 | 111,897 | ||||||||
Cash, cash equivalents and restricted cash equivalents at end of period | $ | 27,087 | $ | 28,394 | $ | 32,838 | |||||
See Notes to Consolidated Financial Statements.
41
1. General
Liquidity And Capital Resources
As of December 31, 2017, Safeguard ("the Company") had $20.7 million of cash and cash equivalents and $4.5 million of marketable securities for a total of $25.2 million. As of December 31, 2017, the Company had $41.0 million of principal outstanding on our 2018 Debentures, which the Company anticipates repaying or refinancing by the maturity date of May 15, 2018, and $50.0 million of principal outstanding on its Credit Facility due in May 2020. The Company currently has $25.0 million of availability under the Credit Facility.
In January 2018, Safeguard announced that, from that date forward, we will not deploy any capital into new partner company opportunities and will focus on supporting our existing partner companies and maximizing monetization opportunities for partner company interests to enable distributions of net proceeds to shareholders. In that context, we will consider initiatives including, among others: the sale of individual partner companies, the sale of certain partner company interests in secondary market transactions, or a combination thereof, as well as other opportunities to maximize shareholder value. We anticipate distributing to shareholders net proceeds from the sale of partner companies or partner company interests, as applicable, after satisfying our debt obligations and working capital needs. In connection with our change in strategy, in January 2018, we implemented an initiative to generate annual cost savings of between $5 million and $6 million, which reflect changes in our personnel and operating cost requirements under the new strategy. We will recognize a charge of approximately $1.3 million in the first quarter of 2018 for severance payments to terminated employees that will be paid over approximately twelve months.
In May 2017, the Company entered into a $75.0 million secured, revolving credit facility (“Credit Facility”) with HPS Investment Partners, LLC (“Lender”). As of December 31, 2017, the Company had $50.0 million of principal outstanding on the Credit Facility due in May 2020. The Credit Facility requires the Company to maintain (i) a liquidity threshold of at least $20 million of unrestricted cash; (ii) a tangible net worth, plus unrestricted cash, of at least 1.75x the amount then outstanding under the Credit Facility; (iii) a minimum aggregate appraised value of ownership interests in its partner companies, plus unrestricted cash in excess of the liquidity threshold, of at least $350 million; and (iv) certain diversification requirements and concentration limits with respect to its capital deployments to its partner companies. As of the date these consolidated financial statements were issued, the Company was in compliance with all of these covenants.
The Company funds its operations with cash and marketable securities on hand as well as proceeds from the sales of its interests in its partner companies. Due to the nature of the mergers and acquisitions market, and the developmental cycle of companies like the Company's partner companies, the Company's ability to generate specific amounts of liquidity from sales of its partner company interests in any given period of time cannot be assured. Accordingly, the forecasts which the Company utilizes for projecting future compliance with covenants related to its Credit Facility include significantly discounted probability-weighted proceeds from the sales of its interests in its partner companies. Based on these forecasts, it is probable that the Company will not be able to remain in compliance with certain of its debt covenants over the next twelve months. Non-compliance with any of the covenants would constitute an event of default under the Credit Facility, and the Lender could choose to accelerate the maturity of the indebtedness. If the Lender chose not to provide a waiver and were to accelerate the maturity of the indebtedness, the Company would not have sufficient liquidity to repay the entire balance of its outstanding borrowings and other obligations under the Credit Facility. The uncertainty associated with the Company’s ability to repay its outstanding debt obligations in such a scenario raises substantial doubt about its ability to continue as a going concern for one year after the issuance date of the financial statements.
In order for the Company to maintain compliance with these covenants, the Company's plan includes selling certain of its partner company interests in the ordinary course of its business, limiting capital deployments to existing partner companies, and refinancing all or a portion of its 2018 Debentures that mature on May 15, 2018. Should the Company not be in compliance with any of its debt covenants and be unable to obtain waivers for such events of default, management would pursue one of a number of potential alternatives to satisfy the obligations, including completing an equity offering or obtaining a new debt facility to refinance its existing debt.
Significant Accounting Policies
Principles of Consolidation
The consolidated financial statements include the accounts of Safeguard and all of its subsidiaries in which a controlling financial interest is maintained. All intercompany accounts and transactions are eliminated in consolidation.
42
SAFEGUARD SCIENTIFICS, INC.
NOTES TO CONSOLIDATED FINANCIAL STATEMENTS – (Continued)
Principles of Accounting for Ownership Interests in Companies
The Company accounts for its interests in its partner companies using one of the following methods: consolidation, fair value, equity or cost. The accounting method applied is generally determined by the degree of the Company's influence over the entity, primarily determined by our voting interest in the entity.
In addition to holding voting and non-voting equity and debt securities, the Company also periodically makes advances to its partner companies in the form of promissory notes which are included in the Ownership interests in and advances to partner companies line item in the Consolidated Balance Sheets.
Consolidation Method. The Company generally accounts for partner companies in which it directly or indirectly owns more than 50% of the outstanding voting securities under the consolidation method of accounting. Under this method, the Company includes the partner companies’ financial statements within the Company’s Consolidated Financial Statements, and all significant intercompany accounts and transactions are eliminated. The Company reflects participation of other stockholders in the net assets and in the income or losses of these consolidated partner companies in Equity in the Consolidated Balance Sheets and in Net income (loss) attributable to non-controlling interest in the Statements of Operations. Net income (loss) attributable to non-controlling interest adjusts the Company’s consolidated operating results to reflect only the Company’s share of the earnings or losses of the consolidated partner company. The Company accounts for results of operations and cash flows of a consolidated partner company through the latest date in which it holds a controlling interest. If the Company subsequently relinquishes control but retains an interest in the partner company, the accounting method is adjusted to the equity, cost or fair value method of accounting, as appropriate. As of December 31, 2017, the Company did not hold a controlling interest in any of its partner companies.
Fair Value Method. Unrealized gains and losses on the mark-to-market of the Company's holdings in fair value method companies and realized gains and losses on the sale of any holdings in fair value method companies are recognized in Other income (loss), net in the Consolidated Statements of Operations. As of December 31, 2017, the Company did not account for any of its partner companies under the fair value method.
Equity Method. The Company accounts for partner companies whose results are not consolidated, but over which it exercises significant influence, under the equity method of accounting. Whether or not the Company exercises significant influence with respect to a partner company depends on an evaluation of several factors including, among others, representation of the Company on the partner company’s board of directors and the Company’s ownership level, which is generally a 20% to 50% interest in the voting securities of a partner company, including voting rights associated with the Company’s holdings in common, preferred and other convertible instruments in the company. Under the equity method of accounting, the Company does not reflect a partner company’s financial statements within the Company’s Consolidated Financial Statements; however, the Company’s share of the income or loss of such partner company is reflected in Equity income (loss) in the Consolidated Statements of Operations. The Company includes the carrying value of equity method partner companies in Ownership interests in and advances to partner companies on the Consolidated Balance Sheets. Any excess of the Company’s cost over its underlying interest in the net assets of equity method partner companies that is allocated to intangible assets is amortized over the estimated useful lives of the related intangible assets. The Company reflects its share of the income or loss of the equity method partner companies on a one quarter lag. This reporting lag could result in a delay in recognition of the impact of changes in the business or operations of these partner companies.
When the Company’s carrying value in an equity method partner company is reduced to zero, the Company records no further losses in its Consolidated Statements of Operations unless the Company has an outstanding guarantee obligation or has committed additional funding to such equity method partner company. When such equity method partner company subsequently reports income, the Company will not record its share of such income until it exceeds the amount of the Company’s share of losses not previously recognized.
Cost Method. The Company accounts for partner companies not consolidated or accounted for under the equity method or fair value method under the cost method of accounting. Under the cost method, the Company does not include its share of the income or losses of partner companies in the Company’s Consolidated Statements of Operations. The Company includes the carrying value of cost method partner companies in Ownership interests in and advances to partner companies on the Consolidated Balance Sheets.
Accounting Estimates
The preparation of the Consolidated Financial Statements in accordance with accounting principles generally accepted in the United States of America requires management to make estimates and judgments that affect amounts reported in the financial statements and accompanying notes. Actual results may differ from these estimates. These estimates include the
43
SAFEGUARD SCIENTIFICS, INC.
NOTES TO CONSOLIDATED FINANCIAL STATEMENTS – (Continued)
evaluation of the recoverability of the Company’s ownership interests in and advances to partner companies, income taxes, stock-based compensation and commitments and contingencies. Management evaluates its estimates on an ongoing basis using historical experience and other factors, including the current economic environment, which management believes to be reasonable under the circumstances.
Certain amounts recorded to reflect the Company’s share of income or losses of partner companies accounted for under the equity method are based on unaudited results of operations of those companies and may require adjustments in the future when audits of these entities’ financial statements are completed.
It is reasonably possible that the Company’s accounting estimates with respect to the ultimate recoverability of the carrying value of the Company’s ownership interests in and advances to partner companies could change in the near term and that the effect of such changes on the financial statements could be material. At December 31, 2017, the Company believes the carrying value of the Company’s ownership interests in and advances to partner companies is not impaired, although there can be no assurance that the Company’s future results will confirm this assessment, that a significant write-down or write-off will not be required in the future or that a significant loss will not be recorded in the future upon the sale of a company.
Cash and Cash Equivalents and Marketable Securities
The Company considers all highly liquid instruments with an original maturity of 90 days or less at the time of purchase to be cash equivalents. Cash and cash equivalents consist of deposits that are readily convertible into cash. The Company determines the appropriate classification of marketable securities at the time of purchase and reevaluates such designation as of each balance sheet date. Held-to-maturity securities are carried at amortized cost, which approximates fair value. Marketable securities consist of held-to-maturity securities, primarily consisting of government agency bonds, commercial paper and certificates of deposits. Marketable securities with a maturity date greater than one year from the balance sheet date are considered long-term. The Company has not experienced any significant losses on cash equivalents and does not believe it is exposed to any significant credit risk on cash and cash equivalents.
Restricted Cash Equivalents
Restricted cash equivalents consist of certificates of deposit with various maturity dates. Amounts included in restricted cash equivalents represent those required to be set aside by a contractual agreement with a bank as collateral for a letter of credit. The restriction on the cash will lapse when the related letter of credit is terminated or expires on March 19, 2019. The following table provides a reconciliation of cash, cash equivalents and restricted cash equivalents reported within the Consolidated Balance Sheets that sum to the total of the same such amounts shown in the Consolidated Statements of Cash Flows:
December 31, 2017 | December 31, 2016 | ||||||
(In thousands) | |||||||
Cash and cash equivalents | $ | 20,751 | $ | 22,058 | |||
Long-term restricted cash equivalents | 6,336 | 6,336 | |||||
Total cash, cash equivalents and restricted cash equivalents | $ | 27,087 | $ | 28,394 | |||
Financial Instruments
The Company’s financial instruments (principally cash and cash equivalents, marketable securities, accounts receivable, notes receivable, accounts payable and accrued expenses) are carried at cost, which approximates fair value due to the short-term maturity of these instruments. The Company’s long-term debt is carried at cost.
Impairment of Ownership Interests In and Advances to Partner Companies
On a periodic basis, but no less frequently than quarterly, the Company evaluates the carrying value of its equity and cost method partner companies for possible impairment based on achievement of business plan objectives and milestones, the fair value of each partner company relative to its carrying value, the financial condition and prospects of the partner company and other relevant factors. The business plan objectives and milestones the Company considers include, among others, those related to financial performance, such as achievement of planned financial results or completion of capital raising activities, and those that are not primarily financial in nature, such as hiring of key employees or the establishment of strategic relationships. Management then determines whether there has been an other than temporary decline in the value of its ownership interest in the company. Impairment is measured as the amount by which the carrying value of an asset exceeds its fair value.
44
SAFEGUARD SCIENTIFICS, INC.
NOTES TO CONSOLIDATED FINANCIAL STATEMENTS – (Continued)
The fair value of privately held companies is generally determined based on the value at which independent third parties have invested or have committed to invest in these companies or based on other valuation methods, including discounted cash flows, valuation of comparable public companies and the valuation of acquisitions of similar companies.
Impairment charges related to equity method partner companies are included in Equity income (loss) in the Consolidated Statements of Operations. Impairment charges related to cost method partner companies and funds are included in Other income (loss), net in the Consolidated Statements of Operations.
The reduced cost basis of a previously impaired partner company is not written-up if circumstances suggest the value of the company has subsequently recovered.
Income Taxes
The Company accounts for income taxes under the asset and liability method whereby deferred tax assets and liabilities are recognized for the estimated future tax consequences attributable to differences between the financial statement carrying amounts of existing assets and liabilities and their respective tax bases. The Company measures deferred tax assets and liabilities using enacted tax rates in effect for the year in which the temporary differences are expected to be recovered or settled. The Company recognizes the effect on deferred tax assets and liabilities of a change in tax rates in income in the period of the enactment date. The Company provides a valuation allowance against the net deferred tax asset for amounts which are not considered more likely than not to be realized.
Net Income (Loss) Per Share
The Company computes net income (loss) per share using the weighted average number of common shares outstanding during each year. The Company includes in diluted net income (loss) per share common stock equivalents (unless anti-dilutive) which would arise from the exercise of stock options and conversion of other convertible securities and adjusted, if applicable, for the effect on net income (loss) of such transactions. Diluted net income (loss) per share calculations adjust net income (loss) for the dilutive effect of common stock equivalents and convertible securities issued by the Company’s consolidated or equity method partner companies.
Segment Information
The Company operates as one operating segment based upon the similar nature of its technology-driven partner companies, the functional alignment of the organizational structure, and the reports that are regularly reviewed by the chief operating decision maker for the purpose of assessing performance and allocating resources.
Recent Accounting Pronouncements
In May 2014, the Financial Accounting Standards Board ("FASB") issued Accounting Standards Update ("ASU") No. 2014-09, Revenue from Contracts with Customers (Topic 606) ("ASU 2014-09"). ASU 2014-09 and related subsequent amendments outline a single comprehensive model to use to account for revenue arising from contracts with customers and supersede most current revenue recognition guidance. For public companies, the guidance is effective for annual periods beginning after December 15, 2017 and any interim periods that fall within that reporting period. For nonpublic companies, the guidance is effective for annual periods beginning after December 15, 2018 and interim periods within annual periods beginning after December 15, 2019 with early adoption permitted. As the new standard will supersede most existing revenue guidance, it could impact revenue and cost recognition for partner companies. Any change in revenue or cost recognition for partner companies could affect the Company's recognition of its share of the results of its equity method partner companies. On July 20, 2017, the SEC staff observer at the FASB’s Emerging Issues Task Force ("EITF") meeting announced that the SEC staff will not object if a private company equity method investee meeting the definition of a public business entity that otherwise would not meet the definition of a public business entity except for the inclusion of its financial statements or financial information in another entity’s filings with the SEC, uses private company adoption dates for the new revenue standard. As a result, the Company's private, calendar year partner companies will adopt the new revenue standard for the year ending December 31, 2019. The impact of adoption of the new revenue standard will be reflected in the Company’s financial results for the interim and annual reporting periods beginning in 2020 on a one quarter-lag basis.
In January 2016, the FASB issued ASU 2016-01, Recognition and Measurement of Financial Assets and Financial Liabilities. ASU 2016-01 requires that equity investments (except those accounted for under the equity method of accounting or those that result in consolidation of the investee) are to be measured at fair value with changes in fair value recognized in net income. However, an entity may choose to measure equity investments that do not have readily determinable fair values at cost minus impairment, if any, plus or minus changes resulting from observable price changes in orderly transactions for the
45
SAFEGUARD SCIENTIFICS, INC.
NOTES TO CONSOLIDATED FINANCIAL STATEMENTS – (Continued)
identical or a similar investment of the same issuer. Furthermore, equity investments without readily determinable fair values are to be assessed for impairment using a quantitative approach. The amendments in ASU 2016-01 should be applied by means of a cumulative-effect adjustment to the balance sheet as of the beginning of the fiscal year of adoption, with other amendments related specifically to equity securities without readily determinable fair values applied prospectively. The amendments in ASU 2016-01 will become effective for the Company on January 1, 2018. The adoption of this guidance is not expected to have a material impact upon the Company's financial condition or results of operations.
In February 2016, the FASB issued ASU 2016-02, Leases. The guidance in ASU 2016-02 requires that a lessee recognize in the statement of financial position a liability to make lease payments (the lease liability) and a right-of-use asset representing its right to use the underlying asset for the lease term. For leases with a term of 12 months or less, a lessee is permitted to make an accounting policy election by class of underlying asset not to recognize lease assets and lease liabilities. As with previous guidance, there continues to be a differentiation between finance leases and operating leases, however this distinction now primarily relates to differences in the manner of expense recognition over time and in the classification of lease payments in the statement of cash flows. Lease assets and liabilities arising from both finance and operating leases will be recognized in the statement of financial position. The transitional guidance for adopting the requirements of ASU 2016-02 calls for a modified retrospective approach that includes a number of optional practical expedients that entities may elect to apply. The guidance in ASU 2016-02 will become effective for the Company on January 1, 2019. The Company anticipates making the accounting policy election not to recognize lease assets and lease liabilities for leases with a term of 12 months or less. As of December 31, 2017, the Company's only material long-term lease was for its corporate headquarters in Radnor, PA under a lease expiring in 2026. The Company also has immaterial office equipment leases expiring at various dates through 2020. The Company is currently evaluating the impact that the adoption of ASU 2016-02 will have on its consolidated financial statements.
2. Ownership Interests in and Advances to Partner Companies
The following summarizes the carrying value of the Company’s ownership interests in and advances to partner companies.
December 31, 2017 | December 31, 2016 | ||||||
(In thousands) | |||||||
Equity Method: | |||||||
Partner companies | $ | 107,646 | $ | 154,219 | |||
Private equity funds | 443 | 447 | |||||
108,089 | 154,666 | ||||||
Cost Method: | |||||||
Partner companies | 2,762 | 2,112 | |||||
Private equity funds | 1,334 | 1,550 | |||||
4,096 | 3,662 | ||||||
Advances to partner companies | 22,506 | 25,142 | |||||
$ | 134,691 | $ | 183,470 | ||||
In August 2017, Good Start Genetics, Inc. was acquired by Invitae Corporation ("Invitae"). The Company received 414,237 shares of Invitae common stock in connection with the transaction, excluding 124,092 shares of Invitae common stock which will be held in escrow until August 2018. The Company recognized a net gain of $3.8 million on the transaction for the year ended December 31, 2017. The Invitae shares are classified as Trading securities and recorded at fair value on the Consolidated Balance Sheet at December 31, 2017. In February 2018, the Company sold 414,237 shares of Invitae common stock on the open market for proceeds of $2.6 million after transaction fees.
In March 2017, the Company sold its interest in partner company Nexxt, Inc., formerly Beyond.com, back to Nexxt, Inc. for $26.0 million. The Company received $15.5 million in cash and a three-year, $10.5 million note for the balance due, which accrues interest at a rate of 9.5% per annum. The receipt of the $15.5 million in cash resulted in a gain of $0.1 million which is included in Equity income (loss) in the Consolidated Statements of Operations for the nine months ended September 30, 2017. The $10.5 million note was fully reserved and has a carrying value of zero as of December 31, 2017. In February 2018, Nexxt,Inc. repaid the $10.5 million note in full. A gain will be recorded in the first quarter of 2018.
The Company recognized an impairment charge of $7.0 million related to Full Measure, Inc. which is reflected in Equity income (loss) in the Consolidated Statements of Operations for the year ended December 31, 2017. The impairment was based
46
SAFEGUARD SCIENTIFICS, INC.
NOTES TO CONSOLIDATED FINANCIAL STATEMENTS – (Continued)
on the Company’s decision not to continue to provide additional capital in the absence of significant additional capital raised from new investors. The adjusted carrying value of the Company's interest in Full Measure was $0.0 million at December 31, 2017.
The Company recognized an impairment charge of $3.6 million related to Spongecell, Inc. which is reflected in Equity income (loss) in the Consolidated Statements of Operations for the year ended December 31, 2017. The adjusted carrying value of the Company's interest in Spongecell was $6.0 million at December 31, 2017. Subsequent to year end, Spongecell merged into Flashtalking, a privately-held company, and the Company received shares equal to approximately 10% of Flashtalking’s issued share capital at the time of the closing.
The Company recognized impairment charges totaling $5.2 million related to Pneuron, Inc. which is reflected in Equity income (loss) in the Consolidated Statements of Operations for the year ended December 31, 2017. Pneuron has ceased business operations and the adjusted carrying value of the Company's interest in Pneuron is $0.0 million at December 31, 2017.
In April 2016, Putney, Inc. was acquired by Dechra Pharmaceuticals Plc. The Company received $58.6 million in initial cash proceeds and $0.6 million from escrow during 2017. The Company recognized gains of $55.6 million and $0.6 million on the transaction, which were included in Equity income (loss) in the Consolidated Statements of Operations for the years ended December 31, 2016 and 2017, respectively.
The Company recognized an impairment charge of $3.6 million related to Aventura, Inc. which is reflected in Equity income (loss) in the Consolidated Statements of Operations for the year ended December 31, 2016. The adjusted carrying value of the Company's interest in Aventura was $0.0 million at December 31, 2017.
The Company recognized a $0.4 million gain and a $2.4 million loss on impairment related to its Penn Mezzanine debt and equity participations which is reflected in Other income (loss), net in the Consolidated Statements of Operations for the years ended December 31, 2017 and 2016, respectively. The carrying value of our remaining participating interests in debt and equity securities associated with Penn Mezzanine was $0.0 million and $0.2 million as of December 31, 2017 and 2016, respectively.
The Company recognized a impairment charges of $1.7 million and $3.6 million related to AppFirst, Inc. which is reflected in Equity income (loss) in the Consolidated Statements of Operations for the years ended December 31, 2016 and 2015, respectively. Appfirst's assets were sold in 2016.
In June 2016, the Company sold its ownership interests in Bridgevine, Inc. The Company received cash proceeds of $5.0 million and recognized a gain of $0.4 million on the transaction which is included in Other income (loss), net in the Consolidated Statements of Operations for the year ended December 31, 2016.
In April 2015, DriveFactor, Inc. was acquired by CCC Information Services, Inc. The Company received $9.1 million in initial cash proceeds in connection with the transaction. The Company recognized a gain of $6.1 million on the transaction, which is included in Equity income (loss) in the Consolidated Statements of Operations for the year ended December 31, 2015. In April 2016, the Company received an additional $1.1 million which was released from escrow resulting in a gain of $1.1 million which is included in Equity income (loss) in the Consolidated Statements of Operations for the year ended December 31, 2016.
In April 2016, the Company received $3.3 million associated with the achievement of the final performance milestone related to the December 2013 sale of ThingWorx, Inc. to PTC, Inc., resulting in a gain of $3.3 million which is included in Equity income (loss) in the Consolidated Statements of Operations for the year ended December 31, 2016. In January 2016, the Company received $4.1 million which was released from escrow resulting in a gain of $4.1 million which is included in Equity income (loss), net in the Consolidated Statements of Operations for the year ended December 31, 2015. In July 2015, the Company received $3.3 million associated with the achievement of performance milestones, resulting in a gain of $3.3 million which is included in Equity income (loss), net in the Consolidated Statements of Operations for the year ended December 31, 2015.
In July 2015, Quantia, Inc. was acquired by Physicians Interactive. The Company received $7.8 million in initial cash proceeds in connection with the transaction. In July 2016, the Company received an additional $0.6 million which was released from escrow resulting in a gain of $0.6 million which is included in Equity income (loss) in the Consolidated Statements of Operations for the year ended December 31, 2016. The Company also recognized an impairment charge of $2.9 million related to Quantia in 2015 which is reflected in Equity income (loss) in the Consolidated Statements of Operations for the year ended December 31, 2015. The impairment was based on the difference between the Company's carrying value in Quantia and the initial net proceeds received in July 2015.
In July 2015, the Company received $1.7 million in connection with the expiration of the escrow period related to the January 2014 sale of Alverix, Inc. to Becton, Dickinson and Company, resulting in a gain of $1.7 million which is included in Equity income (loss), net in the Consolidated Statements of Operations for the year ended December 31, 2015.
47
SAFEGUARD SCIENTIFICS, INC.
NOTES TO CONSOLIDATED FINANCIAL STATEMENTS – (Continued)
In July and March 2015, the Company received an aggregate $2.9 million in connection with the expiration of the escrow period related to the February 2014 sale of Crescendo Bioscience, Inc. to Myriad Genetics, Inc., resulting in a gain of $2.9 million which is included in Other income (loss), net in the Consolidated Statements of Operations for the year ended December 31, 2015.
The Company recognized an impairment charge of $3.2 million related to InfoBionic, Inc. in 2015 which is reflected in Equity income (loss) in the Consolidated Statements of Operations for the year ended December 31, 2015. The impairment was due to discontinuation of InfoBionic's first-generation product. The amount of the impairment was determined based on the value at which InfoBionic raised additional equity financing in July 2015 from the Company and other existing capital providers.
The Company recognized an impairment charge of $2.3 million related to Dabo Health, Inc. in 2015 which is reflected in Other income (loss), net in the Consolidated Statements of Operations for the year ended December 31, 2015. The impairment was based on the decision of the Company and other shareholders not to continue to fund Dabo Health's operations.
Summarized Financial Information for Partner Companies
The Company categorizes its partner companies into four stages based upon revenue generation—Development Stage, Initial Revenue Stage, Expansion Stage and, High Traction Stage. The Development Stage is made up of those companies that are pre-revenue businesses. The Company currently has no partner companies in the Development Stage. The Initial Revenue Stage is made up of businesses that have revenues of $5 million or less. The Expansion Stage is made up of companies that have revenue in the range of $5 million to $20 million. The High Traction Stage is made up of companies that have revenue in excess of $20 million per year. See Note 14 to the Consolidated Financial Statements for a listing of partner companies in which the Company held an ownership interest as of December 31, 2017 and their respective revenue stages.
The following summarized financial information by revenue stage for partner companies accounted for under the equity method for the periods presented has been compiled from respective partner company financial statements, reflect certain historical adjustments, and are reported on a one quarter lag. Results of operations of the partner companies are excluded for periods prior to their acquisition and subsequent to their disposition. Historical results are not adjusted when the Company exits or writes-off a partner company.
High Traction Stage
As of December 31, | |||||||
2017 | 2016 | ||||||
(In thousands) | |||||||
Balance Sheets: | |||||||
Current assets | $ | 251,986 | $ | 229,756 | |||
Non-current assets | 111,329 | 106,555 | |||||
Total assets | $ | 363,315 | $ | 336,311 | |||
Current liabilities | $ | 296,349 | $ | 215,622 | |||
Non-current liabilities | 70,042 | 110,315 | |||||
Shareholders’ equity | (3,076 | ) | 10,374 | ||||
Total liabilities and shareholders’ equity | $ | 363,315 | $ | 336,311 | |||
Number of partner companies | 3 | 5 | |||||
Year Ended December 31, | |||||||||||
2017 | 2016 | 2015 | |||||||||
(In thousands) | |||||||||||
Results of Operations: | |||||||||||
Revenue | $ | 251,936 | $ | 278,129 | $ | 301,132 | |||||
Gross profit | $ | 183,139 | $ | 200,811 | $ | 208,883 | |||||
Net loss | $ | (27,030 | ) | $ | (41,586 | ) | $ | (46,558 | ) | ||
48
SAFEGUARD SCIENTIFICS, INC.
NOTES TO CONSOLIDATED FINANCIAL STATEMENTS – (Continued)
Expansion Stage
As of December 31, | |||||||
2017 | 2016 | ||||||
(In thousands) | |||||||
Balance Sheets: | |||||||
Current assets | $ | 75,441 | $ | 88,287 | |||
Non-current assets | 20,833 | 18,874 | |||||
Total assets | $ | 96,274 | $ | 107,161 | |||
Current liabilities | $ | 75,610 | $ | 48,522 | |||
Non-current liabilities | 33,180 | 18,048 | |||||
Shareholders’ equity | (12,516 | ) | 40,591 | ||||
Total liabilities and shareholders’ equity | $ | 96,274 | $ | 107,161 | |||
Number of partner companies | 11 | 11 | |||||
Year Ended December 31, | |||||||||||
2017 | 2016 | 2015 | |||||||||
(In thousands) | |||||||||||
Results of Operations: | |||||||||||
Revenue | $ | 99,882 | $ | 72,258 | $ | 58,093 | |||||
Gross profit | $ | 51,075 | $ | 36,691 | $ | 33,473 | |||||
Net loss | $ | (81,879 | ) | $ | (75,037 | ) | $ | (44,605 | ) | ||
Initial Revenue Stage
As of December 31, | |||||||
2017 | 2016 | ||||||
(In thousands) | |||||||
Balance Sheets: | |||||||
Current assets | $ | 54,383 | $ | 51,615 | |||
Non-current assets | 2,545 | 3,797 | |||||
Total assets | $ | 56,928 | $ | 55,412 | |||
Current liabilities | $ | 36,479 | $ | 21,569 | |||
Non-current liabilities | 17,450 | 30,188 | |||||
Shareholders’ equity | 2,999 | 3,655 | |||||
Total liabilities and shareholders’ equity | $ | 56,928 | $ | 55,412 | |||
Number of partner companies | 11 | 13 | |||||
Year Ended December 31, | |||||||||||
2017 | 2016 | 2015 | |||||||||
(In thousands) | |||||||||||
Results of Operations: | |||||||||||
Revenue | $ | 26,262 | $ | 20,415 | $ | 9,980 | |||||
Gross profit | $ | 17,084 | $ | 14,969 | $ | 7,689 | |||||
Net loss | $ | (78,212 | ) | $ | (70,107 | ) | $ | (47,221 | ) | ||
As of December 31, 2017, the Company’s carrying value in equity method partner companies, in the aggregate, exceeded the Company’s share of the net assets of such companies by approximately $77.5 million. Of this excess, $60.9 million was allocated to goodwill and $16.6 million was allocated to intangible assets.
49
SAFEGUARD SCIENTIFICS, INC.
NOTES TO CONSOLIDATED FINANCIAL STATEMENTS – (Continued)
3. Acquisitions of Ownership Interests in Partner Companies
2017 Transactions
The Company deployed $1.0 million into Prognos. The Company had previously deployed an aggregate of $11.6 million in Prognos. Prognos is a healthcare AI company that’s striving to improve health by tracking and predicting disease earlier in partnership with Life Sciences brands, payers, and clinical diagnostics organizations. The Company accounts for its interest in Prognos under the equity method.
The Company deployed $2.3 million into Syapse, Inc. The Company had previously deployed an aggregate of $13.3 million in Syapse. Syapse is on a mission to deliver the best care for every cancer patient through precision medicine. Syapse’s software platform, data sharing network, and industry partnerships enable healthcare providers to bring precision cancer care to every patient who needs it. The Company accounts for its interest in Syapse under the equity method.
The Company funded an aggregate of $0.6 million of convertible bridge loans to Spongecell, Inc. The Company had previously deployed an aggregate of $18.0 million in Spongecell. Subsequent to year end, Spongecell merged into Flashtalking. The Company accounted for its interest in Spongecell under the equity method.
The Company funded an aggregate of $5.3 million of convertible bridge loans to InfoBionic, Inc. The Company had previously deployed an aggregate of $14.5 million in InfoBionic. InfoBionic is an emerging digital health company focused on creating patient monitoring solutions for chronic disease management with an initial market focus on cardiac arrhythmias. The Company accounts for its interest in InfoBionic under the equity method.
The Company funded an aggregate of $3.8 million of convertible bridge loans to Sonobi, Inc. The Company had previously deployed $5.4 million in Sonobi. Sonobi is an advertising technology developer that creates data-driven tools and solutions to meet the evolving needs of demand- and sell-side organizations within the digital media marketplace. The Company accounts for its interest in Sonobi under the equity method.
The Company funded an aggregate of $2.0 million of convertible bridge loans to NovaSom, Inc. The Company had previously deployed an aggregate of $22.1 million in NovaSom. NovaSom is a medical device company focused on obstructive sleep apnea, specifically home testing with its FDA-cleared wireless device called AccuSom® home sleep test. The Company accounts for its interest in NovaSom under the equity method.
The Company funded an aggregate of $2.0 million of convertible bridge loans to Cask Data, Inc. The Company had previously deployed an aggregate of $11.0 million in Cask Data. Cask Data makes building and running big data solutions on-premises or in the cloud easy with Cask Data Application Platform. The Company accounts for its interest in Cask Data under the equity method.
The Company deployed an aggregate of $4.5 million into CloudMine, Inc. The Company had previously deployed an aggregate of $5.5 million in CloudMine. CloudMine is a leading HIPAA-compliance Enterprise Health Cloud platform. CloudMine empowers healthcare organizations to rapidly and confidently develop connected digital health experiences by reducing complexity, enabling data mobility, and ensuring compliance. The Company accounts for its interest in CloudMine under the equity method.
The Company deployed an aggregate of $3.1 million into Full Measure Education, Inc. The Company had previously deployed an aggregate of $8.6 million in Full Measure. Full Measure designs next-generation, mobile-first technologies for colleges throughout the United States. The Company accounted for its interest in Full Measure under the equity method.
The Company deployed $2.5 million into meQuilibrium. The Company had previously deployed an aggregate of $8.0 million in meQuilibrium. meQuilibrium is a digital coaching platform that delivers clinically validated and highly personalized resilience solutions to employers, health plans, wellness providers and consumers increasing engagement, productivity and performance, as well as improving outcomes in managing stress, health and well-being. The Company accounts for its interest in meQuilibrium under the equity method.
The Company funded $0.3 million of convertible bridge loans to Hoopla Software, Inc. The Company had previously deployed an aggregate of $4.8 million in Hoopla Software. Hoopla Software provides cloud-based software that helps sales organizations inspire and motivate sales team performance. The Company accounts for its interest in Hoopla Software under the equity method.
The Company deployed $1.8 million into QuanticMind, Inc. The Company had previously deployed an aggregate of $9.7 million in QuanticMind. QuanticMind delivers the most intelligent, scalable and fastest platform for maximizing digital marketing performance, including paid search and social, for enterprises. The Company accounts for its interest in QuanticMind under the equity method.
50
SAFEGUARD SCIENTIFICS, INC.
NOTES TO CONSOLIDATED FINANCIAL STATEMENTS – (Continued)
The Company funded an aggregate of $2.0 million of convertible bridge loans to WebLinc, Inc. The Company had previously deployed an aggregate of $12.0 million in WebLinc. WebLinc is a commerce platform and services provider for fast growing online retailers. The Company accounts for its interest in WebLinc under the equity method.
The Company funded $1.8 million of a convertible bridge loan to Good Start Genetics, Inc. The Company had previously deployed an aggregate of $17.2 million in Good Start Genetics. Good Start Genetics was acquired by Invitae Corporation in August 2017.
The Company deployed $2.1 million into Trice Medical, Inc. The Company had previously deployed an aggregate of $8.0 million in Trice Medical. Trice Medical is a diagnostics company focused on micro invasive technologies. The Company accounts for its interest in Trice Medical under the equity method.
The Company deployed $1.5 million into Aktana, Inc. The Company had previously deployed an aggregate of $8.2 million in Aktana. Aktana leverages big data and machine learning to enable pharmaceutical brands to dynamically optimize their strategy and enhance sales execution. The Company accounts for its interest in Aktana under the equity method.
The Company funded $0.2 million of a bridge loan to Lumesis, Inc. The Company had previously deployed an aggregate of $6.2 million in Lumesis. Lumesis is a financial technology company focused on providing business efficiency, regulatory and data solutions to the municipal bond marketplace. The Company accounts for its interest in Lumesis under the equity method.
The Company funded $0.3 million of a convertible bridge loan to Aventura, Inc. to fund wind-down activities. The Company had previously deployed an aggregate of $6.2 million in Aventura. The adjusted carrying value of the Company's interest in Aventura was $0.0 million at December 31, 2017. The Company accounted for its interest in Aventura under the equity method.
2016 Transactions
The Company funded $1.9 million of a convertible bridge loan to Trice Medical, Inc. The Company had previously deployed an aggregate of $6.1 million in Trice Medical. Trice Medical is a diagnostics company focused on micro invasive technologies. The Company accounts for its interest in Trice Medical under the equity method.
The Company funded $1.5 million of a convertible bridge loan to meQuilibrium. The Company had previously deployed $6.5 million in meQuilibrium. meQuilibrium is a digital coaching platform that delivers clinically validated and highly personalized resilience solutions to employers, health plans, wellness providers, and consumers increasing engagement, productivity and performance, as well as improving outcomes in managing stress, health and well-being. The Company accounts for its interest in meQuilibrium under the equity method.
The Company funded an aggregate of $5.2 million of convertible bridge loans to Good Start Genetics, Inc. The Company had previously deployed an aggregate of $12.0 million in Good Start Genetics. The Company accounted for its interest in Good Start Genetics under the equity method.
The Company deployed an aggregate of $5.4 million into WebLinc, Inc. The Company had previously deployed an aggregate of $6.6 million in WebLinc. WebLinc is a commerce platform provider for fast growing online retailers. The Company accounts for its interest in WebLinc under the equity method.
The Company deployed an aggregate of $4.6 million into Full Measure Education, Inc. The Company had previously deployed $4.0 million in Full Measure. Full Measure designed next-generation, mobile-first technologies for community colleges throughout the United States. The Company accounted for its interest in Full Measure under the equity method.
The Company funded an aggregate of $0.7 million of convertible loans to Lumesis, Inc. The Company had previously deployed an aggregate of $5.6 million in Lumesis. Lumesis is a financial technology company focused on providing business efficiency, regulatory and data solutions to the municipal bond marketplace. The Company accounts for its interest in Lumesis under the equity method.
The Company acquired a 23.6% interest in T-REX Group, Inc. for $6.0 million. T-REX Group is a financial services software technology company that specializes in valuation, risk analysis, and structuring tools to unlock investment opportunities for various asset classes. The Company accounts for its interest in T-REX Group under the equity method.
The Company funded $0.6 million of a convertible bridge loan to CloudMine, Inc. The Company had previously deployed an aggregate of $4.9 million in CloudMine. CloudMine empowers payers, providers, and pharmaceutical organizations to mobilize patient information by building robust applications and driving actionable insights. The Company accounts for its interest in CloudMine under the equity method.
51
SAFEGUARD SCIENTIFICS, INC.
NOTES TO CONSOLIDATED FINANCIAL STATEMENTS – (Continued)
The Company funded $0.3 million of a convertible bridge loan to Aventura, Inc. The Company had previously deployed $6.0 million in Aventura. The Company impaired all of the carrying value of Aventura in the fourth quarter of 2016. The Company accounted for its interest in Aventura under the equity method.
The Company acquired a 20.3% interest in Brickwork for $4.2 million. Brickwork helps retailers inform, target, convert, and prepare for store shoppers online as the first scalable software-as-a-service platform powering a seamless customer path between online and in-store shopping. The Company accounts for its interest in Brickwork under the equity method.
The Company deployed an additional $5.0 million in Propeller Health, Inc. The Company had previously deployed $9.0 million in Propeller Health. Propeller Health provides digital solutions to measurably improve respiratory health. The Company accounts for its interest in Propeller Health under the equity method.
The Company funded $2.8 million of a convertible bridge loan to QuanticMind, Inc. The Company had previously deployed $7.0 million in QuanticMind. QuanticMind is a software-as-a-service company that provides enterprise-level predictive advertising management software for paid search, social and mobile. The Company accounts for its interest in QuanticMind under the equity method.
The Company deployed $2.7 million into Aktana, Inc. The Company had previously acquired a 23.4% interest in Aktana for $5.5 million in June 2016. Aktana leverages big data and machine learning to enable pharmaceutical brands to dynamically optimize their strategy and enhance sales execution. The Company accounts for its interest in Aktana under the equity method.
The Company acquired a 32.6% interest in Moxe Health Corporation for $4.5 million. Moxe Health connects payers to their provider networks, facilitating real-time data exchange through its electronic integration platform. The Company accounts for its interest in Moxe Health under the equity method.
The Company deployed an aggregate of $5.0 million into InfoBionic, Inc. The Company had previously deployed an aggregate of $9.5 million in InfoBionic. InfoBionic is an emerging digital health company focused on creating patient monitoring solutions for chronic disease management with an initial market focus on cardiac arrhythmias. The Company accounts for its interest in InfoBionic under the equity method.
The Company deployed an aggregate of $4.0 million into Clutch Holdings, Inc. The Company had previously deployed an aggregate of $12.3 million in Clutch. Clutch provides customer intelligence and personalized engagements that empower consumer-focused businesses to identify, understand and motivate each segment of their customer base. The Company accounts for its interest in Clutch under the equity method.
The Company funded an aggregate of $4.0 million of convertible loans to Spongecell, Inc. The Company had previously deployed an aggregate of $14.0 million in Spongecell. Spongecell helps advertisers enhance the power of digital brand creative by leveraging customer data and brand content to personalize ads for maximum relevance. The Company accounts for its interest in Spongecell under the equity method.
The Company funded an aggregate of $1.2 million of convertible bridge loans to AppFirst, Inc. The Company had previously deployed an aggregate of $11.6 million in AppFirst. The Company impaired its ownership interest in AppFirst in June 2016 due to the shutdown of AppFirst's operations and sale of its assets in June 2016, which generated cash proceeds to the Company of $0.9 million. The Company accounted for its interest in AppFirst under the equity method.
The Company funded an aggregate of $1.0 million of convertible loans to NovaSom, Inc. The Company had previously deployed an aggregate of $21.0 million in NovaSom. NovaSom is a medical device company focused on obstructive sleep apnea, specifically home testing with its FDA-cleared wireless device called AccuSom® Home Sleep Test. The Company accounts for its interest in NovaSom under the equity method.
The Company deployed an additional $5.0 million into Transactis, Inc. The Company had previously deployed $9.5 million in Transactis. Transactis provides electronic billing and payment solutions. The Company accounts for its interest in Transactis under the equity method.
The Company funded $1.0 million of a convertible bridge loan to Hoopla Software, Inc. The Company had previously deployed an aggregate of $3.8 million in Hoopla. Hoopla provides cloud-based software that helps sales organizations inspire and motivate sales team performance. The Company accounts for its interest in Hoopla under the equity method.
The Company deployed an additional $7.5 million into Syapse, Inc. The Company had previously deployed $5.8 million in Syapse. Syapse drives healthcare transformation through precision medicine, enabling provider systems to improve clinical outcomes, streamline operations, and shift to new payment models. The Company accounts for its interest in Syapse under the equity method.
52
SAFEGUARD SCIENTIFICS, INC.
NOTES TO CONSOLIDATED FINANCIAL STATEMENTS – (Continued)
2015 Transactions
The Company acquired a 26.3% interest in Zipnosis, Inc. for $7.0 million. Zipnosis provides health systems with a white-labeled, fully integrated virtual care platform. The Company accounts for its interest in Zipnosis under the equity method.
The Company acquired a 34.2% interest in Cask Data, Inc. for $11.0 million. Cask Data accelerates the development and deployment of production Hadoop applications. The Company accounts for its interest in Cask under the equity method.
The Company deployed an additional $10.0 million into Apprenda, Inc. The Company had previously deployed $12.1 million in Apprenda. Apprenda is an enterprise platform-as-a-service company powering the next generation of enterprise software development in public, private and hybrid clouds. The Company accounts for its interest in Apprenda under the equity method.
The Company funded an aggregate of $2.8 million of convertible bridge loans to Quantia, Inc. The Company had previously deployed an aggregate of $12.5 million in Quantia. The Company accounted for its interest in Quantia under the equity method. In July 2015, Quantia was acquired by Physicians Interactive.
The Company deployed an additional $3.5 million into Pneuron Corporation. The Company had previously deployed $5.0 million in Pneuron. Pneuron enables organizations to rapidly solve business problems through a distributed approach that cuts across data, applications and processes. The Company accounts for its interest in Pneuron under the equity method.
The Company acquired a 22.6% interest in Sonobi, Inc. for $5.4 million. Sonobi is an advertising technology developer that creates data-driven tools and solutions to meet the evolving needs of demand- and sell-side organizations within the digital media marketplace. The Company accounts for its interest in Sonobi under the equity method.
The Company funded an aggregate $1.0 million convertible bridge loan to AdvantEdge Healthcare Solutions, Inc. The Company had previously deployed an aggregate of $15.3 million in AdvantEdge. AdvantEdge is a technology-enabled provider of healthcare revenue cycle and business management solutions that improve decision-making, maximize financial performance, streamline operations and mitigate compliance risks for healthcare providers. The Company accounts for its interest in AdvantEdge under the equity method.
The Company deployed an additional $0.3 million into Dabo Health, Inc. The Company had previously deployed $2.0 million in Dabo Health. The Company impaired all of the carrying value of Dabo Health in the first quarter of 2015. The Company accounted for its interest in Dabo Health under the cost method.
4. Fair Value Measurements
The Company categorizes its financial instruments into a three-level fair value hierarchy that prioritizes the inputs to valuation techniques used to measure fair value. The fair value hierarchy gives the highest priority to quoted prices in active markets for identical assets (Level 1) and the lowest priority to unobservable inputs (Level 3). If the inputs used to measure fair value fall within different levels of the hierarchy, the category level is based on the lowest priority level input that is significant to the fair value measurement of the instrument. Financial assets recorded at fair value on the Company’s Consolidated Balance Sheets are categorized as follows:
Level 1—Observable inputs that reflect quoted prices (unadjusted) for identical assets or liabilities in active markets.
Level 2—Include other inputs that are directly or indirectly observable in the marketplace.
Level 3—Unobservable inputs which are supported by little or no market activity.
The fair value hierarchy also requires an entity to maximize the use of observable inputs and minimize the use of unobservable inputs when measuring fair value.
The following table provides the carrying value and fair value of certain financial assets of the Company measured at fair value on a recurring basis as of December 31, 2017 and 2016:
53
SAFEGUARD SCIENTIFICS, INC.
NOTES TO CONSOLIDATED FINANCIAL STATEMENTS – (Continued)
Carrying Value | Fair Value Measurement at December 31, 2017 | ||||||||||||||
Level 1 | Level 2 | Level 3 | |||||||||||||
(in thousands) | |||||||||||||||
Cash and cash equivalents | $ | 20,751 | $ | 20,751 | $ | — | $ | — | |||||||
Long-term restricted cash equivalents | 6,336 | 6,336 | — | — | |||||||||||
Trading securities | 3,761 | 3,761 | — | — | |||||||||||
Marketable securities—held-to-maturity: | |||||||||||||||
Certificates of deposit | $ | 4,452 | $ | 4,452 | $ | — | $ | — | |||||||
Carrying Value | Fair Value Measurement at December 31, 2016 | ||||||||||||||
Level 1 | Level 2 | Level 3 | |||||||||||||
(In thousands) | |||||||||||||||
Cash and cash equivalents | $ | 22,058 | $ | 22,058 | $ | — | $ | — | |||||||
Long-term restricted cash equivalents | 6,336 | 6,336 | — | — | |||||||||||
Marketable securities—held-to-maturity: | |||||||||||||||
Certificates of deposit | $ | 15,686 | $ | 15,686 | $ | — | $ | — | |||||||
As of December 31, 2017, $4.5 million of marketable securities had contractual maturities which were less than one year and $0.0 million of marketable securities had contractual maturities greater than one year. Held-to-maturity securities are carried at amortized cost, which, due to the short-term maturity of these instruments, approximates fair value using quoted prices in active markets for identical assets or liabilities defined as Level 1 inputs under the fair value hierarchy. Trading securities consist of shares of Invitae Corporation obtained in connection with Invitae's acquisition of Good Start Genetics, Inc. in August 2017. The trading securities are recorded at fair value based on Invitae's closing stock price at December 31, 2017. Subsequent to year end, the Company sold the shares of Invitae common stock on the open market for net proceeds of $2.6 million.
5. Credit Facility and Convertible Debentures
Credit Facility
In May 2017, the Company entered into a $75.0 million secured, revolving credit facility (“Credit Facility”) with HPS Investment Partners, LLC (“Lender”). At closing, the Company borrowed $50.0 million, which resulted in net proceeds of $44.3 million after closing fees to the Lender and other third parties. The Credit Facility has a three-year term with a scheduled maturity of May 11, 2020 and bears interest at a rate of either: (A) LIBOR plus 8.5% (subject to a LIBOR floor of 1%), payable on the last day of the one, two or three month interest period applicable to the LIBOR rate advance, or (B) 7.5% plus the greater of: 2%; the Federal Funds Rate plus 0.5%; LIBOR plus 1%; or the U.S. Prime Rate, payable monthly in arrears. The Credit Facility is not amortized and interest payable under the Credit Facility will reflect at least $50 million as being drawn and outstanding at all times during the term. The Credit Facility also includes an unused line fee equal to 0.75% per annum of the average unused portion of the Credit Facility and a loan service fee, both paid quarterly. The Credit Facility is secured by all of the Company's assets in accordance with the terms of the Credit Facility.
The Credit Facility requires the Company to maintain (i) a liquidity threshold of at least $20 million of unrestricted cash; (ii) a tangible net worth, plus unrestricted cash of at least 1.75x the amount then outstanding under the Credit Facility; (iii) a minimum aggregate appraised value of the Company’s ownership interests in its partner companies, plus unrestricted cash in excess of the liquidity threshold of at least $350 million; and (iv) certain diversification requirements and concentration limits with respect to the Company’s capital deployments to its partner companies. Subject to customary exclusions, the Lender has the right to have one observer representative attend meetings of the Company's Board of Directors.
The Credit Facility provides for customary events of default which include (subject in certain cases to customary grace and cure periods), among others, nonpayment of principal or interest; non-compliance with debt covenants; defaults in, or failure to pay, certain other indebtedness; the rendering of judgments to pay certain amounts of money; certain events of bankruptcy or insolvency; and a material adverse change to the business. Generally, if an event of default occurs and is not cured within the time periods specified (if any), the Lender may declare the outstanding amount under the Credit Facility to be immediately due and payable.
At December 31, 2017, the principal amount outstanding under the Credit Facility was $50.0 million, the unamortized discount and debt issuance costs were $4.7 million and the net carrying value of the credit facility was $45.3 million. The
54
SAFEGUARD SCIENTIFICS, INC.
NOTES TO CONSOLIDATED FINANCIAL STATEMENTS – (Continued)
Company is amortizing the excess of the principal amount of the Credit Facility over its carrying value over the three-year term as additional interest expense using the effective interest method and recorded $1.0 million of such expense for the year ended December 31, 2017. The effective interest rate on the Credit Facility is 14.6%.
Convertible Senior Debentures
In November 2012, the Company issued $55.0 million principal amount of its 5.25% convertible senior debentures due on May 15, 2018 (the “2018 Debentures”). In July and June 2017, the Company repurchased on the open market, and retired, an aggregate of $14.0 million face value of the 2018 Debentures at a cost of $14.5 million, including transaction fees. In connection with the repurchase of these 2018 Debentures, the Company recognized a $0.8 million reduction in equity which is included in Accumulated Paid-In Capital in the Consolidated Balance Sheet as of December 31, 2017 and a $29 thousand loss on extinguishment of the liability which is included in Other loss in the Consolidated Statements of Operations for the year ended December 31, 2017. At December 31, 2017, the Company had $41.0 million of outstanding 2018 Debentures.
Interest on the 2018 Debentures is payable semi-annually on May 15 and November 15. Holders of the 2018 Debentures had the right to convert their notes prior to November 15, 2017 at their option only under the following circumstances:
• | during any calendar quarter commencing after the calendar quarter ending on December 31, 2012, if the last reported sale price of the common stock for at least 20 trading days during the period of 30 consecutive trading days ending on the last trading day of the immediately preceding calendar quarter is greater than or equal to 130% of the conversion price on each applicable trading day; |
• | during the five business day period after any five consecutive trading day period in which the trading price per $1,000 principal amount of notes for each trading day of the measurement period was less than 98% of the product of the last reported sale price of our common stock and the conversion rate on such trading day; |
• | if the notes have been called for redemption; or |
• | upon the occurrence of specified corporate events. |
On or after November 15, 2017 until the close of business on the second business day immediately preceding the maturity date, holders may convert their notes at any time, regardless of whether any of the foregoing conditions have been met. Upon conversion, the Company will satisfy its conversion obligation by paying or delivering, as the case may be, cash, shares of our common stock or a combination of cash and shares of our common stock, at the Company’s election.
The conversion rate of the 2018 Debentures is 55.17 shares of common stock per $1,000 principal amount of debentures, equivalent to a conversion price of approximately $18.13 per share of common stock. The closing price of the Company’s common stock at December 31, 2017 was $11.20. Since their issuance in 2012, none of the 2018 Debentures have been converted to shares of common stock.
On or after November 15, 2016, the Company may redeem for cash any of the 2018 Debentures if the last reported sale price of the Company’s common stock exceeds 140% of the conversion price for at least 20 trading days during the period of 30 consecutive trading days ending on the trading day before the date that notice of redemption is given, including the last trading day of such period. Upon any redemption of the 2018 Debentures, the Company will pay a redemption price of 100% of their principal amount, plus accrued and unpaid interest to, but excluding, the date of redemption, and additional interest, if any.
The 2018 Debentures holders have the right to require the Company to repurchase the 2018 Debentures if the Company undergoes a fundamental change, which includes the sale of all or substantially all of the Company’s common stock or assets; liquidation; dissolution; a greater than 50% change in control; the delisting of the Company’s common stock from the New York Stock Exchange or the NASDAQ Global Market (or any of their respective successors); or a substantial change in the composition of the Company’s board of directors as defined in the governing agreement. Holders may require that the Company repurchase for cash all or part of their debentures at a fundamental change repurchase price equal to 100% of the principal amount of the debentures to be repurchased, plus accrued and unpaid interest to, but excluding, the fundamental change repurchase date.
Because the 2018 Debentures may be settled in cash or partially in cash upon conversion, the Company separately accounts for the liability and equity components of the 2018 Debentures. The carrying amount of the liability component was determined at the transaction date by measuring the fair value of a similar liability that does not have an associated equity component. The carrying amount of the equity component represented by the embedded conversion option was determined by
55
SAFEGUARD SCIENTIFICS, INC.
NOTES TO CONSOLIDATED FINANCIAL STATEMENTS – (Continued)
deducting the fair value of the liability component from the initial proceeds of the 2018 Debentures as a whole. At December 31, 2017, the fair value of the $41.0 million outstanding 2018 Debentures was approximately $41.6 million, based on the midpoint of the bid and ask prices as of such date. At December 31, 2017, the carrying amount of the equity component was $5.6 million, the principal amount of the liability component was $41.0 million, the unamortized discount and debt issuance costs were $0.5 million, and the net carrying value of the liability component was $40.5 million. The Company is amortizing the excess of the face value of the 2018 Debentures over their carrying value over their term as additional interest expense using the effective interest method and recorded $1.5 million, $1.6 million and $1.5 million of such expense for the years ended December 31, 2017, 2016 and 2015, respectively. The effective interest rate on the 2018 Debentures is 8.7%. The Company anticipates refinancing all or a portion of the outstanding 2018 Debentures before the maturity date of May 15, 2018.
6. Equity
In July 2015, the Company's Board of Directors authorized the Company, from time to time and depending on market conditions, to repurchase up to $25.0 million of the Company's outstanding common stock. During the years ended December 31, 2016 and 2015, the Company repurchased an aggregate of 0.7 million shares at an aggregate cost of $10.4 million with $14.6 million remaining for repurchase under the existing authorization.
In February 2018, the Company's Board of Directors adopted a tax benefits preservation plan (the "Plan") designed to protect and preserve the Company's ability to utilize its net operating loss carryforwards ("NOLs"). The Company intends to submit the Plan for shareholder ratification at its 2018 Annual Meeting of Shareholders. The purpose of the Plan is to preserve the Company's ability to use its NOLs, which would be substantially limited if the Company experienced an "ownership change" as defined under Section 382 of the Internal Revenue Code. In general, an ownership change would occur if the Company's shareholders who are treated as owning five percent or more of the outstanding shares of Safeguard for purposes of Section 382 ("five-percent shareholders") collectively increase their aggregate ownership in the Company's overall shares outstanding by more than 50 percentage points. Whether this change has occurred would be measured by comparing each five-percent shareholder's current ownership as of the measurement date to such shareholders' lowest ownership percentage during the three-year period preceding the measurement date. To protect the Company's NOLs from being limited or permanently lost under Section 382, the Plan is intended to deter any person or group from acquiring beneficial ownership of 4.99% or more of the Company's outstanding common stock without the approval of the Board, reducing the likelihood of an unintended ownership change. Under the Plan, the Company will issue one preferred stock purchase right (the "Rights") for each share of Safeguard's common stock held by shareholders of record on March 2, 2018. The issuance of the Rights will not be taxable to Safeguard or its shareholders and will not affect Safeguard's reported earnings per share. The Rights will trade with Safeguard's common shares and will expire no later than February 19, 2021. The Rights and the Plan may also expire on an earlier date upon the occurrence of other events, including a determination by the Company's Board that the Plan is no longer necessary or desirable for the preservation of the Company's tax attributes or that no tax attributes may be carried forward (with such expiration occurring as of the beginning of the applicable taxable year). There can be no assurance that the Plan will prevent the Company from experiencing an ownership change.
7. Stock-Based Compensation
Equity Compensation Plans
The 2014 Equity Compensation Plan has 4.1 million shares authorized for issuance. During 2017 and 2016, the Company issued zero and 46 thousand stock-based awards, respectively, outside of existing plans as inducement awards in accordance with New York Stock Exchange rules. To the extent allowable, service-based options are incentive stock options. Options granted under the plans are at prices equal to or greater than the fair market value at the date of grant. Upon exercise of stock options, the Company issues shares first from treasury stock, if available, then from authorized but unissued shares. At December 31, 2017, the Company had reserved 3.4 million shares of common stock for possible future issuance under its 2014 Equity Compensation Plan, and other previously expired equity compensation plans.
Classification of Stock-Based Compensation Expense
Stock-based compensation expense was recognized in the Consolidated Statements of Operations as follows:
Year Ended December 31, | |||||||||||
2017 | 2016 | 2015 | |||||||||
(In thousands) | |||||||||||
General and administrative expense | $ | 1,138 | $ | 2,394 | $ | 1,611 | |||||
$ | 1,138 | $ | 2,394 | $ | 1,611 | ||||||
56
SAFEGUARD SCIENTIFICS, INC.
NOTES TO CONSOLIDATED FINANCIAL STATEMENTS – (Continued)
At December 31, 2017, the Company had outstanding options that vest based on two different types of vesting schedules:
1) performance-based; and
2) service-based.
Performance-based awards entitle participants to vest in a number of awards determined by achievement by the Company of target capital returns based on net cash proceeds received by the Company upon the sale, merger or other exit transaction of certain identified partner companies. Vesting may occur, if at all, once per year. The requisite service periods for the performance-based awards are based on the Company’s estimate of when the performance conditions will be met. Compensation expense is recognized for performance-based awards for which the performance condition is considered probable of achievement. Compensation expense is recognized over the requisite service periods using the straight-line method but is accelerated if capital return targets are achieved earlier than estimated. No performance-based options were issued during the years ended December 31, 2017, 2016 or 2015. During the years ended December 31, 2017, 2016 and 2015, 1 thousand, 4 thousand and 0 performance-based options vested. During the years ended December 31, 2017, 2016 and 2015, respectively, 8 thousand, 106 thousand and 9 thousand performance-based options were canceled or forfeited. The Company recorded a reduction of compensation expense related to performance-based options of $0.2 million for the year ended December 31, 2017. During the years ending December 31, 2016 and 2015, the Company recorded compensation expense related to performance-based options of $0.2 million and $0.0 million, respectively. The maximum number of unvested options at December 31, 2017 attainable under these grants was 335 thousand shares.
Service-based awards generally vest over four years after the date of grant and expire eight years after the date of grant. Compensation expense is recognized over the requisite service period using the straight-line method. The requisite service period for service-based awards is the period over which the award vests. During the years ended December 31, 2017, 2016 and 2015, respectively, the Company issued 8 thousand, 27 thousand and 31 thousand service-based options to employees. During the years ended December 31, 2017, 2016 and 2015, respectively, 80 thousand, 22 thousand and 8 thousand service-based options were canceled or forfeited. The Company recorded compensation expense related to these options of $0.1 million, $0.2 million and $0.3 million during the years ended December 31, 2017, 2016 and 2015, respectively.
Market-based awards entitled participants to vest in a number of options determined by achievement by the Company of certain target market capitalization increases (measured by reference to stock price increases on a specified number of outstanding shares) over an eight-year period. During the years ended December 31, 2017, 2016 and 2015, the Company did not issue any market-based awards to employees. No market-based options vested during the years ended December 31, 2017, 2016 or 2015. During the years ended December 31, 2017, 2016 and 2015, respectively, 0, 136 thousand and 91 thousand market-based options were canceled or forfeited. The Company did not record compensation expense related to market-based options during the years ended December 31, 2017, 2016 and 2015. There is no further expense to be recognized related to market-based options and there are no further unvested options attainable under these grants at December 31, 2017.
The fair value of the Company’s option awards to employees was estimated at the date of grant using the Black-Scholes option-pricing model. The risk-free rate is based on the U.S. Treasury yield curve in effect at the end of the quarter in which the grant occurred. The expected term of stock options granted was estimated using the historical exercise behavior of employees. Expected volatility was based on historical volatility measured using weekly price observations of the Company’s common stock for a period equal to the stock option’s expected term. Assumptions used in the valuation of options granted in each period were as follows:
Year Ended December 31, | ||||||||
2017 | 2016 | 2015 | ||||||
Service-Based Options | ||||||||
Dividend yield | 0 | % | 0 | % | 0 | % | ||
Expected volatility | 22 | % | 25 | % | 26 | % | ||
Average expected option life | 5 years | 5 years | 5 years | |||||
Risk-free interest rate | 2.1 | % | 1.5 | % | 1.5 | % | ||
The weighted-average grant date fair value of options issued by the Company during the years ended December 31, 2017, 2016 and 2015 was $2.36, $3.29 and $4.25 per share, respectively.
57
SAFEGUARD SCIENTIFICS, INC.
NOTES TO CONSOLIDATED FINANCIAL STATEMENTS – (Continued)
Option activity of the Company is summarized below:
Shares | Weighted Average Exercise Price | Weighted Average Remaining Contractual Life | Aggregate Intrinsic Value | |||||||||
(In thousands) | (In years) | (In thousands) | ||||||||||
Outstanding at December 31, 2014 | 1,316 | $ | 12.81 | |||||||||
Options granted | 31 | 17.26 | ||||||||||
Options exercised | (155 | ) | 13.12 | |||||||||
Options canceled/forfeited | (107 | ) | 13.06 | |||||||||
Outstanding at December 31, 2015 | 1,085 | 12.86 | ||||||||||
Options granted | 27 | 13.03 | ||||||||||
Options exercised | (170 | ) | 7.56 | |||||||||
Options canceled/forfeited | (264 | ) | 11.06 | |||||||||
Outstanding at December 31, 2016 | 678 | 14.90 | ||||||||||
Options granted | 8 | 11.33 | ||||||||||
Options exercised | (29 | ) | 10.16 | |||||||||
Options canceled/forfeited | (88 | ) | 17.20 | |||||||||
Outstanding at December 31, 2017 | 569 | 14.74 | 3.71 | $ | 80 | |||||||
Options exercisable at December 31, 2017 | 198 | 15.67 | 2.65 | — | ||||||||
Shares available for future grant | 1,884 | |||||||||||
The total intrinsic value of options exercised for the years ended December 31, 2017, 2016 and 2015 was $0.1 million, $0.9 million and $0.9 million, respectively.
At December 31, 2017, total unrecognized compensation cost related to non-vested service-based options was $0.1 million. That cost is expected to be recognized over a weighted-average period of 2.1 years. At December 31, 2017, total unrecognized compensation cost related to non-vested performance-based options was $0.1 million. That cost is expected to be recognized over a weighted-average period of 1.9 years but would be accelerated if performance targets are achieved earlier than estimated.
Performance-based stock units vest based on achievement by the Company of target capital returns based on net cash proceeds received by the Company on the sale, merger or other exit transaction of certain identified partner companies, as described above related to performance-based awards. Performance-based stock units represent the right to receive shares of the Company’s common stock, on a one-for-one basis. The Company did not issue any performance-based units during the year ended December 31, 2017. During the years ended December 31, 2016 and 2015, respectively, the Company issued 226 thousand and 153 thousand performance-based stock units to employees. During the years ended December 31, 2017, 2016 and 2015, respectively, 1 thousand, 1 thousand and 7 thousand performance-based stock units vested. During the years ended December 31, 2017, 2016 and 2015, respectively, 6 thousand, 49 thousand and 5 thousand performance-based stock units were canceled or forfeited. Under the terms of the 2016 and 2015 performance-based awards, once performance-based stock units are fully vested, participants are entitled to receive cash payments based on their initial performance grant values as target capital returns described above are exceeded. At December 31, 2017, the liability associated with such potential cash payments was $0.0 million.
During the years ended December 31, 2017, 2016 and 2015, respectively, the Company issued 163 thousand, 130 thousand and 81 thousand restricted shares to employees. Restricted shares generally vest over a period of approximately four years. During the years ended December 31, 2017, 2016 an 2015, respectively, 3 thousand, 12 thousand and 2 thousand restricted shares were canceled or forfeited.
During the years ended December 31, 2017, 2016, and 2015, respectively, the Company issued 54 thousand, 47 thousand and 44 thousand deferred stock units to non-employee directors for annual service grants or fees earned during the preceding quarter. Deferred stock units issued to directors in lieu of directors fees are 100% vested at the grant date; matching deferred stock units equal to 25% of directors’ fees deferred vest one year following the grant date or, if earlier, upon reaching age 65. Deferred stock units are payable in stock on a one-for-one basis. Payments related to the deferred stock units are generally distributable following termination of employment or service, death or permanent disability.
58
SAFEGUARD SCIENTIFICS, INC.
NOTES TO CONSOLIDATED FINANCIAL STATEMENTS – (Continued)
During the years ended December 31, 2017, 2016 and 2015, the Company granted 22 thousand, 10 thousand and 9 thousand shares, respectively, to members of its advisory board. The advisory board was disbanded in February 2018. The Company recorded compensation expense of $0.3 million, $0.1 million and $0.1 million in each year related to these awards.
Total compensation expense for deferred stock units, performance-based stock units and restricted stock was $1.3 million $1.9 million, $1.3 million for the years ended December 31, 2017, 2016 and 2015, respectively. Unrecognized compensation expense related to deferred stock units, performance stock units and restricted stock at December 31, 2017 was $5.1 million. The total fair value of deferred stock units, performance stock units and restricted stock vested during the years ended December 31, 2017, 2016 and 2015 was $1.6 million, $1.2 million and $1.1 million, respectively.
Deferred stock unit, performance-based stock unit and restricted stock activity are summarized below:
Shares | Weighted Average Grant Date Fair Value | |||||
(In thousands) | ||||||
Unvested at December 31, 2015 | 670 | $ | 16.16 | |||
Granted | 413 | 13.27 | ||||
Vested | (89 | ) | 16.46 | |||
Forfeited | (61 | ) | 17.08 | |||
Unvested at December 31, 2016 | 933 | 14.79 | ||||
Granted | 217 | 11.43 | ||||
Vested | (135 | ) | 13.75 | |||
Forfeited | (10 | ) | 14.38 | |||
Unvested at December 31, 2017 | 1,005 | 14.21 | ||||
8. Other Income (Loss), Net
Year ended December 31, 2017: | |||
Loss on mark-to-market of holdings in trading securities | $ | (493 | ) |
Loss on impairment of legacy private equity fund | (216 | ) | |
Gain on legacy Penn Mezzanine debt and equity participations | 399 | ||
Loss on partial extinguishment of 2018 Debentures | (29 | ) | |
$ | (339 | ) | |
Year ended December 31, 2016: | |||
Loss on impairment of Penn Mezzanine debt and equity participations | $ | (2,360 | ) |
Gain on sale of Bridgevine | 424 | ||
Other | 254 | ||
$ | (1,682 | ) | |
Year ended December 31, 2015: | |||
Gain on proceeds received from escrow related to sale of Crescendo | $ | 2,914 | |
Loss on impairment of Dabo Health | (2,356 | ) | |
Loss on impairment of legacy private equity fund | (398 | ) | |
Other | 57 | ||
$ | 217 | ||
59
SAFEGUARD SCIENTIFICS, INC.
NOTES TO CONSOLIDATED FINANCIAL STATEMENTS – (Continued)
9. Income Taxes
The federal and state provision (benefit) for income taxes was $0.0 million for the years ended December 31, 2017, 2016 and 2015.
The total income tax provision (benefit) differed from the amounts computed by applying the U.S. federal income tax rate of 35.0% to net income (loss) before income taxes as a result of the following:
Year Ended December 31, | ||||||||
2017 | 2016 | 2015 | ||||||
Statutory tax (benefit) expense | (35.0 | )% | (35.0 | )% | (35.0 | )% | ||
Increase (decrease) in taxes resulting from: | ||||||||
Stock-based compensation | — | 0.2 | 0.1 | |||||
Nondeductible expenses | 0.2 | 0.4 | 0.2 | |||||
Tax Cuts and Jobs Act impact | 93.2 | — | — | |||||
Valuation allowance | (58.4 | ) | 34.4 | 34.7 | ||||
0.0 | % | 0.0 | % | 0.0 | % | |||
The tax effects of temporary differences that gave rise to significant portions of the deferred tax assets were as follows:
As of December 31, | |||||||
2017 | 2016 | ||||||
(In thousands) | |||||||
Deferred tax asset: | |||||||
Carrying values of partner companies and other holdings | $ | 69,751 | $ | 95,134 | |||
Tax loss and credit carryforwards | 58,138 | 82,775 | |||||
Accrued expenses | 766 | 1,183 | |||||
Stock-based compensation | 814 | 1,763 | |||||
Other | 967 | 1,310 | |||||
130,436 | 182,165 | ||||||
Valuation allowance | (130,436 | ) | (182,165 | ) | |||
Net deferred tax asset | $ | — | $ | — | |||
As of December 31, 2017, the Company and its subsidiaries consolidated for tax purposes had federal net operating loss carryforwards of approximately $254.3 million. These carryforwards expire as follows:
Total | |||
(In thousands) | |||
2018 | $ | — | |
2019 | — | ||
2020 | — | ||
2021 | 3,728 | ||
2022 and thereafter | 250,572 | ||
$ | 254,300 | ||
In December 2017, the U.S. government enacted comprehensive tax legislation commonly referred to as the Tax Cuts and Jobs Act (the "Tax Act"). The Tax Act makes broad and complex changes to the U.S. tax code, including, but not limited to: (i) reducing the U.S. federal corporate tax rate from 35 percent to 21 percent; (ii) eliminating the corporate alternative minimum tax (AMT) and changing how existing AMT credits can be realized; (iii) creating a new limitation on deductible interest expense; and (iv) changing rules related to uses and limitations of net operating carryforwards created in tax years beginning after December 31, 2017. The most significant impact on the Company's consolidated financial statements is a reduction of approximately $82.5 million in deferred tax assets which is offset by changes to the Company’s valuation allowance.
In assessing the recoverability of deferred tax assets, the Company considers whether it is more likely than not that some portion or all of the deferred tax assets will not be realized. The Company has determined that it is more likely than not that
60
SAFEGUARD SCIENTIFICS, INC.
NOTES TO CONSOLIDATED FINANCIAL STATEMENTS – (Continued)
certain future tax benefits may not be realized as a result of current and future income. Accordingly, a valuation allowance has been recorded against substantially all of the Company’s deferred tax assets.
The Company recognizes in its Consolidated Financial Statements the impact of a tax position if that position is more likely than not to be sustained upon examination, based on the technical merits of the position. All uncertain tax positions relate to unrecognized tax benefits that would impact the effective tax rate when recognized.
The Company does not expect any material increase or decrease in its income tax expense, in the next twelve months, related to examinations or changes in uncertain tax positions.
There were no changes in the Company’s uncertain tax positions for the years ended December 31, 2017, 2016 and 2015.
The Company files income tax returns in the U.S. federal jurisdiction, and various state jurisdictions. Tax years 2014 and forward remain open for examination for federal tax purposes and the Company’s more significant state tax jurisdictions. To the extent utilized in future years’ tax returns, net operating loss carryforwards at December 31, 2017 will remain subject to examination until the respective tax year is closed. The Company recognizes penalties and interest accrued related to income tax liabilities in income tax benefit (expense) in the Consolidated Statements of Operations.
10. Net Loss Per Share
The calculations of net loss per share were:
Year Ended December 31, | |||||||||||
2017 | 2016 | 2015 | |||||||||
(In thousands, except per share data) | |||||||||||
Basic: | |||||||||||
Net loss | $ | (88,572 | ) | $ | (22,262 | ) | $ | (59,524 | ) | ||
Weighted average common shares outstanding | 20,430 | 20,343 | 20,874 | ||||||||
Net loss per share | $ | (4.34 | ) | $ | (1.09 | ) | $ | (2.85 | ) | ||
Diluted: | |||||||||||
Net loss | $ | (88,572 | ) | $ | (22,262 | ) | $ | (59,524 | ) | ||
Weighted average common shares outstanding | 20,430 | 20,343 | 20,874 | ||||||||
Net loss per share | $ | (4.34 | ) | $ | (1.09 | ) | $ | (2.85 | ) | ||
Basic and diluted average common shares outstanding for purposes of computing net income (loss) per share includes outstanding common shares and vested deferred stock units (DSUs).
If a consolidated or equity method partner company has dilutive stock options, unvested restricted stock, DSUs, or warrants, diluted net income (loss) per share is computed by first deducting from net income (loss) the income attributable to the potential exercise of the dilutive securities of the partner company from net income (loss). Any impact is shown as an adjustment to net income (loss) for purposes of calculating diluted net income (loss) per share.
Diluted loss per share for the years ended December 31, 2017, 2016 and 2015 do not reflect the following potential shares of common stock that would have an anti-dilutive effect or have unsatisfied performance or market conditions:
• | At December 31, 2017, 2016 and 2015, options to purchase 0.6 million, 0.7 million and 1.1 million shares of common stock, respectively, at prices ranging from $9.83 to $19.95 per share, $9.83 to $19.95 per share and $7.14 to $19.95 per share per share, respectively, were excluded from the calculation. |
• | At December 31, 2017, 2016 and 2015 unvested restricted stock, performance-based stock units and DSUs convertible into 1.0 million, 0.9 million and 0.7 million shares of stock, respectively, were excluded from the calculations. |
• | For the years ended December 31, 2017, 2016, and 2015, 2.3 million, 3.0 million and 3.0 million shares of common stock, respectively, representing the effect of assumed conversion of the 2018 Debentures were excluded from the calculations. |
11. Related Party Transactions
61
SAFEGUARD SCIENTIFICS, INC.
NOTES TO CONSOLIDATED FINANCIAL STATEMENTS – (Continued)
In May 2001, the Company entered into a $26.5 million loan agreement with Warren V. Musser, a former Chairman and Chief Executive Officer of the Company. Through December 31, 2017, the Company recognized impairment charges against the loan of $15.7 million. Since 2001 and through December 31, 2017, the Company has received a total of $17.1 million in payments on the loan. The carrying value of the loan at December 31, 2017 was zero. The Company received payments of $0.1 million on this loan agreement in the year ended December 31, 2016 and did not receive any payments on this loan agreement in the years ended December 31, 2017 or 2015.
In the normal course of business, the Company’s officers and employees hold board positions with partner and other companies in which the Company has a direct or indirect ownership interest.
12. Commitments and Contingencies
The Company and its partner companies are involved in various claims and legal actions arising in the ordinary course of business. In the current opinion of the Company, the ultimate disposition of these matters will not have a material adverse effect on the Company’s consolidated financial position or results of operations, however, no assurance can be given as to the outcome of these actions, and one or more adverse rulings could have a material adverse effect on the Company’s consolidated financial position and results of operations or that of its partner companies. The Company records costs associated with legal fees as such services are rendered.
The Company leases its corporate headquarters under a lease expiring in 2026 and office equipment under leases expiring at various dates to 2020. Total rental expense under operating leases was $0.5 million, $0.5 million and $0.5 million for the years ended December 31, 2017, 2016 and 2015, respectively. At December 31, 2017, future minimum lease payments under non-cancelable operating leases with initial or remaining terms of one year or more are as follows:
Total | |||
(In thousands) | |||
2018 | $ | 593 | |
2019 | 605 | ||
2020 | 603 | ||
2021 | 598 | ||
2022 and thereafter | 2,648 | ||
$ | 5,047 | ||
The Company had outstanding guarantees of $3.8 million at December 31, 2017 which related to one of the Company's private equity holdings.
The Company is required to return a portion or all the distributions it received as a general partner of a private equity fund for further distribution to such fund's limited partners (“clawback”). The Company’s ownership in the fund is 19%. The clawback liability is joint and several, such that the Company may be required to fund the clawback for other general partners should they default. The Company believes its potential liability due to the possibility of default by other general partners is remote. The Company was notified by the fund's manager that the fund is being dissolved and $1.0 million of the Company's clawback liability was paid in the first quarter of 2017. The maximum additional clawback liability is $0.3 million which was reflected in Other long-term liabilities on the Consolidated Balance Sheet at December 31, 2017.
In October 2001, the Company entered into an agreement with a former Chairman and Chief Executive Officer of the Company, to provide for annual payments of $0.65 million per year and certain health care and other benefits for life. The related current liability of $0.8 million was included in Accrued expenses and other current liabilities and the long-term portion of $1.8 million was included in Other long-term liabilities on the Consolidated Balance Sheet at December 31, 2017.
We have provided a $6.3 million letter of credit that is scheduled to expire on March 31, 2019 to the landlord of CompuCom Systems, Inc.’s Dallas headquarters which was required in connection with the sale of CompuCom Systems in 2004. The letter of credit is secured by cash which is classified as Long-term restricted cash equivalents on the Consolidated Balance Sheet. The restriction on the cash will lapse when the related letter of credit is terminated or expires on March 31, 2019.
In January 2018, the Company announced a change in strategy and implemented an initiative to generate annual cost savings of between $5 million and $6 million. The Company will incur approximately $1.3 million of severance payments to terminated employees that will be paid over approximately twelve months. The Company has agreements with certain
62
SAFEGUARD SCIENTIFICS, INC.
NOTES TO CONSOLIDATED FINANCIAL STATEMENTS – (Continued)
employees that provide for severance payments to the employee in the event the employee is terminated without cause or an employee terminates his employment for “good reason.” The maximum aggregate exposure under severance agreements for employees who were not terminated in January 2018 in connection with the change in strategy was approximately $2.9 million at December 31, 2017.
In June 2011, the Company's former partner company, Advanced BioHealing, Inc. (“ABH”) was acquired by Shire plc (“Shire”). Prior to the expiration of the escrow period in March 2012, Shire filed a claim against all amounts held in escrow related to the sale based principally upon a United States Department of Justice (“DOJ”) false claims act investigation relating to ABH (the “Investigation”). In connection with the Investigation, in July 2015 the Company received a Civil Investigation Demand-Documentary Material (“CID”) from the DOJ regarding ABH and Safeguard’s relationship with ABH. Pursuant to the CID, the Company provided the requested materials and information. To the Company’s knowledge, the CID was related to multiple qui tam (“whistleblower”) actions, one of which was filed in 2014 by an ex-employee of ABH that named the Company and one of the Company’s employees along with other entities and individuals as defendants. At this time, the DOJ has declined to pursue the qui tam action as it relates to the Company and such Company employee. In addition, in connection with the above matters, the Company and other former equity holders in ABH entered into a settlement and release with Shire, which resulted in the release to Shire of all amounts held in escrow related to the sale of ABH.
13. Supplemental Cash Flow Information
During the years ended December 31, 2017 and 2016, the Company converted $10.8 million and $3.9 million, respectively, of advances to partner companies into ownership interests in partner companies. Cash paid for interest for the years ended December 31, 2017, 2016 and 2015 was $5.0 million, $2.9 million and $2.9 million, respectively. Cash paid for taxes in each of the years ended December 31, 2017, 2016 and 2015 was $0.0 million.
14. Segment Reporting
The Company operates as one operating segment based upon the similar nature of its technology-driven partner companies, the functional alignment of the organizational structure, and the reports that are regularly reviewed by the chief operating decision maker for the purpose of assessing performance and allocating resources.
63
SAFEGUARD SCIENTIFICS, INC.
NOTES TO CONSOLIDATED FINANCIAL STATEMENTS – (Continued)
As of December 31, 2017, the Company held interests in 25 non-consolidated partner companies. The Company’s active partner companies as of December 31, 2017 were as follows for the years ended December 31, 2017, 2016 and 2015:
Safeguard Primary Ownership as of December 31, | ||||||||||
Partner Company | Revenue Stage | 2017 | 2016 | 2015 | Accounting Method | |||||
AdvantEdge Healthcare Solutions, Inc. | High Traction | 40.1% | 40.1% | 40.1% | Equity | |||||
Aktana, Inc. | Expansion | 24.5% | 31.2% | NA | Equity | |||||
Apprenda, Inc. | Expansion | 29.3% | 29.4% | 29.5% | Equity | |||||
Brickwork | Initial Revenue | 20.3% | 20.3% | NA | Equity | |||||
Cask Data, Inc. | Initial Revenue | 31.2% | 31.3% | 34.2% | Equity | |||||
CloudMine, Inc. | Initial Revenue | 47.3% | 30.1% | 30.1% | Equity | |||||
Clutch Holdings, Inc. | Expansion | 42.7% | 42.8% | 39.3% | Equity | |||||
Hoopla Software, Inc. | Initial Revenue | 25.5% | 25.5% | 25.6% | Equity | |||||
InfoBionic, Inc. | Initial Revenue | 39.5% | 39.7% | 38.5% | Equity | |||||
Lumesis, Inc. | Expansion | 43.8% | 44.1% | 44.7% | Equity | |||||
MediaMath, Inc. | High Traction | 20.5% | 20.5% | 20.6% | Equity | |||||
meQuilibrium | Initial Revenue | 36.2% | 31.5% | 31.5% | Equity | |||||
Moxe Health Corporation | Initial Revenue | 32.4% | 32.4% | NA | Equity | |||||
NovaSom, Inc. | High Traction | 31.7% | 31.7% | 31.7% | Equity | |||||
Prognos (formerly Medivo) | Expansion | 28.7% | 35.2% | 34.5% | Equity | |||||
Propeller Health, Inc. | Initial Revenue | 24.0% | 24.0% | 24.6% | Equity | |||||
QuanticMind, Inc. | Expansion | 24.7% | 23.2% | 23.6% | Equity | |||||
Sonobi, Inc. | Expansion | 21.6% | 21.6% | 22.6% | Equity | |||||
Spongecell, Inc. * | Expansion | 23.0% | 23.0% | 23.0% | Equity | |||||
Syapse, Inc. | Expansion | 20.1% | 26.2% | 24.4% | Equity | |||||
T-REX Group, Inc. | Initial Revenue | 21.1% | 23.6% | NA | Equity | |||||
Transactis, Inc. | Expansion | 23.8% | 24.2% | 24.5% | Equity | |||||
Trice Medical, Inc. | Initial Revenue | 24.8% | 27.6% | 27.7% | Equity | |||||
WebLinc, Inc. | Expansion | 38.0% | 38.0% | 29.2% | Equity | |||||
Zipnosis, Inc | Initial Revenue | 25.4% | 25.4% | 26.3% | Equity | |||||
* Spongecell, Inc. merged into Flashtalking in January 2018.
As of December 31, 2017 and 2016, all of the Company’s assets were located in the United States.
64
SAFEGUARD SCIENTIFICS, INC.
NOTES TO CONSOLIDATED FINANCIAL STATEMENTS – (Continued)
15. Selected Quarterly Financial Information (Unaudited)
Three Months Ended | |||||||||||||||
March 31 | June 30 | September 30 | December 31 | ||||||||||||
(In thousands, except per share data) | |||||||||||||||
2017: | |||||||||||||||
General and administrative expense | $ | 4,947 | $ | 4,486 | $ | 3,758 | $ | 3,940 | |||||||
Operating loss | (4,947 | ) | (4,486 | ) | (3,758 | ) | (3,940 | ) | |||||||
Other income (loss), net | 249 | (89 | ) | (379 | ) | (120 | ) | ||||||||
Interest income | 801 | 1,087 | 1,004 | 984 | |||||||||||
Interest expense | (1,198 | ) | (2,112 | ) | (2,643 | ) | (2,667 | ) | |||||||
Equity income (loss) | (17,002 | ) | (23,497 | ) | (12,874 | ) | (12,985 | ) | |||||||
Net loss before income taxes | (22,097 | ) | (29,097 | ) | (18,650 | ) | (18,728 | ) | |||||||
Income tax benefit (expense) | — | — | — | — | |||||||||||
Net loss | $ | (22,097 | ) | $ | (29,097 | ) | $ | (18,650 | ) | $ | (18,728 | ) | |||
Net loss per share (a) | |||||||||||||||
Basic | $ | (1.08 | ) | $ | (1.43 | ) | $ | (0.91 | ) | $ | (0.91 | ) | |||
Diluted | $ | (1.08 | ) | $ | (1.43 | ) | $ | (0.91 | ) | $ | (0.91 | ) | |||
2016: | |||||||||||||||
General and administrative expense | $ | 5,228 | $ | 4,849 | $ | 4,687 | $ | 3,928 | |||||||
Operating loss | (5,228 | ) | (4,849 | ) | (4,687 | ) | (3,928 | ) | |||||||
Other income (loss), net | — | 659 | (2,405 | ) | 64 | ||||||||||
Interest income | 420 | 527 | 513 | 615 | |||||||||||
Interest expense | (1,149 | ) | (1,155 | ) | (1,161 | ) | (1,169 | ) | |||||||
Equity income (loss) | (9,495 | ) | 43,794 | (16,345 | ) | (17,283 | ) | ||||||||
Net income (loss) before income taxes | (15,452 | ) | 38,976 | (24,085 | ) | (21,701 | ) | ||||||||
Income tax benefit (expense) | — | — | — | — | |||||||||||
Net income (loss) | $ | (15,452 | ) | $ | 38,976 | $ | (24,085 | ) | $ | (21,701 | ) | ||||
Net income (loss) per share (a) | |||||||||||||||
Basic | $ | (0.76 | ) | $ | 1.92 | $ | (1.18 | ) | $ | (1.07 | ) | ||||
Diluted | $ | (0.76 | ) | $ | 1.70 | $ | (1.18 | ) | $ | (1.07 | ) | ||||
(a) | Per share amounts for the quarters have each been calculated separately. Accordingly, quarterly amounts may not add to the annual amounts because of differences in the average common shares outstanding during each period. Additionally, in regard to diluted per share amounts only, quarterly amounts may not add to the annual amounts because of the inclusion of the effect of potentially dilutive securities only in the periods in which such effect would have been dilutive, and because of the adjustments to net income (loss) for the dilutive effect of partner company common stock equivalents and convertible securities. |
16. Subsequent Events
In January 2018, Spongecell, Inc. merged into Flashtalking, a privately-held company. The Company received Flashtalking ordinary shares equal to approximately 10% of Flashtalking’s issued share capital at the time of the closing. The Company’s final number of Flashtalking shares will be subject to customary indemnification and working capital provisions and agreements.
During 2017, the Company sold its interest in Nexxt, Inc. (formerly known as Beyond.com) for $26.0 million. The Company received an initial $15.5 million for its equity interest and a three-year, $10.5 million term loan. As of December 31, 2017, the note was fully reserved. Subsequent to year-end, Nexxt repaid the term loan in full. The Company will recognize a gain in the first quarter of 2018 on this transaction.
65
Item 9. Changes in and Disagreements With Accountants on Accounting and Financial Disclosure
None.
Item 9A. Controls and Procedures
(a) Evaluation of Disclosure Controls and Procedures
We maintain disclosure controls and procedures, as such term is defined in Rules 13a-15(e) and 15d-15(e) of the Securities Exchange Act of 1934 (the “Exchange Act”), that are designed to provide reasonable assurance that the information required to be disclosed by us in reports filed under the Exchange Act is (i) recorded, processed, summarized and reported within the time periods specified in the SEC’s rules and forms and (ii) accumulated and communicated to our management, including the Principal Executive Officer and Principal Financial Officer, as appropriate to allow timely decisions regarding disclosure. A controls system cannot provide absolute assurance that the objectives of the controls system are met, and no evaluation of controls can provide absolute assurance that all control issues and instances of fraud, if any, within a company have been detected. Our management, with the participation of our Principal Executive Officer and Principal Financial Officer, evaluated the effectiveness of our disclosure controls and procedures as of December 31, 2017. Based on that evaluation, the Principal Executive Officer and Principal Financial Officer concluded that our disclosure controls and procedures as of December 31, 2017 are functioning effectively.
Our business strategy involves the acquisition of new businesses on an ongoing basis, most of which are young, growing companies. Typically, these companies historically have not had all of the controls and procedures they would need to comply with the requirements of the Exchange Act and the rules promulgated thereunder. These companies also frequently develop new products and services. Following an acquisition, or the launch of a new product or service, we work with the company’s management to implement necessary controls and procedures.
(b) Management’s Report on Internal Control Over Financial Reporting
Management is responsible for establishing and maintaining adequate internal control over financial reporting. Internal control over financial reporting is a process designed to provide reasonable assurance regarding the reliability of financial reporting and the preparation of financial statements for external purposes in accordance with generally accepted accounting principles. Our internal control over financial reporting includes those policies and procedures that pertain to the maintenance of records that, in reasonable detail, accurately and fairly reflect the transactions and dispositions of our assets; provide reasonable assurance that transactions are recorded as necessary to permit preparation of financial statements in accordance with generally accepted accounting principles, and that our receipts and expenditures are being made only in accordance with authorizations of our management and directors; and provide reasonable assurance regarding prevention or timely detection of unauthorized acquisition, use, or disposition of our assets that could have a material effect on the financial statements.
Because of its inherent limitations, internal control over financial reporting may not prevent or detect misstatements. Also, projections of any evaluation of effectiveness to future periods are subject to the risk that controls may become inadequate because of changes in conditions, or that the degree of compliance with the policies or procedures may deteriorate.
Management assessed the effectiveness of the Company’s internal control over financial reporting as of December 31, 2017. In making this assessment, management used the framework established in Internal Control — Integrated Framework (2013) issued by the Committee of Sponsoring Organizations of the Treadway Commission (COSO). As a result of this assessment and based on the criteria in the COSO framework, management has concluded that, as of December 31, 2017, the Company’s internal control over financial reporting was effective.
Our independent registered public accounting firm, KPMG LLP, has audited the effectiveness of our internal control over financial reporting as of December 31, 2017. Their opinion on the effectiveness of our internal control over financial reporting and their opinion on our Consolidated Financial Statements are included in Item 8 in this Form 10-K.
(c) Change in Internal Control over Financial Reporting
No change in our internal control over financial reporting occurred during our most recent fiscal quarter that has materially affected, or is reasonably likely to materially affect, our internal control over financial reporting.
Item 9B. Other Information
None.
66
PART III
Item 10. Directors, Executive Officers and Corporate Governance
Incorporated by reference to the portions of our Definitive Proxy Statement entitled “Election of Directors,” “Corporate Governance and Board Matters” and “Section 16(a) Beneficial Ownership Reporting Compliance.” Information about our Executive Officers is included in Annex to Part I above.
Item 11. Executive Compensation
Incorporated by reference to the portions of our Definitive Proxy Statement entitled “Compensation Discussion and Analysis,” “Compensation Committee Report” and “Executive Compensation.”
Item 12. Security Ownership of Certain Beneficial Owners and Management and Related Stockholder Matters
Security ownership of certain beneficial owners is incorporated by reference to the portion of our Definitive Proxy Statement entitled “Stock Ownership of Certain Beneficial Owners, Directors and Officers.”
SECURITIES AUTHORIZED FOR ISSUANCE UNDER EQUITY COMPENSATION PLANS
Our equity compensation plans provide a broad-based program designed to attract and retain talent while creating alignment with the long-term interests of our shareholders. Employees at all levels participate in our equity compensation plans. In addition, members of our Board and members of our Advisory Board receive equity grants for their service on our Board and Advisory Board, respectively. Members of our Board also receive deferred stock unit ("DSU") awards and are eligible to defer directors’ fees and receive DSUs with a value equal to the directors’ fees deferred and matching DSUs equal to 25% of the directors’ fees deferred.
Our 2001 Associates Equity Compensation Plan (“2001 Plan”) provided for the grant of nonqualified stock options, stock appreciation rights, restricted stock, performance units, and other stock-based awards to employees, consultants or advisors of Safeguard and its subsidiaries, provided that no grants could be made under this plan to executive officers or directors of Safeguard. Under the NYSE rules that were in effect at the time this plan was adopted in 2001, shareholder approval of the plan was not required. Except for the persons eligible to participate in the 2001 Plan and the inability to grant incentive stock options under the 2001 Plan, the terms of the 2001 Plan are substantially the same as the other equity compensation plans approved by our shareholders (which are described herein or have been described in previous filings).
A total of 900,000 shares of our common stock were authorized for issuance under the 2001 Plan. At December 31, 2017, 129,902 shares were subject to outstanding options and performance stock units ("PSUs"), no shares were available for future issuance, and 583,772 shares had been issued under the 2001 Plan. The 2001 Plan expired by its terms on February 21, 2011. Equity grants previously awarded under this plan that remained outstanding at December 31, 2017, continue to be administered in accordance with the terms of the grants. Any portions of outstanding equity grants under the 2001 Plan that expire or become unexercisable for any reason shall be canceled and shall be unavailable for future issuance.
During 2011, 2013 and 2016, the Compensation Committee granted “employee inducement” awards to four then newly hired executives. The awards were granted outside of Safeguard’s existing equity compensation plans in accordance with NYSE rules. The employee inducement awards consisted of: (i) options that were outstanding at January 1, 2017 to purchase up to an aggregate of 92,230 shares of Safeguard common stock and (ii) 23,083 shares of restricted stock and 23,083 performance stock units that were granted as inducement awards during 2016. All of the “employee inducement” awards that were granted as stock options have a per share exercise price equal to the average of the high and low prices of Safeguard common stock on the grant date. 38,750 of such stock options were granted with an eight-year term and 53,480 of such stock options were granted with a 10-year term. The 23,083 performance stock units were granted with a 10-year term.
During 2017, there were no shares underlying inducement stock options that were exercised, 6,508 shares of restricted stock underlying certain inducement awards vested and 22,230 of the shares of underlying certain inducement stock options expired.
Of the shares underlying the “employee inducement” awards that were outstanding at December 31, 2017, 40,583 shares (which include both stock options and shares of restricted stock) were subject to time-based vesting, with an aggregate of: (i) 2,188 shares vesting on the first anniversary of the grant date and 6,562 shares vesting in 36 equal monthly installments thereafter, and (ii) 2,188 shares vesting on the second anniversary of the grant date and 6,562 shares vesting in 36 equal monthly installments thereafter, and (iii) 5,771 shares vesting on the first anniversary of the fifteenth day of the first month following the quarter in which the employee began his or her employment and 17,312 shares vesting in 12 quarterly
67
installments thereafter. Of the remaining shares underlying the “employee inducement” awards that were outstanding at December 31, 2017, 75,583 vest based on the aggregate cash produced as a result of monetizations involving certain of our partner companies relative to the amount of cash deployed in connection with such partner companies. With the exception of the market-based vesting or capital-return based vesting provisions, the terms and provisions of the employee inducement awards are substantially the same as equity grants previously awarded to other executives under Safeguard’s equity compensation plans.
The following table provides information as of December 31, 2017 about the securities authorized for issuance under our equity compensation plans. The material features of our equity compensation plans are described in Note 7 to the Consolidated Financial Statements filed as part of our Annual Report on Form 10-K for the year ended December 31, 2017
.
Equity Compensation Plan Information | |||||||
Plan Category | Number of Securities to Be Issued Upon Exercise of Outstanding Options, Warrants and Rights (1) (a) | Weighted-Average Exercise Price of Outstanding Options, Warrants and Rights (2) (b) | Number of Securities Remaining Available for Future Issuance Under Equity Compensation Plans (Excluding Securities Reflected in Column (a)) (c) | ||||
Equity compensation plans approved by security holders (3) | 1,336,670 | $14.8500 | 1,924,755 | ||||
Equity compensation plans not approved by security holders (4) | 222,985 | $14.4440 | — | ||||
Total | 1,559,655 | $14.7384 | 1,924,755 | ||||
(1) | Includes a total of 900,380 shares underlying PSUs and DSUs awarded for no consideration and 66,821 shares underlying DSUs awarded to directors in lieu of all or a portion of directors’ fees. |
(2) | The weighted average exercise price calculation excludes 967,201 shares underlying outstanding DSUs and PSUs included in column (a) which are payable in stock, on a one-for-one basis. |
(3) | Represents awards granted under the 1999 Equity Compensation Plan and the 2014 Plan and shares available for issuance under the 2014 Plan. |
(4) | Includes awards granted under the 2001 Plan and 93,0833 “employee inducement” awards. |
Item 13. Certain Relationships and Related Transactions, and Director Independence
Incorporated by reference to the portions of the Definitive Proxy Statement entitled “Corporate Governance Principles and Board Matters – ‘Board Independence’ and “Review and Approval of Transactions with Related Persons.”
Item 14. Principal Accountant Fees and Services
Incorporated by reference to the portion of the Definitive Proxy Statement entitled “Independent Public Accountant – Audit Fees.”
68
PART IV
Item 15. Exhibits and Financial Statement Schedules
(a) Consolidated Financial Statements and Schedules
Incorporated by reference to Item 8 of this Report on Form 10-K.
(b) Exhibits
The exhibits required to be filed as part of this Report are listed in the exhibit index below.
(c) Financial Statement Schedules
None.
Exhibits
The following is a list of exhibits required by Item 601 of Regulation S-K filed as part of this Report. For exhibits that previously have been filed, the Registrant incorporates those exhibits herein by reference. The exhibit table below includes the Form Type and Filing Date of the previous filing and the location of the exhibit in the previous filing which is being incorporated by reference herein. Documents which are incorporated by reference to filings by parties other than the Registrant are identified in footnotes to this table.
Incorporated Filing Reference | |||||
Exhibit Number | Description | Form Type & Filing Date | Original Exhibit Number | ||
3.1.1 | Form 8-K 10/25/07 | 3.1 | |||
3.1.2 | Form 8-K 8/27/09 | 3.1 | |||
3.1.3 | Form 10-Q 4/25/14 | 3.1 | |||
3.1.4 | Form 8-K 2/20/18 | 3.1 | |||
3.2 | Form 8-K 2/13/18 | 3.1 | |||
4.1.1 | Form 8-K 11/20/12 | 4.1 | |||
4.1.2 | Form 8-K 2/20/18 | 4.1 | |||
10.1* | Form 10-Q 11/6/08 | 10.4 | |||
10.2 | Form 10-Q 11/6/08 | 10.5 | |||
10.3* | Form 10-Q 7/25/14 | 10.1 | |||
10.4* | Form 10-K 3/19/09 | 10.4 | |||
10.5* | Form 8-K 4/25/08 | 10.1 | |||
10.6* | Form 10-Q 4/24/15 | 10.2 | |||
10.7.1* | Form 8-K 5/29/08 | 10.1 | |||
10.7.2* | Form 10-K 3/19/09 | 10.9.2 | |||
10.7.3* | Form 10-K 3/11/13 | 10.9.3 | |||
10.8.1* | Form 10-K 3/19/09 | 10.12 | |||
10.8.2* | Form 10-K 3/16/10 | 10.11.2 | |||
69
10.8.3* | Form 10-K 3/11/13 | 10.10.3 | |||
10.9.1* | Form 8-K 1/7/14 | 10.1 | |||
10.10.1* | Form 10-Q 7/26/13 | 10.2 | |||
10.11.1 | Form 8-K 5/28/09 | 10.1 | |||
10.11.2 | Form 8-K 1/4/11 | 10.1 | |||
10.11.3 | Form 10-Q 7/28/11 | 10.2 | |||
10.11.4 | Form 8-K 12/27/12 | 10.1 | |||
10.11.5 | Form 8-K 12/23/14 | 10.1 | |||
10.11.6 | Form 8-K 12/29/15 | 10.1 | |||
10.12 | Form 10-K 3/13/06 | 10.36 | |||
10.13 | Form 8-K 5/18/11 | 10.1 | |||
10.14 | Form 10-Q 4/24/15 | 10.1 | |||
14.1 † | — | — | |||
21.1 † | — | — | |||
23.1 † | — | — | |||
31.1 † | — | — | |||
31.2 † | — | — | |||
32.1 ‡ | — | — | |||
32.2 ‡ | — | — | |||
101 | — | — | |||
† | Filed herewith |
‡ | Furnished herewith |
* | These exhibits relate to management contracts or compensatory plans, contracts or arrangements in which directors and/or executive officers of the Registrant may participate. |
70
SIGNATURES
Pursuant to the requirements of Section 13 or 15(d) of the Securities Exchange Act of 1934, the Registrant has duly caused this report to be signed on its behalf by the undersigned, thereunto duly authorized.
SAFEGUARD SCIENTIFICS, INC. | ||||
By: | STEPHEN T. ZARRILLI | |||
STEPHEN T. ZARRILLI | ||||
President and Chief Executive Officer | ||||
Dated: March 7, 2018
Pursuant to the requirements of the Securities Exchange Act of 1934, this report has been signed below by the following persons on behalf of the Registrant and in the capacities and on the dates indicated.
Signature | Title | Date | ||
STEPHEN T. ZARRILLI | President and Chief Executive Officer and Director (Principal Executive Officer) | March 7, 2018 | ||
Stephen T. Zarrilli | ||||
JEFFREY B. MCGROARTY | Senior Vice President and Chief Financial Officer (Principal Financial and Accounting Officer) | March 7, 2018 | ||
Jeffrey B. McGroarty | ||||
JULIE A. DOBSON | Director | March 7, 2018 | ||
Julie A. Dobson | ||||
STEPHEN FISHER | Director | March 7, 2018 | ||
Stephen Fisher | ||||
GEORGE MACKENZIE | Director | March 7, 2018 | ||
George MacKenzie | ||||
MAUREEN MORRISON | Director | March 7, 2018 | ||
Maureen Morrison | ||||
JOHN J. ROBERTS | Director | March 7, 2018 | ||
John J. Roberts | ||||
ROBERT J. ROSENTHAL | Chairman of the Board of Directors | March 7, 2018 | ||
Robert J. Rosenthal | ||||
71