Attached files
| file | filename |
|---|---|
| EX-32.1 - EXHIBIT 32.1 - Five9, Inc. | a123117exhibit321.htm |
| EX-31.2 - EXHIBIT 31.2 - Five9, Inc. | a123117exhibit312.htm |
| EX-31.1 - EXHIBIT 31.1 - Five9, Inc. | a123117exhibit311.htm |
| EX-23.1 - EXHIBIT 23.1 - Five9, Inc. | a123117exhibit231.htm |
| EX-21.1 - EXHIBIT 21.1 - Five9, Inc. | a123117exhibit211.htm |
| EX-10.16 - EXHIBIT 10.16 - Five9, Inc. | a123117exhibit1016.htm |
| EX-10.14 - EXHIBIT 10.14 - Five9, Inc. | a123117exhibit1014.htm |
UNITED STATES SECURITIES AND EXCHANGE COMMISSION
Washington, D.C. 20549
FORM 10-K
(Mark One)
x | ANNUAL REPORT PURSUANT TO SECTION 13 OR 15(d) OF THE SECURITIES EXCHANGE ACT OF 1934 |
For the fiscal year ended December 31, 2017
OR
o | TRANSITION REPORT PURSUANT TO SECTION 13 OR 15(d) OF THE SECURITIES EXCHANGE ACT OF 1934 |
For the transition period from to
Commission File Number: 001-36383
Five9, Inc.
(Exact Name of Registrant as Specified in Its Charter)
Delaware | 94- 3394123 | |
(State or Other Jurisdiction of Incorporation or Organization) | (I.R.S. Employer Identification No.) | |
Bishop Ranch 8
4000 Executive Parkway, Suite 400
San Ramon, CA 94583
(Address of Principal Executive Offices) (Zip Code)
(925) 201-2000
(Registrant’s Telephone Number, Including Area Code)
Securities registered pursuant to Section 12(b) of the Act: | ||
Title of each class | Name of each exchange on which registered | |
Common Stock, $0.001 par value | The NASDAQ Global Market | |
Securities registered pursuant to Section 12(g) of the Act: None | ||
Indicate by check mark if the registrant is a well-known seasoned issuer, as defined in Rule 405 of the Securities Act. Yes: x No: o
Indicate by check mark if the registrant is not required to file reports pursuant to Section 13 or Section 15(d) of the Act. Yes: o No: x
Indicate by check mark whether the registrant: (1) has filed all reports required to be filed by Section 13 or 15(d) of the Securities Exchange Act of 1934 during the preceding 12 months (or for such shorter period that the registrant was required to file such reports), and (2) has been subject to such filing requirements for the past 90 days. Yes: x No: o
Indicate by check mark whether the registrant has submitted electronically and posted on its corporate Web site, if any, every Interactive Data File required to be submitted and posted pursuant to Rule 405 of Regulation S-T (§232.405 of this chapter) during the preceding 12 months (or for such shorter period that the registrant was required to submit and post such files). Yes: x No: o
Indicate by check mark if disclosure of delinquent filers pursuant to Item 405 of Regulation S-K (§ 229.405 of this chapter) is not contained herein, and will not be contained to the best of registrant’s knowledge, in definitive proxy or information statements incorporated by reference in Part III of this Form 10-K or any amendment to this Form 10-K. x
Indicate by check mark whether the registrant is a large accelerated filer, an accelerated filer, a non-accelerated filer, a smaller reporting company, or an emerging growth company. See definition of “large accelerated filer,” “accelerated filer,” “smaller reporting company,” and “emerging growth company” in Rule 12b-2 of the Exchange Act.
Large Accelerated Filer | x | Accelerated Filer | o | ||||
Non-accelerated filer | o | (Do not check if a smaller reporting Company) | Smaller Reporting Company | o | |||
Emerging growth company | o | ||||||
If an emerging growth company, indicate by check mark if the registrant has elected not to use the extended transition period for complying with any new or revised financial accounting standards provided pursuant to Section 13(a) of the Exchange Act. o
Indicate by check mark whether the registrant is a shell company (as defined in Rule 12b-2 of the Exchange Act). Yes: o No: x
The aggregate market value of registrant’s common stock held by non-affiliates of the registrant based upon the closing sale price on the NASDAQ Global Market on June 30, 2017, the last business day of the Registrant’s most recently completed second fiscal quarter, was approximately $1,040.5 million. Shares held by each executive officer, director and their affiliated holders and by each other person (if any) who owns 10% of the outstanding common stock or more have been excluded in that such persons may be deemed to be affiliates. This determination of affiliate status is not necessarily a conclusive determination for other purposes.
As of February 22, 2018, there were 56,734,715 shares of the Registrant’s common stock, par value $0.001 per share, outstanding.
DOCUMENTS INCORPORATED BY REFERENCE
Portions of the registrant’s definitive Proxy Statement for the 2018 Annual Stockholders’ Meeting, which the registrant expects to file with the Securities and Exchange Commission within 120 days of December 31, 2017, are incorporated by reference into Part III (Items 10, 11,12, 13 and 14) of this Annual Report on Form 10-K.
FIVE9, INC.
FORM 10-K
TABLE OF CONTENTS
1
SPECIAL NOTE REGARDING FORWARD-LOOKING STATEMENTS
This Annual Report on Form 10-K contains forward-looking statements within the meaning of Section 27A of the Securities Act of 1933 and Section 21E of the Securities Exchange Act of 1934, which involve substantial risks and uncertainties. These statements reflect the current views of our senior management with respect to future events and our financial performance. These forward-looking statements include statements with respect to our business, expenses, strategies, losses, growth plans, product and client initiatives, market growth projections, and our industry. Statements that include the words “expect,” “intend,” “plan,” “believe,” “project,” “forecast,” “estimate,” “may,” “should,” “anticipate” and similar statements of a future or forward-looking nature identify forward-looking statements for purposes of the federal securities laws or otherwise.
Forward-looking statements address matters that involve risks and uncertainties. Accordingly, there are or will be important factors that could cause our actual results to differ materially from those indicated in these statements. These factors include the information set forth under the caption “Risk Factors” and elsewhere in this report, including the following:
• | our quarterly and annual results may fluctuate significantly, may not fully reflect the underlying performance of our business and may result in decreases in the price of our common stock; |
• | if we are unable to attract new clients or sell additional services and functionality to our existing clients, our revenue and revenue growth will be harmed; |
• | our recent rapid growth may not be indicative of our future growth, and even if we continue to grow rapidly, we may fail to manage our growth effectively; |
• | failure to adequately expand our sales force could impede our growth; |
• | if we fail to manage our technical operations infrastructure, our existing clients may experience service outages, our new clients may experience delays in the deployment of our solution and we could be subject to, among other things, claims for credits or damages; |
• | security breaches and improper access to or disclosure of our data or our clients’ data, or other cyber attacks on our systems, could result in litigation and regulatory risk, harm our reputation and adversely affect our business; |
• | the markets in which we participate are highly competitive, and if we do not compete effectively, our operating results could be harmed; |
• | if our existing clients terminate their subscriptions or reduce their subscriptions and related usage, our revenues and gross margins will be harmed and we will be required to spend more money to grow our client base; |
• | our growth depends in part on the success of our strategic relationships with third parties and our failure to successfully grow and manage these relationships could harm our business; |
• | we are establishing a network of master agents and resellers to sell our solution; our failure to effectively develop, manage, and maintain this network could materially harm our revenues; |
• | we sell our solution to larger organizations that require longer sales and implementation cycles and often demand more configuration and integration services or customized features and functions that we may not offer, any of which could delay or prevent these sales and harm our growth rates, business and operating results; |
• | because a significant percentage of our revenue is derived from existing clients, downturns or upturns in new sales will not be immediately reflected in our operating results and may be difficult to discern; |
• | we rely on third-party telecommunications and internet service providers to provide our clients and their customers with telecommunication services and connectivity to our cloud contact center software, any increase in the cost thereof, reduction in efficacy or any failure by these service providers to provide reliable services could cause us to lose customers, increase our customers’ cost of using our solution and subject us to, among other things, claims for credits or damages; |
• | we have a history of losses and we may be unable to achieve or sustain profitability; |
• | we may not be able to secure additional financing on favorable terms, or at all, to meet our future capital needs; and |
• | failure to comply with laws and regulations could harm our business and our reputation. |
The foregoing factors should not be construed as exhaustive and should be read together with the other cautionary statements included in this report. If one or more of these or other risks or uncertainties materialize, or if
2
our underlying assumptions prove to be incorrect, our actual results may differ materially from what we anticipate. You should not place undue reliance on our forward-looking statements. Any forward-looking statements you read in this report reflect our views only as of the date of this report with respect to future events and are subject to these and other risks, uncertainties and assumptions relating to our operations, results of operations, growth strategy and liquidity. We undertake no obligation to update any forward-looking statements made in this report to reflect events or circumstances after the date of this report or to reflect new information or the occurrence of unanticipated events, except as required by law.
3
PART I
ITEM 1. Business
Overview
Five9 is a pioneer and leading provider of cloud software for contact centers. Since our inception, we have exclusively focused on delivering our platform in the cloud and are disrupting a significantly large market by replacing legacy on-premise contact center systems. Contact centers are vital hubs of interaction between organizations and their customers and, therefore, are essential to delivering successful customer service, sales and marketing strategies. Our mission is to empower organizations to transform their contact centers into customer engagement centers of excellence, while improving business agility and significantly lowering the cost and complexity of their contact center operations. Our purpose-built, highly scalable and secure Virtual Contact Center, or VCC, cloud platform delivers a comprehensive suite of easy-to-use applications that enable the breadth of contact center-related customer service, sales and marketing functions. We have become an established leader in the cloud contact center market, facilitating more than three billion interactions between our more than 2,000 clients and their customers per year. We believe our ability to combine software and telephony into a single unified platform that is delivered in the cloud creates a significant advantage.
Based on our current product offering and historical average annual recurring revenue per seat, we believe that the market for our solution is approximately $24 billion annually worldwide. Gartner estimated that there are approximately 15.8 million contact center agents worldwide. Furthermore, we believe cloud penetration of the contact center market in North America is between 10% to 15%. We believe adoption of cloud contact center software solutions is increasing rapidly as a result of several distinct trends. The increasing adoption of cloud computing, especially within customer relationship management, or CRM, is creating strong demand for integrated cloud contact center software solutions. In addition, cloud contact center software solutions now offer the functionality required by large, complex enterprise contact centers. Furthermore, we believe organizations typically refresh their contact center systems every 8 to 10 years, which provides an opportunity for cloud solutions to replace legacy on-premise contact center systems when these replacement decisions arise. On-premise systems require large up-front investments, long deployment cycles and are burdensome to maintain. These systems are also often inflexible, complex, and require significant duplication of effort and integration across multiple sites. This creates substantial challenges for clients with on-premise contact center systems to implement new features or upgrades, or to integrate with adjacent cloud solutions. As a result, cloud contact center software solutions are replacing legacy on-premise contact center systems.
Our solution, which is comprised of our Virtual Contact Center, or VCC, cloud platform and applications, allows simultaneous management and optimization of customer interactions across voice, chat, email, web, social media and mobile channels, either directly or through our application programming interfaces, or APIs. Our VCC cloud platform matches each customer interaction with an appropriate agent resource and delivers relevant customer data to the agent in real-time through integrations with adjacent enterprise applications, such as CRM software, to optimize the customer experience and improve agent productivity. Our solution ensures our clients always have the latest version of our software. Delivered on-demand, our solution enables our clients to quickly deploy agent seats in any geographic location with only a computer, headset and broadband internet connection, and rapidly adjust the number of contact center agent seats in response to changing business requirements. Unlike legacy on-premise contact center systems, our solution requires minimal up-front investment, can be rapidly deployed and is maintained by us in the cloud.
Our sales model consists of a field sales team that sells our solution into larger opportunities and a telesales team that sells our solution into smaller opportunities. We have developed a proven, high velocity, metrics-driven sales and marketing strategy, which is designed to effectively identify, qualify and close sales opportunities. To complement this go-to-market strategy, we have developed a large ecosystem of technology and system integrator partners and independent software vendors to help increase awareness of our solution in the market and drive incremental sales opportunities with new and existing clients. We are establishing a network of master sales agents, which provide sales leads, and resellers, which sell our solution to new and existing clients. We expect that this network will enable us to attract additional clients, and we expect our resellers will assist us in expanding internationally.
4
We provide our solution through a software-as-a-service, or SaaS, business model with recurring subscriptions based primarily on the number of agent seats and minutes of usage, as well as the specific functionalities and applications our clients deploy.
We have achieved significant growth in recent periods. For the years ended December 31, 2017, 2016 and 2015, our revenues were $200.2 million, $162.1 million and $128.9 million, respectively, representing year-over-year growth of 24% and 26%, respectively. We incurred net losses of $9.0 million, $11.9 million and $25.8 million for the years ended December 31, 2017, 2016 and 2015, respectively, as a result of increased investment in our growth. As of December 31, 2017, 2016 and 2015, our total assets were $128.2 million, $105.2 million and $99.2 million, respectively. Our recurring revenue model combined with our Annual Dollar-Based Retention Rate, which was 98% as of December 31, 2017, have enhanced our ability to forecast our financial performance and plan future investments. For a description of how our Annual Dollar-Based Retention Rate is calculated, please refer to ITEM 7 “Management’s Discussion and Analysis of Financial Condition and Results of Operations” in Part II of this Annual Report on Form 10-K.
We operate in a single reportable segment. Please refer to the geographical information for each of the last three years in Note 11 of the notes to our consolidated financial statements. Please refer to the discussion of risks related to our foreign operations in the section entitled “ITEM 1A. Risk Factors.”
Industry Overview
Contact centers must evolve in today’s rapidly changing technology environment
Contact centers are vital hubs of interaction between organizations and their customers and are mission critical to the successful execution of customer service, sales and marketing strategies. Both consumer and enterprise technology trends are driving an evolution in contact center strategies. Today, customers increasingly expect seamless communications across multiple channels, including voice, chat, email, web, social media and mobile, thereby increasing the number of touch points between organizations and their customers. Along with these additional channels, customers expect personalized interactions to enhance overall customer service. Delivering customer interactions to an appropriate agent resource, while delivering relevant customer data to the agent in real-time, is crucial in providing effective customer service.
As the needs of organizations and their customers have become more sophisticated, so have the demands for contact centers. Striving for greater efficiency in meeting demand, the use of remote agents and geographically dispersed contact centers has proliferated. To increase capacity and undertake upgrades, on-premise contact centers must unify geographically dispersed agents and hardware, which requires building out teams and facilities to forecasted future capacity and is a long-term undertaking. In order to meet these changing demands, contact centers must upgrade their existing on-premise contact center systems or migrate their contact center operations to the cloud.
Legacy on-premise contact center systems are inefficient
The majority of contact center operations today rely on legacy on-premise contact center systems that include business workflows, as well as hardware and software architectures designed more than a decade ago. Legacy on-premise contact center systems are typically developed for location-specific deployments and are often costly, inflexible, complex and require significant duplication of effort and integration across multiple sites. Key shortcomings of these legacy systems include:
• | Long and complex implementation and upgrade cycles. Implementation of legacy on-premise contact center systems requires long deployment timelines and complex integrations with other enterprise systems. Once these systems have been deployed, integrated and customized, upgrades and modifications can be extremely challenging. Due to these customized solutions and complex integrations, clients will often forego or postpone upgrades for fear of disabling key functionality. If they do choose to upgrade, clients are often required to rebuild integrations in order to retain full functionality, which frequently results in significant expenditures of time, resources and capital. |
• | Inflexible resource deployment. As organizations expand globally, they require the ability to easily manage remote agents and quickly adjust agent seats to accommodate peak call volumes. Most legacy on-premise contact center systems do not provide these capabilities and, as a result, their clients are typically unable to quickly scale their contact center operations in response to changing business needs. This often results in costly over-building of additional capacity to accommodate peak volumes. |
5
• | Duplicative technology stacks across multiple sites. Organizations must integrate multiple contact center sites to drive efficiency and create a unified customer view. Organizations running on-premise systems often find themselves with dissimilar systems at each site resulting in non-integrated and inefficient silos of technology. Moreover, technology at each site is in a constant state of change over time. The initial and ongoing integration of these contact center sites for such organizations requires significant ongoing investment. |
Our Opportunity
Based on our current product offerings and historical average annual recurring revenue per seat, we believe that the market for our solution is approximately $24 billion annually worldwide. Gartner estimated that there are approximately 15.8 million contact center agents worldwide. Furthermore, we believe cloud penetration of the contact center market in North America is between 10% to 15%. We believe the market for contact center solutions is undergoing a significant shift to the cloud driven primarily by:
• | Adoption of cloud CRM solutions |
• | Sophistication of cloud contact center software solutions |
• | Technology refresh of on-premise contact center systems |
• | Simplicity of the cloud vs. complexity of legacy on-premise |
Adoption of cloud CRM solutions has grown as organizations seek to enhance their sales strategies, increase business agility and reduce costs. CRM solutions typically integrate deeply with contact center solutions to provide agents with real-time access to customer information. The shift to cloud CRM and ease of integration are creating significant demand for integrated cloud contact center software solutions. As the market opportunity has expanded, cloud contact center software solutions have evolved to meet the requirements of large, complex enterprise contact centers. We believe organizations have typically refreshed their on-premise contact center systems every 8 to 10 years. Given the prevalence of cloud CRM and the capabilities of cloud-based contact centers, cloud solutions are increasingly considered as a replacement alternative to legacy on-premise contact center systems during these refresh decisions.
Our Solution
We deliver a comprehensive, end to end cloud software solution for contact centers. Our solution enables organizations of all sizes to enhance the customer experience through omnichannel engagement, improve customer service, increase sales performance and improve the efficiency and cost of their operations. Our solution is designed to enable customers to seamlessly engage through voice, video, website, mobile, chat, email, click-to-call, callback, social and messaging. Our agent interface, built on HTML5, is an intuitive browser-based design providing easy visualization of customer profile, context and cross channel history. Our Freedom platform provides a modern micro services-based open enterprise architecture built with representational state transfer, or REST, API’s and powerful software development kits, or SDKs, enabling customers, partners and developers to deliver powerful solutions that bridge the context gap between their unique systems. We provide high voice quality with our Agent Connect service and our call-by-call carrier optimization routing. Our web analytics capabilities enable businesses to see what visitors are doing live on their website, in a mobile application, or in interactions with their agents. It provides customer journey analytics and lifetime journey mapping with full insight across all channels and enables enterprises to address online presence for both buying and customer care use cases. Combined with our robust natural language processing, or NLP, which can determine sentiment and reasons for contact and our next best actions engine for real-time recommendations, enterprises are able to transform their customer’s experience from reactive interactions into trusted, proactive engagements, or proactive analytics. Our complete end-to-end capabilities include computer-telephony integration, or CTI, interactive voice response, or IVR, visual IVR, automatic contact distribution, or ACD, with skills-based routing, reporting, dashboards, agent and supervisor desktop, dialer, mobile applications for contact center and customer, pre-built CRM integrations, quality management, speech and desktop analytics, customer surveys and workforce management.
Our cloud contact center solution provides the following key elements:
• | Rapid implementation, seamless updates and pre-built integrations. Our solution is designed to be deployed quickly and seamlessly with minimal disruption to a client’s operations. The pre-built integrations with leading CRM and other enterprise applications reduce the complexity and burden-of-effort of integrating with the client’s business applications. The solution is designed to be seamlessly updated so that |
6
clients are always on the latest version of the software, while maintaining their existing configurations, ensuring minimal disruption to the client’s contact center operations.
• | Highly flexible platform. Our solution provides easy administration, configuration and role-based functionalities for agents, supervisors and administrators enabling the rapid adjustment of contact center resources to meet a changing mix of contact channels and peaks-and-troughs in contact volumes. |
• | Scalable, secure and reliable multi-tenant architecture. Our solution provides organizations of all sizes with the robust contact center functionality, scalability, flexibility and security required in the most sophisticated and distributed environments. |
Our solution provides the following key benefits to clients:
• | Higher agent productivity. Our solution empowers agent productivity and effectiveness by allowing agents to handle both inbound and outbound calls and interact with customers across multiple contact channels, including voice, chat, email, web, social media and mobile. Our solution gives agents the ability to switch between media channels through an easy-to-use, unified interface that provides agents with all the relevant content and tools needed to complete the task at hand. |
• | Improved customer experience. Our intelligent contact routing and self-service IVR capabilities, pre-built CRM integrations, and multichannel engagement ensure that customers receive an omnichannel experience. Each new contact is quickly routed to an appropriate agent resource. Using the rich contact history and additional context through integrations with CRM applications, agents have immediate access to the most current, relevant and accurate information about the customer, resulting in increased first contact resolutions and a more satisfying experience for the customer. |
• | Enhanced end-to-end visibility. Our solution provides clients’ operations staff, quality team and leadership with a complete view of contact center performance through a comprehensive set of historical reports, real-time dashboards, and quality and performance management tools. Clients can also extract reporting data from our solution for further analysis using a spreadsheet application or using the sophistication of an enterprise business intelligence application. This insight provides an organization-wide view of customer engagement performance and allows clients to quickly determine the appropriate actions required to address changing circumstances. |
• | Greater operational efficiency. Our solution provides contact center managers and supervisors with significant visibility into their agents’ productivity and effectiveness and the performance of their inbound queues and outbound campaigns. Our solution has robust intelligence and analytics capabilities to help supervisors optimize operations and campaigns in real-time to drive increased efficiency. Our role-based interfaces deliver specific functionality to both desktops and mobile devices to meet the unique needs of agents, supervisors and administrators. |
• | Compelling value proposition. We provide a unified cloud-based software and telephony platform for contact center operations, including software applications, technology infrastructure, maintenance, monitoring, storage, security, client support and upgrades, which enables our clients to simplify their technology infrastructure and streamline IT costs. We manage upgrades and deployments remotely, resulting in lower total cost of operations relative to legacy on-premise contact center systems that often require in-house technical support staff. |
Our Competitive Strengths
We believe that our position as a leading provider of cloud contact center software results from several key competitive strengths, including:
• | Cloud-based, enterprise-grade platform and end-to-end application suite. We deliver a cloud-based enterprise-grade platform and applications suite with multi-channel capabilities that allows our clients to manage their entire contact center operation. Our highly scalable, secure and multi-tenant architecture enables us to serve large, distributed enterprises with complex contact center requirements, as well as smaller organizations, all from a single cloud platform. |
• | Rapid deployment and support of our comprehensive solution. Our high-touch engagement model for larger implementations leverages a proven lifecycle approach including detailed discovery, design, testing, training and optimization. This not only accelerates agent activation, but also targets desired business |
7
outcomes. Through the use of tools and processes that have been refined over thousands of customers, we can also efficiently meet the needs of our smaller clients. We offer flexibility and integrate with a number of leading CRM vendors, including: salesforce.com, Inc., or Salesforce, Oracle Corporation, or Oracle, Zendesk, Inc., or Zendesk, Microsoft Corporation, or Microsoft, ServiceNow, Inc., or ServiceNow, and others. Once operational, we offer a high touch Premium Support service where we assign a Technical Account Manager who has intimate knowledge of the customers’ operations so we can quickly resolve issues and fine tune the solution. As a result, our clients’ contact centers become fully operational faster and they recognize time to value more quickly than with legacy on-premise contact center systems.
• | Reliable, secure, compliant and scalable platform. Our platform delivers what we believe is industry leading reliability; cybersecurity using a defense-in-depth approach; legal and regulatory compliance features designed to assist our clients in complying with applicable laws, regulations and industry standards including Telephone Consumer Protection Act, or TCPA, Customer Proprietary Network Information, or CPNI, Health Insurance Portability and Accountability Act of 1996, Communications Assistance for Law Enforcement Act, or CALEA, Gramm-Leach-Bliley Act, EU’s General Data Protection Regulation, or GDPR, Canada’s Personal Information Protection and Electronic Documents Act, or PIPEDA, and analogous provincial laws, and Payment Card Industry Data Security Standard, or PCI DSS, and is scalable to accommodate the requirements of larger clients. |
• | Proven, repeatable and scalable go-to-market model. We engage with our clients through a highly scalable and metrics-driven sales and marketing organization that effectively identifies, qualifies and closes sales opportunities. The deep domain expertise of our field sales team is instrumental in selling to larger opportunities, and our highly efficient telesales model enables us to cost-effectively identify, qualify and close a high volume of smaller opportunities. Our ecosystem of technology and system integrator partners increases awareness of our solution and helps generate new sales opportunities. We believe our go-to-market model gives us an efficient and effective means of targeting organizations of all sizes. |
• | Established market presence and a large, diverse client base. We have a large, diverse client base of over 2,000 organizations across multiple industries. We believe our clients view us as a key strategic solutions provider. The performance, reliability, ease-of-use and comprehensive nature of our solution has resulted in high client retention. |
• | Extensive partner ecosystem. We have cultivated a robust ecosystem of partners including a variety of leading CRM software vendors such as Salesforce, Oracle, Zendesk, Microsoft and ServiceNow; WFO vendors such as Calabrio, Verint and CSI; unified communications vendors such as Microsoft Teams (formerly Skype for Business) and Cisco; system integrators such as Accenture PLC, Deloitte Consulting LLP and PwC LLP; master agents and resellers; cloud private branch exchange, or PBX, phone systems vendors; independent software vendors; and telephony providers such as AT&T Inc., Verizon Communications Inc. and CenturyLink Communications, LLC. We believe this ecosystem has enabled us to increase our brand awareness and enhance the functionality and value of our solution for our clients. |
• | Focus on innovation and thought leadership. Since our inception, we have been an innovator of cloud contact center software. Our investment in research and development has driven our growth and enabled us to deliver a cloud contact center software solution with the features and functionality to power the most complex contact centers. Our extensive domain expertise enables us to enhance our solution and serves as a critical competitive differentiator. We strive to be a thought leader in our industry, identifying and developing cloud capabilities to transform traditional contact center operations into customer engagement centers of excellence. |
Our Growth Strategy
Our objective is to strengthen our position as a leader in cloud contact center software. To accomplish this goal, we are pursuing the following growth strategies:
• | Capture increased market share. We believe that the adoption of cloud contact center software solutions is increasingly driven by mainstream adoption of cloud computing, especially within CRM, as well as the increasing capabilities of these solutions. With organizations refreshing their contact center systems every 8 to 10 years, cloud solutions have an opportunity to replace legacy on-premise contact center systems at the time a replacement decision is made. We believe there is a substantial opportunity for us to win new clients |
8
and increase our market share given the strength and client benefits of our cloud solution. We intend to continue to invest aggressively in our sales force and marketing capabilities to win new clients.
• | Continue to increase sales in our existing client base. Many of our clients initially deploy our solution to support only a portion of their contact center agents. We intend to increase the number of agents using our solution within our existing clients as they experience the benefits of our cloud solution. We also intend to sell our existing clients incremental applications to increase our revenue and the value of our existing client relationships. |
• | Maintain our innovation leadership by strengthening and extending our solution. We have an innovative platform that has enabled us to establish a leadership position in the cloud contact center software market. To preserve and expand our leadership position, we intend to continue to make significant investments in research and development to strengthen our existing solution and develop additional industry-leading contact center features and applications. |
• | Further develop our partner ecosystem. We have established strong partner relationships with organizations in the contact center ecosystem to further enhance the value of our VCC cloud platform. We intend to continue to cultivate new relationships with additional CRM, WFO and unified communications partners as well as system integrators, master agents, resellers, PBX providers, phone systems vendors, independent software vendors and telephony providers to enhance the value of our solution and drive sales. |
• | Expand internationally. To date, our primary focus has been on the U.S. market, which represented 94%, 93% and 93% of our revenue in 2017, 2016 and 2015, respectively, based on bill to addresses. We believe there is a significant opportunity for our cloud solution to disrupt incumbent legacy on-premise contact center systems internationally. We plan to increase our sales capabilities internationally by expanding our direct sales force and working with channel partners to target these markets and grow our international client base. We have co-location data center facilities in Europe to provide clients in certain countries of the European Union, or EU, with regional access to our cloud contact center solution to better serve local needs. |
• | Selectively pursue acquisitions. In addition to organically developing and strengthening our solution, we intend to selectively explore acquisition opportunities of companies and technologies to expand the functionality of our solution, provide access to new clients or markets, or both. |
Our Virtual Contact Center Cloud Platform and Applications
Our cloud contact center software solution consists of our highly scalable VCC cloud platform that delivers a comprehensive suite of easy-to-use, secure applications to cover the breadth of contact center-related customer service, sales and marketing functions. Our VCC cloud platform acts as the hub for omnichannel engagement between our clients and their customers. This enables clients to fully manage the end-to-end customer experience in a single unified architecture. Our solution enables our clients to manage customer interactions across multiple channels including voice, chat, email, web, video, social media and mobile and connects them to the most appropriate agent. Whether the resource is an internal contact center agent, an outsourcer, an agent working from home, a knowledge worker, or self-service, our solution enables our clients to deliver a highly effective customer experience.
Our solution is built using a multi-tenant architecture and delivered in the cloud. The following diagram illustrates our VCC cloud platform and comprehensive suite of applications used by agents, supervisors and administrators. In addition, we provide a robust set of management applications including workforce management, reporting, quality management and supervisor tools.
9
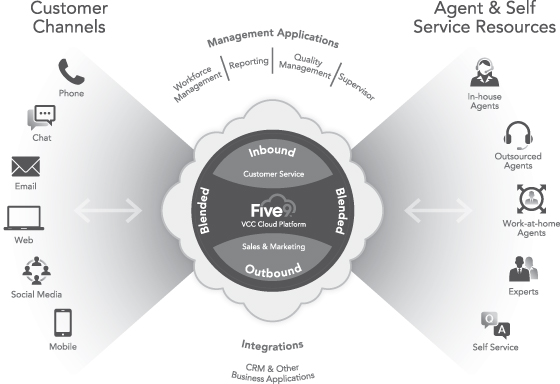
Inbound Contact Center: With our VCC cloud platform, organizations of all sizes have everything they need to handle their inbound customer engagement. This includes the ability to take voice calls, respond to chat and email, and engage with a wide range of social media sources. Our platform includes a full-featured IVR system that allows our clients to provide a self-service capability and to automatically determine the customer intent and identify the type of resource to best handle the customer inquiry. At the center of our VCC cloud platform is the ACD module which provides intelligent routing of customer interactions. This enables clients to classify and prioritize customer interactions and ensure that the interactions are delivered to the most appropriate resource to provide the best customer experience and maximize business results.
Through CTI capabilities, out-of-the-box integrations with CRM solutions (such as Salesforce, Oracle, Zendesk, Microsoft and ServiceNow), and easy to use open APIs, clients can provide a personalized customer experience by prioritizing important customers and delivering customer information to the agent handling the interaction. This promotes quick first contact resolution, which is a key factor in delivering a superior customer experience.
Outbound Contact Center: Our Outbound Contact Center application enables our clients to improve the efficiency and productivity of outbound contact center agents. We provide a complete solution for outbound sales and marketing campaigns, including multiple automated dialing options, so our clients can find the right match for their needs and environment, whether outbound business-to-consumer, or B2C, business-to-business, B2B, or 1:1 proactive customer care. We provide a variety of outbound dialer modes, including a patented predictive dialer capability. The predictive dialer greatly enhances the productivity of agents and sales representatives by increasing productive talk time and minimizing idle time spent listening to voice mail and busy signals. These dialer solutions allow our clients to choose the automation capabilities that best align with their contact center environment and objectives, including lead prospecting, qualifying, nurturing and converting. We also provide campaign management tools such as list management, sophisticated dialer rules and agent scripting. In addition, we provide a manual touch mode option that provides tools to outbound clients to comply with the TCPA regulations.
Blended Contact Center: We provide both inbound and outbound capabilities on a single platform to unify contact center operations and enable end-to-end customer engagement. This improves agent productivity as interactions are automatically selected and routed to agents based on interaction volume. When inbound call volumes are low, the blending ability allows clients to shift inbound agent resources to outbound-related functions.
10
For example, inbound agents can be assigned to the outbound queue for automatic follow-ups on any customer interaction, flag customer surveys for personalized attention, or resolve open customer issues.
Omnichannel Applications Powered by Five9: Our multichannel applications are powered by a unique set of technologies. These technologies include an advanced Natural Language Processing, or NLP, engine to filter and categorize interactions, eliminate spam and determine sentiment. Based on a client’s unique set of business policies and needs, our solution provides simpler, smarter, and more productive omnichannel engagement by offering agents Sentiment Analysis, Clustering, Trending Topics, and Relevance. In addition, Five9 powers agent assistance tools to help agents resolve issues quickly.
Five9 VCC integrates voice with chat, email, web, social media and mobile applications for a true omnichannel agent and customer experience.
• | Five9 Social - Applies contact center customer service and sales best practices to social channels. Our solution routes, tracks and reports on agent performance in responding to social media posts in the same manner as other channels. |
• | Five9 Chat - Live consumer-to-agent chat from mobile or web devices gives agents the ability to respond, record and manage multiple chat interactions. |
• | Five9 Email - Makes email a high-response sales, service and support channel. Our email routing capability filters and intelligently routes email requests to enable the best qualified agents to respond in a timely manner. |
• | Five9 Visual IVR - Our visual IVR application provides mobile customer care for today’s connected customers. It allows clients to develop an IVR script once and deploy it on multiple touchpoints, including mobile devices and websites. |
• | Five9 Web Engagement - Sophisticated analytics with machine learning identify user patterns on websites, match persona and outcome probabilities and trigger proactive engagement actions. This enables contact centers to proactively identify when online customers may require assistance to complete a purchase, solve a problem, answer a question or any other online interaction. Given that today the majority of contact center interactions originate on the web, Five9 Web Engagement including chat capability enables contact centers to move beyond simple interactions to true personalized engagement. |
Management Applications: Our integrated portfolio of management applications is built and delivered on our highly scalable and flexible VCC cloud platform. Our solution provides real-time supervisor tools to monitor and manage the performance of agents and call flows. We also provide a suite of configurable management reports to enable clients to manage the end-to-end performance of their contact center operations. For clients with high-end Workforce Optimization, or WFO, needs, our solution can provide fully integrated workforce and quality management applications through our strategic relationships with Calabrio, Verint and CSI. Our solution has native recording capabilities for contact centers that need to record their interactions.
Our clients can access our VCC cloud platform in five different ways:
• | Agent Desktop: Serves as the unified environment for contact center agents. Agents are provided with one easy-to-use desktop that is designed to allow agents to seamlessly conduct omnichannel interactions. Our universal transaction model adjusts to the needs of the interaction, including voice, chat, email, web, social media or mobile, yet feels familiar to the agent, making training simple. Automated call scripting and real-time customer data, such as purchase and interaction history, is delivered to empower agents with the information they need to deliver a superior customer experience. |
• | CRM Integrations: For clients who prefer to have their agents or sales representatives work within their CRM desktop, we offer pre-built integrations with leading providers of CRM systems such as Salesforce, Oracle, Zendesk, Microsoft and ServiceNow. In addition, professional services can provide integrations with custom or legacy CRM systems. Our solution provides softphone and telephony capabilities within the CRM desktop, and routes each customer interaction to an appropriate agent resource. Agents are able to work within a familiar desktop, equipped with full telephony controls and giving them immediate access to the most current, relevant and accurate information about the customer. |
• | Supervisor: Provides supervisors with tools to optimize the contact center and ensure high quality customer interactions. These tools include a visual supervisor dashboard that provides easy to use visibility |
11
into call routing, queues, service levels, workflow management, utilization, campaign statistics and agent productivity. A mobile tablet version of the supervisor application is also available to help supervisors monitor agents, listen in on conversations, coach agents, and oversee queues and agent performance metrics while on the contact center floor. These metrics typically include average handle time, first contact resolution, number of interactions handled and contact outcomes.
• | Administrator: Provides administrators with a comprehensive set of integrated tools to easily configure agent skills (such as language, domain expertise, and media channels to service), determine interaction routing strategies, specify IVR scripts and manage the contact center operation. The Five9 Administrator system is easy to use so that contact center business personnel can set up and make changes themselves, without having to rely on specialized IT staff often required to manage legacy on-premise contact center systems. This represents a key advantage of our VCC cloud platform as it allows businesses to adapt quickly to keep up with the rapid changes required in contact center operations. |
• | Reporting and Analytics: Real-time and historical reports provide statistics and key performance indicators to allow executives and supervisors to monitor the contact center, improve reaction time to interaction volume and manage agents more effectively. We provide more than 100 standard reports with multiple views and drill-downs into individual inbound calls and multichannel interaction metrics, customer interaction outcomes, and outbound sales and marketing program metrics. Our reporting module also enables clients to build customized reports and reporting schedules. |
Clients
We have a large and diverse client base comprised of more than 2,000 organizations as of December 31, 2017, with no single client representing more than 10% of our revenues in 2017, 2016 or 2015. Our client base spans organizations of all sizes across multiple industries, including banking and financial services, business process outsourcers, consumer, healthcare and technology.
Sales
Our sales model consists of a field sales team that sells our solution into larger opportunities and a telesales team that sells our solution into smaller opportunities. We established our business targeting smaller opportunities and have expanded our sales focus to larger opportunities as we gained traction in the market and enhanced the capabilities of our cloud solution. We have developed a disciplined, high volume, metrics-driven sales strategy, designed to enable us to efficiently generate and close a large number of new sales opportunities. Our telesales team focuses on qualified leads generated through traffic to our websites, and also supports our field sales team through lead generation and lead-tracking activities. Our field and telesales teams are also responsible for selling to existing clients that may renew their subscriptions, increase the number of agents using our cloud solution, add new applications from our solution and expand the deployment of our solution across their contact centers.
Marketing
To build client awareness and adoption of our solution, our lead generation activities consist primarily of client referrals, search engine marketing, internet advertising, digital marketing campaigns, social marketing, trade shows, industry events, co-marketing with strategic partners and telemarketing. In addition, our industry analyst, press and media outreach programs, and web site marketing initiatives are designed to build brand awareness and preference for Five9. We offer free trials and services to allow prospective clients to experience the quality and ease-of-use of our cloud solution, to learn about the features and functionality of our VCC cloud platform in more detail, and to quantify the benefits of our cloud solution.
To complement our sales and marketing efforts, we have developed a large ecosystem of software, technology, telephony and system integrator partners and independent software vendors who help increase awareness of our solution and generate new and installed base sales opportunities.
Research and Development
Our ability to compete depends in large part on our continuous commitment to research and development and our ability to improve the functionality of, and add new features to, our VCC cloud platform. Our core research and development center is based in our San Ramon, California headquarters with additional engineers located in Russia, which allows us to benefit from relatively low-cost and highly skilled software developers. Our engineering team has deep software and telecommunications skills, and works closely with our sales team to identify our clients’
12
product requirements. In addition, continuous interactions with our partners enable our engineers to enhance the usability and performance of our platform and its integration with best-in-class CRM and other business applications and telephony technologies.
As of December 31, 2017, we had 170 employees in our research and development group. Our research and development expenses totaled $27.1 million, $23.9 million and $22.7 million for the years ended December 31, 2017, 2016 and 2015, respectively. We intend to continue investing in research and development to continue to deliver robust functionality to our clients.
Professional Services
We offer comprehensive professional services to our clients to assist in the successful implementation and optimization of our solution. Our professional services include application configuration, system integration, and education and training. Our clients may use our professional services team for implementing our solution or, in limited cases, they may also choose to perform these services themselves or engage third-party service providers to perform such services. Our cloud solution allows us to eliminate the need for lengthy and complex technology integrations, such as deploying equipment or maintaining hardware infrastructure for individual clients. As a result, we are typically able to deploy and optimize our solution in significantly less time than required for deployments of legacy on-premise contact center systems.
Technology and Operations
Our highly scalable and flexible VCC cloud platform is the result of more than 15 years of research, development, client engagement and operational experience. The platform is comprised of in-house developed intellectual property, open source products and commercially available hardware and software. The platform is designed to be redundant and we believe that all components can be upgraded, expanded or replaced with minimal or no interruption in service.
We currently deliver our services globally from four third-party co-location data center facilities located in Santa Clara, California; Atlanta, Georgia; Slough, England and Amsterdam, The Netherlands. We also deliver some services using public cloud infrastructure in the Asia Pacific region. Our infrastructure, including our third-party co-location facilities, is designed to support real-time mission-critical telecommunications, applications and operational support systems. Our infrastructure is built with redundant, fault-tolerant components divided into distinct security zones forming protective layers for our applications and customer data.
We have designed and maintain an operations, capacity and security program to monitor and maintain our platform, ensure efficient utilization of the platform capacity and protect against security threats or data breaches. Our operations team monitors our data centers for potential performance issues, unauthorized attempts to access secure data or applications and the overall integrity of the platform.
Competition
The market for contact center software is fragmented, highly competitive and evolving rapidly in response to shifting consumer behavior, especially the rapid adoption of mobile devices and social media. The proliferation of each is driving change in contact center technology, as customers expect companies to give them the option of seamless communication across any channel according to their preference and needs. Combined with the disruptive nature of the cloud in the contact center, this has resulted in competitors who come from different market and product heritages, and who vary in size, breadth and scope of the products and services offered. We currently compete with large legacy on-premise contact center system vendors that offer on-premise enterprise telephony and contact center systems, such as Avaya Inc., or Avaya, and Cisco Systems, Inc., or Cisco, and legacy on-premise software companies with a historical focus on CTI, such as Aspect Software, Inc., or Aspect, Genesys Telecommunications Laboratories, Inc., or Genesys, and Interactive Intelligence Group, Inc., now part of Genesys. These companies are expanding their traditional on-premise contact center systems with cloud-based offerings, either through acquisitions or in-house development. Additionally, we compete with vendors that historically provided other contact center services and technologies and expanded to offer cloud contact center software. These companies include inContact, Inc., acquired by NICE Systems, and Seranova, formerly LiveOps, Inc. We also face competition from smaller contact center service providers with specialized contact center software offerings. Our actual and potential competitors may enjoy competitive advantages over us, including greater name recognition, longer operating histories, larger marketing budgets and greater financial and technical resources. We believe the principal competitive factors in our market include:
13
• | breadth and depth of solution features; |
• | reliability, scalability and quality of the platform; |
• | ease and speed of deployment; |
• | ease of application administration and use; |
• | level of client satisfaction; |
• | domain expertise in contact center operations; |
• | integration with third-party applications; |
• | pricing; |
• | ability to quickly adjust agent seats based on business requirements; |
• | breadth and domain expertise of the sales, marketing and support organization; |
• | ability to keep pace with client requirements; |
• | extent and efficiency of our professional services; |
• | ability to offer multiple channels of engagement; and |
• | size and financial stability of operations. |
We believe we currently compete effectively with respect to each of the factors identified above.
Intellectual Property
We rely on a combination of patent, copyright, and trade secret laws in the U.S. and other jurisdictions, as well as license agreements, confidentiality agreements, and other contractual protections, to protect our proprietary technology. We also rely on a number of registered and unregistered trademarks to protect our brand. In addition, we require our employees and independent contractors involved in development of intellectual property on our behalf to enter into agreements acknowledging that all works or other intellectual property generated or conceived by them on our behalf are our property, and assigning to us any rights, including intellectual property rights, that they may claim or otherwise have in those works or property, to the extent allowable under applicable law.
As of December 31, 2017, our intellectual property portfolio included seven registered U.S. trademarks, 10 issued U.S. patents, two pending U.S. patent applications and one registered U.S. copyright. As of December 31, 2017, we also had two issued patents, six pending patent applications and 11 limited trademark registrations outside the U.S. The expiration dates of our issued patents range from 2030 to 2034. In general, our patents and patent applications apply to aspects of our VCC cloud platform.
We are also a party to various license agreements with third parties that typically grant us the right to use certain third-party technology in conjunction with our solution. We expect that software and other applications in our industry may be subject to third-party infringement claims as the number of competitors grows and the functionality of applications in different industry segments overlaps. Any of these third parties might make a claim of infringement against us at any time.
Seasonality
We believe that there can be seasonal factors that may cause our revenues in the first half of a year to be relatively lower than our revenues in the second half of a year. During 2017, 2016 and 2015, 53% of our total revenues were generated in the second half of each year. We believe this is due to increased activities in retail, healthcare and education.
Employees
As of December 31, 2017, we had 860 full-time employees, including 387 in technology and operations, 170 in research and development, 193 in sales and marketing, and 110 in general and administrative. None of our employees are covered by collective bargaining agreements. We believe our employee relations are good and we have never experienced any work stoppages.
Regulatory
The following summarizes important, but not all, federal, state and foreign regulations that could impact our operations. Federal and state regulations are subject to judicial review, administrative revision and statutory changes through legislation that could materially affect how we and others in this industry operate.
14
The Telecommunications Act of 1996 vests the Federal Communications Commission, or FCC, with jurisdiction over interstate telecommunications services, while preserving state and local jurisdiction over many aspects of these services. As a result, telecommunications services are regulated at both the federal and state levels in the United States.
We are classified as a telecommunications service provider for federal regulatory purposes. Since our business is regulated by the FCC, we are subject to existing or potential FCC regulations relating to privacy, disability access, porting of numbers, automatic number dialing, contributions to the federal Universal Service Fund and related funds, or USF, and other requirements. If we do not comply with FCC rules and regulations, we could be subject to FCC enforcement actions, fines, loss of operating authority and possibly restrictions on our ability to operate or offer certain of our services. Any enforcement action by the FCC, which may be a public process, would hurt our reputation in the industry, possibly impair our ability to sell our services to clients and could harm our business and results of operations.
We must comply with numerous federal regulations, including:
• | Telephone Consumer Protection Act, or TCPA, which regulates the use of automatic dialing equipment and pre-recorded messages to contact consumers; |
• | CALEA, which requires covered entities to assist law enforcement in undertaking electronic surveillance; |
• | contributions to the USF, which requires that we pay a percentage of our revenues resulting from the provision of interstate telecommunications services to support certain federal programs; |
• | payment of annual FCC regulatory fees based on our interstate and international revenues; |
• | rules pertaining to access to our services by people with disabilities and contributions to the Telecommunications Relay Services fund; and |
• | FCC rules regarding CPNI which require that we not use such information without customer approval, subject to certain exceptions. |
In addition, we must make contributions and other payments on our usage-based fees to state and local governmental entities. The tax and fee structure for communications services such as ours is complex, ambiguous and subject to interpretation. If taxing and regulatory authorities enact new rules or regulations or expand their interpretations of existing rules and regulations, we could incur additional liabilities. In addition, the collection of additional taxes, fees or surcharges in the future could increase our prices or reduce our profit margins. Compliance with these regulations may also make us less competitive with those competitors who are not subject to, or choose not to comply with, these regulations. See Note 10 of the notes to consolidated financial statements under ITEM 8 of this Form 10-K for a discussion of our liabilities related to USF matters.
As we expand internationally, we will be subject to laws and regulations in the countries in which we offer our services. Regulation of the solutions we provide outside the U.S. varies from country to country, is often unclear, and may be more onerous than those imposed on our services in the U.S. For example, the European Union adopted a new law governing data protection and privacy called the General Data Protection Regulation, or the GDPR, which will be in effect in May 2018. The law requires companies to meet new and extended requirements regarding the processing of personal data. Non-compliance with the GDPR may result in administrative fines of up to $20 million EUR or 4% of the worldwide revenue from the preceding year, whichever is higher. In addition, we are subject to Canada’s Personal Information Protection and Electronic Documents Act, or PIPEDA, and the analogous provincial laws, which similarly impose data privacy and security obligations on our processing of personal data. Our regulatory obligations in foreign jurisdictions could harm the use or cost of our solution in international locations as data protection and privacy laws and regulations around the world continue to evolve.
The legislative and regulatory scheme for telecommunications service providers and other solutions we provide will continue to evolve and can be expected to change the competitive environment for these services. It is not possible to predict how such evolution and changes will affect our business or our industry. If we do not comply with current or future rules or regulations that apply to our business, we could be subject to substantial additional fines and penalties, we may have to restructure our service offerings, exit certain markets, accept lower margins or raise the price of our services, any of which could harm our business and results of operations. See “Risk Factors — Risks Related to Regulatory Matters” under ITEM 1A of this Form 10-K for more information.
15
Company Information
We were incorporated in Delaware in 2001. We operate in a single reportable segment. Our principal executive office is located at Bishop Ranch 8, 4000 Executive Parkway, Suite 400, San Ramon, CA 94583 and our telephone number is (925) 201-2000. Our website address is www.five9.com. Our website and the information contained therein or connected thereto shall not be deemed to be incorporated into this annual report on Form 10-K. We own or have rights to trademarks or trade names that we use in connection with the operation of our business, including our corporate names, logos and domain names. In addition, we own or have the rights to copyrights, trade secrets and other proprietary rights that protect the content of our products. Solely for convenience, some of the copyrights, trademarks and trade names referred to in this annual report on Form 10-K are listed without ©, ® and ™ symbols, but we will assert, to the fullest extent under applicable law, our rights to our copyrights, trademarks and trade names.
Available Information
Our annual report on Form 10-K, quarterly reports on Form 10-Q, current reports on Form 8-K, proxy and information statements and amendments to reports are filed with, or furnished to, the United States Securities and Exchange Commission, or SEC, pursuant to the Securities Exchange Act of 1934, as amended, or the Exchange Act. The public may obtain these filings at the SEC’s Public Reference Room at 100 F Street, NE, Washington, DC 20549 or by calling the SEC at 1-800-SEC-0330. The SEC also maintains a website at https://www.sec.gov that contains reports, proxy and information statements and other information regarding Five9 and other companies that file materials with the SEC electronically. Copies of Five9’s reports on Form 10-K, Forms 10-Q and Forms 8-K, may be obtained, free of charge, electronically through our internet website, http://investors.five9.com/sec.cfm as soon as reasonably practicable after such material is filed electronically with, or furnished to, the SEC. The information on our website is not a part of, or incorporated by reference into, this annual report on Form 10-K.
ITEM 1A. Risk Factors
Our operations and financial results are subject to various risks and uncertainties. You should consider carefully the risks and uncertainties described below, together with all of the other information in this report. If any of the following risks or other risks actually occur, our business, financial condition, results of operations, and future prospects could be materially harmed, and the price of our common stock could decline.
Risks Related to Our Business and Industry
Our quarterly and annual results may fluctuate significantly, may not fully reflect the underlying performance of our business and may result in decreases in the price of our common stock.
Our quarterly and annual results of operations, including our revenues, profitability and cash flow have varied, and may vary significantly in the future, and period-to-period comparisons of our operating results may not be meaningful. Accordingly, the results of any one quarter or period should not be relied upon as an indication of future performance. Our quarterly and annual financial results may fluctuate as a result of a variety of factors, many of which are outside our control and, as a result, may not fully reflect the underlying performance of our business. Fluctuation in quarterly and annual results may harm the value of our common stock. Factors that may cause fluctuations in our quarterly and annual results include, without limitation:
• | market acceptance of our solution; |
• | our ability to attract new clients and grow our business with existing clients; |
• | client renewal rates; |
• | our ability to adequately expand our sales and service team; |
• | our ability to acquire and maintain strategic and client relationships; |
• | the amount and timing of costs and expenses related to the maintenance and expansion of our business, operations and infrastructure; |
• | the timing and success of new product and feature introductions by us or our competitors or any other change in the competitive dynamics of our industry, including consolidation among competitors, clients or strategic partners; |
• | network outages or security incidents, which may result in additional expenses or losses, the loss of clients, the provision of client credits, and harm to our reputation; |
16
• | seasonal factors that may cause our revenues in the first half of a year to be relatively lower than our revenues in the second half of a year; |
• | inaccessibility or failure of our cloud contact center software due to failures in the products or services provided by third parties; |
• | our ability to expand, and effectively utilize our network of master agents and resellers; |
• | the timing of recognition of revenues under current and future GAAP; |
• | changes in our pricing policies or those of our competitors; |
• | the level of professional services and support we provide our clients; |
• | the components of our revenue; |
• | the addition or loss of key clients, including through acquisitions or consolidations; |
• | general economic, industry and market conditions; |
• | the timing of costs and expenses related to the development or acquisition of technologies or businesses and potential future charges for impairment of goodwill from acquired companies; |
• | compliance with, or changes in, the current and future domestic and international regulatory environment; |
• | the hiring, training and retention of key employees; |
• | litigation or other claims against us; |
• | the ability to expand internationally, and to do so profitability; |
• | our ability to obtain additional financing; |
• | advances and trends in new technologies and industry standards; and |
• | increases or decreases in the costs to provide our solution or pricing changes upon any renewals of client agreements. |
If we are unable to attract new clients or sell additional services and functionality to our existing clients, our revenue and revenue growth will be harmed.
To increase our revenue, we must add new clients, add additional agent seats and sell additional functionality to existing clients, and encourage existing clients to renew their subscriptions on terms favorable to us. As our industry matures, as our clients experience seasonal trends in their business, or as competitors introduce lower cost or differentiated products or services that are perceived to compete favorably with ours, our ability to add new clients and renew, maintain or sell additional services to existing clients based on pricing, cost of ownership, technology and functionality could be harmed. As a result, our existing clients may not renew our agreements or may decrease the number of agent seats, and we may be unable to attract new clients or grow or maintain our business with existing clients, which could harm our revenue and growth.
Furthermore, a portion of our revenue is generated by acquiring domestic and international telecommunications minutes from wholesale telecommunication service providers and reselling those minutes to our clients. As a result, if telecommunications rates decrease, we must resell more minutes to maintain our level of usage revenue.
Our recent rapid growth may not be indicative of our future growth, and if we continue to grow rapidly, we may fail to manage our growth effectively.
For the years ended December 31, 2017, 2016 and 2015, our revenues were $200.2 million, $162.1 million and $128.9 million, respectively, representing year-over-year growth of 24% and 26%, respectively. In the future, as our revenue increases, our annual revenue growth rate may decline. We believe our revenue growth will depend on a number of factors, including our ability to:
• | compete with other vendors of cloud-based enterprise contact center systems to capture market share, including from providers of legacy on-premise systems; |
• | increase our existing clients’ use of our solution and further develop our partner ecosystem; |
• | strengthen and improve our solution through significant investments in research and development and the introduction of new and enhanced solutions; |
• | introduce our solution to new markets outside of the United States and increase global awareness of our brand; and |
17
• | selectively pursue acquisitions. |
If we are not successful in achieving these objectives, our ability to grow our revenue may be negatively impacted. In addition, we plan to continue to invest in future growth, including expending substantial financial and other resources on:
• | sales and marketing, including a significant expansion of our sales and professional services organization; |
• | our technology infrastructure, including systems architecture, management tools, scalability, availability, performance and security, as well as disaster recovery measures; |
• | solution development, including investments in our solution development team and the development of new solutions, as well as new applications and features for existing solutions; |
• | international expansion; and |
• | general administration, including legal, regulatory compliance and accounting expenses. |
Moreover, we continue to expand our headcount and operations. We grew from 780 employees as of December 31, 2016 to 860 employees as of December 31, 2017. We anticipate that we will continue to expand our operations and headcount in the near term. This growth has placed, and future growth will place, a significant strain on our management, administrative, operational and financial resources and infrastructure. Our success will depend in part on our ability to manage this growth effectively. To manage the expected growth of our operations and personnel, we will need to continue to improve our operational, financial and management controls and our reporting systems and procedures. Failure to effectively manage growth could result in difficulty or delays in adding new clients, declines in quality or client satisfaction, increases in costs, system failures, difficulties in introducing new features or solutions, the need for more capital than we anticipate or other operational difficulties, and any of these difficulties could harm our business performance and results of operations.
The expected addition of new employees and the capital investments that we anticipate will be necessary to manage our growth will make it more difficult for us to generate earnings or offset any future revenue shortfalls by reducing costs and expenses in the short term. If we fail to manage our anticipated growth, we will be unable to execute our business plan successfully.
Failure to adequately expand our direct sales force will impede our growth.
We need to continue to expand and optimize our sales infrastructure in order to grow our client base and business. We plan to continue to expand our direct sales force, both domestically and internationally. Identifying and recruiting qualified personnel and training them in the use and sale of our solution requires significant time, expense and attention. It can take several months before our sales representatives are fully trained and productive. Our business may be harmed if our efforts, and the expense incurred, to expand and train our direct sales force do not generate a corresponding increase in revenues. In particular, if we are unable to hire, develop and retain talented sales personnel or if new sales personnel are unable to achieve desired productivity levels in a reasonable period of time, we may not be able to realize the expected benefits of this investment or increase our revenues.
If we fail to manage our technical operations infrastructure, our existing clients may experience service outages, our new clients may experience delays in the deployment of our solution and we could be subject to, among other things, claims for credits or damages.
Our success depends in large part upon the capacity, stability and performance of our operations infrastructure. From time to time, we have experienced interruptions in service, and may experience such interruptions in the future. These service interruptions may be caused by a variety of factors, including infrastructure changes, human or software errors, viruses, security attacks, fraud, spikes in client usage and denial of service issues. In some instances, we may not be able to identify the cause or causes of these performance problems within an acceptable period of time. Our failure to achieve or maintain expected performance levels, stability and security could harm our relationships with our clients, result in claims for credits or damages, damage our reputation and significantly reduce client demand for our solution and harm our business.
Any future service interruptions could:
• | cause our clients to seek credits or damages for losses incurred; |
• | cause existing clients to cancel their contracts and move to a competitor; |
• | affect our reputation as a reliable service provider; |
18
• | make it more difficult for us to attract new clients or expand our business with existing clients; or |
• | require us to replace existing equipment. |
We have experienced significant growth in the number of agents and interactions that our infrastructure supports. As the number of agent seats within our client base grows and our clients’ use of our service increases, we need to continue to make additional investments in our capacity to maintain adequate stability and performance, the availability of which may be limited or the cost of which may be prohibitive. In addition, we need to properly manage our operations infrastructure in order to support version control, changes in hardware and software parameters and the evolution of our solution. If we do not accurately predict or improve our infrastructure requirements to keep pace with growth in our business, our business could be harmed.
Security breaches and improper access to or disclosure of our data or our clients’ data, or other cyber attacks on our systems, could result in litigation and regulatory risk, harm our reputation and adversely affect our business.
Our solution involves the storage and transmission of our clients’ information, including information about our clients’ customers or other information treated by our clients as confidential. Unauthorized access, unauthorized use of our systems, security breaches or other cyber attacks could result in the loss of confidentiality, integrity and availability of such information, leading to litigation, indemnity obligations, increased expense, and other liability. Such incidents could also cause interruptions to the solution we provide, degrade the user experience, or cause clients to lose confidence in our solution. In April 2017, we were notified that third parties were suspected of having unlawfully acquired some of our clients’ information. We conducted an investigation, believe this acquisition was the result of a vulnerability that has now been remediated, and notified clients we determined may have been impacted. Expenses incurred to date related to this incident have not been material.
While we have security measures in place to protect client information and minimize the probability of security breaches and other cyber attacks, if these measures fail as a result of a cyber-attack, other third-party action, employee error, malfeasance or otherwise, and someone obtains unauthorized access to our clients’ information, our reputation could be damaged, our business may suffer and we could incur significant liability. Because the techniques used to obtain unauthorized access or sabotage systems change frequently and generally are not identified until they are launched against a target, we may be unable to anticipate these techniques or to implement adequate preventative measures. In addition, third parties may attempt to fraudulently induce employees or users to disclose information in order to gain access to our data or our users’ data. Moreover, any failure on the part of third parties, including our clients, to maintain appropriate security measures for their own systems could harm our relationships with our clients, result in claims against us for credits or damages, damage our reputation and significantly reduce client demand for our solution. Any or all of these issues could harm our ability to attract new clients, cause existing clients to cancel, reduce or not renew their subscriptions, result in reputational damage or subject us to third-party lawsuits, regulatory fines or other action or liability, including orders or consent decrees forcing us to modify our business practices, all of which could have a material and adverse effect on our business, reputation or financial results.
The markets in which we participate are highly competitive, and if we do not compete effectively, our operating results could be harmed.
The market for contact center solutions is highly competitive. Generally, we do not have long-term contracts with our clients and our clients can terminate our service and switch to competitors’ offerings on short notice.
We currently compete with large legacy technology vendors that offer on-premise enterprise telephony and contact center systems, such as Avaya and Cisco, and legacy on-premise software companies that come from a computer-telephony integration, or CTI, heritage, such as Aspect and Genesys (including through its acquisition of Interactive Intelligence). These companies are supplementing their traditional on-premise contact center systems with cloud offerings, either through acquisition or in-house development. Additionally, we compete with vendors that historically provided other contact center services and technologies and expanded to offer cloud contact center software. These companies include inContact (acquired by NICE Ltd.) and LiveOps, now named Seranova. We also face competition from smaller contact center service providers with specialized contact center software offerings. Our actual and potential competitors may enjoy competitive advantages over us, including greater name recognition, longer operating histories and larger marketing budgets, as well as greater financial or technical resources. With the introduction of new technologies and market entrants, we expect competition to intensify in the future.
19
Some of our competitors can devote significantly greater resources than we can to the development, promotion and sale of their products and services and many have the ability to initiate or withstand substantial price competition. Current or potential competitors may also be acquired by third parties with significantly greater resources, such as NICE Ltd.’s acquisition of inContact and Genesys’ acquisition of Interactive Intelligence. In addition, many of our competitors have stronger name recognition, longer operating histories, established relationships with clients, more comprehensive product offerings, larger installed bases and major distribution agreements with consultants, system integrators and resellers. Our competitors may also establish cooperative relationships among themselves or with third parties that may further enhance their product offerings or resources and ability to compete. If our competitors’ products, services or technologies become more accepted than our solution, if they are successful in bringing their products or services to market earlier than ours, or if their products or services are less expensive or more technologically capable than ours, our revenues could be harmed. Pricing pressures and increased competition could result in reduced sales and revenues, reduced margins and loss of, or a failure to maintain or improve, our competitive market position, any of which could harm our business.
If our existing clients terminate their subscriptions or reduce their subscriptions and related usage, our revenues and gross margins will be harmed and we will be required to spend more money to grow our client base.
We expect to continue to derive a significant portion of our revenues from existing clients. As a result, retaining our existing clients is critical to our future operating results. We offer monthly, annual and multiple-year contracts to our clients, with 30 days’ notice generally required for changes in the number of agent seats, including to zero, or termination of their contracts. Subscriptions and related usage by our existing clients may decrease if:
• | clients are not satisfied with our services, prices or the functionality of our solution; |
• | the stability, performance or security of our solution are not satisfactory; |
• | our clients’ business declines due to industry cycles, seasonality, business difficulties or other reasons; |
• | competition increases from other contact center providers; |
• | fewer clients purchase usage from us; |
• | alternative technologies, products or features emerge that we do not provide; |
• | our clients or potential clients experience financial difficulties; or |
• | the U.S. or global economy declines. |
If our existing clients’ subscriptions and related usage decrease or are terminated, we will need to spend more money to acquire new clients to maintain our existing level of revenues. We incur significant costs and expenses, including sales and marketing expenses, to acquire new clients, and those costs and expenses are an important factor in determining our net profitability. There can be no assurance that our efforts to acquire new clients will be successful.
Our growth depends in part on the success of our strategic relationships with third parties and our failure to successfully grow and manage these relationships could harm our business.
We leverage strategic relationships with third parties, such as CRM providers, Workforce Optimization, or WFO, providers, other technology providers, system integrators, and telephony providers. For example, our CRM and system integrator relationships provide significant lead generation for new client opportunities. These relationships are typically not exclusive and our partners often also offer products of our competitors. As we grow our business, we will continue to depend on both existing and new strategic relationships. Our competitors may be more successful than we are in establishing or expanding relationships with third parties or may provide incentives to third parties to favor their products over our solution. These strategic partners may cease to recommend our solution to prospective clients due to actual or perceived lack of features, technological or security issues or failures, reputational concerns, economic incentives, or other factors, which would harm our business, financial condition and operations. Furthermore, there has and continues to be a significant amount of consolidation in our industry and adjacent industries, and if our partners are acquired, fail to work effectively with us or go out of business, they may no longer support or promote our solution, or may be less effective in doing so, which could harm our business, financial condition and operations. If we are unsuccessful in establishing or maintaining our strategic relationships with third parties, or these partners fail to recommend our solution, our ability to compete in the marketplace or to grow our revenues could be impaired and our operating results may suffer. Even if we are successful, we cannot assure you that these relationships will result in increased client usage of our solution or increased revenue.
20
In addition, identifying new partners, and negotiating and documenting relationships with them, requires significant time and resources. As the complexity of our solution and our third-party relationships increases, the management of those relationships and the negotiation of contractual terms sufficient to protect our rights and limit our potential liabilities will become more complicated. We also license technology from certain third parties, including through OEM relationships. Certain of these agreements permit either party to terminate all or a portion of the relationship without cause at any time and for any reason. If one of these agreements is terminated by the other party, we would have to find an alternative source or develop new technology ourselves, either of which could cause delays in our ability to offer our solution or certain product features to our clients, result in increased expense and harm our business. Our inability to successfully manage and maintain these complex relationships or negotiate sufficient contractual terms could harm our business.
We are establishing a network of master agents and resellers to sell our solution; our failure to effectively develop, manage, and maintain this network could materially harm our revenues.
We are establishing a network of master sales agents, which provide sales leads, and resellers, which sell our solution to new and existing clients. We expect that this network will enable us to attract additional clients. We expect our resellers will also assist us in expanding internationally. These master agents and resellers sell, or may in the future decide to sell, solutions for our competitors. Our competitors may be able to cause our current or potential master agents or resellers to favor their services over ours, either through financial incentives, technological innovation, by offering a broader array of services to these service providers or otherwise, which could reduce the effectiveness of our use of these third parties. If we fail to maintain relationships with current master agents and resellers, fail to develop relationships with new master agents and resellers in new and existing markets, if we fail to manage, train, or provide appropriate incentives to our existing master agents and resellers, or if our master agents and resellers are not successful in their sales efforts, sales of our subscriptions may decrease or not grow at an appropriate rate and our operating results could be harmed.
In addition, identifying new resellers, and negotiating and documenting relationships with them, requires significant time and resources. As the complexity of our solution and our reseller relationships increases, the management of those relationships and the negotiation of contractual terms sufficient to protect our rights and limit our potential liabilities will become more complicated. Our inability to successfully manage these complex relationships or negotiate sufficient contractual terms could harm our business.
The loss of one or more of our key clients, or a failure to renew our subscription agreements with one or more of our key clients, could harm our ability to market our solution.
We rely on our reputation and recommendations from key clients in order to market and sell our solution. The loss of any of our key clients, or a failure of some of them to renew or to continue to recommend our solution, could have a significant impact on our revenues, reputation and our ability to obtain new clients. In addition, acquisitions of our clients could lead to cancellation of our contracts with those clients, thereby reducing the number of our existing and potential clients.
Our clients may fail to comply with the terms of their agreements, necessitating action by us to collect payment, or may terminate their subscriptions for our solution.
If clients fail to pay us under the terms of our agreements or fail to comply with the terms of our agreements, including compliance with regulatory requirements, we may terminate clients, lose revenue, be unable to collect amounts due to us, be subject to legal or regulatory action and incur costs in enforcing the terms of our contracts, including litigation. Some of our clients may seek bankruptcy protection or other similar relief and fail to pay amounts due to us, seek reimbursement for amounts already paid, or pay those amounts more slowly, either of which could harm our operating results, financial position and cash flow.
We sell our solution to larger organizations that require longer sales and implementation cycles and often demand more configuration and integration services or customized features and functions that we may not offer, any of which could delay or prevent these sales and harm our growth rates, business and operating results.
As we continue to target our sales efforts at larger organizations, we face greater costs, longer sales and implementation cycles and less predictability in closing sales. These larger organizations typically require more configuration and integration services, which increases our upfront investment in sales and deployment efforts, with no guarantee that these clients will subscribe to our solution or increase the scope of their subscription. Furthermore,
21
with larger organizations, we must provide greater levels of education regarding the use and benefits of our solution to a broader group of people. As a result of these factors, we must devote a significant amount of sales support and professional services resources to individual clients and prospective clients, thereby increasing the cost and time required to complete sales. Our typical sales cycle for larger organizations is four to six months, but can be significantly longer, and we expect that our average sales cycle may increase as sales to larger organizations continue to grow as a percentage of our business. Longer sales cycles could cause our operating and financial results to be less predictable and to fluctuate from period to period. In addition, many of our clients that are larger organizations initially deploy our solution to support only a portion of their contact center agents. Our success depends on our ability to increase the number of agent seats and the number of applications utilized by larger organizations over time. There is no guarantee that these clients will increase their subscriptions for our solution. If we do not expand our initial relationships with larger organizations, the return on our investments in sales and deployment efforts for these clients will decrease and our business may suffer.
Furthermore, we may not be able to provide the configuration and integration services that larger organizations typically require. For example, our solution does not currently permit clients to modify our software code, but instead requires them to use our set of application programming interfaces, or APIs. If prospective clients require customized features or functions that we do not offer, and that would be difficult for them to deploy themselves, they will need to use our services or third-party service providers or we may lose sales opportunities with larger organizations and our business could suffer.
Because a significant percentage of our revenue is derived from existing clients, downturns or upturns in new sales will not be immediately reflected in our operating results and may be difficult to discern.
We generally recognize subscription revenue from clients monthly as services are delivered. As a result, a significant percentage of the subscription revenue we report in each quarter is derived from existing clients. Consequently, a decline in new subscriptions in any single quarter will likely have only a small impact on our revenue results for that quarter. However, the cumulative impact of such declines could negatively impact our business and results of operations in future quarters. Accordingly, the effect of significant downturns in sales and market acceptance of our solution, and potential changes in our pricing policies or renewal rates, will typically not be reflected in our results of operations until future periods. We also may be unable to adjust our cost structure to reflect the changes in revenue, resulting in lower margins and earnings. In addition, our subscription model makes it difficult for us to rapidly increase our revenue through additional sales in any period, as revenue from new clients will be recognized over time as services are delivered. For example, many of our clients initially deploy our solution to support only a portion of their contact center agents. Any increase to our revenue and the value of these existing client relationships will only be reflected in our results of operations if and when these clients increase the number of agent seats and the number of components of our solution over time.
We rely on third-party telecommunications and internet service providers to provide our clients and their customers with telecommunication services and connectivity to our cloud contact center software and any failure by these service providers to provide reliable services could cause us to lose clients and subject us to claims for credits or damages, among other things.
We rely on third-party telecommunication service providers to provide our clients and their customers with telecommunication services. These telephony services include the public switched telephone network, or PSTN, telephone numbers, call termination and origination services, and local number portability for our clients. In addition, we depend on our internet bandwidth suppliers to provide uninterrupted and error-free service through their telecommunications networks. We exercise little control over these third-party providers, which increases our vulnerability to problems with the services they provide. When problems occur, it may be difficult to identify the source of the problem. Service disruption or outages, whether caused by our service, the products or services of our third-party service providers, or our clients’ or their customers’ equipment and systems, may result in loss of market acceptance of our solution and any necessary repairs or other remedial actions may force us to incur significant costs and expenses.
If any of these service providers fail to provide reliable services, suffer outages, degrade, disrupt, increase the cost of or terminate the services that we and our clients depend on, we may be required to switch to another service provider. Delays caused by switching our technology to another service provider, if available, and qualifying this new service provider could materially harm our client relationships, business, financial condition and operating results. Further, any failure on the part of third-party service providers to achieve or maintain expected performance
22
levels, stability and security could harm our relationships with our clients, cause us to lose clients, result in claims for credits or damages, increase our costs or the costs incurred by our customers, damage our reputation, significantly reduce client demand for our solution and seriously harm our financial condition and operating results.
Our clients and their customers rely on internet service providers to provide them with access and connectivity to our cloud contact center software and changes in how internet service providers handle and charge for access to the internet could materially harm our client relationships, business, financial condition and operations results.
In 2015, the FCC released an order, commonly referred to as net neutrality, that, among other things, prohibited (i) the impairment or degradation of lawful internet traffic on the basis of content, application or service and (ii) the practice of favoring some internet traffic over other internet traffic based on the payment of higher fees. In December 2017, the FCC voted to overturn the net neutrality regulations imposed by the 2015 order. Internet service providers in the U.S. may now be able to impair or degrade the use of, or increase the cost of using, our solution. Net neutrality regulations vary widely among the jurisdictions in which we operate. While certain jurisdictions have strong protections for services such as ours, other countries either lack a net neutrality framework or otherwise do not strictly enforce net neutrality regulations. The impairment, degradation or prioritization of lawful internet traffic by internet service providers could materially harm our client relationships, business, financial condition and operating results.
We depend on data centers operated by third parties and any disruption in the operation of these facilities could harm our business.
We host our solution at data centers located in Santa Clara, California; Atlanta, Georgia; Slough, England and Amsterdam, The Netherlands. Any failure or downtime in one of our data center facilities could affect a significant percentage of our clients. While we control and have access to our servers and all of the components of our network that are located in our external data centers, we do not control the operation of these facilities. The owners of our data center facilities have no obligation to renew their agreements with us on commercially reasonable terms, or at all. If we are unable to renew these agreements on commercially reasonable terms, or if one of our data center operators is acquired, closes, suffers financial difficulty or is unable to meet our growing capacity needs, we may be required to transfer our servers and other infrastructure to new data center facilities, and we may incur significant costs and service interruptions in connection with doing so.
Our data centers are subject to various points of failure. Problems with cooling equipment, generators, uninterruptible power supply, routers, switches, or other equipment, whether or not within our control, could result in service interruptions for our clients as well as equipment damage. Our data centers are subject to disasters such as earthquakes, floods, fires, hurricanes, acts of terrorism, sabotage, break-ins, acts of vandalism and other events, which could cause service interruptions or the operators of these data centers to close their facilities for an extended period of time or permanently. The destruction or impairment of any of our data center facilities could result in significant downtime for our solution and the loss of client data. Because our ability to attract and retain clients depends on our providing clients with highly reliable service, even minor interruptions in our service could harm our business, revenues and reputation. Additionally, in connection with the continuing expansion of our existing data center facilities, there is an increased risk that service interruptions may occur as a result of server addition, relocation or other issues.
Our data centers are also subject to increased power costs. We may not be able to pass on any increase in power costs to our clients, which could reduce our operating margins.
Shifts over time or from quarter-to-quarter in the mix of sizes or types of organizations that purchase our solution or changes in the components of our solution purchased by our clients could affect our gross margins and operating results.
Our strategy is to sell our solution to both smaller and larger organizations. Our gross margins can vary depending on numerous factors related to the implementation and use of our solution, including the features and number of agent seats purchased by our clients and the level of usage and professional services and support required by our clients. For example, our larger clients typically require more professional services and because our professional services offerings typically have negative margins, any increase in sales of professional services could harm our gross margins and operating results. We also have lower margins on our usage revenues. Sales to larger organizations may also entail longer sales cycles and more significant selling efforts. Selling to smaller clients may involve smaller contract sizes, fewer opportunities to sell additional services, a higher likelihood of contract
23
terminations, fewer potential agent seats and greater credit risk and uncertainty. If the mix of organizations that purchase our solution, or the mix of solution components purchased by our clients, changes unfavorably, our revenues and gross margins could decrease and our operating results could be harmed.
We are in the process of expanding our international operations, which exposes us to significant risks.
To date, we have not generated significant revenues from outside of the U.S., Canada and the U.K. However, we already have significant operations outside these countries and we expect to grow our international presence in the future. The future success of our business will depend, in part, on our ability to expand our operations and customer base to other countries. Operating in international markets requires significant resources and management attention and will subject us to regulatory, economic, and political risks that are different from those in the U.S. Due to our limited experience with international operations and developing and managing sales and distribution channels in international markets, our international expansion efforts may not be successful.
We have a history of losses and we may be unable to achieve or sustain profitability.
We have incurred significant losses in each annual period since our inception in 2001. We incurred net losses of $9.0 million, $11.9 million and $25.8 million for the years ended December 31, 2017, 2016 and 2015, respectively. As of December 31, 2017, we had an accumulated deficit of $175.4 million. These losses and our accumulated deficit reflect the substantial investments we have made to develop our solution and acquire new clients. We expect the dollar amount of our costs and expenses to increase in the future as revenue increases, although at a slower rate. We expect our losses to continue for the foreseeable future as we continue to develop and expand our business. Furthermore, to the extent we are successful in increasing our client base, we may also incur increased losses because costs associated with acquiring clients are generally incurred up front, while revenues are recognized over the course of the client relationship. We also have negative gross margins on our professional services, which are expected to continue in the medium term. In addition, as a public company, we incur significant legal, accounting and other expenses. Our historical or recent growth in revenues is not necessarily indicative of our future performance. Accordingly, there is no assurance that we will achieve profitability in the future nor that, if we do become profitable, we will sustain profitability.
If the market for cloud contact center software solutions develops more slowly than we expect or declines, our business could be harmed.
The cloud contact center software market is not as mature as the market for legacy on-premise contact center systems, and it is uncertain whether cloud contact center solutions will achieve and sustain high levels of client demand and market acceptance. Our success will depend to a substantial extent on the widespread adoption of cloud contact center software solutions as a replacement for legacy on-premise systems. Many larger organizations have invested substantial technical, personnel and financial resources to integrate legacy on-premise contact center systems into their businesses and, therefore, may be reluctant or unwilling to migrate to cloud contact center solutions such as ours. It is difficult to predict client adoption rates and demand for our solution, the future growth rate and size of the cloud contact center software market, or the entry of competitive products and services. The expansion of the cloud contact center software market depends on a number of factors, including the refresh rate for legacy on-premise systems, cost, performance and perceived value associated with cloud contact center software solutions, as well as the ability of providers of cloud contact center software solutions to address security, stability and privacy concerns. If we or other cloud contact center solution providers experience security incidents, loss of client data, disruptions in service or other problems, the market for cloud contact center software products, solutions and services as a whole, including our solution, may be harmed. If cloud contact center software solutions do not achieve widespread adoption, or there is a reduction in demand for such solutions caused by a lack of client acceptance, enhanced product offerings from on-premise providers, technological challenges, weakening economic conditions, security or privacy concerns, competing technologies and products, decreases in corporate spending or otherwise, it could result in decreased revenues and our business could be harmed.
Our recent growth makes it difficult to evaluate and predict our current business and future prospects.
While we have been in existence since 2001, much of our growth has occurred in recent years. Our recent growth may make it difficult for investors to evaluate our current business and our future prospects. We have encountered and will continue to encounter risks and difficulties frequently experienced by growing companies in rapidly changing industries, including increasing and unforeseen expenses as we continue to grow our business.
24
Our ability to forecast our future operating results is limited and subject to a number of uncertainties, including our ability to predict revenue levels, and plan for and model future growth. We have encountered and will continue to encounter risks and uncertainties frequently experienced by growing companies in rapidly changing industries, such as the risks and uncertainties described in this report. If our assumptions regarding these risks and uncertainties, which we use to plan our business, are incorrect or change due to adjustments in our markets or our competitors and their product offerings, or if we do not address these risks successfully, our operating and financial results could differ materially from our expectations and our business could suffer.
If our solution fails, or is perceived to fail, to perform properly or if it contains technical defects, our reputation could be harmed, our market share may decline and we could be subject to product liability claims.
Our solution may contain undetected errors or defects that may result in failures or otherwise cause our solution to fail to perform in accordance with client expectations. Moreover, our clients could incorrectly implement or inadvertently misuse our products, which could result in client dissatisfaction and harm the perceived utility of our products and our brand. Because our clients use our solution for mission-critical aspects of their business, any real or perceived errors or defects in, or other performance problems with, our solution may damage our clients’ businesses and could significantly harm our reputation. If that occurs, we could lose future sales, or our existing clients could elect to cancel our solution, seek payment credits, seek damages against us, or delay or withhold payment to us, which could result in reduced revenues, an increase in our provision for uncollectible accounts and service credits, an increase in collection cycles for accounts receivable, and harm our financial results. In addition, since telecommunications billing is inherently complex and requires highly sophisticated information systems to administer, our billing system may experience errors or we may improperly operate the system, which could result in the system incorrectly calculating the fees owed by our clients or related taxes and administrative fees. Clients also may make indemnification or warranty claims against us, which could result in significant expense and risk of litigation. Product performance problems could result in loss of market share, failure to achieve market acceptance and the diversion of development resources.
Any product liability, intellectual property, warranty or other claims against us could damage our reputation and relationships with our clients, and could require us to spend significant time and money in litigation or pay significant settlements or damages. Although we maintain general liability insurance, including coverage for errors and omissions, this coverage may not be sufficient to cover liabilities resulting from such claims. Also, our insurers may disclaim coverage. Our liability insurance also may not continue to be available to us on reasonable terms, in sufficient amounts, or at all. Any contract or product liability claims successfully brought against us would harm our business.
We are subject to many hazards and operational risks that can disrupt our business, some of which may not be insured or fully covered by insurance.
Our operations are subject to many hazards inherent in the cloud contact center software business, including:
• | damage to third-party and our infrastructure and data centers, related equipment and surrounding properties caused by earthquakes, hurricanes, tornadoes, floods, fires and other natural disasters, explosions and acts of terrorism; |
• | security breaches resulting in loss or disclosure of confidential client and customer data and potential liability to clients and non-client third parties for such disclosures; |
• | inadvertent damage from third parties; and |
• | other hazards that could also result in suspension of operations, personal injury and even loss of life. |
These risks could result in substantial losses and the curtailment or suspension of our operations. For example, in the event of a major earthquake along the West Coast of the United States (where our corporate headquarters and one of our data centers are located), hurricane, tropical storm or severe weather in the southeastern United States (where our other U.S. data center is located) or catastrophic events such as fire, power loss, telecommunications failure, cyber-attack, war or terrorist attack, we may be unable to continue our operations and may endure system and service interruptions, reputational harm, delays in product development, breaches of data security and loss of critical data, any of which could harm our business and operating results.
We are not insured against all claims, events or accidents that might occur. If a significant accident or event occurs that is not fully insured, if we fail to recover all anticipated insurance proceeds for significant accidents or events for which we are insured, or if we or our data center providers fail to reopen facilities damaged by such
25
accidents or events, our operations and financial condition could be harmed. In addition to being denied coverage under existing insurance policies, we may not be able to maintain or obtain insurance of the type and amount we desire at reasonable rates.
The contact center software solutions market is subject to rapid technological change, and we must develop and sell incremental and new products in order to maintain and grow our business.
The contact center software solutions market is characterized by rapid changes in client requirements, frequent introductions of new and enhanced products and features and continuing and rapid technological advancement. To compete successfully, we must continue to design, develop, manufacture and sell new and enhanced contact center products, applications and features that provide increasingly higher capabilities, performance and stability at lower cost. If we are unable to develop or acquire new features for our existing solution or new applications that achieve market acceptance or that keep pace with technological developments, our business would be harmed. For example, we are focused on enhancing the reliability, features and functionality of our contact center solution to enhance its utility to our clients, particularly larger clients with complex, dynamic and global operations. The success of these enhancements depends on many factors, including timely development, introduction and market acceptance, as well as our ability to transition our existing clients to these new products, applications and features. Failure in this regard may significantly impair our revenue growth. In addition, because our solution is designed to operate on a variety of systems, we will need to continuously modify and enhance our solution to keep pace with changes in hardware, operating systems, the increasing trend toward multi-channel communications and other changes to software technologies. We may not be successful in developing or acquiring these modifications and enhancements or bringing them to market in a timely fashion. Furthermore, uncertainties about the timing and nature of new network platforms or technologies, or modifications to existing platforms or technologies, could delay introduction of our solution and increase our research and development expenses. Any failure of our solution to operate effectively with future network platforms and technologies could reduce the demand for our solution, result in client dissatisfaction and harm our business.
Our ability to continue to enhance our solution is dependent on adequate research and development resources. If we are not able to adequately fund our research and development efforts, we may not be able to compete effectively and our business and operating results may be harmed.
In order to remain competitive, we must continue to develop new solution offerings and enhancements to our existing cloud contact center software. Maintaining adequate research and development personnel and resources to meet the demands of the market is essential. If we are unable to develop products, applications or features internally due to constraints, such as high employee turnover, insufficient cash, inability to hire sufficient research and development personnel or a lack of other research and development resources, we may miss market opportunities. Furthermore, many of our competitors expend considerably greater amounts on their research and development programs than we do, and those that do not may be acquired by larger companies that would allocate greater resources to our competitors’ research and development programs. Our failure to devote adequate research and development resources or compete effectively with the research and development programs of our competitors could harm our business.
If we are unable to maintain the compatibility of our software with other products and technologies, our business would be harmed.
Our clients often integrate our solution with their business applications, particularly third-party CRM solutions. These third-party providers or their partners could alter their products so that our solution no longer integrates well with them, or they could delay or deny our access to technology releases that allow us to adapt our solution to integrate with their products in a timely fashion. If we cannot adapt our solution to changes in complementary technology deployed by our clients, it may significantly impair our ability to compete effectively.
Our business could be harmed if our clients are not satisfied with the professional services and technical support provided by us or our partners.
Our business depends on our ability to satisfy our clients, not only with respect to our solution, but also with the professional services and technical support that are required for our clients to implement and use our solution to address their business needs. Professional services and technical support may be performed by our own staff or, in a select subset of cases, by third parties. We will need to continue to expand and optimize our professional services
26
and technical support in order to keep up with new client installations and ongoing service, which will take time and expense to implement. Identifying and recruiting qualified service personnel and training them in our solution is difficult and competitive and requires significant time, expense and attention. We may be unable to respond quickly enough to accommodate short-term increases in client demand for support services. We also may be unable to modify the format of our support services or change our pricing to compete with changes in support services provided by our competitors. Increased client demand for these services, without corresponding revenues, could increase our costs and harm our operating results. If a client is not satisfied with the deployment and ongoing services performed by us or a third party, then we could lose clients, miss opportunities to expand our business with these clients, incur additional costs, or suffer reduced margins on, our service revenue, any of which could damage our ability to grow our business. In addition, negative publicity related to our professional services and technical support, regardless of its accuracy, may damage our business by affecting our ability to compete for new business with current and prospective clients.
Sales to clients outside the United States or with international operations and our international sales efforts and operations support expose us to risks inherent in international sales and operations.
A key element of our growth strategy is to expand our international sales efforts and develop a worldwide client base. Because of our limited experience with international sales, our international expansion may not be successful and may not produce the return on investment we expect. To date, we have realized only a small portion of our revenues from clients outside the United States.
Our international employees are primarily located in the Philippines, where technical support, training and other professional services are performed, and Russia, where software development services are performed. We have also started to increase our sales, marketing and support personnel in the U.K. to maintain and support our European data centers and to provide service and support to clients in the European Union. Operating in international markets requires significant resources and management attention and subjects us to intellectual property, regulatory, economic and political risks that are different from those in the United States. As we increase our international sales efforts and continue our other international operations, we will face risks in doing business internationally that could harm our business, including:
• | the need to establish and protect our brand in international markets; |
• | the need to localize and adapt our solution for specific countries, including translation into foreign languages and associated costs and expenses; |
• | difficulties in staffing and managing foreign operations, particularly hiring and training qualified sales and service personnel; |
• | the need to make implementations, and offer customer care, in various native languages; |
• | different pricing environments, longer sales and accounts receivable payment cycles and collections issues; |
• | weaker protection for intellectual property and other legal rights than in the U.S. and practical difficulties in enforcing intellectual property and other rights outside of the U.S.; |
• | increased risk of piracy, counterfeiting and other misappropriation of our intellectual property in our locations outside the U.S.; |
• | new and different sources of competition; |
• | general economic conditions in international markets; |
• | fluctuations in the value of the U.S. dollar and foreign currencies, which may make our solution more expensive in other countries or may increase our costs, impacting our operating results when translated into U.S. dollars; |
• | compliance with customs duties, tariffs and other international trade complexities; |
• | compliance challenges related to the complexity of multiple, conflicting and changing governmental laws and regulations, including employment, tax, telecommunications and telemarketing laws and regulations; |
• | privacy and data protection laws and regulations that are complex, expensive to comply with and may require that client data be stored and processed in a designated territory; |
• | increased risk of international telecom fraud; |
• | laws and business practices favoring local competitors; |
27
• | compliance with laws and regulations for foreign operations, including the Foreign Corrupt Practices Act, the U.K. Bribery Act and other anti-corruption laws, import and export control laws, tariffs, trade barriers, economic sanctions and regulatory or contractual limitations on our ability to sell our solution in certain foreign markets, and the risks and costs of non-compliance; |
• | increased financial accounting and reporting burdens and complexities; |
• | restrictions or taxes on the transfer of funds; |
• | adverse tax consequences; and |
• | unstable economic and political conditions. |
These risks could harm our international operations, increase our operating costs and hinder our ability to grow our international business and, consequently, our overall business and results of operations. In addition, if the political and military situation in Russia and the Ukraine, or the relationship between Russia and the United States, significantly worsens, or if either Russia or the United States imposes significant new economic sanctions or restrictions on doing business, and we are restricted or precluded from continuing our software development operations in Russia, our costs could increase, and our product development efforts, business and results of operations could be significantly harmed.
In addition, compliance with laws and regulations applicable to our international operations increases our cost of doing business outside the United States. We may be unable to keep current with changes in foreign government requirements and laws as they change from time to time. Failure to comply with these regulations could harm our business. In many countries outside the United States it is common for others to engage in business practices that are prohibited by our internal policies and procedures or U.S. or international regulations applicable to us. Although we have implemented policies and procedures designed to ensure compliance with these laws and policies, there can be no assurance that all of our employees, contractors, strategic partners and agents will comply with these laws and policies. Violations of laws or key control policies by our employees, contractors, strategic partners or agents could result in delays in revenue recognition, financial reporting misstatements, fines, penalties, or prohibitions on selling our solution, any of which could harm our business.
We have undergone recent changes to our management team; we depend on our senior management team, and the loss of one or more key employees or an inability to attract and retain highly skilled executives and other employees could harm our business and results of operations.
Our Chief Executive Officer resigned for health reasons (though he remains as Executive Chairman of our Board of Directors) effective December 2, 2017, resulting in the appointment of our Chief Financial Officer as Interim Chief Executive Officer, the promotion of our EVP of Global Sales and Services to President, and the commencement of a search for a Chief Executive Officer. Our success depends, in part, upon the performance and continued services of our key executive officers. If our new executive leadership team fails to perform effectively or if we fail to retain these executives or other members of our executive leadership team, including after we hire a new Chief Executive Officer, our business, financial condition or results of operations could be harmed. We also rely on our leadership team in the areas of research and development, marketing, sales, services and general and administrative functions, and on mission-critical individual contributors. The loss of one or more of our executive officers or key employees could seriously harm our business. We currently do not maintain key person life insurance policies on any of our employees.
To execute our growth plan, we must attract and retain highly qualified personnel, including a new CEO, and we may incur significant costs to do so. Competition for these personnel is intense, especially for a CEO, engineers highly experienced in designing and developing cloud software and for senior sales executives. We have, from time to time, experienced, and we expect to continue to experience, difficulty in hiring and retaining employees with appropriate qualifications. We invest significant time and expense in training our employees, which increases their value to competitors who may seek to recruit them and increases our costs. If we fail to attract new personnel or fail to retain and motivate our current personnel, our business and future growth prospects would be harmed. Many of the companies with which we compete for experienced personnel have greater resources than we have. If we hire employees from competitors or other companies, their former employers may attempt to assert that these employees or we have breached legal obligations, resulting in a diversion of our time and resources and, potentially, damages.
Volatility or lack of performance in the trading price of our common stock may also affect our ability to attract and retain qualified personnel because job candidates and existing employees often emphasize the value of the stock awards they receive in connection with their employment when considering whether to accept or continue
28
employment. If the perceived value of our stock awards is low or declines, it may harm our ability to recruit and retain highly skilled employees.
If we fail to grow our marketing capabilities and develop widespread brand awareness cost effectively, our business may suffer.
Our ability to increase our client base and achieve broader market acceptance of our cloud contact center software solution will depend to a significant extent on our ability to expand our marketing operations. We plan to continue to dedicate significant resources to our marketing programs, including internet advertising, digital marketing campaigns, social marketing, trade shows, industry events, co-marketing with strategic partners and telemarketing. The effectiveness of our online advertising has varied over time and may vary in the future due to competition for key search terms, changes in search engine use and changes in the search algorithms used by major search engines. All of these efforts will continue to require us to invest significant financial and other resources in our marketing efforts. Our business will be seriously harmed if our efforts and expenditures do not generate a proportionate increase in revenue.
In addition, we believe that developing and maintaining widespread awareness of our brand in a cost-effective manner, both in the United States and internationally, is critical to achieving widespread acceptance of our solution and attracting new clients. Brand promotion activities may not generate client awareness or increase revenues, and even if they do, any increase in revenues may occur after the expense has been occurred, and may not offset the costs and expenses of building our brand. If we fail to successfully promote, maintain and protect our brand, or incur substantial costs and expenses, we may fail to attract or retain clients necessary to realize a sufficient return on our brand-building efforts, or to achieve the widespread brand awareness that is critical for broad client adoption of our solution.
We may not be able to secure additional financing on favorable terms, or at all, to meet our future capital needs.
To date, we have financed our operations, primarily through sales of our solution, lease facilities and the net proceeds from our equity and debt financings. We do not know when or if our operations will generate sufficient cash to fund our ongoing operations. In the future, we may require additional capital to respond to business opportunities, challenges, acquisitions, a decline in sales, increased regulatory obligations or unforeseen circumstances and may engage in equity or debt financings or enter into credit facilities.
We have a substantial amount of debt. As of December 31, 2017, we had approximately $32.6 million in principal amount outstanding under our New Revolving Credit Facility entered into on August 1, 2016 and a $0.3 million FCC civil penalty payable to the U.S. Treasury. See Note 6 of the notes to consolidated financial statements.
Our New Revolving Credit Facility is collateralized by substantially all of our assets and contains a number of covenants that limit our ability to, among other things, sell assets, make acquisitions or investments, incur debt, grant liens, pay dividends, enter into transactions with our affiliates and use all of our available cash on hand and may prevent us from engaging in acts that may be in our best long-term interests. The amount of our current total debt and the collateral pledged under the New Revolving Credit Facility and the covenants to which we are bound may prevent us from being able to timely secure additional debt or equity financing on favorable terms, or at all, or to pursue business opportunities, including potential acquisitions. Any debt financing obtained by us in the future would cause us to incur additional debt service expenses and could include additional restrictive covenants relating to our capital raising activities and other financial and operational matters, which may make it more difficult for us to obtain additional capital and pursue business opportunities. If we raise additional funds through further issuances of equity or convertible debt securities, our existing stockholders could suffer significant dilution in their percentage ownership of our company, and any new equity securities we issue could have rights, preferences and privileges senior to those of holders of our common stock. If we are unable to obtain adequate financing or financing on terms satisfactory to us when we require it, our ability to continue to grow and support our business and to respond to business challenges could be significantly limited.
Adverse economic conditions may harm our business.
Our business depends on the overall demand for cloud contact center software solutions and on the economic health of our current and prospective clients. In addition to the United States, Canada and Latin America, we plan to market and sell our solution in Europe, Asia and other international markets. If economic conditions, including
29
currency exchange rates, in these areas and other key potential markets for our solution continue to remain uncertain or deteriorate, clients may delay or reduce their contact center and overall information technology spending. If our clients experience economic hardship, this could reduce the demand for our solution, delay and lengthen sales cycles, lower prices for our solution, and lead to slower growth or even a decline in our revenues, operating results and cash flows.
We may acquire other companies or technologies or be the target of strategic transactions, which could divert our management’s attention, result in additional dilution to our stockholders and otherwise disrupt our operations and harm our operating results.
We may acquire or invest in businesses, applications or technologies that we believe could complement or expand our solution, enhance our technical capabilities or otherwise offer growth opportunities. The pursuit of potential acquisitions may divert the attention of management, and cause us to incur various costs and expenses in identifying, investigating and pursuing acquisitions, whether or not they are consummated. We may not be able to identify desirable acquisition targets or be successful in entering into an agreement with any particular target.
To date, the growth in our business has been primarily organic, and we have limited experience in acquiring other businesses, having only completed one small acquisition. In any future acquisitions, we may not be able to successfully integrate acquired personnel, operations and technologies, or effectively manage the combined business following the acquisition. We also may not achieve the anticipated benefits from our future acquired businesses due to a number of factors, including:
• | inability to integrate or benefit from acquisitions in a profitable manner; |
• | unanticipated costs or liabilities associated with the acquisition, including legal claims arising from the activities of companies we acquire; |
• | acquisition-related costs; |
• | difficulty converting the clients of the acquired business to our solution and contract terms, including due to disparities in the revenue, licensing, support or professional services model of the acquired company; |
• | difficulty integrating the accounting systems, operations and personnel of the acquired business; |
• | difficulties and additional costs and expenses associated with supporting legacy products and the hosting infrastructure of the acquired business; |
• | diversion of management’s attention from other business concerns; |
• | harm to our existing relationships with our partners and clients as a result of the acquisition; |
• | the loss of our or the acquired business’s key employees; |
• | diversion of resources that could have been more effectively deployed in other parts of our business; and |
• | use of substantial portions of our available cash to consummate the acquisition. |
In addition, a significant portion of the purchase price of companies we acquire may be allocated to acquired goodwill and other intangible assets, which must be assessed for impairment at least annually. In the future, if our acquisitions do not yield expected returns, we may be required to take charges to our operating results based on this impairment assessment process, which could harm our results of operations.
Acquisitions could also result in dilutive issuances of equity securities, the use of our available cash, or the incurrence of debt, which could harm our operating results. In addition, if an acquired business fails to meet our expectations, our operating results, business and financial condition may suffer.
In addition, third parties may be interested in acquiring us. We will continue to consider and discuss such transactions as we deem appropriate. Such potential transactions may divert the attention of management, and cause us to incur various costs and expenses in investigating and evaluating such transactions, whether or not they are consummated.
If we are unable to maintain and further develop effective internal control over financial reporting, investors may lose confidence in the accuracy and completeness of our financial reports and the market price of our common stock may decrease.
As a public company, we are required to maintain internal control over financial reporting and to report any material weaknesses in such internal controls. Section 404 of the Sarbanes-Oxley Act of 2002, or Section 404, requires that we evaluate and determine the effectiveness of our internal control over financial reporting and provide
30
a management report on our internal control over financial reporting. However, our independent registered public accounting firm had not been required to formally attest to the effectiveness of our internal control over financial reporting pursuant to Section 404 for periods prior to the year ended December 31, 2017 as we were an “emerging growth company,” as defined by The Jumpstart Our Businesses Act of 2012, or The JOBS Act. Beginning with this annual report, our independent registered public accounting firm is required to provide this attestation, which has and will continue to increase our cost and expense.
If we identify one or more material weaknesses in our internal control over financial reporting, we will be unable to assert that our internal controls are effective. A “material weakness” is a deficiency, or a combination of deficiencies, in internal control over financial reporting such that there is a reasonable possibility that a material misstatement of our annual or interim financial statements will not be prevented or detected on a timely basis.
If we have material weaknesses in our internal control over financial reporting, we may not detect errors on a timely basis and our financial statements may be materially misstated. If we identify material weaknesses in our internal control over financial reporting, if we are unable to comply with the requirements of Section 404 in a timely manner, if we are unable to assert that our internal control over financial reporting is effective or if our independent registered public accounting firm is unable to attest that our internal control over financial reporting is effective, investors may lose confidence in the accuracy and completeness of our financial reports and the market price of our common stock could decrease. We could also become subject to stockholder or other third-party litigation as well as investigations by the stock exchange on which our securities are listed, the SEC or other regulatory authorities, which could require additional financial and management resources and could result in fines, trading suspensions or other remedies.
We are no longer an emerging growth company and the additional requirements we must comply with may strain our resources and divert management’s attention from other business concerns.
We are no longer an “emerging growth company” as defined in the JOBS Act. While we were an emerging growth company, we were able to take advantage of certain exemptions from reporting requirements that are applicable to other public companies. Compliance with these additional laws, rules and regulations has, and will continue to increase our legal and financial compliance costs, make some activities more difficult, time consuming or costly and increase demand on our systems and resources. As a result, management’s attention may be diverted from other business concerns and our costs and expenses will increase, which could harm our business and operating results. We may also need to hire more employees in the future or engage additional outside consultants to comply with these requirements, which will increase our costs and expenses.
Changes in financial accounting standards or practices may cause adverse, unexpected financial reporting fluctuations and affect our reported operating results.
U.S. GAAP is subject to interpretation by the FASB, the SEC and various bodies formed to promulgate and interpret appropriate accounting principles. A change in accounting standards or practices can have a significant effect on our reported results and may even affect our financial statements completed before the change is effective. New accounting pronouncements and varying interpretations of accounting pronouncements have occurred and will occur in the future. Changes to existing rules or the questioning of current practices may harm our reported financial results or the way we account for or conduct our business.
For example, in May 2014, the FASB issued new revenue recognition rules under Accounting Standard Codification 606 - Revenue from Contracts with Customers (“ASC 606”), which includes a single set of rules and criteria for revenue recognition to be used across all industries. We adopted this new standard in January 2018 using a modified retrospective method. With the adoption of this standard, the timing of our commission expense recognition will change, which will cause fluctuations in our operating results. See Note 1 of the notes to consolidated financial statements for information regarding the effect of new accounting pronouncements on our financial statements. The application of new accounting guidance including ASC 606 will be based on all information available to us as of the date of adoption and up through subsequent interim reporting, including transition guidance published by the standard setters. However, the interpretation of these new standards will continue to evolve as other public companies adopt the new guidance and the standard setters issue new interpretative guidance related to these rules. As a result, changes in the interpretation of these rules could result in material adjustments to our application of the new guidance, which could have a material effect on our results of operations and financial condition. Additionally, any difficulties in implementing these pronouncements could cause
31
us to fail to meet our financial reporting obligations, which could result in regulatory discipline and harm investors’ confidence in us.
In addition, certain factors have in the past and may in the future cause us to defer recognition of revenues. For example, the inclusion in our client contracts of material non-standard terms, such as acceptance criteria, could require the deferral of revenue. To the extent that such contracts become more prevalent in the future our revenue may be harmed.
Because of these factors and other specific requirements under U.S. GAAP for revenue recognition, we must have precise terms and conditions in our arrangements in order to recognize revenue when we deliver our solution or perform our professional services. Negotiation of mutually acceptable terms and conditions can extend our sales cycle, and we may accept terms and conditions that do not permit revenue recognition at the time of delivery.
The results of the United Kingdom’s referendum on withdrawal from the European Union may have a negative effect on global economic conditions, financial markets and our business.
In June 2016, a majority of voters in the United Kingdom elected to withdraw from the European Union in a national referendum, referred to as Brexit. The referendum was advisory, and the terms of any withdrawal are subject to a negotiation period that could last at least two years after the government of the United Kingdom formally initiated the withdrawal process on March 29, 2017. This election to withdraw has created significant uncertainty about the future relationship between the United Kingdom and the European Union, including with respect to the laws and regulations that will apply as the United Kingdom and the European Union determine which European Union laws to replace or replicate after the effectiveness of the withdrawal. The referendum has also given rise to calls for the governments of other European Union member states to consider withdrawal.
Brexit has harmed and may continue to harm global economic conditions and the stability of global financial markets. For example, Brexit introduced significant volatility in global stock markets and currency exchange rate fluctuations that resulted in the strengthening of the U.S. dollar against foreign currencies in which we conduct business. This volatility will likely continue while the United Kingdom and the European Union negotiate the terms of the withdrawal, as well as after the withdrawal takes effect. The strengthening of the U.S. dollar relative to other currencies will make our solution more expensive to international clients and may harm our international sales. Brexit could also cause disruptions to and create uncertainty surrounding our business, including affecting our relationships with our existing and future clients, owners of our data center facilities in the U.K. and The Netherlands and our data center partners’ ability to retain and hire qualified employees, which could harm our business, business opportunities, results of operations, financial condition and cash flows.
We may not be able to utilize a significant portion of our net operating loss or research tax credit carryforwards, and under recently enacted lower federal corporate tax rates such tax benefits will be of less value, which could harm our profitability and financial condition.
As of December 31, 2017, we had federal and state net operating loss carryforwards due to prior period losses of $188.8 million and $104.4 million, respectively, which if not utilized will begin to expire in 2024 for federal purposes. The state net operating loss started to expire in 2017. As of December 31, 2017, we also had research credit carryforwards for federal and California state tax purposes of $2.8 million and $2.4 million. If not utilized, the federal research credit carryforwards will begin to expire in 2022. If we are unable to generate sufficient taxable income to utilize our net operating loss and research tax credit carryforwards, these carryforwards could expire unused and be unavailable to offset future income tax liabilities, which could harm our profitability and financial condition.
In addition, under Section 382 of the Internal Revenue Code of 1986, as amended, or IRC Section 382, our ability to utilize net operating loss carryforwards or other tax attributes, such as research tax credits, in any taxable year may be limited if we experience an “ownership change.” An IRC Section 382 “ownership change” generally occurs if one or more stockholders or groups of stockholders who own at least 5% of our stock increase their ownership by more than 50 percentage points over their lowest ownership percentage within a rolling three-year period. Similar rules may apply under state tax laws. We experienced an ownership change prior to 2014 and the disclosed amounts of our net operating losses and potential tax credits have been reduced for the resulting effect of the IRC Section 382 limitations. Subsequent or future issuances or sales of our stock (including certain transactions involving our stock that are outside of our control) could cause an “ownership change” again, which would impose an annual limit on the amount of pre-ownership change net operating loss carryforwards and other tax attributes we
32
can use to reduce our taxable income, potentially increasing and accelerating our liability for income taxes, and also potentially causing those tax attributes to expire unused. It is possible that such an ownership change could materially reduce our ability to use our net operating loss carryforwards or other tax attributes to offset taxable income, which could require us to pay more income taxes than if we were able to fully utilize our net operating loss carryforwards and harm our profitability.
We continue to assess the impact of recently enacted H.R. 1, commonly referred to as the Tax Cuts and Jobs Act, or the new tax law, as well as any future regulations implementing the new tax law and any interpretations of the new tax law. The effect of those regulations and interpretations, as well as any additional tax reform legislation in the United States or elsewhere, could harm our business and financial condition by, among other things, decreasing the value of our net operating loss carryforwards. If we are required to reduce the value of our net operating loss carryforwards, we may be required to record a corresponding charge to current earnings, which could harm our financial condition and results of operations in the period in which it is recorded.
Risks Related to Our Intellectual Property
Any failure to protect our intellectual property rights could impair our ability to protect our proprietary technology and our brand.
Our success and ability to compete depend in part upon our intellectual property. As of December 31, 2017, our intellectual property portfolio included seven registered U.S. trademarks, 10 issued U.S. patents, two pending U.S. patent applications and one registered U.S. copyright. As of December 31, 2017, we also had two issued patents, six pending patent applications and 11 limited trademark registrations outside the U.S. The expiration dates of our issued patents range from 2030 to 2034. We primarily rely on copyright, trade secret and trademark laws, trade secret protection and confidentiality or license agreements with our employees, clients, partners and others to protect our intellectual property rights. However, the steps we take to protect our intellectual property rights may be inadequate. We may not be able to obtain any further patents or trademarks, our current patents could be invalidated or our competitors could design their products around our patented technology, and our pending applications may not result in the issuance of patents or trademarks. We have pending patent applications and limited trademark registrations outside the U.S., and we may have to expend significant resources to obtain additional protection as we expand our international operations. Furthermore, legal standards relating to the validity, enforceability and scope of protection of intellectual property rights in other countries, including Russia, where we have significant research and development operations, and the Philippines, where we have significant technical support, training and other professional services are performed, are uncertain and may afford little or no effective protection of our proprietary technology, and the risk of intellectual property misappropriation may be higher in these countries. Consequently, we may be unable to prevent our proprietary technology from being exploited abroad, which could affect our ability to expand into international markets or require costly efforts to protect our technology.
In order to protect our intellectual property rights, we may be required to spend significant resources to monitor and protect these rights. Litigation brought to protect and enforce our intellectual property rights could be costly, time consuming and distracting to management and could result in the impairment or loss of our intellectual property. Furthermore, our efforts to enforce our intellectual property rights may be met with defenses, counterclaims and countersuits attacking the validity and enforceability of our intellectual property rights. Accordingly, we may not be able to prevent third parties from infringing upon or misappropriating our intellectual property. Our failure to secure, protect and enforce our intellectual property rights could substantially harm the value of our technology, solutions, brand and business.
We will likely continue to be subject to third-party intellectual property infringement claims.
There is considerable patent and other intellectual property development activity and litigation in our industry. Our success depends upon our not infringing upon the intellectual property rights of others. Our competitors, as well as a number of other entities and individuals, may own or claim to own intellectual property relating to our industry. From time to time, third parties have claimed that we are infringing upon their intellectual property rights. For example, on April 3, 2012, NobelBiz, Inc., or NobelBiz, filed a patent infringement lawsuit against us alleging that our local caller ID management service infringes United States Patent No. 8135122. Subsequently, NobelBiz amended its complaint to add claims related to U.S. Patent No. 8565399, which is a continuation in the same family as the prior patent and addresses the same technology. In December 2017, the parties settled the matter and the case was dismissed in its entirety.
33
Certain technology necessary for us to provide our solution may be patented, copyrighted or otherwise protected by other parties either now or in the future. In such case, we would have to negotiate a license for the use of that technology. We may not be able to negotiate such a license at a price that is acceptable, or at all. The existence of such a patent, copyright or other protections, or our inability to negotiate a license for any such technology on acceptable terms, could force us to cease using such technology and offering solutions incorporating such technology.
Others have claimed, or in the future may claim, that our solution and underlying technology infringe or violate their intellectual property rights. However, we may be unaware of the intellectual property rights that others may claim cover some or all of our technology or solution. Any claims or litigation could cause us to incur significant costs and expenses and, if successfully asserted against us, could require that we pay substantial damages or ongoing royalty payments, require that we refrain from using, manufacturing or selling certain offerings or features or using certain processes, prevent us from offering our solution or certain features thereof, or require that we comply with other unfavorable terms, any of which could harm our business and operating results. We may also be obligated to indemnify our clients or business partners or pay substantial settlement costs, including royalty payments, in connection with any such claim or litigation and to obtain licenses, modify applications, or refund fees, which could be costly. Even if we were to prevail in such a dispute, any litigation regarding our intellectual property could be costly and time consuming and divert the attention of our management and key personnel from our business operations.
We employ third-party licensed software for use in or with our solution, and the inability to maintain these licenses or errors in the software we license could result in increased costs, or reduced service levels, which could harm our business.
Our solution incorporates certain third-party software obtained under licenses from other companies. We anticipate that we will continue to rely on such software and development tools from third parties in the future. Although we believe that there are commercially reasonable alternatives to the third-party software we currently license, this may not be the case, or it may be difficult or costly to transition to other providers. In addition, integration of the software used in our solution with new third-party software may require significant work and require substantial investment of our time and resources. To the extent that our solution depends upon the successful operation of third-party software in conjunction with our software, any undetected errors or defects in this third-party software could prevent the deployment or impair the functionality of our solution, delay new product or solution introductions, result in increased costs, or a failure of our solution and injure our reputation. Our use of additional or alternative third-party software would require us to enter into license agreements with third parties and to integrate such software to our solution.
There can be no assurance that the technology licensed by us will continue to provide competitive features and functionality or that licenses for technology currently utilized by us or other technology that we may seek to license in the future, will be available to us at a reasonable cost or on commercially reasonable terms, or at all. Third-party licensors may also be acquired or go out of business, which could preclude us from continuing to use such technology. The loss of, or inability to maintain, existing licenses could result in lost product features and litigation. The loss in existing licenses could also result in implementation delays or reductions until equivalent technology or suitable alternative solutions could be developed, identified, licensed and integrated, and could increase our costs and harm our business.
Our solution utilizes open source software, and any failure to comply with the terms of one or more of these open source licenses could negatively affect our business.
Our solution includes software covered by open source licenses, which may include, for example, free general public use licenses, open source front-end libraries and open source applications. The terms of various open source licenses have not been interpreted by United States courts, and there is a risk that such licenses could be construed in a manner that imposes unanticipated conditions or restrictions on our ability to market our solution. By the terms of certain open source licenses, we could be required to release the source code of our proprietary software, and to make our proprietary software available under open source licenses, if we combine our proprietary software with open source software in a certain manner. In the event that portions of our proprietary software are determined to be subject to an open source license, we could be required to publicly release the affected portions of our source code, re-engineer all or a portion of our technologies, or otherwise be limited in the licensing of our technologies, each of which could reduce or eliminate the value of our technologies and solutions. In addition to risks related to license
34
requirements, usage of open source software can lead to greater risks than use of third-party commercial software, as open source licensors generally do not provide warranties or controls on the origin of the software. Given the nature of open source software, there is also a risk that third parties may assert copyright and other intellectual property infringement claims against us based on our use of certain open source software programs. Many of the risks associated with the usage of open source software cannot be eliminated, and could harm our business.
Risks Related to Regulatory Matters
Failure to comply with laws and regulations could harm our business and our reputation.
Our business is subject to regulation by various federal, state, local and foreign governmental agencies, including agencies responsible for monitoring and enforcing employment and labor laws, workplace safety, environmental laws, consumer protection laws, anti-bribery laws, import/export controls, federal securities laws and tax laws and regulations. In certain jurisdictions, these regulatory requirements may be more stringent than those in the United States and in other circumstances these requirements may be more stringent in the United States. Noncompliance with applicable regulations or requirements could subject us to investigations, sanctions, mandatory recalls, enforcement actions, disgorgement of profits, fines, damages, civil and criminal penalties or injunctions. If any governmental sanctions, fines or penalties are imposed, or if we do not prevail in any possible civil or criminal litigation, our business, operating results, financial condition and our reputation could be harmed. In addition, responding to any action will likely result in a significant diversion of management’s attention and resources and an increase in professional fees. Enforcement actions and sanctions could further harm our business, operating results, financial condition and our reputation.
Alleged or actual failure to comply with the constantly evolving legal and contractual environment surrounding calling consumers and wireless phone numbers by other companies or our competitors or governmental or private enforcement actions related thereto, could harm our business, financial condition, results of operations and cash flows.
The legal and contractual environment surrounding calling consumers and wireless phone numbers is constantly evolving. In the United States, two federal agencies, the Federal Trade Commission, or FTC and the FCC, and various states have laws including, at the federal level, the Telephone Consumer Protection Act of 1991, or TCPA, that restrict the placing of certain telephone calls and texts to residential and wireless telephone subscribers by means of automatic telephone dialing systems, prerecorded or artificial voice messages and fax machines. These laws require companies to institute processes and safeguards to comply with these restrictions. Some of these laws, where a violation is established, can be enforced by the FTC, FCC, State Attorneys General, or private party litigants. In these types of actions, the plaintiff may seek damages, statutory penalties, costs and/or attorneys’ fees.
We have designed our solution to comply with these laws. To the extent that our solution is viewed by clients or potential clients as less functional, or more difficult to deploy or use, because of our solution’s compliance features, we may lose market share to competitors that do not include similar compliance safeguards. Our contractual arrangements with our clients who use our solution to place calls also expressly require them to comply with all such laws and to indemnify us for any failure to do so. We take reasonable steps to confirm such compliance. Even with these efforts, it is possible that the FTC, FCC, private litigants or others may attempt to hold our clients, or us as a software provider, responsible for alleged violations of these laws. It also is possible that we may not successfully enforce or collect upon our contractual indemnities from our clients. Additionally, these laws, and any changes to them or the interpretation thereof, that further restrict calling consumers, including to wireless phone numbers, adverse publicity regarding the alleged or actual failure by companies, including our clients and competitors, to comply with such laws or governmental or private enforcement actions related thereto, could result in a reduction in the use of our solution by our clients and potential clients, which could harm our business, financial condition, results of operations and cash flows.
Increased taxes on our service may increase our clients’ cost of using our service and/or increase our costs and reduce our profit margins to the extent the costs are not passed through to our clients, and we may be subject to liabilities for past sales and other taxes, surcharges and fees.
During 2011, we analyzed our activities and determined that we were obligated to collect sales taxes on sales of our subscription services in certain U.S. states. Accordingly, we registered with those states and, in 2012, commenced paying past-due amounts and collecting sales taxes from our clients and remitting such taxes to the applicable state taxing authorities. Prior to 2012, we did not collect or remit U.S. state or local sales, use, gross
35
receipts, excise and utility user taxes, fees or surcharges on our solution. During the first quarter of 2015, we conducted an updated review of the taxability of sales of our subscription services and identified four additional U.S. states where we may be obligated to collect and remit sales taxes.
During 2013, we analyzed our activities and determined that we may be obligated to collect and remit sales, excise and utility user taxes, as well as surcharges as a communications service provider, and pay gross receipts taxes, on our usage-based fees in certain U.S. states and municipalities. We neither collected nor remitted state and local taxes or surcharges on usage-based fees in any of the periods prior to 2014. Based on our ongoing assessment of our U.S. state and local tax collection and remittance obligations in respect of usage-based fees, in 2014, we registered for tax and regulatory purposes in all U.S. states where we determined such registration is proper and commenced collecting and remitting applicable state and local taxes and surcharges on such fees.
We have accrued a contingent liability of $1.5 million for our best estimate of the probable amount of taxes and surcharges that may be imposed by various states and municipalities on our activities, including our usage-based and subscription services, prior to registration. This contingent liability is based on our analysis of a number of factors, including the source location of our usage-based fees, the taxability of our subscription services and the rules and regulations in each state. The actual amount of state and local taxes and surcharges paid may differ from our estimates. See Note 10 of the notes to consolidated financial statements.
While we have accrued for these potential liabilities in each period, such accruals are based on analyses of our business activities, the operation of our solution, applicable statutes, regulations and rules in each state and locality and estimates of sales subject to sales tax or other charges. State and local taxing and regulatory authorities may challenge our position and may decide to audit our business and operations with respect to state or local sales, use, gross receipts, excise and utility user taxes, fees or surcharges, which could result in our being liable for taxes, fees, or surcharges, as well as related penalties and interest, above our recorded accrued liability or additional liability for taxes, fees, or surcharges, as well as penalties and interest for our clients, which could harm our results of operations and our relationships with our clients. In addition, if our international sales grow, additional foreign countries may seek to impose sales or other tax collection obligations on us, which would increase our exposure to liability.
The applicability of state or local taxes, fees or surcharges relative to services such as ours is complex, ambiguous and subject to interpretation and change. If states enact new legislation or if taxing and regulatory authorities promulgate new rules or regulations or expand or otherwise alter their interpretations of existing rules and regulations, we could incur additional liabilities. In addition, the collection of additional taxes, fees or surcharges in the future could increase our prices or reduce our profit margins. Compliance with new or existing legislation, rules or regulations may also make us less competitive with those competitors who are not subject to, or choose not to comply with, such legislation, rules or regulations. We have incurred, and will continue to incur, substantial ongoing costs associated with complying with state or local tax, fee or surcharge requirements in the numerous markets in which we conduct or will conduct business.
Our ability to offer services outside the U.S. is subject to different regulatory and taxation requirements, which may be complicated and uncertain.
As we continue to expand the sale and implementation of our solutions internationally, we will be subject to new regulations, taxes, surcharges and fees. Compliance with these new complex regulatory requirements that differ from country to country and are frequently changing may impose substantial compliance burdens on our business. At times, it may be difficult to determine which laws and regulations apply, we may discover that we are required to comply with certain laws and regulations after having provided services for some time in that jurisdiction, which could subject us to retroactive taxes, fees and penalties, and we may be subject to conflicting requirements. For example, prior to 2016, we had not collected taxes on our sales in Canada. During the second quarter of 2015, we reviewed the taxability of our sales in Canada and determined that we were obligated to collect from our Canadian clients and remit to the Canadian federal and certain provincial governments Value-added Taxes, or VAT, and/or Provincial Sales Taxes, or PST. We commenced collecting and remitting such taxes in January 2016. Additionally, as we expand internationally, the risk that governments will regulate or impose new or increased taxes or fees on our services increases. Any such additional regulation or taxes could decrease the value of our international expansion and harm our results of operations.
36
We are subject to assessments for unpaid USF contributions, as well as interest thereon and civil penalties, due to our late registration and past failure to recognize our obligation as a USF contributor and as an international carrier.
During the third quarter of 2012, we determined that based on our business activities, we are classified as a telecommunications service provider for regulatory purposes and we are required to make direct contributions to the USF based on revenue we receive from the resale of interstate and international telecommunications services. In order to comply with the obligation to make direct contributions, in November 2012, we made a voluntary self-disclosure to the FCC Enforcement Bureau and have registered with the USAC which is charged by the FCC with administering the USF. In April 2013, we began remitting required contributions on a prospective basis directly to USAC.
Our registration with USAC subjects us to assessments for unpaid USF contributions, as well as interest thereon and civil penalties, due to our late registration and past failure to recognize our obligation as a USF contributor and as an international carrier. We are required to pay assessments for periods prior to our registration. As of December 31, 2012, our total past due USF contribution being imposed by USAC and accrued by us for the period from 2003 through 2012 was $8.1 million, of which $4.7 million was undisputed and $3.4 million was disputed. We subsequently updated our filings and increased the liability related to 2008 through 2012 by $0.5 million, arriving at a new total of $3.9 million in disputed liability. As of January 31, 2017, we had fully paid the promissory note issued to USAC for the undisputed portion. In January 2017, the FCC ruled in our favor with respect to most of the disputed amount. In September 2017, USAC issued a credit to us reflecting the FCC’s ruling for the $3.1 million of the $3.9 million in disputed liability. In addition, USAC reversed the interest and penalties related to the disputed liability of $3.1 million. The remaining $0.8 million in dispute involves USAC’s assessment of liability for the period of 2003 through 2007, which was prior to the five year window during which we were required to maintain financial records for USF contribution purposes. In 2013, we filed a Request for Review (a form of appeal) of this disputed amount with the FCC, which remains pending. If the Request for Review is not resolved in our favor, it is possible that we will be held to the back assessments of $0.8 million, which includes interest and penalties on that amount.
In 2012, we also determined that we were a provider of international telecommunications services and therefore we were required to secure from the FCC a section 214 international carrier authorization permitting such international telecommunications. We applied with the FCC for international carrier authority, which was granted on June 9, 2015.
On June 12, 2015, in connection with our late registration with the USAC and past failure to recognize our obligation as a USF contributor and as an international carrier from 2003 to 2012, we entered into a consent decree with the FCC Enforcement Bureau. In the consent decree, we agreed to pay a civil penalty of $2.0 million to the U.S. Treasury in twelve equal quarterly installments starting in July 2015 without interest. In the third quarter of 2014, we had accrued a $2.0 million liability for the then tentative civil penalty, of which $0.3 million in principal remained outstanding as of December 31, 2017. The consent decree also requires us to adopt certain internal regulatory compliance monitoring and training requirements, and to report on the status of those compliance efforts to the FCC’s Enforcement Bureau during a period of three years. Our implementation of the internal regulatory compliance monitoring and training requirements were completed in August 2015, and the annual compliance reporting to the FCC will continue until June 2018. To the extent that we do not comply with these obligations, we could be subject to further enforcement action, including fines and penalties, by the FCC. See Note 10 of the notes to consolidated financial statements.
Our ongoing obligations to pay federal, state and local telecommunications contributions and taxes may decrease our price advantage over our competitors who have historically paid these contributions and taxes and could also make us less competitive with those competitors who are not subject to, or choose not to comply with, those requirements. In addition, if we are unable to continue to pass some or all of the cost of these contributions and taxes to our clients, our profit margins on the minutes we resell will decrease. Our federal contributions and tax obligations may significantly increase in the future, due to new interpretations by governing authorities, governmental budget pressures, changes in our business model or solutions or other factors.
37
If we do not comply with FCC rules and regulations, we could be subject to further FCC enforcement actions, fines, loss of licenses and possibly restrictions on our ability to operate or offer certain of our services.
Since our business is regulated by the FCC, we are subject to existing or potential FCC regulations relating to privacy, disability access, porting of numbers, USF contributions and other requirements. If we do not comply with FCC rules and regulations, we could be subject to further FCC enforcement actions, fines, loss of licenses and possibly restrictions on our ability to operate or offer certain of our services. Any further enforcement action by the FCC, which may be a public process, would hurt our reputation in the industry, possibly impair our ability to sell our services to clients and could harm our business and results of operations.
The regulations to which we are subject (in whole or in part) include:
• | the Communications Assistance for Law Enforcement Act, or CALEA, which requires covered entities to assist law enforcement in undertaking electronic surveillance; |
• | contributions to the USF which requires that we pay a percentage of our revenues resulting from the provision of interstate telecommunications services to support certain federal programs; |
• | payment of annual FCC regulatory fees based on our interstate and international revenues; |
• | rules pertaining to access to our services by people with disabilities and contributions to the Telecommunications Relay Services fund; and |
• | FCC rules regarding Customer Proprietary Network Information, or CPNI, which prohibit us from using such information without client approval, subject to certain exceptions. |
If we do not comply with any current or future rules or regulations that apply to our business, we could be subject to additional and substantial fines and penalties, we may have to restructure our service offerings, exit certain markets, accept lower margins or raise the price of our services, any of which could harm our business and results of operations.
Reform of federal and state USF programs could increase the cost of our service to our clients, diminishing or eliminating our pricing advantage.
The FCC and a number of states are considering reform or other modifications to USF programs. The way we calculate our contribution may change if the FCC or certain states engage in reform or adopt other modifications. In April 2012, the FCC released a Further Notice of Proposed Rulemaking to consider reforms to the manner in which companies like us contribute to the federal USF program. In general, the Further Notice of Proposed Rulemaking is considering questions like: what companies should contribute, how contributions should be assessed, and methods to improve the administration of the system. We cannot predict the outcome of this proceeding nor its impact on our business at this time. The changes in the leadership of the U.S. Government resulting from the federal election in 2016 may renew interest in completing this proceeding.
Should the FCC or certain states adopt new contribution mechanisms or otherwise modify contribution obligations that increase our contribution burden, we will either need to raise the amount we currently collect from our clients to cover this obligation or absorb the costs, which would reduce our profit margins. Furthermore, the FCC has ruled that states can require us to contribute to state USF programs. A number of states already require us to contribute, while others are actively considering extending their programs to include the solution we provide. Currently our USF contributions are borne by our clients, which could result in our solution becoming less competitive as compared to products provided by our competitors.
Privacy concerns and domestic or foreign laws and regulations may reduce the demand for our solution, increase our costs and harm our business.
Our clients can use our solution to collect, use and store information, including personally identifiable information or other information treated as confidential, regarding their customers and potential customers. Federal, state and foreign government bodies and agencies have adopted, are considering adopting, or may adopt laws and regulations regarding the collection, use, storage and disclosure of such information obtained from consumers and individuals. The costs of compliance with, and other burdens imposed by, such laws and regulations that are applicable to us and the businesses of our clients may limit the use and adoption of our solution and reduce overall demand, or lead to significant fines, penalties or other regulatory liabilities such as orders or consent decrees forcing us to modify our business practices, as well as reputational damage or third-party lawsuits for any noncompliance with such laws. Furthermore, privacy and data protection concerns may cause consumers to resist providing the
38
personal data necessary to allow our clients to use our solution effectively. Even the perception of privacy concerns, whether or not valid, may inhibit market adoption of our solution in certain industries or countries.
Domestic and international legislative and regulatory initiatives may harm our clients’ ability to process, handle, store, use and transmit information, including demographic and personally identifiable information or other information treated as confidential, regarding their customers, which could reduce demand for our solution. These laws and regulations are still evolving and are likely to be in flux and subject to uncertain interpretation for the foreseeable future. Our business could be harmed if legislation or regulations are adopted, interpreted or implemented in a manner that is inconsistent from country to country and inconsistent with our current policies and practices, or those of our clients. In addition, foreign data protection, privacy, and consumer protection laws and regulations are often more stringent than those in the United States. In particular, the European Union and its member states traditionally have imposed greater legal obligations on companies that collect and process personal data.
In October 2015, the Court of Justice for the European Union invalidated the U.S.-EU Safe Harbor program, or the Safe Harbor. The Safe Harbor provided participating U.S. companies with a legal basis to comply with EU data transfer regulations that would otherwise restrict the transfer of personal data by our clients from the European Union to us in the United States. Some of our clients relied on the Safe Harbor to transfer the personal data of their customers located in the EU to the United States. Other clients relied on legally recognized alternative mechanisms such as standard contractual clauses issued by the European Commission (commonly referred to as “model contracts”) or binding corporate resolutions to make such transfers. We relied on the use of standard contractual clauses issued by the European Commission before the invalidation of the Safe Harbor in October 2015, and we continue to do so currently. In July 2016, EU and U.S. regulators announced the approval of a new trans-Atlantic agreement, the EU-U.S. Privacy Shield, or the Privacy Shield, which succeeds the Safe Harbor. Companies interested in self-certifying compliance with this new trans-Atlantic data-transfer framework could do so beginning in August 2016, when the U.S. Department of Commerce began accepting certifications. The self-certification process under the Privacy Shield is similar to the Safe Harbor. However, the compliance requirements under the Privacy Shield are generally more stringent than under the Safe Harbor. The Privacy Shield is subject to annual review by the EU Commission. In October 2017, the EU Commission released its report and accompanying working document on the first annual review of the Privacy Shield, including recommendations on the functioning of the Privacy Shield that need to be improved by the US authorities. The Art. 29 Working Party (advisory body comprised of representatives of EU data protection authorities) issued in December 2017 a report concerning the first annual review of the functioning of the Privacy Shield in which it identified a number of significant concerns that need to be addressed by both the EU Commission and the U.S. authorities by May 25, 2018. The Art. 29 Working Party threatens to take legal action against the Privacy Shield adequacy decision if its concerns are not properly addressed within the given timeframe.
Other methods for transferring personal data across the Atlantic are also facing legal scrutiny. In October 2017 the Irish High Court decided in a case concerning the validity of standard contractual clauses to refer certain questions to the European Court of Justice, or the ECJ, for a determination in a preliminary ruling. An adverse decision from the ECJ will impact how either we or our clients transfer personal data out of the EU. Further uncertainty exists with regard to data transfers in relation to the United Kingdom due to a referendum in which voters in the UK decided to withdraw from the European Union. Finally, the EU recently adopted the General Data Protection Regulation, or GDPR, which is the most comprehensive reform of data protection law in the EU’s history. The GDPR, which will become applicable in May 2018, will significantly update and modify European data protection law, including extending its application to a wider range of non-EU entities, harmonizing data protection rules across EU member states, giving data subjects important new rights, and significantly increasing penalties for non-compliance.
In addition, as indicated above, we are also subject to Canada’s Personal Information Protection and Electronic Documents Act, or PIPEDA, and the analogous provincial laws, which similarly impose data privacy and security obligations on our processing of personal data.
Any of these developments, and the cost of compliance, could harm our operations and financial results. Moreover, any non-compliance, or perceived non-compliance, with these obligations, could result in investigations or enforcement actions by applicable regulators, lawsuits by private parties, changes to our business practices, increased cost of operations, or declines in client growth, or may otherwise harm our business.
39
In addition to government activity, privacy advocacy groups and the technology and other industries are considering various new, additional or different self-regulatory standards that may place additional burdens on us. If the processing of information were to be curtailed in this manner, our solution may be less attractive, which may reduce demand for our solution and harm our business.
Risks Related to Ownership of Our Common Stock
Our stock price has been volatile, may continue to be volatile and may decline, including due to factors beyond our control.
The market price of our common stock has been volatile in the past and may fluctuate significantly in the future in response to numerous factors, many of which are beyond our control. During the twelve months ended December 31, 2017, the sale price per share of our common stock ranged from a low of $14.00 to a high of $27.81. Factors that may contribute to continuing volatility in the price of our common stock include:
• | actual or anticipated fluctuations in our operating results; |
• | the financial projections we provide to the public, any changes in these projections or our failure to meet these projections; |
• | failure of securities analysts to initiate or maintain coverage of our company, changes in financial estimates by any securities analysts who follow our company, or our failure to meet these estimates or the expectations of investors; |
• | ratings changes by any securities analysts who follow our company; |
• | sales of our common stock by us or our significant stockholders, or the public announcement of same; |
• | the assessment of our business or position in our market published in research and other reports; |
• | announcements by us or our competitors of significant technical innovations, acquisitions, strategic partnerships, joint ventures or capital commitments; |
• | changes in operating performance and stock market valuations of other technology companies generally, or those in the software as a service industry in particular; |
• | price and volume fluctuations in the overall stock market, including as a result of trends in the U.S. or global economy; |
• | any major change in our board of directors or management; |
• | lawsuits threatened or filed against us; |
• | security breaches or incidents impacting our clients or their customers; |
• | legislation or regulation of our business, the internet and/or contact centers; |
• | loss of key personnel; |
• | new entrants into the contact center market, including the transition by providers of legacy on-premise contact center systems to cloud solutions, as well as cable and incumbent telephone companies and other well-capitalized competitors; |
• | new products or new sales by us or our competitors; |
• | the perceived or real impact of events that harm our direct competitors; |
• | developments with respect to patents or proprietary rights; |
• | general market conditions; |
• | distributions to limited partners, or block sales, by original venture capital investors; and |
• | other events or factors, including those resulting from war, incidents of terrorism or responses to these events, which could be unrelated to, or outside of, our control. |
In addition, stock markets have experienced extreme price and volume fluctuations that have affected and continue to affect the market prices of equity securities of many technology companies. Stock prices of many technology companies have fluctuated in a manner unrelated or disproportionate to the operating performance of those companies. These and other factors may disproportionately impact the trading price of our common stock. In the past, stockholders have instituted securities class action litigation following periods of market volatility. If we were to become involved in securities litigation, it could subject us to substantial costs, divert resources and the
40
attention of management from our business and harm our business, results of operations, financial condition, reputation and cash flows.
If securities or industry analysts discontinue publishing research or reports about our business, or publish negative reports about our business, our share price and trading volume could decline.
The trading market for our common stock depends in part on the research and reports that securities or industry analysts publish about us or our business, our market and our competitors. We do not have any control over these analysts. If one or more of the analysts who cover us downgrade our shares or change their opinion of our shares, our share price would likely decline. If one or more of these analysts cease coverage of our company or fail to regularly publish reports on us, we could lose visibility in the financial markets, which could cause our share price or trading volume to decline.
Substantial future sales of shares of our common stock could cause the market price of our common stock to decline.
The market price of shares of our common stock could decline as a result of substantial sales of our common stock, particularly sales by our directors, executive officers and significant stockholders and persons to whom our shares are distributed by our significant stockholders or the perception in the market that holders of a large number of shares intend to sell their shares.
Certain holders of our outstanding common stock have rights, subject to certain conditions, to require us to file registration statements covering their shares or to include their shares in registration statements that we may file for ourselves or our stockholders. The filing of a registration statement for these shares may cause our stock price to decline, even before such shares are actually sold in the market. We have also registered shares of common stock that we may issue under our employee equity incentive plans. These shares can be sold freely in the public market upon issuance.
Anti-takeover provisions in our charter documents and under Delaware law could make an acquisition of our company more difficult, limit attempts by our stockholders to replace or remove our current management and limit the market price of our common stock.
Provisions in our amended and restated certificate of incorporation and amended and restated bylaws may have the effect of delaying or preventing a change in control or changes in our management. Our amended and restated certificate of incorporation and amended and restated bylaws:
• | provide that our board of directors is classified into three classes of directors; |
• | provide that stockholders may remove directors only for cause and only with the approval of holders of at least 66 2⁄3% of our then outstanding capital stock; |
• | provide that the authorized number of directors may be changed only by resolution of the board of directors; |
• | provide that all vacancies, including newly created directorships, may, except as otherwise required by law, be filled by the affirmative vote of a majority of directors then in office, even if less than a quorum; |
• | provide that our stockholders may not take action by written consent, and may only take action at annual or special meetings of our stockholders; |
• | provide that stockholders seeking to present proposals before a meeting of stockholders or to nominate candidates for election as directors at a meeting of stockholders must provide notice in writing in a timely manner, and also specify requirements as to the form and content of a stockholder’s notice; |
• | restrict the forum for certain litigation against us to Delaware; |
• | do not provide for cumulative voting rights (therefore allowing the holders of a majority of the shares of common stock entitled to vote in any election of directors to elect all of the directors standing for election); |
• | provide that special meetings of our stockholders may be called only by the chairman of the board, our chief executive officer or the board of directors pursuant to a resolution adopted by a majority of the total number of authorized directors; and |
• | provide that stockholders will be permitted to amend our amended and restated bylaws only upon receiving at least 662/3% of the votes entitled to be cast by holders of all outstanding shares then entitled to vote generally in the election of directors, voting together as a single class. |
41
These provisions may frustrate or prevent any attempts by our stockholders to replace or remove our current management by making it more difficult for stockholders to replace members of our board of directors, which is responsible for appointing the members of our management. In addition, because we are incorporated in Delaware, we are governed by the provisions of Section 203 of the Delaware General Corporation Law, which generally prohibits a Delaware corporation from engaging in any of a broad range of business combinations with any “interested” stockholder for a period of three years following the date on which the stockholder became an “interested” stockholder.
Our amended and restated certificate of incorporation provides that the Court of Chancery of the State of Delaware is the sole and exclusive forum for substantially all disputes between us and our stockholders, which could limit our stockholders’ ability to obtain a favorable judicial forum for disputes with us or our directors, officers or employees.
Our amended and restated certificate of incorporation provides that, unless we consent to the selection of an alternative forum, the Court of Chancery of the State of Delaware is the sole and exclusive forum for (1) any derivative action or proceeding brought on our behalf, (2) any action asserting a claim of breach of fiduciary duty owed by any of our directors, officers or other employees to us or to our stockholders, (3) any action asserting a claim arising pursuant to the Delaware General Corporation Law or (4) any action asserting a claim governed by the internal affairs doctrine. The choice of forum provision may limit a stockholder’s ability to bring a claim in a judicial forum that it finds favorable for disputes with us or our directors, officers or other employees, which may discourage such lawsuits against us and our directors, officers and other employees. Alternatively, if a court were to find the choice of forum provision contained in our amended and restated certificate of incorporation to be inapplicable or unenforceable in an action, we may incur additional costs associated with resolving such action in other jurisdictions, which could harm our business, operating results and financial condition.
We have never paid cash dividends and do not intend to pay dividends for the foreseeable future.
We have never declared or paid any cash dividends on our common stock. We currently intend to retain any future earnings and do not expect to pay any dividends in the foreseeable future. Any future determination to declare cash dividends will be made at the discretion of our board of directors, subject to applicable laws, and will depend on a number of factors, including our financial condition, results of operations, capital requirements, contractual restrictions, general business conditions and other factors that our board of directors may deem relevant. In addition, our New Revolving Credit Facility prohibits us and our subsidiaries from, among other things, paying any dividends or making any other distribution or payment on account of our common stock. Accordingly, holders of our common stock must rely on sales of their common stock after price appreciation, which may never occur, as the only way to realize any future gains on their investments.
ITEM 1B. Unresolved Staff Comments
None.
ITEM 2. Properties
We currently lease approximately 108,100 square feet of office space worldwide. Information concerning our principal leased properties as of December 31, 2017 is set forth below:
Location | Principal Use | Square Footage | Lease Expiration Date | ||||
San Ramon, California | Corporate headquarters, sales, marketing, product design, professional services, research and development | 79,600 | March 2021 | ||||
The Philippines | Technical support, training and other professional services | 16,500 | March, 2020 | ||||
Russia | Software development | 12,000 | December 2018* | ||||
* | This represents the expiration date for the lease renewal effective in February 2018. | ||||||
42
The hosting of our equipment and software at co-located third-party facilities is also significant to our business. We have entered into rental agreements with third-party facilities in Santa Clara, California; Atlanta, Georgia; Miami, Florida; Slough, England; and Amsterdam, The Netherlands, which require monthly payments for a fixed period of time in exchange for certain guarantees of network and telecommunication availability. These agreements expire at various dates through 2021.
We believe our facilities are sufficient for our current needs.
ITEM 3. Legal Proceedings
Information with respect to this item may be found under the heading “Legal Matters” in Note 10 of the Notes to Consolidated Financial Statements in this Annual Report on Form 10-K, which information is incorporated herein by reference.
ITEM 4. Mine Safety Disclosures
Not applicable.
43
PART II
ITEM 5. Market for Registrant’s Common Equity, Related Stockholder Matters and Issuer Purchases of Equity Securities
Stock Price
Our common stock trades on The NASDAQ Global Market, or NASDAQ, under the symbol “FIVN.” The following table sets forth, for the periods indicated, the high and low reported sales prices of our common stock as reported by NASDAQ.
High | Low | |||||||
Year 2017 | ||||||||
First quarter | $ | 18.93 | $ | 14.00 | ||||
Second quarter | 24.80 | 16.30 | ||||||
Third quarter | 23.93 | 19.53 | ||||||
Fourth quarter | 27.81 | 22.51 | ||||||
Year 2016 | ||||||||
First quarter | $ | 9.84 | $ | 6.14 | ||||
Second quarter | 12.96 | 8.23 | ||||||
Third quarter | 16.23 | 11.46 | ||||||
Fourth quarter | 16.40 | 12.58 | ||||||
Number of Common Stock Holders
On February 22, 2018, there were approximately 38 stockholders of record of our common stock who held an aggregate of 56,734,715 shares of our common stock. We believe that there are a substantially greater number of beneficial owners of our common stock.
Dividend Policy
We have never declared or paid any cash dividends on our common stock. We currently intend to retain any future earnings and do not expect to pay any dividends in the foreseeable future. In addition, our credit agreement prohibits us and our subsidiaries from, among other things, paying any dividends or making any other distribution or payment on account of our common stock. See “Management’s Discussion and Analysis of Financial Condition and Results of Operation - Liquidity and Capital Resources” below. Any future determination to declare cash dividends will be made at the discretion of our board of directors, subject to applicable laws, and will depend on a number of factors, including our financial condition, results of operations, capital requirements, contractual restrictions, including under our credit agreement, general business conditions and other factors that our board of directors may deem relevant.
Recent Sales of Unregistered Securities
None.
Use of Proceeds from Public Offerings of Common Stock
The Registration Statement on Form S-1 (File No. 333-194258) for our IPO of our common stock was declared effective by the SEC on April 3, 2014.
We received aggregate proceeds of $74.9 million from our IPO after deducting underwriters’ discounts and commissions of $5.6 million, but before deducting offering expenses of approximately $4.2 million, of which $0.8 million had been paid prior to 2014 and the remaining $3.4 million had been paid in the first two quarters of 2014.
There has been no material change in the planned use of proceeds from our IPO as described in our final prospectus (dated April 3, 2014) filed with the SEC on April 4, 2014 pursuant to Rule 424(b)(4). We currently invest
44
a portion of the IPO proceeds in registered money market funds and to date have used a portion of the proceeds for general corporate purposes.
Purchases of Equity Securities by the Issuer and Affiliated Purchasers
None.
Stock Performance Graph
The graph below compares the cumulative total return on our common stock with that of the Russell 2000 Index and the NASDAQ Computer and Data Processing Index. The period shown commences on April 4, 2014 and ends on December 31, 2017. The graph assumes $100 was invested at the close of market on April 4, 2014 in the common stock of Five9, the Russell 2000 Index and the NASDAQ Computer and Data Processing Index, and assumes the reinvestment of any dividends. The stock price performance on the following graph is not intended to forecast or be indicative of future stock price performance of our common stock.
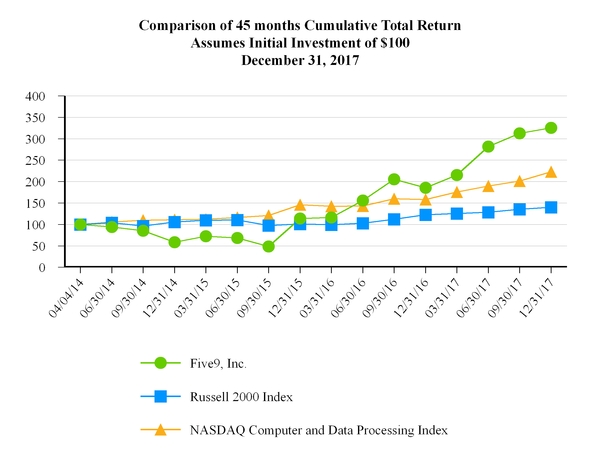
This performance graph shall not be deemed “soliciting material” or to be “filed” with the SEC for purposes of Section 18 of the Exchange Act, or otherwise subject to the liabilities under that Section, and shall not be deemed to be incorporated by reference into any filing of Five9, Inc. under the Securities Act of 1933, as amended, or the Securities Act of 1934 Exchange, as amended.
45
ITEM 6. Selected Financial Data
The following selected consolidated statement of operations data for the years ended December 31, 2017, 2016 and 2015 and the selected consolidated balance sheet data as of December 31, 2017 and 2016 are derived from our audited consolidated financial statements included elsewhere in this Form 10-K. The following selected consolidated statement of operations data for the years ended December 31, 2014 and 2013 and the selected consolidated balance sheet data as of December 31, 2015, 2014 and 2013 are derived from our audited consolidated financial statements that are not included in this report.
Our historical results are not necessarily indicative of the results that may be expected in the future. You should read the following selected financial data in conjunction with the section titled “Management’s Discussion and Analysis of Financial Condition and Results of Operations”, our consolidated financial statements, related notes, and other financial information included elsewhere in this Form 10-K.
Year Ended December 31, | ||||||||||||||||||||
2017 | 2016 | 2015 | 2014 | 2013 | ||||||||||||||||
(in thousands, except per share data) | ||||||||||||||||||||
Revenue | $ | 200,225 | $ | 162,090 | $ | 128,868 | $ | 103,102 | $ | 84,132 | ||||||||||
Cost of revenue | 83,104 | 66,934 | 59,495 | 54,661 | 48,807 | |||||||||||||||
Gross profit | 117,121 | 95,156 | 69,373 | 48,441 | 35,325 | |||||||||||||||
Operating expenses: | ||||||||||||||||||||
Research and development (1)(2) | 27,120 | 23,878 | 22,659 | 22,110 | 17,529 | |||||||||||||||
Sales and marketing (1)(2) | 66,570 | 52,748 | 42,042 | 37,445 | 28,065 | |||||||||||||||
General and administrative (1)(2) | 29,151 | 25,072 | 25,822 | 24,416 | 18,053 | |||||||||||||||
Total operating expenses | 122,841 | 101,698 | 90,523 | 83,971 | 63,647 | |||||||||||||||
Loss from operations | (5,720 | ) | (6,542 | ) | (21,150 | ) | (35,530 | ) | (28,322 | ) | ||||||||||
Other income (expense), net: | ||||||||||||||||||||
Extinguishment of debt | — | (1,026 | ) | — | — | — | ||||||||||||||
Interest and other | (2,981 | ) | (4,238 | ) | (4,627 | ) | (3,916 | ) | (1,051 | ) | ||||||||||
Change in fair value of convertible preferred and common stock warrant liabilities | — | — | — | 1,745 | (1,871 | ) | ||||||||||||||
Total other income (expense), net | (2,981 | ) | (5,264 | ) | (4,627 | ) | (2,171 | ) | (2,922 | ) | ||||||||||
Loss before income taxes | (8,701 | ) | (11,806 | ) | (25,777 | ) | (37,701 | ) | (31,244 | ) | ||||||||||
Provision for income taxes | 268 | 54 | 61 | 85 | 70 | |||||||||||||||
Net loss | $ | (8,969 | ) | $ | (11,860 | ) | $ | (25,838 | ) | $ | (37,786 | ) | $ | (31,314 | ) | |||||
Net loss per share: | ||||||||||||||||||||
Basic and diluted | $ | (0.16 | ) | $ | (0.23 | ) | $ | (0.52 | ) | $ | (1.00 | ) | $ | (7.82 | ) | |||||
Shares used in computing net loss per share: | ||||||||||||||||||||
Basic and diluted | 54,946 | 52,342 | 50,141 | 37,604 | 4,006 | |||||||||||||||
(1) Depreciation and amortization expenses included in our results of operations are as follows (in thousands):
Year Ended December 31, | ||||||||||||||||||||
2017 | 2016 | 2015 | 2014 | 2013 | ||||||||||||||||
Cost of revenue | $ | 6,300 | $ | 6,573 | $ | 5,950 | $ | 5,138 | $ | 3,709 | ||||||||||
Research and development | 795 | 737 | 455 | 229 | 214 | |||||||||||||||
Sales and marketing | 120 | 221 | 206 | 196 | 83 | |||||||||||||||
General and administrative | 1,099 | 859 | 777 | 900 | 409 | |||||||||||||||
Total depreciation and amortization | $ | 8,314 | $ | 8,390 | $ | 7,388 | $ | 6,463 | $ | 4,415 | ||||||||||
46
(2) Stock-based compensation expense is included in our results of operations as follows (in thousands):
Year Ended December 31, | ||||||||||||||||||||
2017 | 2016 | 2015 | 2014 | 2013 | ||||||||||||||||
Cost of revenue | $ | 2,202 | $ | 1,375 | $ | 866 | $ | 542 | $ | 194 | ||||||||||
Research and development | 3,042 | 2,059 | 1,790 | 1,931 | 499 | |||||||||||||||
Sales and marketing | 4,364 | 2,363 | 1,800 | 1,510 | 751 | |||||||||||||||
General and administrative | 5,735 | 3,846 | 3,274 | 2,770 | 505 | |||||||||||||||
Total stock-based compensation | $ | 15,343 | $ | 9,643 | $ | 7,730 | $ | 6,753 | $ | 1,949 | ||||||||||
December 31, | ||||||||||||||||||||
2017 | 2016 | 2015 | 2014 | 2013 | ||||||||||||||||
(in thousands) | ||||||||||||||||||||
Consolidated Balance Sheet Data: | ||||||||||||||||||||
Cash, cash equivalents and short-term investments | $ | 68,947 | $ | 58,122 | $ | 58,484 | $ | 78,289 | $ | 17,748 | ||||||||||
Working capital | 53,317 | 40,933 | 22,712 | 56,234 | 1,076 | |||||||||||||||
Total assets | 128,196 | 105,239 | 99,233 | 116,934 | 56,278 | |||||||||||||||
Total debt and capital leases | 46,742 | 45,799 | 46,617 | 47,696 | 30,332 | |||||||||||||||
Additional paid-in capital | 222,202 | 196,555 | 180,649 | 170,286 | 34,089 | |||||||||||||||
Total stockholders’ equity (deficit) | 46,838 | 30,328 | 26,280 | 41,753 | (2,968 | ) | ||||||||||||||
ITEM 7. Management’s Discussion and Analysis of Financial Condition and Results of Operations
You should read the following discussion in conjunction with the consolidated financial statements and notes thereto included elsewhere in this report.
Overview
We are a pioneer and leading provider of cloud software for contact centers, facilitating more than three billion interactions between our more than 2,000 clients and their customers per year. We believe we achieved this leadership position through our expertise and technology, which has empowered us to help organizations of all sizes transition from legacy on-premise contact center systems to our cloud solution. Our solution, which is comprised of our VCC cloud platform and applications, allows simultaneous management and optimization of customer interactions across voice, chat, email, web, social media and mobile channels, either directly or through our APIs. Our VCC cloud platform routes each customer interaction to an appropriate agent resource, and delivers relevant customer data to the agent in real-time to optimize the customer experience. Unlike legacy on-premise contact center systems, our solution requires minimal up-front investment and can be rapidly deployed and adjusted depending on our client’s requirements.
Since founding our business in 2001, we have focused exclusively on delivering cloud contact center software. We initially targeted smaller contact center opportunities with our telesales team and, over time, invested in expanding the breadth and depth of the functionality of our cloud platform to meet the evolving requirements of our clients. In 2009, we made a strategic decision to expand our market opportunity to include larger contact centers. This decision drove further investments in research and development and the establishment of our field sales team to meet the requirements of these larger contact centers. We believe this shift has helped us diversify our client base, while significantly enhancing our opportunity for future revenue growth. To complement these efforts, we have also focused on building client awareness and driving adoption of our solution through marketing activities, which include internet advertising, digital marketing campaigns, social marketing, trade shows, industry events and telemarketing.
We provide our solution through a SaaS business model with recurring subscriptions. We offer a comprehensive suite of applications delivered on our VCC cloud platform that are designed to enable our clients to manage and optimize interactions across inbound and outbound contact centers. We primarily generate revenue by
47
selling subscriptions and related usage of our VCC cloud platform. We charge our clients monthly subscription fees for access to our solution, primarily based on the number of agent seats, as well as the specific functionalities and applications our clients deploy. We define agent seats as the maximum number of named agents allowed to concurrently access our solution. Our clients typically have more named agents than agent seats, and multiple named agents may use an agent seat, though not simultaneously. Substantially all of our clients purchase both subscriptions and related telephony usage from us. A small percentage of our clients subscribe to our platform but purchase telephony usage directly from wholesale telecommunications service providers. We do not sell telephony usage on a stand-alone basis to any client. The related usage fees are based on the volume of minutes for inbound and outbound interactions. We also offer bundled plans, generally for smaller deployments, where the client is charged a single monthly fixed fee per agent seat that includes both subscription and unlimited usage in the contiguous 48 states and, in some cases, Canada. We offer monthly, annual and multiple-year contracts to our clients, generally with 30 days’ notice required for changes in the number of agent seats. Our clients can use this notice period to rapidly adjust the number of agent seats used to meet their changing contact center volume needs, including to reduce the number of agent seats to zero. As a general matter, this means that a client can effectively terminate its agreement with us upon 30 days’ notice. Our larger clients typically choose annual contracts, which generally include an implementation and ramp period of several months. Fixed subscription fees, including bundled plans, are generally billed monthly in advance, while related usage fees are billed in arrears. For the years ended December 31, 2017, 2016 and 2015, subscription and related usage fees accounted for 94%, 95% and 96% of our revenue, respectively. The remainder was comprised of professional services revenue from the implementation and optimization of our solution.
Our revenue increased to $200.2 million for the year ended December 31, 2017, from $162.1 million and $128.9 million for the years ended December 31, 2016 and 2015, respectively. Revenue growth has primarily been driven by our larger clients. For each of the years ended December 31, 2017, 2016 and 2015, no single client accounted for more than 10% of our total revenue. As of December 31, 2017, we had over 2,000 clients across multiple industries. Our clients’ subscriptions generally range in size from fewer than 10 agent seats to approximately 2,000 agent seats. We had net loss of $9.0 million, $11.9 million and $25.8 million for the years ended December 31, 2017, 2016 and 2015, respectively.
We have continued to make significant expenditures and investments, including in sales and marketing, research and development and infrastructure. We primarily evaluate the success of our business based on revenue growth and the efficiency and effectiveness of our investments. The growth of our business and our future success depend on many factors, including our ability to continue to expand our client base to include larger opportunities, grow revenue from our existing client base, innovate and expand internationally. While these areas represent significant opportunities for us, they also pose risks and challenges that we must successfully address in order to sustain the growth of our business and improve our operating results. In order to pursue these opportunities, we anticipate that we will continue to expand our operations and headcount in the near term.
Due to our continuing investments to grow our business, increase our sales and marketing efforts, pursue new opportunities, enhance our solution and build our technology, we expect our cost of revenue and operating expenses to increase in absolute dollars in future periods. However, we expect these expenses to decrease as a percentage of revenue as we grow our revenue and gain economies of scale by increasing our client base without direct incremental development costs and by utilizing more of the capacity of our data centers.
Key Operating and Financial Performance Metrics
In addition to measures of financial performance presented in our consolidated financial statements, we monitor the key metrics set forth below to help us evaluate growth trends, establish budgets, measure the effectiveness of our sales and marketing efforts and assess operational efficiencies.
Annual Dollar-Based Retention Rate
We believe that our Annual Dollar-Based Retention Rate provides insight into our ability to retain and grow revenue from our clients, and is a measure of the long-term value of our client relationships. Our Annual Dollar-Based Retention Rate is calculated by dividing our Retained Net Invoicing by our Retention Base Net Invoicing on a monthly basis, which we then average using the rates for the trailing twelve months for the period being presented. We define Retention Base Net Invoicing as recurring net invoicing from all clients in the comparable prior year period, and we define Retained Net Invoicing as recurring net invoicing from that same group of clients in the current period. We define recurring net invoicing as subscription and related usage revenue excluding the impact of
48
service credits, reserves and deferrals. Historically, the difference between recurring net invoicing and our subscription and related usage revenue has been within 10%.
The following table shows our Annual Dollar-Based Retention Rate for the periods presented:
Twelve Months Ended December 31, | ||||||
2017 | 2016 | 2015 | ||||
Annual Dollar-Based Retention Rate | 98% | 100% | 96% | |||
Our Dollar-Based Retention Rate declined from 2016 to 2017 primarily due to the prior year period benefiting from the ramp of one of our largest customers.
Adjusted EBITDA
We monitor adjusted EBITDA, a non-GAAP financial measure, to analyze our financial results and believe that it is useful to investors, as a supplement to U.S. GAAP measures, in evaluating our ongoing operational performance and enhancing an overall understanding of our past financial performance. We believe that adjusted EBITDA helps illustrate underlying trends in our business that could otherwise be masked by the effect of the income or expenses that we exclude from adjusted EBITDA. Furthermore, we use this measure to establish budgets and operational goals for managing our business and evaluating our performance. We also believe that adjusted EBITDA provides an additional tool for investors to use in comparing our recurring core business operating results over multiple periods with other companies in our industry.
Adjusted EBITDA should not be considered in isolation from, or as a substitute for, financial information prepared in accordance with U.S. GAAP and our calculation of adjusted EBITDA may differ from that of other companies in our industry. We compensate for the inherent limitations associated with using adjusted EBITDA through disclosure of these limitations, presentation of our financial statements in accordance with U.S. GAAP and reconciliation of adjusted EBITDA to the most directly comparable U.S. GAAP measure, net loss. We calculate adjusted EBITDA as net loss before (1) depreciation and amortization, (2) stock-based compensation, (3) interest income, expense and other, (4) provision for income taxes, and (5) other unusual items that do not directly affect what we consider to be our core operating performance.
The following table shows a reconciliation of net loss to adjusted EBITDA for the periods presented (in thousands):
Year Ended December 31, | ||||||||||||
2017 | 2016 | 2015 | ||||||||||
Net loss | $ | (8,969 | ) | $ | (11,860 | ) | $ | (25,838 | ) | |||
Non-GAAP adjustments: | ||||||||||||
Depreciation and amortization (1) | 8,314 | 8,390 | 7,388 | |||||||||
Stock-based compensation (2) | 15,343 | 9,643 | 7,730 | |||||||||
Extinguishment of debt | — | 1,026 | — | |||||||||
Interest expense | 3,471 | 4,226 | 4,727 | |||||||||
Interest (income) and other | (490 | ) | 13 | (100 | ) | |||||||
Legal settlement (3) | 1,700 | — | — | |||||||||
Legal and indemnification fees related to settlement | 135 | — | — | |||||||||
Reversal of interest and penalties on accrued federal fees (4) | (2,133 | ) | — | — | ||||||||
Reversal of accrued federal fees (5) | — | (3,114 | ) | — | ||||||||
Provision for income taxes | 268 | 54 | 61 | |||||||||
Out of period adjustment for sales tax liability (6) | — | — | 765 | |||||||||
Adjusted EBITDA | $ | 17,639 | $ | 8,378 | $ | (5,267 | ) | |||||
49
(1) | See ITEM 6 of this Form 10-K for depreciation and amortization expenses included in our results of operations for the periods presented. |
(2) | See Note 7 of the notes to the consolidated financial statements under ITEM 8 of this Form 10-K for stock-based compensation expense included in our results of operations for the periods presented. |
(3) | See “Legal Matters” in Note 10 of the notes to the consolidated financial statements under ITEM 8 of this Form 10-K for additional information. |
(4) | Included in general and administrative expense. Amount represents the reversal of accrued interest and penalties related to the Universal Services Fund ("USF") liability following a favorable ruling from the FCC's Wireline Competition Bureau. See Note 10 of the notes to the consolidated financial statements under ITEM 8 of this Form 10-K for additional information. |
(5) | Included in cost of revenue. Amount represents a credit recorded in the fourth quarter of 2016 following a favorable ruling from the FCC’s Wireline Competition Bureau. See Note 10 of the notes to the consolidated financial statements under ITEM 8 of this Form 10-K. |
(6) | Included in general and administrative expense. The 2015 amount represents immaterial out of period adjustments recorded in the first two quarters of 2015 for 2011 through 2014. |
Key Components of Our Results of Operations
Revenue
Our revenue consists of subscription and related usage as well as professional services. We consider our subscription and related usage to be recurring revenue. This recurring revenue includes fixed subscription fees for the delivery and support of our VCC cloud platform, as well as related usage fees. The related usage fees are based on the volume of minutes for inbound and outbound client interactions. We also offer bundled plans, generally for smaller deployments, where the client is charged a single monthly fixed fee per agent seat that includes both subscription and unlimited usage in the contiguous 48 states and, in some cases, Canada. We offer monthly, annual and multiple-year contracts for our clients, generally with 30 days’ notice required for changes in the number of agent seats. Our clients can use this notice period to rapidly adjust the number of agent seats used to meet their changing contact center volume needs, including to reduce the number of agent seats to zero. As a general matter, this means that a client can effectively terminate its agreement with us upon 30 days’ notice.
Fixed subscription fees, including plans with bundled usage, are generally billed monthly in advance, while variable usage fees are billed in arrears. Fixed subscription fees are recognized on a straight-line basis over the applicable term, predominantly the monthly contractual billing period. Support activities include technical assistance for our solution and upgrades and enhancements on a when and if available basis, which are not billed separately. Variable subscription related usage fees for non-bundled plans are billed in arrears based on client-specific per minute rate plans and are recognized as actual usage occurs. We generally require advance deposits from clients based on estimated usage. All fees, except usage deposits, are non-refundable.
In addition, we generate professional services revenue from assisting clients in implementing our solution and optimizing use. These services include application configuration, system integration and education and training services. Professional services are primarily billed on a fixed-fee basis and are typically performed by us directly. In limited cases, our clients choose to perform these services themselves or engage their own third-party service providers to perform such services. Professional services are recognized as the services are performed using the proportional performance method, with performance measured based on labor hours, provided all other criteria for revenue recognition are met.
We do not expect the adoption of ASC 606, the new revenue recognition guidance, in January 2018 to have a material impact on the recognition or timing of revenue. See Note 1 of notes to consolidated financial statements in this report for additional information.
Cost of Revenue
Our cost of revenue consists primarily of personnel costs (including stock-based compensation), fees that we pay to telecommunications providers for usage, USF contributions and other regulatory costs, depreciation and related expenses of the servers and equipment, costs to build out and maintain co-location data centers, and allocated office and facility costs and amortization of acquired technology. Cost of revenue can fluctuate based on a number of factors, including the fees we pay to telecommunications providers, which vary depending on our clients’ usage
50
of our VCC cloud platform, the timing of capital expenditures and related depreciation charges and changes in headcount. We expect to continue investing in our network infrastructure and operations and client support function to maintain high quality and availability of service, resulting in absolute dollar increases in our cost of revenue. As our business grows, we expect to realize economies of scale in network infrastructure, personnel and client support.
Operating Expenses
We classify our operating expenses as research and development, sales and marketing and general and administrative expenses.
Research and Development. Our research and development expenses consist primarily of salary and related expenses (including stock-based compensation) for personnel related to the development of improvements and expanded features for our services, as well as quality assurance, testing, product management and allocated overhead. We expense research and development expenses as they are incurred except for internal use software development costs that qualify for capitalization. We believe that continued investment in our solution is important for our future growth, and we expect research and development expenses to increase in absolute dollars in the foreseeable future, although these expenses as a percentage of our revenue are expected to decrease over time.
Sales and Marketing. Sales and marketing expenses consist primarily of salaries and related expenses (including stock-based compensation) for personnel in sales and marketing, sales commissions, as well as advertising, marketing, corporate communications, travel costs and allocated overhead. We currently expense sales commissions associated with the acquisition of new client contracts as incurred in the period the contract is acquired. Beginning in January 2018, we anticipate a significant amount of sales commission expense will be deferred over an expected related benefit period of five years as required by ASC 340 - Other Assets and Deferred Costs. See Note 1 of notes to consolidated financial statements in this report for additional information. We believe it is important to continue investing in sales and marketing to continue to generate revenue growth. Accordingly, while we expect sales and marketing expenses to increase in absolute dollars as we continue to support our growth initiatives, with the adoption of ASC 606 in January 2018, we also expect sales and marketing expense to decrease on our consolidated statements of operations commencing in the first quarter of 2018 due to the deferral of a significant portion of sales commissions as required by ASC 340.
General and Administrative. General and administrative expenses consist primarily of salary and related expenses (including stock-based compensation) for management, finance and accounting, legal, information systems and human resources personnel, professional fees, compliance costs, other corporate expenses and allocated overhead. We expect that general and administrative expenses will fluctuate in absolute dollars from period to period but decline as a percentage of revenue over time.
Other Income (Expense), Net
Other income (expense), net consists primarily of interest expense associated with our debt and capital leases. We expect interest expense for our outstanding debt to decrease due to a lower interest rate for our new revolving credit facility compared to the 2014 loan and security agreement and the 2013 loan and security agreement (see Note 6 of the notes to consolidated financial statements in this report). We expect interest expense for our capital leases to increase as a result of our continued capital spending funded by capital leases.
Provision for Income Taxes
Our provision for income taxes consists primarily of corporate income taxes resulting from profits generated in foreign jurisdictions by our wholly-owned subsidiaries, along with state income taxes payable in the United States. We do not expect the new legislation signed into law by President Trump in December 2017 to have a significant impact on our future income tax provision. See Note 9 of the notes to consolidated financial statements in this report for additional information.
51
Results of Operations for the Years Ended December 31, 2017, 2016 and 2015
Based on the consolidated statements of operations and comprehensive loss set forth in this annual report, the following table sets forth our operating results as a percentage of revenue for the periods indicated:
Year Ended December 31, | |||||||||
2017 | 2016 | 2015 | |||||||
Revenue | 100 | % | 100 | % | 100 | % | |||
Cost of revenue | 42 | % | 41 | % | 46 | % | |||
Gross profit | 58 | % | 59 | % | 54 | % | |||
Operating expenses: | |||||||||
Research and development | 14 | % | 15 | % | 18 | % | |||
Sales and marketing | 32 | % | 32 | % | 32 | % | |||
General and administrative | 15 | % | 16 | % | 20 | % | |||
Total operating expenses | 61 | % | 63 | % | 70 | % | |||
Loss from operations | (3 | )% | (4 | )% | (16 | )% | |||
Other income (expense), net: | |||||||||
Extinguishment of debt | — | % | (1 | )% | — | % | |||
Interest expense | (2 | )% | (2 | )% | (4 | )% | |||
Interest income and other | 1 | % | — | % | — | % | |||
Total other income (expense), net | (1 | )% | (3 | )% | (4 | )% | |||
Loss before income taxes | (4 | )% | (7 | )% | (20 | )% | |||
Provision for income taxes | — | % | — | % | — | % | |||
Net loss | (4 | )% | (7 | )% | (20 | )% | |||
Comparison of the Years Ended December 31, 2017 and 2016
Revenue
Year Ended December 31, | ||||||||
2017 | 2016 | $ Change | % Change | |||||
(in thousands, except percentages) | ||||||||
Revenue | $200,225 | $162,090 | $38,135 | 24% | ||||
The increase in revenue for 2017 compared to 2016 was primarily attributable to our larger clients, driven by an increase in our sales and marketing activities and our improved brand awareness. We do not expect the adoption of ASC 606 in January 2018 to have a material impact on the recognition or timing of revenue.
Cost of Revenue
Year Ended December 31, | ||||||||
2017 | 2016 | $ Change | % Change | |||||
(in thousands, except percentages) | ||||||||
Cost of revenue | $83,104 | $66,934 | $16,170 | 24% | ||||
% of Revenue | 42% | 41% | ||||||
The increase in cost of revenue for 2017 compared to 2016 was primarily due to a $7.0 million increase in personnel costs including stock-based compensation costs, driven by increased headcount and higher fair value of employee equity awards due mainly to our increased stock price, and a $3.1 million reversal of accrued USF charges recorded in 2016 resulted from a favorable ruling from the FCC’s Wireline Competition Bureau. See Note 10 of the notes to consolidated financial statements in this report for more information. The increase was also driven by a $2.5 million increase in third party hosted software costs, a $1.9 million increase in data center costs, and a $0.9 million
52
increase in USF contributions and other federal telecommunication service fees, all of which were due primarily to increased client activities. The $1.5 million increase in facility-related and overhead allocation costs also contributed to the increase in cost of revenue.
Gross Profit
Year Ended December 31, | ||||||||
2017 | 2016 | $ Change | % Change | |||||
(in thousands, except percentages) | ||||||||
Gross profit | $117,121 | $95,156 | $21,965 | 23% | ||||
% of Revenue | 58% | 59% | ||||||
The increase in gross profit for 2017 compared to 2016 was primarily due to increases in subscription and higher amounts charged for, and better efficiencies in, professional services. The slight decrease in gross margin for 2017 compared to 2016 was primarily attributable to higher stock-based compensation costs due mainly to an increase in the fair value of employee equity awards driven by our increased stock price.
Operating Expenses
Research and Development
Year Ended December 31, | ||||||||
2017 | 2016 | $ Change | % Change | |||||
(in thousands, except percentages) | ||||||||
Research and development | $27,120 | $23,878 | $3,242 | 14% | ||||
% of Revenue | 14% | 15% | ||||||
The increase in research and development expenses for 2017 compared to 2016 was primarily due to a $1.9 million increase in cash-based personnel-related cost driven by increased headcount and a $1.0 million increase in stock-based compensation costs mainly due to higher fair value of employee equity awards driven by our increased stock price.
Sales and Marketing
Year Ended December 31, | ||||||||
2017 | 2016 | $ Change | % Change | |||||
(in thousands, except percentages) | ||||||||
Sales and marketing | $66,570 | $52,748 | $13,822 | 26% | ||||
% of Revenue | 32% | 32% | ||||||
The increase in sales and marketing expenses for 2017 compared to 2016 was primarily due to a $4.8 million increase in cash-based personnel costs driven by increased headcount, a $3.8 million increase in commissions paid to sales personnel driven by growth in sales and bookings of our solution, a $2.0 million increase in stock-based compensation costs mainly due to higher fair value of employee equity awards driven by our increased stock price, a $1.0 million increase in discretionary and other marketing-related expenses, and a $0.9 million increase in business travel and related expenses. These increases, as well as the remainder of the increase, were primarily due to the execution of our growth strategy to acquire new clients, to increase the number of agent seats within our existing client base, and to establish brand awareness.
With the adoption of ASC 606 in January 2018, we expect sales and marketing expense for 2018 to decrease between $5.0 million and $7.0 million due to the deferral of a significant portion of sales commissions as required by ASC 340.
53
General and Administrative
Year Ended December 31, | ||||||||
2017 | 2016 | $ Change | % Change | |||||
(in thousands, except percentages) | ||||||||
General and administrative | $29,151 | $25,072 | $4,079 | 16% | ||||
% of Revenue | 15% | 16% | ||||||
The increase in general and administrative expenses for 2017 compared to 2016 was primarily due to a $2.8 million increase in cash-based personnel-related costs driven by increased headcount, a $2.0 million increase in settlement and associated legal costs incurred in 2017, and a $1.9 million increase in stock-based compensation costs due mainly to higher fair value of employee equity awards driven by our increased stock price and the modification of equity awards held by a former executive. See Note 7 of the notes to consolidated financial statements in this report for more information. These increases were offset in part by a $1.4 million decrease in facilities and allocated overhead costs and a $2.1 million reversal of interest and penalties on the accrued federal fees during 2017 following a favorable ruling from the FCC's Wireline Competition Bureau. See Note 10 of the notes to consolidated financial statements in this report for more information.
Other Income (Expense), Net
Year Ended December 31, | |||||||||||||||
2017 | 2016 | $ Change | % Change | ||||||||||||
(in thousands, except percentages) | |||||||||||||||
Extinguishment of debt | $ | — | $ | (1,026 | ) | 1,026 | 100 | % | |||||||
Interest expense | $ | (3,471 | ) | $ | (4,226 | ) | $ | 755 | 18 | % | |||||
Interest income and other | 490 | (12 | ) | 502 | 4,183 | % | |||||||||
Total other income (expense), net | $ | (2,981 | ) | $ | (5,264 | ) | $ | 2,283 | 43 | % | |||||
% of Revenue | (1 | )% | (3 | )% | |||||||||||
The favorable change in other income (expense), net for 2017 compared to 2016 was primarily due to a $1.0 million loss on the refinancing of debt recorded in the third quarter of 2016 in connection with the repayment of amounts due under the 2013 Loan and Security Agreement and the 2014 Loan and Security Agreement. See Note 6 of the notes to consolidated financial statements in this report for more information. The favorable change was also driven by lower interest expense resulting from lower interest rates under the 2016 Loan and Security Agreement versus the prior loan and security agreements, partially offset by the $0.4 million non-cash adjustment on investment for 2017.
Comparison of the Years Ended December 31, 2016 and 2015
Revenue
Year Ended December 31, | ||||||||
2016 | 2015 | $ Change | % Change | |||||
(in thousands, except percentages) | ||||||||
Revenue | $162,090 | $128,868 | $33,222 | 26% | ||||
The increase in revenue for 2016 compared to 2015 was primarily attributable to our larger clients, driven by an increase in our sales and marketing activities and our improved brand awareness. For the years ended December 31, 2016 and 2015, the majority of our revenues and revenue growth has been from our larger clients as we move to larger average deals sizes and maintain strong customer retention rates.
54
Cost of Revenue
Year Ended December 31, | ||||||||
2016 | 2015 | $ Change | % Change | |||||
(in thousands, except percentages) | ||||||||
Cost of revenue | $66,934 | $59,495 | $7,439 | 13% | ||||
% of Revenue | 41% | 46% | ||||||
The increase in cost of revenue for 2016 compared to 2015 was primarily due to a $4.0 million increase in cash-based personnel costs driven by increased headcount, a $2.2 million increase in third party hosted software costs due to increased client activities, a $1.5 million increase in USF contributions and other federal telecommunication service fees primarily due to increased client usage, a $1.3 million increase in facility-related costs, a $0.7 million increase in data center costs due to increased client activities, a $0.6 million increase in depreciation expenses, a $0.6 million increase in travel expenses, and a $0.5 million increase in stock-based compensation expenses. The remainder of the increase was primarily due to our business growth. These increases were offset in part by a $1.3 million decrease in telecommunication carrier costs relating to our clients’ long distance call usage due to improved usage efficiencies and by a $3.1 million reversal in the fourth quarter of 2016 of accrued USF charges due to a favorable ruling from the FCC’s Competition Wireline Bureau.
Gross Profit
Year Ended December 31, | ||||||||
2016 | 2015 | $ Change | % Change | |||||
(in thousands, except percentages) | ||||||||
Gross profit | $95,156 | $69,373 | $25,783 | 37% | ||||
% of Revenue | 59% | 54% | ||||||
The increases in gross profit and gross margin for 2016 compared to 2015 was primarily due to economies of scale for subscription, improved efficiencies in usage, and higher amounts charged for, and better efficiencies in, professional services. In addition, the reversal of $3.1 million in USF charges during the fourth quarter of 2016 related to the favorable ruling from the FCC’s Competition Wireline Bureau resulted in an increase in gross profit and gross margin for 2016 compared to 2015. Excluding the effect of the USF reversal, the increase in gross margin for 2016 compared to 2015 was primarily due to higher amounts charged for, and better efficiencies in, professional services, improved efficiencies in usage, and economies of scale for subscription.
Operating Expenses
Research and Development
Year Ended December 31, | ||||||||
2016 | 2015 | $ Change | % Change | |||||
(in thousands, except percentages) | ||||||||
Research and development | $23,878 | $22,659 | $1,219 | 5% | ||||
% of Revenue | 15% | 18% | ||||||
The increase in research and development expenses for 2016 compared to 2015 was primarily due to a $0.4 million increase in consulting expenses, a $0.3 million increase in depreciation expenses, a $0.3 million increase in travel expenses, and a $0.3 million increase in stock-based compensation expenses.
55
Sales and Marketing
Year Ended December 31, | ||||||||
2016 | 2015 | $ Change | % Change | |||||
(in thousands, except percentages) | ||||||||
Sales and marketing | $52,748 | $42,042 | $10,706 | 25% | ||||
% of Revenue | 32% | 32% | ||||||
The increase in sales and marketing expenses for 2016 compared to 2015 was primarily due to a $4.2 million increase in cash-based personnel costs driven by increased headcount, a $3.0 million increase in commissions paid to sales personnel due to increased bookings, a $1.5 million increase in discretionary and other marketing-related expenses, a $0.8 million increase in travel expenses, a $0.6 million increase in facilities and allocated overhead costs, and a $0.6 million increase in stock-based compensation. These increases as well as the remainder of the increase were primarily due to the execution of our growth strategy to acquire new clients, grow the number of agent seats within our existing client base and establish brand awareness. The increase in stock-based compensation was also due to an increase in the fair value of employee equity awards.
General and Administrative
Year Ended December 31, | ||||||||
2016 | 2015 | $ Change | % Change | |||||
(in thousands, except percentages) | ||||||||
General and administrative | $25,072 | $25,822 | $(750) | (3)% | ||||
% of Revenue | 16% | 20% | ||||||
The decrease in general and administrative expenses for 2016 compared to 2015 was primarily due to a $0.8 million adjustment recorded in the first and the second quarters of 2015 for additional sales taxes for certain revenue earned during the period 2011 through the first quarter of 2015, a $0.7 million decrease in facilities and allocated overhead costs, a decrease of $0.5 million in legal and consulting expenses, and a decrease of $0.4 million related to the reversal of contingent sales tax liabilities. This decrease was partially offset by an increase of $0.8 million in cash-based personnel costs driven by increased headcount, an increase of $0.6 million in stock-based compensation expense, and an increase of $0.4 million due to the one time benefit in the second quarter of 2015 related to our entry into a consent decree with the FCC.
Other Income (Expense), Net
Year Ended December 31, | |||||||||||||||
2016 | 2015 | $ Change | % Change | ||||||||||||
(in thousands, except percentages) | |||||||||||||||
Extinguishment of debt | $ | (1,026 | ) | $ | — | $ | (1,026 | ) | (100 | )% | |||||
Interest expense | $ | (4,226 | ) | $ | (4,727 | ) | 501 | (11 | )% | ||||||
Interest income and other | (12 | ) | 100 | (112 | ) | (112 | )% | ||||||||
Total other income (expense), net | $ | (5,264 | ) | $ | (4,627 | ) | $ | (637 | ) | 14 | % | ||||
% of Revenue | (3 | )% | (4 | )% | |||||||||||
The increase in interest expense for 2016 compared to 2015 was primarily due to a $1.0 million loss on extinguishment of debt recorded in connection with the repayment of amounts due under the 2013 Loan and Security Agreement and the 2014 Loan and Security Agreement. The loss was comprised of $0.4 million in prepayment penalties, a $0.4 million write-off of unamortized debt discounts, and a $0.2 million write-off of unamortized debt issuance costs. This increase was partially offset by lower interest expense related to lower interest rates under the 2016 Loan and Security Agreement compared to the 2014 Loan and Security Agreement and the 2013 Loan and Security Agreement.
56
Liquidity and Capital Resources
To date, we have financed our operations, primarily through sales of our solution, lease facilities and net proceeds from our equity and debt financings. As of December 31, 2017, we had cash and cash equivalents totaling $68.9 million.
As of December 31, 2017, we had a total of $32.6 million outstanding under our New Revolving Credit Facility as described in the following. On August 1, 2016, we entered into a loan agreement (“2016 Loan and Security Agreement”) with two lenders for a new revolving credit facility (“New Revolving Credit Facility”) of up to $50.0 million. The New Revolving Credit Facility matures August 1, 2019. Under the terms of the New Revolving Credit Facility, the balance outstanding cannot exceed our trailing four months of MRR (monthly recurring revenue including subscription and usage) multiplied by the average trailing 12 month dollar based retention rate (calculated on the same basis as set forth in Item 7 of this report, see “Annual Dollar-Based Retention Rate”). The New Revolving Credit Facility carries a variable annual interest rate of the prime rate plus 0.50%, subject to a 0.25% increase if our adjusted EBITDA is negative at the end of any fiscal quarter. In addition, we are required to maintain $25.0 million of unrestricted cash and cash equivalents deposited with two lenders in connection with our 2016 Loan and Security Agreement. See Note 6 of the notes to consolidated financial statements for more information. As of December 31, 2017, the amount available for additional borrowings was $17.4 million.
We believe our existing cash and cash equivalents and the amount available for borrowing under our New Revolving Credit Facility (or any refinancing of the facility) will be sufficient to meet our working capital and capital expenditure needs for at least the next 12 months. Our future capital requirements will depend on many factors including our growth rate, continuing market acceptance of our solution, client retention, our ability to gain new clients, the timing and extent of spending to support development efforts, the outcome of any pending or future litigation or other claims by third parties or governmental entities, the expansion of sales and marketing activities and the introduction of new and enhanced offerings. We may also acquire or invest in complementary businesses, technologies and intellectual property rights, which may increase our future capital requirements, both to pay acquisition costs and to support our combined operations. We may raise additional equity or debt financing at any time. We may not be able to raise additional equity or debt financing on terms acceptable to us or at all. If we are unable to raise additional capital when desired or required, our business, operating results, and financial condition would be harmed. In addition, if our operating performance during the next twelve months is below our expectations, our liquidity and ability to operate our business could be harmed.
If we raise additional funds by issuing equity or equity-linked securities, the ownership of our existing stockholders will be diluted. If we raise additional funds through the incurrence of additional indebtedness, we will be subject to increased debt service obligations and could also be subject to new or additional restrictive covenants and other operating restrictions that could harm our ability to conduct our business.
Cash Flows
The following table summarizes our cash flows for the periods presented (in thousands):
Year Ended December 31, | ||||||||||||
2017 | 2016 | 2015 | ||||||||||
Net cash provided by (used in) operating activities | $ | 11,106 | $ | 6,838 | $ | (12,939 | ) | |||||
Net cash provided by (used in) investing activities | (2,650 | ) | (2,397 | ) | 19,690 | |||||||
Net cash provided by (used in) financing activities | 2,369 | (4,803 | ) | (6,556 | ) | |||||||
Net increase in cash and cash equivalents | $ | 10,825 | $ | (362 | ) | $ | 195 | |||||
Cash Flows from Operating Activities
Cash provided by or used in operating activities is primarily influenced by our personnel-related expenditures, data center and telecommunications carrier costs, office and facility related costs, USF contributions and other regulatory costs and the amount and timing of client payments. Our largest source of operating cash inflows is cash collections from our clients for subscription and related usage services. Payments from clients for our solutions and usage services are typically received monthly. If we continue to improve our financial results, we expect net cash provided by operating activities to increase.
57
During the year ended December 31, 2017, net cash provided by operating activities was $11.1 million compared to $6.8 million for the same period of 2016. The increase of $4.3 million was primarily due to an $8.0 million favorable impact from a decrease in net loss after adjusting for non-cash expenses, offset by a $3.7 million decrease in net cash resulting from changes in operating assets and liabilities. Cash outflows during 2017 included total payments of $1.8 million for settlement, legal and indemnification fees related to the Melcher litigation. See Note 10 of the notes to consolidated financial statements for more information.
During the year ended December 31, 2017, cash outflows from changes in operating assets and liabilities was $1.3 million compared to cash inflows of $2.4 million for the same period in 2016. This unfavorable change was primarily due to a $1.8 million unfavorable change in accounts receivable driven by increased sales, a $1.1 million unfavorable change in prepaid expenses and other current assets mainly due to higher deferred cost of revenue, and a $1.2 million unfavorable change in accrued and other current liabilities primarily related to accrued cash-based personnel-related cost driven by headcount and the timing of payments for accrued liabilities.
During the year ended December 31, 2016, net cash provided by operating activities was $6.8 million compared to net cash used of $12.9 million for the same period of 2015. The $19.8 million increase in net cash provided by operating activities was primarily due to a $14.6 million favorable impact from a decrease in net loss after adjusting for non-cash expenses and a $5.2 million favorable change in net cash flows from operating assets and liabilities.
During the year ended December 31, 2016, cash inflows from changes in operating assets and liabilities was $2.4 million compared to cash outflows of $2.8 million for the same period in 2015, resulted in an overall improvement of $5.2 million. This improvement was primarily due to a $2.6 million favorable change in deferred revenue mainly attributable to increased billings, $2.4 million favorable change in accounts payable related to timing of payments, and $1.8 million favorable change in accrued and other current liabilities primarily due to employee paid-time off, sales commissions and bonus, driven by our improved sales and financial performance and increased headcount. This improvement was offset in part primarily by an unfavorable change of $1.0 million in accounts receivable due to increased sales.
Cash Flows from Investing Activities
Net cash used in investing activities was $2.7 million for the year ended December 31, 2017 compared to $2.4 million for the same period in 2016. The 0.3 million increase in cash used was primarily driven by the $1.5 million increase in purchase of property and equipment, offset primarily by our purchase of $1.2 million in convertible notes held for investment in 2016. Our most significant capital expenditures have been investments in our software and equipment for our data centers. We expect such capital investment will continue in the future to support our expected growth.
Net cash used in investing activities was $2.4 million for the year ended December 31, 2016 compared to net cash provided by investing activities of $19.7 million for the year ended December 31, 2015. The $22.1 million decrease in net cash provided by investing activities was primarily driven by our 2015 activities, including the proceeds of $40.0 million received in 2015 from the maturity of our short-term investments, $0.8 million release in restricted cash in 2015 due to the release of two letters of credit related to our office lease obligation and an insurance policy, offset in part by the $20.0 million purchase of short-term investments in 2015. The purchase of $1.2 million in convertible notes held for investment in 2016 also contributed to the decrease in net cash provided by investing activities in 2016.
Cash Flows from Financing Activities
Net cash provided by financing activities was $2.4 million for the year ended December 31, 2017 compared to net cash used of $4.8 million for the same period in 2016. This $7.2 million favorable change was primarily driven by a $1.7 million increase in cash received from stock option exercises in 2017, a $2.1 million increase in proceeds from the sale of common stock under our employee stock purchase plan in 2017, and our debt refinancing activities in 2016 including the $36.9 million repayments on notes payable and revolving line of credit as part of our cancellation of the 2013 Loan and Security Agreement and the 2014 Loan and Security Agreement, offset in part by the cash received from the $32.6 million drawdown under our New Revolving Credit Facility in 2016.
Net cash used in financing activities was $4.8 million for the year ended December 31, 2016 compared to $6.6 million for the year ended December 31, 2015. The $1.8 million favorable change was primarily driven by the $3.0 million increase in cash received from stock option exercises, a $0.6 million increase in cash received from the
58
sale of common stock under our employee stock purchase plan, and by our 2016 debt refinancing activities including the cash received from the $32.6 million drawdown in 2016 under our New Revolving Credit Facility, offset in part by the repayments of $36.9 million in notes payable and our revolving line of credit as part of our cancellation of the 2013 Loan and Security Agreement and the 2014 Loan and Security Agreement during 2016.
Critical Accounting Policies and Estimates
Our consolidated financial statements are prepared in accordance with U.S. GAAP. The preparation of these financial statements requires us to make estimates and assumptions that affect the reported amounts of assets, liabilities, revenue, expenses and related disclosures. On an ongoing basis, we evaluate our estimates and assumptions. Our actual results may differ from these estimates under different assumptions or conditions.
Our significant accounting policies are described in the notes to consolidated financial statements under ITEM 8, Note 1, of this Form 10-K.
Revenue Recognition
Our revenue consists of subscription services and related usage as well as professional services. We charge clients monthly subscription fees for access to our VCC solution. Monthly subscription fees are primarily based on the number of agent seats, as well as the specific VCC functionalities and applications deployed by the client. Agent seats are defined as the maximum number of named agents allowed to concurrently access the VCC cloud platform. Clients typically have more named agents than agent seats. Multiple named agents may use an agent seat, though not simultaneously. Substantially all of our clients purchase both subscriptions and related telephony usage. A small percentage of our clients subscribe to our platform but purchase telephony usage directly from a wholesale telecommunications service provider. We do not sell telephony usage on a stand-alone basis to any client. The related usage fees are based on the volume of minutes used for inbound and outbound customer interactions. We also offer bundled plans, generally for smaller deployments whereby the client is charged a single monthly fixed fee per agent seat that includes both subscription and unlimited usage in the contiguous 48 states and, in some cases, Canada. Professional services revenue is derived primarily from implementations, including application configuration, system integration, optimization, education and training services. Clients are not permitted to take possession of our software.
We offer monthly, annual and multiple-year contracts to clients, generally with 30 days’ notice required for changes in the number of agent seats and sometimes with a minimum number of agent seats requirement. Our clients can use this notice period to rapidly adjust the number of agent seats used to meet their changing contact center volume needs, including to reduce the number of agent seats to zero. As a general matter, this means that a client can effectively terminate its agreement with us upon 30 days’ notice. Larger clients typically choose annual contracts, which generally include an implementation and ramp period of several months. Fixed subscription fees, including plans bundled with usage, are generally billed monthly in advance, while related usage fees are billed in arrears. Support activities include technical assistance and upgrades and enhancements to our solution on a when-and-if-available basis, which are not billed separately.
We generally require advance deposits from our clients based on estimated usage. Fees for certain clients’ usage are applied against the advance deposit resulting in continuous consumption and requiring frequent replenishment of the deposit. Any unused portion of the deposit is refundable to the client upon termination of the arrangement, provided all amounts due have been paid. All fees, except usage deposits, are non-refundable.
Professional services are primarily billed on a fixed-fee basis and are performed by us directly or, alternatively, clients may also choose to perform these services themselves or engage their own third-party service providers.
Our sales arrangements generally involve multiple deliverables, including subscription services and related usage as well as professional services, all of which have standalone value to the client. We allocate arrangement consideration to these deliverables based on the relative standalone selling price method in accordance with the selling price hierarchy, which includes: (i) Vendor Specific Objective Evidence (“VSOE”) if available; (ii) Third Party Evidence (“TPE”) if VSOE is not available; and (iii) Best Estimate of Selling Price (“BESP”) if neither VSOE nor TPE is available.
VSOE. We determine VSOE based on our historical pricing and discounting practices for the specific service when sold separately. In determining VSOE, we require that a substantial majority of the selling prices for these services fall within a reasonably narrow pricing range. We limit our assessment of VSOE for each element to
59
either the price charged when the same element is sold separately or the price established by management, having the relevant authority to do so, for an element not yet sold separately. We have not met the criteria to establish selling prices based on VSOE.
TPE. When VSOE cannot be established for deliverables in multiple element arrangements, we apply judgment with respect to whether we can establish a selling price based on TPE. TPE is determined based on competitor prices for similar deliverables when sold separately. Our services are significantly differentiated such that the comparable pricing of deliverables with similar functionality cannot be obtained. Furthermore, we are unable to reliably determine the standalone selling prices of similar deliverables sold by competitors. As a result, we have not met the criteria to establish selling prices based on TPE.
BESP. Since we are unable to establish a selling price using VSOE or TPE, we use BESP in our allocation of arrangement consideration. The objective of BESP is to determine the price at which we would transact a sale if the product or service were sold on a stand-alone basis. We determine BESP for deliverables by considering multiple factors including, but not limited to, prices we charge for similar offerings, pricing policies, market conditions, and competitive landscape. We limit the amount of allocable arrangement consideration to amounts that are fixed or determinable and that are not contingent on future performance or future deliverables.
We recognize revenue for each unit of accounting when all of the following criteria have been met:
• | persuasive evidence of an arrangement exists; |
• | delivery has occurred; |
• | the fee is fixed or determinable; and |
• | collection is reasonably assured. |
Revenue allocated to the separate accounting units is recognized as follows:
• | fixed subscription revenue is recognized on a straight-line basis over the applicable term, predominantly the monthly contractual billing period; |
• | variable usage revenue is recognized as actual usage occurs. Usage revenue in subscription arrangements that include bundled usage is recognized on a straight-line basis over the applicable term, as the Company cannot reliably estimate client usage patterns; and |
• | professional services revenue is recognized as services are performed using the proportional performance method, with performance measured based on labor hours, assuming all other revenue recognition criteria have been met. |
At the time of each revenue transaction, we assess whether fees under the arrangement are fixed or determinable and whether collection is probable. For arrangements where the fee is not fixed or determinable, we recognize revenue as these amounts become due and payable. We assess collection based on a number of factors, including past transaction history and the creditworthiness of the client. If we determine that collection of fees is not reasonably assured, we defer the revenue and recognize revenue at the time collection becomes reasonably assured, which is generally upon receipt of payment. We maintain a revenue reserve for potential credits to be issued in accordance with service level agreements or for other revenue adjustments.
Significant judgment is involved in the determination of whether the facts and circumstances of an arrangement support that the fee for the arrangement is considered to be fixed or determinable and that collectibility of the fee is probable, and these judgments can affect the amount of revenue that we recognize in a particular reporting period. Generally, we are able to estimate whether collection is probable, but significant judgment is applied as we assess the creditworthiness of our customers to make this determination. Key external and internal factors are considered in developing our creditworthiness assessment, including public information, historical and current financial statements and past collection history. If our experience were to change, it could have a material adverse effect on our results of operations.
The revenue recognition standards include guidance relating to any tax assessed by a governmental authority that is directly imposed on a revenue-producing transaction between a seller and a customer which may include, but is not limited to, sales, use, value added and excise taxes. We record USF contributions and other regulatory costs on a gross basis in our consolidated statement of operations and comprehensive loss and record surcharges and sales, use and excise taxes billed to our clients on a net basis. The cost of gross USF contributions payable to USAC and
60
suppliers is presented as a cost of revenue in the consolidated statement of operations and comprehensive loss. Surcharges and sales, use and excise taxes incurred in excess of amounts billed to our clients are presented in general and administrative expense in the consolidated statement of operations and comprehensive loss.
Recent Accounting Pronouncements
Refer to Note 1 in Item 8 of this Form 10-K for information related to recent accounting pronouncements.
Off Balance Sheet Arrangements
As of December 31, 2017, we did not have any off balance sheet arrangements, as defined in Item 303(a)(4)(ii) of SEC Regulation S-K, such as the use of unconsolidated subsidiaries, structured finance, special purpose entities or variable interest entities.
Contractual Obligations
Commitments
Our principal contractual obligations consist of future payment obligations under debt, capital leases to finance data centers and other computer and networking equipment, operating leases for office space, research and development, and sales and marketing facilities, and agreements with third parties to provide co-location hosting, telecommunication usage and equipment maintenance services.
The following table summarizes our significant contractual obligations as of December 31, 2017 (in thousands).
Payment Due by Period | ||||||||||||||||||||
Less Than | More than | |||||||||||||||||||
Total | 1 Year | 1-3 Years | 3-5 Years | 5 Years | ||||||||||||||||
Notes payable (1) | $ | 333 | $ | 333 | $ | — | $ | — | $ | — | ||||||||||
Revolving line of credit (2) | 32,594 | — | 32,594 | — | — | |||||||||||||||
Capital lease obligations (3) | 15,578 | 7,770 | 7,808 | — | — | |||||||||||||||
Operating lease obligations (4) | 8,781 | 2,750 | 5,377 | 654 | — | |||||||||||||||
Hosting services (5) | 914 | 855 | 59 | — | — | |||||||||||||||
Telecommunication usage (6) | 3,950 | 2,355 | 1,595 | — | — | |||||||||||||||
Equipment maintenance (7) | 536 | 426 | 110 | — | — | |||||||||||||||
Total | $ | 62,686 | $ | 14,489 | $ | 47,543 | $ | 654 | $ | — | ||||||||||
(1) Represents the outstanding principal balance under a promissory note with USAC. Interest on these obligations is described in Note 6 of the notes to consolidated financial statements of this Form 10-K.
(2) Represents outstanding principal balance under our New Revolving Credit Facility. Interest on this obligation is described in Note 6 of the notes to consolidated financial statements of this Form 10-K.
(3) Represents financing of computer and networking equipment and software purchases for our co-location data centers.
(4) Represents our obligations to make payments under the lease agreements for our office facilities and office equipment leases.
(5) Represents guaranteed minimum payments for co-location facilities and services.
(6) Represents guaranteed minimum payments for telecommunication services.
(7) Represents our payment obligations under maintenance services contracts for certain data center equipment.
The contractual commitment amounts in the table above are associated with agreements that are enforceable and legally binding. Obligations under contracts that we can cancel without a significant penalty are not included in the table above.
61
Indemnification Agreements
In the ordinary course of business, we enter into agreements of varying scope and terms pursuant to which we agree to indemnify clients, vendors, lessors, business partners and other parties with respect to certain matters, including, but not limited to, losses arising out of breach of such agreements, services to be provided by us or from intellectual property infringement claims made by third parties. In addition, we have entered into indemnification agreements with our directors and certain officers and employees that will require us, among other things, to indemnify them against certain liabilities that may arise by reason of their status or service as directors, officers or employees. Other than as described below, there are no claims that we are aware of that could have a material effect on our consolidated balance sheet, consolidated statement of operations and comprehensive loss, or consolidated statements of cash flows.
On October 27, 2016, we received notice from Lance Fried, a former officer and director of Face It, of his claim for indemnification by us (as successor in interest to Face It), and for advancement of all legal fees and expenses he incurs in connection with the defense of the Melcher litigation. See Note 10 of the notes to consolidated financial statements of this Form 10-K for detail. As of May 31, 2017, we had advanced Mr. Fried $62 thousand in connection with this claim. However, we dispute that Mr. Fried is entitled to advancement in connection with the Melcher Litigation. On July 31, 2017, Mr. Fried filed a complaint against us in the Court of Chancery for the State of Delaware, in which he alleges that we breached advancement obligations to him. In the lawsuit, Mr. Fried seeks advancement of his legal fees and expenses in connection with the defense of the Melcher litigation, payment of his legal fees and expenses incurred in connection with his advancement action, and interest. We believe the action is without merit and are defending against it vigorously. On December 7, 2017, the Delaware Chancery Court stayed Mr. Fried’s advancement lawsuit, in favor of arbitration. On January 9, 2018, we received Mr. Fried’s demand for arbitration against us with respect to the same matter. Regardless of the outcome of Mr. Fried’s advancement action against us, Mr. Fried is required to reimburse us for any amounts advanced to him if it is ultimately determined that Mr. Fried is not entitled to indemnification in connection with the Melcher litigation. In addition, we believe we have indemnification rights against the former stockholders of Face It (including Mr. Fried) for all losses that are incurred by us in connection with the Melcher litigation, including without limitation, amounts incurred to indemnify or advance the legal fees and expenses of Mr. Fried pursuant to his indemnification claim against us.
Contingencies — Legal and Regulatory
We are subject to certain legal and regulatory proceedings, and from time to time may be involved in a variety of claims, lawsuits, investigations, and proceedings relating to contractual disputes, intellectual property rights, employment matters, regulatory compliance matters, and other litigation matters relating to various claims that arise in the normal course of business. We determine whether an estimated loss from a contingency should be accrued by assessing whether a loss is deemed probable and can be reasonably estimated. We assess our potential liability by analyzing specific litigation and regulatory matters using reasonably available information. We develop our views on estimated losses in consultation with inside and outside counsel, which involves a subjective analysis of potential results and outcomes, assuming various combinations of appropriate litigation and settlement strategies. Legal fees are expensed in the period in which they are incurred. See Note 10 of the notes to consolidated financial statements of this Form 10-K for details.
ITEM 7A. Quantitative and Qualitative Disclosure About Market Risk
We are exposed to market risk in the ordinary course of our business. Market risk represents the risk of loss that may impact our financial position due to adverse changes in financial market prices and rates. Our market risk exposure is primarily a result of fluctuations in interest rates and foreign currency exchange rates. We do not hold or issue financial instruments for trading purposes.
Interest Rate Sensitivity
As of December 31, 2017, we had cash and cash equivalents of $68.9 million that were held primarily in cash or money-market funds. We hold our cash and cash equivalents for working capital purposes. Declines in interest rates would reduce future interest income. For the year ended December 31, 2017, the effect of a hypothetical 10% increase or decrease in overall interest rates would not materially impact our interest income. The carrying amount of our cash equivalents reasonably approximates fair value. We do not enter into investments for trading or speculative purposes. Due to the short-term nature of our money-market funds, we believe that we do not have any material exposure to changes in the fair value of our cash equivalents as a result of changes in interest rates.
62
As of December 31, 2017, we had a total of $32.6 million in outstanding borrowings under our variable interest rate debt or financing agreements. See Note 6 of the notes to consolidated financial statements of this report for a detailed discussion of our indebtedness. For the year ended December 31, 2017, a hypothetical 10% increase in the interest rates under these agreements would not materially impact our interest expense.
Foreign Currency Risk
The functional currency of our foreign subsidiaries is the U.S. dollar. Our sales are primarily denominated in U.S. dollars and, therefore, our net revenue is not directly subject to foreign currency risk. However, we are indirectly exposed to foreign currency risk. A stronger U.S. dollar could make our solution more expensive in foreign countries and therefore reduce demand. A weaker U.S. dollar could have the opposite effect. Such economic exposure to currency fluctuations is difficult to measure or predict because our sales are influenced by many factors in addition to the impact of currency fluctuations.
Our operating expenses are generally denominated in the currencies of the countries in which our operations are located except for Russia where compensation of our employees is primarily denominated in the U.S. dollar. Our consolidated results of operations and cash flows are, therefore, subject to fluctuations due to changes in foreign currency exchange rates and may be adversely affected in the future due to changes in foreign exchange rates. To date, we have not entered into any hedging arrangements with respect to foreign currency risk or other derivative financial instruments. During the year ended December 31, 2017, the effect of a hypothetical 10% change in foreign currency exchange rates applicable to our business would have a maximum impact of $0.9 million on our operating results.
63
ITEM 8. Financial Statements and Supplementary Data.
64
Report of Independent Registered Public Accounting Firm
To the Stockholders and Board of Directors
Five9, Inc.:
Opinions on the Consolidated Financial Statements and Internal Control over Financial Reporting
We have audited the accompanying consolidated balance sheets of Five9, Inc. and subsidiaries (the “Company”) as of December 31, 2017 and 2016, and the related consolidated statements of operations and comprehensive loss, stockholders’ equity, and cash flows for each of the years in the three-year period ended December 31, 2017, and the related notes (collectively, the “consolidated financial statements”). We also have audited the Company’s internal control over financial reporting as of December 31, 2017, based on criteria established in Internal Control - Integrated Framework (2013) issued by the Committee of Sponsoring Organizations of the Treadway Commission.
In our opinion, the consolidated financial statements referred to above present fairly, in all material respects, the financial position of the Company as of December 31, 2017 and 2016, and the results of its operations and its cash flows for each of the years in the three-year period ended December 31, 2017, in conformity with U.S. generally accepted accounting principles. Also in our opinion, the Company maintained, in all material respects, effective internal control over financial reporting as of December 31, 2017, based on criteria established in Internal Control - Integrated Framework (2013) issued by the Committee of Sponsoring Organizations of the Treadway Commission.
Basis for Opinion
The Company’s management is responsible for these consolidated financial statements, for maintaining effective internal control over financial reporting, and for its assessment of the effectiveness of internal control over financial reporting, included in the accompanying Management’s Annual Report on Internal Control Over Financial Reporting appearing under Item 9A. Our responsibility is to express an opinion on these consolidated financial statements and an opinion on the Company’s internal control over financial reporting based on our audits. We are a public accounting firm registered with the Public Company Accounting Oversight Board (United States) (“PCAOB”) and are required to be independent with respect to the Company in accordance with the U.S. federal securities laws and the applicable rules and regulations of the Securities and Exchange Commission and the PCAOB.
We conducted our audits in accordance with the standards of the PCAOB. Those standards require that we plan and perform the audits to obtain reasonable assurance about whether the consolidated financial statements are free of material misstatement, whether due to error or fraud, and whether effective internal control over financial reporting was maintained in all material respects.
Our audits of the consolidated financial statements included performing procedures to assess the risks of material misstatement of the consolidated financial statements, whether due to error or fraud, and performing procedures that respond to those risks. Such procedures included examining, on a test basis, evidence regarding the amounts and disclosures in the consolidated financial statements. Our audits also included evaluating the accounting principles used and significant estimates made by management, as well as evaluating the overall presentation of the consolidated financial statements. Our audit of internal control over financial reporting included obtaining an understanding of internal control over financial reporting, assessing the risk that a material weakness exists, and testing and evaluating the design and operating effectiveness of internal control based on the assessed risk. Our audits also included performing such other procedures as we considered necessary in the circumstances. We believe that our audits provide a reasonable basis for our opinions.
Definition and Limitations of Internal Control Over Financial Reporting
A company’s internal control over financial reporting is a process designed to provide reasonable assurance regarding the reliability of financial reporting and the preparation of financial statements for external purposes in accordance with generally accepted accounting principles. A company’s internal control over financial reporting includes those policies and procedures that (1) pertain to the maintenance of records that, in reasonable detail, accurately and fairly reflect the transactions and dispositions of the assets of the company; (2) provide reasonable assurance that transactions are recorded as necessary to permit preparation of financial statements in accordance with generally accepted accounting principles, and that receipts and expenditures of the company are being made only in accordance with authorizations
65
of management and directors of the company; and (3) provide reasonable assurance regarding prevention or timely detection of unauthorized acquisition, use, or disposition of the company’s assets that could have a material effect on the financial statements.
Because of its inherent limitations, internal control over financial reporting may not prevent or detect misstatements. Also, projections of any evaluation of effectiveness to future periods are subject to the risk that controls may become inadequate because of changes in conditions, or that the degree of compliance with the policies or procedures may deteriorate.
KPMG LLP
We have served as the Company’s auditor since 2012.
San Francisco, California
March 1, 2018
66
FIVE9, INC.
CONSOLIDATED BALANCE SHEETS
(In thousands, except per share data)
December 31, | ||||||||
2017 | 2016 | |||||||
ASSETS | ||||||||
Current assets: | ||||||||
Cash and cash equivalents | $ | 68,947 | $ | 58,122 | ||||
Accounts receivable, net | 19,048 | 13,881 | ||||||
Prepaid expenses and other current assets | 4,840 | 3,008 | ||||||
Total current assets | 92,835 | 75,011 | ||||||
Property and equipment, net | 19,888 | 14,688 | ||||||
Intangible assets, net | 1,073 | 1,539 | ||||||
Goodwill | 11,798 | 11,798 | ||||||
Other assets | 2,602 | 2,203 | ||||||
Total assets | $ | 128,196 | $ | 105,239 | ||||
LIABILITIES AND STOCKHOLDERS’ EQUITY | ||||||||
Current liabilities: | ||||||||
Accounts payable | $ | 4,292 | $ | 3,366 | ||||
Accrued and other current liabilities | 11,787 | 9,604 | ||||||
Accrued federal fees | 1,151 | 2,742 | ||||||
Sales tax liability | 1,326 | 1,347 | ||||||
Notes payable | 336 | 742 | ||||||
Capital leases | 6,651 | 6,230 | ||||||
Deferred revenue | 13,975 | 10,047 | ||||||
Total current liabilities | 39,518 | 34,078 | ||||||
Revolving line of credit | 32,594 | 32,594 | ||||||
Sales tax liability — less current portion | 1,044 | 1,476 | ||||||
Notes payable — less current portion | — | 318 | ||||||
Capital leases — less current portion | 7,161 | 5,915 | ||||||
Other long-term liabilities | 1,041 | 530 | ||||||
Total liabilities | 81,358 | 74,911 | ||||||
Commitments and contingencies (Note 10) | ||||||||
Stockholders’ equity: | ||||||||
Preferred stock, $0.001 par value; 5,000 shares authorized, no shares issued and outstanding as of December 31, 2017 and 2016 | — | — | ||||||
Common stock, $0.001 par value; 450,000 shares authorized, 56,632 shares and 53,363 shares issued and outstanding as of December 31, 2017 and 2016, respectively | 57 | 53 | ||||||
Additional paid-in capital | 222,202 | 196,555 | ||||||
Accumulated deficit | (175,421 | ) | (166,280 | ) | ||||
Total stockholders’ equity | 46,838 | 30,328 | ||||||
Total liabilities and stockholders’ equity | $ | 128,196 | $ | 105,239 | ||||
See accompanying notes to consolidated financial statements.
67
FIVE9, INC.
CONSOLIDATED STATEMENTS OF OPERATIONS AND COMPREHENSIVE LOSS
(In thousands, except per share data)
Year Ended December 31, | ||||||||||||
2017 | 2016 | 2015 | ||||||||||
Revenue | $ | 200,225 | $ | 162,090 | $ | 128,868 | ||||||
Cost of revenue | 83,104 | 66,934 | 59,495 | |||||||||
Gross profit | 117,121 | 95,156 | 69,373 | |||||||||
Operating expenses: | ||||||||||||
Research and development | 27,120 | 23,878 | 22,659 | |||||||||
Sales and marketing | 66,570 | 52,748 | 42,042 | |||||||||
General and administrative | 29,151 | 25,072 | 25,822 | |||||||||
Total operating expenses | 122,841 | 101,698 | 90,523 | |||||||||
Loss from operations | (5,720 | ) | (6,542 | ) | (21,150 | ) | ||||||
Other income (expense), net: | ||||||||||||
Extinguishment of debt | — | (1,026 | ) | — | ||||||||
Interest expense | (3,471 | ) | (4,226 | ) | (4,727 | ) | ||||||
Interest income and other | 490 | (12 | ) | 100 | ||||||||
Total other income (expense), net | (2,981 | ) | (5,264 | ) | (4,627 | ) | ||||||
Loss before income taxes | (8,701 | ) | (11,806 | ) | (25,777 | ) | ||||||
Provision for income taxes | 268 | 54 | 61 | |||||||||
Net loss | $ | (8,969 | ) | $ | (11,860 | ) | $ | (25,838 | ) | |||
Net loss per share: | ||||||||||||
Basic and diluted | $ | (0.16 | ) | $ | (0.23 | ) | $ | (0.52 | ) | |||
Shares used in computing net loss per share: | ||||||||||||
Basic and diluted | 54,946 | 52,342 | 50,141 | |||||||||
Comprehensive Loss: | ||||||||||||
Net loss and comprehensive loss | $ | (8,969 | ) | $ | (11,860 | ) | $ | (25,838 | ) | |||
See accompanying notes to consolidated financial statements.
68
FIVE9, INC.
CONSOLIDATED STATEMENTS OF STOCKHOLDERS’ EQUITY
(In thousands)
Common Stock | Additional Paid-In Capital | Accumulated Deficit | Total Stockholders’ Equity | ||||||||||||||||
Shares | Amount | ||||||||||||||||||
Balance as of December 31, 2014 | 49,322 | $ | 49 | $ | 170,286 | $ | (128,582 | ) | $ | 41,753 | |||||||||
Issuance of common stock upon exercise of stock options and warrants | 992 | 1 | 1,265 | — | 1,266 | ||||||||||||||
Issuance of common stock upon vesting of restricted stock units | 566 | 1 | (1 | ) | — | — | |||||||||||||
Issuance of common stock under ESPP | 306 | — | 1,369 | — | 1,369 | ||||||||||||||
Stock-based compensation | — | — | 7,730 | — | 7,730 | ||||||||||||||
Forfeiture of unvested restricted common stock | (21 | ) | — | — | — | — | |||||||||||||
Net loss | — | — | — | (25,838 | ) | (25,838 | ) | ||||||||||||
Balance as of December 31, 2015 | 51,165 | 51 | 180,649 | (154,420 | ) | 26,280 | |||||||||||||
Issuance of common stock upon exercise of stock options and warrants | 982 | 1 | 4,285 | — | 4,286 | ||||||||||||||
Issuance of common stock upon vesting of restricted stock units | 896 | 1 | (1 | ) | — | — | |||||||||||||
Issuance of common stock under ESPP | 320 | — | 1,979 | — | 1,979 | ||||||||||||||
Stock-based compensation | — | — | 9,643 | — | 9,643 | ||||||||||||||
Net loss | — | — | — | (11,860 | ) | (11,860 | ) | ||||||||||||
Balance as of December 31, 2016 | 53,363 | 53 | 196,555 | (166,280 | ) | 30,328 | |||||||||||||
Issuance of common stock upon exercise of stock options and warrants | 2,033 | 2 | 6,033 | — | 6,035 | ||||||||||||||
Issuance of common stock upon vesting of restricted stock units | 971 | 1 | (1 | ) | — | — | |||||||||||||
Issuance of common stock under ESPP | 265 | 1 | 4,100 | — | 4,101 | ||||||||||||||
Stock-based compensation | — | — | 15,343 | — | 15,343 | ||||||||||||||
Other (1) | — | — | 172 | (172 | ) | — | |||||||||||||
Net loss | — | — | — | (8,969 | ) | (8,969 | ) | ||||||||||||
Balance as of December 31, 2017 | 56,632 | $ | 57 | $ | 222,202 | $ | (175,421 | ) | $ | 46,838 | |||||||||
(1) | Effective January 2017, the Company adopted Accounting Standards Update (“ASU”) 2016-09 - Improvements to Employee Share-Based Payment Accounting. Accordingly, the Company accounted for forfeitures as they occurred rather than by estimating expected forfeitures. This amount represents the net effect of this change. See Note 1 for more information. |
See accompanying notes to consolidated financial statements.
69
FIVE9, INC.
CONSOLIDATED STATEMENTS OF CASH FLOWS
(In thousands)
Year Ended December 31, | ||||||||||||
2017 | 2016 | 2015 | ||||||||||
Cash flows from operating activities: | ||||||||||||
Net loss | $ | (8,969 | ) | $ | (11,860 | ) | $ | (25,838 | ) | |||
Adjustments to reconcile net loss to net cash used in operating activities: | ||||||||||||
Depreciation and amortization | 8,314 | 8,390 | 7,388 | |||||||||
Provision for doubtful accounts | 95 | 75 | 171 | |||||||||
Stock-based compensation | 15,343 | 9,643 | 7,730 | |||||||||
Amortization of debt discount and issuance costs | 80 | 241 | 350 | |||||||||
Loss on extinguishment of debt | — | 1,026 | — | |||||||||
Reversal of interest and penalties on accrued federal fees | (2,133 | ) | — | — | ||||||||
Reversal of accrued federal fees | — | (3,114 | ) | — | ||||||||
Non-cash adjustment on investment | (366 | ) | — | — | ||||||||
Accretion of interest | 21 | 20 | — | |||||||||
Others | (48 | ) | (10 | ) | 46 | |||||||
Changes in operating assets and liabilities: | ||||||||||||
Accounts receivable | (5,163 | ) | (3,389 | ) | (2,410 | ) | ||||||
Prepaid expenses and other current assets | (1,912 | ) | (859 | ) | (224 | ) | ||||||
Other assets | (33 | ) | 203 | (312 | ) | |||||||
Accounts payable | 813 | 811 | (1,610 | ) | ||||||||
Accrued and other current liabilities | 1,061 | 2,262 | 426 | |||||||||
Accrued federal fees and sales tax liability | 90 | (182 | ) | 441 | ||||||||
Deferred revenue | 3,882 | 3,680 | 1,038 | |||||||||
Other liabilities | 31 | (99 | ) | (135 | ) | |||||||
Net cash provided by (used in) operating activities | 11,106 | 6,838 | (12,939 | ) | ||||||||
Cash flows from investing activities: | ||||||||||||
Purchases of property and equipment | (2,650 | ) | (1,131 | ) | (1,116 | ) | ||||||
Purchases of convertible notes held for investment | — | (1,206 | ) | — | ||||||||
Decrease (increase) in restricted cash | — | (60 | ) | 806 | ||||||||
Purchase of short-term investments | — | — | (20,000 | ) | ||||||||
Proceeds from maturity of short-term investments | — | — | 40,000 | |||||||||
Net cash provided by (used in) investing activities | (2,650 | ) | (2,397 | ) | 19,690 | |||||||
Cash flows from financing activities: | ||||||||||||
Proceeds from exercise of common stock options and warrants | 6,035 | 4,286 | 1,266 | |||||||||
Proceeds from sale of common stock under ESPP | 4,101 | 1,979 | 1,369 | |||||||||
Proceeds from revolving line of credit | — | 32,594 | — | |||||||||
Repayments on revolving line of credit | — | (12,500 | ) | — | ||||||||
Repayments of notes payable | (699 | ) | (24,351 | ) | (3,447 | ) | ||||||
Payments of capital leases | (7,068 | ) | (6,237 | ) | (5,744 | ) | ||||||
Payment of prepayment penalty and related fees | — | (368 | ) | — | ||||||||
Payments for debt issuance costs | — | (206 | ) | — | ||||||||
Net cash provided by (used in) financing activities | 2,369 | (4,803 | ) | (6,556 | ) | |||||||
Net increase in cash and cash equivalents | 10,825 | (362 | ) | 195 | ||||||||
Cash and cash equivalents: | ||||||||||||
Beginning of period | 58,122 | 58,484 | 58,289 | |||||||||
End of period | $ | 68,947 | $ | 58,122 | $ | 58,484 | ||||||
Supplemental disclosures of cash flow data: | ||||||||||||
Cash paid for interest | $ | 3,311 | $ | 4,234 | $ | 4,340 | ||||||
Cash paid for income taxes | 121 | 115 | 186 | |||||||||
Non-cash investing and financing activities: | ||||||||||||
Equipment obtained under capital lease | $ | 10,261 | $ | 8,202 | $ | 6,284 | ||||||
Equipment purchased and unpaid at period-end | 145 | 163 | 151 | |||||||||
Capitalization of leasehold improvement through non-cash lease incentive | 142 | — | — | |||||||||
Conversion of accrued federal fees to note payable, net | — | — | 1,675 | |||||||||
See accompanying notes to the consolidated financial statements.
70
FIVE9, INC.
Notes to Consolidated Financial Statements
1. Description of Business and Summary of Significant Accounting Policies
Five9, Inc. and its wholly-owned subsidiaries, or the Company, is a provider of cloud software for contact centers. The Company was incorporated in Delaware in 2001 and is headquartered in San Ramon, California. The Company has offices in Europe and Asia, which primarily provide research, development, sales, marketing, and client support services.
Basis of Presentation
The accompanying consolidated financial statements have been prepared in accordance with generally accepted accounting principles in the United States (“GAAP”) and applicable rules and regulations of the Securities and Exchange Commission (“SEC”) regarding annual financial reporting. All intercompany transactions and balances have been eliminated in consolidation.
Certain prior period amounts included in the consolidated financial statements have been reclassified to conform to the current period presentation.
Use of Estimates
The preparation of consolidated financial statements in accordance with GAAP requires management to make estimates and assumptions that affect the reported amounts of assets and liabilities and disclosure of contingent assets and liabilities at the date of the consolidated financial statements and the reported amounts of revenue and expenses during the reporting period. The significant estimates made by management affect revenue, the allowance for doubtful accounts, loss contingencies, including the Company’s accrual for federal fees and sales tax liability, and accrued liabilities. Management periodically evaluates such estimates and they are adjusted prospectively based upon such periodic evaluation. Actual results could differ from those estimates.
Foreign Currency
The functional currency of the Company’s foreign subsidiaries is the U.S. dollar. For these subsidiaries, the monetary assets and liabilities are re-measured into U.S. dollars at the current exchange rate as of the balance sheet date, and all non-monetary assets and liabilities are re-measured into U.S. dollars at historical exchange rates. Revenues is primarily denominated in U.S dollars. Expenses are converted using average rates in effect on a monthly basis. Exchange gains and losses resulting from foreign currency transactions were not significant in any period and are reported in “Other income (expense), net” in the consolidated statements of operations and comprehensive loss.
Cash and Cash Equivalents
The Company considers highly liquid instruments with a maturity of three months or less at the date of purchase to be cash equivalents. The Company deposits cash and cash equivalents with financial institutions that management believes are of high credit quality. Cash equivalents consist of money market funds and certificates of deposit with original maturities of three months or less, and are stated at cost plus accrued interest, which approximates fair value.
Concentration Risks
Financial instruments, which potentially subject the Company to significant concentrations of credit risk, consist primarily of cash, cash equivalents, and accounts receivable. A significant portion of the Company’s cash and cash equivalents is held at two large reputable financial institutions. Total cash and cash equivalents in excess of insured limits were $68.3 million and $57.5 million as of December 31, 2017 and 2016, respectively. The Company has not experienced any losses in such accounts.
As of December 31, 2017 and 2016, no single client represented more than 10% of accounts receivable. For the years ended December 31, 2017, 2016 and 2015, no single client represented more than 10% of revenue.
71
Allowance for Doubtful Accounts
The Company records a provision for doubtful accounts based on historical experience and a detailed assessment of the collectability of its accounts receivable. In estimating the allowance for doubtful accounts, management considers, among other factors, the aging of the accounts receivable, historical write-offs and the creditworthiness of each client. If circumstances change, such as higher-than-expected defaults or an unexpected material adverse change in a major client’s ability to meet its financial obligations, the Company’s estimate of the recoverability of the amounts due could be reduced by a material amount.
The following table presents the changes in the allowance for doubtful accounts (in thousands):
Year Ended December 31, | ||||||||||||
2017 | 2016 | 2015 | ||||||||||
Balance, beginning of period | $ | 12 | $ | 15 | $ | 65 | ||||||
Add: bad debt expense | 95 | 75 | 171 | |||||||||
Less: write-offs, net of recoveries | (74 | ) | (78 | ) | (221 | ) | ||||||
Balance, end of period | $ | 33 | $ | 12 | $ | 15 | ||||||
Property and Equipment, Net
Property and equipment is stated at cost less accumulated depreciation and amortization, and is depreciated using the straight-line method over the estimated useful lives of the assets as follows:
Asset Category | Estimated Useful Lives | |
Computer and network equipment | 3 to 5 years | |
Computer software | 3 years | |
Development costs | 1 to 5 years | |
Furniture and fixtures | 7 years | |
Leasehold improvements | Shorter of useful life or lease term | |
Maintenance and repairs are charged to expense as incurred, and improvements and betterments are capitalized. When assets are retired or otherwise disposed of, the cost and accumulated depreciation and amortization are removed from the consolidated balance sheet and any resulting gain or loss is reflected in the consolidated statements of operations and comprehensive loss in the period realized.
The Company evaluates the recoverability of property and equipment for possible impairment whenever events or circumstances indicate that the carrying amount of such assets or asset groups may not be recoverable. Recoverability of these assets is measured by a comparison of the carrying amounts to the future undiscounted cash flows the assets or asset groups are expected to generate. If such evaluation indicates that the carrying amount of the assets or asset groups is not recoverable, the carrying amount of such assets or asset groups is reduced to fair value. No impairment losses have been recognized in any of the periods presented.
Goodwill and Intangible Assets
The Company records goodwill when the consideration paid in a business combination exceeds the fair value of the net tangible assets and the identified intangible assets acquired. Goodwill is not amortized, but instead is required to be tested for impairment annually and whenever events or changes in circumstances indicate that the carrying value of goodwill may exceed its fair value.
The Company performs testing for impairment of goodwill in its fourth quarter, or as events occur or circumstances change that would more likely than not reduce the fair value of the Company’s single reporting unit below its carrying amount. A qualitative assessment is first made to determine whether it is necessary to perform the two-step quantitative goodwill impairment test. This initial qualitative assessment includes, among other things, consideration of: (i) market capitalization of the Company, (ii) past, current and projected future earnings and equity; (iii) recent trends and market conditions; and (iv) valuation metrics involving similar companies that are publicly-traded and acquisitions of similar companies, if available. If this initial qualitative assessment indicates that it is more likely than not that impairment exists, a second analysis will be performed, involving a comparison
72
between the estimated fair values of the Company’s reporting unit with its respective carrying amount including goodwill. If the carrying value exceeds estimated fair value, there is an indication of potential impairment, and a third analysis is performed to measure the amount of impairment. The third analysis involves calculating an implied fair value of goodwill by measuring the excess of the estimated fair value of the reporting unit over the aggregate estimated fair values of the individual assets less liabilities. If the carrying value of goodwill exceeds the implied fair value of goodwill, an impairment charge is recorded for the excess.
Intangible assets, consisting of acquired developed technology, domain names and customer relationships, are carried at cost less accumulated amortization. All intangible assets have been determined to have definite lives and are amortized on a straight-line basis over their estimated remaining economic lives, ranging from five to seven years. Amortization expense related to developed technology is included in cost of revenue. Amortization expense related to customer relationships is included in sales and marketing expense. Amortization expense related to domain names is included in general and administrative expense. Intangible assets are reviewed for impairment whenever events or changes in circumstances indicate an asset’s carrying value may not be recoverable.
Revenue Recognition
The Company’s revenue consists of subscription services and related usage as well as professional services. The Company charges clients monthly subscription fees for access to the Company’s VCC solution. The monthly subscription fees are primarily based on the number of agent seats, as well as the specific VCC functionalities and applications deployed by the client. Agent seats are defined as the maximum number of named agents allowed to concurrently access the VCC cloud platform. Clients typically have more named agents than agent seats. Multiple named agents may use an agent seat, though not simultaneously. Substantially all of the Company’s clients purchase both subscriptions and related telephony usage. A small percentage of the Company’s clients subscribe to its platform but purchase telephony usage directly from a wholesale telecommunications service provider. The Company does not sell telephony usage on a stand-alone basis to any client. The related usage fees are based on the volume of minutes used for inbound and outbound client interactions. The Company also offers bundled plans, generally for smaller deployments, whereby the client is charged a single monthly fixed fee per agent seat that includes both subscription and unlimited usage in the contiguous 48 states and, in some cases, Canada. Professional services revenue is derived primarily from VCC implementations, including application configuration, system integration, optimization, education and training services. Clients are not permitted to take possession of the Company’s software.
The Company offers monthly, annual and multiple-year contracts to its clients, generally with 30 days’ notice required for changes in the number of agent seats and sometimes with a minimum number of agent seats requirement. Larger clients typically choose annual contracts, which generally include an implementation and ramp period of several months. Fixed subscription fees (including bundled plans) are generally billed monthly in advance, while related usage fees are billed in arrears. Support activities include technical assistance for the Company’s solution and upgrades and enhancements to the VCC cloud platform on a when-and-if-available basis, which are not billed separately.
The Company generally requires advance deposits from its clients based on estimated usage when such usage is not billed as part of a bundled plan. Fees for certain clients’ usage are applied against the advance deposit resulting in continuous consumption and therefore requiring frequent replenishment of the deposit. Any unused portion of the deposit is refundable to the client upon termination of the arrangement, provided all amounts due have been paid. All fees, except usage deposits, are non-refundable.
Professional services are primarily billed on a fixed-fee basis and are performed by the Company directly or, alternatively, clients may also choose to perform these services themselves or engage their own third-party service providers.
The Company’s sales arrangements generally involve multiple deliverables, including subscription services and related usage as well as professional services, all of which have stand-alone value to the client. The Company allocates arrangement consideration to these deliverables based on the relative stand-alone selling price method in accordance with the selling price hierarchy, which includes: (i) Vendor Specific Objective Evidence, or VSOE, if available; (ii) Third-Party Evidence, or TPE, if VSOE is not available; and (iii) Best Estimate of Selling Price, or BESP, if neither VSOE nor TPE is available.
VSOE. The Company determines VSOE based on its historical pricing and discounting practices for the specific service when sold separately. In determining VSOE, the Company requires that a substantial majority of the
73
selling prices for these services fall within a reasonably narrow pricing range. The Company limits its assessment of VSOE for each element to either the price charged when the same element is sold separately or the price established by management, having the relevant authority to do so, for an element not yet sold separately. The Company has not met the criteria to establish selling prices based on VSOE.
TPE. When VSOE cannot be established for deliverables in multiple element arrangements, the Company applies judgment with respect to whether it can establish a selling price based on TPE. TPE is determined based on competitor prices for similar deliverables when sold separately. The Company’s services are significantly differentiated such that the comparable pricing of deliverables with similar functionality cannot be obtained. Furthermore, the Company is unable to reliably determine the stand-alone selling prices of similar deliverables sold by competitors. As a result, the Company has not met the criteria to establish selling prices based on TPE.
BESP. Since the Company is unable to establish a selling price using VSOE or TPE, it uses BESP in its allocation of arrangement consideration. The objective of BESP is to determine the price at which the Company would transact a sale if the product or service were sold on a stand-alone basis. The Company determines BESP for deliverables by considering multiple factors including prices it charges for similar offerings, pricing policies, market conditions and the competitive landscape. The Company limits the amount of allocable arrangement consideration to amounts that are fixed or determinable and that are not contingent on future performance or future deliverables.
The Company recognizes revenue for each unit of accounting when all of the following criteria have been met:
• | persuasive evidence of an arrangement exists; |
• | delivery has occurred; |
• | the fee is fixed or determinable; and |
• | collection is reasonably assured. |
Revenue allocated to the separate accounting units is recognized as follows:
• | fixed subscription revenue is recognized on a straight-line basis over the applicable term, predominantly the monthly contractual billing period; |
• | variable usage revenue is recognized as actual usage occurs. Usage revenue in subscription arrangements that include bundled usage is recognized on a straight-line basis over the applicable term, as the Company cannot reliably estimate client usage patterns; and |
• | professional services revenue is recognized as services are performed using the proportional performance method, with performance measured based on labor hours, assuming all other revenue recognition criteria have been met. |
At the time of each revenue transaction, the Company assesses whether fees under the arrangement are fixed or determinable and whether collection is reasonably assured. For arrangements where the fee is not fixed or determinable, the Company recognizes revenue as these amounts become due and payable. The Company assesses collection based on a number of factors, including past transaction history and the creditworthiness of the client. If the Company determines that collection of fees is not reasonably assured, it defers the revenue and recognizes revenue at such time when collection becomes reasonably assured, which is generally upon receipt of payment. The Company maintains a revenue reserve for potential credits to be issued in accordance with service level agreements or for other revenue adjustments.
The revenue recognition standards include guidance relating to any tax assessed by a governmental authority that is directly imposed on a revenue-producing transaction between a seller and a customer and may include, but is not limited to, sales, use, value added and excise taxes. The Company records USF contributions and other regulatory costs on a gross basis in its consolidated statements of operations and comprehensive loss and records surcharges and sales, use and excise taxes billed to its clients on a net basis. The cost of gross USF contributions payable to the USAC and suppliers is presented as a cost of revenue in the consolidated statements of operations and comprehensive loss. For the years ended December 31, 2017, 2016 and 2015, total USF contributions and other regulatory costs included in cost of revenue were $8.6 million, $4.6 million, and $6.2 million, respectively. Total USF contributions and other regulatory costs for the year ended December 31, 2016 was $7.7 million before the $3.1 million reversal related to the favorable Federal Communications Commission (“FCC”) Competition Wireline Bureau ruling recorded in the fourth quarter of 2016. Surcharges and sales, use and excise taxes incurred in excess of amounts billed to the Company’s clients are presented in general and administrative expense in the consolidated statements of operations and comprehensive loss.
74
Deferred Revenue
Deferred revenue consists of billings or payments received from clients for subscription service, usage and professional services in advance of revenue recognition and are recognized as the revenue recognition criteria are met. The Company generally invoices its clients monthly in advance for subscription services. Accordingly, the deferred revenue balance does not represent the total contract value of sales arrangements. The current portion of deferred revenue represents the amount that is expected to be recognized as revenue within one year from the balance sheet date.
Cost of Revenue
Cost of revenue consists primarily of personnel costs (including stock-based compensation), fees that the Company pays to telecommunications providers for usage, USF contributions and other regulatory costs, depreciation and related expenses of the servers and equipment, costs to build out and maintain co-location data centers, and allocated office and facility costs and amortization of acquired technology. Personnel costs include those associated with support of the Company’s solution, clients and data center operations, as well as with providing professional services. Data center costs include costs to build out and setup, as well as co-location fees for the right to place the Company’s servers in data centers owned by third parties.
Research and Development
Research and development expenses consist primarily of salary and related expenses (including stock-based compensation) for personnel related to the development of improvements and expanded features for our services, as well as quality assurance, testing, product management and allocated overhead. Research and development costs are expensed as incurred except for internal use software development costs that qualify for capitalization. The Company reviews development costs incurred for internal-use software in the application development stage and assesses costs for capitalization. As of December 31, 2017 and 2016, the amount of capitalized internal-use software development costs was $0.4 million and $0.5 million, respectively.
Advertising Costs
We primarily advertise our services through the web and in conjunction with partners. Advertising costs are expensed as incurred and were $11.4 million, $10.7 million and $9.2 million for the years ended December 31, 2017, 2016 and 2015, respectively.
Commissions
Commissions consist of variable compensation earned by sales personnel and referral fees we paid to third parties. Sales commissions associated with the acquisition or renewal of a client contract are recognized as sales and marketing expense as incurred. Commission expense was $14.0 million, $10.2 million and $7.2 million for the years ended December 31, 2017, 2016 and 2015, respectively.
Stock-Based Compensation
All stock-based compensation granted to employees and non-employee directors is measured as the grant date fair value of the award. The Company estimates the fair value of stock options and purchase rights under the Company’s Equity Incentive Plans and the 2014 Employee Stock Purchase Plan, or ESPP, respectively, using the Black-Scholes option-pricing model. The fair value of restricted stock awards is equal to the fair value of the Company’s common stock on the date of grant. Compensation expense is recognized net of forfeitures using the straight-line method over the service period, which is generally the vesting period.
Income Taxes
The Company accounts for income taxes using the asset and liability method. Deferred tax assets and liabilities are recognized for the estimated future tax consequences attributable to differences between the financial statement carrying amounts of existing assets and liabilities and their respective tax basis. Deferred tax assets and liabilities are measured using enacted tax rates in effect for the year in which those temporary differences are expected to be recovered or settled. The effect on deferred tax assets and liabilities of a change in tax rates is recognized in operations in the period that includes the enactment date. The Company records a valuation allowance to reduce its deferred tax assets to the amount of future tax benefit that is more likely than not to be realized. As of
75
December 31, 2017 and 2016, the Company recorded a full valuation allowance against the net deferred tax assets because of its history of operating losses in the United States. The Company classifies interest and penalties on unrecognized tax benefits as income tax expense.
Net Loss Per Share
Basic net loss per share is calculated by dividing net loss by the weighted average number of shares of common stock outstanding during the period, and excludes any dilutive effects of employee stock-based awards and warrants. Diluted net income per share is computed giving effect to all potentially dilutive common shares, including common stock issuable upon exercise of stock options and warrants, vesting of restricted stock and purchases under the ESPP. In periods of net loss, all potentially issuable common shares are excluded from the diluted net loss per share computation because they are anti-dilutive. Therefore, basic and diluted net loss per share are the same for all years presented in the consolidated statements of operations and comprehensive loss.
Indemnification
Certain of the Company’s agreements with clients include provisions for indemnification against liabilities if its services infringe a third-party’s intellectual property rights. To date, the Company has not incurred any material costs as a result of such indemnification provisions and the Company has not accrued any liabilities related to such obligations in the consolidated financial statements as of December 31, 2017 and 2016.
Segment Information
The Company has determined that its Chief Executive Officer is its chief operating decision maker. The Company’s Chief Executive Officer reviews financial information presented on a consolidated basis for purposes of assessing performance and making decisions on how to allocate resources. Accordingly, the Company has determined that it operates in a single reportable segment.
Recently Adopted Accounting Pronouncements
In March 2016, the FASB issued ASU No. 2016-09, Compensation-Stock Compensation (Topic 718): Improvements to Employee Share-Based Payment Accounting. This ASU simplifies several aspects of the accounting for share-based payment transactions, including the accounting for income taxes, forfeitures, and statutory tax withholding requirements, as well as classification in the statement of cash flows. The guidance was effective for the Company beginning in the first quarter of 2017. Accordingly, commencing in January 2017, the Company accounted for forfeitures as they occurred, rather than by estimating expected forfeitures. The net effect of this change was recognized as a $0.2 million reduction to accumulated deficit in the consolidated financial statements. Upon adoption of the new standard, all excess tax benefits and tax deficiencies (including tax benefits of dividends on share-based payment awards) are recognized as income tax expense or benefit in the income statement. The tax effects of exercised or vested awards are treated as discrete items in the reporting period in which they occur. The Company also recognizes excess tax benefits regardless of whether the benefit reduces taxes payable in the current period. The Company has applied the modified retrospective adoption approach beginning January 1, 2017 and prior periods have not been adjusted. As a result, the Company established a net operating loss deferred tax asset of $5.3 million to account for prior period excess tax benefits through retained earnings, however an offsetting valuation allowance of $5.3 million was also established through retained earnings because it is not more likely than not that the deferred tax asset will be realized due to historical and expected future losses, such that there is no impact on the Company’s consolidated financial statements.
Recent Accounting Pronouncements Not Yet Effective
In June 2016, the FASB issued ASU No. 2016-13, Financial Instruments—Credit Losses (Topic 326): Measurement of Credit Losses on Financial Instruments, which requires measurement and recognition of expected credit losses for certain types of financial assets held. ASU 2016-13 is effective for the Company in its first quarter of 2020, and earlier adoption is permitted beginning in the first quarter of 2019. The Company is currently evaluating the impact of ASU 2016-13 on its consolidated financial statements.
In February 2016, the FASB issued ASU No. 2016-02, Leases (Topic 842) and issued subsequent amendments to the initial guidance in September 2017 within ASU 2017-13 (collectively, Topic 842). Under the new guidance, a lessee will be required to recognize assets and liabilities for both finance, or capital, and operating leases
76
with lease terms of more than 12 months. The ASU also will require disclosures to help investors and other financial statement users better understand the amount, timing, and uncertainty of cash flows arising from leases. Lessor accounting will remain largely unchanged from current GAAP. In transition, lessees and lessors are required to recognize and measure leases at the beginning of the earliest period presented using a modified retrospective approach that includes a number of optional practical expedients that entities may elect to apply. This guidance is effective for the Company beginning in the first quarter of 2019. Early adoption is permitted. The Company is currently assessing the effect the guidance will have on its consolidated financial statements.
In May 2014, the FASB issued ASU No. 2014-09, Revenue from Contracts with Customers: Topic 606 and issued subsequent amendments to the initial guidance in August 2015, March 2016, April 2016, May 2016, September 2017 and November 2017 within ASU 2015-04, ASU 2016-08, ASU 2016-10 and ASU 2016-12, ASU 2017-13 and ASU 2017-14, respectively (collectively, Topic 606). Topic 606 requires an entity to recognize the amount of revenue to which it expects to be entitled for the transfer of promised goods or services to customers and will replace most existing revenue recognition guidance in U.S. GAAP when it becomes effective. Topic 606 defines a five-step process to achieve this core principle and, in doing so, more judgment and estimates will be required within the revenue recognition process than are required under current GAAP (Accounting Standards Codification 605). Topic 606 is effective for the Company's annual and interim reporting periods beginning January 1, 2018 (“effective date”). The guidance permits two methods of adoption: retrospectively to each prior reporting period presented (full retrospective method), or retrospectively with the cumulative effect of initially applying the guidance recognized at the date of initial application (modified retrospective method). The Company adopted the new standard effective January 1, 2018 using the modified retrospective method.
The Company anticipates the adoption of this standard will result in significant changes in the way we account for sales commissions, specifically, certain client acquisition costs will be capitalized when they are initially paid to employees, and amortized over a related benefit period of five years.
The adoption is not expected to have a material impact on the recognition or timing of revenue, or on the provision for income taxes and deferred taxes.
The Company currently anticipates the adoption of the standard will result in a decrease to accumulated deficit of $18.0 million to $28.0 million related to the recognition of deferred commission contract assets, and immaterial adjustments to deferred revenue. In addition, the new standard will expand the disclosures made in our consolidated financial statements, including disaggregation of revenue, information on contract balances, deferred contract acquisition costs, performance obligations and remaining performance obligations.
The Company has established new accounting policies and is implementing the system, processes, and internal controls necessary to support the requirement of the new standard.
There are several other new accounting pronouncements issued by the FASB, which the Company will adopt. However, the Company does not believe any of those accounting pronouncements will have a material impact on its consolidated financial position, operating results or statements of cash flows.
2. Fair Value Measurements
The Company carries cash equivalents consisting of money market funds at fair value on a recurring basis. Fair value is based on the price that would be received from selling an asset in an orderly transaction between market participants at the measurement date. Fair value is estimated by applying the following hierarchy, which prioritizes the inputs used to measure fair value into three levels and bases the categorization within the hierarchy upon the lowest level of input that is available and significant to the fair value measurement:
Level 1 — Observable inputs which include unadjusted quoted prices in active markets for identical assets.
Level 2 — Observable inputs other than Level 1 inputs, such as quoted prices for similar assets, quoted prices for identical or similar assets in inactive markets, or other inputs that are observable or can be corroborated by observable market data for substantially the full term of the asset.
Level 3 — Unobservable inputs that are supported by little or no market activity and that are based on management’s assumptions, including fair value measurements determined by using pricing models, discounted cash flow methodologies or similar techniques.
77
The fair value of assets and liabilities carried at fair value was determined using the following inputs (in thousands):
December 31, 2017 | ||||||||||||
Total | Level 1 | Level 3 | ||||||||||
Assets | ||||||||||||
Cash equivalents: | ||||||||||||
Money market funds | $ | 20,092 | $ | 20,092 | $ | — | ||||||
Other Assets | ||||||||||||
Embedded conversion option held for investment | $ | 984 | $ | — | $ | 984 | ||||||
December 31, 2016 | ||||||||||||
Total | Level 1 | Level 3 | ||||||||||
Assets | ||||||||||||
Cash equivalents: | ||||||||||||
Money market funds | $ | 20,069 | $ | 20,069 | $ | — | ||||||
Other Assets | ||||||||||||
Embedded conversion option held for investment | $ | 873 | $ | — | $ | 873 | ||||||
Fair Value Measured and Recorded Using Significant Unobservable Inputs (Level 3) (in thousands):
December 31, 2017 | ||||
Beginning balance | $ | 873 | ||
Total gains included in earnings (1) | 111 | |||
Ending balance | $ | 984 | ||
(1) | Amount includes both fair value and foreign currency adjustments. |
The valuation of an embedded conversion option held for investment was performed using a Black-Scholes option-pricing model which relies primarily on estimates of expected term, volatility, risk-free rate, and dividends related to our investment in a privately-held company, or the investee. The most significant unobservable inputs used in the determination of estimated fair value of the option are the estimates of share price and volatility, driven by the investee’s ability to meet financial targets, and which directly correlates to the fair value recognized in other non-current assets within the consolidated balance sheets.
The fair value of this asset is estimated quarterly by management based on inputs received from the investee’s management using the excess earnings method under the income approach. Potential valuation adjustments are made as the progress toward achieving financial targets becomes determinable, with the impact of such adjustments being recorded to ‘Interest income and other’ in our consolidated statements of operations and comprehensive loss.
During 2017, there were no transfers in or out of Level 3 from other levels in the fair value hierarchy. In addition, there were no assets or liabilities measured at fair value on a non-recurring basis as of December 31, 2017.
In February 2018, the Company exercised the embedded option to convert its convertible notes into common shares of the investee company prior to the investee company’s acquisition. See Note 14.
The Company’s other financial instruments’ fair value, including accounts receivable, accounts payable and other current liabilities, approximate its carrying value due to the relatively short maturity of those instruments. The carrying amounts of the Company’s debt and capital leases approximate their fair value, which is the present value of expected future cash payments based on assumptions about current interest rates and the creditworthiness of the Company. The inputs used to measure fair value of the Company’s debt and capital leases are classified as Level 2 inputs.
78
3. Cash and Cash Equivalents
Cash and cash equivalents consisted of the following (in thousands):
December 31, | ||||||||
2017 | 2016 | |||||||
Cash and cash equivalents: | ||||||||
Cash | $ | 48,855 | $ | 38,053 | ||||
Money market funds | 20,092 | 20,069 | ||||||
Total cash and cash equivalents | $ | 68,947 | $ | 58,122 | ||||
As of December 31, 2017, the Company was required to maintain $25.0 million of unrestricted cash and cash equivalents deposited with two lenders in connection with its credit agreement as a compensating balance (see Note 6).
Restricted Cash
As of December 31, 2017 and 2016, the Company’s restricted cash balance was not material. Restricted cash is included in ‘Other assets’ on the accompanying consolidated balance sheets.
4. Financial Statement Components
Accounts receivable, net consisted of the following (in thousands):
December 31, | ||||||||
2017 | 2016 | |||||||
Trade accounts receivable | $ | 17,481 | $ | 12,640 | ||||
Unbilled trade accounts receivable, net of advance client deposits | 1,600 | 1,253 | ||||||
Allowance for doubtful accounts | (33 | ) | (12 | ) | ||||
Accounts receivable, net | $ | 19,048 | $ | 13,881 | ||||
Prepaid expenses and other current assets consisted of the following (in thousands):
December 31, | ||||||||
2017 | 2016 | |||||||
Prepaid expenses | $ | 2,437 | $ | 2,199 | ||||
Other current assets | 2,403 | 809 | ||||||
Prepaid expenses and other current assets | $ | 4,840 | $ | 3,008 | ||||
Property and equipment, net consisted of the following (in thousands):
December 31, | ||||||||
2017 | 2016 | |||||||
Computer and network equipment | $ | 47,195 | $ | 37,664 | ||||
Computer software | 6,974 | 5,133 | ||||||
Internal-use software development costs | 500 | 475 | ||||||
Furniture and fixtures | 1,282 | 1,130 | ||||||
Leasehold improvements | 801 | 624 | ||||||
Property and equipment | 56,752 | 45,026 | ||||||
Accumulated depreciation and amortization | (36,864 | ) | (30,338 | ) | ||||
Property and equipment, net | $ | 19,888 | $ | 14,688 | ||||
79
In accordance with our property and equipment policy, we review the estimated useful lives of our fixed assets on an ongoing basis. A review of our existing estimates indicated that the actual lives of certain data center assets were longer than previously estimated useful lives used for depreciation purposes in our financial statements. As a result, effective July 1, 2017, we changed the estimated useful lives of certain data center assets to better reflect the estimated periods during which these assets will remain in service. The estimated useful lives of these assets, which we previously depreciated for three years, have now been increased to a range of three to five years. For the year ended December 31, 2017, this change in accounting estimate decreased depreciation expense by $1.6 million and decreased both basic and diluted net loss per share by $0.03.
Depreciation and amortization expense associated with property and equipment was $7.8 million, $7.9 million, and $6.9 million for the years ended December 31, 2017, 2016 and 2015, respectively.
Property and equipment capitalized under capital lease obligations consist primarily of computer and network equipment and were as follows (in thousands):
December 31, | ||||||||
2017 | 2016 | |||||||
Gross | $ | 46,624 | $ | 35,504 | ||||
Less: accumulated depreciation and amortization | (30,438 | ) | (23,128 | ) | ||||
Total | $ | 16,186 | $ | 12,376 | ||||
Accrued and other current liabilities consisted of the following (in thousands):
December 31, | ||||||||
2017 | 2016 | |||||||
Accrued expenses | $ | 3,130 | $ | 2,148 | ||||
Accrued compensation and benefits | 8,657 | 7,456 | ||||||
Accrued and other current liabilities | $ | 11,787 | $ | 9,604 | ||||
5. Goodwill and Intangible Assets
Goodwill
Goodwill was recorded as a result of the Company’s acquisition in October 2013 of Face It, Corp., which the Company also refers to as SoCoCare.
During the fourth quarter of 2017, the Company completed its annual goodwill impairment test. Based on its assessment of the qualitative factors, management concluded that the fair value of the Company was more likely than not greater than its carrying amount as of December 31, 2017. As such, it was not necessary to perform the two-step quantitative goodwill impairment test. Subsequent to the 2017 annual impairment test, we believe there have been no significant events or circumstances negatively affecting the valuation of goodwill. As of December 31, 2017 and 2016, there was no impairment to the carrying value of the Company’s goodwill.
Intangible Assets
Intangible assets were acquired in connection with the Company’s acquisition of SoCoCare in October 2013. The components of intangible assets are as follows (in thousands):
December 31, 2017 | December 31, 2016 | |||||||||||||||||||||||
Gross Carrying Amount | Accumulated Amortization | Net Carrying Amount | Gross Carrying Amount | Accumulated Amortization | Net Carrying Amount | |||||||||||||||||||
Developed technology | $ | 2,460 | $ | (1,478 | ) | $ | 982 | $ | 2,460 | $ | (1,126 | ) | $ | 1,334 | ||||||||||
Customer relationships | 520 | (437 | ) | 83 | 520 | (333 | ) | 187 | ||||||||||||||||
Domain names | 50 | (42 | ) | 8 | 50 | (32 | ) | 18 | ||||||||||||||||
Total | $ | 3,030 | $ | (1,957 | ) | $ | 1,073 | $ | 3,030 | $ | (1,491 | ) | $ | 1,539 | ||||||||||
80
Amortization expense related to intangible assets was $0.5 million for each of the years ended December 31, 2017, 2016 and 2015. As of December 31, 2017, the expected future amortization expense for intangible assets was as follows (in thousands):
Period | Expected Future Amortization Expense | |||
2018 | $ | 442 | ||
2019 | 351 | |||
2020 | 280 | |||
Total | $ | 1,073 | ||
Intangible assets are reviewed for impairment whenever events or changes in circumstances indicate an asset’s carrying value may not be recoverable. The Company concluded that there was no impairment to the carrying value of its intangible assets as of December 31, 2017 and 2016.
6. Debt
2016 Loan and Security Agreement
On August 1, 2016, or the Effective Date, the Company entered into a loan and security agreement, or the 2016 Loan and Security Agreement, with the lenders party thereto and City National Bank, as agent for such lenders. The 2016 Loan and Security Agreement provides for a revolving line of credit, or the New Revolving Credit Facility, of up to $50.0 million and matures on August 1, 2019. On the Effective Date, the Company borrowed $32.6 million under the 2016 Loan and Security Agreement. The proceeds were used to extinguish existing indebtedness under all prior loan and security agreements and for working capital and other general corporate purposes.
Loans under the 2016 Loan and Security Agreement bear a variable annual interest rate of the prime rate plus 0.50%, subject to a 0.25% increase if the Company’s adjusted EBITDA is negative at the end of any fiscal quarter. The Company has agreed to pay a fee of 0.25% per annum on the unused portion of the New Revolving Credit Facility as well as an anniversary fee of $31,250 on each of the first and second anniversaries of the Effective Date. The Company is accreting the total estimation of unused fees and anniversary fees evenly over the full term of the 2016 Loan and Security Agreement. Under the terms of the 2016 Loan and Security Agreement, the outstanding balance cannot exceed the Company’s trailing four months of MRR (monthly recurring revenue including subscription and usage) multiplied by the average trailing 12 month dollar based retention rate (calculated on the same basis as in the Company’s periodic reports filed with the SEC). As of December 31, 2017, the outstanding principal balance under the 2016 Loan and Security Agreement was $32.6 million, which is included in ‘Revolving line of credit’ in the consolidated balance sheets. As of December 31, 2017, the amount available for additional borrowings was $17.4 million.
The Company incurred approximately $0.2 million in fees that were directly attributable to the issuance of this credit facility in 2016. These costs are deferred and included within ‘Prepaid expenses and other current assets’ and ‘Other assets’ in the Company’s consolidated balance sheets and being amortized to interest expense on a straight-line basis over three years starting from the Effective Date of the New Revolving Credit Facility.
The obligations of the Company under the 2016 Loan and Security Agreement are guaranteed by the Company’s subsidiary, Five9 Acquisition. The Company’s obligations under the 2016 Loan and Security Agreement and Five9 Acquisition’s obligations under its guaranty are secured by a first priority perfected security interest in and lien on substantially all of the Company’s and Five9 Acquisition’s assets. The 2016 Loan and Security Agreement contains certain customary covenants, including the requirement that the Company maintain $25.0 million of unrestricted cash deposited with the lenders for the term of the agreement, a minimum liquidity ratio of unrestricted cash and accounts receivable to the outstanding amounts under the 2016 Loan and Security Agreement, as well as customary events of default. Under the 2016 Loan and Security Agreement, the Company is also prohibited from declaring dividends or making other distributions on our capital stock. The Company was in compliance with these covenants as of December 31, 2017.
The Company recorded a $1.0 million loss on extinguishment of debt in the third quarter of 2016 under the 2013 Loan and Security Agreement and the 2014 Loan and Security Agreement (each as described below). The loss
81
was comprised of $0.4 million in prepayment penalties, a $0.4 million write-off of unamortized debt discounts, and a $0.2 million write-off of unamortized debt issuance costs.
2014 Loan and Security Agreement
Prior to entering into the 2016 Loan and Security Agreement on August 1, 2016, the Company had a term loan facility of $30.0 million with a syndicate of two lenders, which was entered into in February 2014 and amended in December 2014 and February 2015, or the 2014 Loan and Security Agreement. The term loan facility was available to the Company in tranches. The first tranche for $20.0 million was advanced upon entering into the agreement. The remaining $10.0 million was available for drawdown by the Company in $1.0 million increments, which expired on February 20, 2016. The term loan bore interest at a variable per annum rate equal to the greater of 10% or LIBOR plus 9%. The term loan was secured by substantially all the assets of the Company and was subordinate to the 2013 Loan and Security Agreement. Upon the effectiveness of the 2016 Loan and Security Agreement on August 1, 2016 as described above, the Company canceled and paid back all borrowings under the 2014 Loan and Security Agreement.
In connection with entering into the 2014 Loan and Security Agreement, the Company issued to the lenders warrants to purchase 177,865 shares of common stock at $10.12 per share, which vest and become exercisable over a ten year term from the date of issuance, based on amounts drawn under the $30.0 million term loan facility. In February 2014, based on the drawdown of $20.0 million, 118,577 shares of common stock issuable under the warrants vested and were exercisable by the lenders. The remaining 59,288 shares of common stock issuable under the warrants pertaining to the undrawn $10.0 million did not vest and were canceled on February 20, 2016, when the $10.0 million was no longer available for borrowing.
2013 Loan and Security Agreement
Prior to entering into the 2016 Loan and Security Agreement on August 1, 2016, the Company had a revolving line of credit of up to $20.0 million, or the Prior Revolving Credit Facility, under a loan and security agreement with a lender entering into in March 2013 and was last amended in December 2014, or the 2013 Loan and Security Agreement. The Prior Revolving Credit Facility carried a variable annual interest rate of the prime rate plus 0.50%. The 2013 Loan and Security Agreement was collateralized by substantially all the assets of the Company. Upon the effectiveness of the 2016 Loan and Security Agreement on August 1, 2016 as described above, the Company canceled and paid back all amounts due under the Prior Revolving Credit Facility.
In connection with its acquisition of SoCoCare in October 2013, the Company also borrowed $5.0 million under a term loan under the 2013 Loan and Security Agreement in October 2013. Upon the effectiveness of the 2016 Loan and Security Agreement on August 1, 2016 as described above, the Company canceled and paid back all amounts due under the term loan.
Promissory Note
In July 2013, the Company issued a promissory note to the USAC for $4.1 million in principal amount as a financing arrangement for that amount of accrued federal fees. The promissory note carries a fixed annual interest rate of 12.75% and is repayable in 42 equal monthly installments of principal and interest beginning in August 2013. As of December 31, 2016, $0.1 million of this promissory note was outstanding and is included as notes payable in the accompanying consolidated balance sheets. This promissory note was fully paid as of January 2017.
FCC Civil Penalty
In June 2015, the Company entered into a consent decree with the FCC Enforcement Bureau (Note 10), in which the Company agreed to pay a civil penalty of $2.0 million to the U.S. Treasury in twelve equal quarterly installments starting in July 2015 without interest. As a result, the Company discounted the $2.0 million liability, which was accrued in the third quarter of 2014 for the then tentative civil penalty, to its present value of $1.7 million at an annual interest rate of 12.75% to reflect the imputed interest and reclassified this discounted liability from ‘Accrued federal fees’ to ‘Notes payable.’ The $0.3 million discount was recorded as a reduction to general and administrative expense in the three months ended June 30, 2015 and is being recognized as interest expense over the payment term of the civil penalty. As of December 31, 2017 and 2016, the outstanding civil penalty payable was $0.3 million and $1.0 million, respectively, of which the net carrying value was $0.3 million and $0.9 million, respectively, and is included as ‘Notes payable’ in the accompanying consolidated balance sheets.
82
As of December 31, 2017 and 2016, the Company’s outstanding debt is summarized as follows (in thousands):
December 31, | ||||||||
2017 | 2016 | |||||||
Promissory note to USAC | $ | — | $ | 120 | ||||
FCC civil penalty | 333 | 1,000 | ||||||
Total notes payable, gross | 333 | 1,120 | ||||||
Less: discount | (7 | ) | (79 | ) | ||||
Total notes payable, net carrying value | 326 | 1,041 | ||||||
Revolving line of credit | 32,594 | 32,594 | ||||||
Interest accretion under 2016 line of credit | $ | 10 | $ | 19 | ||||
Total debt, net carrying value | $ | 32,930 | $ | 33,654 | ||||
Less: current portion of debt * | (336 | ) | (742 | ) | ||||
Total debt, less current portion ** | 32,594 | 32,912 | ||||||
* Included in ‘Notes payable’ in the consolidated balance sheets. | ||||||||
** Included in ‘Notes payable - less current portion’ and ‘Revolving line of credit - less current portion’ in the consolidated balance sheets. | ||||||||
Maturities of the Company’s outstanding debt as of December 31, 2017 are as follows (in thousands):
Period | Amount to Mature | |||
2018 | $ | 333 | ||
2019 | 32,594 | |||
Total | $ | 32,927 | ||
7. Stockholders’ Equity
Capital Structure
Common Stock
The Company is authorized to issue 450,000,000 shares of common stock with a par value of $0.001 per share. As of December 31, 2017 and 2016, the Company had 56,631,647 and 53,363,013 shares of common stock issued and outstanding, respectively.
Holders of the Company's common stock are entitled to dividends, if and when declared by the board of directors. In the event of liquidation, dissolution or winding up, subject to the rights of the holders of any then outstanding shares of preferred stock, holders of common stock will be entitled to receive the assets and funds of the Company that are legally available for distribution.
Preferred Stock
The Company is authorized to designate and issue up to 5,000,000 shares of preferred stock with a par value of $0.001 per share in one or more series without stockholder approval and to fix the rights, preferences, privileges and restrictions thereof. As of December 31, 2017 and 2016, there were no shares of preferred stock issued and outstanding.
Warrants
As of December 31, 2017 and 2016, the Company had outstanding warrants to purchase 13,013 and 131,597 shares of common stock, respectively, with a weighted average exercise price of $5.76 and $9.80 per share, respectively. The warrants outstanding as of December 31, 2017 will expire on October 18, 2023.
83
Common Stock Reserved for Future Issuance
As of December 31, 2017, shares of common stock reserved for future issuance related to outstanding equity awards, warrants, and employee equity incentive plans were as follows (in thousands):
December 31, 2017 | |||
Stock options outstanding | 4,047 | ||
Restricted stock units outstanding | 2,033 | ||
Shares available for future grant under 2014 Plan | 7,300 | ||
Shares available for future issuance under ESPP | 1,371 | ||
Common stock warrants outstanding | 13 | ||
Total shares of common stock reserved | 14,764 | ||
Equity Incentive Plans
Prior to its initial public offering, or IPO, in April 2014, the Company granted stock options under its Amended and Restated 2004 Equity Incentive Plan, as amended, or the 2004 Plan.
Under the terms of the 2004 Plan, the Company had the ability to grant incentive and nonstatutory stock options. Incentive stock options could only be granted to Company employees. Nonstatutory stock options could be granted to Company employees, directors and consultants. Such options are exercisable at prices, as determined by the board of directors, generally equal to the fair value of the Company’s common stock at the date of grant. Options granted to employees generally vest over a four-year period, with an initial vesting period of 12 months for 25% of the shares, and the remaining 75% of the shares vesting monthly on a ratable basis over the remaining 36 months. Options generally expire 10 years after the grant date and are generally exercisable upon vesting. Vested options generally expire 90 days after termination of the optionee’s employment or relationship as a consultant or director, unless otherwise extended by the terms of the stock option agreement.
In March 2014, the Company’s board of directors and stockholders approved the 2014 Equity Incentive Plan, or 2014 Plan, and 5,300,000 shares of common stock were authorized for issuance under the 2014 Plan. In addition, on the first day of each year beginning in 2015 and ending in 2024, the 2014 Plan provides for an annual automatic increase to the shares reserved for issuance in an amount equal to 5% of the total number of shares outstanding on December 31st of the preceding calendar year or a lesser number as determined by the Company’s board of directors. Pursuant to the automatic annual increase, 2,831,582 additional shares were reserved under the 2014 Plan on January 1, 2018.
No further grants were made under the 2004 Plan once the 2014 Plan became effective on April 3, 2014. Upon the effectiveness of the 2014 Plan, all shares reserved for future issuance under the 2004 Plan became available for issuance under the 2014 Plan. Additionally, any forfeited or expired shares that would have otherwise returned to the 2004 Plan instead return to the 2014 Plan.
The 2014 Plan allows the Company to grant stock options, restricted stock units, or RSU, restricted stock awards, performance stock awards, stock appreciation rights, performance cash awards, and other stock awards. To date, the Company has granted stock options and RSUs under the 2014 Plan. Stock options granted under the 2014 Plan are in general at a price equal to the fair market value of the common stock on the date of grant and vest over four years. The Company's stock options expire 10 years from the date of grant. Each RSU granted under the 2014 Plan represents a right to receive one share of the Company’s common stock when the RSU vests. RSUs generally vest over one to four years.
84
Stock Options
A summary of the Company’s stock option activity during the year ended December 31, 2017 is as follows (in thousands, except years and per share data):
Number of Shares | Weighted Average Exercise Price | Weighted Average Remaining Contractual Life (Years) | Aggregate Intrinsic Value (1) | |||||||||
Outstanding as of December 31, 2016 | 5,556 | $ | 5.23 | |||||||||
Options granted | 619 | 18.11 | ||||||||||
Options exercised | (1,986 | ) | 3.04 | |||||||||
Options forfeited or expired | (142 | ) | 12.83 | |||||||||
Outstanding as of December 31, 2017 | 4,047 | $ | 8.00 | 6.4 | 68,334 | |||||||
Vested and expected to vest as of December 31, 2017 | 4,047 | 8.00 | 6.4 | 68,334 | ||||||||
Exercisable as of December 31, 2017 | 2,911 | 6.20 | 5.6 | 54,380 | ||||||||
(1) The aggregate intrinsic value amounts are computed based on the difference between the exercise price of the stock options and the fair market value of the Company’s common stock of $24.88 per share as of December 31, 2017 for all in-the-money stock options outstanding. | ||||||||||||
Following is additional information pertaining to the Company’s stock option activity (in thousands, except per share data):
Year Ended December 31, | ||||||||||||
2017 | 2016 | 2015 | ||||||||||
Weighted average grant date fair value per share of options granted | $ | 8.81 | $ | 4.50 | $ | 2.38 | ||||||
Intrinsic value of options exercised (1) | 33,820 | 5,865 | 3,233 | |||||||||
Total fair value of options vested during the period | 7,296 | 3,813 | 4,824 | |||||||||
Cash received from options exercised | 6,047 | 4,286 | 1,268 | |||||||||
(1) Intrinsic value of options exercised is the difference between the fair market value of the Company’s common stock at the time of exercise and the exercise price paid. | ||||||||||||
Restricted Stock Units
A summary of RSU activity during the year ended December 31, 2017 is as follows (in thousands, except years and per share data):
Number of Shares | Weighted Average Grant Date Fair Value Per Share | ||||||
Outstanding as of December 31, 2016 | 2,019 | $ | 7.65 | ||||
RSUs granted | 1,176 | 18.29 | |||||
RSUs vested and released | (971 | ) | 8.85 | ||||
RSUs forfeited | (191 | ) | 11.42 | ||||
Outstanding as of December 31, 2017 | 2,033 | $ | 12.81 | ||||
85
Following is additional information pertaining to the Company’s RSU activity (in thousands, except per share data):
Year Ended December 31, | ||||||||||||
2017 | 2016 | 2015 | ||||||||||
Weighted average grant date fair value per share of RSUs granted | $ | 18.29 | $ | 9.71 | $ | 5.10 | ||||||
Total fair value of RSUs vested during the period | 21,161 | 10,706 | 2,907 | |||||||||
Employee Stock Purchase Plan
In March 2014, the Company’s board of directors and stockholders adopted the 2014 Employee Stock Purchase Plan, or ESPP, and the shares authorized for issuance thereunder. The ESPP became effective on April 3, 2014.
The ESPP permits eligible employees to purchase shares of the Company’s common stock through payroll deductions with up to 15% of their pre-tax earnings subject to certain Internal Revenue Code limitations. The purchase price of the shares is 85% of the lower of the fair market value of the Company’s common stock on the first day of a six month offering period, except for the initial offering period, or the relevant purchase date. In addition, no participant may purchase more than 1,500 shares of common stock in each purchase period.
The number of shares of common stock originally reserved for issuance under the ESPP was 880,000 shares, which increases automatically each year, beginning on January 1, 2015 and continuing through January 1, 2024, by the lesser of (i) 1% of the total number of shares of our common stock outstanding on December 31 of the preceding calendar year; (ii) 1,000,000 shares of common stock (subject to adjustment to reflect any split or combination of our common stock); or (iii) such lesser number as determined by the Company’s board of directors. Pursuant to the automatic annual increase, 566,316 additional shares were reserved under the ESPP on January 1, 2018.
During 2017, 265,172 shares were purchased by employees under the ESPP at a weighted-average price of $15.47 per share.
Stock-Based Compensation
Stock-based compensation expenses for the years ended December 31, 2017, 2016 and 2015 were as follows (in thousands):
Year Ended December 31, | ||||||||||||
2017 | 2016 | 2015 | ||||||||||
Cost of revenue | $ | 2,202 | $ | 1,375 | $ | 866 | ||||||
Research and development | 3,042 | 2,059 | 1,790 | |||||||||
Sales and marketing | 4,364 | 2,363 | 1,800 | |||||||||
General and administrative (1) | 5,735 | 3,846 | 3,274 | |||||||||
Total stock-based compensation | $ | 15,343 | $ | 9,643 | $ | 7,730 | ||||||
(1) | Effective December 2017, the Company’s former Chief Executive Officer and President resigned from his position and became the Executive Chairman of the Board. Due to this substantive change in status, certain of his stock option and RSU awards were modified which resulted in incremental stock based compensation expense of approximately $1.0 million. |
As of December 31, 2017, unrecognized stock-based compensation expense by award type and their expected weighted-average recognition periods are summarized in the following table (in thousands, except years).
Stock Option | RSU | ESPP | ||||||||||
Unrecognized stock-based compensation expense | $ | 10,703 | $ | 26,401 | $ | 670 | ||||||
Weighted-average amortization period | 2.5 years | 2.8 years | 0.4 years | |||||||||
The Company recognizes stock-based compensation expense that is calculated based upon awards that have vested, reduced for actual forfeitures. All stock-based compensation for equity awards granted to employees and non-employee directors is measured based on the grant date fair value of the award.
86
The Company values RSUs at the closing market price of its common stock on the date of grant. The Company estimates the fair value of each stock option and purchase right under the ESPP granted to employees on the date of grant using the Black-Scholes option-pricing model and using the assumptions disclosed in the table below. Expected volatility is based upon the historical volatility of a peer group of publicly traded companies. The expected term of options granted is estimated using the simplified method by taking the average of the vesting term and the contractual term of the option. The expected volatility assumption for purchase rights under the ESPP is based on the historical volatility of the Company's common stock. The risk-free rate for the expected term of the awards is based on U.S. Treasury zero-coupon issues at the time of grant. The Company has not paid, and does not anticipate paying, cash dividends on its shares of common stock. Accordingly, the expected dividend yield is zero.
The weighted-average assumptions used to value stock options and purchase rights under the ESPP granted during the years ended December 31, 2017, 2016 and 2015 were as follows:
Stock Options | Year Ended December 31, | |||||
2017 | 2016 | 2015 | ||||
Expected term (years) | 5.9 | 5.7 | 6.1 | |||
Volatility | 49% | 46% | 49% | |||
Risk-free interest rate | 2.1% | 1.4% | 1.6% | |||
Dividend yield | — | — | — | |||
ESPP | Granted In | |||||||||||
November 2017 | May 2017 | November 2016 | May 2016 | November 2015 | May 2015 | |||||||
Expected term (years) | 0.5 | 0.5 | 0.5 | 0.5 | 0.5 | 0.5 | ||||||
Volatility | 36% | 43% | 42% | 58% | 54% | 43% | ||||||
Risk-free interest rate | 1.4% | 1.0% | 0.6% | 0.4% | 0.3% | 0.1% | ||||||
Dividend yield | — | — | — | — | — | — | ||||||
8. Net Loss Per Share
Basic net loss per share is calculated by dividing net loss by the weighted average number of shares of common stock outstanding during the period, and excludes any dilutive effects of employee stock-based awards and warrants. Diluted net income per share is computed giving effect to all potentially dilutive common shares, including common stock issuable upon exercise of stock options and warrants and vesting of restricted stock. As the Company had net losses for the years ended December 31, 2017, 2016 and 2015, all potentially issuable common shares were determined to be anti-dilutive.
The following table presents the calculation of basic and diluted net loss per share (in thousands, except per share data).
Year Ended December 31, | ||||||||||||
2017 | 2016 | 2015 | ||||||||||
Net loss | $ | (8,969 | ) | $ | (11,860 | ) | $ | (25,838 | ) | |||
Weighted-average shares used in computing basic and diluted net loss per share | 54,946 | 52,342 | 50,141 | |||||||||
Basic and diluted net loss per share | $ | (0.16 | ) | $ | (0.23 | ) | $ | (0.52 | ) | |||
87
The following securities were excluded from the calculation of diluted net loss per share because their effect would have been anti-dilutive (in thousands).
December 31, | |||||||||
2017 | 2016 | 2015 | |||||||
Stock options | 4,047 | 5,556 | 6,092 | ||||||
Restricted stock units | 2,033 | 2,019 | 1,818 | ||||||
ESPP | — | — | 156 | ||||||
Common stock warrants | 13 | 132 | 191 | ||||||
Total | 6,093 | 7,707 | 8,257 | ||||||
9. Income Taxes
The following table presents components of loss before income taxes for the periods presented (in thousands):
Year Ended December 31, | ||||||||||||
2017 | 2016 | 2015 | ||||||||||
United States | $ | (9,434 | ) | $ | (12,222 | ) | $ | (26,305 | ) | |||
International | 733 | 416 | 528 | |||||||||
Loss before income taxes | $ | (8,701 | ) | $ | (11,806 | ) | $ | (25,777 | ) | |||
Provision for income taxes for the periods presented consisted of (in thousands):
Year Ended December 31, | ||||||||||||
2017 | 2016 | 2015 | ||||||||||
Current: | ||||||||||||
U.S. federal | $ | — | $ | — | $ | — | ||||||
U.S. state | 42 | 16 | 21 | |||||||||
Foreign | 226 | 38 | 40 | |||||||||
Total provision for income taxes | $ | 268 | $ | 54 | $ | 61 | ||||||
Income tax expense differed from the amounts computed by applying the U.S. federal income tax rate of 34% to pre-tax loss for the periods presented as a result of the following (in thousands):
Year Ended December 31, | ||||||||||||
2017 | 2016 | 2015 | ||||||||||
U.S. federal tax at statutory rate | $ | (2,958 | ) | $ | (4,014 | ) | $ | (8,764 | ) | |||
U.S. state income taxes | (708 | ) | 490 | (756 | ) | |||||||
Non-deductible expense (benefit) | (5,673 | ) | 931 | 438 | ||||||||
Research and development credit | (402 | ) | (262 | ) | (440 | ) | ||||||
Stock-based compensation | (14,622 | ) | 983 | 737 | ||||||||
Impact of 2017 Tax Act | 25,952 | — | — | |||||||||
Other | 2 | (104 | ) | 481 | ||||||||
Change in valuation allowance | (1,323 | ) | 2,030 | 8,365 | ||||||||
Total provision for income taxes | $ | 268 | $ | 54 | $ | 61 | ||||||
88
The tax effects of temporary differences that give rise to significant portions of the Company’s deferred tax assets and liabilities as of December 31, 2017 and 2016 related to the following (in thousands):
December 31, | ||||||||
2017 | 2016 | |||||||
Deferred tax assets: | ||||||||
Net operating loss and credit carryforwards | $ | 47,991 | $ | 48,533 | ||||
Accrued liabilities | 3,183 | 3,801 | ||||||
Allowance for doubtful accounts | 416 | 429 | ||||||
Property and equipment | (98 | ) | 183 | |||||
Deferred revenue | 140 | 23 | ||||||
Accrued compensation | 900 | 1,183 | ||||||
Intangibles | 7 | 14 | ||||||
Gross deferred tax assets | 52,539 | 54,166 | ||||||
Valuation allowance | (52,275 | ) | (53,598 | ) | ||||
Net deferred tax assets | 264 | 568 | ||||||
Deferred tax liabilities: | ||||||||
Amortized intangibles | (264 | ) | (568 | ) | ||||
Gross deferred tax liabilities | (264 | ) | (568 | ) | ||||
Net deferred taxes | $ | — | $ | — | ||||
The Company has not provided for U.S. income taxes on undistributed earnings of its foreign subsidiaries because it intends to permanently re-invest those earnings outside the United States. The undistributed earnings of the Company's foreign subsidiaries was zero as of December 31, 2017 due to the one time transition tax, and were $1.2 million and $0.8 million as of December 31, 2016 and 2015, respectively.
A valuation allowance is provided for deferred tax assets where the recoverability of the assets is uncertain. The determination to provide a valuation allowance is dependent upon the assessment of whether it is more likely than not that sufficient future taxable income will be generated to utilize the deferred tax assets. Based on the weight of the available evidence, which includes the Company’s historical operating losses, lack of taxable income, and the accumulated deficit, for the year ended December 31, 2017, the Company has provided a valuation allowance against its U.S. net deferred tax assets. The net change in the valuation allowance for the years ended December 31, 2017 and 2016 was a decrease of $1.3 million and an increase of $2.0 million, respectively.
As of December 31, 2017, the Company had net operating loss carry-forwards for federal and state income tax purposes of $188.8 million and $104.4 million, respectively, available to reduce future income subject to income taxes. If not utilized, these carryforwards will begin to expire in 2024 for federal purposes. The state net operating loss started to expire in 2017. As of December 31, 2017, the Company also had research credit carryforwards for federal and California state tax purposes of $2.8 million and $2.4 million. If not utilized, the federal research credit carryforwards will begin to expire in 2022. The California state research credits can be carried forward indefinitely. The Internal Revenue Code (“IRC”) of 1986, as amended, imposes restrictions on the utilization of net operating losses in the event of an “ownership change” of a corporation. Accordingly, a company’s ability to use net operating losses may be limited as prescribed under the IRC Section 382. Events which may cause limitations in the amount of the net operating losses that the Company may use in any one year include, but are not limited to, a cumulative ownership change of more than 50% over a three-year period. Utilization of the federal and state net operating losses may be subject to substantial annual limitation due to the ownership change limitations provided by the IRC Section 382 and similar state provisions. In the event the Company has changes in ownership, net operating losses and research and development credit carryforwards, which are fully reserved by the deferred tax asset valuation allowance, could be limited and may expire unutilized.
89
Unrecognized Tax Benefits
The table below shows the changes in the gross amount of unrecognized tax benefits for the periods presented (in thousands):
Year Ended December 31, | ||||||||||||
2017 | 2016 | 2015 | ||||||||||
Unrecognized benefit — beginning of period | $ | 2,805 | $ | 2,485 | $ | 1,975 | ||||||
Gross increases — current year tax positions | 310 | 324 | 522 | |||||||||
Gross decreases — prior year tax positions | — | (4 | ) | (12 | ) | |||||||
Unrecognized benefit — end of period | $ | 3,115 | $ | 2,805 | $ | 2,485 | ||||||
As of December 31, 2017 and 2016, an immaterial amount of the total unrecognized tax benefits, if recognized, would have an impact on the Company’s effective tax rate. The Company recognizes interest and penalties related to uncertain tax positions as income tax expense. The Company does not anticipate its total unrecognized tax benefits as of December 31, 2017 will significantly change due to settlement of examination or the expiration of statute of limitations during the next 12 months. The Company is currently unaware of any uncertain tax positions that could result in significant additional payments, accruals or other material deviation in this estimate over the next 12 months.
The Company is subject to taxation in the United States, various states and several foreign jurisdictions. Due to the Company’s net carryover of unused operating losses, all years from 2001 forward remain subject to future examination by the U.S. federal and state tax authorities. The Company’s foreign tax returns are open to audit under the statutes of limitations of the respective foreign countries in which the subsidiaries are located. The Company considers all undistributed earnings of its foreign subsidiaries indefinitely reinvested.
Tax Reform
In December 2017, President Trump signed into law new legislation (the “2017 Tax Act”) that significantly revises the Internal Revenue Code of 1986, as amended. The newly enacted federal income tax law, among other things, contains significant changes to corporate taxation, including reduction of the corporate tax rate from a top marginal rate of 35% to a flat rate of 21%, limitation of the tax deduction for interest expense to 30% of adjusted earnings, limitation of the deduction for newly generated net operating losses to 80% of current year taxable income and elimination of net operating loss carrybacks, one time taxation of offshore earnings at reduced rates regardless of whether they are repatriated (the “Transition Tax”), future taxation of certain classes of offshore earnings regardless of whether they are repatriated, immediate deductions for certain new investments instead of deductions for depreciation expense over time, and modifying or repealing many business deductions and credits beginning in 2018.
In December 2017, the SEC issued Staff Accounting Bulletin No. 118 which provided a measurement period of up to one year from the enactment of the 2017 Tax Act for companies to complete the accounting for the 2017 Tax Act and its related impacts. The income tax effects of the 2017 Tax Act for which the accounting is incomplete include: the impact of the Transition Tax, whether to continue applying the exception to the presumption of the repatriation of foreign earnings and the impact of the reversal of the exception, the revaluation of deferred tax assets and liabilities to reflect the 21 percent corporate tax rate, the realizability of deferred tax assets relating to executive compensation, whether to elect to expense or depreciate new capital equipment, the US states tax impact to the aforementioned items, and the unrecognized tax benefits relating to the aforementioned items. The company has made reasonable estimates for each of these items; however it may be affected by other analyses related to the 2017 Tax Act, including but not limited to, any deferred adjustments related to the filing of the Company’s 2017 federal and state tax returns and further guidance yet to be issued.
The Transition Tax is estimated to have no impact on the Company’s US taxable income for the year ended December 31, 2017.
Principally because the 2017 Tax Act has now applied a tax on accumulated foreign earnings through December 31, 2017, the Company is evaluating whether to continue applying the exception to the presumption of the repatriation of foreign earnings. The Company has not provided for an estimate of the taxes associated with the reversal of the application of the exception. Although the historic foreign earnings have been taxed by the 2017 Tax Act for Federal and conforming states purposes, the impact of the reversal of the exception will also apply to US
90
states which do not conform to the 2017 Tax Act, to foreign withholding taxes, and to foreign income taxes for repatriation of earnings from lower-tier foreign subsidiaries to higher-tier foreign subsidiaries. The Company is analyzing the optimal use of its US state attributes, foreign tax law regarding income recognition of distributions, as well as foreign corporation law relating to distributable foreign earnings.
Reduction of U.S. federal corporate tax rate: As a result of the 2017 Tax Act, the corporate tax rate decreased from 35% to 21% effective January 1, 2018. Accordingly, the Company’s deferred tax assets decreased by $26.0 million, fully offset by a decrease in the valuation allowance. For its deferred tax assets and liabilities, the Company recorded no provisional net decrease with no corresponding net adjustment to deferred income tax expense for the year ended December 31, 2017 due to a full valuation allowance. While the Company was able to make a reasonable estimate of the impact of the reduction in corporate rate, such estimates may be affected by other analyses related to the 2017 Tax Act, including, but not limited to, any deferred adjustments related to the filing of the Company's 2017 federal and state tax returns and the Company's calculation of the state tax effect of adjustments made to federal temporary differences.
Section 162(m): The Company's accounting for the changes to share-based payment awards and Section 162(m) of the 2017 Tax Act is incomplete, and the Company was not yet able to make reasonable estimates of the effects because the relevant regulations have yet to be issued. Therefore, no provisional adjustments were recorded.
In addition, the Company recorded no reduction to deferred tax asset related to the write-off of prior years’ post-vesting cancellations of non-qualified stock options as of fiscal year ended December 31, 2017.
The Company does not expect to have an impact from the implementation of certain limitations on executive stock-based compensation under the 2017 Tax Act.
Cost Recovery: While the Company has not yet completed all of the computations necessary or completed an inventory of its 2017 expenditures that qualify for immediate expensing, the Company has recorded no current benefit related to cost recovery due to domestic losses.
For the year ended December 31, 2017, the enactment of the 2017 Tax Act had no impact on the Company’s total income tax benefit and pretax income due to its full valuation allowance.
10. Commitments and Contingencies
Leases
The Company has operating lease agreements for offices, research and development, and sales and marketing facilities that expire at various dates through 2021. The Company recognizes rent expense on a straight-line basis over the lease term and records the difference between cash rent payments and the recognized rent expense as a deferred rent liability. Rent expense was $2.6 million, $2.1 million and $2.0 million for the years ended December 31, 2017, 2016 and 2015, respectively.
The Company enters into capital leases to finance data center and other computer and networking equipment.
As of December 31, 2017, approximate remaining future minimum lease payments under non-cancelable leases were as follows (in thousands):
Year Ending December 31, | Capital Leases | Operating Leases | ||||||
2018 | $ | 7,770 | $ | 2,750 | ||||
2019 | 5,564 | 2,747 | ||||||
2020 | 2,244 | 2,630 | ||||||
2021 | — | 654 | ||||||
Total future minimum lease payment | $ | 15,578 | $ | 8,781 | ||||
Less — amount representing interest | (1,766 | ) | ||||||
Present value of total capital lease obligation | $ | 13,812 | ||||||
Capital lease obligation — current portion | 6,651 | |||||||
Capital lease obligation — net of current portion | 7,161 | |||||||
91
Hosting, Telecommunication Usage and Maintenance Services
The Company has agreements with third parties to provide co-location hosting and telecommunication usage services. The agreements require payments per month for a fixed period of time in exchange for certain guarantees of network and telecommunication availability. The Company is also committed to make future payments under maintenance service contracts for certain data center equipment.
As of December 31, 2017, future minimum payments under these arrangements were as follows (in thousands):
Year Ending December 31, | Hosting Services | Telecommunication Usage Services | Equipment Maintenance Services | |||||||||
2018 | $ | 855 | $ | 2,355 | $ | 426 | ||||||
2019 | 36 | 1,505 | 93 | |||||||||
2020 | 23 | 90 | 17 | |||||||||
Total future minimum payment | $ | 914 | $ | 3,950 | $ | 536 | ||||||
Universal Services Fund Liability
During the third quarter of 2012, the Company determined that based on its business activities, it is classified as a telecommunications service provider for regulatory purposes and it should make direct contributions to the federal USF and related funds based on revenues it receives from the resale of interstate and international telecommunications services. In order to comply with the obligation to make direct contributions, the Company made a voluntary self-disclosure to the FCC Enforcement Bureau and registered with the USAC, which is charged by the FCC with administering the USF. The Company filed exemption certificates with its wholesale telecommunications service providers in order to eliminate its obligation to reimburse such wholesale telecommunications service providers for their USF contributions calculated on services sold to the Company. In April 2013, the Company began remitting required contributions on a prospective basis directly to USAC.
The Company’s registration with USAC subjects it to assessments for unpaid USF contributions, as well as interest thereon and civil penalties, due to its late registration and past failure to recognize its obligation as a USF contributor and as an international carrier. The Company is required to pay assessments for periods prior to the Company’s registration. As of December 31, 2012, the total past due USF contribution being imposed by USAC and accrued by the Company for the period from 2003 through 2012 was $8.1 million, of which $4.7 million was undisputed and $3.4 million was disputed. The Company subsequently updated its filings and increased the liability related to 2008 through 2012 by $0.5 million, arriving at a new total of $3.9 million in disputed liability. In July 2013, the Company and USAC agreed to a financing arrangement for $4.1 million of the undisputed $4.7 million of the unpaid USF contributions whereby the Company issued to USAC a promissory note payable in the principal amount of the $4.1 million and paid off the remaining undisputed $0.6 million. The Company fully paid the promissory note as of January 2017.
In January 2017, the FCC’s Wireline Competition Bureau ruled in the Company's favor with respect to most of the disputed amount. In September 2017, USAC issued a credit to the Company reflecting the FCC's ruling for the $3.1 million of the $3.9 million in disputed liability. In addition, USAC reversed the interest and penalties related to the disputed liability of $3.1 million. The remaining $0.8 million in dispute involves USAC’s assessment of liability for the period of 2003 through 2007, which was prior to the five year window during which the Company was required to maintain financial records for USF contribution purposes. The Company filed a Request for Review (a form of appeal) of this disputed amount with the FCC's Wireline Competition Bureau in 2013, which remains pending. If the Request for Review is not resolved in the Company’s favor, it is possible that the Company will be held to the back assessments of $0.8 million, which includes interest and penalties on that amount.
As of December 31, 2017, the accrued liability on the remaining disputed assessments, including interest and penalties for the period of 2003 through 2007, was $0.8 million offset by $0.7 million in other USF credits.
State and Local Taxes and Surcharges
In April 2012, the Company commenced collecting and remitting sales taxes on sales of subscription services in all the U.S. states in which it determined it was obligated to do so. During the first quarter of 2015, the Company conducted an updated sales tax review of the taxability of sales of its subscription services. As a result, the Company determined that it may be obligated to collect and remit sales taxes on such sales in four additional states. Based on
92
its best estimate of the probable sales tax liability in those four states relating to its sales of subscription services during the period 2011 through 2014, during the three months ended March 31, 2015, the Company recorded a general and administrative expense of $0.6 million to accrue for such taxes.
During 2013, the Company analyzed its activities and determined it may be obligated to collect and remit various state and local taxes and surcharges on its usage-based fees. The Company had not remitted state and local taxes on usage-based fees in any of the periods prior to 2014 and therefore accrued a sales tax liability for this contingency. In January 2014, the Company commenced paying such taxes and surcharges to certain state authorities. In June 2014, the Company commenced collecting state and local taxes or surcharges on usage-based fees from its clients on a current basis and remitting such taxes to the applicable U.S. state taxing authorities.
During 2017, 2016 and 2015, the Company remitted zero, $0.3 million and $1.1 million, respectively, for contingent sales taxes on both usage-based fees and sales of subscription services. For the years ended December 31, 2017, 2016 and 2015, the Company recognized a gain of $0.6 million, a gain of $0.4 million, and an expense of $1.2 million, respectively, as an adjustment to general and administrative expense related to its estimated sales tax liability on both usage-based fees and sales of subscription services in the U.S. and Canada, which was not being collected from its clients.
As of December 31, 2017 and 2016, the Company had total accrued liabilities of $1.5 million and $2.1 million, respectively, for such contingent sales taxes and surcharges that were not being collected from its clients but may be imposed by various taxing authorities, of which $0.4 million and $0.6 million, respectively, were included in current “Sales tax liability” on the consolidated balance sheets, and the remaining were included in non-current “Sales tax liability” on the consolidated balance sheets. The Company’s estimate of the probable loss incurred under this contingency is based on its analysis of the source location of its usage-based fees and the regulations and rules in each tax jurisdiction.
Legal Matters
The Company is involved in various legal and regulatory matters arising in the normal course of business. In management’s opinion, resolution of these matters is not expected to have a material impact on the Company’s consolidated results of operations, cash flows, or its financial position. However, due to the uncertain nature of legal matters, an unfavorable resolution of a matter could materially affect the Company’s future consolidated results of operations, cash flows or financial position in a particular period. The Company expenses legal fees as incurred.
The Company is currently involved in the following lawsuits as a defendant.
Melcher Litigation
On September 28, 2016, a complaint was filed in the United States District Court for the Southern District of California against Five9, Inc., or Five9, as the successor in interest to Face It, Corp., or Face It, and Lance Fried, a former Five9 employee who was the former Chief Executive Officer of Face It. The action, captioned Melcher, et al. v. Five9, Inc., et al., No. 16-cv-02440, or the Melcher Litigation, was filed as a direct action by Carl Melcher, or Melcher, a purported former stockholder of Face It, and his related investment entity Melcher Family Limited Partnership, or MFLP.
In the complaint, the plaintiffs alleged that Face It repurchased the plaintiffs’ stock in September 2013 before Five9 acquired Face It, and that in connection with the repurchase, Fried made material misstatements or omissions to Melcher, by failing to disclose that Face It allegedly was in concurrent discussions about a potential sale of the company to Five9. The complaint alleged violations of Sections 10(b) and 20(a) of the Securities Exchange Act of 1934 and Rule 10b-5 promulgated thereunder, as well as various claims under state law and common law. The complaint sought to set aside Face It’s September 2013 stock repurchase from the plaintiffs, as well as an unspecified amount of damages and an award of attorney’s fees and costs, in addition to other relief.
On November 8, 2016, the court entered an order staying the lawsuit and ordered the parties to proceed to arbitration of the dispute before the American Arbitration Association, or AAA. On November 16, 2016, Melcher and MFLP submitted a Demand for Arbitration to AAA against Five9, asserting claims identical to those alleged in the lawsuit.
On March 31, 2017, Five9 reached a settlement with the plaintiffs that fully resolved the plaintiffs’ claims against Five9 and provided for mutual releases between the plaintiffs and Five9 in exchange for a one-time payment by Five9 to the plaintiffs of $1.7 million. As a result of the settlement, the AAA arbitration was concluded, and on
93
July 10, 2017 the plaintiffs filed an amended complaint in the Melcher Litigation solely against Fried, removing Five9 as a defendant.
NobelBiz Litigation
On August 5, 2011, NobelBiz sent a letter to the Company asserting infringement of a patent related to virtual call centers. On April 3, 2012, NobelBiz filed a patent infringement lawsuit against the Company in the United States District Court for the Eastern District of Texas. The patent asserted in the complaint is different, but related, to the patent asserted in the original letter. The lawsuit, NobelBiz Inc. v. Five9, Inc., Case No. 6:12-cv-00243-LED, alleged that the Company’s local caller ID management service infringed United States Patent No. 8135122, or the ‘122 patent. The ‘122 patent, titled “System and Method for Modifying Communication Information (MCI),” issued on March 13, 2012, and according to the complaint is alleged to relate to “a system for processing a telephone call from a call originator (also referred to as a calling party) to a call target (also referred to as a receiving party), where the system accesses a database storing outgoing telephone numbers, selects a replacement telephone number from the outgoing telephone numbers based on the telephone number of the call target, and originates an outbound call to the call target with a modified outgoing caller identification (‘caller ID’).” NobelBiz sought damages in the form of lost profits as well as injunctive relief. On March 28, 2013, the court granted the Company’s motion to transfer the case to the United States District Court for the Northern District of California. Subsequently, NobelBiz amended its complaint to add claims related to U.S. Patent No. 8565399, or the ‘399 patent, which is a continuation in the same family as the ‘122 patent and addresses the same technology. The Company responded to the complaint and amended complaint by asserting noninfringement and invalidity of the ‘122 and ‘399 patents. On January 16, 2015, the court issued an order regarding claim construction of the two patents-in-suit. On March 7, 2016, the court stayed the case pending an appeal in lawsuits involving NobelBiz, Global Connect and TCN that also involve the ‘122 and ‘399 patents. On July 19, 2017, the Federal Circuit Court of Appeal issued a ruling confirming the claim construction in Five9’s lawsuit and resolving the appeal in favor of Global Connect and TCN and against NobelBiz. Subsequently, the district court set a new schedule for the litigation in light of this ruling with motions for summary judgment set to occur in 2018.
Subsequently, Five9 was able to settle all claims with NobelBiz that includes a license to the ‘122 patent, the ‘399 patent, and all other patents in the same patent family. On December 4, 2017, the parties filed a joint notice of settlement and request for dismissal of the lawsuit in its entirety. On December 6, 2017, the Court issued an order dismissing the case.
Indemnification Agreements
In the ordinary course of business, the Company enters into agreements of varying scope and terms pursuant to which it agrees to indemnify clients, vendors, lessors, business partners and other parties with respect to certain matters, including, but not limited to, losses arising out of breach of such agreements, services to be provided by the Company or from intellectual property infringement claims made by third parties. In addition, the Company has entered into indemnification agreements with its directors and certain officers and employees that will require it, among other things, to indemnify them against certain liabilities that may arise by reason of their status or service as directors, officers or employees. Other than as described below, there are no claims that it is aware of that could have a material effect on the consolidated balance sheet, consolidated statement of operations and comprehensive loss, or consolidated statements of cash flows.
On October 27, 2016, the Company received notice from Lance Fried, a former officer and director of Face It, of his claim for indemnification by the Company (as successor in interest to Face It), and for advancement of all legal fees and expenses he incurs in connection with the defense of the Melcher litigation. See "Legal Matters" above. As of May 31, 2017, the Company had advanced Mr. Fried $62 thousand in connection with this claim. However, the Company disputes that Mr. Fried is entitled to advancement in connection with the Melcher litigation. On July 31, 2017, Mr. Fried filed a complaint against the Company in the Court of Chancery for the State of Delaware, in which he alleges that the Company breached advancement obligations to him. In the lawsuit, Mr. Fried seeks advancement of his legal fees and expenses in connection with the defense of the Melcher litigation, payment of his legal fees and expenses incurred in connection with his advancement action, and interest. The Company believes the action is without merit and is defending against it vigorously. On December 7, 2017, the Delaware Chancery Court stayed Mr. Fried’s advancement lawsuit, in favor of arbitration. On January 9, 2018, the Company received Mr. Fried’s demand for arbitration against the Company with respect to the same matter. Regardless of the outcome of Mr. Fried’s advancement action against the Company, Mr. Fried is required to reimburse the Company for any amounts advanced to him if it is ultimately determined that Mr. Fried is not entitled to indemnification in
94
connection with the Melcher litigation. In addition, the Company believes that it has indemnification rights against the former stockholders of Face It (including Mr. Fried) for all losses that are incurred by the Company in connection with the Melcher litigation, including without limitation, amounts incurred to indemnify or advance the legal fees and expenses of Mr. Fried pursuant to his indemnification claim against the Company.
11. Geographical Information
The following table is a summary of revenues by geographic region based on client billing address and has been estimated based on the amounts billed to clients during the periods (in thousands).
Year Ended December 31, | ||||||||||||
2017 | 2016 | 2015 | ||||||||||
United States | $ | 188,303 | $ | 151,484 | $ | 120,037 | ||||||
International | 11,922 | 10,606 | 8,831 | |||||||||
Total revenue | $ | 200,225 | $ | 162,090 | $ | 128,868 | ||||||
The following table summarizes total property and equipment, net in the respective locations (in thousands).
December 31, | ||||||||||||
2017 | 2016 | 2015 | ||||||||||
United States | $ | 17,949 | $ | 13,025 | $ | 10,939 | ||||||
International | 1,939 | 1,663 | 2,286 | |||||||||
Property and equipment, net | $ | 19,888 | $ | 14,688 | $ | 13,225 | ||||||
12. Retirement Plans
The Company has a 401(k) plan to provide tax deferred salary deductions for all eligible employees. Participants may make voluntary contributions to the 401(k) plan, limited by certain Internal Revenue Service restrictions. The Company is responsible for the administrative costs of the 401(k) plan. The Company does not match employee contributions.
The Company complies with the requirement of maintaining a retirement plan for employees in the Philippines. This plan is a non-contributory and defined benefit type that provides retirement to employees equal to approximately one month salary for every year of credited service for employees who attain the normal retirement of age of 60 with at least five years of service. The benefits are paid in a lump sum amount upon retirement from the Company. Total defined benefit liability was $0.5 million and $0.4 million as of December 31, 2017 and 2016, respectively. Total retirement expense for this plan was $0.3 million, $0.1 million, and $0.1 million for fiscal years 2017, 2016, and 2015, respectively.
95
13. Selected Quarterly Financial Data (Unaudited)
Selected quarterly financial information for 2017 and 2016 is as follows:
Quarter Ended | ||||||||||||||||||||||||||||||||
Dec. 31, 2017 | Sept. 30, 2017 | Jun. 30, 2017 | Mar. 31, 2017 | Dec. 31, 2016 | Sept. 30, 2016 | Jun. 30, 2016 | Mar. 31, 2016 | |||||||||||||||||||||||||
(unaudited, in thousands, except per share data) | ||||||||||||||||||||||||||||||||
Revenue | $ | 55,403 | $ | 50,081 | $ | 47,727 | $ | 47,014 | $ | 44,207 | $ | 40,982 | $ | 38,886 | $ | 38,015 | ||||||||||||||||
Cost of revenue (1)(2) | 22,363 | 20,497 | 20,273 | 19,971 | 15,770 | 17,790 | 16,764 | 16,610 | ||||||||||||||||||||||||
Gross profit | 33,040 | 29,584 | 27,454 | 27,043 | 28,437 | 23,192 | 22,122 | 21,405 | ||||||||||||||||||||||||
Operating expenses: | ||||||||||||||||||||||||||||||||
Research and development (1)(2) | 6,748 | 6,689 | 6,836 | 6,847 | 6,236 | 6,041 | 5,799 | 5,802 | ||||||||||||||||||||||||
Sales and marketing (1)(2) | 17,358 | 16,502 | 16,932 | 15,778 | 14,480 | 12,925 | 12,637 | 12,706 | ||||||||||||||||||||||||
General and administrative (1)(2) | 8,767 | 4,679 | 6,845 | 8,860 | 6,511 | 6,143 | 5,882 | 6,536 | ||||||||||||||||||||||||
Total operating expenses | 32,873 | 27,870 | 30,613 | 31,485 | 27,227 | 25,109 | 24,318 | 25,044 | ||||||||||||||||||||||||
Loss from operations | 167 | 1,714 | (3,159 | ) | (4,442 | ) | 1,210 | (1,917 | ) | (2,196 | ) | (3,639 | ) | |||||||||||||||||||
Other income (expense), net: | ||||||||||||||||||||||||||||||||
Extinguishment of debt | — | — | — | — | — | (1,026 | ) | — | — | |||||||||||||||||||||||
Interest expense | (836 | ) | (865 | ) | (888 | ) | (882 | ) | (869 | ) | (961 | ) | (1,197 | ) | (1,199 | ) | ||||||||||||||||
Interest income and other | 164 | 118 | 90 | 118 | 54 | 12 | (33 | ) | (45 | ) | ||||||||||||||||||||||
Total other income (expense), net | (672 | ) | (747 | ) | (798 | ) | (764 | ) | (815 | ) | (1,975 | ) | (1,230 | ) | (1,244 | ) | ||||||||||||||||
Income (loss) before income taxes | (505 | ) | 967 | (3,957 | ) | (5,206 | ) | 395 | (3,892 | ) | (3,426 | ) | (4,883 | ) | ||||||||||||||||||
Provision for (benefit from) income taxes | 126 | 43 | 50 | 49 | (14 | ) | (2 | ) | 42 | 28 | ||||||||||||||||||||||
Net income (loss) | $ | (631 | ) | $ | 924 | $ | (4,007 | ) | $ | (5,255 | ) | $ | 409 | $ | (3,890 | ) | $ | (3,468 | ) | $ | (4,911 | ) | ||||||||||
Net income (loss) per share: | ||||||||||||||||||||||||||||||||
Basic | $ | (0.01 | ) | $ | 0.02 | $ | (0.07 | ) | $ | (0.10 | ) | $ | 0.01 | $ | (0.07 | ) | $ | (0.07 | ) | $ | (0.10 | ) | ||||||||||
Diluted | $ | (0.01 | ) | $ | 0.02 | $ | (0.07 | ) | $ | (0.10 | ) | $ | 0.01 | $ | (0.07 | ) | $ | (0.07 | ) | $ | (0.10 | ) | ||||||||||
Shares used in computing net loss per share: | ||||||||||||||||||||||||||||||||
Basic | 56,034 | 55,310 | 54,723 | 53,688 | 53,126 | 52,708 | 52,143 | 51,377 | ||||||||||||||||||||||||
Diluted | 56,034 | 59,441 | 54,723 | 53,688 | 56,633 | 52,708 | 52,143 | 51,377 | ||||||||||||||||||||||||
(1) Included stock-based compensation as follows:
Quarter Ended | ||||||||||||||||||||||||||||||||
Dec. 31, 2017 | Sept. 30, 2017 | Jun. 30, 2017 | Mar. 31, 2017 | Dec. 31, 2016 | Sept. 30, 2016 | Jun. 30, 2016 | Mar. 31, 2016 | |||||||||||||||||||||||||
(unaudited, in thousands) | ||||||||||||||||||||||||||||||||
Cost of revenue | $ | 594 | $ | 599 | $ | 575 | $ | 434 | $ | 424 | $ | 357 | $ | 329 | $ | 265 | ||||||||||||||||
Research and development | 807 | 797 | 801 | 637 | 549 | 547 | 528 | 435 | ||||||||||||||||||||||||
Sales and marketing | 1,128 | 1,084 | 1,224 | 928 | 759 | 626 | 544 | 434 | ||||||||||||||||||||||||
General and administrative | 2,111 | 1,240 | 1,254 | 1,130 | 984 | 989 | 1,013 | 860 | ||||||||||||||||||||||||
Total stock-based compensation | $ | 4,640 | $ | 3,720 | $ | 3,854 | $ | 3,129 | $ | 2,716 | $ | 2,519 | $ | 2,414 | $ | 1,994 | ||||||||||||||||
96
(2) Included depreciation and amortization expenses as follows:
Quarter Ended | ||||||||||||||||||||||||||||||||
Dec. 31, 2017 | Sept. 30, 2017 | Jun. 30, 2017 | Mar. 31, 2017 | Dec. 31, 2016 | Sept. 30, 2016 | Jun. 30, 2016 | Mar. 31, 2016 | |||||||||||||||||||||||||
(unaudited, in thousands) | ||||||||||||||||||||||||||||||||
Cost of revenue | $ | 1,611 | $ | 1,397 | $ | 1,716 | $ | 1,576 | $ | 1,608 | $ | 1,668 | $ | 1,616 | $ | 1,680 | ||||||||||||||||
Research and development | 170 | 182 | 237 | 206 | 224 | 204 | 161 | 148 | ||||||||||||||||||||||||
Sales and marketing | 30 | 30 | 30 | 30 | 58 | 56 | 54 | 53 | ||||||||||||||||||||||||
General and administrative | 257 | 272 | 287 | 283 | 196 | 212 | 229 | 222 | ||||||||||||||||||||||||
Total depreciation and amortization | $ | 2,068 | $ | 1,881 | $ | 2,270 | $ | 2,095 | $ | 2,086 | $ | 2,140 | $ | 2,060 | $ | 2,103 | ||||||||||||||||
14. Subsequent Event
In February 2018, the Company entered into an agreement to convert the outstanding notes receivable of Euro 1.1 million to common shares in the investee company prior to the investee company’s acquisition.
ITEM 9. Changes in and Disagreements with Accountants on Accounting and Financial Disclosure
None.
ITEM 9A. Controls and Procedures
Evaluation of Disclosure Controls and Procedures
Under the supervision and with the participation of our management, including our Interim Chief Executive Officer and Chief Financial Officer, we conducted an evaluation of the effectiveness of our disclosure controls and procedures, as defined in Rules 13a-15(e) and 15d-15(e) under the Exchange Act, as of December 31, 2017.
Based on management’s evaluation, our Interim Chief Executive Officer and Chief Financial Officer concluded that, as of December 31, 2017, our disclosure controls and procedures were designed, and were effective, to provide assurance at a reasonable level that the information we are required to disclose in reports that we file or submit under the Exchange Act is recorded, processed, summarized and reported within the time periods specified in the SEC rules and forms, and that such information is accumulated and communicated to our management as appropriate to allow timely decisions regarding required disclosures.
In designing and evaluating our disclosure controls and procedures, management recognizes that any disclosure controls and procedures, no matter how well designed and operated, can provide only reasonable assurance of achieving the desired control objectives. In addition, the design of disclosure controls and procedures must reflect the fact that there are resource constraints and that management is required to apply its judgment in evaluating the benefits of possible controls and procedures relative to their costs.
Management’s Annual Report on Internal Control Over Financial Reporting
Our management is responsible for establishing and maintaining adequate internal control over financial reporting (as defined in Rule 13a-15(f) and 15d-15(f) under the Exchange Act). Our management conducted an assessment of the effectiveness of our internal control over financial reporting as of December 31, 2017 based on the criteria set forth in the 2013 Internal Control-Integrated Framework issued by the Committee of Sponsoring Organizations of the Treadway Commission. Based on the assessment, our management has concluded that our internal control over financial reporting was effective as of December 31, 2017 to provide reasonable assurance regarding the reliability of financial reporting and the preparation of financial statements in accordance with U.S. GAAP.
Changes in Internal Control over Financial Reporting
During the three months ended December 31, 2017, there was no change in our internal control over financial reporting that has materially affected, or is reasonably likely to materially affect, our internal control over financial reporting.
97
ITEM 9B. Other Information
None.
98
PART III
ITEM 10. Directors, Executive Officers and Corporate Governance
The information concerning our directors, compliance with Section 16(a) of the Exchange Act, our Audit Committee and any changes to the process by which stockholders may recommend nominees to the Board required by this Item are incorporated herein by reference to information contained in our Proxy Statement for the 2018 Annual Meeting of Stockholders to be filed with the SEC within 120 days of the year ended December 31, 2017, or 2018 Proxy Statement, including “Proposal No 1. — Election of Directors”, “Corporate Governance” and “Section 16(a) Beneficial Ownership Reporting Compliance.”
The information concerning our executive officers required by this Item is incorporated herein by reference to information contained in the 2018 Proxy Statement including “Executive Officers.”
We have adopted a code of conduct that applies to all employees, including our principal executive officers, our principal financial officer, and all other executive officers. Our code of conduct is available on our website at http://investors.five9.com/corporate-governance.cfm. We plan to post on our website at the address described above any future amendments or waivers of our Code of Conduct.
ITEM 11. Executive Compensation
The information required by this Item is incorporated herein by reference to information contained in the 2018 Proxy Statement, including “Corporate Governance”, “Executive Compensation” and “Compensation of Directors.”
ITEM 12. Security Ownership of Certain Beneficial Owners and Management and Related Stockholder Matters
The information required by this Item is incorporated herein by reference to information contained in the 2018 Proxy Statement, including “Security Ownership of Certain Beneficial Owners and Management” and “Equity Compensation Plan Information.”
ITEM 13. Certain Relationships and Related Transactions, and Director Independence
The information required by this Item is incorporated herein by reference to information contained in the 2018 Proxy Statement, including “Corporate Governance” and “Transactions With Related Persons.”
ITEM 14. Principal Accountant Fees and Services
The information required by this Item is incorporated herein by reference to information contained in the 2018 Proxy Statement, including “Proposal No. 4 — Ratification of Appointment of Independent Registered Public Accounting Firm.”
99
PART IV
ITEM 15. Exhibits and Financial Statement Schedules
(a) The following documents are filed as part of this Report:
1. Consolidated Financial Statements
The consolidated financial statements of Five9 and the report of independent registered public accounting firm thereon are set forth under Part II, Item 8 of this report.
2. Consolidated Financial Statement Schedules
The Financial Statement Schedules not listed have been omitted because the information required to be set forth herein is included in ITEM 8 — Financial Statements and Supplementary Data or they are not applicable or are not required.
3. Exhibits.
The following exhibits are filed with or incorporated by reference in this report. Where such filing is made by incorporation by reference to a previously filed registration statement or report, such registration statement or report is identified in parentheses.
Exhibit Index | ||
Exhibit Number | Description | |
3.1Ø | Amended and Restated Certificate of Incorporation of Five9, Inc. (filed as Exhibit 3.2 to the Company’s Current Report on Form 8-K filed with the SEC on April 10, 2014 (File No. 001-36383) and incorporated by reference herein). | |
3.2Ø | Amended and Restated Bylaws of Five9, Inc. (filed as Exhibit 3.1 to the Company’s Current Report on Form 8-K filed with the SEC on April 10, 2014 (File No. 001-36383) and incorporated by reference herein). | |
4.1Ø | Form of Common Stock Certificate (filed as Exhibit 4.1 to Amendment No.1 to the Company’s Registration Statement on Form S-1 filed with the SEC on March 24, 2014 (File No. 333-194258) and incorporated by reference herein). | |
4.2Ø | Eighth Amended and Restated Stockholders’ Agreement, dated October 28, 2013, among the Registrant and certain holders of its capital stock, as amended by the First Amendment dated December 20, 2013 and the Second Amendment dated December 30, 2013 (filed as Exhibit 4.2 to Amendment No. 1 to the Company’s Registration Statement on Form S-1 filed with the SEC on March 24, 2014 (File No. 333-194258) and incorporated by reference herein). | |
4.3Ø | Joinder to the Eighth Amended and Restated Stockholders’ Agreement, dated April 1, 2014 (filed as Exhibit 4.2 to the Company’s Quarterly Report on Form 10-Q filed with the SEC on May 14, 2014 (File No. 001-36383) and incorporated by reference herein). | |
4.4Ø | Third Amendment to Eighth Amended and Restated Stockholders’ Agreement, dated April 15, 2014 (filed as Exhibit 4.3 to the Company’s Quarterly Report on Form 10-Q filed with the SEC on May 14, 2014 (File No. 001-36383) and incorporated by reference herein). | |
4.5Ø | Warrant to purchase shares of series D-2 preferred stock issued to City National Bank (filed as Exhibit 4.4 to the Company’s Registration Statement on Form S-1 filed with the SEC on March 3, 2014 (File No. 333-194258) and incorporated by reference herein). | |
100
Exhibit Index | ||
Exhibit Number | Description | |
4.6Ø | Form of Warrant to purchase shares of common stock (filed as Exhibit 4.5 to the Company’s Registration Statement on Form S-1 filed with the SEC on March 3, 2014 (File No. 333-194258) and incorporated by reference herein). | |
4.7Ø | Form of Warrant to purchase shares of common stock issued to Fifth Street Finance Corp. and Fifth Street Mezzanine Partners V, L.P. (filed as Exhibit 4.6 to the Company’s Registration Statement on Form S-1 filed with the SEC on March 3, 2014 (File No. 333-194258) and incorporated by reference herein). | |
10.1+Ø | Independent Contractor Agreement between the Registrant and Michael Burkland (filed as Exhibit 10.1 to the Company’s Quarterly Report on Form 10-Q filed with the SEC on November 8, 2018 (File No. 001-36383) and incorporated by referenced herein). | |
10.2+Ø | Form of Indemnification Agreement between the Registrant and each of its directors and executive officers, as amended on July 31, 2015 (filed as Exhibit 10.1 to the Company’s Quarterly Report on Form 10-Q filed with the SEC on August 5, 2015 (File No. 001-36383) and incorporated by referenced herein.) | |
10.3+Ø | Employment Agreement between the Registrant and Michael Burkland (filed as Exhibit 10.2 to the Company’s Registration Statement on Form S-1 filed with the SEC on March 3, 2014 (File No. 333-194258) and incorporated by reference herein). | |
10.4+Ø | Confirmation Letter between the Registrant and Barry Zwarenstein (filed as Exhibit 10.3 to the Company’s Registration Statement on Form S-1 filed with the SEC on March 3, 2014 (File No. 333-194258) and incorporated by reference herein). | |
10.5+Ø | Offer Letter between the Registrant and Dan Burkland and amendment (filed as Exhibit 10.4 to the Company’s Registration Statement on Form S-1 filed with the SEC on March 3, 2014 (File No. 333-194258) and incorporated by reference herein). | |
10.6+Ø | Offer Letter between the Registrant and Scott Welch (filed as Exhibit 10.7 to the Company’s Annual Report on Form 10-K filed with the SEC on March 10, 2015 (File No. 001-36383) and incorporated by referenced herein). | |
10.7+Ø | Five9, Inc. Amended and Restated 2004 Equity Incentive Plan (filed as Exhibit 10.8 to Amendment No.2 to the Company’s Registration Statement on Form S-1 filed with the SEC on April 3, 2014 (File No. 333-194258) and incorporated by reference herein). | |
10.8+Ø | Amendment to Five9, Inc. Amended and Restated 2004 Equity Incentive Plan, effective March 6, 2014 (filed as Exhibit 10.2 to the Company’s Quarterly Report on Form 10-Q filed with the SEC on May 14, 2014 (File No. 001-36383) and incorporated by reference herein). | |
10.9+Ø | Five9, Inc. 2014 Equity Incentive Plan and related form agreements (filed as Exhibit 10.9 to Amendment No.1 to the Company’s Registration Statement on Form S-1 filed with the SEC on March 24, 2014 (File No. 333-194258) and incorporated by reference herein). | |
10.10+Ø | Five9, Inc. 2014 Employee Stock Purchase Plan (filed as Exhibit 10.10 to Amendment No.1 to the Company’s Registration Statement on Form S-1 filed with the SEC on March 24, 2014 (File No. 333-194258) and incorporated by reference herein). | |
10.11+Ø | Key Employee Severance Benefit Plan (filed as Exhibit 10.12 to the Company’s Registration Statement on Form S-1 filed with the SEC on March 3, 2014 (File No. 333-194258) and incorporated by reference herein). | |
10.12+Ø | Five9 Inc. 2016 Executive Bonus Plan (filed as Exhibit 10.14 to the Company’s Annual Report on Form 10-K filed with the SEC on March 3, 2016 (File No. 001-36383) and incorporated by reference herein). | |
10.13+Ø | Five9 Inc. Non-Employee Director Compensation Policy (filed as Exhibit 10.13 to the Company’s Annual Report on Form 10-K filed with the SEC on March 3, 2016 (File No. 001-36383) and incorporated by reference herein). . | |
10.14+ | ||
10.15+Ø | Five9 Inc. 2017 Executive Bonus Program (filed as Exhibit 10.14 to the Company’s Annual Report on Form 10-K filed with the SEC on March 3, 2016 (File No. 001-36383) and incorporated by reference herein). . | |
101
Exhibit Index | ||
Exhibit Number | Description | |
10.16 | ||
10.17Ø | Loan and Security Agreement, dated March 8, 2012, by and between the Registrant and City National Bank (filed as Exhibit 10.15 to the Company’s Registration Statement on Form S-1 filed with the SEC on March 3, 2014 (File No. 333-194258) and incorporated by reference herein). | |
10.18Ø | First Amendment to Loan and Security Agreement, dated as of October 18, 2013, by and between the Registrant and City National Bank (filed as Exhibit 10.16 to the Company’s Registration Statement on Form S-1 filed with the SEC on March 3, 2014 (File No. 333-194258) and incorporated by reference herein). | |
10.19Ø | Consent and Second Amendment to Loan and Security Agreement, dated as of February 20, 2014, by and between the Registrant and City National Bank (filed as Exhibit 10.17 to the Company’s Registration Statement on Form S-1 filed with the SEC on March 3, 2014 (File No. 333-194258) and incorporated by reference herein). | |
10.20Ø | Third Amendment to Loan and Security Agreement, dated December 16, 2014, by and between Five9, Inc. and City National Bank (filed as Exhibit 10.1 to the Company’s Current Report on Form 8-K filed with the SEC on December 18, 2014 (File No. 001-36383) and incorporated by reference herein). | |
10.21Ø | Loan and Security Agreement, dated as of February 20, 2014, by and among the Registrant, Five9 Acquisition LLC, Fifth Street Finance Corp. and Fifth Street Mezzanine Partners V, L.P. as lenders, and Fifth Street Finance Corp. as agent (filed as Exhibit 10.18 to the Company’s Registration Statement on Form S-1 filed with the SEC on March 3, 2014 (File No. 333-194258) and incorporated by reference herein). | |
10.22Ø | First Amendment to Loan and Security Agreement, dated December 16, 2014, by and between Five9, Inc., Five9 Acquisition LLC, Fifth Street Finance Corp. and Fifth Street Mezzanine Partners V, L.P. (filed as Exhibit 10.2 to the Company’s Current Report on Form 8-K filed with the SEC on December 18, 2014 (File No. 001-36383) and incorporated by reference herein). | |
10.23Ø | Second Amendment to Loan and Security Agreement, dated February 19, 2015, by and between Five9, Inc., Five9 Acquisition LLC, Fifth Street Finance Corp. and Fifth Street Mezzanine Partners V, L.P. (filed as Exhibit 10.1 to the Company’s Current Report on Form 8-K filed with the SEC on February 25, 2015 (File No. 001-36383) and incorporated by reference herein). | |
10.24Ø | Equipment Lease Agreement, dated November 8, 2012, between the Registrant and Winmark Capital Corporation (filed as Exhibit 10.20 to the Company’s Registration Statement on Form S-1 filed with the SEC on March 3, 2014 (File No. 333-194258) and incorporated by reference herein). | |
10.25Ø | Loan and Security Agreement, dated August 1, 2016, by and among Five9, Inc., the lenders party thereto and City National Bank, as agent for such lenders (filed as Exhibit 10.1 to the Company’s Current Report on Form 8-K filed with the SEC on August 3, 2016 (File No. 001-36383) and incorporated by reference herein). | |
10.26Ø | Promissory Note, dated July 16, 2013, between the Registrant and Universal Service Administrative Company (filed as Exhibit 10.26 to the Company’s Registration Statement on Form S-1 filed with the SEC on March 3, 2014 (File No. 333-194258) and incorporated by reference herein). | |
21.1 | ||
23.1 | ||
24.1 | Power of Attorney (included on signature page to this Annual Report on Form 10-K). | |
31.1 | ||
31.2 | ||
32.1† | ||
101.INS | XBRL Instance Document | |
101.SCH | XBRL Taxonomy Schema Linkbase Document | |
102
Exhibit Index | ||
Exhibit Number | Description | |
101.CAL | XBRL Taxonomy Calculation Linkbase Document | |
101.DEF | XBRL Taxonomy Definition Linkbase Document | |
101.LAB | XBRL Taxonomy Labels Linkbase Document | |
101.PRE | XBRL Taxonomy Presentation Linkbase Document | |
Ø Previously filed.
+ Indicates management contract or compensatory plan.
† The certifications attached as Exhibit 32.1 that accompany this Annual Report on Form 10-K, are not deemed filed with the Securities and Exchange Commission and are not to be incorporated by reference into any filing of Five9, Inc. under the Securities Act of 1933, as amended, or the Securities Exchange Act of 1934, as amended, whether made before or after the date of this Annual Report on Form 10-K, irrespective of any general incorporation language contained in such filing.
103
SIGNATURES
Pursuant to the requirements of Section 13 or 15(d) of the Securities Exchange Act of 1934, the Registrant has duly caused this report to be signed on its behalf by the undersigned, thereunto duly authorized.
Five9, Inc. | |||
Date: | March 1, 2018 | By: | /s/ Barry Zwarenstein |
Barry Zwarenstein | |||
Interim Chief Executive Officer and Chief Financial Officer | |||
POWER OF ATTORNEY
KNOW ALL PERSONS BY THESE PRESENTS that each individual whose signature appears below constitutes and appoints Barry Zwarenstein as his or her true and lawful attorneys-in-fact and agents with the power to act, with or without the other, with full power of substitution and resubstitution, for him or her and in his or her name, place and stead, in his or her capacity as a director or officer or both, as the case may be, of the Company, to sign any and all amendments to this Annual Report on Form 10-K, and to file the same, with exhibits thereto and other documents in connection therewith, with the Securities and Exchange Commission granting unto said attorneys-in-fact and agents, and each of them, full power and authority to do and perform each and every act and thing requisite and necessary to be done, as fully to all intents and purposes as he might or could do in person, hereby ratifying and confirming all that each of said attorneys-in-fact and agents, or his substitute or substitutes may lawfully do or cause to be done by virtue hereof.
Pursuant to the requirements of the Securities Exchange Act of 1934, this report has been signed below by the following persons on behalf of the Registrant and in the capacities and on the dates indicated.
Signature | Title | Date | ||
/s/ Barry Zwarenstein | Interim Chief Executive Officer and Chief Financial Officer | March 1, 2018 | ||
Barry Zwarenstein | (Principal Executive Officer, Principal Financial Officer and Principal Accounting Officer) | |||
/s/ Michael Burkland | Executive Chairman, Director | March 1, 2018 | ||
Michael Burkland | ||||
/s/ Jack Acosta | Director | March 1, 2018 | ||
Jack Acosta | ||||
/s/ Kimberly Alexy | Director | March 1, 2018 | ||
Kimberly Alexy | ||||
/s/ Michael Burdiek | Director | March 1, 2018 | ||
Michael Burdiek | ||||
/s/ David DeWalt | Director | March 1, 2018 | ||
David DeWalt | ||||
/s/ David Welsh | Director; Lead Independent Director | March 1, 2018 | ||
David Welsh | ||||
/s/ Robert Zollars | Director | March 1, 2018 | ||
Robert Zollars | ||||
104