Attached files
| file | filename |
|---|---|
| EX-32.3 - EX-32.3 - Century Communities, Inc. | ccs-20171231xex32_3.htm |
| EX-32.2 - EX-32.2 - Century Communities, Inc. | ccs-20171231xex32_2.htm |
| EX-32.1 - EX-32.1 - Century Communities, Inc. | ccs-20171231xex32_1.htm |
| EX-31.3 - EX-31.3 - Century Communities, Inc. | ccs-20171231xex31_3.htm |
| EX-31.2 - EX-31.2 - Century Communities, Inc. | ccs-20171231xex31_2.htm |
| EX-31.1 - EX-31.1 - Century Communities, Inc. | ccs-20171231xex31_1.htm |
| EX-23.1 - EX-23.1 - Century Communities, Inc. | ccs-20171231xex23_1.htm |
| EX-21.1 - EX-21.1 - Century Communities, Inc. | ccs-20171231xex21_1.htm |
| EX-12.1 - EX-12.1 - Century Communities, Inc. | ccs-20171231xex12_1.htm |
UNITED STATES
SECURITIES AND EXCHANGE COMMISSION
Washington, D.C. 20549
__________________
FORM 10‑K
_______________________________
☒ ANNUAL REPORT PURSUANT TO SECTION 13 OR 15(d) OF THE SECURITIES EXCHANGE ACT OF 1934
For the fiscal year ended DECember 31, 2017
OR
☐ TRANSITION REPORT PURSUANT TO SECTION 13 OR 15(d) OF THE SECURITIES EXCHANGE ACT OF 1934
For the transition period from ____________to____________
Commission File No. 001-36491
__________________________
Century Communities, Inc.
(Exact Name of Registrant as Specified in Its Charter)
_______________ _____________________________
|
|
|
|
|
Delaware |
|
68-0521411 |
|
(State or Other Jurisdiction of |
|
(I.R.S. Employer |
|
8390 East Crescent Parkway, Suite 650 |
|
80111 |
|
(Address of Principal Executive Offices) |
|
(Zip Code) |
(Registrant’s Telephone Number, Including Area Code): (303) 770-8300
Securities registered pursuant to Section 12(b) of the Act:
|
Title of each Class |
|
Name of each Exchange on which registered |
|
Common Stock, par value $0.01 per share |
New York Stock Exchange |
Securities registered pursuant to Section 12(g) of the Act: None
__________________________
Indicate by check mark if the registrant is a well-known seasoned issuer, as defined in Rule 405 of the Securities Act. Yes ☐ No ☒
Indicate by check mark if the registrant is not required to file reports pursuant to Section 13 or Section 15(d) of the Act. Yes ☐ No ☒
Indicate by check mark whether the registrant: (1) has filed all reports required to be filed by Section 13 or 15(d) of the Securities Exchange Act of 1934 during the preceding 12 months (or for such shorter period that the registrant was required to file such reports), and (2) has been subject to such filing requirements for the past 90 days. Yes ☒ No ☐
Indicate by check mark whether the registrant has submitted electronically and posted on its corporate Web site, if any, every Interactive Data File required to be submitted and posted pursuant to Rule 405 of Regulation S-T (§232.405 of this chapter) during the preceding 12 months (or for such shorter period that the registrant was required to submit and post such files). Yes ☒ No ☐
Indicate by check mark if disclosure of delinquent filers pursuant to Item 405 of Regulation S-K (§229.405 of this chapter) is not contained herein, and will not be contained, to the best of registrant’s knowledge, in definitive proxy or information statements incorporated by reference in Part III of this Form 10-K or any amendment to this Form 10-K. ☒
Indicate by check mark whether the registrant is a large accelerated filer, an accelerated filer, a non-accelerated filer, a smaller reporting company, or an emerging growth company. See the definitions of “large accelerated filer,” “accelerated filer,” “smaller reporting company,” and “emerging growth company” in Rule 12b-2 of the Exchange Act. (Check one):
|
|
|
|
|
|
|
|
|
|
|
|
|
Large accelerated filer |
☐ |
|
Accelerated filer |
☒ |
|
Non-accelerated filer |
☐ |
(Do not check if smaller reporting company) |
Smaller reporting company |
☐ |
|
|
|
|
Emerging growth company |
☐ |
If an emerging growth company, indicate by check mark if the registrant has elected not to use the extended transition period for complying with any new or revised financial accounting standards provided pursuant to Section 13(a) of the Exchange Act. ☐
Indicate by check mark whether the registrant is a shell company (as defined in Rule 12b‑2 of the Exchange Act.) Yes ☐ No ☒
The aggregate market value of the registrant’s common stock held by non-affiliates of the registrant on June 30, 2017 was approximately $457.7 million based on the closing price of $24.80 per share as reported on the New York Stock Exchange on June 30, 2017.
As of February 27, 2018, the registrant had 29,616,597 shares issued and outstanding.
DOCUMENTS INCORPORATED BY REFERENCE:
Part III of this Annual Report on Form 10-K incorporates by reference certain portions of the registrant’s definitive proxy statement for its 2018 Annual Meeting of Stockholders to be filed with the Commission not later than 120 days after the end of the fiscal year covered by this report.
CENTURY COMMUNITIES, INC.
ANNUAL REPORT ON FORM 10-K
For the Fiscal Year Ended December 31, 2017
i
CAUTIONARY NOTE ABOUT FORWARD-LOOKING STATEMENTS
Some of the statements included in this Annual Report on Form 10-K (which we refer to as this “Form 10-K”) constitute forward-looking statements within the meaning of the federal securities laws. Forward-looking statements relate to expectations, beliefs, projections, forecasts, future plans and strategies, anticipated events or trends and similar expressions concerning matters that are not historical facts. These statements are only predictions. We caution that forward-looking statements are not guarantees. Actual events and results of operations could differ materially from those expressed or implied in the forward-looking statements. Forward-looking statements are typically identified by the use of terms such as “may,” “will,” “should,” “expect,” “could,” “intend,” “plan,” “anticipate,” “estimate,” “believe,” “continue,” “predict,” “potential” or the negative of such terms and other comparable terminology. You can also identify forward-looking statements by discussions of strategy, plans or intentions. Actual results and the timing of events may differ materially from those contained in these forward-looking statements due a number of factors.
The forward-looking statements included in this Form 10-K reflect our current views about future events and are subject to numerous known and unknown risks, uncertainties, assumptions and changes in circumstances that may cause our actual results to differ significantly from those expressed in any forward-looking statement. Statements regarding the following subjects, among others, may be forward-looking:
|
· |
economic changes either nationally or in the markets in which we operate, including declines in employment, volatility of mortgage interest rates and inflation; |
|
· |
economic changes either nationally or in the markets in which we operate, including declines in employment, volatility of mortgage interest rates and inflation; |
|
· |
a downturn in the homebuilding industry, including a decline in real estate values or market conditions resulting in impairment of our assets; |
|
· |
changes in assumptions used to make industry forecasts; |
|
· |
continued volatility and uncertainty in the credit markets and broader financial markets; |
|
· |
our future operating results and financial condition; |
|
· |
our business operations; |
|
· |
changes in our business and investment strategy; |
|
· |
availability of land to acquire, and our ability to acquire such land on favorable terms or at all; |
|
· |
availability, terms and deployment of capital; |
|
· |
availability of mortgage financing or an increase in the number of foreclosures in the market; |
|
· |
shortages of or increased prices for labor, land or raw materials used in housing construction; |
|
· |
delays in land development or home construction resulting from adverse weather conditions or other events outside our control; |
|
· |
impact of construction defect, product liability, and/or home warranty claims, including the adequacy of accruals and the applicability and sufficiency of our insurance coverage; |
|
· |
changes in, or the failure or inability to comply with, governmental laws and regulations; |
|
· |
the timing of receipt of regulatory approvals and the opening of projects; |
|
· |
the degree and nature of our competition; |
|
· |
our leverage and debt service obligations; |
|
· |
availability of qualified personnel and our ability to retain our key personnel; and |
|
· |
changes in United States generally accepted accounting principles (which we refer to as “GAAP”). |
The forward-looking statements are based on our beliefs, assumptions and expectations of future events, taking into account all information currently available to us. Forward-looking statements are not guarantees of future events or of our performance. These beliefs, assumptions and expectations can change as a result of many possible events or factors, not all of which are known to us. Some of these events and factors are described in “Item 7. Management’s Discussion and Analysis of Financial Condition and Results of Operations” and in “Part I, Item 1A. Risk Factors” in this Form 10-K, and other risks and uncertainties detailed in this and our other reports and filings with the SEC. If a change occurs, our business, financial condition, liquidity, cash flows and results of operations may vary materially from those expressed in or implied by our forward-looking statements. New risks and uncertainties arise over time, and it is not possible for us to predict the occurrence of those matters or the manner in which they may affect us. Except as required by law, we are not obligated to, and do not intend to, update or revise any forward-looking statements, whether as a result of new information, future events or otherwise. Therefore, you should not rely on these forward-looking statements as of any date subsequent to the date of this Form 10-K.
As used in this Form 10-K, references to “Company,” “we,” “us” or “our” refer to Century Communities, Inc., a Delaware corporation, and, unless the context otherwise requires, its subsidiaries and affiliates.
1
General
Century Communities, Inc., a Delaware corporation (which we refer to as “we,” “CCS,” or the “Company”), is engaged in the development, design, construction, marketing and sale of single-family attached and detached homes in metropolitan areas in the States of California, Colorado, Georgia, Nevada, North Carolina, South Carolina, Tennessee, Texas, Utah, and Washington. In many of our projects, in addition to building homes, we are responsible for the entitlement and development of the underlying land. Our homebuilding operations are organized into the following four reportable segments based on the geographic regions in which we operate: West, Mountain, Texas and Southeast. Additionally, our indirect wholly-owned subsidiaries, Inspire Home Loans Inc. and Parkway Title, LLC, which provide mortgage services and title services, respectively, to our home buyers, have been identified as our Financial Services segment.
Since the private placement of 12.1 million shares of our common stock, par value $0.01 per share, in May of 2013, we have grown rapidly through the acquisitions of other homebuilders and organic entrance into new markets, as outlined below:

|
|
||||
|
•Raised $224 million through 144A equity offering. •Acquired Jimmy Jacobs Homes in Austin and San Antonio Texas for $16 million |
•Acquired LVLH in Las Vegas for $165 million. •Raised $200 million through offering of senior unsecured notes. •Successfully completed IPO •Acquired Grand View Builders in Houston for $13 million. •Acquired Peachtree Communities in Atlanta for $57 million. |
•Raised $60 million through offering of senior unsecured notes. •Expanded unsecured line of credit to $300 million with $100 million accordion feature.
|
•Entered the Salt Lake City market. •Acquired 50% of Wade Jurney Homes for $15 million. •Formed financial services companies to provide title and mortgage services. •Entered the Charlotte, NC market. |
•Expanded unsecured line of credit to $400 million. •Raised $525 million through offering of senior unsecured notes. •Entered West Coast and strengthened Southeast presence through the acquisition of UCP, Inc. for $362 million, including acquired debt •Expanded Seattle through the acquisition of Sundquist Homes for $50 million. |
Our Annual Reports on Form 10-K, Quarterly Reports on Form 10-Q, and Current Reports on Form 8-K are available on our website at www.centurycommunities.com as soon as reasonably practicable after such materials are electronically filed with, or furnished to, the U.S. Securities and Exchange Commission (which we refer to as the “SEC”).
Description of Business
Land acquisition process
We acquire land for our homebuilding operations with the primary intent to develop and construct single family detached or attached homes for sale on the acquired land. From time to time, we may sell land to other developers and homebuilders where we have excess land positions. We generally acquire land for cash, either through bulk acquisitions of land or through option contracts. Option contracts are generally structured where we have the right, but not the obligation, to buy land at predetermined prices on a defined schedule. Potential land acquisitions are identified by our local management within the markets in which we operate. Our land acquisition process includes soil tests, independent environmental studies, other engineering work and financial analysis which include an evaluation of expected returns, projected gross margins, estimated sales paces and pricing. All potential land acquisitions are approved by our Corporate office to ensure appropriate capital allocations taking into consideration current and projected inventory levels and risk adjusted returns.
Homebuilding marketing and sales process
We build and sell an extensive range of home types across a variety of price points. Our emphasis is on acquiring well-located land positions and offering quality homes. The core of our business plan is to acquire and develop land strategically, based on our understanding of population growth patterns, entitlement restrictions and infrastructure development. We focus on locations within our
2
markets with convenient access to metropolitan areas that are generally characterized by diverse economic and employment bases and demographics and increasing populations. We believe these conditions create strong demand for new housing, and these locations represent what we believe to be attractive opportunities for long-term growth. We also seek assets that have desirable characteristics, such as good access to major job centers, schools, shopping, recreation and transportation facilities, and we strive to offer a broad spectrum of product types in these locations. Location, product and customer service are key components of the connection we seek to establish with each individual homebuyer. Our construction expertise across an extensive product offering allows us flexibility to pursue a wide array of land acquisition opportunities and appeal to a broad range of potential homebuyers, from entry-level to first- and second-time move-up buyers and lifestyle homebuyers. Additionally, we believe our diversified product strategy enables us to adapt quickly to changing market conditions and to optimize returns while strategically reducing portfolio risk.
Our philosophy is to provide a positive experience to our homeowners by actively engaging them in the building process and by enhancing communication, knowledge and satisfaction. In many of our communities, we provide our customers with customization options to suit their lifestyle needs and have developed a number of home designs with features such as outdoor living spaces, one-story living and first floor master bedroom suites to appeal to universal design needs. We also engineer our homes for energy efficiency, which is aimed at reducing the impact on the environment and lowering energy costs to our homebuyers. As part of these efforts, we offer homebuyers environmentally friendly alternatives, such as solar power to supplement a home’s energy needs.
We engage architects, engineers and other professionals in connection with the home design process who are familiar with local market preferences, constraints, conditions and requirements. We serve as the general contractor, with all construction work typically performed by subcontractors. While we maintain long-standing relationships with many of our subcontractors and design professionals, we typically do not enter into long-term contractual commitments with them.
We sell our homes through our own sales representatives and through independent real estate brokers. Our in-house sales force typically works from sales offices located in model homes close to or in each community. Sales representatives assist potential buyers by providing them with basic floor plans, price information, development and construction timetables, tours of model homes and the selection of options. Sales personnel are trained by us and generally have had prior experience selling new homes in the local market. Our personnel, along with subcontracted marketing and design consultants, carefully design the exterior and interior of each home to coincide with the lifestyles of targeted homebuyers.
We advertise directly to potential homebuyers through the internet and in newspapers and trade publications, as well as through marketing brochures and newsletters. We may also use billboards, radio and television advertising, and our website, to market the location, price range and availability of our homes. We also attempt to operate in conspicuously located communities that permit us to take advantage of local traffic patterns. Model homes play a significant role in our marketing efforts by not only creating an attractive atmosphere, but also by displaying options and upgrades.
Customer relations, quality control and warranty programs
We pay particular attention to the product design process and carefully consider quality and choice of materials in order to attempt to eliminate building deficiencies. The quality and workmanship of the subcontractors we employ are monitored and we make regular inspections and evaluations of our subcontractors.
We maintain quality control and customer service staff whose role includes providing a positive experience for each customer throughout the pre-sale, sale, building, closing and post-closing periods. These employees are also responsible for providing after sales customer service. Our quality and service initiatives include taking customers on a comprehensive tour of their home prior to closing and using customer survey results to improve our standards of quality and customer satisfaction.
Generally, we provide each homeowner with product warranties covering workmanship and materials for one year from the time of closing, and warranties covering structural systems for eight to 10 years from the time of closing in connection with our general liability insurance policy. The subcontractors who perform most of the actual construction also provide to us customary warranties on workmanship.
Customer Financing
During the fourth quarter of 2016, our wholly owned subsidiary, Parkway Financial Group, LLC, formed Inspire Home Loans Inc. (which we refer to as “Inspire”). Inspire offers mortgage services to our homebuyers. In addition to Inspire, Parkway Title, LLC (which we refer to as “Parkway Title”) provides title services to select markets in which we operate. Inspire and Parkway Title comprise our
3
Financial Services segment. We seek to assist our homebuyers in obtaining financing by arranging with mortgage lenders to offer qualified buyers a variety of financing options.
Materials
When constructing homes, we use various materials and components. It has typically taken us five to eight months or more to construct a home, during which time materials are subject to price fluctuations. Such price fluctuations are caused by several factors, among them seasonal variation in availability and increased demand for materials as a result of the improved housing market.
Seasonality
We experience seasonal variations in our quarterly operating results and capital requirements. Historically, new order activity is highest during the spring and summer months. As a result, we typically have more homes under construction, close more homes, and have greater revenues and operating income in the second half of our fiscal year. Historical results are not necessarily indicative of current or future homebuilding activities.
Governmental regulation and environmental matters
We are subject to numerous local, state, federal and other statutes, ordinances, rules and regulations concerning zoning, development, building design, construction and similar matters which impose restrictive zoning and density requirements in order to limit the number of homes that can eventually be built within the boundaries of a particular area. Projects that are not entitled may be subjected to periodic delays, changes in use, less intensive development or elimination of development in certain specific areas due to government regulations. We may also be subject to periodic delays or may be precluded entirely from developing in certain communities due to building moratoriums or “slow-growth” or “no-growth” initiatives that could be implemented in the future. Local and state governments also have broad discretion regarding the imposition of development fees for projects in their jurisdiction. Projects for which we have received land use and development entitlements or approvals may still require a variety of other governmental approvals and permits during the development process and can also be impacted adversely by unforeseen health, safety and welfare issues, which can further delay these projects or prevent their development.
We are also subject to a variety of local, state, federal and other statutes, ordinances, rules and regulations concerning the environment. The particular environmental laws which apply to any given homebuilding site vary according to the site’s location, its environmental conditions, and the present and former uses of the site, as well as adjoining properties. Environmental laws and conditions may result in delays, may cause us to incur substantial compliance and other costs, and can prohibit or severely restrict homebuilding activity in environmentally sensitive regions or areas. From time to time, the Environmental Protection Agency and similar federal or state agencies review homebuilders’ compliance with environmental laws and may levy fines and penalties for failure to strictly comply with applicable environmental laws or impose additional requirements for future compliance as a result of past failures. Any such actions taken with respect to us may increase our costs. Further, we expect that increasingly stringent requirements will be imposed on homebuilders in the future. Environmental regulations can also have an adverse impact on the availability and price of certain raw materials such as lumber.
Under various environmental laws, current or former owners of real estate, as well as certain other categories of parties, may be required to investigate and clean up hazardous or toxic substances or petroleum product releases, and may be held liable to a governmental entity or to third parties for property damage and for investigation and cleanup costs incurred by such parties in connection with the contamination. In addition, in those cases where an endangered species is involved, environmental rules and regulations can result in the elimination of development in identified environmentally sensitive areas. To date, we have never had a significant environmental issue.
Segment and geographic area disclosures
We have broken our homebuilding operations into the following reportable segments based on the geographic markets in which we operate:
|
· |
West (Southern California, Central Valley, Bay Area and Washington) |
|
· |
Mountain (Colorado, Nevada and Utah) |
|
· |
Texas (Houston, San Antonio and Austin) |
|
· |
Southeast (Georgia, North Carolina, South Carolina and Tennessee) |
We have also identified our Financial Services operations, which provide mortgage and title services to our homebuyers, as a fifth reportable segment. Our Corporate operations are a nonoperating segment, as it serves to support our homebuilding operations through
4
functions, such as our executive, finance, treasury, human resources, and accounting departments. We have adjusted prior period segment information to conform to the current period presentation.
Footnote 2 (Reporting Segments) of our Consolidated Financial Statements contains information regarding the operations of our reportable segments.
The below table presents the approximate number of employees for each reportable segment as of December 31, 2017 and 2016.
|
|
Year Ended December 31, |
|||||
|
|
2017 |
2016 |
||||
|
West |
160 |
- |
||||
|
Mountain |
262 | 265 | ||||
|
Texas |
106 | 95 | ||||
|
Southeast |
308 | 165 | ||||
|
Financial Services |
70 |
- |
||||
|
Corporate |
105 | 40 | ||||
|
Total |
1,011 | 565 | ||||
Competition
We face competition in the homebuilding industry, which is characterized by relatively low barriers to entry. Homebuilders compete for, among other things, home buying customers, desirable land parcels, financing, raw materials and skilled labor. Increased competition may prevent us from acquiring attractive land parcels on which to build homes or make such acquisitions more expensive, hinder our market share expansion or lead to pricing pressures on our homes that may adversely impact our margins and revenues. Our competitors may independently develop land and construct housing units that are superior or substantially similar to our products, or may be significantly larger, have a longer operating history and have greater resources or lower cost of capital than us; accordingly, they may be able to compete more effectively in one or more of the markets in which we operate or plan to operate. We also compete with other homebuilders that have long-standing relationships with subcontractors and suppliers in the markets in which we operate or plan to operate and we compete for sales with individual resales of existing homes and with available rental housing.
Our business routinely encounters and attempts to address risks, some of which will cause our future results to differ, sometimes materially, from those originally anticipated. Below, we have described our present view of the most significant risks facing the Company. The risk factors set forth below are not the only risks that we may face or that could adversely affect us. If any of the circumstances described in the risk factors discussed in this Form 10-K actually occur, our business, prospects, liquidity, financial condition and results of operations could be materially and adversely affected. If this were to occur, the trading price of our securities could decline significantly and stockholders may lose all or part of their investment.
The following discussion of risk factors contains “forward-looking statements,” which may be important to understanding any statement in this Form 10-K or in our other filings and public disclosures. In particular, the following information should be read in conjunction with the sections in this Form 10-K entitled, “Cautionary Note about Forward-Looking Statements,” “Item 7. Management’s Discussion and Analysis of Financial Condition and Results of Operations,” and “Item 8. Financial Statements and Supplementary Data.”
Risks Related to Our Business
Adverse changes in general economic conditions could reduce the demand for homes and, as a result, could have a material adverse effect on us.
The residential homebuilding industry is cyclical and is highly sensitive to changes in local and general economic conditions that are outside our control, including:
|
· |
consumer confidence, levels of employment, personal income growth and household debt-to-income levels of potential homebuyers; |
|
· |
the availability of financing for homebuyers, including private and federal mortgage financing programs and federal, state, and provincial regulation of lending practices; |
5
|
· |
real estate taxes and federal and state income tax provisions, including provisions for the deduction of mortgage interest payments; |
|
· |
U.S. and global financial system and credit markets, including short- and long-term interest rates and inflation; |
|
· |
housing demand from population growth and demographic changes (including immigration levels and trends in urban and suburban migration); |
|
· |
competition from other real estate investors with significant capital, including other real estate operating companies and developers and institutional investment funds; and |
|
· |
the supply of new or existing homes and other housing alternatives, such as apartments and other residential rental property. |
The U.S. housing market can also be negatively impacted by declining consumer confidence, restrictive mortgage standards, and relatively large supplies of foreclosures, resales and new homes, among other factors. In the event these economic and business factors occur, we could experience declines in the market value of our inventory and demand for our homes, which could have a material adverse effect on our business, prospects, liquidity, financial condition and results of operations.
The health of the residential homebuilding industry may also be significantly affected by “shadow inventory” levels. “Shadow inventory” refers to the number of homes with a mortgage that are in some form of distress but that have not yet been listed for sale. Shadow inventory can occur when lenders put properties that have been foreclosed or forfeited to lenders on the market gradually, rather than all at once, or delay the foreclosure process. They may choose to do so because of regulations and foreclosure moratoriums, because of the additional costs and resources required to process and sell foreclosed properties, or because they want to avoid depressing housing prices further by putting many distressed properties up for sale at the same time. A significant shadow inventory in our markets could, were it to be released into our markets, adversely impact home prices and demand for our homes, which could have a material adverse effect on our business, prospects, liquidity, financial condition and results of operations.
In addition, an important segment of our customer base consists of first- and second-time move-up buyers, who often purchase homes subject to contingencies related to the sale of their existing homes. The difficulties that these buyers face in selling their homes during periods of weak economic conditions may adversely affect our sales. Moreover, during such periods, we may need to reduce our sales prices and offer greater incentives to buyers to compete for sales that may result in reduced margins.
Our long-term growth depends upon our ability to successfully identify and acquire desirable land parcels for residential build-out.
Our future growth depends upon our ability to successfully identify and acquire attractive land parcels for development of our homes at reasonable prices and with terms that meet our underwriting criteria. Our ability to acquire land parcels for new homes may be adversely affected by changes in the general availability of land parcels, the willingness of land sellers to sell land parcels at reasonable prices, competition for available land parcels, availability of financing to acquire land parcels, zoning and other market conditions. If the supply of land parcels appropriate for development of homes is limited because of these factors, or for any other reason, our ability to grow could be significantly limited, and the number of homes that we build and sell could decline. Additionally, our ability to begin new projects could be impacted if we elect not to purchase land parcels under option contracts. To the extent that we are unable to purchase land parcels timely or enter into new contracts for the purchase of land parcels at reasonable prices, our home sales revenue and results of operations could be negatively impacted.
Our geographic concentration could materially and adversely affect us if the homebuilding industry in our current markets should decline.
Our business strategy is focused on the design, construction and sale of single-family detached and attached homes in metropolitan areas in the States of California, Colorado, Georgia, Nevada, North Carolina, South Carolina, Tennessee, Texas, Utah, and Washington. Because our operations are concentrated in these areas, a prolonged economic downturn in one or more of these areas could have a material adverse effect on our business, prospects, liquidity, financial condition and results of operations, and a disproportionately greater impact on us than other homebuilders with more diversified operations.
Any increase in unemployment or underemployment may lead to an increase in the number of loan delinquencies and property repossessions and have an adverse impact on us.
In the United States, the unemployment rate was 4.1% as of the end of December 2017, according to the U.S. Bureau of Labor Statistics. People who are not employed, are underemployed or are concerned about the loss of their jobs are less likely to purchase new homes,
6
may be forced to try to sell the homes they own and may face difficulties in making required mortgage payments. Therefore, any increase in unemployment or underemployment may lead to an increase in the number of loan delinquencies and property repossessions and have an adverse impact on us both by reducing the demand for the homes we build and by increasing the supply of homes for sale.
If homebuyers are not able to obtain suitable financing, our results of operations may decline.
A substantial majority of our homebuyers finance their home purchases through lenders that provide mortgage financing. First-time homebuyers are generally more affected by the availability of financing than other potential homebuyers. These buyers are an important source of our demand. A limited availability of home mortgage financing may adversely affect the volume of our home sales and the sales prices we achieve in the United States.
During the recent past, the mortgage lending industry in the United States has experienced significant instability, beginning with increased defaults on subprime loans and other nonconforming loans and compounded by expectations of increasing interest payment requirements and further defaults. This in turn resulted in a decline in the market value of many mortgage loans and related securities. In response, lenders, regulators and others questioned the adequacy of lending standards and other credit requirements for several loan products and programs offered in recent years. Credit requirements have tightened, and investor demand for mortgage loans and mortgage-backed securities has declined. The deterioration in credit quality during the downturn had caused almost all lenders to stop offering subprime mortgages and most other loan products that were not eligible for sale to Fannie Mae or Freddie Mac, or loans that did not conform to Fannie Mae, Freddie Mac, FHA or Veterans Administration (which we refer to as the “VA”) requirements. Fewer loan products and tighter loan qualifications may continue to make it more difficult for certain buyers to finance the purchase of our homes. These factors may reduce the pool of qualified homebuyers and make it more difficult to sell to first-time and move-up buyers who have historically made up a substantial part of our customers. Reductions in demand adversely affected our business and financial results during the downturn. The liquidity provided by Fannie Mae and Freddie Mac to the mortgage industry has been very important to the housing market. These entities have required substantial injections of capital from the federal government and may require additional government support in the future. Several federal government officials have proposed changing the nature of the relationship between Fannie Mae and Freddie Mac and the federal government and even nationalizing or eliminating these entities entirely. If Fannie Mae and Freddie Mac were dissolved or if the federal government determined to stop providing liquidity support to the mortgage market, there would be a reduction in the availability of the financing provided by these institutions. Any such reduction would likely have an adverse effect on interest rates, mortgage availability and our sales of new homes. The FHA insures mortgage loans that generally have lower loan payment requirements and qualification standards compared to conventional guidelines, and as a result, continue to be a particularly important source for financing the sale of our homes. In recent years, lenders have taken a more conservative view of FHA guidelines causing significant tightening of borrower eligibility for approval. Availability of condominium financing and minimum credit score benchmarks has reduced opportunity for those purchasers. In the future, there may be further restrictions on FHA-insured loans, including limitations on seller-paid closing costs and concessions. This or any other restriction may negatively affect the availability or affordability of FHA financing, which could adversely affect our potential homebuyers’ ability to secure adequate financing and, accordingly, our ability to sell homes in the United States. In addition, changes in federal and provincial regulatory and fiscal policies aimed at aiding the home buying market (including a repeal of the home mortgage interest tax deduction) may also negatively affect potential homebuyers’ ability to purchase homes.
Decreases in the availability of credit and increases in the cost of credit adversely affect the ability of homebuyers to obtain or service mortgage debt. Even if potential homebuyers do not themselves need mortgage financing, where potential homebuyers must sell their existing homes in order to buy a new home, increases in mortgage costs, lack of availability of mortgages and/or regulatory changes could prevent the buyers of potential homebuyers’ existing homes from obtaining a mortgage, which would result in our potential customers’ inability to buy a new home. Similar risks apply to those buyers who are awaiting delivery of their homes and are currently in backlog. The success of homebuilders depends on the ability of potential homebuyers to obtain mortgages for the purchase of homes. If our customers (or potential buyers of our customers’ existing homes) cannot obtain suitable financing, our sales and results of operations could be adversely affected, and the price of our common stock may decline.
Interest rate increases or changes in federal lending programs or other regulations could lower demand for our homes, which could materially and adversely affect us.
Most of the purchasers of our homes finance their acquisitions with mortgage financing. Rising interest rates, decreased availability of mortgage financing or of certain mortgage programs, higher down payment requirements or increased monthly mortgage costs may lead to reduced demand for our homes and mortgage loans. Increased interest rates can also hinder our ability to realize our backlog because our home purchase contracts provide customers with a financing contingency. Financing contingencies allow customers to cancel their home purchase contracts in the event that they cannot arrange for adequate financing. As a result, rising interest rates can decrease our
7
home sales and mortgage originations. Any of these factors could have a material adverse effect on our business, prospects, liquidity, financial condition and results of operations.
In addition, the federal government plays a significant role in supporting mortgage lending through its conservatorship of Fannie Mae and Freddie Mac, both of which purchase home mortgages and mortgage-backed securities originated by mortgage lenders, and its insurance of mortgages originated by lenders through the FHA and the VA. The availability and affordability of mortgage loans, including consumer interest rates for such loans, could be adversely affected by a curtailment or cessation of the federal government’s mortgage-related programs or policies. The FHA may continue to impose stricter loan qualification standards, raise minimum down payment requirements, impose higher mortgage insurance premiums and other costs, and/or limit the number of mortgages it insures. Due to growing federal budget deficits, the U.S. Treasury may not be able to continue supporting the mortgage-related activities of Fannie Mae, Freddie Mac, the FHA and the VA at present levels, or it may revise significantly the federal government’s participation in and support of the residential mortgage market. Because the availability of Fannie Mae, Freddie Mac, FHA- and VA-backed mortgage financing is an important factor in marketing and selling many of our homes, any limitations, restrictions or changes in the availability of such government-backed financing could reduce our home sales, which could have a material adverse effect on our business, prospects, liquidity, financial condition and results of operations.
Any limitation on, or reduction or elimination of, tax benefits associated with owning a home would have an adverse effect on the demand for our home products, which could be material to our business.
Significant expenses of owning a home, including mortgage interest and real estate taxes, generally are deductible expenses for an individual’s U.S. federal, and in some cases, state income taxes, subject to various limitations under current tax law and policy. If the U.S. federal government or a state government changes its income tax laws, as has been discussed from time to time, to eliminate, limit or substantially modify these income tax deductions, the after-tax cost of owning a new home would increase for many of our potential customers.
On December 22, 2017, the Tax Cuts and Jobs Act (which we refer to as the “TCJA”) was signed into law. The TCJA imposes certain caps and limitations for certain homeowners, such as lowering the mortgage interest deduction cap on a newly purchased home to $750,000 a year from the current $1,000,000 threshold. The resulting loss or reduction of homeowner tax deductions may adversely impact demand for and sales prices of new homes.
Increases in taxes could prevent potential customers from buying our homes and adversely affect our business or financial results.
Increases in property tax rates by local governmental authorities, as experienced in response to reduced federal and state funding, can adversely affect the ability of potential customers to obtain financing or their desire to purchase new homes. Fees imposed on developers to fund schools, open spaces or road improvements, and/or to provide low and moderate income housing, could increase our costs and have an adverse effect on our operations. In addition, increases in sales taxes could adversely affect our potential customers who may consider those costs in determining whether to make a new home purchase and decide, as a result, not to purchase one of our homes.
The recently passed comprehensive tax reform bill could adversely affect our business and financial condition.
On December 22, 2017, TCJA was signed into law. The TCJA significantly reforms the Internal Revenue Code of 1986, as amended. The TCJA, among other things, contains significant changes to corporate taxation, including reduction of the corporate tax rate from a top marginal rate of 35% to a flat rate of 21%, limitation of the tax deduction for interest expense to 30% of adjusted earnings (except for certain small businesses), limitation of the deduction for net operating losses to 80% of current year taxable income, elimination of net operating loss carrybacks, one time taxation of offshore earnings at reduced rates regardless of whether they are repatriated, immediate deductions for certain new investments instead of deductions for depreciation expense over time, and modifying or repealing many business deductions and credits. We continue to examine the impact this tax reform legislation may have on our business. Notwithstanding the reduction in the corporate income tax rate, the overall impact of the TCJA is uncertain and our business and financial condition could be adversely affected. Furthermore, as a result of the reduction in the corporate tax rates, we expect to have a significant reduction in the value of our deferred tax assets, but we have not yet fully determined the amount of such reduction. The impact of this tax reform on holders of our common stock is also uncertain and could be adverse.
Changes to the population growth rates in certain of the markets in which we operate or plan to operate could affect the demand for homes in these regions.
Slower rates of population growth or population declines in the States of California, Colorado, Georgia, Nevada, North Carolina, South Carolina, Tennessee, Texas, Utah, and Washington, or other key markets in the United States we plan to enter, especially as compared
8
to the high population growth rates in prior years, could affect the demand for housing, causing home prices in these markets to fall, and adversely affect our plans for growth, business, financial condition and operating results.
Difficulty in obtaining sufficient capital could result in an inability to acquire land for our developments or increased costs and delays in the completion of development projects.
The homebuilding industry is capital-intensive and requires significant up-front expenditures to acquire land parcels and begin development. If internally generated funds are not sufficient, we may seek additional capital in the form of equity or debt financing from a variety of potential sources, including additional bank financings and/or securities offerings. The availability of borrowed funds, especially for land acquisition and construction financing, may be greatly reduced nationally, and the lending community may require increased amounts of equity to be invested in a project by borrowers in connection with both new loans and the extension of existing loans. The credit and capital markets have recently experienced significant volatility. If we are required to seek additional financing to fund our operations, continued volatility in these markets may restrict our flexibility to access such financing. If we are not successful in obtaining sufficient capital to fund our planned capital and other expenditures, we may be unable to acquire land for our housing developments and/or to develop the housing. Additionally, if we cannot obtain additional financing to fund the purchase of land under our option contracts or purchase contracts, we may incur contractual penalties and fees. Any difficulty in obtaining sufficient capital for planned development expenditures could also cause project delays and any such delay could result in cost increases. Any one or more of the foregoing events could have a material adverse effect on our business, prospects, liquidity, financial condition and results of operations.
We face potentially substantial risk with respect to our land and lot inventory arising from significant changes in economic or market conditions.
We intend to acquire land parcels for replacement and expansion of land inventory within our current and any new markets. The risks inherent in purchasing and developing land parcels increase as consumer demand for housing decreases. As a result, we may buy and develop land parcels on which homes cannot be profitably built and sold. The market value of land parcels, building lots and housing inventories can fluctuate significantly as a result of changing market conditions, and the measures we employ to manage inventory risk may not be adequate to insulate our operations from a severe drop in inventory values. When market conditions are such that land values are not appreciating, previously entered into option agreements may become less desirable, at which time we may elect to forego deposits and pre-acquisition costs and terminate the agreements. In addition, inventory carrying costs can be significant and can result in losses in a poorly performing project or market. In the event of significant changes in economic or market conditions, we may have to sell homes at significantly lower margins or at a loss, if we are able to sell them at all.
If we are unable to develop our communities successfully or within expected timeframes, our results of operations could be adversely affected.
Before a community generates any revenues, time and material expenditures are required to acquire land, obtain development approvals and construct significant portions of project infrastructure, amenities, model homes and sales facilities. A decline in our ability to develop and market our communities successfully and to generate positive cash flow from these operations in a timely manner could have a material adverse effect on our business and results of operations and on our ability to service our debt and to meet our working capital requirements.
Adverse weather and geological conditions may increase costs, cause project delays and reduce consumer demand for housing, all of which could materially and adversely affect us.
As a homebuilder, we are subject to numerous risks, many of which are beyond our management’s control, such as droughts, floods, wildfires, landslides, soil subsidence, earthquakes and other weather-related and geological events which could damage projects, cause delays in completion of projects, or reduce consumer demand for housing, and shortages in labor or materials, which could delay project completion and cause increases in the prices for labor or materials, thereby affecting our sales and profitability. Many of our core markets are in Colorado, an area which has historically experienced seasonal wildfires and soil subsidence. Texas, a market into which we continue to expand, has historically experienced tornadoes, coastal flooding and hurricanes. California and Nevada, markets into which we recently expanded, have historically experienced extreme temperatures, droughts and water shortages. In addition to directly damaging our projects, earthquakes, wildfires, mudslides or other geological events could damage roads and highways providing access to those projects, thereby adversely affecting our ability to market homes in those areas and possibly increasing the costs of completion.
There are some risks of loss for which we may be unable to purchase insurance coverage. For example, losses associated with landslides, earthquakes and other geological events may not be insurable and other losses, such as those arising from terrorism, may not be
9
economically insurable. A sizeable uninsured loss could materially and adversely affect our business, prospects, liquidity, financial condition and results of operations.
Changes in global or regional climate conditions and governmental actions in response to such changes may adversely affect us by increasing the costs of, or restricting, our planned or future growth activities.
Projected climate change, if it occurs, may exacerbate the scarcity or presence of water and other natural resources in affected regions, which could limit, prevent or increase the costs of residential development in certain areas. In addition, there is a variety of new legislation being enacted, or considered for enactment, at the federal, state and local level relating to energy and climate change, and as climate change concerns continue to grow, legislation and regulations of this nature are expected to continue. This legislation relates to items such as carbon dioxide emissions control and building codes that impose energy efficiency standards. Government mandates, standards or regulations intended to mitigate or reduce greenhouse gas emissions or projected climate change impacts could result in prohibitions or severe restrictions on land development in certain areas, increased energy and transportation costs, and increased compliance expenses and other financial obligations to meet permitting, land development, or home construction-related requirements that we may be unable to fully recover (due to market conditions or other factors), any of which could cause a reduction in our homebuilding gross margins and materially and adversely affect our consolidated financial statements. Energy-related initiatives could similarly affect a wide variety of companies throughout the United States and the world, and because our results of operations are heavily dependent on significant amounts of raw materials, these initiatives could have an indirect adverse impact on our results of operations and profitability to the extent the manufacturers and suppliers of our materials are burdened with expensive cap and trade or other climate related regulations.
As a result, climate change impacts, and laws and land development and home construction standards, and/or the manner in which they are interpreted or implemented, to address potential climate change concerns could increase our costs and have a long-term adverse impact on our business and consolidated financial statements. This is a particular concern in the western United States, which have instituted some of the most extensive and stringent environmental laws and residential building construction standards in the country.
Failure to recruit, retain and develop highly skilled, competent personnel may have a material adverse effect on our standards of service.
Key employees, including management team members, are fundamental to our ability to obtain, generate and manage opportunities. Key employees working in the homebuilding and construction industries are highly sought after. Failure to attract and retain such personnel or to ensure that their experience and knowledge is not lost when they leave the business through retirement, redundancy or otherwise may adversely affect the standards of our service and may have an adverse impact on our business, financial conditions and operating results. In addition, we do not maintain key person insurance in respect of any member of our senior management team. The loss of any of our management members or key personnel could adversely impact our business, financial condition and operating results.
Failure to find suitable contractors may have a material adverse effect on our standards of service.
Substantially all of our construction work is done by third-party subcontractors with us acting as the general contractor. Accordingly, the timing and quality of our construction depend on the availability and skill of our subcontractors. The recent increase in levels of homebuilding in the markets in which we operate has occasionally led to some difficulty in securing the services of skilled tradesmen who are currently in high demand. While we anticipate being able to obtain sufficient materials and reliable subcontractors and believe that our relationships with subcontractors are good, we do not have long-term contractual commitments with any subcontractors, and there can be no assurance that skilled subcontractors will continue to be available at reasonable rates and in the areas in which we conduct our operations.
In the future, certain of the subcontractors engaged by us may be represented by labor unions or subject to collective bargaining arrangements. A strike or other work stoppage involving any of our subcontractors could also make it difficult for us to retain subcontractors for our construction work. In addition, union activity could result in higher costs to retain our subcontractors. The inability to contract with skilled subcontractors at reasonable costs on a timely basis could have a material adverse effect on our business, prospects, liquidity, financial condition and results of operations.
Our reliance on contractors can expose us to various liability risks.
We rely on contractors in order to perform the construction of our homes, and in many cases, to select and obtain raw materials. We are exposed to various risks as a result of our reliance on these contractors and their respective subcontractors and suppliers, including the possibility of defects in our homes due to improper practices or materials used by contractors, which may require us to comply with our warranty obligations and/or bring a claim under an insurance policy. For example, despite our quality control efforts, we may
10
discover that our subcontractors were engaging in improper construction practices or installing defective materials in our homes. When we discover these issues, we repair the homes in accordance with our new home warranty and as required by law. We establish warranty and other reserves for the homes we sell based on market practices, our historical experiences, and our judgment of the qualitative risks associated with the types of homes built. However, the cost of satisfying our warranty and other legal obligations in these instances may be significantly higher than our warranty reserves, and we may be unable to recover the cost of repair from such subcontractors. Regardless of the steps we take, we can in some instances be subject to fines or other penalties, and our reputation may be injured.
In addition, several other homebuilders have received inquiries from regulatory agencies concerning whether homebuilders using contractors are deemed to be employers of the employees of such contractors under certain circumstances. Although contractors are independent of the homebuilders that contract with them under normal management practices and the terms of trade contracts and subcontracts within the homebuilding industry, if regulatory agencies reclassify the employees of contractors as employees of homebuilders, homebuilders using contractors could be responsible for wage, hour and other employment-related liabilities of their contractors, which could adversely affect our results of operations.
If we experience shortages in labor supply, increased labor costs or labor disruptions, there could be delays or increased costs in developing our communities or building homes, which could adversely affect our operating results.
We require a qualified labor force to develop our communities. Access to qualified labor may be affected by circumstances beyond our control, including:
|
· |
work stoppages resulting from labor disputes; |
|
· |
shortages of qualified trades people, such as carpenters, roofers, electricians and plumbers, especially in our key markets in the United States; |
|
· |
changes in laws relating to union organizing activity; |
|
· |
changes in immigration laws and trends in labor force migration; and |
|
· |
increases in subcontractor and professional services costs. |
Any of these circumstances could give rise to delays in the start or completion of, or could increase the cost of, developing one or more of our communities and building homes. We may not be able to recover these increased costs by raising our home prices because the price for each home is typically set months prior to its delivery pursuant to sales contracts with our homebuyers. In such circumstances, our operating results could be adversely affected. Additionally, market and competitive forces may also limit our ability to raise the sales prices of our homes.
Utility and resource shortages or rate fluctuations could have an adverse effect on our operations.
Several of the markets in which we operate and in which we may operate in the future have historically been subject to utility and resource shortages, including significant changes to the availability of electricity and water and seasonal fluctuation in the ability of certain commodities, particularly lumber. Shortages of natural resources in our markets, particularly of water, may make it more difficult for us to obtain regulatory approval of new developments. We have also experienced material fluctuations in utility and resource costs across our markets, and we may incur additional costs and may not be able to complete construction on a timely basis if such fluctuations arise. In particular, as the housing market has improved and the number of new homes being constructed has increased, we have experienced increased construction costs due to additional competition for labor and materials. Furthermore, these shortages and rate fluctuations may adversely affect the regional economies in which we operate, which may reduce demand for our homes and negatively affect our business and results of operations.
Government regulations and legal challenges may delay the start or completion of our communities, increase our expenses or limit our homebuilding or other activities, which could have a negative impact on our results of operations.
The approval of numerous governmental authorities must be obtained in connection with our development activities, and these governmental authorities often have broad discretion in exercising their approval authority. We incur substantial costs related to compliance with legal and regulatory requirements. Any increase in legal and regulatory requirements may cause us to incur substantial additional costs, or in some cases cause us to determine that the property is not feasible for development. Various local, provincial, state and federal statutes, ordinances, rules and regulations concerning building, health and safety, environment, zoning, sales and similar matters apply to and/or affect the housing industry.
11
Municipalities may restrict or place moratoriums on the availability of utilities, such as water and sewer taps. If municipalities in which we operate take such actions, it could have an adverse effect on our business by causing delays, increasing our costs or limiting our ability to operate in those municipalities.
We may become subject to various state and local “slow growth” or “no growth” initiatives and other ballot measures that could negatively impact the availability of land and building opportunities within those localities.
Governmental regulation affects not only construction activities but also sales activities, mortgage lending activities and other dealings with consumers. In addition, it is possible that some form of expanded energy efficiency legislation may be passed by the U.S. Congress or federal agencies and certain state and provincial legislatures, which may, despite being phased in over time, significantly increase our costs of building homes and the sale price to our buyers, and adversely affect our sales volumes. We may be required to apply for additional approvals or modify our existing approvals because of changes in local circumstances or applicable law. Further, we may experience delays and increased expenses as a result of legal challenges to our proposed communities, whether brought by governmental authorities or private parties.
An inability to obtain additional performance, payment and completion surety bonds and letters of credit could limit our future growth.
We are often required to provide performance, payment and completion surety bonds or letters of credit to secure the completion of our construction contracts, development agreements and other arrangements. We have obtained facilities to provide the required volume of performance, payment and completion surety bonds and letters of credit for our expected growth in the medium term; however, unexpected growth may require additional facilities. We may also be required to renew or amend our existing facilities. Our ability to obtain additional performance, payment and completion surety bonds and letters of credit primarily depends on our credit rating, capitalization, working capital, past performance, management expertise and certain external factors, including the capacity of the markets for such bonds. Performance, payment and completion surety bond and letter of credit providers consider these factors in addition to our performance and claims record and provider-specific underwriting standards, which may change from time to time.
If our performance record or our providers’ requirements or policies change, if we cannot obtain the necessary consent from our lenders, or if the market’s capacity to provide performance, payment and completion bonds or letters of credit is not sufficient for any unexpected growth and we are unable to renew or amend our existing facilities on favorable terms, or at all, we could be unable to obtain additional performance, payment and completion surety bonds or letters of credit from other sources when required, which could have a material adverse effect on our business, financial condition and results of operations.
A major health and safety incident relating to our business could be costly in terms of potential liabilities and reputational damage.
Building sites are inherently dangerous, and operating in the homebuilding industry poses certain inherent health and safety risks. Due to health and safety regulatory requirements and the number of projects we work on, health and safety performance is critical to the success of all areas of our business. Any failure in health and safety performance may result in penalties for non-compliance with relevant regulatory requirements, and a failure that results in a major or significant health and safety incident is likely to be costly in terms of potential liabilities incurred as a result. Such a failure could generate significant negative publicity and have a corresponding impact on our reputation, our relationships with relevant regulatory agencies or governmental authorities, and our ability to win new business, which in turn could have a material adverse effect on our business, financial condition and operating results.
We are subject to environmental laws and regulations, which may increase our costs, limit the areas in which we can build homes and delay completion of our projects.
We are subject to a variety of local, state and federal statutes, rules and regulations concerning land use and the protection of health and the environment, including those governing discharge of pollutants to water and air, including asbestos, the handling of hazardous materials and the cleanup of contaminated sites. We may be liable for the costs of removal, investigation or remediation of hazardous or toxic substances located on, under, from or in a property currently or formerly owned, leased or occupied by us, whether or not we caused or knew of the pollution. The costs of any required removal, investigation or remediation of such substances or the costs of defending against environmental claims may be substantial. The presence of such substances, or the failure to remediate such substances properly, may also adversely affect our ability to sell the land or to borrow using the land as security. Environmental impacts from historical activities have been identified at some of the projects we have developed in the past and additional projects may be located on land that may have been contaminated by previous use. Although we are not aware of any projects requiring material remediation activities by us as a result of historical contamination, no assurances can be given that material claims or liabilities relating to such developments will not arise in the future.
12
The particular impact and requirements of environmental laws that apply to any given community vary greatly according to the community site, the site’s environmental conditions and the present and former use of the site. From time to time, the United States Environmental Protection Agency and other federal or state agencies review homebuilders’ compliance with environmental laws and may levy fines and penalties for failure to comply with applicable environmental laws or impose additional requirements for future compliance as a result of past failures. Any such actions taken with respect to us may increase our costs. We expect that increasingly stringent requirements may be imposed on homebuilders in the future. Environmental laws may result in delays, cause us to implement time consuming and expensive compliance programs and prohibit or severely restrict development in certain environmentally sensitive regions or areas, such as wetlands. We also may not identify all of these concerns during any pre-development review of project sites. Environmental regulations can also have an adverse impact on the availability and price of certain raw materials, such as lumber. Furthermore, we could incur substantial costs, including cleanup costs, fines, penalties and other sanctions and damages from third-party claims for property damage or personal injury, as a result of our failure to comply with, or liabilities under, applicable environmental laws and regulations. In addition, we are subject to third-party challenges, such as by environmental groups, under environmental laws and regulations to the permits and other approvals required for our projects and operations. These matters could adversely affect our business, financial condition and operating results.
We may be liable for claims for damages as a result of use of hazardous materials.
As a homebuilding business with a wide variety of historic homebuilding and construction activities, we could be liable for future claims for damages as a result of the past or present use of hazardous materials, including building materials which in the future become known or are suspected to be hazardous. Any such claims may adversely affect our business, financial condition and operating results. Insurance coverage for such claims may be limited or non-existent.
Our properties may contain or develop harmful mold, which could lead to liability for adverse health effects and costs of remediating the problem.
Litigation and concern about indoor exposure to certain types of toxic molds have been increasing as the public becomes increasingly aware that exposure to mold can cause a variety of health effects and symptoms, including allergic reactions. Toxic molds can be found almost anywhere; they can grow on virtually any organic substance, as long as moisture and oxygen are present. There are molds that can grow on wood, paper, carpet, foods and insulation. When excessive moisture accumulates in buildings or on building materials, mold growth will often occur, particularly if the moisture problem remains undiscovered or unaddressed. It is impossible to eliminate all mold and mold spores in the indoor environment. If mold or other airborne contaminants exist or appear at our properties, we may have to undertake a costly remediation program to contain or remove the contaminants or increase indoor ventilation. If indoor air quality were impaired, we could be liable to our homebuyers or others for property damage or personal injury.
We may not be able to compete effectively against competitors in the homebuilding industry, especially in the new markets we plan to enter.
Competition in the homebuilding industry is intense, and there are relatively low barriers to entry into our business. Homebuilders compete for, among other things, home buying customers, desirable land parcels, financing, raw materials and skilled labor. Increased competition could hurt our business, as it could prevent us from acquiring attractive land parcels on which to build homes or make such acquisitions more expensive, hinder our market share expansion and lead to pricing pressures on our homes that may adversely impact our margins and revenues. If we are unable to successfully compete, our business, prospects, liquidity, financial condition and results of operations could be materially and adversely affected. We compete with large national and regional homebuilding companies and with smaller local homebuilders for land, financing, raw materials and skilled management and labor resources. Furthermore, a number of our primary competitors are significantly larger, have a longer operating history and may have greater resources or lower cost of capital than ours; accordingly, they may be able to compete more effectively in one or more of the markets in which we operate. Many of these competitors also have long-standing relationships with subcontractors and suppliers in the markets in which we operate. As we expand our operations into California, Colorado, Georgia, Nevada, North Carolina, South Carolina, Tennessee, Texas, Utah, Washington, and other markets, we face new competition from many established homebuilders in those markets, and we will not have the benefit of the extensive relationships and strong reputations with subcontractors, suppliers and homebuyers that we enjoy in our Colorado markets.
Raw materials and building supply shortages and price fluctuations could delay or increase the cost of home construction and adversely affect our operating results.
The homebuilding industry has, from time to time, experienced raw material shortages and been adversely affected by volatility in global commodity prices. In particular, shortages and fluctuations in the price of concrete, drywall, lumber or other important raw materials could result in delays in the start or completion of, or increase the cost of, developing one or more of our residential communities. These
13
shortages can be more severe during periods of strong demand for housing or during periods following natural disasters that have a significant impact on existing residential and commercial structures. The cost of raw materials may also be materially and adversely affected during periods of shortages or high inflation. Shortages and price increases could cause delays in and increase our costs of home construction. We generally are unable to pass on increases in construction costs to customers who have already entered into home purchase contracts. Sustained increases in construction costs may adversely affect our gross margins, which in turn could materially and adversely affect our business, liquidity, financial condition and results of operations.
In addition, the cost of petroleum products, which are used both to deliver our materials and to transport workers to our job sites, fluctuates and may be subject to increased volatility as a result of geopolitical events or accidents. Changes in such costs could also result in higher prices for any product utilizing petrochemicals. These cost increases may have an adverse effect on our operating margin and results of operations and may result in a decline in the price of our common stock. Furthermore, any such cost increase may adversely affect the regional economies in which we operate and reduce demand for our homes.
Increases in our cancellation rate could have a negative impact on our home sales revenue and homebuilding margins.
Our backlog reflects sales contracts with our homebuyers for homes that have not yet been delivered. We have received a deposit from a homebuyer for each home reflected in our backlog, and generally we have the right to retain the deposit if the homebuyer fails to comply with his or her obligations under the sales contract, subject to certain exceptions, including as a result of state and local law, the homebuyer’s inability to sell his or her current home or, in certain circumstances, the homebuyer’s inability to obtain suitable financing. Home order cancellations negatively impact the number of closed homes, net new home orders, home sales revenue and results of operations, as well as the number of homes in backlog. Home order cancellations can result from a number of factors, including declines or slow appreciation in the market value of homes, increases in the supply of homes available to be purchased, increased competition, higher mortgage interest rates, homebuyers’ inability to sell their existing homes, homebuyers’ inability to obtain suitable financing, including providing sufficient down payments, and adverse changes in economic conditions. An increase in the level of our home order cancellations could have a negative impact on our business, prospects, liquidity, financial condition and results of operations.
Homebuilding is subject to product liability and warranty claims arising in the ordinary course of business that can be significant.
As a homebuilder, we are subject to home warranty and construction defect claims arising in the ordinary course of business. There can be no assurance that any developments we undertake will be free from defects once completed. Construction defects may occur on projects and developments and may arise during a significant period of time after completion. Defects arising on a development attributable to us may lead to significant contractual or other liabilities.
As a consequence, we maintain products and completed operations excess liability insurance, obtain indemnities and certificates of insurance from subcontractors generally covering claims related to damages resulting from faulty workmanship and materials, and create warranty and other reserves for the homes we sell based on historical experience in our markets and our judgment of the risks associated with the types of homes built. Although we actively monitor our insurance reserves and coverage, because of the uncertainties inherent to these matters, we cannot provide assurance that our insurance coverage, our subcontractor arrangements and our reserves will be adequate to address all of our warranty and construction defect claims in the future. In addition, contractual indemnities can be difficult to enforce. We may also be responsible for applicable self-insured retentions, and some types of claims may not be covered by insurance or may exceed applicable coverage limits. Additionally, the coverage offered by and the availability of products and completed operations excess liability insurance for construction defects is currently limited and costly. This coverage may be further restricted or become more costly in the future.
Unexpected expenditures attributable to defects or previously unknown sub-surface conditions arising on a development project may have a material adverse effect on our business, financial condition and operating results. In addition, severe or widespread incidents of defects giving rise to unexpected levels of expenditure, to the extent not covered by insurance or redress against subcontractors, may adversely affect our business, financial condition and operating results.
We may suffer uninsured losses or suffer material losses in excess of insurance limits.
We could suffer physical damage to property and liabilities resulting in losses that may not be fully compensated by insurance. In addition, certain types of risks, such as personal injury claims, may be, or may become in the future, either uninsurable or not economically insurable, or may not be currently or in the future covered by our insurance policies. Should an uninsured loss or a loss in excess of insured limits occur, we could sustain financial loss or lose capital invested in the affected property as well as anticipated future income from that property. In addition, we could be liable to repair damage or meet liabilities caused by uninsured risks. We
14
may be liable for any debt or other financial obligations related to affected property. Material losses or liabilities in excess of insurance proceeds may occur in the future.
In the United States, the coverage offered and the availability of general liability insurance for construction defects is currently limited and is costly. As a result, an increasing number of our subcontractors in the United States may be unable to obtain insurance. If we cannot effectively recover construction defect liabilities and costs of defense from our subcontractors or their insurers, or if we have self-insured, we may suffer losses. Coverage may be further restricted and become even more costly. Such circumstances could adversely affect our business, financial condition and operating results.
Our operating performance is subject to risks associated with the real estate industry.
Real estate investments are subject to various risks and fluctuations and cycles in value and demand, many of which are beyond our control. Certain events may decrease cash available for operations, as well as the value of our real estate assets. These events include, but are not limited to:
|
· |
adverse changes in financial conditions of buyers and sellers of properties, particularly residential homes and land suitable for development of residential homes; |
|
· |
adverse changes in international, national or local economic and demographic conditions; |
|
· |
competition from other real estate investors with significant capital, including other real estate operating companies and developers and institutional investment funds; |
|
· |
reductions in the level of demand for and increases in the supply of land suitable for development; |
|
· |
fluctuations in interest rates, which could adversely affect our ability, or the ability of homebuyers, to obtain financing on favorable terms, or at all; |
|
· |
unanticipated increases in expenses, including, without limitation, insurance costs, development costs, real estate assessments and other taxes and costs of compliance with laws, regulations and governmental policies; and |
|
· |
changes in enforcement of laws, regulations and governmental policies, including, without limitation, health, safety, environmental, zoning and tax laws, governmental fiscal policies and the Americans with Disabilities Act of 1990. |
In addition, periods of economic slowdown or recession, rising interest rates or declining demand for real estate, or the public perception that any of these events may occur, could result in a general decline in the purchase of homes or an increased incidence of home order cancellations. If we cannot successfully implement our business strategy, our business, prospects, liquidity, financial condition and results of operations will be adversely affected.
Because real estate investments are relatively illiquid, our ability to promptly sell one or more properties for reasonable prices in response to changing economic, financial and investment conditions may be limited and we may be forced to hold non-income producing properties for extended periods of time.
Real estate investments are relatively difficult to sell quickly. As a result, our ability to promptly sell one or more properties in response to changing economic, financial and investment conditions is limited and we may be forced to hold non-income producing assets for an extended period of time. We cannot predict whether we will be able to sell any property for the price or on the terms that we set or whether any price or other terms offered by a prospective purchaser would be acceptable to us. We also cannot predict the length of time needed to find a willing purchaser and to close the sale of a property.
If the market value of our land inventory decreases, our results of operations could be adversely affected by impairments and write-downs.
The market value of our land and housing inventories depends on market conditions. We acquire land for expansion into new markets and for replacement of land inventory and expansion within our current markets. There is an inherent risk that the value of the land owned by us may decline after purchase. The valuation of property is inherently subjective and based on the individual characteristics of each property. We may have acquired options on or bought and developed land at a cost we will not be able to recover fully or on which we cannot build and sell homes profitably. In addition, our deposits for lots controlled under option or similar contracts may be put at risk.
15
Factors, such as changes in regulatory requirements and applicable laws (including in relation to building regulations, taxation and planning), political conditions, the condition of financial markets, both local and national economic conditions, the financial condition of customers, potentially adverse tax consequences, and interest and inflation rate fluctuations, subject land valuations to uncertainty. Moreover, all valuations are made on the basis of assumptions that may not prove to reflect economic or demographic reality. If housing demand decreases below what we anticipated when we acquired our inventory, our profitability may be adversely affected and we may not be able to recover our costs when we sell and build houses.
We regularly review the value of our land holdings and continue to review our holdings on a periodic basis. If material write-downs and impairments in the value of our inventory are required in the future, we may have to sell land or homes at a loss, which could adversely affect our results of operations and financial condition.
Inflation could adversely affect our business and financial results.
Inflation could adversely affect us by increasing the costs of land, materials and labor needed to operate our business. In the event of an increase in inflation, we may seek to increase the sales prices of homes in order to maintain satisfactory margins. However, an oversupply of homes relative to demand and home prices being set several months before homes are delivered may make any such increase difficult or impossible. In addition, inflation is often accompanied by higher interest rates, which historically have had a negative impact on housing demand. In such an environment, we may not be able to raise home prices sufficiently to keep up with the rate of inflation and our margins could decrease. Moreover, the cost of capital increases as a result of inflation and the purchasing power of our cash resources declines. Current or future efforts by the government to stimulate the economy may increase the risk of significant inflation and its adverse impact on our business or financial results.
Our quarterly operating results may fluctuate because of the seasonal nature of our business and other factors.
Our quarterly operating results generally fluctuate by season. Historically, we have entered into a larger percentage of contracts for the sale of our homes during the spring and summer months. Weather-related problems, typically in the fall, late winter and early spring, may delay starts or closings and increase costs and thus reduce profitability. Seasonal natural disasters such as floods and fires could cause delays in the completion of, or increase the cost of, developing one or more of our communities, causing an adverse effect on our sales and revenues.
In many cases, we may not be able to recapture increased costs by raising prices. In addition, deliveries may be staggered over different periods of the year and may be concentrated in particular quarters. Our quarterly operating results may fluctuate because of these and other factors.
We are subject to financial reporting and other requirements as a public company for which our accounting and other management systems and resources may not be adequately prepared.
As a public company with listed equity securities, we are required to comply with certain laws, regulations and requirements, including the requirements of the Securities Exchange Act of 1934, as amended (which we refer to as the “Exchange Act”), certain corporate governance provisions of the Sarbanes-Oxley Act of 2002 (which we refer to as the “Sarbanes-Oxley Act”), related regulations of the SEC, and requirements of the New York Stock Exchange. The Exchange Act requires that we file annual, quarterly and current reports with respect to our business and financial condition. The Sarbanes-Oxley Act requires, among other things, that we maintain effective internal controls and procedures for financial reporting. Section 404 of the Sarbanes-Oxley Act requires our management and independent auditors to report annually on the effectiveness of our internal control over financial reporting.
We have completed the process of compiling the systems necessary to perform the evaluations needed to comply with Section 404 of the Sarbanes-Oxley Act. These reporting and other obligations place significant demands on our management, administrative, operational, and accounting resources and will cause us to incur significant expenses. We may in the future need to upgrade our systems or create new systems, implement additional financial and management controls, reporting systems and procedures, create or outsource an internal audit function, and hire additional accounting and finance staff. If we are unable to accomplish these objectives in a timely and effective fashion, our ability to comply with the financial reporting requirements and other rules that apply to reporting companies could be impaired. Any failure to maintain effective internal control over financial reporting could have a material adverse effect on our business, prospects, liquidity, financial condition and results of operations.
As a public company, we are obligated to maintain proper and effective internal controls over financial reporting. These internal controls may not be determined to be effective, which may adversely affect investor confidence in the Company.
16
We are required, pursuant to Section 404 of the Sarbanes-Oxley Act, to furnish a report by management on, among other things, the effectiveness of our internal control over financial reporting as of the end of our fiscal year 2017. This assessment includes disclosure of any material weaknesses identified by our management in our internal control over financial reporting.
We are also required to disclose changes made in our internal control and procedures on a quarterly basis. However, our independent registered public accounting firm may issue a report that is adverse in the event it is not satisfied with the level at which our controls are documented, designed or operating. In order to continue to maintain effective internal controls over financial reporting, we may need to undertake various actions, such as implementing new internal controls and procedures and hiring accounting or internal audit staff.
Acts of war or terrorism may seriously harm our business.
Acts of war, any outbreak or escalation of hostilities between the United States and any foreign power or acts of terrorism may cause disruption to the U.S. economy, or the local economies of the markets in which we operate, cause shortages of building materials, increase costs associated with obtaining building materials, result in building code changes that could increase costs of construction, affect job growth and consumer confidence or cause economic changes that we cannot anticipate, all of which could reduce demand for our homes and adversely impact our business, prospects, liquidity, financial condition and results of operations.
Negative publicity may affect our business performance and could affect the value of our securities.
Unfavorable media related to the Company, our industry, or Company brands, marketing, personnel, operations, business performance or prospects may affect the value of our securities and the performance of our business, regardless of its accuracy or inaccuracy. Our success in maintaining, extending and expanding our brand image depends on our ability to adapt to a rapidly changing media environment. Adverse publicity or negative commentary on social media outlets, such as blogs, websites or newsletters, could hurt operating results, as consumers might avoid brands that receive bad press or negative reviews. Negative publicity may result in a decrease in operating results that could lead to a decline in the value of our securities.
Poor relations with the residents of our communities could negatively impact sales, which could cause our revenues or results of operations to decline.
Residents of communities we develop rely on us to resolve issues or disputes that may arise in connection with the operation or development of their communities. Efforts made by us to resolve these issues or disputes could be deemed unsatisfactory by the affected residents and subsequent actions by these residents could adversely affect sales or our reputation. In addition, we could be required to make material expenditures related to the settlement of such issues or disputes or to modify our community development plans, which could adversely affect our results of operations.
Failure to manage land acquisitions and development and construction processes could result in significant cost overruns or errors in valuing sites.
We own and purchase a large number of sites each year and are therefore dependent on our ability to process a very large number of transactions (which include, among other things, evaluating the site purchase, designing the layout of the development, sourcing materials and subcontractors and managing contractual commitments) efficiently and accurately. Errors by employees, failure to comply with regulatory requirements and conduct of business rules, failings or inadequacies in internal control processes, inabilities to obtain desired approvals and entitlements, cost overruns, equipment failures, natural disasters or the failure of external systems, including those of our suppliers or counterparties, could result in operational losses that could adversely affect our business, financial condition and operating results and our relationships with our customers.
We may incur a variety of costs to engage in future growth or expansion of our operations or acquisitions or disposals of businesses, and the anticipated benefits may never be realized.
As a part of our business strategy, we may make acquisitions, or significant investments in, and/or disposals of businesses. Any future acquisitions, investments and/or disposals would be accompanied by risks such as:
|
· |
difficulties in assimilating the operations and personnel of acquired companies or businesses; |
|
· |
diversion of our management’s attention from ongoing business concerns; |
|
· |
our potential inability to maximize our financial and strategic position through the successful incorporation or disposition of operations; |
17
|
· |
maintenance of uniform standards, controls, procedures and policies; and |
|
· |
impairment of existing relationships with employees, contractors, suppliers and customers as a result of the integration of new management personnel and cost-saving initiatives. |
We cannot guarantee that we will be able to successfully integrate any company or business that we might acquire in the future, and our failure to do so could harm our current business.
In addition, we may not realize the anticipated benefits of these transactions and there may be other unanticipated or unidentified effects. While we would seek protection, for example, through warranties and indemnities in the case of acquisitions, significant liabilities may not be identified in due diligence or come to light after the expiry of warranty or indemnity periods. Additionally, while we would seek to limit our ongoing exposure, for example, through liability caps and period limits on warranties and indemnities in the case of disposals, some warranties and indemnities may give rise to unexpected and significant liabilities. Any claims arising in the future may adversely affect our business, financial condition and operating results.
Our acquisitions of the assets of Jimmy Jacobs Homes L.P. in September 2013, Las Vegas Land Holdings, LLC in April 2014, Grand View Builders in August 2014, Peachtree Communities Group, Inc. in November 2014, UCP in August 2017, and Sundquist Homes in October 2017 were accounted for as business combinations in accordance with our accounting policies and GAAP with the acquired assets and assumed liabilities recorded at their estimated fair values as of the acquisition date. Based upon estimates of the fair value of the assets to be acquired and the liabilities to be assumed, we have recorded a step-up to the historical basis of an acquired home under construction inventory. As homes are delivered in future periods, this step-up will initially result in gross margins from home sales revenues that are commensurate with the stage of completion of the acquired inventory and the related risk assumed by us for its completion. The ultimate gross margins from home sales revenues that we will be able to achieve from our acquired businesses will be impacted by (1) our ability to construct homes at prices consistent with our forecasted budgets, and (2) future pricing increases or decreases based on market demand.
We may be unable to successfully integrate our and UCP’s businesses or realize the anticipated benefits of the UCP Merger.
The UCP Merger involved the combination of two companies that previously operated as independent public companies. We are currently devoting significant management attention and resources to integrate our and UCP’s business practices and operations. Potential difficulties that we may encounter as part of the integration process include the following:
|
|
• |
|
the inability to successfully combine our and UCP’s businesses in a manner that permits us to achieve, on a timely basis, or at all, the enhanced revenue opportunities and cost savings and other benefits anticipated to result from the UCP Merger; |
|
|
• |
|
complexities associated with managing the combined businesses, including difficulty addressing possible differences in corporate cultures and management philosophies and the challenge of integrating complex systems, technology, networks and other assets of each of the companies in a seamless manner that minimizes any adverse impact on homebuying customers, suppliers, employees and other constituencies; and |
|
|
• |
|
potential unknown liabilities associated with the UCP Merger. |
In addition, it is possible that the integration process could result in:
|
|
• |
|
diversion of the attention of each company’s management; and |
|
|
• |
|
the disruption of, or the loss of momentum in, our ongoing business. |
Any of these issues could adversely affect our business and financial results.
We may be unable to realize anticipated cost synergies and expects to incur substantial expenses related to the UCP Merger, which could have a material adverse effect on our business, financial condition and results of operations.
Following the consummation of the UCP Merger, we expect to realize annualized cost synergies of approximately $10.0 million beginning in 2018.
18
While we believe these cost synergies are achievable, our ability to achieve such estimated cost synergies in the timeframe described, or at all, is subject to various assumptions by our management, which may or may not be realized, as well as the incurrence of other costs in our operations that offset all or a portion of such cost synergies. As a consequence, we may not be able to realize all of these cost synergies within the timeframe expected or at all. In addition, we may incur additional and/or unexpected costs in order to realize these cost synergies. Failure to achieve the expected cost synergies could significantly reduce the expected benefits associated with the UCP Merger and adversely affect us.
We expect to continue to incur non-recurring costs associated with consummating the UCP Merger, combining the operations of the two companies, and achieving the desired cost synergies. These fees and costs have been, and will continue to be, substantial. The substantial majority of non-recurring expenses will consist of transaction costs related to the UCP Merger and include, among others, fees paid to legal, accounting and financial advisors, employee benefit costs, and filing and printing fees.
These costs described above, as well as other unanticipated costs and expenses, could have a material adverse effect on our financial condition and operating results.
We are expected to incur substantial expenses in connection with the integration process related to the UCP Merger.
We are expected to incur substantial expenses in connection with the integration process related to the UCP Merger. There are a large number of processes, policies, procedures, operations, technologies and systems that may need to be integrated, including purchasing, accounting and finance, sales, payroll, pricing and benefits. While we have assumed that a certain level of expenses will be incurred, there are many factors beyond our control that could affect the total amount or the timing of the integration expenses. Moreover, many of the expenses that will be incurred are, by their nature, difficult to estimate accurately. These expenses could, particularly in the near term, exceed the savings that we expect to achieve from the elimination of duplicative expenses and the realization of economies of scale and cost savings. These integration expenses likely will result in us taking significant charges against earnings, and the amount and timing of such charges are uncertain at present.
Our future results will suffer if we do not effectively manage our expanded operations.
As a result of the UCP Merger, the size of our business has increased significantly. Our future success will depend, in part, upon our ability to manage this expanded business, which will pose substantial challenges for management, including challenges related to the management and monitoring of new operations and associated increased costs and complexity. There can be no assurances that we will be successful or that we will realize the expected operating efficiencies, cost savings, revenue enhancements or other benefits from the UCP Merger.
We may not be able to continue to grow through acquisitions.
In the past, we have sought growth through acquisitions of, or significant investments in, businesses that offer complementary products and services or otherwise support our growth objectives. However, we cannot assure you that we will continue to identify attractive acquisition targets and consummate acquisitions. As a result of the UCP Merger and the incurrence of debt in connection therewith, the amount of our indebtedness is significantly higher than prior to the consummation of the UCP Merger. As a result, we cannot assure you that we will be able to arrange financing for future acquisitions on terms acceptable to us. In addition, the combined company is substantially larger than we have been in the past, and we may face additional scrutiny in connection with federal and state governmental approvals in connection with any future acquisitions of attractive targets or may not be able to obtain such approvals at all. The realization of any of these risks could adversely affect our business.
We may be subject to various risks relating to our plan to vertically integrate mortgage lending into our business.
We are in the process of vertically integrating mortgage lending into our business, which will enable us to provide financing to our homebuyers. There are risks involved with engaging in the mortgage lending business, including establishing sufficient stringent underwriting standards, so as to limit the level of foreclosures experienced on mortgages originated by us. We may hold some of the loans we originate to maturity; however, in order to finance our planned mortgage business, we will most likely sell the loans we originate, either as whole loans or pursuant to a securitization. It is customary in connection with such transactions for the originator, such as we would be, to make representations and warranties to the purchasers, guarantors and insurers about the mortgage loans and the manner in which they were originated and to offer certain indemnities and guaranties to the purchasers, guarantors and insurers. In the event of defaults on the loans we originate, we may be required to repurchase or substitute mortgage loans, or indemnify buyers, guarantors or insurers of our loans. Because we have limited experience in originating and underwriting home loans, our underwriting standards may not be as stringent as a more traditional lender, and accordingly, we may experience a higher rate of default than lenders who have engaged in the mortgage lending industry for a longer period of time. Moreover, the loans we originate will be limited primarily to buyers of our homes, so our pool of borrowers will be less diverse than as would be the case with a traditional lender, and thus there could be a higher correlation in the default rate with our borrowers. In addition, because we would be originating loans to buyers of our homes, there is the risk that we may be more incentivized, compared to more traditional lenders, to lower our underwriting
19
standards in order to close home sales. Should our underwriting standards not adequately screen quality applicants, the default rate on the loans we originate may be higher, which could have an adverse impact on our results of operations and financial condition, either because the loans we own are no longer performing or because we are required to repurchase or otherwise indemnify purchasers, guarantors or insurers of the loans we sell or securitize.
Risk Related to Conflicts of Interest
As a result of Dale Francescon’s and Robert Francescon’s relationship with the Company, conflicts of interest may arise with respect to any transactions involving or with Dale Francescon, Robert Francescon, or their affiliates, and their interests may not be aligned with yours.
Dale Francescon and Robert Francescon are our Co-Chief Executive Officers, sit on our board of directors, and collectively beneficially own 3,894,572 shares of our common stock, which represents 13.2% of our common stock outstanding as of December 31, 2017. For so long as Dale Francescon and Robert Francescon continue to beneficially own a significant stake in us, they will have significant influence over the power to:
|
· |
elect our directors and exercise overall control over the Company; |
|
· |
agree to sell or otherwise transfer a controlling stake in the Company; and |
|
· |
determine the outcome of substantially all actions requiring the majority approval of our stockholders, including transactions with related parties, corporate reorganizations, mergers, acquisitions and dispositions of assets. |
The interests of Dale Francescon and Robert Francescon may not be fully aligned with yours, and this could lead to a strategy that is not in your best interests. In addition, their significant ownership in us and resulting ability to effectively control us will limit your ability to influence corporate matters and may discourage someone from making a significant equity investment in us, or could discourage transactions involving a change in control.
In addition, there may be transactions between us and Dale Francescon, Robert Francescon, or their affiliates that could present an actual or perceived conflict of interest. These conflicts of interest may lead Dale and/or Robert Francescon to recuse himself or themselves from actions of our board of directors with respect to any transactions involving or with Dale or Robert Francescon or their affiliates. For example, we have entered into employment agreements with Dale Francescon and Robert Francescon, our Co-Chief Executive Officers, in their capacities as officers, pursuant to which they are required to devote substantially full-time attention to our affairs. These employment agreements were not negotiated on an arm’s-length basis. We may choose not to enforce, or to enforce less vigorously, our rights under these agreements because of our desire to maintain our ongoing relationship with Dale Francescon and Robert Francescon.
Risks Related to Our Indebtedness
We use and expect to continue to use leverage in executing our business strategy, which may adversely affect the return on our assets.
We may incur a substantial amount of debt in the future. As of December 31, 2017, we had approximately $824.6 million in outstanding indebtedness, consisting of $379.2 million outstanding on our 6.875% Senior Notes due 2022 (which we refer to as our “Existing 6.875% Notes”), $394.7 million outstanding on our 5.875% Senior Notes due 2025 (which we refer to as our “Existing 5.875% Notes”), $48.3 million outstanding on our mortgage repurchase facilities, and $2.3 million outstanding on other financing obligations.
As of December 31, 2017, we had $400 million of available borrowing capacity, with no borrowings outstanding, under our revolving credit facility. Our board of directors will consider a number of factors when evaluating our level of indebtedness and when making decisions regarding the incurrence of new indebtedness, including the purchase price of assets to be acquired with debt financing, the estimated market value of our assets and the ability of particular assets, and the Company as a whole, to generate cash flow to cover the expected debt service. Our charter does not contain a limitation on the amount of debt we may incur and our board of directors may change our target debt levels at any time without the approval of our stockholders.
Incurring a substantial amount of debt could have important consequences for our business, including:
20
|
· |
making it more difficult for us to satisfy our obligations with respect to our debt or to our trade or other creditors; |
|
· |
increasing our vulnerability to adverse economic or industry conditions; |
|
· |
limiting our ability to obtain additional financing to fund capital expenditures and acquisitions, particularly when the availability of financing in the capital markets is limited; |
|
· |
requiring a substantial portion of our cash flows from operations for the payment of interest on our debt and reducing our ability to use our cash flows to fund working capital, capital expenditures, acquisitions and general corporate requirements; |
|
· |
limiting our flexibility in planning for, or reacting to, changes in our business and the industry in which we operate; and |
|
· |
placing us at a competitive disadvantage to less leveraged competitors. |
We cannot assure you that our business will generate sufficient cash flow from operations or that future borrowings will be available to us through capital markets financings or under our credit facilities or otherwise in an amount sufficient to enable us to pay our indebtedness, or to fund our other liquidity needs. We may need to refinance all or a portion of our indebtedness, on or before its maturity. We cannot assure you that we will be able to refinance any of our indebtedness on commercially reasonable terms, or at all. In addition, we may incur additional indebtedness in order to finance our operations or to repay existing indebtedness. If we cannot service our indebtedness, we may have to take actions such as selling assets, seeking additional debt or equity or reducing or delaying capital expenditures, strategic acquisitions, investments and alliances. We cannot assure you that any such actions, if necessary, could be effected on commercially reasonable terms, or at all, or on terms that would be advantageous to our stockholders or on terms that would not require us to breach the terms and conditions of our existing or future debt agreements.
Access to financing sources may not be available on favorable terms, or at all, especially in light of current market conditions, which could adversely affect our ability to maximize our returns.
We expect to employ prudent levels of leverage to finance the acquisition and development of our lots and construction of our homes. Our access to additional third-party sources of financing will depend, in part, on:
|
· |
general market conditions; |
|
· |
the market’s perception of our growth potential; |
|
· |
with respect to acquisition and/or development financing, the market’s perception of the value of the land parcels to be acquired and/or developed; |
|
· |
our current debt levels; |
|
· |
our current and expected future earnings; |
|
· |
our cash flow; and |
|
· |
the market price per share of our common stock. |
If the capital and credit markets experience increased volatility or weakness, potential lenders may be unwilling or unable to provide us with financing that is attractive to us or may charge us prohibitively high fees in order to obtain financing. In such a situation, investment returns on our assets and our ability to make acquisitions could be adversely affected by our inability to secure additional financing on reasonable terms, if at all.
In addition, while we have not encountered any such issues to date, if the credit rating agencies that rate our debt were to downgrade our credit ratings, it would likely increase our cost of capital and make it more difficult for us to obtain new financing and access the capital and credit markets, which could also have a material adverse effect on our business, financial condition, results of operations, or cash flows.
Depending on market conditions at the relevant time, we may have to rely more heavily on additional equity financings or on less efficient forms of debt financing that require a larger portion of our cash flow from operations, thereby reducing funds available for our
21
operations, future business opportunities and other purposes. We may not have access to such equity or debt capital on favorable terms at the desired times, or at all.
Interest expense on debt we will incur may limit our cash available to fund our growth strategies.
As of December 31, 2017, we had approximately $824.6 million in outstanding indebtedness, consisting of $379.2 million outstanding on our Existing 6.875% Notes, $394.7 million outstanding on our Existing 5.875% Notes, $48.3 million outstanding on our mortgage repurchase facilities, and $2.3 million outstanding on other financing obligations.
As of December 31, 2017, we had $400.0 million of available borrowing capacity, with no borrowings outstanding, under our revolving credit facility. As part of our growth strategy, we may incur a significant amount of additional debt. Certain of our current debt has, and any additional debt we subsequently incur may have, a floating rate of interest. Higher interest rates could increase debt service requirements on our current floating rate debt and on any floating rate debt we subsequently incur, and could reduce funds available for operations, future business opportunities or other purposes. If we need to repay existing debt during periods of rising interest rates, we could be required to refinance our then-existing debt on unfavorable terms or liquidate one or more of our assets to repay such debt at times which may not permit realization of the maximum return on such assets and could result in a loss. The occurrence of either such event or both could materially and adversely affect our cash flows and results of operations.
Interest rate changes may adversely affect us.
We currently do not hedge against interest rate fluctuations. We may obtain in the future one or more forms of interest rate protection—in the form of swap agreements, interest rate cap contracts or similar agreements—to hedge against the possible negative effects of interest rate fluctuations. However, we cannot assure you that any hedging will adequately relieve the adverse effects of interest rate increases or that counterparties under these agreements will honor their obligations thereunder. In addition, we may be subject to risks of default by hedging counterparties. Adverse economic conditions could also cause the terms on which we borrow to be unfavorable. We could be required to liquidate one or more of our assets at times which may not permit us to receive an attractive return on our assets in order to meet our debt service obligations.
Our current financing arrangements contain, and our future financing arrangements likely will contain, restrictive covenants relating to our operations.
Our current financing arrangements contain, and the financing arrangements we enter into in the future likely will contain, covenants (financial and otherwise) affecting our ability to incur additional debt, make certain investments, reduce liquidity below certain levels, make distributions to our stockholders and otherwise affect our operating policies. The restrictions contained in our financing arrangements could also limit our ability to plan for or react to market conditions, meet capital needs or make acquisitions or otherwise restrict our activities or business plans. If we fail to meet or satisfy any of these covenants in our debt agreements we would be in default under these agreements, and our lenders could elect to declare outstanding amounts due and payable, terminate their commitments, require the posting of additional collateral or enforce their respective interests against existing collateral. A default also could limit significantly our financing alternatives, which could cause us to curtail our investment activities and/or dispose of assets when we otherwise would not choose to do so. If we default on several of our debt agreements or any single significant debt agreement, it could have a material adverse effect on our business, prospects, liquidity, financial condition and results of operations.
We may not be able to generate sufficient cash flow to meet our debt service obligations.
Our ability to generate sufficient cash flow from operations to make scheduled payments on our debt obligations will depend on our current and future financial performance, which is subject to general economic, financial, competitive, legislative, regulatory and other factors that are beyond our control. In the future, we may fail to generate sufficient cash flow from the sales of our homes and land to meet our cash requirements. Further, our capital requirements may vary materially from those currently planned if, for example, our revenues do not reach expected levels or we have to incur unforeseen capital expenditures and make investments to maintain our competitive position. If we do not generate sufficient cash flow from operations to satisfy our debt obligations, including interest payments and the payment of principal at maturity, we may have to undertake alternative financing plans, such as refinancing or restructuring our debt, selling assets, reducing or delaying capital investments or seeking to raise additional capital. We cannot provide assurance that any refinancing would be possible, that any assets could be sold, or, if sold, of the timeliness and amount of proceeds realized from those sales, that additional financing could be obtained on acceptable terms, if at all, or that additional financing would be permitted under the terms of our various debt instruments then in effect. Furthermore, our ability to refinance would depend upon the condition of the finance and credit markets. Our inability to generate sufficient cash flow to satisfy our debt obligations, or to refinance our obligations on commercially reasonable terms or on a timely basis, would materially affect our business, financial condition or results of operations and may delay or prevent the expansion of our business.
22
The agreements governing our debt include provisions that may restrict our financial and business operations, but may not necessarily restrict our ability to take actions that may impair our ability to repay our debt.
The agreements governing our indebtedness, including our revolving credit facility and the indentures that govern our senior notes, contain negative covenants customary for such financings, such as limiting our ability to sell or dispose of assets, incur additional indebtedness or liens, make certain restricted payments, make certain investments, consummate mergers, consolidations or other business combinations or engage in other lines of business. These restrictions may interfere with our ability to engage in other necessary or desirable business activities, which could materially affect our business, financial condition or results of operations.
Our revolving credit facility also requires us to comply with certain financial ratios and covenants, such as maximum consolidated leverage ratios, minimum consolidated interest coverage ratios and minimum tangible net worth. Our ability to comply with these covenants depends on our financial condition and performance and also is subject to events outside our control. Asset write-downs, other non-cash charges and other one-time events also impact our ability to comply with these covenants. In addition, these restrictions may interfere with our ability to obtain financing or to engage in other necessary or desirable business activities, which may have a material effect on our operations. These covenants are subject to important exceptions and qualifications. Moreover, if we fail to comply with these covenants and are unable to obtain a waiver or amendment, an event of default would result. Our revolving credit facility and other debt agreements, including the indentures governing our senior notes, also contain other events of default customary for such financings. We cannot provide assurance that we would have sufficient liquidity to repay or refinance our debt if such amounts were accelerated upon an event of default. If we are unable to service our debt, this could materially affect our business, financial condition or results of operations.
We may require additional capital in the future and may not be able to secure adequate funds on terms acceptable to us.
The expansion and development of our business may require significant capital, which we may be unable to obtain, to fund our capital expenditures and operating expenses, including working capital needs. In accordance with our growth strategy, we expect to opportunistically raise additional debt capital to help fund the growth of our business, subject to market and other conditions, but such debt capital may not be available to us on a timely basis at reasonable rates, or at all.
In the future, we may fail to generate sufficient cash flow from the sales of our homes and land to meet our cash requirements. Further, our capital requirements may vary materially from those currently planned if, for example, our revenues do not reach expected levels or we have to incur unforeseen capital expenditures and make investments to maintain our competitive position. If this is the case, we may require additional financing sooner than anticipated or we may have to delay or abandon some or all of our development and expansion plans or otherwise forego market opportunities.
To a large extent, our cash flow generating ability is subject to general economic, financial, competitive, legislative and regulatory factors and other factors that are beyond our control. We cannot assure you that our business will generate cash flow from operations in an amount sufficient to enable us to fund our liquidity needs. As a result, we may need to refinance all or a portion of our debt, on or before its maturity, or obtain additional equity or debt financing. We cannot assure you that we will be able to do so on favorable terms, if at all. Any inability to generate sufficient cash flow, refinance our debt or incur additional debt on favorable terms could adversely affect our financial condition and could cause us to be unable to service our debt and may delay or prevent the expansion of our business.
We are dependent upon payments from our subsidiaries to fund payments on our indebtedness and our ability to receive funds from our subsidiaries is dependent upon the profitability of our subsidiaries and restrictions imposed by law and contracts.
We are dependent on the cash flow of, and dividends and distributions to us from, our subsidiaries in order to service our existing indebtedness. Our subsidiaries are separate and distinct legal entities and have no obligation, contingent or otherwise, to pay any amounts due pursuant to any indebtedness of ours or to make any funds available therefor, except for those subsidiaries that have guaranteed our obligations under our outstanding indebtedness. The ability of our subsidiaries to pay any dividends and distributions will be subject to, among other things, the terms of any debt instruments of our subsidiaries then in effect as well as among other things, the availability of profits or funds and requirements of applicable laws, including surplus, solvency and other limits imposed on the
23
ability of companies to pay dividends. There can be no assurance that our subsidiaries will generate cash flow sufficient to pay dividends or distributions to us that enable us to pay interest or principal on our existing indebtedness.
Risks Related to Our Organization and Structure
We depend on key personnel.
Our success depends to a significant degree upon the contributions of certain key personnel including, but not limited to, Dale Francescon and Robert Francescon, our Co-Chief Executive Officers, each of whom would be difficult to replace. Although we have entered into employment agreements with Dale Francescon and Robert Francescon, in their capacities as officers, there is no guarantee that these executives will remain employed with us. If any of our key personnel were to cease employment with us, our operating results could suffer. Further, the process of attracting and retaining suitable replacements for key personnel whose services we may lose would result in transition costs and would divert the attention of other members of our senior management from our existing operations. The loss of services from key personnel or a limitation in their availability could materially and adversely impact our business, prospects, liquidity, financial condition and results of operations. Further, such a loss could be negatively perceived in the capital markets. We have not obtained and do not expect to obtain key man life insurance that would provide us with proceeds in the event of death or disability of any of our key personnel.
Termination of the employment agreements with the members of our management team could be costly and prevent a change in control of the Company.
The employment agreements we have entered into with Dale Francescon and Robert Francescon, our Co-Chief Executive Officers, in their capacities as officers, each provide that if their employment with us terminates under certain circumstances, we may be required to pay them significant amounts of severance compensation, thereby making it costly to terminate their employment. Furthermore, these provisions could delay or prevent a transaction or a change in control of the Company that might involve a premium paid for shares of our common stock or otherwise be in the best interests of our stockholders, which could adversely affect the market price of our common stock.
Certain anti-takeover defenses and applicable law may limit the ability of a third party to acquire control of the Company.
Our charter and bylaws and Delaware law contain provisions that may delay or prevent a transaction or a change in control of the Company that might involve a premium paid for shares of our common stock or otherwise be in the best interests of our stockholders, which could adversely affect the market price of our common stock. Certain of these provisions are described below.
Selected provisions of our charter and bylaws. Our charter and/or bylaws contain anti-takeover provisions that:
|
· |
authorize our board of directors, without further action by the stockholders, to issue up to 50 million shares of preferred stock in one or more series, and with respect to each series, to fix the number of shares constituting that series, the powers, rights and preferences of the shares of that series, and the qualifications, limitations and restrictions of that series; |
|
· |
require that actions to be taken by our stockholders may be taken only at an annual or special meeting of our stockholders and not by written consent; |
|
· |
specify that special meetings of our stockholders can be called only by our board of directors, the chairman of our board of directors, our chief executive officer, or our president; |
|
· |
provide that our bylaws may be amended by our board of directors without stockholder approval; |
|
· |
provide that directors may be removed from office only by the affirmative vote of the holders of 66 2/3% of the voting power of our capital stock entitled to vote generally in the election of directors; |
|
· |
provide that vacancies on our board of directors or newly created directorships resulting from an increase in the number of our directors may be filled only by a vote of a majority of directors then in office, even though less than a quorum; |
|
· |
provide that, subject to the express rights, if any, of the holders of any series of preferred stock, any amendment, modification or repeal of, or the adoption of any new or additional provision, inconsistent with our charter provisions relating to the removal of directors, exculpation of directors, indemnification, the prohibition against stockholder action by written consent, and the
24
|
vote of our stockholders required to amend our bylaws requires the affirmative vote of the holders of at least 66 2/3% of the voting power of our capital stock entitled to vote generally in the election of directors; |
|
· |
provide that the stockholders may amend, modify or repeal our bylaws, or adopt new or additional provisions of our bylaws, only with the affirmative vote of 66 2/3% of the voting power of our capital stock entitled to vote generally; and |
|
· |
establish advance notice procedures for stockholders to submit nominations of candidates for election to our board of directors and other proposals to be brought before a stockholders meeting. |
Selected provisions of Delaware law. We are a Delaware corporation, and we have elected to be subject to Section 203 of the DGCL by provision of our charter. In general, Section 203 of the DGCL prevents an “interested stockholder” (as defined in the DGCL) from engaging in a “business combination” (as defined in the DGCL) with us for three years following the date that person becomes an interested stockholder unless one or more of the following occurs:
|
· |
Before that person became an interested stockholder, our board of directors approved the transaction in which the interested stockholder became an interested stockholder or approved the business combination; |
|
· |
Upon consummation of the transaction that resulted in the interested stockholder becoming an interested stockholder, the interested stockholder owned at least 85% of our voting stock outstanding at the time the transaction commenced, excluding for purposes of determining the voting stock outstanding (but not the outstanding voting stock owned by the interested stockholder) stock held by directors who are also officers of the Company and by employee stock plans that do not provide employees with the right to determine confidentially whether shares held under the plan will be tendered in a tender or exchange offer; or |
|
· |
Following the transaction in which that person became an interested stockholder, the business combination is approved by our board of directors and authorized at a meeting of stockholders by the affirmative vote of the holders of at least 66 2/3% of our outstanding voting stock not owned by the interested stockholder. |
The DGCL generally defines “interested stockholder” as any person who, together with affiliates and associates, is the owner of 15% or more of our outstanding voting stock or is our affiliate or associate and was the owner of 15% or more of our outstanding voting stock at any time within the three-year period immediately before the date of determination.
We may change our operational policies, investment guidelines and business and growth strategies without stockholder consent, which may subject us to different and more significant risks in the future.
Our board of directors determines our operational policies, investment guidelines and business and growth strategies. Our board of directors may make changes to, or approve transactions that deviate from, those policies, guidelines and strategies without a vote of, or notice to, our stockholders. Under any of these circumstances, we may expose ourselves to different and more significant risks in the future, which could have a material adverse effect on our business, prospects, liquidity, financial condition and results of operations.
If we fail to maintain an effective system of internal controls, we may not be able to accurately determine our financial results or prevent fraud. As a result, our stockholders could lose confidence in our financial results, which could materially and adversely affect us.
Effective internal controls are necessary for us to provide reliable financial reports and effectively prevent fraud. There is no assurance that material weaknesses or significant deficiencies will not be identified in the future or that we will be successful in adequately remediating any such material weaknesses and significant deficiencies. We may in the future discover areas of our internal controls that need improvement. We cannot be certain that we will be successful in maintaining adequate internal control over our financial reporting and financial processes. Furthermore, as we grow our business, our internal controls will become more complex, and we will require significantly more resources to ensure our internal controls remain effective. Additionally, the existence of any material weakness or significant deficiency would require management to devote significant time and incur significant expense to remediate any such material weaknesses or significant deficiencies and management may not be able to remediate any such material weaknesses or significant deficiencies in a timely manner. The existence of any material weakness in our internal control over financial reporting could also result in errors in our financial statements that could require us to restate our financial statements again, cause us to fail to meet our reporting obligations and cause stockholders to lose confidence in our reported financial information, all of which could materially and adversely affect us.
25
Changes in accounting rules, assumptions and/or judgments could materially and adversely affect us.
Accounting rules and interpretations for certain aspects of our operations are highly complex and involve significant assumptions and judgment. These complexities could lead to a delay in the preparation and dissemination of our financial statements. Furthermore, changes in accounting rules and interpretations or in our accounting assumptions and/or judgments, such as asset impairments, could significantly impact our financial statements. In some cases, we could be required to apply a new or revised standard retroactively, resulting in restating prior period financial statements. Any of these circumstances could have a material adverse effect on our business, prospects, liquidity, financial condition and results of operations.
We may face substantial damages or be enjoined from pursuing important activities as a result of existing or future litigation, arbitration or other claims.
In our homebuilding activities, we are exposed to potentially significant litigation, including breach of contract, contractual disputes and disputes relating to defective title, property misdescription or construction defects, including use of defective materials. Although we have established warranty, claim and litigation reserves that we believe are adequate, due to the uncertainty inherent in litigation, legal proceedings may result in the award of substantial damages against us beyond our reserves. Furthermore, plaintiffs may in certain of these legal proceedings seek class action status with potential class sizes that vary from case to case. Class action lawsuits can be costly to defend, and if we were to lose any certified class action suit, it could result in substantial liability for us. In addition, we are subject to potential lawsuits, arbitration proceedings and other claims in connection with our business.
With respect to certain general liability exposures, including construction defect and product liability claims, interpretation of underlying current and future trends, assessment of claims and the related liability and reserve estimation process require us to exercise significant judgment due to the complex nature of these exposures, with each exposure often exhibiting unique circumstances. Furthermore, once claims are asserted for construction defects, it is difficult to determine the extent to which the assertion of these claims will expand geographically. As a result, our insurance policies may not be available or adequate to cover any liability for damages, the cost of repairs, and/or the expense of litigation surrounding current claims, and future claims may arise out of events or circumstances not covered by insurance and not subject to effective indemnification agreements with our subcontractors. Should such a situation arise, it may have a material adverse effect on our business, financial condition and operating results.
Failure by our directors, officers or employees to comply with applicable codes of conduct could materially and adversely affect us.
We have adopted a code of business conduct and ethics for our directors, officers and any employees. Our adoption of this code and other standards of conduct is not a representation or warranty that all persons subject to this code or standards are or will be in complete compliance. The failure of a director, officer or employee to comply with the applicable code or standards of conduct may result in termination of the relationship and/or adverse publicity, which could materially and adversely affect us.
Any joint venture investments that we make could be adversely affected by our lack of sole decision making authority, our reliance on co-venturers’ financial conditions and disputes between us and our co-venturers.
On November 1, 2016, we acquired a 50% ownership of WJH LLC (which we refer to as “WJH”), which is a successor to Wade Jurney Homes, Inc. and Wade Jurney of Florida, Inc. WJH primarily targets first-time homebuyers in the Southeastern United States. The Company and Mr. Wade Jurney will share responsibility for all of WJH’s strategic decisions, with Mr. Wade Jurney continuing to manage the day-to-day operations under the existing operating model.
Although it is currently not a focus in our business strategy, we may in the future continue to co-invest with third parties through partnerships, joint ventures or other entities, acquiring non-controlling interests in or sharing responsibility for managing the affairs of a land acquisition and/or a development. In this event, we would not be in a position to exercise sole decision-making authority regarding the acquisition and/or development, and our investment may be illiquid due to our lack of control. Investments in partnerships, joint ventures, or other entities may, under certain circumstances, involve risks not present were a third party not involved, including the possibility that partners or co-venturers might become bankrupt, fail to fund their share of required capital contributions, make poor business decisions or block or delay necessary decisions. Partners or co-venturers may have economic or other business interests or goals which are inconsistent with our business interests or goals, and may be in a position to take actions contrary to our policies or objectives. Such investments may also have the potential risk of impasses on decisions, such as a sale, because neither we nor the partner or co-venturer would have full control over the partnership or joint venture. Disputes between us and partners or co-venturers may result in litigation or arbitration that would increase our expenses and prevent our officers and/or directors from focusing their time and effort on our business. In addition, we may in certain circumstances be liable for the actions of our third-party partners or co-venturers.
26
An information systems interruption or breach in security could adversely affect us.
We rely on accounting, financial and operational management information systems to conduct our operations. Any disruption in these systems could adversely affect our ability to conduct our business. Furthermore, any security breach of information systems or data could result in a violation of applicable privacy and other laws, significant legal and financial exposure, damage to our reputation, and a loss of confidence in our security measures, which could harm our business.
Risks Related to Ownership of our Common Stock
A trading market for our common stock may not be sustained and our common stock prices could decline.
Although our common stock is listed on the New York Stock Exchange under the symbol, “CCS,” an active trading market for the shares of our common stock may not be sustained. Accordingly, no assurance can be given as to the following:
|
· |
the likelihood that an active trading market for shares of our common stock will be sustained; |
|
· |
the liquidity of any such market; |
|
· |
the ability of our stockholders to sell their shares of common stock; or |
|
· |
the price that our stockholders may obtain for their common stock. |
In addition, our common stock has experienced price and volume volatility over the past year. The market price and volume of our common stock may continue to experience fluctuations not only due to general stock market conditions but also due to government regulatory action, tax laws, interest rates and a change a change in sentiment in the market regarding our industry, operations or business prospects. In addition to the other risk factors discussed in this section, the price and volume volatility of our common stock may be affected by:
|
· |
factors influencing home purchases, such as availability of home mortgage loans and interest rates, credit criteria applicable to prospective borrowers, ability to sell existing residences, and homebuyer sentiment in general; |
|
· |
the operating and securities price performance of companies that investors consider comparable to us; |
|
· |
announcements of strategic developments, acquisitions and other material events by us or our competitors; |
|
· |
changes in global financial markets and global economies and general market conditions, such as interest rates, commodity and equity prices and the value of financial assets; |
|
· |
additions or departures of key personnel; |
|
· |
operating results that vary from the expectations of securities analysts and investors; |
|
· |
actions by stockholders; and |
|
· |
passage of legislation or other regulatory developments that adversely affect us or the homebuilding industry. |
If an active market is not maintained, or if our common stock continues to experience price and volume volatility, the market price of our common stock may decline.
Furthermore, our ability to raise funds through the issuance of equity or otherwise use our common stock as consideration is impacted by the price of our common stock. A low stock price may adversely impact our ability to reduce our financial leverage, as measured by the ratio of total debt to total capital. Continued high levels of leverage or significant increases may adversely affect our credit ratings and make it more difficult for us to access additional capital. These factors may limit our ability to implement our operating and growth plans.
27
If securities analysts do not publish, or cease publishing, research or reports about us, our business or our market, or if they change their recommendations regarding our stock adversely, the price of our common stock and trading volume could decline.
The trading market for our common stock could be influenced by any research and reports that securities or industry analysts publish about us, our business or our market. If one or more of the analysts who covers us downgrades our common stock or publishes inaccurate or unfavorable research about us, our business or our market, the price of our common stock would likely decline. If one or more of these analysts ceases coverage of us or fails to publish reports on us regularly, demand for our common stock could decrease, which could cause the price of our common stock and trading volume to decline.
Future offerings of debt securities, which would rank senior to our common stock upon our bankruptcy liquidation, and future offerings of equity securities that may be senior to our common stock for the purposes of dividend and liquidating distributions, may adversely affect the market price of our common stock.
In the future, we may attempt to increase our capital resources by making offerings of debt securities or additional offerings of equity securities. Upon bankruptcy or liquidation, holders of our debt securities and lenders with respect to other borrowings will receive a distribution of our available assets prior to the holders of our common stock. Additional equity offerings may dilute the holdings of our existing stockholders or reduce the market price of our common stock, or both. Our preferred stock, if issued, could have a preference on liquidating distributions or a preference on dividend payments or both that could limit our ability to pay dividends or make liquidating distributions to the holders of our common stock. Our decision to issue securities in any future offering will depend on market conditions and other factors beyond our control. As a result, we cannot predict or estimate the amount, timing or nature of our future offerings, and purchasers of our common stock bear the risk of our future offerings reducing the market price of our common stock and diluting their ownership interest in the Company.
Non-U.S. holders may be subject to United States federal income tax on gain realized on the sale or disposition of shares of our common stock.
Because of our holdings in United States real property interests, we believe we are and will remain a “United States real property holding corporation” (which we refer to as “USRPHC”) for United States federal income tax purposes. As a USRPHC, our stock may be treated as a United States real property interest (which we refer to as “USRPI”), gains from the sale of which by non-U.S. holders would be subject to U.S. income tax and reporting obligations pursuant to the Foreign Investment in Real Property Tax Act (which we refer to as “FIRPTA”). Our common stock will not be treated as a USRPI if it is regularly traded on an established securities market, except in the case of a non-U.S. holder that actually or constructively holds more than five percent of such class of stock at any time during the shorter of the five-year period preceding the date of disposition or the holder’s holding period for such stock. We anticipate that our common stock will continue to be regularly traded on the New York Stock Exchange. However, no assurance can be given in this regard and no assurance can be given that our common stock will remain regularly traded in the future. If our stock is treated as a USRPI, a non-U.S. holder would be subject to regular United States federal income tax with respect to any gain on such stock in the same manner as a taxable U.S. holder (subject to any applicable alternative minimum tax and a special alternative minimum tax in the case of nonresident alien individuals). In addition, the purchaser of the stock would be required to withhold and remit to the IRS 10% of the purchase price unless an exception applies. A non-U.S. holder also would be required to file a U.S. federal income tax return for any taxable year in which it realizes a gain from the disposition of our common stock that is subject to U.S. federal income tax.
Non-U.S. holders should consult their tax advisors concerning the consequences of disposing of shares of our common stock.
ITEM 1B.UNRESOLVED STAFF COMMENTS.
None.
We lease our corporate headquarters located at 8390 East Crescent Parkway, Suite 650, Greenwood Village, Colorado. We also lease offices in the markets where we conduct business, but none of these properties are material to the operation of our business.
28
Because of the nature of the homebuilding business, we and certain of our subsidiaries and affiliates have been named as defendants in various claims, complaints and other legal actions arising in the ordinary course of business. In the opinion of our management, the outcome of these ordinary course matters will not have a material adverse effect upon our financial condition, results of operations or cash flows.
ITEM 4.MINE SAFETY DISCLOSURES.
Not applicable.
ITEM 5.MARKET FOR REGISTRANT’S COMMON EQUITY, RELATED STOCKHOLDER MATTERS AND ISSUER PURCHASES OF EQUITY SECURITIES.
Market Information
The shares of our common stock are listed on the New York Stock Exchange under the symbol, “CCS.” The following table sets forth high and low closing price ranges of our common stock for the periods indicated in the years ended December 31, 2017 and 2016, as reported by the New York Stock Exchange.
|
|
|
|
|
|
|
|
|
Quarter Ended in 2017 |
|
High |
|
Low |
||
|
March 31, |
|
$ |
25.40 |
|
$ |
20.75 |
|
June 30, |
|
$ |
27.90 |
|
$ |
24.35 |
|
September 30, |
|
$ |
26.10 |
|
$ |
21.95 |
|
December 31, |
|
$ |
31.35 |
|
$ |
25.20 |
|
|
|
|
|
|
|
|
|
Quarter Ended in 2016 |
|
High |
|
Low |
||
|
March 31, |
|
$ |
17.07 |
|
$ |
13.47 |
|
June 30, |
|
$ |
18.85 |
|
$ |
16.20 |
|
September 30, |
|
$ |
21.51 |
|
$ |
17.15 |
|
December 31, |
|
$ |
21.60 |
|
$ |
19.20 |
Holders
As of February 27, 2018, there were approximately 70 stockholders of record of our common stock. On February 27, 2018, the last reported sale price of our common stock on the New York Stock Exchange was $31.15 per share.
Dividends
During the years ended December 31, 2017 and 2016, we did not declare or pay any dividends.
Stock Performance Graph
The graph below compares the cumulative total return of our common stock, the S&P 500 Index, the Dow Jones US Home Construction Index, and peer group companies for the periods from June 18, 2014, the date our common stock commenced trading on the New York Stock Exchange, to December 31, 2016.
It is assumed in the graph that $100 was invested in (1) our common stock; (2) the stocks of the companies in the Standard & Poor’s 500 Stock Index; (3) the stocks of the Dow Jones U.S. Home Construction Index; and (4) the stocks of the peer group companies, just prior to the commencement of the period and that all dividends received within a quarter were reinvested in that quarter. The peer group index is composed of the following companies: AV Homes Inc., Beazer Homes USA, Inc., Inc., M/I Homes, Inc., M.D.C. Holdings, Inc., Tripointe Homes and William Lyon Homes.
The stock price performance shown on the following graph is not indicative of future price performance.
29
Comparison of Cumulative Total Return from June 18, 2014 (the Date our Common Stock Commenced Trading on the New York Stock Exchange) to December 31, 2017
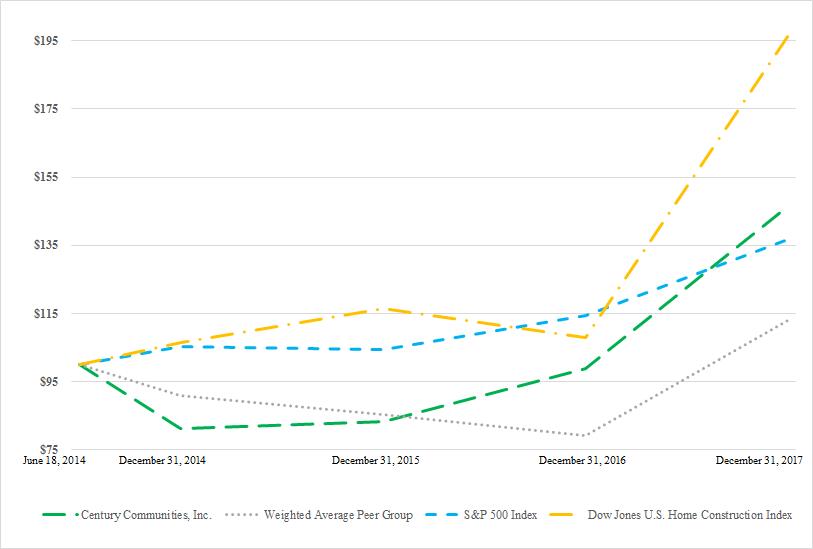
Issuer Purchases of Equity Securities
The following table summarizes the number of shares of our common stock that were repurchased from certain employees of the Company during the quarter ended December 31, 2017. Such shares were not repurchased pursuant to our stock repurchase program,
30
but were repurchased to satisfy statutory minimum federal and state tax obligations associated with the vesting of restricted shares of common stock issued under our 2017 Omnibus Incentive Plan (which we refer to as our “2017 Incentive Plan”).
|
|
Total number of shares purchased |
Average price paid per share |
Total number of shares purchased as part of publicly announced plans or programs |
Maximum number of shares that may yet be purchased under the plans or programs |
||||||
|
October |
||||||||||
|
Purchased 10/1 through 10/31 |
14,459 |
$ |
25.25 |
N/A |
N/A |
|||||
|
November |
||||||||||
|
Purchased 11/1 through 11/30 |
— |
— |
N/A |
N/A |
||||||
|
December |
||||||||||
|
Purchased 12/1 through 12/31 |
— |
— |
N/A |
N/A |
||||||
|
Total |
14,459 |
$ |
25.25 | |||||||
31
ITEM 6.SELECTED FINANCIAL DATA.
The data in this table should be read in conjunction with “Item 7. Management’s Discussion and Analysis of Financial Condition and Results of Operations” and our consolidated financial statements and related notes thereto, which are included in “Item 8. Consolidated Financial Statements.”
|
|
|
|
|
|
|
|
|
|
|
|
|
|
|
|
|
|
|
|
|
|||||||||||||
|
(in thousands, except per share amounts) |
|
Year Ended December 31, |
|||||||||||||
|
|
|
2017 |
|
2016 |
|
2015 |
|
2014 |
|
2013 |
|||||
|
Consolidated Statements of Operations: |
|
|
|
|
|
|
|
|
|
|
|
|
|
|
|
|
Total revenues |
|
$ |
1,423,799 |
|
$ |
994,440 |
|
$ |
734,489 |
|
$ |
362,392 |
|
$ |
171,133 |
|
Income before income tax expense |
|
$ |
84,164 |
|
$ |
73,149 |
|
$ |
60,305 |
|
$ |
30,959 |
|
$ |
18,073 |
|
Net income |
|
$ |
50,295 |
|
$ |
49,540 |
|
$ |
39,890 |
|
$ |
20,022 |
|
$ |
12,431 |
|
Basic earnings per share |
|
$ |
2.06 |
|
|
2.34 |
|
|
1.88 |
|
|
1.03 |
|
|
0.95 |
|
Diluted earnings per share |
|
$ |
2.03 |
|
|
2.33 |
|
|
1.88 |
|
|
1.03 |
|
|
0.95 |
|
Balance Sheet Data (end of period): |
|
|
|
|
|
|
|
|
|
|
|
|
|
|
|
|
Cash and cash equivalents |
|
$ |
88,832 |
|
$ |
29,450 |
|
$ |
29,287 |
|
$ |
33,462 |
|
$ |
109,998 |
|
Inventories |
|
$ |
1,390,354 |
|
$ |
857,885 |
|
$ |
810,137 |
|
$ |
556,323 |
|
$ |
184,072 |
|
Total assets |
|
$ |
1,735,022 |
|
$ |
1,007,528 |
|
$ |
917,741 |
|
$ |
670,616 |
|
$ |
312,639 |
|
Total debt |
|
$ |
824,602 |
|
$ |
454,008 |
|
$ |
390,243 |
|
$ |
224,247 |
|
$ |
1,500 |
|
Total liabilities |
|
$ |
999,789 |
|
$ |
533,892 |
|
$ |
508,262 |
|
$ |
305,411 |
|
$ |
41,083 |
|
Equity |
|
$ |
735,233 |
|
$ |
473,636 |
|
$ |
409,479 |
|
$ |
365,205 |
|
$ |
271,556 |
|
Other Operating Information (dollars in thousands): |
|
|
|
|
|
|
|
|
|
|
|
|
|
|
|
|
Number of homes delivered |
|
|
3,640 |
|
|
2,825 |
|
|
2,401 |
|
|
1,046 |
|
|
448 |
|
Average sales price of homes delivered |
|
$ |
386.1 |
|
$ |
346.5 |
|
$ |
302.1 |
|
$ |
336.4 |
|
$ |
382.0 |
|
Backlog at end of period, number of homes |
|
|
1,320 |
|
|
749 |
|
|
714 |
|
|
772 |
|
|
222 |
|
Backlog at end of period, aggregate sales value |
|
$ |
572,888 |
|
$ |
302,823 |
|
$ |
271,138 |
|
$ |
246,327 |
|
$ |
103,250 |
|
Average sales price of homes in backlog |
|
$ |
434.0 |
|
$ |
404.3 |
|
$ |
379.7 |
|
$ |
319.1 |
|
$ |
465.1 |
|
Net new home contracts |
|
|
3,814 |
|
|
2,860 |
|
|
2,356 |
|
|
1,042 |
|
|
406 |
|
Selling communities at period end |
|
|
119 |
|
|
89 |
|
|
88 |
|
|
75 |
|
|
23 |
ITEM 7. MANAGEMENT’S DISCUSSION AND ANALYSIS OF FINANCIAL CONDITION AND RESULTS OF OPERATIONS.
Overview
We are engaged in the development, design, construction, marketing and sale of single-family attached and detached homes in metropolitan areas in the States of California, Colorado, Georgia, Nevada, North Carolina, South Carolina, Tennessee, Texas, Utah, and Washington. In many of our projects, in addition to building homes, we are responsible for the entitlement and development of the underlying land. Our homebuilding operations are organized into the following four reportable segments based on the geographic regions in which we operate: West, Mountain, Texas and Southeast. Additionally, our indirect wholly-owned subsidiaries, Inspire Home Loans Inc. and Parkway Title, LLC, which provide mortgage services and title services, respectively, to our home buyers have been identified as our Financial Services operating segment.
We build and sell an extensive range of home types across a variety of price points. Our emphasis is on acquiring well-located land positions and offering quality homes with innovative design elements.
Results of Operations – Years Ended December 31, 2017 and 2016
During the year ended December 31, 2017, we experienced moderate improvement in the homebuilding market throughout our operating segments. The current homebuilding market enjoys a stable macro-economic environment, which includes stable employment growth as well as growth in median household incomes. These factors along with low levels of existing housing inventory resulted in an environment in which we were able to achieve increases in net new home contracts, home deliveries, and average sales price for the year ended December 31, 2017 of 33.4%, 28.8%, and 11.4%, respectively, as compared to the year ended December 31, 2016. The
32
increases in net new home contracts, home deliveries and average sales price, along with our continued focus on cost control and investing in our infrastructure prudently as we expand, resulted in total revenue and income before tax of $1.4 billion and $84.2 million, respectively for the year ended December 31, 2017, which represented a 43.2% and 15.1% increase, respectively, over the year ended December 31, 2016.
In August 2017, we acquired UCP, Inc. (which we refer to as “UCP”), which was a homebuilder and land developer with expertise in residential land acquisition, development and entitlement, as well as home design, construction and sales. Our acquisition of UCP included approximately 4,199 owned lots within 43 total communities located in the States of California, Washington, North Carolina, South Carolina and Tennessee. The 4,199 lots included 346 homes in backlog and 59 model homes. The results of UCP are included in our financial statements from August 4, 2017 through December 31, 2017 and consisted of $201.4 million in revenue related to 403 home deliveries.
Additionally in October 2017, we acquired substantially all the assets and operations and assumed certain liabilities of Sundquist Homes and affiliates, a homebuilder with operations in the greater Seattle, Washington area, for approximately $50 million. The acquired assets consisted of approximately 147 owned lots. The 147 lots included 45 homes in backlog. The results of Sundquist Homes are included in our financial statements from October 31, 2017 through December 31, 2017 and consisted of $18.7 million in revenue related to 24 deliveries.
We believe our operations are well positioned for future growth as a result of the strong markets in which we operate, our product offerings which span the home buying segment as well as current and future inventories of attractive land positions. As we have grown, we have continued to focus on maintaining prudent leverage and, as a result, we believe we are well positioned to execute on our growth strategy in order to optimize our stockholder returns.
We anticipate the homebuilding markets in each of our operating segments to continue to be tied to the local economy and, to a lesser degree, the macro-economic environment. Accordingly, our net sales, home deliveries, and average sales price in future years could be negatively affected by economic conditions such as decreases in employment and median household incomes, as well as decreases in household formations and increasing supply of inventories. Additionally, our results could be impacted by a decrease in home affordability as a result of price appreciation or significant increases in mortgage interest rates or tightening of mortgage lending standards.
Strategy
Our strategy is focused on increasing the returns on our inventory while generating strong profitability. In general, we are focused on the following initiatives:
|
· |
Maintaining a strong balance sheet and prudent use of leverage as we grow; |
|
· |
Offering products that appeal to a broad range of entry-level, move-up, lifestyle and luxury homebuyers based on each local market in which we operate; |
|
· |
Maintaining a strong pipeline of future land holdings, including utilizing lot option contracts to manage our risk to land holdings; |
|
· |
Expanding into new markets that meet our underwriting criteria either through organic start-up operations or through acquisitions of existing homebuilders; and |
|
· |
Controlling costs, including costs of home sales revenue and selling and general administrative expenses, to achieve increased profitability. |
Our operating strategy has resulted in growth in revenue and income before income taxes over the last five years, and we believe it will continue to produce positive results. Our operating strategy will continue to evolve to market changes, and we cannot provide any assurances that our strategies will continue to be successful.
33
The following table summarizes our results of operation for the years ended December 31, 2017 and 2016.
|
|
|
|
|
|
|
|
|
|
|
|
|
|
|
|
|
|
(in thousands, except per share amounts) |
|
Year Ended December 31, |
|
|
|
|
|
|
|
||||||
|
|
|
2017 |
|
2016 |
|
Amount |
|
% |
|||||||
|
|
|||||||||||||||
|
Consolidated Statements of Operations: |
|
|
|
|
|
|
|
|
|
|
|
|
|
|
|
|
Revenue |
|
|
|
|
|
|
|
|
|
|
|
|
|
|
|
|
Home sales revenues |
|
$ |
1,405,443 |
|
|
$ |
978,733 |
|
|
$ |
426,710 |
|
|
43.6 |
% |
|
Land sales revenues |
|
|
8,503 |
|
|
|
15,707 |
|
|
|
(7,204) |
|
|
(45.9) |
% |
|
|
|
|
1,413,946 |
|
|
|
994,440 |
|
|
|
419,506 |
|
|
42.2 |
% |
|
Financial services revenue |
|
|
9,853 |
|
|
|
— |
|
|
|
9,853 |
|
|
— |
|
|
Total revenues |
|
|
1,423,799 |
|
|
|
994,440 |
|
|
|
429,359 |
|
|
43.2 |
% |
|
Homebuilding cost of revenues |
|
|
|
|
|
|
|
|
|
|
|
|
|
|
|
|
Cost of home sales revenues |
|
|
(1,153,359) |
|
|
|
(786,127) |
|
|
|
(367,232) |
|
|
46.7 |
% |
|
Cost of land sales and other revenues |
|
|
(6,516) |
|
|
|
(14,217) |
|
|
|
7,701 |
|
|
(54.2) |
% |
|
|
|
|
(1,159,875) |
|
|
|
(800,344) |
|
|
|
(359,531) |
|
|
44.9 |
% |
|
Financial services costs |
|
|
(8,664) |
|
|
|
— |
|
|
|
(8,664) |
|
|
|
|
|
Selling, general, and administrative |
|
|
(176,304) |
|
|
|
(122,224) |
|
|
|
(54,080) |
|
|
44.2 |
% |
|
Acquisition expense |
|
|
(9,905) |
|
|
|
(490) |
|
|
|
(9,415) |
|
|
1,921.4 |
% |
|
Equity in income of unconsolidated subsidiaries |
|
|
12,176 |
|
|
|
191 |
|
|
|
11,985 |
|
|
6,274.9 |
% |
|
Other income (expense) |
|
|
2,937 |
|
|
|
1,576 |
|
|
|
1,361 |
|
|
86.4 |
% |
|
Income before income tax expense |
|
|
84,164 |
|
|
|
73,149 |
|
|
|
11,015 |
|
|
15.1 |
% |
|
Income tax expense |
|
|
(33,869) |
|
|
|
(23,609) |
|
|
|
(10,260) |
|
|
43.5 |
% |
|
Net income |
|
$ |
50,295 |
|
|
$ |
49,540 |
|
|
$ |
755 |
|
|
1.5 |
% |
|
Earnings per share: |
|
|
|
|
|
|
|
|
|
|
|
|
|
|
|
|
Basic |
|
$ |
2.06 |
|
|
$ |
2.34 |
|
|
$ |
(0.28) |
|
|
(12.0) |
% |
|
Diluted |
|
$ |
2.03 |
|
|
$ |
2.33 |
|
|
$ |
(0.30) |
|
|
(12.9) |
% |
|
Adjusted diluted earnings per share(1) |
|
$ |
2.87 |
|
|
$ |
2.36 |
|
|
$ |
0.51 |
|
|
21.6 |
% |
|
Other Operating Information (dollars in thousands): |
|
|
|
|
|
|
|
|
|
|
|
|
|
|
|
|
Number of homes delivered |
|
|
3,640 |
|
|
|
2,825 |
|
|
|
815.0 |
|
|
28.8 |
% |
|
Average sales price of homes delivered |
|
$ |
386.1 |
|
|
$ |
346.5 |
|
|
$ |
39.6 |
|
|
11.4 |
% |
|
Homebuilding gross margin percentage |
|
|
17.9 |
% |
|
|
19.7 |
% |
|
|
(1.8) |
% |
|
(9.1) |
% |
|
Adjusted homebuilding gross margin excluding interest and purchase price accounting for acquired work in process inventory (1) |
|
|
21.4 |
% |
|
|
21.7 |
% |
|
|
(0.3) |
% |
|
(1.4) |
% |
|
Cancellation rate |
|
|
21 |
% |
|
|
20 |
% |
|
|
1 |
% |
|
5.0 |
% |
|
Backlog at end of period, number of homes |
|
|
1,320 |
|
|
|
749 |
|
|
|
571 |
|
|
76.2 |
% |
|
Backlog at end of period, aggregate sales value |
|
$ |
572,888 |
|
|
$ |
302,823 |
|
|
$ |
270,065 |
|
|
89.2 |
% |
|
Average sales price of homes in backlog |
|
$ |
434.0 |
|
|
$ |
404.3 |
|
|
$ |
29.7 |
|
|
7.3 |
% |
|
Net new home contracts |
|
|
3,814 |
|
|
|
2,860 |
|
|
|
954 |
|
|
33.4 |
% |
|
Selling communities at period end |
|
|
119 |
|
|
|
89 |
|
|
|
30 |
|
|
33.7 |
% |
|
Average selling communities |
|
|
101 |
|
|
|
89 |
|
|
|
12 |
|
|
13.5 |
% |
|
Total owned and controlled lot inventory |
|
|
30,784 |
|
|
|
18,296 |
|
|
|
12,488 |
|
|
68.3 |
% |
|
Adjusted EBITDA(1) |
|
$ |
150,477 |
|
|
$ |
100,343 |
|
|
$ |
50,134 |
|
|
50.0 |
% |
|
Adjusted income before income tax expense(1) |
|
$ |
109,694 |
|
|
$ |
74,028 |
|
|
$ |
35,666 |
|
|
48.2 |
% |
|
Adjusted net income(1) |
|
$ |
71,082 |
|
|
$ |
50,135 |
|
|
$ |
20,947 |
|
|
41.8 |
% |
|
Net debt to net capital(1) |
|
|
48.7 |
% |
|
|
46.1 |
% |
|
|
2.6 |
% |
|
5.6 |
% |
(1)Non-GAAP financial measure.
34
Results of Operations by Segment
|
|
|
|
|
|
|
|
|
|
|
|
|
|
|
|
|
|
|
|
|
|
|
|
|
|
|
|
|
|
New Homes Delivered |
|
Average Sales Price of Homes Delivered |
|
Home Sales Revenues |
|
Income before Income Tax |
|||||||||||||||||
|
|
|
Year Ended December 31, |
|
Year Ended December 31, |
|
Year Ended December 31, |
|
Year Ended December 31, |
|||||||||||||||||
|
|
|
2017 |
|
2016 |
|
2017 |
|
2016 |
|
2017 |
|
2016 |
|
2017 |
|
2016 |
|||||||||
|
West |
|
|
398 |
|
|
— |
|
$ |
529.4 |
|
$ |
— |
|
$ |
210,696 |
|
$ |
— |
|
$ |
14,640 |
|
$ |
— |
|
|
Mountain |
|
|
1,465 |
|
|
1,222 |
|
$ |
418.0 |
|
$ |
409.5 |
|
|
612,392 |
|
|
500,386 |
|
|
75,704 |
|
|
66,613 | |
|
Texas |
|
|
413 |
|
|
338 |
|
$ |
389.6 |
|
$ |
400.0 |
|
|
160,891 |
|
|
135,207 |
|
|
10,952 |
|
|
2,686 | |
|
Southeast |
|
|
1,364 |
|
|
1,265 |
|
$ |
309.0 |
|
$ |
271.3 |
|
|
421,464 |
|
|
343,140 |
|
|
29,662 |
|
|
31,138 | |
|
Financial Services |
|
|
— |
|
|
— |
|
$ |
— |
|
$ |
— |
|
|
— |
|
|
— |
|
|
1,225 |
|
|
— |
|
|
Corporate |
|
|
— |
|
|
— |
|
$ |
— |
|
$ |
— |
|
|
— |
|
|
— |
|
|
(48,019) |
|
|
(27,288) | |
|
Total |
|
|
3,640 |
|
|
2,825 |
|
$ |
386.1 |
|
$ |
346.5 |
|
$ |
1,405,443 |
|
$ |
978,733 |
|
$ |
84,164 |
|
$ |
73,149 | |
West
In our West segment, for the year ended December 31, 2017, our income before income tax increased by $14.6 million to $14.6 million. We acquired the entirety of our operations in our West segment in conjunction with our acquisitions of UCP and Sundquist Homes as discussed above. Since completing these acquisitions, we delivered 398 new homes with an average price of $529.4 thousand and generated $210.7 million in home sales revenues in our West segment.
Mountain
In our Mountain segment, for the year ended December 31, 2017, our income before income tax increased by $9.1 million to $75.7 million, as compared to $66.6 million for the same period in 2016. This increase is related to an increase in the number of homes delivered and an increase in the average selling price of those homes in 2017.
Texas
In our Texas segment, for the year ended December 31, 2017, our income before income tax increased by $8.3 million to $11.0 million as compared $2.7 million for the same period in 2016. This increase is primarily related to an increase in the number of homes delivered in 2017.
Southeast
In our Southeast segment, for the year ended December 31, 2017, our income before income tax decreased by $1.5 million to $29.7 million, as compared to $31.1 million for the same period in 2016. The number of homes delivered, home sales revenue and average selling price all increased in our Southeast segment year over year. However, as we have recently started operations in North Carolina, our selling, general and administrative expenses have increased without a corresponding increase in revenues.
Financial Services
Our indirect wholly-owned subsidiaries, Inspire Home Loans Inc. and Parkway Title, LLC, which provide mortgage services and title services, respectively, to our home buyers have been identified as our Financial Services segment. We began providing mortgage services to our customers during the second quarter of 2017. Substantially all of the loans we originate are sold in the secondary market within a short period of time after origination, generally within 30 days. During the year ended December 31, 2017, we originated and closed 550 loans with a total principal amount of $172.2 million.
Corporate
During the year ended December 31, 2017, our Corporate segment generated losses of $48.0 million, as compared to losses of $27.3 million for the same period in 2016. The increase in expenses during the year ended December 31, 2017 was primarily attributed to the following: (1) an increase of $9.4 million in acquisition expenses, (2) an increase of $11.6 million in compensation related expenses, including non-cash expenses for share based payments and an increase in the number of employees after our acquisition of UCP and
35
Sundquist Homes, (3) an increase of $3.4 million in information technology related expenses, and (4) an increase of $1.0 million in advertising costs, partially offset by an increase in equity in income from unconsolidated subsidiaries.
Homebuilding Gross Margin
Homebuilding gross margin represents home sales revenue less cost of home sales revenues. Our homebuilding gross margin percentage, which represents homebuilding gross margin divided by home sales revenues, decreased for the year ended December 31, 2017 to 17.9%, as compared to 19.7% for the year ended December 31, 2016. The decrease is primarily driven by purchase accounting for acquired work in process inventory.
In the following table, we calculate our gross margins adjusting for interest in cost of sales, and purchase price accounting for acquired work in process inventory. See “Critical Accounting Policies” below and Footnote 3 (Business Combinations) of our Consolidated Financial Statements for additional discussion regarding our methodology for estimating the fair value of acquired work in process inventory.
(dollars in thousands)
|
|
|
|
|
|
|
|
|
|
|
|
|
|
|
|
|
Year Ended December 31, |
||||||||||
|
|
|
2017 |
|
% |
|
2016 |
|
% |
||||
|
|
|
|
|
|
|
|
|
|
|
|
|
|
|
Home sales revenues |
|
$ |
1,405,443 |
|
100.0 |
% |
|
$ |
978,733 |
|
100.0 |
% |
|
Cost of home sales revenues |
|
|
(1,153,359) |
|
82.1 |
% |
|
|
(786,127) |
|
80.3 |
% |
|
Gross margin from home sales |
|
|
252,084 |
|
17.9 |
% |
|
|
192,606 |
|
19.7 |
% |
|
Add: Interest in cost of home sales revenues |
|
|
32,898 |
|
2.3 |
% |
|
|
19,502 |
|
2.0 |
% |
|
Adjusted homebuilding gross margin excluding interest (1) |
|
|
284,982 |
|
20.3 |
% |
|
|
212,108 |
|
21.7 |
% |
|
Add: Purchase price accounting for acquired work in process inventory |
|
|
15,625 |
|
1.1 |
% |
|
|
389 |
|
0.0 |
% |
|
Adjusted homebuilding gross margin excluding interest and purchase price accounting for acquired work in process inventory (1) |
|
$ |
300,607 |
|
21.4 |
% |
|
$ |
212,497 |
|
21.7 |
% |
(1) This non-GAAP financial measure should not be used as a substitute for the Company’s operating results in accordance with GAAP. An analysis of any non-GAAP financial measure should be used in conjunction with results presented in accordance with GAAP.
Excluding interest in cost of home sales and purchase price accounting, our adjusted homebuilding gross margin percentage was 21.4% for the year ended December 31, 2017, as compared to 21.7% for the year ended December 31, 2016. We believe the above information is meaningful as it isolates the impact that indebtedness and acquisitions have on homebuilding gross margin and allows for comparability of our gross margins to previous periods and our competitors.
Selling, General and Administrative Expense
|
(dollars in thousands) |
|||||||||||||||
|
|
Year Ended December 31, |
Increase |
|||||||||||||
|
|
2017 |
2016 |
Amount |
% |
|||||||||||
|
Selling, general and administrative |
$ |
(176,304) |
$ |
(122,224) |
$ |
(54,080) | 44.2 |
% |
|||||||
|
As a percentage of homes sales revenue |
(12.5) |
% |
(12.5) |
% |
|||||||||||
Our selling, general and administrative costs increased $54.1 million for the year ended December 31, 2017 as compared to 2016. The increase was primarily attributable to the following: (1) an increase of $12.1 million in commission expense resulting from a 44% increase in home sales revenues, (2) an increase of $26.2 million in compensation related expenses, including incentive compensation as a result of higher head count to support our growth, (3) an increase of $4.7 million in advertising expenses, (4) an increase of $2.0
36
million in information technology expenses, and (5) a net increase of $9.0 million related to individually insignificant changes in other expenses, including rent, insurance, depreciation and legal.
Other Income (Expense)
For the year ended December 31, 2017, other income (expense) increased to $2.9 million from $1.6 million for the same period in 2016. The increase was related to increases in interest income and forfeited deposits.
Equity in Income from Unconsolidated Subsidiaries
As of December 31, 2017, our investment in WJH was $28.2 million and we recognized $12.2 million and $0.2 million of equity in income of unconsolidated subsidiaries during the years ended December 31, 2017 and 2016, respectively. Our investment in WJH was made in November 2016, and as such there were limited earnings during 2016. WJH had 1,742 home deliveries with an average sales price of $148.2 thousand during the year ended December 31, 2017.
Income Tax Expense
Our income tax expense for the year ended December 31, 2017 was $33.9 million, as compared to $23.6 million for the year ended December 31, 2016. Our income tax expense for the year ended December 31, 2017 results in an effective tax rate of 40.2%, as compared to an effective tax rate of 32.3% for the year ended December 31, 2016. Our effective tax rate is driven by our blended federal and state statutory rate of 37.8%. Our blended federal and state statutory tax rate is reflective of the states in which we operate, including Nevada, Texas and Washington which generally do not have corporate income tax. As a result of the Tax Cuts and Jobs Act signed into law on December 22, 2017, we recorded a provisional remeasurement of our deferred tax assets totaling $2.8 million. Our blended federal and state statutory tax rate is partially offset by benefits from additional deductions for domestic production activities in 2017.
Segment Assets
(dollars in thousands)
|
|
December 31, |
December 31, |
Increase (Decrease) |
|||||||||||
|
|
2017 |
2016 |
Amount |
Change |
||||||||||
|
West |
$ |
273,749 |
$ |
— |
$ |
273,749 |
NM |
|||||||
|
Mountain |
571,880 | 541,657 | 30,223 | 5.6 |
% |
|||||||||
|
Texas |
192,078 | 138,392 | 53,686 | 38.8 |
% |
|||||||||
|
Southeast |
401,618 | 262,448 | 139,170 | 53.0 |
% |
|||||||||
|
Financial Services |
63,137 |
— |
63,137 |
NM |
||||||||||
|
Corporate |
232,560 | 65,031 | 167,529 | 257.6 |
% |
|||||||||
|
Total assets |
$ |
1,735,022 |
$ |
1,007,528 |
$ |
727,494 | 72.2 |
% |
||||||
|
|
|
|
|
|
|
|
|
|
|
|
|
|
|
|
|
|
|
|
|
|
|
|
Lots owned and |
|
December 31, 2017 |
|
December 31, 2016 |
|
% Change |
|
||||||||||||||
|
controlled |
|
Owned |
|
Controlled |
|
Total |
|
Owned |
|
Controlled |
|
Total |
|
Owned |
|
Controlled |
|
Total |
|||
|
|
|
|
|
|
|
|
|
|
|
|
|
|
|
|
|
|
|
|
|
|
|
|
West |
|
3,742 |
|
3,179 |
|
6,921 |
|
— |
|
— |
|
— |
|
NM |
|
|
NM |
|
|
NM |
|
|
Mountain |
|
4,666 |
|
4,856 |
|
9,522 |
|
4,354 |
|
2,959 |
|
7,313 |
|
7.2 |
% |
|
64.1 |
% |
|
30.2 |
% |
|
Texas |
|
2,517 |
|
3,489 |
|
6,006 |
|
1,356 |
|
3,420 |
|
4,776 |
|
85.6 |
% |
|
2.0 |
% |
|
25.8 |
% |
|
Southeast |
|
4,827 |
|
3,508 |
|
8,335 |
|
2,953 |
|
3,254 |
|
6,207 |
|
63.5 |
% |
|
7.8 |
% |
|
34.3 |
% |
|
Total |
|
15,752 |
|
15,032 |
|
30,784 |
|
8,663 |
|
9,633 |
|
18,296 |
|
81.8 |
% |
|
56.0 |
% |
|
68.3 |
% |
Of our total lots owned and controlled as of December 31, 2017, 51.2% were owned and 48.8% were controlled, as compared to 47.3% owned and 52.7% controlled as of December 31, 2016.
Total assets increased by $727.5 million, or 72.2%, to $1.7 billion at December 31, 2017, as compared to $1.0 billion at December 31, 2016. The increase is related to the increase in assets from our acquisitions of UCP and Sundquist Homes, as well as the increased investments in all of our operating segments.
37
Other Homebuilding Operating Data
|
|
|
|
|
|
|
|
|
|
|
|
|
|
Year Ended |
|
|
|
|
|
||
|
Net new home contracts |
|
December 31, |
|
Increase |
|||||
|
|
|
2017 |
|
2016 |
|
Amount |
|
% Change |
|
|
West |
|
296 |
|
— |
|
296 |
|
NM |
|
|
Mountain |
|
1,591 |
|
1,260 |
|
331 |
|
26.3 |
% |
|
Texas |
|
477 |
|
349 |
|
128 |
|
36.7 |
% |
|
Southeast |
|
1,450 |
|
1,251 |
|
199 |
|
15.9 |
% |
|
Total |
|
3,814 |
|
2,860 |
|
954 |
|
33.4 |
% |
Net new home contracts (new home contracts net of cancellations) for the year ended December 31, 2017 increased by 954 homes, or 33.4%, to 3,814, as compared to 2,860 for the year ended December 31, 2016. The increase in our net new home contracts was driven by an increase in our absorption rates as well as our acquisitions of UCP and Sundquist Homes.
Our overall monthly “absorption rate” (the rate at which home orders are contracted, net of cancelations) for the years ended December 31, 2017 and 2016 by segment are included in the table below:
|
|
|
|
|
|
|
|
|
|
|
|
|
|
Year Ended December 31, |
|
Increase |
|||||
|
|
|
2017 |
|
2016 |
|
Amount |
|
% Change |
|
|
West |
|
3.7 |
|
— |
|
3.7 |
|
NM |
|
|
Mountain |
|
4.0 |
|
3.0 |
|
1.0 |
|
33.3 |
% |
|
Texas |
|
1.7 |
|
1.3 |
|
0.4 |
|
30.8 |
% |
|
Southeast |
|
3.4 |
|
3.4 |
|
— |
|
— |
% |
|
Total |
|
3.2 |
|
2.7 |
|
0.5 |
|
18.5 |
% |
Our absorption rate increased by 18.5% to 3.2 per month during the year ended December 31, 2017, as compared to 2.7 per month during the same period in 2016. The increase in absorption rate is attributable to the strong homebuilding environment as a result of positive economic trends across our markets.
|
|
||||||||||
|
Selling communities at period end |
As of December 31, |
Increase/(Decrease) |
||||||||
|
|
2017 |
2016 |
Amount |
% Change |
||||||
|
|
||||||||||
|
West |
19 |
— |
19 |
NM |
||||||
|
Mountain |
33 | 35 | (2) | (5.7) |
% |
|||||
|
Texas |
27 | 23 | 4 | 17.4 |
% |
|||||
|
Southeast |
40 | 31 | 9 | 29.0 |
% |
|||||
|
Total |
119 | 89 | 30 | 33.7 |
% |
|||||
Our selling communities increased by 30 communities to 119 communities at December 31, 2017, as compared to 89 communities at December 31, 2016. The increase is attributable to our acquisitions of UCP and Sundquist Homes, as well as organic growth in our existing markets.
|
|
|
|
|
|
|
|
|
|
|
|
|
|
|
|
|
|
|
|
|
|
|
|
|
|
|
|
|
|
|
|
|
|
|
|
|
|
|
|
|
|
|
|
|
|
|
|
|
|
|
|
|
|
|
|
|
As of December 31, |
|
|
|
|
|
|
|
|
|
||||||||||||||
|
Backlog |
|
2017 |
|
2016 |
|
% Change |
|
||||||||||||||||||
|
|
|||||||||||||||||||||||||
|
|
|
Homes |
|
Dollar Value |
|
Average Sales Price |
|
Homes |
|
Dollar Value |
|
Average Sales Price |
|
Homes |
|
Dollar Value |
|
Average Sales Price |
|||||||
|
|
|
|
|
|
|
|
|||||||||||||||||||
|
West |
|
270 |
|
$ |
164,071 |
|
$ |
607.7 |
|
— |
|
$ |
— |
|
$ |
— |
|
NM |
|
|
NM |
|
|
NM |
|
|
Mountain |
|
455 |
|
|
200,887 |
|
|
441.5 |
|
329 |
|
|
148,298 |
|
|
450.8 |
|
38.3 |
% |
|
35.5 |
% |
|
(2.1) |
% |
|
Texas |
|
215 |
|
|
82,886 |
|
|
385.5 |
|
151 |
|
|
72,423 |
|
|
479.6 |
|
42.4 |
% |
|
14.4 |
% |
|
(19.6) |
% |
|
Southeast |
|
380 |
|
|
125,044 |
|
|
329.1 |
|
269 |
|
|
82,102 |
|
|
305.2 |
|
41.3 |
% |
|
52.3 |
% |
|
7.8 |
% |
|
Total / Weighted Average |
|
1,320 |
|
$ |
572,888 |
|
$ |
434.0 |
|
749 |
|
$ |
302,823 |
|
$ |
404.3 |
|
76.2 |
% |
|
89.2 |
% |
|
7.3 |
% |
38
Backlog reflects the number of homes, net of cancellations experienced during the period, for which we have entered into a sales contract with a customer but for which we have not yet delivered the home. At December 31, 2017, we had 1,320 homes in backlog with a total value of $572.9 million, which represents an increase of 76.2% and 89.2%, respectively, as compared to 749 homes in backlog with a total value of $302.8 million at December 31, 2016. The increase in backlog and backlog value is primarily attributable to our acquisitions of UCP and Sundquist Homes as well as the increase in our absorption rates. The increase in average sales price of homes in backlog is driven by increases in most of our markets as a result of pricing strength due to positive market trends.
Supplemental Pro Forma Information
To aid readers with 2017 over 2016 comparability for the entire consolidated business including UCP, the following also presents limited supplemental pro forma information.
|
|
|
|
|
|
|
|
|
|
|
|
|
|
|
|
|
|
|
|
|
|
|
|
|
Year Ended December 31, |
||||||||||||||||||
|
(dollars in thousands) |
|
2017 |
|
2016 |
||||||||||||||||
|
|
|
|
Pro Forma Home sales revenues |
|
Pro Forma Net new home contracts |
|
Pro Forma Deliveries |
|
|
Pro Forma Average sales price |
|
|
Pro Forma Home sales revenues |
|
Pro Forma Net new home contracts |
|
Pro Forma Deliveries |
|
|
Pro Forma Average sales price |
|
West |
|
$ |
416,327 |
|
769 |
|
818 |
|
$ |
509.0 |
|
$ |
289,037 |
|
668 |
|
596 |
|
$ |
485.0 |
|
Mountain |
|
|
612,392 |
|
1,591 |
|
1,465 |
|
$ |
418.0 |
|
|
500,386 |
|
1,260 |
|
1,222 |
|
$ |
409.5 |
|
Texas |
|
|
160,891 |
|
477 |
|
413 |
|
$ |
389.6 |
|
|
135,207 |
|
349 |
|
338 |
|
$ |
400.0 |
|
Southeast |
|
|
462,550 |
|
1,563 |
|
1,509 |
|
$ |
306.5 |
|
|
398,022 |
|
1,516 |
|
1,489 |
|
$ |
267.3 |
|
Total |
|
$ |
1,652,160 |
|
4,400 |
|
4,205 |
|
$ |
392.9 |
|
$ |
1,322,652 |
|
3,793 |
|
3,645 |
|
$ |
362.9 |
39
Results of Operations – Years Ended December 31, 2016 and 2015
During the year ended December 31, 2016, we experienced moderate improvement in the homebuilding market throughout most of our segments. We were able to achieve increases in net new home contracts, home deliveries, and average sales price for the year ended December 31, 2016 of 21.4%, 17.7%, and 14.7%, respectively, as compared to the year ended December 31, 2015. The increases in net new home contracts, home deliveries and average sales price, along with our continued focus on cost control and investing in our infrastructure prudently as we expand, resulted in total revenue and net income of $994.4 million and $49.5 million, respectively, for the year ended December 31, 2016, which represented a 35.4% and 24.2% increase, respectively, over the year ended December 31, 2015.
During 2016, we also invested for future growth through (i) our entrance into the Utah and North Carolina markets, (ii) commencing our Financial Services operating segment through our indirect wholly-owned subsidiaries, Inspire and Parkway Title, and (iii) acquiring a 50% ownership in WJH. We also continued to expand our future pipeline of land positions as we increased our total lots owned and under control from 13,160 as of December 31, 2015 to 18,296 as of December 31, 2016.
40
The following table summarizes our results of operation for the years ended December 31, 2016 and 2015.
|
|
|
|
|
|
|
|
|
|
|
|
|
|
|
|
|
|
|
|
|
|
|
|
||||||||||||
|
(in thousands, except per share amounts) |
|
Year Ended December 31, |
|
Increase (Decrease) |
|
|||||||||||
|
|
|
2016 |
|
2015 |
|
Amount |
|
% |
|
|||||||
|
|
|
|
|
|
|
|
|
|
|
|
||||||
|
Consolidated Statements of Operations: |
|
|
|
|
|
|
|
|
|
|
|
|
|
|
|
|
|
Revenue |
|
|
|
|
|
|
|
|
|
|
|
|
|
|
|
|
|
Homebuilding revenues |
||||||||||||||||
|
Home sales revenues |
|
$ |
978,733 |
|
|
$ |
725,437 |
|
|
$ |
253,296 |
|
|
34.9 |
% |
|
|
Land sales and other revenue |
|
|
15,707 |
|
|
|
9,052 |
|
|
|
6,655 |
|
|
73.5 |
% |
|
|
|
|
|
994,440 |
|
|
|
734,489 |
|
|
|
259,951 |
|
|
35.4 |
% |
|
|
Financial services revenue |
|
|
- |
|
|
|
- |
|
|
|
- |
|
|
- |
|
|
|
Total revenue |
|
|
994,440 |
|
|
|
734,489 |
|
|
|
259,951 |
|
|
35.4 |
% |
|
|
Homebuilding Cost of Revenues |
|
|
|
|
|
|
|
|
|
|
|
|
|
|
|
|
|
Cost of home sales revenues |
|
|
(786,127) |
|
|
|
(579,203) |
|
|
|
(206,924) |
|
|
35.7 |
% |
|
|
Cost of land sales and other revenues |
|
|
(14,217) |
|
|
|
(8,432) |
|
|
|
(5,785) |
|
|
68.6 |
% |
|
|
|
|
|
(800,344) |
|
|
|
(587,635) |
|
|
|
(212,709) |
|
|
(36.2) |
% |
|
|
Financial services costs |
|
|
- |
|
|
|
- |
|
|
|
- |
|
|
- |
|
|
|
Selling, general, and administrative |
|
|
(122,224) |
|
|
|
(87,840) |
|
|
|
(34,384) |
|
|
39.1 |
% |
|
|
Acquisition expense |
|
|
(490) |
|
|
|
(491) |
|
|
|
1 |
|
|
(0.2) |
% |
|
|
Equity income of unconsolidated subsidiaries |
|
|
191 |
|
|
|
- |
|
|
|
191 |
|
|
NM |
|
|
|
Other income (expense) |
|
|
1,576 |
|
|
|
1,782 |
|
|
|
(206) |
|
|
(11.6) |
% |
|
|
Income before income tax expense |
|
|
73,149 |
|
|
|
60,305 |
|
|
|
12,844 |
|
|
21.3 |
% |
|
|
Income tax expense |
|
|
(23,609) |
|
|
|
(20,415) |
|
|
|
(3,194) |
|
|
15.6 |
% |
|
|
Net income |
|
$ |
49,540 |
|
|
$ |
39,890 |
|
|
$ |
9,650 |
|
|
24.2 |
% |
|
|
Earnings per share: |
|
|
|
|
|
|
|
|
|
|
|
|
|
|
|
|
|
Basic |
|
$ |
2.34 |
|
|
$ |
1.88 |
|
|
$ |
0.46 |
|
|
24.5 |
% |
|
|
Diluted |
|
$ |
2.33 |
|
|
$ |
1.88 |
|
|
$ |
0.45 |
|
|
23.9 |
% |
|
|
Other Operating Information (dollars in thousands): |
|
|
|
|
|
|
|
|
|
|
|
|
|
|
|
|
|
Number of homes delivered |
|
|
2,825 |
|
|
|
2,401 |
|
|
|
424 |
|
|
17.7 |
% |
|
|
Average sales price of homes delivered |
|
$ |
346.5 |
|
|
$ |
302.1 |
|
|
$ |
44.4 |
|
|
14.7 |
% |
|
|
Homebuilding gross margin percentage |
|
|
19.7 |
% |
|
|
20.2 |
% |
|
|
(0.5) |
% |
|
(2.5) |
% |
|
|
Adjusted homebuilding gross margin excluding interest and purchase price accounting for acquired work in process inventory (1) |
|
|
21.7 |
% |
|
|
21.9 |
% |
|
|
(0.2) |
% |
|
(1.0) |
% |
|
|
Cancellation rate |
|
|
20 |
% |
|
|
21 |
% |
|
|
(1) |
% |
|
(4.8) |
% |
|
|
Backlog at end of period, number of homes |
|
|
749 |
|
|
|
714 |
|
|
|
35 |
|
|
4.9 |
% |
|
|
Backlog at end of period, aggregate sales value |
|
$ |
302,823 |
|
|
$ |
271,138 |
|
|
$ |
31,685 |
|
|
11.7 |
% |
|
|
Average sales price of homes in backlog |
|
$ |
404.3 |
|
|
$ |
379.7 |
|
|
$ |
24.6 |
|
|
6.5 |
% |
|
|
Net new home contracts |
|
|
2,860 |
|
|
|
2,356 |
|
|
|
504 |
|
|
21.4 |
% |
|
|
Selling communities at period end |
|
|
89 |
|
|
|
88 |
|
|
|
1 |
|
|
1.1 |
% |
|
|
Average selling communities |
|
|
89 |
|
|
|
90 |
|
|
|
(1) |
|
|
(1.1) |
% |
|
|
Total owned and controlled lot inventory |
|
|
18,296 |
|
|
|
13,160 |
|
|
|
5,136 |
|
|
39.0 |
% |
|
|
Adjusted EBITDA(1) |
|
$ |
100,343 |
|
$ |
|
78,274 |
|
|
$ |
22,069 |
|
|
28.2 |
% |
|
|
Adjusted income before income tax expense(1) |
|
$ |
74,028 |
|
$ |
|
63,469 |
|
|
$ |
10,559 |
|
|
16.6 |
% |
|
|
Adjusted net income(1) |
|
$ |
50,135 |
|
$ |
|
41,255 |
|
|
$ |
8,880 |
|
|
21.5 |
% |
|
|
Net debt to net capital(1) |
|
|
46.1 |
% |
|
|
46.0 |
% |
|
|
0.1 |
% |
|
0.2 |
% |
|
|
(1) Non-GAAP financial measure. |
|
|
|
|
|
|
|
|
|
|
|
|
|
|
|
|
41
Results of Operations by Segment
(dollars in thousands)
|
|
New Homes Delivered |
Average Sales Price of Homes Delivered |
Home Sales Revenues |
Income before Income Tax |
||||||||||||||||||||
|
|
Year Ended December 31, |
Year Ended December 31, |
Year Ended December 31, |
Year Ended December 31, |
||||||||||||||||||||
|
|
2016 |
2015 |
2016 |
2015 |
2016 |
2015 |
2016 |
2015 |
||||||||||||||||
|
Mountain |
1,222 | 898 |
$ |
409.5 |
$ |
382.4 |
$ |
500,385 |
$ |
343,424 |
$ |
66,613 |
$ |
49,515 | ||||||||||
|
Texas |
338 | 329 |
$ |
400.0 |
$ |
342.9 | 135,207 | 112,825 | 2,686 | 4,260 | ||||||||||||||
|
Southeast |
1,265 | 1,174 |
$ |
271.3 |
$ |
229.3 | 343,141 | 269,188 | 31,138 | 23,574 | ||||||||||||||
|
Corporate |
— |
— |
$ |
— |
$ |
— |
— |
— |
(27,288) | (17,044) | ||||||||||||||
|
Total |
2,825 | 2,401 |
$ |
346.5 |
$ |
302.1 |
$ |
978,733 |
$ |
725,437 |
$ |
73,149 |
$ |
60,305 | ||||||||||
Mountain
In our Mountain segment, for the year ended December 31, 2016, our income before income tax increased by $17.1 million to $66.6 million, as compared to $49.5 million for the same period in 2015. This increase is related to an increase in the number of homes delivered and an increase in the average selling price of those homes in 2016.
Texas
In our Texas segment, for the year ended December 31, 2016, our income before income tax decreased by $1.6 million to $2.7 million, as compared $4.3 million for the same period in 2015. This decrease is related to an increase in the number of homes delivered and an increase in the gross margin of those homes sold year over year.
Southeast
In our Southeast segment, for the year ended December 31, 2016, our income before income tax increased by $7.6 million to $31.1 million, as compared to $23.6 million for the same period in 2015. This increase is related to an additional 91 home deliveries with an increase of $42.0 thousand in the average selling price during the year ended December 31, 2016, as compared to the same period in 2015.
Corporate
Our corporate segment generated $27.3 million in loss during the year ended December 31, 2016 as compared to a loss of $17.0 million for the same period in 2015. The increase in expenses was primarily attributed to the following: (1) an increase of $4.1 million in compensation related expenses, including non-cash expenses for share based payments, (2) an increase of $1.6 million in legal and insurance costs, and (3) and an increase of $1.0 million in information technology related expenses.
Homebuilding Gross Margin
Homebuilding gross margin represents home sales revenue less cost of home sales revenues. Our homebuilding gross margin percentage, which represents homebuilding gross margin divided by home sales revenues, decreased for the year ended December 31, 2016 to 19.7%, as compared to 20.2% for the year ended December 31, 2015. The decrease is primarily driven by higher interest expense in cost of sales as a result of higher debt balances outstanding in 2016 as compared to 2015.
In the following table, we calculate our gross margins adjusting for interest in cost of sales, and purchase price accounting for acquired work in process inventory. See “Critical Accounting Policies” below and Footnote 3 (Business Combinations) of our Consolidated Financial Statements for additional discussion regarding our methodology for estimating the fair value of acquired work in process inventory.
42
|
|
|
|
|
|
|
|
|
|
|
|
|
|
|
(dollars in thousands) |
|
Year Ended December 31, |
||||||||||
|
|
|
2016 |
|
% |
|
2015 |
|
% |
||||
|
|
|
|
|
|
|
|
|
|
|
|
|
|
|
Home sales revenues |
|
$ |
978,733 |
|
100.0 |
% |
|
$ |
725,437 |
|
100.0 |
% |
|
Cost of home sales revenues |
|
|
786,127 |
|
80.3 |
% |
|
|
579,203 |
|
79.8 |
% |
|
Gross margin from home sales |
|
|
192,606 |
|
19.7 |
% |
|
|
146,234 |
|
20.2 |
% |
|
Add: Interest in cost of home sales revenues |
|
|
19,502 |
|
2.0 |
% |
|
|
10,082 |
|
1.4 |
% |
|
Adjusted homebuilding gross margin excluding interest (1) |
|
|
212,108 |
|
21.7 |
% |
|
|
156,316 |
|
21.5 |
% |
|
Add: Purchase price accounting for acquired work in process inventory |
|
|
389 |
|
0.0 |
% |
|
|
2,673 |
|
0.4 |
% |
|
Adjusted homebuilding gross margin excluding interest and purchase price accounting for acquired work in process inventory (1) |
|
$ |
212,497 |
|
21.7 |
% |
|
$ |
158,989 |
|
21.9 |
% |
(1) This non-GAAP financial measure should not be used as a substitute for the Company’s operating results in accordance with GAAP. An analysis of any non-GAAP financial measure should be used in conjunction with results presented in accordance with GAAP.
Excluding interest in cost of home sales and purchase price accounting, our adjusted homebuilding gross margin percentage was 21.7% for the year ended December 31, 2016, as compared to 21.9% for the year ended December 31, 2015. The nominal decrease in adjusted gross margin is attributed to a wider geographic mix of home deliveries in 2016 as compared to 2015. We believe the above information is meaningful as it isolates the impact that indebtedness and acquisitions have on homebuilding gross margin and allows for comparability of our gross margins to previous periods and our competitors.
Selling, General and Administrative Expense
|
(dollars in thousands) |
|||||||||||||||
|
|
Year Ended December 31, |
Increase |
|||||||||||||
|
|
2016 |
2015 |
Amount |
% |
|||||||||||
|
Selling, general and administrative |
$ |
122,224 |
$ |
87,840 |
$ |
34,384 | 39.1 |
% |
|||||||
|
As a percentage of homes sales revenue |
12.5 |
% |
12.1 |
% |
|||||||||||
Our selling, general and administrative costs increased $34.4 million for the year ended December 31, 2016 as compared to 2015. The increase was primarily attributable to the following: (1) an increase of $10.6 million in compensation-related expenses, including incentive compensation, resulting largely from an increase in headcount, (2) an increase of $10.5 million in commission expense to $39.4 million for the year ended December 31, 2016, resulting from a 34.9% increase in home sales revenues, (3) an increase of $2.7 million related to advertising costs associated with our increased number of homes delivered, (4) an increase of $1.2 million related to depreciation and amortization as a result of an increased property plant and equipment balance year over year, (5) an increase of $3.4 million in legal costs, (6) an increase of $1.1 million in information technology expenses related to the growth of the Company, and (7) an increase of $4.9 million related to increases in rent, model expenses, other corporate expenses, and feasibility related costs.
Other Income (Expense)
Other income (expense) remained relatively consistent at $1.6 million and $1.8 million for the years ended December 31, 2016 and 2015, respectively.
Income Tax Expense
Our income tax expense for the year ended December 31, 2016 was $23.6 million, as compared to $20.4 million for the year ended December 31, 2015. Our income tax expense for the year ended December 31, 2016 results in an effective tax rate of 32.3%, as compared to an effective tax rate of 33.8% for the year ended December 31, 2015. Our effective tax rate is driven by our blended federal and state statutory rate of 37.4%. Our blended federal and state statutory tax rate is reflective of the states in which we operate, including Nevada and Texas, which generally do not have corporate income tax. Our blended federal and state statutory tax rate is partially offset by
43
benefits from additional deductions for domestic production activities and federal energy credits allowed for under the Internal Revenue Code.
Segment Assets
|
|
December 31, |
December 31, |
Increase (Decrease) |
|||||||||
|
|
2016 |
2015 |
Amount |
Change |
||||||||
|
Mountain |
$ |
541,657 |
$ |
533,862 | 7,795 | 1.5 |
% |
|||||
|
Texas |
138,392 | 168,571 | (30,179) | (17.9) |
% |
|||||||
|
Southeast |
262,448 | 185,331 | 77,117 | 41.6 |
% |
|||||||
|
Corporate |
65,031 | 29,977 | 35,054 | 116.9 |
% |
|||||||
|
Total assets |
$ |
1,007,528 |
$ |
917,741 |
$ |
89,787 | 9.8 |
% |
||||
|
Lots owned |
December 31, 2016 |
December 31, 2015 |
% Change |
||||||||||||||||||
|
and controlled |
Owned |
Controlled |
Total |
Owned |
Controlled |
Total |
Owned |
Controlled |
Total |
||||||||||||
|
Mountain |
4,354 | 2,959 | 7,313 | 4,835 | 1,022 | 5,857 | (9.9) |
% |
189.5 |
% |
24.9 |
% |
|||||||||
|
Texas |
1,356 | 3,420 | 4,776 | 1,493 | 568 | 2,061 | (9.2) |
% |
502.1 |
% |
131.7 |
% |
|||||||||
|
Southeast |
2,953 | 3,254 | 6,207 | 2,667 | 2,575 | 5,242 | 10.7 |
% |
26.4 |
% |
18.4 |
% |
|||||||||
|
Total |
8,663 | 9,633 | 18,296 | 8,995 | 4,165 | 13,160 | (3.7) |
% |
131.3 |
% |
39.0 |
% |
|||||||||
Of our total lots owned and controlled as of December 31, 2016, 47.3% were owned and 52.7% were controlled, as compared to 68.4% owned and 31.6% controlled as of December 31, 2015.
Total assets increased by $89.8 million, or 9.8%, to $1.0 billion at December 31, 2016. The increase is primarily driven by increased investments in our Southeast and Mountain segments as well as our entrance into the Utah market (Mountain segment) and our purchase of lots in the Charlotte, North Carolina market (Southeast segment).
Other Homebuilding Operating Data
|
|
Year Ended |
||||||||
|
Net new home contracts |
December 31, |
Increase |
|||||||
|
|
2016 |
2015 |
Amount |
% Change |
|||||
|
Mountain |
1,260 | 938 | 322 | 34.3 |
% |
||||
|
Texas |
349 | 284 | 65 | 22.9 |
% |
||||
|
Southeast |
1,251 | 1,134 | 117 | 10.3 |
% |
||||
|
Total |
2,860 | 2,356 | 504 | 21.4 |
% |
||||
Net new home contracts (new home contracts net of cancellations) for the year ended December 31, 2016 increased by 504 homes, or 21.4%, to 2,860, as compared to 2,356 for the year ended December 31, 2015. The increase in our net new home contracts was driven by overall positive market conditions in the markets in which we operate.
Our overall monthly “absorption rate” (the rate at which home orders are contracted, net of cancelations) for the years ended December 31, 2016 and 2015 by segment are included in the table below:
|
|
|
|
|
|
|
|
|
|
|
|
|
|
December 31, |
|
Increase |
|||||
|
|
|
2016 |
|
2015 |
|
Amount |
|
% Change |
|
|
Mountain |
|
3.0 |
|
2.4 |
|
0.6 |
|
25.0 |
% |
|
Texas |
|
1.3 |
|
1.0 |
|
0.3 |
|
30.0 |
% |
|
Southeast |
|
3.4 |
|
3.2 |
|
0.2 |
|
6.3 |
% |
|
Total |
|
2.7 |
|
2.4 |
|
0.3 |
|
12.5 |
% |
44
Our absorption rate increased by 12.5% to 2.7 per month during the year ended December 31, 2016, as compared to 2.4 per month for the same period in 2015. The increase in absorption rate is attributable to the strong homebuilding environment as a result of positive economic trends in most of our markets.
|
Selling communities at period end |
As of December 31, |
Increase/(Decrease) |
||||||||
|
|
2016 |
2015 |
Amount |
% Change |
||||||
|
Mountain |
35 | 32 | 3 | 9.4 |
% |
|||||
|
Texas |
23 | 23 |
— |
— |
% |
|||||
|
Southeast |
31 | 33 | (2) | (6.1) |
% |
|||||
|
Total |
89 | 88 | 1 | 1.1 |
% |
|||||
Our selling communities increased by one community to 89 communities at December 31, 2016, as compared to 88 communities at December 31, 2015.
|
|
|
|
|
|
|
|
|
|
|
|
|
|
|
|
|
|
|
|
|
|
|
|
|
|
|
|
|
|
As of December 31, |
|
|
|
|
|
|
|
|
|
||||||||||||||
|
Backlog |
|
2016 |
|
2015 |
|
% Change |
|
||||||||||||||||||
|
|
|
Homes |
|
Dollar Value |
|
Average Sales Price |
|
Homes |
|
Dollar Value |
|
Average Sales Price |
|
Homes |
|
Dollar Value |
|
Average Sales Price |
|||||||
|
Mountain |
|
329 |
|
|
148,298 |
|
|
450.8 |
|
291 |
|
|
133,876 |
|
|
460.1 |
|
13.1 |
% |
|
10.8 |
% |
|
(2.0) |
% |
|
Texas |
|
151 |
|
|
72,423 |
|
|
479.6 |
|
140 |
|
|
63,013 |
|
|
450.1 |
|
7.9 |
% |
|
14.9 |
% |
|
6.6 |
% |
|
Southeast |
|
269 |
|
|
82,102 |
|
|
305.2 |
|
283 |
|
|
74,249 |
|
|
262.4 |
|
(4.9) |
% |
|
10.6 |
% |
|
16.3 |
% |
|
Total / Weighted Average |
|
749 |
|
$ |
302,823 |
|
$ |
404.3 |
|
714 |
|
$ |
271,138 |
|
$ |
379.7 |
|
4.9 |
% |
|
11.7 |
% |
|
6.5 |
% |
Backlog reflects the number of homes, net of actual cancellations experienced during the period, for which we have entered into a sales contract with a customer but for which we have not yet delivered the home. At December 31, 2016, we had 749 homes in backlog with a total value of $302.8 million, which represents an increase of 4.9% and 11.7%, respectively, as compared to December 31, 2015. The increase in backlog and backlog value is primarily attributable to the increase in the demand for new homes in the markets in which we operate. The increase in average sales price of homes in backlog is driven by increases across all of our operating segments, as a result of pricing strength due to positive market trends as well as product mix towards higher priced communities.
Critical Accounting Policies
Critical accounting estimates are those that we believe are both significant and that require us to make difficult, subjective or complex judgments, often because we need to estimate the effect of inherently uncertain matters. We base our estimates and judgments on historical experiences and various other factors that we believe to be appropriate under the circumstances. Actual results may differ from these estimates, and the estimates included in our financial statements might be impacted if we used different assumptions or conditions. Our management believes that the following accounting policies are among the most important to the portrayal of our financial condition and results of operations and require among the most difficult, subjective or complex judgments:
Revenue Recognition
Revenues from home sales are recorded and a profit is recognized when the respective units are closed, title has passed, the homeowner’s initial and continuing investment is adequate, and other attributes of ownership have been transferred to the homeowner. Sales incentives are recorded as a reduction of revenues when the respective unit is closed. When it is determined that the earnings process is not complete, the sale and the related profit are deferred for recognition in future periods.
We also serve as the general contractor for custom homes in our Texas segment, where the customer and not the Company owns the underlying land (Build on Your Own Lot Contracts). Accordingly, we recognize revenue for the Build on Your Own Lot Contracts, which are primarily cost plus contracts, on the percentage-of-completion method where progress toward completion is measured by relating the actual cost of work performed to date to the current estimated total cost of the respective contracts. As the Company makes such estimates, judgments are required to evaluate potential variances in the cost of materials and labor and productivity.
In August 2015, the Financial Accounting Standards Board (which we refer to as “FASB”) issued ASU 2015-14, “Revenue from Contracts with Customers (ASC 606).” ASU 2015-14 defers the effective date of ASU No. 2014-09, “Revenue from Contracts with
45
Customers (Topic 606)” and will be effective for the Company beginning on January 1, 2018, including interim reporting periods within that period. Early adoption is permitted as of annual reporting periods beginning after December 15, 2016. We plan to adopt ASU 2015-14 on January 1, 2018 under the modified retrospective approach.
We are substantially complete with our evaluation of the impact on our consolidated financial statements of adopting ASU 2015-14. We have evaluated contracts in each of our revenue streams in our reportable segments and have determined that there will not be a material impact on the amount or timing of recording home sales revenues and related costs of home sales revenues as a result of adopting ASU 2015-14. While the adoption of ASU 2015-14 will not result in a material impact to our consolidated financial statements, it will impact the following:
|
· |
Certain costs incurred related to our model homes, which were previously capitalized to inventory, will now be expensed as incurred. |
|
· |
Forfeited customer earnest money deposits which are currently presented in other income within the Consolidated Statement of Operations will be presented as other revenue. |
|
· |
Land sales to third parties which do not meet the definition of a customer in ASC 606, will be classified as other income in our Consolidated Statement of Operations. |
|
· |
Deferral of an allocated amount of revenue and costs associated with unsatisfied performance obligations, primarily the installation of landscaping, at the time of home delivery. |
|
· |
Reclassification of certain costs related to our model homes from inventory to property and equipment on our Consolidated Balance Sheet. |
Under the modified retrospective approach, we anticipate recording an opening adjustment to decrease retained earnings related to model homes costs that were previously capitalized to inventory, but would have been expensed as incurred under ASU 2015-14.
Inventories and Cost of Sales
We capitalize pre-acquisition, land, development, and other allocated costs, including interest, during development and home construction.
Land, development, and other common costs are allocated to inventory using the relative-sales-value method; however, as lots within a project typically have comparable market values, we generally allocate land, development, and common costs equally to each lot within the project. Home construction costs are recorded using the specific-identification method. Cost of sales for homes closed includes the allocation of construction costs of each home and all applicable land acquisition, land development, and related common costs, both incurred and estimated to be incurred. Changes to estimated total development costs subsequent to initial home closings in a community are generally allocated to the remaining homes in the community.
When a home is closed, the Company generally has not paid all incurred costs necessary to complete the home, and a liability and a charge to cost of home sales revenues are recorded for the amount that is estimated will ultimately be paid related to completed homes.
Impairment of Real Estate Inventories
We review all of our communities for an indicator of impairment and record an impairment loss when conditions exist where the carrying amount of inventory is not recoverable and exceeds its fair value. Indicators of impairment include, but are not limited to, significant decreases in local housing market values and selling prices of comparable homes, significant decreases to gross margins and sales absorption rates, costs in excess of budget, and actual or projected cash flow losses. We prepare and analyze cash flows at the lowest level for which there is identifiable cash flows that are independent of the cash flows of other groups of assets, which we have determined as the community level.
If events or circumstances indicate that the carrying amount may be impaired, such impairment will be measured based upon the difference between the carrying amount and the fair value of such assets determined using the estimated future discounted cash flows, excluding interest charges, generated from the use and ultimate disposition of the respective inventories. Such losses, if any, are reported within costs of sales.
When estimating undiscounted cash flows, we make various assumptions, including the following: the expected sales prices and sales incentives to be offered, including the number of homes available, pricing and incentives offered by us or other builders in other communities, and future sales prices adjustments based on market and economic trends; the costs incurred to date and expected to be incurred including, but not limited to, land and land development costs, home construction costs, interest costs, indirect construction,
46
and selling and marketing costs; any alternative product offerings that may be offered that could have an impact on sales, sales prices and/or building costs; and alternative uses for the property.
For the years ended December 31, 2017, 2016, and 2015, the following table shows the number of communities for which we identified an indicator of impairment and therefore tested for whether an impairment existed, compared to the total number of communities that existed during such period.
|
|
||||
|
|
Number of Communities Tested for Impairment |
Total Number of Existing Communities |
||
|
Year ended December 31, 2017 |
12 | 119 | ||
|
Year ended December 31, 2016 |
4 | 89 | ||
|
Year ended December 31, 2015 |
— |
88 |
For the year ended December 31, 2017, we recorded impairment charges on five communities, totaling $0.8 million. The impairment charges are in “Cost of home sales revenues” in our Consolidated Statement of Operations. For the years ended December 31, 2016 and 2015, no inventory impairments were recorded.
We evaluate our investment in unconsolidated subsidiaries for impairment whenever events or changes in circumstances indicate that there may be an other-than-temporary decline in value. To do so, we calculate the estimated fair value of the investment using a market, income or replacement cost approach, or combination thereof. The amount of impairment recognized, if any, would be the excess of the investment’s carrying amount over its estimated fair value. We consider various factors to determine if a decline in the value of the investment is other-than-temporary. These factors are Level 2 and 3 inputs and include but are not limited to, age of the venture, our intent and ability to retain our investment in the entity, the financial condition and long-term prospects of the entity, expected term of the investment, and the relationships with our partners. If we believe that the decline in the fair value is temporary, no impairment is recorded. The aforementioned factors are taken as a whole by management in determining the valuation of our investment. Should the actual results differ from management’s estimates, the valuation could be negatively affected and may result in a negative impact on the consolidated financial statements.
Warranties
Estimated future direct warranty costs are accrued and charged to cost of sales in the period when the related homebuilding revenues are recognized. Amounts accrued, which are included in accrued expenses and other liabilities on the Consolidated Balance Sheet, are based upon historical experience rates. We subsequently assess the adequacy of our warranty accrual on a quarterly basis through an internally developed analysis that incorporates historical payment trends and adjust the amounts recorded if necessary.
Stock-Based Compensation
We estimate the grant date fair value of stock-based compensation awards and recognize the fair value as compensation costs over the requisite service period, which is generally three years, for all awards that vest. We value the fair value our restricted stock awards and restricted stock units equal to the closing price of our common stock on the New York Stock Exchange on the date of grant.
Income Taxes
We account for income taxes in accordance with ASC 740, Income Taxes, which requires recognition of deferred tax assets and liabilities at enacted income tax rates for the temporary differences between the financial reporting bases and the tax bases of its assets and liabilities. Any effects of changes in income tax rates or tax laws are included in the provision for income taxes in the period of enactment. When it is more likely than not that a portion or all of a deferred tax asset will not be realized in the future, we provide a corresponding valuation allowance against the deferred tax asset. In addition, when it is more likely than not that a tax position will be sustained upon examination by a tax authority that has full knowledge of all relevant information, we measure the amount of tax benefit from the position and record the largest amount of tax benefit that is more likely than not of being realized after settlement with a tax authority. Our policy is to recognize interest to be paid on an underpayment of income taxes in interest expense and any related statutory penalties in the provision for income taxes on our Consolidated Statement of Operations.
On December 22, 2017, the Tax Cuts and Jobs Act (which we refer to as the “TCJA”) was signed into law. The TCJA significantly reforms the Internal Revenue Code of 1986, as amended. The TCJA, among other things, contains significant changes to corporate taxation, including reduction of the corporate tax rate, commencing in 2018, from a top marginal rate of 35% to a flat rate of 21%, limitation of the tax deduction for interest expense to 30% of adjusted earnings (except for certain small businesses), limitation of the deduction for net operating losses to 80% of current year taxable income, elimination of net operating loss carrybacks, one time taxation
47
of offshore earnings at reduced rates regardless of whether they are repatriated, immediate deductions for certain new investments instead of deductions for depreciation expense over time, and modifying or repealing many business deductions and credits.
Also on December 22, 2017, the SEC staff issued Staff Accounting Bulletin No. 118 (SAB 118) which addresses the application of ASC Topic 740 to the TCJA. SAB 118 outlines that if the accounting for the effects of the TCJA is incomplete, but a reasonable estimate can be made, then provisional amounts should be reflected in the financial statements.
Our accounting for the impacts of the TCJA related to current and deferred taxes, and in particular related to our acquisitions of UCP and Sundquist Homes, remain incomplete as of the date of these financial statements. Accordingly, we remeasured our deferred tax assets and liabilities based on the rates at which they are expected to reverse in the future, which is generally our estimated blended state and federal statutory rate in future periods of approximately 24%. This remeasurement resulted in a provisional reduction to our deferred tax assets of $2.8 million. This reduction is reflected in “Income tax expense” in our Consolidated Statement of Operations.
We anticipate that our accounting for the TCJA will be finalized upon the completion of our analysis of our tax basis in UCP, Inc., including refining certain calculations associated with UCP’s distributive share of its investment in UCP, LLC at the acquisition date of August 4, 2017 in accordance with I.R.C. §704(c). Additionally, we are still reviewing certain items related to the TCJA and refining our calculations. The resolution of these items could potentially affect the measurement of our provisional reduction to our deferred tax asset.
Goodwill
We evaluate goodwill for possible impairment in accordance with Accounting Standards Codification (which we refer to as “ASC”) Topic 350, Intangibles–Goodwill and Other, on an annual basis, or more frequently if events or changes in circumstances indicate that the carrying amount of such assets may not be recoverable. We use a three step process to assess whether or not goodwill can be realized. The first step is a qualitative assessment that analyzes current economic indicators associated with a particular reporting unit. For example, we analyze changes in economic, market and industry conditions, business strategy, cost factors, and financial performance, among others, to determine if there would be a significant decline to the fair value of a particular reporting unit. If the qualitative assessment indicates a stable or improved fair value, no further testing is required.
If a qualitative assessment indicates that a significant decline to fair value of a reporting unit is more likely than not, or if a reporting unit’s fair value has historically been closer to its carrying value, we will proceed to the second step where we calculate the fair value of a reporting unit based on discounted future cash flows. If this step indicates that the carrying value of a reporting unit is in excess of its fair value, we will proceed to the third step where the fair value of the reporting unit will be allocated to assets and liabilities as they would in a business combination. Impairment occurs when the carrying amount of goodwill exceeds its estimated fair value calculated in the third step.
Business Combinations
We account for business combinations in accordance with ASC Topic 850, Business Combinations, if the acquired assets assumed and liabilities incurred constitute a business. We consider acquired companies to constitute a business if the acquired net assets and processes have the ability to create outputs in the form of revenue. For acquired companies constituting a business, we recognize the identifiable assets acquired and liabilities assumed at their acquisition-date fair values and recognize any excess of total consideration paid over the fair value of the identifiable assets as goodwill.
The estimated fair value of the acquired assets and assumed liabilities requires significant judgments by management which are outlined below:
Inventories
The fair value of acquired inventories largely depends on the stage of production of the acquired land and work in process inventory. For acquired land inventory, we typically utilize, with the assistance of a third party appraiser, a forecasted cash flow approach for the development, marketing, and sale of each community acquired. Significant assumptions included in our estimates include future per lot development costs, construction and overhead costs, mix of products sold in each community, as well as average sales price. For work in process inventories, we estimate the fair value based upon the stage of production of each unit and a gross margin that we believe a
48
market participant would require to complete the remaining development and requisite selling efforts. For the acquisitions that we completed in 2017, we estimated a market participant would require a gross margin ranging from 6% to 22%.
Liquidity and Capital Resources
Overview
Our principal uses of capital for the year ended December 31, 2017 were the acquisition of UCP and Sundquist Homes, as well as for regular land purchases, land development, home construction, investment in unconsolidated subsidiaries and the payment of routine liabilities. We used funds generated by operations, common stock issuances, and available borrowings under our Revolving Credit Facility to meet our short-term working capital requirements.
Cash flows for each of our communities depend on the stage in the development cycle, and can differ substantially from reported earnings. Early stages of development or expansion require significant cash outlays for land acquisitions, entitlements and other approvals, and construction of model homes, roads, utilities, general landscaping and other amenities. Because these costs are a component of our inventory and not recognized in our statement of operations until a home closes, we incur significant cash outlays prior to our recognition of earnings. In the later stages of community development, cash inflows may significantly exceed earnings reported for financial statement purposes, as the cash outflow associated with home and land construction was previously incurred. From a liquidity standpoint, we are currently actively acquiring and developing lots in our markets to maintain and grow our lot supply and active selling communities that are strategically located in our core markets. As we continue to expand our business, our cash outlays for land purchases and land development to grow our lot inventory have begun to exceed our cash generated by operations.
Covenant Compliance
On October 21, 2014, we entered into a credit agreement with Texas Capital Bank, National Association, as Administrative Agent and L/C Issuer, and the lenders from time to time party thereto (which we refer to as the “Credit Agreement”). The Credit Agreement provides the Company with a revolving line of credit (which we refer to as the “Revolving Credit Facility”) of up to $120 million. Under the terms of the Credit Agreement, we are entitled to request an increase in the size of the Revolving Credit Facility by an amount not exceeding $80 million. If the existing lenders elect not to provide the full amount of a requested increase, we may invite one or more other lender(s) to become a party to the Credit Agreement, subject to the approval of the Administrative Agent and L/C Issuer. The Credit Agreement includes a letter of credit sublimit of $20 million. The obligations under the Revolving Credit Facility are guaranteed by certain of our subsidiaries.
On July 31, 2015, we entered into a First Modification Agreement with Texas Capital Bank, National Association, as Administrative Agent, the lenders party thereto, and our subsidiary guarantors party thereto, which modified the Credit Agreement. The First Modification Agreement, among other things, (i) increased the Revolving Credit Facility from $120 million to $200 million, (ii) extended the maturity date of the Revolving Credit Facility from October 21, 2017 to October 21, 2018, (iii) admitted Bank of America, N.A. as a new lender under the Revolving Credit Facility, and (iv) increased the amount of the Company’s option to request, from time to time, an increase in the size of the Revolving Credit Facility, from an amount not exceeding $80 million to an amount not exceeding $100 million, subject to the terms and conditions of the First Modification Agreement and the Credit Agreement.
On December 22, 2015, we entered into a Second Modification Agreement with Texas Capital Bank, National Association, as Administrative Agent, the lenders party thereto, and our subsidiary guarantors party thereto, which modified the Credit Agreement. The Second Modification Agreement, among other things, (i) increased the Revolving Credit Facility from $200 million to $300 million, and (ii) admitted Compass Bank, an Alabama Banking Corporation, and U.S. Bank National Association as new lenders under the Revolving Credit Facility.
On August 19, 2016, we entered into a Third Modification Agreement with Texas Capital Bank, National Association, as Administrative Agent, the lenders party thereto, and our subsidiary guarantors party thereto, which further modified the Credit Agreement. The Third Modification Agreement, among other things, (i) increased the Revolving Credit Facility from $300 million to $380 million through our exercise of $80 million of the accordion feature of the Credit Agreement, (ii) admitted Citibank, N.A. and Flagstar Bank, FSB as new lenders under the Revolving Credit Facility, (iii) increased certain lenders’ respective commitments to the Revolving Credit Facility, and (iv) extended the maturity date of the Revolving Credit Facility by one year to mature on October 21, 2019.
On February 24, 2017, we entered into a Commitment Increase Agreement with Texas Capital Bank, National Association, as Administrative Agent, Flagstar Bank, FSB (which we refer to as “Flagstar”), and our subsidiary guarantors party thereto. The Commitment Increase Agreement supplements the Credit Agreement, and (i) increased the Revolving Credit Facility from $380 million
49
to $400 million through our exercise of the remaining $20 million of the accordion feature of the Credit Agreement, and (ii) increased Flagstar’s commitment to the Credit Facility.
Unless terminated earlier, the principal amount under the Revolving Credit Facility, together with all accrued unpaid interest and other amounts owing thereunder, if any, will be payable in full on October 21, 2019, the maturity date of the Revolving Credit Facility. Borrowings under the Revolving Credit Facility bear interest at a floating rate equal to the London Interbank Offered Rate plus an applicable margin between 2.75% and 3.25% per annum, or, in the Administrative Agent’s discretion, a base rate plus an applicable margin between 1.75% and 2.25% per annum. The “applicable margins” described above are determined by a schedule based on our leverage ratio, as defined in the Credit Agreement. The Credit Agreement also provides for fronting fees and letter of credit fees payable to the L/C Issuer and commitment fees payable to the Administrative Agent equal to 0.20% of the unused portion of the Revolving Credit Facility.
The Credit Agreement contains customary affirmative and negative covenants (including limitations on the Company’s ability to grant liens, incur additional debt, pay dividends, redeem its common stock, make certain investments and engage in certain merger, consolidation or asset sale transactions), as well as customary events of default. The Credit Agreement also requires the Company to maintain (i) a leverage ratio of not more than 1.50 to 1.0 as of the last day of any fiscal quarter, based upon the ratio of debt to tangible net worth of the Company and its subsidiaries on a consolidated basis, (ii) an interest coverage ratio of not less than 1.50 to 1.0 for any four fiscal quarter period, based upon the ratio of EBITDA to cash interest expense of the Company and its subsidiaries on a consolidated basis, (iii) a consolidated tangible net worth of not less than the sum of $250 million, plus 50% of the net proceeds of any issuances of equity interests of the Company and the guarantors of the Revolving Credit Facility, plus 50% of the amount of consolidated net income of the Company and its subsidiaries, (iv) liquidity of not less than $25 million, and (v) a risk asset ratio of not more than 1.25 to 1.0, based upon the ratio of the book value of all risk assets owned by the Company and its subsidiaries to the Company’s tangible net worth.
As of December 31, 2017 and 2016, we were in compliance with all covenants under the Credit Agreement.
At-the-Market Offering Program
On November 7, 2016, we entered into a Distribution Agreement (which we refer to as the “First Distribution Agreement”) with J.P. Morgan Securities LLC, Merrill Lynch, Pierce, Fenner & Smith Incorporated, and Citigroup Global Markets Inc. (which we refer to collectively as the “Sales Agents,” and individually as a “Sales Agent”), relating to our common stock. Under the First Distribution Agreement we were authorized to offer and sell shares of our common stock having an aggregate offering price of up to $50.0 million from time to time through any of our Sales Agents in “at the market” offerings. During the years ended December 31, 2017 and 2016, we sold and issued 1.4 million and 0.6 million shares of our common stock, respectively, under the First Distribution Agreement, which provided net proceeds to us of $33.5 million and $11.4 million, respectively, and, in connection with such sales, paid total commissions and fees to the Sales Agents of $0.7 million and $0.2 million, respectively.
On August 9, 2017, we entered into a second Distribution Agreement (which we refer to as the “Second Distribution Agreement”) with the Sales Agents, pursuant to which we may offer and sell from time to time up to $100.0 million in “at the market” offerings. During the year ended December 31, 2017, we sold and issued 2.3 million shares of our common stock under the Second Distribution Agreement, which provided net proceeds to us of $64.6 million, and, in connection with such sales, paid total commissions and fees to the Sales Agents of $1.3 million. At December 31, 2017, there was approximately $34.2 million available for sale and issuance under the Second Distribution Agreement.
Cash Flows—Year Ended December 31, 2017 Compared to the Year Ended December 31, 2016
For the year ended December 31, 2017 and December 31, 2016, the comparison of cash flows is as follows:
|
· |
Net cash used in operating activities increased to $114.6 million during the year ended December 31, 2017 from net cash used of $45.8 million during the same period in 2016. The increase in cash used in operations was primarily a result of an increase in net cash used in working capital items including cash held in escrow, accounts receivable, prepaid expenses and other assets, accounts payable, accrued expenses and other liabilities, and mortgage loans held for sale of $92.4 million for the year ended December 31, 2017, as compared to cash used of $16.6 million for the same period in 2016. We had a net outflow associated with inventories of $83.4 million during the year ended December 31, 2017, compared to a net outflow of $91.9 million during the same period in 2016. The outflow in 2017 was driven by our investment in inventories through the purchase of 6,530 lots
50
|
during the year ended December 31, 2017, as well as 2,228 homes under construction as of December 31, 2017. These outflows were offset by cash inflows associated with 3,640 home deliveries during the year ended December 31, 2017. |
|
· |
Net cash used in investing activities was $134.4 million during the year ended December 31, 2017, compared to $23.2 million used during the same period in 2016. The increase relates to our acquisition of UCP and Sundquist Homes, which resulted in cash outflows, net of cash acquired, totaling $130.0 million an increase in purchases of property and equipment, partially offset the sale of our South Carolina operations which generated cash proceeds of $17.1 million, and a decrease in contributions to our unconsolidated joint venture during the year ended December 31, 2017, as compared to the same period in 2016. |
|
· |
Net cash provided by financing activities was $308.5 million during the year ended December 31, 2017, compared to $69.2 million during the same period in 2016. The increase in cash provided by financing activities is primarily attributed to cash proceeds from issuance of senior notes totaling $527.5 million, the net proceeds received from the sale of common stock totaling $98.1 million, and net proceeds from our mortgage repurchase facilities of $48.3 million, partially offset by an increase in net payments on our Revolving Credit Facility totaling $255.0 million, repayment of debt assumed in connection with our UCP acquisition of $151.9 million, a decrease in proceeds received from issuance of insurance premium notes and other indebtedness totaling $9.2 million, and an increase of debt issuance costs of $7.4 million. |
As of December 31, 2017, our cash balance was $88.8 million.
Cash Flows—Year Ended December 31, 2016 Compared to the Year Ended December 31, 2015
For the year ended December 31, 2016 and December 31, 2015, the comparison of cash flows is as follows:
|
· |
Net cash used in operating activities decreased to $45.8 million during the year ended December 31, 2016 from net cash used of $162.7 million during the same period in 2015. The decrease in cash used in operations was primarily a result of a net outflow associated with inventories of $91.9 million during the year ended December 31, 2016, compared to a net outflow of $208.5 million during the same period in 2015. The outflow in 2016 was driven by our investment in inventories through the purchase of 2,493 lots during the year ended December 31, 2016, as well as 1,367 homes under construction as of December 31, 2016. These outflows were partially offset by cash inflows associated with home deliveries of 2,825 homes in 2016. We had net cash used in working capital items including cash held in escrow, accounts receivable, prepaid expenses and other assets, accounts payable and accrued expenses and other liabilities of $16.6 million for the year ended December 31, 2016, as compared to cash used of $5.6 million for the same period in 2015. |
|
· |
Net cash used in investing activities was $23.2 million during the year ended December 31, 2016, compared to $4.2 million used during the same period in 2015. The increase relates to our investment in unconsolidated subsidiaries in 2016 as well increased purchases of property and equipment, partially offset by proceeds on a secured note receivable and the sale of assets. |
|
· |
Net cash provided by financing activities was $69.2 million during the year ended December 31, 2016, compared to $162.8 million during the same period in 2015. The decrease in cash provided by financing activities is primarily attributed to the issuance of senior notes in 2015 totaling $59.0 million, an increase in net payments on our Revolving Credit Facility totaling $55.0 million, and a decrease of a total of $2.5 million in cash used for repurchasing our common stock under our stock repurchase program and upon the vesting of restricted stock awards during the year ended December 31, 2016. These decreases in cash provided in 2016 were partially offset by the net proceeds received from the sale of common stock totaling $11.4
51
|
million, an increase in proceeds from insurance premium notes totaling $10.4 million, and a decrease in debt issuance costs paid of $1.7 million. |
As of December 31, 2016, our cash balance was $29.5 million.
Contractual Obligations
Our contractual obligations as of December 31, 2017 were as follows (in thousands):
|
|
|
|
|
|
|
|
|
|
|
|
|
|
|
|
|
|
|
|
Payments due by period |
|||||||||||||
|
|
|
Total |
|
Less than 1 year |
|
1 - 3 years |
|
3 - 5 years |
|
More than 5 years |
|||||
|
Long-term debt maturities, including interest |
|
$ |
1,127,568 |
|
$ |
100,609 |
|
$ |
99,938 |
|
$ |
467,292 |
|
$ |
459,729 |
|
Operating leases |
|
|
9,053 |
|
|
3,113 |
|
|
4,270 |
|
|
1,670 |
|
|
- |
|
Total contractual obligations |
|
$ |
1,136,621 |
|
$ |
103,722 |
|
$ |
104,208 |
|
$ |
468,962 |
|
$ |
459,729 |
Off-Balance Sheet Arrangements
In the ordinary course of business, we enter into land purchase contracts in order to procure lots for the construction of our homes. We are subject to customary obligations associated with entering into contracts for the purchase of land and improved lots. These purchase contracts typically require a cash deposit, and the purchase of properties under these contracts is generally contingent upon satisfaction of certain requirements, including obtaining applicable property and development entitlements. We also utilize option contracts with land sellers as a method of acquiring land in staged takedowns, to help us manage the financial and market risk associated with land holdings, and to reduce the use of funds from our corporate financing sources. Option contracts generally require payment by us of a non-refundable deposit for the right to acquire lots over a specified period of time at pre-determined prices. Our obligations with respect to purchase contracts and option contracts are generally limited to the forfeiture of the related non-refundable cash deposits. As of December 31, 2017, we had outstanding purchase contracts and option contracts for 15,032 lots totaling $436.7 million, and had $18.9 million of non-refundable cash deposits pertaining to land option contracts. While our performance, including the timing and amount of purchase, if any, under these outstanding purchase and option contracts is subject to change, we currently anticipate performing on 60% to 70% of the purchase and option contracts during the year ending December 31, 2017, with performance on the remaining purchase and option contacts occurring in future periods.
Our utilization of land option contracts is dependent on, among other things, the availability of land sellers willing to enter into option takedown arrangements, the availability of capital to financial intermediaries to finance the development of optioned lots, general housing market conditions, and local market dynamics. Options may be more difficult to procure from land sellers in strong housing markets and are more prevalent in certain geographic regions.
We post letters of credit and performance bonds related to our land development performance obligations, with local municipalities. As of December 31, 2017 and 2016, we had $78.3 million and $70.1 million, respectively, in letters of credit and performance bonds issued and outstanding. We anticipate that the obligations secured by these performance bonds and letters of credit generally will be performed in the ordinary course of business.
The following table presents EBITDA and Adjusted EBITDA for the years ended December 31, 2017, 2016, and 2015. Adjusted EBITDA is a non-GAAP financial measure we use as a supplemental measure in evaluating operating performance. We define Adjusted EBITDA as consolidated net income before (i) income tax expense, (ii) interest in cost of home sales revenues, (iii) other interest expense, (iv) depreciation and amortization expense, and (v) adjustments resulting from the application of purchase accounting for acquired work in process inventory related to business combinations. We believe Adjusted EBITDA provides an indicator of general economic performance that is not affected by fluctuations in interest rates or effective tax rates, levels of depreciation or amortization, and items considered to be non-recurring. Accordingly, our management believes that this measurement is useful for comparing general operating performance from period to period. Adjusted EBITDA should be considered in addition to, and not as a substitute for, consolidated net income in accordance with GAAP as a measure of performance. Our presentation of Adjusted EBITDA should not be
52
construed as an indication that our future results will be unaffected by unusual or non-recurring items. Our Adjusted EBITDA is limited as an analytical tool, and should not be considered in isolation or as a substitute for analysis of our results as reported under GAAP.
|
|
|
|
|
|
|
|
|
|
|
|
|
|
Year Ended December 31, |
|||||||
|
|
|
2017 |
|
2016 |
|
2015 |
|||
|
Net income |
|
$ |
50,295 |
|
$ |
49,540 |
|
$ |
39,890 |
|
Income tax expense |
|
|
33,869 |
|
|
23,609 |
|
|
20,415 |
|
Interest in cost of home sales revenues |
|
|
32,898 |
|
|
19,502 |
|
|
10,082 |
|
Interest expense (income) |
|
|
(3) |
|
|
5 |
|
|
10 |
|
Depreciation and amortization expense |
|
|
6,973 |
|
|
5,580 |
|
|
4,713 |
|
EBITDA |
|
|
124,032 |
|
|
98,236 |
|
|
75,110 |
|
Purchase price accounting for acquired work in process inventory |
|
|
15,625 |
|
|
389 |
|
|
2,673 |
|
Purchase price accounting for investment in unconsolidated subsidiaries outside basis |
|
|
915 |
|
|
1,228 |
|
|
— |
|
Acquisition expense |
|
|
9,905 |
|
|
490 |
|
|
491 |
|
Adjusted EBITDA |
|
$ |
150,477 |
|
$ |
100,343 |
|
$ |
78,274 |
Net Debt to Net Capital
The following table presents our ratio of net debt to net capital, which is a non-GAAP financial measure. We calculate this by dividing net debt (notes payable and revolving line of credit less cash held in escrow and cash and cash equivalents) by net capital (net debt plus total stockholders’ equity). The most directly comparable GAAP measure is the ratio of debt to total capital. We believe the ratio of net debt to net capital is a relevant and useful financial measure to investors in understanding the leverage employed in our operations and as an indicator of the our ability to obtain external financing.
|
|
|
|
|
|
|
|
|
|
|
|
|
|
Year Ended December 31, |
|||||||
|
|
|
2017 |
|
2016 |
|
2015 |
|||
|
Notes payable and revolving line of credit |
|
$ |
824,602 |
|
$ |
454,088 |
|
$ |
390,243 |
|
Total stockholders' equity |
|
|
735,233 |
|
|
473,636 |
|
|
409,479 |
|
Total capital |
|
$ |
1,559,835 |
|
$ |
927,724 |
|
$ |
799,723 |
|
Debt to capital |
|
|
52.9% |
|
|
48.9% |
|
|
48.8% |
|
|
|
|
|
|
|
|
|
|
|
|
Notes payable and revolving line of credit |
|
$ |
824,602 |
|
$ |
454,088 |
|
$ |
390,243 |
|
Cash held in escrow |
|
|
(37,723) |
|
|
(20,044) |
|
|
(11,817) |
|
Cash and cash equivalents |
|
|
(88,832) |
|
|
(29,450) |
|
|
(29,287) |
|
Net debt |
|
|
698,047 |
|
|
404,594 |
|
|
349,139 |
|
Total stockholders' equity |
|
|
735,233 |
|
|
473,636 |
|
|
409,479 |
|
Net capital |
|
$ |
1,433,280 |
|
$ |
878,230 |
|
$ |
758,618 |
|
|
|
|
|
|
|
|
|
|
|
|
Net debt to net capital |
|
|
48.7% |
|
|
46.1% |
|
|
46.0% |
53
Adjusted Diluted Earnings per Common Share
Adjusted Diluted Earnings per Common Share (which we refer to as “Adjusted Diluted EPS”) is a non-GAAP financial measure that we believe is useful to management, investors and other users of our financial information in evaluating our operating results and understanding our operating trends without the effect of certain non-recurring items. We believe excluding certain non-recurring items provides more comparable assessment of our financial results from period to period. Adjusted Diluted EPS is calculated by excluding the effect of acquisition costs and purchase price accounting for acquired work in process from the calculation of reported EPS.
|
|
|
|
|
|
|
|
|
|
|
|
|
|
Year Ended |
|||||||
|
|
|
December 31, |
|||||||
|
|
|
2017 |
|
2016 |
|
2015 |
|||
|
Numerator |
|
|
|
|
|
|
|
|
|
|
Net income |
|
$ |
50,295 |
|
$ |
49,540 |
|
$ |
39,890 |
|
Less: Undistributed earnings allocated to participating securities |
|
|
(384) |
|
|
(1,050) |
|
|
(1,323) |
|
Net income allocable to common stockholders |
|
$ |
49,911 |
|
$ |
48,490 |
|
$ |
38,567 |
|
Denominator |
|
|
|
|
|
|
|
|
|
|
Weighted average common shares outstanding - basic |
|
|
24,280,871 |
|
|
20,679,189 |
|
|
20,569,012 |
|
Dilutive effect of restricted stock units |
|
|
274,638 |
|
|
112,748 |
|
|
— |
|
Weighted average common shares outstanding - diluted |
|
|
24,555,509 |
|
|
20,791,937 |
|
|
20,569,012 |
|
Earnings per share: |
|
|
|
|
|
|
|
|
|
|
Basic |
|
$ |
2.06 |
|
$ |
2.34 |
|
$ |
1.88 |
|
Diluted |
|
$ |
2.03 |
|
$ |
2.33 |
|
$ |
1.88 |
|
|
|
|
|
|
|
|
|
|
|
|
Adjusted Earnings per share |
|
|
|
|
|
|
|
|
|
|
Numerator |
|
|
|
|
|
|
|
|
|
|
Income before income tax expense |
|
$ |
84,164 |
|
$ |
73,149 |
|
$ |
60,305 |
|
Purchase price accounting for acquired work in process inventory |
|
|
15,625 |
|
|
389 |
|
|
2,673 |
|
Acquisition expense |
|
|
9,905 |
|
|
490 |
|
|
491 |
|
Adjusted income before income tax expense |
|
|
109,694 |
|
|
74,028 |
|
|
63,469 |
|
Income tax expense, adjusted(1) |
|
|
(38,612) |
|
|
(23,893) |
|
|
(22,214) |
|
Adjusted net income |
|
|
71,082 |
|
|
50,135 |
|
|
41,255 |
|
Less: Undistributed earnings allocated to participating securities |
|
|
(543) |
|
|
(1,062) |
|
|
(1,368) |
|
Adjusted net income allocable to common stockholders |
|
$ |
70,539 |
|
$ |
49,073 |
|
$ |
39,887 |
|
|
|
|
|
|
|
|
|
|
|
|
Denominator - Diluted |
|
|
24,555,509 |
|
|
20,791,937 |
|
|
20,569,012 |
|
|
|
|
|
|
|
|
|
|
|
|
Adjusted diluted earnings per share |
|
$ |
2.87 |
|
$ |
2.36 |
|
$ |
1.94 |
|
|
|
|
|
|
|
|
|
|
|
|
(1) |
The tax rate used in calculating adjusted net income was 35.2% for the year ended December 31, 2017. The tax rate used is reflective of our GAAP tax rate for the applicable periods adjusted for certain acquisition costs which are not deductible for tax and the remeasurement of our deferred tax assets as a result of the Tax Cuts and Jobs Act which was signed into law on December 22, 2017. For the three months and year ended December 31, 2016, our GAAP tax rate was utilized. |
ITEM 7A.QUANTITATIVE AND QUALITATIVE DISCLOSURES ABOUT MARKET RISK.
Interest Rates
Market risk is the risk of loss arising from adverse changes in market rates and prices, such as interest rates, foreign currency exchange rates and commodity prices. Our primary exposure to market risk is interest rate risk associated with our Credit Agreement, which was entered into on October 21, 2014. Future borrowings under the Credit Agreement bear interest at a floating rate equal to the London Interbank Offered Rate plus an applicable margin between 2.75% and 3.25% per annum, or, in the Administrative Agent’s discretion, a base rate plus an applicable margin between 1.75% and 2.25% per annum. The “applicable margins” described above are determined
54
by a schedule based on the leverage ratio of the Company, as defined in the Credit Agreement. The Credit Agreement also provides for fronting fees and letter of credit fees payable to the L/C Issuer and commitment fees payable to the Administrative Agent equal to 0.20% of the unused portion of the Revolving Credit Facility.
Inflation
Our homebuilding operations can be adversely impacted by inflation, primarily from higher land, financing, labor, material and construction costs. In addition, inflation can lead to higher mortgage rates, which can significantly affect the affordability of mortgage financing to homebuyers. While we attempt to pass on cost increases to customers through increased prices, when weak housing market conditions exist, we are often unable to offset cost increases with higher selling prices.
Seasonality
Historically, the homebuilding industry experiences seasonal fluctuations in quarterly operating results and capital requirements. We typically experience the highest new home order activity during the spring, although this activity is also highly dependent on the number of active selling communities, timing of new community openings and other market factors. Since it typically takes four to six months to construct a new home, we deliver more homes in the second half of the year as spring and summer home orders convert to home deliveries. Because of this seasonality, home starts, construction costs and related cash outflows have historically been highest in the second and third quarters, and the majority of cash receipts from home deliveries occurs during the second half of the year. We expect this seasonal pattern to continue over the long term, although it may be affected by volatility in the homebuilding industry.
ITEM 8.CONSOLIDATED FINANCIAL STATEMENTS.
The information required by this Item is incorporated herein by reference to the financial statements set forth in Item 15 (Exhibits and Financial Statement Schedules) of Part IV of this Form 10-K.
ITEM 9.CHANGES IN AND DISAGREEMENTS WITH ACCOUNTANTS ON ACCOUNTING AND FINANCIAL DISCLOSURE.
None.
ITEM 9A.CONTROLS AND PROCEDURES.
Evaluation of Disclosure Controls and Procedures
Under the supervision and with the participation of our management, including our principal executive officer and principal financial officer, we conducted an evaluation of the effectiveness of our disclosure controls and procedures (as such term is defined under Rule 13a-15(e) under the Exchange Act) as of December 31, 2017, the end of the period covered by this Form 10-K. Based on this evaluation, our principal executive officer and principal financial officer concluded that our disclosure controls and procedures were effective as of December 31, 2017 in providing reasonable assurance that information required to be disclosed by us in the reports that we file or submit under the Exchange Act is recorded, processed, summarized and reported within the time periods specified in the SEC’s rules and forms.
Management’s Report on Internal Control over Financial Reporting
Our management is responsible for establishing and maintaining adequate internal control over financial reporting (as such term is defined in Exchange Act Rules 13a-15(f) and 15d-15(f)). In addition, our management is required to report their assessment, including their evaluation criteria, on the design and operating effectiveness of our internal control over financial reporting in this Form 10-K.
Our internal control over financial reporting is a process designed under the supervision of our principal executive officer and principal financial officer. During 2017, our management conducted an assessment of the internal control over financial reporting based upon criteria established in the “Internal Control – Integrated Framework” issued by the Committee of Sponsoring Organizations of the Treadway Commission (2013 framework). Based on our management’s assessment, which included a comprehensive review of the design and operating effectiveness of our internal control over financial reporting, our management has concluded that our internal control over financial reporting is effective as of December 31, 2017. In accordance with the SEC's published guidance, because we
55
acquired UCP and Sundquist Homes during the current fiscal year, management has excluded these companies from its evaluation of the effectiveness of the Company's internal control over financial reporting as of December 31, 2017. Home sales revenue and the aggregate total assets attributable to UCP and Sundquist Homes was $201.4 million and $18.7 million, respectively, for the year ended December 31, 2017, and $266.5 million and $59.7 million, respectively, as of December 31, 2017. Based on this assessment, our management concluded that, as of December 31, 2017, the Company's internal control over financial reporting was effective based on those criteria.
Changes in Internal Control over Financial Reporting
There were no changes during the fourth quarter of 2017 in our internal control over financial reporting (as defined in Rule 13a-15(f) under the Exchange Act) that have materially affected or are reasonably likely to materially affect our internal control over financial reporting.
56
Report of Independent Registered Public Accounting Firm
The Board of Directors and Stockholders of Century Communities, Inc.
Opinion on Internal Control over Financial Reporting
We have audited Century Communities, Inc.’s internal control over financial reporting as of December 31, 2017, based on criteria established in Internal Control—Integrated Framework issued by the Committee of Sponsoring Organizations of the Treadway Commission (2013 framework) (the COSO criteria). In our opinion, Century Communities, Inc. (the Company) maintained, in all material respects, effective internal control over financial reporting as of December 31, 2017, based on the COSO criteria.
We also have audited, in accordance with the standards of the Public Company Accounting Oversight Board (United States) (PCAOB), the 2017 consolidated financial statements of the Company and our report dated March 1, 2018 expressed an unqualified opinion thereon.
As indicated in the accompanying Management’s Report on Internal Control over Financial Reporting, management’s assessment of and conclusion on the effectiveness of internal control over financial reporting did not include the internal controls of UCP, Inc. or Sundquist Homes and affiliates, which are included in the 2017 consolidated financial statements of the Company and constituted 19% and 39% of total and net assets, respectively, as of December 31, 2017 and 15% and 22% of revenues and net income, respectively, for the year then ended. Our audit of internal control over financial reporting of the Company also did not include an evaluation of the internal control over financial reporting of UCP, Inc. or Sundquist Homes and affiliates.
Basis for Opinion
The Company’s management is responsible for maintaining effective internal control over financial reporting and for its assessment of the effectiveness of internal control over financial reporting included in the accompanying Management’s Report on Internal Control over Financial Reporting. Our responsibility is to express an opinion on the Company’s internal control over financial reporting based on our audit. We are a public accounting firm registered with the PCAOB and are required to be independent with respect to the Company in accordance with the U.S. federal securities laws and the applicable rules and regulations of the Securities and Exchange Commission and the PCAOB.
We conducted our audit in accordance with the standards of the PCAOB. Those standards require that we plan and perform the audit to obtain reasonable assurance about whether effective internal control over financial reporting was maintained in all material respects.
Our audit included obtaining an understanding of internal control over financial reporting, assessing the risk that a material weakness exists, testing and evaluating the design and operating effectiveness of internal control based on the assessed risk, and performing such other procedures as we considered necessary in the circumstances. We believe that our audit provides a reasonable basis for our opinion.
Definition and Limitations of Internal Control Over Financial Reporting
A company’s internal control over financial reporting is a process designed to provide reasonable assurance regarding the reliability of financial reporting and the preparation of financial statements for external purposes in accordance with generally accepted accounting principles. A company’s internal control over financial reporting includes those policies and procedures that (1) pertain to the maintenance of records that, in reasonable detail, accurately and fairly reflect the transactions and dispositions of the assets of the company; (2) provide reasonable assurance that transactions are recorded as necessary to permit preparation of financial statements in accordance with generally accepted accounting principles, and that receipts and expenditures of the company are being made only in accordance with authorizations of management and directors of the company; and (3) provide reasonable assurance regarding prevention or timely detection of unauthorized acquisition, use, or disposition of the company’s assets that could have a material effect on the financial statements.
Because of its inherent limitations, internal control over financial reporting may not prevent or detect misstatements. Also, projections of any evaluation of effectiveness to future periods are subject to the risk that controls may become inadequate because of changes in conditions, or that the degree of compliance with the policies or procedures may deteriorate.
/s/ Ernst & Young LLP
Denver, Colorado
March 1, 2018
57
None.
Item 10. Directors, Executive Officers and Corporate Governance.
The information required in response to this Item is incorporated herein by reference to the information contained under the captions entitled “Election of Directors—Information about Director Nominees,” “Executive Officers and Compensation” and “Section 16(a) Beneficial Ownership Reporting Compliance” in our definitive proxy statement for our 2018 Annual Meeting of Stockholders, which will be filed with the SEC pursuant to Regulation 14A under the Exchange Act no later than April 30, 2018 (which we refer to as our “2018 Proxy Statement”).
We will provide to any stockholders or other person without charge, upon request, a copy of our Corporate Governance Policy, Code of Business Conduct and Ethics, and the charters for our Audit Committee, Compensation Committee and Nominating and Corporate Governance Committee. You may obtain these documents on our website at http://www.centurycommunities.com under the Investor Relations section or by contacting our Investor Relations department at 303-268-8398.
Item 11. Executive Compensation.
The information required in response to this Item is incorporated herein by reference to the information contained in under the caption entitled “Executive Officers and Compensation” in our 2018 Proxy Statement.
Item 12. Security Ownership of Certain Beneficial Owners and Management and Related Stockholder Matters.
The information required in response to this Item is incorporated herein by reference to the information contained in under the caption entitled “Security Ownership of Certain Beneficial Owners and Management and Related Stockholder Matters” in our 2018 Proxy Statement.
Item 13. Certain Relationships and Related Transactions, and Director Independence.
The information required in response to this Item is incorporated herein by reference to the information contained in under the caption entitled “Certain Relationships and Related Party Transactions” in our 2018 Proxy Statement.
Item 14. Principal Accounting Fees and Services.
The information required in response to this Item is incorporated herein by reference to the information contained in under the caption entitled “Fees Incurred for Services by Principal Accountant” in our 2018 Proxy Statement.
58
ITEM 15.EXHIBITS AND FINANCIAL STATEMENT SCHEDULES.
(a)(1)Financial Statements
The following financial statements of the Company are included in a separate section of this Form 10-K commencing on the page numbers specified below:
|
Page |
|||
|
Consolidated Financial Statements |
|
||
|
Report of Independent Registered Public Accounting Firm |
F-2 |
||
|
Consolidated Balance Sheets as of December 31, 2017 and December 31, 2016 |
F-3 |
||
|
Consolidated Statements of Operations for the Years Ended December 31, 2017, 2016 and 2015 |
F-4 |
||
|
Consolidated Statements of Equity for the Years Ended December 31, 2017, 2016 and 2015 |
F-5 |
||
|
Consolidated Statements of Cash Flows for the Years Ended December 31, 2017, 2016 and 2015 |
F-6 |
||
|
Notes to Consolidated Financial Statements |
F-7 |
||
(a)(2)Financial Statements Schedules
Financial statement schedules have been omitted because they are not applicable, not material, not required or the required information is included in this Form 10-K.
(a)(3)Exhibits
The following exhibits are either filed herewith or incorporated herein by reference:
|
|
|
|
|
|
|
|
|
|
Exhibit Number
|
Description
|
|
|
|
|
3.1 |
|
|
|
|
|
3.2 |
|
|
|
|
|
3.3 |
|
|
|
|
|
4.1 |
|
|
|
|
|
4.2 |
|
|
|
|
59
|
4.3 |
|
|
|
|
|
4.4 |
|
|
|
|
|
4.5 |
|
|
|
|
|
4.5 |
|
|
|
|
|
4.6 |
|
|
|
|
|
4.7 |
|
|
|
|
|
4.8 |
|
|
|
|
|
4.9 |
|
|
|
|
|
4.10 |
|
|
|
|
|
10.1† |
|
|
|
|
|
10.2† |
|
|
|
|
|
10.3† |
|
|
|
|
|
10.4† |
|
|
|
|
60
|
10.5† |
|
|
10.6† |
|
|
|
|
|
10.7 |
|
|
|
|
|
10.8 |
|
|
|
|
|
10.9 |
|
|
|
|
|
10.10 |
|
|
|
|
|
10.11 |
|
|
|
|
|
10.12 |
|
|
|
|
|
10.13 |
|
|
|
|
|
10.14 |
|
|
|
|
|
10.15 |
|
|
|
|
|
12.1 |
Statement Regarding Computation of Ratio of Earnings to Fixed Charges. |
|
|
|
|
21.1 |
|
|
|
|
|
23.1 |
61
|
|
|
|
|
|
|
31.1 |
|
|
|
|
|
31.2 |
|
|
|
|
|
31.3 |
|
|
|
|
|
32.1 |
|
|
|
|
|
32.2 |
|
|
|
|
|
32.3 |
|
|
|
|
|
101.INS |
XBRL Instance Document. |
|
|
|
|
101.SCH |
XBRL Taxonomy Extension Schema Document. |
|
|
|
|
101.CAL |
XBRL Taxonomy Extension Calculation Linkbase Document. |
|
|
|
|
101.DEF |
XBRL Taxonomy Definition Linkbase Document. |
|
|
|
|
101.LAB |
XBRL Taxonomy Extension Labels Linkbase Document. |
|
|
|
|
101.PRE |
XBRL Taxonomy Extension Presentation Linkbase Document. |
† Management contract or compensatory plan or arrangement.
62
SIGNATURES
Pursuant to the requirements of the Securities Exchange Act of 1934, as amended, the Registrant has duly caused this report to be signed on its behalf by the undersigned, thereunto duly authorized.
|
|
|
|
|
|
|
|
|
|
|
|
|
Century Communities, Inc. |
||
|
|
||||||
|
Date: March 1, 2018 |
|
|
|
By: |
|
/s/ Dale Francescon |
|
|
|
|
|
|
|
Dale Francescon |
|
|
|
|
|
|
|
Chairman of the Board and Co-Chief Executive Officer (Co-Principal Executive Officer) |
|
|
||||||
|
Date: March 1, 2018 |
|
|
|
By: |
|
/s/ Robert J. Francescon |
|
|
|
|
|
|
|
Robert J. Francescon |
|
|
|
|
|
|
|
Co-Chief Executive Officer and President (Co-Principal Executive Officer) |
|
|
||||||
Pursuant to the requirements of the Securities Exchange Act of 1934, as amended, this report has been signed below by the following persons on behalf of the Registrant and in the capacities and on the dates indicated.
|
|
|
|
|
|
|
Signature |
|
Title |
|
Date |
|
|
||||
|
/s/ Dale Francescon Dale Francescon |
|
Chairman of the Board of Directors and Co-Chief Executive Officer (Co-Principal Executive Officer) |
|
March 1, 2018 |
|
|
||||
|
/s/ Robert J. Francescon Robert J. Francescon |
|
Co-Chief Executive Officer, President and Director (Co-Principal Executive Officer) |
|
March 1, 2018 |
|
|
||||
|
/s/ David L. Messenger David L. Messenger |
|
Chief Financial Officer (Principal Financial Officer) |
|
March 1, 2018 |
|
|
|
|||
|
|
||||
|
/s/ J. Scott Dixon |
|
Chief Accounting Officer |
|
|
|
J. Scott Dixon |
|
(Principal Accounting Officer) |
|
March 1, 2018 |
|
|
|
|
|
|
|
/s/ David L. Messenger, attorney in fact James M. Lippman |
|
Director |
|
March 1, 2018 |
|
|
|
|||
|
|
||||
|
/s/ David L. Messenger, attorney in fact Keith R. Guericke |
|
Director |
|
March 1, 2018 |
|
|
|
|||
|
|
||||
|
/s/ David L. Messenger, attorney in fact John P. Box |
|
Director |
|
March 1, 2018 |
63
CENTURY COMMUNITIES, INC.
INDEX TO CONSOLIDATED FINANCIAL STATEMENTS
F-1
Report of Independent Registered Public Accounting Firm
The Board of Directors and Stockholders of Century Communities, Inc.
Opinion on the Financial Statements
We have audited the accompanying consolidated balance sheets of Century Communities, Inc. (the Company) as of December 31, 2017 and 2016, and the related consolidated statements of operations, equity and cash flows for each of the three years in the period ended December 31, 2017, and the related notes (collectively referred to as the “financial statements”). In our opinion, the financial statements present fairly, in all material respects, the consolidated financial position of the Company at December 31, 2017 and 2016, and the consolidated results of its operations and its cash flows for each of the three years in the period ended December 31, 2017, in conformity with U.S. generally accepted accounting principles.
We also have audited, in accordance with the standards of the Public Company Accounting Oversight Board (United States) (PCAOB), the Company's internal control over financial reporting as of December 31, 2017, based on criteria established in Internal Control-Integrated Framework issued by the Committee of Sponsoring Organizations of the Treadway Commission (2013 framework), and our report dated March 1, 2018 expressed an unqualified opinion thereon.
Basis for Opinion
These financial statements are the responsibility of the Company's management. Our responsibility is to express an opinion on the Company’s financial statements based on our audits. We are a public accounting firm registered with the PCAOB and are required to be independent with respect to the Company in accordance with the U.S. federal securities laws and the applicable rules and regulations of the Securities and Exchange Commission and the PCAOB.
We conducted our audits in accordance with the standards of the PCAOB. Those standards require that we plan and perform the audit to obtain reasonable assurance about whether the financial statements are free of material misstatement, whether due to error or fraud. Our audits included performing procedures to assess the risks of material misstatement of the financial statements, whether due to error or fraud, and performing procedures that respond to those risks. Such procedures included examining, on a test basis, evidence regarding the amounts and disclosures in the financial statements. Our audits also included evaluating the accounting principles used and significant estimates made by management, as well as evaluating the overall presentation of the financial statements. We believe that our audits provide a reasonable basis for our opinion.
/s/ Ernst & Young LLP
We have served as the Company’s auditor since 2013.
Denver, Colorado
March 1, 2018
F-2
Century Communities, Inc.
As of December 31, 2017 and 2016
(in thousands)
|
|
|
|
|
|
|
|
|
|
|
|
|
|
|
|
|
|
|
December 31, |
|
December 31, |
||
|
|
|
2017 |
|
2016 |
||
|
Assets |
|
|
|
|
|
|
|
Cash and cash equivalents |
|
$ |
88,832 |
|
$ |
29,450 |
|
Cash held in escrow |
|
|
37,723 |
|
|
20,044 |
|
Accounts receivable |
|
|
12,999 |
|
|
5,656 |
|
Inventories |
|
|
1,390,354 |
|
|
857,885 |
|
Mortgage loans held for sale |
|
|
52,327 |
|
|
— |
|
Prepaid expenses and other assets |
|
|
60,812 |
|
|
34,714 |
|
Property and equipment, net |
|
|
27,911 |
|
|
15,935 |
|
Investment in unconsolidated subsidiaries |
|
|
28,208 |
|
|
18,275 |
|
Deferred tax assets, net |
|
|
5,555 |
|
|
— |
|
Amortizable intangible assets, net |
|
|
2,938 |
|
|
4,204 |
|
Goodwill |
|
|
27,363 |
|
|
21,365 |
|
Total assets |
|
$ |
1,735,022 |
|
$ |
1,007,528 |
|
Liabilities and stockholders' equity |
|
|
|
|
|
|
|
Liabilities: |
|
|
|
|
|
|
|
Accounts payable |
|
$ |
24,831 |
|
$ |
15,726 |
|
Accrued expenses and other liabilities |
|
|
150,356 |
|
|
62,296 |
|
Deferred tax liability, net |
|
|
— |
|
|
1,782 |
|
Senior notes payable |
|
|
776,283 |
|
|
259,088 |
|
Revolving line of credit |
|
|
— |
|
|
195,000 |
|
Mortgage repurchase facilities |
|
|
48,319 |
|
|
— |
|
Total liabilities |
|
|
999,789 |
|
|
533,892 |
|
Stockholders' equity: |
|
|
|
|
|
|
|
Preferred stock, $0.01 par value, 50,000,000 shares authorized, none outstanding |
|
|
— |
|
|
— |
|
Common stock, $0.01 par value, 100,000,000 shares authorized, 29,502,624 and 21,620,544 shares issued and outstanding at December 31, 2017 and December 31, 2016, respectively |
|
|
295 |
|
|
216 |
|
Additional paid-in capital |
|
|
566,790 |
|
|
355,567 |
|
Retained earnings |
|
|
168,148 |
|
|
117,853 |
|
Total stockholders' equity |
|
|
735,233 |
|
|
473,636 |
|
Total liabilities and stockholders' equity |
|
$ |
1,735,022 |
|
$ |
1,007,528 |
See Notes to Consolidated Financial Statements.
F-3
Century Communities, Inc.
Consolidated Statements of Operations
For the Years Ended December 31, 2017, 2016 and 2015
(in thousands, except per share amounts)
|
|
|
|
|
|
|
|
|
|
|
|
|
|
Year Ended December 31, |
|||||||
|
|
|
2017 |
|
2016 |
|
|
2015 |
||
|
Revenues |
|
|
|
|
|
|
|
|
|
|
Homebuilding revenues |
|
|
|
|
|
|
|
|
|
|
Home sales revenues |
|
$ |
1,405,443 |
|
$ |
978,733 |
|
$ |
725,437 |
|
Land sales and other revenues |
|
|
8,503 |
|
|
15,707 |
|
|
9,052 |
|
|
|
|
1,413,946 |
|
|
994,440 |
|
|
734,489 |
|
Financial services revenue |
|
|
9,853 |
|
|
— |
|
|
— |
|
Total revenues |
|
|
1,423,799 |
|
|
994,440 |
|
|
734,489 |
|
Homebuilding Cost of Revenues |
|
|
|
|
|
|
|
|
|
|
Cost of home sales revenues |
|
|
(1,153,359) |
|
|
(786,127) |
|
|
(579,203) |
|
Cost of land sales and other revenues |
|
|
(6,516) |
|
|
(14,217) |
|
|
(8,432) |
|
|
|
|
(1,159,875) |
|
|
(800,344) |
|
|
(587,635) |
|
Financial services costs |
|
|
(8,664) |
|
|
— |
|
|
— |
|
Selling, general, and administrative |
|
|
(176,304) |
|
|
(122,224) |
|
|
(87,840) |
|
Acquisition expense |
|
|
(9,905) |
|
|
(490) |
|
|
(491) |
|
Equity in income of unconsolidated subsidiaries |
|
|
12,176 |
|
|
191 |
|
|
— |
|
Other income |
|
|
2,937 |
|
|
1,576 |
|
|
1,782 |
|
Income before income tax expense |
|
|
84,164 |
|
|
73,149 |
|
|
60,305 |
|
Income tax expense |
|
|
(33,869) |
|
|
(23,609) |
|
|
(20,415) |
|
Net income |
|
$ |
50,295 |
|
$ |
49,540 |
|
$ |
39,890 |
|
|
|
|
|
|
|
|
|
|
|
|
Earnings per share: |
|
|
|
|
|
|
|
|
|
|
Basic |
|
$ |
2.06 |
|
$ |
2.34 |
|
$ |
1.88 |
|
Diluted |
|
$ |
2.03 |
|
$ |
2.33 |
|
$ |
1.88 |
|
Weighted average common shares outstanding: |
|
|
|
|
|
|
|
|
|
|
Basic |
|
|
24,280,871 |
|
|
20,679,189 |
|
|
20,569,012 |
|
Diluted |
|
|
24,555,509 |
|
|
20,791,937 |
|
|
20,569,012 |
See Notes to Consolidated Financial Statements.
F-4
Century Communities, Inc.
Consolidated Statements of Equity
For the Years Ended December 31, 2017, 2016 and 2015
(in thousands)
|
|
|
|
|
|
|
|
|
|
|
|
|
|
|
|
|
|
|
|
|
|
|
|
Paid-In |
|
Retained |
|
Total |
|||
|
|
|
Shares |
|
Amount |
|
Capital |
|
Earnings |
|
Equity |
||||
|
Balance at December 31, 2014 |
|
20,876 |
|
$ |
209 |
|
$ |
336,573 |
|
$ |
28,423 |
|
$ |
365,205 |
|
Repurchase of common stock upon vesting of restricted stock awards |
|
(44) |
|
|
— |
|
|
(861) |
|
|
— |
|
|
(861) |
|
Issuance of restricted stock awards |
|
501 |
|
|
— |
|
|
— |
|
|
— |
|
|
— |
|
Stock-based compensation expense |
|
— |
|
|
4 |
|
|
5,241 |
|
|
— |
|
|
5,245 |
|
Forfeitures of restricted stock awards |
|
(29) |
|
|
— |
|
|
— |
|
|
— |
|
|
— |
|
Net income |
|
— |
|
|
— |
|
|
— |
|
|
39,890 |
|
|
39,890 |
|
Balance at December 31, 2015 |
|
21,304 |
|
$ |
213 |
|
$ |
340,953 |
|
$ |
68,313 |
|
$ |
409,479 |
|
Issuance of common stock |
|
578 |
|
|
6 |
|
|
11,363 |
|
|
— |
|
|
11,369 |
|
Repurchase of common stock |
|
(159) |
|
|
(2) |
|
|
(2,391) |
|
|
— |
|
|
(2,393) |
|
Repurchase of common stock upon vesting of restricted stock awards |
|
(60) |
|
|
(1) |
|
|
(1,015) |
|
|
— |
|
|
(1,016) |
|
Stock-based compensation expense |
|
— |
|
|
— |
|
|
6,657 |
|
|
— |
|
|
6,657 |
|
Forfeitures of restricted stock awards |
|
(42) |
|
|
— |
|
|
— |
|
|
— |
|
|
— |
|
Net income |
|
— |
|
|
— |
|
|
— |
|
|
49,540 |
|
|
49,540 |
|
Balance at December 31, 2016 |
|
21,621 |
|
$ |
216 |
|
$ |
355,567 |
|
$ |
117,853 |
|
$ |
473,636 |
|
Issuance of common stock |
|
3,897 |
|
|
39 |
|
|
97,301 |
|
|
— |
|
|
97,340 |
|
Issuance of common stock in connection with business combination |
|
4,176 |
|
|
42 |
|
|
107,737 |
|
|
— |
|
|
107,779 |
|
Replacement award value in connection with business combination |
|
— |
|
|
— |
|
|
1,149 |
|
|
— |
|
|
1,149 |
|
Repurchase of common stock upon vesting of restricted stock awards |
|
(189) |
|
|
(2) |
|
|
(4,506) |
|
|
— |
|
|
(4,508) |
|
Stock-based compensation expense |
|
— |
|
|
— |
|
|
9,542 |
|
|
— |
|
|
9,542 |
|
Forfeitures of restricted stock awards |
|
(2) |
|
|
— |
|
|
— |
|
|
— |
|
|
— |
|
Net income |
|
— |
|
|
— |
|
|
— |
|
|
50,295 |
|
|
50,295 |
|
Balance at December 31, 2017 |
|
29,503 |
|
$ |
295 |
|
$ |
566,790 |
|
$ |
168,148 |
|
$ |
735,233 |
See Notes to Consolidated Financial Statements.
F-5
Century Communities, Inc.
Consolidated Statements of Cash Flows
For the Years Ended December 31, 2017, 2016 and 2015
(in thousands)
|
|
|
|
|
|
|
|
|
|
|
|
|
|
Year Ended December 31, |
|||||||
|
|
|
2017 |
|
2016 |
|
2015 |
|||
|
Operating activities |
|
|
|
|
|
|
|
|
|
|
Net income |
|
$ |
50,295 |
|
$ |
49,540 |
|
$ |
39,890 |
|
Adjustments to reconcile net income to net cash used in operating activities: |
|
|
|
|
|
|
|
|
|
|
Depreciation and amortization |
|
|
6,973 |
|
|
5,580 |
|
|
4,713 |
|
Stock-based compensation expense |
|
|
9,542 |
|
|
6,657 |
|
|
5,245 |
|
Deferred income taxes |
|
|
674 |
|
|
1,507 |
|
|
1,634 |
|
Distribution of income from unconsolidated subsidiaries |
|
|
5,243 |
|
|
— |
|
|
— |
|
Equity in income of unconsolidated subsidiaries |
|
|
(12,176) |
|
|
(191) |
|
|
— |
|
(Gain) loss on disposition of assets |
|
|
577 |
|
|
(446) |
|
|
(128) |
|
Changes in assets and liabilities: |
|
|
|
|
|
|
|
|
|
|
Cash held in escrow |
|
|
(17,679) |
|
|
(8,227) |
|
|
(1,821) |
|
Accounts receivable |
|
|
(166) |
|
|
(488) |
|
|
(1,438) |
|
Inventories |
|
|
(83,380) |
|
|
(91,859) |
|
|
(208,524) |
|
Prepaid expenses and other assets |
|
|
(19,959) |
|
|
(13,420) |
|
|
4,811 |
|
Accounts payable |
|
|
(3,670) |
|
|
4,657 |
|
|
(6,102) |
|
Accrued expenses and other liabilities |
|
|
1,405 |
|
|
854 |
|
|
(1,014) |
|
Mortgage loans held for sale |
|
|
(52,327) |
|
|
— |
|
|
— |
|
Net cash used in operating activities |
|
|
(114,648) |
|
|
(45,836) |
|
|
(162,734) |
|
Investing activities |
|
|
|
|
|
|
|
|
|
|
Purchases of property and equipment |
|
|
(17,627) |
|
|
(7,762) |
|
|
(5,750) |
|
Business combinations net of acquired cash |
|
|
(130,047) |
|
|
— |
|
|
— |
|
Proceeds from sale of South Carolina operations |
|
|
17,074 |
|
|
— |
|
|
— |
|
Investment in unconsolidated subsidiaries |
|
|
(4,000) |
|
|
(17,000) |
|
|
— |
|
Other investing activities |
|
|
154 |
|
|
1,561 |
|
|
1,518 |
|
Net cash used in investing activities |
|
|
(134,446) |
|
|
(23,201) |
|
|
(4,232) |
|
Financing activities |
|
|
|
|
|
|
|
|
|
|
Borrowings under revolving credit facilities |
|
|
175,000 |
|
|
220,000 |
|
|
180,000 |
|
Payments on revolving credit facilities |
|
|
(370,000) |
|
|
(160,000) |
|
|
(65,000) |
|
Proceeds from issuance of senior notes |
|
|
527,500 |
|
|
— |
|
|
58,956 |
|
Proceeds from issuance of insurance premium notes and other |
|
|
2,320 |
|
|
11,612 |
|
|
1,169 |
|
Principal payments on notes payable |
|
|
(6,998) |
|
|
(9,217) |
|
|
(8,656) |
|
Repayment of debt assumed in business combination |
|
|
(151,919) |
|
|
— |
|
|
— |
|
Debt issuance costs |
|
|
(8,579) |
|
|
(1,156) |
|
|
(2,817) |
|
Net proceeds from mortgage repurchase facilities |
|
|
48,320 |
|
|
— |
|
|
— |
|
Net proceeds from issuances of common stock |
|
|
98,063 |
|
|
11,369 |
|
|
— |
|
Repurchases of common stock upon vesting of restricted stock awards |
|
|
(5,231) |
|
|
(1,015) |
|
|
(861) |
|
Repurchases of common stock under our stock repurchase program |
|
|
— |
|
|
(2,393) |
|
|
— |
|
Net cash provided by financing activities |
|
|
308,476 |
|
|
69,200 |
|
|
162,791 |
|
Net decrease in cash and cash equivalents |
|
$ |
59,382 |
|
$ |
163 |
|
$ |
(4,175) |
|
Cash and cash equivalents |
|
|
|
|
|
|
|
|
|
|
Beginning of period |
|
|
29,450 |
|
|
29,287 |
|
|
33,462 |
|
End of period |
|
$ |
88,832 |
|
$ |
29,450 |
|
$ |
29,287 |
|
Supplemental cash flow disclosure |
|
|
|
|
|
|
|
|
|
|
Cash paid for income taxes |
|
$ |
29,632 |
|
$ |
23,467 |
|
$ |
18,657 |
See Notes to Consolidated Financial Statements.
F-6
Century Communities, Inc.
Notes to the Consolidated Financial Statements
December 31, 2017, 2016 and 2015
1. Nature of Operations and Summary of Significant Accounting Policies
Nature of Operations
Century Communities, Inc. (which we refer to as “we,” “CCS,” or the “Company”) is engaged in the development, design, construction, marketing and sale of single-family attached and detached homes in metropolitan areas in the States of California, Colorado, Georgia, Nevada, North Carolina, South Carolina, Tennessee, Texas, Utah, and Washington. In many of our projects, in addition to building homes, we are responsible for the entitlement and development of the underlying land. Our homebuilding operations are organized into the following four reportable segments based on the geographic regions in which we operate: West, Mountain, Texas and Southeast. Additionally, our indirect wholly-owned subsidiaries Inspire Home Loans Inc. and Parkway Title, LLC, which provide mortgage services and title services, respectively, to our home buyers have been identified as our Financial Services segment.
On August 4, 2017, we acquired UCP, Inc. (which we refer to as “UCP”) which was a homebuilder and land developer with expertise in residential land acquisition, development and entitlement, as well as home design, construction and sales, and with operations in the States of California, Washington, North Carolina, South Carolina and Tennessee. The merger was unanimously approved by the board of directors of both the Company and UCP and was also approved by UCP stockholders on August 1, 2017. In connection with the merger, each share of UCP Class A common stock outstanding immediately prior to the closing was converted into $5.32 in cash and 0.2309 of a newly issued share of our common stock. Approximately 4.2 million shares of our common stock were issued and $100.2 million in cash was paid in connection with the merger. Additionally, on October 31, 2017, we acquired substantially all the assets and operations and assumed certain liabilities of Sundquist Homes and affiliates (which we refer to as “Sundquist Homes”), a homebuilder with operations in the greater Seattle, Washington area, for approximately $50.2 million in cash. Our operating results presented herein include the operations of UCP and Sundquist Homes from the dates of the respective acquisitions through December 31, 2017.
Principles of Consolidation
The consolidated financial statements include the accounts of the Company, as well as all subsidiaries in which we have a controlling interest, and each variable interest entity (which we refer to as “VIE”) for which the Company is deemed the primary beneficiary. All intercompany accounts and transactions have been eliminated.
All numbers related to lots and communities disclosed in the notes to the consolidated financial statements are unaudited.
Use of Estimates
The preparation of financial statements in conformity with U.S. generally accepted accounting principles (GAAP) requires management to make estimates and assumptions that affect the reported amounts of assets and liabilities and disclosure of contingent assets and liabilities at the date of the consolidated financial statements and the reported amounts of revenues and expenses during the reporting period. Accordingly, actual results could differ from those estimates.
Cash and Cash Equivalents
The Company considers all liquid investments with original maturities of three months or less to be cash equivalents.
Cash Held in Escrow
Cash held in escrow consists of amounts related to the proceeds from home closings held for our benefit in escrow, which are typically held for less than a few days.
Accounts Receivable
Accounts receivable primarily consists of contract receivables related to certain contracts in our Texas segment accounted for under the percentage-of-completion method, income tax receivables and rebates receivables.
F-7
We periodically review the collectability of our accounts receivables, and, if it is determined that a receivable might not be fully collectible, an allowance is recorded for the amount deemed uncollectible. As of December 31, 2017 and 2016, no allowance was recorded related to accounts receivable.
Inventories and Cost of Sales
We capitalize pre-acquisition, land, development, and other allocated costs, including interest, during development and home construction.
Land, development, and other common costs are allocated to inventory using the relative-sales-value method; however, as lots within a project typically have comparable market values, we generally allocate land, development, and common costs equally to each lot within the project. Home construction costs are recorded using the specific-identification method. Cost of sales for homes closed includes the allocation of construction costs of each home and all applicable land acquisition, land development, and related common costs, both incurred and estimated to be incurred. Changes to estimated total development costs subsequent to initial home closings in a community are generally allocated to the remaining homes in the community.
When a home is closed, the Company generally has not paid all incurred costs necessary to complete the home, and a liability and a charge to cost of home sales revenues are recorded for the amount that is estimated will ultimately be paid related to completed homes.
Inventories are carried at cost unless events and circumstances indicate that the carrying value may not be recoverable. We review for indicators of impairment at the lowest level of identifiable cash flows, which we have determined as the community level.
Indicators of impairment include, but are not limited to, significant decreases in local housing market values and selling prices of comparable homes, decreases in actual or trending gross margins or sales absorption rates, significant unforeseen cost in excess of budget, and actual or projected cash flow losses.
If an indicator of impairment is identified, we estimate the recoverability of the community by comparing the estimated future cash flows on an undiscounted basis to its carrying value. If the undiscounted cash flows are more than the carrying value, the community is recoverable and no impairment is recorded. If the undiscounted cash flows are less than the community’s carrying value, we generally estimate the fair value using a discounted cash flow approach. A community with a fair value less than its carrying value is impaired and is written down to fair value.
When estimating cash flows of a community, we make various assumptions, including the following: (i) expected sales prices and sales incentives to be offered, including the number of homes available, pricing and incentives being offered by us or other builders in other communities, and future sales price adjustments based on market and economic trends; (ii) expected sales pace based on local housing market conditions, competition, and historical trends; (iii) costs expended to date and expected to be incurred, including, but not limited to, land and land development costs, home construction costs, interest costs, indirect construction and overhead costs, and selling and marketing costs; and (iv) alternative uses for the property. For the year ended December 31, 2017, we recorded impairment charges on five communities, totaling $0.8 million, which is included in “Cost of home sales revenues” in our Consolidated Statements of Operations. For the years ended December 31, 2016 and 2015, no inventory impairments were recorded.
Home Sales and Profit Recognition
Revenues from home sales are recorded and a profit is recognized when the respective units are closed, title has passed, the homeowner’s initial and continuing investment is adequate, and other attributes of ownership have been transferred to the homeowner. Sales incentives are recorded as a reduction of revenues when the respective unit is closed. When it is determined that the earnings process is not complete, the sale and the related profit are deferred for recognition in future periods.
We also serve as the general contractor for custom homes in our Texas operating segment, where the customer and not the Company owns the underlying land (which we refer to as “Build on Your Own Lot Contracts”). Accordingly, we recognize revenue for the Build on Your Own Lot Contracts, which are primarily cost plus contracts, on the percentage-of-completion method where progress toward completion is measured by relating the actual cost of work performed to date to the current estimated total cost of the respective contracts. As the Company makes such estimates, judgments are required to evaluate potential variances in the cost of materials and labor and productivity. During the years ended December 31, 2017, 2016 and 2015, we recognized revenue of $10.4 million, $7.3 million and
F-8
$6.1 million, respectively, associated with Build on Your Own Lot Contracts, which is presented in home sales revenues on the Consolidated Statements of Operations.
Performance Deposits
We are occasionally required to make a land, bond, and utility deposit as each new development is started. These amounts typically are refundable as each home is sold. Performance deposits are included in prepaid expenses and other assets on the Consolidated Balance Sheet.
Lot Option and Escrow Deposits
We enter into lot option purchase agreements with unrelated parties to acquire lots for the construction of homes. Under these agreements, we have paid deposits, which in many cases are non-refundable, in consideration for the right, but not the obligation, to purchase land or lots at a future point in time with predetermined terms. Lot option and escrow deposits are included in prepaid expenses and other assets on the Consolidated Balance Sheet.
Property and Equipment
Property and equipment are stated at cost less accumulated depreciation. Depreciation is charged to expense on the straight-line basis over the estimated useful life of each asset. During the year ended December 31, 2017, we determined that it was no longer probable that we would dispose of the golf course in our Rhodes Ranch Community, in our Mountain segment, within one year. Accordingly, we reclassified the assets associated with the golf course, previously classified as “Held for sale” within “Prepaid expenses and other assets” to the related assets on our Consolidated Balance Sheets as of December 31, 2017 and 2016, respectively. Additionally, we recorded a catch-up depreciation expense totaling $0.7 million during the year ended December 31, 2017, which is classified as “Cost of land sales and other revenues” in our Consolidated Statements of Operations.
The estimated useful lives for each major depreciable classification of property and equipment are as follows:
|
|
||
|
|
Years |
|
|
Buildings and improvements |
3 – 40 years |
|
|
Leasehold improvements |
3 – 10 years |
|
|
Machinery and equipment |
3 – 25 years |
|
|
Furniture and fixtures |
2 – 7 years |
|
|
Model furnishings |
2 – 5 years |
|
|
Computer hardware and software |
1 – 5 years |
Mortgage Loans Held for Sale
We use best efforts commitments with various investors to mitigate the risk associated with mortgage loans held for sale. Best efforts commitments which fix the forward sales price that will be realized in the secondary market are used to eliminate our interest rate and price risks. These best effort commitments are considered derivative instruments under ASC 815, “Derivatives and Hedging,” however, we do not have any derivative instruments designated as hedging instruments as of December 31, 2017. Substantially all of the loans originated by us and their related servicing rights are sold in the secondary mortgage market within a short period of time after origination, generally within 30 days. In accordance with ASC 825, “Financial Instruments” we use the fair value option to record residential mortgage loans available-for-sale at the price they are committed to be sold under the best efforts commitments.
Expected gains and losses from the sale of our loans held for sale are included in the measurement of written loan commitments that are accounted for at fair value through Financial Services revenues at the time of commitment. As of December 31, 2017, mortgage loans available-for-sale had an aggregate fair value of $52.3 million and an aggregate outstanding principal balance of $50.4 million. The net gain resulting from changes in fair value of the best efforts commitments and mortgage loans held in inventory totaled $1.9 million for the year ended December 31, 2017 and are included in “Financial services revenues.” Realized net gains from the sale of mortgages during the year ended December 31, 2017 were $4.2 million and have been included in “Financial Services revenues.”
Investment in Unconsolidated Subsidiaries
We account for our investment in unconsolidated subsidiaries under the equity method because we exercise significant influence over, but do not control, these entities. Under the equity method, these investments are initially recorded at cost and are subsequently adjusted
F-9
to reflect our proportionate share of net earnings or losses, distributions received, contributions made and certain other adjustments, as appropriate. Such investments are included in “Investment in unconsolidated subsidiaries” in our Consolidated Balance Sheets. Distributions from these investments that are related to cash earnings from operations are included as operating activities and distributions that are related to capital transactions are included as investing activities in our Consolidated Statements of Cash Flows. We recognize our proportionate share of the ongoing earnings or losses of the unconsolidated subsidiary in “equity in income of unconsolidated subsidiaries” in our Consolidated Statements of Operations.
We evaluate our investment in unconsolidated subsidiaries for impairment whenever events or changes in circumstances indicate that there may be an other-than-temporary decline in value. To do so, we calculate the estimated fair value of the investment using a market, income or replacement cost approach, or combination thereof. The amount of impairment recognized, if any, would be the excess of the investment’s carrying amount over its estimated fair value. We consider various factors to determine if a decline in the value of the investment is other-than-temporary. These factors are Level 2 and 3 inputs and include but are not limited to, age of the venture, our intent and ability to retain our investment in the entity, the financial condition and long-term prospects of the entity, expected term of the investment, and the relationships with our partners. If we believe that the decline in the fair value is temporary, no impairment is recorded. The aforementioned factors are taken as a whole by management in determining the valuation of our investment. Should the actual results differ from management’s estimates, the valuation could be negatively affected and may result in a negative impact on our consolidated financial statements.
Amortizable Intangible Assets
Amortizable intangible assets consist of the estimated fair value of trade names, home construction contracts, non-compete agreements, and home plans that were acquired upon closing of the acquisition of Jimmy Jacobs, LVLH, Grand View, and Peachtree. The acquisitions were accounted for as business combinations as defined in Accounting Standards Codification (which we refer to as “ASC”) 805, Business Combinations. A high degree of judgment is made by management on variables, such as revenue growth rates, profitability, and discount rates, when calculating the value of the intangible assets. The identified intangible assets are amortized over their respective estimated useful life. Trade names, non-compete agreements, and other intangibles assets are amortized to selling, general and administrative expenses in the Consolidated Statements of Operations. Intangible assets for cell phone tower leases, and home construction contracts are amortized to other income and cost of home sales revenues, respectively, as income on the related contracts are earned.
The estimated lives for each major amortizable classification of intangible assets are as follows:
|
|
||
|
|
Years |
|
|
Trade names |
2 – 4 years |
|
|
Home construction contracts |
1 – 2 years |
|
|
Non-compete agreements |
2 – 5 years |
|
|
Cell phone tower leases |
5 – 20 years |
|
|
Home plans |
7 years |
Earnest Money Deposits
We collect earnest deposits at the time a home buyer’s contract is accepted. Earnest money deposits held on homes under contract as of December 31, 2017 and 2016, totaled $14.1 million and $7.3 million, respectively, and are included in accrued expenses and other liabilities on the Consolidated Balance Sheets.
Stock-Based Compensation
We account for share-based awards in accordance with ASC 718, Compensation—Stock Compensation. ASC 718 requires us to estimate the grant date fair value of stock-based compensation awards and to recognize the fair value as compensation costs over the requisite service period, which is generally three years, for all awards that vest. We value our restricted stock awards and restricted stock units equal to the closing price of our common stock on the New York Stock Exchange on the date of grant.
Income Taxes
We account for income taxes in accordance with ASC 740, Income Taxes, which requires recognition of deferred tax assets and liabilities at enacted income tax rates for the temporary differences between the financial reporting bases and the tax bases of its assets and
F-10
liabilities. Any effects of changes in income tax rates or tax laws are included in the provision for income taxes in the period of enactment. When it is more likely than not that a portion or all of a deferred tax asset will not be realized in the future, the Company provides a corresponding valuation allowance against the deferred tax asset. As of December 31, 2017 and 2016, we had no valuation allowance recorded against our deferred tax assets.
In addition, when it is more likely than not that a tax position will be sustained upon examination by a tax authority that has full knowledge of all relevant information, the Company measures the amount of tax benefit from the position and records the largest amount of tax benefit that is more likely than not of being realized after settlement with a tax authority. The Company’s policy is to recognize interest to be paid on an underpayment of income taxes in interest expense and any related statutory penalties in the provision for income taxes on the Consolidated Statements of Operations. As of December 31, 2017 and 2016, we had no reserves for uncertain tax positions.
Goodwill
We evaluate goodwill for possible impairment in accordance with ASC 350, Intangibles–Goodwill and Other, on an annual basis, or more frequently if events or changes in circumstances indicate that the carrying amount of such assets may not be recoverable. We use a three step process to assess whether or not goodwill can be realized. The first step is a qualitative assessment that analyzes current economic indicators associated with a particular reporting unit. If the qualitative assessment indicates a stable or improved fair value, no further testing is required.
If a qualitative assessment indicates that a significant decline to fair value of a reporting unit is more likely than not, we will proceed to the second step where we calculate the fair value of a reporting unit based on discounted future cash flows. If this step indicates that the carrying value of a reporting unit is in excess of its fair value, we will proceed to the third step where the fair value of the reporting unit will be allocated to assets and liabilities as they would in a business combination. Impairment occurs when the carrying amount of goodwill exceeds its estimated fair value calculated in the third step.
As of December 31, 2017 and 2016, we determined our goodwill was not impaired.
Business Combinations
We account for business combinations in accordance with ASC 850, Business Combinations, if the acquired assets assumed and liabilities incurred constitute a business. We consider acquired companies to constitute a business if the acquired net assets and processes have the ability to create outputs in the form of revenue. For acquired companies constituting a business, we recognize the identifiable assets acquired and liabilities assumed at their acquisition-date fair values and recognize any excess of total consideration paid over the fair value of the identifiable net assets as goodwill.
Variable Interest Entities
We review land option contracts where we have a non-refundable deposit to determine whether the corresponding land seller is a VIE and, if so, whether we are the primary beneficiary.
In determining whether we are the primary beneficiary, we consider, among other things, whether we have the power to direct the activities that most significantly impact the economic performance of the VIE. In making this determination, we consider whether we have the power to direct certain activities, including, but not limited to, determining or limiting the scope or purpose of the VIE, the ability to sell or transfer property owned or controlled by the VIE, or arranging financing for the VIE. We are not the primary beneficiary of any VIE as of December 31, 2017 and 2016.
We analyzed each of our land option contracts to determine whether the land seller is a VIE and, if so, whether we are the primary beneficiary. Although we do not have legal title to the underlying land, we are required to consolidate a VIE if we are the primary beneficiary. As a result of our analysis, we determined that as of December 31, 2017, we were not the primary beneficiary of any VIE from which we have acquired rights to land under the land option contract. As of December 31, 2017 and 2016, we have non-refundable cash deposits totaling $18.9 million and $10.5 million, respectively, classified in “Prepaid expenses and other assets” in our Consolidated Balance Sheets for land option contracts. The non-refundable deposit is our maximum exposure to loss for the transactions as of December 31, 2017 and 2016, respectively.
Recently Issued Accounting Standards
In August 2015, the Financial Accounting Standards Board (which we refer to as “FASB”) issued ASU 2015-14, “Revenue from Contracts with Customers (ASC 606).” ASU 2015-14 defers the effective date of ASU No. 2014-09, “Revenue from Contracts with
F-11
Customers (Topic 606)” and will be effective for the Company beginning on January 1, 2018, including interim reporting periods within that period. Early adoption is permitted as of annual reporting periods beginning after December 15, 2016. We plan to adopt ASU 2015-14 on January 1, 2018 under the modified retrospective approach.
We are substantially complete with our evaluation of the impact on our consolidated financial statements of adopting ASU 2015-14. We have evaluated contracts in each of our revenue streams in each of our reportable segments and have determined that there will not be a material impact on the amount or timing of recording home sales revenues and related costs of home sales revenues as a result of adopting ASU 2015-14. While the adoption of ASU 2015-14 will not result in a material impact to our consolidated financial statements, it will impact the following:
|
· |
Certain costs incurred related to our model homes, which were previously capitalized to inventory, will now be expensed as incurred. |
|
· |
Forfeited customer earnest money deposits, which are currently presented in other income within the Consolidated Statements of Operations, will be presented as other revenue. |
|
· |
Land sales to third parties which do not meet the definition of a customer in ASC 606 will be classified as other income in our Consolidated Statements of Operations. |
|
· |
Deferral of an allocated amount of revenue and costs associated with unsatisfied performance obligations, primarily the installation of landscaping, at the time of home delivery. |
|
· |
Reclassification of certain costs related to our model homes from inventory to property and equipment on our Consolidated Balance Sheet. |
Under the modified retrospective approach, we anticipate recording an opening adjustment to decrease retained earnings related to model homes costs that were previously capitalized to inventory, but would have been expensed as incurred under ASU 2015-14.
In February 2016, the FASB issued ASU 2016-02, “Leases (Topic 842).” ASU 2016-02 requires the recognition of lease assets and lease liabilities by lessees for those leases classified as operating leases under previous GAAP. ASU 2016-02 is effective for the Company beginning January 1, 2019 and interim periods within the annual periods. We are currently evaluating the impact ASU 2016-02 will have on our consolidated financial statements.
In August 2016, the FASB issued ASU 2016-15, “Statement of Cash Flows - Classification of Certain Cash Receipts and Cash Payments.” ASU 2016-15 consists of eight provisions that provide guidance on the classification of certain cash receipts and cash payments in the statement of cash flows. ASU 2016-15 is effective for annual reporting periods, and interim periods therein, beginning after December 15, 2017. We do not believe that ASU 2016-15 will have a material effect on our consolidated financial statements.
Recently Adopted Accounting Standards
In March 2016, the FASB issued ASU 2016-09, “Compensation – Stock Compensation (Topic 718): Improvements to Employee Share-Based Payment Accounting.” ASU 2016-09 simplifies several aspects of the accounting for share-based payment transactions including income tax consequences, classification of awards as either equity or liabilities, and classification on the statement of cash flows. ASU 2016-09 is effective for the Company beginning January 1, 2017 and interim periods within the annual periods. We have adopted this standard and as a result have realized excess tax benefits of $1.1 million, which is included as a reduction to “Income tax expense” in our Condensed Consolidated Statements of Operations. Our calculation of earnings per share was also modified to reflect a change to exclude excess tax benefits from assumed proceeds in our computation of diluted shares outstanding under the treasury method. We have elected to continue to estimate forfeitures in recognizing the expense for our equity awards. Employee taxes paid by withholding shares on vesting of stock compensation are classified as a financing activity in our Condensed Consolidated Statements of Cash Flows.
In January 2017, the FASB issued ASU 2017-04, “Intangibles – Goodwill and Other (Topic 350): Simplifying the Test for Goodwill Impairment.” ASU 2017-04 requires only a one-step quantitative impairment test, whereby a goodwill impairment loss will be measured as the excess of a reporting unit’s carrying amount over its fair value. It eliminates Step 2 of the current two-step goodwill impairment test. ASU 2017-04 is effective for annual reporting periods in fiscal years beginning after December 15, 2019 and early adoption is permitted. We elected to early adopt ASU 2017-04 for the reporting period beginning January 1, 2017. Our adoption of ASU 2017-04 has not had a material effect on our condensed consolidated financial statements.
F-12
2. Reporting Segments
Our homebuilding operations are engaged in the development, design, construction, marketing and sale of single-family attached and detached homes in ten states, which are aggregated into four regions, each of which is managed by one of our regional presidents. Each of our homebuilding divisions is considered an operating segment, but has been aggregated into reportable segments defined by our regional structure as each region has similar economic characteristics and housing products. Each of our regional managers report to our chief operating decision makers (which we refer to as “CODMs”), the Co-Chief Executive Officers of our Company. The CODMs review the results of our operations, including total revenue and income before income tax expense to determine profitability, at the regional level. Accordingly, we have broken our homebuilding operations into the following reportable segments based on the geographic markets in which we operate:
|
· |
West (Southern California, Central Valley, Bay Area and Washington) |
|
· |
Mountain (Colorado, Nevada and Utah) |
|
· |
Texas (Houston, San Antonio and Austin) |
|
· |
Southeast (Georgia, North Carolina, South Carolina and Tennessee) |
We have also identified our Financial Services operations, which provide mortgage and title services to our homebuyers as a fifth reportable segment. Our Corporate operations are a nonoperating segment, as it serves to support our homebuilding operations through functions, such as our executive, finance, treasury, human resources, and accounting departments. We have adjusted prior period segment information to conform to the current period presentation.
The following table summarizes total revenue and income before income tax expense by segment (in thousands):
|
|
|
|
|
|
|
|
|
|
|
|
Year Ended December 31, |
|||||||
|
|
2017 |
|
2016 |
|
2015 |
|||
|
Revenue: |
|
|
|
|
|
|
|
|
|
West |
$ |
210,696 |
|
$ |
— |
|
|
— |
|
Mountain |
|
616,517 |
|
|
504,293 |
|
|
349,072 |
|
Texas |
|
165,170 |
|
|
147,006 |
|
|
116,229 |
|
Southeast |
|
421,563 |
|
|
343,141 |
|
|
269,188 |
|
Financial Services |
|
9,853 |
|
|
— |
|
|
— |
|
Corporate |
|
— |
|
|
— |
|
|
— |
|
Total revenue |
$ |
1,423,799 |
|
$ |
994,440 |
|
$ |
734,489 |
|
|
|
|
|
|
|
|
|
|
|
Income (loss) before income tax expense: |
|
|
|
|
|
|
|
|
|
West |
$ |
14,640 |
|
$ |
— |
|
|
— |
|
Mountain |
|
75,704 |
|
|
66,613 |
|
|
49,515 |
|
Texas |
|
10,952 |
|
|
2,686 |
|
|
4,260 |
|
Southeast |
|
29,662 |
|
|
31,138 |
|
|
23,574 |
|
Financial Services |
|
1,225 |
|
|
— |
|
|
— |
|
Corporate |
|
(48,019) |
|
|
(27,288) |
|
|
(17,044) |
|
Total income before income tax expense |
$ |
84,164 |
|
$ |
73,149 |
|
$ |
60,305 |
The following table summarizes total assets by segment (in thousands):
|
|
||||||
|
|
December 31, |
December 31, |
||||
|
|
2017 |
2016 |
||||
|
West |
$ |
273,749 |
$ |
— |
||
|
Mountain |
571,880 | 541,657 | ||||
|
Texas |
192,078 | 138,392 | ||||
|
Southeast |
401,618 | 262,448 | ||||
|
Financial Services |
63,137 |
— |
||||
|
Corporate |
232,560 | 65,031 | ||||
|
Total assets |
$ |
1,735,022 |
$ |
1,007,528 | ||
Corporate assets include certain cash and cash equivalents, our investment in unconsolidated subsidiaries, prepaid insurance, and deferred financing costs on our revolving line of credit.
F-13
3. Business Combinations
UCP, Inc.
On August 4, 2017, we acquired UCP, Inc. which was a homebuilder and land developer with expertise in residential land acquisition, development and entitlement, as well as home design, construction and sales, and with operations in the States of California, Washington, North Carolina, South Carolina and Tennessee. The merger was unanimously approved by the board of directors of both the Company and UCP and was also approved by UCP stockholders on August 1, 2017. In connection with the merger, each share of UCP Class A common stock outstanding immediately prior to the closing was converted into $5.32 in cash and 0.2309 of a newly issued share of our common stock. No fractional shares were issued in connection with the merger, and UCP stockholders received cash in lieu of any fractional shares. Approximately 4.2 million shares of our common stock were issued and $100.2 million in cash was paid in connection with the merger. Outstanding UCP restricted stock units were also converted into an aggregate amount of 0.2 million Century Communities restricted stock units pursuant to the merger. We determined that the total fair value of these awards was $6.2 million, of which $1.1 million was attributable to services performed by UCP employees prior to the merger and, as such, was included as consideration. During the year ended December 31, 2017, we incurred $9.6 million in acquisition related expenses, presented as “Acquisition expense” on the Unaudited Condensed Consolidated Statements of Operations. Total consideration of $209.0 million inclusive of cash acquired of $20.3 million is summarized as follows (in thousands, except per share amount):
|
|
|
|
|
|
UCP Shares (including noncontrolling interest) |
|
|
18,085 |
|
Cash paid per share |
|
$ |
5.32 |
|
Cash consideration |
|
$ |
96,213 |
|
Cash consideration pertaining to stockholder exercising appraisal rights |
|
$ |
3,937 |
|
Total cash consideration |
|
$ |
100,150 |
|
|
|
|
|
|
UCP Shares (including noncontrolling interest) |
|
|
18,085 |
|
Exchange ratio |
|
|
0.2309 |
|
Number of CCS shares issued |
|
|
4,176 |
|
Closing price of Century Communities stock |
|
$ |
25.80 |
|
Consideration attributable to common stock |
|
$ |
107,737 |
|
Total replacement award value |
|
$ |
1,149 |
|
Total equity consideration |
|
$ |
108,886 |
|
|
|
|
|
|
Total consideration in cash and equity |
|
$ |
209,036 |
The acquired assets consisted of approximately 4,199 owned lots within 43 total communities in the States of California, Washington, North Carolina, South Carolina and Tennessee. The 4,199 lots included 346 homes in backlog and 59 model homes. As the acquired assets and processes have the ability to create outputs in the form of revenue from the sale of single family residences, we concluded that the acquisition represents a business combination.
The following table summarizes our estimate of the fair value of assets acquired and liabilities assumed as of the acquisition date of UCP (in thousands):
|
|
|
|
|
Cash and cash equivalents |
$ |
20,264 |
|
Accounts receivable |
|
7,248 |
|
Inventories |
|
394,098 |
|
Prepaid expenses and other assets |
|
6,988 |
|
Property and equipment, net |
|
717 |
|
Deferred tax asset, net |
|
7,931 |
|
Goodwill |
|
5,998 |
|
Total assets |
$ |
443,244 |
|
|
|
|
|
Accounts payable |
$ |
10,712 |
|
Accrued expenses and other liabilities |
|
70,577 |
|
Notes payable |
|
152,919 |
|
Total liabilities |
|
234,208 |
|
Purchase price/Net equity |
$ |
209,036 |
F-14
The purchase price accounting reflected above is preliminary and is based upon estimates and assumptions that are subject to change within the measurement period (up to one year from the acquisition date). The measurement period remains open pending the completion of valuation procedures related to the acquired assets and assumed liabilities including inventories and our deferred tax asset. We have not yet finalized the allocation of goodwill to our reporting units.
Acquired inventories consist of both acquired land and work in process inventories. We determined the estimate of fair value for acquired land inventory with the assistance of a third-party appraiser primarily using a forecasted cash flow approach for the development, marketing, and sale of each community acquired. Significant assumptions included in our estimate include future per lot development costs, construction and overhead costs, mix of products sold in each community, as well as average sales price, and absorption rates. We estimated the fair value of acquired work in process inventories based upon the stage of production of each unit and a gross margin that we believe a market participant would require to complete the remaining development and requisite selling efforts. The stage of production, as of the acquisition date, ranged from recently started lots to fully completed single family residences. We estimated a market participant would require a gross margin ranging from 6% to 20% based upon the stage of production of the individual lot. Goodwill represents the excess of the purchase price over the fair value of assets acquired and liabilities assumed. We expect that $6.5 million of Goodwill will be deductible for tax purposes. The purchase price accounting reflected in the accompanying financial statements is preliminary and is based upon estimates and assumptions that are subject to change within the measurement period (up to one year from the acquisition date).
On August 17, 2017, we sold BMCH South Carolina, LLC, a subsidiary of UCP that was recently acquired as part of our acquisition of UCP, to a third party for approximately $17.1 million. Accordingly, the estimated fair value of the acquired assets of BMCH South Carolina, LLC was determined to be equal to the disposal price given the proximity of the two transactions.
We determined that UCP’s carrying costs approximated fair value for all other acquired assets and assumed liabilities.
UCP’s results of operations, which include homebuilding revenues of $201.4 million and income before tax of $20.5 million, are included in the accompanying Consolidated Statements of Operations for the period from August 4, 2017 through December 31, 2017.
Sundquist Homes
On October 31, 2017, we acquired substantially all the assets and operations and assumed certain liabilities of Sundquist Homes and affiliates, a homebuilder with operations in the greater Seattle, Washington area, for approximately $50.2 million in cash. The acquired assets include owned and controlled land, homes under construction and model homes. As the acquired assets and processes have the ability to create outputs in the form of revenue from the sale of single family residences, we concluded that the acquisition represents a business combination.
The following table summarizes our preliminary estimates of the fair value of the assets acquired and liabilities assumed as of the acquisition date of Sundquist Homes (in thousands):
|
|
|
|
|
Accounts receivable |
$ |
11 |
|
Inventories |
|
55,077 |
|
Prepaid expenses and other assets |
|
1,050 |
|
Property and equipment, net |
|
142 |
|
Total assets |
$ |
56,280 |
|
|
|
|
|
Accounts payable |
$ |
3,646 |
|
Accrued expenses and other liabilities |
|
2,431 |
|
Total liabilities |
|
6,077 |
|
Purchase price/Net equity |
$ |
50,203 |
The purchase price accounting reflected above is preliminary and is based upon estimates and assumptions that are subject to change within the measurement period (up to one year from the acquisition date). The measurement period remains open pending the completion of valuation procedures related to the acquired assets and assumed liabilities.
Acquired inventories consist of both acquired land and work in process inventories. We determined the estimate of fair value for acquired land inventory with the assistance of a third-party appraiser primarily using a forecasted cash flow approach for the development, marketing, and sale of each community acquired. Significant assumptions included in our estimate include future per lot development costs, construction and overhead costs, mix of products sold in each community, as well as average sales price, and absorption rates. We estimated the fair value of acquired work in process inventories based upon the stage of production of each unit and a gross margin that we believe a market participant would require to complete the remaining development and requisite selling efforts. The stage of production, as of the acquisition date, ranged from recently started lots to fully completed single family
F-15
residences. We estimated a market participant would require a gross margin ranging from 6% to 20% based upon the stage of production of the individual lot. The purchase price accounting reflected in the accompanying financial statements is preliminary and is based upon estimates and assumptions that are subject to change within the measurement period (up to one year from the acquisition date). We expect that $4.8 million of tax Goodwill will be deductible for tax purposes in connection with this acquisition. During the year ended December 31, 2017, we incurred $0.3 million in acquisition related expenses, presented as “Acquisition expense” on the Unaudited Condensed Consolidated Statements of Operations.
We determined that Sundquist Homes’s carrying costs approximated fair value for all other acquired assets and assumed liabilities.
Sundquist Homes’s results of operations, which include homebuilding revenues of $18.7 million and income before tax of $3.9 million, are included in the accompanying Consolidated Statements of Operations for the period from October 31, 2017 through December 31, 2017. Income before income tax includes adjustments for inventory and acquisition expenses.
Unaudited Pro Forma Financial Information
Unaudited pro forma revenue and income before tax expense for the years ended December 31, 2017 and 2016 give effect to the results of the acquisitions of UCP and Sundquist Homes as of January 1, 2017 and 2016, respectively. Unaudited pro forma income before tax expense adjusts the operating results of UCP and Sundquist Homes to reflect the additional costs that would have been recorded assuming the fair value adjustments had been applied as of the beginning of the period presented and excludes acquisition expense incurred related to the transactions. Pro forma basic and diluted EPS gives effect to the issuance of approximately 4.2 million shares of common stock as consideration for the acquisition of UCP as though the acquisition had occurred on January 1, 2017 and 2016, respectively (in thousands, except share and per share information):
|
|
|
|
|
|
|
|
|
|
Year Ended December 31, |
|||
|
|
2017 |
|
2016 |
||
|
Revenues |
$ |
1,718,924 |
|
$ |
1,403,514 |
|
|
|
|
|
|
|
|
Income before tax expense |
$ |
110,764 |
|
$ |
85,896 |
|
Tax expense |
|
(40,822) |
|
|
(17,848) |
|
Net income |
$ |
69,942 |
|
$ |
68,048 |
|
Less: Undistributed earnings allocated to participating securities |
|
(456) |
|
|
(1,204) |
|
Numerator for basic and diluted pro forma EPS |
$ |
69,486 |
|
$ |
66,844 |
|
|
|
|
|
|
|
|
Pro forma weighted average shares-basic |
|
28,456,725 |
|
|
24,855,043 |
|
Pro forma weighted average shares-diluted |
|
28,760,635 |
|
|
24,967,791 |
|
|
|
|
|
|
|
|
Pro forma basic EPS |
$ |
2.44 |
|
$ |
2.69 |
|
Pro forma diluted EPS |
$ |
2.42 |
|
$ |
2.68 |
F-16
4. Inventory
Inventory included the following (in thousands):
|
|
||||||
|
|
December 31, |
December 31, |
||||
|
|
2017 |
2016 |
||||
|
Homes under construction |
$ |
869,554 |
$ |
455,454 | ||
|
Land and land development |
479,038 | 373,496 | ||||
|
Capitalized interest |
41,762 | 28,935 | ||||
|
Total inventories |
$ |
1,390,354 |
$ |
857,885 | ||
5. Amortizable Intangible Assets
Amortizable intangible assets included the following (in thousands):
|
|
As of December 31, |
|||||
|
|
2017 |
2016 |
||||
|
Trade names |
$ |
— |
$ |
1,185 | ||
|
Non-compete agreements |
5,065 | 5,065 | ||||
|
In place lot option contracts |
— |
628 | ||||
|
Cell phone tower lease |
1,408 | 1,408 | ||||
|
Home plans |
764 | 764 | ||||
|
Gross intangible assets |
7,237 | 9,050 | ||||
|
Accumulated amortization |
(4,299) | (4,846) | ||||
|
Intangible assets, net |
$ |
2,938 |
$ |
4,204 | ||
We recognized amortization expense on our intangible assets of $1.3 million, $1.9 million and $2.4 million during the years ended December 31, 2017, 2016 and 2015, respectively. During the years ended December 31, 2017 and 2016, we wrote off fully depreciated amortizable intangible assets totaling $1.8 million and $2.2 million, respectively, and the related accumulated amortization.
As of December 31, 2017, expected amortization expense for amortizable intangible assets for each of the next five years, and thereafter, is as follows (in thousands):
|
2018 |
$ |
1,181 | |
|
2019 |
765 | ||
|
2020 |
173 | ||
|
2021 |
113 | ||
|
2022 |
73 | ||
|
Thereafter |
633 | ||
|
Net intangible assets, net |
$ |
2,938 |
F-17
6. Property and Equipment
Property and equipment included the following (in thousands):
|
|
|
|
|
|
|
|
|
|
|
December 31, |
|
December 31, |
||
|
|
|
2017 |
|
2016 |
||
|
Land |
|
$ |
3,167 |
|
$ |
3,159 |
|
Buildings and improvements |
|
|
2,069 |
|
|
1,571 |
|
Leasehold improvements |
|
|
991 |
|
|
587 |
|
Machinery and equipment |
|
|
10,334 |
|
|
958 |
|
Furniture and fixtures |
|
|
1,938 |
|
|
749 |
|
Model furnishings |
|
|
16,113 |
|
|
12,315 |
|
Computer hardware and software |
|
|
7,605 |
|
|
3,656 |
|
|
|
|
42,217 |
|
|
22,995 |
|
Less accumulated depreciation |
|
|
(14,306) |
|
|
(7,060) |
|
Total property and equipment, net |
|
$ |
27,911 |
|
$ |
15,935 |
7. Prepaid Expenses and Other Assets
Prepaid expenses and other assets included the following (in thousands):
|
|
||||||
|
|
December 31, |
December 31, |
||||
|
|
2017 |
2016 |
||||
|
Prepaid insurance |
$ |
6,549 |
$ |
12,259 | ||
|
Lot option and escrow deposits |
35,700 | 12,320 | ||||
|
Performance deposits |
3,295 | 1,544 | ||||
|
Deferred financing costs revolving line of credit, net |
1,795 | 2,637 | ||||
|
Restricted cash |
4,881 | 1,505 | ||||
|
Secured note receivable |
2,753 | 2,850 | ||||
|
Other |
5,839 | 1,599 | ||||
|
Total prepaid expenses and other assets |
$ |
60,812 |
$ |
34,714 | ||
8. Investment in Unconsolidated Subsidiaries
On November 1, 2016, we acquired a 50% ownership interest in WJH LLC (which we refer to as “WJH”), which is the successor to Wade Jurney Homes, Inc. and Wade Jurney of Florida, Inc., for $15.0 million of which $1.0 million was held by the Company for potential indemnification claims for a period of twelve months following the closing. WJH primarily targets first-time homebuyers in the Southeastern United States. As a result of the transaction, we own 50% of WJH and Wade Jurney Jr., an individual, owns the other 50% interest. Each party contributed an additional $3.0 million in capital to WJH upon its formation and we incurred $0.1 million in related acquisition costs. The Company and Wade Jurney Jr. share responsibility for all of WJH’s strategic decisions, with Wade Jurney Jr. continuing to manage the day-to-day operations under the existing operating model. Our investment in WJH is treated as an unconsolidated investment under the equity method of accounting.
Our aggregate investment in WJH at December 31, 2017 of $28.2 million was more than our share of the underlying net assets of WJH, resulting in outside basis of approximately $5.4 million. Of the $5.4 million in outside basis, $1.1 million and $4.4 million are attributed to the underlying trade names and goodwill of WJH, respectively. Amounts allocated to intangible assets will be amortized to equity in earnings over approximately 10 years.
As of December 31, 2017 and 2016, our investment in WJH was $28.2 million and $18.3 million, respectively, and we recognized $12.2 million and $0.2 million of equity in income of unconsolidated subsidiaries during the years ended December 31, 2017 and 2016, respectively. During the year ended December 31, 2017, we made capital contributions totaling $3.0 million and received operating distributions from WJH of $5.2 million.
F-18
The following table provides unaudited selected financial information for WJH as of and for the year ended December 31, 2017, and as of and for the period from November 1, 2016 (our investment date) through December 31, 2016 (in thousands):
|
|
|
|
|
|
|
|
|
|
|
December 31, |
||||
|
|
|
2017 (unaudited) |
|
2016 (unaudited) |
||
|
Inventories |
|
$ |
101,649 |
|
$ |
42,069 |
|
Total assets |
|
$ |
136,531 |
|
$ |
63,572 |
|
Total liabilities |
|
$ |
91,002 |
|
$ |
39,733 |
|
Partners' capital |
|
$ |
45,529 |
|
$ |
23,839 |
|
Homebuilding revenues |
|
$ |
271,653 |
|
$ |
31,019 |
|
Income before income tax expense |
|
$ |
26,185 |
|
$ |
2,839 |
9. Accrued Expenses and Other Liabilities
Accrued expenses and other liabilities included the following (in thousands):
|
|
||||||
|
|
December 31, |
December 31, |
||||
|
|
2017 |
2016 |
||||
|
Earnest money deposits |
$ |
14,077 |
$ |
7,304 | ||
|
Warranty reserve |
8,531 | 2,479 | ||||
|
Accrued compensation costs |
22,129 | 12,627 | ||||
|
Land development and home construction accruals |
61,918 | 31,486 | ||||
|
Liability for product financing arrangement |
19,751 |
— |
||||
|
Accrued interest |
14,435 | 3,039 | ||||
|
Income taxes payable |
851 | 783 | ||||
|
Other |
8,664 | 4,578 | ||||
|
Total accrued expenses and other liabilities |
$ |
150,356 |
$ |
62,296 | ||
10. Warranties
Estimated future direct warranty costs are accrued and charged to cost of home sales revenues in the period when the related home sales revenues are recognized. Amounts accrued, which are included in accrued expenses and other liabilities on the Consolidated Balance Sheets, are based upon historical experience rates. We subsequently assess the adequacy of our warranty accrual on a quarterly basis through an internal model that incorporates historical payment trends and adjust the amounts recorded if necessary. Based on favorable warranty payment trends relative to our estimates at the time of home closing, we reduced our warranty reserve by $1.5 million, $1.4 million and $0.6 million during the years ended December 31, 2017, 2016 and 2015, respectively, which is included as a reduction to cost of homes sales revenues on our Consolidated Statements of Operations. Changes in our warranty accrual for the years ended December 31, 2017, 2016, and 2015 are detailed in the table below (in thousands):
|
|
Year Ended December 31, |
||||||||
|
|
2017 |
2016 |
2015 |
||||||
|
Beginning balance |
$ |
2,479 |
$ |
2,622 |
$ |
2,194 | |||
|
Warranty reserve assumed in business combination |
5,327 |
— |
— |
||||||
|
Warranty expense provisions |
4,709 | 2,873 | 2,676 | ||||||
|
Payments |
(2,526) | (1,610) | (1,628) | ||||||
|
Warranty adjustment |
(1,458) | (1,406) | (620) | ||||||
|
Ending balance |
$ |
8,531 |
$ |
2,479 |
$ |
2,622 | |||
F-19
11. Debt
Our outstanding debt obligations included the following as of December 31, 2017 and 2016 (in thousands):
|
|
||||||
|
|
December 31, |
December 31, |
||||
|
|
2017 |
2016 |
||||
|
6.875% senior notes |
$ |
379,238 |
$ |
253,089 | ||
|
5.875% senior notes |
394,725 |
— |
||||
|
Financing obligations |
2,320 | 5,999 | ||||
|
Senior notes payable |
776,283 | 259,088 | ||||
|
Revolving line of credit |
— |
195,000 | ||||
|
Mortgage repurchase facilities |
48,319 |
— |
||||
|
Total debt |
$ |
824,602 |
$ |
454,088 | ||
6.875% senior notes
In May 2014, we completed a private offering of $200.0 million in aggregate principal amount of senior unsecured notes due 2022 (which we refer to as the “Initial Senior Notes”) in reliance on Rule 144A and Regulation S under the Securities Act of 1933, as amended (which we refer to as the “Securities Act”). The Initial Senior Notes were issued under the Indenture, dated as of May 5, 2014, among the Company, our subsidiary guarantors party thereto, and U.S Bank National Association, as trustee (which we refer to as the “May 2014 Indenture,” as it may be supplemented or amended from time to time). The Initial Senior Notes were issued at a price equal to 99.239% of their principal amount, and we received net proceeds of approximately $193.3 million. In February 2015, we completed an offer to exchange $200.0 million in aggregate principal amount of our 6.875% senior notes due 2022, which are registered under the Securities Act (which we refer to as the “Initial Exchange Notes”), for all of the Initial Senior Notes. The terms of the Initial Exchange Notes are identical in all material respects to the Initial Senior Notes, except that the Initial Exchange Notes are registered under the Securities Act and the transfer restrictions, registration rights, and additional interest provisions applicable to the Initial Senior Notes do not apply to the Initial Exchange Notes.
In April 2015, we completed a private offering of an additional $60 million in aggregate principal amount of our 6.875% senior notes due 2022 (which we refer to as the “April 2015 Senior Notes”) in reliance on Rule 144A and Regulation S under the Securities Act. The April 2015 Senior Notes were issued at a price equal to 98.26% of their principal amount, and we received net proceeds of approximately $58.5 million. The April 2015 Senior Notes were additional notes issued under the May 2014 Indenture. In October 2015, we completed an offer to exchange $60.0 million in aggregate principal amount of our 6.875% senior notes due 2022, which are registered under the Securities Act (which we refer to as the “October 2015 Exchange Notes”), for all of the April 2015 Senior Notes. The terms of the October 2015 Exchange Notes are identical in all material respects to the April 2015 Senior Notes, except that the October 2015 Exchange Notes are registered under the Securities Act and the transfer restrictions, registration rights, and additional interest provisions that were applicable to the April 2015 Senior Notes do not apply to the October 2015 Exchange Notes.
In January 2017, we completed a private offering of an additional $125 million in aggregate principal amount of our 6.875% senior notes due 2022 (which we refer to as the “January 2017 Senior Notes”) in reliance on Rule 144A and Regulation S under the Securities Act. The January 2017 Senior Notes were issued at a price equal to 102.00% of their principal amount, and we received net proceeds of approximately $125.4 million. The January 2017 Senior Notes were additional notes issued under the May 2014 Indenture. In April 2017, we completed an offer to exchange $125.0 million in aggregate principal amount of our 6.875% senior notes due 2022, which are registered under the Securities Act (which we refer to as the “April 2017 Exchange Notes”), for all of the January 2017 Senior Notes. The terms of the April 2017 Exchange Notes are identical in all material respects to the January 2017 Senior Notes, except that the April 2017 Exchange Notes are registered under the Securities Act and the transfer restrictions, registration rights, and additional interest provisions that were applicable to the January 2017 Senior Notes do not apply to the April 2017 Exchange Notes.
The Initial Exchange Notes, October 2015 Exchange Notes, and April 2017 Exchange Notes (which we refer to collectively, as the “Existing 6.875% Notes”) will be treated as a single series of notes under the May 2014 Indenture, and will vote as a single class of notes for all matters submitted to a vote of holders under the May 2014 Indenture.
The Existing 6.875% Notes are unsecured senior obligations which are guaranteed on an unsecured senior basis by certain of our current and future subsidiaries. The Existing 6.875% Notes contain certain restrictive covenants on issuing future secured debt and other transactions. The aggregate principal balance of the Existing 6.875% Notes is due May 2022, with interest only payments due semi-annually in May and November of each year.
As of December 31, 2017, the aggregate amount outstanding on the Existing 6.875% Notes was $379.2 million.
F-20
5.875% senior notes
In May 2017, we completed a private offering of $400 million in aggregate principal amount of our 5.875% Senior Notes due 2025 (which we refer to as the “May 2017 Senior Notes”) in reliance on Rule 144A and Regulation S under the Securities Act. The May 2017 Senior Notes were issued under the Indenture, dated as of May 12, 2017, among the Company, our subsidiary guarantors party thereto, and U.S Bank National Association, as trustee (which we refer to as the “May 2017 Indenture,” as it may be supplemented or amended from time to time). The May 2017 Senior Notes were issued at a price equal to 100.00% of their principal amount, and we received net proceeds of approximately $395.5 million. In December 2017, we completed an offer to exchange approximately $400.0 million in aggregate principal amount of our 5.875% senior notes due 2025, which are registered under the Securities Act (which we refer to as the “December 2017 Exchange Notes”), for an equivalent amount of the May 2017 Senior Notes that were tendered and accepted for exchange. The terms of the December 2017 Exchange Notes are identical in all material respects to the May 2017 Senior Notes, except that the December 2017 Exchange Notes are registered under the Securities Act and the transfer restrictions, registration rights, and additional interest provisions that are applicable to the May 2017 Senior Notes do not apply to the December 2017 Exchange Notes.
The May 2017 Senior Notes and December 2017 Exchange Notes (which we refer to collectively, as the “Existing 5.875% Notes”) will be treated as a single series of notes under the May 2017 Indenture, and will vote as a single class of notes for all matters submitted to a vote of holders under the May 2017 Indenture.
The Existing 5.875% Notes are unsecured senior obligations which are guaranteed on an unsecured senior basis by certain of our current and future subsidiaries. The Existing 5.875% Notes contain certain restrictive covenants on issuing future secured debt and other transactions. The aggregate principal balance of the Existing 5.875% Notes is due July 2025, with interest only payments due semi-annually in January and July of each year.
As of December 31, 2017, the aggregate amount outstanding on the May 2017 Senior Notes and December 2017 Exchange Notes was $394.7 million.
Revolving line of credit
On October 21, 2014, we entered into a credit agreement with Texas Capital Bank, National Association, as Administrative Agent and L/C Issuer, and the lenders from time to time party thereto (which we refer to as the “Credit Agreement”). The Credit Agreement provides us with a revolving line of credit of up to $120 million (which we refer to as the “Revolving Credit Facility”).
Under the terms of the Credit Agreement, we are entitled to request an increase in the size of the Revolving Credit Facility by an amount not exceeding $80 million. If the existing lenders elect not to provide the full amount of a requested increase, we may invite one or more other lender(s) to become a party to the Credit Agreement, subject to the approval of the Administrative Agent and L/C Issuer. The Credit Agreement includes a letter of credit sublimit of $20 million. The obligations under the Revolving Credit Facility are guaranteed by certain of our subsidiaries.
On July 31, 2015, we entered into a First Modification Agreement with Texas Capital Bank, National Association, as Administrative Agent, the lenders party thereto, and our subsidiary guarantors party thereto, which modified the Credit Agreement. The First Modification Agreement, among other things, (i) increased the Revolving Credit Facility from $120 million to $200 million, (ii) extended the maturity date of the Revolving Credit Facility from October 21, 2017 to October 21, 2018, (iii) admitted Bank of America, N.A. as a new lender under the Revolving Credit Facility, and (iv) increased the amount of the Company’s option to request, from time to time, an increase in the size of the Revolving Credit Facility, from an amount not exceeding $80 million to an amount not exceeding $100 million, subject to the terms and conditions of the First Modification Agreement and the Credit Agreement.
On December 22, 2015, we entered into a Second Modification Agreement with Texas Capital Bank, National Association, as Administrative Agent, the lenders party thereto, and our subsidiary guarantors party thereto, which modified the Credit Agreement. The Second Modification Agreement, among other things, (i) increased the Revolving Credit Facility from $200 million to $300 million, and (ii) admitted Compass Bank, an Alabama Banking Corporation, and U.S. Bank National Association as new lenders under the Revolving Credit Facility.
On August 19, 2016, we entered into a Third Modification Agreement with Texas Capital Bank, National Association, as Administrative Agent, the lenders party thereto, and our subsidiary guarantors party thereto, which further modified the Credit Agreement. The Third Modification Agreement, among other things, (i) increased the Revolving Credit Facility from $300 million to $380 million through our exercise of $80 million of the accordion feature of the Credit Agreement, (ii) admitted Citibank, N.A. and Flagstar Bank, FSB as new
F-21
lenders under the Revolving Credit Facility, (iii) increased certain lenders’ respective commitments to the Revolving Credit Facility, and (iv) extended the term of the Revolving Credit Facility by one year to mature on October 21, 2019.
On February 24, 2017, we entered into a Commitment Increase Agreement with Texas Capital Bank, National Association, as Administrative Agent, Flagstar Bank, FSB (which we refer to as “Flagstar”), and our subsidiary guarantors party thereto. The Commitment Increase Agreement supplements the Credit Agreement, and (i) increased the Revolving Credit Facility from $380 million to $400 million through our exercise of the remaining $20 million of the accordion feature of the Credit Agreement, and (ii) increased Flagstar’s commitment to the Credit Facility.
Unless terminated earlier, on October 21, 2019, the maturity date of the Revolving Credit Facility, the principal amount thereunder, together with all accrued unpaid interest and other amounts owing thereunder, if any, will be payable in full on such date. Borrowings under the Revolving Credit Facility bear interest at a floating rate equal to the LIBOR plus an applicable margin between 2.75% and 3.25% per annum, or, in the Administrative Agent’s discretion, a base rate plus an applicable margin between 1.75% and 2.25% per annum. The “applicable margins” described above are determined by a schedule based on our leverage ratio, as defined in the Credit Agreement. The Credit Agreement also provides for fronting fees and letter of credit fees payable to the L/C Issuer and commitment fees payable to the Administrative Agent equal to 0.20% of the unused portion of the Revolving Credit Facility.
The Credit Agreement contains customary affirmative and negative covenants (including limitations on our ability to grant liens, incur additional debt, pay dividends, redeem our common stock, make certain investments and engage in certain merger, consolidation or asset sale transactions), as well as customary events of default. The Credit Agreement also requires us to maintain (i) a leverage ratio of not more than 1.50 to 1.0 as of the last day of any fiscal quarter, based upon our and our subsidiaries’ (on a consolidated basis) ratio of debt to tangible net worth, (ii) an interest coverage ratio of not less than 1.50 to 1.0 for any four fiscal quarter period, based upon our and our subsidiaries’ (on a consolidated basis) ratio of EBITDA to cash interest expense, (iii) a consolidated tangible net worth of not less than the sum of $250 million, plus 50% of the net proceeds of any issuances of equity interests by us and the guarantors of the Revolving Credit Facility, plus 50% of the amount of our and our subsidiaries’ consolidated net income, (iv) liquidity of not less than $25 million, and (v) a risk asset ratio of not more than 1.25 to 1.0, based upon the ratio of the book value of all risk assets owned by us and our subsidiaries to the our tangible net worth. As of December 31, 2017, we were in compliance with all covenants under the Credit Agreement.
As of December 31, 2017, we did not have any amounts outstanding under the Credit Agreement.
Mortgage Repurchase Facilities – Financial Services
On April 10, 2017, Inspire Home Loans Inc. (which we refer to as “Inspire”), an indirect wholly-owned subsidiary of the Company, entered into a Master Repurchase Agreement (which we refer to as the “First Master Repurchase Agreement”) with Branch Banking and Trust Company, as the buyer thereunder (which we refer to as the “Buyer”). The First Master Repurchase Agreement provides Inspire with a revolving mortgage loan repurchase facility of up to $25 million (which we refer to as the “First Repurchase Facility”). The primary purpose of the First Repurchase Facility is to provide financing and liquidity to Inspire by facilitating purchase transactions in which Inspire transfers eligible loans to the Buyer, and the Buyer transfers funds, subject to a simultaneous agreement by the Seller to repurchase from the Buyer such eligible loans (i) upon written notice to the Buyer by Inspire, (ii) on a prescribed date in the future, (iii) upon the occurrence of prescribed events, or (iv) on the Termination Date (as defined below). The purchase transactions are based on and subject to the terms and conditions set forth in the First Master Repurchase Agreement. The maximum aggregate amount of the Buyer’s commitment to fund purchase transactions under the First Repurchase Facility is $25 million (which we refer to as the “Commitment”), subject to certain sublimits. The First Repurchase Facility and the Buyer’s Commitment thereunder expires on the earlier of (i) April 9, 2018, and (ii) the date when the Buyer’s Commitment is terminated pursuant to the First Master Repurchase Agreement or by operation of law (which we refer to as the “Termination Date”).
On September 15, 2017, Inspire entered into a second Master Repurchase Facility (which we refer to as the “Second Master Repurchase Agreement”) with J.P. Morgan Chase Bank, N.A. as the buyer thereunder. The Second Master Repurchase Agreement provides Inspire with a revolving mortgage loan repurchase facility of up to $35 million (which we refer to as the “Second Repurchase Facility”). The purpose of the Second Repurchase Facility is similar to the purpose outlined above for the First Repurchase Facility. Amounts outstanding under the First Repurchase Facility and Second Repurchase Facility are not guaranteed by us or any of our subsidiaries. Each of the First Master Repurchase Agreement and Second Master Repurchase Agreement contains various affirmative and negative covenants applicable to Inspire that are customary for arrangements of this type. As of December 31, 2017, we were in compliance with all covenants under each of the First Repurchase Facility and Second Repurchase Facility.
As of December 31 2017, there was an aggregate $48.3 million outstanding under both the First Master Repurchase Agreement and Second Master Repurchase Agreement, and such outstanding amount was collateralized by the mortgage loans held for sale.
F-22
Other Financing Obligations
As of December 31, 2017, we had $2.3 million of outstanding land development notes. During the year ended December 31, 2017, we repaid four outstanding insurance premium notes. As of December 31, 2016, we had $6.0 million of outstanding insurance premium notes.
Aggregate annual maturities of debt as of December 31, 2017 are as follows (in thousands):
|
2018 |
$ |
50,639 | |
|
2019 |
— |
||
|
2020 |
— |
||
|
2021 |
— |
||
|
2022 |
385,000 | ||
|
Thereafter |
400,000 | ||
|
Total |
835,639 | ||
|
Less: Discount and deferred financing costs, net on senior notes |
(11,037) | ||
|
Carrying amount |
$ |
824,602 |
12. Interest
Interest is capitalized to inventories while the related communities are being actively developed and until homes are completed. As our qualifying assets exceeded our outstanding debt during the years ended December 31, 2017, 2016, and 2015, we capitalized all interest costs incurred during these periods, except for interest incurred on capital leases of machinery related to our golf course operations.
Our interest costs are as follows (in thousands):
|
|
|||||||||
|
|
Year Ended December 31, |
||||||||
|
|
2017 |
2016 |
2015 |
||||||
|
Interest capitalized beginning of period |
$ |
28,935 |
$ |
21,533 |
$ |
11,302 | |||
|
Interest capitalized during period |
45,725 | 26,904 | 20,313 | ||||||
|
Less: capitalized interest in cost of sales |
(32,898) | (19,502) | (10,082) | ||||||
|
Interest capitalized end of period |
$ |
41,762 |
$ |
28,935 |
$ |
21,533 | |||
13. Income Taxes
On December 22, 2017, the Tax Cuts and Jobs Act (which we refer to as the “TCJA”) was signed into law. The TCJA significantly reforms the Internal Revenue Code of 1986, as amended. The TCJA, among other things, contains significant changes to corporate taxation, including reduction of the corporate tax rate, commencing in 2018, from a top marginal rate of 35% to a flat rate of 21%, limitation of the tax deduction for interest expense to 30% of adjusted earnings (except for certain small businesses), limitation of the deduction for net operating losses to 80% of current year taxable income, elimination of net operating loss carrybacks, immediate deductions for certain new investments instead of deductions for depreciation expense over time, and modifying or repealing many business deductions and credits.
Also on December 22, 2017 the SEC staff issued Staff Accounting Bulletin No. 118 (SAB 118) which addresses the application of ASC Topic 740 to the TCJA. SAB 118 outlines that if the accounting for the effects of the TCJA is incomplete, but a reasonable estimate can be made, then provisional amount should be reflected in the financial statements.
Our accounting for the impacts of the TCJA related to current and deferred taxes, and in particular our deferred taxes related to our acquisition of UCP and Sundquist Homes, remains incomplete as of the date of these financial statements. Accordingly, we remeasured our deferred tax assets and liabilities based on the rates at which they are expected to reverse in the future, which is generally our estimated blended state and federal statutory rate in future periods of approximately 24%. This remeasurement resulted in a provisional reduction to our deferred tax assets of $2.8 million. This reduction is reflected in “Income tax expense” in our Consolidated Statements of Operations.
F-23
We anticipate that our accounting for the TCJA will be finalized upon the completion of our analysis of our tax basis in UCP and Sundquist Homes, including refining certain calculations associated with UCP’s distributive share of its investment in UCP, LLC at the acquisition date of August 4, 2017 in accordance with I.R.C. §704(c). Additionally, we are still reviewing certain items related to the TCJA and refining our calculations. The resolution of these items could potentially affect the measurement of our provisional reduction to our deferred tax asset.
Our income tax expense for the years ended December 31, 2017, 2016 and 2015 comprises the following current and deferred amounts (in thousands):
|
|
Year Ended December 31, |
||||||||
|
|
2017 |
2016 |
2015 |
||||||
|
Current |
|||||||||
|
Federal |
$ |
29,241 |
$ |
19,417 |
$ |
16,754 | |||
|
State and local |
3,954 | 2,685 | 2,027 | ||||||
|
Total current |
33,195 | 22,102 | 18,781 | ||||||
|
Deferred |
|||||||||
|
Federal |
920 | 1,357 | 1,513 | ||||||
|
State and local |
(246) | 150 | 121 | ||||||
|
Total deferred |
674 | 1,507 | 1,634 | ||||||
|
Income tax expense |
$ |
33,869 |
$ |
23,609 |
$ |
20,415 | |||
Total income tax expense differed from the amounts computed by applying the federal statutory income tax rate of 35% to income before income taxes as a result of the following items (in thousands):
|
|
|||||||||
|
|
|
Year Ended December 31, |
|||||||
|
|
|
2017 |
|
2016 |
|
2015 |
|||
|
Statutory income tax expense |
|
$ |
29,469 |
|
$ |
25,602 |
|
$ |
21,107 |
|
State income tax expense, net of federal income tax expense |
|
|
3,596 |
|
|
1,954 |
|
|
1,690 |
|
Domestic production activities deduction |
|
|
(2,513) |
|
|
(2,146) |
|
|
(1,766) |
|
Provisional re-measurement of deferred tax assets |
|
|
2,790 |
|
|
- |
|
|
- |
|
Federal energy credits |
|
|
- |
|
|
(1,944) |
|
|
- |
|
Other permanent items |
|
|
248 |
|
|
221 |
|
|
37 |
|
Other adjustments |
|
|
279 |
|
|
(78) |
|
|
(653) |
|
Income tax expense |
|
$ |
33,869 |
|
$ |
23,609 |
|
$ |
20,415 |
Deferred income tax assets and liabilities are recognized for the future tax consequences of temporary differences. Temporary differences arise when revenues and expenses for financial reporting are recognized for tax purposes in a different period. ASC 740 requires that a valuation allowance be recorded against deferred tax assets unless it is more likely than not that the deferred tax asset will be utilized. As a result of this analysis, the Company has not recorded a valuation allowance against its deferred tax assets. The Company will continue to evaluate the need to record valuation allowances against deferred tax assets and will make adjustments in accordance with the accounting standard.
F-24
The tax effects of temporary differences that give rise to significant portions of the deferred tax assets and liabilities at December 31, 2017 and 2016 (in thousands):
|
|
|
|
|
|
|
|
|
|
|
As of December 31, |
||||
|
|
|
2017 |
|
2016 |
||
|
Deferred tax assets |
|
|
|
|
|
|
|
Warranty reserves |
|
$ |
1,848 |
|
$ |
928 |
|
Amortizable intangible assets |
|
|
- |
|
|
113 |
|
Stock based compensation |
|
|
1,629 |
|
|
2,105 |
|
Accrued compensation and other |
|
|
574 |
|
|
845 |
|
Inventories, additional costs capitalized for tax |
|
|
7,844 |
|
|
- |
|
Deferred tax asset |
|
|
11,895 |
|
|
3,991 |
|
|
|
|
|
|
|
|
|
Deferred tax liabilities |
|
|
|
|
|
|
|
Prepaid expenses |
|
|
148 |
|
|
191 |
|
Property and equipment |
|
|
4,276 |
|
|
2,023 |
|
Amortizable intangible assets |
|
|
1,280 |
|
|
- |
|
Accrued expenses |
|
|
636 |
|
|
3,057 |
|
Inventories, additional costs capitalized for tax |
|
|
- |
|
|
502 |
|
Deferred tax liability |
|
|
6,340 |
|
|
5,773 |
|
Net deferred tax asset/(liability) |
|
$ |
5,555 |
|
$ |
(1,782) |
The uncertainty provisions of ASC 740 also require the Company to recognize the impact of a tax position in its consolidated financial statements only if the technical merits of that position indicate that the position is more likely than not of being sustained upon audit. During the year, the Company did not record a reserve for uncertain tax positions. We file income tax returns in the U.S. federal jurisdiction and various state jurisdictions. We are subject to U.S. federal income tax examination for calendar tax years ending 2014 through 2017. Additionally, we are subject to various state income tax examinations for the 2013 through 2017 calendar tax years.
14. Fair Value Disclosures
ASC 820, Fair Value Measurement, defines fair value as the price that would be received for selling an asset or paid to transfer a liability in an orderly transaction between market participants at measurement date and requires assets and liabilities carried at fair value to be classified and disclosed in the following three categories:
Level 1 – Quoted prices for identical instruments in active markets.
Level 2 – Quoted prices for similar instruments in active markets; quoted prices for identical or similar instruments in markets that are inactive; and model-derived valuations in which all significant inputs and significant value drivers are observable in active markets at measurement date.
Level 3 – Valuations derived from techniques where one or more significant inputs or significant value drivers are unobservable in active markets at measurement date.
The following table presents carrying values and estimated fair values of financial instruments (in thousands):
|
|
||||||||||||||
|
|
December 31, 2017 |
December 31, 2016 |
||||||||||||
|
|
Hierarchy |
Carrying |
Fair Value |
Carrying |
Fair Value |
|||||||||
|
Secured notes receivable(1) |
Level 2 |
$ |
2,753 |
$ |
2,727 |
$ |
2,850 |
$ |
2,828 | |||||
|
Mortgage loans held for sale(2) |
Level 2 |
$ |
52,327 |
$ |
52,327 |
$ |
— |
$ |
— |
|||||
|
|
||||||||||||||
|
6.875% senior notes(3) |
Level 2 |
$ |
379,238 |
$ |
397,044 |
$ |
253,089 |
$ |
260,090 | |||||
|
5.875 % senior notes (3) |
Level 2 |
$ |
394,725 |
$ |
400,225 |
$ |
— |
$ |
— |
|||||
|
Revolving line of credit(4) |
Level 2 |
$ |
— |
$ |
— |
$ |
195,000 |
$ |
195,000 | |||||
|
Insurance premium notes and other(4) |
Level 2 |
$ |
2,320 |
$ |
2,320 |
$ |
5,999 |
$ |
5,999 | |||||
|
Mortgage repurchase facilities(4) |
Level 2 |
$ |
48,319 |
$ |
48,319 |
$ |
— |
$ |
— |
|||||
F-25
|
(1) |
|
Estimated fair value of the secured notes received was based on cash flow models discounted at market interest rates that considered the underlying risks of the note. |
|
(2) |
|
The mortgage loans held for sale are carried at fair value as of December 31, 2017, which was based on quoted market prices for those committed mortgage loans. |
|
(3) |
|
Estimated fair value of the senior notes incorporated recent trading activity in inactive markets. |
|
(4) |
|
Carrying amount approximates fair value due to short-term nature and interest rate terms. |
The carrying amount of cash and cash equivalents approximates fair value. Nonfinancial assets and liabilities include items such as inventory and property and equipment that are measured at fair value when acquired and resulting from impairment, if deemed necessary.
15. Operating Leases
The Company maintains noncancellable operating leases for office space. The Company recognizes expense on a straight-line basis over the life of each lease. Rent expense for the years ended December 31, 2017, 2016 and 2015 was $2.3 million, $1.4 million and $1.1 million, respectively, included in selling, general, and administrative on our Consolidated Statements of Operations.
Future minimum lease payments as of December 31, 2017 are as follows (in thousands):
|
2018 |
$ |
3,113 | |
|
2019 |
2,314 | ||
|
2020 |
1,956 | ||
|
2021 |
1,418 | ||
|
2022 |
252 | ||
|
Thereafter |
— |
||
|
Total |
$ |
9,053 |
16. Post-Retirement Plan
The Company has a 401(k) plan covering substantially all employees. The Company makes matching contributions of 50% of employees’ salary deferral amounts on the first 6% of employees’ compensation. The Company also has a second 401(k) plan assumed from our acquisition of UCP, in which matching contributions are based on a percentage of employee compensation. Contributions to the plans during the years ended December 31, 2017, 2016 and 2015 were $1.0 million, $0.4 million and $0.2 million, respectively.
17. Stock-Based Compensation
During the year ended December 31, 2017, we granted shares of restricted stock units, which vest over a period of three years from the grant date.
The following table summarizes the activity of our restricted stock units and restricted common stock for the years ended December 31, 2017, 2016 and 2015 (in thousands):
|
|
|
|
|
|
|
|
|
|
|
|
|
|
|
|
|
|
|
|
Year Ended December 31, |
|||||||||||||
|
|
|
2017 |
|
2016 |
|
2015 |
|||||||||
|
|
|
Shares |
|
|
Weighted average per share grant date fair value |
|
Shares |
|
|
Weighted average per share grant date fair value |
|
Shares |
|
|
Weighted average per share grant date fair value |
|
Outstanding, beginning of year |
|
852 |
|
$ |
15.81 |
|
696 |
|
$ |
18.18 |
|
366 |
|
$ |
20.78 |
|
Granted |
|
460 |
|
|
21.64 |
|
514 |
|
|
14.28 |
|
500 |
|
|
16.92 |
|
Vested |
|
(452) |
|
|
17.19 |
|
(297) |
|
|
18.65 |
|
(141) |
|
|
20.62 |
|
Forfeited |
|
(26) |
|
|
19.63 |
|
(61) |
|
|
16.05 |
|
(29) |
|
|
17.42 |
|
Outstanding, end of year |
|
834 |
|
$ |
18.16 |
|
852 |
|
$ |
15.81 |
|
696 |
|
$ |
18.18 |
F-26
A summary of our outstanding awards of restricted common stock and restricted stock units are as follows (in thousands, except years):
|
|
|
|
|
|
|
|
|
|
|
|
|
|
|
As of December 31, 2017 |
||||||
|
|
|
Restricted Stock Awards |
|
Restricted Stock Units |
|
Total |
|||
|
Unvested awards/units |
|
|
138 |
|
|
696 |
|
|
834 |
|
Unrecognized compensation cost |
|
$ |
319 |
|
$ |
7,034 |
|
$ |
7,353 |
|
Period to recognize compensation cost |
|
|
0.2 years |
|
|
1.8 years |
|
|
1.8 years (average) |
During the years ended December 31, 2017, 2016 and 2015, the Company recognized stock-based compensation expense of $9.5 million, $6.7 million and $5.2 million, respectively, which is generally included in selling, general, and administrative on the Consolidated Statements of Operations.
18. Stockholders’ Equity
The Company’s authorized capital stock consists of 100.0 million shares of common stock, par value $0.01 per share, and 50.0 million shares of preferred stock, par value $0.01 per share. As of December 31, 2017 and 2016, there were 29.4 million and 21.3 million shares of common stock issued and outstanding, exclusive of the restricted common stock issued, respectively.
We issued 0.3 million shares of common stock related to the vesting of restricted stock awards during the years ended December 31, 2017 under our First Amended & Restated 2013 Long-Term Incentive Plan. At our 2017 annual meeting of stockholders held on May 10, 2017, our stockholders approved the adoption of the Century Communities, Inc. 2017 Omnibus Incentive Plan (which we refer to as our “2017 Incentive Plan”), which replaced our First Amended & Restated 2013 Long-Term Incentive Plan. We had reserved a total of 1.8 million shares of our common stock for issuance under our First Amended & Restated 2013 Long-Term Incentive Plan, of which approximately 0.6 million shares rolled over into the 2017 Incentive Plan when it became effective. As of December 31, 2017, approximately 1.2 million shares remain available for issuance under the 2017 Incentive Plan. We also issued 4.2 million shares of our common stock in connection with our acquisition of UCP, as discussed in Note 3.
On November 7, 2016, we entered into a Distribution Agreement (which we refer to as the “First Distribution Agreement”) with J.P. Morgan Securities LLC, Merrill Lynch, Pierce, Fenner & Smith Incorporated, and Citigroup Global Markets Inc. (which we refer to collectively as the “Sales Agents”), relating to our common stock. Under the First Distribution Agreement, we were authorized to offer and sell shares of our common stock having an aggregate offering price of up to $50.0 million from time to time through any of our Sales Agents in “at the market” offerings. On August 9, 2017, we entered into a second Distribution Agreement (which we refer to as the “Second Distribution Agreement”) with the Sales Agents, pursuant to which we may offer and sell from time to time up to $100.0 million in “at the market” offerings. During the years ended December 31, 2017 and 2016, we sold and issued an aggregate of 3.7 million and 0.6 million shares of our common stock, respectively, under the First Distribution Agreement and Second Distribution Agreement, which provided net proceeds to us of $98.1 million and $11.4 million, respectively, and in connection with such sales, we paid total commissions and fees to the Sales Agents of $2.0 million and $0.2 million, respectively.
19. Earnings Per Share
We use the two-class method of calculating earnings per share (EPS) as our unvested restricted stock awards have non-forfeitable rights to dividends, and accordingly represent a participating security. The two-class method is an earnings allocation method under which EPS is calculated for each class of common stock and participating security considering both dividends declared (or accumulated) and participation rights in undistributed earnings as if all such earnings had been distributed during the period.
F-27
The following table sets forth the computation of basic and diluted earnings per share for the years ended December 31, 2017, 2016 and 2015 (in thousands, except share and per share information):
|
|
||||||||
|
|
Year Ended December 31, |
|||||||
|
|
2017 |
2016 |
2015 |
|||||
|
Numerator |
||||||||
|
Net income |
$ |
50,295 |
$ |
49,540 |
$ |
39,890 | ||
|
Less: Undistributed earnings allocated to participating securities |
(384) | (1,050) | (1,323) | |||||
|
Net income allocable to common stockholders |
$ |
49,911 |
$ |
48,490 |
$ |
38,567 | ||
|
Denominator |
||||||||
|
Weighted average common shares outstanding - basic |
24,280,871 | 20,679,189 | 20,569,012 | |||||
|
Dilutive effect of restricted stock units |
274,638 | 112,748 |
— |
|||||
|
Weighted average common shares outstanding - diluted |
24,555,509 | 20,791,937 | 20,569,012 | |||||
|
Earnings per share: |
||||||||
|
Basic |
$ |
2.06 |
$ |
2.34 |
$ |
1.88 | ||
|
Diluted |
$ |
2.03 |
$ |
2.33 |
$ |
1.88 | ||
We do not have any common unit equivalents to exclude from diluted earnings per share during the years ended December 31, 2017, 2016 and 2015.
20. Related-Party Transactions
Prior to our May 2013 private placement, the Company transacted with entities that were controlled by the same individuals who control the Company and are Co-CEOs of the Company. Transactions between entities under common control for land inventory are recorded at the carrying basis of the related party.
During the years ended December 31, 2017, 2016 and 2015, we delivered homes for which the land was originally purchased from entities under common control. Recording the lots at the carrying basis of the entities under common control as opposed to the purchase price benefitted gross margins by $0.8 million, $2.9 million, and $1.8 million for the years ended December 31, 2017, 2016 and 2015, respectively. As of December 31, 2017, we have no land which was originally purchased from entities under common control.
21. Commitments and Contingencies
Letters of Credit and Performance Bonds
In the normal course of business, the Company posts letters of credit and performance bonds related to our land development performance obligations, with local municipalities. As of December 31, 2017 and 2016, we had $78.3 million and $70.1 million, respectively, in letters of credit and performance bonds issued and outstanding.
Litigation
The Company is subject to claims and lawsuits that arise primarily in the ordinary course of business, which consist primarily of construction defect claims. It is the opinion of management that if the claims have merit, parties other than the Company would be, at least in part, liable for the claims, and eventual outcome of these claims will not have a material adverse effect upon our consolidated financial condition, results of operations, or cash flows. When we believe that a loss is probable and estimable, we record a charge to selling, general, and administrative on our Consolidated Statements of Operations for our estimated loss.
We do not believe that the ultimate resolution of any claims and lawsuits will have a material adverse effect upon our consolidated financial position, results of operations, or cash flow.
F-28
22. Results of Quarterly Operations (Unaudited)
|
|
Quarter |
|||||||||||
|
|
First |
Second |
Third |
Fourth |
||||||||
|
|
(in thousands, except per share amounts) |
|||||||||||
|
2017 |
||||||||||||
|
Home sales revenues |
$ |
226,420 |
$ |
287,588 |
$ |
374,935 |
$ |
516,500 | ||||
|
Gross margin from home sales revenues |
$ |
44,096 |
$ |
53,700 |
$ |
63,570 |
$ |
90,718 | ||||
|
Income before tax expense |
$ |
12,051 |
$ |
23,109 |
$ |
15,156 |
$ |
33,848 | ||||
|
Net income |
$ |
8,799 |
$ |
14,831 |
$ |
9,470 |
$ |
17,195 | ||||
|
Basic earnings per share |
$ |
0.40 |
$ |
0.67 |
$ |
0.37 |
$ |
0.61 | ||||
|
Diluted earnings per share |
$ |
0.40 |
$ |
0.66 |
$ |
0.37 |
$ |
0.60 | ||||
|
|
||||||||||||
|
2016 |
||||||||||||
|
Home sales revenues |
$ |
181,081 |
$ |
257,179 |
$ |
248,075 |
$ |
292,398 | ||||
|
Gross margin from home sales revenues |
$ |
36,728 |
$ |
49,296 |
$ |
50,425 |
$ |
56,157 | ||||
|
Income before tax expense |
$ |
12,429 |
$ |
19,097 |
$ |
19,731 |
$ |
21,892 | ||||
|
Net income |
$ |
7,983 |
$ |
13,142 |
$ |
13,342 |
$ |
15,073 | ||||
|
Basic and diluted earnings per share |
$ |
0.38 |
$ |
0.62 |
$ |
0.63 |
$ |
0.71 | ||||
23. Supplemental Guarantor Information
The Existing 6.875% Notes and the Existing 5.875% Notes are our unsecured senior obligations, and are fully and unconditionally guaranteed on an unsecured basis, jointly and severally, by substantially all of our direct and indirect wholly-owned operating subsidiaries (which we refer to as “Guarantors”).
Each of the May 2014 Indenture governing the Existing 6.875% Notes, and the May 2017 Indenture governing the Existing 5.875% Notes, provides that the guarantees of a Guarantor will be automatically and unconditionally released and discharged: (1) upon any sale, transfer, exchange or other disposition (by merger, consolidation or otherwise) of all of the equity interests of such Guarantor after which the applicable Guarantor is no longer a “Restricted Subsidiary” (as defined in the applicable Indenture), which sale, transfer, exchange or other disposition does not constitute an “Asset Sale” (as defined in the applicable Indenture) or is made in compliance with applicable provisions of the applicable Indenture; (2) upon any sale, transfer, exchange or other disposition (by merger, consolidation or otherwise) of all of the assets of such Guarantor, which sale, transfer, exchange or other disposition does not constitute an Asset Sale or is made in compliance with applicable provisions of the applicable Indenture; provided, that after such sale, transfer, exchange or other disposition, such Guarantor is an “Immaterial Subsidiary” (as defined in the applicable Indenture); (3) unless a default has occurred and is continuing, upon the release or discharge of such Guarantor from its guarantee of any indebtedness for borrowed money of the Company and the Guarantors so long as such Guarantor would not then otherwise be required to provide a guarantee pursuant to the applicable Indenture; provided that if such Guarantor has incurred any indebtedness in reliance on its status as a Guarantor in compliance with applicable provisions of the applicable Indenture, such Guarantor’s obligations under such indebtedness, as the case may be, so incurred are satisfied in full and discharged or are otherwise permitted to be incurred by a Restricted Subsidiary (other than a Guarantor) in compliance with applicable provisions of the applicable Indenture; (4) upon the designation of such Guarantor as an “Unrestricted Subsidiary” (as defined in the applicable Indenture), in accordance with the applicable Indenture; (5) if the Company exercises its legal defeasance option or covenant defeasance option under the applicable Indenture or if the obligations of the Company and the Guarantors are discharged in compliance with applicable provisions of the applicable Indenture, upon such exercise or discharge; or (6) in connection with the dissolution of such Guarantor under applicable law in accordance with the applicable Indenture.
As the guarantees were made in connection with the February 2015 exchange offer for the Initial Exchange Notes, the October 2015 exchange offer for the October 2015 Exchange Notes, the April 2017 exchange offer for the April 2017 Exchange Notes, and the December exchange offer for the December 2017 Exchange Notes, the Guarantors’ condensed financial information is presented as if the guarantees existed during the periods presented. If any Guarantors are released from the guarantees in future periods, the changes are reflected prospectively.
F-29
We have determined that separate, full financial statements of the Guarantors would not be material to investors and, accordingly, supplemental financial information is presented below:
|
|
|
|
|
|
|
|
|
|
|
|
|
|
|
|
|
|
|
|
Supplemental Condensed Consolidated Balance Sheet |
|||||||||||||
|
|
|
As of December 31, 2017 (in thousands) |
|||||||||||||
|
|
|
|
|
|
Guarantor |
|
Non Guarantor |
|
Elimination |
|
Consolidated |
||||
|
|
|
CCS |
|
Subsidiaries |
|
Subsidiaries |
|
Entries |
|
CCS |
|||||
|
Assets |
|
|
|
|
|
|
|
|
|
|
|
|
|
|
|
|
Cash and cash equivalents |
|
$ |
56,234 |
|
$ |
23,399 |
|
$ |
9,199 |
|
$ |
— |
|
$ |
88,832 |
|
Cash held in escrow |
|
|
— |
|
|
37,088 |
|
|
635 |
|
|
— |
|
|
37,723 |
|
Accounts receivable |
|
|
3,124 |
|
|
9,944 |
|
|
(69) |
|
|
— |
|
|
12,999 |
|
Investment in consolidated subsidiaries |
|
|
1,434,619 |
|
|
— |
|
|
— |
|
|
(1,434,619) |
|
|
— |
|
Inventories |
|
|
— |
|
|
1,390,354 |
|
|
— |
|
|
— |
|
|
1,390,354 |
|
Mortgage loans held for sale |
|
|
— |
|
|
— |
|
|
52,327 |
|
|
— |
|
|
52,327 |
|
Prepaid expenses and other assets |
|
|
3,028 |
|
|
57,273 |
|
|
511 |
|
|
— |
|
|
60,812 |
|
Deferred tax assets, net |
|
|
5,555 |
|
|
— |
|
|
— |
|
|
— |
|
|
5,555 |
|
Property and equipment, net |
|
|
11,694 |
|
|
15,683 |
|
|
534 |
|
|
— |
|
|
27,911 |
|
Investment in unconsolidated subsidiaries |
|
|
28,208 |
|
|
— |
|
|
— |
|
|
|
|
|
28,208 |
|
Amortizable intangible assets, net |
|
|
— |
|
|
2,938 |
|
|
— |
|
|
— |
|
|
2,938 |
|
Goodwill |
|
|
— |
|
|
27,363 |
|
|
— |
|
|
— |
|
|
27,363 |
|
Total assets |
|
$ |
1,542,462 |
|
$ |
1,564,042 |
|
$ |
63,137 |
|
$ |
(1,434,619) |
|
$ |
1,735,022 |
|
Liabilities and stockholders’ equity |
|
|
|
|
|
|
|
|
|
|
|
|
|
|
|
|
Liabilities: |
|
|
|
|
|
|
|
|
|
|
|
|
|
|
|
|
Accounts payable |
|
$ |
1,452 |
|
$ |
23,057 |
|
$ |
322 |
|
$ |
— |
|
$ |
24,831 |
|
Accrued expenses and other liabilities |
|
|
31,814 |
|
|
117,070 |
|
|
1,472 |
|
|
— |
|
|
150,356 |
|
Notes payable |
|
|
773,963 |
|
|
2,320 |
|
|
— |
|
|
— |
|
|
776,283 |
|
Revolving line of credit |
|
|
— |
|
|
— |
|
|
— |
|
|
— |
|
|
— |
|
Mortgage repurchase facilities |
|
|
— |
|
|
— |
|
|
48,319 |
|
|
— |
|
|
48,319 |
|
Total liabilities |
|
|
807,229 |
|
|
142,447 |
|
|
50,113 |
|
|
— |
|
|
999,789 |
|
Stockholders’ equity: |
|
|
735,233 |
|
|
1,421,595 |
|
|
13,024 |
|
|
(1,434,619) |
|
|
735,233 |
|
Total liabilities and stockholders’ equity |
|
$ |
1,542,462 |
|
$ |
1,564,042 |
|
$ |
63,137 |
|
$ |
(1,434,619) |
|
$ |
1,735,022 |
F-30
|
|
|
|
|
|
|
|
|
|
|
|
|
|
|
|
|
|
|
|
Supplemental Condensed Consolidated Balance Sheet |
|||||||||||||
|
|
|
As of December 31, 2016 (in thousands) |
|||||||||||||
|
|
|
|
|
|
|
|
|
|
|
|
|
|
|
|
|
|
|
|
|
|
|
Guarantor |
|
Non Guarantor |
|
Elimination |
|
Consolidated |
||||
|
|
|
CCS |
|
Subsidiaries |
|
Subsidiaries |
|
Entries |
|
CCS |
|||||
|
Assets |
|
|
|
|
|
|
|
|
|
|
|
|
|
|
|
|
Cash and cash equivalents |
|
$ |
14,637 |
|
$ |
8,646 |
|
$ |
6,167 |
|
$ |
— |
|
$ |
29,450 |
|
Cash held in escrow |
|
|
— |
|
|
20,044 |
|
|
— |
|
|
— |
|
|
20,044 |
|
Accounts receivable |
|
|
2,980 |
|
|
2,676 |
|
|
— |
|
|
— |
|
|
5,656 |
|
Investment in subsidiaries |
|
|
895,990 |
|
|
— |
|
|
— |
|
|
(895,990) |
|
|
— |
|
Inventories |
|
|
— |
|
|
857,885 |
|
|
— |
|
|
— |
|
|
857,885 |
|
Prepaid expenses and other assets |
|
|
3,303 |
|
|
31,244 |
|
|
167 |
|
|
— |
|
|
34,714 |
|
Property and equipment, net |
|
|
1,166 |
|
|
14,747 |
|
|
22 |
|
|
— |
|
|
15,935 |
|
Investment in unconsolidated subsidiaries |
|
|
18,275 |
|
|
— |
|
|
— |
|
|
— |
|
|
18,275 |
|
Amortizable intangible assets, net |
|
|
— |
|
|
4,204 |
|
|
— |
|
|
— |
|
|
4,204 |
|
Goodwill |
|
|
— |
|
|
21,365 |
|
|
— |
|
|
— |
|
|
21,365 |
|
Total assets |
|
$ |
936,351 |
|
$ |
960,811 |
|
$ |
6,356 |
|
$ |
(895,990) |
|
$ |
1,007,528 |
|
Liabilities and stockholders’ equity |
|
|
|
|
|
|
|
|
|
|
|
|
|
|
|
|
Liabilities: |
|
|
|
|
|
|
|
|
|
|
|
|
|
|
|
|
Accounts payable |
|
$ |
257 |
|
$ |
15,593 |
|
$ |
(124) |
|
$ |
— |
|
$ |
15,726 |
|
Accrued expenses and other liabilities |
|
|
12,587 |
|
|
49,679 |
|
|
30 |
|
|
— |
|
|
62,296 |
|
Deferred tax liabilities, net |
|
|
1,782 |
|
|
— |
|
|
— |
|
|
— |
|
|
1,782 |
|
Senior notes payable |
|
|
253,089 |
|
|
5,999 |
|
|
— |
|
|
— |
|
|
259,088 |
|
Revolving line of credit |
|
|
195,000 |
|
|
— |
|
|
— |
|
|
— |
|
|
195,000 |
|
Total liabilities |
|
|
462,715 |
|
|
71,271 |
|
|
(94) |
|
|
— |
|
|
533,892 |
|
Stockholders’ equity: |
|
|
473,636 |
|
|
889,540 |
|
|
6,450 |
|
|
(895,990) |
|
|
473,636 |
|
Total liabilities and stockholders’ equity |
|
$ |
936,351 |
|
$ |
960,811 |
|
$ |
6,356 |
|
$ |
(895,990) |
|
$ |
1,007,528 |
|
|
|
|
|
|
|
|
|
|
|
|
|
|
|
|
|
|
|
|
Supplemental Condensed Consolidated Statement of Operations |
|||||||||||||
|
|
For the Year Ended December 31, 2017 (in thousands) |
||||||||||||||
|
|
|
|
|
|
Guarantor |
|
Non Guarantor |
|
Elimination |
|
Consolidated |
||||
|
|
|
CCS |
|
Subsidiaries |
|
Subsidiaries |
|
Entries |
|
CCS |
|||||
|
Revenues |
|
|
|
|
|
|
|
|
|
|
|
|
|
|
|
|
Homebuilding revenues |
|
|
|
|
|
|
|
|
|
|
|
|
|
|
|
|
Home sales revenues |
|
$ |
— |
|
$ |
1,405,443 |
|
$ |
— |
|
$ |
— |
|
$ |
1,405,443 |
|
Land sales and other revenues |
|
|
— |
|
|
8,503 |
|
|
— |
|
|
— |
|
|
8,503 |
|
|
|
|
— |
|
|
1,413,946 |
|
|
— |
|
|
— |
|
|
1,413,946 |
|
Financial services revenue |
|
|
— |
|
|
— |
|
|
9,853 |
|
|
— |
|
|
9,853 |
|
Total revenues |
|
|
— |
|
|
1,413,946 |
|
|
9,853 |
|
|
— |
|
|
1,423,799 |
|
Homebuilding cost of revenues |
|
|
|
|
|
|
|
|
|
|
|
|
|
|
|
|
Cost of homes sales revenues |
|
|
— |
|
|
(1,153,359) |
|
|
— |
|
|
— |
|
|
(1,153,359) |
|
Cost of land sales and other revenues |
|
|
— |
|
|
(6,516) |
|
|
— |
|
|
— |
|
|
(6,516) |
|
|
|
|
— |
|
|
(1,159,875) |
|
|
— |
|
|
— |
|
|
(1,159,875) |
|
Financial services costs |
|
|
— |
|
|
— |
|
|
(8,664) |
|
|
— |
|
|
(8,664) |
|
Selling, general and administrative |
|
|
(48,386) |
|
|
(127,918) |
|
|
— |
|
|
— |
|
|
(176,304) |
|
Acquisition expense |
|
|
(9,905) |
|
|
— |
|
|
— |
|
|
— |
|
|
(9,905) |
|
Equity in earnings from consolidated subsidiaries |
|
|
83,979 |
|
|
— |
|
|
— |
|
|
(83,979) |
|
|
— |
|
Equity in income of unconsolidated subsidiaries |
|
|
12,176 |
|
|
— |
|
|
— |
|
|
— |
|
|
12,176 |
|
Other income (expense) |
|
|
1,080 |
|
|
1,820 |
|
|
37 |
|
|
— |
|
|
2,937 |
|
Income before income tax expense |
|
|
38,944 |
|
|
127,973 |
|
|
1,226 |
|
|
(83,979) |
|
|
84,164 |
|
Income tax expense |
|
|
11,351 |
|
|
(44,791) |
|
|
(429) |
|
|
— |
|
|
(33,869) |
|
Net income |
|
$ |
50,295 |
|
$ |
83,182 |
|
$ |
797 |
|
$ |
(83,979) |
|
$ |
50,295 |
F-31
|
|
Supplemental Condensed Consolidated Statement of Operations |
||||||||||||||
|
|
For the Year Ended December 31, 2016 (in thousands) |
||||||||||||||
|
|
|||||||||||||||
|
|
Guarantor |
Non Guarantor |
Elimination |
Consolidated |
|||||||||||
|
|
CCS |
Subsidiaries |
Subsidiaries |
Entries |
CCS |
||||||||||
|
Revenues |
|||||||||||||||
|
Homebuilding revenues |
|||||||||||||||
|
Home sales revenues |
$ |
— |
$ |
978,733 |
$ |
— |
$ |
— |
$ |
978,733 | |||||
|
Land sales and other revenues |
— |
15,707 |
— |
— |
15,707 | ||||||||||
|
|
— |
994,440 |
— |
— |
994,440 | ||||||||||
|
Financial services revenue |
— |
— |
— |
— |
— |
||||||||||
|
Total revenues |
— |
994,440 |
— |
— |
994,440 | ||||||||||
|
Homebuilding cost of revenues |
|||||||||||||||
|
Cost of homes sales revenues |
— |
(786,127) |
— |
— |
(786,127) | ||||||||||
|
Cost of land sales and other revenues |
— |
(14,217) |
— |
— |
(14,217) | ||||||||||
|
|
— |
(800,344) |
— |
— |
(800,344) | ||||||||||
|
Financial services costs |
— |
— |
— |
— |
— |
||||||||||
|
Selling, general and administrative |
(25,674) | (96,235) | (315) |
— |
(122,224) | ||||||||||
|
Acquisition expense |
(490) |
— |
— |
— |
(490) | ||||||||||
|
Equity in earnings from consolidated subsidiaries |
64,297 |
— |
— |
(64,297) |
— |
||||||||||
|
Equity in income of unconsolidated subsidiaries |
191 |
— |
— |
— |
191 | ||||||||||
|
Other income (expense) |
34 | 1,542 |
— |
— |
1,576 | ||||||||||
|
Income before income tax expense |
38,358 | 99,403 | (315) | (64,297) | 73,149 | ||||||||||
|
Income tax expense |
11,182 | (34,791) |
— |
— |
(23,609) | ||||||||||
|
Net income |
$ |
49,540 |
$ |
64,612 |
$ |
(315) |
$ |
(64,297) |
$ |
49,540 | |||||
F-32
|
|
Supplemental Condensed Consolidated Statement of Operations |
||||||||||||||
|
|
For the Year Ended December 31, 2015 (in thousands) |
||||||||||||||
|
|
|||||||||||||||
|
|
Guarantor |
Non Guarantor |
Elimination |
Consolidated |
|||||||||||
|
|
CCS |
Subsidiaries |
Subsidiaries |
Entries |
CCS |
||||||||||
|
Revenues |
|||||||||||||||
|
Homebuilding revenues |
|||||||||||||||
|
Home sales revenues |
$ |
— |
$ |
725,437 |
$ |
— |
$ |
— |
$ |
725,437 | |||||
|
Land sales and other revenues |
— |
9,052 |
— |
— |
9,052 | ||||||||||
|
|
— |
734,489 |
— |
— |
734,489 | ||||||||||
|
Financial services revenue |
— |
— |
— |
— |
— |
||||||||||
|
Total revenues |
— |
734,489 |
— |
— |
734,489 | ||||||||||
|
Homebuilding cost of revenues |
|||||||||||||||
|
Cost of homes sales revenues |
— |
(579,203) |
— |
— |
(579,203) | ||||||||||
|
Cost of land sales and other revenues |
— |
(8,432) |
— |
— |
(8,432) | ||||||||||
|
|
— |
(587,635) |
— |
— |
(587,635) | ||||||||||
|
Financial services costs |
— |
— |
— |
— |
— |
||||||||||
|
Selling, general and administrative |
(18,013) | (69,827) |
— |
— |
(87,840) | ||||||||||
|
Acquisition expense |
(491) |
— |
— |
— |
(491) | ||||||||||
|
Equity in earnings from consolidated subsidiaries |
51,197 |
— |
— |
(51,197) |
— |
||||||||||
|
Other income (expense) |
44 | 1,738 |
— |
— |
1,782 | ||||||||||
|
Income before income tax expense |
32,737 | 78,765 |
— |
(51,197) | 60,305 | ||||||||||
|
Income tax expense |
7,153 | (27,568) |
— |
— |
(20,415) | ||||||||||
|
Net income |
$ |
39,890 |
$ |
51,197 |
$ |
— |
$ |
(51,197) |
$ |
39,890 | |||||
F-33
|
|
|
|
|
|
|
|
|
|
|
|
|
|
|
|
|
|
|
|
|
|
|
|
|
|
|
|
|
|
|
|
|
|
|
|
|
Supplemental Condensed Consolidated Statement of Cash Flows |
|||||||||||||
|
|
|
For the Year Ended December 31, 2017 (in thousands) |
|||||||||||||
|
|
|
|
|
|
Guarantor |
|
Non Guarantor |
|
Elimination |
|
Consolidated |
||||
|
|
|
CCS |
|
Subsidiaries |
|
Subsidiaries |
|
Entries |
|
CCS |
|||||
|
Net cash provided by/(used in) operating activities |
|
$ |
(27,787) |
|
$ |
(36,309) |
|
$ |
(50,552) |
|
$ |
— |
|
$ |
(114,648) |
|
Net cash used in investing activities |
|
$ |
(456,299) |
|
$ |
(118,583) |
|
$ |
(513) |
|
$ |
440,949 |
|
$ |
(134,446) |
|
Financing activities |
|
|
|
|
|
|
|
|
|
|
|
|
|
|
|
|
Borrowings under revolving credit facilities |
|
$ |
175,000 |
|
$ |
— |
|
$ |
— |
|
$ |
— |
|
$ |
175,000 |
|
Payments on revolving credit facilities |
|
|
(370,000) |
|
|
— |
|
|
— |
|
|
— |
|
|
(370,000) |
|
Proceeds from issuance of senior notes |
|
|
527,500 |
|
|
— |
|
|
— |
|
|
— |
|
|
527,500 |
|
Proceeds from insurance premium notes and other |
|
|
— |
|
|
2,320 |
|
|
— |
|
|
— |
|
|
2,320 |
|
Repayment of debt assumed in business combination |
|
|
— |
|
|
(151,919) |
|
|
— |
|
|
— |
|
|
(151,919) |
|
Principal payments on notes payable |
|
|
— |
|
|
(6,998) |
|
|
— |
|
|
— |
|
|
(6,998) |
|
Debt issuance costs |
|
|
(8,579) |
|
|
— |
|
|
— |
|
|
— |
|
|
(8,579) |
|
Repurchases of common stock upon vesting of restricted stock awards |
|
|
(5,231) |
|
|
— |
|
|
— |
|
|
— |
|
|
(5,231) |
|
Payments from (and advances to) parent/subsidiary |
|
|
108,930 |
|
|
326,242 |
|
|
5,777 |
|
|
(440,949) |
|
|
— |
|
Net proceeds from mortgage repurchase facilities |
|
|
— |
|
|
— |
|
|
48,320 |
|
|
— |
|
|
48,320 |
|
Net proceeds from issuances of common stock |
|
|
98,063 |
|
|
— |
|
|
— |
|
|
— |
|
|
98,063 |
|
Net cash provided by financing activities |
|
$ |
525,683 |
|
$ |
169,645 |
|
$ |
54,097 |
|
$ |
(440,949) |
|
$ |
308,476 |
|
Net decrease in cash and cash equivalents |
|
$ |
41,597 |
|
$ |
14,753 |
|
$ |
3,032 |
|
$ |
— |
|
$ |
59,382 |
|
Cash and cash equivalents |
|
|
|
|
|
|
|
|
|
|
|
|
|
|
|
|
Beginning of period |
|
$ |
14,637 |
|
$ |
8,646 |
|
$ |
6,167 |
|
$ |
— |
|
$ |
29,450 |
|
End of period |
|
$ |
56,234 |
|
$ |
23,399 |
|
$ |
9,199 |
|
$ |
— |
|
$ |
88,832 |
|
|
|
|
|
|
|
|
|
|
|
|
|
|
|
|
|
|
|
|
Supplemental Condensed Consolidated Statement of Cash Flows |
|||||||||||||
|
|
|
For the Year Ended December 31, 2016 (in thousands) |
|||||||||||||
|
|
|
|
|
|
Guarantor |
|
Non Guarantor |
|
Elimination |
|
Consolidated |
||||
|
|
|
CCS |
|
Subsidiaries |
|
Subsidiaries |
|
Entries |
|
CCS |
|||||
|
Net cash provided by/(used in) operating activities |
|
$ |
(16,138) |
|
$ |
(29,123) |
|
$ |
(575) |
|
$ |
— |
|
$ |
(45,836) |
|
Net cash used in investing activities |
|
$ |
(58,032) |
|
$ |
(5,585) |
|
$ |
(23) |
|
$ |
40,439 |
|
$ |
(23,201) |
|
Financing activities |
|
|
|
|
|
|
|
|
|
|
|
|
|
|
|
|
Borrowings under revolving credit facilities |
|
$ |
220,000 |
|
$ |
— |
|
$ |
— |
|
$ |
— |
|
$ |
220,000 |
|
Payments on revolving credit facilities |
|
|
(160,000) |
|
|
— |
|
|
— |
|
|
— |
|
|
(160,000) |
|
Proceeds from issuance of senior notes |
|
|
— |
|
|
— |
|
|
— |
|
|
— |
|
|
— |
|
Proceeds from insurance premium notes and other |
|
|
— |
|
|
11,612 |
|
|
— |
|
|
— |
|
|
11,612 |
|
Repurchases of common stock under our stock repurchase program |
|
|
(2,393) |
|
|
— |
|
|
— |
|
|
— |
|
|
(2,393) |
|
Principal payments on notes payable |
|
|
— |
|
|
(9,217) |
|
|
— |
|
|
— |
|
|
(9,217) |
|
Debt issuance costs |
|
|
(1,156) |
|
|
— |
|
|
— |
|
|
— |
|
|
(1,156) |
|
Repurchases of common stock upon vesting of restricted stock awards |
|
|
(1,015) |
|
|
— |
|
|
— |
|
|
— |
|
|
(1,015) |
|
Payments from (and advances to) parent/subsidiary |
|
|
— |
|
|
33,674 |
|
|
6,765 |
|
|
(40,439) |
|
|
— |
|
Net proceeds from mortgage repurchase facilities |
|
|
— |
|
|
— |
|
|
— |
|
|
— |
|
|
— |
|
Net proceeds from issuances of common stock |
|
|
11,369 |
|
|
— |
|
|
— |
|
|
— |
|
|
11,369 |
|
Net cash provided by financing activities |
|
$ |
66,805 |
|
$ |
36,069 |
|
$ |
6,765 |
|
$ |
(40,439) |
|
$ |
69,200 |
|
Net decrease in cash and cash equivalents |
|
$ |
(7,365) |
|
$ |
1,361 |
|
$ |
6,167 |
|
$ |
— |
|
$ |
163 |
|
Cash and cash equivalents |
|
|
|
|
|
|
|
|
|
|
|
|
|
|
|
|
Beginning of period |
|
$ |
22,002 |
|
$ |
7,285 |
|
$ |
— |
|
$ |
— |
|
$ |
29,287 |
|
End of period |
|
$ |
14,637 |
|
$ |
8,646 |
|
$ |
6,167 |
|
$ |
— |
|
$ |
29,450 |
F-34
|
|
Supplemental Condensed Consolidated Statement of Cash Flows |
||||||||||||||
|
|
For the Year Ended December 31, 2015 (in thousands) |
||||||||||||||
|
|
Guarantor |
Non Guarantor |
Elimination |
Consolidated |
|||||||||||
|
|
CCS |
Subsidiaries |
Subsidiaries |
Entries |
CCS |
||||||||||
|
Net cash used in operating activities |
$ |
(3,742) |
$ |
(158,992) |
$ |
— |
$ |
— |
$ |
(162,734) | |||||
|
Net cash used in investing activities |
(167,244) | (3,839) |
— |
166,851 | (4,232) | ||||||||||
|
Financing activities |
|||||||||||||||
|
Borrowings under revolving credit facilities |
180,000 |
— |
— |
— |
180,000 | ||||||||||
|
Payments on revolving credit facilities |
(65,000) |
— |
— |
— |
(65,000) | ||||||||||
|
Proceeds from issuance of senior notes |
58,956 |
— |
— |
— |
58,956 | ||||||||||
|
Proceeds from issuance of notes payable |
— |
1,169 |
— |
— |
1,169 | ||||||||||
|
Principal payments on notes payable |
— |
(8,656) |
— |
— |
(8,656) | ||||||||||
|
Debt issuance costs |
(2,817) |
— |
— |
— |
(2,817) | ||||||||||
|
Repurchases of common stock upon vesting of restricted stock awards |
(861) |
— |
— |
— |
(861) | ||||||||||
|
Payments from (and advances to) parent/subsidiary |
— |
166,851 |
— |
(166,851) |
— |
||||||||||
|
Net cash provided by financing activities |
170,278 | 159,364 |
— |
(166,851) | 162,791 | ||||||||||
|
Net decrease in cash and cash equivalents |
(708) | (3,467) |
— |
— |
(4,175) | ||||||||||
|
Cash and cash equivalents |
|||||||||||||||
|
Beginning of period |
22,710 | 10,752 |
— |
— |
33,462 | ||||||||||
|
End of period |
$ |
22,002 |
$ |
7,285 |
$ |
— |
$ |
— |
$ |
29,287 | |||||
F-35