Attached files
| file | filename |
|---|---|
| EX-32.2 - EX-32.2 - UNIVERSAL HEALTH REALTY INCOME TRUST | uht-ex322_12.htm |
| EX-32.1 - EX-32.1 - UNIVERSAL HEALTH REALTY INCOME TRUST | uht-ex321_6.htm |
| EX-31.2 - EX-31.2 - UNIVERSAL HEALTH REALTY INCOME TRUST | uht-ex312_7.htm |
| EX-31.1 - EX-31.1 - UNIVERSAL HEALTH REALTY INCOME TRUST | uht-ex311_8.htm |
| EX-23.1 - EX-23.1 - UNIVERSAL HEALTH REALTY INCOME TRUST | uht-ex231_11.htm |
| EX-21 - EX-21 - UNIVERSAL HEALTH REALTY INCOME TRUST | uht-ex21_795.htm |
| EX-10.2 - EX-10.2 - UNIVERSAL HEALTH REALTY INCOME TRUST | uht-ex102_16.htm |
UNITED STATES
SECURITIES AND EXCHANGE COMMISSION
Washington, D.C. 20549
FORM 10-K
☒ ANNUAL REPORT PURSUANT TO SECTION 13 OR 15(d) OF THE
SECURITIES EXCHANGE ACT OF 1934
For the fiscal year ended December 31, 2017
OR
☐ TRANSITION REPORT PURSUANT TO SECTION 13 OR 15(d) OF THE
SECURITIES EXCHANGE ACT OF 1934
For the transition period from to
Commission File No. 1-9321
UNIVERSAL HEALTH REALTY INCOME TRUST
(Exact name of registrant as specified in its charter)
|
Maryland |
23-6858580 |
|
(State or other jurisdiction of incorporation or organization) |
(I.R.S. Employer Identification Number) |
|
|
|
|
Universal Corporate Center 367 South Gulph Road P.O. Box 61558 King of Prussia, Pennsylvania |
19406-0958 (Zip Code) |
|
(Address of principal executive offices) |
|
Registrant’s telephone number, including area code: (610) 265-0688
Securities registered pursuant to Section 12(b) of the Act:
|
Title of each Class Shares of beneficial interest, $.01 par value |
Name of each exchange on which registered New York Stock Exchange |
Securities registered pursuant to Section 12(g) of the Act: None
Indicate by check mark if the registrant is a well-known seasoned issuer, as defined in Rule 405 of the Securities Act.
Yes ☒ No ☐
Indicate by check mark if the registrant is not required to file reports pursuant to Section 13 or Section 15(d) of the Act.
Yes ☐ No ☒
Indicate by check mark whether the registrant (1) has filed all reports required to be filed by Section 13 or 15(d) of the Securities Exchange Act of 1934 during the preceding 12 months (or for such shorter period that the registrant was required to file such reports), and (2) has been subject to such filing requirements for the past 90 days.
Yes ☒ No ☐
Indicate by check mark whether the registrant has submitted electronically and posted on its corporate Web site, if any, every Interactive Data File required to be submitted and posted pursuant to Rule 405 of Regulation S-T during the preceding 12 months (or for such shorter period that the registrant was required to submit and post such files).
Yes ☒ No ☐
Indicate by check mark if disclosure of delinquent filers pursuant to Item 405 of Regulation S-K is not contained herein, and will not be contained, to the best of registrant’s knowledge, in definitive proxy or information statements incorporated by reference in Part III of this Form 10-K or any amendment to this Form 10-K. ☒
Indicate by check mark whether the registrant is a large accelerated filer, an accelerated filer, a non-accelerated filer or a smaller reporting company. See the definitions of “large accelerated filer,” “accelerated filer” and “smaller reporting company” in Rule 12b-2 of the Exchange Act. (Check one):
|
Large accelerated filer |
|
☒ |
|
Accelerated filer |
|
☐ |
|
|
|
|
|
|||
|
Non-accelerated filer |
|
☐ |
|
Smaller reporting company |
|
☐ |
|
|
|
|
|
Emerging growth company |
|
☐ |
If an emerging growth company, indicate by check mark if the registrant has elected not to use the extended transition period for complying with any new or revised financial accounting standards provided pursuant to Section 13(a) of the Exchange Act. ☐
Indicate by check mark whether the registrant is a shell company (as defined in Rule 12b-2 of the Act) Yes ☐ No ☒
Aggregate market value of voting shares and non-voting shares held by non-affiliates as of June 30, 2017: $1.0 billion (For the purpose of this calculation only, all members of the Board of Trustees are deemed to be affiliates). Number of shares of beneficial interest outstanding of registrant as of January 31, 2018: 13,735,391
DOCUMENTS INCORPORATED BY REFERENCE
Portions of the registrant’s definitive proxy statement for our 2017 Annual Meeting of Shareholders, which will be filed with the Securities and Exchange Commission within 120 days after December 31, 2017 (incorporated by reference under Part III).
UNIVERSAL HEALTH REALTY INCOME TRUST
2017 FORM 10-K ANNUAL REPORT
TABLE OF CONTENTS
|
PART I |
||
|
Item 1 |
1 |
|
|
Item 1A |
8 |
|
|
Item 1B |
18 |
|
|
Item 2 |
19 |
|
|
Item 3 |
26 |
|
|
Item 4 |
26 |
|
|
|
||
|
PART II |
||
|
Item 5 |
26 |
|
|
Item 6 |
28 |
|
|
Item 7 |
Management’s Discussion and Analysis of Financial Condition and Results of Operations |
31 |
|
Item 7A |
48 |
|
|
Item 8 |
49 |
|
|
Item 9 |
Changes in and Disagreements With Accountants on Accounting and Financial Disclosure |
49 |
|
Item 9A |
49 |
|
|
Item 9B |
53 |
|
|
|
||
|
PART III |
||
|
Item 10 |
53 |
|
|
Item 11 |
53 |
|
|
Item 12 |
Security Ownership of Certain Beneficial Owners and Management and Related Stockholder Matters |
53 |
|
Item 13 |
Certain Relationships and Related Transactions, and Director Independence |
53 |
|
Item 14 |
53 |
|
|
|
||
|
PART IV |
||
|
Item 15 |
54 |
|
|
|
|
|
|
Item 16 Form 10-K Summary |
55 |
|
|
56 |
||
|
|
|
|
This Annual Report on Form 10-K is for the year ended December 31, 2017. This Annual Report modifies and supersedes documents filed prior to this Annual Report. Information that we file with the Securities and Exchange Commission (the “SEC”) in the future will automatically update and supersede information contained in this Annual Report. In this Annual Report, “we,” “us,” “our” and the “Trust” refer to Universal Health Realty Income Trust and its subsidiaries.
As disclosed in this Annual Report, including in Part I, Item 1.-Relationship with Universal Health Services, Inc. (“UHS”), a wholly-owned subsidiary of UHS (UHS of Delaware, Inc.) serves as our Advisor pursuant to the terms of an annually renewable Advisory Agreement dated December 24, 1986. Our officers are all employees of UHS through its wholly-owned subsidiary, UHS of Delaware, Inc. In addition, three of our hospital facilities and seventeen medical office buildings or free-standing emergency departments, that are either wholly or jointly-owned by us, have leases with subsidiaries of UHS and/or include tenants which are subsidiaries of UHS. Any reference to “UHS” or “UHS facilities” in this report is referring to Universal Health Services, Inc.’s subsidiaries, including UHS of Delaware, Inc.
In this Annual Report, the term “revenues” does not include the revenues of the unconsolidated limited liability companies in which we have various non-controlling equity interests ranging from 33% to 95%. We currently account for our share of the income/loss from these investments by the equity method (see Note 8 to the Consolidated Financial Statements included herein).
General
We are a real estate investment trust (“REIT”) which commenced operations in 1986. We invest in health care and human service related facilities currently including acute care hospitals, rehabilitation hospitals, sub-acute facilities, medical office buildings (“MOBs”), free-standing emergency departments and childcare centers. As of February 28, 2018, we have sixty-eight real estate investments located in twenty states in the United States consisting of: (i) six hospital facilities including three acute care, one rehabilitation and two sub-acute; (ii) fifty-four medical/office buildings; (iii) four free-standing emergency departments (“FEDs”), and; (iv) four preschool and childcare centers.
Available Information
We have our principal executive offices at Universal Corporate Center, 367 South Gulph Road, King of Prussia, PA 19406. Our telephone number is (610) 265-0688. Our website is located at http://www.uhrit.com. Copies of the annual, quarterly and current reports we file with the SEC, and any amendments to those reports, are available free of charge on our website. Additionally, we have adopted governance guidelines, a Code of Business Conduct and Ethics applicable to all of our officers and directors, a Code of Ethics for Senior Officers and charters for each of the Audit Committee, Compensation Committee and Nominating and Corporate Governance Committee of the Board of Trustees. These documents are also available free of charge on our website. Copies of such reports and charters are available in print to any shareholder who makes a request. Such requests should be made to our Secretary at our King of Prussia, PA corporate headquarters. We intend to satisfy the disclosure requirement under Item 5.05 of Form 8-K relating to amendments to or waivers of any provision of our Code of Ethics for Senior Officers by promptly posting this information on our website. The information posted on our website is not incorporated into this Annual Report.
In accordance with Section 303A.12(a) of The New York Stock Exchange Listed Company Manual, we submitted our CEO’s Certification to the New York Stock Exchange in 2017. Additionally, contained in Exhibits 31.1 and 31.2 of this Annual Report are our CEO’s and CFO’s certifications regarding the quality of our public disclosure under Section 302 of the Sarbanes-Oxley Act of 2002.
1
As of February 28, 2018, we have investments in sixty-eight facilities, located in twenty states and consisting of the following:
|
Facility Name |
|
Location |
|
Type of Facility |
|
Ownership |
|
|
Guarantor |
|
||
|
Southwest Healthcare System, Inland Valley Campus(A) |
|
Wildomar, CA |
|
Acute Care |
|
100% |
|
|
Universal Health Services, Inc. |
|
||
|
McAllen Medical Center(A) |
|
McAllen, TX |
|
Acute Care |
|
100% |
|
|
Universal Health Services, Inc. |
|
||
|
Wellington Regional Medical Center(A) |
|
W. Palm Beach, FL |
|
Acute Care |
|
100% |
|
|
Universal Health Services, Inc. |
|
||
|
Kindred Hospital Chicago Central(B) |
|
Chicago, IL |
|
Sub-Acute Care |
|
100% |
|
|
Kindred Healthcare, Inc. |
|
||
|
Vibra Hospital of Corpus Christi(B) |
|
Corpus Christi, TX |
|
Sub-Acute Care |
|
100% |
|
|
Kindred Healthcare, Inc. |
|
||
|
HealthSouth Deaconess Rehabilitation Hospital(F) |
|
Evansville, IN |
|
Rehabilitation |
|
100% |
|
|
Encompass Health Corporation |
|
||
|
Family Doctor’s Medical Office Bldg.(B) |
|
Shreveport, LA |
|
MOB |
|
100% |
|
|
Christus Health Northern Louisiana |
|
||
|
Kelsey-Seybold Clinic at Kings Crossing(B) |
|
Kingwood, TX |
|
MOB |
|
100% |
|
|
Kelsey-Seybold Medical Group, PLLC |
|
||
|
Professional Buildings at Kings Crossing |
|
|
|
|
|
|
|
|
|
|
|
|
|
Building A(B) |
|
Kingwood, TX |
|
MOB |
|
100% |
|
|
|
— |
|
|
|
Building B(B) |
|
Kingwood, TX |
|
MOB |
|
100% |
|
|
|
— |
|
|
|
Chesterbrook Academy(B) |
|
Audubon, PA |
|
Preschool & Childcare |
|
100% |
|
|
Nobel Learning Comm. & Subs. |
|
||
|
Chesterbrook Academy(B) |
|
New Britain, PA |
|
Preschool & Childcare |
|
100% |
|
|
Nobel Learning Comm. & Subs. |
|
||
|
Chesterbrook Academy(B) |
|
Newtown, PA |
|
Preschool & Childcare |
|
100% |
|
|
Nobel Learning Comm. & Subs. |
|
||
|
Chesterbrook Academy(B) |
|
Uwchlan, PA |
|
Preschool & Childcare |
|
100% |
|
|
Nobel Learning Comm. & Subs. |
|
||
|
Southern Crescent Center I(B) |
|
Riverdale, GA |
|
MOB |
|
100% |
|
|
|
— |
|
|
|
Southern Crescent Center, II(D) |
|
Riverdale, GA |
|
MOB |
|
100% |
|
|
|
— |
|
|
|
St. Matthews Medical Plaza II(C) |
|
Louisville, KY |
|
MOB |
|
33% |
|
|
|
— |
|
|
|
Desert Valley Medical Center(E) |
|
Phoenix, AZ |
|
MOB |
|
100% |
|
|
|
— |
|
|
|
Cypresswood Professional Center(B) |
|
|
|
|
|
|
|
|
|
|
|
|
|
8101 |
|
Spring, TX |
|
MOB |
|
100% |
|
|
|
— |
|
|
|
8111 |
|
Spring, TX |
|
MOB |
|
100% |
|
|
|
— |
|
|
|
Desert Springs Medical Plaza(D) |
|
Las Vegas, NV |
|
MOB |
|
100% |
|
|
|
— |
|
|
|
701 South Tonopah Bldg.(A) |
|
Las Vegas, NV |
|
MOB |
|
100% |
|
|
|
— |
|
|
|
Santa Fe Professional Plaza(E) |
|
Scottsdale, AZ |
|
MOB |
|
100% |
|
|
|
— |
|
|
|
Summerlin Hospital MOB I(D) |
|
Las Vegas, NV |
|
MOB |
|
100% |
|
|
|
— |
|
|
|
Summerlin Hospital MOB II(D) |
|
Las Vegas, NV |
|
MOB |
|
100% |
|
|
|
— |
|
|
|
Danbury Medical Plaza(B) |
|
Danbury, CT |
|
MOB |
|
100% |
|
|
|
— |
|
|
|
Mid Coast Hospital MOB(C) |
|
Brunswick, ME |
|
MOB |
|
74% |
|
|
|
— |
|
|
|
Rosenberg Children’s Medical Plaza(E) |
|
Phoenix, AZ |
|
MOB |
|
100% |
|
|
|
— |
|
|
|
Gold Shadow(D) |
|
|
|
|
|
|
|
|
|
|
|
|
|
700 Shadow Lane MOB |
|
Las Vegas, NV |
|
MOB |
|
100% |
|
|
|
— |
|
|
|
2010 & 2020 Goldring MOBs |
|
Las Vegas, NV |
|
MOB |
|
100% |
|
|
|
— |
|
|
|
Apache Junction Medical Plaza(E) |
|
Apache Junction, AZ |
|
MOB |
|
100% |
|
|
|
— |
|
|
|
Spring Valley Medical Office Building(D) |
|
Las Vegas, NV |
|
MOB |
|
100% |
|
|
|
— |
|
|
|
Spring Valley Hospital Medical Office Building II(D) |
|
Las Vegas, NV |
|
MOB |
|
100% |
|
|
|
— |
|
|
|
Sierra San Antonio Medical Plaza(E) |
|
Fontana, CA |
|
MOB |
|
100% |
|
|
|
— |
|
|
|
Phoenix Children’s East Valley Care Center(E) |
|
Phoenix, AZ |
|
MOB |
|
100% |
|
|
|
— |
|
|
|
Centennial Hills Medical Office Building(D) |
|
Las Vegas, NV |
|
MOB |
|
100% |
|
|
|
— |
|
|
|
Palmdale Medical Plaza(D) |
|
Palmdale, CA |
|
MOB |
|
100% |
|
|
|
— |
|
|
|
Summerlin Hospital Medical Office Building III(D) |
|
Las Vegas, NV |
|
MOB |
|
100% |
|
|
|
— |
|
|
|
Vista Medical Terrace(D) |
|
Sparks, NV |
|
MOB |
|
100% |
|
|
|
— |
|
|
|
The Sparks Medical Building(D) |
|
Sparks, NV |
|
MOB |
|
100% |
|
|
|
— |
|
|
|
Auburn Medical Office Building II(E) |
|
Auburn, WA |
|
MOB |
|
100% |
|
|
|
— |
|
|
|
Texoma Medical Plaza(G) |
|
Denison, TX |
|
MOB |
|
95% |
|
|
|
— |
|
|
|
BRB Medical Office Building(E) |
|
Kingwood, TX |
|
MOB |
|
100% |
|
|
|
— |
|
|
|
3811 E. Bell(E) |
|
Phoenix, AZ |
|
MOB |
|
100% |
|
|
|
— |
|
|
|
Lake Pointe Medical Arts Building(E) |
|
Rowlett, TX |
|
MOB |
|
100% |
|
|
|
— |
|
|
|
Forney Medical Plaza(E) |
|
Forney, TX |
|
MOB |
|
100% |
|
|
|
— |
|
|
|
Tuscan Professional Building(E) |
|
Irving, TX |
|
MOB |
|
100% |
|
|
|
— |
|
|
|
Emory at Dunwoody Building(E) |
|
Atlanta, GA |
|
MOB |
|
100% |
|
|
|
— |
|
|
|
PeaceHealth Medical Clinic(E)(H) |
|
Bellingham, WA |
|
MOB |
|
100% |
|
|
|
— |
|
|
|
Forney Medical Plaza II(C) |
|
Forney, TX |
|
MOB |
|
95% |
|
|
|
— |
|
|
|
Northwest Texas Professional Office Tower(E) |
|
Amarillo, TX |
|
MOB |
|
100% |
|
|
|
— |
|
|
|
5004 Poole Road MOB(A) |
|
Denison, TX |
|
MOB |
|
100% |
|
|
|
— |
|
|
|
Ward Eagle Office Village(E) |
|
Farmington Hills, MI |
|
MOB |
|
100% |
|
|
|
— |
|
|
|
The Children’s Clinic at Springdale(E) |
|
Springdale, AR |
|
MOB |
|
100% |
|
|
|
— |
|
|
|
The Northwest Medical Center at Sugar Creek(E) |
|
Bentonville, AR |
|
MOB |
|
100% |
|
|
|
— |
|
|
|
Hanover Emergency Center (E) |
|
Mechanicsville, VA |
|
FED |
|
100% |
|
|
|
— |
|
|
|
South Texas ER at Weslaco(A) |
|
Weslaco, TX |
|
FED |
|
100% |
|
|
|
— |
|
|
|
South Texas ER at Mission(A) |
|
Mission, TX |
|
FED |
|
100% |
|
|
|
— |
|
|
|
Haas Medical Office Park(E) |
|
Ottumwa, IA |
|
MOB |
|
100% |
|
|
Regional Hospital Partners |
|
||
|
Piedmont - Roswell Physician Center(E) |
|
Sandy Springs, GA |
|
MOB |
|
100% |
|
|
|
— |
|
|
|
Piedmont - Vinings Physician Center(E) |
|
Vinings, GA |
|
MOB |
|
100% |
|
|
|
— |
|
|
|
Madison Professional Office Building (E) |
|
Madison, AL |
|
MOB |
|
100% |
|
|
|
— |
|
|
|
Chandler Corporate Center III(E) |
|
Chandler, AZ |
|
MOB |
|
100% |
|
|
|
— |
|
|
|
Frederick Crestwood MOB(E) |
|
Frederick, MD |
|
MOB |
|
100% |
|
|
|
— |
|
|
2
|
Facility Name |
|
Location |
|
Type of Facility |
|
Ownership |
|
|
Guarantor |
|
||
|
|
Las Vegas, NV |
|
MOB |
|
100% |
|
|
|
— |
|
||
|
Henderson Medical Plaza (D)(I) |
|
Henderson, NV |
|
MOB |
|
100% |
|
|
|
— |
|
|
|
Health Center at Hamburg (E)(J) |
|
Hamburg, PA |
|
MOB |
|
100% |
|
|
|
|
|
|
|
Las Palmas Del Sol Emergency Center - West(E)(J) |
|
El Paso, TX |
|
FED |
|
100% |
|
|
|
|
|
|
|
(A) |
Real estate assets owned by us and leased to subsidiaries of Universal Health Services, Inc. (“UHS”). |
|
(B) |
Real estate assets owned by us and leased to an unaffiliated third-party or parties. |
|
(C) |
Real estate assets owned by a limited liability company (“LLC”) or a limited partnership (“LP”) in which we have a noncontrolling ownership interests and include tenants who are unaffiliated third-parties. |
|
(D) |
Real estate assets owned by us or an LLC in which we hold 100% ownership interests and include tenants who are subsidiaries of UHS. |
|
(E) |
Real estate assets owned by us or an LLC in which we hold 100% ownership interests and include tenants who are unaffiliated third-parties. |
|
(F) |
The lessee on the HealthSouth Deaconess Health Rehabilitation Hospital (“Deaconess”) is HealthSouth/Deaconess L.L.C., a joint venture between HealthSouth Properties Corporation and Deaconess Hospital, Inc. The lease with Deaconess is scheduled to expire on May 31, 2019. Pursuant to a name change effective January 1, 2018, Encompass Health Corporation is the guarantor. |
|
(G) |
Real estate assets owned by an LLC or an LP in which we have a noncontrolling ownership interest and include tenants who are subsidiaries of UHS. |
|
(H) |
This MOB was acquired during the first quarter of 2012. In connection with the third-party loan agreement on this property, we are required to maintain separate financial records for the related entities. |
|
(I) |
This newly constructed MOB, located on the campus of Henderson Hospital, which is owned and operated by a subsidiary of UHS, was completed and opened during the second quarter of 2017. |
|
(J) |
These properties were acquired during the third quarter of 2017. |
Other Information
Included in our portfolio at December 31, 2017 and 2016 are six hospital facilities with an aggregate investment of $130.4 million. The leases with respect to the six hospital facilities comprised approximately 26%, 28% and 29% of our consolidated revenues in 2017, 2016 and 2015, respectively.
As of January 1, 2018, the leases on our six hospital facilities have fixed terms with an average of 3.1 years remaining and include renewal options ranging from zero to five, five-year terms. The remaining lease terms for each hospital facility, which vary by hospital, are included herein in Item 2. Properties.
We believe a facility’s earnings before interest, taxes, depreciation, amortization and lease rental expense (“EBITDAR”) and a facility’s EBITDAR divided by the sum of minimum rent plus additional rent payable to us (“Coverage Ratio”), which are non-GAAP financial measures, are helpful to us and our investors as a measure of the operating performance of a hospital facility. EBITDAR, which is used as an indicator of a facility’s estimated cash flow generated from operations (before rent expense, capital additions and debt service), is used by us in evaluating a facility’s financial viability and its ability to pay rent. For the hospital facilities owned by us at the end of each respective year, the combined weighted average Coverage Ratio was approximately 7.5 (ranging from -0.8 to 18.0) during 2017, 8.3 (ranging from 0.6 to 18.1) during 2016 and 8.1 (ranging from 1.1 to 19.3) during 2015. The Coverage Ratio for individual facilities varies.
Pursuant to the terms of the leases for our hospital facilities, free-standing emergency departments, some single-tenant MOBs and the preschool and childcare centers, each lessee, including subsidiaries of UHS, is responsible for building operations, maintenance, renovations and property insurance. We, or the LLCs in which we have invested, are responsible for the building operations, maintenance and renovations of the remaining MOBs, however, a portion, or in some cases all, of the expenses associated with the MOBs are passed on directly to the tenants. Cash reserves have been established to fund required building maintenance and renovations at the multi-tenant MOBs. Lessees are required to maintain all risk, replacement cost and commercial property insurance policies on the leased properties and we, or the LLC in which we have invested, are also named insureds on these policies. In addition, we, UHS or the LLCs in which we have invested, maintain property insurance on all properties. For additional information on the terms of our leases, see “Relationship with Universal Health Services, Inc.”
See our consolidated financial statements and accompanying notes to the consolidated financial statements included in this Annual Report for our total assets, liabilities, debt, revenues, income and other operating information.
Relationship with Universal Health Services, Inc. (“UHS”)
Leases: We commenced operations in 1986 by purchasing properties of certain subsidiaries from UHS and immediately leasing the properties back to the respective subsidiaries. Most of the leases were entered into at the time we commenced operations and provided for initial terms of 13 to 15 years with up to six additional 5-year renewal terms. The current base rentals and lease and renewal terms for each of the three hospital facilities leased to subsidiaries of UHS are provided below. The base rents are paid monthly and each lease also provides for additional or bonus rents which are computed and paid on a quarterly basis based upon a computation that compares current quarter revenue to a corresponding quarter in the base year. The three hospital leases with subsidiaries of UHS are unconditionally guaranteed by UHS and are cross-defaulted with one another.
3
The combined revenues generated from the leases on the UHS hospital facilities accounted for approximately 25% of our total revenue for the five years ended December 31, 2017 (approximately 22%, 24% and 25% for the years ended December 31, 2017, 2016 and 2015 respectively). Including 100% of the revenues generated at the unconsolidated LLCs in which we have various non-controlling equity interests ranging from 33% to 95%, the leases on the UHS hospital facilities accounted for approximately 20% of the combined consolidated and unconsolidated revenue for the five years ended December 31, 2017 (approximately 19% for each of the years ended December 31, 2017 and 2016, and 20% for the year ended December 31, 2015). In addition, we have seventeen MOBs, or free-standing emergency departments (“FEDs”), that are either wholly or jointly-owned by us, that include tenants which are subsidiaries of UHS.
Pursuant to the Master Lease Document by and among us and certain subsidiaries of UHS, dated December 24, 1986 (the “Master Lease”), which governs the leases of all hospital properties with subsidiaries of UHS, UHS has the option to renew the leases at the lease terms described below by providing notice to us at least 90 days prior to the termination of the then current term. UHS also has the right to purchase the respective leased facilities at the end of the lease terms or any renewal terms at the appraised fair market value. In addition, the Master Lease, as amended during 2006, includes a change of control provision whereby UHS has the right, upon one month’s notice should a change of control of the Trust occur, to purchase any or all of the three leased hospital properties listed below at their appraised fair market value. Additionally, UHS has rights of first refusal to: (i) purchase the respective leased facilities during and for 180 days after the lease terms at the same price, terms and conditions of any third-party offer, or; (ii) renew the lease on the respective leased facility at the end of, and for 180 days after, the lease term at the same terms and conditions pursuant to any third-party offer.
The table below details the existing lease terms and renewal options for our three acute care hospitals operated by wholly-owned subsidiaries of UHS:
|
Hospital Name |
|
Annual Minimum Rent |
|
|
End of Lease Term |
|
Renewal Term (years) |
|
|
||
|
McAllen Medical Center |
|
$ |
5,485,000 |
|
|
December, 2021 |
|
|
10 |
|
(a) |
|
Wellington Regional Medical Center |
|
$ |
3,030,000 |
|
|
December, 2021 |
|
|
10 |
|
(b) |
|
Southwest Healthcare System, Inland Valley Campus |
|
$ |
2,648,000 |
|
|
December, 2021 |
|
|
10 |
|
(b) |
|
(a) |
UHS has two 5-year renewal options at existing lease rates (through 2031). |
|
(b) |
UHS has two 5-year renewal options at fair market value lease rates (2022 through 2031). |
Management cannot predict whether the leases with subsidiaries of UHS, which have renewal options at existing lease rates or fair market value lease rates, or any of our other leases, will be renewed at the end of their lease term. If the leases are not renewed at their current rates or the fair market value lease rates, we would be required to find other operators for those facilities and/or enter into leases on terms potentially less favorable to us than the current leases. In addition, if subsidiaries of UHS exercise their options to purchase the respective leased hospital or FED facilities upon expiration of the lease terms, our future revenues could decrease if we were unable to earn a favorable rate of return on the sale proceeds received, as compared to the rental revenue currently earned pursuant to these leases.
In April, 2017, the recently constructed Henderson Medical Plaza MOB received its certificate of occupancy. Henderson Medical Plaza is located on the campus of the Henderson Hospital Medical Center, a newly constructed acute care hospital that is owned and operated by a subsidiary of UHS and was completed and opened during the fourth quarter of 2016. A ground lease has been executed between the limited liability company that owns the MOB and a subsidiary of UHS, the terms of which include a seventy-five year lease term with two, ten-year renewal options at the lessee’s option at an adjusting lease rate. We have invested net cash of approximately $12.4 million on the development and construction of this MOB as of December 31, 2017.
During the first quarter of 2015, we purchased from wholly-owned subsidiaries of UHS, the real property of two newly-constructed and recently opened FEDs located in Weslaco and Mission, Texas. Each FED consists of approximately 13,600 square feet and is operated by wholly-owned subsidiaries of UHS. In connection with these acquisitions, ten-year lease agreements with six, 5-year renewal terms were executed with UHS for each FED. The first four, 5-year renewal terms (covering years 2025 through 2044) include 2% annual lease rate increases, computed on a cumulative and compounded basis, and the last two, 5-year renewal terms (covering the years 2045 through 2054) will be at the then fair market value lease rates. These leases are cross-defaulted with one another. UHS has the option to purchase the leased properties upon the expiration of the fixed term and each five-year extended term at the fair market value at that time. The aggregate acquisition cost of these facilities was approximately $12.8 million, and the aggregate rental revenue earned by us at the commencement of the leases is approximately $900,000 annually.
Advisory Agreement: UHS of Delaware, Inc. (the “Advisor”), a wholly-owned subsidiary of UHS, serves as Advisor to us under an Advisory Agreement (the “Advisory Agreement”) dated December 24, 1986. Pursuant to the Advisory Agreement, the
4
Advisor is obligated to present an investment program to us, to use its best efforts to obtain investments suitable for such program (although it is not obligated to present any particular investment opportunity to us), to provide administrative services to us and to conduct our day-to-day affairs. All transactions between us and UHS must be approved by the Trustees who are unaffiliated with UHS (the “Independent Trustees”). In performing its services under the Advisory Agreement, the Advisor may utilize independent professional services, including accounting, legal, tax and other services, for which the Advisor is reimbursed directly by us. The Advisory Agreement may be terminated for any reason upon sixty days written notice by us or the Advisor. The Advisory Agreement expires on December 31 of each year; however, it is renewable by us, subject to a determination by the Independent Trustees, that the Advisor’s performance has been satisfactory. Our advisory fee was 0.70% during each of 2017, 2016 and 2015 of our average invested real estate assets, as derived from our consolidated balance sheet. In December of 2017, based upon a review of our advisory fee and other general and administrative expenses as compared to an industry peer group, the Advisory Agreement was renewed for 2018 pursuant to the same terms as the Advisory Agreement in place during the last three years.
The average real estate assets for advisory fee calculation purposes exclude certain items from our consolidated balance sheet such as, among other things, accumulated depreciation, cash and cash equivalents, base and bonus rent receivables, deferred charges and other assets. The advisory fee is payable quarterly, subject to adjustment at year-end based upon our audited financial statements. In addition, the Advisor is entitled to an annual incentive fee equal to 20% of the amount by which cash available for distribution to shareholders for each year, as defined in the Advisory Agreement, exceeds 15% of our equity as shown on our consolidated balance sheet, determined in accordance with generally accepted accounting principles without reduction for return of capital dividends. The Advisory Agreement defines cash available for distribution to shareholders as net cash flow from operations less deductions for, among other things, amounts required to discharge our debt and liabilities and reserves for replacement and capital improvements to our properties and investments. No incentive fees were paid during 2017, 2016 or 2015 since the incentive fee requirements were not achieved. Advisory fees incurred and paid (or payable) to UHS amounted to $3.6 million during 2017, $3.3 million during 2016 and $2.8 million during 2015 and were based upon average invested real estate assets of $511 million, $466 million and $401 million during 2017, 2016 and 2015, respectively.
Officers and Employees: Our officers are all employees of a wholly-owned subsidiary of UHS and although as of December 31, 2017 we had no salaried employees, our officers do typically receive annual stock-based compensation awards in the form of restricted stock. In special circumstances, if warranted and deemed appropriate by the Compensation Committee of the Board of Trustees, our officers may also receive one-time compensation awards in the form of restricted stock and/or cash bonuses.
Share Ownership: As of December 31, 2017 and 2016, UHS owned 5.7% and 5.8%, respectively, of our outstanding shares of beneficial interest.
SEC reporting requirements of UHS: UHS is subject to the reporting requirements of the Securities and Exchange Commission (“SEC”) and is required to file annual reports containing audited financial information and quarterly reports containing unaudited financial information. Since the leases on the hospital facilities leased to wholly-owned subsidiaries of UHS comprised approximately 22%, 24% and 25% of our consolidated revenues for the years ended December 31, 2017, 2016 and 2015, respectively, and since a subsidiary of UHS is our Advisor, you are encouraged to obtain the publicly available filings for Universal Health Services, Inc. from the SEC’s website. These filings are the sole responsibility of UHS and are not incorporated by reference herein.
Taxation
No provision has been made for federal income tax purposes since we qualify as a REIT under Sections 856 to 860 of the Internal Revenue Code of 1986, and intend to continue to remain so qualified. To qualify as a REIT, we must meet certain organizational and operational requirements, including a requirement to distribute at least 90% of our annual REIT taxable income to shareholders. As a REIT, we generally will not be subject to federal, state or local income tax on income that we distribute as dividends to our shareholders. We have historically distributed, and intend to continue to distribute, 100% of our annual REIT taxable income to our shareholders.
Please see the heading “If we fail to maintain our REIT status, we will become subject to federal income tax on our taxable income at regular corporate rates” under “Risk Factors” for more information.
Competition
We compete for the acquisition, leasing and financing of health care related facilities. Our competitors include, but are not limited to, other REITs, banks and other companies, including UHS. Some of these competitors are larger and may have a lower cost of capital than we do. These developments could result in fewer investment opportunities for us and lower spreads over the cost of our capital, which would hurt our growth.
5
In most geographical areas in which our facilities operate, there are other facilities that provide services comparable to those offered by our facilities. In addition, some competing facilities are owned by tax-supported governmental agencies or by nonprofit corporations and may be supported by endowments and charitable contributions and exempt from property, sales and income taxes. Such exemptions and support are not available to certain operators of our facilities, including UHS. In some markets, certain competing facilities may have greater financial resources, be better equipped and offer a broader range of services than those available at our facilities. Certain hospitals that are located in the areas served by our facilities are specialty hospitals that provide medical, surgical and behavioral health services that may not be provided by the operators of our hospitals. The increase in outpatient treatment and diagnostic facilities, ambulatory surgical centers and freestanding emergency departments also increases competition for us.
In addition, the number and quality of the physicians on a hospital’s staff are important factors in determining a hospital’s success and competitive advantage. Typically, physicians are responsible for making hospital admission decisions and for directing the course of patient treatment. The operators of our facilities also compete with other health care providers in recruiting and retaining qualified hospital management, nurses and other medical personnel. From time-to-time, the operators of our acute care hospitals may experience the effects of a shortage of skilled nursing staff nationwide, which has caused and may continue to cause an increase in salaries, wages and benefits expense in excess of the inflation rate. Our operators may experience difficulties attracting and retaining qualified physicians, nurses and medical support personnel. We anticipate that our operators, including UHS, will continue to encounter increased competition in the future that could lead to a decline in patient volumes and harm their businesses, which in turn, could harm our business.
A large portion of our non-hospital properties consist of MOBs which are located either close to or on the campuses of hospital facilities. These properties are either directly or indirectly affected by the factors discussed above as well as general real estate factors such as the supply and demand of office space and market rental rates. To improve our competitive position, we anticipate that we will continue investing in additional healthcare related facilities and leasing the facilities to qualified operators, perhaps including subsidiaries of UHS.
Regulation and Other Factors
During 2017, 2016 and 2015, 25%, 26% and 26%, respectively, of our revenues were earned pursuant to leases with operators of acute care services hospitals and free-standing emergency departments (“FEDs”), the majority of which are subsidiaries of UHS. A significant portion of the revenue earned by the operators of our acute care hospitals and FEDs is derived from federal and state healthcare programs, including Medicare and Medicaid (excluding managed Medicare and Medicaid programs).
Our acute care facilities derive a significant portion of their revenue from third-party payors, including the Medicare and Medicaid programs. Changes in these government programs in recent years have resulted in limitations on reimbursement and, in some cases, reduced levels of reimbursement for healthcare services. Payments from federal and state government programs are subject to statutory and regulatory changes, administrative rulings, interpretations and determinations, requirements for utilization review, and federal and state funding restrictions, all of which could materially increase or decrease program payments, as well as affect the cost of providing service to patients and the timing of payments to facilities. Neither we nor the operators of our hospital facilities are able to predict the effect of recent and future policy changes on our respective results of operations. In addition, the uncertainty and fiscal pressures placed upon federal and state governments as a result of, among other things, the funding requirements and other provisions of the Patient Protection and Affordable Care Act (the “PPACA”), may affect the availability of taxpayer funds for Medicare and Medicaid programs. In addition, possible repeal or replacement of the PPACA may have significant impact on the reimbursement for healthcare services. If the rates paid or the scope of services covered by government payors are reduced, there could be a material adverse effect on the business, financial position and results of operations of the operators of our hospital facilities, and in turn, ours.
In addition, the healthcare industry is required to comply with extensive and complex laws and regulations at the federal, state and local government levels relating to, among other things: hospital billing practices and prices for services; relationships with physicians and other referral sources; adequacy of medical care and quality of medical equipment and services; ownership of facilities; qualifications of medical and support personnel; confidentiality, maintenance, privacy and security issues associated with health-related information and patient medical records; the screening, stabilization and transfer of patients who have emergency medical conditions; certification, licensure and accreditation of our facilities; operating policies and procedures, and; construction or expansion of facilities and services.
These laws and regulations are extremely complex, and, in many cases, the operators of our facilities do not have the benefit of regulatory or judicial interpretation. In the future, it is possible that different interpretations or enforcement of these laws and regulations could subject the current or past practices of our operators to allegations of impropriety or illegality or could require them to make changes in their facilities, equipment, personnel, services, capital expenditure programs and operating expenses. Although UHS and other operators of our hospitals and FEDs believe that their policies, procedures and practices comply with governmental regulations, no assurance can be given that they will not be subjected to additional governmental inquiries or actions, or that they
6
would not be faced with sanctions, fines or penalties if so subjected. Even if they were to ultimately prevail, a significant governmental inquiry or action under one of the above laws, regulations or rules could have a material adverse effect upon them, and in turn, us.
Each of our hospital facilities is deemed certified, meaning that they are accredited, properly licensed under the relevant state laws and regulations and certified under the Medicare program. The effect of maintaining certified facilities is to allow such facilities to participate in the Medicare and Medicaid programs. The operators of our hospital facilities believe that the facilities are in material compliance with applicable federal, state, local and other relevant regulations and standards. However, should any of our hospital facilities lose their deemed certified status and thereby lose certification under the Medicare or Medicaid programs, such facilities would be unable to receive reimbursement from either of those programs and their business, and in turn, ours, could be materially adversely affected.
The various factors and government regulation related to the healthcare industry, such as those outlined above, affects us because:
|
(i) |
The financial ability of lessees to make rent payments to us may be affected by governmental regulations such as licensure, certification for participation in government programs, and government reimbursement, and; |
|
(ii) |
Our bonus rents on the three acute care hospitals operated by subsidiaries of UHS are based on our lessees’ net revenues which in turn are affected by the amount of reimbursement such lessees receive from the government. |
A significant portion of the revenue earned by the operators of our acute care hospitals and FEDs is derived from federal and state healthcare programs, including Medicare and Medicaid. Under the statutory framework of the Medicare and Medicaid programs, many of the general acute care operations are subject to administrative rulings, interpretations and discretion that may affect payments made under either or both of such programs as well as by other third party payors. The federal government makes payments to participating hospitals under its Medicare program based on various formulas. For inpatient services, the operators of our acute care hospitals are subject to an inpatient prospective payment system (“IPPS”). Under IPPS, hospitals are paid a predetermined fixed payment amount for each hospital discharge. The fixed payment amount is based upon each patient’s Medicare severity diagnosis related group (“MS-DRG”). Every MS-DRG is assigned a payment rate based upon the estimated intensity of hospital resources necessary to treat the average patient with that particular diagnosis. These rates are based upon historical national average costs and do not consider the actual costs incurred by a hospital in providing care. The MS-DRG rates are adjusted annually based on geographic region and are weighted based upon a statistically normal distribution of severity.
For outpatient services, acute care hospitals are paid under an outpatient prospective payment system (“PPS”) according to ambulatory procedure codes. The outpatient PPS rate is a geographic adjusted national payment amount that includes the Medicare payment and the beneficiary co-payment. Special payments under the outpatient PPS may be made for certain new technology items and services through transitional pass-through payments and special reimbursement rates.
Our three acute care hospitals and two FEDs operated by subsidiaries of UHS and two sub-acute care hospital facilities operated by an unaffiliated third-party are located in Texas, Florida, California and Illinois. The majority of these states have reported significant budget deficits that have resulted in reductions of Medicaid funding at various times during the last few years and which could adversely affect future levels of Medicaid reimbursement received by certain operators of our facilities, including the operators of our hospital facilities. We can provide no assurance that reductions to Medicaid revenues earned by operators of certain of our facilities, particularly our hospital operators in the above-mentioned states, will not have a material adverse effect on the future operating results of those operators which, in turn, could have a material adverse effect on us.
Executive Officers of the Registrant
|
Name |
|
Age |
|
|
Position |
|
|
Alan B. Miller |
|
|
80 |
|
|
Chairman of the Board, Chief Executive Officer and President |
|
Charles F. Boyle |
|
|
58 |
|
|
Vice President and Chief Financial Officer |
|
Cheryl K. Ramagano |
|
|
55 |
|
|
Vice President, Treasurer and Secretary |
|
Timothy J. Fowler |
|
|
62 |
|
|
Vice President, Acquisition and Development |
Mr. Alan B. Miller has been our Chairman of the Board and Chief Executive Officer since our inception in 1986 and was appointed President in February, 2003. He had previously served as our President until 1990. Mr. Miller has been Chairman of the Board and Chief Executive Officer of UHS since its inception in 1978. He previously held the title of President of UHS as well, until 2009 when Marc D. Miller was elected as President of UHS. He is the father of Marc D. Miller, who was elected to our Board of Trustees in December, 2008 and also serves as President and a member of the Board of Directors of UHS.
7
Mr. Charles F. Boyle was appointed our Vice President and Chief Financial Officer in 2003 and had served as our Vice President and Controller since 1991. Mr. Boyle has held various positions at UHS since 1983. He was appointed Senior Vice President of UHS in 2017 and continues to serve as its Controller. He had served as Vice President and Controller of UHS since 2003 and as its Assistant Vice President-Corporate Accounting since 1994.
Ms. Cheryl K. Ramagano was appointed Secretary of the Trust in 2003 and has served as our Vice President and Treasurer since 1992. Ms. Ramagano has held various positions at UHS since 1983. She was appointed Senior Vice President of UHS in 2017 and continues to serve as its Treasurer. She had served as Vice President and Treasurer of UHS since 2003 and as its Assistant Treasurer since 1994.
Mr. Timothy J. Fowler was elected as our Vice President of Acquisition and Development upon the commencement of his employment with UHS in 1993.
We are subject to numerous known and unknown risks, many of which are described below and elsewhere in this Annual Report. Any of the events described below could have a material adverse effect on our business, financial condition and results of operations. Additional risks and uncertainties that we are not aware of, or that we currently deem to be immaterial, could also impact our business and results of operations.
The revenues and results of operations of the tenants of our hospital facilities, including UHS, and our medical office buildings, are significantly affected by payments received from the government and other third party payors.
The operators of our hospital facilities, FEDs and tenants of our medical office buildings derive a significant portion of their revenue from third party payors, including the Medicare and Medicaid programs. Changes in these government programs in recent years have resulted in limitations on reimbursement and, in some cases, reduced levels of reimbursement for health care services. Payments from federal and state government programs are subject to statutory and regulatory changes, administrative rulings, interpretations and determinations, requirements for utilization review, and federal and state funding restrictions, all of which could materially increase or decrease program payments, as well as affect the cost of providing service to patients and the timing of payments to facilities. Our tenants are unable to predict the effect of recent and future policy changes on their operations.
Our three acute care hospitals and two FEDs operated by subsidiaries of UHS and two sub-acute care hospital facilities operated by an unaffiliated third-party are located in Texas, Florida, California and Illinois. The majority of these states have reported significant budget deficits that have resulted in reductions of Medicaid funding at various times during the last few years and which could adversely affect future levels of Medicaid reimbursement received by certain operators of our facilities, including the operators of our hospital facilities. We can provide no assurance that reductions to Medicaid revenues earned by operators of certain of our facilities, particularly our hospital operators in the above-mentioned states, will not have a material adverse effect on the future operating results of those operators which, in turn, could have a material adverse effect on us. In addition, the uncertainty and fiscal pressures placed upon federal and state governments as a result of, among other things, the funding requirements and other provisions of the Patient Protection and Affordable Care Act, may affect the availability of taxpayer funds for Medicare and Medicaid programs. If the rates paid or the scope of services covered by government payors are reduced, there could be a material adverse effect on the business, financial position and results of operations of the operators of our hospital facilities, and in turn, ours.
In addition to changes in government reimbursement programs, the ability of our hospital operators to negotiate favorable contracts with private payors, including managed care providers, significantly affects the revenues and operating results of those facilities. Private payors, including managed care providers, increasingly are demanding that hospitals accept lower rates of payment. Our hospital operators expect continued third party efforts to aggressively manage reimbursement levels and cost controls. Reductions in reimbursement amounts received from third party payors could have a material adverse effect on the financial position and results of operations of our hospital operators.
Reductions or changes in Medicare and Medicaid funding could have a material adverse effect on the future operating results of the operators of our facilities, including UHS, which could, in turn, materially reduce our revenues and net income.
On January 3, 2013, the American Taxpayer Relief Act of 2012 (the “2012 Act”) was signed into law. The 2012 Act postponed for two months sequestration cuts mandated under the Budget Control Act of 2011. The postponed sequestration cuts include a 2% annual reduction over ten years in Medicare spending to providers. Medicaid is exempt from sequestration. In order to offset the cost of the legislation, the 2012 Act reduces payments to other providers totaling almost $26 billion over ten years. Approximately half of those funds will come from reductions in Medicare reimbursement to hospitals. Although the Bipartisan Budget Act of 2013 has reduced certain sequestration-related budgetary cuts, spending reductions related to the Medicare program remain in place. On
8
December 26, 2013, H.J. Res. 59, the Bipartisan Budget Act of 2013, which includes the Pathway for SGR Reform Act of 2013 (“the Act”), was signed into law. In addition, on February 15, 2014, Public Law 113-082 was enacted. The 2012 Act and subsequent federal legislation achieves new savings by extending sequestration for mandatory programs – including Medicare – for another three years, through 2027.
The 2012 Act includes a document and coding (“DCI”) adjustment and a reduction in Medicaid disproportionate share hospital (“DSH”) payments. Expected to save $10.5 billion over 10 years, the DCI adjustment decreases projected Medicare hospital payments for inpatient and overnight care through a downward adjustment in annual base payment increases. These reductions are meant to recoup what Medicare authorities consider to be “overpayments” to hospitals that occurred as a result of the transition to Medicare Severity Diagnosis Related Groups. The reduction in Medicaid DSH payments was expected to save $4.2 billion over 10 years. This provision extends the changes regarding DSH payments established by the Legislation and determines future allotments off of the rebased level. On February 9, 2018, President Trump signed into law H.R. 1892, The Bipartisan Budget Act of 2018, which eliminated the DSH cuts scheduled for 2018 and 2019 but added additional DSH reductions of $4 billion in 2020 and $8 billion a year between 2021 and 2025. We cannot predict the effect this enactment will have on operators (including UHS), and, thus, our business.
The uncertainties of health care reform could materially affect the business and future results of operations of the operators of our facilities, including UHS, which could, in turn, materially reduce our revenues and net income.
On March 23, 2010, the Patient Protection and Affordable Care Act (the “PPACA”) was signed into law. The Healthcare and Education Reconciliation Act of 2010 (the “Reconciliation Act”), which contains a number of amendments to the PPACA, was signed into law on March 30, 2010. Two primary goals of the PPACA, combined with the Reconciliation Act (collectively referred to as the “Legislation”), are to provide for increased access to coverage for healthcare and to reduce healthcare-related expenses.
Although it was expected that the Legislation would result in a reduction in uninsured patients in the U.S., which would reduce the operators’ of our facilities’ expense from uncollectible accounts receivable, the Legislation made a number of other changes to Medicare and Medicaid which we believe may have an adverse impact on the operators of our facilities. It has been projected that the Legislation will result in a net reduction in Medicare and Medicaid payments to hospitals totaling $155 billion over 10 years. The Legislation revises reimbursement under the Medicare and Medicaid programs to emphasize the efficient delivery of high quality care and contains a number of incentives and penalties under these programs to achieve these goals. The Legislation provides for decreases in the annual market basket update for federal fiscal years 2010 through 2019, a productivity offset to the market basket update beginning October 1, 2011 for Medicare Part B reimbursable items and services and beginning October 1, 2012 for Medicare inpatient hospital services. The Legislation and subsequent revisions provide for reductions to both Medicare DSH and Medicaid DSH payments. The Medicare DSH reductions began in October, 2013 while Medicaid DSH reimbursements are scheduled to begin in 2020. The Legislation implements a value-based purchasing program, which will reward the delivery of efficient care. Conversely, certain facilities will receive reduced reimbursement for failing to meet quality parameters; such hospitals will include those with excessive readmission or hospital-acquired condition rates.
A 2012 U.S. Supreme Court ruling limited the federal government’s ability to expand health insurance coverage by holding unconstitutional sections of the Legislation that sought to withdraw federal funding for state noncompliance with certain Medicaid coverage requirements. Pursuant to that decision, the federal government may not penalize states that choose not to participate in the Medicaid expansion program by reducing their existing Medicaid funding. Therefore, states can choose to accept or not to participate without risking the loss of federal Medicaid funding. As a result, many states, including Texas, have not expanded their Medicaid programs without the threat of loss of federal funding. CMS has granted, and is expected to grant additional, section 1115 demonstration waivers providing for work and community engagement requirements for certain Medicaid eligible individuals. It is anticipated this will lead to reductions in coverage, and likely increases in uncompensated care for the operators of our facilities, in states where these demonstration waivers are granted.
The various provisions in the Legislation that directly or indirectly affect Medicare and Medicaid reimbursement are scheduled to take effect over a number of years. The impact of the Legislation on healthcare providers will be subject to implementing regulations, interpretive guidance and possible future legislation or legal challenges. Certain Legislation provisions, such as that creating the Medicare Shared Savings Program create uncertainty in how healthcare may be reimbursed by federal programs in the future. Thus, at this time, we cannot predict the impact of the Legislation on the future reimbursement of our hospital operators and we can provide no assurance that the Legislation will not have a material adverse effect on the future results of operations of the tenants/operators of our properties and, thus, our business.
The Legislation also contained provisions aimed at reducing fraud and abuse in healthcare. The Legislation amends several existing laws, including the federal Anti-Kickback Statute and the False Claims Act, making it easier for government agencies and private plaintiffs to prevail in lawsuits brought against healthcare providers. While Congress had previously revised the intent requirement of the Anti-Kickback Statute to provide that a person is not required to “have actual knowledge or specific intent to commit a violation of” the Anti-Kickback Statute in order to be found in violation of such law, the Legislation also provides that any
9
claims for items or services that violate the Anti-Kickback Statute are also considered false claims for purposes of the federal civil False Claims Act. The Legislation provides that a healthcare provider that retains an overpayment in excess of 60 days is subject to the federal civil False Claims Act, although final regulations implementing this statutory requirement remain pending. The Legislation also expands the Recovery Audit Contractor program to Medicaid. These amendments also make it easier for severe fines and penalties to be imposed on healthcare providers that violate applicable laws and regulations.
The impact of the Legislation on hospitals may vary. Because Legislation provisions are effective at various times over the next several years, we anticipate that many of the provisions in the Legislation may be subject to further revision. Initiatives to repeal the Legislation, in whole or in part, to delay elements of implementation or funding, and to offer amendments or supplements to modify its provisions have been persistent. The ultimate outcomes of legislative attempts to repeal or amend the Legislation and legal challenges to the Legislation are unknown. Legislation has already been enacted that has repealed the individual mandate to obtain health insurance penalty that was part of the original Legislation. In addition, Congress is considering legislation that would, in material part (i) eliminate the large employer mandates to obtain or provide health insurance coverage, respectively; (ii) permit insurers to impose a surcharge up to 30 percent on individuals who go uninsured for more than two months and then purchase coverage; (iii) provide tax credits towards the purchase of health insurance, with a phase-out of tax credits according to income level; (iv) expand health savings accounts; (v) impose a per capita cap on federal funding of state Medicaid programs, or, if elected by a state, transition federal funding to block grants, and; (vi) permit states to seek a waiver of certain federal requirements that would allow such state to define essential health benefits differently from federal standards and that would allow certain commercial health plans to take health status, including pre-existing conditions, into account in setting premiums.
In addition to legislative changes, the Legislation can be significantly impacted by executive branch actions. In relevant part, President Trump has already taken executive actions: (i) requiring all federal agencies with authorities and responsibilities under the Legislation to “exercise all authority and discretion available to them to waiver, defer, grant exemptions, from, or delay” parts of the Legislation that place “unwarranted economic and regulatory burdens” on states, individuals or health care providers; (ii) the issuance of a proposed rule by the Department of Labor to enable the formation of health plans that would be exempt from certain Legislation essential health benefits requirements, and; (iii) eliminating cost-sharing reduction payments to insurers that would otherwise offset deductibles and other out-of-pocket expenses for health plan enrollees at or below 250 percent of the federal poverty level. The uncertainty resulting from these Executive Branch policies has led to reduced Exchange enrollment in 2018 and is expected to further worsen the individual and small group market risk pools in future years. It is also anticipated that these and future policies may create additional cost and reimbursement pressures on hospitals.
It remains unclear what portions of the Legislation may remain, or what any replacement or alternative programs may be created by any future legislation. Any such future repeal or replacement may have significant impact on the reimbursement for healthcare services generally, and may create reimbursement for services competing with the services offered by the operators of our hospitals. Accordingly, there can be no assurance that the adoption of any future federal or state healthcare reform legislation will not have a negative financial impact on the operators of our hospitals, including their ability to compete with alternative healthcare services funded by such potential legislation, or for the operators of our hospitals to receive payment for services.
The trend toward value-based purchasing may negatively impact the revenues of our hospital operators.
We believe that value-based purchasing initiatives of both governmental and private payers tying financial incentives to quality and efficiency of care will increasingly affect the results of operations of our hospitals and other healthcare facilities and may negatively impact their revenues if they are unable to meet expected quality standards. The Affordable Care Act contains a number of provisions intended to promote value-based purchasing in federal healthcare programs. Medicare now requires providers to report certain quality measures in order to receive full reimbursement increases for inpatient and outpatient procedures that were previously awarded automatically. In addition, hospitals that meet or exceed certain quality performance standards will receive increased reimbursement payments, and hospitals that have “excess readmissions” for specified conditions will receive reduced reimbursement. Furthermore, Medicare no longer pays hospitals additional amounts for the treatment of certain hospital-acquired conditions unless the conditions were present at admission. Beginning in Federal Fiscal Year (FFY) 2015, hospitals that rank in the worst 25% of all hospitals nationally for hospital acquired conditions in the previous year will receive reduced Medicare reimbursements. The ACA also prohibits the use of federal funds under the Medicaid program to reimburse providers for treating certain provider-preventable conditions.
There is a trend among private payers toward value-based purchasing of healthcare services, as well. Many large commercial payers require hospitals to report quality data, and several of these payers will not reimburse hospitals for certain preventable adverse events. We expect value-based purchasing programs, including programs that condition reimbursement on patient outcome measures, to become more common and to involve a higher percentage of reimbursement amounts. We are unable at this time to predict how this trend will affect the results of operations of the operators of our hospitals, but it could negatively impact their revenues if they are unable to meet quality standards established by both governmental and private payers.
10
Increased competition in the health care industry has resulted in lower revenues and higher costs for our operators, including UHS, and may affect our revenues, property values and lease renewal terms.
The health care industry is highly competitive and competition among hospitals and other health care providers for patients and physicians has intensified in recent years. In most geographical areas in which our facilities are operated, there are other facilities that provide services comparable to those offered by our facilities. In addition, some competing facilities are owned by tax-supported governmental agencies or by nonprofit corporations and may be supported by endowments and charitable contributions and exempt from property, sales and income taxes. Such exemptions and support are not available to certain operators of our facilities, including UHS.
In some markets, certain competing facilities may have greater financial resources, be better equipped and offer a broader range of services than those available at our facilities. Certain hospitals that are located in the areas served by our facilities are specialty hospitals that provide medical, surgical and behavioral health services that may not be provided by the operators of our hospitals. The increase in outpatient treatment and diagnostic facilities, outpatient surgical centers and freestanding ambulatory surgical centers also increases competition for our operators.
In addition, the operators of our facilities face competition from other health care providers, including physician owned facilities and other competing facilities, including certain facilities operated by UHS but the real property of which is not owned by us. Such competition is experienced in markets including, but not limited to, McAllen, Texas, the site of our McAllen Medical Center, a 370-bed acute care hospital, and Riverside County, California, the site of our Southwest Healthcare System-Inland Valley Campus, a 130-bed acute care hospital.
In addition, the number and quality of the physicians on a hospital’s staff are important factors in determining a hospital’s competitive advantage. Typically, physicians are responsible for making hospital admission decisions and for directing the course of patient treatment. Since the operators of our facilities also compete with other health care providers, they may experience difficulties in recruiting and retaining qualified hospital management, nurses and other medical personnel.
We anticipate that our operators, including UHS, will continue to encounter increased competition in the future that could lead to a decline in patient volumes and harm their businesses, which in turn, could harm our business.
Operators that fail to comply with governmental reimbursement programs such as Medicare or Medicaid, licensing and certification requirements, fraud and abuse regulations or new legislative developments may be unable to meet their obligations to us.
Our operators, including UHS and its subsidiaries, are subject to numerous federal, state and local laws and regulations that are subject to frequent and substantial changes (sometimes applied retroactively) resulting from legislation, adoption of rules and regulations, and administrative and judicial interpretations of existing law. The ultimate timing or effect of these changes cannot be predicted. Government regulation may have a dramatic effect on our operators’ costs of doing business and the amount of reimbursement received by both government and other third-party payors. The failure of any of our operators to comply with these laws, requirements and regulations could adversely affect their ability to meet their obligations to us. These regulations include, among other items: hospital billing practices and prices for service; relationships with physicians and other referral sources; adequacy of medical care; quality of medical equipment and services; qualifications of medical and support personnel; the implementation of, and continued compliance with, electronic health records’ regulations; confidentiality, maintenance and security issues associated with health-related information and patient medical records; the screening, stabilization and transfer of patients who have emergency medical conditions; certification, licensure and accreditation of our facilities; operating policies and procedures, and; construction or expansion of facilities and services.
If our operators fail to comply with applicable laws and regulations, they could be subjected to liabilities, including criminal penalties, civil penalties (including the loss of their licenses to operate one or more facilities), and exclusion of one or more facilities from participation in the Medicare, Medicaid and other federal and state health care programs. The imposition of such penalties could jeopardize that operator’s ability to make lease or mortgage payments to us or to continue operating its facility. In addition, our bonus rents are based on net revenues of the UHS hospital facilities, which in turn are affected by the amount of reimbursement that such lessees receive from the government.
Although UHS and the other operators of our acute care facilities believe that their policies, procedures and practices comply with governmental regulations, no assurance can be given that they will not be subjected to governmental inquiries or actions, or that they would not be faced with sanctions, fines or penalties if so subjected. Because many of these laws and regulations are relatively new, in many cases, our operators don’t have the benefit of regulatory or judicial interpretation. In the future, it is possible that different interpretations or enforcement of these laws and regulations could subject their current or past practices to allegations of impropriety or illegality or could require them to make changes in the facilities, equipment, personnel, services, capital expenditure
11
programs and operating expenses. Even if they were to ultimately prevail, a significant governmental inquiry or action under one of the above laws, regulations or rules could have a material adverse effect upon them, and in turn, us.
A worsening of the economic and employment conditions in the United States could materially affect our business and future results of operations of the operators of our facilities which could, in turn, materially reduce our revenues and net income.
Our future results of operations could be unfavorably impacted by deterioration in general economic conditions which could result in increases in the number of people unemployed and/or uninsured. Our operators’ patient volumes, revenues and financial results depend significantly on the universe of patients with health insurance, which to a large extent is dependent on the employment status of individuals in certain markets. A worsening of economic conditions may result in a higher unemployment rate which will likely increase the number of individuals without health insurance. As a result, the operators of our facilities may experience a decrease in patient volumes. Should that occur, it may result in decreased occupancy rates at our medical office buildings as well as a reduction in the revenues earned by the operators of our hospital facilities which would unfavorably impact our future bonus rentals (on the UHS hospital facilities) and may potentially have a negative impact on the future lease renewal terms and the underlying value of the hospital properties.
U.S. federal tax reform legislation now and in the future could affect REITs, both positively and negatively, in ways that are difficult to anticipate.
The Tax Cuts and Jobs Act of 2017 (the “2017 Tax Act”), signed into law on December 22, 2017, represents sweeping tax reform legislation that makes significant changes to corporate and individual tax rates and the calculation of taxes. While we currently do not expect the 2017 Tax Act will have a significant direct impact on us, it may impact us indirectly as our tenants and the jurisdictions in which we do business as well as the overall investment thesis for REITs may be impacted both positively and negatively in ways that are difficult to predict. Additionally, the overall impact of the 2017 Tax Act depends on future interpretations and regulations that may be issued by federal tax authorities, as well as changes in state and local taxation in response to the 2017 Tax Act, and it is possible that such future interpretations, regulations and other changes could adversely impact us.
The deterioration of credit and capital markets may adversely affect our access to sources of funding and we cannot be certain of the availability and terms of capital to fund the growth of our business when needed.
To retain our status as a REIT, we are required to distribute 90% of our taxable income to shareholders and, therefore, we generally cannot use income from operations to fund our growth. Accordingly, our growth strategy depends, in part, upon our ability to raise additional capital at reasonable costs to fund new investments. We believe we will be able to raise additional debt and equity capital at reasonable costs to refinance our debts (including third-party debt held by various LLCs in which we own non-controlling equity interests) at or prior to their maturities and to invest at yields which exceed our cost of capital. We can provide no assurance that financing will be available to us on satisfactory terms when needed, which could harm our business. Given these uncertainties, our growth strategy is not assured and may fail.
To fund all or a portion of our future financing needs, we rely on borrowings from various sources including fixed rate, long-term debt as well as borrowings pursuant to our revolving credit agreement. If any of the lenders were unable to fulfill their future commitments, our liquidity could be impacted, which could have a material unfavorable impact on our results of operations and financial condition.
In addition, the degree to which we are, or in the future may become, leveraged, our ability to obtain financing could be adversely impacted and could make us more vulnerable to competitive pressures. Our ability to meet existing and future debt obligations depends upon our future performance and our ability to secure additional financing on satisfactory terms, each of which is subject to financial, business and other factors that are beyond our control. Any failure by us to meet our financial obligations would harm our business.
In the event we need to access the capital markets or other sources of financing, there can be no assurance that we will be able to obtain financing on acceptable terms or within an acceptable time. Our inability to obtain financing on terms acceptable to us could have a material unfavorable impact on our results of operations, financial condition and liquidity.
A substantial portion of our revenues are dependent upon one operator. If UHS experiences financial difficulties, or otherwise fails to make payments to us, or elects not to renew the leases on our three acute care hospitals, our revenues could be materially reduced.
For the year ended December 31, 2017, lease payments from UHS comprised approximately 32% of our consolidated revenues. In addition, as of December 31, 2017, subsidiaries of UHS leased three of the six hospital facilities owned by us with terms expiring in
12
2021. We cannot assure you that UHS will continue to satisfy its obligations to us or renew existing leases upon their scheduled maturity. In addition, if subsidiaries of UHS exercise their options to purchase the respective three leased hospitals, or two leased FEDs, upon expiration of the lease terms, our future revenues could decrease if we were unable to earn a favorable rate of return on the sale proceeds received, as compared to the rental revenue currently earned pursuant to the leases on the facilities. The failure or inability of UHS to satisfy its obligations to us, or should UHS elect not to renew the leases on the three acute care hospitals or two FEDs, our revenues and net income could be materially reduced, which could in turn reduce the amount of dividends we pay and cause our stock price to decline.
Our relationship with UHS may create conflicts of interest.
In addition to being dependent upon UHS for a substantial portion of our revenues and leases, since 1986, UHS of Delaware, Inc. (the “Advisor”), a wholly-owned subsidiary of UHS, has served as our Advisor. Pursuant to our Advisory Agreement, the Advisor is obligated to present an investment program to us, to use its best efforts to obtain investments suitable for such program (although it is not obligated to present any particular investment opportunity to us), to provide administrative services to us and to conduct our day-to-day affairs. Further, all of our officers are employees of the Advisor. As of December 31, 2017, we had no salaried employees although our officers do typically receive annual stock-based compensation awards in the form of restricted stock. In special circumstances, if warranted and deemed appropriate by the Compensation Committee of the Board of Trustees, our officers may also receive one-time compensation awards in the form of restricted stock and/or cash bonuses. We believe that the quality and depth of the management and advisory services provided to us by our Advisor and UHS could not be replicated by contracting with unrelated third parties or by being self-advised without considerable cost increases. We believe that these relationships have been beneficial to us in the past, but we cannot guarantee that they will not become detrimental to us in the future.
All transactions with UHS must be approved by a majority of our Independent Trustees. Because of our historical and continuing relationship with UHS and its subsidiaries, in the future, our business dealings may not be on the same or as favorable terms as we might achieve with a third party with whom we do not have such a relationship. Disputes may arise between us and UHS that we are unable to resolve or the resolution of these disputes may not be as favorable to us as a resolution we might achieve with a third party.
UHS and its subsidiaries, are subject to pending legal actions, purported stockholder class actions, governmental investigations and regulatory actions.
UHS and its subsidiaries are subject to pending legal actions, purported shareholder class actions, governmental investigations and regulatory actions. Since UHS comprised approximately 32%, 33% and 33% of our consolidated revenues for the years ended December 31, 2017, 2016 and 2015, respectively, and since a subsidiary of UHS is our Advisor, you are encouraged to obtain and review the disclosures contained in the Legal Proceedings section of Universal Health Services, Inc.’s Forms 10-K and 10-Q, as publicly filed with the Securities and Exchange Commission. These filings are the sole responsibility of UHS and are not incorporated by reference herein
Defending itself against the allegations in the lawsuits and governmental investigations, or similar matters and any related publicity, could potentially entail significant costs and could require significant attention from UHS management. UHS has stated that it is unable to predict the outcome of these matters or to reasonably estimate the amount or range of any such loss; however, the outcome of these lawsuits, investigations and other actions could have a material adverse effect on their business, financial condition, results of operations and/or cash flows.
UHS is and may become subject to other loss contingencies, both known and unknown, which may relate to past, present and future facts, events, circumstances and occurrences. Should an unfavorable outcome occur in some or all of the legal proceedings or other loss contingencies, or if successful claims and other actions are brought against UHS in the future, there could be a material adverse impact on their financial position, results of operations and liquidity, which in turn could have a material adverse effect on us.
In particular, government investigations, as well as qui tam lawsuits, may lead to material fines, penalties, damages payments or other sanctions, including exclusion from government healthcare programs. Settlements of lawsuits involving Medicare and Medicaid issues routinely require both monetary payments and corporate integrity agreements, each of which could have a material adverse effect on UHS’s business, financial condition, results of operations and/or cash flows, which in turn could have a material adverse effect on us.
We hold non-controlling equity ownership interests in various joint-ventures.
For the year ended December 31, 2017, 13% of our consolidated and unconsolidated revenues were generated by four jointly-owned LLCs/LPs in which we hold non-controlling equity ownership interests ranging from 33% to 95%. Our level of investment and lack of control exposes us to potential losses of our investments and revenues. Although our ownership arrangements have been beneficial to us in the past, we cannot guarantee that they will continue to be beneficial in the future.
13
Pursuant to the operating and/or partnership agreements of the four LLCs/LPs in which we continue to hold non-controlling ownership interests, the third-party member and the Trust, at any time, potentially subject to certain conditions, have the right to make an offer (“Offering Member”) to the other member(s) (“Non-Offering Member”) in which it either agrees to: (i) sell the entire ownership interest of the Offering Member to the Non-Offering Member (“Offer to Sell”) at a price as determined by the Offering Member (“Transfer Price”), or; (ii) purchase the entire ownership interest of the Non-Offering Member (“Offer to Purchase”) at the equivalent proportionate Transfer Price. The Non-Offering Member has 60 to 90 days to either: (i) purchase the entire ownership interest of the Offering Member at the Transfer Price, or; (ii) sell its entire ownership interest to the Offering Member at the equivalent proportionate Transfer Price. The closing of the transfer must occur within 60 to 90 days of the acceptance by the Non-Offering Member.
In addition to the above-mentioned rights of the third-party members, from time to time, we have had discussions with third-party members about purchasing or selling the interests or the underlying property to each other or a third party. If we were to sell our interests or underlying property, we may not be able to redeploy the proceeds into assets at the same or greater return as we currently receive. During any such time that we were not able to do so, our ability to increase or maintain our dividend at current levels could be adversely affected which could cause our stock price to decline.
The bankruptcy, default, insolvency or financial deterioration of our tenants could significantly delay our ability to collect unpaid rents or require us to find new operators.
Our financial position and our ability to make distributions to our shareholders may be adversely affected by financial difficulties experienced by any of our major tenants, including bankruptcy, insolvency or a general downturn in the business. We are exposed to the risk that our operators may not be able to meet their obligations, which may result in their bankruptcy or insolvency. Although our leases and loans provide us the right to terminate an investment, evict an operator, demand immediate repayment and other remedies, the bankruptcy laws afford certain rights to a party that has filed for bankruptcy or reorganization. An operator in bankruptcy may be able to restrict our ability to collect unpaid rents or interest during the bankruptcy proceeding.
Required regulatory approvals can delay or prohibit transfers of our healthcare facilities.
Transfers of healthcare facilities to successor tenants or operators may be subject to regulatory approvals or ratifications, including, but not limited to, change of ownership approvals under certificate of need laws and Medicare and Medicaid provider arrangements that are not required for transfers of other types of commercial operations and other types of real estate. The replacement of any tenant or operator could be delayed by the regulatory approval process of any federal, state or local government agency necessary for the transfer of the facility or the replacement of the operator licensed to manage the facility. If we are unable to find a suitable replacement tenant or operator upon favorable terms, or at all, we may take possession of a facility, which might expose us to successor liability or require us to indemnify subsequent operators to whom we might transfer the operating rights and licenses, all of which may materially adversely affect our business, results of operations, and financial condition.
Real estate ownership creates risks and liabilities that may result in unanticipated losses or expenses.
Our business is subject to risks associated with real estate acquisitions and ownership, including:
|
|
• |
general liability, property and casualty losses, some of which may be uninsured; |
|
|
• |
the illiquid nature of real estate and the real estate market that impairs our ability to purchase or sell our assets rapidly to respond to changing economic conditions; |
|
|
• |
real estate market factors, such as the supply and demand of office space and market rental rates, changes in interest rates as well as an increase in the development of medical office condominiums in certain markets; |
|
|
• |
costs that may be incurred relating to maintenance and repair, and the need to make expenditures due to changes in governmental regulations, including the Americans with Disabilities Act; |
|
|
• |
environmental hazards at our properties for which we may be liable, including those created by prior owners or occupants, existing tenants, mortgagors or other persons, and; |
|
|
• |
defaults and bankruptcies by our tenants. |
In addition to the foregoing risks, we cannot predict whether the leases on our properties, including the leases on the hospitals leased to subsidiaries of UHS, which have options to purchase the respective leased facilities at the end of the lease or renewal terms at the appraised fair market value, will be renewed at their current rates or fair market value lease rates at the end of the lease terms in 2021. If the leases are not renewed, we may be required to find other operators for these hospitals and/or enter into leases with less favorable terms. The exercise of purchase options for our hospitals may result in a less favorable rate of return for us than the rental
14
revenue currently earned on such facilities. Further, the purchase options and rights of first refusal granted to the respective lessees to purchase or lease the respective leased hospitals, after the expiration of the lease term, may adversely affect our ability to sell or lease a hospital, and may present a potential conflict of interest between us and UHS since the price and terms offered by a third-party are likely to be dependent, in part, upon the financial performance of the facility during the final years of the lease term.
Significant potential liabilities and rising insurance costs and availability may have an adverse effect on the operations of our operators, which may negatively impact their ability to meet their obligations to us.
As is typical in the healthcare industry, in the ordinary course of business, our operators, including UHS, are subject to medical malpractice lawsuits, product liability lawsuits, class action lawsuits and other legal actions. Some of these actions may involve large claims, as well as significant defense costs. If their ultimate liability for professional and general liability claims could change materially from current estimates, if such policy limitations should be partially or fully exhausted in the future, or payments of claims exceed estimates or are not covered by insurance, it could have a material adverse effect on the operations of our operators and, in turn, us.
Property insurance rates, particularly for earthquake insurance in California, have also continued to increase. Our tenants and operators, including UHS, may be unable to fulfill their insurance, indemnification and other obligations to us under their leases and mortgages and thereby potentially expose us to those risks. In addition, our tenants and operators may be unable to pay their lease or mortgage payments, which could potentially decrease our revenues and increase our collection and litigation costs. Moreover, to the extent we are required to foreclose on the affected facilities, our revenues from those facilities could be reduced or eliminated for an extended period of time. In addition, we may in some circumstances be named as a defendant in litigation involving the actions of our operators. Although we have no involvement in the activities of our operators and our standard leases generally require our operators to carry insurance to cover us in certain cases, a significant judgment against us in such litigation could exceed our and our operators’ insurance coverage, which would require us to make payments to cover the judgment.
If we fail to maintain our REIT status, we will become subject to federal income tax on our taxable income at regular corporate rates.
In order to qualify as a REIT, we must comply with certain highly technical and complex Internal Revenue Code provisions. Although we believe we have been qualified as a REIT since our inception, there can be no assurance that we have been so qualified or will remain qualified in the future. Failure to qualify as a REIT may subject us to income tax liabilities, including federal income tax at regular corporate rates. The additional income tax incurred may significantly reduce the cash flow available for distribution to shareholders and for debt service. In addition, if disqualified, we might be barred from qualification as a REIT for four years following disqualification. Also, if disqualified, we will not be allowed a deduction for distributions to stockholders in computing our taxable income and we could be subject to increased state and local income taxes.
Even if we remain qualified as a REIT, we may face other tax liabilities that reduce our cash flow.
Even if we remain qualified for taxation as a REIT, we may be subject to certain federal, state and local taxes on our income and assets, including taxes on any undistributed income, tax on income from some activities conducted as a result of a foreclosure, and state or local income, property and transfer taxes. Any of these taxes would decrease cash available for the payment of our debt obligations.
Dividends paid by REITs generally do not qualify for reduced tax rates.
In general, dividends (qualified) paid by a U.S. corporation to individual U.S. shareholders are subject to Federal income tax at a maximum rate of 20% for 2017 and 2018 (subject to certain additional taxes for certain taxpayers). In contrast, since we are a REIT, our distributions to individual U.S. shareholders are not eligible for the reduced rates which apply to distributions from regular corporations, and thus may be subject to Federal income tax at a rate as high as 39.6% for 2017 and 37% for 2018 (subject to certain additional taxes for certain taxpayers).
Should we be unable to comply with the strict income distribution requirements applicable to REITs utilizing only cash generated by operating activities, we would be required to generate cash from other sources which could adversely affect our financial condition.
To obtain the favorable tax treatment associated with qualifying as a REIT, in general, we are required each year to distribute to our shareholders at least 90% of our net taxable income. In addition, we are subject to a tax on any undistributed portion of our income at regular corporate rates and might also be subject to a 4% excise tax on this undistributed income. To meet the distribution requirements necessary to achieve the tax benefits associated with qualifying as a REIT, we could be required to: (i) seek borrowed
15
funds even if conditions are not favorable for borrowing; (ii) issue equity which could have a dilutive effect on the future dividends and share value of our existing shareholders, and/or; (iii) divest assets that we might have otherwise decided to retain. Securing funds through these other non-operating means could adversely affect our financial condition and future results of operations.
Complying with REIT requirements may cause us to forego otherwise attractive opportunities.
To qualify as a REIT for federal income tax purposes, we continually must satisfy tests concerning, among other things, the sources of our income, the nature and diversification of our assets, the amounts we distribute to our stockholders and the ownership of our stock. We may be unable to pursue investments that would be otherwise advantageous to us in order to satisfy the source-of-income, asset-diversification or distribution requirements for qualifying as a REIT. Thus, compliance with the REIT requirements may hinder our ability to make certain attractive investments.
The market value of our common stock could be substantially affected by various factors.
Many factors, certain of which are outside of our control, could have an adverse effect on the share price of our common stock. These factors include certain of the risks discussed herein, our financial condition, performance and prospects, the market for similar securities issued by REITs, demographic changes, operating results of our operators and other hospital companies, changes in our financial estimates or recommendations of securities analysts, speculation in the press or investment community, the possible effects of war, terrorist and other hostilities, adverse weather conditions, the level of seasonal illnesses, changes in general conditions in the economy, financial markets or overall interest rate environment, or other developments affecting the health care industry.
When interest rates increase, our common stock may decline in price.
Our common stock, like other dividend stocks, is sensitive to changes in market interest rates. In response to changing interest rates the price of our common stock may behave like a long-term fixed-income security and, compared to shorter-term instruments, may have more volatility. A wide variety of market factors can cause interest rates to rise, including central bank monetary policy, an uptick in inflation and changes in general economic conditions. The risks associated with increasing rates are intensified given that interest rates have been near historic lows but may be expected to increase in the future, with unpredictable effects on the markets and on the price of our common stock. Consequential effects of a general rise in interest rates may hamper our access to capital markets, affect the liquidity of our underlying investments in real estate, and, by extension, limit management’s effective range of responses to changing tenant circumstances or in answer to investment opportunities. Limited operational alternatives may further hinder our ability to maintain or increase our dividend, and the market price of our common stock may experience further declines as the result.
Ownership limitations and anti-takeover provisions in our declaration of trust and bylaws and under Maryland law and in our leases with UHS may delay, defer or prevent a change in control or other transactions that could provide shareholders with a take-over premium. We are subject to significant anti-takeover provisions.
In order to protect us against the risk of losing our REIT status for federal income tax purposes, our declaration of trust permits our Trustees to redeem shares acquired or held in excess of 9.8% of the issued and outstanding shares of our voting stock and, which in the opinion of the Trustees, would jeopardize our REIT status. In addition, any acquisition of our common or preferred shares that would result in our disqualification as a REIT is null and void. The right of redemption may have the effect of delaying, deferring or preventing a change in control of our company and could adversely affect our shareholders’ ability to realize a premium over the market price for the shares of our common stock.
Our declaration of trust authorizes our Board of Trustees to issue additional shares of common and preferred stock and to establish the preferences, rights and other terms of any series of preferred stock that we issue. Although our Board of Trustees has no intention to do so at the present time, it could establish a series of preferred stock that could delay, defer or prevent a transaction or a change in control that might involve the payment of a premium over the market price for our common stock or otherwise be in the best interests of our shareholders.
The Master Lease Documents by and among us and certain subsidiaries of UHS, which governs the three acute care hospital properties and the freestanding emergency departments leased to subsidiaries of UHS, includes a change of control provision. The change of control provision grants UHS the right, upon one month’s notice should a change of control of the Trust occur, to purchase any or all of the leased hospital properties at their appraised fair market values. The exercise of this purchase option may result in a less favorable rate of return earned on the sales proceeds received than the rental revenue currently earned on such facilities.
These provisions could discourage unsolicited acquisition proposals or make it more difficult for a third-party to gain control of us, which could adversely affect the market price of our securities and prevent shareholders from receiving a take-over premium.
16
We depend heavily on key management personnel and the departure of one or more of our key executives or a significant portion of our operators’ local hospital management personnel could harm our business.
The expertise and efforts of our senior executives and key members of our operators’ local hospital management personnel are critical to the success of our business. The loss of the services of one or more of our senior executives or of a significant portion of our operators’ local hospital management personnel could significantly undermine our management expertise and our operators’ ability to provide efficient, quality health care services at our facilities, which could harm their business, and in turn, harm our business.
Increasing investor interest in our sector and consolidation at the operator or REIT level could increase competition and reduce our profitability.
Our business is highly competitive and we expect that it may become more competitive in the future. We compete for the acquisition, leasing and financing of health care related facilities. Our competitors include, but are not limited to, other REITs, banks and other companies, including UHS, some of which are larger and may have a lower cost of capital than we do. These developments could result in fewer investment opportunities for us and lower spreads over our cost of our capital, which would hurt our growth. Increased competition makes it more challenging for us to identify and successfully capitalize on opportunities that meet our business goals and could improve the bargaining power of property owners seeking to sell, thereby impeding our investment, acquisition and development activities. If we cannot capitalize on our development pipeline, identify and purchase a sufficient quantity of healthcare facilities at favorable prices or if we are unable to finance acquisitions on commercially favorable terms, our business, results of operations and financial condition may be materially adversely affected.
We may be required to incur substantial renovation costs to make certain of our healthcare properties suitable for other operators and tenants.
Healthcare facilities are typically highly customized and may not be easily adapted to non-healthcare-related uses. The improvements generally required to conform a property to healthcare use, such as upgrading electrical, gas and plumbing infrastructure, are costly and at times tenant-specific. A new or replacement operator or tenant may require different features in a property, depending on that operator’s or tenant’s particular operations. If a current operator or tenant is unable to pay rent and vacates a property, we may incur substantial expenditures to modify a property before we are able to secure another operator or tenant. Also, if the property needs to be renovated to accommodate multiple operators or tenants, we may incur substantial expenditures before we are able to re-lease the space. These expenditures or renovations may materially adversely affect our business, results of operations and financial condition.
We are subject to significant corporate regulation as a public company and failure to comply with all applicable regulations could subject us to liability or negatively affect our stock price.
As a publicly traded company, we are subject to a significant body of regulation, including the Sarbanes-Oxley Act of 2002. While we have developed and instituted a corporate compliance program based on what we believe are the current best practices in corporate governance and continue to update this program in response to newly implemented or changing regulatory requirements, we cannot provide assurance that we are or will be in compliance with all potentially applicable corporate regulations. For example, we cannot provide assurance that in the future our management will not find a material weakness in connection with its annual review of our internal control over financial reporting pursuant to Section 404 of the Sarbanes-Oxley Act. We also cannot provide assurance that we could correct any such weakness to allow our management to assess the effectiveness of our internal control over financial reporting as of the end of our fiscal year in time to enable our independent registered public accounting firm to state that we have maintained effective internal control over financial reporting as of the end of our fiscal year. If we fail to comply with any of these regulations, we could be subject to a range of regulatory actions, fines or other sanctions or litigation. If we must disclose any material weakness in our internal control over financial reporting, our stock price could decline.
A cyber security incident could cause a violation of HIPAA, breach of member privacy, or other negative impacts.
We and UHS rely extensively on our information technology (“IT”) systems to manage clinical and financial data, communicate with our patients, payors, vendors and other third parties and summarize and analyze operating results. In addition, UHS has made significant investments in technology to adopt and utilize electronic health records and to become a meaningful user of health information technology pursuant to the American Recovery and Reinvestment Act of 2009. A cyber-attack that bypasses our IT security systems causing an IT security breach, loss of protected health information or other data subject to privacy laws, loss of proprietary business information, or a material disruption of our IT business systems, could have a material adverse impact on our business and result of operations. In addition, our future results of operations, as well as our reputation, could be adversely impacted by theft, destruction, loss, or misappropriation of public health information, other confidential data or proprietary business information.
17
Different interpretations of accounting principles could have a material adverse effect on our results of operations or financial condition.
Generally accepted accounting principles are complex, continually evolving and may be subject to varied interpretation by us, our independent registered public accounting firm and the SEC. Such varied interpretations could result from differing views related to specific facts and circumstances. Differences in interpretation of generally accepted accounting principles could have a material adverse effect on our financial position or results of operations.
None.
18
The following table shows our investments in hospital facilities leased to UHS and other non-related parties and also provides information related to various properties in which we have significant investments, some of which are accounted for by the equity method. The capacity in terms of beds (for the hospital facilities) and the five-year occupancy levels are based on information provided by the lessees.
|
|
|
|
|
|
|
|
|
|
|
|
|
|
|
|
|
|
|
|
|
|
|
|
|
|
|
|
|
Lease Term |
|
|
|
|
|
|
|
|
|
|||||||
|
|
|
|
|
Number |
|
|
|
|
|
|
|
|
|
|
|
|
|
|
|
|
|
|
|
|
|
|
|
|
|
|
End of |
|
|
|
|
|
% of RSF |
|
|
|
|
|
||
|
|
|
|
|
of |
|
|
|
|
|
|
|
|
|
|
|
|
|
|
|
|
|
|
|
|
|
|
|
|
|
|
initial |
|
|
|
|
|
under |
|
|
|
|
|
||
|
|
|
|
|
available |
|
|
Average Occupancy(1) |
|
|
|
|
|
|
or |
|
Renewal |
|
|
lease with |
|
|
Range of |
|
|||||||||||||||||||||
|
Hospital Facility Name and |
|
Type of |
|
beds @ |
|
|
|
|
|
Minimum |
|
|
renewed |
|
term |
|
|
guaranteed |
|
|
guaranteed |
|
||||||||||||||||||||||
|
Location |
|
facility |
|
12/31/2017 |
|
|
2017 |
|
|
2016 |
|
|
2015 |
|
|
2014 |
|
|
2013 |
|
|
rent(5) |
|
|
term |
|
(years) |
|
|
escalators |
|
|
escalation |
|
||||||||||
|
Southwest Healthcare System: Inland Valley Campus(2)(5)(7) Wildomar, California |
|
Acute Care |
|
|
130 |
|
|
|
62 |
% |
|
|
64 |
% |
|
|
63 |
% |
|
|
59 |
% |
|
|
58 |
% |
|
$ |
2,648,000 |
|
|
2021 |
|
|
10 |
|
|
|
0 |
% |
|
|
— |
|
|
McAllen Medical Center(3)(5)(7) McAllen, Texas |
|
Acute Care |
|
|
370 |
|
|
|
45 |
% |
|
|
47 |
% |
|
|
48 |
% |
|
|
44 |
% |
|
|
43 |
% |
|
|
5,485,000 |
|
|
2021 |
|
|
10 |
|
|
|
0 |
% |
|
|
— |
|
|
Wellington Regional Medical Center(4)(5)(7) West Palm Beach, Florida |
|
Acute Care |
|
|
153 |
|
|
|
57 |
% |
|
|
55 |
% |
|
|
56 |
% |
|
|
59 |
% |
|
|
58 |
% |
|
|
3,030,000 |
|
|
2021 |
|
|
10 |
|
|
|
0 |
% |
|
|
— |
|
|
HealthSouth Deaconess Rehab. Hospital(8) Evansville, Indiana |
|
Rehabilitation |
|
|
85 |
|
|
|
73 |
% |
|
|
75 |
% |
|
|
80 |
% |
|
|
80 |
% |
|
|
79 |
% |
|
|
714,000 |
|
|
2019 |
|
|
5 |
|
|
|
0 |
% |
|
|
— |
|
|
Vibra Hospital of Corpus Christi Corpus Christi, Texas |
|
Sub- Acute Care |
|
|
74 |
|
|
|
50 |
% |
|
|
51 |
% |
|
|
56 |
% |
|
|
58 |
% |
|
|
58 |
% |
|
|
738,000 |
|
|
2019 |
|
|
25 |
|
|
|
100 |
% |
|
|
3 |
% |
|
Kindred Hospital Chicago Central(10) Chicago, Illinois |
|
Sub- Acute Care |
|
|
84 |
|
|
|
39 |
% |
|
|
46 |
% |
|
|
52 |
% |
|
|
54 |
% |
|
|
51 |
% |
|
|
1,513,000 |
|
|
2021 |
|
|
— |
|
|
|
0 |
% |
|
|
— |
|
|
|
|
|
|
|
|
|
|
|
|
|
|
|
|
|
|
|
|
|
|
|
|
|
|
Lease Term |
|
|
|
|
|
|
||||||
|
|
|
|
|
|
|
|
|
|
|
|
|
|
|
|
|
|
|
|
|
|
|
|
|
|
|
|
|
End of |
|
|
|
% of RSF |
|
|
|
|
|
|
|
|
|
|
|
|
|
|
|
|
|
|
|
|
|
|
|
|
|
|
|
|
|
|
|
|
|
initial |
|
|
|
under |
|
|
|
|
|
|
|
Type |
|
Average Occupancy(1) |
|
|
|
|
|
|
or |
|
Renewal |
|
lease with |
|
|
Range of |
||||||||||||||||||
|
|
|
of |
|
|
|
|
|
|
|
|
|
|
|
|
|
|
|
|
|
|
|
|
|
Minimum |
|
|
renewed |
|
term |
|
guaranteed |
|
|
guaranteed |
||
|
Facility Name and Location |
|
facility |
|
2017 |
|
|
2016 |
|
|
2015 |
|
|
2014 |
|
|
2013 |
|
|
rent(5) |
|
|
term |
|
(years) |
|
escalators |
|
|
escalation |
|||||||
|
Spring Valley MOB I(5) Las Vegas, Nevada |
|
MOB |
|
|
72 |
% |
|
|
72 |
% |
|
|
61 |
% |
|
|
60 |
% |
|
|
64 |
% |
|
$ |
710,000 |
|
|
2018-2028 |
|
Various |
|
|
100 |
% |
|
3% |
|
Spring Valley MOB II(5) Las Vegas, Nevada |
|
MOB |
|
|
85 |
% |
|
|
85 |
% |
|
|
84 |
% |
|
|
77 |
% |
|
|
76 |
% |
|
|
786,000 |
|
|
2018-2022 |
|
Various |
|
|
42 |
% |
|
1%-3% |
|
Summerlin Hospital MOB I(5) Las Vegas, Nevada |
|
MOB |
|
|
65 |
% |
|
|
64 |
% |
|
|
62 |
% |
|
|
66 |
% |
|
|
77 |
% |
|
|
1,140,000 |
|
|
2018-2028 |
|
Various |
|
|
96 |
% |
|
2%-3% |
|
Summerlin Hospital MOB II(5) Las Vegas, Nevada |
|
MOB |
|
|
80 |
% |
|
|
78 |
% |
|
|
74 |
% |
|
|
78 |
% |
|
|
74 |
% |
|
|
1,525,000 |
|
|
2018-2023 |
|
Various |
|
|
89 |
% |
|
2%-5% |
|
Summerlin Hospital MOB III(5) Las Vegas, Nevada |
|
MOB |
|
|
100 |
% |
|
|
100 |
% |
|
|
100 |
% |
|
|
90 |
% |
|
|
81 |
% |
|
|
1,961,000 |
|
|
2018-2024 |
|
Various |
|
|
82 |
% |
|
2%-3% |
|
Rosenberg Children’s Medical Plaza Phoenix, Arizona |
|
MOB |
|
|
99 |
% |
|
|
99 |
% |
|
|
99 |
% |
|
|
99 |
% |
|
|
99 |
% |
|
|
1,165,000 |
|
|
2018-2026 |
|
Various |
|
|
59 |
% |
|
3% |
|
Centennial Hills MOB(5) Las Vegas, Nevada |
|
MOB |
|
|
75 |
% |
|
|
73 |
% |
|
|
73 |
% |
|
|
71 |
% |
|
|
62 |
% |
|
|
1,508,000 |
|
|
2018-2024 |
|
Various |
|
|
62 |
% |
|
2%-3% |
|
PeaceHealth Medical Clinic Bellingham, Washington |
|
MOB |
|
|
100 |
% |
|
|
100 |
% |
|
|
100 |
% |
|
|
100 |
% |
|
|
100 |
% |
|
|
2,570,000 |
|
|
2021 |
|
20 |
|
|
100 |
% |
|
1% |
|
Lake Pointe Medical Arts Building Rowlett, Texas |
|
MOB |
|
|
100 |
% |
|
|
100 |
% |
|
|
100 |
% |
|
|
100 |
% |
|
|
97 |
% |
|
|
973,000 |
|
|
2018-2023 |
|
Various |
|
|
57 |
% |
|
3% |
|
Chandler Corporate Center III(10) Chandler, Arizona |
|
MOB |
|
|
92 |
% |
|
|
92 |
% |
|
|
- |
|
|
|
- |
|
|
|
- |
|
|
|
1,255,000 |
|
|
2027 |
|
Various |
|
|
100 |
% |
|
2% |
|
Frederick Crestwood MOB(10) Frederick, Maryland |
|
MOB |
|
|
100 |
% |
|
|
100 |
% |
|
|
- |
|
|
|
- |
|
|
|
- |
|
|
|
1,696,000 |
|
|
2026-2030 |
|
Various |
|
|
100 |
% |
|
3% |
|
2704 North Tenaya Way(10) Las Vegas, Nevada |
|
MOB |
|
|
100 |
% |
|
|
100 |
% |
|
|
- |
|
|
|
- |
|
|
|
- |
|
|
|
1,123,000 |
|
|
2023 |
|
18 |
|
|
100 |
% |
|
3% |
|
Mid Coast Hospital MOB Brunswick, Maine |
|
MOB |
|
|
100 |
% |
|
|
100 |
% |
|
|
100 |
% |
|
|
100 |
% |
|
|
100 |
% |
|
|
1,471,000 |
|
|
2018-2026 |
|
Various |
|
|
100 |
% |
|
2% |
|
Texoma Medical Plaza Denison, Texas |
|
MOB |
|
|
100 |
% |
|
|
100 |
% |
|
|
98 |
% |
|
|
87 |
% |
|
|
76 |
% |
|
|
1,668,000 |
|
|
2018-2027 |
|
Various |
|
|
39 |
% |
|
3% |
|
(1) |
Average occupancy rate for the hospital facilities is based on the average number of available beds occupied during each of the five years ended December 31, 2017. Average available beds is the number of beds which are actually in service at any given time for immediate patient use with the necessary equipment and staff available for patient care. A hospital may have appropriate licenses for more beds than are in service for a number of reasons, including lack of demand, incomplete construction and anticipation of future needs. The average occupancy rate of a hospital is affected by a number of factors, including the number of physicians using the hospital, changes in the number of beds, the composition and size of the population of the community in which the hospital is located, general and local economic conditions, variations in local medical and surgical practices and the degree of outpatient use of the hospital services. Average occupancy rate for the multi-tenant medical office buildings is based on the occupied square footage of each building, including any applicable master leases. |
19
|
(2) |
In July, 2002, the operations of Inland Valley Regional Medical Center (“Inland Valley”) were merged with the operations of Rancho Springs Medical Center (“Rancho Springs”), an acute care hospital located in California and also operated by UHS, the real estate assets of which are not owned by us. Inland Valley, our lessee, was merged into Universal Health Services of Rancho Springs, Inc. The merged entity is now doing business as Southwest Healthcare System (“Southwest Healthcare”). As a result of merging the operations of the two facilities, the revenues of Southwest Healthcare include the revenues of both Inland Valley and Rancho Springs. Although we do not own the real estate assets of the Rancho Springs facility, Southwest Healthcare became the lessee on the lease relating to the real estate assets of the Inland Valley facility. Since the bonus rent calculation for the Inland Valley campus is based on net revenues and the financial results of the two facilities are no longer separable, the lease was amended during 2002 to exclude from the bonus rent calculation the estimated net revenues generated at the Rancho Springs campus (as calculated pursuant to a percentage based allocation determined at the time of the merger). No assurance can be given as to the effect, if any, the merger of Inland Valley and Rancho Springs had on the underlying value of Inland Valley. Base rental commitments and the guarantee by UHS under the original lease continue for the remainder of the lease term. The average occupancy rates shown for this facility for all years were based on the combined number of beds occupied at the Inland Valley and Rancho Springs campuses. |
|
(3) |
During the first quarter of 2001, UHS purchased the assets and operations of the 60-bed McAllen Heart Hospital located in McAllen, Texas. Upon acquisition by UHS, the Heart Hospital began operating under the same license as McAllen Medical Center (which has 370 available beds as of December 31, 2017). The net revenues of the combined operations included revenues generated by the Heart Hospital, the real property of which is not owned by us. Accordingly, the McAllen Medical Center lease was amended during 2001 to exclude from the bonus rent calculation, the estimated net revenues generated at the Heart Hospital (as calculated pursuant to a percentage based allocation determined at the time of the merger). During 2000, UHS purchased the South Texas Behavioral Health Center, a behavioral health care facility located in McAllen, Texas. In 2006, a newly constructed, 134-bed replacement facility for the South Texas Behavioral Health Center was completed and opened. We do not own the real property of South Texas Behavioral Health Center. Upon UHS’s acquisition of the South Texas Behavioral Health Center in 2000, the facility’s license was merged into the operating license of McAllen Medical Center/McAllen Heart Hospital. There was no amendment to the McAllen Medical Center lease related to the operations of the South Texas Behavioral Health Center and its net revenues are distinct and excluded from the bonus rent calculation. In 2007, the operations of each of the above-mentioned facilities, as well as the operations of Edinburg Regional Medical Center/Children’s Hospital, a 235-bed facility located in Edinburg, Texas, were merged into one license operating as the South Texas Health System (“STHS”). The real property of Edinburg Regional Medical Center/Children’s Hospital is not owned by us and its net revenues are distinct and excluded from the bonus rent calculation. In 2015, the newly constructed South Texas ER at Weslaco and South Texas ER at Mission (Free-standing Emergency Departments (“FEDs”)) were completed and opened. These facilities also operate under the STHS license. The real property of these two FEDs was purchased by us and leased back to STHS. The average occupancy rates reflected above are based upon the combined occupancy and combined number of beds at McAllen Medical Center and McAllen Heart Hospital. No assurance can be given as to the effect, if any, the consolidation of the facilities into one operating license, as mentioned above, had on the underlying value of McAllen Medical Center. Base rental commitments and the guarantee by UHS under the original lease continue for the remainder of the lease terms. |
|
(4) |
In 2014, an 80-bed expansion was added to Wellington Regional Medical Center increasing the hospital’s total available beds from 153 to 233. Pursuant to terms of the Wellington Regional Medical Center lease, we are entitled to bonus rental on the net revenues generated from the 80-bed expansion. However, since we did not acquire the property associated with the additional 80-beds, the hospital’s base rental remained unchanged and the additional beds are not included in the number of available beds reflected above. |
|
(5) |
The real estate assets of this facility are owned by us (either directly or through an LLC in which we hold 100% of the ownership interest) and include tenants who are subsidiaries of UHS. |
|
(6) |
Minimum rent amounts contain impact of straight-line rent adjustments, if applicable. |
|
(7) |
See Note 2 to the consolidated financial statements-Relationship with UHS and Related Party Transactions, regarding UHS’s purchase option, right of first refusal and change of control purchase option related to these properties. We believe the respective fair values for each of these hospitals exceeds the respective net book values as of December 31, 2017 amounting to: $14.0 million for Southwest Healthcare System-Inland Valley Campus; $19.1 million for McAllen Medical Center, and; $13.7 million for Wellington Regional Medical Center. |
|
(8) |
The lessee of this facility has a purchase option which is exercisable, subject to certain terms and conditions, at the expiration of each lease term (current term expires in 2019). If exercised, the purchase option stipulates that the purchase price be the fair market value of the facility, subject to stipulated minimum and maximum prices. As currently being utilized, we believe the estimated current fair market value of the property is between the stipulated minimum and maximum prices. We believe the fair market value of the facility exceeds the $2.8 million net book value as of December 31, 2017. The lessee also has a first refusal to purchase right which, if applicable and subject to certain terms and conditions, grants the lessee the option to purchase the property at the same terms and conditions as an accepted third-party offer. |
|
(9) |
During the second quarter of 2016, the tenant of this facility provided the required notice to us, exercising the 5-year renewal option on the facility, extending the lease term to December, 2021 at existing lease rates. The lessee of this facility has a purchase option which is exercisable, subject to certain terms and conditions, at the expiration of each lease term. If exercised, the purchase option stipulates that the purchase price be the fair market value of the facility, subject to a stipulated minimum price. We believe the fair market value of the facility exceeds the $158,000 net book value as of December 31, 2017. The lessee also has a first refusal to purchase right which, if applicable and subject to certain terms and conditions, grants the lessee the option to purchase the property at the same terms and conditions as an accepted third-party offer. |
|
(10) |
This property was acquired during 2016. |
20
Leasing Trends at Our Significant Medical Office Buildings
During 2017, we had a total of 38 new or renewed leases related to the medical office buildings indicated above, in which we have significant investments, some of which are accounted for by the equity method. These leases comprised approximately 10% of the aggregate rentable square feet of these properties (7% related to renewed leases and 3% related to new leases). Rental rates, tenant improvement costs and rental concessions vary from property to property based upon factors such as, but not limited to, the current occupancy and age of our buildings, local overall economic conditions, proximity to hospital campuses and the vacancy rates, rental rates and capacity of our competitors in the market. The weighted-average tenant improvement costs associated with these new or renewed leases was approximately $10 per square foot during 2017. The weighted-average leasing commissions on the new and renewed leases commencing during 2017 was approximately 2% of base rental revenue over the term of the leases. The average aggregate value of the tenant concessions, generally consisting of rent abatements, provided in connection with new and renewed leases commencing during 2017 was approximately 2% of the future aggregate base rental revenue over the lease terms. Rent abatements were, or will be, recognized in our results of operations under the straight-line method over the lease term regardless of when payments are due. In connection with lease renewals executed during 2017, the weighted-average rental rates, as compared to rental rates on the expired leases, decreased by approximately 3%.
Set forth is information detailing the rentable square feet (“RSF”) associated with each of our properties as of December 31, 2017 and the percentage of RSF on which leases expire during the next five years and thereafter. For the MOBs that have scheduled lease expirations during 2018 of 10% or greater (of RSF), we have included information regarding estimated market rates relative to lease rates on the expiring leases.
21
|
|
|
|
|
|
|
|
|
|
Percentage of RSF with lease expirations |
|
||||||||||||||||||||||
|
|
|
Total RSF |
|
|
Available for Lease Jan. 1, 2018 |
|
|
2018 |
|
|
2019 |
|
|
2020 |
|
|
2021 |
|
|
2022 |
|
|
2023 and Later |
|
||||||||
|
Hospital Investments: |
|
|
|
|
|
|
|
|
|
|
|
|
|
|
|
|
|
|
|
|
|
|
|
|
|
|
|
|
|
|
|
|
|
McAllen Medical Center |
|
|
422,276 |
|
|
|
0 |
% |
|
|
0 |
% |
|
|
0 |
% |
|
|
0 |
% |
|
|
100 |
% |
|
|
0 |
% |
|
|
0 |
% |
|
Wellington Regional Medical Center |
|
|
196,489 |
|
|
|
0 |
% |
|
|
0 |
% |
|
|
0 |
% |
|
|
0 |
% |
|
|
100 |
% |
|
|
0 |
% |
|
|
0 |
% |
|
Southwest Healthcare System - Inland Valley |
|
|
164,377 |
|
|
|
0 |
% |
|
|
0 |
% |
|
|
0 |
% |
|
|
0 |
% |
|
|
100 |
% |
|
|
0 |
% |
|
|
0 |
% |
|
Kindred Hospital Chicago Central |
|
|
115,554 |
|
|
|
0 |
% |
|
|
0 |
% |
|
|
0 |
% |
|
|
0 |
% |
|
|
100 |
% |
|
|
0 |
% |
|
|
0 |
% |
|
HealthSouth Deaconess Rehab. Hospital |
|
|
77,440 |
|
|
|
0 |
% |
|
|
0 |
% |
|
|
100 |
% |
|
|
0 |
% |
|
|
0 |
% |
|
|
0 |
% |
|
|
0 |
% |
|
Vibra Hospital Corpus Christi |
|
|
69,700 |
|
|
|
0 |
% |
|
|
0 |
% |
|
|
100 |
% |
|
|
0 |
% |
|
|
0 |
% |
|
|
0 |
% |
|
|
0 |
% |
|
Sub-total Hospitals |
|
|
1,045,836 |
|
|
|
0 |
% |
|
|
0 |
% |
|
|
14 |
% |
|
|
0 |
% |
|
|
86 |
% |
|
|
0 |
% |
|
|
0 |
% |
|
|
|
|
|
|
|
|
|
|
|
|
|
|
|
|
|
|
|
|
|
|
|
|
|
|
|
|
|
|
|
|
|
|
|
Medical Office Buildings: |
|
|
|
|
|
|
|
|
|
|
|
|
|
|
|
|
|
|
|
|
|
|
|
|
|
|
|
|
|
|
|
|
|
Goldshadow - 2010 - 2020 Goldring MOB's |
|
|
74,774 |
|
|
|
33 |
% |
|
|
5 |
% |
|
|
7 |
% |
|
|
12 |
% |
|
|
14 |
% |
|
|
7 |
% |
|
|
22 |
% |
|
Goldshadow - 700 Shadow Lane MOB (a.) |
|
|
42,060 |
|
|
|
14 |
% |
|
|
38 |
% |
|
|
26 |
% |
|
|
22 |
% |
|
|
0 |
% |
|
|
0 |
% |
|
|
0 |
% |
|
Texoma Medical Plaza |
|
|
115,284 |
|
|
|
0 |
% |
|
|
6 |
% |
|
|
0 |
% |
|
|
55 |
% |
|
|
5 |
% |
|
|
14 |
% |
|
|
20 |
% |
|
St. Matthews Medical Plaza II |
|
|
103,011 |
|
|
|
0 |
% |
|
|
0 |
% |
|
|
2 |
% |
|
|
0 |
% |
|
|
11 |
% |
|
|
18 |
% |
|
|
69 |
% |
|
Desert Springs Medical Plaza (b.) |
|
|
102,579 |
|
|
|
58 |
% |
|
|
14 |
% |
|
|
8 |
% |
|
|
0 |
% |
|
|
6 |
% |
|
|
0 |
% |
|
|
14 |
% |
|
Peace Health Medical Clinic |
|
|
98,886 |
|
|
|
0 |
% |
|
|
0 |
% |
|
|
0 |
% |
|
|
0 |
% |
|
|
100 |
% |
|
|
0 |
% |
|
|
0 |
% |
|
Centennial Hills Medical Office Building |
|
|
96,573 |
|
|
|
25 |
% |
|
|
8 |
% |
|
|
5 |
% |
|
|
23 |
% |
|
|
12 |
% |
|
|
11 |
% |
|
|
16 |
% |
|
Summerlin Hospital Medical Office Building II |
|
|
92,313 |
|
|
|
20 |
% |
|
|
8 |
% |
|
|
23 |
% |
|
|
11 |
% |
|
|
29 |
% |
|
|
6 |
% |
|
|
3 |
% |
|
Summerlin Hospital Medical Office Building I |
|
|
89,636 |
|
|
|
35 |
% |
|
|
7 |
% |
|
|
17 |
% |
|
|
31 |
% |
|
|
7 |
% |
|
|
0 |
% |
|
|
3 |
% |
|
The Sparks Medical Building |
|
|
35,127 |
|
|
|
0 |
% |
|
|
6 |
% |
|
|
16 |
% |
|
|
21 |
% |
|
|
0 |
% |
|
|
33 |
% |
|
|
24 |
% |
|
Vista Medical Terrace |
|
|
50,921 |
|
|
|
56 |
% |
|
|
8 |
% |
|
|
0 |
% |
|
|
13 |
% |
|
|
0 |
% |
|
|
14 |
% |
|
|
9 |
% |
|
Chandler Corporate Center III |
|
|
81,770 |
|
|
|
8 |
% |
|
|
0 |
% |
|
|
0 |
% |
|
|
0 |
% |
|
|
0 |
% |
|
|
0 |
% |
|
|
92 |
% |
|
3811 E. Bell (b.) |
|
|
80,484 |
|
|
|
40 |
% |
|
|
12 |
% |
|
|
14 |
% |
|
|
4 |
% |
|
|
3 |
% |
|
|
0 |
% |
|
|
27 |
% |
|
Henderson Union Village MOB |
|
|
78,963 |
|
|
|
63 |
% |
|
|
0 |
% |
|
|
0 |
% |
|
|
0 |
% |
|
|
0 |
% |
|
|
3 |
% |
|
|
34 |
% |
|
Summerlin Hospital Medical Office Building III |
|
|
77,713 |
|
|
|
0 |
% |
|
|
8 |
% |
|
|
44 |
% |
|
|
10 |
% |
|
|
18 |
% |
|
|
9 |
% |
|
|
11 |
% |
|
Mid Coast Hospital MOB |
|
|
74,629 |
|
|
|
0 |
% |
|
|
5 |
% |
|
|
0 |
% |
|
|
0 |
% |
|
|
4 |
% |
|
|
0 |
% |
|
|
91 |
% |
|
North West Texas Professional Office Tower |
|
|
72,351 |
|
|
|
0 |
% |
|
|
0 |
% |
|
|
0 |
% |
|
|
0 |
% |
|
|
0 |
% |
|
|
64 |
% |
|
|
36 |
% |
|
Rosenberg Children's Medical Plaza (b.) |
|
|
66,231 |
|
|
|
1 |
% |
|
|
75 |
% |
|
|
6 |
% |
|
|
3 |
% |
|
|
0 |
% |
|
|
0 |
% |
|
|
15 |
% |
|
Frederick Crestwood MOB |
|
|
62,297 |
|
|
|
0 |
% |
|
|
0 |
% |
|
|
0 |
% |
|
|
0 |
% |
|
|
0 |
% |
|
|
0 |
% |
|
|
100 |
% |
|
Palmdale Medical Plaza |
|
|
59,405 |
|
|
|
44 |
% |
|
|
9 |
% |
|
|
0 |
% |
|
|
16 |
% |
|
|
12 |
% |
|
|
0 |
% |
|
|
19 |
% |
|
Sierra San Antonio Medical Plaza |
|
|
59,160 |
|
|
|
31 |
% |
|
|
1 |
% |
|
|
3 |
% |
|
|
0 |
% |
|
|
13 |
% |
|
|
5 |
% |
|
|
47 |
% |
|
Spring Valley Medical Office Building (a.) |
|
|
57,828 |
|
|
|
19 |
% |
|
|
17 |
% |
|
|
23 |
% |
|
|
18 |
% |
|
|
6 |
% |
|
|
3 |
% |
|
|
14 |
% |
|
Spring Valley Medical Office Building II (d.) |
|
|
57,432 |
|
|
|
15 |
% |
|
|
39 |
% |
|
|
21 |
% |
|
|
17 |
% |
|
|
0 |
% |
|
|
8 |
% |
|
|
0 |
% |
|
Southern Crescent Center II |
|
|
53,680 |
|
|
|
49 |
% |
|
|
0 |
% |
|
|
8 |
% |
|
|
4 |
% |
|
|
0 |
% |
|
|
39 |
% |
|
|
0 |
% |
|
Desert Valley Medical Center (b.) |
|
|
53,625 |
|
|
|
4 |
% |
|
|
14 |
% |
|
|
12 |
% |
|
|
13 |
% |
|
|
11 |
% |
|
|
21 |
% |
|
|
25 |
% |
|
Tuscan Professional Building (a.) |
|
|
53,231 |
|
|
|
0 |
% |
|
|
12 |
% |
|
|
0 |
% |
|
|
30 |
% |
|
|
19 |
% |
|
|
39 |
% |
|
|
0 |
% |
|
Lake Pointe Medical Arts Building (a.) |
|
|
50,974 |
|
|
|
0 |
% |
|
|
23 |
% |
|
|
14 |
% |
|
|
34 |
% |
|
|
9 |
% |
|
|
15 |
% |
|
|
5 |
% |
|
Forney Medical Plaza (c.) |
|
|
50,947 |
|
|
|
9 |
% |
|
|
67 |
% |
|
|
0 |
% |
|
|
0 |
% |
|
|
5 |
% |
|
|
5 |
% |
|
|
14 |
% |
|
2704 N. Tenaya Way |
|
|
44,894 |
|
|
|
0 |
% |
|
|
0 |
% |
|
|
0 |
% |
|
|
0 |
% |
|
|
0 |
% |
|
|
0 |
% |
|
|
100 |
% |
|
Southern Crescent Center I |
|
|
41,897 |
|
|
|
74 |
% |
|
|
0 |
% |
|
|
5 |
% |
|
|
0 |
% |
|
|
0 |
% |
|
|
0 |
% |
|
|
21 |
% |
|
Auburn Medical Office Building |
|
|
41,311 |
|
|
|
19 |
% |
|
|
0 |
% |
|
|
0 |
% |
|
|
20 |
% |
|
|
0 |
% |
|
|
61 |
% |
|
|
0 |
% |
|
BRB Medical Office Building (b.) |
|
|
40,733 |
|
|
|
12 |
% |
|
|
22 |
% |
|
|
0 |
% |
|
|
66 |
% |
|
|
0 |
% |
|
|
0 |
% |
|
|
0 |
% |
|
Cypresswood Professional Center - 8101 |
|
|
10,200 |
|
|
|
100 |
% |
|
|
0 |
% |
|
|
0 |
% |
|
|
0 |
% |
|
|
0 |
% |
|
|
0 |
% |
|
|
0 |
% |
|
Cypresswood Professional Center - 8111 |
|
|
29,882 |
|
|
|
21 |
% |
|
|
7 |
% |
|
|
16 |
% |
|
|
56 |
% |
|
|
0 |
% |
|
|
0 |
% |
|
|
0 |
% |
|
Medical Center of Western Connecticut |
|
|
36,141 |
|
|
|
24 |
% |
|
|
5 |
% |
|
|
71 |
% |
|
|
0 |
% |
|
|
0 |
% |
|
|
0 |
% |
|
|
0 |
% |
|
Phoenix Children’s East Valley Care Center |
|
|
30,960 |
|
|
|
0 |
% |
|
|
0 |
% |
|
|
0 |
% |
|
|
0 |
% |
|
|
0 |
% |
|
|
0 |
% |
|
|
100 |
% |
|
Forney Medical Plaza II |
|
|
30,507 |
|
|
|
42 |
% |
|
|
5 |
% |
|
|
0 |
% |
|
|
0 |
% |
|
|
0 |
% |
|
|
0 |
% |
|
|
53 |
% |
|
Madison Station MOB |
|
|
30,096 |
|
|
|
0 |
% |
|
|
0 |
% |
|
|
0 |
% |
|
|
0 |
% |
|
|
0 |
% |
|
|
100 |
% |
|
|
0 |
% |
|
Apache Junction Medical Plaza |
|
|
26,901 |
|
|
|
9 |
% |
|
|
0 |
% |
|
|
17 |
% |
|
|
0 |
% |
|
|
34 |
% |
|
|
32 |
% |
|
|
8 |
% |
|
Santa Fe Professional Plaza |
|
|
24,883 |
|
|
|
0 |
% |
|
|
9 |
% |
|
|
23 |
% |
|
|
10 |
% |
|
|
27 |
% |
|
|
0 |
% |
|
|
31 |
% |
|
Professional Bldg at King's Crossing - Bldg A |
|
|
11,528 |
|
|
|
100 |
% |
|
|
0 |
% |
|
|
0 |
% |
|
|
0 |
% |
|
|
0 |
% |
|
|
0 |
% |
|
|
0 |
% |
|
Professional Bldg at King's Crossing - Bldg B |
|
|
12,790 |
|
|
|
0 |
% |
|
|
0 |
% |
|
|
11 |
% |
|
|
18 |
% |
|
|
0 |
% |
|
|
32 |
% |
|
|
39 |
% |
22
|
|
|
20,470 |
|
|
|
0 |
% |
|
|
0 |
% |
|
|
0 |
% |
|
|
100 |
% |
|
|
0 |
% |
|
|
0 |
% |
|
|
0 |
% |
|
|
Emory at Dunwoody Building |
|
|
20,366 |
|
|
|
0 |
% |
|
|
0 |
% |
|
|
0 |
% |
|
|
0 |
% |
|
|
0 |
% |
|
|
0 |
% |
|
|
100 |
% |
|
Piedmont - Roswell Physicians Center |
|
|
19,927 |
|
|
|
0 |
% |
|
|
0 |
% |
|
|
0 |
% |
|
|
0 |
% |
|
|
0 |
% |
|
|
0 |
% |
|
|
100 |
% |
|
Piedmont - Vinings Physicians Center |
|
|
16,790 |
|
|
|
0 |
% |
|
|
0 |
% |
|
|
0 |
% |
|
|
0 |
% |
|
|
0 |
% |
|
|
0 |
% |
|
|
100 |
% |
|
Ward Eagle Office Village |
|
|
16,282 |
|
|
|
0 |
% |
|
|
0 |
% |
|
|
0 |
% |
|
|
0 |
% |
|
|
0 |
% |
|
|
0 |
% |
|
|
100 |
% |
|
Haas Medical Office Park |
|
|
15,850 |
|
|
|
0 |
% |
|
|
0 |
% |
|
|
0 |
% |
|
|
0 |
% |
|
|
0 |
% |
|
|
0 |
% |
|
|
100 |
% |
|
Health Center at Hamburg |
|
|
15,400 |
|
|
|
0 |
% |
|
|
0 |
% |
|
|
0 |
% |
|
|
0 |
% |
|
|
0 |
% |
|
|
0 |
% |
|
|
100 |
% |
|
Northwest Medical Center at Sugar Creek |
|
|
13,696 |
|
|
|
0 |
% |
|
|
0 |
% |
|
|
0 |
% |
|
|
0 |
% |
|
|
0 |
% |
|
|
21 |
% |
|
|
79 |
% |
|
Family Doctor's MOB |
|
|
12,050 |
|
|
|
0 |
% |
|
|
0 |
% |
|
|
0 |
% |
|
|
0 |
% |
|
|
100 |
% |
|
|
0 |
% |
|
|
0 |
% |
|
701 South Tonopah Building |
|
|
10,747 |
|
|
|
0 |
% |
|
|
0 |
% |
|
|
0 |
% |
|
|
0 |
% |
|
|
100 |
% |
|
|
0 |
% |
|
|
0 |
% |
|
The Children's Clinic at Springdale |
|
|
9,761 |
|
|
|
0 |
% |
|
|
0 |
% |
|
|
0 |
% |
|
|
0 |
% |
|
|
0 |
% |
|
|
0 |
% |
|
|
100 |
% |
|
5004 Pool Road MOB |
|
|
4,400 |
|
|
|
0 |
% |
|
|
0 |
% |
|
|
0 |
% |
|
|
0 |
% |
|
|
0 |
% |
|
|
100 |
% |
|
|
0 |
% |
|
|
|
|
|
|
|
|
|
|
|
|
|
|
|
|
|
|
|
|
|
|
|
|
|
|
|
|
|
|
|
|
|
|
|
Preschool and Childcare Centers: |
|
|
|
|
|
|
|
|
|
|
|
|
|
|
|
|
|
|
|
|
|
|
|
|
|
|
|
|
|
|
|
|
|
Chesterbrook Academy - Audubon |
|
|
8,300 |
|
|
|
0 |
% |
|
|
0 |
% |
|
|
0 |
% |
|
|
0 |
% |
|
|
0 |
% |
|
|
0 |
% |
|
|
100 |
% |
|
Chesterbrook Academy - Uwchlan |
|
|
8,163 |
|
|
|
0 |
% |
|
|
0 |
% |
|
|
0 |
% |
|
|
0 |
% |
|
|
0 |
% |
|
|
0 |
% |
|
|
100 |
% |
|
Chesterbrook Academy - Newtown |
|
|
8,100 |
|
|
|
0 |
% |
|
|
0 |
% |
|
|
0 |
% |
|
|
0 |
% |
|
|
100 |
% |
|
|
0 |
% |
|
|
0 |
% |
|
Chesterbrook Academy - New Britain |
|
|
7,998 |
|
|
|
0 |
% |
|
|
0 |
% |
|
|
0 |
% |
|
|
100 |
% |
|
|
0 |
% |
|
|
0 |
% |
|
|
0 |
% |
|
|
|
|
|
|
|
|
|
|
|
|
|
|
|
|
|
|
|
|
|
|
|
|
|
|
|
|
|
|
|
|
|
|
|
Ambulatory Care Centers: |
|
|
|
|
|
|
|
|
|
|
|
|
|
|
|
|
|
|
|
|
|
|
|
|
|
|
|
|
|
|
|
|
|
Hanover Emergency Center |
|
|
22,000 |
|
|
|
0 |
% |
|
|
0 |
% |
|
|
0 |
% |
|
|
0 |
% |
|
|
0 |
% |
|
|
0 |
% |
|
|
100 |
% |
|
South Texas ER at Mission |
|
|
13,578 |
|
|
|
0 |
% |
|
|
0 |
% |
|
|
0 |
% |
|
|
0 |
% |
|
|
0 |
% |
|
|
0 |
% |
|
|
100 |
% |
|
South Texas ER at Weslaco |
|
|
13,578 |
|
|
|
0 |
% |
|
|
0 |
% |
|
|
0 |
% |
|
|
0 |
% |
|
|
0 |
% |
|
|
0 |
% |
|
|
100 |
% |
|
Las Palmas Del Sol Emergency Center - West |
|
|
9,395 |
|
|
|
0 |
% |
|
|
0 |
% |
|
|
0 |
% |
|
|
0 |
% |
|
|
0 |
% |
|
|
0 |
% |
|
|
100 |
% |
|
Sub-total Other Investments |
|
|
2,671,458 |
|
|
|
18 |
% |
|
|
9 |
% |
|
|
8 |
% |
|
|
12 |
% |
|
|
11 |
% |
|
|
10 |
% |
|
|
32 |
% |
|
Total |
|
|
3,717,294 |
|
|
|
13 |
% |
|
|
7 |
% |
|
|
10 |
% |
|
|
9 |
% |
|
|
32 |
% |
|
|
7 |
% |
|
|
22 |
% |
|
|
(a) |
The estimated market rates related to the 2018 expiring RSF are greater than the lease rates on the expiring leases by an average of approximately 2% to 4%. |
|
|
(b) |
The estimated market rates related to the 2018 expiring RSF are less than the lease rates on the expiring leases by an average of approximately 1% to 4%. |
|
|
(c) |
The estimated market rates related to the 2018 expiring RSF are less than the lease rates on the expiring leases by an average of approximately 8%. |
|
|
(d) |
The estimated market rates related to the 2018 expiring RSF are less than the lease rates on the expiring leases by an average of approximately 25%. |
On a combined basis, based upon the aggregate revenues and square footage for the hospital facilities owned as of December 31, 2017 and 2016, the average effective annual rental per square foot was $18.19 and $17.99, respectively. On a combined basis, based upon the aggregate consolidated and unconsolidated revenues and the estimated average occupied square footage for our MOBs, FEDs and childcare centers owned as of December 31, 2017 and 2016, the average effective annual rental per square foot was $28.40 and $28.74, respectively. On a combined basis, based upon the aggregate consolidated and unconsolidated revenues and estimated average occupied square footage for all of our properties owned as of December 31, 2017 and 2016, the average effective annual rental per square foot was $25.14 and $25.41, respectively. The estimated average occupied square footage for 2017 was calculated by averaging the unavailable rentable square footage on January 1, 2017 and January 1, 2018. The estimated average occupied square footage for 2016 was calculated by averaging the unavailable rentable square footage on January 1, 2016 and January 1, 2017.
During 2017, the lease with one of the UHS-related hospitals (McAllen Medical Center) generated revenues that comprised more or equal to 10% of our consolidated revenues. None of the properties had book values greater than 10% of our consolidated assets as of December 31, 2017. Including 100% of the revenues generated at the properties owned by our unconsolidated LLCs, none of our unconsolidated LLCs had revenues greater than 10% of the combined consolidated and unconsolidated revenues during 2017. Including 100% of the book values of the properties owned by our unconsolidated LLCs, none of the properties had book values greater than 10% of the consolidated and unconsolidated assets.
The following table sets forth the average effective annual rental per square foot for 2017, based upon average occupied square feet for McAllen Medical Center:
23
|
Property |
|
2017 Average Occupied Square Feet |
|
|
2017 Revenues |
|
|
2017 Average Effective Rental Per Square Foot |
|
|||
|
McAllen Medical Center |
|
|
422,276 |
|
|
$ |
7,191,146 |
|
|
$ |
17.03 |
|
The following table sets forth lease expirations for each of the next ten years for our properties as of December 31, 2017.
|
|
|
Expiring Square Feet |
|
|
Number of Tenants |
|
|
Annual Rentals of Expiring Leases(1) |
|
|
Percentage of Annual Rentals(2) |
|
||||
|
Hospital properties |
|
|
|
|
|
|
|
|
|
|
|
|
|
|
|
|
|
2018 |
|
|
0 |
|
|
0 |
|
|
$ |
0 |
|
|
|
0 |
% |
|
|
2019 |
|
|
147,140 |
|
|
2 |
|
|
|
1,452,061 |
|
|
|
2 |
% |
|
|
2020 |
|
|
0 |
|
|
0 |
|
|
0 |
|
|
|
0 |
% |
||
|
2021 |
|
|
898,696 |
|
|
4 |
|
|
|
12,657,649 |
|
|
|
18 |
% |
|
|
2022 |
|
|
0 |
|
|
0 |
|
|
0 |
|
|
|
0 |
% |
||
|
2023 |
|
|
0 |
|
|
0 |
|
|
0 |
|
|
|
0 |
% |
||
|
2024 |
|
|
0 |
|
|
0 |
|
|
0 |
|
|
|
0 |
% |
||
|
2025 |
|
|
0 |
|
|
0 |
|
|
0 |
|
|
|
0 |
% |
||
|
2026 |
|
|
0 |
|
|
0 |
|
|
0 |
|
|
|
0 |
% |
||
|
2027 |
|
|
0 |
|
|
0 |
|
|
0 |
|
|
|
0 |
% |
||
|
Thereafter |
|
|
0 |
|
|
0 |
|
|
0 |
|
|
|
0 |
% |
||
|
Subtotal-hospital facilities |
|
|
1,045,836 |
|
|
|
6 |
|
|
$ |
14,109,710 |
|
|
|
20 |
% |
|
Other consolidated properties |
|
|
|
|
|
|
|
|
|
|
|
|
|
|
|
|
|
2018 |
|
|
238,772 |
|
|
73 |
|
|
$ |
7,351,494 |
|
|
|
10 |
% |
|
|
2019 |
|
|
196,240 |
|
|
61 |
|
|
|
5,542,473 |
|
|
|
7 |
% |
|
|
2020 |
|
|
263,418 |
|
|
70 |
|
|
|
7,510,862 |
|
|
|
10 |
% |
|
|
2021 |
|
|
265,271 |
|
|
45 |
|
|
|
7,496,533 |
|
|
|
10 |
% |
|
|
2022 |
|
|
242,829 |
|
|
45 |
|
|
|
7,006,279 |
|
|
|
9 |
% |
|
|
2023 |
|
|
208,556 |
|
|
30 |
|
|
|
5,467,946 |
|
|
|
7 |
% |
|
|
2024 |
|
|
67,267 |
|
|
8 |
|
|
|
2,040,610 |
|
|
|
3 |
% |
|
|
2025 |
|
|
109,305 |
|
|
10 |
|
|
|
3,288,102 |
|
|
|
4 |
% |
|
|
2026 |
|
|
48,574 |
|
|
7 |
|
|
|
1,422,031 |
|
|
|
2 |
% |
|
|
2027 |
|
|
122,698 |
|
|
7 |
|
|
|
2,562,332 |
|
|
|
3 |
% |
|
|
Thereafter |
|
|
111,584 |
|
|
8 |
|
|
|
2,969,876 |
|
|
|
5 |
% |
|
|
Subtotal-other consolidated properties |
|
|
1,874,514 |
|
|
|
364 |
|
|
$ |
52,658,538 |
|
|
|
70 |
% |
|
Other unconsolidated properties (MOBs) |
|
|
|
|
|
|
|
|
|
|
|
|
|
|
|
|
|
2018 |
|
|
12,317 |
|
|
4 |
|
|
$ |
350,854 |
|
|
|
0 |
% |
|
|
2019 |
|
|
2,086 |
|
|
2 |
|
|
|
22,379 |
|
|
|
0 |
% |
|
|
2020 |
|
|
63,189 |
|
|
8 |
|
|
|
1,843,717 |
|
|
|
3 |
% |
|
|
2021 |
|
|
19,619 |
|
|
6 |
|
|
|
321,422 |
|
|
|
0 |
% |
|
|
2022 |
|
|
34,452 |
|
|
9 |
|
|
|
638,824 |
|
|
|
1 |
% |
|
|
2023 |
|
|
12,641 |
|
|
4 |
|
|
|
456,644 |
|
|
|
1 |
% |
|
|
2024 |
|
|
34,508 |
|
|
6 |
|
|
|
691,209 |
|
|
|
1 |
% |
|
|
2025 |
|
|
45,610 |
|
|
5 |
|
|
|
435,676 |
|
|
|
1 |
% |
|
|
2026 |
|
|
68,024 |
|
|
8 |
|
|
|
1,456,849 |
|
|
|
2 |
% |
|
|
2027 |
|
|
12,331 |
|
|
4 |
|
|
|
458,588 |
|
|
|
1 |
% |
|
|
Thereafter |
|
|
5,857 |
|
|
1 |
|
|
|
55,947 |
|
|
|
0 |
% |
|
|
Subtotal-other unconsolidated properties |
|
|
310,634 |
|
|
|
57 |
|
|
$ |
6,732,109 |
|
|
|
10 |
% |
|
Total all properties at December 31, 2017 |
|
|
3,230,984 |
|
|
|
427 |
|
|
$ |
73,500,357 |
|
|
|
100 |
% |
24
|
data related to the unconsolidated LLCs/LPs in which we hold various non-controlling ownership interests at December 31, 2017 and exclude the bonus rentals earned on the UHS hospital facilities. |
|
(2) |
The percentages of annual rentals reflected above were calculated based upon the annual rentals of expiring leases (as reflected above) divided by the total annual rentals of expiring leases (as reflected above). |
25
None
Not applicable
PART II
|
ITEM 5. |
Market for Registrant’s Common Equity, Related Stockholder Matters and Issuer Purchases of Equity Securities |
Market Information
Our shares of beneficial interest are listed on the New York Stock Exchange. The high and low closing sales prices for our shares of beneficial interest for each quarter in the years ended December 31, 2017 and 2016 are summarized below:
|
|
|
2017 |
|
|
2016 |
|
||||||||||
|
|
|
High Price |
|
|
Low Price |
|
|
High Price |
|
|
Low Price |
|
||||
|
First Quarter |
|
$ |
66.64 |
|
|
$ |
60.01 |
|
|
$ |
56.80 |
|
|
$ |
47.26 |
|
|
Second Quarter |
|
$ |
79.68 |
|
|
$ |
64.20 |
|
|
$ |
57.85 |
|
|
$ |
52.27 |
|
|
Third Quarter |
|
$ |
84.23 |
|
|
$ |
73.35 |
|
|
$ |
64.06 |
|
|
$ |
56.73 |
|
|
Fourth Quarter |
|
$ |
78.02 |
|
|
$ |
72.14 |
|
|
$ |
65.59 |
|
|
$ |
55.17 |
|
Holders
As of January 31, 2018, there were approximately 339 shareholders of record of our shares of beneficial interest.
Dividends
It is our intention to declare quarterly dividends to the holders of our shares of beneficial interest so as to comply with applicable sections of the Internal Revenue Code governing REITs. Our revolving credit facility limits our ability to increase dividends in excess of 95% of cash available for distribution, as defined in our revolving credit agreement, unless additional distributions are required to be made so as to comply with applicable sections of the Internal Revenue Code and related regulations governing REITs. In each of the past two years, dividends per share were declared as follows:
|
|
|
2017 |
|
|
2016 |
|
||
|
First Quarter |
|
$ |
.655 |
|
|
$ |
.645 |
|
|
Second Quarter |
|
|
.660 |
|
|
|
.650 |
|
|
Third Quarter |
|
|
.660 |
|
|
|
.650 |
|
|
Fourth Quarter |
|
|
.665 |
|
|
|
.655 |
|
|
|
|
$ |
2.640 |
|
|
$ |
2.600 |
|
Equity Compensation
Refer to Item 12. Security Ownership of Certain Beneficial Owners and Management and Related Stockholder Matters, of this report for information regarding securities authorized for issuance under our equity compensation plan.
26
The following graph compares our performance with that of the S&P 500 and a group of peer companies, where performance has been weighted based on market capitalization. Companies in our peer group are as follows: HCP, Inc., Omega Healthcare Investors, Inc., Welltower, Inc. (previously known as Health Care REIT, Inc.), Healthcare Realty Trust, Inc., LTC Properties, Inc., and National Health Investors, Inc.
The total cumulative return on investment (change in the year-end stock price plus reinvested dividends) for each of the periods for us, the peer group and the S&P 500 composite is based on the stock price or composite index at the end of fiscal 2012.
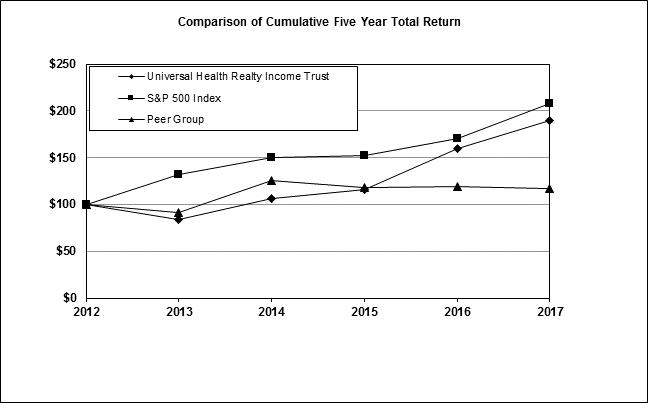
|
|
|
Base |
|
|
INDEXED RETURNS |
|
||||||||||||||||||
|
|
|
Period |
|
|
Years Ending |
|
||||||||||||||||||
|
Company Name / Index |
|
Dec 12 |
|
|
Dec 13 |
|
|
Dec 14 |
|
|
Dec 15 |
|
|
Dec 16 |
|
|
Dec 17 |
|
||||||
|
Universal Health Realty Income Trust |
|
$ |
100 |
|
|
$ |
83.66 |
|
|
$ |
106.41 |
|
|
$ |
116.40 |
|
|
$ |
159.36 |
|
|
$ |
189.16 |
|
|
S&P 500 Index |
|
$ |
100 |
|
|
$ |
132.39 |
|
|
$ |
150.51 |
|
|
$ |
152.59 |
|
|
$ |
170.84 |
|
|
$ |
208.14 |
|
|
Peer Group |
|
$ |
100 |
|
|
$ |
91.68 |
|
|
$ |
125.57 |
|
|
$ |
118.56 |
|
|
$ |
118.85 |
|
|
$ |
116.92 |
|
27
The following table contains our selected financial data for, or at the end of, each of the five years ended December 31, 2017. You should read this table in conjunction with our consolidated financial statements and related notes contained elsewhere in this Annual Report and Part II, Item 7, Management’s Discussion and Analysis of Financial Condition and Results of Operations.
|
|
|
(000s, except per share amounts) |
|
|||||||||||||||||
|
|
|
2017 |
|
|
2016 |
|
|
2015 |
|
|
2014 |
|
|
2013 |
|
|||||
|
Operating Results: |
|
|
|
|
|
|
|
|
|
|
|
|
|
|
|
|
|
|
|
|
|
Total revenues(1) |
|
$ |
72,348 |
|
|
$ |
67,081 |
|
|
$ |
63,950 |
|
|
$ |
59,786 |
|
|
$ |
54,280 |
|
|
Net income(2) |
|
$ |
45,619 |
|
|
$ |
17,215 |
|
|
$ |
23,691 |
|
|
$ |
51,551 |
|
|
$ |
13,169 |
|
|
Balance Sheet Data: |
|
|
|
|
|
|
|
|
|
|
|
|
|
|
|
|
|
|
|
|
|
Real estate investments, net of accumulated depreciation(1)(3) |
|
$ |
446,397 |
|
|
$ |
447,240 |
|
|
$ |
390,496 |
|
|
$ |
380,109 |
|
|
$ |
297,748 |
|
|
Investments in LLCs, net of liabilities(1)(4) |
|
|
2,776 |
|
|
|
33,731 |
|
|
|
30,492 |
|
|
|
8,605 |
|
|
|
39,201 |
|
|
Intangible assets, net of accumulated amortization(3) |
|
|
20,559 |
|
|
|
23,815 |
|
|
|
19,757 |
|
|
|
23,123 |
|
|
|
20,782 |
|
|
Total assets(1)(3) |
|
|
490,008 |
|
|
|
524,750 |
|
|
|
458,503 |
|
|
|
428,490 |
|
|
|
373,710 |
|
|
Total indebtedness, including debt premium(1)(3)(5) |
|
|
256,409 |
|
|
|
315,717 |
|
|
|
252,306 |
|
|
|
212,779 |
|
|
|
199,518 |
|
|
Other Data: |
|
|
|
|
|
|
|
|
|
|
|
|
|
|
|
|
|
|
|
|
|
Funds from operations(6) |
|
$ |
42,228 |
|
|
$ |
41,559 |
|
|
$ |
38,349 |
|
|
$ |
35,937 |
|
|
$ |
34,955 |
|
|
Cash provided by (used in): |
|
|
|
|
|
|
|
|
|
|
|
|
|
|
|
|
|
|
|
|
|
Operating activities |
|
|
46,005 |
|
|
|
40,733 |
|
|
|
38,178 |
|
|
|
32,796 |
|
|
|
31,294 |
|
|
Investing activities |
|
|
39,461 |
|
|
|
(74,834 |
) |
|
|
(44,309 |
) |
|
|
(4,038 |
) |
|
|
(13,373 |
) |
|
Financing activities |
|
|
(86,009 |
) |
|
|
34,137 |
|
|
|
6,164 |
|
|
|
(29,815 |
) |
|
|
(17,491 |
) |
|
Per Share Data: |
|
|
|
|
|
|
|
|
|
|
|
|
|
|
|
|
|
|
|
|
|
Basic earnings per share: |
|
|
|
|
|
|
|
|
|
|
|
|
|
|
|
|
|
|
|
|
|
Total basic earnings per share(2) |
|
$ |
3.35 |
|
|
$ |
1.28 |
|
|
$ |
1.78 |
|
|
$ |
3.99 |
|
|
$ |
1.04 |
|
|
Diluted earnings per share: |
|
|
|
|
|
|
|
|
|
|
|
|
|
|
|
|
|
|
|
|
|
Total diluted earnings per share(2) |
|
$ |
3.35 |
|
|
$ |
1.28 |
|
|
$ |
1.78 |
|
|
$ |
3.99 |
|
|
$ |
1.04 |
|
|
Diluted funds from operations per share: |
|
|
|
|
|
|
|
|
|
|
|
|
|
|
|
|
|
|
|
|
|
Total diluted funds from operations per share |
|
$ |
3.10 |
|
|
$ |
3.09 |
|
|
$ |
2.88 |
|
|
$ |
2.78 |
|
|
$ |
2.75 |
|
|
Dividends per share |
|
$ |
2.640 |
|
|
$ |
2.600 |
|
|
$ |
2.560 |
|
|
$ |
2.520 |
|
|
$ |
2.495 |
|
|
Other Information (in thousands) |
|
|
|
|
|
|
|
|
|
|
|
|
|
|
|
|
|
|
|
|
|
Weighted average number of shares outstanding—basic |
|
|
13,625 |
|
|
|
13,464 |
|
|
|
13,293 |
|
|
|
12,927 |
|
|
|
12,689 |
|
|
Weighted average number of shares and share equivalents outstanding—diluted |
|
|
13,625 |
|
|
|
13,468 |
|
|
|
13,301 |
|
|
|
12,934 |
|
|
|
12,701 |
|
|
(1) |
As discussed in Note 1 “Summary of Significant Accounting Policies—Investments in Limited Liability Companies”, our consolidated financial statements only include the accounts of our consolidated investments. |
|
(2) |
Net income and earnings per share during 2017 includes: (i) $2.0 million of hurricane recovery proceeds received in excess of damaged property write-downs, and; (ii) a $27.2 million net gain (net of related transaction costs) recorded in connection with the Arlington transaction, as discussed in Note 3 “New Construction, Acquisitions, Dispositions and Property Exchange Transaction”. Net income and earnings per share during 2016 includes $528,000 of transactions costs related to various transactions during 2016. Net income and earnings per share during 2015 includes: (i) an $8.7 million gain recorded in connection with a property exchange transaction, and; (ii) $243,000 of transaction costs related to various transactions during 2015. Net income and earnings per share during 2014 includes: (i) a $25.4 million gain recorded in connection with our purchase of third-party minority ownership interests in eight LLCs (January and August, 2014, as discussed below) in which we formerly held non-controlling majority ownership interests (we own 100% of each of these entities since the effective dates); (ii) a $13.0 million gain on the divestiture of real property (the Bridgeway), and; (iii) $427,000 of transaction costs related to the 2014 acquisition and divestiture activity previously mentioned. Net income and earnings per share during 2013 includes approximately $200,000 of transaction costs related to various acquisitions. |
|
(3) |
Amounts include the fair value of the real property and debt of the eight previously unconsolidated LLCs, which we began consolidating during the first and third quarters of 2014 subsequent to our purchase of the third-party minority ownership interests on January 1, 2014 and August 1, 2014 (we owned 100% of each of these entities at December 31, 2014). |
28
|
Investments in LLCs at December 31, 2014 and 2013 reflect the consolidation of various LLCs, as mentioned in notes 2 and 3 above. Additionally, at December 31, 2013, Investments in LLCs reflects the deconsolidation of Palmdale Medical Properties. This LLC was deemed to be a variable interest entity during the term of the master lease and was consolidated in our financial statements through June 30, 2013 since we were the primary beneficiary through that date. Effective July 1, 2013, this LLC is no longer be deemed a variable interest entity and is accounted for in our financial statements on an unconsolidated basis pursuant to the equity method. Effective January 1, 2014, Investments in LLCs reflects the consolidation of Palmdale Medical Properties, since we purchased the third-party minority ownership interests in Palmdale and began accounting for this LLC on a consolidated basis as of that date. |
|
(5) |
Excludes third-party debt that is non-recourse to us, incurred by unconsolidated LLCs in which we hold various non-controlling equity interests as follows: $27.8 million as of December 31, 2017, $28.4 million as of December 31, 2016, $28.9 million as of December 31, 2015, $52.7 million as of December 31, 2014 and $80.1 million as of December 31, 2013 (See Note 8 to the consolidated financial statements). |
|
(6) |
Our funds from operations (“FFO”) during 2017, 2016, 2015, 2014 and 2013 are net of reductions for transaction costs of $107,000, $528,000, $243,000 $427,000 and $203,000, respectively. On January 1, 2017, we adopted ASU 2017-01 “Business Combinations (Topic 805) – Clarifying the Definition of a Business”, which permits the capitalization of acquisition costs to the underlying assets since acquisitions are now generally considered asset acquisitions versus business combinations. |
Funds from operations (“FFO”) is a widely recognized measure of performance for REITs. We believe that FFO and FFO per diluted share, and adjusted funds from operations (“AFFO”) and AFFO per diluted share, which are non-GAAP financial measures (“GAAP” is Generally Accepted Accounting Principles in the United States of America), are helpful to our investors as measures of our operating performance. We compute FFO, as reflected below, in accordance with standards established by the National Association of Real Estate Investment Trusts (“NAREIT”), which may not be comparable to FFO reported by other REITs that do not compute FFO in accordance with the NAREIT definition, or that interpret the NAREIT definition differently than we interpret the definition. FFO adjusts for the effects of various gains that occurred during the periods presented, as well as hurricane insurance recovery proceeds in excess of damaged property write-downs that occurred in 2017. AFFO was also computed for the year ended December 31, 2017, as discussed herein, since we believe it is helpful to our investors since it adjusts for the hurricane accounting impact on our financial statements. FFO/AFFO do not represent cash generated from operating activities in accordance with GAAP and should not be considered to be an alternative to net income determined in accordance with GAAP. In addition, FFO/AFFO should not be used as: (i) an indication of our financial performance determined in accordance with GAAP; (ii) an alternative to cash flow from operating activities determined in accordance with GAAP; (iii) a measure of our liquidity, or; (iv) an indicator of funds available for our cash needs, including our ability to make cash distributions to shareholders.
29
A reconciliation of our reported net income to FFO and AFFO for each of the last five years is shown below:
|
|
|
(000s) |
|
|||||||||||||||||
|
|
|
2017 |
|
|
2016 |
|
|
2015 |
|
|
2014 |
|
|
2013 |
|
|||||
|
Net income |
|
$ |
45,619 |
|
|
$ |
17,215 |
|
|
$ |
23,691 |
|
|
$ |
51,551 |
|
|
$ |
13,169 |
|
|
Depreciation and amortization expense on real property/intangibles: |
|
|
|
|
|
|
|
|
|
|
|
|
|
|
|
|
|
|
|
|
|
Consolidated investments |
|
|
24,598 |
|
|
|
22,493 |
|
|
|
21,710 |
|
|
|
20,548 |
|
|
|
18,496 |
|
|
Unconsolidated affiliates |
|
|
1,240 |
|
|
|
1,851 |
|
|
|
1,690 |
|
|
|
2,290 |
|
|
|
3,290 |
|
|
Less gains: |
|
|
|
|
|
|
|
|
|
|
|
|
|
|
|
|
|
|
|
|
|
Gain on property exchange |
|
|
— |
|
|
|
— |
|
|
|
(8,742 |
) |
|
|
— |
|
|
|
— |
|
|
Gains on fair value recognition resulting from the purchase of minority interests in majority-owned LLCs, net |
|
|
— |
|
|
|
— |
|
|
|
— |
|
|
|
(25,409 |
) |
|
|
— |
|
|
Gain on divestiture of real property |
|
|
— |
|
|
|
— |
|
|
|
— |
|
|
|
(13,043 |
) |
|
|
— |
|
|
Gain on Arlington transaction |
|
|
(27,196 |
) |
|
|
— |
|
|
|
— |
|
|
|
— |
|
|
|
— |
|
|
Hurricane insurance recovery proceeds in excess of damaged property write-downs |
|
|
(2,033 |
) |
|
|
— |
|
|
|
— |
|
|
|
— |
|
|
|
— |
|
|
Funds From Operations |
|
$ |
42,228 |
|
|
$ |
41,559 |
|
|
$ |
38,349 |
|
|
$ |
35,937 |
|
|
$ |
34,955 |
|
|
Hurricane related expenses |
|
|
4,967 |
|
|
|
— |
|
|
|
— |
|
|
|
— |
|
|
|
— |
|
|
Hurricane related recoveries |
|
|
(4,967 |
) |
|
|
— |
|
|
|
— |
|
|
|
— |
|
|
|
— |
|
|
Adjusted Funds From Operations |
|
$ |
42,228 |
|
|
$ |
41,559 |
|
|
$ |
38,349 |
|
|
$ |
35,937 |
|
|
$ |
34,955 |
|
|
Weighted average number of shares and equivalents outstanding - Diluted |
|
|
13,625 |
|
|
|
13,468 |
|
|
|
13,301 |
|
|
|
12,934 |
|
|
|
12,701 |
|
|
Funds From Operations per diluted share |
|
$ |
3.10 |
|
|
$ |
3.09 |
|
|
$ |
2.88 |
|
|
$ |
2.78 |
|
|
$ |
2.75 |
|
|
Adjusted Funds From Operations per diluted share |
|
$ |
3.10 |
|
|
$ |
3.09 |
|
|
$ |
2.88 |
|
|
$ |
2.78 |
|
|
$ |
2.75 |
|
30
Overview
We are a real estate investment trust (“REIT”) that commenced operations in 1986. We invest in healthcare and human service related facilities currently including acute care hospitals, rehabilitation hospitals, sub-acute facilities, surgery centers, free-standing emergency departments, childcare centers and medical/office buildings. As of February 28, 2018, we have sixty-eight real estate investments or commitments in twenty states consisting of:
|
|
• |
six hospital facilities including three acute care, one rehabilitation and two sub-acute; |
|
|
• |
four free-standing emergency departments (“FEDs”); |
|
|
• |
fifty-four medical/office buildings (“MOBs”), including four owned by unconsolidated LLCs/LPs, and; |
|
|
• |
four preschool and childcare centers. |
Forward Looking Statements
This report contains “forward-looking statements” that reflect our current estimates, expectations and projections about our future results, performance, prospects and opportunities. Forward-looking statements include, among other things, information concerning our possible future results of operations, business and growth strategies, financing plans, expectations that regulatory developments or other matters will not have a material adverse effect on our business or financial condition, our competitive position and the effects of competition, the projected growth of the industry in which we operate, and the benefits and synergies to be obtained from our completed and any future acquisitions, and statements of our goals and objectives, and other similar expressions concerning matters that are not historical facts. Words such as “may,” “will,” “should,” “could,” “would,” “predicts,” “potential,” “continue,” “expects,” “anticipates,” “future,” “intends,” “plans,” “believes,” “estimates,” “appears,” “projects” and similar expressions, as well as statements in future tense, identify forward-looking statements.
Forward-looking statements should not be read as a guarantee of future performance or results, and will not necessarily be accurate indications of the times at, or by which, such performance or results will be achieved. Forward-looking information is based on information available at the time and/or our good faith belief with respect to future events, and is subject to risks and uncertainties that could cause actual performance or results to differ materially from those expressed in the statements. Such factors include, among other things, the following:
|
|
• |
a substantial portion of our revenues are dependent upon one operator, Universal Health Services, Inc. (“UHS”). We cannot assure you that subsidiaries of UHS will renew the leases on our three acute care hospitals (which are scheduled to expire in December, 2021) and two FEDs at existing lease rates or fair market value lease rates. In addition, if subsidiaries of UHS exercise their options to purchase the respective leased hospital facilities and FEDs upon expiration of the lease terms, our future revenues and results of operations could decrease if we were unable to earn a favorable rate of return on the sale proceeds received, as compared to the rental revenue currently earned pursuant to these leases; |
|
|
• |
in certain of our markets, the general real estate market has been unfavorably impacted by increased competition/capacity and decreases in occupancy and rental rates which may adversely impact our operating results and the underlying value of our properties; |
|
|
• |
a number of legislative initiatives have recently been passed into law that may result in major changes in the health care delivery system on a national or state level to the operators of our facilities, including UHS. No assurances can be given that the implementation of these new laws will not have a material adverse effect on the business, financial condition or results of operations of our operators; |
|
|
• |
the potential indirect impact of the Tax Cuts and Jobs Act of 2017 (the “2017 Tax Act”), signed into law on December 22, 2017, which makes significant changes to corporate and individual tax rates and calculation of taxes, which could potentially impact our tenants and jurisdictions, both positively and negatively, in which we do business, as well as the overall investment thesis for REITS; |
|
|
• |
a subsidiary of UHS is our Advisor and our officers are all employees of a wholly-owned subsidiary of UHS, which may create the potential for conflicts of interest; |
|
|
• |
lost revenues resulting from the exercise of purchase options, lease expirations and renewals, loan repayments and other restructuring; |
|
|
• |
our ability to continue to obtain capital on acceptable terms, including borrowed funds, to fund future growth of our business; |
31
|
|
• |
failure of UHS or the other operators of our hospital facilities to comply with governmental regulations related to the Medicare and Medicaid licensing and certification requirements could have a material adverse impact on our future revenues and the underlying value of the property; |
|
|
• |
the potential unfavorable impact on our business of deterioration in national, regional and local economic and business conditions, including a worsening of credit and/or capital market conditions, which may adversely affect our ability to obtain capital which may be required to fund the future growth of our business and refinance existing debt with near term maturities; |
|
|
• |
a deterioration in general economic conditions which could result in increases in the number of people unemployed and/or insured and likely increase the number of individuals without health insurance; as a result, the operators of our facilities may experience decreases in patient volumes which could result in decreased occupancy rates at our medical office buildings; |
|
|
• |
a worsening of the economic and employment conditions in the United States could materially affect the business of our operators, including UHS, which may unfavorably impact our future bonus rentals (on the UHS hospital facilities) and may potentially have a negative impact on the future lease renewal terms and the underlying value of the hospital properties; |
|
|
• |
real estate market factors, including without limitation, the supply and demand of office space and market rental rates, changes in interest rates as well as an increase in the development of medical office condominiums in certain markets; |
|
|
• |
the impact of property values and results of operations of severe weather conditions, including the effects of Hurricane Harvey on several of our properties in Texas; |
|
|
• |
government regulations, including changes in the reimbursement levels under the Medicare and Medicaid programs; |
|
|
• |
the issues facing the health care industry that affect the operators of our facilities, including UHS, such as: changes in, or the ability to comply with, existing laws and government regulations; unfavorable changes in the levels and terms of reimbursement by third party payors or government programs, including Medicare (including, but not limited to, the potential unfavorable impact of future reductions to Medicare reimbursements resulting from the Budget Control Act of 2011, as discussed below) and Medicaid (most states have reported significant budget deficits that have, in the past, resulted in the reduction of Medicaid funding to the operators of our facilities, including UHS); demographic changes; the ability to enter into managed care provider agreements on acceptable terms; an increase in uninsured and self-pay patients which unfavorably impacts the collectability of patient accounts; decreasing in-patient admission trends; technological and pharmaceutical improvements that may increase the cost of providing, or reduce the demand for, health care, and; the ability to attract and retain qualified medical personnel, including physicians; |
|
|
• |
in August, 2011, the Budget Control Act of 2011 (the “2011 Act”) was enacted into law. The 2011 Act imposed annual spending limits for most federal agencies and programs aimed at reducing budget deficits by $917 billion between 2012 and 2021, according to a report released by the Congressional Budget Office. The 2011 Act provides for new spending on program integrity initiatives intended to reduce fraud and abuse under the Medicare program. Among its other provisions, the law established a bipartisan Congressional committee, known as the Joint Select Committee on Deficit Reduction (the “Joint Committee”), which was tasked with making recommendations aimed at reducing future federal budget deficits by an additional $1.5 trillion over 10 years. The Joint Committee was unable to reach an agreement by the November 23, 2011 deadline and, as a result, across-the-board cuts to discretionary, national defense and Medicare spending were implemented on March 1, 2013 resulting in Medicare payment reductions of up to 2% per fiscal year with a uniform percentage reduction across all Medicare programs. The Bipartisan Budget Act of 2015, enacted on November 2, 2015, continued the 2% reductions to Medicare reimbursement imposed under the 2011 Act. We cannot predict whether Congress will restructure the implemented Medicare payment reductions or what federal other deficit reduction initiatives may be proposed by Congress going forward. We also cannot predict the effect these enactments will have on operators (including UHS), and, thus, our business; |
32
|
|
• |
Legislation has already been enacted that has repealed the individual mandate to obtain health insurance penalty that had been required by the ACA. In addition, Congress is considering legislation that would, in material part: (i) eliminate the large employer mandates to provide health insurance coverage; (ii) permit insurers to impose a surcharge up to 30 percent on individuals who go uninsured for more than two months and then purchase coverage; (iii) provide tax credits towards the purchase of health insurance, with a phase-out of tax credits accordingly to income level; (iv) expand health savings accounts; (v) impose a per capita cap on federal funding of state Medicaid programs, or, if elected by a state, transition federal funding to block grants, and; (vi) permit states to seek a waiver of certain federal requirements that would allow such state to define essential health benefits differently from federal standards and that would allow certain commercial health plans to take health status, including pre-existing conditions, into account in setting premiums. In addition to legislative changes, the Legislation can be significantly impacted by executive branch actions. In relevant part, President Trump has already taken executive actions: (i) requiring all federal agencies with authorities and responsibilities under the Legislation to “exercise all authority and discretion available to them to waiver, defer, grant exemptions, from, or delay” parts of the Legislation that place “unwarranted economic and regulatory burdens” on states, individuals or health care providers; (ii) directing the Department of Labor to enable the formation of health plans that would be exempt from certain Legislation essential health benefits requirements, and; (iii) eliminating cost-sharing reduction payments to insurers that would otherwise offset deductibles and other out-of-pocket expenses for health plan enrollees at or below 250 percent of the federal poverty level. |
It remains unclear what portions of the Legislation may remain, or whether any replacement or alternative programs may be created by any future legislation. Any such future repeal or replacement may have significant impact on the reimbursement for healthcare services generally, and may create reimbursement for services competing with the services offered by our hospitals. Accordingly, there can be no assurance that the adoption of any future federal or state healthcare reform legislation will not have a negative financial impact on our hospitals, including their ability to compete with alternative healthcare services funded by such potential legislation, or for our hospitals to receive payment for services
|
|
• |
there can be no assurance that if any of the announced or proposed changes described above are implemented there will not be negative financial impact on the operators of our hospitals, which material effects may include a potential decrease in the market for health care services or a decrease in the ability of the operators of our hospitals to receive reimbursement for health care services provided which could result in a material adverse effect on the financial condition or results of operations of the operators of our properties, and, thus, our business; |
|
|
• |
competition for our operators from other REITs; |
|
|
• |
the operators of our facilities face competition from other health care providers, including physician owned facilities and other competing facilities, including certain facilities operated by UHS but the real property of which is not owned by us. Such competition is experienced in markets including, but not limited to, McAllen, Texas, the site of our McAllen Medical Center, a 370-bed acute care hospital, and Riverside County, California, the site of our Southwest Healthcare System-Inland Valley Campus, a 130-bed acute care hospital; |
|
|
• |
changes in, or inadvertent violations of, tax laws and regulations and other factors than can affect REITs and our status as a REIT; |
|
|
• |
should we be unable to comply with the strict income distribution requirements applicable to REITs, utilizing only cash generated by operating activities, we would be required to generate cash from other sources which could adversely affect our financial condition; |
33
|
|
determined by the Offering Member (“Transfer Price”), or; (ii) purchase the entire ownership interest of the Non-Offering Member (“Offer to Purchase”) at the equivalent proportionate Transfer Price. The Non-Offering Member has 60 to 90 days to either: (i) purchase the entire ownership interest of the Offering Member at the Transfer Price, or; (ii) sell its entire ownership interest to the Offering Member at the equivalent proportionate Transfer Price. The closing of the transfer must occur within 60 to 90 days of the acceptance by the Non-Offering Member; |
|
|
• |
fluctuations in the value of our common stock, and; |
|
|
• |
other factors referenced herein or in our other filings with the Securities and Exchange Commission. |
Given these uncertainties, risks and assumptions, you are cautioned not to place undue reliance on such forward-looking statements. Our actual results and financial condition, including the operating results of our lessees and the facilities leased to subsidiaries of UHS, could differ materially from those expressed in, or implied by, the forward-looking statements.
Forward-looking statements speak only as of the date the statements are made. We assume no obligation to publicly update any forward-looking statements to reflect actual results, changes in assumptions or changes in other factors affecting forward-looking information, except as may be required by law. All forward-looking statements attributable to us or persons acting on our behalf are expressly qualified in their entirety by this cautionary statement.
Critical Accounting Policies and Estimates
The preparation of financial statements in conformity with accounting principles generally accepted in the United States of America requires us to make estimates and assumptions that affect the amounts reported in our consolidated financial statements and accompanying notes.
We consider our critical accounting policies to be those that require us to make significant judgments and estimates when we prepare our financial statements, including the following:
Revenue Recognition: Our revenues consist primarily of rentals received from tenants, which are comprised of minimum rent (base rentals), bonus rentals and reimbursements from tenants for their pro-rata share of expenses such as common area maintenance costs, real estate taxes and utilities.
The minimum rent for our six hospital facilities, which is paid monthly, is fixed over the term of the respective leases which are scheduled to expire in 2019 (2 hospitals) or 2021 (4 hospitals). In addition, for the three hospital facilities leased to subsidiaries of UHS, bonus rents are paid on a quarterly basis, based upon a computation that compares the hospitals’ current quarter net revenues to the corresponding quarter in the base year. Rental income recorded by our other properties, including our consolidated and unconsolidated MOBs, relating to leases in excess of one year in length, is recognized using the straight-line method under which contractual rents are recognized evenly over the lease term regardless of when payments are due. The amount of rental revenue resulting from straight-line rent adjustments is dependent on many factors including the nature and amount of any rental concessions granted to new tenants, stipulated rent increases under existing leases, as well as the acquisitions and sales of properties that have existing in-place leases with terms in excess of one year. As a result, the straight-line adjustments to rental revenue may vary from period-to-period. Tenant reimbursements for operating expenses are accrued as revenue in the same period the related expenses are incurred.
Real Estate Investments: Land, buildings and capital improvements are recorded at cost and stated at cost less accumulated depreciation. Expenditures for maintenance and repairs are charged to operations as incurred. Renovations or replacements, which improve or extend the life of an asset, are capitalized and depreciated over their estimated useful lives.
Purchase Accounting for Acquisition of Investments in Real Estate: Purchase accounting is applied to the assets and liabilities related to all real estate investments acquired from third parties. In accordance with current accounting guidance, the fair value of the real estate acquired is allocated to the acquired tangible assets, consisting primarily of land, building and tenant improvements, and identified intangible assets and liabilities, consisting of the value of above-market and below-market leases, and acquired ground leases, based in each case on their fair values. Loan premiums, in the case of above market rate loans, or loan discounts, in the case of below market loans, are recorded based on the fair value of any loans assumed in connection with acquiring the real estate.
The fair values of the tangible assets of an acquired property are determined based on comparable land sales for land and replacement costs adjusted for physical and market obsolescence for the improvements. The fair values of the tangible assets of an acquired property are also determined by valuing the property as if it were vacant, and the “as-if-vacant” value is then allocated to land, building and tenant improvements based on management’s determination of the relative fair values of these assets. Management determines the as-if-vacant fair value of a property based on assumptions that a market participant would use, which is similar to
34
methods used by independent appraisers. In addition, there is intangible value related to having tenants leasing space in the purchased property, which is referred to as in-place lease value. Such value results primarily from the buyer of a leased property avoiding the costs associated with leasing the property and also avoiding rent losses and unreimbursed operating expenses during the hypothetical lease-up period. Factors considered by management in performing these analyses include an estimate of carrying costs during the expected lease-up periods considering current market conditions and costs to execute similar leases. In estimating carrying costs, management includes real estate taxes, insurance and other operating expenses and estimates of lost rental revenue during the expected lease-up periods based on current market demand. Management also estimates costs to execute similar leases including leasing commissions, tenant improvements, legal and other related costs. The value of in-place leases are amortized to expense over the remaining initial terms of the respective leases.
In allocating the fair value of the identified intangible assets and liabilities of an acquired property, above-market and below-market in-place lease values are recorded based on the present value (using an interest rate which reflects the risks associated with the leases acquired) of the difference between (i) the contractual amounts to be paid pursuant to the in-place leases and (ii) estimated fair market lease rates from the perspective of a market participant for the corresponding in-place leases, measured, for above-market leases, over a period equal to the remaining non-cancelable term of the lease and, for below-market leases, over a period equal to the initial term plus any below market fixed rate renewal periods. The capitalized above-market lease values are amortized as a reduction of rental income over the remaining non-cancelable terms of the respective leases. The capitalized below-market lease values, also referred to as acquired lease obligations, are amortized as an increase to rental income over the initial terms of the respective leases.
Asset Impairment: We review each of our properties for indicators that its carrying amount may not be recoverable. Examples of such indicators may include a significant decrease in the market price of the property, a change in the expected holding period for the property, a significant adverse change in how the property is being used or expected to be used based on the underwriting at the time of acquisition, an accumulation of costs significantly in excess of the amount originally expected for the acquisition or development of the property, or a history of operating or cash flow losses of the property. When such impairment indicators exist, we review an estimate of the future undiscounted net cash flows (excluding interest charges) expected to result from the real estate investment’s use and eventual disposition and compare that estimate to the carrying value of the property. We consider factors such as future operating income, trends and prospects, as well as the effects of leasing demand, competition and other factors. If our future undiscounted net cash flow evaluation indicates that we are unable to recover the carrying value of a real estate investment, an impairment loss is recorded to the extent that the carrying value exceeds the estimated fair value of the property. These losses have a direct impact on our net income because recording an impairment loss results in an immediate negative adjustment to net income. The evaluation of anticipated cash flows is highly subjective and is based in part on assumptions regarding future occupancy, rental rates and capital requirements that could differ materially from actual results in future periods. Since cash flows on properties considered to be long-lived assets to be held and used are considered on an undiscounted basis to determine whether the carrying value of a property is recoverable, our strategy of holding properties over the long-term directly decreases the likelihood of their carrying values not being recoverable and therefore requiring the recording of an impairment loss. If our strategy changes or market conditions otherwise dictate an earlier sale date, an impairment loss may be recognized and such loss could be material. If we determine that the asset fails the recoverability test, the affected assets must be reduced to their fair value.
We generally estimate the fair value of rental properties utilizing a discounted cash flow analysis that includes projections of future revenues, expenses and capital improvement costs that a market participant would use based on the highest and best use of the asset, which is similar to the income approach that is commonly utilized by appraisers. In certain cases, we may supplement this analysis by obtaining outside broker opinions of value or third party appraisals.
In considering whether to classify a property as held for sale, we consider factors such as whether management has committed to a plan to sell the property, the property is available for immediate sale in its present condition for a price that is reasonable in relation to its current value, the sale of the property is probable, and actions required for management to complete the plan indicate that it is unlikely that any significant changes will made to the plan. If all the criteria are met, we classify the property as held for sale. Upon being classified as held for sale, depreciation and amortization related to the property ceases and it is recorded at the lower of its carrying amount or fair value less cost to sell. The assets and related liabilities of the property are classified separately on the consolidated balance sheets for the most recent reporting period. Only those assets held for sale that constitute a strategic shift or that will have a major effect on our operations are classified as discontinued operations.
An other than temporary impairment of an investment in an LLC is recognized when the carrying value of the investment is not considered recoverable based on evaluation of the severity and duration of the decline in value, including projected declines in cash flow. To the extent impairment has occurred, the excess carrying value of the asset over its estimated fair value is charged to income.
Federal Income Taxes: No provision has been made for federal income tax purposes since we qualify as a REIT under Sections 856 to 860 of the Internal Revenue Code of 1986, and intend to continue to remain so qualified. To qualify as a REIT, we must meet certain organizational and operational requirements, including a requirement to distribute at least 90% of our annual REIT
35
taxable income to shareholders. As a REIT, we generally will not be subject to federal, state or local income tax on income that we distribute as dividends to our shareholders. We have historically distributed, and intend to continue to distribute, 100% of our annual REIT taxable income to our shareholders.
We are subject to a federal excise tax computed on a calendar year basis. The excise tax equals 4% of the amount by which 85% of our ordinary income plus 95% of any capital gain income for the calendar year exceeds cash distributions during the calendar year, as defined. No provision for excise tax has been reflected in the financial statements as no tax was due.
Earnings and profits, which determine the taxability of dividends to shareholders, will differ from net income reported for financial reporting purposes due to the differences for federal tax purposes in the cost basis of assets and in the estimated useful lives used to compute depreciation and the recording of provision for investment losses.
Results of Operations
Year ended December 31, 2017 as compared to the year ended December 31, 2016:
For the year ended December 31, 2017, net income was $45.6 million as compared to $17.2 million during 2016. The $28.4 million increase was primarily attributable to:
|
|
• |
a $27.2 million increase due to the gain recorded during the first quarter of 2017 in connection with the Arlington Medical Properties, LLC transaction, as discussed herein; |
|
|
• |
a $2.0 million increase resulting from the hurricane recovery proceeds in excess of damaged property write-downs; |
|
|
• |
a $708,000 decrease due to increased interest expense resulting primarily from an increase in our average cost of funds under our revolving credit agreement, offset by the repayment of four third-party mortgages (during the second, third and fourth quarters of 2017) utilizing funds borrowed under our revolving credit agreement which bear interest at a comparatively lower interest rate; |
|
|
• |
a $421,000 increase due to a decrease in transaction cost expense, and; |
|
|
• |
$538,000 of other combined net decreases primarily attributable to the unfavorable impact resulting from the temporary closure of the properties damaged by Hurricane Harvey, as discussed below. |
Total revenue increased $5.3 million, or 7.9%, during the year ended December 31, 2017, as compared to 2016, due primarily to the revenues generated at MOBs acquired during 2017 and 2016, as well as net increases at various other properties.
Included in our other operating expenses are expenses related to the consolidated medical office buildings, which totaled $17.4 million and $16.4 million for the years ended December 31, 2017 and 2016, respectively. The increase in operating expenses during 2017, as compared to 2016, is partially due to new acquisitions during 2017 and 2016. A large portion of the expenses associated with our consolidated medical office buildings is passed on directly to the tenants either directly as tenant reimbursements of common area maintenance expenses or included in base rental amounts. Tenant reimbursements for operating expenses are accrued as revenue in the same period the related expenses are incurred and are included as tenant reimbursement revenue in our consolidated statements of income.
During 2017, we had a total of 38 new or renewed leases related to the medical office buildings as indicated in Item 2. Properties, in which we have significant investments, some of which are accounted for by the equity method. These leases comprised approximately 10% of the aggregate rentable square feet of these properties (7% related to renewed leases and 3% related to new leases). Rental rates, tenant improvement costs and rental concessions vary from property to property based upon factors such as, but not limited to, the current occupancy and age of our buildings, local overall economic conditions, proximity to hospital campuses and the vacancy rates, rental rates and capacity of our competitors in the market. The weighted-average tenant improvement costs associated with these new or renewed leases was approximately $10 per square foot during 2017. The weighted-average leasing commissions on the new and renewed leases commencing during 2017 was approximately 2% of base rental revenue over the term of the leases. The average aggregate value of the tenant concessions, generally consisting of rent abatements, provided in connection with new and renewed leases commencing during 2017 was approximately 2% of the future aggregate base rental revenue over the lease terms. Rent abatements were, or will be, recognized in our results of operations under the straight-line method over the lease term regardless of when payments are due. In connection with lease renewals executed during 2017, the weighted-average rental rates, as compared to rental rates on the expired leases, decreased by approximately 3%.
During 2016, we had a total of 32 new or renewed leases related to the medical office buildings in which we have significant investments, some of which are accounted for by the equity method. These leases comprised approximately 10% of the aggregate rentable square feet of these properties (7% related to renewed leases and 3% related to new leases). Rental rates, tenant improvement costs and rental concessions vary from property to property based upon factors such as, but not limited to, the current occupancy and
36
age of our buildings, local overall economic conditions, proximity to hospital campuses and the vacancy rates, rental rates and capacity of our competitors in the market. The weighted-average tenant improvement costs associated with these new or renewed leases was approximately $12 per square foot during 2016. The weighted-average leasing commissions on the new and renewed leases commencing during 2016 was approximately 2% of base rental revenue over the term of the leases. The average aggregate value of the tenant concessions, generally consisting of rent abatements, provided in connection with new and renewed leases commencing during 2016 was approximately 2% of the future aggregate base rental revenue over the lease terms. Rent abatements were, or will be, recognized in our results of operations under the straight-line method over the lease term regardless of when payments are due. In connection with lease renewals executed during 2016, the weighted-average rental rates, as compared to rental rates on the expired leases, decreased by approximately 3%.
Funds from operations (“FFO”) is a widely recognized measure of performance for REITs. We believe that FFO and FFO per diluted share, and adjusted funds from operations (“AFFO”) and AFFO per diluted share, which are non-GAAP financial measures (“GAAP” is Generally Accepted Accounting Principles in the United States of America), are helpful to our investors as measures of our operating performance. We compute FFO, as reflected below, in accordance with standards established by the National Association of Real Estate Investment Trusts (“NAREIT”), which may not be comparable to FFO reported by other REITs that do not compute FFO in accordance with the NAREIT definition, or that interpret the NAREIT definition differently than we interpret the definition. FFO adjusts for the effects of various gains, such as gains on transactions, as well as the hurricane insurance recovery proceeds in excess of damaged property write-downs that occurred during the periods presented. AFFO was also computed for the year ended December 31, 2017, as discussed herein, since we believe it is helpful to our investors since it adjusts for the hurricane accounting impact on our financial statements. FFO/AFFO do not represent cash generated from operating activities in accordance with GAAP and should not be considered to be an alternative to net income determined in accordance with GAAP. In addition, FFO/AFFO should not be used as: (i) an indication of our financial performance determined in accordance with GAAP; (ii) an alternative to cash flow from operating activities determined in accordance with GAAP; (iii) a measure of our liquidity, or; (iv) an indicator of funds available for our cash needs, including our ability to make cash distributions to shareholders.
Below is a reconciliation of our reported net income to FFO and AFFO for 2017 and 2016 (in thousands):
|
|
|
2017 |
|
|
2016 |
|
||
|
Net income |
|
$ |
45,619 |
|
|
$ |
17,215 |
|
|
Depreciation and amortization expense on consolidated investments |
|
|
24,598 |
|
|
|
22,493 |
|
|
Depreciation and amortization expense on unconsolidated affiliates |
|
|
1,240 |
|
|
|
1,851 |
|
|
Hurricane insurance recovery proceeds in excess of damaged property write-downs |
|
|
(2,033 |
) |
|
|
— |
|
|
Gain on Arlington transaction |
|
|
(27,196 |
) |
|
|
— |
|
|
Funds From Operations |
|
$ |
42,228 |
|
|
$ |
41,559 |
|
|
Hurricane related expenses |
|
|
4,967 |
|
|
|
- |
|
|
Hurricane insurance recoveries |
|
|
(4,967 |
) |
|
|
- |
|
|
Adjusted Funds From Operations |
|
$ |
42,228 |
|
|
$ |
41,559 |
|
|
|
|
|
|
|
|
|
|
|
|
Weighted average number of shares and equivalents outstanding - Diluted |
|
|
13,625 |
|
|
|
13,468 |
|
|
Funds From Operations per diluted share |
|
$ |
3.10 |
|
|
$ |
3.09 |
|
|
Adjusted Funds From Operations per diluted share |
|
$ |
3.10 |
|
|
$ |
3.09 |
|
|
|
|
|
|
|
|
|
|
|
Our FFO/AFFO increased to $42.2 million, or $3.10 per diluted share during 2017, as compared to $41.6 million, or $3.09 per diluted share, during 2016. The net increase in FFO and AFFO during 2017, as compared to 2016, was primarily attributable to: (i) a net increase in the income (before depreciation and amortization expense) generated at our properties, including the properties acquired at various times during 2016 and 2017; (ii) a decrease in transaction cost expense, as mentioned above, offset by; (iii) an unfavorable impact of approximately $510,000 resulting from the temporary closure of the properties impacted by Hurricane Harvey, as discussed below.
Impact of Hurricane Harvey
In late August, 2017, five of our medical office buildings listed below located in the Houston, Texas area incurred extensive water damage as a result of Hurricane Harvey. Since the hurricane, each of these properties remain temporarily closed and non-operational as we complete the damage assessments and restoration of the properties to an operational condition. Although we can provide no assurance on the estimated re-opening dates, it is expected that the buildings will continue to be closed through the majority of the second quarter of 2018. In the aggregate, these properties comprised approximately 2% of our consolidated revenues during the six months ended June 30, 2017.
37
As discussed below, we believe we are entitled to insurance recovery proceeds for substantially all of the costs incurred related to the remediation, repair and reconstruction of each of these properties, subject to certain deductibles and other limitations. In addition, during the period that these properties are non-operational, we believe we are entitled to business interruption insurance recoveries for the lost income related to each of these properties, subject to certain deductibles and other limitations.
Properties damaged and closed from Hurricane Harvey:
|
|
• |
Cypresswood Professional Center – located in Spring, Texas and consisting of two MOBs. |
|
|
• |
Professional Buildings at King’s Crossing – located in Kingwood, Texas and consisting of two MOBs. |
|
|
• |
Kelsey-Seybold Clinic at King’s Crossing – located in Kingwood, Texas and consisting of one MOB. |
Hurricane related expenses and recoveries:
At the time of the hurricane, we maintained insurance policies with a commercial insurance carrier providing for property damage coverage, subject to certain deductibles and other limitations, of up to $20 million in the aggregate applicable to the impacted properties and up to $50 million in the aggregate for business interruption coverage pursuant to a shared limit policy. Additionally, we have insurance coverage under the National Flood Insurance Program providing for property damage coverage of up to $500,000 per each of the 5 buildings, subject to certain deductibles and other limitations.
When all property insurance coverage and deductibles applicable to the above-mentioned hurricane damaged buildings are considered, we believe we are entitled to recovery of substantially all hurricane related expenses and reconstruction costs, less an aggregate net deductible of $25,000. In addition, pursuant to the business interruption policy, we believe we are entitled to substantially all lost income at these properties resulting from the hurricane, less an aggregate deductible of $100,000. However, we can provide no assurance that we will ultimately collect, after satisfaction of the applicable deductibles, substantially all of the hurricane related expenses and reconstruction costs and the lost income resulting from the related interruption of business at the impacted properties.
Included in our financial results for the year ended December 31, 2017 are hurricane related expenses of approximately $5.0 million consisting of $3.6 million related to property damage and $1.4 million related to remediation and demolition expenses. Also included in our financial results for the twelve-month period ended December 31, 2017 are aggregate hurricane related insurance recoveries of approximately $7.0 million, consisting of $5.0 million related to recovery of hurricane related expenses and $2.0 million related to recovery proceeds in excess of the damaged property write-downs.
As of December 31, 2017, our financial statements do not include any business interruption insurance recoveries since no business interruption insurance proceeds were received as of that date. However, we expect that business interruption insurance recoveries will be recognized in future periods when recovery proceeds are probable and/or insurance carrier notifications are received.
The hurricane related expenses and insurance recoveries recorded to date are based upon the damage assessments of the real property at each of the above-mentioned properties. We are unable to assess the ultimate repair cost of the damaged property or the amount of total insurance recoveries we may ultimately receive. As of December 31, 2017, the aggregate hurricane-related insurance recoveries have exceeded the combined net book value of the damaged property and the hurricane related expenses incurred as of that date. Although we expect to receive additional hurricane-related insurance proceeds in the future, the timing and amount of such proceeds cannot be determined at this time since it will be based upon factors such as ultimate replacement costs of damaged assets and the ultimate value of the business interruption claims. Therefore, in connection with Hurricane Harvey, it is likely that we will record additional hurricane related expenses and hurricane related insurance recoveries in future periods, which could be material.
Year ended December 31, 2016 as compared to the year ended December 31, 2015:
For the year ended December 31, 2016, net income was $17.2 million as compared to $23.7 million during 2015. The $6.5 million decrease in net income during 2016, as compared to 2015, was primarily attributable to the following:
|
|
• |
a decrease of approximately $8.7 million resulting from the gain recorded on a property exchange transaction that occurred in May, 2015; |
|
|
• |
a $1.1 million decrease due to an increase in interest expense resulting primarily from: (i) the refinancing in the form of a member loan (during the fourth quarter of 2015) of a previously outstanding $22.8 million, third-party mortgage loan of an unconsolidated LLC utilizing funds borrowed under our revolving credit facility, and; (ii) the interest expense incurred on the additional borrowings utilized to finance the 2016 acquisitions, as discussed herein; |
38
|
|
purchase of an additional 10% ownership interest in the Arlington Medical Properties, LLC from the third-party minority member, and; |
|
|
• |
$1.4 million of other combined net increases due primarily to increased net income generated at various properties, the income generated at the properties acquired during 2016 (before interest expense) and the favorable impact resulting from the property exchange transaction completed during the second quarter of 2015. |
Total revenue increased $3.1 million, or 4.9%, during the year ended December 31, 2016, as compared to 2015, due primarily to the revenues generated at MOBs acquired during 2016, as well as net increases at various other properties.
Included in our other operating expenses are expenses related to the consolidated medical office buildings, which totaled $16.4 million for each of the years ended December 31, 2016 and 2015. A large portion of the expenses associated with our consolidated medical office buildings is passed on directly to the tenants either directly as tenant reimbursements of common area maintenance expenses or included in base rental amounts.
During 2015, we had a total of 60 new or renewed leases related to the medical office buildings in which we have significant investments, some of which are accounted for by the equity method. These leases comprised approximately 14% of the aggregate rentable square feet of these properties (4% related to renewed leases and 10% related to new leases). Rental rates, tenant improvement costs and rental concessions vary from property to property based upon factors such as, but not limited to, the current occupancy and age of our buildings, local overall economic conditions, proximity to hospital campuses and the vacancy rates, rental rates and capacity of our competitors in the market. The weighted-average tenant improvement costs associated with these new or renewed leases was approximately $11 per square foot during 2015. The weighted-average leasing commissions on the new and renewed leases commencing during 2015 was approximately 2% of base rental revenue over the term of the leases. The average aggregate value of the tenant concessions, generally consisting of rent abatements, provided in connection with new and renewed leases commencing during 2015 was approximately 2% of the future aggregate base rental revenue over the lease terms. Rent abatements were, or will be, recognized in our results of operations under the straight-line method over the lease term regardless of when payments are due. In connection with lease renewals executed during 2015, the weighted-average rental rates, as compared to rental rates on the expired leases, decreased by approximately 3%.
Below is a reconciliation of our reported net income to FFO for 2016 and 2015 (in thousands):
|
|
|
2016 |
|
|
2015 |
|
||
|
Net income |
|
$ |
17,215 |
|
|
$ |
23,691 |
|
|
Depreciation and amortization expense on consolidated investments |
|
|
22,493 |
|
|
|
21,710 |
|
|
Depreciation and amortization expense on unconsolidated affiliates |
|
|
1,851 |
|
|
|
1,690 |
|
|
Gain on property exchange |
|
|
— |
|
|
|
(8,742 |
) |
|
Funds From Operations |
|
$ |
41,559 |
|
|
$ |
38,349 |
|
|
|
|
|
|
|
|
|
|
|
|
Weighted average number of shares and equivalents outstanding - Diluted |
|
|
13,468 |
|
|
|
13,301 |
|
|
Funds From Operations per diluted share |
|
$ |
3.09 |
|
|
$ |
2.88 |
|
Our FFO increased $3.2 million to $41.6 million, or $3.09 per diluted share, during 2016, as compared to $38.3 million, or $2.88 per diluted share, during 2015. The increase in FFO during 2016, as compared to 2015, related primarily to: (i) an increase in income generated at various properties as well as the favorable impact on our net income resulting from the property exchange transaction in May, 2015, and; (ii) a $944,000 net increase in the addback of depreciation and amortization expense incurred at our properties on a consolidated and unconsolidated basis.
Effects of Inflation
Inflation has not had a material impact on our results of operations over the last three years. However, since the healthcare industry is very labor intensive and salaries and benefits are subject to inflationary pressures, as are supply and other costs, we and the operators of our hospital facilities cannot predict the impact that future economic conditions may have on our/their ability to contain future expense increases. Depending on general economic and labor market conditions, the operators of our hospital facilities may experience unfavorable labor market conditions, including a shortage of nurses which may cause an increase in salaries, wages and benefits expense in excess of the inflation rate. Their ability to pass on increased costs associated with providing healthcare to Medicare and Medicaid patients is limited due to various federal, state and local laws which have been enacted that, in certain cases, limit their ability to increase prices. Therefore, there can be no assurance that these factors will not have a material adverse effect on the future results of operations of the operators of our facilities which may affect their ability to make lease payments to us.
39
Most of our leases contain provisions designed to mitigate the adverse impact of inflation. Our hospital leases require all building operating expenses, including maintenance, real estate taxes and other costs, to be paid by the lessee. In addition, certain of the hospital leases contain bonus rental provisions, which require the lessee to pay additional rent to us based on increases in the revenues of the facility over a base year amount. In addition, most of our MOB leases require the tenant to pay an allocable share of operating expenses, including common area maintenance costs, insurance and real estate taxes. These provisions may reduce our exposure to increases in operating costs resulting from inflation. To the extent that some leases do not contain such provisions, our future operating results may be adversely impacted by the effects of inflation.
40
Liquidity and Capital Resources
Year ended December 31, 2017 as compared to December 31, 2016:
Net cash provided by operating activities
Net cash provided by operating activities was $46.0 million during 2017 as compared to $40.7 million during 2016. The $5.3 million increase was attributable to:
|
|
• |
a favorable change of approximately $1.4 million due to an increase in net income plus/minus the adjustments to reconcile net income to net cash provided by operating activities (depreciation and amortization, amortization of debt premium, stock-based compensation, hurricane related expenses and recoveries, and gain on Arlington transaction); |
|
|
• |
a favorable change of $3.6 million in tenant reserves, deposits and deferred and prepaid rents, consisting primarily of $4.6 million received in 2017 from a tenant as reimbursement for their share of the cost of certain tenant improvements; |
|
|
• |
an unfavorable change of $286,000 in rent receivable; |
|
|
• |
a favorable change of $438,000 in accrued expense and other liabilities, and; |
|
|
• |
other combined net favorable changes of approximately $107,000 |
Net cash provided by/(used in) investing activities
Net cash provided by investing activities was $39.5 million during 2017 as compared to $74.8 million of net cash used in investing activities during 2016.
2017:
During 2017, $39.5 million of net cash was provided by investing activities as follows:
|
|
• |
spent $532,000 to fund equity investments in various unconsolidated LLCs; |
|
|
• |
spent approximately $15.3 million in additions to real estate investments, including construction costs for the Henderson Medical Plaza MOB (this property opened in April, 2017), as well as tenant improvements at various MOBs; |
|
|
• |
received $7.0 million of aggregate hurricane related insurance recoveries; |
|
|
• |
spent approximately $1.4 million to fund hurricane related remediation expenses; |
|
|
• |
spent approximately $9.0 million in connection with the July and September, 2017 acquisitions of the Health Center of Hamburg and the Las Palmas FED, respectively, as discussed in Note 3 to the consolidated financial statements – New Construction, Acquisitions, Dispositions and Property Exchange Transaction; |
|
|
• |
spent approximately $7.9 million to acquire the minority interest in a majority-owned LLC (Arlington Medical Properties, LLC); |
|
|
• |
received $65.2 million of net cash proceeds generated in connection with the divestiture of St. Mary’s Professional Office Building, as discussed herein (net of closing costs); |
|
|
• |
$216,000 of installment repayments received in connection with a member loan advanced to an LLC, and; |
|
|
• |
received $1.2 million of cash distributions in excess of income received from our unconsolidated LLCs ($3.6 million of cash distributions received less $2.4 million of equity in income of unconsolidated LLCs). |
2016:
During 2016, we used $74.8 million of net cash in investing activities as follows:
|
|
• |
spent $5.5 million to fund equity investments in unconsolidated LLCs; |
|
|
• |
spent $11.2 million in additions to real estate investments, including the construction costs related to Henderson Medical Plaza MOB (opened in April, 2017), as well as tenant improvements at various MOBs; |
|
|
• |
spent $60.4 million to acquire the real estate assets of four MOBs, as discussed in Note 3 to the consolidated financial statements – New Construction, Acquisitions, Dispositions and Property Exchange Transaction; |
|
|
• |
received $851,000 of cash repayments for an outstanding member loan to an unconsolidated LLC, as discussed in Note 8 to the consolidated financial statements – Summarized Financial Information of Equity Affiliates, and; |
41
|
|
• |
received $1.4 million of cash in excess of income related to our unconsolidated LLCs ($5.8 million of cash distributions received less $4.4 million of equity in income of unconsolidated LLCs). |
Net cash (used in)/provided by financing activities
Net cash used in financing activities was $86.0 million during 2017, as compared to $34.1 million of net cash provided by financing activities during 2016.
2017:
The $86.0 million of cash used in financing activities during 2017 consisted of:
|
|
• |
received $22.6 million of proceeds from two new mortgage notes payable that are non-recourse to us; |
|
|
• |
received $9.4 million of net cash from the issuance of shares of beneficial interest, including $9.1 million of net cash received in connection with our at-the-market equity issuance program, as discussed below; |
|
|
• |
repaid $20.5 million of net borrowings on our revolving credit agreement; |
|
|
• |
repaid $61.0 million on mortgage notes payable that are non-recourse to us, including the repayment of an aggregate of $58.5 million of previously outstanding mortgage notes payable on six properties that were funded utilizing borrowings under our revolving credit agreement (two of which were subsequently refinanced with new mortgages aggregating to $22.6 million, as mentioned above); |
|
|
• |
paid $446,000 of financing costs related to the revolving credit agreement and new mortgage notes payable that are non-recourse to us, and; |
|
|
• |
paid $36.1 million of dividends. |
2016:
The $34.1 million of net cash provided by financing activities during 2016 consisted of:
|
|
• |
received $59.4 million of additional borrowings on our revolving line of credit; |
|
|
• |
received $13.5 million of net cash from the issuance of shares of beneficial interest, $13.2 million of which related to our at-the-market equity issuance program, as discussed below; |
|
|
• |
repaid $3.2 million on mortgages and other notes payable that are non-recourse to us; |
|
|
• |
paid $307,000 of financing costs related to the amendment of our revolving credit facility; |
|
|
• |
paid $35.1 million of dividends, and; |
|
|
• |
paid $30,000 of partial settlements of dividend equivalent rights. |
At-The-Market Equity Issuance Program (“ATM”):
We maintained an at-the-market equity issuance program (“ATM”) pursuant to the terms of which we could sell, from time-to-time, common shares of our beneficial interest up to an aggregate sales price of approximately $23.3 million to or through Merrill Lynch, Pierce, Fenner and Smith, Incorporated (“Merrill Lynch”), as sales agent and/or principal. The common shares were offered pursuant to the Registration Statement filed with the Securities and Exchange Commission, which became effective during the fourth quarter of 2015. During the third quarter of 2017, we met our aggregate sales threshold of $23.3 million pursuant to this program.
42
Pursuant to the ATM Program, during the twelve months ended December 31, 2017, there were 127,499 shares issued at an average price of $74.71 per share which generated approximately $9.1 million of net cash proceeds (net of approximately $400,000, consisting of compensation of $238,000 to Merrill Lynch, as well as $162,000 of other various fees and expenses). Since inception of this ATM program, including shares issued under a prior Registration Statement filed with the Securities and Exchange Commission in November 2012, we have issued 957,415 shares at an average price of $52.22 per share, which generated approximately $47.9 million of net proceeds (net of approximately $2.1 million, consisting of compensation of $1.25 million to Merrill Lynch as well as $840,000 of other various fees and expenses).
During 2016, pursuant to the ATM Program, there were 249,016 shares issued at an average price of $55.30 per share (all of which were issued during the second quarter), which generated approximately $13.2 million of net cash proceeds (net of approximately $558,000, consisting of compensation of $344,000 to Merrill Lynch, as well as $214,000 of other various fees and expenses). There were no shares issued pursuant to an ATM program during 2015.
We have generally used the proceeds generated pursuant to the ATM program to reduce amounts outstanding under our revolving credit agreement. After such repayment of debt, we may re-borrow funds under our revolving credit agreement for general operating purposes, including working capital, capital expenditures, acquisitions, dividend payments and the refinance of third-party debt.
43
Year ended December 31, 2016 as compared to December 31, 2015:
Net cash provided by operating activities
Net cash provided by operating activities was $40.7 million during 2016 as compared to $38.2 million during 2015. The $2.6 million increase was attributable to:
|
|
• |
a favorable change of approximately $3.1 million due to an increase in net income plus the adjustments to reconcile net income to net cash provided by operating activities (depreciation and amortization, amortization of debt premium, stock-based compensation and gain on property exchange); |
|
|
• |
an unfavorable change of $914,000 in rent receivable due, in part, to increased receivables at properties acquired during 2016, and; |
|
|
• |
other combined net favorable changes of approximately $410,000 |
Net cash used in investing activities
Net cash used in investing activities was $74.8 million during 2016 as compared to $44.3 million during 2015. The factors contributing to the $74.8 million of net cash used in investing activities during 2016 are detailed above.
2015:
During 2015, we used $44.3 million of net cash in investing activities as follows:
|
|
• |
spent $667,000 to fund equity investments in unconsolidated LLCs; |
|
|
• |
spent $22.8 million in advances in the form of a member loan to an unconsolidated LLC; |
|
|
• |
spent $5.3 million in additions to real estate investments primarily for tenant improvements at various MOBs; |
|
|
• |
spent $150,000 consisting of a deposit on real estate assets; |
|
|
• |
spent $16.8 million to acquire the real estate assets of a medical office building and two free-standing emergency departments; |
|
|
• |
spent $2.3 million for payment of a note payable related to the purchase of third-party minority interests in six majority-owned LLCs during the third quarter of 2014; |
|
|
• |
received $306,000 of cash as repayment for a member loan to an unconsolidated LLC; |
|
|
• |
received $224,000 of cash in excess of income related to our unconsolidated LLCs ($2.8 million of cash distributions received less $2.5 million of equity in income of unconsolidated LLCs); |
|
|
• |
received $1.1 million of cash proceeds in connection with the refinancing of third-party debt by a majority-owned LLC in which we hold a noncontrolling ownership interest, and; |
|
|
• |
received $2.0 million of cash proceeds in connection with the property exchange with an unrelated third party. |
Net cash provided by financing activities
Net cash provided by financing activities was $34.1 million during 2016 as compared to $6.2 million during 2015. The factors contributing to the $34.1 million of net cash provided by financing activities during 2016 are detailed above.
2015:
The $6.2 million of net cash provided by financing activities during 2015 consisted of:
|
|
• |
received $52.4 million of additional borrowings on our revolving line of credit; |
|
|
• |
received $5.2 million of proceeds related to a new mortgage note payable (refinance) that is non-recourse to us; |
|
|
• |
received $1.7 million of net cash from the issuance of shares of beneficial interest ($1.1 million relates to shares issued in late December, 2014); |
|
|
• |
repaid $17.8 million on mortgages and other notes payable that are non-recourse to us; |
|
|
• |
paid $1.1 million of financing costs on the new revolving credit facility and a new mortgage note payable refinance, and; |
|
|
• |
paid $34.1 million of dividends. |
44
Additional cash flow and dividends paid information for 2017, 2016 and 2015:
As indicated on our consolidated statements of cash flows, we generated net cash provided by operating activities of $46.0 million during 2017, $40.7 million during 2016 and $38.2 million during 2015. As also indicated on our statements of cash flows, noncash and other items such as depreciation and amortization expense, amortization of debt premium, stock-based compensation expense, the 2017 hurricane related expenses and insurance recoveries and the gains recorded during 2017 and 2015, are the primary differences between our net income and net cash provided by operating activities for each year. In addition, as reflected in the cash flows from investing activities section, we received $1.2 million during 2017, $1.4 million during 2016 and $224,000 during 2015, of cash distributions in excess of income from various unconsolidated LLCs which represents our share of the net cash flow distributions from these entities. These cash distributions in excess of income represent operating cash flows net of capital expenditures and debt repayments made by the LLCs.
We therefore generated $47.2 million during 2017, $42.1 million during 2016 and $38.4 million during 2015, related to the operating activities of our properties recorded on a consolidated and an unconsolidated basis. We paid dividends of $36.1 million during 2017, $35.1 million during 2016 and $34.1 million during 2015. During 2017, the $47.2 million of cash generated related to the operating activities of our properties was approximately $11.1 million greater than that $36.1 million of dividends paid. During 2016, the $42.1 million of cash generated related to the operating activities of our properties was approximately $7.0 million greater than the $35.1 million of dividends paid. During 2015, the $38.4 million of cash generated related to the operating activities of our properties exceeded the $34.1 million of dividends paid by approximately $4.3 million.
As indicated in the cash flows from investing activities and cash flows from financing activities sections of the statements of cash flows, there were various other sources and uses of cash during each of the last three years. From time to time, various other sources and uses of cash may include items such as investments and advances made to/from LLCs, additions to real estate investments, acquisitions/divestiture of properties, net borrowings/repayments of debt, and proceeds generated from the issuance of equity. Therefore, in any given period, the funding source for our dividend payments is not wholly dependent on the operating cash flow generated by our properties. Rather, our dividends as well as our capital reinvestments into our existing properties, acquisitions of real property and other investments are funded based upon the aggregate net cash inflows or outflows from all sources and uses of cash from the properties we own either in whole or through LLCs, as outlined above.
In determining and monitoring our dividend level on a quarterly basis, our management and Board of Trustees consider many factors in determining the amount of dividends to be paid each period. These considerations primarily include: (i) the minimum required amount of dividends to be paid in order to maintain our REIT status; (ii) the current and projected operating results of our properties, including those owned in LLCs, and; (iii) our future capital commitments and debt repayments, including those of our LLCs. Based upon the information discussed above, as well as consideration of projections and forecasts of our future operating cash flows, management and the Board of Trustees have determined that our operating cash flows have been sufficient to fund our dividend payments. Future dividend levels will be determined based upon the factors outlined above with consideration given to our projected future results of operations.
We expect to finance all capital expenditures and acquisitions and pay dividends utilizing internally generated and additional funds. Additional funds may be obtained through: (i) borrowings under our $250 million revolving credit facility agreement (which had $67.4 million of available borrowing capacity, net of outstanding borrowings and letters of credit, as of December 31, 2017); (ii) borrowings under or refinancing of existing third-party debt pursuant to mortgage loan agreements entered into by our consolidated and unconsolidated LLCs/LPs; (iii) the issuance of equity, and/or; (iv) the issuance of other long-term debt.
We believe that our operating cash flows, cash and cash equivalents, available borrowing capacity under our revolving credit agreement and access to the capital markets provide us with sufficient capital resources to fund our operating, investing and financing requirements for the next twelve months, including providing sufficient capital to allow us to make distributions necessary to enable us to continue to qualify as a REIT under Sections 856 to 860 of the Internal Revenue Code of 1986. In the event we need to access the capital markets or other sources of financing, there can be no assurance that we will be able to obtain financing on acceptable terms or within an acceptable time. Our inability to obtain financing on terms acceptable to us could have a material unfavorable impact on our results of operations, financial condition and liquidity.
Credit facilities and mortgage debt
Management routinely monitors and analyzes the Trust’s capital structure in an effort to maintain the targeted balance among capital resources including the level of borrowings pursuant to our $250 million revolving credit facility, the level of borrowings pursuant to non-recourse mortgage debt secured by the real property of our properties and our level of equity including consideration
45
of additional equity issuances. This ongoing analysis considers factors such as the current debt market and interest rate environment, the current/projected occupancy and financial performance of our properties, the current loan-to-value ratio of our properties, the Trust’s current stock price, the capital resources required for anticipated acquisitions and the expected capital to be generated by anticipated divestitures. This analysis, together with consideration of the Trust’s current balance of revolving credit agreement borrowings, non-recourse mortgage borrowings and equity, assists management in deciding which capital resource to utilize when events such as refinancing of specific debt components occur or additional funds are required to finance the Trust’s growth.
On May 24, 2016, we amended our revolving credit agreement (“Credit Agreement”) to, among other things, increase the borrowing capacity to $250 million from $185 million previously. The amended Credit Agreement, which is scheduled to mature in March, 2019, includes a $40 million sub limit for letters of credit and a $20 million sub limit for swingline/short-term loans. The Credit Agreement also provides a one-time option to extend the maturity date for an additional one year period, and an option to increase the total facility borrowing capacity up to an additional $50 million, subject to lender agreement. Borrowings under the Credit Agreement are guaranteed by certain subsidiaries of the Trust. In addition, borrowings under the Credit Agreement are secured by first priority security interests in and liens on all equity interests in the Trust’s wholly-owned subsidiaries. Borrowings made pursuant to the Credit Agreement will bear interest, at our option, at one, two, three, or six month LIBOR plus an applicable margin ranging from 1.50% to 2.00% or at the Base Rate plus an applicable margin ranging from 0.50% to 1.00%. The Credit Agreement defines “Base Rate” as the greatest of: (a) the administrative agent’s prime rate; (b) the federal funds effective rate plus 1/2 of 1%, and; (c) one month LIBOR plus 1%. A commitment fee of 0.20% to 0.40% (depending on our total leverage ratio) will be charged on the average unused portion of the revolving credit commitments. The margins over LIBOR, Base Rate and the commitment fee are based upon our ratio of debt to total capital. At December 31, 2017, the applicable margin over the LIBOR rate was 1.625%, the margin over the Base Rate was 0.625%, and the commitment fee was 0.25%.
At December 31, 2017, we had $181.1 million of outstanding borrowings and $1.5 million of letters of credit outstanding against our revolving credit agreement. The carrying amount and fair value of borrowings outstanding pursuant to the Credit Agreement was $181.1 million at December 31, 2017. We had $67.4 million of available borrowing capacity, net of the outstanding borrowings and letters of credit outstanding as of December 31, 2017. There are no compensating balance requirements. The average amount outstanding under our Credit Agreement during the years ended December 31, 2017, 2016 and 2015 was $182.4 million, $164.2 million and $114.3 million, respectively, with corresponding effective interest rates of 2.8%, 2.3% and 2.1%, respectively, including commitment fees.
The Credit Agreement contains customary affirmative and negative covenants, including limitations on certain indebtedness, liens, acquisitions and other investments, fundamental changes, asset dispositions and dividends and other distributions. The Credit Agreement also contains restrictive covenants regarding the Trust’s ratio of total debt to total assets, the fixed charge coverage ratio, the ratio of total secured debt to total asset value, the ratio of total unsecured debt to total unencumbered asset value, and minimum tangible net worth, as well as customary events of default, the occurrence of which may trigger an acceleration of amounts outstanding under the Credit Agreement. We are in compliance with all of the covenants at December 31, 2017. We also believe that we would remain in compliance if the full amount of our commitment was borrowed.
The following table includes a summary of the required compliance ratios, giving effect to the covenants contained in the Credit Agreement (dollar amounts in thousands):
|
|
|
Covenant |
|
|
December 31, 2017 |
|
||
|
Tangible net worth |
|
$ |
136,170 |
|
|
$ |
190,002 |
|
|
Total leverage |
< 60 |
% |
|
|
41.2 |
% |
||
|
Secured leverage |
< 30 |
% |
|
|
11.7 |
% |
||
|
Unencumbered leverage |
< 60 |
% |
|
|
37.7 |
% |
||
|
Fixed charge coverage |
> 1.50x |
|
|
|
3.8x |
|
||
46
As indicated on the following table, we have eleven mortgages, all of which are non-recourse to us, included on our consolidated balance sheet as of December 31, 2017 (amounts in thousands):
|
Facility Name |
|
Outstanding Balance (in thousands)(a.) |
|
|
Interest Rate |
|
|
Maturity Date |
||
|
Sparks Medical Building/Vista Medical Terrace floating rate mortgage loan (b.) |
|
$ |
4,130 |
|
|
|
4.63 |
% |
|
February, 2018 |
|
Centennial Hills Medical Office Building floating rate mortgage loan (c.) |
|
|
9,764 |
|
|
|
4.63 |
% |
|
April, 2018 |
|
Rosenberg Children’s Medical Plaza fixed rate mortgage loan (c.) |
|
|
7,968 |
|
|
|
4.85 |
% |
|
May, 2018 |
|
Vibra Hospital-Corpus Christi fixed rate mortgage loan |
|
|
2,624 |
|
|
|
6.50 |
% |
|
July, 2019 |
|
700 Shadow Lane and Goldring MOBs fixed rate mortgage loan |
|
|
6,059 |
|
|
|
4.54 |
% |
|
June, 2022 |
|
BRB Medical Office Building fixed rate mortgage loan |
|
|
6,126 |
|
|
|
4.27 |
% |
|
December, 2022 |
|
Desert Valley Medical Center fixed rate mortgage loan |
|
|
4,946 |
|
|
|
3.62 |
% |
|
January, 2023 |
|
2704 North Tenaya Way fixed rate mortgage loan |
|
|
7,007 |
|
|
|
4.95 |
% |
|
November, 2023 |
|
Summerlin Hospital Medical Office Building III floating rate mortgage loan |
|
|
13,199 |
|
|
|
4.03 |
% |
|
April, 2024 |
|
Tuscan Professional Building fixed rate mortgage loan |
|
|
4,519 |
|
|
|
5.56 |
% |
|
June, 2025 |
|
Phoenix Children’s East Valley Care Center fixed rate mortgage loan |
|
|
9,400 |
|
|
|
3.95 |
% |
|
January, 2030 |
|
Total, excluding net debt premium and net financing fees |
|
|
75,742 |
|
|
|
|
|
|
|
|
Less net financing fees |
|
|
(680 |
) |
|
|
|
|
|
|
|
Plus net debt premium |
|
|
297 |
|
|
|
|
|
|
|
|
Total mortgage notes payable, non-recourse to us, net |
|
$ |
75,359 |
|
|
|
|
|
|
|
|
|
(a.) |
All mortgage loans require monthly principal payments through maturity and most include a balloon principal payment upon maturity. |
|
|
(b.) |
This loan was fully repaid upon its maturity, utilizing borrowings under our Credit Agreement. |
|
|
(c.) |
This loan is scheduled to mature within the next twelve months, at which time we will decide whether to refinance pursuant to a new mortgage loan or by utilizing borrowings under our Credit Agreement. |
On December, 1, 2017, upon its maturity, the $6.1 million fixed rate mortgage loan on the Phoenix Children’s East Valley Care Center was refinanced with a new $9.4 million fixed rate mortgage, with a maturity date of January, 2030.
On October 2, 2017, upon its maturity, the $10.8 million fixed rate mortgage loan on the Summerlin Hospital Medical Office Building II was fully repaid utilizing borrowings under our Credit Agreement.
On July 3, 2017, upon its maturity, the $6.6 million floating rate mortgage loan on the Auburn Medical Office Building II was fully repaid utilizing borrowings under our Credit Agreement.
On June 1, 2017, upon its maturity, the $4.5 million fixed rate mortgage loan on the Medical Center of Western Connecticut was fully repaid utilizing borrowings under our Credit Agreement.
On April 3, 2017, upon its maturity, the $20.2 million fixed rate mortgage loan on the Peace Health Medical Clinic was fully repaid utilizing borrowings under our Credit Agreement.
On March 31, 2017, upon its maturity, a $10.3 million floating rate mortgage loan on Summerlin Hospital Medical Office Building III was fully repaid. In April, 2017, we refinanced this property with a $13.2 million fixed rate mortgage, with a maturity date of April, 2024.
The mortgages are secured by the real property of the buildings as well as property leases and rents. The mortgages have a combined fair value of approximately $76.3 million as of December 31, 2017. Changes in market rates on our fixed rate debt impacts the fair value of debt, but it has no impact on interest incurred or cash flow.
47
At December 31, 2016, we had fifteen mortgages, all of which were non-recourse to us, included in our consolidated balance sheet. The combined outstanding balance of these fifteen mortgages was $114.2 million (excluding net debt premium of $436,000 and net of net financing fees of $381,000 at December 31, 2016), and had a combined fair value of approximately $115.7 million at December 31, 2016.
Contractual Obligations:
The following table summarizes the schedule of maturities of our outstanding borrowing under our revolving credit facility (“Credit Agreement”), the outstanding mortgages applicable to our properties recorded on a consolidated basis and our other contractual obligations as of December 31, 2017 (amounts in thousands):
|
|
|
Payments Due by Period (dollars in thousands) |
|
|||||||||||||||||
|
Debt and Contractual Obligation |
|
Total |
|
|
Less than 1 Year |
|
|
2-3 years |
|
|
4-5 years |
|
|
More than 5 years |
|
|||||
|
Long-term non-recourse debt-fixed (a) (b) |
|
$ |
61,848 |
|
|
$ |
9,453 |
|
|
$ |
5,673 |
|
|
$ |
13,796 |
|
|
$ |
32,926 |
|
|
Long-term non-recourse debt-variable (a) (b) |
|
|
13,894 |
|
|
|
13,894 |
|
|
|
— |
|
|
|
— |
|
|
|
— |
|
|
Long-term debt-variable (c) |
|
|
181,050 |
|
|
|
— |
|
|
|
181,050 |
|
|
|
— |
|
|
|
— |
|
|
Estimated future interest payments on debt outstanding as of December 31, 2017 (d) |
|
|
20,613 |
|
|
|
8,239 |
|
|
|
5,569 |
|
|
|
3,727 |
|
|
|
3,078 |
|
|
Operating leases (e) |
|
|
27,755 |
|
|
|
464 |
|
|
|
928 |
|
|
|
928 |
|
|
|
25,435 |
|
|
Equity and debt financing commitments (f) |
|
|
362 |
|
|
|
362 |
|
|
|
— |
|
|
|
— |
|
|
|
— |
|
|
Total contractual obligations |
|
$ |
305,522 |
|
|
$ |
32,412 |
|
|
$ |
193,220 |
|
|
$ |
18,451 |
|
|
$ |
61,439 |
|
|
(a) |
The mortgages are secured by the real property of the buildings as well as property leases and rents. Property-specific debt is detailed above. |
|
(b) |
Consists of non-recourse debt with an aggregate fair value of approximately $76.3 million as of December 31, 2017. Changes in market rates on our fixed rate debt impacts the fair value of debt, but it has no impact on interest incurred or cash flow. Excludes $27.8 million of combined third-party debt outstanding as of December 31, 2017, that is non-recourse to us, at the unconsolidated LLCs in which we hold various non-controlling ownership interests (see Note 8 to the consolidated financial statements). |
|
(c) |
Consists of $181.1 million of borrowings outstanding as of December 31, 2017 under the terms of our $250 million Credit Agreement which matures on March 27, 2019. The amount outstanding approximates fair value as of December 31, 2017. |
|
(d) |
Assumes that all debt outstanding as of December 31, 2017, including borrowings under the Credit Agreement, and the eleven loans, which are non-recourse to us, remain outstanding until the stated maturity date of the debt agreements at the same interest rates which were in effect as of December 31, 2017. We have the right to repay borrowings under the Credit Agreement at any time during the term of the agreement, without penalty. Interest payments are expected to be paid utilizing cash flows from operating activities or borrowings under our revolving Credit Agreement. |
|
(e) |
Reflects our future minimum operating lease payment obligations outstanding as of December 31, 2017, as discussed in Note 6-Leases to the Consolidated Financial Statements, in connection with ground leases at fourteen of our consolidated properties. |
|
(f) |
Consists of equity investment and debt financing commitments remaining in connection with our investment at FTX MOB Phase II. |
Off Balance Sheet Arrangements
As of December 31, 2017, we were party to certain off balance sheet arrangements amounting to $1.5 million related to Centennial Hills Medical Properties which were terminated in early 2018.
Market Risks Associated with Financial Instruments
During the third quarter of 2013, we entered into an interest rate cap on a total notional amount of $10 million whereby we paid a premium of $136,000. During the first quarter of 2014, we entered into two additional interest rate cap agreements on a total notional amount of $20 million whereby we paid premiums of $134,500. In exchange for the premium payments, the counterparties agreed to pay us the difference between 1.50% and one-month LIBOR if one-month LIBOR rises above 1.50% during the term of the cap. From inception through the January, 2017 expirations, no payments were made to us by the counterparties pursuant to the terms of these caps.
During the second quarter of 2016, we entered into an interest rate cap on a total notional amount of $30 million whereby we paid a premium of $115,000. In exchange for the premium payment, the counterparties agreed to pay us the difference between
48
1.50% and one-month LIBOR if one-month LIBOR rises above 1.50% during the term of the cap. This interest rate cap became effective in January, 2017, coinciding with the expiration of the above-mentioned interest rate caps and expires in March, 2019. From inception through December 31, 2017, there were no payments made to us by the counterparty pursuant to the terms of this cap.
During the third quarter of 2016, we entered into an additional interest rate cap agreement on a total notional amount of $30 million whereby we paid a premium of $55,000. In exchange for the premium payment, the counterparties agreed to pay us the difference between 1.5% and one-month LIBOR if one-month LIBOR rises above 1.5% during the term of the cap. This interest rate cap became effective in October, 2016 and expires in March, 2019. From inception through December 31, 2017, there were no payments made to us by the counterparty pursuant to the terms of this cap.
The sensitivity analysis related to our fixed and variable rate debt assumes current market rates with all other variables held constant. The fair value of our debt is approximately $257.4 million. The difference between actual amounts outstanding and fair value is approximately $592,000.
The table below presents information about our financial instruments that are sensitive to changes in interest rates, including debt obligations as of December 31, 2017. For debt obligations, the table presents principal cash flows and related weighted average interest rates by contractual maturity dates.
|
|
|
Maturity Date, Year Ending December 31 |
|
|||||||||||||||||||||||||
|
(Dollars in thousands) |
|
2018 |
|
|
2019 |
|
|
2020 |
|
|
2021 |
|
|
2022 |
|
|
Thereafter |
|
|
Total |
|
|||||||
|
Long-term debt: |
|
|
|
|
|
|
|
|
|
|
|
|
|
|
|
|
|
|
|
|
|
|
|
|
|
|
|
|
|
Fixed rate: |
|
|
|
|
|
|
|
|
|
|
|
|
|
|
|
|
|
|
|
|
|
|
|
|
|
|
|
|
|
Debt(a) |
|
$ |
9,453 |
|
|
$ |
3,984 |
|
|
$ |
1,689 |
|
|
$ |
1,845 |
|
|
$ |
11,951 |
|
|
$ |
32,926 |
|
|
$ |
61,848 |
|
|
Average interest rates |
|
|
4.5 |
% |
|
|
4.4 |
% |
|
|
4.3 |
% |
|
|
4.3 |
% |
|
|
4.4 |
% |
|
|
4.2 |
% |
|
|
4.4 |
% |
|
Variable rate: |
|
|
|
|
|
|
|
|
|
|
|
|
|
|
|
|
|
|
|
|
|
|
|
|
|
|
|
|
|
Debt(b) |
|
$ |
13,894 |
|
|
$ |
181,050 |
|
|
$ |
— |
|
|
$ |
— |
|
|
$ |
— |
|
|
$ |
— |
|
|
$ |
194,944 |
|
|
Average interest rates |
|
|
3.1 |
% |
|
|
3.1 |
% |
|
|
— |
|
|
|
— |
|
|
|
— |
|
|
|
— |
|
|
|
3.1 |
% |
|
Interest rate caps: |
|
|
|
|
|
|
|
|
|
|
|
|
|
|
|
|
|
|
|
|
|
|
|
|
|
|
|
|
|
Notional amount |
|
$ |
— |
|
|
$ |
60,000 |
|
|
$ |
— |
|
|
$ |
— |
|
|
$ |
— |
|
|
$ |
— |
|
|
$ |
60,000 |
|
|
Interest rates |
|
|
— |
|
|
|
1.5 |
% |
|
|
— |
|
|
|
— |
|
|
|
— |
|
|
|
— |
|
|
|
1.5 |
% |
|
(a) |
Consists of non-recourse mortgage notes payable. |
|
(b) |
Includes $13.9 million of non-recourse mortgage notes payable and of $181.1 million of outstanding borrowings under the terms of our $250 million revolving credit agreement. |
As calculated based upon our variable rate debt outstanding as of December 31, 2017 that is subject to interest rate fluctuations, and giving effect to the above-mentioned interest rate caps, each 1% change in interest rates would impact our net income by approximately $1.3 million.
Our Consolidated Balance Sheets, Consolidated Statements of Income, Comprehensive Income, Changes in Equity and Cash Flows, together with the reports of KPMG LLP, an independent registered public accounting firm, are included elsewhere herein. Reference is made to the “Index to Financial Statements and Schedule.”
None.
Conclusion Regarding the Effectiveness of Disclosure Controls and Procedures
As of December 31, 2017, under the supervision and with the participation of our management, including our Chief Executive Officer (“CEO”) and Chief Financial Officer (“CFO”), we performed an evaluation of the effectiveness of our disclosure controls and procedures as defined in Rule 13a-15(e) or Rule 15d-15(e) under the Securities and Exchange Act of 1934, as amended (the “1934 Act”). Based on this evaluation, the CEO and CFO have concluded that our disclosure controls and procedures are effective to ensure that material information is recorded, processed, summarized and reported by management on a timely basis in order to comply with our disclosure obligations under the Securities and Exchange Act of 1934 and the SEC rules thereunder.
49
Changes in Internal Control Over Financial Reporting
There have been no changes in our internal control over financial reporting or in other factors during the fourth quarter of 2017 that have materially affected, or are reasonably likely to materially affect, our internal control over financial reporting.
50
Management’s Report on Internal Control Over Financial Reporting
Management is responsible for establishing and maintaining an adequate system of internal control over our financial reporting. In order to evaluate the effectiveness of internal control over financial reporting, as required by Section 404 of the Sarbanes-Oxley Act, management has conducted an assessment, including testing, using the criteria established in Internal Control—Integrated Framework (2013), issued by the Committee of Sponsoring Organizations of the Treadway Commission (COSO). Our system of internal control over financial reporting is designed to provide reasonable assurance regarding the reliability of financial reporting and the preparation and fair presentation of financial statements for external purposes in accordance with U.S. generally accepted accounting principles. Because of its inherent limitations, internal control over financial reporting may not prevent or detect misstatements. Also, projections of any evaluation of effectiveness of internal control over financial reporting to future periods are subject to the risk that controls may become inadequate because of changes in conditions, or that the degree of compliance with the policies or procedures may deteriorate.
Based on its assessment, management has concluded that we maintained effective internal control over financial reporting as of December 31, 2017, based on criteria established in Internal Control—Integrated Framework (2013), issued by the COSO. The effectiveness of our internal control over financial reporting as of December 31, 2017 has been audited by KPMG LLP, an independent registered public accounting firm, as stated in their report which is included herein.
51
Report of Independent Registered Public Accounting Firm
To the Shareholders and Board of Trustees
Universal Health Realty Income Trust:
Opinion on Internal Control Over Financial Reporting
We have audited Universal Health Realty Income Trust and subsidiaries’ (the “Company”) internal control over financial reporting as of December 31, 2017, based on criteria established in Internal Control – Integrated Framework (2013) issued by the Committee of Sponsoring Organizations of the Treadway Commission. In our opinion, the Company maintained, in all material respects, effective internal control over financial reporting as of December 31, 2017, based on criteria established in Internal Control – Integrated Framework (2013) issued by the Committee of Sponsoring Organizations of the Treadway Commission.
We also have audited, in accordance with the standards of the Public Company Accounting Oversight Board (United States) (“PCAOB”), the consolidated balance sheets of the Company as of December 31, 2017 and 2016, the related consolidated statements of income, comprehensive income, changes in equity, and cash flows for each of the years in the three-year period ended December 31, 2017, and the related notes and financial statement schedule III (collectively, the “consolidated financial statements”), and our report dated February 28, 2018, expressed an unqualified opinion on those consolidated financial statements.
Basis for Opinion
The Company’s management is responsible for maintaining effective internal control over financial reporting and for its assessment of the effectiveness of internal control over financial reporting, included in the accompanying Management’s Report on Internal Control Over Financial Reporting. Our responsibility is to express an opinion on the Company’s internal control over financial reporting based on our audit. We are a public accounting firm registered with the PCAOB and are required to be independent with respect to the Company in accordance with the U.S. federal securities laws and the applicable rules and regulations of the Securities and Exchange Commission and the PCAOB.
We conducted our audit in accordance with the standards of the PCAOB. Those standards require that we plan and perform the audit to obtain reasonable assurance about whether effective internal control over financial reporting was maintained in all material respects. Our audit of internal control over financial reporting included obtaining an understanding of internal control over financial reporting, assessing the risk that a material weakness exists, and testing and evaluating the design and operating effectiveness of internal control based on the assessed risk. Our audit also included performing such other procedures as we considered necessary in the circumstances. We believe that our audit provides a reasonable basis for our opinion.
Definition and Limitations of Internal Control Over Financial Reporting
A company’s internal control over financial reporting is a process designed to provide reasonable assurance regarding the reliability of financial reporting and the preparation of financial statements for external purposes in accordance with generally accepted accounting principles. A company’s internal control over financial reporting includes those policies and procedures that (1) pertain to the maintenance of records that, in reasonable detail, accurately and fairly reflect the transactions and dispositions of the assets of the company; (2) provide reasonable assurance that transactions are recorded as necessary to permit preparation of financial statements in accordance with generally accepted accounting principles, and that receipts and expenditures of the company are being made only in accordance with authorizations of management and directors of the company; and (3) provide reasonable assurance regarding prevention or timely detection of unauthorized acquisition, use, or disposition of the company’s assets that could have a material effect on the financial statements.
Because of its inherent limitations, internal control over financial reporting may not prevent or detect misstatements. Also, projections of any evaluation of effectiveness to future periods are subject to the risk that controls may become inadequate because of changes in conditions, or that the degree of compliance with the policies or procedures may deteriorate.
(signed) KPMG LLP
Philadelphia, Pennsylvania
February 28, 2018
52
None.
There is hereby incorporated by reference the information to appear under the captions “Proposal No. 1” (Election of Trustees), “Section 16(a) Beneficial Ownership Reporting Compliance” and “Corporate Governance” in our Proxy Statement to be filed with the Securities and Exchange Commission within 120 days after December 31, 2017. See also “Executive Officers of the Registrant” appearing in Item 1 hereof.
There is hereby incorporated by reference information to appear under the caption “Executive Compensation” in our Proxy Statement to be filed with the Securities and Exchange Commission within 120 days after December 31, 2017.
|
ITEM 12. |
Security Ownership of Certain Beneficial Owners and Management and Related Stockholder Matters |
There is hereby incorporated by reference the information to appear under the caption “Security Ownership of Certain Beneficial Owners and Management” in our Proxy Statement to be filed with the Securities and Exchange Commission within 120 days after December 31, 2017.
There is hereby incorporated by reference the information to appear under the captions “Certain Relationships and Related Transactions” and “Corporate Governance” in our Proxy Statement to be filed with the Securities and Exchange Commission within 120 days after December 31, 2017.
There is hereby incorporated herein by reference the information to appear under the caption “Relationship with Independent Registered Public Accounting Firm” in our Proxy Statement, to be filed with the Securities and Exchange Commission within 120 days after December 31, 2017.
53
|
(a) |
Documents filed as part of this report: |
|
|
(1) |
Financial Statements: See “Index to Financial Statements and Schedule” |
|
|
(2) |
Financial Statement Schedules: See “Index to Financial Statements and Schedule” |
|
|
(3) |
Exhibits: |
|
No. |
|
Description |
|
3.1 |
|
Declaration of Trust, dated as of August 1986, previously filed as Exhibit 4.1 to the Trust’s Registration Statement on Form S-3 (File No. 333-60638) is incorporated herein by reference. (P) |
|
|
|
|
|
3.2 |
|
Amendment to Declaration of Trust, dated as of June 15, 1993, previously filed as Exhibit 4.2 to the Trust’s Registration Statement on Form S-3 (File No. 333-60638) is incorporated herein by reference. (P) |
|
|
|
|
|
3.3 |
|
|
|
|
|
|
|
3.4 |
|
|
|
|
|
|
|
10.1 |
|
Advisory Agreement, dated as of December 24, 1986, between UHS of Delaware, Inc. and the Trust, previously filed as Exhibit 10.2 to the Trust’s Current Report on Form 8-K dated December 24, 1986, is incorporated herein by reference. (P) |
|
|
|
|
|
10.2 |
|
|
|
|
|
|
|
10.3 |
|
Contract of Acquisition, dated as of August 1986, between the Trust and certain subsidiaries of Universal Health Services, Inc., previously filed as Exhibit 10.2 to Amendment No. 3 of the Registration Statement on Form S-11 and S-2 of Universal Health Services, Inc. and the Trust (File No. 33-7872), is incorporated herein by reference. (P) |
|
|
|
|
|
10.4 |
|
Form of Leases, including Form of Master Lease Document Leases, between certain subsidiaries of Universal Health Services, Inc. and the Trust, previously filed as Exhibit 10.3 to Amendment No. 3 of the Registration Statement on Form S-11 and Form S-2 of Universal Health Services, Inc. and the Trust (File No. 33-7872), is incorporated herein by reference. (P) |
|
|
|
|
|
10.5 |
|
Corporate Guaranty of Obligations of Subsidiaries Pursuant to Leases and Contract of Acquisition, dated December 1986, issued by Universal Health Services, Inc. in favor of the Trust, previously filed as Exhibit 10.5 to the Trust’s Current Report on Form 8-K dated December 24, 1986, is incorporated herein by reference. (P) |
|
|
|
|
|
10.6 |
|
Lease, dated December 22, 1993, between the Trust and THC-Chicago, Inc., as lessee, previously filed as Exhibit 10.14 to the Trust’s Annual Report on Form 10-K for the year ended December 31, 1993, is incorporated herein by reference. (P) |
|
|
|
|
|
10.7 |
|
|
|
|
|
|
|
10.8 |
|
|
|
|
|
|
|
10.9 |
|
|
|
|
|
|
54
|
No. |
|
Description |
|
|
||
|
|
|
|
|
10.11 |
|
|
|
|
|
|
|
10.12* |
|
|
|
|
|
|
|
10.13* |
|
|
|
|
|
|
|
11 |
|
|
|
|
|
|
|
21 |
|
|
|
|
|
|
|
23.1 |
|
Consent of Independent Registered Public Accounting Firm, filed herewith. |
|
|
|
|
|
31.1 |
|
|
|
|
|
|
|
31.2 |
|
|
|
|
|
|
|
32.1 |
|
|
|
|
|
|
|
32.2 |
|
|
|
|
|
|
|
101 |
|
INS XBRL Instance Document, filed herewith. |
|
|
|
|
|
101 |
|
SCH XBRL Taxonomy Extension Schema Document, filed herewith. |
|
|
|
|
|
101 |
|
CAL XBRL Taxonomy Extension Calculation Linkbase Document, filed herewith. |
|
|
|
|
|
101 |
|
DEF XBRL Taxonomy Extension Definition Linkbase Document, filed herewith. |
|
|
|
|
|
101 |
|
LAB XBRL Taxonomy Extension Label Linkbase Document, filed herewith. |
|
|
|
|
|
101 |
|
PRE XBRL Taxonomy Extension Presentation Linkbase Document, filed herewith. |
|
|
|
|
|
|
|
|
|
|
|
|
*Management contract or compensatory plan or arrangement.
Exhibits, other than those incorporated by reference, have been included in copies of this Annual Report filed with the Securities and Exchange Commission. Shareholders of the Trust will be provided with copies of those exhibits upon written request to the Trust.
None.
55
Pursuant to the requirements of Section 13 or 15(d) of the Securities Exchange Act of 1934, the registrant has duly caused this report to be signed on its behalf by the undersigned, thereunto duly authorized.
|
|
UNIVERSAL HEALTH REALTY INCOME TRUST |
|
|
|
|
|
|
|
By: |
/S/ ALAN B. MILLER |
|
|
|
Alan B. Miller, Chairman of the Board, Chief Executive Officer and President |
Date: February 28, 2018
Pursuant to the requirements of the Securities Exchange Act of 1934, this report has been signed below by the following persons on behalf of the registrant and in the capacities and on the dates indicated.
|
Signatures |
Title |
Date |
|
|
|
|
|
/S/ ALAN B. MILLER
Alan B. Miller |
Chairman of the Board, Chief Executive Officer and President (Principal Executive Officer) |
February 28, 2018 |
|
|
|
|
|
/S/ JAMES E. DALTON, JR.
James E. Dalton, Jr. |
Trustee |
February 28, 2018 |
|
|
|
|
|
/S/ MICHAEL ALLAN DOMB
Michael Allan Domb |
Trustee |
February 28, 2018 |
|
|
|
|
|
/S/ ELLIOT J. SUSSMAN
Elliot J. Sussman, M.D., M.B.A. |
Trustee |
February 28, 2018 |
|
|
|
|
|
/S/ ROBERT F. MCCADDEN
Robert F. McCadden |
Trustee |
February 28, 2018 |
|
|
|
|
|
/S/ MARC D. MILLER
Marc D. Miller |
Trustee |
February 28, 2018 |
|
|
|
|
|
/S/ CHARLES F. BOYLE
Charles F. Boyle |
Vice President and Chief Financial Officer (Principal Financial and Accounting Officer) |
February 28, 2018 |
56
INDEX TO FINANCIAL STATEMENTS AND SCHEDULE
57
Report of Independent Registered Public Accounting Firm
To the Shareholders and Board of Trustees
Universal Health Realty Income Trust:
Opinion on the Consolidated Financial Statements
We have audited the accompanying consolidated balance sheets of Universal Health Realty Income Trust and subsidiaries (the “Company”) as of December 31, 2017 and 2016, the related consolidated statements of income, comprehensive income, changes in equity, and cash flows for each of the years in the three‑year period ended December 31, 2017, and the related notes and financial statement schedule III (collectively, the “consolidated financial statements”). In our opinion, the consolidated financial statements present fairly, in all material respects, the financial position of the Company as of December 31, 2017 and 2016, and the results of its operations and its cash flows for each of the years in the three‑year period ended December 31, 2017, in conformity with U.S. generally accepted accounting principles.
We also have audited, in accordance with the standards of the Public Company Accounting Oversight Board (United States) (“PCAOB”), the Company’s internal control over financial reporting as of December 31, 2017, based on criteria established in Internal Control – Integrated Framework (2013) issued by the Committee of Sponsoring Organizations of the Treadway Commission, and our report dated February 28, 2018 expressed an unqualified opinion on the effectiveness of the Company’s internal control over financial reporting.
Basis for Opinion
These consolidated financial statements are the responsibility of the Company’s management. Our responsibility is to express an opinion on these consolidated financial statements based on our audits. We are a public accounting firm registered with the PCAOB and are required to be independent with respect to the Company in accordance with the U.S. federal securities laws and the applicable rules and regulations of the Securities and Exchange Commission and the PCAOB.
We conducted our audits in accordance with the standards of the PCAOB. Those standards require that we plan and perform the audit to obtain reasonable assurance about whether the consolidated financial statements are free of material misstatement, whether due to error or fraud. Our audits included performing procedures to assess the risks of material misstatement of the consolidated financial statements, whether due to error or fraud, and performing procedures that respond to those risks. Such procedures included examining, on a test basis, evidence regarding the amounts and disclosures in the consolidated financial statements. Our audits also included evaluating the accounting principles used and significant estimates made by management, as well as evaluating the overall presentation of the consolidated financial statements. We believe that our audits provide a reasonable basis for our opinion.
(signed) KPMG LLP
We have served as the Company’s auditor since 2002.
Philadelphia, Pennsylvania
February 28, 2018
58
UNIVERSAL HEALTH REALTY INCOME TRUST
(dollar amounts in thousands)
|
|
|
December 31, |
|
|
December 31, |
|
||
|
|
|
2017 |
|
|
2016 |
|
||
|
Assets: |
|
|
|
|
|
|
|
|
|
Real Estate Investments: |
|
|
|
|
|
|
|
|
|
Buildings and improvements and construction in progress |
|
$ |
546,634 |
|
|
$ |
534,190 |
|
|
Accumulated depreciation |
|
|
(153,379 |
) |
|
|
(138,588 |
) |
|
|
|
|
393,255 |
|
|
|
395,602 |
|
|
Land |
|
|
53,142 |
|
|
|
51,638 |
|
|
Net Real Estate Investments |
|
|
446,397 |
|
|
|
447,240 |
|
|
Investments in and advances to limited liability companies ("LLCs") |
|
|
4,671 |
|
|
|
35,593 |
|
|
Other Assets: |
|
|
|
|
|
|
|
|
|
Cash and cash equivalents |
|
|
3,387 |
|
|
|
3,930 |
|
|
Base and bonus rent and other receivables from UHS |
|
|
2,680 |
|
|
|
2,321 |
|
|
Rent receivable - other |
|
|
6,422 |
|
|
|
5,291 |
|
|
Intangible assets (net of accumulated amortization of $28.7 million and $27.1 million at December 31, 2017 and December 31, 2016, respectively) |
|
|
20,559 |
|
|
|
23,815 |
|
|
Deferred charges and other assets, net |
|
|
5,892 |
|
|
|
6,560 |
|
|
Total Assets |
|
$ |
490,008 |
|
|
$ |
524,750 |
|
|
Liabilities: |
|
|
|
|
|
|
|
|
|
Line of credit borrowings |
|
$ |
181,050 |
|
|
$ |
201,500 |
|
|
Mortgage notes payable, non-recourse to us, net |
|
|
75,359 |
|
|
|
114,217 |
|
|
Accrued interest |
|
|
540 |
|
|
|
626 |
|
|
Accrued expenses and other liabilities |
|
|
12,188 |
|
|
|
11,809 |
|
|
Tenant reserves, deposits and deferred and prepaid rents |
|
|
10,310 |
|
|
|
5,321 |
|
|
Total Liabilities |
|
|
279,447 |
|
|
|
333,473 |
|
|
Equity: |
|
|
|
|
|
|
|
|
|
Preferred shares of beneficial interest, $.01 par value; 5,000,000 shares authorized; none issued and outstanding |
|
|
— |
|
|
|
— |
|
|
Common shares, $.01 par value; 95,000,000 shares authorized; issued and outstanding: 2017 - 13,735,369; 2016 - 13,599,055 |
|
|
137 |
|
|
|
136 |
|
|
Capital in excess of par value |
|
|
265,335 |
|
|
|
255,656 |
|
|
Cumulative net income |
|
|
618,120 |
|
|
|
572,501 |
|
|
Cumulative dividends |
|
|
(673,175 |
) |
|
|
(637,121 |
) |
|
Accumulated other comprehensive income |
|
|
144 |
|
|
|
105 |
|
|
Total Equity |
|
|
210,561 |
|
|
|
191,277 |
|
|
Total Liabilities and Equity |
|
$ |
490,008 |
|
|
$ |
524,750 |
|
See the accompanying notes to these consolidated financial statements.
59
UNIVERSAL HEALTH REALTY INCOME TRUST
CONSOLIDATED STATEMENTS OF INCOME
(amounts in thousands, except per share amounts)
|
|
|
Year ended December 31, |
|
|||||||||
|
|
|
2017 |
|
|
2016 |
|
|
2015 |
|
|||
|
Revenues: |
|
|
|
|
|
|
|
|
|
|
|
|
|
Base rental - UHS facilities |
|
$ |
16,888 |
|
|
$ |
16,299 |
|
|
$ |
15,955 |
|
|
Base rental - Non-related parties |
|
|
40,335 |
|
|
|
37,060 |
|
|
|
35,157 |
|
|
Bonus rental - UHS facilities |
|
|
4,917 |
|
|
|
4,723 |
|
|
|
4,565 |
|
|
Tenant reimbursements and other - Non-related parties |
|
|
9,198 |
|
|
|
8,113 |
|
|
|
7,490 |
|
|
Tenant reimbursements and other - UHS facilities |
|
|
1,010 |
|
|
|
886 |
|
|
|
783 |
|
|
|
|
|
72,348 |
|
|
|
67,081 |
|
|
|
63,950 |
|
|
Expenses: |
|
|
|
|
|
|
|
|
|
|
|
|
|
Depreciation and amortization |
|
|
25,116 |
|
|
|
22,956 |
|
|
|
22,108 |
|
|
Advisory fees to UHS |
|
|
3,577 |
|
|
|
3,263 |
|
|
|
2,810 |
|
|
Other operating expenses |
|
|
19,511 |
|
|
|
18,220 |
|
|
|
18,152 |
|
|
Transaction costs |
|
|
107 |
|
|
|
528 |
|
|
|
243 |
|
|
Hurricane related expenses |
|
|
4,967 |
|
|
|
— |
|
|
|
— |
|
|
Hurricane insurance recoveries |
|
|
(4,967 |
) |
|
|
— |
|
|
|
— |
|
|
|
|
|
48,311 |
|
|
|
44,967 |
|
|
|
43,313 |
|
|
Income before equity in income of unconsolidated limited liability companies ("LLCs"), interest expense, hurricane insurance recovery proceeds in excess of damaged property write-downs and gain |
|
|
24,037 |
|
|
|
22,114 |
|
|
|
20,637 |
|
|
Equity in income of unconsolidated LLCs |
|
|
2,416 |
|
|
|
4,456 |
|
|
|
2,536 |
|
|
Hurricane insurance recovery proceeds in excess of damaged property write-downs |
|
|
2,033 |
|
|
|
— |
|
|
|
— |
|
|
Gain on Arlington transaction |
|
|
27,196 |
|
|
|
— |
|
|
|
— |
|
|
Gain on property exchange |
|
|
— |
|
|
|
— |
|
|
|
8,742 |
|
|
Interest expense, net |
|
|
(10,063 |
) |
|
|
(9,355 |
) |
|
|
(8,224 |
) |
|
Net income |
|
$ |
45,619 |
|
|
$ |
17,215 |
|
|
$ |
23,691 |
|
|
Basic earnings per share |
|
$ |
3.35 |
|
|
$ |
1.28 |
|
|
$ |
1.78 |
|
|
Diluted earnings per share |
|
$ |
3.35 |
|
|
$ |
1.28 |
|
|
$ |
1.78 |
|
|
Weighted average number of shares outstanding - Basic |
|
|
13,625 |
|
|
|
13,464 |
|
|
|
13,293 |
|
|
Weighted average number of share equivalents |
|
|
— |
|
|
|
4 |
|
|
|
8 |
|
|
Weighted average number of shares and equivalents outstanding - Diluted |
|
|
13,625 |
|
|
|
13,468 |
|
|
|
13,301 |
|
See the accompanying notes to these consolidated financial statements.
60
UNIVERSAL HEALTH REALTY INCOME TRUST
CONSOLIDATED STATEMENTS OF COMPREHENSIVE INCOME
(dollar amounts in thousands)
|
|
|
Year ended December 31, |
|
|||||||||
|
|
|
2017 |
|
|
2016 |
|
|
2015 |
|
|||
|
Net Income |
|
$ |
45,619 |
|
|
$ |
17,215 |
|
|
$ |
23,691 |
|
|
Other comprehensive income/(loss): |
|
|
|
|
|
|
|
|
|
|
|
|
|
Unrealized derivative gains/(losses) on interest rate caps |
|
|
39 |
|
|
|
199 |
|
|
|
(6 |
) |
|
Total other comprehensive income/(loss): |
|
|
39 |
|
|
|
199 |
|
|
|
(6 |
) |
|
Total comprehensive income |
|
$ |
45,658 |
|
|
$ |
17,414 |
|
|
$ |
23,685 |
|
See the accompanying notes to these consolidated financial statements.
61
UNIVERSAL HEALTH REALTY INCOME TRUST
CONSOLIDATED STATEMENTS OF CHANGES IN EQUITY
|
|
|
Common Shares |
|
|
|
|
|
|
|
|
|
|
|
|
|
|
|
|
|
|
|
|
|
|
|
|
|
|||||
|
|
|
|
|
|
|
|
|
|
|
Capital in |
|
|
|
|
|
|
|
|
|
|
Accumulated other |
|
|
UHT |
|
|
|
|
|
|||
|
|
|
Number |
|
|
|
|
|
|
excess of |
|
|
Cumulative |
|
|
Cumulative |
|
|
comprehensive |
|
|
Shareholders' |
|
|
Total |
|
|||||||
|
|
|
of Shares |
|
|
Amount |
|
|
par value |
|
|
net income |
|
|
dividends |
|
|
income/(loss) |
|
|
Equity |
|
|
Equity |
|
||||||||
|
January 1, 2015 |
|
|
13,302 |
|
|
$ |
133 |
|
|
$ |
240,835 |
|
|
$ |
531,595 |
|
|
$ |
(567,894 |
) |
|
$ |
(88 |
) |
|
$ |
204,581 |
|
|
$ |
204,581 |
|
|
Shares of Beneficial Interest: |
|
|
|
|
|
|
|
|
|
|
|
|
|
|
|
|
|
|
|
|
|
|
|
|
|
|
|
|
|
|
|
|
|
Issued |
|
|
25 |
|
|
|
- |
|
|
|
513 |
|
|
|
— |
|
|
|
— |
|
|
|
— |
|
|
|
513 |
|
|
|
513 |
|
|
Partial settlement of dividend equivalent rights |
|
|
— |
|
|
|
— |
|
|
|
(75 |
) |
|
|
— |
|
|
|
— |
|
|
|
— |
|
|
|
(75 |
) |
|
|
(75 |
) |
|
Restricted stock-based compensation expense |
|
|
— |
|
|
|
— |
|
|
|
427 |
|
|
|
— |
|
|
|
— |
|
|
|
— |
|
|
|
427 |
|
|
|
427 |
|
|
Dividends ($2.56/share) |
|
|
— |
|
|
|
— |
|
|
|
— |
|
|
|
— |
|
|
|
(34,089 |
) |
|
|
— |
|
|
|
(34,089 |
) |
|
|
(34,089 |
) |
|
Comprehensive income: |
|
|
|
|
|
|
|
|
|
|
|
|
|
|
|
|
|
|
|
|
|
|
|
|
|
|
|
|
|
|
|
|
|
Net income |
|
|
— |
|
|
|
— |
|
|
|
— |
|
|
|
23,691 |
|
|
|
— |
|
|
|
— |
|
|
|
23,691 |
|
|
|
23,691 |
|
|
Unrealized loss on interest rate cap |
|
|
— |
|
|
|
— |
|
|
|
— |
|
|
|
— |
|
|
|
— |
|
|
|
(6 |
) |
|
|
(6 |
) |
|
|
(6 |
) |
|
Subtotal - comprehensive income |
|
|
|
|
|
|
|
|
|
|
|
|
|
|
23,691 |
|
|
|
|
|
|
|
(6 |
) |
|
|
23,685 |
|
|
|
23,685 |
|
|
January 1, 2016 |
|
|
13,327 |
|
|
|
133 |
|
|
|
241,700 |
|
|
|
555,286 |
|
|
|
(601,983 |
) |
|
|
(94 |
) |
|
|
195,042 |
|
|
|
195,042 |
|
|
Shares of Beneficial Interest: |
|
|
|
|
|
|
|
|
|
|
|
|
|
|
|
|
|
|
|
|
|
|
|
|
|
|
|
|
|
|
|
|
|
Issued |
|
|
272 |
|
|
|
3 |
|
|
|
13,505 |
|
|
|
— |
|
|
|
— |
|
|
|
— |
|
|
|
13,508 |
|
|
|
13,508 |
|
|
Partial settlement of dividend equivalent rights |
|
|
— |
|
|
|
— |
|
|
|
(30 |
) |
|
|
— |
|
|
|
— |
|
|
|
— |
|
|
|
(30 |
) |
|
|
(30 |
) |
|
Restricted stock-based compensation expense |
|
|
— |
|
|
|
— |
|
|
|
481 |
|
|
|
— |
|
|
|
— |
|
|
|
— |
|
|
|
481 |
|
|
|
481 |
|
|
Dividends ($2.60/share) |
|
|
— |
|
|
|
— |
|
|
|
— |
|
|
|
— |
|
|
|
(35,138 |
) |
|
|
— |
|
|
|
(35,138 |
) |
|
|
(35,138 |
) |
|
Comprehensive income: |
|
|
|
|
|
|
|
|
|
|
|
|
|
|
|
|
|
|
|
|
|
|
|
|
|
|
|
|
|
|
|
|
|
Net income |
|
|
— |
|
|
|
— |
|
|
|
— |
|
|
|
17,215 |
|
|
|
— |
|
|
|
— |
|
|
|
17,215 |
|
|
|
17,215 |
|
|
Unrealized gain on interest rate cap |
|
|
— |
|
|
|
— |
|
|
|
— |
|
|
|
— |
|
|
|
— |
|
|
|
199 |
|
|
|
199 |
|
|
|
199 |
|
|
Subtotal - comprehensive income |
|
|
|
|
|
|
|
|
|
|
|
|
|
|
17,215 |
|
|
|
|
|
|
|
199 |
|
|
|
17,414 |
|
|
|
17,414 |
|
|
|
|
|
|
|
|
|
|
|
|
|
|
|
|
|
|
|
|
|
|
|
|
|
|
|
|
|
|
|
|
|
|
|
|
January 1, 2017 |
|
|
13,599 |
|
|
|
136 |
|
|
|
255,656 |
|
|
|
572,501 |
|
|
|
(637,121 |
) |
|
|
105 |
|
|
|
191,277 |
|
|
|
191,277 |
|
|
Shares of Beneficial Interest: |
|
|
|
|
|
|
|
|
|
|
|
|
|
|
|
|
|
|
|
|
|
|
|
|
|
|
|
|
|
|
|
|
|
Issued |
|
|
136 |
|
|
|
1 |
|
|
|
9,141 |
|
|
|
— |
|
|
|
— |
|
|
|
— |
|
|
|
9,142 |
|
|
|
9,142 |
|
|
Restricted stock-based compensation expense |
|
|
— |
|
|
|
— |
|
|
|
538 |
|
|
|
— |
|
|
|
— |
|
|
|
— |
|
|
|
538 |
|
|
|
538 |
|
|
Dividends ($2.64/share) |
|
|
— |
|
|
|
— |
|
|
|
— |
|
|
|
— |
|
|
|
(36,054 |
) |
|
|
— |
|
|
|
(36,054 |
) |
|
|
(36,054 |
) |
|
Comprehensive income: |
|
|
|
|
|
|
|
|
|
|
|
|
|
|
|
|
|
|
|
|
|
|
|
|
|
|
|
|
|
|
|
|
|
Net income |
|
|
— |
|
|
|
— |
|
|
|
— |
|
|
|
45,619 |
|
|
|
— |
|
|
|
— |
|
|
|
45,619 |
|
|
|
45,619 |
|
|
Unrealized gain on interest rate cap |
|
|
— |
|
|
|
— |
|
|
|
— |
|
|
|
— |
|
|
|
— |
|
|
|
39 |
|
|
|
39 |
|
|
|
39 |
|
|
Subtotal - comprehensive income |
|
|
|
|
|
|
|
|
|
|
|
|
|
|
45,619 |
|
|
|
|
|
|
|
39 |
|
|
|
45,658 |
|
|
|
45,658 |
|
|
December 31, 2017 |
|
|
13,735 |
|
|
$ |
137 |
|
|
$ |
265,335 |
|
|
$ |
618,120 |
|
|
$ |
(673,175 |
) |
|
$ |
144 |
|
|
$ |
210,561 |
|
|
$ |
210,561 |
|
See the accompanying notes to these consolidated financial statements.
62
UNIVERSAL HEALTH REALTY INCOME TRUST
CONSOLIDATED STATEMENTS OF CASH FLOWS
(amounts in thousands)
|
|
|
Year ended December 31, |
|
|||||||||
|
|
|
2017 |
|
|
2016 |
|
|
2015 |
|
|||
|
Cash flows from operating activities: |
|
|
|
|
|
|
|
|
|
|
|
|
|
Net income |
|
$ |
45,619 |
|
|
$ |
17,215 |
|
|
$ |
23,691 |
|
|
Adjustments to reconcile net income to net cash provided by operating activities: |
|
|
|
|
|
|
|
|
|
|
|
|
|
Depreciation and amortization |
|
|
25,091 |
|
|
|
23,008 |
|
|
|
22,198 |
|
|
Amortization of debt premium |
|
|
(139 |
) |
|
|
(225 |
) |
|
|
(225 |
) |
|
Stock-based compensation expense |
|
|
538 |
|
|
|
481 |
|
|
|
427 |
|
|
Hurricane related expenses |
|
|
4,967 |
|
|
|
— |
|
|
|
— |
|
|
Hurricane insurance recoveries |
|
|
(4,967 |
) |
|
|
— |
|
|
|
— |
|
|
Hurricane insurance recovery proceeds in excess of damaged property write-downs |
|
|
(2,033 |
) |
|
|
— |
|
|
|
— |
|
|
Gain on Arlington transaction |
|
|
(27,196 |
) |
|
|
— |
|
|
|
— |
|
|
Gain on property exchange |
|
|
— |
|
|
|
— |
|
|
|
(8,742 |
) |
|
Changes in assets and liabilities: |
|
|
|
|
|
|
|
|
|
|
|
|
|
Rent receivable |
|
|
(1,490 |
) |
|
|
(1,204 |
) |
|
|
(290 |
) |
|
Accrued expenses and other liabilities |
|
|
441 |
|
|
|
3 |
|
|
|
(184 |
) |
|
Tenant reserves, deposits and deferred and prepaid rents |
|
|
4,989 |
|
|
|
1,377 |
|
|
|
1,781 |
|
|
Accrued interest |
|
|
(86 |
) |
|
|
122 |
|
|
|
(41 |
) |
|
Leasing costs paid |
|
|
(769 |
) |
|
|
(627 |
) |
|
|
(556 |
) |
|
Other, net |
|
|
1,040 |
|
|
|
583 |
|
|
|
119 |
|
|
Net cash provided by operating activities |
|
|
46,005 |
|
|
|
40,733 |
|
|
|
38,178 |
|
|
Cash flows from investing activities: |
|
|
|
|
|
|
|
|
|
|
|
|
|
Investments in LLCs |
|
|
(532 |
) |
|
|
(5,454 |
) |
|
|
(667 |
) |
|
Repayments of advances made to LLCs |
|
|
216 |
|
|
|
851 |
|
|
|
306 |
|
|
Advances made to LLCs |
|
|
— |
|
|
|
— |
|
|
|
(22,795 |
) |
|
Cash distributions in excess of income from LLCs |
|
|
1,187 |
|
|
|
1,362 |
|
|
|
224 |
|
|
Cash distribution of refinancing proceeds from LLCs |
|
|
— |
|
|
|
— |
|
|
|
1,045 |
|
|
Additions to real estate investments, net |
|
|
(15,313 |
) |
|
|
(11,204 |
) |
|
|
(5,257 |
) |
|
Cash proceeds received from divestiture of property, net |
|
|
65,220 |
|
|
|
— |
|
|
|
— |
|
|
Cash received for property exchange |
|
|
— |
|
|
|
— |
|
|
|
2,000 |
|
|
Hurricane insurance recoveries for damaged real estate property |
|
|
4,967 |
|
|
|
— |
|
|
|
— |
|
|
Hurricane insurance recovery proceeds in excess of damaged property write-downs |
|
|
2,033 |
|
|
|
— |
|
|
|
— |
|
|
Hurricane remediation expenses paid |
|
|
(1,387 |
) |
|
|
— |
|
|
|
— |
|
|
Deposits on real estate assets |
|
|
— |
|
|
|
— |
|
|
|
(150 |
) |
|
Net cash paid for acquisition of properties |
|
|
(9,040 |
) |
|
|
(60,389 |
) |
|
|
(16,765 |
) |
|
Cash paid to acquire minority interests in majority-owned LLCs |
|
|
(7,890 |
) |
|
|
— |
|
|
|
(2,250 |
) |
|
Net cash provided by/(used in) investing activities |
|
|
39,461 |
|
|
|
(74,834 |
) |
|
|
(44,309 |
) |
|
Cash flows from financing activities: |
|
|
|
|
|
|
|
|
|
|
|
|
|
Net borrowings on line of credit |
|
|
— |
|
|
|
59,350 |
|
|
|
52,400 |
|
|
Net repayments on line of credit |
|
|
(20,450 |
) |
|
|
— |
|
|
|
— |
|
|
Proceeds from mortgage notes payable |
|
|
22,600 |
|
|
|
— |
|
|
|
5,200 |
|
|
Repayments of mortgage notes payable |
|
|
(61,021 |
) |
|
|
(3,230 |
) |
|
|
(17,826 |
) |
|
Financing costs paid |
|
|
(446 |
) |
|
|
(307 |
) |
|
|
(1,114 |
) |
|
Dividends paid |
|
|
(36,054 |
) |
|
|
(35,138 |
) |
|
|
(34,089 |
) |
|
Partial settlement of dividends equivalent rights |
|
|
— |
|
|
|
(30 |
) |
|
|
(75 |
) |
|
Issuance of shares of beneficial interest, net |
|
|
9,362 |
|
|
|
13,492 |
|
|
|
1,668 |
|
|
Net cash (used in)/provided by financing activities |
|
|
(86,009 |
) |
|
|
34,137 |
|
|
|
6,164 |
|
|
(Decrease)/increase in cash and cash equivalents |
|
|
(543 |
) |
|
|
36 |
|
|
|
33 |
|
|
Cash and cash equivalents, beginning of period |
|
|
3,930 |
|
|
|
3,894 |
|
|
|
3,861 |
|
|
Cash and cash equivalents, end of period |
|
$ |
3,387 |
|
|
$ |
3,930 |
|
|
$ |
3,894 |
|
|
Supplemental disclosures of cash flow information: |
|
|
|
|
|
|
|
|
|
|
|
|
|
Interest paid |
|
$ |
9,692 |
|
|
$ |
8,895 |
|
|
$ |
8,025 |
|
|
Supplemental disclosures of non-cash transactions: |
|
|
|
|
|
|
|
|
|
|
|
|
|
Acquisitions: |
|
|
|
|
|
|
|
|
|
|
|
|
|
Financing assumed in acquisition |
|
$ |
— |
|
|
$ |
7,499 |
|
|
$ |
— |
|
|
Property Exchange Transaction: |
|
|
|
|
|
|
|
|
|
|
|
|
|
Net assets acquired in property exchange |
|
$ |
— |
|
|
$ |
— |
|
|
$ |
9,886 |
|
|
Net assets relinquished in property exchange |
|
|
— |
|
|
|
— |
|
|
|
(3,144 |
) |
See accompanying notes to these consolidated financial statements.
63
UNIVERSAL HEALTH REALTY INCOME TRUST
NOTES TO CONSOLIDATED FINANCIAL STATEMENTS
December 31, 2017
(1) ORGANIZATION AND SUMMARY OF SIGNIFICANT ACCOUNTING POLICIES
Nature of Operations
Universal Health Realty Income Trust and subsidiaries (the “Trust”) is organized as a Maryland real estate investment trust. We invest in healthcare and human service related facilities currently including acute care hospitals, rehabilitation hospitals, sub-acute facilities, free-standing emergency departments, childcare centers and medical/office buildings. As of February 28, 2018, we have sixty-eight real estate investments located in twenty states consisting of:
|
|
• |
six hospital facilities consisting of three acute care, one rehabilitation and two sub-acute; |
|
|
• |
four free-standing emergency departments (“FEDs”); |
|
|
• |
fifty-four medical/office buildings (“MOBs”), including four owned by unconsolidated limited liability companies (“LLCs”)/limited liability partnerships (“LPs”), and; |
|
|
• |
four preschool and childcare centers. |
Our future results of operations could be unfavorably impacted by deterioration in general economic conditions which could result in increases in the number of people unemployed and/or uninsured. Should that occur, it may result in decreased occupancy rates at our medical office buildings as well as a reduction in the revenues earned by the operators of our hospital facilities which would unfavorably impact our future bonus rentals (on the three Universal Health Services, Inc. hospital facilities) and may potentially have a negative impact on the future lease renewal terms and the underlying value of the hospital properties. Management is unable to predict the effect, if any, that these factors may have on the operating results of our lessees or on their ability to meet their obligations under the terms of their leases with us. Management’s estimate of future cash flows from our leased properties could be materially affected in the near term, if certain of the leases are not renewed or renewed with less favorable terms at the end of their lease terms.
Revenue Recognition
Our revenues consist primarily of rentals received from tenants, which are comprised of minimum rent (base rentals), bonus rentals and reimbursements from tenants for their pro-rata share of expenses such as common area maintenance costs, real estate taxes and utilities.
The minimum rent for our six hospital facilities, which is paid monthly, is fixed over the term of the respective leases which are scheduled to expire in 2019 (2 hospitals) or 2021 (4 hospitals). In addition, for the three hospital facilities leased to subsidiaries of UHS, bonus rents are paid on a quarterly basis, based upon a computation that compares the hospitals’ current quarter net revenues to the corresponding quarter in the base year. Rental income recorded by our other properties, including our consolidated and unconsolidated MOBs, relating to leases in excess of one year in length, is recognized using the straight-line method under which contractual rents are recognized evenly over the lease term regardless of when payments are due. The amount of rental revenue resulting from straight-line rent adjustments is dependent on many factors including the nature and amount of any rental concessions granted to new tenants, stipulated rent increases under existing leases, as well as the acquisitions and sales of properties that have existing in-place leases with terms in excess of one year. As a result, the straight-line adjustments to rental revenue may vary from period-to-period. Tenant reimbursements for operating expenses are accrued as revenue in the same period the related expenses are incurred.
Real Estate Investments
Land, buildings and capital improvements are recorded at cost and stated at cost less accumulated depreciation. Expenditures for maintenance and repairs are charged to operations as incurred. Renovations or replacements, which improve or extend the life of an asset, are capitalized and depreciated over their estimated useful lives.
Purchase Accounting for Acquisition of Investments in Real Estate
Purchase accounting is applied to the assets and liabilities related to all real estate investments acquired from third parties. In accordance with current accounting guidance, the fair value of the real estate acquired is allocated to the acquired tangible assets, consisting primarily of land, building and tenant improvements, and identified intangible assets and liabilities, consisting of the value
64
of above-market and below-market leases, and acquired ground leases, based in each case on their fair values. Loan premiums, in the case of above market rate loans, or loan discounts, in the case of below market loans, are recorded based on the fair value of any loans assumed in connection with acquiring the real estate.
The fair values of the tangible assets of an acquired property are determined based on comparable land sales for land and replacement costs adjusted for physical and market obsolescence for the improvements. The fair values of the tangible assets of an acquired property are also determined by valuing the property as if it were vacant, and the “as-if-vacant” value is then allocated to land, building and tenant improvements based on management’s determination of the relative fair values of these assets. Management determines the as-if-vacant fair value of a property based on assumptions that a market participant would use, which is similar to methods used by independent appraisers. In addition, there is intangible value related to having tenants leasing space in the purchased property, which is referred to as in-place lease value. Such value results primarily from the buyer of a leased property avoiding the costs associated with leasing the property and also avoiding rent losses and unreimbursed operating expenses during the hypothetical lease-up period. Factors considered by management in performing these analyses include an estimate of carrying costs during the expected lease-up periods considering current market conditions and costs to execute similar leases. In estimating carrying costs, management includes real estate taxes, insurance and other operating expenses and estimates of lost rental revenue during the expected lease-up periods based on current market demand. Management also estimates costs to execute similar leases including leasing commissions, tenant improvements, legal and other related costs. The value of in-place leases are amortized to expense over the remaining initial terms of the respective leases.
In allocating the fair value of the identified intangible assets and liabilities of an acquired property, above-market and below-market in-place lease values are recorded based on the present value (using an interest rate which reflects the risks associated with the leases acquired) of the difference between (i) the contractual amounts to be paid pursuant to the in-place leases and (ii) estimated fair market lease rates from the perspective of a market participant for the corresponding in-place leases, measured, for above-market leases, over a period equal to the remaining non-cancelable term of the lease and, for below-market leases, over a period equal to the initial term plus any below market fixed rate renewal periods. The capitalized above-market lease values are amortized as a reduction of rental income over the remaining non-cancelable terms of the respective leases. The capitalized below-market lease values, also referred to as acquired lease obligations, are amortized as an increase to rental income over the initial terms of the respective leases.
Our intangible assets primarily consist of the value of in-place leases at December 31, 2017, and will be amortized over the remaining lease terms (aggregate weighted average of 4.4 years at December 31, 2017) and is expected to result in estimated aggregate amortization expense of $3.7 million, $3.1 million, $2.9 million $2.5 million and $1.8 million for 2018, 2019, 2020, 2021 and 2022, respectively. Amortization expense on intangible values of in place leases and above-market leases was $4.9 million for the year ended December 31, 2017, $5.1 million for the year ended December 31, 2016 and $5.5 million for the year ended December 31, 2015. Depreciation is computed using the straight-line method over the estimated useful lives of the buildings and capital improvements. The estimated original useful lives of our buildings ranges from 25-45 years and the estimated original useful lives of capital improvements ranges from 3-35 years. On a consolidated basis, depreciation expense was $19.7 million for the year ended December 31, 2017, $17.4 million for the year ended December 31, 2016 and $16.2 million for the year ended December 31, 2015.
Cash and Cash Equivalents
We consider all highly liquid investment instruments with original maturities of three months or less to be cash equivalents.
Asset Impairment
We review each of our properties for indicators that its carrying amount may not be recoverable. Examples of such indicators may include a significant decrease in the market price of the property, a change in the expected holding period for the property, a significant adverse change in how the property is being used or expected to be used based on the underwriting at the time of acquisition, an accumulation of costs significantly in excess of the amount originally expected for the acquisition or development of the property, or a history of operating or cash flow losses of the property. When such impairment indicators exist, we review an estimate of the future undiscounted net cash flows (excluding interest charges) expected to result from the real estate investment’s use and eventual disposition and compare that estimate to the carrying value of the property. We consider factors such as future operating income, trends and prospects, as well as the effects of leasing demand, competition and other factors. If our future undiscounted net cash flow evaluation indicates that we are unable to recover the carrying value of a real estate investment, an impairment loss is recorded to the extent that the carrying value exceeds the estimated fair value of the property. These losses have a direct impact on our net income because recording an impairment loss results in an immediate negative adjustment to net income. The evaluation of anticipated cash flows is highly subjective and is based in part on assumptions regarding future occupancy, rental rates and capital requirements that could differ materially from actual results in future periods. Since cash flows on properties considered to be long-lived assets to be held and used are considered on an undiscounted basis to determine whether the carrying value of a property is recoverable, our strategy of holding properties over the long-term directly decreases the likelihood of their carrying values not being
65
recoverable and therefore requiring the recording of an impairment loss. If our strategy changes or market conditions otherwise dictate an earlier sale date, an impairment loss may be recognized and such loss could be material. If we determine that the asset fails the recoverability test, the affected assets must be reduced to their fair value.
We generally estimate the fair value of rental properties utilizing a discounted cash flow analysis that includes projections of future revenues, expenses and capital improvement costs that a market participant would use based on the highest and best use of the asset, which is similar to the income approach that is commonly utilized by appraisers. In certain cases, we may supplement this analysis by obtaining outside broker opinions of value or third party appraisals.
In considering whether to classify a property as held for sale, we consider factors such as whether management has committed to a plan to sell the property, the property is available for immediate sale in its present condition for a price that is reasonable in relation to its current value, the sale of the property is probable, and actions required for management to complete the plan indicate that it is unlikely that any significant changes will made to the plan. If all the criteria are met, we classify the property as held for sale. Upon being classified as held for sale, depreciation and amortization related to the property ceases and it is recorded at the lower of its carrying amount or fair value less cost to sell. The assets and related liabilities of the property are classified separately on the consolidated balance sheets for the most recent reporting period. Only those assets held for sale that constitute a strategic shift or that will have a major effect on our operations are classified as discontinued operations.
An other than temporary impairment of an investment in an LLC is recognized when the carrying value of the investment is not considered recoverable based on evaluation of the severity and duration of the decline in value, including projected declines in cash flow. To the extent impairment has occurred, the excess carrying value of the asset over its estimated fair value is charged to income.
Investments in Limited Liability Companies (“LLCs”)
In accordance with the professional standards and guidance relating to accounting for investments and real estate ventures, we account for our unconsolidated investments in LLCs/LPs which we do not control using the equity method of accounting. The third-party members in these investments have equal voting rights with regards to issues such as, but not limited to: (i) divestiture of property; (ii) annual budget approval, and; (iii) financing commitments. These investments, which represent 33% to 95% non-controlling ownership interests, are recorded initially at our cost and subsequently adjusted for our net equity in the net income, cash contributions to, and distributions from, the investments. Pursuant to certain agreements, allocations of sales proceeds and profits and losses of some of the LLC investments may be allocated disproportionately as compared to ownership interests after specified preferred return rate thresholds have been satisfied.
In the Consolidated Statements of Cash Flows, distributions and equity in net income are presented net as cash flows from operating activities. Cumulative distributions received exceeding cumulative equity in earnings represent returns of investments and are classified as cash flows from investing activities in the Consolidated Statements of Cash Flows.
At December 31, 2017, we have non-controlling equity investments or commitments in four jointly-owned LLCs/LPs which own MOBs. We accounted for these LLCs/LPs on an unconsolidated basis pursuant to the equity method since they are not variable interest entities and we do not have a controlling voting interest. The majority of these LLCs are joint-ventures between us and non-related parties that manage and hold minority ownership interests in the entities. Each entity is generally self-sustained from a cash flow perspective and generates sufficient cash flow to meet its operating cash flow requirements and service the third-party debt (if applicable) that is non-recourse to us. Although there is typically no ongoing financial support required from us to these entities since they are cash-flow sufficient, we may, from time to time, provide funding for certain purposes such as, but not limited to, significant capital expenditures, leasehold improvements and debt financing. Although we are not obligated to do so, if approved by us at our sole discretion, additional cash fundings are typically advanced as equity or member loans. These entities maintain property insurance on the properties.
Federal Income Taxes
No provision has been made for federal income tax purposes since we qualify as a real estate investment trust under Sections 856 to 860 of the Internal Revenue Code of 1986, and intend to continue to remain so qualified. To qualify as a REIT, we must meet certain organizational and operational requirements, including a requirement to distribute at least 90% of our annual REIT taxable income to shareholders. As a REIT, we generally will not be subject to federal, state or local income tax on income that we distribute as dividends to our shareholders. We have historically distributed, and intend to continue to distribute, 100% of our annual REIT taxable income to our shareholders.
We are subject to a federal excise tax computed on a calendar year basis. The excise tax equals 4% of the amount by which 85% of our ordinary income plus 95% of any capital gain income for the calendar year exceeds cash distributions during the calendar year, as defined. No provision for excise tax has been reflected in the financial statements as no tax was due.
66
Earnings and profits, which determine the taxability of dividends to shareholders, will differ from net income reported for financial reporting purposes due to the differences for federal tax purposes in the cost basis of assets and in the estimated useful lives used to compute depreciation and the recording of provision for impairment losses.
The aggregate gross cost basis and net book value of the properties for federal income tax purposes are approximately $584 million and $384 million, respectively, at December 31, 2017. The aggregate cost basis and net book value of the properties for federal income tax purposes were approximately $561 million and $385 million, respectively, at December 31, 2016.
Stock-Based Compensation
We expense the grant-date fair value of restricted stock awards over the vesting period. We recognize the grant-date fair value of equity-based compensation and account for these transactions using the fair-value based method.
The expense associated with share-based compensation arrangements is a non-cash charge. In the Consolidated Statements of Cash Flows, share-based compensation expense is an adjustment to reconcile net income to cash provided by operating activities.
Fair Value
Fair value is a market-based measurement, not an entity-specific measurement and determined based upon the assumptions that market participants would use in pricing the asset or liability. As a basis for considering market participant assumptions in fair value measurements, accounting requirements establish a fair value hierarchy that distinguishes between market participant assumptions based on market data obtained from sources independent of the reporting entity (observable inputs that are classified within Level 1 and 2 of the hierarchy) and the reporting entity’s own assumptions about market participant assumptions (unobservable inputs classified within Level 3 of the hierarchy). In instances when it is necessary to establish the fair value of our real estate investments and investments in LLCs we use unobservable inputs which are typically based on our own assumptions.
The fair value of our real estate investments, components of real estate investments and debt assumed in conjunction with acquisition and impairment activity, are considered to be Level 3 valuations as they are primarily based upon an income capitalization approach. Significant inputs into the models used to determine fair value of real estate investments and components of real estate investments include future cash flow projections, holding period, terminal capitalization rate and discount rates. Additionally the fair value of land takes into consideration comparable sales, as adjusted for site specific factors. The fair value of real estate investments is based upon significant judgments made by management, and accordingly, we typically obtain assistance from third party valuation specialists. Significant inputs into the models used to determine the fair value of assumed mortgages included the outstanding balance, term, stated interest rate and current market rate of the mortgage.
The carrying amounts reported in the balance sheet for cash, receivables, and short-term borrowings approximate their fair values due to the short-term nature of these instruments. Accordingly, these items are excluded from the fair value disclosures included elsewhere in these notes to the consolidated financial statements.
Concentration of Revenues
The rental revenue earned pursuant to the lease on McAllen Medical Center generated approximately 10% during 2017, and 11% during each of 2016 and 2015, of our consolidated revenues.
Use of Estimates
The preparation of financial statements in conformity with generally accepted accounting principles in the United States of America requires us to make estimates and assumptions that affect the amounts reported in our consolidated financial statements and accompanying notes. Actual results could differ from those estimates.
New Accounting Standards
Except as noted below there were no new accounting pronouncements that impacted, or are expected to impact us.
In November 2016, the FASB issued ASU 2016-18, Statement of Cash Flows: Restricted Cash ("ASU 2016-18"). ASU 2016-18 requires entities to show the changes in the total of cash and restricted cash in the statement of cash flows. As a result, entities will no longer present transfers between cash and restricted cash in the statement of cash flows. ASU 2016-18 will be effective for us retrospectively for annual and interim reporting periods beginning after December 15, 2017 with early adoption permitted. We do not believe ASU 2016-18 will have a material impact on our consolidated financial statements.
In August, 2016, the Financial Accounting Standards Board (“FASB”) issued ASU No. 2016-15, Classification of Certain Cash Receipts and Cash Payments, which adds or clarifies guidance of the classification of certain cash receipts and payments in the statement of cash flows with the intent to alleviate diversity in practice for classifying various types of cash flows. This ASU is
67
effective for annual and interim reporting periods beginning after December 15, 2017, with early adoption permitted. We are currently evaluating the impact of this ASU on our statement of cash flows.
In February 2016, the FASB issued ASU 2016-02, Leases (Topic 842), which sets out the principles for the recognition, measurement, presentation and disclosure of leases for both parties to a contract (i.e., lessees and lessors). The new standard requires lessees to apply a dual approach, classifying leases as either finance or operating leases based on the principle of whether or not the lease is effectively a financed purchase by the lessee. This classification will determine whether lease expense is recognized based on an effective interest method or on a straight-line basis over the term of the lease. A lessee is also required to record a right-of-use asset and a lease liability for all leases with a term of greater than 12 months regardless of their classification. Leases with a term of 12 months or less will be accounted for similar to existing guidance for operating leases today. The new standard requires lessors to account for leases using an approach that is substantially equivalent to existing guidance for sales-type leases, direct financing leases and operating leases. Upon adoption of this new standard, we will recognize significant rights of use assets and lease obligation liabilities on the consolidated balance sheet, primarily as a result of our ground lease obligations. ASU 2016-02 supersedes the previous leases standard, Leases (Topic 840). The standard is effective on January 1, 2019, with early adoption permitted. We are currently in the process of evaluating the impact the adoption of ASU 2016-02 will have on our financial position or results of operations.
In 2014, the FASB issued ASU 2014-09, Revenue From Contracts With Customers (“ASU 2014-09”), which outlines a comprehensive model for entities to use in accounting for revenue arising from contracts with customers. ASU 2014-09 states that “an entity recognizes revenue to depict the transfer of promised goods or services to customers in an amount that reflects the consideration to which the entity expects to be entitled in exchange for those goods or services.” While ASU 2014-09 specifically references contracts with customers, it may apply to certain other transactions such as the sale of real estate or equipment. In 2015, the FASB provided for a one-year deferral of the effective date for ASU 2014-09, which is now effective for us beginning January 1, 2018. We expect to adopt the standard using the modified retrospective approach, which requires a cumulative-effect adjustment to equity as of the date of adoption. We do not expect this adoption to have a material impact on our consolidated financial statements, as a substantial portion of our revenue consists of rental income from leasing arrangements, which is specifically excluded from ASU 2014-09.
In January, 2017, the FASB issued ASU 2017-01, “Business Combinations (Topic 805) - Clarifying the Definition of a Business” to clarify the definition of a business in order to allow for the evaluation of whether transactions should be accounted for as acquisitions or disposals of assets or businesses. ASU 2017-01 will be effective for fiscal years beginning after December 15, 2017, including interim periods within those fiscal years. Subsequent to our adoption of this guidance in January, 2017, we believe that our property acquisitions will generally qualify as asset acquisitions under the standard, which permits the capitalization of acquisition costs to the underlying assets. We adopted this new guidance effective January 1, 2017. This new guidance is not expected to have a significant impact on our financial statements.
(2) RELATIONSHIP WITH UHS AND RELATED PARTY TRANSACTIONS
Leases: We commenced operations in 1986 by purchasing properties of certain subsidiaries from UHS and immediately leasing the properties back to the respective subsidiaries. Most of the leases were entered into at the time we commenced operations and provided for initial terms of 13 to 15 years with up to six additional 5-year renewal terms. The current base rentals and lease and renewal terms for each of the three hospital facilities leased to subsidiaries of UHS are provided below. The base rents are paid monthly and each lease also provides for additional or bonus rents which are computed and paid on a quarterly basis based upon a computation that compares current quarter revenue to a corresponding quarter in the base year. The three hospital leases with subsidiaries of UHS are unconditionally guaranteed by UHS and are cross-defaulted with one another.
The combined revenues generated from the leases on the UHS hospital facilities accounted for approximately 25% of our total revenue for the five years ended December 31, 2017 (approximately 22%, 24% and 25% for the years ended December 31, 2017, 2016 and 2015 respectively). Including 100% of the revenues generated at the unconsolidated LLCs in which we have various non-controlling equity interests ranging from 33% to 95%, the leases on the UHS hospital facilities accounted for approximately 20% of the combined consolidated and unconsolidated revenue for the five years ended December 31, 2017 (approximately 19% for each of the years ended December 31, 2017 and 2016, and 20% for the year ended December 31, 2015). In addition, we have seventeen MOBs, or free-standing emergency departments (“FEDs”), that are either wholly or jointly-owned by us, that include tenants which are subsidiaries of UHS.
Pursuant to the Master Lease Document by and among us and certain subsidiaries of UHS, dated December 24, 1986 (the “Master Lease”), which governs the leases of all hospital properties with subsidiaries of UHS, UHS has the option to renew the leases at the lease terms described below by providing notice to us at least 90 days prior to the termination of the then current term. UHS also
68
has the right to purchase the respective leased facilities at the end of the lease terms or any renewal terms at the appraised fair market value. In addition, the Master Lease, as amended during 2006, includes a change of control provision whereby UHS has the right, upon one month’s notice should a change of control of the Trust occur, to purchase any or all of the three leased hospital properties listed below at their appraised fair market value. Additionally, UHS has rights of first refusal to: (i) purchase the respective leased facilities during and for 180 days after the lease terms at the same price, terms and conditions of any third-party offer, or; (ii) renew the lease on the respective leased facility at the end of, and for 180 days after, the lease term at the same terms and conditions pursuant to any third-party offer.
The table below details the existing lease terms and renewal options for our three acute care hospitals operated by wholly-owned subsidiaries of UHS:
|
Hospital Name |
|
Annual Minimum Rent |
|
|
End of Lease Term |
|
Renewal Term (years) |
|
|
||
|
McAllen Medical Center |
|
$ |
5,485,000 |
|
|
December, 2021 |
|
|
10 |
|
(a) |
|
Wellington Regional Medical Center |
|
$ |
3,030,000 |
|
|
December, 2021 |
|
|
10 |
|
(b) |
|
Southwest Healthcare System, Inland Valley Campus |
|
$ |
2,648,000 |
|
|
December, 2021 |
|
|
10 |
|
(b) |
|
(a) |
UHS has two 5-year renewal options at existing lease rates (through 2031). |
|
(b) |
UHS has two 5-year renewal options at fair market value lease rates (2022 through 2031). |
Management cannot predict whether the leases with subsidiaries of UHS, which have renewal options at existing lease rates or fair market value lease rates, or any of our other leases, will be renewed at the end of their lease term. If the leases are not renewed at their current rates or the fair market value lease rates, we would be required to find other operators for those facilities and/or enter into leases on terms potentially less favorable to us than the current leases. In addition, if subsidiaries of UHS exercise their options to purchase the respective leased hospital or FED facilities upon expiration of the lease terms, our future revenues could decrease if we were unable to earn a favorable rate of return on the sale proceeds received, as compared to the rental revenue currently earned pursuant to these leases.
In April, 2017, the recently constructed Henderson Medical Plaza MOB received its certificate of occupancy. Henderson Medical Plaza is located on the campus of the Henderson Hospital Medical Center, a newly constructed acute care hospital that is owned and operated by a subsidiary of UHS and was completed and opened during the fourth quarter of 2016. A ground lease has been executed between the limited liability company that owns the MOB and a subsidiary of UHS, the terms of which include a seventy-five year lease term with two, ten-year renewal options at the lessee’s option at an adjusting lease rate. We have invested net cash of approximately $12.4 million on the development and construction of this MOB as of December 31, 2017.
During the first quarter of 2015, we purchased from wholly-owned subsidiaries of UHS, the real property of two newly-constructed and recently opened FEDs located in Weslaco and Mission, Texas. Each FED consists of approximately 13,600 square feet and is operated by wholly-owned subsidiaries of UHS. In connection with these acquisitions, ten-year lease agreements with six, 5-year renewal terms were executed with UHS for each FED. The first four, 5-year renewal terms (covering years 2025 through 2044) include 2% annual lease rate increases, computed on a cumulative and compounded basis, and the last two, 5-year renewal terms (covering the years 2045 through 2054) will be at the then fair market value lease rates. These leases are cross-defaulted with one another. UHS has the option to purchase the leased properties upon the expiration of the fixed term and each five-year extended term at the fair market value at that time. The aggregate acquisition cost of these facilities was approximately $12.8 million, and the aggregate rental revenue earned by us at the commencement of the leases is approximately $900,000 annually.
Advisory Agreement: UHS of Delaware, Inc. (the “Advisor”), a wholly-owned subsidiary of UHS, serves as Advisor to us under an Advisory Agreement (the “Advisory Agreement”) dated December 24, 1986. Pursuant to the Advisory Agreement, the Advisor is obligated to present an investment program to us, to use its best efforts to obtain investments suitable for such program (although it is not obligated to present any particular investment opportunity to us), to provide administrative services to us and to conduct our day-to-day affairs. All transactions between us and UHS must be approved by the Trustees who are unaffiliated with UHS (the “Independent Trustees”). In performing its services under the Advisory Agreement, the Advisor may utilize independent professional services, including accounting, legal, tax and other services, for which the Advisor is reimbursed directly by us. The Advisory Agreement may be terminated for any reason upon sixty days written notice by us or the Advisor. The Advisory Agreement expires on December 31 of each year; however, it is renewable by us, subject to a determination by the Independent Trustees, that the Advisor’s performance has been satisfactory. Our advisory fee was 0.70% during each of 2017, 2016 and 2015 of our average invested real estate assets, as derived from our consolidated balance sheet. In December of 2017, based upon a review of our advisory fee and other general and administrative expenses as compared to an industry peer group, the Advisory Agreement was renewed for 2018 pursuant to the same terms as the Advisory Agreement in place during the last three years.
69
The average real estate assets for advisory fee calculation purposes exclude certain items from our consolidated balance sheet such as, among other things, accumulated depreciation, cash and cash equivalents, base and bonus rent receivables, deferred charges and other assets. The advisory fee is payable quarterly, subject to adjustment at year-end based upon our audited financial statements. In addition, the Advisor is entitled to an annual incentive fee equal to 20% of the amount by which cash available for distribution to shareholders for each year, as defined in the Advisory Agreement, exceeds 15% of our equity as shown on our consolidated balance sheet, determined in accordance with generally accepted accounting principles without reduction for return of capital dividends. The Advisory Agreement defines cash available for distribution to shareholders as net cash flow from operations less deductions for, among other things, amounts required to discharge our debt and liabilities and reserves for replacement and capital improvements to our properties and investments. No incentive fees were paid during 2017, 2016 or 2015 since the incentive fee requirements were not achieved. Advisory fees incurred and paid (or payable) to UHS amounted to $3.6 million during 2017, $3.3 million during 2016 and $2.8 million during 2015 and were based upon average invested real estate assets of $511 million, $466 million and $401 million during 2017, 2016 and 2015, respectively.
Officers and Employees: Our officers are all employees of a wholly-owned subsidiary of UHS and although as of December 31, 2017 we had no salaried employees, our officers do typically receive annual stock-based compensation awards in the form of restricted stock. In special circumstances, if warranted and deemed appropriate by the Compensation Committee of the Board of Trustees, our officers may also receive one-time compensation awards in the form of restricted stock and/or cash bonuses.
Share Ownership: As of December 31, 2017 and 2016, UHS owned 5.7% and 5.8%, respectively, of our outstanding shares of beneficial interest.
SEC reporting requirements of UHS: UHS is subject to the reporting requirements of the Securities and Exchange Commission (“SEC”) and is required to file annual reports containing audited financial information and quarterly reports containing unaudited financial information. Since the leases on the hospital facilities leased to wholly-owned subsidiaries of UHS comprised approximately 22%, 24% and 25% of our consolidated revenues for the years ended December 31, 2017, 2016 and 2015, respectively, and since a subsidiary of UHS is our Advisor, you are encouraged to obtain the publicly available filings for Universal Health Services, Inc. from the SEC’s website. These filings are the sole responsibility of UHS and are not incorporated by reference herein.
70
(3) NEW CONSTRUCTION, ACQUISITIONS, DISPOSITIONS AND PROPERTY EXCHANGE TRANSACTION
2017:
Acquisitions:
During 2017, we paid approximately $9.0 million to:
|
|
• |
purchase the Las Palmas Del Sol Emergency Center – West, an FED located in El Paso, Texas for a purchase price of approximately $4.2 million (including approximately $60,000 of transaction costs). This FED is 100% leased under the terms of a ten year triple net lease that had a remaining lease term of approximately 9 years at the time of purchase, with two, five year renewal options. |
|
|
• |
purchase the Health Center at Hamburg located in Hamburg, Pennsylvania for a purchase price of approximately $4.8 million (including approximately $96,000 of transactions costs). This medical office building is 100% leased under the terms of a fifteen year triple net lease and had a remaining lease term of approximately 8.5 years at the time of purchase, with two, five year renewal options. |
The aggregate purchase price for these acquisitions was allocated to the assets acquired and liabilities assumed consisting of tangible property and intangible assets and liabilities, based on the fair values estimated at the acquisition dates. The intangible assets consist of the value of the in-place leases at the properties at the time of acquisition, and the intangible liabilities consist of the value of a below-market lease at the time of acquisition. The value of the in-place leases will be amortized over the average remaining lease of each property at the time of acquisition (aggregate weighted average of 8.4 years at December 31, 2017). The below market lease, which is reflected below as below market intangibles will be amortized over the remaining term of the respective lease. The estimated aggregate allocation, including transaction costs, is as follows:
|
Land |
$1,496 |
|
Buildings and improvements |
8,434 |
|
Intangible assets |
1,598 |
|
Below-market lease intangibles |
(2,488) |
|
|
|
|
Net cash paid |
$9,040 |
|
|
|
Disposition:
During March, 2017, Arlington Medical Properties, LLC, a formerly jointly-owned limited liability company in which we held an 85% noncontrolling ownership interest, sold the real estate assets of St. Mary’s Professional Office Building (“St. Mary’s”) as part of a series of planned tax deferred like-kind exchange transactions pursuant to Section 1031 of the Internal Revenue Code, as discussed below. St. Mary’s is a multi-tenant medical office building located in Reno, Nevada. A third party member owned the remaining 15% of Arlington Medical Properties LLC, which we acquired prior to the divestiture of St. Mary’s for a purchase price of $7.9 million. The divestiture of St. Mary’s generated an aggregate of approximately $57.3 million of net cash proceeds to us. These proceeds, which were net of closing costs and the purchase price paid for the minority member’s ownership interest in the LLC, include repayment to us of a $21.4 million member loan. Our results of operations for the year ended December 31, 2017 include a net gain of $27.2 million (net of related transaction costs) recorded in connection with this transaction.
Summary of Like-Kind Exchange Transactions Pursuant to Section 1031 of the IRS Code:
During 2016 and 2017, as part of a series of planned tax deferred like-kind exchange transactions pursuant to Section 1031 of the Internal Revenue Code in connection with the divestiture of St. Mary’s, we acquired two MOBs during 2016 (2704 North Tenaya Way located in Nevada and Frederick Memorial Hospital Crestwood located in Maryland, as discussed below) and an MOB and an FED during 2017 (Health Center at Hamburg located in Pennsylvania and Las Palmas Del Sol Emergency Center located in Texas, as discussed above). These acquisitions were planned and executed in accordance with the provisions of Section 1031 of the Internal Revenue Code. Therefore, we believe they qualify as tax deferred like-kind exchange transactions in connection with the divestiture of St. Mary’s in March, 2017.
New Construction:
During the first quarter of 2016, we began the development and construction of the Henderson Medical Plaza, an MOB located on the campus of the Henderson Hospital Medical Center which is owned by a UHS subsidiary and opened in late October, 2016. The MOB contains approximately 78,800 rentable square feet and was opened during April, 2017. A ground lease has been executed
71
between the limited liability company that owns the MOB and a subsidiary of UHS, the terms of which include a seventy-five year lease term with two, ten-year renewal options at the lessee’s option at an adjusting lease rate. We have invested net cash of approximately $12.4 million on the development and construction of this MOB as of December 31, 2017.
2016:
Acquisitions:
During 2016, we paid approximately $60.4 million in cash, and assumed approximately $7.1 million of third-party debt that is non-recourse to us, to:
|
|
• |
purchase the 2704 North Tenaya Way MOB located in Las Vegas, Nevada, during the fourth quarter for a total purchase price of approximately $15.3 million, including the assumption of approximately $7.1 million of third-party debt that is non-recourse to us. The property consists of approximately 45,000 rentable square feet and is fully occupied pursuant to the terms of a triple net lease that had a remaining lease term of approximately 7.1 years at the time of acquisition. |
|
|
• |
purchase the Frederick Memorial Hospital Crestwood, an MOB located in Frederick, Maryland, during the third quarter for approximately $24.3 million. The property, which consists of approximately 62,300 rentable square feet, is fully occupied pursuant to the terms of triple net leases that had an average remaining lease term of approximately 12 years at the time of acquisition. |
|
|
• |
purchase the Chandler Corporate Center III located in Chandler, Arizona, during the second quarter for approximately $18.0 million. The property, which consists of 82,000 rentable square feet, is currently 92% occupied by one tenant pursuant to the terms of a twelve year escalating triple net lease, with a ten year fair-market value renewal option. The lease had a remaining lease term of approximately 11.3 years at the time of acquisition. |
|
|
• |
purchase the Madison Professional Office Building located in Madison, Alabama, during the first quarter for approximately $10.1 million, including a $150,000 deposit paid in 2015. This multi-tenant property consists of approximately 30,100 rentable square feet and is fully occupied with an average remaining lease term of approximately 6.2 years at the time of acquisition. |
The aggregate purchase price for these acquisitions was allocated to the assets acquired and liabilities assumed consisting of tangible property and intangible assets and liabilities, based on the fair value estimated or finalized at acquisition as detailed in the table below. Previous reported estimated purchase price allocations that have been finalized in the fourth quarter did not have a material impact on our consolidated financial statements. The intangible assets include the value of in-place leases at the properties at the time of acquisition as well as the above market lease values. The value of the in-place leases will be amortized over the average remaining lease terms of approximately 6 to 12 years at the time of acquisition (aggregate weighted average of 7.6 years at December 31, 2017). The above/below market leases, which are reflected below as intangible assets/below-market intangibles will be amortized over the remaining term of the respective leases. The estimated aggregate allocation is as follows:
|
Land |
$9,914 |
|
Buildings and improvements |
50,117 |
|
Intangible assets |
9,211 |
|
Below-market lease intangibles |
(1,287) |
|
Deposit paid in 2015………………………………………...……………………………….. |
(150) |
|
Debt (including fair value adjustment of $362)…...……..……………………………….….. |
(7,499) |
|
Financing fees paid on debt acquired……………...……..……………………………….….. |
83 |
|
|
|
|
Net cash paid |
$60,389 |
|
|
|
As of December 31, 2017, our net intangible assets total $20.6 million (net of $28.7 million accumulated amortization) and primarily consists of the amount related to acquired, in-place leases which have a weighted average remaining amortization period of 4.4 years.
Dispositions:
There were no divestitures during 2016.
72
Property Exchange Transaction:
In May, 2015, in exchange for the real property of Sheffield Medical Building (“Sheffield”), a 73,446 square foot MOB located in Atlanta, Georgia, we received $2 million in cash and the real property of two MOBs located in Sandy Springs and Vinings, Georgia, from an unrelated third party. In connection with the two MOBs acquired in this transaction, triple net, master lease agreements applicable to 100% of the combined 36,700 rentable square feet of these properties were executed with the counterparty. These master lease agreements have initial terms of 15 years and provide for 3% annual rent increases. We recorded an $8.7 million gain which is included in our Consolidated Statements of Income for the year ended December 31, 2015, representing the difference between recorded net book value of Sheffield and the fair values of the properties exchanged, combined with the cash proceeds received.
Acquisitions:
In February, 2015, we purchased the Haas Medical Office Park, two single story buildings having an aggregate of approximately 16,000 rentable square feet, located in Ottumwa, Iowa, for approximately $4.1 million.
In January and February of 2015, we purchased from wholly-owned subsidiaries of UHS, the real property of two newly-constructed and recently opened FEDs located in Weslaco and Mission, Texas, for an aggregate acquisition cost of approximately $12.8 million. Each FED consists of approximately 13,600 square feet and is operated by wholly-owned subsidiaries of UHS. In connection with these acquisitions, ten-year lease agreements with six 5-year renewal terms were executed with UHS for each FED. In connection with the lease agreements, the lessee shall have the option to purchase the leased property upon the expiration of the fixed term and each five-year extended term at the fair market value at that time.
The aggregate purchase price for these three MOBs and two FEDs was allocated to the assets acquired and liabilities assumed consisting of tangible property and identified intangible assets, based on their respective fair values at acquisition as detailed in the table below. Substantially all of the intangible assets include the value of the in-place leases at the MOBs at the time of acquisition which will be amortized over the average remaining lease term of approximately 15.0 years at the time of acquisition (aggregate weighted average of 12.4 years at December 31, 2017) for each of the MOBs located in Sandy Springs and Vinings, Georgia and approximately 10.4 years at the time of acquisition (aggregate weighted average of 7.6 years at December 31, 2017) for the Haas Medical Office Park.
|
|
|
|
Land |
$7,050 |
|
Buildings and improvements |
17,518 |
|
Intangible assets |
2,182 |
|
Cash received- exchange transaction |
2,000 |
|
Other liabilities |
(116) |
|
Deposit paid in 2014 |
(100) |
|
Net book value of property divested in exchange transaction |
(3,027) |
|
Gain on exchange transaction |
(8,742) |
|
|
|
|
Net cash paid |
$16,765 |
|
|
|
Dispositions:
There were no divestitures during 2015.
(4) LEASES
As Lessor:
As lessor, all of our leases are classified as operating leases with initial terms typically ranging from 3 to 15 years with up to five additional, five-year renewal options. Under the terms of the leases, we earn fixed monthly base rents and pursuant to the leases with subsidiaries of UHS, we may earn periodic bonus rents (see Note 1). The bonus rents from the subsidiaries of UHS, which are based upon each facility’s net revenue in excess of base amounts, are computed and paid on a quarterly basis based upon a computation that compares current quarter revenue to the corresponding quarter in the base year.
73
Minimum future base rents from non-cancelable leases related to properties included in our financial statements on a consolidated basis, excluding increases resulting from changes in the consumer price index, bonus rents and the impact of straight line rent adjustments, are as follows (amounts in thousands):
|
2018 |
|
$ |
55,022 |
|
|
2019 |
|
|
49,763 |
|
|
2020 |
|
|
44,416 |
|
|
2021 |
|
|
39,387 |
|
|
2022 |
|
|
19,565 |
|
|
Thereafter |
|
|
56,963 |
|
|
Total minimum base rents |
|
$ |
265,116 |
|
Some of the leases contain gross terms where operating expenses are included in the base rent amounts. Other leases contain net terms where the operating expenses are assessed separately from the base rentals. The table above contains a mixture of both gross and net leases, and does not include any separately calculated operating expense reimbursements. Under the terms of the hospital leases, the lessees are required to pay all operating costs of the properties including property insurance and real estate taxes. Tenants of the medical office buildings generally are required to pay their pro-rata share of the property’s operating costs.
As Lessee:
As of December 31, 2017, we are the lessee with various third parties, including subsidiaries of UHS, in connection with ground leases for land at fourteen of our consolidated properties. Total consolidated amounts expensed relating to the applicable leases in 2017, 2016 and 2015 was approximately $460,000, $450,000 and $448,000, respectively. Total future ground lease payments on a consolidated basis due in each of the next five years and thereafter are as follows (amounts in thousands):
|
2018 |
|
$ |
464 |
|
|
2019 |
|
|
464 |
|
|
2020 |
|
|
464 |
|
|
2021 |
|
|
464 |
|
|
2022 |
|
|
464 |
|
|
Thereafter |
|
|
25,435 |
|
|
Total ground lease expense |
|
$ |
27,755 |
|
(5) DEBT AND FINANCIAL INSTRUMENTS
Debt:
Management routinely monitors and analyzes the Trust’s capital structure in an effort to maintain the targeted balance among capital resources including the level of borrowings pursuant to our $250 million revolving credit facility, the level of borrowings pursuant to non-recourse mortgage debt secured by the real property of our properties and our level of equity including consideration of additional equity issuances. This ongoing analysis considers factors such as the current debt market and interest rate environment, the current/projected occupancy and financial performance of our properties, the current loan-to-value ratio of our properties, the Trust’s current stock price, the capital resources required for anticipated acquisitions and the expected capital to be generated by anticipated divestitures. This analysis, together with consideration of the Trust’s current balance of revolving credit agreement borrowings, non-recourse mortgage borrowings and equity, assists management in deciding which capital resource to utilize when events such as refinancing of specific debt components occur or additional funds are required to finance the Trust’s growth.
On May 24, 2016, we amended our revolving credit agreement (“Credit Agreement”) to, among other things, increase the borrowing capacity to $250 million from $185 million previously. The amended Credit Agreement, which is scheduled to mature in March, 2019, includes a $40 million sub limit for letters of credit and a $20 million sub limit for swingline/short-term loans. The Credit Agreement also provides a one-time option to extend the maturity date for an additional one year period, and an option to increase the total facility borrowing capacity up to an additional $50 million, subject to lender agreement. Borrowings under the Credit Agreement are guaranteed by certain subsidiaries of the Trust. In addition, borrowings under the Credit Agreement are secured by first priority security interests in and liens on all equity interests in the Trust’s wholly-owned subsidiaries. Borrowings made pursuant to the Credit Agreement will bear interest, at our option, at one, two, three, or six month LIBOR plus an applicable margin ranging from 1.50% to 2.00% or at the Base Rate plus an applicable margin ranging from 0.50% to 1.00%. The Credit Agreement defines “Base Rate” as the greatest of: (a) the administrative agent’s prime rate; (b) the federal funds effective rate plus 1/2 of 1%, and; (c) one month LIBOR plus 1%. A commitment fee of 0.20% to 0.40% (depending on our total leverage ratio) will be charged on the average
74
unused portion of the revolving credit commitments. The margins over LIBOR, Base Rate and the commitment fee are based upon our ratio of debt to total capital. At December 31, 2017, the applicable margin over the LIBOR rate was 1.625%, the margin over the Base Rate was 0.625%, and the commitment fee was 0.25%.
At December 31, 2017, we had $181.1 million of outstanding borrowings and $1.5 million of letters of credit outstanding against our revolving credit agreement. The carrying amount and fair value of borrowings outstanding pursuant to the Credit Agreement was $181.1 million at December 31, 2017. We had $67.4 million of available borrowing capacity, net of the outstanding borrowings and letters of credit outstanding as of December 31, 2017. There are no compensating balance requirements. The average amount outstanding under our Credit Agreement during the years ended December 31, 2017, 2016 and 2015 was $182.4 million, $164.2 million and $114.3 million, respectively, with corresponding effective interest rates of 2.8%, 2.3% and 2.1%, respectively, including commitment fees.
The Credit Agreement contains customary affirmative and negative covenants, including limitations on certain indebtedness, liens, acquisitions and other investments, fundamental changes, asset dispositions and dividends and other distributions. The Credit Agreement also contains restrictive covenants regarding the Trust’s ratio of total debt to total assets, the fixed charge coverage ratio, the ratio of total secured debt to total asset value, the ratio of total unsecured debt to total unencumbered asset value, and minimum tangible net worth, as well as customary events of default, the occurrence of which may trigger an acceleration of amounts outstanding under the Credit Agreement. We are in compliance with all of the covenants at December 31, 2017. We also believe that we would remain in compliance if the full amount of our commitment was borrowed.
The following table includes a summary of the required compliance ratios, giving effect to the covenants contained in the Credit Agreement (dollar amounts in thousands):
|
|
|
Covenant |
|
|
2017 |
|
||
|
Tangible net worth |
|
$ |
136,170 |
|
|
$ |
190,002 |
|
|
Total leverage |
|
< 60 |
|
% |
|
41.2 |
% |
|
|
Secured leverage |
|
< 30 |
|
% |
|
11.7 |
% |
|
|
Unencumbered leverage |
|
< 60 |
|
% |
|
37.7 |
% |
|
|
Fixed charge coverage |
> 1.50x |
|
3.8x |
|
||||
As indicated on the following table, we have eleven mortgages, all of which are non-recourse to us, included on our consolidated balance sheet as of December 31, 2017 (amounts in thousands):
|
Facility Name |
|
Outstanding Balance (in thousands)(a.) |
|
|
Interest Rate |
|
|
Maturity Date |
||
|
Sparks Medical Building/Vista Medical Terrace floating rate mortgage loan (b.) |
|
$ |
4,130 |
|
|
|
4.63 |
% |
|
February, 2018 |
|
Centennial Hills Medical Office Building floating rate mortgage loan (c.) |
|
|
9,764 |
|
|
|
4.63 |
% |
|
April, 2018 |
|
Rosenberg Children’s Medical Plaza fixed rate mortgage loan (c.) |
|
|
7,968 |
|
|
|
4.85 |
% |
|
May, 2018 |
|
Vibra Hospital-Corpus Christi fixed rate mortgage loan |
|
|
2,624 |
|
|
|
6.50 |
% |
|
July, 2019 |
|
700 Shadow Lane and Goldring MOBs fixed rate mortgage loan |
|
|
6,059 |
|
|
|
4.54 |
% |
|
June, 2022 |
|
BRB Medical Office Building fixed rate mortgage loan |
|
|
6,126 |
|
|
|
4.27 |
% |
|
December, 2022 |
|
Desert Valley Medical Center fixed rate mortgage loan |
|
|
4,946 |
|
|
|
3.62 |
% |
|
January, 2023 |
|
2704 North Tenaya Way fixed rate mortgage loan |
|
|
7,007 |
|
|
|
4.95 |
% |
|
November, 2023 |
|
Summerlin Hospital Medical Office Building III floating rate mortgage loan |
|
|
13,199 |
|
|
|
4.03 |
% |
|
April, 2024 |
|
Tuscan Professional Building fixed rate mortgage loan |
|
|
4,519 |
|
|
|
5.56 |
% |
|
June, 2025 |
|
Phoenix Children’s East Valley Care Center fixed rate mortgage loan |
|
|
9,400 |
|
|
|
3.95 |
% |
|
January, 2030 |
|
Total, excluding net debt premium and net financing fees |
|
|
75,742 |
|
|
|
|
|
|
|
|
Less net financing fees |
|
|
(680 |
) |
|
|
|
|
|
|
|
Plus net debt premium |
|
|
297 |
|
|
|
|
|
|
|
|
Total mortgage notes payable, non-recourse to us, net |
|
$ |
75,359 |
|
|
|
|
|
|
|
75
|
|
(a.) |
All mortgage loans require monthly principal payments through maturity and either fully amortize or include a balloon principal payment upon maturity. |
|
|
(b.) |
This loan was fully repaid upon its maturity, utilizing borrowings under our Credit Agreement. |
|
|
(c.) |
This loan is scheduled to mature within the next twelve months, at which time we will decide whether to refinance pursuant to a new mortgage loan or by utilizing borrowings under our Credit Agreement. |
On December, 1, 2017, upon its maturity, the $6.1 million fixed rate mortgage loan on the Phoenix Children’s East Valley Care Center was refinanced with a new $9.4 million fixed rate mortgage, with a maturity date of January, 2030.
On October 2, 2017, upon its maturity, the$10.8 million fixed rate mortgage loan on the Summerlin Hospital Medical Office Building II was fully repaid utilizing borrowings under our Credit Agreement.
On July 3, 2017, upon its maturity, the $6.6 million floating rate mortgage loan on the Auburn Medical Office Building II was fully repaid utilizing borrowings under our Credit Agreement.
On June 1, 2017, upon its maturity, the $4.5 million fixed rate mortgage loan on the Medical Center of Western Connecticut was fully repaid utilizing borrowings under our Credit Agreement.
On April 3, 2017, upon its maturity, the $20.2 million fixed rate mortgage loan on the Peace Health Medical Clinic was fully repaid utilizing borrowings under our Credit Agreement.
On March 31, 2017, upon its maturity, a $10.3 million floating rate mortgage loan on Summerlin Hospital Medical Office Building III was fully repaid. In April, 2017, we refinanced this property with a $13.2 million fixed rate mortgage, as shown above.
The mortgages are secured by the real property of the buildings as well as property leases and rents. The mortgages have a combined fair value of approximately $76.3 million as of December 31, 2017. We consider these to be “Level 2” in the fair value hierarchy as outlined in the authoritative guidance for disclosures in connection with debt instruments. Changes in market rates on our fixed rate debt impacts the fair value of debt, but it has no impact on interest incurred or cash flow.
At December 31, 2016, we had fifteen mortgages, all of which were non-recourse to us, included in our consolidated balance sheet. The combined outstanding balance of these fifteen mortgages was $114.2 million (excluding net debt premium of $436,000 and net of net financing fees of $381,000 at December 31, 2016), and had a combined fair value of approximately $115.7 million at December 31, 2016. We consider these to be “Level 2” in the fair value hierarchy as outlined in the authoritative guidance for disclosures in connection with debt instruments.
As of December 31, 2017, our aggregate consolidated scheduled debt repayments (including mortgages) are as follows (amounts in thousands):
|
2018 |
|
$ |
23,347 |
|
|
2019 (a.) |
|
|
185,035 |
|
|
2020 |
|
|
1,688 |
|
|
2021 |
|
|
1,846 |
|
|
2022 |
|
|
11,950 |
|
|
Later |
|
|
32,926 |
|
|
Total |
|
$ |
256,792 |
|
|
|
(a.) |
Includes repayment of $181.1 million of outstanding borrowings under the terms of our $250 million revolving credit agreement. |
Financial Instruments:
During the third quarter of 2013, we entered into an interest rate cap on a total notional amount of $10 million whereby we paid a premium of $136,000. During the first quarter of 2014, we entered into two additional interest rate cap agreements on a total notional amount of $20 million whereby we paid premiums of $134,500. In exchange for the premium payments, the counterparties agreed to pay us the difference between 1.50% and one-month LIBOR if one-month LIBOR rises above 1.50% during the term of the cap. From inception through the January, 2017 expirations, no payments were made to us by the counterparties pursuant to the terms of these caps.
76
During the second quarter of 2016, we entered into an interest rate cap on the total notional amount of $30 million whereby we paid a premium of $115,000. In exchange for the premium payment, the counterparties agreed to pay us the difference between 1.50% and one-month LIBOR if one-month LIBOR rises above 1.50% during the term of the cap. This interest rate cap became effective in January, 2017, coinciding with the expiration of the above-mentioned interest rate caps and expires in March, 2019. From inception through December 31, 2017, there were no payments made to us by the counterparty pursuant to the terms of this cap.
During the third quarter of 2016, we entered into an additional interest rate cap agreement on a total notional amount of $30 million whereby we paid a premium of $55,000. In exchange for the premium payment, the counterparties agreed to pay us the difference between 1.5% and one-month LIBOR if one-month LIBOR rises above 1.5% during the term of the cap. This interest rate cap became effective in October, 2016 and expires in March, 2019. From inception through December 31, 2017, there were no payments made to us by the counterparty pursuant to the terms of this cap.
(6) DIVIDENDS AND EQUITY ISSUANCE PROGRAM
Dividends:
During each of the last three years, dividends were declared and paid by us as follows:
|
|
• |
2017: $2.64 per share of which $1.47 per share was ordinary income and $1.17 per share was total capital gain (total capital gain amount includes Unrecaptured Section 1250 gain of $.453 per share). |
|
|
• |
2016: $2.60 per share of which $2.00 per share was ordinary income and $.60 per share was a return of capital distribution. |
|
|
• |
2015: $2.56 per share of which $2.17 per share was ordinary income and $.39 per share was a return of capital distribution. |
Equity Issuance Program:
We maintained an at-the-market equity issuance program (“ATM”) pursuant to the terms of which we could sell, from time-to-time, common shares of our beneficial interest up to an aggregate sales price of approximately $23.3 million to or through Merrill Lynch, Pierce, Fenner and Smith, Incorporated (“Merrill Lynch”), as sales agent and/or principal. The common shares were offered pursuant to the Registration Statement filed with the Securities and Exchange Commission, which became effective during the fourth quarter of 2015. During the third quarter of 2017, we met our aggregate sales threshold of $23.3 million pursuant to this program.
Pursuant to the ATM Program, during the twelve months ended December 31, 2017, there were 127,499 shares issued at an average price of $74.71 per share which generated approximately $9.1 million of net cash proceeds (net of approximately $400,000, consisting of compensation of $238,000 to Merrill Lynch, as well as $162,000 of other various fees and expenses). Since inception of this ATM program, including shares issued under a prior Registration Statement filed with the Securities and Exchange Commission in November 2012, we have issued 957,415 shares at an average price of $52.22 per share, which generated approximately $47.9 million of net proceeds (net of approximately $2.1 million, consisting of compensation of $1.25 million to Merrill Lynch as well as $840,000 of other various fees and expenses).
During 2016, pursuant to the ATM Program, there were 249,016 shares issued at an average price of $55.30 per share (all of which were issued during the second quarter), which generated approximately $13.2 million of net cash proceeds (net of approximately $558,000, consisting of compensation of $344,000 to Merrill Lynch, as well as $214,000 of other various fees and expenses). There were no shares issued pursuant to an ATM program during 2015.
We have generally used the proceeds generated pursuant to the ATM program to reduce amounts outstanding under our revolving credit agreement. After such repayment of debt, we may re-borrow funds under our revolving credit agreement for general operating purposes, including working capital, capital expenditures, acquisitions, dividend payments and the refinance of third-party debt.
(7) INCENTIVE PLANS
During 2007, upon the expiration of our 1997 Incentive Plan, as discussed below, our Board of Trustees and shareholders approved the Universal Health Realty Income Trust 2007 Restricted Stock Plan which was amended and restated in 2016 (the “2007 Plan”). An aggregate of 125,000 shares were authorized for issuance under this plan and a total of 85,765 shares, net of cancellations, have been issued pursuant to the terms of this plan, 67,555 of which have vested as of December 31, 2017. At December 31, 2017 there are 39,235 shares remaining for issuance under the terms of the 2007 Plan.
77
During 2017, there were 9,105 restricted Shares of Beneficial Interest, net of cancellations, issued to the Trustees and officers of the Trust pursuant to the 2007 Plan at a weighted average grant price of $73.46 per share ($668,853 in the aggregate). These restricted shares are scheduled to vest in June of 2019 (the second anniversary of the date of grant).
During 2016, there were 9,105 restricted Shares of Beneficial Interest, net of cancellations, issued to the Trustees and officers of the Trust pursuant to the 2007 Plan at a weighted average grant price of $56.34 per share ($512,976 in the aggregate). These restricted shares are scheduled to vest in June of 2018 (the second anniversary of the date of grant).
During 2015, there were 9,730 restricted Shares of Beneficial Interest, net of cancellations, issued to the Trustees and officers of the Trust pursuant to the 2007 Plan at a weighted average grant price of $47.75 per share ($464,608 in the aggregate). These restricted shares vested in June of 2017 (the second anniversary of the date of grant).
We expense the grant-date fair value restricted stock awards under the straight-line method over the stated vesting period of the award. In connection with these grants, we recorded compensation expense of approximately $538,000, $481,000 and $427,000 during 2017, 2016 and 2015, respectively. The remaining expenses associated with these grants is approximately $581,000 and will be recorded over the remaining weighted average vesting period for outstanding restricted Shares of Beneficial Interest of approximately one year at December 31, 2017.
Prior to its expiration in 2007, the Universal Health Realty Income Trust 1997 Incentive Plan (the “1997 Plan”) provided for the granting of stock options and dividend equivalents rights (“DERs”) to employees of the Trust, including officers and trustees. Awards granted pursuant to the 1997 Plan prior to its termination date remained exercisable, in accordance with the terms of the outstanding agreements. All stock options were granted with an exercise price equal to the fair market value on the date of the grant. The options granted vested ratably at 25% per year beginning one year after the date of grant, and expired in ten years. DERs on outstanding awards were earned in amounts equal to the cash or stock dividends declared subsequent to the date of grant. As of December 31, 2017 or 2016, there were no options outstanding under the 1997 Plan. During 2017, no expense was recorded in connection with the DERs. The net expense recorded in connection with the DERs did not have a material impact on our consolidated financial statements during each of the years ended December 31, 2016, and 2015.
During the fourth quarter of 2008, the Board of Trustees of the Trust approved amendments to the outstanding stock option agreements made pursuant to the 1997 Plan. These original agreements provided for the deferred payment of dividend equivalents on shares covered by the options, with payment tied to the date the options were exercised or expire. In order to meet certain changes to tax law requirements, the agreements, as amended, provided for the current payment of dividend equivalents in the years in which dividends were declared and paid or, if later, when the related options became vested. There were no DERs were outstanding at December 31, 2017 or 2016. DERs with respect to 23,000 shares were outstanding at December 31, 2015. There were no DERs paid during 2017. In December of 2016 and 2015, DERs which were vested and accrued as of each respective date, were paid to officers and Trustees of the Trust amounting to approximately $30,000 and $75,000, respectively.
Stock options to purchase shares of beneficial interest have been granted to eligible individuals, including our officers and trustees. Information with respect to these options, before adjustment to the option price to give effect to the dividend equivalent rights, is summarized as follows:
|
Outstanding Options |
|
Number of Shares |
|
|
Exercise Weighted- Average Price |
|
|
Grant Price Range (High-Low) |
|
|||
|
Balance, January 1, 2015 |
|
|
36,000 |
|
|
$ |
35.94 |
|
|
$34.90/$36.53 |
|
|
|
Exercised |
|
|
(13,000 |
) |
|
|
34.90 |
|
|
$34.90/$34.90 |
|
|
|
Balance, January 1, 2016 |
|
|
23,000 |
|
|
$ |
36.53 |
|
|
$36.53/$36.53 |
|
|
|
Exercised |
|
|
(23,000 |
) |
|
|
36.53 |
|
|
$36.53/$36.53 |
|
|
|
Balance, January 1, 2017 |
|
|
— |
|
|
|
— |
|
|
|
— |
|
|
Exercised |
|
|
— |
|
|
|
— |
|
|
|
— |
|
|
Outstanding options vested and exercisable as of December 31, 2017 |
|
|
— |
|
|
|
— |
|
|
|
— |
|
There were no stock options exercised during 2017. During 2016, there were 23,000 stock options exercised with a total in-the-money value of $520,420. During 2015, there were 13,000 stock options exercised with a total in-the-money value of $154,500. There were no options outstanding at December 31, 2017 or 2016.
78
(8) SUMMARIZED FINANCIAL INFORMATION OF EQUITY AFFILIATES
In accordance with the Financial Accounting Standards Board’s (“FASB”) standards and guidance relating to accounting for investments and real estate ventures, we account for our unconsolidated investments in LLCs/LPs which we do not control using the equity method of accounting. The third-party members in these investments have equal voting rights with regards to issues such as, but not limited to: (i) divestiture of property; (ii) annual budget approval, and; (iii) financing commitments. These investments, which represent 33% to 95% non-controlling ownership interests, are recorded initially at our cost and subsequently adjusted for our net equity in the net income, cash contributions to, and distributions from, the investments. Pursuant to certain agreements, allocations of sales proceeds and profits and losses of some of the LLC investments may be allocated disproportionately as compared to ownership interests after specified preferred return rate thresholds have been satisfied.
In the Consolidated Statements of Cash Flows, distributions and equity in net income are presented net as cash flows from operating activities. Cumulative distributions received exceeding cumulative equity in earnings represent returns of investments and are classified as cash flows from investing activities in the Consolidated Statements of Cash Flows.
At December 31, 2017, we have non-controlling equity investments or commitments in four jointly-owned LLCs/LPs which own MOBs. As of December 31, 2017, we accounted for these LLCs/LPs on an unconsolidated basis pursuant to the equity method since they are not variable interest entities and we do not have a controlling voting interest. The majority of these entities are joint-ventures between us and non-related parties that hold minority ownership interests in the entities. Each entity is generally self-sustained from a cash flow perspective and generates sufficient cash flow to meet its operating cash flow requirements and service the third-party debt (if applicable) that is non-recourse to us. Although there is typically no ongoing financial support required from us to these entities since they are cash-flow sufficient, we may, from time to time, provide funding for certain purposes such as, but not limited to, significant capital expenditures, leasehold improvements and debt financing. Although we are not obligated to do so, if approved by us at our sole discretion, additional cash fundings are typically advanced as equity or member loans. These entities maintain property insurance on the properties.
During March, 2017, Arlington Medical Properties, LLC, a formerly jointly-owned limited liability company in which we held an 85% noncontrolling ownership interest, sold the real estate assets of St. Mary’s Professional Office Building (“St. Mary’s”) as part of a series of planned tax deferred like-kind exchange transactions pursuant to Section 1031 of the Internal Revenue Code. A third party member owned the remaining 15% of Arlington Medical Properties LLC, which we acquired prior to the divestiture of St. Mary’s.
The following property table represents the four LLCs or LPs in which we own a noncontrolling interest and were accounted for under the equity method as of December 31, 2017:
|
Name of LLC/LP |
|
Ownership |
|
|
Property Owned by LLC |
|
|
Suburban Properties |
|
|
33 |
% |
|
St. Matthews Medical Plaza II |
|
Brunswick Associates (a.)(d.) |
|
|
74 |
% |
|
Mid Coast Hospital MOB |
|
Grayson Properties (b.)(e.) |
|
|
95 |
% |
|
Texoma Medical Plaza |
|
FTX MOB Phase II (c.) |
|
|
95 |
% |
|
Forney Medical Plaza II |
|
(a.) |
This LLC has a third-party term loan of $8.4 million, which is non-recourse to us, outstanding as of December 31, 2017. |
|
(b.) |
This building is on the campus of a UHS hospital and has tenants that include subsidiaries of UHS. This LP has a third-party term loan of $14.2 million, which is non-recourse to us, outstanding as of December 31, 2017. |
|
(c.) |
We have committed to invest up to $2.5 million in equity and debt financing, of which $2.1 million has been funded as of December 31, 2017. This LP has a third-party term loan of $5.2 million, which is non-recourse to us, outstanding as of December 31, 2017. |
|
(d.) |
At December 31, 2017, we are the lessee with a third party on a ground lease for land. |
|
(e.) |
At December 31, 2017, we are the lessee with a UHS-related party on a ground lease for land. |
79
Below are the combined statements of income for the LLCs/LPs accounted for under the equity method at December 31, 2017, 2016 and 2015. The 2017 amounts include the financial results of Arlington Medical Properties, LLC, through the March 13, 2017 divestiture date. The 2016 and 2015 amounts include the financial results of Arlington Medical Properties, LLC for the full years.
|
|
|
For the Year Ended December 31, |
|
|||||||||
|
|
|
2017 |
|
|
2016 |
|
|
2015 |
|
|||
|
|
|
(amounts in thousands) |
|
|||||||||
|
Revenues |
|
$ |
10,673 |
|
|
$ |
15,252 |
|
|
$ |
14,347 |
|
|
Operating expenses |
|
|
3,883 |
|
|
|
5,439 |
|
|
|
5,605 |
|
|
Depreciation and amortization |
|
|
1,988 |
|
|
|
2,554 |
|
|
|
2,398 |
|
|
Interest, net |
|
|
1,570 |
|
|
|
2,565 |
|
|
|
2,578 |
|
|
Net income |
|
$ |
3,232 |
|
|
$ |
4,694 |
|
|
$ |
3,766 |
|
|
Our share of net income (a.) |
|
$ |
2,416 |
|
|
$ |
4,456 |
|
|
$ |
2,536 |
|
|
(a.) |
Our share of net income during 2017, 2016 and 2015, includes approximately $284,000, $1.2 million and $200,000, respectively, of interest income earned by us on an advance made to Arlington Medical Properties, LLC. This advance was repaid to us effective with the previously mentioned Arlington Medical Properties, LLC transaction during March, 2017. |
Below are the combined balance sheets for the four LLCs that were accounted for under the equity method as of December 31, 2017 and the five LLCs (including Arlington Medical Properties, LLC, which was divested during the first quarter of 2017) that were accounted for under the equity method as of December 31, 2016:
|
|
|
December 31, |
|
|||||
|
|
|
2017 |
|
|
2016 |
|
||
|
|
|
(amounts in thousands) |
|
|||||
|
Net property, including CIP |
|
$ |
33,111 |
|
|
$ |
60,970 |
|
|
Other assets |
|
|
3,560 |
|
|
|
4,598 |
|
|
Total assets |
|
$ |
36,671 |
|
|
$ |
65,568 |
|
|
|
|
|
|
|
|
|
|
|
|
Other liabilities |
|
$ |
3,067 |
|
|
$ |
3,334 |
|
|
Mortgage notes payable, non-recourse to us |
|
|
27,839 |
|
|
|
28,367 |
|
|
Advances payable to us (a.) |
|
|
— |
|
|
|
21,638 |
|
|
Equity |
|
|
5,765 |
|
|
|
12,229 |
|
|
Total liabilities and equity |
|
$ |
36,671 |
|
|
$ |
65,568 |
|
|
|
|
|
|
|
|
|
|
|
|
Our share of equity in and advances to LLCs reflected as: |
|
|
|
|
|
|
|
|
|
Investments in LLCs |
|
$ |
4,671 |
|
|
$ |
13,955 |
|
|
Advances to LLCs |
|
|
- |
|
|
|
21,638 |
|
|
Investments in and advances to LLCs before amounts included in accrued expenses and other liabilities |
|
|
4,671 |
|
|
|
35,593 |
|
|
Amounts included in accrued expenses and other liabilities |
|
|
(1,895 |
) |
|
|
(1,862 |
) |
|
Our share of equity in and advances to LLCs, net |
|
$ |
2,776 |
|
|
$ |
33,731 |
|
|
|
(a.) |
Consists of a 5.29% member loan to Arlington Medical Properties, LLC, which was fully repaid to us in March, 2017, as discussed above. |
As of December 31, 2017, aggregate principal amounts due on mortgage notes payable by unconsolidated LLCs, which are accounted for under the equity method and are non-recourse to us, are as follows (amounts in thousands):
|
2018 |
|
$ |
594 |
|
|
2019 |
|
|
621 |
|
|
2020 |
|
|
5,415 |
|
|
2021 |
|
|
13,549 |
|
|
2022 |
|
|
216 |
|
|
2023 and thereafter |
|
|
7,444 |
|
|
Total |
|
$ |
27,839 |
|
80
|
|
Mortgage Loan Balance (a.) |
||||||||
|
Name of LLC/LP |
|
12/31/2017 |
|
|
12/31/2016 |
|
Maturity Date |
||
|
FTX MOB Phase II (5.00% fixed rate mortgage loan) |
|
$ |
5,202 |
|
|
$ |
5,301 |
|
October, 2020 (b.) |
|
Grayson Properties (5.034% fixed rate mortgage loan) |
|
|
14,191 |
|
|
|
14,438 |
|
September, 2021 |
|
Brunswick Associates (3.64% fixed rate mortgage loan) |
|
|
8,446 |
|
|
|
8,628 |
|
December, 2024 |
|
|
|
$ |
27,839 |
|
|
$ |
28,367 |
|
|
|
|
(a.) |
All mortgage loans require monthly principal payments through maturity and include a balloon principal payment upon maturity. |
|
|
(b.) |
This loan originally matured on October 1, 2017, and was renewed and extended at a fixed interest rate of 5% with a revised maturity date of October 1, 2020. |
Pursuant to the operating and/or partnership agreements of the four LLCs/LPs in which we continue to hold non-controlling ownership interests, the third-party member and the Trust, at any time, potentially subject to certain conditions, have the right to make an offer (“Offering Member”) to the other member(s) (“Non-Offering Member”) in which it either agrees to: (i) sell the entire ownership interest of the Offering Member to the Non-Offering Member (“Offer to Sell”) at a price as determined by the Offering Member (“Transfer Price”), or; (ii) purchase the entire ownership interest of the Non-Offering Member (“Offer to Purchase”) at the equivalent proportionate Transfer Price. The Non-Offering Member has 60 to 90 days to either: (i) purchase the entire ownership interest of the Offering Member at the Transfer Price, or; (ii) sell its entire ownership interest to the Offering Member at the equivalent proportionate Transfer Price. The closing of the transfer must occur within 60 to 90 days of the acceptance by the Non-Offering Member.
(9) SEGMENT REPORTING
Our primary business is investing in and leasing healthcare and human service facilities through direct ownership or through joint ventures, which aggregate into a single reportable segment. We actively manage our portfolio of healthcare and human service facilities and may from time to time make decisions to sell lower performing properties not meeting our long-term investment objectives. The proceeds of sales are typically reinvested in new developments or acquisitions, which we believe will meet our planned rate of return. It is our intent that all healthcare and human service facilities will be owned or developed for investment purposes. Our revenue and net income are generated from the operation of our investment portfolio.
Our portfolio is located throughout the United States, however, we do not distinguish or group our operations on a geographical basis for purposes of allocating resources or measuring performance. We review operating and financial data for each property on an individual basis; therefore, we define an operating segment as our individual properties. Individual properties have been aggregated into one reportable segment based upon their similarities with regard to both the nature and economics of the facilities, tenants and operational processes, as well as long-term average financial performance.
(10) IMPACT OF HURRICANE HARVEY
In late August, 2017, five of our medical office buildings listed below located in the Houston, Texas area incurred extensive water damage as a result of Hurricane Harvey. Since the hurricane, each of these properties remain temporarily closed and non-operational as we complete the damage assessments and restoration of the properties to an operational condition. Although we can provide no assurance on the estimated re-opening dates, it is expected that the buildings will continue to be closed through the majority of the second quarter of 2018. In the aggregate, these properties comprised approximately 2% of our consolidated revenues during the six months ended June 30, 2017.
As discussed below, we believe we are entitled to insurance recovery proceeds for substantially all of the costs incurred related to the remediation, repair and reconstruction of each of these properties, subject to certain deductibles and other limitations. In addition, during the period that these properties are non-operational, we believe we are entitled to business interruption insurance recoveries for the lost income related to each of these properties, subject to certain deductibles and other limitations.
Properties damaged and closed from Hurricane Harvey:
|
|
• |
Cypresswood Professional Center – located in Spring, Texas and consisting of two MOBs. |
|
|
• |
Professional Buildings at King’s Crossing – located in Kingwood, Texas and consisting of two MOBs. |
|
|
• |
Kelsey-Seybold Clinic at King’s Crossing – located in Kingwood, Texas and consisting of one MOB. |
Hurricane related expenses and recoveries:
81
At the time of the hurricane, we maintained insurance policies with a commercial insurance carrier providing for property damage coverage, subject to certain deductibles and other limitations, of up to $20 million in the aggregate applicable to the impacted properties and up to $50 million in the aggregate for business interruption coverage pursuant to a shared limit policy. Additionally, we have insurance coverage under the National Flood Insurance Program providing for property damage coverage of up to $500,000 per each of the 5 buildings, subject to certain deductibles and other limitations.
When all property insurance coverage and deductibles applicable to the above-mentioned hurricane damaged buildings are considered, we believe we are entitled to recovery of substantially all hurricane related expenses and reconstruction costs, less an aggregate net deductible of $25,000. In addition, pursuant to the business interruption policy, we believe we are entitled to substantially all lost income at these properties resulting from the hurricane, less an aggregate deductible of $100,000. However, we can provide no assurance that we will ultimately collect, after satisfaction of the applicable deductibles, substantially all of the hurricane related expenses and reconstruction costs and the lost income resulting from the related interruption of business at the impacted properties.
Included in our financial results for the year ended December 31, 2017 are hurricane related expenses of approximately $5.0 million consisting of $3.6 million related to property damage and $1.4 million related to remediation and demolition expenses. Also included in our financial results for the twelve-month period ended December 31, 2017 are aggregate hurricane related insurance recoveries of approximately $7.0 million, consisting of $5.0 million related to recovery of hurricane related expenses and $2.0 million related to recovery proceeds in excess of the damaged property write-downs.
As of December 31, 2017, our financial statements do not include any business interruption insurance recoveries since no business interruption insurance proceeds were received as of that date. However, we expect that business interruption insurance recoveries will be recognized in future periods when recovery proceeds are probable and/or insurance carrier notifications are received.
The hurricane related expenses and insurance recoveries recorded to date are based upon the damage assessments of the real property at each of the above-mentioned properties. We are unable to assess the ultimate repair cost of the damaged property or the amount of total insurance recoveries we may ultimately receive. As of December 31, 2017, the aggregate hurricane-related insurance recoveries have exceeded the combined net book value of the damaged property and the hurricane related expenses incurred as of that date. Although we expect to receive additional hurricane-related insurance proceeds in the future, the timing and amount of such proceeds cannot be determined at this time since it will be based upon factors such as ultimate replacement costs of damaged assets and the ultimate value of the business interruption claims. Therefore, in connection with Hurricane Harvey, it is likely that we will record additional hurricane related expenses and hurricane related insurance recoveries in future periods, which could be material.
The following amounts are included in our financial results for the year ended December 31, 2017 (amounts in thousands):
|
Property write-down (a.) |
$ |
3,578 |
|
|
Hurricane related expenses (b.) |
|
1,389 |
|
|
Total hurricane-related expenses |
$ |
4,967 |
|
|
Insurance recoveries received |
|
(7,000 |
) |
|
Insurance recoveries in excess of damaged property write-down |
$ |
2,033 |
|
|
|
|
|
|
|
|
(a.) |
Consists of the aggregate net book values of the estimated damaged depreciable assets at each property based upon our assessments of the real estate assets. Since the net book values of the damaged assets were not separately determinable, the write-downs were determined using a systematic and rational method to allocate the long lives asset’s carrying amounts to the affected components. |
|
|
(b.) |
Consists of the aggregate remediation, demolition and general clean-up costs for the properties listed above. |
In addition, the aggregate lost revenue for the hurricane impacted properties mentioned above amounted to approximately $510,000 through December 31, 2017. We believe we will be entitled to insurance recoveries for a substantial portion of these lost revenues pursuant to our business interruption policy, subject to an aggregate deductible, as discussed above.
82
(11) QUARTERLY RESULTS (unaudited)
|
|
|
2017 |
|
|||||||||||||||||
|
|
|
First Quarter |
|
|
Second Quarter |
|
|
Third Quarter |
|
|
Fourth Quarter |
|
|
Total |
|
|||||
|
|
|
(amounts in thousands, except per share amounts) |
|
|||||||||||||||||
|
Revenues |
|
$ |
17,750 |
|
|
$ |
18,145 |
|
|
$ |
18,194 |
|
|
$ |
18,259 |
|
|
$ |
72,348 |
|
|
Net income before gain and excess insurance recovery proceeds |
|
$ |
4,366 |
|
|
$ |
4,033 |
|
|
$ |
3,960 |
|
|
$ |
4,031 |
|
|
$ |
16,390 |
|
|
Gain on Arlington transaction |
|
$ |
27,196 |
|
|
$ |
— |
|
|
$ |
— |
|
|
$ |
— |
|
|
$ |
27,196 |
|
|
Hurricane insurance recovery proceeds in excess of damaged property write-downs |
|
$ |
— |
|
|
$ |
— |
|
|
$ |
— |
|
|
$ |
2,033 |
|
|
$ |
2,033 |
|
|
Net income |
|
$ |
31,562 |
|
|
$ |
4,033 |
|
|
$ |
3,960 |
|
|
$ |
6,064 |
|
|
$ |
45,619 |
|
|
Total basic earnings per share |
|
$ |
2.32 |
|
|
$ |
0.30 |
|
|
$ |
0.29 |
|
|
$ |
0.44 |
|
|
$ |
3.35 |
|
|
Total diluted earnings per share |
|
$ |
2.32 |
|
|
$ |
0.30 |
|
|
$ |
0.29 |
|
|
$ |
0.44 |
|
|
$ |
3.35 |
|
|
|
|
|
|
|
|
|
|
|
|
|
|
|
|
|
|
|
|
|
|
|
|
|
|
|
|
|
|
|
|
|
|
|
|
|
|
|
|
|
|
|
|
|
|
|
|
2016 |
|
|||||||||||||||||
|
|
|
First Quarter |
|
|
Second Quarter |
|
|
Third Quarter |
|
|
Fourth Quarter |
|
|
Total |
|
|||||
|
|
|
(amounts in thousands, except per share amounts) |
|
|||||||||||||||||
|
Revenues |
|
$ |
16,226 |
|
|
$ |
16,461 |
|
|
$ |
16,801 |
|
|
$ |
17,593 |
|
|
$ |
67,081 |
|
|
Net income |
|
$ |
4,428 |
|
|
$ |
4,523 |
|
|
$ |
3,818 |
|
|
$ |
4,446 |
|
|
$ |
17,215 |
|
|
Total basic earnings per share |
|
$ |
0.33 |
|
|
$ |
0.34 |
|
|
$ |
0.28 |
|
|
$ |
0.33 |
|
|
$ |
1.28 |
|
|
Total diluted earnings per share |
|
$ |
0.33 |
|
|
$ |
0.34 |
|
|
$ |
0.28 |
|
|
$ |
0.33 |
|
|
$ |
1.28 |
|
83
Universal Health Realty Income Trust
Real Estate and Accumulated Depreciation — December 31, 2017
(amounts in thousands)
|
|
|
|
|
|
|
|
|
|
|
|
|
|
|
|
|
|
|
Gross amount at |
|
|
|
|
|
|
Date of |
|
|
|
|
|||||||||||||
|
|
|
|
|
|
|
|
|
|
|
|
|
|
|
|
|
|
|
which carried |
|
|
|
|
|
|
Completion of |
|
|
|
|
|||||||||||||
|
|
|
Initial Cost |
|
|
at end of period |
|
|
Accumulated |
|
|
Construction, |
|
|
|
|
|||||||||||||||||||||||||||
|
Description |
|
Encumbrance (c.) |
|
|
Land |
|
|
Building & Improv. |
|
|
Adjustments to Basis (a.) |
|
|
Land |
|
|
Building & Improvements |
|
|
CIP |
|
|
Total |
|
|
Depreciation as of Dec. 31, 2017 |
|
|
Acquisition or Significant improvement |
|
Date Acquired |
|
Average Depreciable Life |
|||||||||
|
Inland Valley Regional Medical Center Wildomar, California |
|
|
— |
|
|
$ |
2,050 |
|
|
$ |
10,701 |
|
|
$ |
14,596 |
|
|
$ |
2,050 |
|
|
$ |
25,297 |
|
|
|
|
|
|
$ |
27,347 |
|
|
$ |
13,307 |
|
|
2007 |
|
1986 |
|
43 Years |
|
McAllen Medical Center McAllen, Texas |
|
|
— |
|
|
|
4,720 |
|
|
|
31,442 |
|
|
|
10,189 |
|
|
|
6,281 |
|
|
|
40,070 |
|
|
|
|
|
|
|
46,351 |
|
|
|
27,221 |
|
|
1994 |
|
1986 |
|
42 Years |
|
Wellington Regional Medical Center West Palm Beach, Florida |
|
|
— |
|
|
|
1,190 |
|
|
|
14,652 |
|
|
|
17,370 |
|
|
|
1,663 |
|
|
|
31,549 |
|
|
|
|
|
|
|
33,212 |
|
|
|
19,485 |
|
|
2006 |
|
1986 |
|
42 Years |
|
HealthSouth Deaconess Rehabilitation Hospital Evansville, Indiana |
|
|
— |
|
|
|
500 |
|
|
|
6,945 |
|
|
|
1,062 |
|
|
|
500 |
|
|
|
8,007 |
|
|
|
|
|
|
|
8,507 |
|
|
|
5,678 |
|
|
1993 |
|
1989 |
|
40 Years |
|
Kindred Chicago Central Hospital Central Chicago, Illinois |
|
|
— |
|
|
|
158 |
|
|
|
6,404 |
|
|
|
1,838 |
|
|
|
158 |
|
|
|
8,242 |
|
|
|
|
|
|
|
8,400 |
|
|
|
8,242 |
|
|
1993 |
|
1986 |
|
25 Years |
|
Family Doctor’s Medical Office Building Shreveport, Louisiana |
|
|
— |
|
|
|
54 |
|
|
|
1,526 |
|
|
|
494 |
|
|
|
54 |
|
|
|
2,020 |
|
|
|
|
|
|
|
2,074 |
|
|
|
1,045 |
|
|
1991 |
|
1995 |
|
45 Years |
|
Kelsey-Seybold Clinic at King’s Crossing Kingwood, Texas (d.) |
|
|
— |
|
|
|
439 |
|
|
|
1,618 |
|
|
|
(1,618 |
) |
|
|
439 |
|
|
|
— |
|
|
|
|
|
|
|
439 |
|
|
|
— |
|
|
1995 |
|
1995 |
|
45 Years |
|
Professional Buildings at King’s Crossing Kingwood, Texas (d.) |
|
|
— |
|
|
|
439 |
|
|
|
1,837 |
|
|
|
(1,837 |
) |
|
|
439 |
|
|
|
— |
|
|
|
|
|
|
|
439 |
|
|
|
— |
|
|
1995 |
|
1995 |
|
45 Years |
|
Chesterbrook Academy Audubon, Pennsylvania |
|
|
— |
|
|
|
307 |
|
|
|
996 |
|
|
|
— |
|
|
|
307 |
|
|
|
996 |
|
|
|
|
|
|
|
1,303 |
|
|
|
477 |
|
|
1996 |
|
1996 |
|
45 Years |
|
Chesterbrook Academy New Britain, Pennsylvania |
|
|
— |
|
|
|
250 |
|
|
|
744 |
|
|
|
— |
|
|
|
250 |
|
|
|
744 |
|
|
|
|
|
|
|
994 |
|
|
|
360 |
|
|
1991 |
|
1996 |
|
45 Years |
|
Chesterbrook Academy Uwchlan, Pennsylvania |
|
|
— |
|
|
|
180 |
|
|
|
815 |
|
|
|
— |
|
|
|
180 |
|
|
|
815 |
|
|
|
|
|
|
|
995 |
|
|
|
392 |
|
|
1992 |
|
1996 |
|
45 Years |
|
Chesterbrook Academy Newtown, Pennsylvania |
|
|
— |
|
|
|
195 |
|
|
|
749 |
|
|
|
— |
|
|
|
195 |
|
|
|
749 |
|
|
|
|
|
|
|
944 |
|
|
|
362 |
|
|
1992 |
|
1996 |
|
45 Years |
|
The Southern Crescent Center I (b.) |
|
|
— |
|
|
|
1,130 |
|
|
|
5,092 |
|
|
|
(2,271 |
) |
|
|
1,130 |
|
|
|
2,821 |
|
|
|
|
|
|
|
3,951 |
|
|
|
2,493 |
|
|
1994 |
|
1996 |
|
45 Years |
|
The Southern Crescent Center II (b.) Riverdale, Georgia |
|
|
— |
|
|
|
— |
|
|
|
— |
|
|
|
5,040 |
|
|
|
806 |
|
|
|
4,234 |
|
|
|
|
|
|
|
5,040 |
|
|
|
2,494 |
|
|
2000 |
|
1998 |
|
35 Years |
|
The Cypresswood Professional Center Spring, Texas (e.) |
|
|
— |
|
|
|
573 |
|
|
|
3,842 |
|
|
|
(3,004 |
) |
|
|
573 |
|
|
|
838 |
|
|
|
|
|
|
|
1,411 |
|
|
|
507 |
|
|
1997 |
|
1997 |
|
35 Years |
|
701 South Tonopah Building Las Vegas, Nevada (f.) |
|
|
— |
|
|
|
— |
|
|
|
1,579 |
|
|
|
68 |
|
|
|
— |
|
|
|
1,647 |
|
|
|
|
|
|
|
1,647 |
|
|
|
1,150 |
|
|
1999 |
|
1999 |
|
25 Years |
|
Danbury Medical Plaza Danbury, Connecticut |
|
|
— |
|
|
|
1,151 |
|
|
|
5,176 |
|
|
|
826 |
|
|
|
1,151 |
|
|
|
6,002 |
|
|
|
|
|
|
|
7,153 |
|
|
|
3,560 |
|
|
2000 |
|
2000 |
|
30 Years |
|
Vibra Hospital of Corpus Christi Corpus Christi, Texas |
|
|
2,624 |
|
|
|
1,104 |
|
|
|
5,508 |
|
|
|
— |
|
|
|
1,104 |
|
|
|
5,508 |
|
|
|
|
|
|
|
6,612 |
|
|
|
1,557 |
|
|
2008 |
|
2008 |
|
35 Years |
|
Apache Junction Medical Plaza Apache Junction, AZ |
|
|
— |
|
|
|
240 |
|
|
|
3,590 |
|
|
|
1,159 |
|
|
|
240 |
|
|
|
4,749 |
|
|
|
|
|
|
|
4,989 |
|
|
|
1,317 |
|
|
2004 |
|
2004 |
|
30 Years |
|
Auburn Medical Office Building II Auburn, WA (g.) |
|
|
— |
|
|
|
— |
|
|
|
10,200 |
|
|
|
176 |
|
|
|
— |
|
|
|
10,376 |
|
|
|
|
|
|
|
10,376 |
|
|
|
2,058 |
|
|
2009 |
|
2009 |
|
36 Years |
|
BRB Medical Office Building Kingwood, Texas |
|
|
6,126 |
|
|
|
430 |
|
|
|
8,970 |
|
|
|
39 |
|
|
|
430 |
|
|
|
9,009 |
|
|
|
|
|
|
|
9,439 |
|
|
|
1,764 |
|
|
2010 |
|
2010 |
|
37 Years |
|
Centennial Hills Medical Office Building Las Vegas, NV (f.) |
|
|
9,764 |
|
|
|
— |
|
|
|
19,890 |
|
|
|
1,880 |
|
|
|
— |
|
|
|
21,770 |
|
|
|
38 |
|
|
|
21,808 |
|
|
|
4,612 |
|
|
2006 |
|
2006 |
|
34 Years |
|
Desert Springs Medical Plaza Las Vegas, NV |
|
|
— |
|
|
|
1,200 |
|
|
|
9,560 |
|
|
|
1,339 |
|
|
|
1,200 |
|
|
|
10,899 |
|
|
|
100 |
|
|
|
12,199 |
|
|
|
2,680 |
|
|
1998 |
|
1998 |
|
30 Years |
|
700 Shadow Lane & Goldring MOBs Las Vegas, NV |
|
|
6,059 |
|
|
|
400 |
|
|
|
11,300 |
|
|
|
3,539 |
|
|
|
400 |
|
|
|
14,839 |
|
|
|
12 |
|
|
|
15,251 |
|
|
|
3,554 |
|
|
2003 |
|
2003 |
|
30 Years |
|
Spring Valley Hospital MOB I Las Vegas, NV (f.) |
|
|
— |
|
|
|
— |
|
|
|
9,500 |
|
|
|
1,063 |
|
|
|
— |
|
|
|
10,563 |
|
|
|
19 |
|
|
|
10,582 |
|
|
|
2,317 |
|
|
2004 |
|
2004 |
|
35 Years |
84
Universal Health Realty Income Trust
Real Estate and Accumulated Depreciation — December 31, 2017 (continued)
(amounts in thousands)
|
|
|
|
|
|
|
|
|
|
|
|
|
|
|
|
|
|
|
Gross amount at |
|
|
|
|
|
|
Date of |
|
|
|
|
|||||||||||||
|
|
|
|
|
|
|
|
|
|
|
|
|
|
|
|
|
|
|
which carried |
|
|
|
|
|
|
Completion of |
|
|
|
|
|||||||||||||
|
|
|
Initial Cost |
|
|
at end of period |
|
|
Accumulated |
|
|
Construction, |
|
|
|
|
|||||||||||||||||||||||||||
|
Description |
|
Encumbrance (c.) |
|
|
Land |
|
|
Building & Improv. |
|
|
Adjustments to Basis (a.) |
|
|
Land |
|
|
Building & Improvements |
|
|
CIP |
|
|
Total |
|
|
Depreciation as of Dec. 31, 2017 |
|
|
Acquisition or Significant improvement |
|
Date Acquired |
|
Average Depreciable Life |
|||||||||
|
Spring Valley Hospital MOB II Las Vegas, NV (f.) |
|
|
— |
|
|
|
— |
|
|
|
9,800 |
|
|
|
503 |
|
|
|
— |
|
|
|
10,303 |
|
|
|
|
|
|
|
10,303 |
|
|
|
2,282 |
|
|
2006 |
|
2006 |
|
34 Years |
|
Summerlin Hospital MOB I Las Vegas, NV |
|
|
— |
|
|
|
460 |
|
|
|
15,440 |
|
|
|
1,460 |
|
|
|
460 |
|
|
|
16,900 |
|
|
|
48 |
|
|
|
17,408 |
|
|
|
3,988 |
|
|
1999 |
|
1999 |
|
30 Years |
|
Summerlin Hospital MOB II Las Vegas, NV |
|
|
— |
|
|
|
370 |
|
|
|
16,830 |
|
|
|
1,446 |
|
|
|
370 |
|
|
|
18,276 |
|
|
|
13 |
|
|
|
18,659 |
|
|
|
4,326 |
|
|
2000 |
|
2000 |
|
30 Years |
|
Summerlin Hospital MOB III Las Vegas, NV (f.) |
|
|
13,199 |
|
|
|
— |
|
|
|
14,900 |
|
|
|
2,161 |
|
|
|
— |
|
|
|
17,061 |
|
|
|
|
|
|
|
17,061 |
|
|
|
3,260 |
|
|
2009 |
|
2009 |
|
36 Years |
|
Emory at Dunwoody Building Dunwoody, GA |
|
|
— |
|
|
|
782 |
|
|
|
3,455 |
|
|
|
— |
|
|
|
782 |
|
|
|
3,455 |
|
|
|
|
|
|
|
4,237 |
|
|
|
789 |
|
|
2011 |
|
2011 |
|
35 Years |
|
Forney Medical Plaza Forney, TX |
|
|
— |
|
|
|
910 |
|
|
|
11,960 |
|
|
|
55 |
|
|
|
910 |
|
|
|
12,015 |
|
|
|
|
|
|
|
12,925 |
|
|
|
3,026 |
|
|
2011 |
|
2011 |
|
35 Years |
|
Lake Pointe Medical Arts Building Rowlett, TX |
|
|
— |
|
|
|
1,100 |
|
|
|
9,000 |
|
|
|
31 |
|
|
|
1,100 |
|
|
|
9,031 |
|
|
1 |
|
|
|
10,132 |
|
|
|
1,992 |
|
|
2011 |
|
2011 |
|
35 Years |
|
|
Tuscan Professional Building Irving, TX |
|
|
4,519 |
|
|
|
1,100 |
|
|
|
12,525 |
|
|
|
1,214 |
|
|
|
1,100 |
|
|
|
13,739 |
|
|
|
|
|
|
|
14,839 |
|
|
|
2,715 |
|
|
2011 |
|
2011 |
|
35 Years |
|
Peace Health Medical Clinic Bellingham, WA |
|
|
— |
|
|
|
1,900 |
|
|
|
24,910 |
|
|
|
— |
|
|
|
1,900 |
|
|
|
24,910 |
|
|
|
|
|
|
|
26,810 |
|
|
|
5,024 |
|
|
2012 |
|
2012 |
|
35 Years |
|
Northwest Texas Professional Office Tower Amarillo, TX (f.) |
|
|
— |
|
|
|
— |
|
|
|
7,180 |
|
|
|
— |
|
|
|
— |
|
|
|
7,180 |
|
|
|
|
|
|
|
7,180 |
|
|
|
1,208 |
|
|
2012 |
|
2012 |
|
35 Years |
|
Ward Eagle Office Village Farmington Hills, MI |
|
|
— |
|
|
|
220 |
|
|
|
3,220 |
|
|
|
— |
|
|
|
220 |
|
|
|
3,220 |
|
|
|
|
|
|
|
3,440 |
|
|
|
526 |
|
|
2013 |
|
2013 |
|
35 Years |
|
5004 Poole Road MOB Denison, TX |
|
|
— |
|
|
|
96 |
|
|
|
529 |
|
|
|
— |
|
|
|
96 |
|
|
|
529 |
|
|
|
|
|
|
|
625 |
|
|
|
81 |
|
|
2013 |
|
2013 |
|
35 Years |
|
Desert Valley Medical Center Phoenix, AZ |
|
|
4,946 |
|
|
|
2,280 |
|
|
|
4,624 |
|
|
|
479 |
|
|
|
2,280 |
|
|
|
5,103 |
|
|
|
80 |
|
|
|
7,463 |
|
|
|
757 |
|
|
1996 |
|
1996 |
|
30 Years |
|
Hanover Emergency Center Mechanicsville, VA |
|
|
— |
|
|
|
1,300 |
|
|
|
6,224 |
|
|
|
— |
|
|
|
1,300 |
|
|
|
6,224 |
|
|
|
|
|
|
|
7,524 |
|
|
|
699 |
|
|
2014 |
|
2014 |
|
35 Years |
|
Haas Medical Office Park Ottumwa, IA (g.) |
|
|
— |
|
|
|
— |
|
|
|
3,571 |
|
|
|
— |
|
|
|
— |
|
|
|
3,571 |
|
|
|
|
|
|
|
3,571 |
|
|
|
343 |
|
|
2015 |
|
2015 |
|
35 Years |
|
South Texas ER at Mission Mission, TX |
|
|
— |
|
|
|
1,441 |
|
|
|
4,696 |
|
|
|
— |
|
|
|
1,441 |
|
|
|
4,696 |
|
|
|
|
|
|
|
6,137 |
|
|
|
458 |
|
|
2015 |
|
2015 |
|
35 Years |
|
North Valley Medical Plaza Phoenix, AZ |
|
|
— |
|
|
|
930 |
|
|
|
6,929 |
|
|
|
612 |
|
|
|
930 |
|
|
|
7,541 |
|
|
796 |
|
|
|
9,267 |
|
|
|
1,004 |
|
|
2010 |
|
2010 |
|
30 Years |
|
|
Northwest Medical Center at Sugar Creek Bentonville, AR |
|
|
— |
|
|
|
1,100 |
|
|
|
2,870 |
|
|
|
— |
|
|
|
1,100 |
|
|
|
2,870 |
|
|
|
|
|
|
|
3,970 |
|
|
|
366 |
|
|
2014 |
|
2014 |
|
35 Years |
|
The Children’s Clinic at Springdale Springdale, AR |
|
|
— |
|
|
|
610 |
|
|
|
1,570 |
|
|
|
— |
|
|
|
610 |
|
|
|
1,570 |
|
|
|
|
|
|
|
2,180 |
|
|
|
225 |
|
|
2014 |
|
2014 |
|
35 Years |
|
Rosenberg Children’s Medical Plaza Phoenix, AZ (g.) |
|
|
7,968 |
|
|
|
— |
|
|
|
23,302 |
|
|
|
34 |
|
|
|
— |
|
|
|
23,336 |
|
|
|
|
|
|
|
23,336 |
|
|
|
2,682 |
|
|
2001 |
|
2001 |
|
35 Years |
|
Phoenix Children’s East Valley Care Center Phoenix, AZ |
|
|
9,400 |
|
|
|
1,050 |
|
|
|
10,900 |
|
|
|
— |
|
|
|
1,050 |
|
|
|
10,900 |
|
|
|
|
|
|
|
11,950 |
|
|
|
1,250 |
|
|
2006 |
|
2006 |
|
35 Years |
|
Palmdale Medical Plaza Palmdale, CA (f.) |
|
|
— |
|
|
|
— |
|
|
|
10,555 |
|
|
|
1,745 |
|
|
|
— |
|
|
|
12,300 |
|
|
|
8 |
|
|
|
12,308 |
|
|
|
1,638 |
|
|
2008 |
|
2008 |
|
34 Years |
|
Piedmont-Roswell Physician Center Sandy Springs, GA |
|
|
— |
|
|
|
2,338 |
|
|
|
2,128 |
|
|
|
— |
|
|
|
2,338 |
|
|
|
2,128 |
|
|
|
|
|
|
|
4,466 |
|
|
|
243 |
|
|
2015 |
|
2015 |
|
30 Years |
|
Piedmont-Vinings Physician Center Vinings, GA |
|
|
— |
|
|
|
1,348 |
|
|
|
2,418 |
|
|
|
— |
|
|
|
1,348 |
|
|
|
2,418 |
|
|
|
|
|
|
|
3,766 |
|
|
|
267 |
|
|
2015 |
|
2015 |
|
30 Years |
85
Schedule III
Universal Health Realty Income Trust
Real Estate and Accumulated Depreciation — December 31, 2017 (continued)
(amounts in thousands)
|
|
|
|
|
|
|
|
|
|
|
|
|
|
|
|
|
|
|
Gross amount at |
|
|
|
|
|
|
Date of |
|
|
|
|
|||||||||||||
|
|
|
|
|
|
|
|
|
|
|
|
|
|
|
|
|
|
|
which carried |
|
|
|
|
|
|
Completion of |
|
|
|
|
|||||||||||||
|
|
|
Initial Cost |
|
|
at end of period |
|
|
Accumulated |
|
|
Construction, |
|
|
|
|
|||||||||||||||||||||||||||
|
Description |
|
Encumbrance (c.) |
|
|
Land |
|
|
Building & Improv. |
|
|
Adjustments to Basis (a.) |
|
|
Land |
|
|
Building & Improvements |
|
|
CIP |
|
|
Total |
|
|
Depreciation as of Dec. 31, 2017 |
|
|
Acquisition or Significant improvement |
|
Date Acquired |
|
Average Depreciable Life |
|||||||||
|
Plaza Scottsdale, AZ |
|
|
— |
|
|
|
1,090 |
|
|
|
1,960 |
|
|
|
359 |
|
|
|
1,090 |
|
|
|
2,319 |
|
|
|
1 |
|
|
|
3,410 |
|
|
|
360 |
|
|
1999 |
|
1999 |
|
30 Years |
|
Sierra San Antonio Medical Plaza Fontana, CA (g.) |
|
|
— |
|
|
|
— |
|
|
|
11,538 |
|
|
|
514 |
|
|
|
— |
|
|
|
12,052 |
|
|
10 |
|
|
|
12,062 |
|
|
|
1,560 |
|
|
2006 |
|
2006 |
|
30 Years |
|
|
Vista Medical Terrace & Sparks MOB Sparks, NV (f.) |
|
|
4,130 |
|
|
|
— |
|
|
|
9,276 |
|
|
|
608 |
|
|
|
— |
|
|
|
9,884 |
|
|
|
39 |
|
|
|
9,923 |
|
|
|
1,760 |
|
|
2008 |
|
2008 |
|
30 Years |
|
South Texas ER at Weslaco Weslaco ,TX |
|
|
— |
|
|
|
1,749 |
|
|
|
4,879 |
|
|
|
— |
|
|
|
1,749 |
|
|
|
4,879 |
|
|
|
|
|
|
|
6,628 |
|
|
|
485 |
|
|
2015 |
|
2015 |
|
35 Years |
|
Chandler Corporate Center III Chandler, AZ |
|
|
— |
|
|
|
2,328 |
|
|
|
14,131 |
|
|
|
— |
|
|
|
2,328 |
|
|
|
14,131 |
|
|
|
|
|
|
|
16,459 |
|
|
|
1,042 |
|
|
2016 |
|
2016 |
|
35 Years |
|
Frederick Crestwood MOB Frederick, MD |
|
|
— |
|
|
|
2,265 |
|
|
|
18,731 |
|
|
|
— |
|
|
|
2,265 |
|
|
|
18,731 |
|
|
|
|
|
|
|
20,996 |
|
|
|
939 |
|
|
2016 |
|
2016 |
|
35 Years |
|
Madison Professional Office Building Madison, AL |
|
|
— |
|
|
|
2,296 |
|
|
|
6,411 |
|
|
|
— |
|
|
|
2,296 |
|
|
|
6,411 |
|
|
|
|
|
|
|
8,707 |
|
|
|
473 |
|
|
2016 |
|
2016 |
|
35 Years |
|
Tenaya Medical Office Building Las Vegas, NV |
|
|
7,007 |
|
|
|
3,032 |
|
|
|
10,602 |
|
|
|
— |
|
|
|
3,032 |
|
|
|
10,602 |
|
|
|
|
|
|
|
13,634 |
|
|
|
444 |
|
|
2016 |
|
2016 |
|
35 Years |
|
Hendserson Medical Plaza Henderson, NV (f.) |
|
|
— |
|
|
|
— |
|
|
|
10,718 |
|
|
|
— |
|
|
|
— |
|
|
|
10,718 |
|
|
|
6,287 |
|
|
|
17,005 |
|
|
|
412 |
|
|
2017 |
|
2017 |
|
35 Years |
|
Hamburg Medical Building Hamburg, PA |
|
|
— |
|
|
|
696 |
|
|
|
3,406 |
|
|
|
— |
|
|
|
696 |
|
|
|
3,406 |
|
|
|
|
|
|
|
4,102 |
|
|
|
64 |
|
|
2017 |
|
2017 |
|
35 Years |
|
Las Palmas Del Sol Emergency Center - West El Paso, TX |
|
|
— |
|
|
|
801 |
|
|
|
5,029 |
|
|
|
— |
|
|
|
801 |
|
|
|
5,029 |
|
|
|
|
|
|
|
5,830 |
|
|
|
59 |
|
|
2017 |
|
2017 |
|
35 Years |
|
TOTALS |
|
$ |
75,742 |
|
|
$ |
50,302 |
|
|
$ |
478,853 |
|
|
$ |
63,169 |
|
|
$ |
53,142 |
|
|
$ |
539,182 |
|
|
$ |
7,452 |
|
|
$ |
599,776 |
|
|
$ |
153,379 |
|
|
|
|
|
|
|
|
a. |
Consists of costs subsequent to acquisition that were capitalized, divested or written down in connection with asset impairments and hurricane related damage. |
|
b. |
During 2008, a $4.6 million provision for asset impairment was recorded in connection with the real estate assets of Southern Crescent Center I & Southern Crescent Center II. |
|
c. |
Consists of outstanding balances as of December 31, 2017 on third-party debt that is non-recourse to us. |
|
d. |
Carrying value of depreciable assets were written down to zero as a result of substantial damage from Hurricane Harvey during the third quarter of 2017. |
|
e. |
Carrying value of depreciable assets were written down as a result of substantial damage from Hurricane Harvey during the third quarter of 2017. |
|
f. |
At December 31, 2017, we are the lessee with a UHS-related party on a ground lease for land. |
|
g. |
At December 31, 2017, we are the lessee with a third party on a ground lease for land. |
86
UNIVERSAL HEALTH REALTY INCOME TRUST
DECEMBER 31, 2017
(amounts in thousands)
(1) RECONCILIATION OF REAL ESTATE PROPERTIES
The following table reconciles the Real Estate Properties from January 1, 2015 to December 31, 2017:
|
|
|
2017 |
|
|
2016 |
|
|
2015 |
|
|||
|
Balance at January 1, |
|
$ |
585,828 |
|
|
$ |
511,657 |
|
|
$ |
486,589 |
|
|
Additions (a.) |
|
|
12,492 |
|
|
|
14,186 |
|
|
|
4,972 |
|
|
Acquisitions |
|
|
9,931 |
|
|
|
60,031 |
|
|
|
24,568 |
|
|
Disposals/Divestitures (b.) |
|
|
(8,475 |
) |
|
|
(46 |
) |
|
|
(4,472 |
) |
|
Balance at December 31, |
|
$ |
599,776 |
|
|
$ |
585,828 |
|
|
$ |
511,657 |
|
(2) RECONCILIATION OF ACCUMULATED DEPRECIATION
The following table reconciles the Accumulated Depreciation from January 1, 2015 to December 31, 2017:
|
|
|
2017 |
|
|
2016 |
|
|
2015 |
|
|||
|
Balance at January 1, |
|
$ |
138,588 |
|
|
$ |
121,161 |
|
|
$ |
106,480 |
|
|
Disposals/Divestitures (b.) |
|
|
(4,896 |
) |
|
|
(9 |
) |
|
|
(1,568 |
) |
|
Depreciation expense |
|
|
19,687 |
|
|
|
17,436 |
|
|
|
16,249 |
|
|
Balance at December 31, |
|
$ |
153,379 |
|
|
$ |
138,588 |
|
|
$ |
121,161 |
|
|
|
(a.) |
Included in the additions during 2017 and 2016, were $3.0 million and $9.5 million, respectively, related to Henderson Medical Plaza, which was completed and opened during 2017. |
|
|
(b.) |
2017 includes property damage write-downs resulting from substantial damage from Hurricane Harvey during the third quarter of 2017, as discussed in Note 10 to the consolidated financial statements – Impact of Hurricane Harvey. |
87