Attached files
| file | filename |
|---|---|
| EX-32.2 - EXHIBIT 32.2 - ServiceNow, Inc. | now-20171231xex322.htm |
| EX-32.1 - EXHIBIT 32.1 - ServiceNow, Inc. | now-20171231xex321.htm |
| EX-31.2 - EXHIBIT 31.2 - ServiceNow, Inc. | now-20171231xex312.htm |
| EX-31.1 - EXHIBIT 31.1 - ServiceNow, Inc. | now-20171231xex311.htm |
| EX-23.1 - EXHIBIT 23.1 - ServiceNow, Inc. | now-20171231xex231.htm |
| EX-21.1 - EXHIBIT 21.1 - ServiceNow, Inc. | now-20171231xex211.htm |
| EX-10.3 - EXHIBIT 10.3 - ServiceNow, Inc. | now-20171231xex103.htm |
UNITED STATES
SECURITIES AND EXCHANGE COMMISSION
Washington, D.C. 20549
FORM 10-K
x | Annual Report pursuant to Section 13 or 15(d) of the Securities Exchange Act of 1934 |
For the fiscal year ended December 31, 2017
OR
¨ | Transition report pursuant to Section 13 or 15(d) of the Securities Exchange Act of 1934 |
Commission File Number: 001-35580

SERVICENOW, INC.
(Exact name of registrant as specified in its charter)
Delaware | 20-2056195 | |
(State or other jurisdiction of incorporation or organization) | (I.R.S. Employer Identification Number) | |
ServiceNow, Inc.
2225 Lawson Lane
Santa Clara, California 95054
(408) 501-8550
(Address, including zip code, and telephone number, including area code, of registrant’s principal executive offices)
Securities registered pursuant to Section 12(b) of the Act:
Title of each class | Name of each exchange on which registered | |
Common stock, par value $0.001 per share | New York Stock Exchange, Inc. | |
Securities registered pursuant to Section 12(g) of the Act:
Not applicable
__________________________
Indicate by check mark if the Registrant is a well-known seasoned issuer, as defined in Rule 405 of the Securities Act. Yes x No ¨
Indicate by check mark if the Registrant is not required to file reports pursuant to Section 13 or Section 15(d) of Act. Yes ¨ No x
Indicate by check mark whether the Registrant (1) has filed all reports required to be filed by Section 13 or 15(d) of the Securities Exchange Act of 1934 during the preceding 12 months (or for such shorter period that the Registrant was required to file such reports), and (2) has been subject to such filing requirements for the past 90 days: Yes x No ¨
Indicate by check mark whether the Registrant has submitted electronically and posted on its corporate Web site, if any, every Interactive Data File required to be submitted and posted pursuant to Rule 405 of Regulation S-T (§232.405 of this chapter) during the preceding 12 months (or for such shorter period that the Registrant was required to submit and post such files). Yes x No ¨
Indicate by check mark if disclosure of delinquent filers pursuant to Item 405 of Regulation S-K (§229.405 of this chapter) is not contained herein, and will not be contained, to the best of Registrant’s knowledge, in definitive proxy or information statements incorporated by reference in Part III of this Form 10-K or any amendment to this Form 10-K. ¨
Indicate by check mark whether the Registrant is a large accelerated filer, an accelerated filer, a non-accelerated filer, a smaller reporting company or an emerging growth company. See the definitions of “large accelerated filer,” “accelerated filer,” “smaller reporting company” and "emerging growth company" in Rule 12b-2 of the Exchange Act. (Check one):
Large accelerated filer x Accelerated filer ¨ Non-accelerated filer ¨ Smaller reporting company ¨
(Do not check if a smaller reporting company) | Emerging growth company ¨ |
If an emerging growth company, indicate by check mark if the registrant has elected not to use the extended transition period for complying with any new or revised financial accounting standards provided pursuant to Section 13(a) of the Exchange Act. ¨
Indicate by check mark whether the Registrant is a shell company (as defined in Rule 12b-2 of the Act). Yes ¨ No x
Based on the closing price of the Registrant’s Common Stock on the last business day of the Registrant’s most recently completed second fiscal quarter, which was June 30, 2017, the aggregate market value of its shares (based on a closing price of $106.00 per share on June 30, 2017 as reported on the New York Stock Exchange) held by non-affiliates was approximately $12.6 billion.
As of January 31, 2018, there were approximately 174.7 million shares of the Registrant’s Common Stock outstanding.
DOCUMENTS INCORPORATED BY REFERENCE
Portions of the Registrant’s definitive proxy statement for its 2018 Annual Meeting of Stockholders (Proxy Statement) to be filed within 120 days of the Registrant’s fiscal year ended December 31, 2017, are incorporated by reference in Part III of this Report on Form 10-K. Except with respect to information specifically incorporated by reference in this Form 10-K, the Proxy Statement is not deemed to be filed as part of this Form 10-K.
TABLE OF CONTENTS
Page | ||
Item 1 | ||
Item 1A | ||
Item 1B | ||
Item 2 | ||
Item 3 | ||
Item 4 | ||
Item 5 | ||
Item 6 | ||
Item 7 | ||
Item 7A | ||
Item 8 | ||
Item 9 | ||
Item 9A | ||
Item 9B | ||
Item 10 | ||
Item 11 | ||
Item 12 | ||
Item 13 | ||
Item 14 | ||
Item 15 | ||
Item 16 | ||
Index to Exhibits | ||
PART I
FORWARD-LOOKING STATEMENTS
This Annual Report on Form 10-K, including the “Management's Discussion and Analysis of Financial Condition and Results of Operations,” contains forward-looking statements regarding future events and our future results that are based on our current expectations, estimates, forecasts and projections about our business, our results of operations, the industry in which we operate and the beliefs and assumptions of our management. Words such as “believe,” “may,” “will,” “estimate,” “continue,” “anticipate,” “would,” “could,” “should,” “intend” and “expect,” variations of these words, and similar expressions are intended to identify those forward-looking statements. These forward-looking statements are only predictions and are subject to risks, uncertainties and assumptions that are difficult to predict. Therefore, actual results may differ materially and adversely from those expressed in any forward-looking statements. Factors that might cause or contribute to such differences include, but are not limited to, those discussed in this Report under the section entitled “Risk Factors” in Item 1A of Part I and elsewhere herein, and in other reports we file with the Securities and Exchange Commission (SEC). While forward-looking statements are based on the reasonable expectations of our management at the time that they are made, you should not rely on them. We undertake no obligation to revise or update publicly any forward-looking statements for any reason, whether as a result of new information, future events or otherwise, except as may be required by law.
ITEM 1. | BUSINESS |
ServiceNow is a leading provider of enterprise cloud computing solutions that define, structure, manage and automate services for global enterprises. We help our customers improve service quality and reduce costs while scaling and automating their businesses.
We offer a comprehensive set of cloud-based services that automate workflow within and between departments in an enterprise. Historically, our focus was on solving challenges found in enterprise information technology (IT) departments, and we pioneered the use of the cloud to deliver IT service management applications. We now provide workflow solutions that go beyond the scope of the IT department to include service management for customer service, human resources, security operations and other enterprise departments where a patchwork of semi-automated and manual processes had been used in the past. Using our cloud services, users can easily request business services from these departments, actions and responses can be automated within the enterprise, the quality of service provided by these departments improves, and overall the business runs more efficiently.
All of our cloud services are built on our proprietary platform, which features one code base and one data model. Our platform also enables customers to easily create, by themselves or with our partners, their own service-oriented business applications across the enterprise. We deliver our software via the Internet as a service, through an easy-to-use, consumer product-like interface, which means it can be easily configured and rapidly deployed.
We market our services to enterprises in a wide variety of industries, including financial services, consumer products, IT services, health care, government, education and technology. We sell our subscription services primarily through direct sales and, to a lesser extent, through indirect channel sales. We also offer a portfolio of professional and other services, both directly and through our network of partners.
We were incorporated as Glidesoft, Inc. in California in June 2004 and changed our name to Service-now.com in February 2006. In May 2012, we reincorporated in Delaware as ServiceNow, Inc.
Our Cloud Services
Now Platform
All of our products are built on a single platform, which is the foundation for all of our cloud-based services. Our platform allows our customers to create a single system of record for their systems and workflows, and it is the foundation of our ability to deliver specific enterprise applications and services. Our single system of record also allows customers to complement their other vertical applications and achieve various business objectives such as better data integrity, faster updates and better responsiveness to user needs. Among the most popular services that our platform supports are workflow automation, electronic service catalogs and portals, configuration management systems, data benchmarking, performance analytics, encryption and collaboration and development tools. Our platform also enables developers in IT and other departments across the enterprise to create, test and deploy their own applications within an integrated development environment while leveraging the single data model and common services of our platform.
1
Information Technology (IT)
We have three product suites focused on meeting the challenges of enterprise IT management and operations. Our IT Service Management (ITSM) product suite defines, structures, consolidates, manages and automates IT services that are offered to an enterprise’s employees, customers and partners. Among its capabilities, our ITSM product suite records incidents, remediates problems and automates IT asset management. Our second product suite, IT Operations Management (ITOM), connects a customer's physical and cloud-based IT infrastructure with our applications and platform. It identifies a customer's IT infrastructure components (e.g., servers) and associated business services (e.g., email) which are dependent upon that infrastructure. It also maintains a single data record for all IT configurable items, which allows our customers to exercise control over their on-premises or cloud-based infrastructures and orchestrate key processes and tasks. Finally, our IT Business Management (ITBM) product suite enables customers to manage their IT priorities, including the scope and cost of IT projects, the development of software related to those projects and the overall management of the customer's IT project portfolio.
Customer Service
Our customer service management product defines, structures, consolidates, manages and automates customer service cases and requests. It allows common customer requests such as password resets to be automated with out-of-the-box self-service, and for other cases it routes work from the customer service agent to field service, engineering, operations, finance or legal personnel to resolve the underlying issues. Our field service management application allows field service agents to be effectively assigned, deployed and managed on the same underlying customer service management platform that created and managed the customer incident.
Human Resources (HR) Service Delivery
Our HR service delivery product defines, structures, consolidates, manages and automates HR services related to employee requests. HR service delivery capabilities include HR case management, employee self-service, knowledge management and management of employee lifecycle events such as onboarding, transfers and off-boarding.
Security Operations
Our security operations product defines, structures, consolidates, manages and automates security operations management requirements of third-party and other sources of security alerts from a customer's infrastructure. Security operations management capabilities include security incident management, threat enrichment intelligence, vulnerability response management and security incident intelligence sharing. Our governance, risk and compliance product defines, structures, consolidates, manages and automates cross-functional governance, risk and compliance workflows such as compliance controls and risk mitigation.
Professional Services
Our professional services include process design, implementation and configuration, and optimization services to help customers achieve their business objectives and derive value from their ServiceNow investment. We also offer strategic services to customers embarking on significant business transformations to reimagine their service management strategy and roadmap - from first insight to final implementation. Our network of partners also provides professional services and training to our customers.
We provide an expansive portfolio of training and certification programs for service management across IT, HR, customer service, and other departments. Flexible training options, plus topic- and role-based content, help engage our customers' employees, optimize business processes and enhance efficiency.
Customer Support
As part of their subscription, customers receive support 24 hours a day, seven days a week around the globe, from technical resources located in the United States and internationally. We also offer self-service technical support through our support portal, which provides access to documentation, knowledge base articles, online support forums and online incident filing.
2
Our Technology and Operations
We designed our cloud-based services to support global enterprises. We operate a multi-instance architecture that provides each customer with its own dedicated application logic and database. This architecture is designed to deliver high-availability, scalability, performance, security and ease of upgrading. We have a standardized Java-based development environment, with the majority of our software written in industry-standard software programming languages. Our cloud infrastructure primarily consists of industry-standard servers and network components. Our operating system and databases are Linux, and MySQL and MariaDB.
Our data centers operate in paired configurations to enable replication for high-availability and redundancy. We operate data centers in Australia, Brazil, Canada, Hong Kong, the Netherlands, Singapore, Switzerland, the United Kingdom and the United States.
We offer customers the option to deploy our services on dedicated hardware in our data centers. Our architecture also gives us the added flexibility to deploy our services on-premises at a customer data center in order to support regulatory or security requirements, and a minority of our customers have elected to do so. The customer support we provide for on-premises customers is similar to the support we provide to customers deployed in our own managed data centers.
Sales and Marketing
We sell our services primarily through our global direct sales organization. Additionally, we sell our services indirectly through third-party channels by partnering with systems integrators, managed services providers and resale partners, particularly in less developed markets.
Our marketing efforts and lead generation activities consist primarily of customer referrals, Internet advertising (including via our website), trade shows, industry events and press releases. We also host our annual Knowledge user conference, webinars and other user forums where customers and partners both participate in and present on a variety of programs designed to help accelerate success with our services and platform.
We are continuing to expand our sales capabilities in new geographies, including through investments in direct and indirect sales channels, professional services capabilities, customer support resources and implementation partners. In addition to adding new geographies, we also plan to increase our investment in our existing locations in order to achieve scale efficiencies in our sales and marketing efforts.
Customers
We primarily sell our services to large enterprise customers. We host and support large enterprise-wide deployments for our customers. As of December 31, 2017, we had approximately 4,400 enterprise customers, including more than 40% of the Global 2000. Our customers operate in a wide variety of industries, including financial services, consumer products, IT services, health care, government, education and technology. No single customer accounted for more than 10% of our revenues for any of the periods presented.
Backlog
Backlog represents future unearned revenue amounts to be invoiced under our existing agreements that are not included in the deferred revenue on our consolidated balance sheets. As of December 31, 2017 and 2016, we had backlog of approximately $2.6 billion and $1.9 billion, respectively. We expect backlog to fluctuate from period to period due to a number of factors, including the timing and duration of customer subscription and professional services agreements, variations in the billing cycle of subscription agreements, the timing of customer renewals and foreign exchange rate fluctuations.
Financial Information about Segments and Geographic Areas
We manage our operations and allocate resources as a single organizational entity, and therefore we manage, monitor and report our financials as a single reporting segment. For information regarding our revenue, revenue by geographic area and long-lived assets by geographic area, please refer to Note 2 and Note 17 in the notes to our consolidated financial statements included elsewhere in this Annual Report on Form 10-K. For financial information about our segment, please refer to the section entitled “Management's Discussion and Analysis of Financial Condition and Results of Operations” in Item 7 of Part II and to our consolidated financial statements and the related notes thereto included elsewhere in this Annual Report on Form 10-K. For information regarding risks associated with our international operations, please refer to the section entitled “Risk Factors” in Item 1A of Part I in this Annual Report on Form 10-K.
3
Research and Development
Our research and development organization is responsible for the design, development, testing and certification of our solutions. We focus on developing new services and core technologies and further enhancing the functionality, reliability and performance of our existing solutions. We focus our efforts on anticipating customer demand and then bringing new services and new versions of existing services to market quickly in order to remain competitive in the marketplace. We have made, and will continue to make, significant investments in research and development to strengthen our existing applications, expand the number of applications on our platform, enhance our user experience, and develop additional mobile, automation and machine intelligence technologies. Total research and development expense was $377.5 million, $285.2 million and $217.4 million for the years ended December 31, 2017, 2016 and 2015, respectively.
Acquisitions and Investments
In addition to continuing to invest in our own research and development efforts, we have made acquisitions and investments in the past and will continue to assess opportunities for strategic acquisitions and investments to complement our technology and skill sets and expand our product reach. We are focused on building out the core capabilities of our platform through both acquisitions and investments that will satisfy growing customer needs.
Competition
The markets for our solutions generally are rapidly evolving and highly competitive, with relatively low barriers to entry. As the markets in which we operate continue to mature, we expect competition to intensify. We compete primarily with large, well-established, enterprise application software vendors, in-house solutions, large integrated systems vendors, established and emerging cloud vendors and vendors of products and services for development operations. Many prospective customers have invested substantial personnel and financial resources to implement and integrate their current enterprise software into their businesses and therefore may be reluctant or unwilling to migrate away from their current solution to an enterprise cloud solution. Accordingly, we compete with both enterprise application software vendors that provide on-premises software and with vendors providing cloud-based services. Our competitors vary in size and in the breadth and scope of the products and services offered. As we continue to expand the breadth of our services to include offerings for service domains outside of IT, we expect increasing competition from platform and application development vendors focused on these other markets.
Various factors influence purchase decisions in our industry, including total cost of ownership, level of customer satisfaction, breadth and depth of product functionality, security, adherence to industry standards, brand awareness, flexibility and performance. We believe that we compete favorably with our competitors on each of these factors. However, many of our competitors have substantially greater financial, technical and other resources and may be able to respond more quickly and effectively than we can to new or changing opportunities, technologies, standards and customer requirements. An existing competitor or new entrant could introduce new technology that reduces demand for our services. In addition, some of our competitors offer their products or services at a lower price, which has resulted in pricing pressures. Some of our larger competitors also have the operating flexibility to bundle competing products and services with other software offerings, which may enable them to offer such products and services at a lower price as part of a larger sale. As competition intensifies, we expect pricing competition to continue or increase.
Intellectual Property
We rely upon a combination of copyright, trade secret, patent and trademark laws in the United States and other jurisdictions as well as confidentiality procedures and contractual restrictions, such as confidentiality and license agreements, to establish, protect and grow our intellectual property (IP) rights. We also enter into confidentiality and proprietary rights agreements with our employees, partners, vendors, consultants and other third parties and control access to our IP and other proprietary information. We also purchase or license technology that we incorporate into our products or services.
We continue to grow our patent portfolio and IP rights around the world that relate to our platform, applications, services, research and development and other activities, and our success depends in part upon our ability to protect our core technology and IP. We have over 350 U.S. and foreign patents, including patents acquired from third parties, and over 250 pending patent applications. We do not believe that our proprietary technology is dependent on any single patent or other IP right or groups of related patents or IP rights. We file patent applications to protect our IP and have in the past and may in the future acquire additional patents, patent portfolios, or patent applications. However, we cannot be certain that any of our patent applications will result in the issuance of a patent or whether the examination process will result in patents of value or applicability. In addition, any patents that have been or may be issued or acquired may be contested, circumvented, found unenforceable or invalidated, and we may not be able to prevent third parties from infringing them.
4
Despite our efforts to protect our proprietary rights, unauthorized parties may attempt to copy or obtain and use our technology to develop products and services that provide features and functionality that are similar to our solutions. Policing unauthorized use of our technology is difficult. The laws of the countries in which we market our services may offer little or no effective protection of our proprietary technology. Our competitors could also independently develop services equivalent to ours, and our intellectual property rights may not be broad enough for us to prevent competitors from doing so. Reverse engineering, unauthorized copying or other misappropriation of our proprietary technology could enable third parties to benefit from our technology without paying us for it, which would significantly harm our business.
Our industry is characterized by frequent claims and related litigation regarding patent and other intellectual property rights. From time to time, third parties may assert patent, copyright, trademark and other intellectual property rights against us, our channel partners or our customers. In addition, based on our greater visibility, expanding solutions footprint, and market exposure as a public company, we face a higher risk of being the subject of intellectual property infringement claims from third parties. For example, in 2016 we settled two patent-related litigation matters and recorded a one-time charge of $270.0 million related to aggregate legal settlements. See “Risk Factors–Claims by others that we infringe their proprietary technology or other rights could harm our business” for additional information.
Employees
As of December 31, 2017, we had 6,222 full-time employees worldwide, including 1,498 in cloud operations, professional services, training and customer support, 2,413 in sales and marketing, 1,419 in research and development and 892 in general and administrative roles. None of our U.S. employees is represented by a labor union with respect to his or her employment. Employees in certain European countries are represented by workers' councils and also have the benefits of collective bargaining arrangements at the national level. We consider our relations with our employees to be very good and have not experienced interruptions of operations or work stoppages due to labor disagreements.
Available Information
You can obtain copies of our Annual Report on Form 10-K, Quarterly Reports on Form 10-Q, Current Reports on Form 8-K, and other filings with the SEC, and all amendments to these filings, free of charge from our website at www.servicenow.com as soon as reasonably practicable following our filing of any of these reports with the SEC. The public may read and copy any materials we have filed with the SEC at the SEC’s Public Reference Room at 100 F Street, NE, Room 1580, Washington, DC 20549. The public may obtain information on the operation of the Public Reference Room by calling the SEC at 1-800-SEC-0330. The SEC maintains an Internet site that contains reports, proxy and information statements and other information regarding issuers that file electronically with the SEC at www.sec.gov. The contents of these websites are not incorporated into this filing and our references to the URLs for these websites are intended to be inactive textual references only.
5
ITEM 1A. | RISK FACTORS |
Investing in our securities involves a high degree of risk. You should consider carefully the risks and uncertainties described below, together with all of the other information in this Annual Report on Form 10-K, including our consolidated financial statements and related notes, before making an investment decision. We have identified the following risks and uncertainties that may have a material adverse effect on our business, financial condition, results of operations and future prospects. Our business could be harmed by any of these risks. The trading price of our common stock could decline due to any of these risks, and you may lose all or part of your investment.
Risks Related to Our Business and Industry
We expect our revenue growth rate to continue to decline, and we may continue to incur losses in accordance with U.S. Generally Accepted Accounting Principles (GAAP).
We have experienced significant revenue growth in prior periods; however, our revenue growth rate is declining, and we expect that it will continue to decline into the foreseeable future. We also expect our costs to increase in future periods as we continue to invest in our capacity to support anticipated growth. These investments may not result in increased revenues or growth in our business. Even if our revenues continue to increase, we expect to continue to incur a loss in accordance with GAAP during future periods due to increased costs such as non-cash charges associated with equity awards, business combinations and other expenses. Additionally, we may encounter unforeseen operating expenses, difficulties, complications, delays and other unforeseen or unpredictable factors that may result in increased costs. Furthermore, it is difficult to predict the size and growth rate of our market, customer demand for our products, customer adoption and renewal rates, and the entry of competitive products or the success of existing competitive products. As a result of these and other factors, we may not achieve or maintain profitability in the future, our gross margins may be negatively impacted, and our ability to generate cash flow from operations may be negatively impacted. If we fail to increase our revenues sufficiently to keep pace with our growing investments and other expenses, our business, operating results and growth prospects will be adversely affected.
If we suffer a cyber-security event, we may lose customers and incur significant liabilities, any of which would harm our business and operating results.
Our operations involve the storage, transmission and processing of our customers’ confidential, proprietary and sensitive information, including personally identifiable information, protected health information and credit card and other financial information. While we have security measures in place designed to protect customer information and prevent data loss, these measures may be breached as a result of third-party actions, including intentional misconduct by computer hackers, employee error, malfeasance or otherwise, and result in someone obtaining unauthorized access to our customers’ data or our data, including our intellectual property and other confidential business information. Moreover, computer malware, viruses and hacking, phishing and denial of service attacks by third parties have become more prevalent in our industry, and have occurred on our systems in the past and may occur on our systems in the future. Because techniques used to obtain unauthorized access to or sabotage systems change frequently and generally are not recognized until successfully launched against a target, we may be unable to anticipate these techniques or to implement adequate preventative measures. As cyber-security threats develop and evolve, it may be necessary to make significant further investments to protect data and infrastructure. A security breach or unauthorized access or loss of data could result in a disruption to our service, litigation, the triggering of indemnification and other contractual obligations, regulatory investigations, government fines and penalties, reputational damage, loss of sales and customers, mitigation and remediation expenses and other liabilities. We do not have insurance sufficient to compensate us for the potentially significant losses that may result from security breaches.
6
If we do not accurately predict, prepare for, and respond promptly to rapidly evolving technological and market developments, our competitive position and business prospects may be harmed.
The markets in which we compete have evolved rapidly, and the pace of innovation will continue to accelerate, as cloud, mobile, workflow, consumer product-like user experiences, social, collaboration, machine learning, artificial intelligence, internet connected devices, robotic automation, security, cryptography, development tools and other digital technologies increasingly become the basis for customer purchases. At the same time, our customers and prospective customers are facing their own competitive imperatives to adopt digital technologies, resulting in the ongoing disruption of almost every sector of the global economy. Accordingly, to compete effectively in our rapidly changing markets, we must: identify and innovate in the right emerging technologies among the many in which we could make investments knowing that we cannot make substantial investments in all of them; accurately predict our customers’ changing business needs; successfully deliver new platform technologies and products that meet these business needs; efficiently integrate with other technologies within our customers’ digital environments; profitably market and sell new products in markets where our sales and marketing teams have less experience; and effectively deliver, either directly or through our ecosystem of partners, the business process planning, IT systems architecture planning, and product implementation services that our customers require to be successful. If we fail to meet any of these requirements, our competitive position and business prospects may be harmed.
Delays in the release of, or actual or perceived defects in, new or updated products may slow the adoption of our most recent technologies, reduce our ability to efficiently provide our services, decrease customer satisfaction, increase our vulnerability to cyber attacks, and adversely impact sales of additional products to our customers.
We must successfully continue to release new products and updates to existing products. The success of any release depends on a number of factors, including our ability to manage the risks associated with quality or other defects or deficiencies, delays in the timing of releases, and other complications that may arise during the early stages of introduction. If releases are delayed or if customers perceive that our releases contain bugs or other defects, customer adoption of our new products or updates may be adversely impacted, customer satisfaction may decrease, our ability to efficiently provide our services may be reduced, and our growth prospects may be harmed.
Various factors, including our customers’ business, integration, migration and security requirements, or errors by us or our partners, may cause implementations of our products to be delayed, inefficient or otherwise unsuccessful.
Our business depends upon the successful implementation of our products by our customers. Increasingly, we, as well as our customers, rely on our network of partners to deliver implementation services, and there may not be enough qualified implementation partners available to meet customer demand. Further, various factors, including our customers’ business, integration, migration and security requirements, or errors by us or our partners, may cause implementations to be delayed, inefficient or otherwise unsuccessful. For example, changes in the functional requirements of our customers, delays in timeline, or deviation from recommended best practices may occur during the course of an implementation project. As a result of these and other risks, we or our customers may incur significant implementation costs in connection with the purchase and implementation of our products. Some customer implementations may take longer than planned or fail to meet our customers’ expectations, which may delay our ability to upsell additional products or result in customers canceling or failing to renew their subscriptions before our products have been fully implemented. Unsuccessful, lengthy, or costly customer implementation and integration projects could result in claims from customers, harm to our reputation, and opportunities for competitors to displace our products, each of which could have an adverse effect on our business and operating results.
7
Disruptions or defects in our services could damage our customers’ businesses, subject us to substantial liability and harm our reputation and financial results.
From time to time, we experience defects in our services, and new defects may be detected in the future. For example, we provide regular updates to our services, which frequently contain undetected defects when first introduced or released. Defects may also be introduced by our use of third-party software, including open source software. Disruptions may result from errors we make in delivering, configuring or hosting our services, or designing, installing, expanding or maintaining our cloud infrastructure. Disruptions in service can also result from incidents that are outside of our control, including denial of service attacks. We currently serve our customers primarily using equipment managed by us and co-located in third-party data center facilities operated by several different providers located around the world. These centers are vulnerable to damage or interruption from earthquakes, floods, fires, power loss and similar events. They may also be subject to break-ins, sabotage, intentional acts of vandalism and similar misconduct, equipment failure and adverse events caused by operator error. Despite precautions taken at these facilities, problems at these facilities could result in lengthy interruptions in our services and the loss of customer data. In addition, our customers may use our services in ways that cause disruptions in service for other customers. Our customers use our services to manage important aspects of their own businesses, and our reputation and business will be adversely affected if our customers and potential customers believe our services are unreliable. Disruptions or defects in our services may reduce our revenues, cause us to issue credits or pay penalties, subject us to claims and litigation, cause our customers to delay payment or terminate or fail to renew their subscriptions, and adversely affect our ability to attract new customers. The occurrence of payment delays, or service credit, warranty, termination for material breach or other claims against us, could result in an increase in our bad debt expense, an increase in collection cycles for accounts receivable, an increase to our service level credit accruals or other increased expenses or risks of litigation. We do not have insurance sufficient to compensate us for the potentially significant losses that may result from claims arising from disruptions in our services.
Our operating results may vary significantly from period to period, and if we fail to meet the financial performance expectations of investors or securities analysts, the price of our common stock could decline substantially.
Our operating results may vary significantly from period to period as a result of various factors, some of which are beyond our control. For any quarterly or annual period, there is a risk that our financial performance will not meet the financial guidance we have previously given for that period, or that we may otherwise fail to meet the financial performance expectations of the securities analysts who issue reports on our company and our common stock price, or of investors in our common stock. There is also a risk that we may issue forward-looking financial guidance for a quarterly or annual period that fails to meet the expectations of such securities analysts or investors. If any of the foregoing occurs, for any reason either within or outside of our control, the price of our common stock could decline substantially and investors in our common stock could incur substantial losses. Some of the important factors that may cause our revenues, operating results and cash flows to vary widely, or cause our forward-looking financial guidance, to fall below the expectations of such securities analysts or investors, include:
• | our ability to attract new customers, retain and increase sales to existing customers, and satisfy our customers’ requirements; |
• | changes in our mix of products and services; |
• | changes in foreign currency exchange rates and our ability to effectively hedge our foreign currency exposure; |
• | the rate of expansion and productivity of our sales force; |
• | the number of new employees added; |
• | the cost, timing and management effort for our development of new products and services; |
• | general economic conditions that may adversely affect either our customers’ ability or willingness to purchase additional subscriptions, delay a prospective customer’s purchasing decision, reduce the value of new subscription contracts or adversely affect renewal rates; |
• | the amount and timing of operating costs and capital expenditures related to the operation and expansion of our business; |
• | seasonality in terms of when we enter into customer agreements for our services; |
• | the length of the sales cycle for our services; |
• | changes to our management team; |
• | changes in our pricing policies, whether initiated by us or as a result of competition; |
• | significant security breaches, technical difficulties or interruptions of our services; |
• | new solutions, products or changes in pricing policies introduced by our competitors; |
• | changes in effective tax rates; |
• | changes in the average contract term of our customer agreements, changes in timing of renewals and changes in billings duration; |
• | changes in our renewal and upsell rates; |
• | the timing of customer payments and payment defaults by customers; |
• | extraordinary expenses such as litigation costs or damages, including settlement payments; |
8
• | the costs associated with acquiring new businesses and technologies and the follow-on costs of integration, including the tax effects of acquisitions; |
• | the impact of new accounting pronouncements, including the new revenue recognition standards that were effective for us beginning January 1, 2018; |
• | changes in laws or regulations impacting the delivery of our services; |
• | our ability to comply with privacy laws and regulations, including the General Data Protection Regulation (GDPR); |
• | the amount and timing of equity awards and the related financial statement expenses; and |
• | our ability to accurately estimate the total addressable market for our products and services. |
Changes in our effective tax rate could impact our financial results.
We are subject to income taxes in the United States and various foreign jurisdictions. We believe that our provision for income taxes is reasonable, but the ultimate tax outcome may differ from the amounts recorded in our financial statements and may materially affect our financial results in the period or periods in which such outcome is determined. Our effective tax rate could be adversely affected by changes in the mix of earnings and losses in countries with differing statutory tax rates, certain non-deductible expenses, the valuation of deferred tax assets and liabilities and the effects of acquisitions. Increases in our effective tax rate would reduce our profitability or in some cases increase our losses.
Additionally, our future effective tax rate could be impacted by changes in accounting principles or changes in U.S. federal, state or international tax laws or tax rulings. The U.S. recently enacted significant tax reform, and certain provisions of the new law may adversely affect us. Many countries and organizations such as the Organization for Economic Cooperation and Development are actively considering changes to existing tax laws or have proposed or enacted new laws that could increase our tax obligations in countries where we do business or cause us to change the way we operate our business. Any changes in federal, state or international tax laws or tax rulings may increase our worldwide effective tax rate and harm our financial position and results of operations.
In addition, we may be subject to income tax audits by tax jurisdictions throughout the world, many of which have not established clear guidance on the tax treatment of cloud computing companies. Although we believe our income tax liabilities are reasonably estimated and accounted for in accordance with applicable laws and principles, an adverse resolution of one or more uncertain tax positions in any period could have a material impact on the results of operations for that period.
Uncertainties in the interpretation and application of the 2017 Tax Cuts and Jobs Act could materially affect our tax obligations and effective tax rate.
The 2017 Tax Cuts and Jobs Act (the Tax Act) was enacted on December 22, 2017, and significantly changes how the U.S. imposes income tax on multinational corporations. The U.S. Department of Treasury has broad authority to issue regulations and interpretative guidance that may significantly impact how we will apply the law and affect our results of operations in the period issued.
The Tax Act requires complex computations not previously provided in U.S. tax law. As such, the application of accounting guidance for such items is currently uncertain. Further, compliance with the Tax Act and the accounting for such provisions require accumulation of information not previously required or regularly produced. As a result, we have provided a provisional estimate on the effect of the Tax Act in our financial statements. As additional regulatory guidance is issued by the applicable taxing authorities, accounting treatment is clarified, we perform additional analysis on the application of the law, and we refine estimates in calculating the impact, our final analysis, which will be recorded in the period completed, may be different from our current provisional amounts, which could materially affect our tax obligations and effective tax rate.
9
Our financial results may be adversely affected by changes in accounting principles applicable to us.
We prepare our financial statements in accordance with GAAP, which are subject to interpretation or changes by the Financial Accounting Standards Board (FASB), the SEC and other bodies formed to promulgate and interpret appropriate accounting principles. New accounting pronouncements and changes in accounting principles have occurred in the past and are expected to occur in the future, which may have a significant effect on our financial results. For example, in May 2014, the FASB issued Accounting Standards Update (ASU) 2014-09, “Revenue from Contracts with Customers (Topic 606),” which supersedes nearly all existing revenue recognition guidance under GAAP. Under this new standard, revenue is recognized when a customer obtains control of promised goods or services and is recognized in an amount that reflects the consideration which the entity expects to receive in exchange for those goods or services. This new standard is effective for our interim and annual periods beginning January 1, 2018, and we expect this new standard to have a material impact on the timing of revenue and expense recognition for our contracts related to on-premises offerings and on our deferred commissions asset and the related amortization expense. Refer to Note 2 in the notes to our consolidated financial statements included elsewhere in this Annual Report on Form 10-K for additional information on the new guidance and its impact on us. Adoption of this standard and any difficulties in implementation of changes in accounting principles, including the ability to modify our accounting systems and internal controls, could cause us to fail to meet our financial reporting obligations, which could result in regulatory discipline and harm investors’ confidence in us.
Foreign currency exchange rate fluctuations could harm our financial results.
We conduct significant transactions, including revenue transactions and intercompany transactions, in currencies other than the U.S. Dollar or the functional operating currency of the transactional entities. In addition, our international subsidiaries maintain significant net assets that are denominated in currencies other than the functional operating currencies of these entities. Accordingly, changes in the value of currencies relative to the U.S. Dollar may impact our consolidated revenues and operating results due to transactional and translational remeasurement that is reflected in our earnings. It is particularly difficult to forecast any impact from exchange rate movements, so there is risk that unanticipated currency fluctuations could adversely affect our financial results or cause our results to differ from investor expectations or our own guidance in any future periods. In addition, the June 23, 2016 referendum by British voters to exit the European Union adversely impacted global markets, including currencies, and resulted in a decline in the value of the British pound, as compared to the U.S. Dollar and other currencies. Volatility in exchange rates and global financial markets may continue due to a number of factors, including the continued negotiation of the United Kingdom's exit from the European Union and the recent political and economic uncertainty globally.
While we have not engaged in the hedging of our foreign currency transactions to date, in 2018 we expect to begin using derivative instruments, such as foreign currency forwards, swaps and option contracts, to hedge certain exposures to fluctuations in foreign currency exchange rates. These hedging contracts may reduce, but cannot entirely eliminate, the impact of adverse currency exchange rate movements. Further, unanticipated changes in currency exchange rates may result in poorer overall investment performance than if we had not engaged in any such hedging transactions. In addition, the degree of correlation between price movements of the instruments used in a hedging strategy and price movements in the portfolio positions being hedged may vary. Moreover, for a number of reasons, including our limited experience with these hedging contracts, we may not seek or be able to establish a perfect or effective correlation between such hedging instruments and the portfolio holdings being hedged. Any such imperfect correlation may prevent us from achieving the intended hedge and expose us to risk of loss.
10
The markets in which we participate are intensely competitive, and if we do not compete effectively our business and operating results will be adversely affected.
The markets for our enterprise cloud solutions are rapidly evolving and highly competitive, with relatively low barriers to entry. As the market for service management matures, we expect competition to intensify. We compete primarily with large, well-established, enterprise application software vendors, in-house solutions, large integrated systems vendors, established and emerging cloud vendors and vendors of products and services for development operations. Many prospective customers have invested substantial personnel and financial resources to implement and integrate their current enterprise software into their businesses and therefore may be reluctant or unwilling to migrate away from their current solution to our enterprise cloud solutions. Many of our competitors and potential competitors are larger, have greater name recognition, longer operating histories, more established customer relationships, larger marketing budgets and greater resources than we do. Further, other potential competitors not currently offering competitive products may expand their services to compete with our services. We have expanded the breadth of our services to include offerings in the markets for IT operations management, customer service management, security operations management, HR service delivery and use of our platform by developers of custom applications. As a result, we expect increasing competition from platform vendors and from application development vendors focused on these other markets. Our competitors may be able to respond more quickly and effectively than we can to new or changing opportunities, technologies, standards and customer requirements. In addition, some of our competitors offer their products or services at a lower price, which has resulted in pricing pressures. Larger competitors with more diverse product and service offerings may reduce the price of products or subscriptions that compete with ours or may bundle them with other products and subscriptions. We expect that smaller competitors and new entrants may accelerate pricing pressures, including in the IT service management market, which is our more mature offering and from which we derive the substantial majority of our revenues. For all of these reasons, we may not be able to compete successfully and competition could result in reduced sales, reduced margins, losses or the failure of our solutions to achieve or maintain market acceptance, any of which could harm our business.
Lawsuits against us by third-parties that allege we infringe their intellectual property rights could harm our business and operating results.
There is considerable patent and other intellectual property development activity in our industry. Many companies in our industry, including our competitors and other third parties, as well as non-practicing entities, own large numbers of patents, copyrights, trademarks and trade secrets, which they may use to assert claims of patent infringement, misappropriation or other violations of intellectual property rights against us.
Moreover, the patent portfolios of most of our competitors are larger than ours. This disparity may increase the risk that our competitors may sue us for patent infringement and may limit our ability to counterclaim for patent infringement or settle through patent cross-licenses. From time to time, our competitors or other third parties, including patent holding companies seeking to monetize patents they have purchased or otherwise obtained, may claim that we are infringing upon their intellectual property rights. For example, we recorded charges for aggregate legal settlements of $270.0 million in our consolidated statement of comprehensive loss during the year ended December 31, 2016. The charge covers the fulfillment by us of all financial obligations under settlement agreements with BMC and HPE, with no remaining financial obligations under either settlement.
In any intellectual property litigation, regardless of the scope or merits of the claims at issue, we may incur substantial attorney’s fees and other litigation expenses and, if the claims are successfully asserted against us and we are found to be infringing upon the intellectual property rights of others, we could be required to: pay substantial damages and make substantial ongoing royalty payments; cease offering our products and services; modify our products and services; comply with other unfavorable terms, including settlement terms; and indemnify our customers and business partners and obtain costly licenses on their behalf and refund fees or other payments previously paid to us. Further, upon expiration of the term of any third-party agreements that allow us to use their intellectual property, we may be unable to renew such agreements on favorable terms, if at all, in which case we may face intellectual property litigation. The mere existence of any lawsuit, or any interim or final outcomes, and the course of its conduct and the public statements related to it (or absence of such statements) by the courts, press, analysts and litigants, could be unsettling to our customers and prospective customers and could cause an adverse impact to our customer satisfaction and related renewal rates and cause us to lose potential sales, and could also be unsettling to investors or prospective investors in our common stock and could cause a substantial decline in the price of our common stock. Accordingly, any claim or litigation against us could be costly, time-consuming and divert the attention of our management and key personnel from our business operations and harm our financial condition and operating results.
11
Our intellectual property protections may not provide us with a competitive advantage, and defending our intellectual property may result in substantial expenses that harm our operating results.
Our success depends to a significant degree on our ability to protect our proprietary technology and our brand under a combination of patent and other intellectual property laws of the United States and other jurisdictions. Though we seek patent protection for our technology, we may not be successful in obtaining patent protection, and any patents acquired in the future may not provide us with competitive advantages, or may be successfully challenged by third parties. Furthermore, legal standards relating to the validity, enforceability and scope of protection of intellectual property rights are uncertain. Any of our intellectual property rights may be challenged by others or invalidated through administrative process or litigation. Effective patent, trademark, copyright and trade secret protection may not be available to us in every country in which our services are available. The laws of some foreign countries may not be as protective of intellectual property rights as those in the United States, and mechanisms for enforcement of intellectual property rights may be inadequate. We may be required to spend significant resources to monitor and protect our intellectual property rights. We have, and in the future may, initiate claims or litigation against third parties for infringement of our proprietary rights or to establish the validity of our proprietary rights. Any litigation, whether or not it is resolved in our favor, could result in significant expense to us, divert the efforts of our technical and management personnel and may result in counter-claims with respect to infringement of intellectual property rights by us. If we are unable to prevent third parties from infringing upon or misappropriating our intellectual property, or are required to incur substantial expenses in defending our intellectual property rights, our business and operating results may be adversely affected.
If we are unsuccessful in increasing our penetration of international markets or managing the risks associated with foreign markets, our business and operating results will be adversely affected.
Sales outside of North America represented approximately 33% and 32% of our total revenues for each of the years ended December 31, 2017 and 2016, respectively. Our business and future prospects depend on increasing our international sales as a percentage of our total revenues, and the failure to grow internationally will harm our business. Additionally, operating in international markets requires significant investment and management attention and will subject us to regulatory and economic risks that are different from those in the United States. We have made, and will continue to make, substantial investments in data centers and cloud computing infrastructure, sales, marketing, personnel and facilities as we enter and expand in new geographic markets. When we make these investments, it is typically unclear whether, and when, sales in the new market will justify our investments, and we may significantly underestimate the level of investment and time required to be successful, or whether we will be successful. Our rate of acquisition of new Global 2000 customers, a key factor effecting our growth, has generally been lower in Africa, Asia, Eastern Europe, South America and other markets in which we are less established, as compared to North America, Australia and areas within Western Europe. Over time an increasing proportion of the Global 2000 companies that are not yet our customers are located in emerging markets where we are less established. We have experienced, and may continue to experience, difficulties in some of our investments in geographic expansion, including in hiring qualified sales management personnel and managing foreign operations.
Risks inherent with international sales include without limitation:
• | compliance with multiple, conflicting and changing governmental laws and regulations, including employment, tax, competition, privacy and data protection laws and regulations; |
• | compliance by us and our business partners with international bribery and anti-corruption laws, including the UK Bribery Act and the Foreign Corrupt Practices Act; |
• | the risk that illegal or unethical activities of our business partners will be attributed to or result in liability to us; |
• | longer and potentially more complex sales cycles; |
• | longer accounts receivable payment cycles and other collection difficulties; |
• | tax treatment of revenues from international sources and changes to tax codes, including being subject to foreign tax laws and being liable for paying withholding, income or other taxes in foreign jurisdictions; |
• | different pricing and distribution environments; |
• | foreign currency fluctuations which may cause transactional and translational remeasurement losses; |
• | potential changes in international trade policies and agreements; |
• | local business practices and cultural norms that may favor local competitors; and |
• | localization of our services, including translation into foreign languages and associated expenses. |
If we are unable to manage these risks, if our required investments in these international markets are greater than anticipated, or if we are unsuccessful in increasing sales in emerging markets, our revenue growth rate, business and operating results will be adversely affected.
12
If we lose key employees or are unable to attract and retain the employees we need, our business and operating results will be adversely affected.
Our success depends largely upon the continued services of our management team, including our Chief Executive Officer, and many key individual contributors. From time to time, there may be changes in our management team resulting from the hiring or departure of executives. For example, in 2017, Frank Slootman stepped down as our President and Chief Executive Officer, and John J. Donahoe was appointed as his successor. Such changes may result in a loss of institutional knowledge and cause disruptions to our business.
In the technology industry, there is substantial and continuous competition for engineers with high levels of experience in designing, developing and managing software and Internet-related solutions, as well as competition for sales executives and operations personnel. We may not be successful in attracting and retaining qualified personnel. We have from time to time experienced, and we may continue to experience, difficulty in hiring and retaining highly skilled employees with appropriate qualifications, and may not be able to fill positions in desired geographic areas or at all. In particular, competition for experienced software and cloud computing infrastructure engineers in the San Francisco Bay area, San Diego, Seattle, London and Amsterdam, our primary operating locations, is intense. Our employees, including our executive officers, are employed by us on an “at-will” basis, which means they may terminate their employment with us at any time. If we fail to attract new personnel or fail to retain and motivate our current personnel, our business and future growth prospects could be adversely affected.
Privacy laws and concerns, evolving regulation of cloud computing, cross-border data transfer restrictions, other foreign and domestic regulations and standards related to personal data and the Internet may adversely affect our business.
National and local governments or agencies have in the past adopted, and may in the future adopt, laws and regulations affecting data privacy, the use of the Internet as a commercial medium, and data sovereignty requirements concerning the location of data centers that store and process data. Changing laws, regulations and standards applying to the collection, transfer, processing, storage or use of personal data could affect our customers’ ability to use and share data, potentially restricting our ability to store, process and share data with our customers in connection with providing our services, and in some cases, could impact our ability to offer our services in certain locations or our customers’ ability to deploy our services globally. For example, the European Union (EU) and United States agreed to a framework to facilitate the transfer of data from the EU to the United States, called Privacy Shield, but this new framework has been challenged by private parties and may face additional challenges by national regulators or private parties. Additionally, in 2016 the EU adopted a new regulation governing data privacy called the General Data Protection Regulation (GDPR), which takes effect in May 2018. Further, laws such as the EU’s proposed e-Privacy Regulation are increasingly aimed at the use of personal information for marketing purposes, and the tracking of individuals’ online activities.
The costs of compliance with, and other burdens imposed by, GDPR, the e-Privacy Regulation and other privacy laws, regulations and standards may cause us to incur substantial operational costs or require us to modify our data handling practices, may limit the use and adoption of our services and reduce overall demand for our services. In addition, non-compliance could result in proceedings against us by governmental entities or others, significant fines, and may otherwise adversely impact our business, financial condition and operating results.
In addition to government activity, privacy advocacy groups and the technology and other industries have established or may establish various new, additional or different self-regulatory standards that may place additional burdens on us. Our customers may expect us to meet voluntary certifications or adhere to other standards established by third parties. If we are unable to maintain these certifications or meet these standards, it could reduce demand for our applications and adversely affect our business.
Because we generally recognize revenues from our subscription service over the subscription term, a decrease in new or renewed subscriptions during a reporting period may not be immediately reflected in our operating results for that period.
We generally recognize revenues from customers ratably over the terms of their subscriptions. As a result, most of the revenues we report in each period are derived from the recognition of deferred revenues relating to subscriptions entered into during previous periods. Consequently, a decrease in new or renewed subscriptions in any single reporting period will have a limited impact on our revenues for that period. In addition, our ability to adjust our cost structure in the event of a decrease in new or renewed subscriptions may be limited.
13
Further, a decline in new or renewed subscriptions in a given period will negatively affect our revenues in future periods. Accordingly, the effect of significant downturns in sales and market acceptance of our services, and changes in our rate of renewals, may not be fully reflected in our results of operations until future periods. Our subscription model also makes it difficult for us to rapidly increase our revenues through additional sales in any period, as revenues from new customers are generally recognized over the applicable subscription term. Additionally, due to the complexity of certain of our customer contracts, the actual revenue recognition treatment required under Topic 606 will depend on contract-specific terms and may result in greater variability in revenues from period to period.
A decrease in new or renewed subscriptions in a reporting period may not be immediately reflected in our billings results for that period due to factors that may offset the decrease.
A decrease in new or renewed subscriptions in a reporting period may not have an immediate impact on billings for that period due to factors that may offset the decrease, such as an increase in billings duration, the dollar value of contracts with future start dates, or the dollar value of collections in the current period related to contracts with future start dates.
As we acquire or invest in companies and technologies, we may not realize the expected business or financial benefits and the acquisitions and investments may divert our management’s attention and result in additional dilution to our stockholders.
We have acquired or invested in companies and technologies in the past as part of our business strategy and may continue to evaluate potential strategic transactions, including acquisitions of, or investments in, businesses, technologies, services, products and other assets in the future. We also may enter into relationships with other businesses to expand our service offerings, functionality or our ability to provide services in international locations, which could involve preferred or exclusive licenses, additional channels of distribution, discount pricing or investments in other companies. Acquisitions and investments involve numerous risks, including:
• | assimilating or integrating the businesses, technologies, products, personnel or operations of the acquired companies; |
• | failing to achieve the expected benefits of the acquisition or investment; |
• | potential loss of key employees of the acquired company; |
• | inability to maintain relationships with customers and partners of the acquired business; |
• | unanticipated expenses related to acquired technology and its integration into our existing technology; |
• | potential adverse tax consequences; |
• | inability to generate sufficient revenue to offset acquisition or investment costs; |
• | disruption to our business and diversion of management attention and other resources; |
• | potential financial and credit risks associated with acquired customers; |
• | dependence on acquired technologies or licenses for which alternatives may not be available to us without significant cost or complexity; |
• | in the case of foreign acquisitions, the challenges associated with integrating operations across different cultures and languages and any currency and regulatory risks associated with specific countries; and |
• | potential unknown liabilities associated with the acquired businesses. |
In addition, we may have to pay cash, incur debt, or issue equity or equity-linked securities to pay for any future acquisitions, each of which could adversely affect our financial condition or the market price of our common stock. Furthermore, if we finance acquisitions by issuing equity or convertible or other debt securities or loans, our existing stockholders may be diluted, or we could face constraints related to the terms of and repayment obligation related to the incurrence of indebtedness that could affect the market price of our common stock. The occurrence of any of these risks could harm our business, operating results and financial condition.
14
A portion of our revenues are generated by sales to government entities and heavily regulated organizations, which are subject to a number of challenges and risks.
A portion of our sales are to governmental agencies. Additionally, many of our current and prospective customers, such as those in the financial services and health care industries, are highly regulated and may be required to comply with more stringent regulations in connection with subscribing to and implementing our services. Selling to these entities can be highly competitive, expensive and time consuming, often requiring significant upfront time and expense without any assurance that we will successfully complete a sale. Furthermore, engaging in sales activities to foreign governments introduces additional compliance risks specific to the Foreign Corrupt Practices Act, the UK Bribery Act and other similar statutory requirements prohibiting bribery and corruption in the jurisdictions in which we operate. Government and highly regulated entities often require contract terms that differ from our standard arrangements and impose compliance requirements that are complicated, require preferential pricing or “most favored nation” terms and conditions, or are otherwise time consuming and expensive to satisfy. If we undertake to meet special standards or requirements and do not meet them, we could be subject to increased liability from our customers or regulators. Even if we do meet them, the additional costs associated with providing our services to government and highly regulated customers could harm our margins. Moreover, changes in the underlying regulatory conditions that affect these types of customers could harm our ability to efficiently provide our services to them and to grow or maintain our customer base.
Our use of open source software could harm our ability to sell our services and subject us to possible litigation.
Our products incorporate software licensed to us by third-party authors under open source licenses, and we may continue to incorporate open source software into other services in the future. We attempt to monitor our use of open source software in an effort to avoid subjecting our services to adverse licensing conditions. However, there can be no assurance that our efforts have been or will be successful. There is little or no legal precedent governing the interpretation of the terms of open source licenses, and therefore the potential impact of these terms on our business is uncertain and enforcement of these terms may result in unanticipated obligations regarding our services and technologies. For example, depending on which open source license governs open source software included within our services or technologies, we may be subjected to conditions requiring us to offer our services to users at no cost; make available the source code for modifications and derivative works based upon, incorporating or using the open source software; and license such modifications or derivative works under the terms of the particular open source license. Moreover, if an author or other third party that distributes such open source software were to allege that we had not complied with the conditions of one or more of these licenses, we could be required to incur significant legal costs defending ourselves against such allegations, be subject to significant damages or be enjoined from the distribution of our services.
If we are unable to maintain effective internal control over financial reporting, the accuracy and timeliness of our financial reporting may be adversely affected.
The Sarbanes-Oxley Act requires us, among other things, to assess and report on the effectiveness of our internal control over financial reporting annually and disclosure controls and procedures quarterly. In addition, our independent registered public accounting firm is required to audit the effectiveness of our internal control over financial reporting pursuant to Section 404(b) of the Sarbanes-Oxley Act annually. Our independent registered public accounting firm may issue a report that is adverse in the event it is not satisfied with the level at which our controls are documented, designed or operating. Moreover, our testing, or the subsequent testing by our independent registered public accounting firm, may reveal material weaknesses. If material weaknesses are identified or we are not able to comply with the requirements of Section 404 in a timely manner, our reported financial results could be materially misstated or could subsequently require restatement, we could receive an adverse opinion regarding our internal control over financial reporting from our independent registered public accounting firm, we could be subject to investigations or sanctions by regulatory authorities and we could incur substantial expenses. New accounting principles, such as the new revenue recognition standards that became effective for us beginning January 1, 2018, require significant changes to our existing processes and controls. We may not be able to effectively implement system and process changes required for new standards on a timely basis. Any delays or failure to update our systems and processes could also lead to a material weakness.
15
Global economic conditions may harm our industry, business and results of operations.
We operate globally and as a result our business and revenues are impacted by global macroeconomic conditions. Global financial developments seemingly unrelated to us or the software industry may harm us. From time to time, the United States and other key international economies have been impacted by geopolitical instability, high levels of bad debt globally, falling demand for a variety of goods and services, high levels of persistent unemployment and wage and income stagnation in some geographic markets, restricted credit, poor liquidity, reduced corporate profitability, volatility in credit, equity and foreign exchange markets, bankruptcies and overall uncertainty with respect to the economy. These conditions can arise suddenly and affect the rate of information technology spending and could adversely affect our customers’ ability or willingness to purchase our services, delay prospective customers’ purchasing decisions, reduce the value or duration of their subscriptions, or affect renewal rates, all of which could harm our operating results. In addition, the effects, if any, of global financial conditions on our business can be difficult to distinguish from the effects on our business from product, pricing, and other developments in the markets specific to our products and our relative competitive strength. If we make incorrect judgments about our business for this reason our business and results of operations could be adversely affected.
Natural disasters and other events beyond our control could harm our business.
Natural disasters or other catastrophic events may cause damage or disruption to our operations, international commerce and the global economy, and thus could have a negative effect on us. Our business operations are subject to interruption by natural disasters, flooding, fire, power shortages, pandemics, terrorism, political unrest and other events beyond our control. Although we maintain crisis management and disaster response plans, such events could make it difficult or impossible for us to deliver our services to our customers, could decrease demand for our services, and could cause us to incur substantial expense. Our insurance may not be sufficient to cover losses or additional expense that we may sustain in connection with any natural disaster. The majority of our research and development activities, corporate offices, information technology systems, and other critical business operations are located near major seismic faults in California and Washington. Customer data could be lost, significant recovery time could be required to resume operations and our financial condition and operating results could be adversely affected in the event of a major natural disaster or catastrophic event.
Risks Related to Our 0% Convertible Senior Notes Due 2022 (2022 Notes) and Our 0% Convertible Senior Notes Due 2018 (2018 Notes)
We may not have the ability to raise the funds necessary to settle conversions of the convertible senior notes in cash or to repurchase the convertible senior notes upon a fundamental change, and our future debt may contain limitations on our ability to pay cash upon conversion or repurchase of the convertible senior notes.
Holders of the 2022 Notes and 2018 Notes have the right to require us to repurchase all or a portion of their 2022 Notes and 2018 Notes upon the occurrence of a fundamental change (as defined in the indenture for each of the 2022 Notes and 2018 Notes, as applicable) at a repurchase price equal to 100% of the principal amount of the 2022 Notes and 2018 Notes to be repurchased, plus accrued and unpaid special interest, if any. In addition, if a make-whole fundamental change (as defined in the indenture for each of the 2022 Notes and 2018 Notes, as applicable) occurs prior to the maturity date of the 2022 Notes or 2018 Notes, we will in some cases be required to increase the conversion rate for a holder that elects to convert its 2022 Notes or 2018 Notes in connection with such make-whole fundamental change. Upon conversion of the 2022 Notes or 2018 Notes, unless we elect to deliver solely shares of our common stock to settle such conversion (other than paying cash in lieu of delivering any fractional share), we will be required to make cash payments in respect of the 2022 Notes or 2018 Notes being converted. However, we may not have enough available cash or be able to obtain financing at the time we are required to make repurchases of the 2022 Notes or 2018 Notes surrendered therefor or pay cash with respect to the 2022 Notes or 2018 Notes being converted.
We and our subsidiaries may incur substantial additional debt in the future, subject to the restrictions contained in our future debt instruments, some of which may be secured debt. We are not restricted under the terms of the indentures governing each of the 2022 Notes and 2018 Notes from incurring additional debt, securing existing or future debt, recapitalizing our debt or taking a number of other actions that could have the effect of diminishing our ability to make payments on the 2022 Notes and 2018 Notes when due. Furthermore, the indentures for each of the 2022 Notes and 2018 Notes prohibit us from engaging in certain mergers or acquisitions unless, among other things, the surviving entity assumes our obligations under the 2022 Notes and 2018 Notes and their respective indentures. These and other provisions in each of the indentures could deter or prevent a third party from acquiring us even when the acquisition may be favorable to holders of the 2022 Notes and 2018 Notes.
16
In addition, our ability to repurchase or to pay cash upon conversion of the 2022 Notes or 2018 Notes may be limited by law, regulatory authority or agreements governing our future indebtedness. Our failure to repurchase 2022 Notes or 2018 Notes at a time when the repurchase is required by each indenture or to pay cash upon conversion of the 2022 Notes or 2018 Notes as required by each indenture would constitute a default. A default under each indenture or the fundamental change itself could also lead to a default under agreements governing our future indebtedness. Moreover, the occurrence of a fundamental change under each indenture could constitute an event of default under any such agreements. If the payment of the related indebtedness were to be accelerated after any applicable notice or grace periods, we may not have sufficient funds to repay the indebtedness and repurchase the 2022 Notes or 2018 Notes, or to pay cash upon conversion of the 2022 Notes or 2018 Notes.
The conditional conversion feature of the 2022 Notes and 2018 Notes, if triggered, may adversely affect our financial condition and operating results.
The holders of the 2022 Notes and 2018 Notes may elect to convert their notes during any calendar quarter (and only during such calendar quarter) if the last reported sale price of our common stock for at least 20 trading days during the period of 30 consecutive trading days ending on the last trading day of the immediately preceding calendar quarter is greater than or equal to $175.18, in the case of the 2022 Notes, or $96.04, in the case of the 2018 Notes (in each case, the Conversion Condition). The Conversion Condition was met for the 2018 Notes during the three months ended June 30, 2017, September 30, 2017, and December 31, 2017, respectively. Accordingly, the 2018 Notes were convertible at the holders’ option during each of the three months ended September 30, 2017 and December 31, 2017 and will continue to be convertible at the holders’ option through the three months ending March 31, 2018. During the year ended December 31, 2017, we paid cash to settle an immaterial principal amount of the 2018 Notes. Based on additional conversion requests we have received through the filing date, we expect to settle in cash an aggregate of $37.3 million in principal amount of the 2018 Notes during the first quarter of 2018 and $7.3 million in principal amount of the 2018 Notes during the second quarter of 2018. We may receive additional conversion requests that require settlement in the second quarter or the remainder of the year 2018. If one or more holders elect to convert their 2018 Notes (or 2022 Notes, if the Conversion Condition is triggered) in future periods, unless we elect to satisfy our conversion obligation by delivering solely shares of our common stock (other than paying cash in lieu of delivering any fractional share), we may settle all or a portion of our conversion obligation in cash, which could adversely affect our liquidity and result in a material adverse effect on our financial position, results of operations and cash flows. In addition, to the extent we receive conversion requests, we may also record a loss on extinguishment of the 2018 Notes (or 2022 Notes, if the Conversion Condition is triggered) converted by noteholders based on the difference between the fair market value allocated to the liability component on the settlement date and the net carrying amount of the liability component and unamortized debt issuance on the settlement date.
The convertible note hedge and warrant transactions may affect the value of the 2022 Notes and 2018 Notes and our common stock.
In connection with the sale of the 2022 Notes and 2018 Notes, we entered into convertible note hedge (the 2022 Note Hedge and 2018 Note Hedge, respectively) transactions with certain financial institutions (option counterparties). We also entered into warrant transactions with the option counterparties pursuant to which we sold warrants for the purchase of our common stock (the 2022 Warrants and 2018 Warrants, respectively). The 2022 Note Hedge and 2018 Note Hedge transactions are expected generally to reduce the potential dilution upon any conversion of the 2022 Notes or 2018 Notes and/or offset any cash payments we are required to make in excess of the principal amount of converted 2022 Notes or 2018 Notes, as the case may be. The warrant transactions could separately have a dilutive effect to the extent that the market price per share of our common stock exceeds the exercise price of the 2022 Warrants or 2018 Warrants, which is $203.40 and $107.46, respectively.
The option counterparties and/or their respective affiliates may modify their hedge positions by entering into or unwinding various derivatives with respect to our common stock and/or purchasing or selling our common stock in secondary market transactions prior to the maturity of the 2022 Notes or 2018 Notes (and are likely to do so during any observation period related to a conversion of 2022 Notes or 2018 Notes, or following any repurchase of 2022 Notes or 2018 Notes by us on any fundamental change repurchase date (as defined in the indentures for the 2022 Notes and 2018 Notes) or otherwise). This activity could also cause or avoid an increase or a decrease in the market price of our common stock or the 2022 Notes or 2018 Notes, which could affect note holders’ ability to convert the 2022 Notes or 2018 Notes and, to the extent the activity occurs during any observation period related to a conversion of the 2022 Notes or 2018 Notes, it could affect the amount and value of the consideration that note holders will receive upon conversion of the 2022 Notes or 2018 Notes.
17
The potential effect, if any, of these transactions and activities on the market price of our common stock or the 2022 Notes or 2018 Notes will depend in part on market conditions and cannot be ascertained at this time. Any of these activities could adversely affect the value of our common stock and the value of the 2022 Notes and 2018 Notes (and as a result, the value of the consideration, the amount of cash and/or the number of shares, if any, that note holders would receive upon the conversion of any 2022 Notes or 2018 Notes) and, under certain circumstances, the ability of the note holders to convert the 2022 Notes or 2018 Notes.
We do not make any representation or prediction as to the direction or magnitude of any potential effect that the transactions described above may have on the price of the 2022 Notes or 2018 Notes or our common stock. In addition, we do not make any representation that the option counterparties will engage in these transactions or that these transactions, once commenced, will not be discontinued without notice.
We are subject to counterparty risk with respect to the 2022 Note Hedge and 2018 Note Hedge transactions.
The option counterparties are financial institutions, and we will be subject to the risk that any or all of them may default under the 2022 Note Hedge or 2018 Note Hedge transactions. Our exposure to the credit risk of the option counterparties will not be secured by any collateral. Recent global economic conditions have resulted in the actual or perceived failure or financial difficulties of many financial institutions. If an option counterparty becomes subject to insolvency proceedings, we will become an unsecured creditor in those proceedings, with a claim equal to our exposure at that time under our transactions with that option counterparty. Our exposure will depend on many factors but, generally, an increase in our exposure will be correlated to an increase in the market price and in the volatility of our common stock. In addition, upon a default by an option counterparty, we may suffer adverse tax consequences and more dilution than we currently anticipate with respect to our common stock. We can provide no assurances as to the financial stability or viability of the option counterparties.
Risks Related to Ownership of Our Common Stock
The market price of our common stock has historically been and is likely to continue to be volatile and could subject us to litigation.
The trading price of our common stock has been, and is likely to continue to be, volatile and could be subject to wide fluctuations in response to various factors, some of which are beyond our control. In addition, the trading prices of the securities of technology companies in general have been highly volatile, and the volatility in market price and trading volume of securities is often unrelated or disproportionate to the financial performance of the companies issuing the securities. Factors affecting the market price of our common stock, some of which are beyond our control, include:
• | changes in the estimates of our operating results or changes in recommendations by securities analysts that elect to follow our common stock; |
• | announcements of new products, services or technologies, new applications or enhancements to services, strategic alliances, acquisitions, or other significant events by us or by our competitors; |
• | fluctuations in the valuation of companies perceived by investors to be comparable to us, such as high-growth or cloud companies; |
• | changes to our management team; |
• | trading activity by directors, executive officers and significant stockholders, or the perception in the market that the holders of a large number of shares intend to sell their shares; |
• | the size of our market float; |
• | the volume of trading in our common stock, including sales upon exercise of outstanding options or vesting of equity awards or sales and purchases of any common stock issued upon conversion of the 2022 Notes or 2018 Notes or in connection with the 2022 Note Hedge and 2022 Warrant transactions relating to the 2022 Notes, or 2018 Note Hedge and 2018 Warrant transactions relating to the 2018 Notes; |
• | the economy as a whole, market conditions in our industry, and the industries of our customers; and |
• | overall performance of the equity markets. |
Following periods of volatility in the market price of a company’s securities, securities class action litigation has often been brought against that company. Securities litigation could result in substantial costs and divert our management’s attention and resources from our business. This could have a material adverse effect on our business, operating results, and financial condition.
18
We do not intend to pay dividends on our common stock so any returns will be limited to changes in the value of our common stock.
We have never declared or paid any cash dividends on our common stock. We currently anticipate that we will retain future earnings for the development, operation and expansion of our business and do not anticipate declaring or paying any cash dividends for the foreseeable future. In addition, our ability to pay cash dividends on our common stock may be prohibited or limited by the terms of any future debt financing arrangement. Any return to stockholders will therefore be limited to the increase, if any, of our stock price.
Provisions in our charter documents, Delaware law, our 2022 Notes and our 2018 Notes might discourage, delay or prevent a change of control of our company or changes in our management and, therefore, depress the market price of our common stock.
Our restated certificate of incorporation and restated bylaws contain provisions that could depress the market price of our common stock by acting to discourage, delay or prevent a change in control of our company or changes in our management that the stockholders of our company may deem advantageous. These provisions among other things:
• | establish a classified board of directors so that not all members of our board are elected at one time; |
• | permit the board of directors to establish the number of directors; |
• | provide that directors may only be removed “for cause” and only with the approval of 66 2/3% of our stockholders; |
• | require super-majority voting to amend some provisions in our restated certificate of incorporation and restated bylaws; |
• | authorize the issuance of “blank check” preferred stock that our board could use to implement a stockholder rights plan; |
• | eliminate the ability of our stockholders to call special meetings of stockholders; |
• | prohibit stockholder action by written consent, which requires all stockholder actions to be taken at a meeting of our stockholders; |
• | provide that the board of directors is expressly authorized to make, alter or repeal our restated bylaws; and |
• | establish advance notice requirements for nominations for election to our board or for proposing matters that can be acted upon by stockholders at annual stockholder meetings (though our restated bylaws have implemented stockholder proxy access). |
In addition, Section 203 of the Delaware General Corporation Law may discourage, delay or prevent a change in control of our company. Section 203 imposes certain restrictions on merger, business combinations and other transactions between us and holders of 15% or more of our common stock.
Further, the fundamental change provisions of our 2022 Notes or 2018 Notes may delay or prevent a change in control of our company, because those provisions allow note holders to require us to repurchase such notes upon the occurrence of a fundamental change.
19
ITEM 1B. | UNRESOLVED STAFF COMMENTS |
None.
ITEM 2. | PROPERTIES |
Our principal office is located in Santa Clara, California.
We also maintain offices in various North American, South American, European and Asian countries. All of our properties are currently leased. We believe our existing facilities are adequate to meet our current requirements. See Note 16 in the notes to our consolidated financial statements included elsewhere in this Annual Report on Form 10-K for more information about our lease commitments. We expect to expand our facilities capacity as our employee base grows. We believe we will be able to obtain such space on acceptable and commercially reasonable terms.
ITEM 3. | LEGAL PROCEEDINGS |
From time to time, we are party to litigation and other legal proceedings in the ordinary course of business. While the results of any litigation or other legal proceedings are uncertain, we are not presently a party to any legal proceedings that, if determined adversely to us, would individually or taken together have a material adverse effect on our business, financial position, results of operations or cash flows.
ITEM 4. | MINE SAFETY DISCLOSURES |
Not applicable.
20
PART II
ITEM 5. | MARKET FOR REGISTRANT'S COMMON EQUITY, RELATED STOCKHOLDER MATTERS AND ISSUER PURCHASES OF EQUITY SECURITIES |
Market Information for Common Stock
Our common stock is listed on the New York Stock Exchange under the symbol “NOW.”
The following table sets forth for the indicated periods the high and low sales prices of our common stock as reported by the New York Stock Exchange.
High | Low | ||||||
Year ended December 31, 2017 | |||||||
First Quarter | $ | 94.72 | $ | 74.63 | |||
Second Quarter | $ | 110.66 | $ | 84.03 | |||
Third Quarter | $ | 118.64 | $ | 103.00 | |||
Fourth Quarter | $ | 131.26 | $ | 112.84 | |||
Year ended December 31, 2016 | |||||||
First Quarter | $ | 85.67 | $ | 46.00 | |||
Second Quarter | $ | 77.76 | $ | 60.05 | |||
Third Quarter | $ | 80.31 | $ | 64.31 | |||
Fourth Quarter | $ | 89.79 | $ | 72.80 | |||
Dividend Policy
We have never paid any cash dividends on our common stock. Our board of directors currently intends to retain any future earnings to support operations and to finance the growth and development of our business, and therefore does not intend to pay cash dividends on our common stock for the foreseeable future. Any future determination related to our dividend policy will be made at the discretion of our board of directors.
Stockholders
As of December 31, 2017, there were 11 registered stockholders of record (not including an indeterminate number of beneficial holders of stock held in street name through brokers and other intermediaries) of our common stock.
Securities Authorized for Issuance under Equity Compensation Plans
The information required by this item will be included in an amendment to this Annual Report on Form 10-K or incorporated by reference from our definitive proxy statement to be filed with the SEC pursuant to Regulation 14A.
Stock Performance Graph
The following shall not be deemed incorporated by reference into any of our other filings under the Securities Exchange Act of 1934, as amended (the Exchange Act) or the Securities Act except to the extent we specifically incorporate it by reference into such filing.
The graph below compares the cumulative total stockholder return on our common stock with the cumulative total return on the NYSE Composite Index and the Standard & Poor Systems Software Index for each of the last five fiscal years ended December 31, 2013 through December 31, 2017, assuming an initial investment of $100. Data for the NYSE Composite Index and the Standard & Poor Systems Software Index assume reinvestment of dividends.
21
The comparisons in the graph below are based upon historical data and are not indicative of, nor intended to forecast, future performance of our common stock.
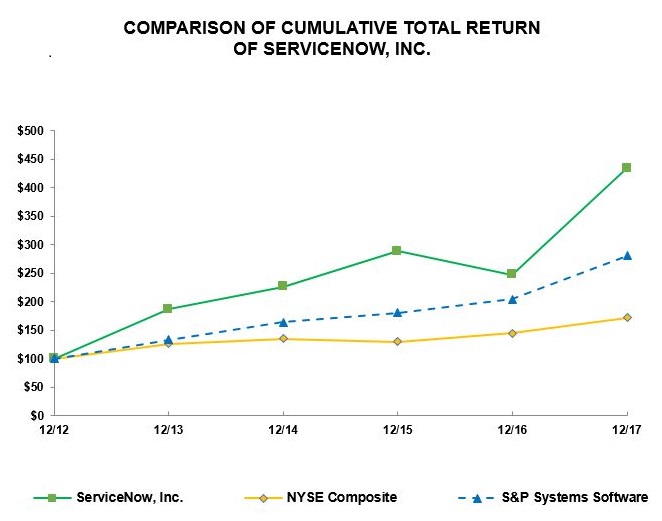
Base Period | |||||||||||||||||||||||
Dec 31, 2012 | Dec 31, 2013 | Dec 31, 2014 | Dec 31, 2015 | Dec 31, 2016 | Dec 31, 2017 | ||||||||||||||||||
ServiceNow, Inc. | $ | 100.00 | $ | 186.51 | $ | 225.94 | $ | 288.25 | $ | 247.55 | $ | 434.20 | |||||||||||
NYSE Composite | 100.00 | 126.28 | 134.81 | 129.29 | 144.73 | 171.83 | |||||||||||||||||
S&P Systems Software | 100.00 | 132.90 | 163.47 | 180.59 | 204.49 | 280.92 | |||||||||||||||||
Unregistered Sales of Equity Securities
There were no unregistered sales of equity securities which have not been previously disclosed in a quarterly report on Form 10-Q or a current report on Form 8-K during the year ended December 31, 2017.
Issuer Purchases of Equity Securities
During the quarter ended December 31, 2017, we did not purchase any of our equity securities that are registered under Section 12 of the Exchange Act.
22
ITEM 6. | SELECTED CONSOLIDATED FINANCIAL DATA |
The following selected consolidated financial data should be read together with our consolidated financial statements and accompanying notes and “Management’s Discussion and Analysis of Financial Condition and Results of Operations” appearing elsewhere in this filing. The selected consolidated financial data in this section are not intended to replace our consolidated financial statements and the related notes. Our historical results are not necessarily indicative of our future results.
The selected consolidated statements of operations data for each of the years ended December 31, 2017, 2016 and 2015, and the selected consolidated balance sheet data as of December 31, 2017 and 2016 are derived from our audited consolidated financial statements and are included in this Form 10-K. The consolidated statements of operations data for the year ended December 31, 2014, and 2013, and the selected consolidated balance sheet data as of December 31, 2015, 2014, and 2013 are derived from our audited consolidated financial statements which are not included in this Annual Report on Form 10-K. The consolidated financial information below reflects the impact of the Company’s acquisitions.
Year Ended December 31, | |||||||||||||||||||
2017 | 2016 | 2015 | 2014 | 2013 | |||||||||||||||
(in thousands, except share and per share data) | |||||||||||||||||||
Consolidated Statements of Operations Data: | |||||||||||||||||||
Revenues: | |||||||||||||||||||
Subscription | $ | 1,739,795 | $ | 1,221,639 | $ | 848,278 | $ | 567,217 | $ | 349,804 | |||||||||
Professional services and other | 193,231 | 168,874 | 157,202 | 115,346 | 74,846 | ||||||||||||||
Total revenues | 1,933,026 | 1,390,513 | 1,005,480 | 682,563 | 424,650 | ||||||||||||||
Cost of revenues (1): | |||||||||||||||||||
Subscription | 315,570 | 235,414 | 183,400 | 142,687 | 87,928 | ||||||||||||||
Professional services and other | 184,202 | 163,268 | 146,013 | 106,089 | 67,331 | ||||||||||||||
Total cost of revenues | 499,772 | 398,682 | 329,413 | 248,776 | 155,259 | ||||||||||||||
Gross profit | 1,433,254 | 991,831 | 676,067 | 433,787 | 269,391 | ||||||||||||||
Operating expenses (1): | |||||||||||||||||||
Sales and marketing | 946,617 | 700,464 | 498,439 | 341,119 | 195,190 | ||||||||||||||
Research and development | 377,518 | 285,239 | 217,389 | 148,258 | 78,678 | ||||||||||||||
General and administrative | 210,533 | 158,936 | 126,604 | 96,245 | 61,790 | ||||||||||||||
Legal settlements (2) | — | 270,000 | — | — | — | ||||||||||||||
Total operating expenses | 1,534,668 | 1,414,639 | 842,432 | 585,622 | 335,658 | ||||||||||||||
Loss from operations | (101,414 | ) | (422,808 | ) | (166,365 | ) | (151,835 | ) | (66,267 | ) | |||||||||
Interest expense | (53,394 | ) | (33,278 | ) | (31,097 | ) | (29,059 | ) | (3,498 | ) | |||||||||
Interest income and other income (expense), net | 5,804 | 6,035 | 4,450 | 5,354 | (1,432 | ) | |||||||||||||
Loss before income taxes | (149,004 | ) | (450,051 | ) | (193,012 | ) | (175,540 | ) | (71,197 | ) | |||||||||
Provision for income taxes | 126 | 1,753 | 5,414 | 3,847 | 2,511 | ||||||||||||||
Net loss | $ | (149,130 | ) | $ | (451,804 | ) | $ | (198,426 | ) | $ | (179,387 | ) | $ | (73,708 | ) | ||||
Net loss per share - basic and diluted | $ | (0.87 | ) | $ | (2.75 | ) | $ | (1.27 | ) | $ | (1.23 | ) | $ | (0.54 | ) | ||||
Weighted-average shares used to compute net loss per share - basic and diluted | 171,175,577 | 164,533,823 | 155,706,643 | 145,355,543 | 135,415,809 | ||||||||||||||
23
(1) | Stock-based compensation included in the statements of operations data above was as follows: |
Year Ended December 31, | |||||||||||||||||||
2017 | 2016 | 2015 | 2014 | 2013 | |||||||||||||||
(in thousands) | |||||||||||||||||||
Cost of revenues: | |||||||||||||||||||
Subscription | $ | 35,334 | $ | 28,420 | $ | 23,416 | $ | 14,988 | $ | 8,434 | |||||||||
Professional services and other | 27,475 | 26,442 | 23,265 | 13,116 | 4,749 | ||||||||||||||
Sales and marketing | 170,527 | 131,571 | 102,349 | 54,006 | 21,609 | ||||||||||||||
Research and development | 92,025 | 81,731 | 70,326 | 42,535 | 16,223 | ||||||||||||||
General and administrative | 68,717 | 49,416 | 38,357 | 29,674 | 14,566 | ||||||||||||||
Total stock-based compensation | $ | 394,078 | $ | 317,580 | $ | 257,713 | $ | 154,319 | $ | 65,581 | |||||||||
(2) | For details regarding the legal settlements expenses of $270.0 million included in the year ended December 31, 2016, refer to Note 16 in the notes to our consolidated financial statements included elsewhere in this Annual Report on Form 10-K. |
As of December 31, | |||||||||||||||||||
2017 | 2016 | 2015 | 2014 | 2013 | |||||||||||||||
(in thousands) | |||||||||||||||||||
Consolidated Balance Sheet Data: | |||||||||||||||||||
Cash and cash equivalents and investments | $ | 2,170,740 | $ | 1,162,020 | $ | 1,223,917 | $ | 935,563 | $ | 889,910 | |||||||||
Working capital, excluding current portion of deferred revenue and convertible senior notes, net | 2,133,850 | 1,132,819 | 947,002 | 809,660 | 722,214 | ||||||||||||||
Total assets | 3,397,904 | 2,033,767 | 1,807,052 | 1,424,752 | 1,168,077 | ||||||||||||||
Deferred revenue, current and non-current portion | 1,320,383 | 895,101 | 603,754 | 422,238 | 266,722 | ||||||||||||||
Convertible senior notes, net, current and non-current portion | 1,173,436 | 507,812 | 474,534 | 443,437 | 414,378 | ||||||||||||||
Total stockholders’ equity | 584,132 | 386,961 | 566,814 | 428,675 | 394,259 | ||||||||||||||
24
ITEM 7. | MANAGEMENT’S DISCUSSION AND ANALYSIS OF FINANCIAL CONDITION AND RESULTS OF OPERATIONS |
You should read the following discussion and analysis of our financial condition and results of operations together with our consolidated financial statements and the related notes appearing under “Consolidated Financial Statements and Supplementary Data” in Item 8 of this filing. Some of the information contained in this discussion and analysis or set forth elsewhere in this filing, including information with respect to our plans and strategy for our business, includes forward-looking statements that involve risks and uncertainties. You should carefully read the “Risk Factors” section of this filing for a discussion of important factors that could cause actual results and the timing of certain events to differ materially from future results expressed or implied by the forward-looking statements contained in the following discussion and analysis.
Our billings and free cash flow measures included in the sections entitled “—Key Business Metrics—Billings,” and “—Key Business Metrics—Free Cash Flow” are not in accordance with U.S. Generally Accepted Accounting Principles (GAAP). These non-GAAP financial measures are not intended to be considered in isolation or as a substitute for, or superior to, financial information prepared and presented in accordance with GAAP. These measures may be different from non-GAAP financial measures used by other companies, limiting their usefulness for comparison purposes. We encourage investors to carefully consider our results under GAAP, as well as our supplemental non-GAAP results, to more fully understand our business.
25
Overview
ServiceNow is a leading provider of enterprise cloud computing solutions that define, structure, manage and automate services for global enterprises. We help our customers improve service quality and reduce costs while scaling and automating their businesses.
We generally offer our services on an annual subscription fee basis, which includes access to the ordered subscription service and related support, including updates to the subscription service during the subscription term. We provide a scaled pricing model based on the duration of the subscription term, and we frequently extend discounts to our customers based on the number of users. We generate sales through our direct sales team and, to a lesser extent, indirectly through resale partners and third-party referrals. We also generate revenues from professional services and for training of customer and partner personnel. We generally bill our customers annually in advance for subscription services and monthly in arrears for our professional services as the work is performed.
A majority of our revenues come from large global enterprise customers. We continue to invest in the development of our services, infrastructure and sales and marketing to drive long-term growth. We increased our overall employee headcount to 6,222 as of December 31, 2017 from 4,801 as of December 31, 2016.
New Revenue Recognition Standard under Topic 606
In May 2014, the Financial Accounting Standards Board issued a new standard related to revenue recognition from contracts with customers (Topic 606), which is effective beginning January 1, 2018. Topic 606 supersedes the prior revenue recognition standard (Topic 605) for periods beginning January 1, 2018. The most significant impacts of the standard relate to the timing of revenue recognition related to our on-premises offerings, in which we grant customers the right to deploy our software on the customer’s own servers without significant penalty, the accounting for incremental costs to obtain a contract and the classification of proceeds from Knowledge and other user forums as a reduction in sales and marketing expenses instead of professional services and other revenues.
Our results of operations below are presented under Topic 605. Our expectations for 2018 revenues, cost of revenues and operating expenses, including the comparison period amounts used to derive the expected trends, are based on Topic 606. In addition, our expectations for 2018 revenues, cost of revenues and operating expenses are based on foreign exchange rates as of December 31, 2017. Refer to Note 2 in the notes to our consolidated financial statements included elsewhere in this Annual Report on Form 10-K for details regarding Topic 606, including adjusted amounts for historical periods.
Key Business Metrics
Number of customers with ACV greater than $1 million. We count the total number of customers with annualized contract value (ACV) greater than $1 million as of the end of the period. We had 500, 350 and 231 customers with ACV greater than $1 million as of December 31, 2017, 2016 and 2015, respectively. For purposes of customer count, a customer is defined as an entity with a unique Dunn & Bradstreet Global Ultimate (GULT), Data Universal Numbering System (DUNS) number and an active subscription contract as of the measurement date. The DUNS number is a global standard for business identification and tracking. We make exceptions for holding companies, government entities and other organizations for which the GULT, in our judgment, does not accurately represent the ServiceNow customer. For example, while all U.S. government agencies roll up to “Government of the United States” under the GULT, we count each government agency that we contract with as a separate customer. Our customer count is subject to adjustments for acquisitions, spin-offs and other market activity. Previously disclosed number of customers with ACV greater than $1 million as well as our average contract term calculations are restated to allow for comparability. ACV is calculated based on the foreign exchange rate in effect at the time the contract was signed. Foreign exchange rate fluctuations could cause some variability in the number of customers with ACV greater than $1 million.
26
G2K customer count. The Global 2000 (G2K) customer count is defined as the total number of G2K companies in our customer base as of the end of the period. The Forbes Global 2000 is an annual ranking of the top 2,000 public companies in the world by Forbes magazine. The ranking is based on a mix of four metrics: sales, profit, assets, and market value. The Forbes Global 2000 is updated annually in the second quarter of the calendar year. Current and prior period G2K customer counts are based on the most recent list for comparability purposes. We adjust the G2K count for acquisitions, spin-offs and other market activity. For example, we add a G2K customer when a G2K company that is not our customer acquires a company in our existing customer base that is not a G2K company. When we enter into a contract with a G2K parent company, or any of its related subsidiaries, or any combination of entities within a G2K company, we count only one G2K customer. We do not count further penetration into entities within a given G2K as a new customer in the G2K customer count. Our G2K customer count also excludes customers that have only purchased our Express product offering, which is our entry-level IT service management solution. Our G2K customer count was 840, 737 and 637 as of December 31, 2017, 2016 and 2015, respectively.
Average ACV per G2K customer. We calculate average ACV for our G2K customers by taking aggregate ACV from G2K customers as of the end of the period divided by the total number of G2K customers as of the end of the period. ACV is calculated based on the foreign exchange rate in effect at the time the contract was entered into, and as a result, foreign currency rate fluctuations could cause variability in the average ACV per G2K customer. Prior G2K customer counts used in calculating ACV per G2K are adjusted for the most recent Forbes Global 2000 list for comparability purposes. Our average ACV per G2K customer was approximately $1.3 million, $1.1 million and $0.9 million as of December 31, 2017, 2016 and 2015, respectively.
Renewal rate. We calculate our renewal rate by subtracting our attrition rate from 100%. Our attrition rate for a period is equal to the ACV from customers lost during the period, divided by the total ACV from all customers that renewed during the period, excluding changes in price or users, and total ACV from all customers lost during the period. Accordingly, our renewal rate is calculated based on ACV and is not based on the number of customers that have renewed. A lost customer is a customer that did not renew an expiring contract and that, in our judgment, will not be renewed. Typically, a customer that reduces its subscription upon renewal is not considered a lost customer. However, in instances where the subscription decrease represents the majority of the customer's ACV, we may deem the renewal as a lost customer. For our renewal rate calculation, we define a customer as an entity with a separate production instance of our service and an active subscription contract as of the measurement date, instead of an entity with a unique GULT or DUNS number. Our renewal rate was 97% for the year ended December 31, 2017 and 98% for the years ended December 31, 2016 and 2015. As our renewal rate is impacted by the timing of renewals, which could occur in advance of, or subsequent to the original contract end date, period-to-period comparison of renewal rates may not be meaningful.
Billings. We define billings, a non-GAAP financial measure, as revenues recognized plus the change in total deferred revenue as presented on the consolidated statements of cash flows. The change in total deferred revenue as presented on the consolidated statements of cash flows represents the change in deferred revenues in local currencies translated into U.S. dollars using an average foreign currency exchange rate, and aligns actual billings with the exchange rates in effect at the time of the billings. We believe billings is a useful leading indicator regarding the performance of our business.
A calculation of billings is provided below:
Year Ended December 31, | |||||||||||
2017 | 2016 | 2015 | |||||||||
(dollars in thousands) | |||||||||||
Billings: | |||||||||||
Total revenues | $ | 1,933,026 | $ | 1,390,513 | $ | 1,005,480 | |||||
Change in deferred revenue from the consolidated statements of cash flows | 381,562 | 300,167 | 195,900 | ||||||||
Total billings | $ | 2,314,588 | $ | 1,690,680 | $ | 1,201,380 | |||||
Year-over-year percentage change in total billings | 37 | % | 41 | % | 41 | % | |||||
Billings consists of amounts invoiced for subscription contracts with existing customers, renewals, upsells and new customers, and contracts for professional services, training, and our Knowledge and other user forum events. Factors that may cause our billings results to vary from period to period include the following:
• | Billings duration. While we typically bill customers annually for our subscription services, customers sometimes request, and we accommodate, billings with durations less than or greater than the typical 12-month term. |
27
• | Contract start date. From time to time, we enter into contracts with a contract start date in the future, and we exclude these amounts from billings as these amounts are not included in our consolidated balance sheets, unless such amounts have been paid as of the balance sheet date. |
• | Foreign currency exchange rates. While a majority of our billings have historically been in U.S. Dollars, an increasing percentage of our billings in recent periods has been in foreign currencies, particularly the Euro and British Pound Sterling. |
• | Timing of contract renewals. While customers typically renew their contracts at the end of the contract term, from time to time customers may do so either before or after the scheduled expiration date. For example, in cases where we are successful in upselling additional products or services, a customer may decide to renew its existing contract early to ensure that all its contracts expire on the same date. In other cases, prolonged negotiations or other factors may result in a contract not being renewed until after it has expired. |
Accordingly, while we believe billings is a useful leading indicator regarding the performance of our business, an increase or decrease in new or renewed subscriptions in a reporting period may not have an immediate impact on billings for that reporting period.
To facilitate greater year-over-year comparability in our billings results, we disclose the impact that foreign currency rate fluctuations and fluctuations in billings duration had on our billings. The impact of foreign currency rate fluctuations is calculated by translating the current period results for entities reporting in currencies other than U.S. Dollars into U.S. Dollars at the average exchange rates in effect during the prior period presented, rather than the actual exchange rates in effect during the current period. The impact of fluctuations in billings duration is calculated by replacing the portion of multi-year billings in excess of 12 months during the current period with the portion of multi-year billings in excess of 12 months during the prior period presented. Notwithstanding the adjustments described above, the comparability of billings results from period to period remains subject to the impact of variations in the dollar value of contracts with future start dates and the timing of contract renewals, for which no adjustments have been presented.
Foreign currency rate fluctuations had a favorable impact of $8.3 million and an unfavorable impact of $8.4 million on billings for the years ended December 31, 2017 and 2016, respectively. Changes in billings duration had a favorable impact of $1.6 million and $16.3 million for the years ended December 31, 2017 and 2016, respectively.
In May 2014, the Financial Accounting Standards Board issued a new standard related to revenue recognition from contracts with customers (Topic 606), which is effective beginning on January 1, 2018. Under Topic 606, due to the change in timing of revenue recognition under certain of our contracts, our definition of billings will be revenues recognized plus the change in total deferred revenue, unbilled receivables, and customer deposits as presented on or derived from our consolidated statements of cash flows. Refer to Note 2 in the notes to our consolidated financial statements included elsewhere in this Annual Report on Form 10-K for details regarding Topic 606.
Free cash flow. We define free cash flow, a non-GAAP financial measure, as GAAP net cash provided by operating activities reduced by purchases of property and equipment. Purchases of property and equipment are otherwise included in cash used in investing activities under GAAP. We believe information regarding free cash flow provides useful information to investors because it is an indicator of the strength and performance of our business operations. However, our calculation of free cash flow may not be comparable to similar measures used by other companies. A calculation of free cash flow is provided below:
Year Ended December 31, | |||||||||||
2017 | 2016 | 2015 | |||||||||
(dollars in thousands) | |||||||||||
Free cash flow: | |||||||||||
Net cash provided by operating activities | $ | 642,825 | $ | 159,921 | $ | 317,754 | |||||
Purchases of property and equipment | (150,510 | ) | (105,562 | ) | (87,481 | ) | |||||
Free cash flow (1) | $ | 492,315 | $ | 54,359 | $ | 230,273 | |||||
(1) Free cash flow includes the effect of a $267.5 million payment for aggregate legal settlements for the year ended December 31, 2016. Refer to Note 16 in the notes to our consolidated financial statements included elsewhere in this Annual Report on Form 10-K for further details.
28
Average contract term. We calculate the average contract term for new customers, upsells and renewals based on the term of those contracts entered into during the period weighted by their ACV. The average new customer contract term was 32 months for the years ended December 31, 2017, 2016 and 2015. The average upsell contract term was 26 months for the years ended December 31, 2017, 2016 and 2015. The average renewal contract term was 27 months, 28 months, and 25 months for the years ended December 31, 2017, 2016 and 2015, respectively.
Components of Results of Operations
Revenues
Subscription revenues. Subscription revenues are primarily comprised of fees that give customers access to the ordered subscription service, and related support and updates, if any, to the subscription service during the subscription term. Pricing includes multiple instances, hosting and support services, data backup and disaster recovery services, as well as future updates, when and if available, offered during the subscription term. We typically invoice our customers for subscription fees in annual increments upon execution of the initial contract or subsequent renewal. Our contracts are generally non-cancelable during the subscription term, though a customer can terminate for breach if we materially fail to perform.
Professional services and other revenues. Professional services revenues consist of fees associated with professional services. Our arrangements for professional services are primarily on a time-and-materials basis. We generally invoice our professional services monthly in arrears based on actual hours and expenses incurred. Other revenues primarily consist of fees from customer training delivered on-site or through publicly available classes and registration and sponsorship fees for our annual Knowledge user conference and other user forums. Typical payment terms require our customers to pay us within 30 days of invoice.
We generate sales directly through our sales team and, to a lesser extent, through our resale partners. Revenues from our direct sales organization represented 88% of our total revenues for the years ended December 31, 2017 and 2016 and 89% of our total revenues for the year ended December 31, 2015. We make sales to our resale partners at a discount and record those revenues at the discounted price when all revenue recognition criteria have been met. From time to time, other third parties provide us referrals for which we pay a referral fee. We include revenues associated with these referrals as part of revenues from our direct sales organization. Referral fees paid to these third parties are between 5% and 15% of the customer's ACV, depending on the level of activity these third parties perform in the sales process. We include these fees in sales and marketing expense.
Allocation of Overhead Costs
Overhead costs associated with office facilities, IT and certain depreciation related to infrastructure that is not dedicated for customer use or research and development use are allocated to cost of revenues and operating expenses based on headcount.
Cost of Revenues
Cost of subscription revenues. Cost of subscription revenues consists primarily of expenses related to hosting our services and providing support to our customers. These expenses are comprised of data center capacity costs, which include facility costs associated with our data centers as well as interconnectivity between data centers, depreciation related to our infrastructure hardware equipment dedicated for customer use, amortization of intangible assets and personnel-related costs directly associated with data center operations and customer support, including salaries, benefits, bonuses and stock-based compensation and allocated overhead.
Cost of professional services and other revenues. Cost of professional services and other revenues consists primarily of personnel-related costs directly associated with our professional services and training departments, including salaries, benefits, bonuses and stock-based compensation, the costs of contracted third-party partners, travel expenses and allocated overhead.
Professional services are performed directly by our services team, as well as by contracted third-party partners. Fees paid to third-party partners are primarily recognized as cost of revenues as the professional services are delivered. Cost of revenues associated with our professional services engagements contracted with third-party partners as a percentage of professional services and other revenues was 19% for the years ended December 31, 2017 and 2016 and 21% for the year ended December 31, 2015.
Sales and Marketing
Sales and marketing expenses consist primarily of personnel-related expenses directly associated with our sales and marketing staff, including salaries, benefits, bonuses, commissions and stock-based compensation. Sales and marketing expenses also include third-party referral fees, expenses related to our annual Knowledge user conference, other marketing program expenses, which include events other than Knowledge, and costs associated with purchasing advertising and marketing data, and allocated overhead.
29
Research and Development
Research and development expenses consist primarily of personnel-related expenses directly associated with our research and development staff, including salaries, benefits, bonuses and stock-based compensation and allocated overhead. Research and development expenses also include data center capacity costs, costs associated with outside services contracted for research and development purposes, amortization of intangible assets and depreciation of infrastructure hardware equipment that is used solely for research and development purposes.
General and Administrative
General and administrative expenses consist primarily of personnel-related expenses for our executive, finance, legal, human resources, facilities and administrative personnel, including salaries, benefits, bonuses and stock-based compensation, external legal, accounting and other professional services fees, other corporate expenses, amortization of intangible assets and allocated overhead.
Legal Settlements
Legal settlements consist of one-time aggregate charges related to the settlement agreements with Hewlett Packard Enterprise Company (HPE) and BMC Software, Inc. (BMC). Refer to Note 16 in the notes to our consolidated financial statements included elsewhere in this Annual Report on Form 10-K for further details regarding these matters.
Provision for Income Taxes
Provision for income taxes consists of federal, state and foreign income taxes. Due to cumulative losses, we maintain a valuation allowance against our U.S. deferred tax assets as of December 31, 2017 and 2016. We consider all available evidence, both positive and negative, including but not limited to earnings history, projected future outcomes, industry and market trends and the nature of each of the deferred tax assets in assessing the extent to which a valuation allowance should be applied against our U.S. deferred tax assets.
30
Results of Operations
To enhance comparability, the following table sets forth our results of operations for the periods presented. The period-to-period comparison of financial results is not necessarily indicative of future results.
Year Ended December 31, | |||||||||||
2017 | 2016 | 2015 | |||||||||
(in thousands) | |||||||||||
Revenues: | |||||||||||
Subscription | $ | 1,739,795 | $ | 1,221,639 | $ | 848,278 | |||||
Professional services and other | 193,231 | 168,874 | 157,202 | ||||||||
Total revenues | 1,933,026 | 1,390,513 | 1,005,480 | ||||||||
Cost of revenues (1): | |||||||||||
Subscription | 315,570 | 235,414 | 183,400 | ||||||||
Professional services and other | 184,202 | 163,268 | 146,013 | ||||||||
Total cost of revenues | 499,772 | 398,682 | 329,413 | ||||||||
Gross profit | 1,433,254 | 991,831 | 676,067 | ||||||||
Operating expenses (1): | |||||||||||
Sales and marketing | 946,617 | 700,464 | 498,439 | ||||||||
Research and development | 377,518 | 285,239 | 217,389 | ||||||||
General and administrative | 210,533 | 158,936 | 126,604 | ||||||||
Legal settlements (2) | — | 270,000 | — | ||||||||
Total operating expenses | 1,534,668 | 1,414,639 | 842,432 | ||||||||
Loss from operations | (101,414 | ) | (422,808 | ) | (166,365 | ) | |||||
Interest expense | (53,394 | ) | (33,278 | ) | (31,097 | ) | |||||
Interest income and other income (expense), net | 5,804 | 6,035 | 4,450 | ||||||||
Loss before income taxes | (149,004 | ) | (450,051 | ) | (193,012 | ) | |||||
Provision for income taxes | 126 | 1,753 | 5,414 | ||||||||
Net loss | $ | (149,130 | ) | $ | (451,804 | ) | $ | (198,426 | ) | ||
(1) | Stock-based compensation included in the statements of operations data above was as follows: |
Year Ended December 31, | |||||||||||
2017 | 2016 | 2015 | |||||||||
(in thousands) | |||||||||||
Cost of revenues: | |||||||||||
Subscription | $ | 35,334 | $ | 28,420 | $ | 23,416 | |||||
Professional services and other | 27,475 | 26,442 | 23,265 | ||||||||
Sales and marketing | 170,527 | 131,571 | 102,349 | ||||||||
Research and development | 92,025 | 81,731 | 70,326 | ||||||||
General and administrative | 68,717 | 49,416 | 38,357 | ||||||||
Total stock-based compensation | $ | 394,078 | $ | 317,580 | $ | 257,713 | |||||
(2) | For details regarding the legal settlements expenses of $270.0 million included in the year ended December 31, 2016, refer to Note 16 in the notes to our consolidated financial statements included elsewhere in this Annual Report on Form 10-K. |
31
Year Ended December 31, | ||||||||
2017 | 2016 | 2015 | ||||||
Revenues: | ||||||||
Subscription | 90 | % | 88 | % | 84 | % | ||
Professional services and other | 10 | 12 | 16 | |||||
Total revenues | 100 | 100 | 100 | |||||
Cost of revenues (1): | ||||||||
Subscription | 16 | 17 | 18 | |||||
Professional services and other | 10 | 12 | 15 | |||||
Total cost of revenues | 26 | 29 | 33 | |||||
Gross profit | 74 | 71 | 67 | |||||
Operating expenses (1): | ||||||||
Sales and marketing | 49 | 50 | 50 | |||||
Research and development | 19 | 21 | 22 | |||||
General and administrative | 11 | 11 | 12 | |||||
Legal settlements (2) | — | 19 | — | |||||
Total operating expenses | 79 | 101 | 84 | |||||
Loss from operations | (5 | ) | (30 | ) | (17 | ) | ||
Interest expense | (3 | ) | (2 | ) | (3 | ) | ||
Interest income and other income (expense), net | — | — | 1 | |||||
Loss before income taxes | (8 | ) | (32 | ) | (19 | ) | ||
Provision for income taxes | — | — | 1 | |||||
Net loss | (8 | )% | (32 | )% | (20 | )% | ||
(1) | Stock-based compensation included in the statements of operations above as a percentage of revenues was as follows: |
Year Ended December 31, | ||||||||
2017 | 2016 | 2015 | ||||||
(in thousands) | ||||||||
Cost of revenues: | ||||||||
Subscription | 2 | % | 2 | % | 2 | % | ||
Professional services and other | 1 | 2 | 2 | |||||
Sales and marketing | 9 | 9 | 10 | |||||
Research and development | 5 | 6 | 8 | |||||
General and administrative | 3 | 4 | 4 | |||||
Total stock-based compensation | 20 | % | 23 | % | 26 | % | ||
(2) | For details regarding the legal settlements expenses of $270.0 million included in the year ended December 31, 2016, refer to Note 16 in the notes to our consolidated financial statements included elsewhere in this Annual Report on Form 10-K. |
32
Comparison of the years ended December 31, 2017 and 2016
As described above under the section entitled “New Revenue Recognition Standard under Topic 606,” the results of operations below are presented under Topic 605. Our expectations for 2018 revenues, cost of revenues and operating expenses, including the comparison period amounts used to derive the expected trends are based on the new Topic 606 revenue recognition standard. In addition, our expectations for 2018 revenues, cost of revenues and operating expenses are based on foreign exchange rates as of December 31, 2017. Refer to Note 2 in the notes to our consolidated financial statements included elsewhere in this Annual Report on Form 10-K for details regarding Topic 606, including adjusted amounts for historical periods.
Revenues
Year Ended December 31, | % Change | |||||||||
2017 | 2016 | |||||||||
(dollars in thousands) | ||||||||||
Revenues: | ||||||||||
Subscription | $ | 1,739,795 | $ | 1,221,639 | 42 | % | ||||
Professional services and other | 193,231 | 168,874 | 14 | % | ||||||
Total revenues | $ | 1,933,026 | $ | 1,390,513 | 39 | % | ||||
Percentage of revenues: | ||||||||||
Subscription | 90 | % | 88 | % | ||||||
Professional services and other | 10 | 12 | ||||||||
Total | 100 | % | 100 | % | ||||||
Subscription revenues increased $518.2 million during the year ended December 31, 2017, compared to the prior year, driven by our upsells and an increase in customer count. We expect subscription revenues to grow in absolute dollars and as a percentage of total revenues in the year ended December 31, 2018 as we continue to add new customers and upsell to existing customers.
Subscription revenues consist of the following:
Year Ended December 31, | % Change | |||||||||
2017 | 2016 | |||||||||
(dollars in thousands) | ||||||||||
Service management products | $ | 1,526,382 | $ | 1,108,846 | 38 | % | ||||
ITOM products | 213,413 | 112,793 | 89 | % | ||||||
Total subscription revenues | $ | 1,739,795 | $ | 1,221,639 | 42 | % | ||||
Our service management products include our platform, ITSM, ITBM, customer service management, HR service delivery and security operations, which have similar features and functions and are generally priced on a per user basis. Our ITOM products, which improve visibility, availability and agility of enterprise services, are generally priced on a per node basis.
Professional services and other revenues increased $24.4 million during the year ended December 31, 2017, compared to the prior year, due to an increase in the services provided to our growing customer base. Included within our total professional services and other revenues are the revenues from our annual Knowledge user conference, which increased to $17.1 million during the year ended December 31, 2017, compared to $12.8 million in the prior year, due to an increase in registration and sponsorship fees in the current year.
We expect professional services and other revenues under Topic 606 for the year ending December 31, 2018 to remain flat in absolute dollar terms when compared to professional services and other revenues for the year ended December 31, 2017, as adjusted for Topic 606. This reflects our plan to focus on deploying our internal professional services organization as a strategic resource while relying on our partner ecosystem to contract directly with customers for service delivery. As described above under the section entitled “New Revenue Recognition Standard under Topic 606,” with the adoption of Topic 606, proceeds from Knowledge and other user forums will be classified as a reduction in sales and marketing expense instead of as professional services and other revenues.
33
Our international operations have provided and will continue to provide a significant portion of our total revenues. Revenues outside North America represented 33% and 32% of total revenues for the years ended December 31, 2017 and 2016, respectively. Because we primarily transact in foreign currencies for sales outside of the United States, the general weakening of the U.S. Dollar relative to other major foreign currencies (primarily the Euro and British Pound Sterling) from the year ended December 31, 2016 to the year ended December 31, 2017 had a favorable impact on our revenues. For entities reporting in currencies other than the U.S. Dollar, if we had translated our results for the year ended December 31, 2017 at the average exchange rates in effect for the year ended December 31, 2016 rather than the actual exchange rates in effect during the period, our reported subscription revenues would have been $6.3 million lower. The impact from the foreign currency movements from the year ended December 31, 2016 to the year ended December 31, 2017 is not material to professional services and other revenues.
Cost of Revenues and Gross Profit Percentage
Year Ended December 31, | % Change | |||||||||
2017 | 2016 | |||||||||
(dollars in thousands) | ||||||||||
Cost of revenues: | ||||||||||
Subscription | $ | 315,570 | $ | 235,414 | 34 | % | ||||
Professional services and other | 184,202 | 163,268 | 13 | % | ||||||
Total cost of revenues | $ | 499,772 | $ | 398,682 | 25 | % | ||||
Gross profit percentage: | ||||||||||
Subscription | 82 | % | 81 | % | ||||||
Professional services and other | 5 | % | 3 | % | ||||||
Total gross profit percentage | 74 | % | 71 | % | ||||||
Gross profit: | $ | 1,433,254 | $ | 991,831 | 45 | % | ||||
Headcount (at period end) | ||||||||||
Subscription | 936 | 729 | 28 | % | ||||||
Professional services and other | 562 | 496 | 13 | % | ||||||
Total headcount | 1,498 | 1,225 | 22 | % | ||||||
Cost of subscription revenues increased $80.2 million during the year ended December 31, 2017, compared to the prior year, primarily due to increased headcount resulting in an increase of $30.8 million in personnel-related costs excluding stock-based compensation, an increase of $8.0 million in other overhead expenses and an increase of $6.9 million in stock-based compensation. In addition, there was an increase of $17.8 million in depreciation expense primarily due to purchases of infrastructure hardware equipment for our data centers, an increase of $7.2 million in data center capacity costs primarily due to the addition of new data centers and the expansion of existing data centers, and an increase of $2.3 million in amortization of intangibles as a result of acquisitions. Service and technical support agreement and software subscription costs increased $5.0 million, and outside service costs increased $1.2 million during year ended December 31, 2017 compared to the prior year.
Our subscription gross profit percentage increased to 82% for the year ended December 31, 2017, from 81% for the year ended December 31, 2016, due to improved data center utilization and economies of scale. We expect our cost of subscription revenues to increase in absolute dollar terms as we provide subscription services to more customers and increase the number of users within our customer instances, but we expect such increase to be at a slower rate than the increase in our subscription revenues, leading to a slight increase in our subscription gross profit percentage for the year ended December 31, 2018 as we continue to leverage the investments we have made in our existing data center infrastructure. To the extent future acquisitions are consummated, our cost of subscription revenues may increase due to additional non-cash charges associated with the amortization of intangible assets acquired.
Cost of professional services and other revenues increased $20.9 million during the year ended December 31, 2017 compared to the prior year, primarily due to increased headcount resulting in an increase of $11.7 million in personnel-related costs excluding stock-based compensation, an increase of $2.1 million in overhead expenses, and an increase of $1.0 million in stock-based compensation. Outside service costs increased $4.6 million during year ended December 31, 2017 compared to the prior year, primarily due to increased utilization of contracted third-party partners for the implementation and configuration of our subscription services.
34
Our professional services and other gross profit percentage increased to 5% during the year ended December 31, 2017, compared to 3% in the prior year, primarily due to the increase in revenues from our annual Knowledge user conference. Costs associated with Knowledge are included in sales and marketing expense. Knowledge contributed $17.1 million, or 10 percentage points, to the professional services and other gross profit percentage for the year ended December 31, 2017. Knowledge contributed $12.8 million, or 8 percentage points, to the professional services and other gross profit percentage for the year ended December 31, 2016.
The impact from the foreign currency movements from the year ended December 31, 2016 to the year ended December 31, 2017 is not material to cost of revenues.
Sales and Marketing
Year Ended December 31 | % Change | |||||||||
2017 | 2016 | |||||||||
(dollars in thousands) | ||||||||||
Sales and marketing | $ | 946,617 | $ | 700,464 | 35 | % | ||||
Percentage of revenues | 49 | % | 50 | % | ||||||
Headcount (at period end) | 2,413 | 1,875 | 29 | % | ||||||
Sales and marketing expenses increased $246.2 million during the year ended December 31, 2017, compared to the prior year, primarily due to increased headcount resulting in an increase of $120.7 million in personnel-related costs excluding stock-based compensation, an increase of $39.0 million in stock-based compensation, an increase of $22.0 million in overhead expenses, and an increase of $30.2 million in commission expense. Commissions and referral fee expenses amounted to 7% of subscription revenues for each of the years ended December 31, 2017 and 2016. Expenses related to our annual Knowledge user conference increased $8.2 million, from $24.0 million for the year ended December 31, 2016 to $32.2 million for the year ended December 31, 2017, due to a 29% increase in registrations year-over-year. Other marketing program expenses, which include expenses related to events other than Knowledge and costs associated with purchasing advertising and marketing data, increased $17.4 million for the year ended December 31, 2017 compared to the prior year. Outside services increased $7.0 million primarily due to an increase in contractors and professional fees to support our sales and marketing functions.
Because we primarily transact in foreign currencies for sales and marketing expenses outside of the United States, the general weakening of the U.S. Dollar relative to other major foreign currencies from the year ended December 31, 2016 to the year ended December 31, 2017 had an unfavorable impact on our sales and marketing expenses. For entities reporting in currencies other than the U.S. Dollar, if we had translated our results for the year ended December 31, 2017 at the average exchange rates in effect for the year ended December 31, 2016 rather than the actual exchange rates in effect during the period, our sales and marketing expenses would have been $2.5 million lower.
We expect sales and marketing expenses to increase for the year ended December 31, 2018 in absolute dollar terms when compared to sales and marketing expenses for the year ended December 31, 2017, as adjusted for Topic 606, but decrease slightly as a percentage of total revenues as we continue to expand our direct sales force, increase our marketing activities, grow our international operations, build brand awareness and sponsor additional marketing events. As described above under the section entitled “New Revenue Recognition Standard under Topic 606,” with the adoption of Topic 606, proceeds from Knowledge and other user forums will be classified as a reduction in sales and marketing expense instead of professional services and other revenues.
35
Research and Development
Year Ended December 31 | % Change | |||||||||
2017 | 2016 | |||||||||
(dollars in thousands) | ||||||||||
Research and development | $ | 377,518 | $ | 285,239 | 32 | % | ||||
Percentage of revenues | 19 | % | 21 | % | ||||||
Headcount (at period end) | 1,419 | 1,054 | 35 | % | ||||||
Research and development expenses increased $92.3 million during the year ended December 31, 2017, compared to the prior year, primarily due to increased headcount resulting in an increase of $60.2 million in personnel-related costs excluding stock-based compensation, an increase of $14.4 million in overhead expenses, and an increase of $10.3 million in stock-based compensation. Outside services increased $3.6 million primarily due to an increase in contractors and consultants that support our research and development functions. Research and development expenses also increased $1.8 million due to depreciation of infrastructure hardware equipment that are used solely for research and development purposes.
Because we primarily transact in foreign currencies for research and development expenses outside of the United States, the general weakening of the U.S. Dollar relative to other major foreign currencies from the year ended December 31, 2016 to the year ended December 31, 2017 had an unfavorable impact on our research and development expenses. For entities reporting in currencies other than the U.S. Dollar, if we had translated our results for the year ended December 31, 2017 at the average exchange rates in effect for the year ended December 31, 2016 rather than the actual exchange rates in effect during the period, our research and development expenses would have been $1.3 million lower.
We expect research and development expenses to increase for the year ended December 31, 2018 in absolute dollar terms, but decrease slightly as a percentage of total revenues as we continue to improve the existing functionality of our services, develop new applications to fill market needs and enhance our core platform.
36
General and Administrative
Year Ended December 31 | % Change | |||||||||
2017 | 2016 | |||||||||
(dollars in thousands) | ||||||||||
General and administrative | $ | 210,533 | $ | 158,936 | 32 | % | ||||
Percentage of revenues | 11 | % | 11 | % | ||||||
Headcount (at period end) | 892 | 647 | 38 | % | ||||||
General and administrative expenses increased $51.6 million during the year ended December 31, 2017, compared to the prior year, primarily due to increased headcount resulting in an increase of $22.4 million in personnel-related costs excluding stock-based compensation, an increase of $19.3 million in stock-based compensation, and an increase of $2.3 million in overhead expenses. Software subscription costs increased $4.6 million, and outside services costs, which include costs related to contractors and consultants, increased $2.3 million to support our administrative function. Amortization of intangibles increased $1.5 million, and acquisition-related costs increased $1.4 million from acquisitions in 2017.
The impact from the foreign currency movements from the year ended December 31, 2016 to the year ended December 31, 2017 is not material to general and administrative expenses.
We expect general and administrative expenses to increase for the year ended December 31, 2018 in absolute dollar terms as we continue to hire new employees, but remain relatively flat as a percentage of total revenues as we continue to grow.
Legal Settlements
Year Ended December 31 | % Change | ||||||||
2017 | 2016 | ||||||||
(dollars in thousands) | |||||||||
Legal settlements | $ | — | $ | 270,000 | NM | ||||
Percentage of revenues | — | % | 19 | % | |||||
NM - Not meaningful.
Legal settlements expense decreased $270.0 million during the year ended December 31, 2017 compared to the prior year, reflecting the legal settlement agreements with HPE and BMC in the prior year. Refer to Note 16 in the notes to our consolidated financial statements included elsewhere in this Annual Report on Form 10-K for further details.
37
Stock-based Compensation
Year Ended December 31 | % Change | |||||||||
2017 | 2016 | |||||||||
(dollars in thousands) | ||||||||||
Cost of revenues: | ||||||||||
Subscription | $ | 35,334 | $ | 28,420 | 24 | % | ||||
Professional services and other | 27,475 | 26,442 | 4 | % | ||||||
Sales and marketing | 170,527 | 131,571 | 30 | % | ||||||
Research and development | 92,025 | 81,731 | 13 | % | ||||||
General and administrative | 68,717 | 49,416 | 39 | % | ||||||
Total stock-based compensation | $ | 394,078 | $ | 317,580 | 24 | % | ||||
Percentage of revenues | 20 | % | 23 | % | ||||||
Stock-based compensation expense increased $76.5 million during the year ended December 31, 2017, compared to the prior year, primarily due to increased headcount and increased weighted-average grant date fair value of equity awards.
Stock-based compensation expense is inherently difficult to forecast due to fluctuations in our stock price. Based upon our stock price as of December 31, 2017, we expect stock-based compensation expense to continue to increase for the year ended December 31, 2018 in absolute dollar terms, but decrease as a percentage of total revenues as we continue to grow.
Interest Expense
Year Ended December 31 | % Change | |||||||||
2017 | 2016 | |||||||||
(dollars in thousands) | ||||||||||
Interest expense | $ | (53,394 | ) | $ | (33,278 | ) | 60 | % | ||
Percentage of revenues | (3 | )% | (2 | )% | ||||||
Interest expense increased $20.1 million during the year ended December 31, 2017, compared to the prior year, due to the increase in amortization expense of debt discount and issuance costs related to our convertible senior notes, including the 2022 Notes issued in the three months ended June 30, 2017. During the year ended December 31, 2018, we expect to incur approximately $63.3 million in amortization expense of debt discount and issuance costs related to the convertible notes.
Interest Income and Other Income (Expense), net
Year Ended December 31 | % Change | |||||||||
2017 | 2016 | |||||||||
(dollars in thousands) | ||||||||||
Interest income | $ | 16,677 | $ | 8,528 | 96 | % | ||||
Foreign currency exchange loss | (11,117 | ) | (2,248 | ) | NM | |||||
Other | 244 | (245 | ) | NM | ||||||
Interest income and other income (expense), net | $ | 5,804 | $ | 6,035 | (4 | )% | ||||
Percentage of revenues | — | % | — | % | ||||||
NM - Not meaningful.
Interest income and other income (expense), net decreased $0.2 million during the year ended December 31, 2017, compared to the prior year, primarily due to increased foreign exchange loss, partially offset by increased interest income. Foreign exchange losses increased $8.9 million for the year ended December 31, 2017 compared to the prior year as a result of fluctuations in foreign currency exchange rates. Interest income increased $8.1 million due to the higher cash balances and higher yields on our invested balances during the year ended December 31, 2017 compared to the prior year.
38
Our expanding international operations will continue to increase our exposure to currency risks, though we cannot presently predict the impact of this exposure on our consolidated financial statements. While we have not engaged in the hedging of our foreign currency transactions to date, we currently expect to initiate a hedging program to hedge selected significant transactions denominated in currencies other than the U.S. Dollar in 2018.
Provision for Income Taxes
Year Ended December 31 | % Change | |||||||||
2017 | 2016 | |||||||||
(dollars in thousands) | ||||||||||
Loss before income taxes | $ | (149,004 | ) | $ | (450,051 | ) | (67 | )% | ||
Provision for income taxes | 126 | 1,753 | (93 | )% | ||||||
Effective tax rate | — | % | — | % | ||||||
Our effective tax rate was 0% for the year ended December 31, 2017 and 2016. Our tax expense decreased $1.6 million during the year ended December 31, 2017, compared to the prior year, primarily due to the tax effects of unrealized gains in investment securities. See Note 15 in the notes to our consolidated financial statements included elsewhere in this Annual Report on Form 10-K for our reconciliation of income taxes at the statutory federal rate to the provision for income taxes.
On December 22, 2017, the 2017 Tax Cuts and Jobs Act (the Tax Act) was enacted into law, changing how the U.S. imposes income tax on multinational corporations. Significant changes include, but are not limited to, a reduction of the corporate income tax rate from 35% to 21%, a transition tax on accumulated foreign earnings, and a transition from a worldwide to a territorial tax system. We are required to recognize the effect of the Tax Act in the period of enactment, such as remeasuring our U.S. deferred tax assets and liabilities as well as reassessing the net realizability of our deferred tax assets and liabilities.
In December 2017, the SEC staff issued Staff Accounting Bulletin No. 118, Income Tax Accounting Implications of the Tax Cuts and Jobs Act (SAB 118), which allows us to record provisional amounts during a measurement period not to extend more than one year beyond the Tax Act enactment date. Since the Tax Act was passed late in the fourth quarter of 2017, and ongoing guidance and accounting interpretation are expected over the next 12 months, we consider the accounting for deferred tax remeasurements, the impact of the transition of U.S. international taxation from a worldwide tax system to a territorial system, and other provisions to be incomplete due to the forthcoming guidance and our ongoing analysis. We expect to complete our analysis within the measurement period in accordance with SAB 118.
We continue to maintain a full valuation allowance on our U.S. federal and state deferred tax assets, and the significant components of the tax expense recorded are current cash taxes payable in various jurisdictions. The cash tax expenses are impacted by each jurisdiction’s individual tax rates, laws on timing of recognition of income and deductions, and availability of net operating losses and tax credits. Given the full valuation allowance, sensitivity of current cash taxes to local rules and our foreign structuring, we expect that our effective tax rate could fluctuate significantly on a quarterly basis and could be adversely affected to the extent earnings are lower than anticipated in countries that have lower statutory rates and higher than anticipated in countries that have higher statutory rates. Prior to the enactment of the Tax Act, we considered earnings from foreign operations to be indefinitely reinvested outside of the United States. We are currently evaluating whether to change our indefinite reinvestment assertion in light of the Tax Act and consider that assessment to be incomplete as permitted under guidance issued by the SEC. We expect to reach a final determination within the measurement period described above.
39
Net Loss
Year Ended December 31 | % Change | |||||||||
2017 | 2016 | |||||||||
(dollars in thousands) | ||||||||||
Net loss | $ | (149,130 | ) | $ | (451,804 | ) | (67 | )% | ||
Percentage of revenues | (8 | )% | (32 | )% | ||||||
Net loss decreased $302.7 million during the year ended December 31, 2017, primarily reflecting the settlement agreements we entered into with HPE and BMC during the prior year. Refer to Note 16 in the notes to our consolidated financial statements included elsewhere in this Annual Report on Form 10-K for further details. We expect to continue to incur a GAAP loss for the year ended December 31, 2018, due to increased costs and expenses including non-cash charges associated with equity awards, amortization of purchased intangibles from acquisitions, and other expenses.
Comparison of the years ended December 31, 2016 and 2015
Revenues
Year Ended December 31, | % Change | |||||||||
2016 | 2015 | |||||||||
(dollars in thousands) | ||||||||||
Revenues: | ||||||||||
Subscription | $ | 1,221,639 | $ | 848,278 | 44 | % | ||||
Professional services and other | 168,874 | 157,202 | 7 | % | ||||||
Total revenues | $ | 1,390,513 | $ | 1,005,480 | 38 | % | ||||
Percentage of revenues: | ||||||||||
Subscription | 88 | % | 84 | % | ||||||
Professional services and other | 12 | 16 | ||||||||
Total | 100 | % | 100 | % | ||||||
Subscription revenues increased $373.4 million during the year ended December 31, 2016, compared to the prior year, driven by upsells and an increase in customer count.
Subscription revenues consist of the following:
Year Ended December 31, | % Change | |||||||||
2016 | 2015 | |||||||||
(dollars in thousands) | ||||||||||
Service management products | $ | 1,108,846 | $ | 783,603 | 42 | % | ||||
ITOM products | 112,793 | 64,675 | 74 | % | ||||||
Total subscription revenues | $ | 1,221,639 | $ | 848,278 | 44 | % | ||||
Our service management products include our platform, ITSM, ITBM, customer service management, HR service delivery and security operations, which have similar features and functions and are generally priced on a per user basis. Our ITOM products, which improve visibility, availability and agility of enterprise services, are generally priced on a per node basis.
Professional services and other revenues increased $11.7 million during the year ended December 31, 2016, compared to the prior year, due to an increase in the services provided to our growing customer base. In addition, revenues from our annual Knowledge user conference increased to $12.8 million during the year ended December 31, 2016, compared to $10.9 million in the prior year, due to increased sponsorship and paid registrations in the current year.
40
Our international operations have provided and will continue to provide a significant portion of our total revenues. Revenues outside North America represented 32% and 30% of total revenues for the year ended December 31, 2016 and 2015, respectively. Because we primarily transact in foreign currencies for sales outside of the United States, the general strengthening of the U.S. Dollar relative to other major foreign currencies (primarily Euro and the British Pound Sterling) from the year ended December 31, 2015 to the year ended December 31, 2016 had an unfavorable impact on our revenues. For entities reporting in currencies other than the U.S. Dollar, if we had translated our results for the year ended December 31, 2016 at the average exchange rates in effect for the year ended December 31, 2015 rather than the actual exchange rates in effect during the period, our subscription revenues would have increased by an additional $6.3 million. The impact from the foreign currency movements from the year ended December 31, 2015 to the year ended December 31, 2016 is not material to professional services and other revenues.
Cost of Revenues and Gross Profit Percentage
Year Ended December 31, | % Change | |||||||||
2016 | 2015 | |||||||||
(dollars in thousands) | ||||||||||
Cost of revenues: | ||||||||||
Subscription | $ | 235,414 | $ | 183,400 | 28 | % | ||||
Professional services and other | 163,268 | 146,013 | 12 | % | ||||||
Total cost of revenues | $ | 398,682 | $ | 329,413 | 21 | % | ||||
Gross profit percentage: | ||||||||||
Subscription | 81 | % | 78 | % | ||||||
Professional services and other | 3 | % | 7 | % | ||||||
Total gross profit percentage | 71 | % | 67 | % | ||||||
Gross profit: | $ | 991,831 | $ | 676,067 | 47 | % | ||||
Headcount (at period end) | ||||||||||
Subscription | 729 | 579 | 26 | % | ||||||
Professional services and other | 496 | 486 | 2 | % | ||||||
Total headcount | 1,225 | 1,065 | 15 | % | ||||||
Cost of subscription revenues increased $52.0 million during the year ended December 31, 2016, compared to the prior year, primarily due to increased headcount resulting in an increase of $17.3 million in personnel-related costs excluding stock-based compensation, an increase of $5.0 million in stock-based compensation, and an increase of $7.2 million in other overhead expenses. In addition, there was an increase of $10.3 million in depreciation expense primarily due to purchases of infrastructure hardware equipment for our data centers, an increase of $5.3 million in data center capacity costs primarily due to the expansion of our data centers, and an increase of $1.5 million in amortization of intangible assets as a result of acquisitions in 2016.
Our subscription gross profit percentage increased to 81% for the year ended December 31, 2016, from 78% for the year ended December 31, 2015, due to improved data center utilization and economies of scale.
Cost of professional services and other revenues increased $17.3 million during the year ended December 31, 2016, compared to the prior year, primarily due to increased headcount resulting in an increase of $8.0 million in personnel-related costs excluding stock-based compensation, an increase of $3.2 million in stock-based compensation, and an increase of $3.4 million in overhead expenses.
Our professional services and other gross profit percentage decreased to 3% during the year ended December 31, 2016, compared to 7% in the prior year, due to lower utilization rates as we invested in specialized resources to support our newer products and higher growth rate in our stock-based compensation of 14% compared to the growth rate in our professional services and other revenues of 7%, partially offset by the increase in revenues from our annual Knowledge user conference. Costs associated with Knowledge are included in sales and marketing expense. Knowledge contributed $12.8 million, or 8 percentage points, to the professional services and other gross profit percentage for the year ended December 31, 2016. Knowledge contributed $10.9 million, or 7 percentage points, to the professional services and other gross profit percentage for the year ended December 31, 2015.
41
Because we primarily transact in foreign currencies for cost of revenues outside of the United States, the general strengthening of the U.S. Dollar relative to other major foreign currencies from the year ended December 31, 2015 to the year ended December 31, 2016 had a favorable impact on our cost of revenues. For entities reporting in currencies other than the U.S. Dollar, if we had translated our results for the year ended December 31, 2016 at the average exchange rates in effect for the year ended December 31, 2015 rather than the actual exchange rates in effect during the year ended December 31, 2016, our cost of subscription revenues would have increased by an additional $3.3 million and our cost of professional services and other revenues would have increased by an additional $1.6 million.
Sales and Marketing
Year Ended December 31 | % Change | |||||||||
2016 | 2015 | |||||||||
(dollars in thousands) | ||||||||||
Sales and marketing | $ | 700,464 | $ | 498,439 | 41 | % | ||||
Percentage of revenues | 50 | % | 50 | % | ||||||
Headcount (at period end) | 1,875 | 1,416 | 32 | % | ||||||
Sales and marketing expenses increased $202.0 million during the year ended December 31, 2016, compared to the prior year, primarily due to increased headcount resulting in an increase of $106.4 million in personnel-related costs excluding stock-based compensation, an increase of $29.2 million in stock-based compensation, an increase of $23.2 million in overhead expenses, and an increase of $15.7 million in commission expense. Commissions and referral fee expenses amounted to 7% and 8% of subscription revenues for the years ended December 31, 2016 and 2015, respectively. Outside services expenses increased $3.7 million primarily due to an increase in contractors and professional fees to support our sales and marketing functions
In addition, expenses related to our annual Knowledge user conference increased $3.0 million, from $21.0 million for the year ended December 31, 2015 to $24.0 million for the year ended December 31, 2016, due to a 35% increase in registration year-over-year. All other marketing program expenses, which include expenses related to events other than Knowledge and costs associated with purchasing advertising and marketing data, increased $18.6 million for the year ended December 31, 2016 compared to the prior year.
Because we primarily transact in foreign currencies for sales and marketing expenses outside of the United States, the general strengthening of the U.S. Dollar relative to other major foreign currencies from the year ended December 31, 2015 to the year ended December 31, 2016 had a favorable impact on our sales and marketing expenses. For entities reporting in currencies other than the U.S. Dollar, if we had translated our results for the year ended December 31, 2016 at the average exchange rates in effect for the year ended December 31, 2015 rather than the actual exchange rates in effect during the period, our sales and marketing expenses would have increased by an additional $6.3 million.
Research and Development
Year Ended December 31 | % Change | |||||||||
2016 | 2015 | |||||||||
(dollars in thousands) | ||||||||||
Research and development | $ | 285,239 | $ | 217,389 | 31 | % | ||||
Percentage of revenues | 21 | % | 22 | % | ||||||
Headcount (at period end) | 1,054 | 756 | 39 | % | ||||||
Research and development expenses increased $67.9 million during the year ended December 31, 2016, compared to the prior year, primarily due to increased headcount resulting in an increase of $39.9 million in personnel-related costs excluding stock-based compensation, an increase of $11.4 million in stock-based compensation, and an increase of $10.2 million in overhead expenses. Outside services expenses increased $2.0 million primarily due to increase in professional fees to support our research and development functions. Research and development expenses also increased $2.5 million due to an increase in data center capacity costs and depreciation of infrastructure hardware equipment that are used solely for research and development purposes. Amortization of intangible assets increased $1.2 million as a result of acquisitions in 2016.
42
The impact from the foreign currency movements from the year ended December 31, 2015 to the year ended December 31, 2016 is not material to research and development expenses.
General and Administrative
Year Ended December 31 | % Change | |||||||||
2016 | 2015 | |||||||||
(dollars in thousands) | ||||||||||
General and administrative | $ | 158,936 | $ | 126,604 | 26 | % | ||||
Percentage of revenues | 11 | % | 12 | % | ||||||
Headcount (at period end) | 647 | 449 | 44 | % | ||||||
General and administrative expenses increased $32.3 million during the year ended December 31, 2016, compared to the prior year, primarily due to increased headcount resulting in an increase of $13.3 million in personnel-related costs excluding stock-based compensation, an increase of $11.1 million in stock-based compensation, and an increase of $6.1 million in overhead expenses.
The impact from the foreign currency movements from the year ended December 31, 2015 to the year ended December 31, 2016 is not material to general and administrative expenses.
Legal Settlements
Year Ended December 31 | % Change | ||||||||
2016 | 2015 | ||||||||
(dollars in thousands) | |||||||||
Legal settlements | $ | 270,000 | $ | — | NM | ||||
Percentage of revenues | 19 | % | NM | ||||||
NM - Not meaningful.
Legal settlements expenses increased $270.0 million during the year ended December 31, 2016, compared to the prior year, related to the settlement agreements with HPE and BMC. Refer to Note 16 in the notes to our consolidated financial statements included elsewhere in this Annual Report on Form 10-K for further details regarding these matters.
Stock-based Compensation
Year Ended December 31 | % Change | |||||||||
2016 | 2015 | |||||||||
(dollars in thousands) | ||||||||||
Cost of revenues: | ||||||||||
Subscription | $ | 28,420 | $ | 23,416 | 21 | % | ||||
Professional services and other | 26,442 | 23,265 | 14 | % | ||||||
Sales and marketing | 131,571 | 102,349 | 29 | % | ||||||
Research and development | 81,731 | 70,326 | 16 | % | ||||||
General and administrative | 49,416 | 38,357 | 29 | % | ||||||
Total stock-based compensation | $ | 317,580 | $ | 257,713 | 23 | % | ||||
Percentage of revenues | 23 | % | 26 | % | ||||||
Stock-based compensation expenses increased $59.9 million during the year ended December 31, 2016, compared to the prior year, primarily due to equity grants to new employees and additional grants to current employees.
43
Interest Expense
Year Ended December 31 | % Change | |||||||||
2016 | 2015 | |||||||||
(dollars in thousands) | ||||||||||
Interest expense | $ | (33,278 | ) | $ | (31,097 | ) | 7 | % | ||
Percentage of revenues | (2 | )% | (3 | )% | ||||||
Interest expense increased $2.2 million during the year ended December 31, 2016, compared to the prior year, due to the increase in amortization expense of debt discount and issuance costs related to our convertible senior notes issued in November 2013.
Interest Income and Other Income (Expense), net
Year Ended December 31 | % Change | |||||||||
2016 | 2015 | |||||||||
(dollars in thousands) | ||||||||||
Interest income | $ | 8,528 | $ | 4,858 | 76 | % | ||||
Foreign currency exchange gain (loss) | (2,248 | ) | 51 | NM | ||||||
Other | (245 | ) | (459 | ) | (47 | )% | ||||
Interest income and other income (expense), net | $ | 6,035 | $ | 4,450 | 36 | % | ||||
Percentage of revenues | — | % | 1 | % | ||||||
NM - Not meaningful.
Interest income and other income (expense), net increased $1.6 million during the year ended December 31, 2016, compared to the prior year, primarily due to increased interest income, partially offset by increased foreign exchange losses. We had foreign exchange losses of $2.2 million for the year ended December 31, 2016, compared to gains of $0.1 million for the year ended December 31, 2015, as a result of fluctuations in foreign currency exchange rates. Interest income increased $3.7 million due to the higher yields during the year ended December 31, 2016 compared to the prior year.
Provision for Income Taxes
Year Ended December 31 | % Change | |||||||||
2016 | 2015 | |||||||||
(dollars in thousands) | ||||||||||
Loss before income taxes | $ | (450,051 | ) | $ | (193,012 | ) | 133 | % | ||
Provision for income taxes | 1,753 | 5,414 | (68 | )% | ||||||
Effective tax rate | — | % | (3 | )% | ||||||
Our effective tax rate was 0% for the year ended December 31, 2016 compared to (3)% for the prior year. Our tax expense decreased $3.7 million during the year ended December 31, 2016, compared to the prior year, primarily due to a partial release of valuation allowance in connection with business combinations. See Note 15 in the notes to our consolidated financial statements included elsewhere in this Annual Report on Form 10-K for our reconciliation of income taxes at the statutory federal rate to the provision for income taxes.
44
Net Loss
Year Ended December 31 | % Change | |||||||||
2016 | 2015 | |||||||||
(dollars in thousands) | ||||||||||
Net loss | $ | (451,804 | ) | $ | (198,426 | ) | 128 | % | ||
Percentage of revenues | (32 | )% | (20 | )% | ||||||
Net loss increased $253.4 million during the year ended December 31, 2016, compared to the prior year, primarily due to legal settlements. Refer to Note 16 in the notes to our consolidated financial statements included elsewhere in this Annual Report on Form 10-K for further details regarding these matters.
45
Quarterly Results of Operations
The following table sets forth our unaudited quarterly consolidated statements of operations. We have prepared the quarterly data on a consistent basis with the audited consolidated financial statements included elsewhere in this Annual Report on Form 10-K. In the opinion of management, the financial information reflects all necessary adjustments, consisting only of normal recurring adjustments, necessary for a fair statement of this data. This information should be read in conjunction with the audited consolidated financial statements and related notes thereto included elsewhere in this Annual Report on Form 10-K. The results of historical periods are not necessarily indicative of the results of operations for a full year or any future period.
For the Three Months Ended | |||||||||||||||||||||||||||||||
Dec 31, 2017 | Sep 30, 2017 | June 30, 2017 | March 31, 2017 | Dec 31, 2016 | Sep 30, 2016 | June 30, 2016 | March 31, 2016 | ||||||||||||||||||||||||
(in thousands, except per share data) | |||||||||||||||||||||||||||||||
Revenues: | |||||||||||||||||||||||||||||||
Subscription | $ | 497,232 | $ | 455,421 | $ | 411,007 | $ | 376,135 | $ | 344,604 | $ | 318,934 | $ | 290,679 | $ | 267,422 | |||||||||||||||
Professional services and other | 49,138 | 42,749 | 60,696 | 40,648 | 41,062 | 38,722 | 50,633 | 38,457 | |||||||||||||||||||||||
Total revenues | 546,370 | 498,170 | 471,703 | 416,783 | 385,666 | 357,656 | 341,312 | 305,879 | |||||||||||||||||||||||
Cost of revenues: | |||||||||||||||||||||||||||||||
Subscription | 87,524 | 81,878 | 75,793 | 70,375 | 64,707 | 61,566 | 56,360 | 52,781 | |||||||||||||||||||||||
Professional services and other | 46,836 | 45,402 | 45,892 | 46,072 | 40,229 | 41,271 | 40,289 | 41,479 | |||||||||||||||||||||||
Total cost of revenues | 134,360 | 127,280 | 121,685 | 116,447 | 104,936 | 102,837 | 96,649 | 94,260 | |||||||||||||||||||||||
Gross profit | 412,010 | 370,890 | 350,018 | 300,336 | 280,730 | 254,819 | 244,663 | 211,619 | |||||||||||||||||||||||
Operating expenses: | |||||||||||||||||||||||||||||||
Sales and marketing | 260,292 | 227,015 | 247,224 | 212,086 | 188,857 | 166,491 | 186,506 | 158,610 | |||||||||||||||||||||||
Research and development | 104,559 | 98,465 | 90,005 | 84,489 | 73,933 | 75,018 | 70,364 | 65,924 | |||||||||||||||||||||||
General and administrative | 60,291 | 52,465 | 51,526 | 46,251 | 41,543 | 40,085 | 36,071 | 41,237 | |||||||||||||||||||||||
Legal settlements (1) | — | — | — | — | — | — | — | 270,000 | |||||||||||||||||||||||
Total operating expenses | 425,142 | 377,945 | 388,755 | 342,826 | 304,333 | 281,594 | 292,941 | 535,771 | |||||||||||||||||||||||
Loss from operations | (13,132 | ) | (7,055 | ) | (38,737 | ) | (42,490 | ) | (23,603 | ) | (26,775 | ) | (48,278 | ) | (324,152 | ) | |||||||||||||||
Interest expense | (16,813 | ) | (16,566 | ) | (11,337 | ) | (8,678 | ) | (8,532 | ) | (8,389 | ) | (8,248 | ) | (8,109 | ) | |||||||||||||||
Interest income and other income (expense), net | 5,065 | 853 | (7,830 | ) | 7,716 | 1,290 | 1,783 | 2,260 | 702 | ||||||||||||||||||||||
Loss before income taxes | (24,880 | ) | (22,768 | ) | (57,904 | ) | (43,452 | ) | (30,845 | ) | (33,381 | ) | (54,266 | ) | (331,559 | ) | |||||||||||||||
Provision for (benefit from) income taxes | 2,927 | 1,420 | (1,431 | ) | (2,790 | ) | 1,744 | 2,877 | (4,641 | ) | 1,773 | ||||||||||||||||||||
Net loss | $ | (27,807 | ) | $ | (24,188 | ) | $ | (56,473 | ) | $ | (40,662 | ) | $ | (32,589 | ) | $ | (36,258 | ) | $ | (49,625 | ) | $ | (333,332 | ) | |||||||
Net loss per share - basic and diluted | $ | (0.16 | ) | $ | (0.14 | ) | $ | (0.33 | ) | $ | (0.24 | ) | $ | (0.20 | ) | $ | (0.22 | ) | $ | (0.30 | ) | $ | (2.06 | ) | |||||||
(1) | For details regarding the legal settlements expenses of $270.0 million included in the three months ended March 31, 2016, refer to Note 16 in the notes to our consolidated financial statements included elsewhere in this Annual Report on Form 10-K. |
46
Seasonality, Cyclicality and Quarterly Trends
We have historically experienced seasonality in terms of when we enter into customer agreements for our services. We sign a significantly higher percentage of agreements with new customers, as well as renewal agreements with existing customers, in the quarter ended December 31. The increase in customer agreements for the quarter ended December 31 is primarily a result of the terms of our commission plans, which incentivize our direct sales force to meet their annual quotas by December 31, and large enterprise account buying patterns typical in the software industry, which are driven primarily by the expiration of annual authorized budgeted expenditures. Furthermore, we usually sign a significant portion of these agreements during the last month, and often the last two weeks, of each quarter. This seasonality in the timing of entering into customer contracts is sometimes not immediately apparent in our billings due to the fact that we exclude contracts with a future start date from our billings. Similarly, this seasonality is reflected to a much lesser extent, and sometimes is not immediately apparent in our revenues, due to the fact that we recognize subscription revenues over the term of the subscription agreement, which is generally 12 to 36 months. Although these seasonal factors are common in the technology industry, historical patterns should not be considered a reliable indicator of our future sales activity or performance.
Our revenues have increased over the periods presented due to increased sales to new customers, as well as upsells to existing customers. Our operating expenses have increased over the periods presented primarily due to increases in headcount and other related expenses to support our growth. We have historically seen an increase in marketing expenses in the quarter ended June 30, and a corresponding decrease in marketing expenses in the quarter ended September 30 due to the expenses incurred for our annual Knowledge user conference. Marketing expenses in the quarter ended December 31 are also historically higher due to user forums we conduct in that quarter. We anticipate operating expenses will continue to increase in future periods as we continue to focus on investing in the long-term growth of our business.
Our free cash flow is impacted by the timing of collections and disbursements, including the timing of capital expenditures. We have historically seen higher collections in the quarter ended March 31 due to seasonality in timing of entering into customer contracts as described above.
Liquidity and Capital Resources
Our principal sources of liquidity are our cash and cash equivalents, investments, and cash generated from operations. As of December 31, 2017, we had $1.8 billion in cash and cash equivalents and short-term investments, of which $250.6 million represented cash held by foreign subsidiaries. $191.5 million of the $1.8 billion are denominated in currencies other than U.S. Dollar. In addition, we had $391.4 million in long-term investments that provide additional capital resources. We do not anticipate that we will need funds generated from foreign operations to fund our domestic operations.
Prior to the enactment of the Tax Act, we considered earnings from foreign operations to be indefinitely reinvested outside of the United States. We are currently evaluating whether to change our indefinite reinvestment assertion in light of the Tax Act and consider that assessment to be incomplete as permitted under guidance issued by the SEC. We expect to reach a final determination within the measurement period in accordance with SAB 118.
In November 2013, we issued the 2018 Notes with an aggregate principal amount of $575.0 million. The 2018 Notes mature on November 1, 2018 unless converted or repurchased in accordance with their terms prior to such date. In connection with the issuance of the 2018 Notes, we entered into the 2018 Note Hedge transactions and 2018 Warrant transactions with certain financial institutions (the option counterparties). We may elect to settle the 2018 Notes in cash, shares of our common stock, or a combination of cash and shares. If the 2018 Note Hedges are exercised, we may elect to receive cash, shares of our common stock, or a combination of cash and shares.
The price of our common stock was greater than or equal to 130% of the conversion price of the 2018 Notes for at least 20 trading days during the 30 consecutive trading days ending on the last trading day of the quarters ended June 30, 2017, September 30, 2017 and December 31, 2017. Therefore, the 2018 Notes first became convertible at the holders’ option beginning on July 1, 2017 and continue to be convertible at the holders' option through March 31, 2018. The impact of the conversion of the 2018 Notes on our liquidity will depend on the settlement method we elect for each instrument described above. We currently intend to settle the principal amount of any converted 2018 Notes in cash.
47
During the year ended December 31, 2017, we paid cash to settle an immaterial principal amount of the 2018 Notes due to early conversion requests. Based on additional conversion requests we have received through the filing date, we expect to settle in cash an aggregate of $37.3 million in principal amount of the 2018 Notes during the first quarter of 2018 and $7.3 million in principal amount of the 2018 Notes during the second quarter of 2018. We may receive additional conversion requests that require settlement in the second quarter or the remainder of the year 2018.
In May and June 2017, we issued the 2022 Notes with an aggregate principal amount of $782.5 million. We currently intend to use approximately $575.0 million of the net proceeds from the 2022 Notes to repay the 2018 Notes. In connection with the issuance of the 2022 Notes, we entered into the 2022 Note Hedge transactions and 2022 Warrant transactions with certain financial institutions. Refer to Note 9 in the notes to our consolidated financial statements and the risk factors included elsewhere in this Annual Report on Form 10-K for additional information on the 2022 Notes, the 2022 Notes Hedges and the 2022 Warrants. In addition, in May 2017, we used approximately $55.0 million of the net proceeds from the 2022 Notes to repurchase shares of our common stock sold by certain purchasers of the 2022 Notes, and during the three months ended June 30, 2017, we used approximately $73.9 million to pay the cost of the 2022 Note Hedges (after such cost was partially offset by the proceeds from the issuance of the 2022 Warrants).
We anticipate our current cash and cash equivalents balance and cash generated from operations will be sufficient to meet our liquidity needs, including the repayment of our 2018 Notes, expansion of data centers, lease obligations, expenditures related to the growth of our headcount and the acquisition of fixed assets, intangibles, and investments in office facilities, to accommodate our growth for at least the next 12 months. Whether these resources are adequate to meet our liquidity needs beyond that period will depend on our growth, operating results, cash utilized for acquisitions and/or debt retirements if any are consummated, and the capital expenditures required to meet possible increased demand for our services. If we require additional capital resources to grow our business at any time in the future, we may seek to finance our operations from the current funds available or seek additional equity or debt financing.
Year Ended December 31, | |||||||||||
2017 | 2016 | 2015 | |||||||||
(dollars in thousands) | |||||||||||
Net cash provided by operating activities | $ | 642,825 | $ | 159,921 | $ | 317,754 | |||||
Net cash used in investing activities (1) | (883,948 | ) | (108,238 | ) | (231,521 | ) | |||||
Net cash provided by (used in) financing activities | 538,892 | (55,752 | ) | 80,330 | |||||||
Net increase (decrease) in cash, cash equivalents and restricted cash net of foreign currency effect | 325,897 | (10,854 | ) | 160,050 | |||||||
(1) | During the year ended December 31, 2017, we adopted Accounting Standards Update 2016-18, “Statement of Cash Flows (Topic 230): Restricted Cash,” which requires that amounts generally described as restricted cash or restricted cash equivalents be included with cash and cash equivalents when reconciling the beginning-of-period and end-of-period total amounts shown on the statement of cash flows. We have adopted changes to the consolidated statements of cash flows on a retrospective basis. The impact of the adoption for the years ended December 31, 2016 and 2015 is not material. |
Operating Activities
Cash provided by operating activities mainly consists of our net loss adjusted for certain non-cash items, including depreciation and amortization, amortization of premiums on investments, amortization of deferred commissions, amortization of issuance cost and debt discount, stock-based compensation, and changes in operating assets and liabilities during the year.
Net cash provided by operating activities was $642.8 million for the year ended December 31, 2017 compared to $159.9 million for the prior year. The increase in operating cash flow was primarily due to a decrease in net loss by $302.7 million. The remaining change was due to an increase in non-cash adjustments to reconcile net loss to net cash provided by operations and the favorable impact on operating cash flow from changes in operating assets and liabilities.
Net cash provided by operating activities was $159.9 million for the year ended December 31, 2016 compared to $317.8 million for the prior year. The decrease in operating cash flow was primarily due to $267.5 million cash paid for aggregate legal settlements during the year ended December 31, 2016 (refer to Note 16 in the notes to our consolidated financial statements included elsewhere in this Annual Report on Form 10-K for further details). The remaining change was due to an increase in non-cash adjustments to reconcile net loss to net cash provided by operations and the favorable impact on operating cash flow from changes in operating assets and liabilities.
48
Investing Activities
Net cash used in investing activities for the year ended December 31, 2017 was $883.9 million compared to $108.2 million for the prior year. The increase in cash used in investing activities was mainly due to a $714.7 million increase in net purchases of investments, a $44.9 million increase in capital expenditures related to the purchases of infrastructure hardware equipment to support the expansion of our data centers as well as investments in leasehold improvements, furniture and equipment to support our headcount growth, a $23.9 million increase in business combinations, net of cash and restricted cash acquired, and a $4.3 million increase in purchases of strategic investments. The increase in cash used in investing activities was partially offset by a $12.1 million decrease in purchases of other intangibles.
Net cash used in investing activities for the year ended December 31, 2016 was $108.2 million compared to $231.5 million for the prior year. The decrease in cash used in investing activities was mainly due to a $181.6 million decrease in net purchases of investments and a $10.0 million decrease in the purchases of strategic investments, partially offset by a $33.2 million increase in business combinations, net of cash and restricted cash acquired, a $17.0 million increase in purchases of other intangibles, and a $18.1 million increase in capital expenditures related to the purchase of infrastructure hardware equipment to support the expansion of our data centers as well as investments in leasehold improvements, furniture and equipment to support our headcount growth.
Financing Activities
Net cash provided by financing activities for the year ended December 31, 2017 was $538.9 million compared to net cash used in financing activities of $55.8 million for the prior year. The change was primarily due to a $698.2 million increase in net proceeds from issuance of the 2022 Notes and the 2022 Note Hedge and 2022 Warrant transactions entered into during the year ended December 31, 2017 and a $16.2 million increase in proceeds from employee stock plans, partially offset by a $62.0 million increase in taxes paid related to net share settlement of equity awards and a $55.0 million increase in cash used to repurchase shares of our common stock.
Net cash used in financing activities for the year ended December 31, 2016 was $55.8 million compared to net cash provided by financing activities of $80.3 million for the prior year. The change was primarily due to a $107.1 million increase in taxes paid related to net share settlement of equity awards as a result of a policy change to net settle shares for all U.S. employees starting in 2016 and a $27.0 million decrease in proceeds from employee stock plans due to a reduction in the number of stock options issued in the last four years.
49
Contractual Obligations and Commitments
The following table represents our future non-cancelable contractual obligations as of December 31, 2017, aggregated by type:
Payments Due by Period | |||||||||||||||||||
Total | Less Than 1 Year | 1 – 3 Years | 3 – 5 Years | More Than 5 Years | |||||||||||||||
(in thousands) | |||||||||||||||||||
Operating leases (1) | $ | 353,859 | $ | 44,713 | $ | 96,204 | $ | 88,828 | $ | 124,114 | |||||||||
Purchase obligations (2) | 80,974 | 31,394 | 34,434 | 11,053 | 4,093 | ||||||||||||||
Principal amount payable on our convertible senior notes (3) | 1,357,494 | 574,994 | — | 782,500 | — | ||||||||||||||
Other | 3,923 | 574 | 1,148 | 1,148 | 1,053 | ||||||||||||||
Total contractual obligations | $ | 1,796,250 | $ | 651,675 | $ | 131,786 | $ | 883,529 | $ | 129,260 | |||||||||
(1) | Consists of future non-cancelable minimum rental payments under operating leases for some of our offices and data centers. |
(2) | Consists of future minimum payments under non-cancelable purchase commitments primarily related to data center and IT operations and sales and marketing activities. Not included in the table above are certain purchase commitments related to our future annual Knowledge user conferences and other customer or sales conferences to be held in 2019 and 2020. If we were to cancel these contractual commitments as of December 31, 2017, we would have been obligated to pay cancellation penalties of approximately $13.9 million in aggregate. |
(3) | For additional information regarding our convertible senior notes, refer to Note 9 in the notes to our consolidated financial statements included elsewhere in this Annual Report on Form 10-K. |
In addition to the obligations in the table above, approximately $4.8 million of unrecognized tax benefits have been recorded as liabilities as of December 31, 2017. It is uncertain as to if or when such amounts may be settled.
Off-Balance Sheet Arrangements
During all periods presented, we did not have any relationships with unconsolidated entities or financial partnerships, such as entities often referred to as structured finance or special purpose entities, which would have been established for the purpose of facilitating off-balance sheet arrangements or other contractually narrow or limited purposes. As such, we are not exposed to any financing, liquidity, market or credit risk that could arise if we had engaged in those types of relationships.
Critical Accounting Policies and Significant Judgments and Estimates
Our management’s discussion and analysis of financial condition and results of operations is based on our consolidated financial statements, which have been prepared in accordance with accounting principles generally accepted in the United States. The preparation of these consolidated financial statements requires us to make estimates and assumptions that affect the reported amounts of assets and liabilities and the disclosure of contingent assets and liabilities at the date of the consolidated financial statements, as well as the reported revenues and expenses during the reporting periods. These items are monitored and analyzed by us for changes in facts and circumstances, and material changes in these estimates could occur in the future. We base our estimates on historical experience and on various other factors that we believe are reasonable under the circumstances, the results of which form the basis for making judgments about the carrying value of assets and liabilities that are not readily apparent from other sources. Changes in estimates are reflected in reported results for the period in which they become known. Actual results may differ from these estimates under different assumptions or conditions and such differences could be material.
While our significant accounting policies are more fully described in Note 2 in the notes to our consolidated financial statements included elsewhere in this Annual Report on Form 10-K, we believe that the following accounting policies are critical to the process of making significant judgments and estimates in the preparation of our audited consolidated financial statements.
Revenue Recognition
We derive our revenues from two sources: (i) subscriptions and (ii) professional services and other. Subscription revenues are primarily comprised of subscription fees that give customers access to the ordered subscription service, related support and updates, if any, to the subscribed service during the subscription term.
50
Our contracts typically do not give the customer the right to take possession of the software supporting the services. Professional services and other revenues consist of fees associated with services provided to customers for process design, implementation, configuration and optimization of our products. Professional services and other revenues also include customer training and registration and sponsorship fees for our annual Knowledge user conference and other user forums.
We commence revenue recognition when all of the following conditions are met:
•There is persuasive evidence of an arrangement;
•The service has been provided to the customer;
•The collection of related fees is reasonably assured; and
•The amount of fees to be paid by the customer is fixed or determinable.
We use a signed contract together with a signed order form as evidence of an arrangement for a new customer. In subsequent transactions with an existing customer, including an upsell or a renewal, we consider the existing signed contract and either the new signed order form or new purchase order as evidence of an arrangement.
We recognize subscription revenues ratably over the contract term beginning on the commencement date of each contract, the date we make our services available to our customers. Once our services are available to customers, we record amounts due in accounts receivable and in deferred revenue. To the extent we bill customers in advance of the contract commencement date, the accounts receivable and corresponding deferred revenue amounts are netted to zero on our consolidated balance sheets, unless such amounts have been paid as of the balance sheet date.
Our professional services arrangements are primarily on a time-and-materials basis and revenues on these arrangements are recognized as the services are delivered. Professional services revenues associated with fixed fee arrangements are recognized using a proportional performance model. In instances where certain milestones are required to be met before revenues are recognized, we defer professional services revenues and the associated costs until milestone criteria have been met.
We assess collectibility based on a number of factors such as past collection history with the customer and creditworthiness of the customer. If we determine collectibility is not reasonably assured, we defer revenue recognition until collectibility becomes reasonably assured. We assess whether the fee is fixed or determinable based on the payment terms associated with the transaction and whether the sales price is subject to refund or adjustment. Our arrangements are generally non-cancelable and do not contain refund-type provisions.
We have multiple element arrangements comprised of subscription fees and professional services. We account for subscription and professional services revenues as separate units of accounting. To qualify as a separate unit of accounting, the delivered item must have value to the customer on a standalone basis. We have concluded that our subscription service has standalone value as it is routinely sold separately by us. In addition, the applications offered through this subscription service are fully functional without any additional development, modification or customization. We provide customers access to our subscription service at the beginning of the contract term. In determining whether professional services have standalone value, we considered the following factors for each professional services agreement: availability of the services from other vendors, the nature of the professional services, the timing of when the professional services contract was signed in comparison to the subscription service start date and the contractual dependence of the subscription service on the customer’s satisfaction with the professional services work. Our professional services, including implementation and configuration services, are not so unique and complex that other vendors cannot provide them. In some instances, customers independently contract with third-party vendors to do the implementation and we regularly outsource implementation services to contracted third-party vendors. As a result, we concluded professional services, including implementation and configuration services, have standalone value.
The total arrangement consideration for a multiple element arrangement is allocated to the identifiable separate units of accounting based on a relative selling price hierarchy. We determined the relative selling price for a deliverable based on its vendor-specific objective evidence (VSOE) of selling price or third-party evidence (TPE) of selling price if VSOE does not exist. If neither VSOE nor TPE of selling price exists for a deliverable, the selling price is determined using the best estimate of selling price (BESP). We determine the BESP for each deliverable primarily by considering the historical selling price of these deliverables in similar transactions as well as other factors, including, but not limited to, market competition, review of stand-alone sales and current pricing practices. In determining the appropriate pricing structure, we consider the available information regarding the competitive pricing of similar products and marketing analysis.
51
In limited circumstances, we grant certain customers the right to deploy our subscription service on the customers’ own servers. These arrangements are subject to software revenue recognition guidance since the customer deploys our software. As we never sell the non-software elements separately from the software elements, we have determined that we do not have sufficient VSOE of fair value for all undelivered non-software elements. Consequently, we defer all revenue and related costs under the arrangement until the last element in the transaction has been delivered or starts to be delivered. Once the delivery of the last element has commenced, we recognize the entire fee and related costs from the arrangement ratably over the remaining period of the arrangement.
Deferred revenue consists primarily of payments received in advance of revenue recognition for our subscriptions and professional services and other revenues and is recognized as the revenue recognition criteria are met.
Deferred Commissions
Deferred commissions are the incremental selling costs that are directly associated with our customer contracts and consist of sales commissions paid to our direct sales force and referral fees paid to independent third-parties. The majority of commissions and referral fees are deferred and amortized on a straight-line basis over the terms of the related customer contracts. We include amortization of deferred commissions in sales and marketing expense in the consolidated statements of comprehensive loss. We believe this is the preferable method of accounting as the commission charges are so closely related to the revenue from the customer contracts that they should be recorded as an asset and charged to expense over the same period that the revenue is recognized. The commission payments are generally paid in full the month after the customer’s initial service under the contract commences.
Goodwill, Intangible Assets and Other Long Lived Assets
Goodwill represents the excess of the purchase price in a business combination over the fair value of net tangible and intangible assets acquired. The allocation of the purchase price requires us to make significant estimates in determining the fair value of acquired assets and assumed liabilities, especially with respect to intangible assets. These estimates are based upon a number of factors, including historical experience, market conditions and information obtained from the management of the acquired company. Critical estimates in valuing certain intangible assets included, but are not limited to, cash flows that an asset is expected to generate in the future, discount rates, the time and expense that would be necessary to recreate the assets and the profit margin a market participant would receive. These estimates are inherently uncertain and unpredictable and, as a result, actual results may differ from estimates.
We evaluate and test the recoverability of goodwill for impairment at least annually during our fourth quarter or more frequently if circumstances indicate that goodwill may not be recoverable. We perform the impairment testing by first assessing qualitative factors to determine whether the existence of events or circumstances leads to a determination that it is more likely than not that the fair value of its reporting unit is less than its carrying amount. If, after assessing the totality of events or circumstances, we determine it is more likely than not that the fair value of a reporting unit is less than its carrying amount, we perform a goodwill impairment test. To calculate any potential impairment, we compare the fair value of a reporting unit with its carrying amount, including goodwill. Any excess of the carrying amount of the reporting unit's goodwill over its fair value is recognized as an impairment loss, and the carrying value of goodwill is written down. We have determined that we have a single reporting unit. We have not recognized any impairment charges related to goodwill during the years ended December 31, 2017, 2016 and 2015 because the aggregate fair value of our company has consistently and materially exceeded the carrying value of our single reporting unit.
We periodically review the carrying amounts of long-lived assets, such as property and equipment, and purchased intangible assets for impairment whenever events or changes in circumstances indicate that the carrying amount of the assets may not be recoverable. We measure the recoverability of these assets by comparing the carrying amount of each asset to the future undiscounted cash flows we expect the asset to generate. If we consider any of these assets to be impaired, the impairment to be recognized equals the amount by which the carrying value of the asset exceeds its fair value. In addition, we periodically evaluate the estimated remaining useful lives of long-lived assets to determine whether events or changes in circumstances warrant a revision to the remaining period of depreciation or amortization. Our intangible assets are amortized over their useful lives ranging from 18 months to ten years.
Screening for and assessing whether impairment indicators exist or if events or changes in circumstances have occurred, including market conditions, operating fundamentals, competition and general economic conditions, requires significant judgment. Additionally, changes in the technology industry occur frequently and quickly. Therefore, there can be no assurance that a charge to operating expenses will not occur as a result of future goodwill, intangible assets and other long-lived assets impairment tests.
52
Stock-based Compensation
We recognize compensation expense related to stock options and restricted stock units (RSUs) on a straight-line basis over the requisite service period, which is generally the vesting term of four years. For RSUs granted with a performance condition, the expenses are recognized on a graded vesting basis over the vesting period, after assessing the probability of achieving requisite performance criteria. This has the impact of greater stock-based compensation expense during the initial years of the vesting period as stock-based compensation cost is recognized over the requisite service period for each separately vesting tranche of the award as though the award were, in substance, multiple awards. We recognize compensation expense related to shares issued pursuant to the employee stock purchase plan (ESPP) on a straight-line basis over the offering period. We estimate the fair value of options using the Black-Scholes options pricing model and fair value of RSU awards using the fair value of our common stock on the date of grant. We recognize compensation expense net of estimated forfeiture activity, which is based on historical forfeiture rates. We evaluate the forfeiture rates at least annually or when events or circumstances indicate a change may be needed. This may cause a fluctuation in our stock-based compensation in the period of change.
Income Taxes
We use the asset and liability method of accounting for income taxes, in which deferred tax assets and liabilities are recognized for the future tax consequences attributable to differences between the consolidated financial statement carrying amounts of existing assets and liabilities and their respective tax bases. We measure deferred tax assets and liabilities using enacted tax rates expected to apply to taxable income in the years in which those temporary differences are expected to be reversed. We recognize the effect on deferred tax assets and liabilities of a change in tax rates as income and expense in the period that includes the enactment date. A valuation allowance is established if it is more likely than not that all or a portion of the deferred tax asset will not be realized. In determining the need for a valuation allowance, we consider future growth, forecasted earnings, future taxable income, the mix of earnings in the jurisdictions in which we operate, historical earnings, taxable income in prior years, if carryback is permitted under the law, carryforward periods and prudent and feasible tax planning strategies.
Our tax positions are subject to income tax audits by multiple tax jurisdictions throughout the world. We recognize the tax benefit of an uncertain tax position only if it is more likely than not the position is sustainable upon examination by the taxing authority, based on the technical merits. We measure the tax benefit recognized as the largest amount of benefit which is more likely than not to be realized upon settlement with the taxing authority. We recognize interest accrued and penalties related to unrecognized tax benefits in our tax provision. Significant judgment is required to evaluate uncertain tax positions. Our evaluations are based upon a number of factors, including changes in facts or circumstances, changes in tax law or guidance, correspondence with tax authorities during the course of audits and effective settlement of audit issues. Changes in the recognition or measurement of uncertain tax positions could result in material increases or decreases in our income tax expense in the period in which we make the change, which could have a material impact on our effective tax rate and operating results.
We calculate the current and deferred income tax provision based on estimates and assumptions that could differ from the actual results reflected in income tax returns filed in subsequent years and record adjustments based on filed income tax returns when identified. The amount of income taxes paid is subject to examination by U.S. federal, state and foreign tax authorities. The estimate of the potential outcome of any uncertain tax issue is subject to management’s assessment of relevant risks, facts and circumstances existing at that time. To the extent the assessment of such tax position changes, we record the change in estimate in the period in which we make the determination.
New Accounting Pronouncements
On December 22, 2017, the 2017 Tax Cuts and Jobs Act (the Tax Act) was enacted into law and significantly changed how the U.S. imposes income tax on multinational corporations. Changes include, but are not limited to, a reduction of the corporate income tax rate from 35% to 21%, a transition tax on accumulated foreign earnings, and a transition from a worldwide to a territorial tax system. We are required to recognize the effect of the Tax Act in the period of enactment, such as remeasuring our U.S. deferred tax assets and liabilities as well as reassessing the net realizability of our deferred tax assets and liabilities.
In December 2017, the SEC staff issued Staff Accounting Bulletin No. 118, Income Tax Accounting Implications of the Tax Cuts and Jobs Act (SAB 118), which allows us to record provisional amounts during a measurement period not to extend more than one year beyond the Tax Act enactment date. Since the Tax Act was passed late in the fourth quarter of 2017, and ongoing guidance and accounting interpretation are expected over the next 12 months, we consider the accounting for deferred tax remeasurements, the impact of the transition of U.S. international taxation from a worldwide tax system to a territorial system and other provisions to be incomplete due to the forthcoming guidance and our ongoing analysis. We expect to complete our analysis within the measurement period in accordance with SAB 118.
53
In May 2014, the Financial Accounting Standards Board issued a new standard related to revenue recognition from contracts with customers (Topic 606), which is effective beginning January 1, 2018. Topic 606 supersedes the prior revenue recognition standard (Topic 605). Under Topic 606, for our on‑premises offerings, we will recognize a portion of the subscription revenue when the on-premises offering is made available, resulting in a larger amount of upfront subscription revenue, and a smaller amount of deferred revenue compared with Topic 605, which required ratable revenue recognition over the contract period. Due to the complexity of certain customer contracts, the actual revenue recognition treatment required under Topic 606 will depend on contract-specific terms and may result in greater variability in revenue from period to period.
Under Topic 606, we will defer all incremental commission costs to obtain customer contracts, including indirect costs that are not tied to a specific contract. On initial contracts, only the portion equivalent to a renewal commission will be amortized over the contract term, while the portion incremental to a renewal commission will be amortized over a period of benefit that we have determined to be five years. On renewal contracts, these costs will be amortized over the renewal term. Additionally, for our on-premises offerings, consistent with the recognition of subscription revenue for on-premises offerings as described above, a portion of the commission costs will be expensed upfront when the on-premises offering is made available. Under Topic 605, we deferred only direct and incremental commission costs to obtain a contract and amortized those costs over the contract term, which is generally 12 to 36 months.
For details regarding these and other recently issued accounting standards, refer to Note 2, Summary of Significant Accounting Policies, of the notes to our consolidated financial statements included elsewhere in this Annual Report on Form 10-K.
ITEM 7A. | QUALITATIVE AND QUANTITATIVE DISCLOSURES ABOUT MARKET RISK |
Foreign Currency Exchange Risk
We have foreign currency risks related to our revenue and operating expenses denominated in currencies other than the U.S. Dollar, primarily the Euro and British Pound Sterling. We are a net receiver of Euro and therefore benefit from a weakening of the U.S. Dollar relative to the Euro and, conversely, are adversely affected by a strengthening of the U.S. Dollar relative to the Euro. Revenues denominated in U.S. Dollar as a percentage of total revenues was 73% during the years ended December 31, 2017 and 2016 and 74% during the year ended December 31, 2015. Changes in exchange rates have recently positively affected, and may continue to positively affect, our total revenues.
We have experienced and expect to continue to experience fluctuations in our net loss as a result of transaction gains or losses related to remeasuring monetary assets and liabilities that are denominated in currencies other than the functional currency of the entities in which they are recorded. We recognized net foreign currency losses of $11.1 million and $2.2 million for the years ended December 31, 2017 and 2016, respectively. While we have not engaged in the hedging of our foreign currency transactions to date, we may do so in 2018.
A hypothetical 10% increase in the U.S. Dollar against other currencies would have resulted in an increase in operating loss of approximately $13.7 million and $7.7 million for the years ended December 31, 2017 and 2016, respectively. The hypothetical increase in operating loss for the year ended December 31, 2017 compared to the year ended December 31, 2016 is due to an assumed decrease in the mix of foreign currency revenue relative to foreign currency expenses. This analysis disregards the possibilities that rates can move in opposite directions and that losses from one geographic area may be offset by gains from another geographic area.
Interest Rate Sensitivity
We had an aggregate of $2.2 billion in cash, cash equivalents, short-term investments and long-term investments as of December 31, 2017. This amount was invested primarily in money market funds, time deposits, corporate notes and bonds, government securities and other debt securities with a minimum rating of BBB by Standard & Poor's, Baa2 by Moody's, or BBB by Fitch. The primary objectives of our investment activities are the preservation of capital and support of our liquidity requirements. Our investments are exposed to market risk due to fluctuations in interest rates, which may affect our interest income and the fair market value of our investments.
As of December 31, 2017, a hypothetical 100 basis point increase in interest rates would have resulted in an approximate $10.7 million decline of the fair value of our available-for-sale securities. This estimate is based on a sensitivity model that measures market value changes when changes in interest rates occur.
54
As of December 31, 2016, we had an aggregate of $1.2 billion in cash, cash equivalents, short-term investments and long-term investments, and a hypothetical 100 basis point increase in interest rates would have resulted in an approximate $5.7 million decline of the fair value of our available-for-sale securities.
Market Risk
In November 2013, we issued the 2018 Notes with an aggregate principal amount of $575.0 million, and in May and June 2017, we issued the 2022 Notes with an aggregate principal amount of $782.5 million. We carry these instruments at face value less unamortized discount on our consolidated balance sheet. Because these instruments does not bear interest, we have no financial statement risk associated with changes in interest rates. However, the fair value of fixed rate instruments fluctuates when interest rates change, and in the case of convertible notes, when the market price of our stock fluctuates.
We hold cash balances with multiple financial institutions in various countries and these balances routinely exceed deposit insurance limits.
As of December 31, 2017, we had $5.8 million invested in privately-held companies that are in the development stage. The fair value of these investments may fluctuate depending on the financial condition and near-term prospects of these companies, and we may be required to record an impairment charge if the carrying value of these investments exceed their fair value.
55
ITEM 8. | CONSOLIDATED FINANCIAL STATEMENTS AND SUPPLEMENTARY DATA |
SERVICENOW, INC.
INDEX TO CONSOLIDATED FINANCIAL STATEMENTS
Page | |
Consolidated Financial Statements | |
The supplementary financial information required by this Item 8, is included in Part II, Item 7 under the caption “Quarterly Results of Operations”, which is incorporated herein by reference.
56
Report of Independent Registered Public Accounting Firm
To the Board of Directors and Stockholders of ServiceNow, Inc.
Opinions on the Financial Statements and Internal Control over Financial Reporting
We have audited the accompanying consolidated balance sheets of ServiceNow, Inc. and its subsidiaries (the “Company”) as of December 31, 2017 and December 31, 2016, and the related consolidated statements of comprehensive loss, of stockholders’ equity and of cash flows for each of the three years in the period ended December 31, 2017, including the related notes (collectively referred to as the “consolidated financial statements”). We also have audited the Company's internal control over financial reporting as of December 31, 2017, based on criteria established in Internal Control - Integrated Framework (2013) issued by the Committee of Sponsoring Organizations of the Treadway Commission (COSO).
In our opinion, the consolidated financial statements referred to above present fairly, in all material respects, the financial position of the Company as of December 31, 2017 and December 31, 2016, and the results of its operations and its cash flows for each of the three years in the period ended December 31, 2017 in conformity with accounting principles generally accepted in the United States of America. Also in our opinion, the Company maintained, in all material respects, effective internal control over financial reporting as of December 31, 2017, based on criteria established in Internal Control - Integrated Framework (2013) issued by the COSO.
Basis for Opinions
The Company's management is responsible for these consolidated financial statements, for maintaining effective internal control over financial reporting, and for its assessment of the effectiveness of internal control over financial reporting, included in Management's Annual Report on Internal Control over Financial Reporting appearing under Item 9A. Our responsibility is to express opinions on the Company’s consolidated financial statements and on the Company's internal control over financial reporting based on our audits. We are a public accounting firm registered with the Public Company Accounting Oversight Board (United States) (“PCAOB”) and are required to be independent with respect to the Company in accordance with the U.S. federal securities laws and the applicable rules and regulations of the Securities and Exchange Commission and the PCAOB.
We conducted our audits in accordance with the standards of the PCAOB. Those standards require that we plan and perform the audits to obtain reasonable assurance about whether the consolidated financial statements are free of material misstatements, whether due to error or fraud, and whether effective internal control over financial reporting was maintained in all material respects.
Our audits of the consolidated financial statements included performing procedures to assess the risks of material misstatement of the consolidated financial statements, whether due to error or fraud, and performing procedures that respond to those risks. Such procedures included examining, on a test basis, evidence regarding the amounts and disclosures in the consolidated financial statements. Our audits also included evaluating the accounting principles used and significant estimates made by management, as well as evaluating the overall presentation of the consolidated financial statements. Our audit of internal control over financial reporting included obtaining an understanding of internal control over financial reporting, assessing the risk that a material weakness exists, and testing and evaluating the design and operating effectiveness of internal control based on the assessed risk. Our audits also included performing such other procedures as we considered necessary in the circumstances. We believe that our audits provide a reasonable basis for our opinions.
Definition and Limitations of Internal Control over Financial Reporting
A company’s internal control over financial reporting is a process designed to provide reasonable assurance regarding the reliability of financial reporting and the preparation of financial statements for external purposes in accordance with generally accepted accounting principles. A company’s internal control over financial reporting includes those policies and procedures that (i) pertain to the maintenance of records that, in reasonable detail, accurately and fairly reflect the transactions and dispositions of the assets of the company; (ii) provide reasonable assurance that transactions are recorded as necessary to permit preparation of financial statements in accordance with generally accepted accounting principles, and that receipts and expenditures of the company are being made only in accordance with authorizations of management and directors of the company; and (iii) provide reasonable assurance regarding prevention or timely detection of unauthorized acquisition, use, or disposition of the company’s assets that could have a material effect on the financial statements.
57
Because of its inherent limitations, internal control over financial reporting may not prevent or detect misstatements. Also, projections of any evaluation of effectiveness to future periods are subject to the risk that controls may become inadequate because of changes in conditions, or that the degree of compliance with the policies or procedures may deteriorate.
/s/ PricewaterhouseCoopers LLP
San Jose, California
February 28, 2018
We have served as the Company’s auditor since 2011.
58
SERVICENOW, INC.
CONSOLIDATED BALANCE SHEETS
(in thousands, except share and per share data)
December 31, | |||||||
2017 | 2016 | ||||||
Assets | |||||||
Current assets: | |||||||
Cash and cash equivalents | $ | 726,495 | $ | 401,238 | |||
Short-term investments | 1,052,803 | 498,124 | |||||
Accounts receivable, net | 434,895 | 322,757 | |||||
Current portion of deferred commissions | 118,690 | 76,780 | |||||
Prepaid expenses and other current assets | 77,681 | 43,636 | |||||
Total current assets | 2,410,564 | 1,342,535 | |||||
Deferred commissions, less current portion | 85,530 | 61,990 | |||||
Long-term investments | 391,442 | 262,658 | |||||
Property and equipment, net | 245,124 | 181,620 | |||||
Intangible assets, net | 86,916 | 65,854 | |||||
Goodwill | 128,728 | 82,534 | |||||
Other assets | 49,600 | 36,576 | |||||
Total assets | $ | 3,397,904 | $ | 2,033,767 | |||
Liabilities and Stockholders’ Equity | |||||||
Current liabilities: | |||||||
Accounts payable | $ | 32,109 | $ | 38,080 | |||
Accrued expenses and other current liabilities | 244,605 | 171,636 | |||||
Current portion of deferred revenue | 1,280,499 | 861,782 | |||||
Current portion of convertible senior notes, net | 543,418 | — | |||||
Total current liabilities | 2,100,631 | 1,071,498 | |||||
Deferred revenue, less current portion | 39,884 | 33,319 | |||||
Convertible senior notes, net | 630,018 | 507,812 | |||||
Other long-term liabilities | 43,239 | 34,177 | |||||
Total liabilities | 2,813,772 | 1,646,806 | |||||
Commitments and contingencies | |||||||
Stockholders’ equity: | |||||||
Preferred stock, $0.001 par value; 10,000,000 shares authorized; no shares issued or outstanding | — | — | |||||
Common stock $0.001 par value; 600,000,000 shares authorized; 174,275,864 and 167,430,773 shares issued and outstanding at December 31, 2017 and 2016, respectively | 174 | 167 | |||||
Additional paid-in capital | 1,731,367 | 1,405,317 | |||||
Accumulated other comprehensive loss | (889 | ) | (21,133 | ) | |||
Accumulated deficit | (1,146,520 | ) | (997,390 | ) | |||
Total stockholders’ equity | 584,132 | 386,961 | |||||
Total liabilities and stockholders’ equity | $ | 3,397,904 | $ | 2,033,767 | |||
See accompanying notes to consolidated financial statements
59
SERVICENOW, INC.
CONSOLIDATED STATEMENTS OF COMPREHENSIVE LOSS
(in thousands, except share and per share data)
Year Ended December 31, | |||||||||||
2017 | 2016 | 2015 | |||||||||
Revenues: | |||||||||||
Subscription | $ | 1,739,795 | $ | 1,221,639 | $ | 848,278 | |||||
Professional services and other | 193,231 | 168,874 | 157,202 | ||||||||
Total revenues | 1,933,026 | 1,390,513 | 1,005,480 | ||||||||
Cost of revenues (1): | |||||||||||
Subscription | 315,570 | 235,414 | 183,400 | ||||||||
Professional services and other | 184,202 | 163,268 | 146,013 | ||||||||
Total cost of revenues | 499,772 | 398,682 | 329,413 | ||||||||
Gross profit | 1,433,254 | 991,831 | 676,067 | ||||||||
Operating expenses (1): | |||||||||||
Sales and marketing | 946,617 | 700,464 | 498,439 | ||||||||
Research and development | 377,518 | 285,239 | 217,389 | ||||||||
General and administrative | 210,533 | 158,936 | 126,604 | ||||||||
Legal settlements | — | 270,000 | — | ||||||||
Total operating expenses | 1,534,668 | 1,414,639 | 842,432 | ||||||||
Loss from operations | (101,414 | ) | (422,808 | ) | (166,365 | ) | |||||
Interest expense | (53,394 | ) | (33,278 | ) | (31,097 | ) | |||||
Interest income and other income (expense), net | 5,804 | 6,035 | 4,450 | ||||||||
Loss before income taxes | (149,004 | ) | (450,051 | ) | (193,012 | ) | |||||
Provision for income taxes | 126 | 1,753 | 5,414 | ||||||||
Net loss | $ | (149,130 | ) | $ | (451,804 | ) | $ | (198,426 | ) | ||
Net loss per share - basic and diluted | $ | (0.87 | ) | $ | (2.75 | ) | $ | (1.27 | ) | ||
Weighted-average shares used to compute net loss per share - basic and diluted | 171,175,577 | 164,533,823 | 155,706,643 | ||||||||
Other comprehensive income (loss): | |||||||||||
Foreign currency translation adjustments | $ | 14,867 | $ | (4,839 | ) | $ | (3,177 | ) | |||
Unrealized gains (losses) on investments, net of tax | 5,377 | 588 | (1,592 | ) | |||||||
Other comprehensive income (loss) | 20,244 | (4,251 | ) | (4,769 | ) | ||||||
Comprehensive loss | $ | (128,886 | ) | $ | (456,055 | ) | $ | (203,195 | ) | ||
(1) | Includes stock-based compensation as follows: |
Year Ended December 31, | |||||||||||
2017 | 2016 | 2015 | |||||||||
Cost of revenues: | |||||||||||
Subscription | $ | 35,334 | $ | 28,420 | $ | 23,416 | |||||
Professional services and other | 27,475 | 26,442 | 23,265 | ||||||||
Sales and marketing | 170,527 | 131,571 | 102,349 | ||||||||
Research and development | 92,025 | 81,731 | 70,326 | ||||||||
General and administrative | 68,717 | 49,416 | 38,357 | ||||||||
See accompanying notes to consolidated financial statements
60
SERVICENOW, INC.
CONSOLIDATED STATEMENTS OF STOCKHOLDERS’ EQUITY
(in thousands, except share data)
Common Stock | Additional Paid-in Capital | Accumulated Deficit | Accumulated Other Comprehensive Loss | Total Stockholders’ Equity | ||||||||||||||||||
Shares | Amount | |||||||||||||||||||||
Balance at December 31, 2014 | 149,509,092 | $ | 150 | $ | 799,221 | $ | (358,583 | ) | $ | (12,113 | ) | $ | 428,675 | |||||||||
Common stock issued under employee stock plans | 11,276,672 | 10 | 93,338 | — | — | 93,348 | ||||||||||||||||
Tax benefit from employee stock plans | — | — | 2,663 | — | — | 2,663 | ||||||||||||||||
Taxes paid related to net share settlement of equity awards | — | — | (12,795 | ) | — | — | (12,795 | ) | ||||||||||||||
Vesting of early exercised stock options | — | — | 44 | — | — | 44 | ||||||||||||||||
Stock-based compensation | — | — | 258,074 | — | — | 258,074 | ||||||||||||||||
Other comprehensive loss, net | — | — | (4,769 | ) | (4,769 | ) | ||||||||||||||||
Net loss | — | (198,426 | ) | — | (198,426 | ) | ||||||||||||||||
Balance at December 31, 2015 | 160,785,764 | $ | 160 | $ | 1,140,545 | $ | (557,009 | ) | $ | (16,882 | ) | $ | 566,814 | |||||||||
Cumulative effect adjustment for ASU 2016-09 adoption | — | — | — | 11,423 | — | 11,423 | ||||||||||||||||
Common stock issued under employee stock plans | 6,645,009 | 7 | 66,361 | — | — | 66,368 | ||||||||||||||||
Taxes paid related to net share settlement of equity awards | — | — | (119,914 | ) | — | — | (119,914 | ) | ||||||||||||||
Stock-based compensation | — | — | 318,325 | — | — | 318,325 | ||||||||||||||||
Other comprehensive loss, net | — | — | — | — | (4,251 | ) | (4,251 | ) | ||||||||||||||
Net loss | — | — | — | (451,804 | ) | — | (451,804 | ) | ||||||||||||||
Balance at December 31, 2016 | 167,430,773 | $ | 167 | $ | 1,405,317 | $ | (997,390 | ) | $ | (21,133 | ) | $ | 386,961 | |||||||||
Common stock issued under employee stock plans | 7,385,897 | 7 | 82,552 | — | — | 82,559 | ||||||||||||||||
Repurchases and retirement of common stock | (540,806 | ) | — | (55,000 | ) | — | — | (55,000 | ) | |||||||||||||
Taxes paid related to net share settlement of equity awards | — | — | (182,127 | ) | — | — | (182,127 | ) | ||||||||||||||
Stock-based compensation | — | — | 394,680 | — | — | 394,680 | ||||||||||||||||
Equity component of the convertible notes, net | — | — | 159,891 | — | — | 159,891 | ||||||||||||||||
Purchase of convertible note hedge | — | — | (128,017 | ) | — | — | (128,017 | ) | ||||||||||||||
Issuance of warrants | — | — | 54,071 | — | — | 54,071 | ||||||||||||||||
Other comprehensive loss, net | — | — | — | — | 20,244 | 20,244 | ||||||||||||||||
Net loss | — | — | — | (149,130 | ) | — | (149,130 | ) | ||||||||||||||
Balance at December 31, 2017 | 174,275,864 | $ | 174 | $ | 1,731,367 | $ | (1,146,520 | ) | $ | (889 | ) | $ | 584,132 | |||||||||
See accompanying notes to consolidated financial statements
61
Year Ended December 31, | |||||||||||
2017 | 2016 | 2015 | |||||||||
Cash flows from operating activities: | |||||||||||
Net loss | $ | (149,130 | ) | $ | (451,804 | ) | $ | (198,426 | ) | ||
Adjustments to reconcile net loss to net cash provided by operating activities: | |||||||||||
Depreciation and amortization | 113,875 | 83,082 | 60,356 | ||||||||
Amortization of premiums on investments | 3,092 | 4,725 | 7,064 | ||||||||
Amortization of deferred commissions | 115,262 | 81,217 | 65,541 | ||||||||
Amortization of debt discount and issuance costs | 53,394 | 33,278 | 31,097 | ||||||||
Stock-based compensation | 394,078 | 317,580 | 257,713 | ||||||||
Deferred income tax | (9,078 | ) | (3,424 | ) | (1,282 | ) | |||||
Other | (3,997 | ) | (962 | ) | (6,223 | ) | |||||
Changes in operating assets and liabilities, net of effect of business combinations: | |||||||||||
Accounts receivable | (98,432 | ) | (125,106 | ) | (50,855 | ) | |||||
Deferred commissions | (174,503 | ) | (136,459 | ) | (80,142 | ) | |||||
Prepaid expenses and other assets | (46,138 | ) | (21,500 | ) | (10,961 | ) | |||||
Accounts payable | (5,504 | ) | (3,554 | ) | 14,785 | ||||||
Deferred revenue | 381,562 | 300,167 | 195,900 | ||||||||
Accrued expenses and other liabilities | 68,344 | 82,681 | 33,187 | ||||||||
Net cash provided by operating activities | 642,825 | 159,921 | 317,754 | ||||||||
Cash flows from investing activities: | |||||||||||
Purchases of property and equipment | (150,510 | ) | (105,562 | ) | (87,481 | ) | |||||
Business combinations, net of cash and restricted cash acquired | (58,203 | ) | (34,297 | ) | (1,100 | ) | |||||
Purchases of other intangibles | (6,670 | ) | (18,750 | ) | (1,750 | ) | |||||
Purchases of investments | (1,189,511 | ) | (518,664 | ) | (712,782 | ) | |||||
Purchases of strategic investments | (4,750 | ) | (500 | ) | (10,500 | ) | |||||
Sales of investments | 85,106 | 297,998 | 277,045 | ||||||||
Maturities of investments | 440,590 | 271,537 | 305,047 | ||||||||
Net cash used in investing activities(1) | (883,948 | ) | (108,238 | ) | (231,521 | ) | |||||
Cash flows from financing activities: | |||||||||||
Net proceeds from borrowings on convertible senior notes | 772,127 | — | — | ||||||||
Principal payments on convertible senior notes | (4 | ) | — | — | |||||||
Proceeds from issuance of warrants | 54,071 | — | — | ||||||||
Purchases of convertible note hedges | (128,017 | ) | — | — | |||||||
Repurchases and retirement of common stock | (55,000 | ) | — | — | |||||||
Proceeds from employee stock plans | 82,567 | 66,378 | 93,348 | ||||||||
Taxes paid related to net share settlement of equity awards | (181,938 | ) | (119,907 | ) | (12,795 | ) | |||||
Payments on financing obligations | (4,914 | ) | (2,223 | ) | (223 | ) | |||||
Net cash provided by (used in) financing activities | 538,892 | (55,752 | ) | 80,330 | |||||||
Foreign currency effect on cash, cash equivalents and restricted cash(1) | 28,128 | (6,785 | ) | (6,513 | ) | ||||||
Net increase (decrease) in cash, cash equivalents and restricted cash(1) | 325,897 | (10,854 | ) | 160,050 | |||||||
Cash, cash equivalents and restricted cash at beginning of period(1) | 401,932 | 412,786 | 252,736 | ||||||||
Cash, cash equivalents and restricted cash at end of period(1) | $ | 727,829 | $ | 401,932 | $ | 412,786 | |||||
Cash, cash equivalents and restricted cash at end of period: | |||||||||||
Cash and cash equivalents | $ | 726,495 | $ | 401,238 | $ | 412,305 | |||||
Current portion of restricted cash included in prepaid expenses and other current assets | 1,301 | 694 | 481 | ||||||||
Non-current portion of restricted cash included in other assets | 33 | — | — | ||||||||
Total cash, cash equivalents and restricted cash shown in the consolidated statement of cash flows | $ | 727,829 | $ | 401,932 | $ | 412,786 | |||||
Supplemental disclosures of other cash flow information: | |||||||||||
Income taxes paid, net of refunds | $ | 7,899 | $ | 4,338 | $ | 3,630 | |||||
Non-cash investing and financing activities: | |||||||||||
Property and equipment included in accounts payable and accrued expenses | $ | 15,007 | $ | 15,381 | $ | 14,427 | |||||
Intangible assets included in accrued expenses and other liabilities | $ | 6,750 | $ | — | $ | — | |||||
Financing obligations for purchases of other intangibles | $ | — | $ | 6,210 | $ | — | |||||
(1) | During the year ended December 31, 2017, we adopted Accounting Standards Update 2016-18, “Statement of Cash Flows (Topic 230): Restricted Cash,” which requires that amounts generally described as restricted cash or restricted cash equivalents be included with cash and cash equivalents when reconciling the beginning-of-period and end-of-period total amounts shown on the statement of cash flows. We have adopted changes to the consolidated statements of cash flows on a retrospective basis. The impact of the adoption for the years ended December 31, 2016 and 2015 is not material. |
See accompanying notes to consolidated financial statements
62
SERVICENOW, INC.
NOTES TO CONSOLIDATED FINANCIAL STATEMENTS
Unless the context requires otherwise, references in this report to “ServiceNow,” the “Company,”, “we,” “us,” and “our” refer to ServiceNow, Inc. and its consolidated subsidiaries.
(1) Description of the Business
ServiceNow is a leading provider of enterprise cloud computing solutions that define, structure, manage and automate services for global enterprises. We help our customers improve service quality and reduce costs while scaling and automating their businesses. We typically deliver our software via the Internet as a service, through an easy-to-use, consumer product-like interface, which means it can be easily configured and rapidly deployed. In a minority of cases, we deploy our software on-premises at a customer data center to support a customer's unique regulatory or security requirements.
(2) Summary of Significant Accounting Policies
Principles of Consolidation
The consolidated financial statements have been prepared in conformity with accounting principles generally accepted in the United States (U.S. GAAP), and include our accounts and the accounts of our wholly-owned subsidiaries. All intercompany transactions and balances have been eliminated upon consolidation.
Use of Estimates
The preparation of consolidated financial statements in conformity with U.S. GAAP requires management to make certain estimates and assumptions. These estimates and assumptions affect the reported amounts of assets and liabilities and disclosure of contingent assets and liabilities at the date of the consolidated financial statements, as well as reported amounts of revenues and expenses during the reporting period. Such management estimates and assumptions include, but are not limited to, the best estimate of selling price of the deliverables included in multiple elements revenue arrangements, the fair value of assets acquired and liabilities assumed for business combinations, stock-based compensation expenses, the assessment of the useful life and recoverability of our property and equipment, goodwill and identifiable intangible assets, and legal contingencies. Actual results could differ from those estimates.
Segments
We define the term “chief operating decision maker” to be our Chief Executive Officer. Our chief operating decision maker allocates resources and assesses financial performance based upon discrete financial information at the consolidated level. Accordingly, we have determined that we operate as a single operating and reportable segment.
Foreign Currency Translation and Transactions
The functional currencies for our foreign subsidiaries are primarily their local currencies. Assets and liabilities of the wholly-owned foreign subsidiaries are translated into U.S. Dollars at exchange rates in effect at each period end. Amounts classified in stockholders’ equity are translated at historical exchange rates. Revenues and expenses are translated at the average exchange rates during the period. The resulting translation adjustments are recorded in accumulated other comprehensive loss as a component of stockholders’ equity. Foreign currency transaction gains and losses are included in interest income and other income (expense), net within the consolidated statements of comprehensive loss, and have not been material for all periods presented.
Allocation of Overhead Costs
Overhead costs associated with office facilities, IT and certain depreciation related to infrastructure that is not dedicated for customer use or research and development use are allocated to cost of revenues and operating expenses based on headcount.
63
Revenue Recognition
We derive our revenues from two sources: (i) subscriptions and (ii) professional services and other. Subscription revenues are primarily comprised of subscription fees that give customers access to the ordered subscription service, related support and updates to the subscribed service during the subscription term. Our contracts typically do not give the customer the right to take possession of the software supporting the services. Professional services and other revenues consist of fees associated with services provided to customers for process design, implementation, configuration and optimization of our products. Professional services and other revenues also include customer training and registration and sponsorship fees for our annual Knowledge user conference and other user forums.
We commence revenue recognition when all of the following conditions are met:
•There is persuasive evidence of an arrangement;
•The service has been provided to the customer;
•The collection of related fees is reasonably assured; and
•The amount of fees to be paid by the customer is fixed or determinable.
Our arrangements are generally non-cancelable and do not contain refund-type provisions.
We recognize subscription revenues ratably over the contract term beginning on the commencement date of each contract, the date we make our services available to our customers. Once our services are available to customers, we record amounts due in accounts receivable and in deferred revenue. To the extent we bill customers in advance of the contract commencement date, the accounts receivable and corresponding deferred revenue amounts are netted to zero on our consolidated balance sheets, unless such amounts have been paid as of the balance sheet date.
Professional services revenues on our time-and materials arrangements are recognized as the services are delivered. Professional services revenues associated with fixed fee arrangements are recognized using a proportional performance model. In instances where certain milestones are required to be met before revenues are recognized, we defer professional services revenues and the associated costs until milestone criteria have been met.
We have multiple element arrangements comprised of subscription fees and professional services. To qualify as a separate unit of accounting, the delivered item must have value to the customer on a standalone basis. We have concluded that our subscription service and professional services, including implementation and configuration services, have standalone value.
The total arrangement consideration for a multiple element arrangement is allocated to the identifiable separate units of accounting based on a relative selling price hierarchy. We determined the relative selling price for a deliverable based on its vendor-specific objective evidence (VSOE) of selling price or third-party evidence (TPE) of selling price if VSOE does not exist. If neither VSOE nor TPE of selling price exists for a deliverable, the selling price is determined using the best estimate of selling price (BESP). We determine the BESP for each deliverable primarily by considering the historical selling price of these deliverables in similar transactions as well as other factors, including, but not limited to, market competition, review of stand-alone sales and current pricing practices. In determining the appropriate pricing structure, we consider the extent of competitive pricing of similar products and marketing analysis.
In limited circumstances, we grant certain customers the right to deploy our subscription service on the customers’ own servers. These arrangements are subject to software revenue recognition guidance since the customer deploys our software. As we never sell the non-software elements separately from the software elements, we have determined that we do not have sufficient VSOE of fair value for all undelivered non-software elements. Consequently, we defer all revenue and related costs under the arrangement until the last element in the transaction has been delivered or starts to be delivered. Once the delivery of the last element has commenced, we recognize the entire fee and related costs from the arrangement ratably over the remaining period of the arrangement.
Deferred revenue consists primarily of payments received in advance of revenue recognition for our subscriptions and professional services and other revenues and is recognized as the revenue recognition criteria are met.
64
Deferred Commissions
Deferred commissions are the incremental selling costs that are directly associated with our customer contracts and consist of sales commissions paid to our direct sales force and referral fees paid to independent third-parties. The majority of commissions and referral fees are deferred and amortized on a straight-line basis over the terms of the related customer contracts. We include amortization of deferred commissions in sales and marketing expense in the consolidated statements of comprehensive loss.
Fair Value Measurements
We apply fair value accounting for all financial assets and liabilities and non-financial assets and liabilities that are recognized in the financial statements on a non-recurring basis or disclosed at fair value in the financial statements on a recurring basis. Fair value is defined as the exchange price that would be received for an asset or paid to transfer a liability (an exit price) in the principal or most advantageous market for the asset or liability in an orderly transaction between market participants on the measurement date. We use a fair value hierarchy that is based on three levels of inputs, of which the first two are considered observable and the last unobservable. The three levels of the fair value hierarchy are as follows:
Level 1—Quoted prices (unadjusted) in active markets for identical assets or liabilities that we have the ability to access;
Level 2—Inputs other than Level 1 that are directly or indirectly observable, such as quoted prices for identical or similar assets and liabilities, quoted prices in markets that are not active, or other inputs that are observable or can be corroborated by observable market data for substantially the full term of the assets or liabilities, such as interest rates, yield curves and foreign currency spot rates; and
Level 3—Unobservable inputs that are supported by little or no market activity and that are significant to the fair value of the assets and liabilities.
Cash and Cash Equivalents
Cash and cash equivalents consist of highly liquid investments with original or remaining maturities of three months or less when purchased. Cash and cash equivalents are stated at fair value.
Investments
Investments consist of commercial paper, corporate notes and bonds, certificates of deposit and U.S. government and agency securities. We classify investments as available-for-sale at the time of purchase and reevaluate such classification as of each balance sheet date. All investments are recorded at estimated fair value. Unrealized gains and losses for available-for-sale securities are included in accumulated other comprehensive income (loss), a component of stockholders’ equity. We evaluate our investments to assess whether those with unrealized loss positions are other than temporarily impaired. We consider impairments to be other than temporary if they are related to deterioration in credit risk or if it is likely we will sell the securities before the recovery of their cost basis. Realized gains and losses and declines in value judged to be other than temporary are determined based on the specific identification method and are reported in interest income and other income (expense), net in the consolidated statements of comprehensive loss.
Strategic Investments
Our strategic investments consist of debt and non-marketable equity investments in privately-held companies. Debt investments in privately-held companies are classified as available-for-sale and are recorded at their estimated fair value with changes in fair value recorded through accumulated other comprehensive income (loss). We report our investments in non-marketable equity securities in privately-held companies, in which we do not have a controlling interest or significant influence, at cost or fair value when an event or circumstance indicates an other-than-temporary decline in value has occurred. We include these strategic investments in “Other assets” on the consolidated balance sheets.
Accounts Receivable
We record trade accounts receivable at the net invoice value and such receivables are non-interest bearing. We consider receivables past due based on the contractual payment terms. We review our exposure to accounts receivable and reserve for specific amounts if collectability is no longer reasonably assured.
65
Property and Equipment
Property and equipment, net, are stated at cost, subject to review of impairment, and depreciated using the straight-line method over the estimated useful lives of the assets as follows:
Building | 39 years | |
Computer equipment and software | 3—5 years | |
Furniture and fixtures | 3—7 years | |
Leasehold and other improvements | shorter of the lease term or estimated useful life | |
When assets are sold, or otherwise disposed of, the cost and related accumulated depreciation are removed from the accounts and any gain or loss is included in cost of revenues or operating expenses depending on whether the asset sold is being used in our provision of services to our customers. Repairs and maintenance expenses are charged to our statements of comprehensive loss as incurred.
Capitalized Software Development Costs
Software development costs for software to be sold, leased, or otherwise marketed are expensed as incurred until the establishment of technological feasibility, at which time those costs are capitalized until the product is available for general release to customers and amortized over the estimated life of the product. Technological feasibility is established upon the completion of a working prototype that has been certified as having no critical bugs and is a release candidate. To date, costs and time incurred between the establishment of technological feasibility and product release have not been significant, and all software development costs have been charged to research and development expense in our consolidated statements of comprehensive loss.
Costs incurred to develop our internal administration, finance and accounting systems are capitalized during the application development stage and generally amortized over the software’s estimated useful life of three to five years.
Leases
Leases are reviewed and classified as capital or operating at their inception. Some of our lease agreements contain rent escalation, rent holidays, lease incentives and renewal options. Rent escalation and rent holidays are included in the determination of rent expenses to be recorded over the lease term. Unless determined to be landlord assets, lease incentives to pay for our costs or assets are recognized as a reduction of rent expense on a straight-line basis over the term of the lease. Renewals are not assumed in the determination of the lease term unless they are deemed to be reasonably assured at the inception of the lease. We begin recognizing rent expense on the date that we obtain the legal right to use and control the leased space. The difference between rent payments and straight-line rent expense is recorded as deferred rent in the consolidated balance sheets. Deferred rent that will be recognized during the ensuing 12-month period is recorded as the current portion of deferred rent included in “Accrued expenses and other current liabilities” and the remainder is recorded as long term deferred rent included in “Other long-term liabilities”.
Goodwill, Intangible Assets and Other Long Lived Assets
Goodwill represents the excess of the purchase price in a business combination over the fair value of the net tangible and intangible assets acquired. We evaluate and test the recoverability of goodwill for impairment at least annually, during the fourth quarter, or more frequently if circumstances indicate that goodwill may not be recoverable. We perform the impairment testing by first assessing qualitative factors to determine whether the existence of events or circumstances leads to a determination that it is more likely than not that the fair value of its reporting unit is less than its carrying amount. If, after assessing the totality of events or circumstances, we determine it is more likely than not that the fair value of a reporting unit is less than its carrying amount, we perform a goodwill impairment test. To calculate any potential impairment, we compare the fair value of a reporting unit with its carrying amount, including goodwill. Any excess of the carrying amount of the reporting unit's goodwill over its fair value is recognized as an impairment loss, and the carrying value of goodwill is written down. For purposes of goodwill impairment testing, we have one reporting unit.
66
We periodically review the carrying amounts of long-lived assets, such as property and equipment, and purchased intangible assets for impairment whenever events or changes in circumstances indicate that the carrying amount of the assets may not be recoverable. We measure the recoverability of these assets by comparing the carrying amount of each asset to the future undiscounted cash flows we expect the asset to generate. If we consider any of these assets to be impaired, the impairment to be recognized equals the amount by which the carrying value of the asset exceeds its fair value. In addition, we periodically evaluate the estimated remaining useful lives of long-lived assets to determine whether events or changes in circumstances warrant a revision to the remaining period of depreciation or amortization. Our intangible assets are amortized over their useful lives ranging from 18 months to ten years.
Advertising Costs
Advertising costs, excluding costs related to our annual Knowledge user conference and other user forums, are expensed as incurred and are included in sales and marketing expense. These costs for the years ended December 31, 2017, 2016 and 2015 were $57.3 million, $42.1 million and $26.0 million, respectively. Costs related to our annual Knowledge user conference and other user forums are deferred and expensed when the respective events occur.
Legal Contingencies
From time to time, we are a party to litigation and other legal proceedings in the ordinary course of business. We accrue for loss contingencies when we can reasonably estimate the amount of loss or range of loss and when, based on the advice of counsel, it is probable that we will incur the loss. Because of uncertainties related to these matters, we base our estimate on the information available at the time of our assessment. As additional information becomes available, we reassess our potential liability and may revise our estimate.
Stock-based Compensation
We recognize compensation expense related to stock options and restricted stock units (RSUs) on a straight-line basis over the requisite service period, which is generally the vesting term of four years. For RSUs granted with a performance condition, the expenses are recognized on a graded vesting basis over the vesting period, after assessing the probability of achieving requisite performance criteria. This has the impact of greater stock-based compensation expense during the initial years of the vesting period as stock-based compensation cost is recognized over the requisite service period for each separately vesting tranche of the award as though the award were, in substance, multiple awards. We recognize compensation expense related to shares issued pursuant to the employee stock purchase plan (ESPP) on a straight-line basis over the offering period. We estimate the fair value of options using the Black-Scholes options pricing model and fair value of RSUs using the fair value of our common stock on the date of grant. We recognize compensation expense net of estimated forfeiture activity, which is based on historical forfeiture rates. In some instances, shares are issued on the vesting dates net of the minimum statutory tax withholding requirements to be paid by us on behalf of our employees. In these instances, we record the liability for withholding amounts to be paid by us as a reduction to additional paid-in capital when paid, and include these payments as a reduction of cash flows from financing activities.
Net Loss Per Share
Basic net loss per share attributable to common stockholders is computed by dividing net loss attributable to common stockholders by the weighted-average number of common shares outstanding during the period. Diluted net loss per share is computed by dividing net loss attributable to common stockholders by the weighted-average number of shares of common stock outstanding during the period, adjusted for the effects of dilutive common shares, which are comprised of outstanding common stock options, RSUs, ESPP obligations, convertible senior notes and warrants. The dilutive potential common shares are computed using the treasury stock method or the as-if converted method, as applicable. The effects of outstanding common stock options, RSUs, ESPP obligations, convertible senior notes and warrants are excluded from the computation of diluted net loss per common share in periods in which the effect would be antidilutive.
Concentration of Credit Risk and Significant Customers
Financial instruments potentially exposing us to credit risk consist primarily of cash, cash equivalents, investments and accounts receivable. We hold cash at financial institutions that management believes are high credit, quality financial institutions and invest in securities with a minimum rating of BBB by Standard & Poor's, Baa2 by Moody's, or BBB by Fitch. We are also exposed to credit risk under the convertible note hedge transactions that may result from counterparties' non-performance.
67
Credit risk arising from accounts receivable is mitigated due to our large number of customers and their dispersion across various industries and geographies. As of December 31, 2017 and 2016, there were no customers that represented more than 10% of our accounts receivable balance. There were no customers that individually exceeded 10% of our revenues in any of the periods presented. For purposes of assessing concentration of credit risk and significant customers, a group of customers under common control or customers that are affiliates of each other are regarded as a single customer.
We review the composition of the accounts receivable balance, historical write-off experience and the potential risk of loss associated with delinquent accounts to determine if an allowance for doubtful accounts is necessary. Individual accounts receivable are written off when we become aware of a specific customer’s inability to meet its financial obligation, and all collection efforts are exhausted. The following table presents the changes in the allowance for doubtful accounts (in thousands):
Balance at Beginning of Year | Additions (Deductions): Charged to Operations | Additions (Deductions): Charged to Deferred Revenue | Less: Write-offs | Balance at End of Year | ||||||||||||
Year ended December 31, 2017 | ||||||||||||||||
Allowance for doubtful accounts | $ | 2,323 | 1,688 | 194 | 1,090 | $ | 3,115 | |||||||||
Year ended December 31, 2016 | ||||||||||||||||
Allowance for doubtful accounts | $ | 1,179 | 2,219 | (391 | ) | 684 | $ | 2,323 | ||||||||
Year ended December 31, 2015 | ||||||||||||||||
Allowance for doubtful accounts | $ | 809 | 841 | (70 | ) | 401 | $ | 1,179 | ||||||||
Warranties and Indemnification
Our cloud computing solutions are typically warranted to perform in material conformance with their specifications.
We include service level commitments to our customers that permit those customers to receive credits in the event we fail to meet those service levels. We establish an accrual based on an evaluation of the known service disruptions. Service level credit accrual charges are recorded against revenue and were not material for all periods presented.
We have also agreed to indemnify our directors, executive officers and certain other officers for costs associated with any fees, expenses, judgments, fines and settlement amounts incurred by any of these persons in any action or proceeding to which any of those persons is, or is threatened to be, made a party by reason of the person’s service as a director or officer, including any action by us, arising out of that person’s services as a director or officer of our company or that person’s services provided to any other company or enterprise at our request. We maintain director and officer insurance coverage that may enable us to recover a portion of any future amounts paid. The fair values of these obligations are not material as of each balance sheet date.
Our agreements include provisions indemnifying customers against intellectual property and other third-party claims. We have not incurred any costs as a result of such indemnification obligations and have not recorded any liabilities related to such obligations in the consolidated financial statements.
Income Taxes
We use the asset and liability method of accounting for income taxes, in which deferred tax assets and liabilities are recognized for the future tax consequences attributable to differences between the consolidated financial statement carrying amounts of existing assets and liabilities and their respective tax bases. We measure deferred tax assets and liabilities using enacted tax rates expected to apply to taxable income in the years in which those temporary differences are expected to be reversed. We recognize the effect on deferred tax assets and liabilities of a change in tax rates within the provision for income taxes as income and expense in the period that includes the enactment date. A valuation allowance is established if it is more likely than not that all or a portion of the deferred tax asset will not be realized. In determining the need for a valuation allowance, we consider future growth, forecasted earnings, future taxable income, the mix of earnings in the jurisdictions in which we operate, historical earnings, taxable income in prior years, if carryback is permitted under the law, carryforward periods and prudent and feasible tax planning strategies.
68
Our tax positions are subject to income tax audits by multiple tax jurisdictions throughout the world. We recognize the tax benefit of an uncertain tax position only if it is more likely than not the position is sustainable upon examination by the taxing authority, based on the technical merits. We measure the tax benefit recognized as the largest amount of benefit which is more likely than not to be realized upon settlement with the taxing authority. We recognize interest accrued and penalties related to unrecognized tax benefits in our tax provision.
We calculate the current and deferred income tax provision based on estimates and assumptions that could differ from the actual results reflected in income tax returns filed in subsequent years and record adjustments based on filed income tax returns when identified. The amount of income taxes paid is subject to examination by U.S. federal, state and foreign tax authorities. The estimate of the potential outcome of any uncertain tax issue is subject to management’s assessment of relevant risks, facts and circumstances existing at that time. To the extent the assessment of such tax position changes, we record the change in estimate in the period in which we make the determination.
New Accounting Pronouncements Adopted in 2017
In May 2017, the Financial Accounting Standards Board (FASB) issued Accounting Standards Update (ASU) 2017-09, “Compensation-Stock Compensation (Topic 718): Scope of Modification Accounting,” which provides guidance about which changes to the terms or conditions of a share-based payment award require an entity to apply modification accounting in Topic 718. This new standard is effective for our interim and annual periods beginning January 1, 2018, and early adoption is permitted. We early adopted this new guidance effective October 1, 2017 and the adoption did not have a material impact on our consolidated financial statements.
In March 2017, the FASB issued ASU 2017-08, “Receivables-Nonrefundable Fees and Other Costs (Subtopic 310-20)-Premium Amortization on Purchased Callable Debt Securities,” which shortens the amortization period for certain callable debt securities held at a premium to require such premiums to be amortized to the earliest call date unless applicable guidance related to certain pools of securities is applied to consider estimated prepayments. This new standard is effective for our interim and annual periods beginning January 1, 2019, and early adoption is permitted. We early adopted this new guidance effective October 1, 2017 and the adoption did not have a material impact on our consolidated financial statements.
In January 2017, the FASB issued ASU 2017-04, “Intangibles-Goodwill and Other (Topic 350): Simplifying the Test for Goodwill Impairment,” which eliminates Step 2 from the goodwill impairment test. This standard requires an entity to perform its annual, or interim, goodwill impairment test by comparing the fair value of a reporting unit with its carrying amount. An entity should recognize an impairment charge for the amount by which the carrying amount exceeds the reporting unit’s fair value. In addition, this new standard eliminates the requirements for any reporting unit with a zero or negative carrying amount to perform a qualitative assessment. This new standard is effective for our interim and annual periods beginning January 1, 2020, and early adoption is permitted. We early adopted this new guidance effective October 1, 2017, and performed our annual impairment assessment in the fourth quarter of 2017 under this new guidance. The adoption of this new guidance did not have a material impact on our consolidated financial statements.
In January 2017, the FASB issued ASU 2017-01, “Business Combinations (Topic 805): Clarifying the Definition of a Business,” which clarifies the definition of a business with the objective of adding guidance to assist entities with evaluating whether transactions should be accounted for as acquisitions (or disposals) of assets or businesses. This new standard is required to be applied on a prospective basis, effective for our interim and annual periods beginning January 1, 2018, and early adoption is permitted. We early adopted this new guidance effective October 1, 2017 and the adoption did not have a material impact on our consolidated financial statements.
In November 2016, the FASB issued ASU 2016-18, “Statement of Cash Flows (Topic 230): Restricted Cash (a consensus of the FASB Emerging Issues Task Force),” which requires that amounts generally described as restricted cash or restricted cash equivalents be included with cash and cash equivalents when reconciling the beginning-of-period and end-of-period total amounts shown on the statement of cash flows. This new standard is effective for our interim and annual periods beginning January 1, 2018, and early adoption is permitted. We early adopted ASU 2016-18 effective October 1, 2017 and have reclassified our consolidated statements of cash flow for each of the periods presented. The adoption did not have a material impact to our statements of cash flows.
69
In August 2016, the FASB issued ASU 2016-15, “Statement of Cash Flows (Topic 230): Classification of Certain Cash Receipts and Cash Payments,” which provides guidance on eight specific cash flow issues. Among these issues, this standard requires, at the settlement of zero-coupon debt instruments or other debt instruments with coupon interest rates that are insignificant in relation to the effective interest rate of the borrowings, the portion of the cash payment attributable to the accreted interest related to the debt discount to be classified as cash flows for operating activities, and the portion of the cash payments attributable to the principal to be classified as cash outflows for financing activities. This new standard is effective for our interim and annual periods beginning January 1, 2018, and early adoption is permitted. We early adopted ASU 2016-15 effective October 1, 2017 and applied this new standard in the cash flow presentation for the settlement of early conversion requests received for our 0% convertible senior notes due November 1, 2018 (2018 Notes). We currently expect to settle the remaining principal amount of our 2018 Notes in cash upon maturity. At that time, we expect to classify approximately $155.3 million of debt discount attributable to the difference between the 0% coupon interest rate and the 6.5% effective interest rate as an operating cash outflow in our consolidated statements of cash flows. The remaining $419.7 million will be presented as a financing cash outflow in our consolidated statements of cash flows.
New Accounting Pronouncements Pending Adoption
In January 2018, the FASB released guidance on the accounting for tax on the global intangible low-taxed income (GILTI) provisions of the Tax Cuts and Jobs Act. The GILTI provisions impose a tax on foreign income in excess of a deemed return on tangible assets of foreign corporations. We are currently evaluating the impact of the adoption of this standard on our consolidated financial statements and have not yet made a provisional estimate as we have not yet completed our assessment or elected an accounting policy to either recognize deferred taxes for basis differences expected to reverse as GILTI or to record GILTI as period costs if and when incurred.
In October 2016, the FASB issued ASU 2016-16, “Income Taxes (Topic 740): Intra-Entity Transfers of Assets Other Than Inventory,” which includes a revision of the accounting for the income tax consequences of intra-entity transfers of assets other than inventory to reduce the complexity in accounting standards. This new standard is effective for our interim and annual periods beginning January 1, 2018, and early adoption is permitted. The new standard is required to be applied on a modified retrospective basis through a cumulative effect adjustment directly to retained earnings as of the beginning of the period of adoption. The impact upon the adoption of this standard on our consolidated financial statements will not be material.
In June 2016, the FASB issued ASU 2016-13, “Financial Instruments-Credit Losses (Topic 326): Measurement of Credit Losses on Financial Instruments,” which requires a financial asset measured at amortized cost basis to be presented at the net amount expected to be collected. Credit losses relating to available-for-sale debt securities should be recorded through an allowance for credit losses. This new standard is effective for our interim and annual periods beginning January 1, 2020. We are currently evaluating the impact of the adoption of this standard on our consolidated financial statements.
In February 2016, the FASB issued ASU 2016-02, “Leases (Topic 842),” which requires lessees to generally recognize on the balance sheet operating and financing lease liabilities and corresponding right-of-use assets, and to recognize on the income statement the expenses in a manner similar to current practice. This new standard, including related amendments recently issued by the FASB, is effective for our interim and annual periods beginning January 1, 2019, and early adoption is permitted. While we are currently evaluating the impact of the adoption of this standard on our consolidated financial statements, we currently anticipate that the adoption of this standard will have a material impact on our consolidated balance sheets given that we had operating lease commitments in excess of $300 million as of December 31, 2017. However, we do not anticipate that the adoption of this standard will have a material impact on our consolidated statements of comprehensive loss because the expense recognition under this new standard will be similar to current practice.
In January 2016, the FASB issued ASU 2016-01, “Financial Instruments-Overall (Subtopic 825-10): Recognition and Measurement of Financial Assets and Financial Liabilities,” which addresses certain aspects of recognition, measurement, presentation, and disclosure of financial instruments, and requires equity securities to be measured at fair value with changes in fair value recognized through net income, which results in greater variability in our net income. This new standard allows a measurement alternative for equity investments that do not have readily determinable fair values to be measured at cost, less any impairment, plus or minus adjustments resulting from observable price changes in orderly transactions for the identical or a similar investment of the same issuer. This new standard is effective for our interim and annual periods beginning January 1, 2018, and will be adopted by means of a cumulative-effect adjustment to the balance sheet as of the beginning of the fiscal year of adoption, with prospective adoption of the amendments related to equity securities without readily determinable fair values existing as of the date of adoption. We expect the adoption of this standard to impact our strategic investments and our marketable equity securities, and plan to elect the measurement alternative for equity investments that do not have readily determinable fair values. We expect to reclassify $10.7 million of unrealized gains on our marketable equity securities as of December 31, 2017 to the accumulated deficit on our consolidated balance sheet effective January 1, 2018.
70
Revenue from Contracts with Customers
In May 2014, the FASB issued ASU 2014-09, “Revenue from Contracts with Customers (Topic 606).” Topic 606 supersedes the prior revenue recognition standard (Topic 605). Under the Topic 606 standard, revenue is recognized when a customer obtains control of promised goods or services and is recognized in an amount that reflects the consideration which the entity expects to receive in exchange for those goods or services. In addition, this standard requires disclosure of the nature, amount, timing, and uncertainty of revenue and cash flows arising from contracts with customers. Topic 606 also includes Subtopic 340-40, Other Assets and Deferred Costs - Contracts with Customers, which requires the deferral of incremental costs of obtaining a contract with a customer.
The Topic 606 guidance permits two methods of adoption: retrospectively to each prior reporting period presented (full retrospective method) or retrospectively with the cumulative effect of initially applying the guidance recognized at the date of initial application (modified retrospective method). We will adopt the standard using the full retrospective method to restate each prior reporting period presented.
In preparation for adoption of the standard on January 1, 2018, we have implemented internal controls and key system functionality to enable the preparation of financial information and have reached conclusions on key accounting assessments related to the standard. The most significant impacts of the standard relate to the timing of revenue recognition related to our on-premises offerings, in which we grant customers the right to deploy our software on the customer’s own servers without significant penalty, the accounting for incremental costs to obtain a contract and the classification of proceeds for Knowledge and other user forums as a reduction in sales and marketing expenses instead of professional services and other revenues.
Under the Topic 606 standard, for our on-premises offerings, the requirement to have vendor specific objective evidence (VSOE) for undelivered elements is eliminated. As a result, we will recognize as subscription revenues a portion of the sales price upon delivery of the software, compared to the current practice of recognizing the entire sales price ratably over an estimated subscription period due to the lack of VSOE. To the extent the amounts recognized as subscription revenues have not been billed, the revenue will be recorded as “unbilled receivables” and reported under “prepaid expenses and other current assets” for short-term unbilled receivables and “other assets” for long-term unbilled receivables on our consolidated balance sheets. In addition, refundable amounts associated with customer contracts will be recorded as “customer deposits” and presented under “accrued expenses and other current liabilities” on our consolidated balance sheets.
In addition, we expect the Topic 606 standard to change the way we account for commissions paid on both our on-premises offerings and our cloud-based subscription offerings. Our current practice is to defer only direct and incremental commission costs to obtain a contract and amortize those costs over the contract term, which is generally 12 to 36 months, for both our on-premises offerings and our cloud-based subscription offerings. Under Topic 606, we will defer all incremental commission costs to obtain customer contracts, including indirect costs that are not tied to a specific contract, for both our on-premises offerings and our cloud-based subscription offerings. On initial contracts, only the portion equivalent to a renewal commission will be amortized over the contract term, while the portion incremental to a renewal commission will primarily be amortized over a period of benefit that we have determined to be approximately five years. On renewal contracts, these costs will be amortized over the renewal term. Additionally, for our on-premises offerings, consistent with the recognition of subscription revenue for on-premises offerings as described above, a portion of the commission cost will be expensed upfront when the on-premises offering is made available.
The direct effect on income taxes resulting from the above-mentioned changes to revenues and commission expenses would result in additional income tax expense being recorded in each of the prior reporting periods that have been restated. The indirect effect of Topic 606 on income taxes associated with intercompany adjustments will be recorded in the first quarter of 2018.
Impact on statements of operations
The table below provides specified line items from our consolidated statements of operations on (i) an actual basis and (ii) as adjusted to reflect the impact that the adoption of Topic 606 would have had on such line items if such adoption had been effective for the applicable periods (in thousands, except share and per share data):
71
Year Ended December 31, | |||||||||||||||
2017 | 2016 | ||||||||||||||
As Reported | As Adjusted | As Reported | As Adjusted | ||||||||||||
Revenues: | |||||||||||||||
Subscription and software | $ | 1,739,795 | $ | 1,739,500 | $ | 1,221,639 | $ | 1,234,070 | |||||||
Professional services and other | 193,231 | 178,994 | 168,874 | 156,915 | |||||||||||
Total revenues | 1,933,026 | 1,918,494 | 1,390,513 | 1,390,985 | |||||||||||
Cost of revenues: | |||||||||||||||
Professional services and other | 184,202 | 184,292 | 163,268 | 163,581 | |||||||||||
Total cost of revenues | 499,772 | 499,862 | 398,682 | 398,995 | |||||||||||
Gross profit | 1,433,254 | 1,418,632 | 991,831 | 991,990 | |||||||||||
Operating expenses: | |||||||||||||||
Sales and marketing | 946,617 | 894,977 | 700,464 | 659,983 | |||||||||||
Total operating expenses | 1,534,668 | 1,483,028 | 1,414,639 | 1,374,158 | |||||||||||
Loss from operations | (101,414 | ) | (64,396 | ) | (422,808 | ) | (382,168 | ) | |||||||
Interest income and other income (expense), net | 5,804 | 4,384 | 6,035 | 5,027 | |||||||||||
Loss before income taxes | (149,004 | ) | (113,406 | ) | (450,051 | ) | (410,419 | ) | |||||||
Provision for income taxes | 126 | 3,440 | 1,753 | 3,830 | |||||||||||
Net loss | $ | (149,130 | ) | $ | (116,846 | ) | $ | (451,804 | ) | $ | (414,249 | ) | |||
Net loss per share - basic and diluted | $ | (0.87 | ) | $ | (0.68 | ) | $ | (2.75 | ) | $ | (2.52 | ) | |||
Weighted-average shares used to compute net loss per share - basic and diluted | 171,175,577 | 171,175,577 | 164,533,823 | 164,533,823 | |||||||||||
Impact on balance sheets
The table below provides specified line items from our consolidated balance sheets on (i) an actual basis and (ii) as adjusted to reflect the impact that the adoption of Topic 606 would have had on such line items if such adoption had been effective as of the applicable date (in thousands):
Year Ended December 31, 2017 | |||||||
As Reported | As Adjusted | ||||||
Assets | |||||||
Accounts receivable, net | $ | 434,895 | $ | 437,051 | |||
Current portion of deferred commissions | 118,690 | 109,643 | |||||
Prepaid expenses and other current assets | 77,681 | 95,959 | |||||
Deferred commissions, less current portion | 85,530 | 224,252 | |||||
Other assets | 49,600 | 51,832 | |||||
Liabilities | |||||||
Accrued expenses and other current liabilities | 244,605 | 253,257 | |||||
Current portion of deferred revenue | 1,280,499 | 1,210,695 | |||||
Deferred revenue, less current portion | 39,884 | 36,120 | |||||
Other long-term liabilities | 43,239 | 65,884 | |||||
Stockholder's equity | |||||||
Accumulated other comprehensive (loss) income | (889 | ) | 5,767 | ||||
Accumulated deficit | (1,146,520 | ) | (958,564 | ) | |||
72
Impact on statements of cash flows
While there will be material changes within individual line items included as part of cash provided by (used in) operating activities, we do not expect the adoption of the Topic 606 standard to have a material impact on net cash provided by (used in) operating, financing, or investing activities in our consolidated cash flows statements.
Impact on footnote disclosures
In future periods, Topic 606 will also require us to disclose in the notes to our consolidated financial statements the amount and timing of revenues expected to be recognized from remaining performance obligations under customer contracts.
(3) Investments
Marketable Securities
The following is a summary of our available-for-sale investment securities, excluding those securities classified within cash and cash equivalents on the consolidated balance sheets (in thousands):
December 31, 2017 | |||||||||||||||
Amortized Cost | Gross Unrealized Gains | Gross Unrealized Losses | Estimated Fair Value | ||||||||||||
Available-for-sale securities: | |||||||||||||||
Commercial paper | $ | 258,348 | $ | 1 | $ | (5 | ) | $ | 258,344 | ||||||
Corporate notes and bonds | 1,006,302 | 26 | (3,084 | ) | 1,003,244 | ||||||||||
Certificates of deposit | 33,084 | — | — | 33,084 | |||||||||||
U.S. government agency securities | 129,494 | — | (638 | ) | 128,856 | ||||||||||
Marketable equity securities | 10,000 | 10,717 | — | 20,717 | |||||||||||
Total available-for-sale securities | $ | 1,437,228 | $ | 10,744 | $ | (3,727 | ) | $ | 1,444,245 | ||||||
December 31, 2016 | |||||||||||||||
Amortized Cost | Gross Unrealized Gains | Gross Unrealized Losses | Estimated Fair Value | ||||||||||||
Available-for-sale securities: | |||||||||||||||
Commercial paper | $ | 56,839 | $ | — | $ | — | $ | 56,839 | |||||||
Corporate notes and bonds | 628,054 | 91 | (1,590 | ) | 626,555 | ||||||||||
Certificates of deposit | 35,355 | — | — | 35,355 | |||||||||||
U.S. government agency securities | 42,088 | 7 | (62 | ) | 42,033 | ||||||||||
Total available-for-sale securities | $ | 762,336 | $ | 98 | $ | (1,652 | ) | $ | 760,782 | ||||||
As of December 31, 2017, the contractual maturities of our investment securities, excluding marketable equity securities and those securities classified within cash and cash equivalents on the consolidated balance sheets, did not exceed 24 months. The fair values of available-for-sale investment securities, by remaining contractual maturity, are as follows (in thousands):
December 31, 2017 | |||
Due in one year or less | $ | 1,032,086 | |
Due in one year through two years | 391,442 | ||
Total | $ | 1,423,528 | |
73
The following table shows the fair values and the gross unrealized losses of these securities, classified by the length of time that the securities have been in a continuous unrealized loss position, and aggregated by investment types, excluding those securities classified within cash and cash equivalents on the consolidated balance sheets (in thousands):
December 31, 2017 | |||||||||||||||||||||||
Less than 12 Months | 12 Months or Greater | Total | |||||||||||||||||||||
Fair Value | Gross Unrealized Losses | Fair Value | Gross Unrealized Losses | Fair Value | Gross Unrealized Losses | ||||||||||||||||||
Commercial paper | $ | 14,809 | $ | (5 | ) | $ | — | $ | — | $ | 14,809 | $ | (5 | ) | |||||||||
Corporate notes and bonds | 819,113 | (2,703 | ) | 141,874 | (381 | ) | 960,987 | (3,084 | ) | ||||||||||||||
U.S. government agency securities | 106,301 | (593 | ) | 22,555 | (45 | ) | 128,856 | (638 | ) | ||||||||||||||
Total | $ | 940,223 | $ | (3,301 | ) | $ | 164,429 | $ | (426 | ) | $ | 1,104,652 | $ | (3,727 | ) | ||||||||
December 31, 2016 | |||||||||||||||||||||||
Less than 12 Months | 12 Months or Greater | Total | |||||||||||||||||||||
Fair Value | Gross Unrealized Losses | Fair Value | Gross Unrealized Losses | Fair Value | Gross Unrealized Losses | ||||||||||||||||||
Corporate notes and bonds | $ | 492,503 | $ | (1,530 | ) | $ | 47,940 | $ | (60 | ) | $ | 540,443 | $ | (1,590 | ) | ||||||||
U.S. government agency securities | 30,033 | (62 | ) | — | — | 30,033 | (62 | ) | |||||||||||||||
Total | $ | 522,536 | $ | (1,592 | ) | $ | 47,940 | $ | (60 | ) | $ | 570,476 | $ | (1,652 | ) | ||||||||
As of December 31, 2017, we had a total of 405 available-for-sale securities, excluding those securities classified within cash and cash equivalents on the consolidated balance sheet in an unrealized loss position. There were no impairments considered “other-than-temporary” as it is more likely than not we will hold the securities until maturity or a recovery of the cost basis.
Strategic Investments
As of December 31, 2017 and 2016, the total amount of debt and equity investments in privately-held companies included in other assets on our consolidated balance sheets was $5.8 million and $11.0 million, respectively. During the year ended December 31, 2017, we reclassified $10.0 million of non-marketable equity securities (at cost) to short-term investments on our consolidated balance sheets due to an initial public offering by the investee, and recorded an unrealized gain of $10.7 million within other comprehensive income (loss) in our consolidated statements of comprehensive loss. We also acquired an additional $4.8 million in strategic investments during the year ended December 31, 2017. The fair value of our debt investments in privately-held companies included within our strategic investments is $1.5 million and $0.5 million as of December 31, 2017 and 2016, respectively. These investments are recorded at fair value using significant unobservable inputs or data in an inactive market and the valuation requires our judgment due to the absence of quoted prices in active markets and inherent lack of liquidity and are categorized accordingly as Level 3 in the fair value hierarchy. We have not recorded any impairment charges for any of our investments in privately-held companies.
74
(4) Fair Value Measurements
The following table presents our fair value hierarchy for our assets measured at fair value on a recurring basis as of December 31, 2017 (in thousands):
Level 1 | Level 2 | Total | |||||||||
Cash equivalents: | |||||||||||
Money market funds | $ | 282,507 | $ | — | $ | 282,507 | |||||
Commercial paper | — | 100,456 | 100,456 | ||||||||
Corporate notes and bonds | — | 50,437 | 50,437 | ||||||||
Short-term investments: | |||||||||||
Commercial paper | — | 258,344 | 258,344 | ||||||||
Corporate notes and bonds | — | 688,316 | 688,316 | ||||||||
Certificates of deposit | — | 17,950 | 17,950 | ||||||||
U.S. government agency securities | — | 67,476 | 67,476 | ||||||||
Marketable equity securities | 20,717 | — | 20,717 | ||||||||
Long-term investments: | |||||||||||
Corporate notes and bonds | — | 314,928 | 314,928 | ||||||||
Certificates of deposit | — | 15,134 | 15,134 | ||||||||
U.S. government agency securities | — | 61,380 | 61,380 | ||||||||
Total | $ | 303,224 | $ | 1,574,421 | $ | 1,877,645 | |||||
The following table presents our fair value hierarchy for our assets measured at fair value on a recurring basis as of December 31, 2016 (in thousands):
Level 1 | Level 2 | Total | |||||||||
Cash equivalents: | |||||||||||
Money market funds | $ | 165,627 | $ | — | $ | 165,627 | |||||
Short-term investments: | |||||||||||
Commercial paper | — | 56,839 | 56,839 | ||||||||
Corporate notes and bonds | — | 388,429 | 388,429 | ||||||||
Certificates of deposit | — | 35,355 | 35,355 | ||||||||
U.S. government agency securities | — | 17,501 | 17,501 | ||||||||
Long-term investments: | |||||||||||
Corporate notes and bonds | — | 238,125 | 238,125 | ||||||||
U.S. government agency securities | — | 24,533 | 24,533 | ||||||||
Total | $ | 165,627 | $ | 760,782 | $ | 926,409 | |||||
We determine the fair value of our security holdings based on pricing from our service provider and market prices from industry-standard independent data providers. Such market prices may be quoted prices in active markets for identical assets (Level 1 inputs) or pricing determined using inputs other than quoted prices that are observable either directly or indirectly (Level 2 inputs), such as yield curve, volatility factors, credit spreads, default rates, loss severity, current market and contractual prices for the underlying instruments or debt, broker and dealer quotes, as well as other relevant economic measures.
See Note 3 for the fair value measurement of our debt investments in privately-held companies and Note 9 for the fair value measurement of our convertible senior notes, which are not included in the table above.
(5) Business Combinations
2017 Business Combinations
SkyGiraffe
On October 31, 2017, we completed the acquisition of a privately-held company, SkyGiraffe Ltd. (SkyGiraffe), by acquiring all issued and outstanding common shares of SkyGiraffe for approximately $32.3 million in an all-cash transaction to enhance the consumer product-like mobile experience of our solutions.
The following table summarizes the allocation of the purchase price to the fair value of the tangible and intangible assets acquired and liabilities assumed as of the acquisition date:
Purchase Price Allocation (in thousands) | Useful Life (in years) | ||||
Net tangible assets acquired | $ | 675 | |||
Intangible assets: | |||||
Developed technology | 15,600 | 5 | |||
Goodwill | 19,386 | ||||
Net deferred tax liabilities (1) | (3,341 | ) | |||
Total purchase price | $ | 32,320 | |||
(1) | Deferred tax liabilities, net primarily relates to purchased identifiable intangible assets and is shown net of deferred tax assets. |
DxContinuum
On January 20, 2017, we completed the acquisition of a privately-held company, DxContinuum, Inc. (DxContinuum), by acquiring all issued and outstanding common shares of DxContinuum for approximately $15.0 million in an all-cash transaction to enhance the predictive capabilities of our solutions.
The following table summarizes the allocation of the purchase price to the fair value of the tangible and intangible assets acquired and liabilities assumed as of the acquisition date:
Purchase Price Allocation (in thousands) | Useful Life (in years) | ||||
Net tangible assets acquired | $ | 37 | |||
Intangible assets: | |||||
Developed technology | 6,400 | 5 | |||
Goodwill | 11,159 | ||||
Net deferred tax liabilities (1) | (2,561 | ) | |||
Total purchase price | $ | 15,035 | |||
(1) | Deferred tax liabilities, net primarily relates to purchased identifiable intangible assets and is shown net of deferred tax assets. |
Other 2017 Business Combinations
We also completed the acquisitions of Qlue, Inc. and Digital Telepathy, Inc. (Telepathy) during the year ended December 31, 2017 for approximately $11.6 million in cash, and have included the results of operations of these companies in our consolidated financial statements from their respective dates of purchase. In allocating the aggregate purchase price based on the estimated fair value, we recorded $9.1 million of goodwill, $3.5 million of developed technology intangible assets (to be amortized over estimated useful life of five years) and $1.1 million of deferred tax liabilities. Amounts allocated to the remaining acquired tangible assets and assumed liabilities were not material. $4.1 million of the goodwill balance associated with these business combinations is deductible for income tax purposes. We are obligated to make cash payments of up to $5.0 million in connection with the acquisition of Telepathy, contingent upon the continued employment by us of certain former employees on specified future dates. We determined that this additional consideration was not part of the purchase price and will be recognized as post-acquisition expense over the related requisite service period.
76
For all of our 2017 business combinations, the excess of purchase consideration over the fair value of net tangible and identifiable intangible assets acquired was recorded as goodwill. We believe the goodwill resulting from these business combinations represents the synergies expected from expanded market opportunities when integrating the acquired technologies with our offerings. Aggregate acquisition-related costs associated with our 2017 business combinations of $2.4 million for the year ended December 31, 2017 are included in general and administrative expenses in our consolidated statement of comprehensive loss.
2016 Business Combinations
BrightPoint Security
On June 3, 2016, we completed the acquisition of a privately-held company, BrightPoint Security, Inc. (BrightPoint), by acquiring all issued and outstanding common shares of BrightPoint for approximately $19.6 million in an all-cash transaction to expand our security operations solutions. The following table summarizes the allocation of the purchase price to the fair value of the tangible and intangible assets acquired and liabilities assumed as of the acquisition date:
Purchase Price Allocation (in thousands) | Useful Life (in years) | ||||
Intangible assets: | |||||
Developed technology | $ | 8,100 | 6 | ||
Customer contracts and related relationships | 500 | 1.5 | |||
Goodwill | 15,258 | ||||
Net tangible liabilities acquired | (1,339 | ) | |||
Net deferred tax liabilities (1) | (2,890 | ) | |||
Total purchase price | $ | 19,629 | |||
(1) | Deferred tax liabilities, net primarily relates to purchased identifiable intangible assets and is shown net of deferred tax assets. |
ITapp
On April 8, 2016, we completed the acquisition of a privately-held company, ITapp Inc. (ITapp), by acquiring all issued and outstanding common shares of ITapp for approximately $14.5 million in an all-cash transaction to expand our IT Operations Management solutions. The following table summarizes the allocation of the purchase price to the fair value of the tangible and intangible assets acquired and liabilities assumed as of the acquisition date:
Purchase Price Allocation (in thousands) | Useful Life (in years) | ||||
Net tangible assets acquired | $ | 140 | |||
Intangible assets: | |||||
Developed technology | 4,700 | 5 | |||
Customer contracts and related relationships | 200 | 1.5 | |||
Goodwill | 11,437 | ||||
Net deferred tax liabilities (1) | (2,015 | ) | |||
Total purchase price | $ | 14,462 | |||
(1) | Deferred tax liabilities, net primarily relates to purchased identifiable intangible assets and is shown net of deferred tax assets. |
For both of our 2016 business combinations, the excess of purchase consideration over the fair value of net tangible and identifiable intangible assets acquired was recorded as goodwill. We believe the goodwill represents the synergies expected from expanded market opportunities when integrating the acquired technologies with our offerings. The goodwill balance for both business combinations is not deductible for income tax purposes. Acquisition-related costs of $1.0 million are included in general and administrative expenses in our consolidated statements of comprehensive loss.
77
Unaudited Pro Forma Financial Information
The results of operations of our 2017 and 2016 business combinations have been included in our consolidated financial statements from their respective dates of purchase. The following pro forma consolidated financial information combines the results of operations from us and all the companies that we acquired since January 1, 2016 for the years ended December 31, 2017 and 2016, as if these acquisitions had occurred on January 1, 2016 (in thousands, except share and per share data):
Year Ended December 31, | |||||||
2017 | 2016 | ||||||
(Unaudited) | |||||||
Revenue | $ | 1,937,374 | $ | 1,397,600 | |||
Net loss | $ | (153,218 | ) | $ | (467,578 | ) | |
Weighted-average shares used to compute net loss per share - basic and diluted | 171,175,577 | 164,533,823 | |||||
Net loss per share - basic and diluted | $ | (0.90 | ) | $ | (2.84 | ) | |
The pro forma results as presented above are based on estimates and assumptions, which we believe are reasonable. They are not necessarily indicative of our consolidated results of operations in future periods or the results that actually would have been realized had we been a combined company during the periods presented. The pro forma results include adjustments primarily related to amortization of acquired intangible assets and acquisition-related costs.
(6) Goodwill and Intangible Assets
Goodwill balances are presented below (in thousands):
Carrying Amount | |||||||
Balance as of December 31, 2015 | $ | 55,669 | |||||
Goodwill acquired | 26,695 | ||||||
Foreign currency translation adjustments | 170 | ||||||
Balance as of December 31, 2016 | 82,534 | ||||||
Goodwill acquired | 39,668 | ||||||
Foreign currency translation adjustments | 6,526 | ||||||
Balance as of December 31, 2017 | $ | 128,728 | |||||
Intangible assets consist of the following (in thousands):
December 31, 2017 | |||||||||||
Gross Carrying Amount | Accumulated Amortization | Net Carrying Amount | |||||||||
Developed technology | $ | 102,349 | $ | (43,382 | ) | $ | 58,967 | ||||
Patents | 31,030 | (3,239 | ) | 27,791 | |||||||
Other | 1,575 | (1,417 | ) | 158 | |||||||
Total intangible assets | $ | 134,954 | $ | (48,038 | ) | $ | 86,916 | ||||
December 31, 2016 | |||||||||||
Gross Carrying Amount | Accumulated Amortization | Net Carrying Amount | |||||||||
Developed technology | $ | 79,206 | $ | (30,858 | ) | $ | 48,348 | ||||
Patents | 17,610 | (867 | ) | 16,743 | |||||||
Other | 1,775 | (1,012 | ) | 763 | |||||||
Total intangible assets | $ | 98,591 | $ | (32,737 | ) | $ | 65,854 | ||||
78
Apart from the business combinations described in Note 5, we acquired $13.4 million and $25.0 million of intangible assets in patents and technology acquisitions during the years ended December 31, 2017 and December 31, 2016, respectively. Weighted-average useful life for the patents and technology acquired during the year ended December 31, 2017 is approximately ten years. Weighted average useful life for the patents and technology acquired during the year ended December 31, 2016 is approximately nine years and five years, respectively.
Amortization expense for intangible assets was approximately $19.7 million, $15.1 million and $11.8 million for the years ended December 31, 2017, 2016 and 2015, respectively.
The following table presents the estimated future amortization expense related to intangible assets held at December 31, 2017 (in thousands):
Years Ending December 31, | |||||||
2018 | $ | 22,772 | |||||
2019 | 22,691 | ||||||
2020 | 12,736 | ||||||
2021 | 10,805 | ||||||
2022 | 6,974 | ||||||
Thereafter | 10,938 | ||||||
Total future amortization expense | $ | 86,916 | |||||
(7) Property and Equipment
Property and equipment, net consists of the following (in thousands):
December 31, | |||||||
2017 | 2016 | ||||||
Computer equipment | $ | 326,378 | $ | 222,648 | |||
Computer software | 46,413 | 32,132 | |||||
Leasehold and other improvements | 56,232 | 37,095 | |||||
Furniture and fixtures | 38,789 | 31,574 | |||||
Building | 7,084 | 6,379 | |||||
Construction in progress | 5,341 | 2,535 | |||||
480,237 | 332,363 | ||||||
Less: Accumulated depreciation | (235,113 | ) | (150,743 | ) | |||
Total property and equipment, net | $ | 245,124 | $ | 181,620 | |||
Construction in progress consists primarily of leasehold improvements and in-process software development costs. Depreciation expense was $93.2 million, $67.8 million and $48.5 million for the years ended December 31, 2017, 2016 and 2015, respectively.
79
(8) Accrued Expenses and Other Current Liabilities
Accrued expenses and other current liabilities consist of the following (in thousands):
December 31, | |||||||
2017 | 2016 | ||||||
Taxes payable | $ | 25,617 | $ | 19,472 | |||
Bonuses and commissions | 84,972 | 67,259 | |||||
Accrued compensation | 45,428 | 30,816 | |||||
Other employee related liabilities | 44,284 | 28,812 | |||||
Other | 44,304 | 25,277 | |||||
Total accrued expenses and other current liabilities | $ | 244,605 | $ | 171,636 | |||
(9) Convertible Senior Notes
In May and June 2017, we issued $782.5 million of 0% convertible senior notes (the 2022 Notes), due June 1, 2022 unless earlier converted or repurchased in accordance with their terms. In November 2013, we issued $575.0 million of 0% convertible senior notes (the 2018 Notes, and together with the 2022 Notes, the Notes), due November 1, 2018 unless earlier converted or repurchased in accordance with their terms. The Notes do not bear interest, and we cannot redeem the Notes prior to maturity.
The Notes are unsecured obligations and do not contain any financial covenants or restrictions on the payments of dividends, the incurrence of indebtedness or the issuance or repurchase of securities by us or any of our subsidiaries.
Upon conversion of the Notes, we may choose to pay or deliver, as the case may be, cash, shares of our common stock or a combination of cash and shares of our common stock. We currently intend to settle the principal amount of the Notes with cash.
Convertible Date | Initial Conversion Price per Share | Initial Conversion Rate per $1,000 Par Value | Initial Number of Shares | |||||||
2022 Notes | February 1, 2022 | $ | 134.75 | 7.42 shares | 5,806,936 | |||||
2018 Notes | July 1, 2018 | $ | 73.88 | 13.54 shares | 7,783,023 | |||||
Holders of the Notes may convert their Notes at their option at any time prior to the close of business on the business day immediately preceding February 1, 2022 and July 1, 2018, for the 2022 Notes and 2018 Notes, respectively (each, a Convertible Date), only under the following circumstances:
• | during any calendar quarter (and only during such calendar quarter) if the last reported sale price of our common stock for at least 20 trading days (whether or not consecutive) during the period of 30 consecutive trading days ending on the last trading day of the immediately preceding calendar quarter is greater than or equal to 130% of the applicable conversion price on each applicable trading day; or |
• | during the five-business day period after any five-consecutive trading day period, or the measurement period, in which the trading price per $1,000 principal amount of the Notes for each trading day of the measurement period was less than 98% of the product of the last reported sale price of our common stock and the applicable conversion rate on each such trading day; or |
• | upon the occurrence of specified corporate events. |
On or after the applicable Convertible Date, a holder may convert all or any portion of its Notes at any time prior to the close of business on the second scheduled trading day immediately preceding the maturity date regardless of the foregoing conditions. Upon conversion, we will pay or deliver, as the case may be, cash, shares of our common stock or a combination of cash and shares of our common stock, at our election. As noted above, we currently intend to settle the principal amount of the Notes with cash.
The conversion price will be subject to adjustment in some events. Holders of the Notes who convert their Notes in connection with certain corporate events that constitute a “make-whole fundamental change” are, under certain circumstances, entitled to an increase in the conversion rate. Additionally, in the event of a corporate event that constitutes a “fundamental change,” holders of the Notes may require us to purchase with cash all or a portion of the Notes upon the occurrence of a fundamental change, at a purchase price equal to 100% of the principal amount of the respective Notes plus any accrued and unpaid special interest, if any.
In accounting for the issuance of the Notes, we separated the Notes into liability and equity components. The carrying cost of the liability component was calculated by measuring the fair value of a similar liability that does not have an associated convertible feature. The carrying amount of the equity component representing the conversion option was determined by deducting the fair value of the liability component from the par value of the Notes. The difference between the principal amount of the Notes and the proceeds allocated to the liability component, or the debt discount, is amortized to interest expense using the effective interest method over the term of the respective Notes. The equity component is not remeasured as long as it continues to meet the conditions for equity classification.
81
In accounting for the transaction costs related to the issuance of the Notes, we allocated the total amount incurred to the liability and equity components based on their relative fair values. Transaction costs attributable to the liability component are being amortized to interest expense over the respective terms of the Notes, and transaction costs attributable to the equity component were netted with the equity component of the Notes in stockholders’ equity. The Notes consisted of the following (in thousands):
December 31, 2017 | December 31, 2016 | ||||||
Liability component: | |||||||
Principal: | |||||||
2022 Notes | $ | 782,500 | $ | — | |||
2018 Notes | 574,994 | 575,000 | |||||
Less: debt issuance cost and debt discount, net of amortization | |||||||
2022 Notes | (152,482 | ) | — | ||||
2018 Notes | (31,576 | ) | (67,188 | ) | |||
Net carrying amount | $ | 1,173,436 | $ | 507,812 | |||
2022 Notes | 2018 Notes | ||||||
Equity component recorded at issuance: | |||||||
Note | $ | 162,039 | $ | 155,319 | |||
Issuance cost | (2,148 | ) | (3,257 | ) | |||
Net amount recorded in equity | $ | 159,891 | $ | 152,062 | |||
The price of our common stock was greater than or equal to 130% of the conversion price of the 2018 Notes for at least 20 trading days during the 30 consecutive trading days ending on the last trading day of the quarter ended June 30, 2017. Therefore, the 2018 Notes first became convertible at the holders’ option beginning on July 1, 2017 and continue to be convertible at the holders' option through March 31, 2018. During the year ended December 31, 2017, we paid cash to settle an immaterial principal amount of the 2018 Notes. Based on additional conversion requests we have received through the filing date, we expect to settle in cash an aggregate of $37.3 million in principal amount of the 2018 Notes during the first quarter of 2018 and $7.3 million in principal amount of the 2018 Notes during the second quarter of 2018. We may receive additional conversion requests that require settlement in the second quarter or the remainder of the year 2018.
As we have the option to settle the principal amount in shares and we are less than 12 months away from the maturity date, we have classified the net carrying amount of our 2018 Notes as a current liability and the equity component of our 2018 Notes continues to remain in permanent equity. Our 2018 Notes were not convertible as of December 31, 2016. Our 2022 Notes were not convertible as of December 31, 2017.
We consider the fair value of the Notes at December 31, 2017 to be a Level 2 measurement. The estimated fair values of the Notes at December 31, 2017 and December 31, 2016 based on the closing trading price per $100 of the Notes were as follows (in thousands):
December 31, 2017 | December 31, 2016 | ||||||
2022 Notes | $ | 897,778 | N/A | ||||
2018 Notes | $ | 1,015,554 | $ | 681,375 | |||
82
As of December 31, 2017, the remaining life of the 2022 Notes and 2018 Notes are 53 months and 10 months, respectively. The following table sets forth total interest expense recognized related to the Notes (in thousands):
Year Ended December 31, | |||||||||||
2017 | 2016 | 2015 | |||||||||
Amortization of debt issuance cost | |||||||||||
2022 Notes | $ | 860 | $ | — | $ | — | |||||
2018 Notes | 1,911 | 1,785 | 1,668 | ||||||||
Amortization of debt discount | |||||||||||
2022 Notes | 16,921 | — | — | ||||||||
2018 Notes | 33,702 | 31,493 | 29,429 | ||||||||
Total | $ | 53,394 | $ | 33,278 | $ | 31,097 | |||||
Effective interest rate of the liability component | |||||||||||
2022 Notes | 4.75% | ||||||||||
2018 Notes | 6.50% | ||||||||||
Note Hedges
To minimize the impact of potential economic dilution upon conversion of the Notes, we entered into convertible note hedge transactions (the 2022 Note Hedge and 2018 Note Hedge, respectively, and collectively, the Note Hedges) with certain investment banks, with respect to our common stock concurrently with the issuance of the 2022 Notes and 2018 Notes.
Purchase | Shares | |||||
(in thousands) | ||||||
2022 Note Hedge | $ | 128,017 | 5,806,936 | |||
2018 Note Hedge | $ | 135,815 | 7,783,023 | |||
The Note Hedges cover shares of our common stock at a strike price per share that corresponds to the initial conversion price of the respective Notes, subject to adjustment, and are exercisable upon conversion of the Notes. If exercised, we may elect to receive cash, shares of our common stock, or a combination of cash and shares. We have accounted for the aggregate amount of purchase price for the Note Hedges as a reduction to additional paid-in capital. The Note Hedges will expire upon the maturity of the Notes. The Note Hedges are intended to reduce the potential economic dilution upon conversion of the Notes in the event that the fair value per share of our common stock at the time of exercise is greater than the conversion price of the Notes. The Note Hedges are separate transactions and are not part of the terms of the Notes. Holders of the Notes will not have any rights with respect to the Note Hedges. The Note Hedges do not impact earnings per share, as they were entered into to offset any dilution from the Notes. As of December 31, 2017, 7,782,946 shares remain subject to the 2018 Note Hedge due to early conversions that have occurred during the year ended December 31, 2017.
Warrants
Proceeds | Shares | Strike Price | First Expiration Date | |||||||||
(in thousands) | ||||||||||||
2022 Warrants | $ | 54,071 | 5,806,936 | $ | 203.40 | September 2022 | ||||||
2018 Warrants | $ | 84,525 | 7,783,023 | $ | 107.46 | February 2019 | ||||||
Separately, we entered into warrant transactions with certain investment banks, whereby we sold warrants to acquire, subject to adjustment, the number of shares of our common stock shown in the table above (the 2022 Warrants and 2018 Warrants, respectively, and collectively, the Warrants). If the average market value per share of our common stock for the reporting period, as measured under the Warrants, exceeds the strike price of the respective Warrants, such Warrants would have a dilutive effect on our earnings per share to the extent we report net income. According to the terms of each of the Warrants, the Warrants will be automatically exercised over a 60 trading day period beginning on the first expiration date of the respective Warrants as set forth above. The Warrants are separate transactions and are not remeasured through earnings each reporting period. The Warrants are not part of the Notes or Note Hedges, and have been accounted for as part of additional paid-in capital.
83
(10) Accumulated Other Comprehensive Loss
The components of accumulated other comprehensive loss consist of the following (in thousands):
December 31, | |||||||
2017 | 2016 | ||||||
Foreign currency translation adjustment | $ | (4,410 | ) | $ | (19,277 | ) | |
Net unrealized gain (loss) on investments, net of tax | 3,521 | (1,856 | ) | ||||
Accumulated other comprehensive loss | $ | (889 | ) | $ | (21,133 | ) | |
Reclassification adjustments out of accumulated other comprehensive loss into net loss were immaterial for all periods presented.
(11) Stockholders' Equity
Common Stock
We are authorized to issue a total of 600,000,000 shares of common stock as of December 31, 2017. Holders of our common stock are not entitled to receive dividends unless declared by our board of directors. As of December 31, 2017, we had 174,275,864 shares of common stock outstanding and had reserved shares of common stock for future issuance as follows:
December 31, 2017 | ||||
Stock plans: | ||||
Options outstanding | 3,369,732 | |||
RSUs (1) | 11,403,341 | |||
Stock awards available for future grants: | ||||
2012 Equity Incentive Plan (2) | 25,813,848 | |||
2012 Employee Stock Purchase Plan (2) | 9,581,944 | |||
Total reserved shares of common stock for future issuance | 50,168,865 | |||
(1) | Represents the number of shares issuable upon settlement of outstanding RSUs and performance RSUs, assuming 100% of the target number of shares for performance RSUs, as discussed under the section entitled “RSUs” in Note 12. |
(2) | Refer to Note 12 for a description of these plans. |
During the years ended December 31, 2017 and 2016, we issued a total of 7,385,897 shares and 6,645,009 shares, respectively, from stock option exercises, vesting of RSUs, net of employee payroll taxes and purchases from ESPP. In May 2017, we repurchased and retired 540,806 shares of our common stock for approximately $55.0 million, or $101.70 per share, from certain purchasers of the 2022 Notes in connection with the 2022 Notes offering. We had no similar repurchases or retirements of common stock during the year ended December 31, 2016.
Preferred Stock
Our board of directors has the authority, without further action by stockholders, to issue up to 10,000,000 shares of preferred stock in one or more series. Our board of directors may designate the rights, preferences, privileges and restrictions of the preferred stock, including dividend rights, conversion rights, voting rights, terms of redemption, liquidation preference and number of shares constituting any series or the designation of any series. The issuance of preferred stock could have the effect of restricting dividends on our common stock, diluting the voting power of our common stock, impairing the liquidation rights of our common stock, or delaying or preventing a change in control. At December 31, 2017 and 2016, no shares of preferred stock were outstanding.
(12) Equity Awards
We currently have two equity incentive plans, our 2005 Stock Option Plan (the 2005 Plan) and our 2012 Equity Incentive Plan (the 2012 Plan). Our 2005 Plan was terminated in connection with our initial public offering in 2012 but continues to govern the terms of outstanding stock options that were granted prior to the termination of the 2005 Plan. We no longer grant equity awards pursuant to our 2005 Plan.
84
Our 2012 Plan provides for the grant of incentive stock options, nonqualified stock options, stock appreciation rights, RSUs, performance-based stock awards and other forms of equity compensation (collectively, equity awards). In addition, the 2012 Plan provides for the grant of performance cash awards. Incentive stock options may be granted only to employees. All other equity awards may be granted to employees, including officers, as well as directors and consultants. The share reserve may increase to the extent outstanding stock options under the 2005 Plan expire or terminate unexercised. The share reserve also automatically increases on January 1 of each year until January 1, 2022, by up to 5% of the total number of shares of common stock outstanding on December 31 of the preceding year as determined by our board of directors. On January 1, 2018, 8,713,793 shares of common stock were automatically added to the 2012 Plan pursuant to the provision described in the preceding sentence.
Our 2012 Employee Stock Purchase Plan (the 2012 ESPP) authorizes the issuance of shares of common stock pursuant to purchase rights granted to our employees. The price at which common stock is purchased under the 2012 ESPP is equal to 85% of the fair market value of our common stock on the first or last day of the offering period, whichever is lower. Offering periods are six months long and begin on February 1 and August 1 of each year. The number of shares of common stock reserved for issuance automatically increases on January 1 of each year until January 1, 2022, by up to 1% of the total number of shares of common stock outstanding on December 31 of the preceding year as determined by our board of directors. On January 1, 2018, 1,742,758 shares of common stock were automatically added to the 2012 ESPP pursuant to the provision described in the preceding sentence.
Stock Options
Stock options are exercisable at a price equal to the market value of the underlying shares of common stock on the date of the grant as determined by our board of directors or, for those stock options issued subsequent to our IPO, the closing price of our common stock as reported on the New York Stock Exchange on the date of grant. Stock options granted under our 2005 Plan and the 2012 Plan to new employees generally vest 25% one year from the date the requisite service period begins and continue to vest monthly for each month of continued employment over the remaining three years. Options granted generally are exercisable for a period of up to ten years.
A summary of stock option activity was as follows:
Number of Shares | Weighted- Average Exercise Price | Weighted- Average Remaining Contractual Term (Years) | Aggregate Intrinsic Value (in thousands) | |||||||||
Outstanding at December 31, 2015 | 8,255,554 | $ | 16.65 | |||||||||
Granted | 617,985 | 71.17 | ||||||||||
Exercised | (2,587,173 | ) | 13.36 | $ | 157,774 | |||||||
Canceled | (467,931 | ) | 58.01 | |||||||||
Outstanding at December 31, 2016 | 5,818,435 | 20.57 | ||||||||||
Granted | 616,720 | 86.33 | ||||||||||
Exercised | (2,970,914 | ) | 12.44 | $ | 277,670 | |||||||
Canceled | (94,509 | ) | 68.88 | |||||||||
Outstanding at December 31, 2017 | 3,369,732 | $ | 38.43 | 5.62 | $ | 309,892 | ||||||
Vested and expected to vest as of December 31, 2017 | 3,283,791 | $ | 37.62 | 5.54 | $ | 304,651 | ||||||
Vested and exercisable as of December 31, 2017 | 2,426,777 | $ | 21.96 | 4.38 | $ | 263,144 | ||||||
Aggregate intrinsic value represents the difference between the estimated fair value of our common stock and the exercise price of outstanding, in-the-money options. The total intrinsic value of the options exercised was $523.1 million for the year ended December 31, 2015. The weighted-average grant date fair value per share of options granted was $37.57, $28.01 and $32.64 for the years ended December 31, 2017, 2016 and 2015, respectively. The total fair value of shares vested was $11.8 million, $17.0 million and $34.5 million for the years ended December 31, 2017, 2016 and 2015, respectively.
Included in the number of options granted during the year ended December 31, 2017 are 396,720 options with both service and market-based criteria, which were granted to our new President and Chief Executive Officer, who started his employment with us during the year. The fair values of the options granted and the corresponding derived service periods were calculated using a Monte Carlo simulation, which estimates the potential outcome of reaching the market condition based on simulated future stock prices. The stock-based compensation expense associated with these options are recorded on a graded vesting basis.
85
As of December 31, 2017, total unrecognized compensation cost, adjusted for estimated forfeitures, related to unvested stock options was approximately $23.7 million. The weighted-average remaining vesting period of unvested stock options at December 31, 2017 was 3.16 years.
RSUs
A summary of RSU activity was as follows:
Number of Shares | Weighted Average Grant Date Fair Value (Per Share) | Aggregate Intrinsic Value (in thousands) | ||||||||
Outstanding at December 31, 2015 | 12,417,805 | $ | 63.38 | |||||||
Granted | 6,870,285 | 61.22 | ||||||||
Vested | (5,213,662 | ) | 59.95 | $ | 354,320 | |||||
Forfeited | (1,852,146 | ) | 63.18 | |||||||
Outstanding at December 31, 2016 | 12,222,282 | 63.66 | ||||||||
Granted | 6,320,457 | 95.70 | ||||||||
Vested | (5,502,004 | ) | 60.79 | $ | 573,861 | |||||
Forfeited | (1,637,394 | ) | 72.69 | |||||||
Outstanding at December 31, 2017 | 11,403,341 | $ | 81.50 | $ | 1,486,882 | |||||
Expected to vest as of December 31, 2017 | 10,191,316 | $ | 1,328,846 | |||||||
RSUs granted under the 2005 Plan and the 2012 Plan to employees generally vest over a four-year period. The total intrinsic value of the RSUs vested was $254.7 million for the year ended December 31, 2015.
Included in the RSU activity table above are shares with both service and performance-based vesting criteria that were granted to certain executives. The number of shares eligible to vest for these performance RSUs will depend upon achievement of a performance metric and are considered as eligible to vest when approved by the compensation committee in January of the year following the grant. The ultimate number of shares eligible to vest for performance RSUs range from 0% to 180% of the target number of shares depending on achievement relative to the performance metric over the applicable period. The shares granted in each year will primarily vest in four quarterly increments from August of the following year contingent on the continuous employment of each executive. The number of RSUs granted in each year in the table above reflects the shares that could be eligible to vest at 100% of target for performance RSUs in each applicable period and includes adjustments for over or under achievement for performance RSUs granted in the prior year. We recognized $40.5 million, $36.1 million, and $30.8 million of stock-based compensation expense, net of actual and estimated forfeitures, associated with performance RSUs on a graded vesting basis during the year ended December 31, 2017, 2016, and 2015, respectively.
As of December 31, 2017, total unrecognized compensation cost, adjusted for estimated forfeitures, related to unvested RSUs was approximately $671.0 million and the weighted-average remaining vesting period was 2.77 years.
86
(13) Stock-Based Compensation
We use the Black-Scholes options pricing model to estimate the fair value of our stock option grants. This model incorporates various assumptions including expected volatility, expected term, risk-free interest rates and expected dividend yields. The following assumptions were used for each respective period to calculate our stock-based compensation for each stock option grant on the date of the grant:
Year Ended December 31, | ||||||||
2017 | 2016 | 2015 | ||||||
Stock Options: | ||||||||
Expected volatility | 39% - 42% | 41% - 42% | 41% - 46% | |||||
Expected term (in years) | 4.89 | 4.89 - 5.60 | 5.50 - 6.08 | |||||
Risk-free interest rate | 1.78% - 2.47% | 1.18% - 1.87% | 1.48% - 1.94% | |||||
Dividend yield | — | % | — | % | — | % | ||
The following assumptions were used to calculate our stock-based compensation for each stock purchase right granted under the 2012 ESPP:
Year Ended December 31, | ||||||||
2017 | 2016 | 2015 | ||||||
ESPP: | ||||||||
Expected volatility | 28% - 49% | 31% - 49% | 31% - 49% | |||||
Expected term (in years) | 0.50 | 0.50 | 0.50 | |||||
Risk-free interest rate | 0.40% - 1.15% | 0.17% - 0.47% | 0.05% - 0.17% | |||||
Dividend yield | — | % | — | % | — | % | ||
Expected volatility. Prior to the third quarter of 2015, we used the historic volatility of publicly traded peer companies as an estimate for expected volatility. In considering peer companies, characteristics such as industry, stage of development, size and financial leverage are considered. Beginning in the third quarter of 2015, we began to include our own historical volatility in addition to publicly traded peers to calculate our expected volatility for a period similar to our expected term. We intend to continue to consistently apply this process using the same or similar public companies until a sufficient amount of historical information regarding the volatility of our own common stock share price becomes available.
Expected term. Prior to the third quarter of 2015, we used the simplified method for calculating the expected term of options as described in the SEC's Staff Accounting Bulletin No. 107, Share-Based Payment. The simplified method calculates the expected term as the mid-point between the vesting date and the contractual expiration date of the award. Beginning in the third quarter of 2015, we determined the expected term based on historical experience of similar awards, giving consideration to the contractual terms of the stock-based awards, vesting schedules and expectations of future employee behavior, because we now believe there is sufficient historical information to derive a reasonable estimate. We estimate the expected term for ESPP using the purchase period.
Risk-free interest rate. The risk-free interest rate is based on the U.S. Treasury yield curve in effect at the time of grant for the expected term of the stock-based award.
Expected dividend yield. Our expected dividend yield is zero, as we have not and do not currently intend to declare dividends in the foreseeable future.
87
(14) Net Loss Per Share
The following tables present the calculation of basic and diluted net loss per share attributable to common stockholders (in thousands, except share and per share data):
Year Ended December 31, | |||||||||||
2017 | 2016 | 2015 | |||||||||
Numerator: | |||||||||||
Net loss | $ | (149,130 | ) | $ | (451,804 | ) | $ | (198,426 | ) | ||
Denominator: | |||||||||||
Weighted-average shares outstanding - basic and diluted | 171,175,577 | 164,533,823 | 155,706,643 | ||||||||
Net loss per share - basic and diluted | $ | (0.87 | ) | $ | (2.75 | ) | $ | (1.27 | ) | ||
Potentially dilutive securities that are not included in the calculation of diluted net loss per share because doing so would be antidilutive are as follows:
Year Ended December 31, | ||||||||
2017 | 2016 | 2015 | ||||||
Common stock options | 3,369,732 | 5,818,435 | 8,255,554 | |||||
Restricted stock units | 11,403,341 | 12,222,282 | 12,417,805 | |||||
ESPP obligations | 361,688 | 366,529 | 254,728 | |||||
2018 Notes | 7,782,946 | 7,783,023 | 7,783,023 | |||||
2018 Warrants | 7,783,023 | 7,783,023 | 7,783,023 | |||||
2022 Notes | 5,806,933 | — | — | |||||
2022 Warrants | 5,806,933 | — | — | |||||
Total potentially dilutive securities | 42,314,596 | 33,973,292 | 36,494,133 | |||||
(15) Income Taxes
The provision for income taxes consists of the following (in thousands):
Year Ended December 31, | |||||||||||
2017 | 2016 | 2015 | |||||||||
Current provision: | |||||||||||
Federal | $ | (445 | ) | $ | (55 | ) | $ | 682 | |||
State | 137 | 135 | 211 | ||||||||
Foreign | 9,512 | 5,097 | 6,125 | ||||||||
9,204 | 5,177 | 7,018 | |||||||||
Deferred provision: | |||||||||||
Federal | (5,934 | ) | (4,462 | ) | — | ||||||
State | (886 | ) | (746 | ) | — | ||||||
Foreign | (2,258 | ) | 1,784 | (1,604 | ) | ||||||
(9,078 | ) | (3,424 | ) | (1,604 | ) | ||||||
Provision for income taxes | $ | 126 | $ | 1,753 | $ | 5,414 | |||||
88
The components of loss before provision for income taxes by U.S. and foreign jurisdictions were as follows (in thousands):
Year Ended December 31, | |||||||||||
2017 | 2016 | 2015 | |||||||||
United States | $ | (80,636 | ) | $ | (432,631 | ) | $ | (150,593 | ) | ||
Foreign | (68,368 | ) | (17,420 | ) | (42,419 | ) | |||||
Total | $ | (149,004 | ) | $ | (450,051 | ) | $ | (193,012 | ) | ||
The effective income tax rate differs from the federal statutory income tax rate applied to the loss before provision for income taxes due to the following (in thousands):
Year Ended December 31, | |||||||||||
2017 | 2016 | 2015 | |||||||||
Tax computed at U.S. federal statutory rate | $ | (50,661 | ) | $ | (153,017 | ) | $ | (65,624 | ) | ||
State taxes, net of federal benefit | 64 | 37 | 53 | ||||||||
Tax rate differential for international subsidiaries | 29,312 | 10,910 | 18,681 | ||||||||
Stock-based compensation | (116,953 | ) | (27,133 | ) | 13,597 | ||||||
Tax credits | (21,038 | ) | (16,452 | ) | (11,961 | ) | |||||
Other | 7,337 | 7,850 | 2,865 | ||||||||
Valuation allowance | 152,065 | 179,558 | 47,803 | ||||||||
Provision for income taxes | $ | 126 | $ | 1,753 | $ | 5,414 | |||||
Significant components of our deferred tax assets are shown below (in thousands). A valuation allowance has been recognized to offset our deferred tax assets, as necessary, by the amount of any tax benefits that, based on evidence, are not expected to be realized.
December 31, | |||||||
2017 | 2016 | ||||||
Deferred tax assets: | |||||||
Net operating loss carryforwards | $ | 518,620 | $ | 640,312 | |||
Accrued expenses | 10,613 | 10,424 | |||||
Credit carryforwards | 75,879 | 50,559 | |||||
Stock-based compensation | 35,782 | 46,530 | |||||
Note hedge | 35,181 | 20,520 | |||||
Other | 14,771 | 13,733 | |||||
Total deferred tax assets | 690,846 | 782,078 | |||||
Less valuation allowance | (614,177 | ) | (728,870 | ) | |||
76,669 | 53,208 | ||||||
Deferred tax liabilities: | |||||||
Depreciation and amortization | (20,708 | ) | (18,914 | ) | |||
Convertible notes | (43,616 | ) | (23,605 | ) | |||
Other | (1,759 | ) | — | ||||
Net deferred tax assets | $ | 10,586 | $ | 10,689 | |||
89
On December 22, 2017, the 2017 Tax Cuts and Jobs Act (the Tax Act) was enacted into law and significantly changed how the U.S. imposes income tax on multinational corporations. Changes include, but are not limited to, a reduction of the corporate income tax rate from 35% to 21%, a transition tax on accumulated foreign earnings and a transition from a worldwide to a territorial tax system. We are required to recognize the effect of the Tax Act in the period of enactment, such as remeasuring our U.S. deferred tax assets and liabilities as well as reassessing the net realizability of our deferred tax assets and liabilities. The provisional amount related to the remeasurement of certain deferred tax assets and liabilities, based on the rates at which they are expected to reverse in the future, was $264.4 million and is offset by our valuation allowance. We have a cumulative deficit in foreign earnings. Accordingly, we estimated the transition tax did not have a material effect on our tax expense as of December 31, 2017.
In December 2017, the SEC staff issued Staff Accounting Bulletin No. 118, Income Tax Accounting Implications of the Tax Cuts and Jobs Act (SAB 118), which allows us to record provisional amounts during a measurement period not to extend more than one year beyond the Tax Act enactment date. Since the Tax Act was passed late in the fourth quarter of 2017, and ongoing guidance and accounting interpretation are expected over the next 12 months, we consider the accounting for deferred tax remeasurements, the impact of the transition of U.S. international taxation from a worldwide tax system to a territorial system and other provisions to be incomplete due to the forthcoming guidance and our ongoing analysis. We expect to complete our analysis within the measurement period in accordance with SAB 118.
As of December 31, 2017, we had U.S. federal net operating loss and federal tax credit carryforwards of approximately $2.1 billion and $56.6 million, respectively. The federal net operating loss carryforwards and federal tax credits will begin to expire in 2024 if not utilized. In addition, we had state net operating loss and state tax credit carryforwards of approximately $1.2 billion and $48.0 million, respectively. The state net operating loss will begin to expire in 2018 if not utilized, and the tax effected amount due to expire in 2018 is immaterial. State tax credits can be carried forward indefinitely. Utilization of our net operating loss and credit carryforwards may be subject to annual limitation due to the ownership change limitations provided by the Internal Revenue Code and similar state provisions. Such an annual limitation could result in the expiration of the net operating loss and tax credit carryforwards before utilization.
We maintain a full valuation allowance against our U.S. deferred tax assets as of December 31, 2017. We regularly assess the need for a valuation allowance against our deferred tax assets. In making that assessment, we consider both positive and negative evidence related to the likelihood of realization of the deferred tax assets to determine, based on the weight of available evidence, whether it is more likely than not that some or all of the deferred tax assets will not be realized. Due to cumulative losses over recent years and based on all available evidence, we have determined that it is more likely than not that net deferred tax assets in the United States will not be realized. We have determined that $10.6 million related to deferred tax assets in certain foreign jurisdictions are realizable since the foreign entities have cumulative income and expected future income. We remeasured the U.S. non-current assets and liabilities at the applicable tax rate of 21% in accordance with the Tax Act. The valuation allowance decreased $114.7 million during the year ended December 31, 2017. This change is primarily attributable to a decrease in the deferred tax balance of $264.4 million due to the reduction in the U.S. income tax rate, offset by increases in deferred tax assets primarily related to net operating losses. We will continue to assess the likelihood of realization of the deferred tax assets in each of the applicable jurisdictions in future periods and will adjust the valuation allowance accordingly.
Prior to the enactment of the Tax Act, we considered earnings from foreign operations to be indefinitely reinvested outside of the United States. We are currently evaluating whether to change our indefinite reinvestment assertion in light of the Tax Act and consider that assessment to be incomplete as permitted under guidance issued by the SEC. We expect to reach a final determination within the measurement period in accordance with SAB 118 as described above.
90
A reconciliation of the beginning and ending balance of total unrecognized tax benefits is as follows (in thousands):
Year Ended December 31, | |||||||||||
2017 | 2016 | 2015 | |||||||||
Balance, beginning period | $ | 18,440 | $ | 11,737 | $ | 9,158 | |||||
Tax positions taken in prior period: | |||||||||||
Gross increases | 398 | 1,122 | 2 | ||||||||
Gross decreases | — | (50 | ) | (1,017 | ) | ||||||
Tax positions taken in current period: | |||||||||||
Gross increases | 8,810 | 5,673 | 3,768 | ||||||||
Gross decreases | — | — | (73 | ) | |||||||
Lapse of statute of limitations | — | (42 | ) | (101 | ) | ||||||
Balance, end of period | $ | 27,648 | $ | 18,440 | $ | 11,737 | |||||
As of December 31, 2017, we had gross unrecognized tax benefits of approximately $27.6 million, of which $4.8 million would impact the effective tax rate, if recognized. We recognize accrued interest and penalties related to unrecognized tax benefits as income tax expense. Accrued interest and penalties included in our liability related to unrecognized tax benefits were $0.5 million and $0.4 million at December 31, 2017 and 2016, respectively. The amount of unrecognized tax benefits could be reduced upon expiration of the applicable statutes of limitations. The potential reduction in unrecognized tax benefits during the next 12 months is not expected to be material. Interest and penalties accrued on these uncertain tax positions will be released upon the expiration of the statutes of limitations and these amounts are also not material.
We are subject to taxation in the United States and foreign jurisdictions. As of December 31, 2017, our tax years 2004 to 2016 remain subject to examination in most jurisdictions.
There are differing interpretations of tax laws and regulations, and as a result, disputes may arise with tax authorities involving issues of the timing and amount of deductions and allocations of income among various tax jurisdictions. We periodically evaluate our exposures associated with our tax filing positions. We believe that adequate amounts have been reserved for any adjustments that may ultimately result from these examinations, and we do not anticipate a significant impact to our gross unrecognized tax benefits within the next 12 months related to these years. Although the timing of the resolution, settlement, and closure of any audit is highly uncertain, it is reasonably possible that the balance of gross unrecognized tax benefits could significantly change in the next 12 months. However, given the number of years that remain subject to examination, we are unable to estimate the full range of possible adjustments to the balance of gross unrecognized tax benefits.
(16) Commitments and Contingencies
Operating Leases and Other Contractual Commitments
For some of our offices and data centers, we have entered into non-cancelable operating lease agreements with various expiration dates. Rent expense associated with office space leases was $39.7 million, $34.2 million and $22.0 million for the years ended December 31, 2017, 2016 and 2015, respectively.
Payments for data center square footage as well as data center capacity for certain data centers, are primarily included in cost of revenues. These costs were $22.5 million, $17.3 million and $13.7 million for the years ended December 31, 2017, 2016 and 2015, respectively.
91
Future minimum payments under our non-cancelable operating leases and other contractual commitments as of December 31, 2017 are presented in the table below (in thousands):
Operating Leases | Purchase Obligations (1) | Other | Total | ||||||||||||
Years Ending December 31, | |||||||||||||||
2018 | $ | 44,713 | $ | 31,394 | $ | 574 | $ | 76,681 | |||||||
2019 | 47,986 | 22,698 | 574 | 71,258 | |||||||||||
2020 | 48,218 | 11,736 | 574 | 60,528 | |||||||||||
2021 | 45,590 | 7,248 | 574 | 53,412 | |||||||||||
2022 | 43,238 | 3,805 | 574 | 47,617 | |||||||||||
Thereafter | 124,114 | 4,093 | 1,053 | 129,260 | |||||||||||
Total | $ | 353,859 | $ | 80,974 | $ | 3,923 | $ | 438,756 | |||||||
(1) | Consists of future minimum payments under non-cancelable purchase commitments primarily related to data center and IT operations and sales and marketing activities. Not included in the table above are certain purchase commitments related to our future annual Knowledge user conferences and other customer or sales conferences to be held in 2019 and 2020. If we were to cancel these contractual commitments as of December 31, 2017, we would have been obligated to pay cancellation penalties of approximately $13.9 million in aggregate. |
In December 2014, we entered into a lease agreement for 328,867 square feet of space, located in Santa Clara, California. The lease commenced in August 2015 for an initial term of 12 years, with two options to renew the lease for additional terms of five years each. Rent is paid on a monthly basis and will increase incrementally over the term of the lease. Total future minimum payments under this operating lease as of December 31, 2017 was $131.8 million, which is included in the table above.
In January 2017, we entered into a lease agreement related to an expansion and lease term extension of our existing San Diego office facility. Rent is paid on a monthly basis and will increase incrementally over the term of the lease. Total future minimum payments under this operating lease as of December 31, 2017 was $46.2 million, which is included in the table above.
In addition to the amounts above, the repayment of our 2022 Notes with an aggregate principal amount of $782.5 million is due on June 1, 2022, and the repayment of our 2018 Notes with an aggregate principal amount of $575.0 million is due on November 1, 2018. Refer to Note 9 for further information regarding our convertible senior notes.
Legal Proceedings
From time to time, we are party to litigation and other legal proceedings in the ordinary course of business. While the results of any litigation or other legal proceedings are uncertain, management does not believe the ultimate resolution of any pending legal matters is likely to have a material adverse effect on our financial position, results of operations or cash flows, except as discussed below and for those matters for which we have recorded a loss contingency. We accrue for loss contingencies when it is both probable that we will incur the loss and when we can reasonably estimate the amount of the loss or range of loss.
Generally, our subscription agreements require us to defend our customers for third-party intellectual property infringement and other claims. Any adverse determination related to intellectual property claims or other litigation could prevent us from offering our services and adversely affect our financial condition and results of operations.
On February 6, 2014, Hewlett-Packard Company (Hewlett-Packard) filed a lawsuit against us in the U.S. District Court for the Northern District of California. The lawsuit alleged patent infringement and sought damages and an injunction. On or about November 1, 2015, Hewlett Packard Enterprise Company (HPE) separated from Hewlett-Packard as an independent company, and Hewlett-Packard assigned to HPE all right, title, and interest in the eight Hewlett-Packard patents in the lawsuit and HPE was substituted as plaintiff in the litigation. On March 4, 2016, we entered into a confidential settlement agreement resolving the lawsuit with HPE (HPE Settlement). As a result, on March 9, 2016, the lawsuit was dismissed.
BMC Software, Inc. (BMC) filed lawsuits against us in the U.S. District Court for the Eastern District of Texas on September 23, 2014 and February 12, 2016, and in the Dusseldorf (Germany) Regional Court, Patent Division, on March 2, 2016. Each of the lawsuits alleged patent infringement and sought damages and an injunction. On April 8, 2016, we entered into a confidential settlement agreement resolving all the lawsuits with BMC (BMC Settlement). As a result, the second Texas lawsuit was dismissed on April 14, 2016, and each of the initial Texas lawsuit and the German lawsuit was dismissed on April 25, 2016.
92
These settlements are considered multiple element arrangements for accounting purposes. We evaluated the accounting treatment of these settlements by identifying each element of the arrangements, which included amongst other elements, a release of past infringement claims and a covenant not to sue for a specified term of years. The primary benefit we received from the arrangements was the settlement and termination of all existing litigation, the avoidance of future litigation expenses and the avoidance of future management and customer disruptions. We determined that none of the elements of the settlement agreements have identifiable future benefits that would be capitalized as an asset. Accordingly, we recorded charges for aggregate legal settlements of $270.0 million in our consolidated statement of comprehensive loss for the year ended December 31, 2016. The charge covers the fulfillment by us of all financial obligations under both the BMC Settlement and HPE Settlement with no remaining financial obligations under either settlement.
(17) Information about Geographic Areas and Products
Revenues by geographic area, based on the location of our users, were as follows for the periods presented (in thousands):
Year Ended December 31, | |||||||||||
2017 | 2016 | 2015 | |||||||||
Revenues by geography | |||||||||||
North America (1) | $ | 1,299,950 | $ | 946,956 | $ | 702,985 | |||||
EMEA (2) | 478,686 | 339,341 | 233,378 | ||||||||
Asia Pacific and other | 154,390 | 104,216 | 69,117 | ||||||||
Total revenues | $ | 1,933,026 | $ | 1,390,513 | $ | 1,005,480 | |||||
Property and equipment, net by geographic area were as follows (in thousands):
December 31, | |||||||
2017 | 2016 | ||||||
Property and equipment, net: | |||||||
North America (3) | $ | 164,040 | $ | 132,671 | |||
EMEA (2) | 50,028 | 37,449 | |||||
Asia Pacific and other | 31,056 | 11,500 | |||||
Total property and equipment, net | $ | 245,124 | $ | 181,620 | |||
(1) | Revenues attributed to the United States were approximately 94% of North America revenues for the years ended December 31, 2017, and 95% for the year ended December 31, 2016 and 2015. |
(2) | Europe, the Middle East and Africa (EMEA) |
(3) | Property and equipment, net attributed to the United States were approximately 89% and 92% of property and equipment, net attributable to North America for the years ended December 31, 2017 and 2016, respectively. |
Subscription revenues consist of the following (in thousands):
Year Ended December 31, | |||||||||||
2017 | 2016 | 2015 | |||||||||
Service management products | $ | 1,526,382 | $ | 1,108,846 | $ | 783,603 | |||||
ITOM products | 213,413 | 112,793 | 64,675 | ||||||||
Total subscription revenues | $ | 1,739,795 | $ | 1,221,639 | $ | 848,278 | |||||
Our service management products include our platform, ITSM, ITBM, customer service management, HR service delivery and security operations, which have similar features and functions, and are generally priced on a per user basis. Our ITOM products, which improve visibility, availability and agility of enterprise services, are generally priced on a per node basis.
(18) Related Party Transactions
We have entered into indemnification agreements with each of our directors, executive officers and certain other officers. These agreements require us to indemnify such individuals, to the fullest extent permitted by Delaware law, for certain liabilities to which they may become subject as a result of their affiliation with us.
93
ITEM 9. | CHANGES IN AND DISAGREEMENTS WITH ACCOUNTANTS ON ACCOUNTING AND FINACIAL DISCLOSURE |
None.
ITEM 9A. | CONTROLS AND PROCEDURES |
(a) Evaluation of Disclosure Controls and Procedures
Our management, with the participation of our Chief Executive Officer and our Chief Financial Officer, evaluated the effectiveness of our disclosure controls and procedures as of December 31, 2017. The term “disclosure controls and procedures,” as defined in Rules 13a-15(e) and 15d-15(e) under the Exchange Act, means controls and other procedures of a company that are designed to ensure that information required to be disclosed by a company in the reports that it files or submits under the Exchange Act is recorded, processed, summarized and reported, within the time periods specified in the SEC's rules and forms. Disclosure controls and procedures include, without limitation, controls and procedures designed to ensure that information required to be disclosed by a company in the reports that it files or submits under the Exchange Act is accumulated and communicated to the company's management, including its principal executive and principal financial officers, as appropriate to allow timely decisions regarding required disclosure. Management recognizes that any controls and procedures, no matter how well designed and operated, can provide only reasonable assurance of achieving their objectives, and management necessarily applies its judgment in evaluating the cost-benefit relationship of possible controls and procedures.
Based on the evaluation of our disclosure controls and procedures as of December 31, 2017, our Chief Executive Officer and Chief Financial Officer concluded that, as of such date, our disclosure controls and procedures were effective at the reasonable assurance level.
(b) Management's Report on Internal Control Over Financial Reporting
Our management is responsible for establishing and maintaining adequate internal control over financial reporting (as defined in Rules 13a-15(f) and 15d-15(f) under the Exchange Act) to provide reasonable assurance regarding the reliability of our financial reporting and the preparation of consolidated financial statements for external purposes in accordance with generally accepted accounting principles.
Our management, under the supervision of our Chief Executive Officer and Chief Financial Officer, conducted an evaluation of the effectiveness of our internal control over financial reporting based on the framework in Internal Control—Integrated Framework (2013), issued by the Committee of Sponsoring Organizations of the Treadway Commission. Based on this evaluation, management concluded that our internal control over financial reporting was effective as of December 31, 2017.
The effectiveness of our internal control over financial reporting as of December 31, 2017 has been audited by PricewaterhouseCoopers LLP, an independent registered public accounting firm, as stated in their report, which is included in Item 8 of this Annual Report on Form 10-K.
(c) Changes in Internal Control over Financial Reporting
During the quarter ended December 31, 2017, we implemented new revenue and commission accounting modules to our existing accounting system and related controls, which enabled us to prepare our financial statements under Topic 605, as well as prepare us for our adoption of Topic 606 on a full retrospective basis effective January 1, 2018. There were no other changes in our internal control over financial reporting identified in management’s evaluation pursuant to Rules 13a or 15(d) of the Exchange Act that occurred during the quarter ended December 31, 2017 that have materially affected, or are reasonably likely to materially affect, our internal control over financial reporting.
ITEM 9B. | OTHER INFORMATION |
None.
PART III
94
ITEM 10. | DIRECTORS, EXECUTIVE OFFICERS AND CORPORATE GOVERNANCE |
The information required by this item will be included in an amendment to this Annual Report on Form 10-K or incorporated by reference from our definitive proxy statement to be filed pursuant to Regulation 14A.
ITEM 11. | EXECUTIVE COMPENSATION |
The information required by this item will be included in an amendment to this Annual Report on Form 10-K or incorporated by reference from our definitive proxy statement to be filed pursuant to Regulation 14A.
ITEM 12. | SECURITY OWNERSHIP OF CERTAIN BENEFICIAL OWNERS AND MANAGEMENT AND RELATED STOCKHOLDER MATTERS |
The information required by this item will be included in an amendment to this Annual Report on Form 10-K or incorporated by reference from our definitive proxy statement to be filed pursuant to Regulation 14A.
ITEM 13. | CERTAIN RELATIONSHIPS AND RELATED TRANSACTIONS AND DIRECTOR INDEPENDENCE |
The information required by this item will be included in an amendment to this Annual Report on Form 10-K or incorporated by reference from our definitive proxy statement to be filed pursuant to Regulation 14A.
ITEM 14. | PRINCIPAL ACCOUNTING FEES AND SERVICES |
The information required by this item will be included in an amendment to this Annual Report on Form 10-K or incorporated by reference from our definitive proxy statement to be filed pursuant to Regulation 14A.
PART IV
ITEM 15. | EXHIBITS AND FINANCIAL STATEMENT SCHEDULES |
The following documents are filed as a part of this Annual Report on Form 10-K:
(a) Financial Statements
The information concerning our financial statements, and Report of Independent Registered Public Accounting Firm required by this Item is incorporated by reference herein to the section of this Annual Report on Form 10-K in Item 8, entitled “Consolidated Financial Statements and Supplementary Data.”
(b) Financial Statement Schedules
All schedules have been omitted because the required information is not present or not present in amounts sufficient to require submission of the schedules, or because the information required is included in Item 8, entitled the “Consolidated Financial Statements and Supplementary Data.”
(c) Exhibits
The list of exhibits filed with this report is set forth in the Exhibit Index following the signature pages and is incorporated herein by reference.
95
ITEM 16. | FORM 10-K SUMMARY |
None.
EXHIBIT INDEX
Exhibit Number | Description of Document | Incorporated by Reference | Filed Herewith | ||||||||
Form | File No. | Exhibit | Filing Date | ||||||||
10-Q | 001-35580 | 3.1 | 8/10/2012 | ||||||||
8-K | 001-35580 | 3.1 | 10/25/2017 | ||||||||
S-1/A | 333-180486 | 4.1 | 6/19/2012 | ||||||||
8-K | 001-35580 | 4.1 | 11/13/2013 | ||||||||
8-K | 001-35580 | 4.1 | 5/30/2017 | ||||||||
10-K | 001-35580 | 10.1 | 2/27/2015 | ||||||||
S-1 | 333-180486 | 10.2 | 3/30/2012 | ||||||||
X | |||||||||||
10-Q | 001-35580 | 10.3 | 8/8/2017 | ||||||||
10-Q | 001-35580 | 10.4 | 8/8/2017 | ||||||||
10-K | 001-35580 | 10.4 | 3/8/2013 | ||||||||
10-Q | 001-35580 | 10.5 | 8/8/2017 | ||||||||
S-1 | 333-180486 | 10.5 | 3/30/2012 | ||||||||
10-Q | 001-35580 | 10.1 | 8/7/2014 | ||||||||
S-1 | 333-180486 | 10.6 | 3/30/2012 | ||||||||
10-Q | 001-35580 | 10.2 | 11/5/2014 | ||||||||
10-Q | 001-35580 | 10.2 | 8/8/2017 | ||||||||
Exhibit Number | Description of Document | Incorporated by Reference | Filed Herewith | ||||||||
Form | File No. | Exhibit | Filing Date | ||||||||
S-1 | 333-180486 | 10.7 | 3/30/2012 | ||||||||
10-Q | 001-35580 | 10.1 | 11/5/2014 | ||||||||
10-Q | 001-35580 | 10.1 | 8/8/2017 | ||||||||
8-K | 001-35580 | 10.1 | 2/27/2017 | ||||||||
10-Q | 001-35580 | 10.1 | 11/6/2017 | ||||||||
S-1/A | 333-184674 | 10.12 | 11/9/2012 | ||||||||
8-K | 001-35580 | 10.1 | 12/15/2014 | ||||||||
8-K | 001-32224 | 99.1 | 11/13/2013 | ||||||||
8-K | 001-35580 | 99.1 | 5/30/2017 | ||||||||
8-K | 001-32224 | 99.2 | 11/13/2013 | ||||||||
8-K | 001-35580 | 99.2 | 5/30/2017 | ||||||||
8-K | 001-32224 | 99.3 | 11/13/2013 | ||||||||
8-K | 001-35580 | 99.1 | 6/22/2017 | ||||||||
8-K | 001-32224 | 99.4 | 11/13/2013 | ||||||||
8-K | 001-35580 | 99.2 | 6/22/2017 | ||||||||
10-Q | 001-35580 | 10.1 | 8/3/2016 | ||||||||
X | |||||||||||
X | |||||||||||
X | |||||||||||
X | |||||||||||
98
Exhibit Number | Description of Document | Incorporated by Reference | Filed Herewith | ||||||||
Form | File No. | Exhibit | Filing Date | ||||||||
X | |||||||||||
X | |||||||||||
X | |||||||||||
101.INS** | XBRL Instance Document - the instance document does not appear in the Interactive Data File because its XBRL tags are embedded within the Inline XBRL document | X | |||||||||
101.SCH** | XBRL Taxonomy Extension Schema Document | X | |||||||||
101.CAL** | XBRL Taxonomy Extension Calculation Linkbase Document | X | |||||||||
101.DEF** | XBRL Taxonomy Extension Definition Linkbase Document | X | |||||||||
101.LAB** | XBRL Taxonomy Extension Label Linkbase Document | X | |||||||||
101.PRE** | XBRL Taxonomy Extension Presentation Linkbase Document | X | |||||||||
+ Registrant has omitted portions of the relevant exhibit and filed such exhibit separately with the Securities and Exchange Commission pursuant to a request for confidential treatment granted under Rule 406 under the Securities Act of 1933, as amended.
* Indicates a management contract, compensatory plan or arrangement.
** Pursuant to Rule 406T of Regulation S-T, the Interactive Data Files on Exhibit 101 hereto are deemed not “filed” for purposes of Sections 11 or 12 of the Securities Act, are deemed not “filed” for purposes of Section 18 of the Exchange Act, and otherwise are not subject to liability under those Sections.
SIGNATURES
Pursuant to the requirements of Section 13 or 15(d) of the Securities Exchange Act of 1934, the registrant has duly caused this report to be signed on its behalf by the undersigned thereunto duly authorized.
Dated: February 28, 2018
SERVICENOW, INC. | |||
By: | /s/ John J. Donahoe | ||
John J. Donahoe President and Chief Executive Officer | |||
99
POWER OF ATTORNEY
KNOW ALL BY THESE PRESENTS, that each person whose signature appears below constitutes and appoints John J. Donahoe and Michael P. Scarpelli, and each of them, as his true and lawful attorneys-in-fact and agents, each with the full power of substitution, for him and in his name, place or stead, in any and all capacities, to sign any and all amendments to this report, and to file the same, with exhibits thereto and other documents in connection therewith, with the Securities and Exchange Commission, granting unto said attorneys-in-fact and agents, and each of them, full power and authority to do and perform each and every act and thing requisite and necessary to be done in and about the premises, as fully to all intents and purposes as he might or could do in person, hereby ratifying and confirming all that said attorneys-in-fact and agents, or their or his substitute or substitutes, may lawfully do or cause to be done by virtue hereof.
Pursuant to the requirements of the Securities Act of 1933, this report has been signed by the following persons in the capacities and on the dates indicated.
Signature | Title | Date | ||
/s/ John J. Donahoe | President, Chief Executive Officer and Director (Principal Executive Officer) | February 28, 2018 | ||
John J. Donahoe | ||||
/s/ Michael P. Scarpelli | Chief Financial Officer (Principal Financial Officer and Principal Accounting Officer) | February 28, 2018 | ||
Michael P. Scarpelli | ||||
/s/ Frank Slootman | Chairman of the Board of Directors | February 28, 2018 | ||
Frank Slootman | ||||
/s/ Susan L. Bostrom | Director | February 28, 2018 | ||
Susan L. Bostrom | ||||
/s/ Jonathan C. Chadwick | Director | February 28, 2018 | ||
Jonathan C. Chadwick | ||||
/s/ Paul E. Chamberlain | Director | February 28, 2018 | ||
Paul E. Chamberlain | ||||
/s/ Ronald E.F. Codd | Director | February 28, 2018 | ||
Ronald E. F. Codd | ||||
/s/ Frederic B. Luddy | Director | February 28, 2018 | ||
Frederic B. Luddy | ||||
/s/ Jeffrey A. Miller | Director | February 28, 2018 | ||
Jeffrey A. Miller | ||||
/s/ Anita M. Sands | Director | February 28, 2018 | ||
Anita M. Sands | ||||
100