Attached files
| file | filename |
|---|---|
| EX-32 - EX-32 - SS&C Technologies Holdings Inc | ssnc-ex32_7.htm |
| EX-31.2 - EX-31.2 - SS&C Technologies Holdings Inc | ssnc-ex312_6.htm |
| EX-31.1 - EX-31.1 - SS&C Technologies Holdings Inc | ssnc-ex311_9.htm |
| EX-23.1 - EX-23.1 - SS&C Technologies Holdings Inc | ssnc-ex231_8.htm |
| EX-21 - EX-21 - SS&C Technologies Holdings Inc | ssnc-ex21_10.htm |
UNITED STATES
SECURITIES AND EXCHANGE COMMISSION
Washington, D.C. 20549
Form 10-K
|
☒ |
ANNUAL REPORT PURSUANT TO SECTION 13 OR 15(d) OF THE SECURITIES EXCHANGE ACT OF 1934 |
For the fiscal year ended December 31, 2017
Commission file number: 001-34675

SS&C TECHNOLOGIES HOLDINGS, INC.
(Exact name of Registrant as Specified in Its Charter)
|
Delaware |
71-0987913 |
|
(State or Other Jurisdiction of Incorporation or Organization) |
(I.R.S. Employer Identification No.) |
80 Lamberton Road
Windsor, CT 06095
(Address of Principal Executive Offices, Including Zip Code)
860-298-4500
(Registrant’s Telephone Number, Including Area Code)
Securities registered pursuant to Section 12(b) of the Act:
|
Title of Each Class |
|
Name of Each Exchange on Which Registered |
|
Common Stock, $0.01 par value per share |
|
The Nasdaq Global Select Market |
Securities registered pursuant to Section 12(g) of the Act: None
Indicate by check mark if the registrant is a well-known seasoned issuer, as defined in Rule 405 of the Securities Act. Yes ☒ No ☐
Indicate by check mark if the registrant is not required to file reports pursuant to Section 13 or Section 15(d) of the Act. Yes ☐ No ☒
Indicate by check mark whether the registrant (1) has filed all reports required to be filed by Section 13 or 15(d) of the Securities Exchange Act of 1934 during the preceding 12 months (or for such shorter period that the Registrant was required to file such reports), and (2) has been subject to such filing requirements for the past 90 days. Yes ☒ No ☐
Indicate by check mark whether the registrant has submitted electronically and posted on its corporate Web site, if any, every Interactive Data File required to be submitted and posted pursuant to Rule 405 of Regulation S-T during the preceding 12 months (or for such shorter period that the registrant was required to submit and post such files. Yes ☒ No ☐
Indicate by check mark if disclosure of delinquent filers pursuant to Item 405 of Regulation S-K is not contained herein, and will not be contained, to the best of registrant’s knowledge, in definitive proxy or information statements incorporated by reference in Part III of this Form 10-K or any amendment to this Form 10-K. ☐
Indicate by check mark whether the registrant is a large accelerated filer, an accelerated filer, a non-accelerated filer, a smaller reporting company, or an emerging growth company. See the definitions of “large accelerated filer,” “accelerated filer,” “smaller reporting company” and “emerging growth company” in Rule 12b-2 of the Exchange Act. (Check one):
|
Large accelerated filer |
☒ |
|
Accelerated filer |
☐ |
|
Non-accelerated filer |
☐ |
(Do not check if a smaller reporting company) |
Smaller reporting company |
☐ |
|
|
|
|
Emerging growth company |
☐ |
If an emerging growth company, indicate by check mark if the registrant has elected not to use the extended transition period for complying with any new or revised financial accounting standards provided pursuant to Section 13(a) of the Exchange Act. ☐
Indicate by check mark whether the registrant is a shell company (as defined in Rule 12b-2 of the Exchange Act). Yes ☐ No ☒
As of June 30, 2017, the aggregate market value of the registrant’s common stock held by non-affiliates was $6,638,369,265 based on the closing sale price per share of the registrant’s common stock on The Nasdaq Global Select Market on such date.
There were 206,631,365 shares of the registrant’s common stock outstanding as of February 16, 2018.
DOCUMENTS INCORPORATED BY REFERENCE:
Part III of this annual report on Form 10-K incorporates by reference certain information from the registrant’s definitive proxy statement for the 2018 annual meeting of stockholders, which the registrant intends to file pursuant to Regulation 14A with the Securities and Exchange Commission not later than 120 days after the registrant’s fiscal year end of December 31, 2017. With the exception of the sections of the definitive proxy statement specifically incorporated herein by reference, the definitive proxy statement is not deemed to be filed as part of this annual report on Form 10-K.
SS&C TECHNOLOGIES HOLDINGS, INC.
ANNUAL REPORT ON FORM 10-K
For the Fiscal Year Ended December 31, 2017
TABLE OF CONTENTS
|
|
|
Page |
|
|
||
|
Item 1. |
4 |
|
|
Item 1A. |
17 |
|
|
Item 1B. |
30 |
|
|
Item 2. |
30 |
|
|
Item 3. |
31 |
|
|
Item 4. |
31 |
|
|
|
|
|
|
|
||
|
Item 5. |
32 |
|
|
Item 6. |
34 |
|
|
Item 7. |
Management’s Discussion and Analysis of Financial Condition and Results of Operations |
35 |
|
Item 7A. |
49 |
|
|
Item 8. |
50 |
|
|
Item 9. |
Changes in and Disagreements with Accountants on Accounting and Financial Disclosure |
86 |
|
Item 9A. |
86 |
|
|
Item 9B. |
86 |
|
|
|
|
|
|
|
||
|
Item 10. |
87 |
|
|
Item 11. |
87 |
|
|
Item 12. |
Security Ownership of Certain Beneficial Owners and Management and Related Stockholder Matters |
87 |
|
Item 13. |
Certain Relationships and Related Transactions, and Director Independence |
87 |
|
Item 14. |
87 |
|
|
|
|
|
|
|
||
|
Item 15. |
88 |
|
|
Item 16. |
91 |
|
Explanatory Note
On June 24, 2016, SS&C Technologies Holdings, Inc. completed a two-for-one stock split, effected in the form of a stock dividend. All share and per share amounts (other than for the Company’s Class A non-voting common stock which, as described herein, had been converted to shares of our common stock prior to the two-for-one stock split) have been retroactively restated for all periods presented to reflect the stock split.
2
Certain statements contained in this annual report constitute forward-looking statements for purposes of the safe harbor provisions under the Private Securities Litigation Reform Act of 1995. All statements contained herein that are not statements of historical fact are forward-looking statements, including, without limitation, statements regarding future financial performance, funding requirements and liquidity; management’s plans and strategies for future operations, including statements relating to anticipated operating performance, cost reductions, competitive strengths or market position, acquisitions and related synergies; growth, declines and other trends in markets we sell into; the anticipated impact of adopting new accounting pronouncements; the anticipated outcome of outstanding claims, legal proceedings, tax audits and other contingent liabilities; foreign currency exchange rates and fluctuations in those rates; general economic conditions; assumptions underlying any of the foregoing; and any other statements that address events or developments that we intend or believe will or may occur in the future. The forward-looking statements contained herein also include statements about the expected effects on the Company of the proposed acquisition of DST Systems, Inc. (“DST”), the expected timing and conditions precedent relating to the proposed acquisition of DST, anticipated earnings enhancements, synergies, and other strategic options. Without limiting the foregoing, the words “believes”, “anticipates”, “plans”, “expects”, “estimates”, “projects”, “forecasts”, “may”, “assume”, “intend”, “will”, “continue”, “opportunity”, “predict”, “potential”, “future”, “guarantee”, “likely”, “target”, “indicate”, “would”, “could” and “should” and similar expressions are intended to identify forward-looking statements, although not all forward-looking statements are accompanied by such words. Forward-looking statements are not guarantees of future performance and actual results may differ materially from those envisaged by such forward-looking statements. The factors discussed under “Item 1A. Risk Factors”, among others, could cause actual results to differ materially from those indicated by forward-looking statements made herein and presented elsewhere by management from time to time. You should not place undue reliance on any such forward-looking statements. Forward-looking statements speak only as of the date of the report, document, press release, webcast, call or other communication in which they are made. We expressly disclaim any obligation to update our forward-looking statements, whether as a result of new information, future events or circumstances, or otherwise, except as required by law.
The following are some of our registered trademarks and/or service marks in the U.S. and/or in other countries: ADVENT, ADVENT CORPORATE ACTIONS, ADVENT CUSTODIAL DATA, ADVENT ONDEMAND, ADVENT PORTFOLIO EXCHANGE, ADVENT REVENUE CENTER, ADVISORWARE, AXYS, BENEFIX, BLACK DIAMOND, DBC, DEAL MACROS, DEAL WORKSHEETS, FIXLINK, FUNDRUNNER, GENEVA, GLOBEOP, GLOBEOP HEDGE FUND INDEX, GOREC, GORISK, MARGINMAN, MAXIMIS, MOXY, PACER, PAGES, PORTIA, PORTPRO, PRO-JECT, RECON, SKYLINE, SYNCOVA, SYLVAN, TAMALE, TAMALE RMS, TRADETHRU, TRADEWARE, and ZOOLOGIC. SS&C Technologies Holdings, Inc. and/or its subsidiaries in the U.S. and/or in other countries have trademark or service mark rights to certain other names and marks referred to in this annual report.
SS&C Technologies Holdings, Inc., or “SS&C Holdings,” is our top-level holding company. SS&C Technologies, Inc., or “SS&C,” is our primary operating company and a wholly-owned subsidiary of SS&C Technologies Holdings, Inc. “We,” “us,” “our” and the “Company” mean SS&C Technologies Holdings, Inc. and its consolidated subsidiaries, including SS&C.
Unless context otherwise requires, references to our “common stock” includes both shares of our common stock and shares of our Class A non-voting common stock.
3
Overview
We are a leading provider of mission-critical, sophisticated software products and software-enabled services that allow financial services providers to automate complex business processes and effectively manage their information processing requirements. Our portfolio of software products and rapidly deployable software-enabled services allows our clients to automate and integrate front-office functions such as trading and modeling, middle-office functions such as portfolio management and reporting, and back-office functions such as accounting, performance measurement, reconciliation, reporting, processing and clearing. Our solutions enable our clients to focus on core operations, better monitor and manage investment performance and risk, improve operating efficiency and reduce operating costs. We provide our solutions globally to approximately 11,000 clients, principally within the institutional asset and wealth management, alternative investment management, financial advisory and financial institutions vertical markets. In addition, our clients include commercial lenders, real estate investment trusts (“REITs”), corporate treasury groups, insurance and pension funds, municipal finance groups and real estate property managers.
We provide the global financial services industry with a broad range of software-enabled services, which consist of software-enabled outsourcing services and subscription-based on-demand software that are managed and hosted at our facilities, and specialized software products, which are deployed at our clients’ facilities. Our software-enabled services, which combine the strengths of our proprietary software with our domain expertise, enable our clients to contract with us to provide many of their mission-critical and complex business processes. For example, we utilize our software to offer comprehensive fund administration services for alternative investment managers, including fund manager services, transfer agency services, funds-of-funds services, tax processing and accounting. We offer clients the flexibility to choose from multiple software delivery options, including on-premise applications and hosted, multi-tenant or dedicated applications. Additionally, we provide certain clients with targeted, blended solutions based on a combination of our various software and software-enabled services. We believe that our software-enabled services provide superior client support and an attractive alternative to clients that do not wish to install, manage and maintain complicated financial software.
Our business model is characterized by substantial contractually recurring revenues, high operating margins and significant cash flow. We generate revenues primarily through our high-value software-enabled services, which are typically sold on a long-term subscription basis and integrated into our clients’ business processes. Our software-enabled services are generally provided under contracts with initial terms of one to five years that require monthly or quarterly payments and are subject to automatic annual renewal at the end of the initial term unless terminated by either party. We also generate revenues by licensing our software to clients through either perpetual or term licenses and by selling maintenance services. Maintenance services are generally provided under annually renewable contracts. As a consequence, a significant portion of our revenues consists of subscription payments and maintenance fees and is contractually recurring in nature. Our pricing typically scales as a function of our clients’ assets under management, the complexity of asset classes managed, the volume of transactions, and the level of service the client requires.
Our contractually recurring revenue model helps us minimize the fluctuations in revenues and cash flows typically associated with up-front, perpetual software license revenues and enhances our ability to manage costs. Our contractually recurring revenues, which include our software-enabled services and maintenance and term licenses revenues, represented 94% of total revenues in the year ended December 31, 2017. We have experienced average revenue retention rates in each of the last five years of greater than 90% on our software-enabled services and maintenance and term licenses contracts for our core enterprise products. We believe that the high value-added nature of our products and services has enabled us to maintain our high revenue retention rates and significant operating margins.
We generated revenues of $1,675.3 million for the year ended December 31, 2017 as compared to revenues of $1,481.4 million for the year ended December 31, 2016. In 2017, we generated 78% of our revenues from clients in North America and 22% from clients outside North America. Our revenues are highly diversified, with our largest client in 2017 accounting for less than 2% of our revenues. Additional financial information, including geographic information, is available in our Consolidated Financial Statements and Note 13 to our Consolidated Financial Statements.
Our Industry
We serve a number of vertical markets within the financial services industry, including alternative investment funds, investment management firms, insurance companies, registered investment advisors (“RIAs”), wealth managers, banks and brokerage firms. We believe that financial services providers will increasingly turn to information technology (“IT”) solutions, provided by an independent vendor, as a result of economic challenges and heightened regulatory requirements. Financial service firms are in a search for more
4
risk-averse business strategies, simplified regulatory compliance, and full service solutions provided by a single vendor. As a result, we believe the financial services industry will continue to invest in IT and outsourcing solutions in 2018.
Market Trends
The demand for our products and services comes from a number of distinct sources: new hedge fund, private equity, real assets, and RIA formation, new business lines and combinations of business lines at existing clients, replacement of legacy in-house operations and competitor systems and expansion of our existing client relationships. Underlying these demand drivers are several industry trends, including:
|
|
● |
Asset Classes and Securities Products Growing in Volume and Complexity. Investment professionals must increasingly track and invest in numerous asset classes that are far more complex than traditional equity and debt instruments. These assets require more sophisticated systems to automate functions such as trading and modeling, portfolio management, accounting, performance measurement, reconciliation, reporting, processing and clearing. Manual tracking of orders and other transactions is not effective for these assets. In addition, as the business knowledge requirements increase, financial services firms see increasing value in outsourcing the management of these assets to firms such as SS&C that offer software-enabled services. |
|
|
● |
Regulatory changes. Our clients must comply with rules, regulations, directives, and standards from governmental and self-regulating organizations. Even years after the enactment of the U.S. Dodd-Frank Wall Street Reform and Consumer Protection Act (“Dodd-Frank Act”), Form Private Fund, the European Union’s Alternative Investment Fund Managers Directive (“AIFMD”), the U.S. Foreign Account Tax Compliance Act, the European Market Infrastructure Regulation and other local reforms, many of the rules are still being defined. We have also seen new regulation impacting our clients operations, including Markets in Financial Instruments Directive (“MiFID II”), Securities and Exchange Commission (“SEC”) Modernization (Forms “N-LIQUID”, “N-PORT”, “N-CEN”), and AEOIS. We expect regulatory changes to increase the complexity of compliance and the demand for our products and services and motivate clients to develop systems infrastructure and research management processes to comply with regulatory requirements. |
|
|
● |
Technological paradigm shift. We have recently seen an increased demand for software delivery options, including cloud-based services, social collaboration and information access through mobile devices. Cloud solutions allow firms to use a broader range of capabilities without incurring implementation or maintenance costs, with software that can be upgraded with limited disruption to a company’s current operations. Accessibility and demands for collaboration is also a key driver of cloud adoption. Mobility is increasingly relevant for the investment management industry and therefore we believe clients have increased expectations of anytime, anywhere access to portfolio and client data, as well as the ability to communicate and collaborate. New technology incorporating machine learning and Robotic Process Automation (“RPA”) are gaining traction in the financial technology industry. We believe that these next generation tools will increase efficiency, reduce errors, and enable complex financial record keeping without human intervention. |
|
|
● |
Increased demands for transparency, efficiency, and risk management. Firms continue to focus on operational risk, resulting from discoveries of fraud and mismanagement during the 2008-2012 U.S. financial crisis and concerns regarding transparency and counterparty exposure. This continued focus has led investment management firms to strive to provide investment data accurately, institutionalize investment operations, and automate their investment process. On the wealth management and advisory sides of our business, we have seen further evolution of the relationship between the end client and a firm, with investors demanding transparency and a customized client experience. We expect that wealth managers will need to become familiar with their clients’ preferences for account access and communication and cater to them. Finally, both institutional and individual investors, faced with increasingly competitive low-fee and automated options, are pushing investment managers for greater efficiencies and lower fees. |
Competitive Strengths
The following are our core strengths that we believe enable us to differentiate ourselves in the markets we serve:
Enhanced capability through software ownership.
We use our proprietary software products and infrastructure to provide our software-enabled services, strengthening our overall operating margins and providing a competitive advantage. Because we primarily use our own proprietary software in the execution of our software-enabled services and generally own and control our products’ source code, we can quickly identify and deploy product improvements and respond to client feedback, enhancing the competitiveness of our software and software-enabled service offerings. This continuous feedback process provides us with a significant advantage over many of our competitors, specifically those software competitors that do not provide a comparable model and therefore do not have the same level of hands-on experience with their products.
5
Global industry leader with strong market position focused on software and software-enabled services for the financial industry.
We are a global business providing a broad portfolio of approximately 90 software products and software-enabled services and have 81 offices worldwide. As of December 31, 2017, we had 7,448 development, service and support professionals with significant expertise across the industries that we serve and a deep working knowledge of our clients’ businesses. We provide highly flexible, scalable and cost-effective solutions that enable our clients to track complex securities, better employ sophisticated investment strategies, scale efficiently and meet evolving regulatory requirements. We believe our product and service offerings position us as a leader within the specific verticals of the financial services software and services market in which we compete. Our products and services allow our clients to automate and integrate their front-office, middle-office and back-office functions, thus enabling straight-through processing that increases productivity and reduces costs.
Trusted provider to our highly diversified and growing client base.
By providing mission-critical, reliable software products and services for over 30 years, we have become a trusted provider to the financial services industry. We have developed a large and growing installed base within multiple segments of the financial services industry. Our clients include some of the largest and most well-recognized firms in the financial services industry. We believe that our high-quality products and superior services have led to long-term client relationships, some of which date from our earliest days of operations. Our strong client relationships, coupled with the fact that many of our current clients use our products for a relatively small portion of their total funds and investment vehicles under management, provide us with a significant opportunity to sell additional solutions to our existing clients and drive future revenue growth at lower cost.
#1, Publically-traded, independent fund administration services.
The third-party service providers that participate in the alternative investment market include fund managers, auditors, fund administrators, attorneys, custodians and prime brokers. Each provider performs a valuable function with the intention of providing transparency of the fund’s assets and the valuation of those assets. Conflicts of interest may arise when the above parties attempt to provide more than one of these services. The industry is increasingly recognizing these conflicts and, as a result, seeking independent fund administrators such as SS&C. As a publically traded company, our clients and prospects have access to our 10-Qs and 10-Ks filed with the SEC, giving them transparency into our overall financial strength.
Experienced management team with strong integrating and operating track record.
Our senior management team has a track record of operational excellence and an average of more than 20 years of experience in the software and financial services industries, and a proven ability to acquire and integrate complementary businesses, as demonstrated by the 49 businesses we have acquired since 1995. By leveraging our domain expertise and knowledge, we have developed, and continue to improve, our mission-critical software products and services to enable our clients to overcome the complexities inherent in their businesses. All of our senior executives are compensated based upon the Company’s financial success.
Business Strategies
Our strategy is to continue to deliver compelling solutions and value propositions to our customers in the software and software-enabled services market. The following are key elements to our strategy for achieving this objective:
Build upon and extend our leadership position in software and software-enabled services in the financial industry.
Since our founding in 1986, we have focused on building substantial financial services domain expertise through close working relationships with our clients. We have developed a deep knowledge base that enables us to respond to our clients’ most complex financial, accounting, actuarial, tax and regulatory needs. We intend to maintain and enhance our technological leadership by using our domain expertise to build valuable new software-enabled services and solutions, continuing to invest in internal development and opportunistically acquiring products and services that address the highly specialized needs of the financial services industry.
Our internal product development team works closely with marketing and client service personnel to ensure that product evolution reflects developments in the marketplace and trends in client requirements. In addition, we intend to continue to develop our products in a cost-effective manner by leveraging common components across product families. We believe that we enjoy a competitive advantage because we can address the investment and financial management needs of high-end clients by providing industry-tested products and services, including cloud-based services and related mobility platforms that meet global market demands and enable our clients to automate and integrate their front-, middle- and back-office functions for improved productivity, reduced manual intervention and bottom-line savings. SS&C’s products are sold to a diverse group of clients from niche players in the financial services industry to the largest institutions in the world. Furthermore, our client base of approximately 11,000 clients represents a fraction of the total number of financial services providers globally. We believe there is opportunity to grow our client
6
base over time as our products become more widely adopted. We believe we also have an opportunity to capitalize on the increasing adoption of outsourcing mission-critical operations by financial services providers as they continue to replace inadequate legacy solutions and custom in-house solutions that are inflexible and costly to maintain. Our software-enabled services revenues increased from $670.2 million for the year ended December 31, 2015 to $1,114.0 million for the year ended December 31, 2017, representing a compound annual growth rate of 28.9%.
Capitalize on longer-term secular growth trends.
With our global footprint and best-in-class product offerings, we aim to capture a significant share of the IT spend of alternative asset, institutional asset and wealth managers through leveraging the deeply embedded service offering we provide and outdistancing the competition. We expect regulatory changes to increase the complexity of compliance and the demand for our products and services, as well as motivate clients to develop infrastructure and research management processes to mitigate regulatory exposure. We plan to benefit from the growing software spend in the increasingly complex and more highly regulated financial services landscape.
Continue to capitalize on acquisitions of complementary businesses and technologies.
We intend to continue to employ a highly disciplined and focused acquisition strategy to broaden and enhance our product and service offerings, expand our intellectual property portfolio, add new clients and supplement our internal development efforts. We believe our acquisitions have been an extension of our research and development effort that has enabled us to purchase proven products and remove the uncertainties associated with software development projects. We will seek to opportunistically acquire, at reasonable valuations, businesses, products and technologies in our existing or complementary vertical markets that will enable us to better satisfy our clients’ rigorous and evolving needs. We have a proven ability to integrate complementary businesses as demonstrated by the 49 businesses we have acquired since 1995. Our experienced senior management team leads a rigorous evaluation of our targets to ensure that they satisfy our product or service needs and will successfully integrate with our business while meeting our targeted financial goals. As a result, our acquisitions have contributed marketable products or services that have added to our revenues. Through the broad reach of our direct sales force and our large installed client base, we believe we can market these acquired products and services to a large number of prospective clients. Additionally, we have been able to improve the operational performance and profitability of our acquired businesses, creating significant value for our stockholders.
Strengthen our international presence.
We believe that there is a significant market opportunity to provide software and services to financial services providers outside North America. In the year ended December 31, 2017, we generated 22% of our revenues from clients outside North America. We are building our international operations in order to increase our sales outside North America. We plan to continue to expand our international market presence by leveraging our existing software products and software-enabled services. We also plan to leverage our growing presence in Asia Pacific as a result of recent acquisitions. We believe this region presents a compelling growth opportunity.
Increase profitability through margin expansion.
We have a proven track record of increasing operating margins both organically and inorganically. We expect to continue to improve margins through cost reductions, operating efficiencies, and realization of cost synergies. We also expect to drive increased margins through delivering innovative end-to-end solutions that provide significant value to customers and warrant premium pricing. We have significant scale with best-in-class solutions and software-enabled services across the delivery spectrum, which we believe, combined with a diversified service offering and client base, drives stable revenues and increased operating leverage. Our operating flexibility allows us to scale our costs based on client demands. Additionally, our low capital expenditure and working capital requirements further drive strong cash flow conversions.
Our Acquisitions
As mentioned above, we intend to continue to employ a highly disciplined and focused acquisition strategy. Our past acquisitions have enabled us to expand our product and service offerings into new markets or client bases within the financial services industry. The addition of new products and services has also enabled us to market other products and services to acquired client bases. We believe our acquisitions have been an extension of our research and development effort and have enabled us to add to our product and service offerings without incurring the uncertainties sometimes associated with software development projects.
Since 1995, we have acquired 49 businesses within our industry. These acquisitions have contributed marketable products and services, which have added to our revenues and earnings. We have generally been able to improve the operating performance and profitability of our acquired businesses. We seek to reduce the costs of the acquired businesses by consolidating sales and marketing
7
efforts and by eliminating redundant administrative tasks and research and development expenses. In many cases, we have also been able to increase revenues generated by acquired products and services by leveraging our existing products and services, larger sales capabilities and client base.
We generally seek to acquire companies that satisfy our financial metrics, including expected return on investment. Through our acquisitions, we seek companies that:
|
|
● |
provide complementary products or services in the financial services industry; |
|
|
● |
possess proven technology and an established client base that will provide a source of ongoing revenue and to whom we may be able to sell existing products and services; |
|
|
● |
expand our intellectual property portfolio to complement our business; |
|
|
● |
address a highly specialized problem or a market niche in the financial services industry; |
|
|
● |
expand our global reach into strategic geographic markets; and |
|
|
● |
have solutions that lend themselves to being delivered as software-enabled services. |
We believe, based on our experience, that there are numerous solution providers addressing highly particularized financial services needs or providing specialized services that would meet our disciplined acquisition criteria.
Acquisitions are discussed further in Liquidity and Capital Resources and in Note 11 to our Consolidated Financial Statements. The following table provides a list of the most substantial acquisitions we have made since 1995 (in thousands):
|
Acquisition Date |
|
Acquired Business |
|
Contract Purchase Price |
|
|
Acquired Capabilities, Products and Services |
|
|
February 2005 |
|
EisnerFast |
|
$ |
25,300 |
|
|
Expanded fund administration services to the hedge fund and private equity markets |
|
April 2005 |
|
Financial Models Company |
|
$ |
159,000 |
|
|
Expanded front-, middle- and back-office products and services to the investment management industry including Pacer, Pages, Recon and Sylvan products |
|
October 2005 |
|
Open Information Systems |
|
$ |
24,000 |
|
|
Entered money market, custody and security lending market with Global Debt Manager, Information Manager and Money Market Manager products |
|
November 2009 |
|
TheNextRound |
|
$ |
21,000 |
|
|
Expanded private equity client base with TNR Solution product |
|
December 2009 |
|
Tradeware |
|
$ |
22,500 |
|
|
Expanded electronic trading offering in broker/dealer market |
|
December 2010 |
|
TimeShareWare |
|
$ |
30,500 |
|
|
Added shared ownership property management platform to real estate offering |
|
May 2012 |
|
Thomson Reuters’ PORTIA Business |
|
$ |
170,000 |
|
|
Added portfolio management software and outsourcing services for institutional managers |
|
June 2012 |
|
GlobeOp Financial Services S.A. |
|
$ |
834,400 |
|
|
Expanded fund administration services in hedge fund and other asset management sectors |
|
November 2014 |
|
DST Global Solutions |
|
$ |
95,000 |
|
|
Added investment management software and services |
|
July 2015 |
|
Advent Software, Inc. |
|
$ |
2,600,000 |
|
|
Expanded global investment management software and services |
|
September 2015 |
|
Varden Technologies |
|
$ |
25,000 |
|
|
Added cloud-based client and advisor communication solutions for investment firms |
|
November 2015 |
|
Primatics Financial |
|
$ |
116,000 |
|
|
Added cloud-based integrated risk, compliance and finance solution for the banking industry |
|
March 2016 |
|
Citigroup's Alternative Investor Service |
|
$ |
425,000 |
|
|
Expanded fund administration services in hedge fund and private equity sectors |
|
December 2016 |
|
Wells Fargo's Global Funds Service |
|
$ |
75,050 |
|
|
Expanded fund administration services in hedge fund and private equity sectors |
|
December 2016 |
|
Conifer Financial Services, LLC |
|
$ |
88,500 |
|
|
Expanded fund administration services in hedge fund and other asset management sectors |
|
October 2017 |
|
CommonWealth Fund Services Ltd. |
|
$ |
16,400 |
|
|
Expanded fund administration services in hedge fund and private equity sectors |
8
On January 11, 2018, the Company and DST Systems, Inc. (“DST”) announced that they had entered into a definitive agreement wherein the Company will acquire DST. Under the terms of the agreement, the Company will acquire DST for an enterprise value of approximately $5.4 billion, comprising $84 per share of DST common stock in cash plus the assumption of debt. The closing, which is expected to occur by the third quarter of 2018, remains subject to DST stockholder approval, clearances by relevant regulatory authorities and satisfaction of customary closing conditions. The Company plans to fund the acquisition and refinance certain of the Company’s existing debt and all of DST’s existing debt with a combination of debt and equity. DST is a global provider of specialized technology, strategic advisory and business operations outsourcing to the financial services and healthcare industries.
Products and Services
Our products and services allow professionals in the financial services industry to automate complex business processes within financial services providers and are instrumental in helping our clients manage significant information processing requirements. Our solutions enable our clients to focus on core operations, better monitor and manage investment performance and risk, improve operating efficiency and reduce operating costs. Our portfolio of approximately 90 products and software-enabled services allows our clients to automate and integrate front-office functions such as trading and modeling, middle-office functions such as portfolio management and reporting, and back-office functions such as accounting, performance measurement, reconciliation, reporting, processing and clearing.
Software-enabled Outsourcing Services
SS&C provides a range of software-enabled outsourcing services that include fund administration, managed services with our world-class data centers, and technology and operations outsourcing.
SS&C GlobeOp. We provide comprehensive on- and offshore fund administration services to hedge fund and other alternative investment managers using our proprietary software products. SS&C GlobeOp offers fund manager services, transfer agency services, funds-of-funds services, tax processing, compliance services and accounting processing. SS&C GlobeOp supports all fund types and investment strategies. Our proprietary modules, “Go-Apps” including GoTrade+ and GoRisk, target specific processes in the post-trade investment cycle and are fully integrated within the SS&C GlobeOp service. Market segments served include hedge funds, funds-of-funds, private equity, and real assets firms.
Black Diamond. Black Diamond offers independent advisors and wealth managers a cloud-based portfolio management platform with aggregation, customizable reporting and rebalancing, and daily reconciliation features. As a cloud-based product offering, advisors can access Black Diamond’s customizable portfolio management and reporting online from anywhere, anytime without the need to maintain costly technology infrastructures. Black Diamond also provides outsourced daily reconciliation and data management services so firms can focus their efforts on servicing clients and growing their business rather than managing complex back office functions.
Advent OnDemand. SS&C Advent OnDemand is the SaaS delivery of SS&C Advent’s suite of asset management solutions, which are hosted either by Advent or a third-party and are offered with or without data management services. Data management services include full account aggregation, daily portfolio reconciliation, corporate actions processing and reference data management.
SS&C Direct. We provide comprehensive software-enabled services through our SS&C Direct operating unit for portfolio accounting, reporting and analysis functions. Since 1997, SS&C Direct has offered ASP, business process outsourcing (“BPO”) and blended outsourcing services to institutional asset managers, insurance companies, hedge funds and financial institutions. The SS&C Direct service includes full BPO investment accounting and operations services, the hosting of a company’s application software, automated workflow integration and quality control mechanisms, and extensive interface and connectivity services to custodian banks, data service providers, depositories, and other external entities.
Evare. Evare is a leader in financial data acquisition, transformation and delivery services. Global managed services connect our clients and their counterparties using each firm’s preferred method of connectivity, custom data formats, and industry standards. All parties utilize their existing systems and protocols without having to upgrade or install software.
e-Investor. SS&C’s e-Investor provides an end-to-end investor transaction processing platform designed to automate the delivery, completion, submission, and tracking of all investor transactions. When coupled with SS&C’s e-Fulfillment, the solution can deliver targeted marketing material and subscription documents through a secure web interface to potential investors, with detailed activity tracking. Once delivered, the prospect (or financial advisor) can complete the subscription document online, leveraging e-Investor’s extensive and flexible data validation and dependency rules.
9
SSCNet. SSCNet is a global trade network linking investment managers, broker-dealers, clearing agencies, custodians and interested parties. SSCNet’s real-time trade matching utility and delivery instruction database facilitate integration of front-, middle- and back-office functions, reducing operational risk and costs.
SVC. SVC is a single source for securities data that consolidates data from leading global sources to provide clients with the convenience of one customized data feed. SVC provides clients with seamless, timely and accurate data for pricing, corporate actions, dividends, interest payments, foreign exchange rates and security master for global financial instruments.
FIXLink. FIXLink is a large, multi-asset FIX connectivity network for IOIs, trades, orders, and allocations, providing a reliable broker-neutral and platform-neutral FIX connectivity service to broker-dealers and institutions.
Portfolio management/accounting software
Our products and services for portfolio management span most of our vertical markets and offer our clients a wide range of investment management solutions. Some of our portfolio management products include:
Geneva. Geneva is a global portfolio management platform designed to meet the real-time needs of global asset managers, hedge funds, prime brokers, fund administrators, private equity firms and family offices worldwide. Geneva integrates all phases of the investment management process – portfolio management, reconciliation and light trade capture and risk capabilities. Its “main memory” database offers more accurate and flexible reporting, and eliminates batch processing and time-consuming error corrections. Geneva enables firms to grow into new markets, deliver greater operational efficiencies, enhance investor service, process high trade volumes across multiple securities, improve compliance and security, and lower operating costs and risks.
Advent Portfolio Exchange. Advent Portfolio Exchange (“APX”) is a comprehensive portfolio management solution for asset managers and wealth managers worldwide, which integrates the front-office functions of prospecting, marketing, customer relationship management and internal business management with the back office operations of portfolio accounting, performance measurement and reporting. It allows firms to manage both high-net-worth and institutional clients through a comprehensive range of capabilities, including customized reporting, automated report packaging, and performance analytics. APX can be deployed locally as well as the cloud.
Global Wealth Platform. A web-based service, Global Wealth Platform combines our core asset management product functions with an innovative, easy-to-use interface. Global Wealth Platform provides an integrated suite with key components — modeling, trading, portfolio accounting, client communications and other mission critical workflows — as an on-demand, software-enabled service.
PORTIA. PORTIA is a comprehensive middle-to-back-office software solution designed to streamline the operations of global investment managers. PORTIA’s functionality supports a broad range of global asset types, fixed income analytics & analysis, multi-currency transaction processing, corporate actions and presentation-quality reporting implemented with flexible deployment options. Built on an open architecture, PORTIA enables real-time integration with other systems, applications, data providers and counterparties to run operations more efficiently and effectively.
HiPortfolio. HiPortfolio is an investment accounting and asset servicing solution. It provides full life cycle processing including comprehensive investment and fund accounting capabilities, flexible transaction processing from order capture to post-trade activity, and proven support for middle- and back-office operations.
CAMRA. CAMRA (Complete Asset Management, Reporting and Accounting) software supports the integrated management of asset portfolios by investment professionals operating across a wide range of institutional investment entities. CAMRA is a multi-user, integrated solution tailored to support the entire portfolio management function and includes features to execute, account for and report on all typical securities transactions.
Pacer. Pacer is a portfolio management and accounting system designed to manage diversified global portfolios and meet the unique management and accounting needs of all business streams, from institutional and pension management, to separately managed accounts, private client portfolios, mutual funds and unit trusts.
TNR Solution. TNR Solution is a software product for private equity, hedge funds, funds of hedge funds and family offices. Built around Microsoft’s .NET platform, the product gives end users the flexibility to manage all aspects of their operations from contact management, fund raising, investor relations, fund, portfolio and deal management, general ledger and reporting.
10
Total Return. Total Return is a portfolio management and partnership accounting system directed toward the hedge fund and family office markets. It is a multi-currency system, designed to provide financial and tax accounting and reporting for businesses with high transaction volumes.
AdvisorWare. AdvisorWare software supports hedge funds, funds-of-funds and family offices with sophisticated global investment, trading and management concerns, and/or complex financial, tax, partnership and allocation reporting requirements. It delivers comprehensive multicurrency investment management, financial reporting, performance fee calculations, net asset value calculations, contact management and partnership accounting in a straight-through processing environment.
Axys. Axys is a turnkey portfolio management and reporting system for small to mid-size investment management organizations. Axys provides investment professionals with broad portfolio accounting functionality on a variety of investment instruments, including equities, fixed income, mutual funds and cash. By using Axys, clients have a timely decision support tool with immediate access to portfolio holdings, asset allocation, realized and unrealized gains and losses, actual and projected income and other data including performance measurement and flexible reporting.
Debt & Derivatives. Debt & Derivatives is a comprehensive financial application software package designed to process and analyze all activities relating to derivative and debt portfolios, including pricing, valuation and risk analysis, derivative processing, accounting, management reporting and regulatory reporting. Debt & Derivatives delivers real-time transaction processing to treasury and investment professionals, including traders, operations staff, accountants and auditors.
MAXIMIS. MAXIMIS is a real-time intranet-enabled portfolio management solution for insurance companies, pension funds and institutional asset managers. Its key product functions include portfolio analysis, investment management, trade processing, cash processing, multi-currency accounting, regulatory reporting, operations and analysis and management reporting.
Recon. Recon is a transaction, position and cash reconciliation system that streamlines reconciliation by identifying exceptions and providing effective workflow tools to resolve issues faster, thereby reducing operational risk. Recon automatically reconciles transactions, holdings and cash from multiple sources.
Performance measurement and attribution
Our performance measurement and attribution solutions calculate rates of return, attribution, composite returns, and ex-post risk measures. These solutions better explain investment strategies and performance to our clients’ investors, giving them greater transparency into their portfolios.
Sylvan. Sylvan is a performance measurement, attribution and composite management platform that is designed to streamline the calculation and reporting of performance measurement requirements.
Insight. Insight is a web-based performance measurement and attribution solution that combines in-depth analytical capabilities with cutting-edge visualization technology. Insight brings clarity to alternative investment firm’s performance analytic with interactive visual displays, benchmark customization, presentation formation, and fulfills GIPs compositing, reporting, and compliance requirements.
Anova. SS&C Anova acts as a central data hub, consolidating and aggregating critical holding, position and transaction data in near real time. Its robust performance and attribution engine provides a detailed breakdown of the sources of risk and return from portfolio holdings, enabling clients to understand and react to their portfolio performance.
Banking and Lending Solutions
SS&C offers end-to-end banking and lending solutions to support the full range of types, including commercial and syndicated, consumer direct, auto, mortgage and lines of credit. Our solutions help streamline and modernize loan operations, bringing “future-proof” flexibility, scalability and transparency to the management of loan assets.
Precision LM. Precision LM is a single database application that provides comprehensive commercial loan management from initial request to final disposition. It is a fully integrated system that supports both loan origination and servicing, and offers a single point of entry that increases efficiency by eliminating redundant data, reducing errors and lowering maintenance and operating costs. Precision LM offers a centralized loan portfolio that maintains a detailed loan history and audit trail from inception and generate comprehensive loan portfolio reporting from a single database, giving the client ability to proactively measure and mitigate risk
11
through the integrated portfolio analytics. Precision LM is fully integrated with commercial mortgage-backed securities (“CMBS”), including complete CMBS pooling, servicing, advances, recoveries and Commercial Mortgage Securities Association reporting.
SS&C Primatics. SS&C Primatics automates processes, enables compliance with changing regulations, and accurate data analysis that is aimed to improve real-time decision-making. The SS&C Primatics Evolv product eliminates the manual processes and spreadsheets by automating all of the loan accounting functions (data, calculations, processes, workflows and reporting) that are not being addressed by core banking systems.
Global Debt Manager (“GDM”). GDM is a suite of industry-leading solutions, seamlessly integrated under a common core with single-sign on. GDM enables global banks and securities firms to streamline global registrar and transfer and paying agency operations, providing a full range of corporate trust support, encompassing money market issuance, long-term debt and common depository, with multi-currency and local market support world-wide. The GDM suite includes Long-term debt manager, Common Depository Manager, GDM Match, and Money Market Manager.
Global Treasury Manager (“GTM”). GTM is a suite of industry-leading solutions designed specifically to meet the needs of broker/dealers, credit unions, and banks. SS&C’s solutions for financial institutions include fixed-income securities trading, safekeeping, money market processing, collateral management, repo processing, portfolio accounting and analytics as well as asset/liability management. GTM’s suite of products include TradeThru, MarginMan, Lightning, and PortPro.
Trading and Treasury operations
Our comprehensive real-time trading systems offer a wide range of trade order management solutions that support both buy-side and sell-side trading. Our full-service trade processing systems deliver comprehensive processing for global treasury and derivative operations. Solutions are available to clients either through a license or as a software-enabled service. Some of our trading and treasury operations products include:
Moxy. Moxy automates and streamlines the portfolio construction, trading and order management process for the investment management community. Moxy also provides internet-ready electronic order routing based on the industry standard FIX messaging protocol so that users can route trades electronically to any FIX-compliant broker, crossing networks, and various dark pools of liquidity that supports the internet or other TCP/IP connections. Trades are executed, processed, settled and accounted for without manual intervention.
Antares. Antares is a comprehensive, real-time, event-driven trading and profit and loss reporting system designed to integrate trade modeling with trade order management. Antares enables clients to trade and report fixed-income, equities, foreign exchange, futures, options, repos and many other instruments across different asset classes. Antares also offers an add-on option of integrating Heatmaps’ data visualization technology to browse and navigate holdings information.
Client Reporting
Our powerful client communications solutions serve investment managers, wealth managers, insurance companies, and alternative investors and allow our customers to create on-demand, custom reports.
SS&C VisionFI. VisionFI (Financial Insights) is a comprehensive, end-to-end solution for designing, producing and distributing client communications content for the financial services industry. It enables firms to deliver high-end, customized reports and deliver via print, email, or online portal.
Pages. Pages is a powerful client communications solution for investment managers, insurance companies, and banks that generate distinctive client statements and slide presentations for print, electronic or face-to-face meetings. Features include desktop publishing-quality statements, personalized and multilingual capabilities, automated processes and a simplified workflow, and complex business logic, including "if-then-else" capabilities to handle one-off situations or other special cases.
Financial modeling
We offer several powerful analytical software and financial modeling applications for the insurance industry. We also provide analytical software and services to the municipal finance groups market. Some of our financial modeling products include:
DBC Debt Structuring Solutions. The DBC family of solutions provides technology for structuring and reporting on municipal finance, general obligation and revenue bond issues, including asset-backed housing and student loan securitization. Underwriters,
12
investment banks, municipal issuers and financial advisors use DBC solutions for structuring new issues, securitizations, strategic planning and asset/liability management. The DBC suite includes DBC Finance, DBC Debt Manager, DBC PortOpt, DBC Housing, DBC Multi-Family/Healthcare, and DBC Student Loan.
Global Markets Risk. Global Markets Risk provides a comprehensive view of risk across all asset classes for banks, hedge funds, asset managers, insurance companies and pension funds. Risk Analytics is designed for risk managers who need better tracking, managing and reporting of value-at-risk and ex-ante risk measures across all asset classes.
Property management
We provide technology solutions for commercial and multifamily property management firms, as well as timeshare and resort operators. Our solutions automate and streamline daily accounting and administrative functions, and give clear insights into our clients’ assets.
SKYLINE. SKYLINE Property Management Software Solutions and Services is a comprehensive property management system that integrates all aspects of real estate property management, from prospect management to lease administration, work order management, accounting and reporting. By providing a single-source view of all real estate holdings, SKYLINE functions as an integrated lease administration system, a historical property/portfolio knowledge base and a robust accounting and financial reporting system, enabling users to track each property managed, including data on specific units and tenants.
TimeShareWare. TimeShareWare Enterprise incorporates a Service Oriented Architecture and provides the tools, structure, and performance needed to accommodate management of complex and demanding resort operations, including sales and marketing, management, contract processing, loan servicing and property management.
Professional services
We offer a range of professional services to assist clients. Professional services consist of consulting and implementation services, including the initial installation of systems, conversion of historical data and ongoing training and support. Our in-house consulting teams work closely with the client to ensure the smooth transition and operation of our systems. Our consulting teams have a broad range of experience in the financial services industry and include certified public accountants, chartered financial analysts, mathematicians and IT professionals from the asset management, real estate, investment, insurance, hedge fund, municipal finance and banking industries. We believe our commitment to professional services facilitates the adoption of our software products across our target markets. For the year ended December 31, 2017, revenues from professional services represented 5% of total revenues.
Product support
We believe a close and active service and support relationship is important to enhancing client satisfaction and furnishes an important source of information regarding evolving client issues. We provide our larger clients with a dedicated client support team whose primary responsibility is to answer questions and provide solutions to address ongoing needs. Direct telephone support is provided during extended business hours, and additional hours are available during peak periods. Approximately every two weeks, we distribute our software and services eBriefings, which are industry-specific newsletters available for key geographic regions around the world. We supplement our service and support activities with comprehensive training. Training options include regularly hosted classroom and online instruction, Zoologic Learning Academy, and online client seminars, or “webinars,” that address current, often technical, issues in the financial services industry.
We periodically make maintenance releases of licensed software available to our clients, as well as regulatory updates (generally during the fourth quarter, on a when and if available basis), to meet industry reporting obligations and other processing requirements.
Clients
We have approximately 11,000 clients globally in the financial services industry that require a full range of information management and analysis, accounting, actuarial, reporting and compliance software on a timely and flexible basis. Our clients include multinational banks, retail banks and credit unions, hedge funds, private equity funds, funds of funds and family offices, institutional asset managers, insurance companies and pension funds, municipal finance groups, brokers/dealers, financial exchanges, commercial lenders, real estate lenders and property managers. Our clients include many of the largest and most well-recognized firms in the financial services industry. During the year ended December 31, 2017, our top 10 clients represented approximately 10% of total revenues, with no single client accounting for more than 2% of total revenues.
13
We believe a direct sales organization is essential to the successful implementation of our business strategy, given the complexity and importance of the operations and information managed by our products, the extensive regulatory and reporting requirements of each industry, and the unique dynamics of each vertical market. Our dedicated direct sales and support personnel are located in various sales offices worldwide and routinely undergo product and sales training. We also use telemarketing to support sales of our real estate property management products and work through alliance partners that sell our software-enabled services to their correspondent banking clients.
Our marketing personnel have extensive experience in marketing to the financial services industry and are responsible for identifying market trends, evaluating and developing marketing opportunities, generating client leads and providing sales support. Our marketing activities focus on cost-effective means of reaching current and potential clients, including:
|
|
● |
content-rich, periodic software and services eBriefings targeted at clients and prospects in each of our vertical and geographic markets, |
|
|
● |
regular product-focused webinars, |
|
|
● |
seminars and symposiums, |
|
|
● |
trade shows and conferences, and |
|
|
● |
e-marketing campaigns. |
This strategy achieves lower marketing costs, more direct contacts with actual and potential clients, increased marketing leads, distribution of more up-to-date marketing information and an improved ability to measure marketing initiatives.
The marketing department also supports the sales force with appropriate and relevant materials, including brochures and fact sheets, for use during the sales process.
Product Development and Engineering
We believe we must introduce new products and offer product innovation on a regular basis to maintain our competitive advantage. To meet these goals, we use multidisciplinary teams of highly trained personnel and leverage this expertise across all product lines. We have invested heavily in developing a comprehensive product analysis process to ensure a high degree of product functionality and quality. Maintaining and improving the integrity, quality and functionality of existing products is the responsibility of individual product managers. Product engineering management efforts focus on enterprise-wide strategies, implementing best-practice technology regimens, maximizing resources and mapping out an integration plan for our entire umbrella of products as well as third-party products. For the years ended December 31, 2017, 2016 and 2015, our research and development expenses were $153.3 million, $152.7 million and $110.4 million, respectively. In addition, we have made significant investments in intellectual property through our acquisitions.
Our research and development engineers work closely with our marketing and support personnel to ensure that product evolution reflects developments in the marketplace and trends in client requirements. We have generally issued a major release of our core products during the second or third quarter of each fiscal year, which includes both functional and technical enhancements. We also provide an annual release typically in the fourth quarter to reflect evolving regulatory changes in time to meet clients’ year-end reporting requirements.
Competition
The market for financial services software and services is competitive, rapidly evolving and highly sensitive to new product introductions and marketing efforts by industry participants, although high conversion costs can create barriers to adoption of new products or technologies. The market is fragmented and served by both large-scale firms with broad offerings as well as firms that target only local markets or specific types of clients. We also face competition from information systems developed and serviced internally by the IT departments of large financial services firms. We believe that we generally compete effectively as to the factors identified for each market below, although some of our existing competitors and potential competitors have substantially greater financial, technical, distribution and marketing resources than we have and may offer products with different functions or features that are more attractive to potential customers than our offerings.
Alternative Investments: In our alternative investments market, we compete with multiple vendors that may be categorized into two groups, the first consists of independent specialized administration providers, which are generally smaller than us, and the second
14
includes prime brokerage and other financial services firms offering fund administration services. Major competitors in this market include CITCO Group and State Street Bank. The key competitive factors in marketing software and services to the alternative investment industry are the need for independent fund administration, features and adaptability of the software, level and quality of customer support, level of software development expertise and total cost of ownership. Our strengths in this market are our expertise, our independence, our transparency, our ability to deliver functionality by multiple methods and our technology, including the ownership of our own software.
Asset Management: In our asset management market, we compete with a variety of other vendors depending on client characteristics such as size, type, location, computing environment and functionality requirements. Competitors in this market range from larger providers of integrated portfolio management systems and outsourcing services, such as BNY Mellon Financial (Eagle Investment Systems), to smaller providers of specialized applications and technologies such as StatPro, Charles River Development and others. We also compete with internal processing and information technology departments of our clients and prospective clients. The key competitive factors in marketing asset management solutions are the reliability, accuracy, timeliness and reporting of processed information to internal and external customers, features and adaptability of the software, level and quality of customer support, level of software development expertise and return on investment. Our strengths in this market are our technology, our ability to deliver functionality by multiple delivery methods and our ability to provide cost-effective solutions for clients.
Insurance and Pension Funds: In our insurance and pension funds market, we compete with a variety of vendors depending on client characteristics such as size, type, location, computing environment and functionality requirements. Competitors in this market range from large providers of portfolio management systems, such as State Street Bank (Princeton Financial Systems) and FIS, to smaller providers of specialized applications and services.
We also compete with outsourcers, as well as the internal processing and information technology departments of our clients and prospective clients. The key competitive factors in marketing insurance and pension plan systems are the accuracy, timeliness and reporting of processed information provided to internal and external clients, features and adaptability of the software, level and quality of customer support, economies of scale and return on investment. Our strengths in this market are our years of experience, our top-tier clients, our ability to provide solutions by multiple delivery methods, our cost-effective and customizable solutions and our expertise.
Financial Advisor: We define the advisory market as independent and regional broker-dealers, wealth managers, trust companies, advisory firms, and registered investment advisers. We compete with a variety of vendors, which are generally smaller firms focused solely on the advisory market. Our competitors include Envestnet, Orion, Addepar, SEI’s wealth management platform, and custodians such as Charles Schwab, Fidelity, and Raymond James. Our strengths in this market are our premier platforms with flexible and on-demand delivery models, and approximately 90 complementary products and services.
Real Estate Property Management: In our real estate property management market, we compete with numerous software vendors consisting of smaller specialized real estate property management solution providers and larger property management software vendors with more dedicated resources than our real estate property management business, such as Yardi Systems. The key competitive factors in marketing property management and timeshare systems are the features and adaptability of the software, level of quality and customer support, degree of responsiveness and overall net cost. Our strengths in this market are the quality of our software and our reputation with our clients.
Financial Institutions: In our financial institutions market, there are multiple software and services vendors that are either smaller providers of specialized applications and technologies or larger providers of enterprise systems, such as FIS and Misys. We also compete with outsourcers as well as the internal processing and information technology departments of our clients and prospective clients. The key competitive factors in marketing financial institution software and services include accuracy and timeliness of processed information provided to clients, features and adaptability of the software, level and quality of customer support, level of software development expertise, total cost of ownership and return on investment. Our strengths in this market are our flexible technology platform and our ability to provide integrated solutions for our clients.
Commercial Lending: In our commercial lending market, we compete with a variety of other vendors depending on client characteristics such as size, type, location and functional requirements. Competitors in this market range from large competitors whose principal businesses are not in the loan management business, such as PNC Financial Services (Midland Loan Services), to smaller providers of specialized applications and technologies. The key competitive factors in marketing commercial lending solutions are the accuracy, timeliness and reporting of processed information provided to customers, level of software development expertise, level and quality of customer support and features and adaptability of the software. Our strength in this market is our ability to provide both broadly diversified and customizable solutions to our clients.
15
Financial Markets: In our financial markets, our competition falls into two categories — the internal development organizations within financial enterprises and specialized financial vendors. The key competitive factors in marketing financial markets technology solutions are a proven track record of delivering high quality solutions, level of responsiveness and overall net cost. Our strengths in this market are a successful track record of delivering solutions and our reputation with our clients.
Proprietary Rights
We rely on a combination of trade secret, copyright, trademark and patent law, nondisclosure agreements and technical measures to protect our proprietary technology. We have registered trademarks for many of our products and will continue to evaluate the registration of additional trademarks as appropriate. We generally enter into confidentiality and/or license agreements with our employees, distributors, clients and potential clients. We seek to protect our software, documentation and other written materials under trade secret and copyright laws, which afford limited protection. These efforts may be insufficient to prevent third-parties from asserting intellectual property rights in our technology. Furthermore, it may be possible for unauthorized third-parties to copy portions of our products or to reverse engineer or otherwise obtain and use proprietary information, and third-parties may assert ownership rights in our proprietary technology. For additional risks relating to our proprietary technology, please see “Risk Factors — Risks “Relating to Our Business” — If we are unable to protect our proprietary technology and other confidential information, our success and our ability to compete will be subject to various risks, such as third-party infringement claims, unauthorized use of our technology, disclosure of our proprietary information or inability to license technology from third-parties.
Rapid technological change characterizes the software development industry. We believe factors such as the technological and creative skills of our personnel, new product developments, frequent product enhancements, name recognition and reliable service and support are more important to establishing and maintaining a leadership position than legal protections of our technology.
Employees
As of December 31, 2017, we had 8,287 full-time employees, consisting of:
|
|
● |
1,236 employees in research and development; |
|
|
● |
5,891 employees in consulting and services; |
|
|
● |
361 employees in sales and marketing; |
|
|
● |
321 employees in client support; and |
|
|
● |
478 employees in finance and administration. |
As of December 31, 2017, 4,350 of our employees were in our international operations. No employee is covered by any collective bargaining agreement. We believe that we have good relations with our employees.
Additional Information
We were incorporated in Delaware in July 2005, as the successor to a corporation originally formed in Connecticut in March 1986. Our principal executive offices are located at 80 Lamberton Road, Windsor, Connecticut 06095, and the telephone number of our principal executive offices is (860) 298-4500.
Our website address is www.ssctech.com. We make available, free of charge, on our website our annual reports on Form 10-K, quarterly reports on Form 10-Q, current reports on Form 8-K, Proxy Statements for the annual stockholder meetings and amendments thereto that we have filed or furnished with the SEC, as soon as reasonably practicable after we electronically file them with the SEC. The same information is available in print to any stockholder who submits a written request to the Company’s Investor Relations department. We are not, however, including the information contained on our website, or information that may be accessed through links on our website, as part of, or incorporating such information by reference into, this annual report on Form 10-K. The SEC maintains an internet site at www.sec.gov that contains reports, proxy and information statements, and other information regarding issuers that file electronically with the SEC. The public may also read and copy any materials we file with the SEC at the SEC's Public Reference Room at 100 F Street, NE, Washington DC, 20549. The public may obtain information on the operation of the Public Reference Room by calling the SEC at 1-800-SEC-0330.
16
You should carefully consider the following risk factors, in addition to other information included in this annual report on Form 10-K and the other reports we submit to the SEC. If any of the following risks occur, it could materially affect our business, operating results, cash flows and financial condition and possibly lead to a decline in our stock price. The risks and uncertainties described below are those that we have identified as material, but are not the only risks and uncertainties facing us. Our business is also subject to general risks and uncertainties that affect many other companies. Additional risks and uncertainties not currently known to us or that we currently believe are not material may also impair our business, operating results, cash flows and financial condition.
Risks Relating to Our Business
Our business is greatly affected by changes in the state of the general economy and the financial markets, and uncertainty in the general economy or the financial services industry could disproportionately affect the demand for our products and services.
In recent years, the global economy has experienced a significant recession, severe disruptions in the credit markets, increased uncertainty about economic, political and market conditions, and periods of heightened volatility in a variety of financial and other markets, including commodity prices and currency rates, all of which have had at times a material and adverse effect on the financial markets and the activity levels of our clients. While the U.S. economy may technically have come out of the recession, the recovery is fragile and may not be sustainable for any specific period of time, and the economy could slip back into an even more significant recession. Our clients include a range of organizations in the financial services industry whose success is linked to the health of the economy generally and of the financial markets specifically. Unfavorable or uncertain economic conditions, economic instability or economic downturns could: (i) cause our clients or prospective clients to cancel, reduce or delay planned expenditures for our products and services; (ii) impair our clients’ ability to pay for products they have purchased; or (iii) cause our clients to process fewer transactions through our software-enabled services, renegotiate their contracts with us, move their IT solutions in-house, switch to lower-priced solutions offered by our competitors or exit the industry. Fluctuations in the value of assets under our clients’ management could also adversely affect our revenues because pricing in many of our agreements is adjusted based on assets under management. We cannot predict the occurrence, timing or duration of any economic downturn, generally, or in the markets in which our businesses operate. Turbulence in the U.S. and international markets, renewed concern about the strength and sustainability of a recovery and prolonged declines in business consumer spending could materially adversely affect our business, results of operations and financial condition, and the liquidity and financial condition of our clients.
We may not achieve the anticipated benefits from our acquisitions and may face difficulties in integrating our acquisitions.
We have acquired and intend in the future to acquire companies, products or technologies that we believe could complement or expand our business, augment our market coverage, enhance our technical capabilities or otherwise offer growth opportunities. For example, on January 11, 2018, we entered into a definitive agreement to acquire DST. However, acquisitions could subject us to contingent or unknown liabilities, and we may have to incur debt or severance liabilities or write off investments, infrastructure costs or other assets. Our success is also dependent on our ability to complete the integration of the operations of acquired businesses in an efficient and effective manner, which may be difficult to accomplish in the rapidly changing financial services software and services industry. We may not realize the benefits we anticipate from acquisitions, such as lower costs, increased revenues, synergies and growth opportunities, or we may realize such benefits more slowly than anticipated, due to our inability to:
|
|
● |
combine operations, facilities and differing firm cultures; |
|
|
● |
maintain employee morale or retain the clients or employees of acquired entities; |
|
|
● |
generate market demand for new products and services; |
|
|
● |
coordinate geographically dispersed operations and successfully adapt to the complexities of international operations, including compliance with laws, rules and regulations in multiple jurisdictions; |
|
|
● |
integrate the technical teams of acquired companies with our engineering organization; or |
|
|
● |
incorporate acquired technologies, products and services into our current and future product and service lines. |
The process of integrating the operations of acquired companies could disrupt our ongoing operations, divert management from day-to-day responsibilities, increase our expenses and harm our business, results of operations and financial condition. Acquisitions may also place a significant strain on our administrative, operational, financial and other resources. In addition, certain of our acquisitions have generated disputes with stockholders or management of acquired companies that have required the expenditure of our resources to address or have led to litigation; any such disputes may reduce the value we hope to realize from our acquisitions, either by increasing our costs of the acquisition, reducing our opportunities to realize revenues from the acquisition or imposing litigation costs or adverse judgments on us. Acquisitions may also expose us to litigation from our stockholders arising out of the
17
acquisition, which, even if unsuccessful, could be costly to defend and serve as a distraction to management. See also “—Risks Relating to Our Pending Acquisition of DST Systems, Inc.”
Consolidations and failures in the financial services industry could adversely affect us by causing a decline in demand for our products and services.
If banks and financial services firms fail or consolidate, there could be a decline in demand for our products and services. Failures, mergers and consolidations of banks and financial institutions reduce the number of our clients and potential clients, which could adversely affect our revenues even if these events do not reduce the aggregate activities of the consolidated entities. Further, if our clients fail and/or merge with or are acquired by other entities that are not our clients, or that use fewer of our products and services, they may discontinue or reduce their use of our products and services. It is also possible that the larger financial institutions resulting from mergers or consolidations would have greater leverage in negotiating terms with us. In addition, these larger financial institutions could decide to perform in-house some or all of the services that we currently provide or could provide or to consolidate their processing on a non-SS&C system. The resulting decline in demand for our products and services could have a material adverse effect on our business, results of operations and financial condition.
Our business has become increasingly focused on the hedge fund industry, and we are subject to the variations and fluctuations of that industry.
As a result of our acquisitions of CommonWealth Fund Services Ltd. (“CommonWealth”) in October 2017, Conifer Financial Services (“Conifer”) and Wells Fargo’s Global Fund Services business (“GFS”) in December 2016, Citigroup Alternative Investor Services business (“Citigroup AIS”) in March 2016, Advent Software, Inc. (“Advent”) in July 2015 and GlobeOp Financial Services S.A. (“GlobeOp”) in May 2012, a higher percentage of our clients are hedge funds or funds of hedge funds. These clients and our business relating to them are affected by trends, developments and risks associated with the global hedge fund industry. The market environment for hedge funds involves risk and has suffered significant turmoil, including as a result of substantial changes in global economies, political uncertainty, stock market declines and new regulatory initiatives. Even in the absence of such factors, the global hedge fund industry is subject to fluctuations in assets under management that are impossible to predict or anticipate. Further, investor demand for hedge funds has experienced recent declines and increased withdrawals as a result of poor performance relative to benchmark indices and increased negative investor sentiment on fees. These risks and trends could significantly and adversely affect some or all of our hedge fund clients, which could adversely affect our business, results of operations and financial condition. In addition, market forces have negatively impacted liquidity for many of the financial instruments in which hedge fund client’s trade, which, in turn, could negatively impact our ability to access independent pricing sources for valuing those instruments.
If we are unable to retain and attract clients, our revenues and net income would remain stagnant or decline.
If we are unable to keep existing clients satisfied, sell additional products and services to existing clients or attract new clients, then our revenues and net income would remain stagnant or decline. A variety of factors could affect our ability to successfully retain and attract clients, including:
|
|
● |
the level of demand for our products and services; |
|
|
● |
the level of client spending for IT; |
|
|
● |
the level of competition from internal client solutions and from other vendors; |
|
|
● |
the quality of our client service and the performance of our products; |
|
|
● |
our ability to update our products and services and develop new products and services needed by clients; |
|
|
● |
our ability to understand the organization and processes of our clients; and |
|
|
● |
our ability to integrate and manage acquired businesses. |
We face significant competition with respect to our products and services, which may result in price reductions, reduced gross margins or loss of market share.
The market for financial services software and services is competitive, rapidly evolving and highly sensitive to new product and service introductions and marketing efforts by industry participants. The market is also highly fragmented and served by numerous firms that target only local markets or specific client types. We also face competition from information systems developed and serviced internally by the IT departments of financial services firms.
18
Some of our current and potential competitors may have significantly greater financial, technical, distribution and marketing resources, generate higher revenues and have greater name recognition. Our current or potential competitors may develop products comparable or superior to those developed by us, or adapt more quickly to new technologies, evolving industry trends or changing client or regulatory requirements. It is also possible that our competitors may enter into alliances with each other or other third-parties, and through such alliances, acquire increased market share. Increased competition may result in price reductions, reduced gross margins and loss of market share. Accordingly, our business may not grow as expected and may decline.
Our role as a fund administrator has in the past, and may in the future, expose us to claims and litigation from clients, their investors, regulators or other third-parties.
As a service provider, we have been, and may in the future be, subject to claims and lawsuits from investors, regulators, liquidators, other third-parties and our clients, some of which pursue high-risk investment strategies and all of which are subject to substantial market risk, in the event that the underlying fund suffers investment losses, incurs instances of fraud, becomes insolvent, files for bankruptcy or otherwise becomes defunct. Even if we are not ultimately found to be liable, defending such claims or lawsuits could be time-consuming, divert management resources, harm our reputation and cause us to incur significant expenses. These claims or lawsuits could have an adverse effect on our business, results of operations and financial condition.
Catastrophic events may adversely affect our business.
A war, terrorist attack, natural disaster, pandemic or other catastrophe may adversely affect our business. A catastrophic event could have a direct negative impact on us or an indirect impact on us by, for example, affecting our clients, the financial markets or the overall economy and reducing our ability to provide, our clients’ ability to use, and the demand for, our products and services. The potential for a direct effect on our business operations is due primarily to our significant investment in infrastructure. Although we maintain redundant facilities and have contingency plans in place to protect against both man-made and natural threats, it is impossible to fully anticipate and protect against all potential catastrophes. A computer virus, physical or cyber security breach, criminal act, military action, power or communication failure, flood, severe storm or the like could lead to service interruptions and data losses for clients, disruptions to our operations, or damage to important facilities. In addition, such an event may cause clients to cancel their agreements with us for our products or services. Any of these events could adversely affect our business, results of operation and financial condition.
Our software-enabled services may be subject to disruptions, attacks or failures that could adversely affect our reputation and our business.
Our software-enabled services maintain and process confidential data and process trades and perform other back-office functions, including wiring funds, on behalf of our clients, some of which is critical to their business operations. For example, our trading systems maintain account and trading information for our clients and their customers. Our internal technology infrastructure on which our software-enabled services depend may be subject to disruptions or may otherwise fail to operate properly or become disabled or damaged as a result of a number of factors, including events that are wholly or partially beyond our control and that could adversely affect our ability to process transactions, provide services or otherwise appropriately conduct our business activities. Such events include IT attacks or failures, threats to physical security, sudden increases in transaction volumes, electrical or telecommunications outages, damaging weather or other acts of nature, or employee or contractor error or malfeasance. In particular, cybersecurity threats have become prevalent in our industry as well as for many firms that process information. Cybersecurity threats are evolving and our security measures, and those of our service providers, may not detect or prevent all attempts to hack our systems, denial-of-service attacks, viruses, malicious software, attempts to gain unauthorized access to data, phishing attacks, social engineering, security breaches or employee or contractor malfeasance and other electronic security breaches that may jeopardize the security of information stored in or transmitted by our sites, networks and systems or that we or our third-party service providers otherwise maintain. Such cyber security incidents could lead to disruptions in our systems, the unauthorized release or destruction of our or our clients’ or other parties’ confidential or otherwise protected information and corruption of data. We and our service providers may not have the resources or technical sophistication to anticipate or prevent all types of attacks, and techniques used to obtain unauthorized access to or sabotage systems change frequently and may not be known until launched against us or our third-party service providers. In the last few years there have been many successful advanced cyber-attacks that have damaged several prominent companies in spite of strong information security measures, and we expect that the risks associated with cyber-attacks and the costs of preventing such attacks will continue to increase in the future. We and our clients are regularly the target of attempted cyber-attacks and we must continuously monitor and develop our systems to protect our technology infrastructure and data from misappropriation or corruption. Although we expend significant resources and oversight efforts in an attempt to ensure that we maintain appropriate safeguards with respect to cyber-attacks, there is no guarantee that our systems and procedures are adequate to protect against all security breaches.
19
If our software-enabled services are disrupted or fail for any reason, or if our systems or facilities are infiltrated or damaged by unauthorized persons, we and our clients could experience data loss, including confidential and personal information, financial loss, harm to their reputation and significant business interruption. If that happens, we may be exposed to significant liability, our reputation may be harmed, our clients may be dissatisfied and we may lose business. Although we maintain privacy, data breach and network security liability insurance, we cannot be certain that our coverage will be adequate or cover liabilities actually incurred, or that insurance will continue to be available to us on economically reasonable terms, or at all. Given the unpredictability of the timing, nature and scope of such failures or disruptions, we could potentially experience significant costs and exposures, including production downtimes, operational delays, other detrimental impacts on our operations or ability to provide services to our customers, the compromising of confidential or otherwise protected information, misappropriation, destruction or corruption of data, security breaches, other manipulation or improper use of our systems or networks, financial losses from remedial actions, loss of business, potential liability, regulatory inquiries, enforcements, actions and fines and/or damage to our reputation, any of which could have a material adverse effect on our business, results of operations and financial condition.
If third-party service providers on which we rely, or other third-parties with which we do business or which facilitate our business activities, suffer disruptions to their IT systems, our business could be harmed.
In providing our software-enabled services to our customers, we depend upon IT infrastructure that is primarily managed by our firm, but we also depend on third-party service providers to provide some of the IT infrastructure on which we rely. Although we seek to ensure that appropriate security and other standards are maintained by these third-parties, these third-parties are also subject to the risks discussed in the preceding risk factor, and there is no guarantee that they will maintain systems and procedures sufficient to protect against system failures and security breaches, including as a result of cyber-attacks.
In addition, the third-parties with which we do business or which facilitate our business activities, including financial intermediaries, are susceptible to the risks described in the preceding risk factor (including regarding the third-parties with which they are similarly interconnected), and our or their business operations and activities may therefore be adversely affected, perhaps materially, by failures, terminations, errors or malfeasance by, or attacks or constraints on, one or more financial, technology or infrastructure institutions or intermediaries with whom they are interconnected or conduct business.
We have substantial operations and a significant number of employees in India and we are therefore subject to regulatory, economic and political uncertainties in India.
We currently have approximately 2,462 employees located in India. The economy of India may differ favorably or unfavorably from the U.S. economy and our business may be adversely affected by the general economic conditions and economic and fiscal policy in India, including changes in exchange rates and controls, interest rates and taxation policies. In particular, in recent years, India’s government has adopted policies that are designed to promote foreign investment, including significant tax incentives, relaxation of regulatory restrictions, liberalized import and export duties and preferential rules on foreign investment and repatriations. These policies may not continue. In addition, we are subject to risks relating to social stability, political, economic or diplomatic developments affecting India in the future.
India faces major challenges in the years ahead sustaining the economic growth that it has experienced over the past several years. These challenges include the need for substantial infrastructure development and improving access to healthcare and education. Our ability to recruit, train and retain qualified employees and develop and operate our facilities in India could be adversely affected if India does not successfully meet these challenges, in which case we may need to relocate those facilities and that could have a material adverse effect on our business, financial condition and results of operations.
20
We expect that our operating results, including our profit margins and profitability, may fluctuate over time.
Historically, our revenues, profit margins and other operating results have fluctuated from period to period and over time primarily due to the timing, size and nature of our license and service transactions. See “Management’s Discussion and Analysis of Financial Condition and Results of Operations” for further discussion on fluctuations in revenues, profit margins and other operating results. Additional factors that may lead to such fluctuation include:
|
|
● |
the timing of the introduction and the market acceptance of new products, product enhancements or services by us or our competitors; |
|
|
● |
the lengthy and often unpredictable sales cycles of large client engagements; |
|
|
● |
the amount and timing of our operating costs and other expenses; |
|
|
● |
the financial health of our clients; |
|
|
● |
changes in the volume of assets under our clients’ management; |
|
|
● |
cancellations of maintenance and/or software-enabled services arrangements by our clients; |
|
|
● |
changes in local, national and international regulatory requirements; |
|
|
● |
acquisitions during the relevant period; |
|
|
● |
implementation of our licensing contracts and software-enabled services arrangements; |
|
|
● |
changes in economic and financial market conditions; and |
|
|
● |
changes in the types of products and services we provide. |
We are dependent on our senior management and their continued performance and productivity.
We are dependent on the continued efforts of the members of our senior management. The loss of any of the members of our senior management may cause a significant disruption in our business, jeopardize existing customer relationships, impair our compliance efforts as a public company, and have a material adverse effect on our business objectives. We do not maintain key man life insurance policies for any senior officer or manager.
If we cannot attract, train and retain qualified employees, we may not be able to provide adequate technical expertise and customer service to our clients.
We believe that our success is due in part to our ability to attract, train and retain highly skilled employees. Competition for qualified personnel in the software and hedge fund industries is intense, and we have, at times, found it difficult to attract and retain skilled personnel for our operations. Our failure to attract and retain a sufficient number of highly skilled employees could prevent us from developing and servicing our products at the same levels as our competitors; therefore, we may lose potential clients and suffer a decline in revenues.
If we are unable to protect our proprietary technology and other confidential information, our success and our ability to compete will be subject to various risks, such as third-party infringement claims, unauthorized use of our technology, disclosure of our proprietary information or inability to license technology from third-parties.
Our success and ability to compete depends in part upon our ability to protect our proprietary technology and other confidential information. We rely on a combination of patent, trade secret, copyright and trademark law, and nondisclosure agreements, license agreements and technical measures to protect our proprietary technology and other confidential information. We have registered trademarks for some of our products and will continue to evaluate the registration of additional trademarks as appropriate. We generally enter into confidentiality agreements with our employees, distributors, clients and potential clients. However, these efforts may be insufficient to prevent those parties or others from infringing, misappropriating, violating or asserting rights in our intellectual property, confidential information or other technology and our proprietary technology and confidential information may be subject to embezzlement, theft, or other similar illegal behavior by our employees or third-parties. In addition, our employees, distributors, clients and potential clients may breach our confidentiality agreements and we may not have adequate remedies for any such breach. Furthermore, it may be possible for unauthorized third-parties to copy portions of our products or to reverse engineer or otherwise obtain and use our proprietary information. If a third-party were to gain unauthorized access to or independently develop the confidential or proprietary information we possess, we could suffer a loss of revenues, we could experience an adverse impact on our competitive position, and our relationships with our clients and our reputation could be materially adversely effected.
21
Existing patent and copyright laws afford only limited protection. Third-parties may develop substantially equivalent or superseding proprietary technology or may offer equivalent products in competition with our products in a manner that does not infringe, misappropriate or otherwise violate our intellectual property or other proprietary rights, thereby substantially reducing the value of our proprietary rights. A number of third-parties hold patents and other intellectual property rights with application in the financial services field. Consequently, we are subject to the risk that such third-parties will claim that our products infringe, misappropriate or otherwise violate their intellectual property rights, including their patent rights. Such claims, regardless of merit, could result in expensive and time-consuming litigation, divert the attention of our personnel, and impair our intellectual property rights. Moreover, as a result of such claims, we may be required to redesign our products or services in a manner that is not infringing, misappropriating or otherwise violating such third-party’s intellectual property rights, which may not be technically or commercially feasible. We may also be required to obtain a license to such intellectual property rights, which may not be available on commercially reasonable terms or at all. Any of the foregoing could have a material adverse effect on our business, results of operation, and financial condition.
We incorporate open source software into a limited number of our software products. We monitor our use of open source software in an effort to avoid subjecting our products to unfavorable conditions or conditions we do not intend. Some open source licenses require that source code subject to the license be disclosed to third-parties, grant such third-parties the right to modify and redistribute that source code and a requirement that the source code for any software derived from it be disclosed. If we combine our proprietary software with open source software in a certain manner, we could, under certain open source licenses, be required to release the source code of our proprietary software to the public. Although we believe that we have complied with our obligations under the applicable licenses for open source software that we use, there is little or no legal precedent governing the interpretation of many of the terms of certain of these licenses. As a result, the potential impact of these terms is uncertain and may result in unanticipated obligations or restrictions regarding those of our products, technologies or solutions affected.
We have acquired and may acquire important technology rights through our acquisitions and have often incorporated and may incorporate features of these technologies across many of our products and services. As a result, we are subject to the above risks and the additional risk that the seller of the technology rights may not have appropriately protected the intellectual property rights we acquired. Indemnification and other rights under applicable acquisition documents are limited in term and scope and therefore provide us with only limited protection.
In addition, we rely on third-party software in providing some of our products and services. If we lose our licenses to use such software or if such licenses are found to infringe, misappropriate or otherwise violate upon the rights of others, we will need to seek alternative means of obtaining the licensed software to continue to provide our products or services, which may not be feasible on a technical or commercial basis. Our inability to replace such software, or to replace such software in a timely manner, could significantly disrupt our business and our ability to deliver products and services to our clients, and adversely affect our business, results of operation and financial condition.
We could become subject to litigation regarding our or a third-party’s intellectual property rights or other confidential or proprietary information, which could seriously harm our business and require us to incur significant costs.
In recent years, there has been a high incidence of litigation in the U.S. involving patents and other intellectual property rights. We are from time to time a party to litigation to enforce our intellectual property rights or to protect our confidential or proprietary information, or as a result of an allegation that we infringe, misappropriate or otherwise violate a third-party’s intellectual property rights, including patents, trademarks, trade secrets and copyrights. From time to time, we have received notices claiming our technology may infringe, misappropriate or otherwise violate third-party intellectual property rights or otherwise threatening to assert intellectual property rights. These claims and any resulting lawsuit, if successful, could subject us to significant liability for damages and our intellectual property rights being reduced, narrowed or held unenforceable or invalid. These lawsuits, regardless of their success, could be time-consuming and expensive to resolve, adversely affect our revenues, profitability and prospects, and divert management time and attention. If we are found to infringe, misappropriate or otherwise violate a third-party’s intellectual property rights, we may be required to pay the third-party substantial monetary damages and to cease the activities covered by such intellectual property rights, unless we obtain a license to such intellectual property rights, which may not be available on commercially reasonable terms or at all. In addition, these claims and threats could also cause us to undertake to re-engineer our products or services which may not be technically or commercially feasible. Any of the foregoing could have a material adverse effect on our business, results of operation and financial condition.
We may be unable to adapt to rapidly changing technology and evolving industry standards and regulatory requirements.
Rapidly changing technology, evolving industry standards and regulatory requirements and new product and service introductions characterize the market for our products and services. Our future success will depend in part upon our ability to enhance
22
our existing products and services and to develop and introduce new products and services to keep pace with such changes and developments and to meet changing client needs. The process of developing our software products is complex and is expected to become increasingly complex and expensive in the future due to the introduction of new platforms, operating systems and technologies. Current areas of significant technological change include mobility, cloud-based computing and the processing and analyzing of large amounts of data. Our ability to keep up with technology and business and regulatory changes is subject to a number of risks, including that:
|
|
● |
we may find it difficult or costly to update our services and software and to develop new products and services quickly enough to meet our clients’ needs; |
|
|
● |
we may find it difficult or costly to make some features of our software work effectively and securely over the Internet or with new or changed operating systems; |
|
|
● |
we may find it difficult or costly to update our software and services to keep pace with business, evolving industry standards, regulatory requirements and other developments in the industries in which our clients operate; and |
|
|
● |
we may be exposed to liability for security breaches that allow unauthorized persons to gain access to confidential information stored on our computers or transmitted over our network. |
Our failure to enhance our existing products and services and to develop and introduce new products and services to promptly address the needs of our clients and a changing marketplace could adversely affect our business, results of operations and financial condition.
Undetected software design defects, errors or failures, or employee errors, may result in defects, delays, loss of our clients’ data, litigation against us and harm to our reputation and business.
Our software products are highly complex and sophisticated and could contain design defects or software errors that are difficult to detect and correct. Errors or bugs in our software may affect the ability of our products to work with other hardware or software products, delay the development or release of new products or new versions of products, result in the loss of client data, damage our reputation, affect market acceptance of our products or result in the rejection of our products by the market, cause loss of revenues, divert development resources, increase product liability and warranty claims, and increase service and support costs. We cannot be certain that, despite testing by us and our clients, errors will not be found in new products or new versions of products. Moreover, our clients engage in complex trading activities and this complexity increases the likelihood that our employees may make errors. Employee errors, poor employee performance or misconduct may be difficult to detect and deter. These product defects or errors in the product operations, or employee errors, poor performance or misconduct, could cause damages to our clients for which they may assert claims or lawsuits against us. The cost of defending such a lawsuit, regardless of its merit, could be substantial and could divert management’s attention and result in reputational harm. In addition, if our business liability insurance coverage proves inadequate with respect to a claim or future coverage is unavailable on acceptable terms or at all, we may be liable for payment of substantial damages. Any or all of these potential consequences could have an adverse impact on our business, results of operations and financial condition.
Because our platform could be used to collect and store personal information of our customers’ employees or customers, privacy concerns could result in additional cost and liability to us or inhibit use of our platform.
Personal privacy has become a significant issue in the U.S. and in many other countries where we offer our solutions or may offer them in the future. The regulatory framework for privacy issues worldwide is currently evolving, is not uniform and is likely to remain uncertain for the foreseeable future. Many federal, state and foreign government bodies and agencies have adopted or are considering adopting laws and regulations regarding the collection, use, disclosure, control, security and deletion of personal information. In the U.S., these include, without limitation, laws and regulations promulgated by states, as well as rules and regulations promulgated under the authority of the Federal Trade Commission (“FTC”) and federal financial regulatory bodies. Internationally, most of the jurisdictions in which we operate have established their own data security and privacy legal frameworks, many of which are broader in scope, more restrictive and impose greater obligations on us and our customers. For instance, effective May 2018, the European Union’s (“E.U.”) General Data Protection Regulation (“GDPR”), a new E.U.-wide legal framework to govern data collection use and sharing and related consumer privacy rights, will strengthen and unify data protection rules for individuals within the E.U. The GDPR also addresses export of personal data outside the E.U. Many of these obligations are updated frequently and subject to interpretation by various regulatory bodies and thus require ongoing monitoring. In addition to government regulation, privacy advocacy and industry groups may propose new and different self-regulatory standards that either legally or contractually apply to us.
23
As a result of uncertainty regarding the interpretation and application of privacy and data protection-related laws, regulations, and self-regulatory requirements, it is possible that these laws, regulations, and requirements may be interpreted and applied in a manner that is inconsistent with our existing data handling practices or the technological features of our solutions. If so, in addition to the possibility of fines, lawsuits and other claims, we could be required to fundamentally change our business activities and practices or modify our solutions, which could have an adverse effect on our business. Any inability to adequately address privacy or data protection-related concerns, even if unfounded, or comply with applicable privacy or data protection-related laws, regulations and policies, could result in additional cost and liability to us, damage our reputation, inhibit sales and harm our business. Furthermore, the costs of compliance with, and other burdens imposed by, the laws, regulations, standards and policies that are applicable to the businesses of our customers may limit the use and adoption of, and reduce the overall demand for, our solutions. Also, privacy concerns, whether valid or not valid, may inhibit market adoption of our solutions, particularly in foreign countries.
Our business is subject to evolving regulations and increased scrutiny from regulators.
Our business is subject to evolving and increasing regulation, and our relationships with our clients may subject us to increased scrutiny from a number of regulators, including the Bermuda Monetary Authority, British Virgin Islands Financial Services Commission, Centrale Bank van Curacao en Sint Maarten, Commodity Futures Trading Commission, FTC, Cayman Islands Monetary Authority, Commission de Surveillance du Secteur Financier, Financial Industry Regulatory Authority, Financial Conduct Authority, Central Bank of Ireland, National Futures Association, Ontario Securities Commission, SEC, Securities Commission of the Bahamas, U.S. Treasury Department and other government entities that regulate the financial services, hedge fund and hedge fund services industry in the U.S., the United Kingdom (“U.K.”) and the other jurisdictions in which we operate. These regulations may limit or curtail our activities, including activities that might be profitable, and changes to existing regulations may affect our ability to continue to offer our existing products and services, or to offer products and services we may wish to offer in the future. As a result of the changes in the global economy and the turmoil in global financial markets in recent years, the risk of additional government regulation has increased. In addition, the final outcome of negotiations between the U.K. and the E.U. with respect to the U.K.’s exit from the E.U. is uncertain. As a result, the impact of the U.K.’s exit on the U.K. regulatory regime is unknown, but it is possible that we will become subject to more onerous regulations in the U.K. as a result.
The European Union’s AIFMD and the U.S. Dodd-Frank Act, among other initiatives, pose significant changes to the regulatory environment in which we and our clients operate. The impact of these regulatory changes remains uncertain. If we fail to comply with any applicable laws, rules or regulations, we may be subject to censure, fines or other sanctions, including revocation of our licenses and/or registrations with various regulatory agencies, criminal penalties and civil lawsuits.
The U.S. Foreign Corrupt Practices Act (“FCPA”) and anti-bribery laws in other jurisdictions, including the U.K. Bribery Act (“Bribery Act”), generally prohibit companies and their intermediaries from making improper payments for the purpose of obtaining or retaining business or other commercial advantage. The FCPA also imposes accounting standards and requirements on publicly traded U.S. corporations and their foreign affiliates which are intended to prevent the diversion of corporate funds to the payment of bribes and other improper payments, and to prevent the establishment of “off books” slush funds from which such improper payments can be made. We and our clients operate in a number of jurisdictions that may pose a risk of potential FCPA or Bribery Act violations. In addition, we cannot predict the nature, scope or effect of future regulatory requirements to which our internal operations might be subject or the manner in which existing laws might be administered or interpreted. While our policies mandate compliance with these laws, there can be no assurance that we will be completely effective in ensuring our compliance with all applicable anti-corruption laws. A failure to comply with these laws, rules or regulations, or allegations of such noncompliance, could adversely affect our business, reputation, results of operations and financial condition.
Additional tax expense or additional tax exposures could affect our future profitability.
We are subject to income taxes in the U.S. and various international jurisdictions. Changes in tax laws and regulations, as well as changes in related interpretations and other tax guidance could materially impact our tax receivables and liabilities and our deferred tax assets and deferred tax liabilities. On December 22, 2017, U.S. federal tax legislation, commonly referred to as the Tax Cuts and Jobs Act (“Tax Act”), was signed into law, significantly reforming the U.S. Internal Revenue Code. The Tax Act, among other things, reduces the U.S. federal statutory corporate tax rate from 35% to 21%, imposes significant additional limitations on the deductibility of interest and executive compensation, allows for the expensing of capital expenditures, puts into effect the migration from a “worldwide” system of taxation to a territorial system and modifies or repeals many business deductions and credits. We recorded a net benefit to income tax expense of $88 million in 2017 related to the enactment of the Tax Act, which includes the remeasurement of deferred tax assets and liabilities for the corporate tax rate reduction, the one-time transition tax imposed on accumulated foreign earnings and deferred taxes provided for the global intangible low-taxed income (“GILTI”) minimum tax that takes effect in 2018. The SEC Staff issued Staff Accounting Bulletin No. 118 (“SAB 118”) to provide guidance to companies on how to implement the accounting and disclosure changes required as a result of the Tax Act. The SEC staff guidance has recognized that, due to the
24
complexity of the Tax Act, the accounting for income tax effects of the change in law may be incomplete upon issuance of a company's financial statements for the reporting period in which the Tax Act was enacted. SAB 118 states that if a company can determine a reasonable estimate for the effects of the Tax Act then this estimate can be included in the financial statements. We have made reasonable estimates and recorded certain provisional tax benefits and charges in connection with the implementation of the Tax Act that were based on our current interpretation and understanding of the law and may change as we receive additional clarification and implementation guidance. Changes to these provisional amounts could result in material charges or credits in future reporting periods. We will continue to gather and analyze information on historical unrepatriated foreign earnings and to monitor state laws relating to this income to finalize both the federal and state tax impact. We will also continue to review the impact of certain limitations on deductions in our assessment of the value of our deferred tax assets as regulatory guidance is issued. See “Management’s Discussion and Analysis of Financial Condition and Results of Operations” for additional information.
Additionally, in the ordinary course of business we are subject to examinations by various authorities, including tax authorities. In addition to ongoing investigations, there could be additional investigations launched in the future by governmental authorities in various jurisdictions, and existing investigations could be expanded. The global and diverse nature of our operations means that these risks will continue to exist and additional investigations, proceedings and contingencies will arise from time to time. Our business, results of operations and financial condition may be affected by the outcome of investigations, proceedings and other contingencies that cannot be predicted with certainty.
A substantial portion of our revenues are derived, and a substantial portion of our operations are conducted, outside the U.S.
For the years ended December 31, 2017, 2016 and 2015 international revenues accounted for 27%, 27% and 32%, respectively, of our total revenues. We sell certain of our products, such as MarginMan and Pacer, primarily outside the U.S. On June 23, 2016, the U.K. held a referendum in which voters approved an exit from the E.U, commonly referred to as “Brexit.” Current uncertainty over the final outcome of the negotiations between the U.K. and the E.U., with respect to the terms of the U.K.’s exit, may adversely affect our operations and financial results, as we generated approximately $115.8 million in revenue from the U.K. in 2017. Our international business is also subject to a variety of other risks, including:
|
|
● |
potential changes in a specific country’s or region’s political or economic climate; |
|
|
● |
the need to comply with a variety of local regulations and laws, U.S. export controls, the FCPA and the Bribery Act; |
|
|
● |
fluctuations in foreign currency exchange rates; |
|
|
● |
application of discriminatory fiscal policies; |
|
|
● |
potential changes in tax laws and the interpretation of such laws; and |
|
|
● |
potential difficulty enforcing third-party contractual obligations and intellectual property rights. |
Such factors could adversely affect our business, results of operations and financial condition.
We are exposed to fluctuations in currency exchange rates that could negatively impact our operating results and financial condition.
Because a significant portion of our business is conducted outside the U.S. and significant revenues are generated outside the U.S., we face exposure to adverse movements in foreign currency exchange rates. Fluctuations in currencies relative to currencies in which our earnings are generated also make it more difficult to perform period-to-period comparisons of our reported results of operations. Because our Consolidated Financial Statements are reported in U.S. dollars, translation of sales or earnings generated in other currencies into U.S. dollars can result in a significant increase or decrease in the reported amount of those sales or earnings. In addition, we incur currency transaction risk whenever we enter into either a purchase or a sales transaction using a currency other than the local currency of the transacting entity. Given the volatility of exchange rates, we cannot be assured we will be able to effectively manage our currency translation or transaction risk, and significant changes in the value of foreign currencies relative to the U.S. dollar could adversely affect our financial statements. See “Management’s Discussion and Analysis of Financial Condition and Results of Operations” for further discussion on the foreign currency translation impact on operating results and financial condition.
We do not currently engage in hedging activities. Changes in economic or political conditions globally and in any of the countries in which we operate could result in exchange rate movements, new currency or exchange controls or other restrictions being imposed on our operations.
25
Changes or modifications in financial accounting standards may have a material adverse impact on our reported results of operations or financial condition.
A change or modification in accounting policies can have a significant effect on our reported results and may even affect our reporting of transactions completed before the change is effective, including the potential impact of the adoption and implementation of the accounting standard update on revenue recognition issued in May 2014 by the Financial Accounting Standards Board. Under the new standard, we will recognize term license revenues upfront at time of delivery rather than ratably over the related contract period. Additionally, under the new standard, we will capitalize and amortize certain direct costs, such as commissions, over the expected customer life rather than expensing them as incurred. While the adoption of the new standard does not change the cash flows received from our contracts with customers, its adoption could have a material adverse effect on our financial position or results of operations. See Note 2 to our Consolidated Financial Statements for additional information. New pronouncements and varying interpretations of existing pronouncements have occurred with frequency and may occur in the future. Changes to existing rules, or changes to the interpretations of existing rules, could lead to changes in our accounting practices, and such changes could materially adversely affect our reported financial results or the way we conduct our business.
A material weakness in our internal controls could have a material adverse effect on us.
Effective internal controls are necessary for us to provide reasonable assurance with respect to our financial reports and to effectively prevent fraud. If we cannot do so, our reputation and operating results could be harmed. A material weakness in our internal control over financial reporting could adversely impact our ability to provide timely and accurate financial information. Even effective internal controls can provide only reasonable assurance with respect to the preparation and fair presentation of financial statements. In addition, controls can be circumvented by individual acts of some persons, by collusion of two or more people, or by management override of the controls. Over time, controls may become inadequate because changes in conditions or deterioration in the degree of compliance with policies or procedures may occur. Because of the inherent limitations in a cost-effective control system, misstatements due to error or fraud may occur and not be detected. If we are unable to report financial information timely and accurately or to maintain effective disclosure controls and procedures, our stock price could be negatively impacted and we could be subject to, among other things, regulatory or enforcement actions by the SEC, which could have a material adverse effect on our business, results of operations and financial condition.
Risks Relating to Our Indebtedness
Our substantial indebtedness could adversely affect our financial health and operations.
We currently have a substantial amount of indebtedness. As of December 31, 2017, we had total indebtedness of $2,092.2 million and additional available borrowings of $149.1 million under our revolving credit facility. To fund our pending acquisition of DST, and to refinance certain of the Company’s and all of DST’s existing indebtedness, we expect to incur substantial indebtedness under a new senior secured credit facility and may issue new senior unsecured notes. This indebtedness could have adverse consequences. For example, it may:
|
|
● |
require us to dedicate a substantial portion of our cash flow from operations to payments on our indebtedness, thereby reducing the availability of our cash flow to fund acquisitions, working capital, capital expenditures, research and development efforts and other general corporate purposes; |
|
|
● |
increase our vulnerability to and limit our flexibility in planning for, or reacting to, change in our business and the industry in which we operate; |
|
|
● |
restrict our ability to make certain distributions with respect to our capital stock due to restricted payment and other financial covenants in our credit facilities and other financing agreements; |
|
|
● |
expose us to the risk of increased interest rates as borrowings under our senior credit facility are subject to variable rates of interest; |
|
|
● |
place us at a competitive disadvantage compared to our competitors that have less debt; and |
|
|
● |
limit our ability to borrow additional funds. |
In addition, the agreement governing our senior credit facility contains financial and other restrictive covenants that limit our ability to engage in activities that may be in our long-term best interests, and any additional indebtedness we incur to fund the DST acquisition or otherwise may also contain restrictive covenants. Our failure to comply with those covenants could result in an event of default which, if not cured or waived, could result in the acceleration of all of our debts. Furthermore, any additional indebtedness we incur to fund the pending acquisition of DST or otherwise may contain similar covenants and restrictions those described above.
26
To service our indebtedness, we require a significant amount of cash. Our ability to generate cash depends on many factors beyond our control.
We are currently obligated to make periodic interest payments on our senior credit facility and senior notes of approximately $91.4 million annually. In connection with the pending DST acquisition, we expect debt interest payments to increase substantially. Our ability to make payments on and to refinance our indebtedness and to fund planned capital expenditures will depend on our ability to generate cash in the future. This, to a certain extent, is subject to general economic, financial, competitive, legislative, regulatory and other factors that are beyond our control.
If our business fails to generate sufficient cash flow from operations and future borrowings are not available to us, we may not be able to pay our indebtedness or fund our other liquidity needs. We may need to refinance all or a portion of our indebtedness on or before maturity. We may not be able to refinance any of our indebtedness on commercially reasonable terms or at all. If we cannot service our indebtedness, we may have to take actions such as selling assets, seeking additional equity or reducing or delaying capital expenditures, strategic acquisitions, investments and joint ventures. We may not be able to effect such actions, if necessary, on commercially reasonable terms or at all.
Restrictive covenants in the agreements governing our indebtedness may restrict our ability to pursue our business strategies.
The agreements governing our senior credit facility and senior notes will limit our ability, among other things, to:
|
|
● |
incur additional indebtedness; |
|
|
● |
make certain investments; |
|
|
● |
sell assets, including capital stock of certain subsidiaries; |
|
|
● |
declare or pay dividends, repurchase or redeem stock or make other distributions to stockholders; |
|
|
● |
consolidate, merge, liquidate or dissolve; |
|
|
● |
enter into transactions with our affiliates; and |
|
|
● |
incur liens. |
In addition, the agreement governing our senior credit facility also requires us to maintain compliance with specified leverage ratios. Our ability to comply with these provisions may be affected by events beyond our control, and these provisions could limit our ability to plan for or react to market conditions, meet capital needs or otherwise conduct our business activities and plans.
Our inability to comply with any of these provisions could result in a default under one or more of the agreements governing our indebtedness. If such a default occurs under one such agreement, the creditors under another debt agreement may elect to declare all borrowings outstanding, together with accrued interest and other fees, to be immediately due and payable. In addition, the lenders under our senior credit facility would have the right to terminate any commitments they have to provide further borrowings.
If we are unable to repay outstanding borrowings when due, the lenders under our senior credit facility also have the right to proceed against the collateral, including our available cash and substantially all of our domestic assets and the assets of our domestic subsidiaries, granted to them to secure the indebtedness under that facility. If the indebtedness under our senior credit facility were to be accelerated, we cannot assure you that our assets would be sufficient to repay in full that indebtedness and our other indebtedness.
Risks Relating to Our Pending Acquisition of DST Systems, Inc.
The anticipated benefits of our pending acquisition of DST may not be realized or those benefits may take longer to realize than expected.
The success of our pending acquisition of DST will depend, to a large extent, on our ability to realize the anticipated benefits and cost savings derived from this transaction and our ability to integrate the two organizations and businesses. The combination of two independent businesses is a complex, costly and time-consuming process. As a result, DST and we will devote significant management attention and resources prior to closing to prepare for integrating, and we will devote significant management attention and resources post-closing to integrate the business practices and operations of both organizations. The integration process may disrupt the businesses and, if implemented ineffectively, would impair the realization of the full expected benefits.
27
In addition, we continue to evaluate our estimates of synergies to be realized from the acquisition, so our actual cost-savings could differ materially from our current estimates. We cannot assure you that we will achieve the full amount of cost-savings on the schedule anticipated or at all.
A failure to meet the challenges involved in integrating the two businesses and to realize the anticipated benefits of the transaction could cause an interruption of, or a loss of momentum in, the activities of the post-acquisition company and could adversely affect its results of operations. In addition, the overall integration of the businesses may result in material unanticipated problems, expenses, liabilities, competitive responses, loss of customer and other business relationships, and diversion of management’s attention. The difficulties of combining the operations of the companies include, among others:
|
|
● |
the diversion of management’s attention to integration matters; |
|
|
● |
difficulties in achieving anticipated cost savings, synergies, business opportunities and growth; |
|
|
● |
difficulties in the integration of operations, software and technology systems; |
|
|
● |
difficulties in conforming standards, controls, procedures and accounting and other policies, business cultures and compensation structures between the two companies; |
|
|
● |
difficulties in the assimilation of employees; |
|
|
● |
difficulties in managing the expanded operations of a significantly larger and more complex company; |
|
|
● |
challenges in keeping existing customers and obtaining new customers; |
|
|
● |
potential unknown liabilities, adverse consequences and unforeseen increased expenses and unanticipated competitive responses associated with our pending acquisition of DST; and |
|
|
● |
coordinating a more geographically dispersed organization. |
Many of these factors will be outside of our control and any one of them could result in increased costs, decreases in the amount of expected revenues and diversion of management’s time and energy, which could materially impact the business, financial condition and results of operations of the post-acquisition company. In addition, even if our operations are integrated successfully with DST, the full benefits of the transactions may not be realized, including the synergies, cost savings or sales or growth opportunities that are expected. These benefits may not be achieved within the anticipated time frame, or at all. Further, additional unanticipated costs may be incurred in the integration of our business with DST. An inability to realize the full extent of, or any of, the anticipated benefits of the acquisition, as well as any delays encountered in the integration process, could have an adverse effect on our financial condition, results of operations and cash flows. All of these factors could cause dilution to our earnings per share, decrease or delay the expected accretive effect of the transaction, and negatively impact the price of our common stock.
We will incur costs as a result of our pending acquisition of DST.
We will incur substantial expenses in connection with our pending acquisition of DST and over a period of time following the completion of the acquisition. While we have assumed that a certain level of transaction expenses will be incurred, factors beyond our control could affect the total amount or the timing of these expenses. Many of the expenses that will be incurred, by their nature, are difficult to estimate accurately. Any increase in these estimated expenses or change in the timing of these expenses could have an adverse effect on our financial condition, results of operations and cash flows.
Failure to consummate the DST acquisition or termination of the acquisition agreement could negatively affect us.
We will not realize any of the anticipated benefits of our pending acquisition of DST until it is completed. Our pending acquisition of DST may not close for various reasons, including our inability to obtain regulatory approvals, satisfy other closing conditions, or because DST terminates the acquisition agreement in favor of another potential acquirer. In the event that we are unable to consummate the pending acquisition of DST, the market price of our common stock may decline.
The announcement and pendency of the DST acquisition could distract our management and adversely affect our business.
Our efforts to complete the DST acquisition could cause substantial disruptions in our business. A substantial amount of our management’s attention is being directed towards the completion of the DST acquisition and thus is being diverted from our day-to-day operations. Any such distraction could affect our management’s ability to service our existing business, pursue other business opportunities or could otherwise adversely affect our business.
28
We and DST must obtain required approvals and consents to consummate the pending acquisition, which if delayed or not granted or granted with unacceptable conditions, may prevent, delay or jeopardize the consummation of the transaction, result in additional expenditures of money and resources and/or reduce the anticipated benefits of the transaction.
Our pending acquisition of DST is subject to customary closing conditions. These closing conditions include, among others, the receipt of required approvals by DST shareholders, foreign regulatory approvals and the expiration or termination of applicable waiting periods under the Hart-Scott-Rodino Antitrust Improvements Act of 1976. The governmental authorities whose approval we need generally have broad discretion in making their decisions. We can provide no assurance that required approvals and consents will be obtained in a timely manner or at all. Further, no assurance can be given that the required DST shareholder approval will be obtained or that the other closing conditions will be satisfied, and, if all required consents and approvals are obtained and the closing conditions are satisfied, no assurance can be given as to the terms, conditions and timing of the approvals or clearances. If any such approvals or clearances are delayed or not granted, or if they are granted with unacceptable conditions, it may prevent, delay or jeopardize the consummation of the DST acquisition, result in additional expenditures of money and resources and/or reduce the anticipated benefits of the acquisition, any of which could have a material adverse effect on our financial condition, results of operations and cash flows and could cause the market price of our common stock to decline.
Risks Relating to Ownership of Our Common Stock
If equity research analysts do not publish or cease publishing research or reports about our business or if they issue unfavorable commentary or downgrade our common stock, the price and trading volume of our common stock could decline.
The trading market for our common stock is influenced by the research and reports that equity research analysts publish about us and our business. We do not control these analysts. The price of our stock or trading volume in our stock could decline if one or more equity analysts downgrade our stock or if those analysts issue other unfavorable commentary or cease publishing regular reports about us or our business.
The market price of our common stock may be volatile, which could result in substantial losses for investors in our common stock.
Shares of our common stock were sold in our initial public offering at a price of $7.50 per share on March 31, 2010, and through December 31, 2017 our common stock has traded as high as $42.50 and as low as $6.64. An active, liquid and orderly market for our common stock may not be sustained, which could depress the trading price of our common stock. In addition, the market price of our common stock may fluctuate significantly. Some of the factors that may cause the market price of our common stock to fluctuate include:
|
|
● |
fluctuations in our quarterly financial results or the quarterly financial results of companies perceived to be similar to us; |
|
|
● |
changes in estimates of our financial results or recommendations by securities analysts; |
|
|
● |
failure of any of our products to achieve or maintain market acceptance; |
|
|
● |
changes in market valuations of similar companies; |
|
|
● |
success of competitive products; |
|
|
● |
changes in our capital structure, such as future issuances of securities or the incurrence of additional debt; |
|
|
● |
announcements by us or our competitors of significant products, contracts, acquisitions or strategic alliances; |
|
|
● |
regulatory developments in any of our markets; |
|
|
● |
litigation involving our Company, our general industry or both; |
|
|
● |
additions or departures of key personnel; |
|
|
● |
investors’ general perception of us; and |
|
|
● |
changes in general economic, industry and market conditions. |
In addition, if the market for technology stocks, financial services stocks or the stock market in general experiences a loss of investor confidence, the trading price of our common stock could decline for reasons unrelated to our business, financial condition or results of operations. If any of the foregoing occurs, it could cause our stock price to fall and may expose us to class action lawsuits that, even if unsuccessful, could be costly to defend and a distraction to management.
29
William C. Stone, our Chairman of the Board and Chief Executive Officer, exerts significant control over our Company.
As of February 16, 2018, William C. Stone, our Chairman of the Board and Chief Executive Officer, beneficially owned approximately 15.5% of the outstanding shares of our common stock. We are party to a stockholders’ agreement with Mr. Stone, pursuant to which Mr. Stone has the right to nominate two members of our board of directors, one of which will be Mr. Stone for so long as he is our Chief Executive Officer. As a result, Mr. Stone has significant influence over our policy and affairs and matters requiring stockholder approval.
SS&C Holdings is a holding company with no operations or assets of its own and its ability to pay dividends is limited or otherwise restricted.
SS&C Holdings has no direct operations and no significant assets other than the stock of SS&C and Advent Software, Inc. The ability of SS&C Holdings to pay dividends is limited by its status as a holding company and by the terms of the agreement governing our indebtedness. See “Risk factors — Risks relating to our indebtedness — Restrictive covenants in the agreements governing our indebtedness may restrict our ability to pursue our business strategies.” Moreover, none of the subsidiaries of SS&C Holdings is obligated to make funds available to SS&C Holdings for the payment of dividends or otherwise. In addition, Delaware law imposes requirements that may restrict the ability of our subsidiaries, including SS&C, to pay dividends to SS&C Holdings. These limitations could reduce our attractiveness to investors.
Our management has broad discretion in the use of our existing cash resources and may not use such funds effectively.
Our management has broad discretion in the application of our cash resources. Accordingly, our stockholders will have to rely upon the judgment of our management with respect to our existing cash resources, with only limited information concerning management’s specific intentions. Our management may spend our cash resources in ways that our stockholders may not desire or that may not yield a favorable return. The failure by our management to apply these funds effectively could harm our business.
Provisions in our certificate of incorporation and bylaws might discourage, delay or prevent a change of control of our Company or changes in our management and, therefore, depress the trading price of our common stock.
Provisions of our certificate of incorporation and bylaws and Delaware law may discourage, delay or prevent a merger, acquisition or other change in control that stockholders may consider favorable, including transactions in which stockholders might otherwise receive a premium for their shares of our common stock. These provisions may also prevent or frustrate attempts by our stockholders to replace or remove our management. These provisions include:
|
|
● |
limitations on the removal of directors; |
|
|
● |
a classified board of directors so that not all members of our board are elected at one time; |
|
|
● |
advance notice requirements for stockholder proposals and nominations; |
|
|
● |
the inability of stockholders to call special meetings; |
|
|
● |
the ability of our board of directors to make, alter or repeal our bylaws; |
|
|
● |
the ability of our board of directors to designate the terms of and issue new series of preferred stock without stockholder approval, which could be used to institute a rights plan, or a poison pill, that would work to dilute the stock ownership of a potential hostile acquirer, likely preventing acquisitions that have not been approved by our board of directors; and |
|
|
● |
a prohibition on stockholders from acting by written consent. |
The existence of the foregoing provisions and anti-takeover measures could limit the price that investors might be willing to pay in the future for shares of our common stock. They could also deter potential acquirers of our Company, thereby reducing the likelihood that our stockholders could receive a premium for their shares of common stock in an acquisition.
None.
We lease our corporate offices, which consist of approximately 93,500 square feet of office space located at 80 Lamberton Road, Windsor, CT 06095. In 2013, we extended the lease term through October 2022. We utilize facilities and offices in 38 other locations in the United States and have offices in North America, Europe, Asia, Australia and Africa. We lease all of our facilities and
30
offices except for our offices in Yorktown, New York, and Harrison, New York, which we own. We believe that our facilities are in good condition and generally suitable to meet our needs for the foreseeable future; however, we will continue to seek additional space as needed to satisfy our growth.
From time to time, the Company is subject to legal proceedings and claims. In the opinion of the Company’s management, the Company is not involved in any litigation or proceedings that would have a material adverse effect on the Company or its business.
Not applicable.
31
|
ITEM 5. |
MARKET FOR REGISTRANT’S COMMON EQUITY, RELATED STOCKHOLDER MATTERS AND ISSUER PURCHASES OF EQUITY SECURITIES |
Our common stock trades on The Nasdaq Global Select Market under the symbol “SSNC”. The following table sets forth, for the periods indicated, the high and low sales prices of our common stock as reported by The Nasdaq Global Select Market:
|
|
|
High |
|
|
Low |
|
||
|
2017 |
|
|
|
|
|
|
|
|
|
Fourth quarter |
|
$ |
42.50 |
|
|
$ |
39.15 |
|
|
Third quarter |
|
$ |
40.53 |
|
|
$ |
36.48 |
|
|
Second quarter |
|
$ |
39.32 |
|
|
$ |
34.75 |
|
|
First quarter |
|
$ |
37.48 |
|
|
$ |
28.51 |
|
|
|
|
|
|
|
|
|
|
|
|
|
|
High |
|
|
Low |
|
||
|
2016 |
|
|
|
|
|
|
|
|
|
Fourth quarter |
|
$ |
33.50 |
|
|
$ |
28.43 |
|
|
Third quarter |
|
$ |
34.19 |
|
|
$ |
27.91 |
|
|
Second quarter (1) |
|
$ |
32.25 |
|
|
$ |
26.15 |
|
|
First quarter (1) |
|
$ |
33.92 |
|
|
$ |
23.62 |
|
|
|
|
|
(1) |
Amounts for the first and second quarter of 2016 have been restated to reflect our two-for-one stock split in the form of a stock dividend, effective on June 24, 2016. |
On February 16, 2018, the closing price reported on The Nasdaq Global Select Market of our common stock was $50.00 per share. As of February 16, 2018, we had approximately 3,000 holders of record of our common stock.
There is no established public trading market for shares of our Class A non-voting common stock, and as of December 31, 2016 there were no shares of our Class A non-voting common stock outstanding. On March 30, 2016, William C. Stone converted 2,703,846 shares of Class A non-voting stock into 2,703,846 shares of the Company’s common stock, or 5,407,692 shares of common stock on a post-split basis. Each share of Class A non-voting common stock converted automatically into one share of the Company’s common stock upon the expiration of the applicable waiting period under the HSR Act.
In 2017, we paid quarterly cash dividends of $0.0625 per share of common stock on March 15, 2017 and June 15, 2017 and $0.07 per share of common stock on September 15, 2017 and December 15, 2017, to stockholders of record as of the close of business on March 1, 2017, June 1, 2017, September 1, 2017 and December 1, 2017, respectively, totaling $54.4 million. Our ability to pay dividends is limited by our status as a holding company and by the terms of the agreements governing our senior credit facility and our senior notes, insofar as we may seek to pay dividends out of funds made available to us by our subsidiaries, because our debt instruments directly or indirectly impose certain limitations on our subsidiaries’ ability to pay dividends or make loans to us. Any future determination as to the declaration and payment of dividends will be at the discretion of our Board of Directors and will depend on then-existing conditions, including our financial condition, operating results, contractual restrictions, capital requirements, current and anticipated cash needs, plans for expansion, and other factors our Board of Directors may deem relevant.
Our equity plan information required by this item is incorporated by reference to the information in Part III, Item 12 of this annual report on Form 10-K.
32
This performance graph shall not be deemed “soliciting material” or to be “filed” with the SEC for purposes of Section 18 of the Securities Exchange Act of 1934, as amended, or the Exchange Act, or otherwise subject to the liabilities under that Section, and shall not be deemed to be incorporated by reference into any filing of SS&C Technologies Holdings, Inc. under the Exchange Act.
The following graph shows a comparison from December 31, 2012 through December 31, 2017 of cumulative total return for our common stock, the Nasdaq Composite Index and the Nasdaq Computer and Data Processing Index. Such returns are based on historical results and are not intended to suggest future performance. Data for the Nasdaq Composite Index and the Nasdaq Computer and Data Processing Index assume reinvestment of dividends.
COMPARISON OF CUMULATIVE TOTAL RETURN*
Among SS&C Technologies Holdings, Inc., the Nasdaq Composite Index
And the Nasdaq Computer and Data Processing Index
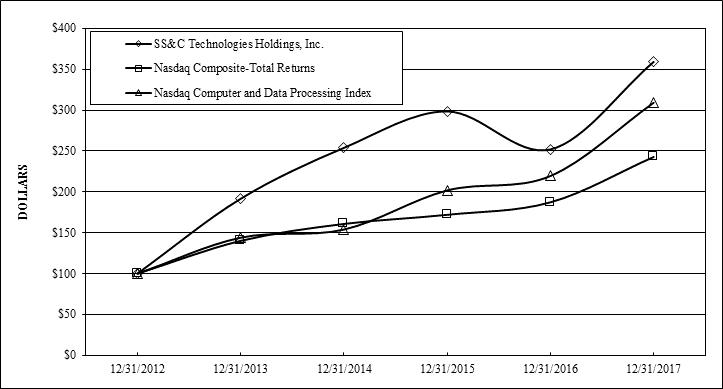
|
* |
$100 invested in stock on 12/31/2012. Return calculations of indices assume the reinvestment of dividends. |
|
|
|
12/31/2012 |
|
|
12/31/2013 |
|
|
12/31/2014 |
|
|
12/31/2015 |
|
|
12/31/2016 |
|
|
12/31/2017 |
|
||||||
|
SS&C Technologies Holdings, Inc. |
|
|
100 |
|
|
|
192 |
|
|
|
254 |
|
|
|
298 |
|
|
|
252 |
|
|
|
359 |
|
|
Nasdaq Composite-Total Returns |
|
|
100 |
|
|
|
140 |
|
|
|
161 |
|
|
|
172 |
|
|
|
187 |
|
|
|
243 |
|
|
Nasdaq Computer & Data Processing Index |
|
|
100 |
|
|
|
144 |
|
|
|
154 |
|
|
|
202 |
|
|
|
219 |
|
|
|
309 |
|
33
The five-year selected financial data set forth below should be read in conjunction with our Consolidated Financial Statements and related notes and “Management’s Discussion and Analysis of Financial Condition and Results of Operations” appearing elsewhere in this annual report on Form 10-K.
|
|
|
For the Year Ended December 31, |
|
|||||||||||||||||
|
|
|
2017 (5) |
|
|
2016 (4) |
|
|
2015 (3) |
|
|
2014 (2) |
|
|
2013 (1) |
|
|||||
|
CONSOLIDATED STATEMENTS OF COMPREHENSIVE INCOME DATA |
|
($ in thousands, except per share data) |
|
|||||||||||||||||
|
Revenues |
|
$ |
1,675,295 |
|
|
$ |
1,481,436 |
|
|
$ |
1,000,285 |
|
|
$ |
767,861 |
|
|
$ |
712,702 |
|
|
Operating income |
|
|
396,913 |
|
|
|
288,695 |
|
|
|
164,738 |
|
|
|
200,372 |
|
|
|
182,968 |
|
|
Net income |
|
|
328,864 |
|
|
|
130,996 |
|
|
|
42,862 |
|
|
|
131,127 |
|
|
|
117,895 |
|
|
Earnings per share - Basic |
|
$ |
1.60 |
|
|
$ |
0.65 |
|
|
$ |
0.24 |
|
|
$ |
0.79 |
|
|
$ |
0.73 |
|
|
Earnings per share - Diluted |
|
$ |
1.55 |
|
|
$ |
0.64 |
|
|
$ |
0.22 |
|
|
$ |
0.75 |
|
|
$ |
0.69 |
|
|
Weighted average shares outstanding - Basic |
|
|
204,923 |
|
|
|
200,252 |
|
|
|
182,196 |
|
|
|
166,628 |
|
|
|
162,390 |
|
|
Weighted average shares outstanding - Diluted |
|
|
211,632 |
|
|
|
205,793 |
|
|
|
190,896 |
|
|
|
174,662 |
|
|
|
171,232 |
|
|
Cash dividends declared and paid per common share (6) |
|
$ |
0.265 |
|
|
$ |
0.25 |
|
|
$ |
0.25 |
|
|
$ |
0.0625 |
|
|
|
— |
|
|
|
|
|
|
|
|
|
|
|
|
|
|
|
|
|
|
|
|
|
|
|
|
|
|
As of December 31, |
|
|||||||||||||||||
|
|
|
2017 (5) |
|
|
2016 (4) |
|
|
2015 (3) |
|
|
2014 (2) |
|
|
2013 (1) |
|
|||||
|
CONSOLIDATED BALANCE SHEET DATA |
|
($ in thousands) |
|
|||||||||||||||||
|
Total assets |
|
$ |
5,539,516 |
|
|
$ |
5,706,971 |
|
|
$ |
5,802,242 |
|
|
$ |
2,266,155 |
|
|
$ |
2,275,324 |
|
|
Total long-term debt, including current portion |
|
|
2,045,195 |
|
|
|
2,501,130 |
|
|
|
2,751,351 |
|
|
|
619,738 |
|
|
|
774,507 |
|
|
Stockholders’ equity |
|
|
2,686,388 |
|
|
|
2,258,578 |
|
|
|
2,105,446 |
|
|
|
1,346,670 |
|
|
|
1,231,708 |
|
|
(1) |
On October 1, 2013, we acquired all of the outstanding stock of Prime Management Limited. See Note 11 to our Consolidated Financial Statements. |
|
(2) |
On November 30, 2014, we acquired all of the outstanding stock of DST Global Solutions Ltd. and the assets and business of DST Global Solutions LLC, together DSTGS, subsidiaries of DST Systems, Inc. See Note 11 to our Consolidated Financial Statements. |
|
(3) |
On July 8, 2015, we acquired all of the outstanding stock of Advent. On September 1, 2015, we acquired the assets and business of Varden Technologies. On November 16, 2015, we acquired all of the outstanding stock of Primatics Financial. See Note 11 to our Consolidated Financial Statements. |
|
(4) |
On March 11, 2016, we acquired the assets and business associated with Citigroup AIS. On October 20, 2016, we acquired all of the outstanding stock of Salentica. On December 1, 2016, we acquired the assets and business associated with GFS. On December 15, 2016, we acquired all of the outstanding stock of Conifer. See Note 11 to our Consolidated Financial Statements. |
|
(5) |
On October 13, 2017, we acquired all of the outstanding stock of CommonWealth. On October 31, 2017, we acquired all of the outstanding stock of Modestspark. See Note 11 to our Consolidated Financial Statements. |
|
(6) |
On June 24, 2016, SS&C Technologies Holdings, Inc. completed a two-for-one stock split, effected in the form of a stock dividend. All share and per share amounts have been retroactively restated for all periods presented to reflect the stock split. |
34
Overview
Business. We are a leading provider of mission-critical, sophisticated software products and software-enabled services that allow financial services providers to automate complex business processes and effectively manage their information processing requirements. Our portfolio of software products and rapidly deployable software-enabled services allows our clients to automate and integrate front-office functions such as trading and modeling, middle-office functions such as portfolio management and reporting, and back-office functions such as accounting, performance measurement, reconciliation, reporting, processing and clearing. Our solutions enable our clients to focus on core operations, better monitor and manage investment performance and risk, improve operating efficiency and reduce operating costs. We provide our solutions globally to approximately 11,000 clients, principally within the institutional asset and wealth management, alternative investment management, financial advisory and financial institutions vertical markets. In addition, our clients include commercial lenders, real estate investment trusts (“REITs”), corporate treasury groups, insurance and pension funds, municipal finance groups and real estate property managers.
Acquisitions. To supplement our growth, we evaluate and execute acquisitions that provide complementary products or services, add proven technology and an established client base and expand our intellectual property portfolio or address a highly specialized problem or a market niche. Since the beginning of 2015, we have spent approximately $3.3 billion to acquire nine businesses in the financial services software industry, using a combination of cash on hand and equity and debt financing (as discussed in Notes 6 and 11 to our Consolidated Financial Statements).
The following table lists the significant businesses we have acquired since January 1, 2015:
|
Acquired Business |
|
Acquisition Date |
|
Acquired Capabilities, Products and Services |
|
CommonWealth Fund Services Ltd. |
|
October 2017 |
|
Expanded fund administration services in hedge fund and private equity sectors |
|
Conifer Financial Services, LLC. |
|
December 2016 |
|
Expanded fund administration services in hedge fund and other asset management sectors |
|
Wells Fargo's Global Funds Service |
|
December 2016 |
|
Expanded fund administration services in hedge fund and private equity sectors |
|
Citigroup's Alternative Investor Service |
|
March 2016 |
|
Expanded fund administration services in hedge fund and private equity sectors |
|
Primatics Financial |
|
November 2015 |
|
Added cloud-based integrated risk, compliance and finance solution for the banking industry |
|
Varden Technologies |
|
September 2015 |
|
Added cloud-based client and advisor communication solutions for investment firms |
|
Advent Software, Inc. |
|
July 2015 |
|
Expanded global investment management software and services |
The discussion in this Part II, Item 7 of this Annual Report on Form 10-K includes the operations of the business listed in the table above for the respective time periods each was owned by SS&C.
On January 11, 2018, we announced that we had entered into a definitive agreement to acquire DST. Under the terms of the agreement, we will acquire DST for an enterprise value of approximately $5.4 billion, comprising $84 per share of DST common stock in cash plus the assumption of debt. The closing, which is expected to occur by the third quarter of 2018, remains subject to DST stockholder approval, clearances by relevant regulatory authorities and satisfaction of customary closing conditions. We plan to fund the acquisition and refinance certain of our existing debt and all of DST’s existing debt with a combination of debt and equity. DST is a global provider of specialized technology, strategic advisory and business operations outsourcing to the financial services and healthcare industries. The DST acquisition will have a material impact on our financial position, results of operations and cash flows.
Revenues. Our contractually recurring revenues, which include our maintenance and term licenses revenues and software-enabled services revenues, were $1,577.7 million in 2017, compared to $1,371.5 million and $916.6 million in 2016 and 2015, respectively. In 2017, contractually recurring revenues represented 94% of total revenues, compared to 93% in 2016 and 92% in 2015, respectively. We believe our high level of contractually recurring revenues provides us with the ability to better manage our costs and capital investments. Our revenues from sales outside the United States were $452.9 million in 2017, compared to $400.2 million and $318.0 million in 2016 and 2015, respectively.
35
As we have expanded our business, we have focused on increasing our contractually recurring revenues. Since 2015, we have seen increased demand in the financial services industry for our software-enabled services from existing and new customers. We have taken a number of steps to support that demand, such as automating our software-enabled services delivery methods, expanded our service offerings and providing our employees with sales incentives. We have also acquired businesses that offer software-enabled services or have a large base of term license or maintenance clients. Our software-enabled services revenues increased from $670.2 million in 2015 to $1,114.0 million in 2017. Our maintenance and term licenses revenues increased from $246.4 million in 2015 to $463.7 million in 2017. Maintenance customer retention rates have continued to be in excess of 90% for our core enterprise products, and we have maintained both pricing levels for new contracts and annual price increases for existing contracts. To support the growth in our software-enabled services revenues and maintain our level of customer service, we have added personnel, expanded our facilities and invested in information technology. These investments and automation improvements in our software-enabled services have served to improve gross margins.
Liquidity. In connection with the acquisition of Advent in the third quarter of 2015, we entered into a new credit agreement, or Credit Agreement, and issued $600 million aggregate principal amount of 5.875% Senior Notes due 2023, or Senior Notes, each of which is described in Contractual Obligations, to fund a portion of the purchase price, refinance amounts outstanding under our prior credit facility (“Prior Facility”) and raise cash for the acquisition of Citigroup’s Alternative Investor Services business (“Citigroup AIS”). In addition, to fund our pending acquisition of DST, and to refinance certain of our existing indebtedness and all of DST’s existing indebtedness, we expect to incur substantial indebtedness under a new senior secured credit facility and may issue equity and new senior unsecured notes, and we expect that our interest expense will increase substantially as a result.
We generated $470.4 million in cash from operating activities in 2017, compared to $418.4 million and $230.6 million in 2016 and 2015, respectively. In 2017, we used our operating cash flow, $45.0 million in proceeds received from debt financing, $60.2 million in proceeds from the exercise of stock options and existing cash to acquire CommonWealth, repay $512.5 million of debt, pay $54.4 million in dividends and invest in capital expenditures in our business.
Results of Operations
Revenues
We derive our revenue from two sources: recurring revenues and, to a lesser degree, non-recurring revenues. Recurring revenues consist of software-enabled services and maintenance and term licenses. As a general matter, fluctuations in our software-enabled services revenues are attributable to the number of new software-enabled services clients as well as total assets under management in our clients’ portfolios and the number of outsourced transactions provided to our existing clients. Maintenance revenues vary based on customer retention, the number of new perpetual licenses and on the annual increases in fees, which are generally tied to the consumer price index, while term license revenues vary based on the rate by which we add or lose clients over time. Non-recurring revenues consist of professional services and perpetual license fees and tend to fluctuate based on the number of new licensing clients and demand for consulting services.
The following table sets forth the percentage of our total revenues represented by each of the following sources of revenues for the periods indicated:
|
|
|
Year Ended December 31, |
|
|||||||||
|
|
|
2017 |
|
|
2016 |
|
|
2015 |
|
|||
|
Revenues: |
|
|
|
|
|
|
|
|
|
|
|
|
|
Software-enabled services |
|
|
66 |
% |
|
|
65 |
% |
|
|
67 |
% |
|
Maintenance and term licenses |
|
|
28 |
|
|
|
28 |
|
|
|
25 |
|
|
Total recurring revenues |
|
|
94 |
|
|
|
93 |
|
|
|
92 |
|
|
Perpetual licenses |
|
|
1 |
|
|
|
1 |
|
|
|
3 |
|
|
Professional services |
|
|
5 |
|
|
|
6 |
|
|
|
5 |
|
|
Total non-recurring revenues |
|
|
6 |
|
|
|
7 |
|
|
|
8 |
|
|
Total revenues |
|
|
100 |
% |
|
|
100 |
% |
|
|
100 |
% |
36
The following table sets forth revenues (dollars in thousands) and percent change in revenues for the periods indicated:
|
|
|
Year Ended December 31, |
|
|
Percent Change from Prior Period |
|
||||||||||||||
|
|
|
2017 |
|
|
2016 |
|
|
2015 |
|
|
2017 |
|
|
2016 |
|
|||||
|
Revenues: |
|
|
|
|
|
|
|
|
|
|
|
|
|
|
|
|
|
|
|
|
|
Software-enabled services |
|
$ |
1,114,008 |
|
|
$ |
956,791 |
|
|
$ |
670,170 |
|
|
|
16 |
% |
|
|
43 |
% |
|
Maintenance and term licenses |
|
|
463,658 |
|
|
|
414,710 |
|
|
|
246,422 |
|
|
|
12 |
|
|
|
68 |
|
|
Total recurring revenues |
|
|
1,577,666 |
|
|
|
1,371,501 |
|
|
|
916,592 |
|
|
|
15 |
|
|
|
50 |
|
|
Perpetual licenses |
|
|
19,679 |
|
|
|
23,960 |
|
|
|
31,467 |
|
|
|
(18 |
) |
|
|
(24 |
) |
|
Professional services |
|
|
77,950 |
|
|
|
85,975 |
|
|
|
52,226 |
|
|
|
(9 |
) |
|
|
65 |
|
|
Total non-recurring revenues |
|
|
97,629 |
|
|
|
109,935 |
|
|
|
83,693 |
|
|
|
(11 |
) |
|
|
31 |
|
|
Total revenues |
|
$ |
1,675,295 |
|
|
$ |
1,481,436 |
|
|
$ |
1,000,285 |
|
|
|
13 |
|
|
|
48 |
|
Fiscal 2017 versus Fiscal 2016. Our revenues increased $193.9 million, primarily due to revenues related to our acquisitions of CommonWealth Fund Services in the fourth quarter of 2017, GFS and Conifer in the fourth quarter of 2016 and Citigroup AIS in the first quarter of 2016, which contributed $117.7 million in revenues, net of a reduction of $2.7 million in revenues related to the loss of sales to these businesses. Additionally, organic revenues increased $75.0 million, of which approximately $35.4 million was the result of the impact of the fair value adjustment for acquired deferred revenue on the periods. The change in organic revenues also reflects a reduction of $19.0 million related to fund administration service clients that were acquired through the Citigroup AIS acquisition who had indicated they were terminating their contracts prior to the acquisition closing. The final purchase price of the Citigroup AIS business acquisition included an adjustment for these terminated clients. The remaining increases in organic revenues were primarily due to an increase in term license revenues and a continued increase in demand for our fund administration services. These increases were also impacted favorably from foreign currency translation by $1.1 million, which resulted from the weakness of the U.S. dollar relative to currencies such as the Canadian dollar, Australian dollar and the euro. Recurring revenues increased $206.2 million, primarily due to the acquisitions, which added revenues of $116.2 million, as well as from an increase in organic revenues of $89.2 million, of which $27.5 million was the result of the impact of the fair value adjustment of acquired deferred revenue on the periods. The organic recurring revenue increase of $89.2 million was primarily due to an increase in software-enabled services revenues within our fund administration business as well as an increase in term licenses revenues. Non-recurring revenues decreased $12.3 million, primarily due to a decrease in organic revenues of $14.2 million, which is net of an increase of approximately $7.9 million resulting from the impact of the fair value adjustment of acquired deferred revenue, partially offset by our acquisitions, which contributed $1.5 million. The organic non-recurring revenue decrease of $14.2 million was due to decreases of $4.4 million and $9.7 million in perpetual licenses and professional services revenues, respectively.
Fiscal 2016 versus Fiscal 2015. Our revenues increased primarily due to revenues related to our acquisitions of GFS and Conifer in the fourth quarter of 2016, Citigroup AIS in the first quarter of 2016, Primatics in the fourth quarter of 2015 and Varden and Advent in the third quarter of 2015, which contributed $418.9 million in revenues. Additionally, organic revenues increased $71.4 million, of which approximately $13.6 million was the result of the impact of the fair value adjustment for acquired deferred revenue on the periods. These increases were partially offset by the unfavorable impact from foreign currency translation of $9.2 million, which resulted from the strength of the U.S. dollar relative to currencies such as the British pound and the Canadian dollar. Maintenance and term licenses revenues and software-enabled services revenues experienced increases due to the acquisitions, which contributed revenues of $124.6 million and $263.6 million, respectively, in 2016. Maintenance and term licenses revenues and software-enabled services revenues reflect reductions of $29.1 million in maintenance and term license revenues and software-enabled services revenues related to the fair value adjustment of acquired deferred revenue for these acquisitions. Professional services revenues and perpetual license revenues experienced increases due to the acquisitions, which contributed revenues of $29.8 million and $0.9 million, respectively, in 2016. Professional services revenues reflect a reduction of $13.5 million related to the fair value adjustment of acquired deferred revenue related to Advent.
Cost of Revenues
Cost of recurring revenues consists primarily of costs related to personnel utilized in servicing our software-enabled services and maintenance contracts and amortization of intangible assets. Cost of non-recurring revenues consists primarily of the cost related to personnel utilized to provide implementation, conversion and training services to our software licensees, as well as system integration and custom programming consulting services and amortization of intangible assets.
37
The following tables set forth each of the following cost of revenues as a percentage of their respective revenue source for the periods indicated:
|
|
|
Year Ended December 31, |
|
|||||||||
|
|
|
2017 |
|
|
2016 |
|
|
2015 |
|
|||
|
Cost of revenues: |
|
|
|
|
|
|
|
|
|
|
|
|
|
Cost of software-enabled services |
|
|
56 |
% |
|
|
57 |
% |
|
|
56 |
% |
|
Cost of maintenance and term licenses |
|
|
41 |
|
|
|
44 |
|
|
|
46 |
|
|
Total cost of recurring revenues |
|
|
52 |
|
|
|
53 |
|
|
|
53 |
|
|
Cost of perpetual licenses |
|
|
13 |
|
|
|
10 |
|
|
|
10 |
|
|
Cost of professional services |
|
|
87 |
|
|
|
81 |
|
|
|
80 |
|
|
Total cost of non-recurring revenues |
|
|
72 |
|
|
|
65 |
|
|
|
54 |
|
|
Total cost of revenues |
|
|
53 |
|
|
|
54 |
|
|
|
53 |
|
|
Gross margin percentage |
|
|
47 |
|
|
|
46 |
|
|
|
47 |
|
The following table sets forth cost of revenues (dollars in thousands) and percent change in cost of revenues for the periods indicated:
|
|
|
Year Ended December 31, |
|
|
Percent Change from Prior Period |
|
||||||||||||||
|
|
|
2017 |
|
|
2016 |
|
|
2015 |
|
|
2017 |
|
|
2016 |
|
|||||
|
Cost of revenues: |
|
|
|
|
|
|
|
|
|
|
|
|
|
|
|
|
|
|
|
|
|
Cost of software-enabled services |
|
$ |
628,133 |
|
|
$ |
544,356 |
|
|
$ |
373,394 |
|
|
|
15 |
% |
|
|
46 |
% |
|
Cost of maintenance and term licenses |
|
|
188,164 |
|
|
|
184,162 |
|
|
|
113,865 |
|
|
|
2 |
|
|
|
62 |
|
|
Total cost of recurring revenues |
|
|
816,297 |
|
|
|
728,518 |
|
|
|
487,259 |
|
|
|
12 |
|
|
|
50 |
|
|
Cost of perpetual licenses |
|
|
2,595 |
|
|
|
2,399 |
|
|
|
3,116 |
|
|
|
8 |
|
|
|
(23 |
) |
|
Cost of professional services |
|
|
67,533 |
|
|
|
69,572 |
|
|
|
41,975 |
|
|
|
(3 |
) |
|
|
66 |
|
|
Total cost of non-recurring revenues |
|
|
70,128 |
|
|
|
71,971 |
|
|
|
45,091 |
|
|
|
(3 |
) |
|
|
60 |
|
|
Total cost of revenues |
|
$ |
886,425 |
|
|
$ |
800,489 |
|
|
$ |
532,350 |
|
|
|
11 |
|
|
|
50 |
|
Fiscal 2017 versus Fiscal 2016. Our total cost of revenues increased $85.9 million, primarily due to our acquisitions, which included CommonWealth, GFS, Conifer and Citigroup AIS, which added costs of $87.4 million for the twelve months ended December 31, 2017. This increase was partially offset by a decrease of $1.2 million in costs of organic revenues, primarily related to cost synergies from acquisitions as well as by the favorable impact from foreign currency translation of $0.3 million, which resulted primarily from the strength of the U.S. dollar relative to the British pound. Cost of recurring revenues increased $87.8 million, primarily due to the acquisitions, which added costs of $87.0 million. Cost of non-recurring revenues decreased $1.8 million, primarily due to lower personnel and personnel-related costs.
Fiscal 2016 versus Fiscal 2015. Our total cost of revenues increased primarily due to our acquisitions of GFS, Conifer, Citigroup AIS, Primatics, Varden and Advent, which added costs of $251.8 million. Additionally, total cost of revenues increased $24.3 million to support revenue growth, partially offset by the favorable impact from foreign currency translation of $8.0 million, which resulted from the strength of the U.S. dollar relative to currencies such as the British pound, the Canadian dollar and the Indian Rupee.
Operating Expenses
Selling and marketing expenses consist primarily of the personnel costs associated with the selling and marketing of our products, including salaries, commissions and travel and entertainment. Such expenses also include amortization of intangible assets, the cost of branch sales offices, trade shows and marketing and promotional materials. Research and development expenses consist primarily of personnel costs attributable to the enhancement of existing products and the development of new software products. General and administrative expenses consist primarily of personnel costs related to management, accounting and finance, information management, human resources and administration and associated overhead costs, as well as fees for professional services.
38
The following table sets forth the percentage of our total revenues represented by each of the following operating expenses for the periods indicated:
|
|
|
Year Ended December 31, |
|
|||||||||
|
|
|
2017 |
|
|
2016 |
|
|
2015 |
|
|||
|
Operating expenses: |
|
|
|
|
|
|
|
|
|
|
|
|
|
Selling and marketing |
|
|
7 |
% |
|
|
8 |
% |
|
|
9 |
% |
|
Research and development |
|
|
9 |
|
|
|
10 |
|
|
|
11 |
|
|
General and administrative |
|
|
7 |
|
|
|
8 |
|
|
|
10 |
|
|
Total operating expenses |
|
|
23 |
% |
|
|
26 |
% |
|
|
30 |
% |
The following table sets forth operating expenses (dollars in thousands) and percent change in operating expenses for the periods indicated:
|
|
|
Year Ended December 31, |
|
|
Percent Change from Prior Period |
|
||||||||||||||
|
|
|
2017 |
|
|
2016 |
|
|
2015 |
|
|
2017 |
|
|
2016 |
|
|||||
|
Operating expenses: |
|
|
|
|
|
|
|
|
|
|
|
|
|
|
|
|
|
|
|
|
|
Selling and marketing |
|
$ |
118,449 |
|
|
$ |
117,098 |
|
|
$ |
94,950 |
|
|
|
1 |
% |
|
|
23 |
% |
|
Research and development |
|
|
153,334 |
|
|
|
152,689 |
|
|
|
110,415 |
|
|
|
0 |
|
|
|
38 |
|
|
General and administrative |
|
|
120,174 |
|
|
|
122,465 |
|
|
|
97,832 |
|
|
|
(2 |
) |
|
|
25 |
|
|
Total operating expenses |
|
$ |
391,957 |
|
|
$ |
392,252 |
|
|
$ |
303,197 |
|
|
|
(0 |
) |
|
|
29 |
|
Fiscal 2017 versus 2016. The decrease in total operating expenses in 2017 of $0.3 million was primarily due to a decrease in organic total operating expenses of $15.7 million as well as the favorable impact from foreign currency translation of $0.8 million, which resulted from the strength of the U.S. dollar relative to the British pound. These decreases were partially offset by increased operating expenses related to our acquisitions of CommonWealth, GFS, Conifer and Citigroup AIS, which added expenses of $16.2 million. The decrease in organic operating expenses was primarily due to lower stock-based compensation, independent contractor costs and market data costs, partially offset by higher professional fees and legal settlement fees.
Fiscal 2016 versus 2015. The increase in total operating expenses in 2016 was primarily due to our acquisitions of Conifer, GFS, Citigroup AIS, Varden and Advent, which added expenses of $109.7 million. Included in those costs are charges of $8.6 million related to the elimination of redundant positions within the acquired businesses. These increases were offset by a decrease in professional fees of $15.5 million primarily due to the acquisition of Advent in the prior year. These increases were also partially offset by the favorable impact from foreign currency translation of $4.7 million, which resulted from the strength of the U.S. dollar relative to currencies such as the British pound, the Canadian dollar and the Indian Rupee.
Comparison of Fiscal 2017, 2016 and 2015 for Interest, Taxes and Other
Interest income. We had interest income of $1.2 million in 2017 compared to $1.5 million in 2016 and $2.0 million in 2015. The decreases in interest income in 2017 and 2016 resulted from lower average cash balances relative to the prior year.
Interest expense. We had interest expense of $108.6 million in 2017 compared to $129.9 million in 2016 and $79.3 million in 2015. The decrease in interest expense in 2017 was primarily due to a lower average debt balance and a lower average interest rate, as a result of the amendment of our senior secured credit facility in March 2017. The increase in interest expense in 2016 reflects the full year effect of the borrowings under the senior secured credit facility and senior notes in connection with our acquisition of Advent during the third quarter of 2015.
Other (expense) income, net. Other (expense) income, net for 2017 consisted primarily of foreign currency transaction losses and for 2016 and 2015 consisted primarily of foreign currency transaction gains.
Loss on extinguishment of debt. We recorded a $2.3 million loss on extinguishment of debt in 2017 in connection with the amendment of our senior secured credit facility. The loss on early extinguishment of debt includes the write-off of a portion of the unamortized capitalized financing fees related to the senior secured credit facility for amounts accounted for as a debt extinguishment, as well as the new financing fees related to the senior secured credit facility for amounts accounted for as a debt modification. We recorded a $30.4 million loss on extinguishment of debt in 2015 in connection with the repayment and termination of our Prior Facility. The loss on early extinguishment of debt includes the write-off of a portion of the unamortized capitalized financing costs
39
and the unamortized original issue discounts related to the Prior Facility for amounts accounted for as a debt extinguishment, as well as a portion of the financing costs related to the Credit Agreement for amounts accounted for as a debt modification.
(Benefit) provision for income taxes. The following table sets forth the (benefit) provision for income taxes (dollars in thousands) and effective tax rates for the periods indicated:
|
|
|
Year Ended December 31, |
|
|
Percent Change from Prior Period |
|
||||||||||||||
|
|
|
2017 |
|
|
2016 |
|
|
2015 |
|
|
2017 |
|
|
2016 |
|
|||||
|
(Benefit) provision for income taxes |
|
$ |
(46,234 |
) |
|
$ |
32,620 |
|
|
$ |
17,980 |
|
|
|
(242 |
)% |
|
|
81 |
% |
|
Effective tax rate |
|
|
(16 |
)% |
|
|
20 |
% |
|
|
30 |
% |
|
|
|
|
|
|
|
|
Our 2017, 2016 and 2015 effective tax rates differ from the statutory rate primarily due to the effect of our foreign operations, and in the case of 2017, due to the effect of enacted U.S. federal tax legislation commonly referred to as the Tax Cuts and Jobs Act (“Tax Act”). The decrease in the effective tax rate from 2016 to 2017 was primarily due to the overall favorable net impact of the Tax Act and the favorable impact of excess tax benefits from stock option compensation. The Tax Act enacted several changes to the U.S. federal corporate income tax system, including the lowering of the U.S. federal corporate tax rate from 35% to 21%, the imposition of one-time mandatory transition tax on accumulated foreign earnings and the creation of a new minimum tax on global intangible low-taxed income (“GILTI”), among other things. We recorded a provisional tax benefit for the impact of the Tax Act of $88.0 million. We have made reasonable estimates to determine the impact of the Tax Act and will continue to analyze the provisions of the newly enacted law in order to complete its accounting during 2018. See Notes 2 and 5 to the Consolidated Financial Statements for additional information. The favorable impact of excess tax benefits from stock option compensation in 2017 is due to the prospective adoption of ASU 2016-09, Compensation – Stock Compensation (Topic 718): Improvements to Employee Share-Based Payment Accounting. The decrease in the effective tax rate from 2015 to 2016 was primarily due to the absence of the unfavorable impact of nondeductible transaction costs and taxes incurred on a one time repatriation of foreign earnings in 2015. We had $347.8 million and $513.5 million of deferred tax liabilities and $66.6 and $62.4 million of deferred tax assets at December 31, 2017 and 2016, respectively.
Our effective tax rate includes the effect of operations outside the U.S., which historically have been taxed at rates lower than the U.S. statutory rate. While we have income from multiple foreign sources, the majority of our non-U.S. operations are in Canada, India and the U.K., where the statutory rates were 26.5%, 34.6% and 19.3%, respectively, in 2017, 26.5%, 34.6% and 20.0%, respectively, in 2016, and 26.5%, 34.6% and 20.3%, respectively, in 2015. A future proportionate change in the composition of income before income taxes from foreign and domestic tax jurisdictions could impact our periodic effective tax rate.
Liquidity and Capital Resources
Our principal cash requirements are to finance the costs of our operations pending the billing and collection of client receivables, to fund payments with respect to our indebtedness, to invest in research and development and to acquire complementary businesses or assets. We expect our cash on hand, cash flows from operations, and cash available under the Amended Senior Secured Credit Agreement to provide sufficient liquidity to fund our current obligations, projected working capital requirements and capital spending for at least the next twelve months.
In October 2017, we purchased CommonWealth for approximately $16.4 million, plus the costs of effecting the transaction and the assumption of certain liabilities. We funded this purchase with cash on hand.
In addition, to fund our pending acquisition of DST, and to refinance certain of our existing indebtedness and all of DST’s existing indebtedness, we expect to incur substantial indebtedness under a new senior secured credit facility and may issue new senior unsecured notes, and we expect that our interest expense will increase substantially as a result.
In 2017, we paid quarterly cash dividends of $0.0625 per share of common stock on March 15, 2017 and June 15, 2017 and $0.07 per share of common stock on September 15, 2017 and December 15, 2017 to stockholders of record as of the close of business on March 1, 2017, June 1, 2017, September 1, 2017 and December 1, 2017, respectively, totaling $54.4 million.
Our cash and cash equivalents at December 31, 2017 were $64.1 million, a decrease of $53.5 million from $117.6 million at December 31, 2016. The decrease in cash was primarily due to repayments of debt, payment of dividends, capital expenditures and cash paid for acquisitions. These decreases were partially offset by cash provided by operations, proceeds from stock option exercises
40
and proceeds received from our borrowings. See Notes 4, 6 and 11 to our Consolidated Financial Statements for further discussion of equity, debt and acquisitions, respectively.
Net cash provided by operating activities was $470.4 million in 2017. Cash provided by operating activities primarily resulted from net income of $328.9 million adjusted for non-cash items of $141.5 million and changes in our working capital accounts (excluding the effect of acquisitions). The changes in our working capital accounts were driven by increases in accounts receivable and prepaid expenses and other assets as well as decreases in accrued expenses and deferred revenue. These changes were partially offset by an increase in accounts payable and a change in income taxes prepaid and payable. The decrease in deferred revenue was primarily due to an increase in the number of new license contracts and contract renewals that qualified for up-front revenue recognition as well as the decline in deferred revenue associated with the completion of professional services installations of our software. The decrease in accrued expenses was primarily due to lower accrued interest on our outstanding debt as well as lower compensation accruals. The increase in accounts payable was primarily due to the timing of payments.
Investing activities used net cash of $63.4 million in 2017, primarily related to $35.6 million in capital expenditures, cash paid for acquisitions of $17.4 million and $10.4 million in capitalized software.
Financing activities used net cash of $466.4 million in 2017, representing repayments of debt totaling $512.5 million, $54.4 million in quarterly dividends and $4.8 million in withholding taxes paid related to equity award net share settlements. These payments were partially offset by $60.2 million cash received from stock option exercises and $45.0 million received from debt borrowings.
Our cash and cash equivalents at December 31, 2016 were $117.6 million, a decrease of $316.6 million from $434.2 million at December 31, 2015. The decrease in cash was primarily due to cash used for acquisitions, repayments of debt, payment of dividends and capital expenditures. These decreases were partially offset by proceeds received from our borrowings as well as cash provided by operations, proceeds from stock option exercises and the related income tax benefits.
Net cash provided by operating activities was $418.4 million in 2016. Cash provided by operating activities primarily resulted from net income of $131.0 million adjusted for non-cash items of $199.5 million and changes in our working capital accounts (excluding the effect of acquisitions) totaling $87.9 million. The changes in our working capital accounts were driven by a change in income taxes prepaid and payable and increases in deferred revenues and accrued expenses. These changes were partially offset by an increase in accounts receivable. The increase in deferred revenues was primarily due to the increase in deferred term license revenue related to Advent. The increase in accrued expenses was primarily due to the increase in accrued employee compensation associated with the annual employee bonuses typically paid in the first quarter. The increase in accounts receivable was primarily due to a decrease in days’ sales outstanding related to receivables within recently acquired businesses.
Investing activities used net cash of $495.3 million in 2016, primarily related to cash paid for acquisitions of $457.5 million, $27.9 million in capital expenditures and $9.6 million in capitalized software.
Financing activities used net cash of $236.1 million in 2016, representing repayments of debt totaling $383.4 million, $50.1 million in quarterly dividends, $7.4 million in withholding taxes related to equity award net share settlements and the payment of $0.5 million in fees related to refinancing activities. These payments were partially offset by $120.0 million received from debt borrowings, $39.2 million from stock option exercises and related income tax windfall benefits of $46.2 million.
We have made a permanent reinvestment determination in certain non-U.S. operations that have historically generated positive operating cash flows. At December 31, 2017, we held approximately $39.4 million in cash and cash equivalents at non-U.S. subsidiaries where we had made such a determination and in turn no provision for income taxes had been made. At December 31, 2017, we held approximately $33.7 million in cash that was available to our foreign borrowers under our senior secured credit facility and will be used to facilitate debt servicing of those entities.
Off-Balance Sheet Arrangements
We have no off-balance sheet arrangements that have or are reasonably likely to have a current or future effect on our financial condition, changes in financial condition, revenues or expenses, results of operations, liquidity, capital expenditures or capital resources that is material to investors.
41
The following table summarizes our contractual obligations as of December 31, 2017 that require us to make future cash payments (in thousands):
|
|
|
Payments Due by Period |
|
|||||||||||||||||
|
Contractual Obligations and Other Commitments |
|
Total |
|
|
Less than 1 Year |
|
|
1-3 Years |
|
|
3-5 Years |
|
|
More than 5 Years |
|
|||||
|
Short-term and long-term debt |
|
$ |
2,092,175 |
|
|
$ |
37,863 |
|
|
$ |
219,476 |
|
|
$ |
1,234,836 |
|
|
$ |
600,000 |
|
|
Interest payments (1) |
|
|
458,984 |
|
|
|
91,724 |
|
|
|
177,684 |
|
|
|
154,326 |
|
|
|
35,250 |
|
|
Operating lease obligations (2) |
|
|
380,407 |
|
|
|
51,705 |
|
|
|
81,327 |
|
|
|
72,021 |
|
|
|
175,354 |
|
|
Tax payable (3) |
|
|
33,628 |
|
|
|
2,690 |
|
|
|
5,380 |
|
|
|
5,380 |
|
|
|
20,178 |
|
|
Purchase obligations (4) |
|
|
30,362 |
|
|
|
24,045 |
|
|
|
6,317 |
|
|
|
— |
|
|
|
— |
|
|
Total contractual obligations |
|
$ |
2,995,556 |
|
|
$ |
208,027 |
|
|
$ |
490,184 |
|
|
$ |
1,466,563 |
|
|
$ |
830,782 |
|
|
(1) |
Reflects interest payments on our Credit Agreement at an assumed interest rate of one-month LIBOR of 1.57% plus 1.75% for U.S. dollar loans on our Term A-1 and A-2 facilities, one-month LIBOR of 1.57% plus 2.25% on our Term B-1 and B-2 facilities and 5.875% on our Senior Notes. |
|
(2) |
We are obligated under noncancelable operating leases for office space and office equipment. The lease for the corporate facility in Windsor, Connecticut expires in 2022. We sublease office space under noncancelable leases. For the years ended December 31, 2017, 2016 and 2015, we received rental income under these leases of $5.4 million, $1.3 million and $0.2 million, respectively. The effect of the rental income to be received in the future has not been included in the table above. |
|
(3) |
Represents our estimated obligation under the Tax Act to pay the deemed repatriation tax on certain non-US earnings over eight years, which has been calculated on a provisional basis. Refer to Note 5 to the “Consolidated Financial Statements” for additional information. |
|
(4) |
Purchase obligations include the minimum amounts committed under contracts for goods and services. |
As of December 31, 2017, our liability for uncertain tax positions and related interest and penalties payable was $52.5 million and $3.6 million, respectively. We are unable to reasonably estimate the timing of such liability and interest payments in individual years beyond 12 months due to uncertainties in the timing of the effective settlement of tax positions. As a result, these amounts are not included in the above contractual obligations table.
Senior Secured Credit Facilities
On July 8, 2015, in connection with our acquisition of Advent, we entered into a Credit Agreement with SS&C, SS&C European Holdings S.A.R.L., an indirect wholly-owned subsidiary of SS&C, or SS&C Sarl, and SS&C Technologies Holdings Europe S.A.R.L., an indirect wholly-owned subsidiary of SS&C, or SS&C Tech Sarl as the borrowers. The Credit Agreement has four tranches of term loans, or together the Term Loans: (i) a $98 million term A-1 facility with a five year term for borrowings by SS&C Sarl, or Term A-1 Loan; (ii) a $152 million term A-2 facility with a five year term for borrowings by SS&C Tech Sarl, or Term A-2 Loan; (iii) a $1.82 billion term B-1 facility with a seven year term for borrowings by SS&C, or Term B-1 Loan; and (iv) a $410 million term B-2 facility with a seven year term for borrowings by SS&C Sarl, or Term B-2 Loan.
In addition, the Credit Agreement has a revolving credit facility with a five year term available for borrowings by SS&C with $150 million in available commitments, or the Revolving Credit Facility, of which $149.1 million was available as of December 31, 2017. The Revolving Credit Facility had $94.0 million drawn as of December 31, 2017. The Revolving Credit Facility also contains a $25 million letter of credit sub-facility, of which $0.9 million and $0.6 million was drawn as of December 31, 2017 and 2016, respectively.
On March 2, 2017, we entered into an amendment (the “Amendment”) to our Credit Agreement (“Amended Senior Secured Credit Agreement”). Pursuant to the Amendment, the highest (non-default) interest rate margin applicable to Term Loan A was reduced from LIBOR plus 2.75% to LIBOR plus 1.75%, and the highest (non-default) interest rate margin applicable to Term Loan B was reduced from LIBOR plus 3.25% to LIBOR plus 2.25%. The LIBOR “floor” was also amended for the Term Loan A and the Term Loan B to be 0%. No changes were made to the financial covenants, outstanding principal amounts or the scheduled amortization.
The Amendment was evaluated in accordance with FASB Accounting Standards Codification 470-50, Debt-Modifications and
Extinguishments, for modification and extinguishment accounting. We accounted for the debt re-pricing as a debt modification with respect to amounts that remained obligations of the same lender in the syndicate with minor changes in cash flows and as a debt
42
extinguishment with respect to amounts that were obligations of lenders that exited the syndicate or remained in the syndicate but experienced a change in cash flows of greater than 10%.
As of December 31, 2017, there was $85.8 million in principal amount outstanding under the Term A-1 Loan, $133.0 million in principal amount outstanding under the Term A-2 Loan, $1,250.0 million in principal amount outstanding under the Term B-1 Loan and $23.5 million in principal amount outstanding under the Term B-2 Loan.
We are required to make scheduled quarterly payments of approximately 0.25% of the remaining principal amount of the Term B-1 Loan and Term B-2 Loan, with the balance due and payable on the seventh anniversary of its incurrence. We are required to make scheduled quarterly payments of 1.25% of the original principal amount of the Term A-1 Loan and Term A-2 Loan until September 30, 2017 and quarterly payments of 2.50% of the original principal amount of the Term A-1 Loan and Term A-2 Loan from December 31, 2017 until June 30, 2020 with the balance due and payable on the fifth anniversary of the incurrence thereof. No amortization is required under the Revolving Credit Facility.
Our obligations under the Term Loans are guaranteed by (i) Holdings and each of our existing and future U.S. wholly-owned restricted subsidiaries, in the case of the Term B-1 Loan and the Revolving Credit Facility and (ii) Holdings, SS&C and each of our existing and future wholly-owned restricted subsidiaries, in the case of the Term A-1 Loan, the Term A-2 Loan and the Term B-2 Loan.
The obligations of the U.S. loan parties under the Amended Senior Secured Credit Agreement are secured by substantially all of the assets of such persons (subject to customary exceptions and limitations), including a pledge of all of the capital stock of substantially all of the U.S. wholly-owned restricted subsidiaries of such persons (with customary exceptions and limitations) and 65% of the capital stock of certain foreign restricted subsidiaries of such persons (with customary exceptions and limitations). All obligations of the non-U.S. loan parties under the Amended Senior Secured Credit Agreement are secured by substantially all of Holdings’ and the other guarantors’ assets (subject to customary exceptions and limitations), including a pledge of all of the capital stock of substantially all of Holdings’ wholly-owned restricted subsidiaries (with customary exceptions and limitations).
The Amended Senior Secured Credit Agreement includes negative covenants that, among other things and subject to certain thresholds and exceptions, limit our ability and the ability of our restricted subsidiaries to incur debt or liens, make investments (including in the form of loans and acquisitions), merge, liquidate or dissolve, sell property and assets, including capital stock of our subsidiaries, pay dividends on our capital stock or redeem, repurchase or retire our capital stock, alter the business we conduct, amend, prepay, redeem or purchase subordinated debt, or engage in transactions with our affiliates. In addition, the Amended Senior Secured Credit Agreement contains a financial covenant requiring us to maintain a consolidated net senior secured leverage ratio. Under the Amended Senior Secured Credit Agreement, certain defaults under agreements governing other material indebtedness could result in an event of default under the Amended Senior Secured Credit Agreement, in which case the lenders could elect to accelerate payments under the Amended Senior Secured Credit Agreement and terminate any commitments they have to provide future borrowings. As of December 31, 2017, we were in compliance with the financial and non-financial covenants.
Senior Notes
On July 8, 2015, in connection with the acquisition of Advent, we issued $600.0 million aggregate principal amount of 5.875% Senior Notes due 2023. The Senior Notes are guaranteed by SS&C and each of our wholly-owned domestic subsidiaries that borrows or guarantees obligations under the Amended Senior Secured Credit Agreement. The guarantees are full and unconditional and joint and several. The Senior Notes are unsecured senior obligations that are equal in right of payments to all existing and future senior debt, including the Amended Senior Secured Credit Agreement.
On April 20, 2016, we commenced an offer to exchange for the Senior Notes, new notes identical in all material respects to the Senior Notes, except that the new notes were registered under the Securities Act of 1933. The exchange offer expired on May 18, 2016 and 100% of the Senior Notes were exchanged for the new notes.
At any time after July 15, 2018, we may redeem some or all of the Senior Notes, in whole or in part, at the redemption prices set forth in the indenture governing the Senior Notes plus accrued and unpaid interest to the redemption date. At any time on or before July 15, 2018, we may redeem all or any portion of the notes at 100% of their principal amount, plus a “make whole” premium calculated pursuant to the indenture governing the Senior Notes, plus accrued and unpaid interest to, but excluding, the redemption date. In addition, prior to July 15, 2018, we may redeem up to 35% of the aggregate principal amount of the Senior Notes at a redemption price equal to 105.875% of the principal amount thereof, plus accrued and unpaid interest to the redemption date, with the net proceeds of one or more equity offerings.
43
The indenture governing the Senior Notes contains a number of covenants that restrict, subject to certain thresholds and exceptions, our ability and the ability of our restricted subsidiaries to incur debt or liens, make certain investments, pay dividends, dispose of certain assets, engage in mergers or acquisitions or engage in transactions with our affiliates. Any event of default under the Amended Senior Secured Credit Agreement that leads to an acceleration of those amounts due would also result in a default under the indenture governing the Senior Notes.
As of December 31, 2017, there were $600.0 million in principal amount of Senior Notes outstanding.
Covenant Compliance
Under the Amended Senior Secured Credit Agreement, we are required to satisfy and maintain a specified financial ratio. Our continued ability to meet this financial ratio can be affected by events beyond our control, and we cannot assure you that we will continue to meet this ratio. Any breach of these covenants could result in an event of default under the Amended Senior Secured Credit Agreement. Upon the occurrence of any event of default under the Amended Senior Secured Credit Agreement, the lenders could elect to declare all amounts outstanding under the Amended Senior Secured Credit Agreement to be immediately due and payable and terminate all commitments to extend further credit. Any event of default under the Amended Senior Secured Credit Agreement that leads to an acceleration of those amounts due also results in a default under the indenture governing the Senior Notes.
Consolidated EBITDA is a non-GAAP financial measure used in key financial covenants contained in the Amended Senior Secured Credit Agreement, which is a material facility supporting our capital structure and providing liquidity to our business. Consolidated EBITDA is defined as earnings before interest, taxes, depreciation and amortization (“EBITDA”), further adjusted to exclude unusual items and other adjustments permitted in calculating covenant compliance under the Amended Senior Secured Credit Agreement. We believe that the inclusion of supplementary adjustments to EBITDA applied in presenting Consolidated EBITDA is appropriate to provide additional information to investors to demonstrate compliance with the specified financial ratio and other financial condition tests contained in the Amended Senior Secured Credit Agreement.
Management uses Consolidated EBITDA to gauge the costs of our capital structure on a day-to-day basis when full financial statements are unavailable. Management further believes that providing this information allows our investors greater transparency and a better understanding of our ability to meet our debt service obligations and make capital expenditures.
Any breach of covenants in the Amended Senior Secured Credit Agreement that are tied to ratios based on Consolidated EBITDA could result in an event of default under that agreement, in which case the lenders could elect to declare all amounts borrowed immediately due and payable and to terminate any commitments they have to provide further borrowings. Any default and subsequent acceleration of payments under the Amended Senior Secured Credit Agreement would have a material adverse effect on our results of operations, financial position and cash flows. Additionally, under the Amended Senior Secured Credit Agreement, our ability to engage in activities such as incurring additional indebtedness, making investments and paying dividends is also tied to ratios based on Consolidated EBITDA.
Consolidated EBITDA does not represent net income or cash flow from operations as those terms are defined by generally accepted accounting principles, or GAAP, and does not necessarily indicate whether cash flows will be sufficient to fund cash needs. Further, the Amended Senior Secured Credit Agreement requires that Consolidated EBITDA be calculated for the most recent four fiscal quarters. As a result, the measure can be disproportionately affected by a particularly strong or weak quarter. Further, it may not be comparable to the measure for any subsequent four-quarter period or any complete fiscal year.
44
Consolidated EBITDA is not a recognized measurement under GAAP and investors should not consider Consolidated EBITDA as a substitute for measures of our financial performance and liquidity as determined in accordance with GAAP, such as net income, operating income or net cash provided by operating activities. Because other companies may calculate Consolidated EBITDA differently than we do, Consolidated EBITDA may not be comparable to similarly titled measures reported by other companies. Consolidated EBITDA has other limitations as an analytical tool, when compared to the use of net income, which is the most directly comparable GAAP financial measure, including:
|
|
● |
Consolidated EBITDA does not reflect the provision of income tax expense in our various jurisdictions; |
|
|
● |
Consolidated EBITDA does not reflect the significant interest expense we incur as a result of our debt leverage; |
|
|
● |
Consolidated EBITDA does not reflect any attribution of costs to our operations related to our investments and capital expenditures through depreciation and amortization charges; |
|
|
● |
Consolidated EBITDA does not reflect the cost of compensation we provide to our employees in the form of stock option awards; and |
|
|
● |
Consolidated EBITDA excludes expenses that we believe are unusual or non-recurring, but which others may believe are normal expenses for the operation of a business. |
The following is a reconciliation of net income to Consolidated EBITDA as defined in our Amended Senior Secured Credit Agreement.
|
|
|
Year Ended December 31, |
|
|||||||||
|
(in thousands) |
|
2017 |
|
|
2016 |
|
|
2015 |
|
|||
|
Net income |
|
$ |
328,864 |
|
|
$ |
130,996 |
|
|
$ |
42,862 |
|
|
Interest expense, net |
|
|
107,473 |
|
|
|
128,454 |
|
|
|
77,357 |
|
|
(Benefit) provision for income taxes |
|
|
(46,234 |
) |
|
|
32,620 |
|
|
|
17,980 |
|
|
Depreciation and amortization |
|
|
237,189 |
|
|
|
228,683 |
|
|
|
150,834 |
|
|
EBITDA |
|
|
627,292 |
|
|
|
520,753 |
|
|
|
289,033 |
|
|
Stock-based compensation |
|
|
41,487 |
|
|
|
50,564 |
|
|
|
44,079 |
|
|
Capital-based taxes |
|
|
314 |
|
|
|
1,482 |
|
|
|
828 |
|
|
Acquired EBITDA and cost savings (1) |
|
|
4,541 |
|
|
|
9,094 |
|
|
|
109,492 |
|
|
Non-cash portion of straight-line rent expense |
|
|
4,385 |
|
|
|
2,198 |
|
|
|
1,529 |
|
|
Loss on extinguishment of debt |
|
|
2,326 |
|
|
|
— |
|
|
|
30,417 |
|
|
Purchase accounting adjustments (2) |
|
|
4,316 |
|
|
|
31,619 |
|
|
|
49,927 |
|
|
Other (3) |
|
|
15,394 |
|
|
|
5,891 |
|
|
|
26,148 |
|
|
Consolidated EBITDA, as defined |
|
$ |
700,055 |
|
|
$ |
621,601 |
|
|
$ |
551,453 |
|
|
(1) |
Acquired EBITDA reflects the EBITDA impact of significant businesses that were acquired during the period as if the acquisition occurred at the beginning of the period, as well as cost savings enacted in connection with acquisitions. |
|
(2) |
Purchase accounting adjustments include (a) an adjustment to increase revenues by the amount that would have been recognized if deferred revenue were not adjusted to fair value at the date of acquisitions, (b) an adjustment to increase personnel and commissions expense by the amount that would have been recognized if prepaid commissions and deferred personnel costs were not adjusted to fair value at the date of the acquisitions and (c) an adjustment to increase rent expense by the amount that would have been recognized if lease obligations were not adjusted to fair value at the date of acquisitions. |
|
(3) |
Other includes expenses and income that are permitted to be excluded per the terms of our Amended Senior Secured Credit Agreement from Consolidated EBITDA, a financial measure used in calculating our covenant compliance. These include expenses and income related to currency transactions, facilities and workforce restructuring, legal settlements and business combinations, amount other infrequently occurring transactions. |
Our covenant requirement for net senior secured leverage ratio and the actual ratio for the year ended December 31, 2017 are as follows:
|
|
|
Covenant Requirement |
|
Actual Ratio |
|
Maximum consolidated net senior secured leverage to Consolidated EBITDA ratio(1) |
|
5.00x |
|
2.04x |
45
|
ended on the measurement date. Consolidated net secured funded indebtedness is comprised of indebtedness for borrowed money, letters of credit, deferred purchase price obligations and capital lease obligations, all of which is secured by liens on our property. |
Critical Accounting Estimates
A number of our accounting policies require the application of significant judgment by our management, and such judgments are reflected in the amounts reported in our Consolidated Financial Statements. In applying these policies, our management uses its judgment to determine the appropriate assumptions to be used in the determination of estimates. Those estimates are based on our historical experience, terms of existing contracts, management’s observation of trends in the industry, information provided by our clients and information available from other outside sources, as appropriate. On an ongoing basis, we evaluate our estimates and judgments, including those related to revenue recognition, goodwill and other intangible assets and other contingent liabilities. Actual results may differ significantly from the estimates contained in our Consolidated Financial Statements. We believe that the following are our critical accounting policies.
Revenue Recognition
Our revenues consist primarily of software-enabled services and maintenance and term license revenues, and, to a lesser degree, perpetual license and professional services revenues.
Software-enabled services revenues, which are based on a monthly fee or are transaction-based, are recognized as the services are performed. Software-enabled services are generally provided under contracts with initial terms of one to five years that require monthly or quarterly payments, and are subject to automatic annual renewal at the end of the initial term unless terminated by either party.
We recognize software-enabled services revenues on a monthly basis as the software-enabled services are provided and when persuasive evidence of an arrangement exists, the price is fixed or determinable and collectability is reasonably assured. We do not recognize any revenues before services are performed. Certain contracts contain additional fees for increases in market value, pricing and trading activity. Revenues related to these additional fees are recognized in the month in which the activity occurs based upon our summarization of account information and trading volume.
We recognize revenues from the sale of perpetual licenses and term licenses which are not bundled with maintenance services when persuasive evidence of an arrangement exists, the product has been delivered, the fee is fixed or determinable and collection of the resulting receivable is reasonably assured. Our products generally do not require significant modification or customization of the underlying software and, accordingly, the implementation services we provide are not considered essential to the functionality of the software.
We use a signed license agreement as evidence of an arrangement for the majority of our transactions. Delivery generally occurs when the product is delivered to a common carrier F.O.B. shipping point, or if delivered electronically, when the client has been provided with access codes that allow for immediate possession via a download. Although our arrangements generally do not have acceptance provisions, if such provisions are included in the arrangement, then delivery occurs at acceptance, unless such acceptance is deemed perfunctory. At the time of the transaction, we assess whether the fee is fixed or determinable based on the payment terms. Collection is assessed based on several factors, including past transaction history with the client and the creditworthiness of the client. The arrangements for perpetual software licenses are generally sold with maintenance and professional services. We allocate revenue to the delivered components, normally the license component, using the residual value method based on vendor-specific objective evidence, or VSOE, of the fair value of the undelivered elements. The total contract value is attributed first to the maintenance and customer support arrangement based on the fair value, which is derived from substantive renewal rates. Fair value of the professional services is based upon stand-alone sales of those services. Professional services are generally billed at an hourly rate plus out-of-pocket expenses. Professional services revenues are recognized as the services are performed. Maintenance agreements generally require us to provide technical support and software updates to our clients (on a when-and-if-available basis). We generally provide maintenance services under one-year renewable contracts. Maintenance revenues are recognized ratably over the term of the contract.
We also sell term licenses ranging from one to seven years, which include bundled maintenance services. For those arrangements with bundled maintenance services, VSOE does not exist for the maintenance element and therefore the total fee is recognized ratably over the contractual term of the arrangement.
46
We occasionally enter into perpetual license agreements requiring significant customization or fixed-fee professional service arrangements. We account for these arrangements in accordance with the percentage-of-completion method based on the ratio of hours incurred to expected total hours; accordingly we must estimate the costs to complete the arrangement utilizing an estimate of man-hours remaining. Due to uncertainties inherent in the estimation process, it is at least reasonably possible that completion costs may be revised. Such revisions are recognized in the period in which the revisions are determined. Due to the complexity of some perpetual license agreements, we routinely apply judgments to the application of software revenue recognition accounting principles to specific agreements and transactions. Different judgments or different contract structures could have led to different accounting conclusions, which could have a material effect on our reported results of operations.
Long-lived Assets, Intangible Assets and Goodwill
We must test goodwill annually for impairment (and in interim periods if certain events occur indicating that the carrying value of goodwill or indefinite-lived intangible assets may be impaired). Historically, we have tested the recoverability of goodwill based on our reporting unit structure by comparing fair value to carrying value. To the extent that we do not achieve our revenue or operating cash flow plans or other measures of fair value decline, including external valuation assumptions, our current goodwill carrying value could be impaired. In 2017, as described in Note 2, we elected to early adopt Accounting Standards Update (“ASU”) 2017-04, Goodwill and Other (Topic 350) – Simplifying the Test for Goodwill Impairment, for its annual goodwill impairment test. The new guidance removes the second step of the goodwill impairment test requiring a hypothetical purchase price allocation. The first step of the impairment analysis indicated that the fair value significantly exceeded the carrying value at December 31, 2017.
We assess the impairment of identifiable intangibles, long-lived assets and goodwill whenever events or changes in circumstances indicate that the carrying value may not be recoverable. Factors we consider important which could trigger an impairment review include the following:
|
|
● |
significant underperformance relative to historical or projected future operating results; |
|
|
● |
significant changes in the manner of our use of the acquired assets or the strategy for our overall business; and |
|
|
● |
significant negative industry or economic trends. |
When we determine that the carrying value of intangibles and long-lived assets may not be recoverable based upon the existence of one or more of the above indicators of potential impairment, we assess whether an impairment has occurred based on whether net book value of the assets exceeds related projected undiscounted cash flows from these assets. We consider a number of factors, including past operating results, budgets, economic projections, market trends and product development cycles in estimating future cash flows. Differing estimates and assumptions as to any of the factors described above could result in a materially different impairment charge, if any, and thus materially different results of operations.
Acquisition Accounting
In connection with our acquisitions, we allocate the purchase price to the assets and liabilities we acquire, such as net tangible assets, completed technology, customer relationships, other identifiable intangible assets, deferred revenue and goodwill. We applied significant judgments and estimates in determining the fair market value of the assets acquired and their useful lives. For example, we have determined the fair value of existing client contracts based on the discounted estimated net future cash flows from such client contracts existing at the date of acquisition and the fair value of the completed technology based on the cost savings method or the relief-from-royalties method on estimated future revenues of such completed technology and assumed obsolescence factors. While actual results during the years ended December 31, 2017, 2016 and 2015 were consistent with our estimated cash flows and we did not incur any impairment charges during those years, different estimates and assumptions in valuing acquired assets could yield materially different results.
Stock-based Compensation
Using the fair value recognition provisions of relevant accounting literature, stock-based compensation cost is measured at the grant date based on the value of the award and is recognized as expense over the appropriate service period. Determining the fair value of stock-based awards requires considerable judgment, including estimating the expected term of stock options and the expected volatility of our stock price. In addition, for stock-based awards where vesting is dependent upon achieving certain operating performance goals, we estimate the likelihood of achieving the performance goals. Differences between actual results and these estimates could have a material effect on our financial results. A deferred income tax asset is recorded over the vesting period as stock compensation expense is recorded for non-qualified stock options. The realizability of the deferred tax asset is ultimately based on the actual value of the stock-based award upon exercise. If the actual value is lower than the fair value determined on the date of grant, then there would be an income tax expense for the portion of the deferred tax asset that is not realizable.
47
The carrying value of our deferred tax assets assumes that we will be able to generate sufficient future taxable income in certain tax jurisdictions, based on estimates and assumptions. If these estimates and related assumptions change in the future, we may be required to record additional valuation allowances against our deferred tax assets resulting in additional income tax expense in our Consolidated Statements of Comprehensive Income (Loss). On a quarterly basis, we evaluate whether deferred tax assets are realizable and assess whether there is a need for additional valuation allowances. The carrying value of our deferred tax assets and liabilities is recorded based on the statutory rates that we expect our deferred tax assets and liabilities to reverse into income. We estimate the state rate at which our deferred tax assets and liabilities will reverse based on estimates of state income apportionment for future years. Each of these estimates requires significant judgment on the part of our management. In addition, we evaluate the need to provide additional tax provisions for adjustments proposed by taxing authorities.
As of December 31, 2017, we had $52.5 million in liabilities associated with unrecognized tax benefits. All of the unrecognized tax benefits, if recognized, would decrease our effective tax rate and increase our net income. Additionally, we recognize accrued interest and penalties relating to unrecognized tax benefits as a component of the income tax provision.
Recently Adopted Accounting Pronouncements
In January 2017, the Financial Accounting Standards Board (“FASB”) issued ASU 2017-04, Goodwill and Other (Topic 350) – Simplifying the Test for Goodwill Impairment. ASU 2017-04 simplifies the subsequent measurement of goodwill by eliminating Step 2 of the goodwill impairment test. In computing the implied fair value of goodwill under Step 2, an entity had to perform procedures to determine the fair value at the impairment testing date of its assets and liabilities (including unrecognized assets and liabilities) following the procedure that would be required in determining the fair value of assets acquired and liabilities assumed in a business combination. As a result of ASU 2017-04, an entity should perform its goodwill impairment test by comparing the fair value of a reporting unit with its carrying amount and then recognize an impairment charge, as necessary, for the amount by which the carrying amount exceeds the reporting unit’s fair value, not to exceed the total amount of goodwill allocated to that reporting unit. ASU 2017-04 is effective for fiscal years and interim periods within those years beginning after December 15, 2019, and early adoption is permitted for interim or annual goodwill impairment tests performed after January 1, 2017. We adopted ASU 2017-04 for its goodwill impairment test in 2017. The adoption of ASU 2017-04 had no impact on our consolidated financial statements as of and for the year ended December 31, 2017.
In November 2016, the FASB issued ASU No. 2016-18, Statement of Cash Flows: Restricted Cash. This ASU provides guidance on the classification of restricted cash in the statement of cash flows. This ASU requires that restricted cash be included within cash and cash equivalents when reconciling the beginning-of-period and end-of-period total amounts shown on the statement of cash flows. ASU 2016-18 is effective for the first quarter of fiscal 2018. Early adoption is permitted and the guidance requires application using a retrospective method. We have early adopted ASU 2016-18, which did not have a material impact on our financial position, results of operations or cash flows.
In March 2016, the FASB issued ASU 2016-09, Compensation – Stock Compensation (Topic 718): Improvements to Employee Share-Based Payment Accounting. This ASU is intended to simplify several aspects of the accounting for share-based payment transactions, including the income tax consequences, classification of awards as either equity or liabilities, and classification on the statement of cash flows. ASU 2016-09 is effective for the first quarter of fiscal 2017. Effective January 1, 2017, excess tax benefits will be prospectively reported as an operating activity in our Consolidated Statements of Cash Flows. We have applied this guidance prospectively as of January 1, 2017, excess tax benefits for the years ended December 31, 2016 and 2015 will not be adjusted and continue to be reported in financing activities in the Consolidated Statements of Cash Flows. As a result of the adoption, we recognized discrete tax benefits of $16.4 million in the provision for income taxes line of the Consolidated Statement of Comprehensive Income (Loss) for the year ended December 31, 2017 related to excess tax benefits upon vesting of a restricted-stock award or stock option exercise event relative to the deferred tax asset position established. We have elected to account for forfeitures as they occur and there was no material effect recorded upon adoption of this change. We have also excluded the excess tax benefits from the assumed proceeds available to repurchase shares in the computation of diluted earnings per share for the year ended December 31, 2017, which had the effect of increasing the weighted average common stock equivalents. Prior to the adoption of ASU 2016-09, we included excess tax benefits in assessing whether common equivalent shares were dilutive in our calculations of weighted average dilutive shares under the treasury stock method. Presentation requirements for cash flows related to employee taxes paid for withheld shares had no impact to all periods presented as such cash flows have historically been presented as financing activities.
In August 2014, the FASB issued ASU 2014-15, Disclosure of Uncertainties about an Entity’s Ability to Continue as a Going Concern. This ASU establishes specific guidance to an organization’s management on their responsibility to evaluate whether there is
48
substantial doubt about the organization’s ability to continue as a going concern. The guidance is effective for annual periods ending after December 15, 2016 and for interim periods thereafter. The adoption of this guidance did not have a material effect on our Consolidated Financial Statements during the year ended December 31, 2016.
Recent Accounting Pronouncements Not Yet Effective
In August 2016, the FASB issued ASU 2016-15, Classification of Certain Cash Receipts and Cash Payments. ASU 2016-15 addresses how certain cash receipts and cash payments are presented and classified in the statement of cash flows under Topic 230, Statement of Cash flow, and other Topics. ASU 2016-15 is effective for the first quarter of fiscal 2018 and the guidance requires application using a retrospective method. The impact of our adoption of ASU 2016-15 to our Consolidated Financial Statements will be to reflect the presentation of debt prepayment or debt extinguishment costs as cash outflows for financing activities within our Consolidated Statement of Cash Flows. This ASU is not expected to have a material impact on our financial position, results of operations or cash flows.
In June 2016, the FASB issued ASU 2016-13, Measurement of Credit Losses on Financial Instruments. ASU 2016-13 requires companies to measure credit losses utilizing a methodology that reflects expected credit losses and requires a consideration of a broader range of reasonable and supportable information to inform credit loss estimates. ASU 2016-13 is effective for the first quarter of fiscal 2020 and earlier adoption is permitted beginning in the first quarter of fiscal 2019. Application of the ASU is through a cumulative-effect adjustment to retained earnings as of the effective date. We are currently evaluating the impact of the pending adoption of ASU 2016-13 on our Consolidated Financial Statements. This ASU is not expected to have a material impact on our financial position, results of operations or cash flows.
In February 2016, the FASB issued ASU 2016-02, Leases (Topic 842). This ASU would require lessees to recognize the following for all leases (with the exception of short-term leases) at the commencement date; (i) a lease liability, which is a lessee’s obligation to make lease payments arising from a lease, measured on a discounted basis; and (ii) a right-of-use asset, which is an asset that represents the lessee’s right to use, or control the use of, a specified asset for the lease term. Lessor accounting is largely unchanged under the amendments of this ASU. Additional disclosures will be required to allow the user to assess the amount, timing and uncertainty of cash flows arising from leasing activities. A modified retrospective transition approach is required for leases existing at the time of adoption. ASU 2016-02 is effective for the first quarter of fiscal 2019 and earlier adoption is permitted. The impact of the adoption of ASU 2016-02 to our Consolidated Financial Statements will be to recognize the majority of our operating lease commitments as operating lease liabilities and right-of-use assets upon adoption, which will result in a material increase in the assets and liabilities recorded on our Consolidated Balance Sheet. We are continuing our assessment, which may identify additional impacts this ASU will have on our Consolidated Financial Statements and related disclosures and internal controls over financial reporting.
In May 2014, the FASB issued ASU 2014-09, Revenue from Contracts with Customers (Topic 606). The objective of ASU 2014-09 is to clarify the principles for recognizing revenue by removing inconsistencies and weaknesses in revenue requirements; providing a more robust framework for addressing revenue issues; improving comparability of revenue recognition practices across entities, industries, jurisdictions and capital markets; and providing more useful information to users of financial statements through improved revenue disclosure requirements. On August 12, 2015, the FASB issued ASU 2015-14, deferring the effective date by one year for ASU 2014-09. ASU 2014-09 is effective for the first quarter of 2018, with early adoption permitted for annual periods beginning after December 15, 2016. The new standard is required to be applied retrospectively to each prior reporting period presented or retrospectively with the cumulative effect of initially applying it recognized at the date of initial application.
Subsequent to the issuance of ASU 2014-09, the FASB has issued the following updates: ASU 2016-08, Revenue from Contracts with Customers (Topic 606) – Principal versus Agent Considerations (Reporting Revenue Gross versus Net); ASU 2016-10, Revenue from Contracts with Customers (Topic 606) – Identifying Performance Obligations and Licensing; ASU 2016-12, Revenue from Contracts with Customers (Topic 606) – Narrow-Scope Improvements and Practical Expedients; ASU 2017-13, Revenue Recognition (Topic 605), Revenue from Contracts with Customers (Topic 606), Leases (Topic 840), and Leases (Topic 842), and Revenue from contracts with Customers (Topic 606) and ASU 2017-14, Income Statement-Reporting Comprehensive Income (Topic 220), Revenue Recognition (Topic 605), and Revenue from contracts with Customers (Topic 606). The amendments in these updates affect the guidance contained within ASU 2014-09.
We will adopt the new revenue standard using the modified retrospective approach when it becomes effective in the first quarter of 2018. Once adopted, we will recognize the license component of term license arrangements upfront and the associated maintenance component will continue to be recognized over the contract period. Under the current revenue standard, for the majority
49
of our term license arrangements which are bundled with maintenance services, both the term license and maintenance revenues are recognized ratably over the contract period. Upon adoption, we will record a one-time pre-tax cumulative effect adjustment of approximately $60 million to increase retained earnings. This amount represents the license component of existing term license arrangements, both in deferred revenue and yet to be billed, which has not yet been recognized and will never be recognized in our Consolidated Statements of Comprehensive Income (Loss) as a result of adopting the standard.
We expect revenue recognition for our other revenue streams to remain materially consistent with our historical revenue recognition practices.
|
Item 7A. |
QUANTITATIVE AND QUALITATIVE DISCLOSURES ABOUT MARKET RISK |
We do not use derivative financial instruments for trading or speculative purposes. We have invested our available cash in short-term, highly liquid financial instruments, having initial maturities of three months or less. When necessary, we have borrowed to fund acquisitions.
At December 31, 2017, we had total debt of $2,092.2 million, including $1,492.2 million of variable interest rate debt. As of December 31, 2017, a 1% change in interest rates would result in a change in interest expense of approximately $14.9 million per year.
During 2017, approximately 27% of our revenues were from clients located outside the United States. A portion of the revenues from clients located outside the U.S. is denominated in foreign currencies, primarily the Canadian dollar. While revenues and expenses of our foreign operations are primarily denominated in their respective local currencies, some subsidiaries do enter into certain transactions in currencies that are different from their local currency. These transactions consist primarily of cross-currency intercompany balances and trade receivables and payables. As a result of these transactions, we have exposure to changes in foreign currency exchange rates that result in foreign currency transaction gains and losses, which we report in other (expense) income. These outstanding amounts were not material for the year ended December 31, 2017. The amount of these balances can fluctuate in the future as we bill customers and buy products or services in currencies other than our functional currency, which could increase our exposure to foreign currency exchange rates. We continue to monitor our exposure to foreign exchange rates as a result of our acquisitions and changes in our operations. We do not enter into any market risk sensitive instruments for trading purposes.
The foregoing risk management discussion and the effect thereof are forward-looking statements. Actual results in the future may differ materially from these projected results due to actual developments in global financial markets. The analytical methods used by us to assess and minimize risk discussed above should not be considered projections of future events or losses.
|
Index to Consolidated Financial Statements |
Page |
|
51 |
|
|
Consolidated Balance Sheets as of December 31, 2017 and 2016 |
53 |
|
54 |
|
|
Consolidated Statements of Cash Flows for the years ended December 31, 2017, 2016 and 2015 |
55 |
|
56 |
|
|
57 |
Financial statement schedules are not submitted because they are not applicable, not required or the information is included in our Consolidated Financial Statements.
50
REPORT OF INDEPENDENT REGISTERED PUBLIC ACCOUNTING FIRM
To the Board of Directors and Stockholders of SS&C Technologies Holdings, Inc.:
Opinions on the Financial Statements and Internal Control over Financial Reporting
We have audited the accompanying consolidated balance sheets of SS&C Technologies Holdings, Inc. and its subsidiaries as of December 31, 2017 and 2016, and the related consolidated statements of comprehensive income (loss), changes in stockholders’ equity and cash flows for each of the three years in the period ended December 31, 2017, including the related notes (collectively referred to as the “consolidated financial statements”). We also have audited the Company's internal control over financial reporting as of December 31, 2017, based on criteria established in Internal Control - Integrated Framework (2013) issued by the Committee of Sponsoring Organizations of the Treadway Commission (COSO).
In our opinion, the consolidated financial statements referred to above present fairly, in all material respects, the financial position of the Company as of December 31, 2017 and 2016, and the results of their operations and their cash flows for each of the three years in the period ended December 31, 2017 in conformity with accounting principles generally accepted in the United States of America. Also in our opinion, the Company maintained, in all material respects, effective internal control over financial reporting as of December 31, 2017, based on criteria established in Internal Control - Integrated Framework (2013) issued by the COSO.
Basis for Opinions
The Company's management is responsible for these consolidated financial statements, for maintaining effective internal control over financial reporting, and for its assessment of the effectiveness of internal control over financial reporting, included in the Report of Management on Internal Control over Financial Reporting appearing under Item 9A. Our responsibility is to express opinions on the Company’s consolidated financial statements and on the Company's internal control over financial reporting based on our audits. We are a public accounting firm registered with the Public Company Accounting Oversight Board (United States) ("PCAOB") and are required to be independent with respect to the Company in accordance with the U.S. federal securities laws and the applicable rules and regulations of the Securities and Exchange Commission and the PCAOB.
We conducted our audits in accordance with the standards of the PCAOB. Those standards require that we plan and perform the audits to obtain reasonable assurance about whether the consolidated financial statements are free of material misstatement, whether due to error or fraud, and whether effective internal control over financial reporting was maintained in all material respects.
Our audits of the consolidated financial statements included performing procedures to assess the risks of material misstatement of the consolidated financial statements, whether due to error or fraud, and performing procedures that respond to those risks. Such procedures included examining, on a test basis, evidence regarding the amounts and disclosures in the consolidated financial statements. Our audits also included evaluating the accounting principles used and significant estimates made by management, as well as evaluating the overall presentation of the consolidated financial statements. Our audit of internal control over financial reporting included obtaining an understanding of internal control over financial reporting, assessing the risk that a material weakness exists, and testing and evaluating the design and operating effectiveness of internal control based on the assessed risk. Our audits also included performing such other procedures as we considered necessary in the circumstances. We believe that our audits provide a reasonable basis for our opinions.
Definition and Limitations of Internal Control over Financial Reporting
A company’s internal control over financial reporting is a process designed to provide reasonable assurance regarding the reliability of financial reporting and the preparation of financial statements for external purposes in accordance with generally accepted accounting principles. A company’s internal control over financial reporting includes those policies and procedures that (i) pertain to the maintenance of records that, in reasonable detail, accurately and fairly reflect the transactions and dispositions of the assets of the company; (ii) provide reasonable assurance that transactions are recorded as necessary to permit preparation of financial statements in accordance with generally accepted accounting principles, and that receipts and expenditures of the company are being made only in accordance with authorizations of management and directors of the company; and (iii) provide reasonable assurance regarding prevention or timely detection of unauthorized acquisition, use, or disposition of the company’s assets that could have a material effect on the financial statements.
51
Because of its inherent limitations, internal control over financial reporting may not prevent or detect misstatements. Also, projections of any evaluation of effectiveness to future periods are subject to the risk that controls may become inadequate because of changes in conditions, or that the degree of compliance with the policies or procedures may deteriorate.
/s/ PricewaterhouseCoopers LLP
Hartford, Connecticut
February 28, 2018
We have served as the Company’s auditor since 1995.
52
SS&C TECHNOLOGIES HOLDINGS, INC. AND SUBSIDIARIES
(dollars in thousands, except share and per share data)
|
|
|
December 31, |
|
|
December 31, |
|
||
|
|
|
2017 |
|
|
2016 |
|
||
|
|
|
|
|
|
|
|
|
|
|
ASSETS |
|
|
|
|
|
|
|
|
|
Current assets: |
|
|
|
|
|
|
|
|
|
Cash and cash equivalents |
|
$ |
64,057 |
|
|
$ |
117,558 |
|
|
Accounts receivable, net of allowance for doubtful accounts of $6,739 and $5,944, respectively |
|
|
243,900 |
|
|
|
241,307 |
|
|
Prepaid expenses and other current assets |
|
|
38,742 |
|
|
|
31,119 |
|
|
Prepaid income taxes |
|
|
12,166 |
|
|
|
23,012 |
|
|
Restricted cash |
|
|
592 |
|
|
|
2,116 |
|
|
Total current assets |
|
|
359,457 |
|
|
|
415,112 |
|
|
Property, plant and equipment: |
|
|
|
|
|
|
|
|
|
Land |
|
|
2,655 |
|
|
|
2,655 |
|
|
Building and improvements |
|
|
59,935 |
|
|
|
42,749 |
|
|
Equipment, furniture, and fixtures |
|
|
138,747 |
|
|
|
120,011 |
|
|
|
|
|
201,337 |
|
|
|
165,415 |
|
|
Less: accumulated depreciation |
|
|
(100,381 |
) |
|
|
(85,020 |
) |
|
Net property, plant and equipment |
|
|
100,956 |
|
|
|
80,395 |
|
|
Deferred income taxes |
|
|
2,324 |
|
|
|
2,410 |
|
|
Goodwill (Note 2) |
|
|
3,707,823 |
|
|
|
3,652,733 |
|
|
Intangible and other assets, net of accumulated amortization of $953,957 and $730,234, respectively |
|
|
1,368,956 |
|
|
|
1,556,321 |
|
|
Total assets |
|
$ |
5,539,516 |
|
|
$ |
5,706,971 |
|
|
LIABILITIES AND STOCKHOLDERS’ EQUITY |
|
|
|
|
|
|
|
|
|
Current liabilities: |
|
|
|
|
|
|
|
|
|
Current portion of long-term debt (Note 6) |
|
$ |
37,863 |
|
|
$ |
126,144 |
|
|
Accounts payable |
|
|
27,087 |
|
|
|
16,490 |
|
|
Income taxes payable |
|
|
6,031 |
|
|
|
3,473 |
|
|
Accrued employee compensation and benefits |
|
|
96,016 |
|
|
|
104,118 |
|
|
Interest payable |
|
|
16,425 |
|
|
|
21,470 |
|
|
Other accrued expenses |
|
|
55,637 |
|
|
|
53,708 |
|
|
Deferred revenue |
|
|
204,601 |
|
|
|
235,222 |
|
|
Total current liabilities |
|
|
443,660 |
|
|
|
560,625 |
|
|
Long-term debt, net of current portion (Note 6) |
|
|
2,007,332 |
|
|
|
2,374,986 |
|
|
Other long-term liabilities |
|
|
118,679 |
|
|
|
59,227 |
|
|
Deferred income taxes |
|
|
283,457 |
|
|
|
453,555 |
|
|
Total liabilities |
|
|
2,853,128 |
|
|
|
3,448,393 |
|
|
Commitments and contingencies (Note 12) |
|
|
|
|
|
|
|
|
|
Stockholders’ equity (Note 4): |
|
|
|
|
|
|
|
|
|
Preferred stock, $0.01 par value per share, 5,000,000 shares authorized; no shares issued |
|
|
— |
|
|
|
— |
|
|
Class A non-voting common stock, $0.01 par value per share, 5,000,000 shares authorized; no shares issued |
|
|
— |
|
|
|
— |
|
|
Common stock, $0.01 par value per share, 400,000,000 shares authorized; 208,109,294 shares and 204,616,054 shares issued, respectively, and 206,535,955 shares and 203,042,715 shares outstanding, respectively, of which 1,126 and 11,252 are unvested, respectively |
|
|
2,081 |
|
|
|
2,046 |
|
|
Additional paid-in capital |
|
|
2,018,106 |
|
|
|
1,921,256 |
|
|
Accumulated other comprehensive loss |
|
|
(82,655 |
) |
|
|
(139,073 |
) |
|
Retained earnings |
|
|
766,856 |
|
|
|
492,349 |
|
|
|
|
|
2,704,388 |
|
|
|
2,276,578 |
|
|
Less: cost of common stock in treasury, 1,573,339 shares |
|
|
(18,000 |
) |
|
|
(18,000 |
) |
|
Total stockholders’ equity |
|
|
2,686,388 |
|
|
|
2,258,578 |
|
|
Total liabilities and stockholders’ equity |
|
$ |
5,539,516 |
|
|
$ |
5,706,971 |
|
The accompanying notes are an integral part of these Consolidated Financial Statements.
53
SS&C TECHNOLOGIES HOLDINGS, INC. AND SUBSIDIARIES
CONSOLIDATED STATEMENTS OF COMPREHENSIVE INCOME (LOSS)
(in thousands, except per share data)
|
|
|
Year Ended December 31, |
|
|||||||||
|
|
|
2017 |
|
|
2016 |
|
|
2015 |
|
|||
|
Revenues: |
|
|
|
|
|
|
|
|
|
|
|
|
|
Software-enabled services |
|
$ |
1,114,008 |
|
|
$ |
956,791 |
|
|
$ |
670,170 |
|
|
Maintenance and term licenses |
|
|
463,658 |
|
|
|
414,710 |
|
|
|
246,422 |
|
|
Total recurring revenues |
|
|
1,577,666 |
|
|
|
1,371,501 |
|
|
|
916,592 |
|
|
Perpetual licenses |
|
|
19,679 |
|
|
|
23,960 |
|
|
|
31,467 |
|
|
Professional services |
|
|
77,950 |
|
|
|
85,975 |
|
|
|
52,226 |
|
|
Total non-recurring revenues |
|
|
97,629 |
|
|
|
109,935 |
|
|
|
83,693 |
|
|
Total revenues |
|
|
1,675,295 |
|
|
|
1,481,436 |
|
|
|
1,000,285 |
|
|
Cost of revenues: |
|
|
|
|
|
|
|
|
|
|
|
|
|
Software-enabled services |
|
|
628,133 |
|
|
|
544,356 |
|
|
|
373,394 |
|
|
Maintenance and term licenses |
|
|
188,164 |
|
|
|
184,162 |
|
|
|
113,865 |
|
|
Total recurring cost of revenues |
|
|
816,297 |
|
|
|
728,518 |
|
|
|
487,259 |
|
|
Perpetual licenses |
|
|
2,595 |
|
|
|
2,399 |
|
|
|
3,116 |
|
|
Professional services |
|
|
67,533 |
|
|
|
69,572 |
|
|
|
41,975 |
|
|
Total non-recurring cost of revenues |
|
|
70,128 |
|
|
|
71,971 |
|
|
|
45,091 |
|
|
Total cost of revenues |
|
|
886,425 |
|
|
|
800,489 |
|
|
|
532,350 |
|
|
Gross profit |
|
|
788,870 |
|
|
|
680,947 |
|
|
|
467,935 |
|
|
Operating expenses: |
|
|
|
|
|
|
|
|
|
|
|
|
|
Selling and marketing |
|
|
118,449 |
|
|
|
117,098 |
|
|
|
94,950 |
|
|
Research and development |
|
|
153,334 |
|
|
|
152,689 |
|
|
|
110,415 |
|
|
General and administrative |
|
|
120,174 |
|
|
|
122,465 |
|
|
|
97,832 |
|
|
Total operating expenses |
|
|
391,957 |
|
|
|
392,252 |
|
|
|
303,197 |
|
|
Operating income |
|
|
396,913 |
|
|
|
288,695 |
|
|
|
164,738 |
|
|
Interest income |
|
|
1,166 |
|
|
|
1,488 |
|
|
|
1,976 |
|
|
Interest expense |
|
|
(108,639 |
) |
|
|
(129,942 |
) |
|
|
(79,333 |
) |
|
Other (expense) income, net |
|
|
(4,484 |
) |
|
|
3,375 |
|
|
|
3,878 |
|
|
Loss on extinguishment of debt |
|
|
(2,326 |
) |
|
|
— |
|
|
|
(30,417 |
) |
|
Income before income taxes |
|
|
282,630 |
|
|
|
163,616 |
|
|
|
60,842 |
|
|
(Benefit) provision for income taxes (Note 5) |
|
|
(46,234 |
) |
|
|
32,620 |
|
|
|
17,980 |
|
|
Net income |
|
$ |
328,864 |
|
|
$ |
130,996 |
|
|
$ |
42,862 |
|
|
|
|
|
|
|
|
|
|
|
|
|
|
|
|
Basic earnings per share |
|
$ |
1.60 |
|
|
$ |
0.65 |
|
|
$ |
0.24 |
|
|
Diluted earnings per share |
|
$ |
1.55 |
|
|
$ |
0.64 |
|
|
$ |
0.22 |
|
|
|
|
|
|
|
|
|
|
|
|
|
|
|
|
Basic weighted average number of common shares outstanding |
|
|
204,923 |
|
|
|
200,252 |
|
|
|
182,196 |
|
|
Diluted weighted average number of common and common equivalent shares outstanding |
|
|
211,632 |
|
|
|
205,793 |
|
|
|
190,896 |
|
|
|
|
|
|
|
|
|
|
|
|
|
|
|
|
Cash dividends declared and paid per common share |
|
$ |
0.265 |
|
|
$ |
0.25 |
|
|
$ |
0.25 |
|
|
|
|
|
|
|
|
|
|
|
|
|
|
|
|
Net income |
|
$ |
328,864 |
|
|
$ |
130,996 |
|
|
$ |
42,862 |
|
|
Other comprehensive income (loss), net of tax: |
|
|
|
|
|
|
|
|
|
|
|
|
|
Foreign currency exchange translation adjustment |
|
|
56,418 |
|
|
|
(55,903 |
) |
|
|
(68,049 |
) |
|
Total comprehensive income (loss), net of tax |
|
|
56,418 |
|
|
|
(55,903 |
) |
|
|
(68,049 |
) |
|
Comprehensive income (loss) |
|
$ |
385,282 |
|
|
$ |
75,093 |
|
|
$ |
(25,187 |
) |
The accompanying notes are an integral part of these Consolidated Financial Statements.
54
SS&C TECHNOLOGIES HOLDINGS, INC. AND SUBSIDIARIES
CONSOLIDATED STATEMENTS OF CASH FLOWS
(in thousands)
|
|
|
Year Ended December 31, |
|
|||||||||
|
|
|
2017 |
|
|
2016 |
|
|
2015 |
|
|||
|
Cash flow from operating activities: |
|
|
|
|
|
|
|
|
|
|
|
|
|
Net income |
|
$ |
328,864 |
|
|
$ |
130,996 |
|
|
$ |
42,862 |
|
|
Adjustments to reconcile net income to net cash provided by operating activities: |
|
|
|
|
|
|
|
|
|
|
|
|
|
Depreciation and amortization |
|
|
237,189 |
|
|
|
228,683 |
|
|
|
150,834 |
|
|
Stock-based compensation expense |
|
|
41,487 |
|
|
|
50,564 |
|
|
|
44,079 |
|
|
Income tax benefit related to exercise of stock options |
|
|
- |
|
|
|
(46,207 |
) |
|
|
(32,960 |
) |
|
Amortization and write-offs of loan origination costs |
|
|
10,552 |
|
|
|
10,680 |
|
|
|
8,126 |
|
|
Loss on extinguishment of debt |
|
|
963 |
|
|
|
— |
|
|
|
3,954 |
|
|
Loss on sale or disposition of property and equipment |
|
|
901 |
|
|
|
162 |
|
|
|
336 |
|
|
Deferred income taxes |
|
|
(152,012 |
) |
|
|
(47,836 |
) |
|
|
(39,806 |
) |
|
Provision for doubtful accounts |
|
|
2,411 |
|
|
|
3,486 |
|
|
|
1,137 |
|
|
Changes in operating assets and liabilities, excluding effects from acquisitions: |
|
|
|
|
|
|
|
|
|
|
|
|
|
Accounts receivable |
|
|
(1,848 |
) |
|
|
(10,850 |
) |
|
|
(12,160 |
) |
|
Prepaid expenses and other assets |
|
|
(7,342 |
) |
|
|
(2,844 |
) |
|
|
(6,019 |
) |
|
Accounts payable |
|
|
13,841 |
|
|
|
(1,300 |
) |
|
|
(5,586 |
) |
|
Accrued expenses |
|
|
(14,806 |
) |
|
|
20,679 |
|
|
|
4,073 |
|
|
Income taxes prepaid and payable |
|
|
45,640 |
|
|
|
65,117 |
|
|
|
11,514 |
|
|
Deferred revenue |
|
|
(35,478 |
) |
|
|
17,077 |
|
|
|
60,240 |
|
|
Net cash provided by operating activities |
|
|
470,362 |
|
|
|
418,407 |
|
|
|
230,624 |
|
|
Cash flow from investing activities: |
|
|
|
|
|
|
|
|
|
|
|
|
|
Additions to property and equipment |
|
|
(35,570 |
) |
|
|
(27,926 |
) |
|
|
(13,600 |
) |
|
Proceeds from sale of property and equipment |
|
|
4 |
|
|
|
71 |
|
|
|
64 |
|
|
Cash paid for business acquisitions, net of cash acquired (Note 11) |
|
|
(17,413 |
) |
|
|
(457,511 |
) |
|
|
(2,729,153 |
) |
|
Additions to capitalized software |
|
|
(10,404 |
) |
|
|
(9,621 |
) |
|
|
(4,273 |
) |
|
Purchase of long-term investment |
|
|
— |
|
|
|
(1,000 |
) |
|
|
— |
|
|
Net cash used in investing activities |
|
|
(63,383 |
) |
|
|
(495,987 |
) |
|
|
(2,746,962 |
) |
|
Cash flow from financing activities: |
|
|
|
|
|
|
|
|
|
|
|
|
|
Cash received from debt borrowings, net of original issue discount |
|
|
45,000 |
|
|
|
120,000 |
|
|
|
3,068,075 |
|
|
Repayments of debt |
|
|
(512,450 |
) |
|
|
(383,436 |
) |
|
|
(903,448 |
) |
|
Proceeds from exercise of stock options |
|
|
60,219 |
|
|
|
39,239 |
|
|
|
30,092 |
|
|
Withholding taxes paid related to equity award net share settlement |
|
|
(4,825 |
) |
|
|
(7,430 |
) |
|
|
(6,939 |
) |
|
Income tax benefit related to exercise of stock options |
|
|
— |
|
|
|
46,207 |
|
|
|
32,960 |
|
|
Proceeds from common stock issuance, net |
|
|
— |
|
|
|
— |
|
|
|
717,802 |
|
|
Purchase of common stock for treasury |
|
|
— |
|
|
|
(15 |
) |
|
|
— |
|
|
Payment of fees related to refinancing activities |
|
|
— |
|
|
|
(519 |
) |
|
|
(46,025 |
) |
|
Dividends paid on common stock |
|
|
(54,357 |
) |
|
|
(50,140 |
) |
|
|
(45,451 |
) |
|
Net cash (used in) provided by financing activities |
|
|
(466,413 |
) |
|
|
(236,094 |
) |
|
|
2,847,066 |
|
|
Effect of exchange rate changes on cash, cash equivalents and restricted cash |
|
|
4,409 |
|
|
|
(3,629 |
) |
|
|
(4,805 |
) |
|
Net (decrease) increase in cash, cash equivalents and restricted cash |
|
|
(55,025 |
) |
|
|
(317,303 |
) |
|
|
325,923 |
|
|
Cash, cash equivalents and restricted cash, beginning of period |
|
|
119,674 |
|
|
|
436,977 |
|
|
|
111,054 |
|
|
Cash, cash equivalents and restricted cash, end of period |
|
$ |
64,649 |
|
|
$ |
119,674 |
|
|
$ |
436,977 |
|
|
|
|
|
|
|
|
|
|
|
|
|
|
|
|
Supplemental disclosure of cash paid for: |
|
|
|
|
|
|
|
|
|
|
|
|
|
Interest |
|
$ |
102,703 |
|
|
$ |
126,693 |
|
|
$ |
42,221 |
|
|
Income taxes, net of refunds |
|
$ |
67,607 |
|
|
$ |
8,809 |
|
|
$ |
42,210 |
|
|
|
|
|
|
|
|
|
|
|
|
|
|
|
|
Supplemental disclosure of non-cash investing activities: |
|
|
|
|
|
|
|
|
|
|
|
|
|
Property and equipment acquired through tenant improvement allowances |
|
$ |
10,334 |
|
|
$ |
2,818 |
|
|
$ |
— |
|
The accompanying notes are an integral part of these Consolidated Financial Statements.
55
SS&C TECHNOLOGIES HOLDINGS, INC. AND SUBSIDIARIES
CONSOLIDATED STATEMENTS OF CHANGES IN STOCKHOLDERS’ EQUITY
FOR THE YEARS ENDED DECEMBER 31, 2017, 2016 AND 2015
(in thousands, except per share data)
|
|
|
Class A |
|
|
|
|
|
|
|
|
|
|
|
|
|
|
|
|
|
|
|
|
|
|
|
|
|
|
|
|
|
|||||
|
|
|
Common Stock |
|
|
Common Stock |
|
|
|
|
|
|
|
|
|
|
|
|
|
|
|
|
|
|
|
|
|
||||||||||
|
|
|
Number |
|
|
|
|
|
|
Number |
|
|
|
|
|
|
|
|
|
|
|
|
|
|
Accumulated |
|
|
|
|
|
|
|
|
|
|||
|
|
|
of |
|
|
|
|
|
|
of |
|
|
|
|
|
|
Additional |
|
|
|
|
|
|
Other |
|
|
|
|
|
|
Total |
|
|||||
|
|
|
Issued |
|
|
|
|
|
|
Issued |
|
|
|
|
|
|
Paid-in |
|
|
Retained |
|
|
Comprehensive |
|
|
Treasury |
|
|
Stockholders’ |
|
|||||||
|
|
|
Shares |
|
|
Amount |
|
|
Shares |
|
|
Amount |
|
|
Capital |
|
|
Earnings |
|
|
Loss (Income) |
|
|
Stock |
|
|
Equity |
|
|||||||||
|
Balance, at December 31, 2014 |
|
|
2,704 |
|
|
$ |
27 |
|
|
|
164,536 |
|
|
$ |
1,644 |
|
|
$ |
964,023 |
|
|
$ |
414,082 |
|
|
$ |
(15,121 |
) |
|
$ |
(17,985 |
) |
|
$ |
1,346,670 |
|
|
Net income |
|
|
— |
|
|
|
— |
|
|
|
— |
|
|
|
— |
|
|
|
— |
|
|
|
42,862 |
|
|
|
— |
|
|
|
— |
|
|
|
42,862 |
|
|
Foreign exchange translation adjustment |
|
|
— |
|
|
|
— |
|
|
|
— |
|
|
|
— |
|
|
|
— |
|
|
|
— |
|
|
|
(68,049 |
) |
|
|
— |
|
|
|
(68,049 |
) |
|
Stock-based compensation expense |
|
|
— |
|
|
|
— |
|
|
|
— |
|
|
|
— |
|
|
|
43,746 |
|
|
|
— |
|
|
|
— |
|
|
|
— |
|
|
|
43,746 |
|
|
Exercise of options, net of withholding taxes |
|
|
— |
|
|
|
— |
|
|
|
4,414 |
|
|
|
44 |
|
|
|
23,109 |
|
|
|
— |
|
|
|
— |
|
|
|
— |
|
|
|
23,153 |
|
|
Non-cash purchase price consideration (Note 11) |
|
|
— |
|
|
|
— |
|
|
|
— |
|
|
|
— |
|
|
|
11,753 |
|
|
|
— |
|
|
|
— |
|
|
|
— |
|
|
|
11,753 |
|
|
Income tax benefit related to exercise of stock options |
|
|
— |
|
|
|
— |
|
|
|
— |
|
|
|
— |
|
|
|
32,960 |
|
|
|
— |
|
|
|
— |
|
|
|
— |
|
|
|
32,960 |
|
|
Cash dividends declared - $0.25 per share (Note 4) |
|
|
— |
|
|
|
— |
|
|
|
— |
|
|
|
— |
|
|
|
— |
|
|
|
(45,451 |
) |
|
|
— |
|
|
|
— |
|
|
|
(45,451 |
) |
|
Issuance of common stock |
|
|
— |
|
|
|
— |
|
|
|
24,154 |
|
|
|
244 |
|
|
|
717,558 |
|
|
|
— |
|
|
|
— |
|
|
|
— |
|
|
|
717,802 |
|
|
Balance, at December 31, 2015 |
|
|
2,704 |
|
|
$ |
27 |
|
|
|
193,104 |
|
|
$ |
1,932 |
|
|
$ |
1,793,149 |
|
|
$ |
411,493 |
|
|
$ |
(83,170 |
) |
|
$ |
(17,985 |
) |
|
$ |
2,105,446 |
|
|
Net income |
|
|
— |
|
|
|
— |
|
|
|
— |
|
|
|
— |
|
|
|
— |
|
|
|
130,996 |
|
|
|
— |
|
|
|
— |
|
|
|
130,996 |
|
|
Foreign exchange translation adjustment |
|
|
— |
|
|
|
— |
|
|
|
— |
|
|
|
— |
|
|
|
— |
|
|
|
— |
|
|
|
(55,903 |
) |
|
|
— |
|
|
|
(55,903 |
) |
|
Stock-based compensation expense |
|
|
— |
|
|
|
— |
|
|
|
— |
|
|
|
— |
|
|
|
50,178 |
|
|
|
— |
|
|
|
— |
|
|
|
— |
|
|
|
50,178 |
|
|
Exercise of options, net of withholding taxes |
|
|
— |
|
|
|
— |
|
|
|
6,104 |
|
|
|
60 |
|
|
|
31,749 |
|
|
|
— |
|
|
|
— |
|
|
|
— |
|
|
|
31,809 |
|
|
Conversion of Class A common stock |
|
|
(2,704 |
) |
|
|
(27 |
) |
|
|
5,408 |
|
|
|
54 |
|
|
|
(27 |
) |
|
|
— |
|
|
|
— |
|
|
|
— |
|
|
|
— |
|
|
Income tax benefit related to exercise of stock options |
|
|
— |
|
|
|
— |
|
|
|
— |
|
|
|
— |
|
|
|
46,207 |
|
|
|
— |
|
|
|
— |
|
|
|
— |
|
|
|
46,207 |
|
|
Cash dividends declared - $0.25 per share (Note 4) |
|
|
— |
|
|
|
— |
|
|
|
— |
|
|
|
— |
|
|
|
— |
|
|
|
(50,140 |
) |
|
|
— |
|
|
|
— |
|
|
|
(50,140 |
) |
|
Purchase of common stock |
|
|
— |
|
|
|
— |
|
|
|
— |
|
|
|
— |
|
|
|
— |
|
|
|
— |
|
|
|
— |
|
|
|
(15 |
) |
|
|
(15 |
) |
|
Balance, at December 31, 2016 |
|
|
— |
|
|
$ |
— |
|
|
|
204,616 |
|
|
$ |
2,046 |
|
|
$ |
1,921,256 |
|
|
$ |
492,349 |
|
|
$ |
(139,073 |
) |
|
$ |
(18,000 |
) |
|
$ |
2,258,578 |
|
|
Net income |
|
|
— |
|
|
|
— |
|
|
|
— |
|
|
|
— |
|
|
|
— |
|
|
|
328,864 |
|
|
|
— |
|
|
|
— |
|
|
|
328,864 |
|
|
Foreign exchange translation adjustment |
|
|
— |
|
|
|
— |
|
|
|
— |
|
|
|
— |
|
|
|
— |
|
|
|
— |
|
|
|
56,418 |
|
|
|
— |
|
|
|
56,418 |
|
|
Stock-based compensation expense |
|
|
— |
|
|
|
— |
|
|
|
— |
|
|
|
— |
|
|
|
41,491 |
|
|
|
— |
|
|
|
— |
|
|
|
— |
|
|
|
41,491 |
|
|
Exercise of options, net of withholding taxes |
|
|
— |
|
|
|
— |
|
|
|
3,493 |
|
|
|
35 |
|
|
|
55,359 |
|
|
|
— |
|
|
|
— |
|
|
|
— |
|
|
|
55,394 |
|
|
Cash dividends declared - $0.265 per share (Note 4) |
|
|
— |
|
|
|
— |
|
|
|
— |
|
|
|
— |
|
|
|
— |
|
|
|
(54,357 |
) |
|
|
— |
|
|
|
— |
|
|
|
(54,357 |
) |
|
Balance, at December 31, 2017 |
|
|
— |
|
|
$ |
— |
|
|
|
208,109 |
|
|
$ |
2,081 |
|
|
$ |
2,018,106 |
|
|
$ |
766,856 |
|
|
$ |
(82,655 |
) |
|
$ |
(18,000 |
) |
|
$ |
2,686,388 |
|
The accompanying notes are an integral part of these Consolidated Financial Statements.
56
SS&C Technologies Holdings, Inc., or “Holdings”, is our top-level holding company. SS&C Technologies, Inc., or “SS&C,” is our primary operating company and a wholly-owned subsidiary of SS&C Technologies Holdings, Inc. The “Company” means SS&C Technologies Holdings, Inc. and its consolidated subsidiaries, including SS&C.
Note 1—Organization
The Company provides software products and software-enabled services to the financial services industry, primarily in North America. The Company also has operations in Europe, Asia, Australia and Africa. The Company’s portfolio of approximately 90 products and software-enabled services allows its clients to automate and integrate front-office functions such as trading and modeling, middle-office functions such as portfolio management and reporting, and back-office functions such as accounting, performance measurement, reconciliation, reporting, processing and clearing. The Company provides its products and related services in eight vertical markets in the financial services industry:
|
|
1. |
Alternative investments; |
|
|
2. |
Insurance and pension funds; |
|
|
3. |
Asset and wealth management; |
|
|
4. |
Financial institutions; |
|
|
5. |
Commercial lenders; |
|
|
6. |
Real estate property management; |
|
|
7. |
Municipal finance; and |
|
|
8. |
Financial markets. |
Note 2—Summary of Significant Accounting Policies
Use of Estimates
The preparation of the Consolidated Financial Statements in conformity with generally accepted accounting principles (“GAAP”) requires management to make estimates and assumptions that affect the reported amounts of assets and liabilities and the disclosure of contingent assets and liabilities at the date of the financial statements and the reported amounts of revenues and expenses during the reporting period. Estimates are used for, but not limited to, collectability of accounts receivable, costs to complete certain contracts, valuation of acquired assets and liabilities, valuation of stock options, income tax accruals and the value of deferred tax assets and liabilities. Estimates are also used to determine the remaining economic lives and carrying value of fixed assets, goodwill and intangible assets. Actual results could differ from those estimates.
Principles of Consolidation
The Consolidated Financial Statements include the accounts of the Company and its subsidiaries. All significant accounts, transactions and profits between the consolidated companies have been eliminated in consolidation. Unconsolidated investments in entities over which the Company does not have control but has the ability to exercise influence over operating and financial policies, if any, are accounted for under the equity method of accounting. Earnings and losses from such investments are recorded on a pre-tax basis, if any. Certain prior year balances have been reclassified to conform to the current year presentation. Such reclassifications did not affect total revenues, operating income or net income.
Revenue Recognition
The Company’s payment terms for perpetual software licenses typically require that the total fee be paid upon signing of the contract. Maintenance services and term license fees are typically due in full at the beginning of each annual period. Professional services and software-enabled services are typically due and payable monthly in arrears. Normally, the Company’s arrangements do not provide for any refund rights, and payments are not contingent on specific milestones or customer acceptance conditions. For arrangements that do contain such provisions, the Company defers revenue until the rights or conditions have expired or have been met.
Unbilled accounts receivable primarily relate to professional services and software-enabled services revenue that has been earned as of month end but is not invoiced until the subsequent month, and to software license revenue that has been earned and is realizable but not invoiced to clients until future dates specified in the client contract.
57
Deferred revenue consists of billings or payments received related to product delivery, maintenance and other services, which have been paid by customers prior to the recognition of revenue. Deferred revenue relates primarily to cash received for maintenance and term license contracts in advance of services being performed over the contractual term.
Software-enabled Services Revenue
The Company primarily offers software-enabled outsourcing services in which the Company utilizes its own software to offer comprehensive fund administration services for alternative investment managers, including fund manager services, transfer agency services, funds-of-funds services, tax processing and accounting. The Company also offers subscription-based on-demand software applications that are managed and hosted at the Company’s facilities. The software-enabled services arrangements provide an alternative for clients who do not wish to install, run and maintain complicated financial software. Under these arrangements, the client does not have the right to take possession of the software, rather, the Company agrees to provide access to its applications, remote use of its equipment to process transactions, access to client’s data stored on its equipment, and connectivity between its environment and the client’s computing systems.
Software-enabled services are generally provided under contracts with initial terms of one to five years that require monthly or quarterly payments, and are subject to automatic annual renewal at the end of the initial term unless terminated by either party.
The Company recognizes software-enabled services revenues on a monthly basis as the software-enabled services are provided and when persuasive evidence of an arrangement exists, the price is fixed or determinable and collectability is reasonably assured. The Company does not recognize any revenue before services are performed. Certain contracts contain additional fees for increases in market value, pricing and trading activity. Revenues related to these additional fees are recognized in the month in which the activity occurs based upon the Company’s summarization of account information and trading volume.
Maintenance and Term Licenses Revenue
Maintenance agreements generally require the Company to provide technical support and software updates (on a when-and-if-available basis) to its clients. Such services are generally provided under one-year renewable contracts. Maintenance revenues are recognized ratably over the term of the maintenance agreement.
The Company also sells term licenses ranging from one to seven years, many of which include bundled maintenance services. For those arrangements with bundled maintenance services, vendor-specific objective evidence (“VSOE”) does not exist for the maintenance element and therefore the total fee is recognized ratably over the contractual term of the arrangement.
Perpetual Licenses Revenue
The Company follows the principles of accounting standards relating to software revenue recognition, which provide guidance on applying GAAP in recognizing revenue on software transactions. Accounting standards require that revenue recognized from software transactions be allocated to each element of the transaction based on the relative fair values of the elements, such as software products, specified upgrades, enhancements, post-contract client support, installation or training. The determination of fair value is based upon VSOE. The Company recognizes perpetual licenses revenues allocated to software products and enhancements generally upon delivery of each of the related products or enhancements, assuming all other revenue recognition criteria are met. In the rare occasion that a perpetual license agreement includes the right to a specified upgrade or product, the Company defers all revenues under the arrangement until the specified upgrade or product is delivered, since typically VSOE does not exist to support the fair value of the specified upgrade or product.
The Company generally recognizes revenue from sales of software or products including proprietary software upon product shipment and receipt of a signed contract, provided that collection is probable and all other revenue recognition criteria are met. The Company sells perpetual software licenses in conjunction with professional services for installation and maintenance. For these arrangements, the total contract value is attributed first to the maintenance arrangement based on its fair value, which is derived from stated renewal rates. The contract value is then attributed to professional services based on estimated fair value, which is derived from the rates charged for similar services provided on a stand-alone basis. The Company’s software license agreements generally do not require significant modification or customization of the underlying software, and, accordingly, implementation services provided by the Company are not considered essential to the functionality of the software. The remainder of the total contract value is then attributed to the software license based on the residual method.
The Company occasionally enters into license agreements requiring significant customization of the Company’s software. The Company accounts for the license fees under these agreements on the percentage-of-completion basis. This method requires estimates
58
to be made for costs to complete the agreement utilizing an estimate of development man-hours remaining. Revenue is recognized each period based on the hours incurred to date compared to the total hours expected to complete the project. Due to uncertainties inherent in the estimation process, it is at least reasonably possible that completion costs may be revised. Such revisions are recognized in the period in which the revisions are determined. Provisions for estimated losses on uncompleted contracts are determined on a contract-by-contract basis, and are made in the period in which such losses are first estimated or determined.
Professional Services Revenue
The Company provides consulting and training services to its clients. Revenues for such services are generally recognized over the period during which the services are performed. The Company typically charges for professional services on a time-and-materials basis. However, some contracts are for a fixed fee. For the fixed-fee arrangements, an estimate is made of the total hours expected to be incurred to complete the project. Due to uncertainties inherent in the estimation process, it is at least reasonably possible that completion costs may be revised. Such revisions are recognized in the period in which the revisions are determined. Revenues are recognized each period based on the hours incurred to date compared to the total hours expected to complete the project.
Research and Development
Research and development costs associated with computer software are charged to expense as incurred. Capitalization of internally developed computer software costs in the case of software to be sold begins upon the establishment of technological feasibility based on a working model. Capitalization of internally developed computer software costs in the case of internal use software begins when management authorizes and commits funding to a project and the preliminary design stage has been completed. Net capitalized software costs of $12.1 million and $8.8 million are included in the December 31, 2017 and 2016 Consolidated Balance Sheets, respectively, under “Intangible and other assets”.
The Company’s policy is to amortize these costs upon a product’s general release to the client. Amortization of capitalized software costs is calculated by the greater of (a) the ratio that current gross revenues for a product bear to the total of current and anticipated future gross revenues for that product or (b) the straight-line method over the remaining estimated economic life of the product, including the period being reported on, typically two to five years. It is reasonably possible that those estimates of anticipated future gross revenues, the remaining estimated economic life of the product, or both could be reduced significantly due to competitive pressures. Amortization expense related to capitalized software development costs was $5.4 million, $3.5 million, and $2.4 million for each of the years ended December 31, 2017, 2016, and 2015, respectively.
Stock-based Compensation
Using the fair value recognition provisions of relevant accounting literature, stock-based compensation cost is measured at the grant date based on the estimated fair value of the award and is recognized as expense over the appropriate service period. Determining the fair value of stock-based awards requires considerable judgment, including estimating the expected term of stock options and the expected volatility of the Company’s stock price. Differences between actual results and these estimates could have a material effect on the Company’s financial results. A deferred income tax asset is recorded over the vesting period as stock compensation expense is recorded for non-qualified option awards. The realizability of the deferred tax asset is ultimately based on the actual value of the stock-based award upon exercise. If the actual value is lower than the fair value determined on the date of grant, then there would be an income tax expense for the portion of the deferred tax asset that is not realizable.
Income Taxes
The Company accounts for income taxes in accordance with the relevant accounting literature. An asset and liability approach is used to recognize deferred tax assets and liabilities for the future tax consequences of items that are recognized in the Company’s financial statements and tax returns in different years. A valuation allowance is established against net deferred tax assets if, based on the weight of available evidence, it is more likely than not that some or all of the net deferred tax assets will not be realized.
The Company accounts for uncertain tax positions using a two-step approach. The first step is to evaluate the tax position for recognition by determining if the weight of available evidence indicates it is more likely than not that the position will be sustained on audit, including resolution of related appeals or litigation processes, if any. The second step is to measure the tax benefit as the largest amount which is more than 50% likely of being realized upon ultimate settlement. The Company considers many factors when evaluating and estimating its tax positions and tax benefits, which may require periodic adjustments and which may not accurately forecast actual outcomes.
On December 22, 2017, the Tax Cuts and Jobs Act (“Tax Act”) was enacted into law and the new legislation contains several significant changes to U.S. tax law that affected the Company, including a one-time mandatory transition tax on accumulated foreign
59
earnings and a reduction of the U.S. corporate income tax rate from a maximum of 35% to a flat 21% rate effective January 1, 2018, among others. The Tax Act also adds new provisions including limitations on the deductibility of interest expense and executive compensation, a minimum tax on global intangible low-taxed income (“GILTI”) and the base erosion anti-abuse tax (“BEAT”). The Company is required to recognize the effect of the tax law changes in the period of enactment, such as determining the transition tax, re-measuring the Company’s U.S. deferred tax assets and liabilities as well as reassessing the net realizability of the Company’s deferred tax assets and liabilities. The GILTI provisions require the Company to include in its U.S. income tax return foreign subsidiary earnings in excess of an allowable return on the foreign subsidiary's tangible assets. Under U.S.GAAP, the Company can make an accounting policy election to either treat taxes due on the GILTI as a current period expense, or factor such amounts into our measurement of deferred taxes. The Company has elected the deferred method and recorded a reasonable estimate of $ 6.7 million related to GILTI. On December 22, 2017, the SEC staff issued Staff Accounting Bulletin No. 118, Income Tax Accounting Implications of the Tax Cuts and Jobs Act (“SAB 118”), which allows the Company to record provisional amounts during a measurement period not to extend beyond one year of the enactment date. Since the Tax Act was passed late in the fourth quarter of 2017, and ongoing guidance and accounting interpretation is expected over the next 12 months, the Company considers the accounting of the transition tax, deferred tax re-measurements, GILTI and other items to be incomplete due to the forthcoming guidance and the Company’s ongoing analysis of final year-end data and tax positions. The Company’s initial accounting for the GILTI tax is provisional under SAB 118 and is incomplete because the Company is still refining its measurement methodology. The Company is currently assessing the impact of other certain provisions, including the base erosion anti-abuse tax (“BEAT”), which does not apply to 2017. Additionally, the Company has considered the impact of limitations on the deductibility of interest expense and executive compensation on the realizability of its deferred tax assets and made a reasonable estimate that these changes do not significantly impact tax expense. The Company expects to complete the analysis regarding all provisions of the Tax Act within the measurement period in accordance with SAB 118. See Note 5 in these notes to the Consolidated Financial Statements for additional information.
Cash and Cash Equivalents
The Company considers all highly liquid marketable securities with original maturities of three months or less at the date of acquisition to be cash equivalents. The Company did not hold any cash equivalents at December 31, 2017 and 2016.
Restricted Cash
Restricted cash includes monies held by a bank as security for letters of credit issued due to lease requirements for office space. The letters of credit are expected to be renewed within the next twelve months, and as such, the restricted cash is classified as a current asset on the Consolidated Balance Sheets.
Property, Plant and Equipment
Property, plant and equipment are stated at cost. Depreciation of property, plant and equipment is calculated using a combination of straight-line and accelerated methods over the estimated useful lives of the assets as follows:
|
Description |
|
Useful Life |
|
|
|
Land |
|
|
— |
|
|
Buildings and improvements |
|
40 years |
|
|
|
Equipment and software |
|
3-5 years |
|
|
|
Furniture and fixtures |
|
7-10 years |
|
|
|
Leasehold improvements |
|
Shorter of lease term or estimated useful life |
|
|
Depreciation expense for the years ended December 31, 2017, 2016 and 2015 was $25.9 million, $23.7 million and $18.9 million, respectively.
Maintenance and repairs are expensed as incurred. The costs of sold or retired assets are removed from the related asset and accumulated depreciation accounts and any gain or loss is included in the Statements of Comprehensive Income (Loss).
Goodwill and Intangible Assets
The Company tests goodwill annually for impairment as of December 31st (and in interim periods if certain events occur or circumstances change that would more likely than not reduce the fair value of a reporting unit below its carrying amount). The Company has completed the required impairment tests for goodwill and has determined that no impairment existed as of December 31, 2017 or 2016. The Company’s impairment analysis, which is based on the Company’s reporting unit structure, indicated that the fair value significantly exceeded the carrying value at December 31, 2017. There were no other indefinite-lived intangible assets as of December 31, 2017 or 2016.
60
The following table summarizes changes in goodwill (in thousands):
|
Balance at December 31, 2015 |
|
$ |
3,549,212 |
|
|
2016 acquisitions |
|
|
148,235 |
|
|
Adjustments to prior acquisitions |
|
|
(4,787 |
) |
|
Effect of foreign currency translation |
|
|
(39,927 |
) |
|
Balance at December 31, 2016 |
|
$ |
3,652,733 |
|
|
2017 acquisitions |
|
|
13,328 |
|
|
Adjustments to prior acquisitions |
|
|
(621 |
) |
|
Effect of foreign currency translation |
|
|
42,383 |
|
|
Balance at December 31, 2017 |
|
$ |
3,707,823 |
|
Customer relationships, completed technology, trade names and other identifiable intangible assets are amortized over lives ranging from three to 17 years based on the ratio that cash flows for the intangible asset bear to the total of expected future cash flows for the intangible asset. Amortization expense associated with customer relationships, completed technology and other amortizable intangible assets was $205.9 million, $201.5 million and $129.5 million for the years ended December 31, 2017, 2016 and 2015, respectively.
A summary of the components of intangible assets is as follows (in thousands):
|
|
|
December 31, |
|
|||||
|
|
|
2017 |
|
|
2016 |
|
||
|
Customer relationships |
|
$ |
1,665,814 |
|
|
$ |
1,645,515 |
|
|
Completed technology |
|
|
550,921 |
|
|
|
545,273 |
|
|
Trade names |
|
|
61,093 |
|
|
|
60,128 |
|
|
Other |
|
|
2,782 |
|
|
|
2,709 |
|
|
Total intangible assets |
|
|
2,280,610 |
|
|
|
2,253,625 |
|
|
Less: accumulated amortization |
|
|
(938,833 |
) |
|
|
(720,930 |
) |
|
Total intangible assets, net |
|
$ |
1,341,777 |
|
|
$ |
1,532,695 |
|
Total estimated amortization expense, related to intangible assets, for each of the next five years, as of December 31, 2017, is expected to approximate (in thousands):
|
Year Ending December 31, |
|
|
|
|
|
2018 |
|
$ |
211,256 |
|
|
2019 |
|
|
193,281 |
|
|
2020 |
|
|
174,492 |
|
|
2021 |
|
|
134,941 |
|
|
2022 |
|
|
118,670 |
|
|
Thereafter |
|
|
509,137 |
|
|
Total |
|
$ |
1,341,777 |
|
Impairment of Long-Lived Assets
The Company evaluates the recoverability of its long-lived assets when there is evidence that events or changes in circumstances have made recovery of the assets’ carrying value unlikely. An impairment loss would be recognized when the sum of the expected future undiscounted net cash flows is less than the carrying amount of the asset. The Company has identified no such impairment losses in the years ended December 31, 2017 and 2016.
Concentration of Credit Risk
Financial instruments, which potentially subject the Company to concentrations of credit risk, consist principally of cash, cash equivalents, marketable securities, and trade receivables. The Company has cash investment policies that limit investments to investment grade securities. Concentrations of credit risk, with respect to trade receivables, are limited due to the fact that the Company’s client base is highly diversified. As of December 31, 2017 and 2016, the Company had no significant concentrations of credit.
61
International Operations and Foreign Currency
The functional currency of each foreign subsidiary is generally the local currency. Accordingly, assets and liabilities of foreign subsidiaries are translated to U.S. dollars at period-end exchange rates, and capital stock accounts are translated at historical rates. Revenues and expenses are translated using the average rates during the period. The resulting translation adjustments are excluded from net earnings and accumulated as a separate component of stockholders’ equity. Foreign currency transaction gains and losses are included within other (expense) income in the Consolidated Statements of Comprehensive Income (Loss) in the periods in which they occur.
Comprehensive Income (Loss)
Items defined as comprehensive income (loss), such as foreign currency translation adjustments, are separately classified in the Consolidated Financial Statements. The accumulated balance of other comprehensive income (loss) is reported separately from retained earnings and additional paid-in capital in the equity section of the Consolidated Balance Sheets. Total comprehensive income (loss) consists of net income (loss) and other accumulated comprehensive income (loss) disclosed in the equity section of the Consolidated Balance Sheets.
Treasury Stock
Treasury stock purchases are accounted for under the cost method and are included as a deduction from equity in the Stockholders’ Equity section of the Consolidated Balance Sheets. Under the cost method, the price paid for the stock is charged to the treasury stock account.
Basic and Diluted Earnings per Share
Earnings per share (“EPS”) is calculated in accordance with the relevant standards. Basic EPS includes no dilution and is computed by dividing income available to the Company’s common stockholders by the weighted average number of common shares outstanding during the period. Diluted EPS is computed by dividing net income by the weighted average number of common and common equivalent shares outstanding during the period. Common equivalent shares consist of stock options, stock appreciation rights (“SARs”) and restricted stock units (“RSUs”) and restricted stock awards (“RSAs”) using the treasury stock method. Common equivalent shares are excluded from the computation of diluted earnings per share if the effect of including such common equivalent shares is anti-dilutive because their total assumed proceeds exceed the average fair value of common stock for the period. The Company has two classes of common stock, each with identical participation rights to earnings and liquidation preferences, and therefore the calculation of EPS as described above is identical to the calculation under the two-class method.
The following table sets forth the computation of basic and diluted EPS (in thousands, except per share amounts):
|
|
|
Year Ended December 31, |
|
|||||||||
|
|
|
2017 |
|
|
2016 |
|
|
2015 |
|
|||
|
Net income |
|
$ |
328,864 |
|
|
$ |
130,996 |
|
|
$ |
42,862 |
|
|
|
|
|
|
|
|
|
|
|
|
|
|
|
|
Shares: |
|
|
|
|
|
|
|
|
|
|
|
|
|
Weighted average common shares outstanding — used in calculation of basic EPS |
|
|
204,923 |
|
|
|
200,252 |
|
|
|
182,196 |
|
|
Weighted average common stock equivalents — options and restricted shares |
|
|
6,709 |
|
|
|
5,541 |
|
|
|
8,700 |
|
|
Weighted average common and common equivalent shares outstanding — used in calculation of diluted EPS |
|
|
211,632 |
|
|
|
205,793 |
|
|
|
190,896 |
|
|
|
|
|
|
|
|
|
|
|
|
|
|
|
|
Earnings per share - Basic |
|
$ |
1.60 |
|
|
$ |
0.65 |
|
|
$ |
0.24 |
|
|
Earnings per share - Diluted |
|
$ |
1.55 |
|
|
$ |
0.64 |
|
|
$ |
0.22 |
|
Weighted average stock options, SARs, RSUs and RSAs representing 10,641,582, 14,094,402 and 7,001,656 shares were outstanding for the years ended December 31, 2017, 2016 and 2015, respectively, but were not included in the computation of diluted EPS because the effect of including them would be anti-dilutive.
62
Recently Adopted Accounting Pronouncements
In January 2017, the Financial Accounting Standards Board (“FASB”) issued Accounting Standards Update (“ASU”) 2017-04, Goodwill and Other (Topic 350) – Simplifying the Test for Goodwill Impairment. ASU 2017-04 simplifies the subsequent measurement of goodwill by eliminating Step 2 of the goodwill impairment test. In computing the implied fair value of goodwill under Step 2, an entity had to perform procedures to determine the fair value at the impairment testing date of its assets and liabilities (including unrecognized assets and liabilities) following the procedure that would be required in determining the fair value of assets acquired and liabilities assumed in a business combination. As a result of ASU 2017-04, an entity should perform its goodwill impairment test by comparing the fair value of a reporting unit with its carrying amount and then recognize an impairment charge, as necessary, for the amount by which the carrying amount exceeds the reporting unit’s fair value, not to exceed the total amount of goodwill allocated to that reporting unit. ASU 2017-04 is effective for fiscal years and interim periods within those years beginning after December 15, 2019, and early adoption is permitted for interim or annual goodwill impairment tests performed after January 1, 2017. The Company adopted ASU 2017-04 for its goodwill impairment test in 2017. The adoption of ASU 2017-04 had no impact on the Company’s consolidated financial statements as of and for the year ended December 31, 2017.
In November 2016, the FASB issued ASU No. 2016-18, Statement of Cash Flows: Restricted Cash. This ASU provides guidance on the classification of restricted cash in the statement of cash flows. This ASU requires that restricted cash be included within cash and cash equivalents when reconciling the beginning-of-period and end-of-period total amounts shown on the statement of cash flows. ASU 2016-18 is effective for the Company for its first quarter of fiscal 2018. Early adoption is permitted and the guidance requires application using a retrospective method. The Company has early adopted ASU 2016-18, which did not have a material impact on the Company’s financial position, results of operations or cash flows.
In March 2016, the FASB issued ASU 2016-09, Compensation – Stock Compensation (Topic 718): Improvements to Employee Share-Based Payment Accounting. This ASU is intended to simplify several aspects of the accounting for share-based payment transactions, including the income tax consequences, classification of awards as either equity or liabilities, and classification on the statement of cash flows. ASU 2016-09 is effective for the Company for its first quarter of fiscal 2017. Effective January 1, 2017, excess tax benefits will be prospectively reported as an operating activity in the Company’s Consolidated Statements of Cash Flows. As the Company has applied this guidance prospectively as of January 1, 2017, excess tax benefits for the years ended December 31, 2016 and 2015 will not be adjusted and continue to be reported in financing activities in the Consolidated Statements of Cash Flows. As a result of the adoption, the Company recognized discrete tax benefits of $16.4 million in the provision for income taxes line of the Consolidated Statement of Comprehensive Income (Loss) for the year ended December 31, 2017 related to excess tax benefits upon vesting of a restricted-stock award or stock option exercise event relative to the deferred tax asset position established. The Company has elected to account for forfeitures as they occur and there was no material effect recorded upon adoption of this change. The Company has also excluded the excess tax benefits from the assumed proceeds available to repurchase shares in the computation of the Company’s diluted earnings per share for the year ended December 31, 2017, which had the effect of increasing the weighted average common stock equivalents. Prior to the adoption of ASU 2016-09, the Company included excess tax benefits in assessing whether common equivalent shares were dilutive in the Company’s calculations of weighted average dilutive shares under the treasury stock method. Presentation requirements for cash flows related to employee taxes paid for withheld shares had no impact to all periods presented as such cash flows have historically been presented as financing activities.
In August 2014, the FASB issued ASU 2014-15, Disclosure of Uncertainties about an Entity’s Ability to Continue as a Going Concern. This ASU establishes specific guidance to an organization’s management on their responsibility to evaluate whether there is substantial doubt about the organization’s ability to continue as a going concern. The guidance is effective for annual periods ending after December 15, 2016 and for interim periods thereafter. The adoption of this guidance did not have a material effect on our Consolidated Financial Statements during the year ended December 31, 2016.
Recent Accounting Pronouncements Not Yet Effective
In August 2016, the FASB issued ASU 2016-15, Classification of Certain Cash Receipts and Cash Payments. ASU 2016-15 addresses how certain cash receipts and cash payments are presented and classified in the statement of cash flows under Topic 230, Statement of Cash flow, and other Topics. ASU 2016-15 is effective for the Company for its first quarter of fiscal 2018 and the guidance requires application using a retrospective method. The impact of the Company’s adoption of ASU 2016-15 to the Company’s Consolidated Financial Statements will be to reflect the presentation of debt prepayment or debt extinguishment costs as cash outflows for financing activities within the Company’s Consolidated Statement of Cash Flows. This ASU is not expected to have a material impact on the Company’s financial position, results of operations or cash flows.
63
In June 2016, the FASB issued ASU 2016-13, Measurement of Credit Losses on Financial Instruments. ASU 2016-13 requires companies to measure credit losses utilizing a methodology that reflects expected credit losses and requires a consideration of a broader range of reasonable and supportable information to inform credit loss estimates. ASU 2016-13 is effective for the Company for its first quarter of fiscal 2020 and earlier adoption is permitted beginning in the first quarter of fiscal 2019. Application of the ASU is through a cumulative-effect adjustment to retained earnings as of the effective date. The Company is currently evaluating the impact of the pending adoption of ASU 2016-13 on the Company’s Consolidated Financial Statements. This ASU is not expected to have a material impact on the Company’s financial position, results of operations or cash flows.
In February 2016, the FASB issued ASU 2016-02, Leases (Topic 842). This ASU would require lessees to recognize the following for all leases (with the exception of short-term leases) at the commencement date; (i) a lease liability, which is a lessee’s obligation to make lease payments arising from a lease, measured on a discounted basis; and (ii) a right-of-use asset, which is an asset that represents the lessee’s right to use, or control the use of, a specified asset for the lease term. Lessor accounting is largely unchanged under the amendments of this ASU. Additional disclosures will be required to allow the user to assess the amount, timing and uncertainty of cash flows arising from leasing activities. A modified retrospective transition approach is required for leases existing at the time of adoption. ASU 2016-02 is effective for the Company for its first quarter of fiscal 2019 and earlier adoption is permitted. The impact of the Company’s adoption of ASU 2016-02 to the Company’s Consolidated Financial Statements will be to recognize the majority of the Company’s operating lease commitments as operating lease liabilities and right-of-use assets upon adoption, which will result in a material increase in the assets and liabilities recorded on the Company’s Consolidated Balance Sheet. The Company is continuing its assessment, which may identify additional impacts this ASU will have on the Company’s Consolidated Financial Statements and related disclosures and internal controls over financial reporting.
In May 2014, the FASB issued ASU 2014-09, Revenue from Contracts with Customers (Topic 606). The objective of ASU 2014-09 is to clarify the principles for recognizing revenue by removing inconsistencies and weaknesses in revenue requirements; providing a more robust framework for addressing revenue issues; improving comparability of revenue recognition practices across entities, industries, jurisdictions and capital markets; and providing more useful information to users of financial statements through improved revenue disclosure requirements. On August 12, 2015, the FASB issued ASU 2015-14, deferring the effective date by one year for ASU 2014-09. ASU 2014-09 is effective for the Company for its first quarter of 2018, with early adoption permitted for annual periods beginning after December 15, 2016. The new standard is required to be applied retrospectively to each prior reporting period presented or retrospectively with the cumulative effect of initially applying it recognized at the date of initial application.
Subsequent to the issuance of ASU 2014-09, the FASB has issued the following updates: ASU 2016-08, Revenue from Contracts with Customers (Topic 606) – Principal versus Agent Considerations (Reporting Revenue Gross versus Net); ASU 2016-10, Revenue from Contracts with Customers (Topic 606) – Identifying Performance Obligations and Licensing; ASU 2016-12, Revenue from Contracts with Customers (Topic 606) – Narrow-Scope Improvements and Practical Expedients; ASU 2017-13, Revenue Recognition (Topic 605), Revenue from Contracts with Customers (Topic 606), Leases (Topic 840), and Leases (Topic 842), and Revenue from contracts with Customers (Topic 606) and ASU 2017-14, Income Statement-Reporting Comprehensive Income (Topic 220), Revenue Recognition (Topic 605), and Revenue from contracts with Customers (Topic 606). The amendments in these updates affect the guidance contained within ASU 2014-09.
The Company will adopt the new revenue standard using the modified retrospective approach when it becomes effective for the Company in the first quarter of 2018. Once adopted, the Company will recognize the license component of term license arrangements upfront and the associated maintenance component will continue to be recognized over the contract period. Under the current revenue standard, for the majority of the Company’s term license arrangements which are bundled with maintenance services, both the term license and maintenance revenues are recognized ratably over the contract period. Upon adoption, the Company will record a one-time pre-tax cumulative effect adjustment of approximately $60 million to increase retained earnings. This amount represents the license component of existing term license arrangements, both in deferred revenue and yet to be billed, which has not yet been recognized and will never be recognized in the Company’s Consolidated Statements of Comprehensive Income (Loss) as a result of adopting the standard.
The Company expects revenue recognition for the Company’s other revenue streams to remain materially consistent with its historical revenue recognition practices.
Note 3—Accounts Receivable, net
Accounts receivable are as follows (in thousands):
64
|
|
|
December 31, |
|
|||||
|
|
|
2017 |
|
|
2016 |
|
||
|
Accounts receivable |
|
$ |
179,019 |
|
|
$ |
172,642 |
|
|
Unbilled accounts receivable |
|
|
71,620 |
|
|
|
74,609 |
|
|
Allowance for doubtful accounts |
|
|
(6,739 |
) |
|
|
(5,944 |
) |
|
Total accounts receivable, net |
|
$ |
243,900 |
|
|
$ |
241,307 |
|
The following table represents the activity for the allowance for doubtful accounts during the years ended December 31, 2017, 2016 and 2015 (in thousands):
|
|
|
Year Ended December 31, |
|
|||||||||
|
Allowance for Doubtful Accounts: |
|
2017 |
|
|
2016 |
|
|
2015 |
|
|||
|
Balance at beginning of period |
|
$ |
5,944 |
|
|
$ |
2,957 |
|
|
$ |
2,241 |
|
|
Charge to costs and expenses |
|
|
2,411 |
|
|
|
3,486 |
|
|
|
1,137 |
|
|
Write-offs, net of recoveries |
|
|
(1,796 |
) |
|
|
(390 |
) |
|
|
(273 |
) |
|
Other adjustments |
|
|
180 |
|
|
|
(109 |
) |
|
|
(148 |
) |
|
Balance at end of period |
|
$ |
6,739 |
|
|
$ |
5,944 |
|
|
$ |
2,957 |
|
Management establishes the allowance for doubtful accounts based on historical bad debt experience. In addition, management analyzes client accounts, client concentrations, client creditworthiness, current economic trends and changes in the client’s payment terms when evaluating the adequacy of the allowance for doubtful accounts.
Note 4—Stockholders’ Equity
Two-for-one Stock Split. On May 25, 2016, the Company’s Board of Directors approved a two-for-one stock split to be effected in the form of a stock dividend. The record date for the stock split was June 7, 2016 and the payment date was June 24, 2016. All share and per share amounts (other than for the Company’s Class A non-voting common stock) have been retroactively restated for all periods presented to reflect the stock split.
Conversion of Class A Common Stock. On March 30, 2016, William C. Stone converted 2,703,846 shares of Class A non-voting stock into 2,703,846 shares of the Company’s common stock, or 5,407,692 shares of common stock on a post-split basis. Each share of Class A non-voting common stock converted automatically into one share of the Company’s common stock upon the expiration of the applicable waiting period under the Hart-Scott-Rodino Antitrust Improvements Act of 1976, as amended.
Public offering. In June 2015, the Company completed a public offering of its common stock. The offering included 24,150,000 newly issued shares of common stock sold by the Company (including 3,150,000 shares of common stock sold pursuant to the underwriters’ option to purchase additional shares) at an offering price of $30.75 per share for which the Company received total net proceeds of approximately $717.8 million.
Authorized shares. In March 2015, the Company’s stockholders approved an increase in the number of authorized shares of the Company’s common stock from 200,000,000 shares to 400,000,000 shares.
Dividends. In 2017, the Company paid quarterly cash dividends of $0.0625 per share of common stock on March 15, 2017 and June 15, 2017 and $0.07 per share of common stock on September 15, 2017 and December 15, 2017 to stockholders of record as of the close of business on March 1, 2017, June 1, 2017, September 1, 2017 and December 1, 2017, respectively, totaling $54.4 million. In 2016, the Company paid quarterly cash dividends of $0.0625 per share of common stock on March 15, 2016, June 15, 2016 and September 15, 2016 and December 15, 2016 to stockholders of record as of the close of business on March 7, 2016, June 1, 2016, September 1, 2016 and December 1, 2016, respectively, totaling $50.1 million.
Note 5—Income Taxes
The sources of income before income taxes were as follows (in thousands):
65
|
|
|
Year Ended December 31, |
|
|||||||||
|
|
|
2017 |
|
|
2016 |
|
|
2015 |
|
|||
|
U.S. |
|
$ |
153,735 |
|
|
$ |
68,222 |
|
|
$ |
15,897 |
|
|
Foreign |
|
|
128,895 |
|
|
|
95,394 |
|
|
|
44,945 |
|
|
Income before income taxes |
|
$ |
282,630 |
|
|
$ |
163,616 |
|
|
$ |
60,842 |
|
The income tax (benefit) provision consists of the following (in thousands):
|
|
|
Year Ended December 31, |
|
|||||||||
|
|
|
2017 |
|
|
2016 |
|
|
2015 |
|
|||
|
Current: |
|
|
|
|
|
|
|
|
|
|
|
|
|
Federal |
|
$ |
81,116 |
|
|
$ |
47,588 |
|
|
$ |
36,345 |
|
|
Foreign |
|
|
21,343 |
|
|
|
18,953 |
|
|
|
15,204 |
|
|
State |
|
|
3,319 |
|
|
|
13,915 |
|
|
|
6,237 |
|
|
Total |
|
|
105,778 |
|
|
|
80,456 |
|
|
|
57,786 |
|
|
Deferred: |
|
|
|
|
|
|
|
|
|
|
|
|
|
Federal |
|
|
(144,719 |
) |
|
|
(38,571 |
) |
|
|
(25,083 |
) |
|
Foreign |
|
|
(2,820 |
) |
|
|
(4,148 |
) |
|
|
(9,367 |
) |
|
State |
|
|
(4,473 |
) |
|
|
(5,117 |
) |
|
|
(5,356 |
) |
|
Total |
|
|
(152,012 |
) |
|
|
(47,836 |
) |
|
|
(39,806 |
) |
|
Total |
|
$ |
(46,234 |
) |
|
$ |
32,620 |
|
|
$ |
17,980 |
|
The reconciliation between the expected tax expense and the actual tax (benefit) provision is computed by applying the U.S. federal corporate income tax rate of 35% to income before income taxes as follows (in thousands):
|
|
|
Year Ended December 31, |
|
|||||||||
|
|
|
2017 |
|
|
2016 |
|
|
2015 |
|
|||
|
Computed “expected” tax expense |
|
$ |
98,921 |
|
|
$ |
57,265 |
|
|
$ |
21,295 |
|
|
(Decrease) increase in income tax expense resulting from: |
|
|
|
|
|
|
|
|
|
|
|
|
|
State income taxes (net of federal income tax benefit) |
|
|
7,457 |
|
|
|
5,674 |
|
|
|
2,656 |
|
|
Foreign operations |
|
|
(36,186 |
) |
|
|
(33,614 |
) |
|
|
(11,281 |
) |
|
Enacted tax law changes |
|
|
(87,960 |
) |
|
|
— |
|
|
|
(1,021 |
) |
|
Excess tax benefits on stock-based compensation |
|
|
(13,637 |
) |
|
|
— |
|
|
|
— |
|
|
Effect of valuation allowance |
|
|
(3,332 |
) |
|
|
2,076 |
|
|
|
3,242 |
|
|
Uncertain tax positions |
|
|
(8,153 |
) |
|
|
6,515 |
|
|
|
3,903 |
|
|
Tax credits |
|
|
(644 |
) |
|
|
(3,748 |
) |
|
|
(3,493 |
) |
|
Non-deductible transaction costs |
|
|
— |
|
|
|
— |
|
|
|
2,354 |
|
|
Other |
|
|
(2,700 |
) |
|
|
(1,548 |
) |
|
|
325 |
|
|
(Benefit) provision for income taxes |
|
$ |
(46,234 |
) |
|
$ |
32,620 |
|
|
$ |
17,980 |
|
On December 22, 2017, the Tax Act was enacted and introduces significant changes to U.S. federal income tax law. The Tax Act, among other things, reduces the U.S. corporate income tax rate from 35% to 21% beginning in 2018, creates a new tax on GILTI and a BEAT, eliminates certain deductions, potentially limits deductions for interest expense and executive compensation, and imposes a mandatory one-time transition tax on the deemed repatriation of cumulative foreign earnings as of December 31, 2017. In accordance with SAB 118, the Company has made reasonable estimates of the effects of the Tax Act, including any state tax impacts of the Tax Act, and has recorded provisional amounts in the Company’s consolidated financial statements as of December 31, 2017. The Company recorded a provisional tax benefit for the impact of the Tax Act of approximately $88.0 million, which is primarily comprised of an income tax benefit of $121.6 million related to the remeasurement of federal net deferred tax assets and liabilities and an income tax expense of $33.6 million related to the mandatory one-time tax on the accumulated earnings of the Company’s foreign subsidiaries, which the Company plans to pay in installments over the allowable eight years. The final impact on the Company from the Tax Act may differ from the aforementioned reasonable estimate due to the complexity of the new legislation. Such differences could be material, due to, among other things, changes in interpretations of the Tax Act, future legislative action to address questions that arise because of the Tax Act, changes in accounting standards for income taxes or related interpretations in response to the Tax Act, or any updates or changes to estimates the Company has utilized to calculate the reasonable estimates. Pursuant to SAB 118, the
66
Company is allowed a measurement period of up to one year after the enactment date of the Tax Act to finalize the accounting of the related tax impacts. The Company will continue to calculate the impact of the Tax Act and will record any resulting tax adjustments through the provision for income taxes in the period in which the adjustments are made.
The components of deferred income taxes at December 31, 2017 and 2016 are as follows (in thousands):
|
|
|
2017 |
|
|
2016 |
|
||||||||||
|
|
|
Deferred |
|
|
Deferred |
|
|
Deferred |
|
|
Deferred |
|
||||
|
|
|
Tax |
|
|
Tax |
|
|
Tax |
|
|
Tax |
|
||||
|
|
|
Assets |
|
|
Liabilities |
|
|
Assets |
|
|
Liabilities |
|
||||
|
Tax credit carryforwards |
|
$ |
26,271 |
|
|
$ |
— |
|
|
$ |
21,905 |
|
|
$ |
— |
|
|
Net operating loss carryforwards |
|
|
24,158 |
|
|
|
— |
|
|
|
34,666 |
|
|
|
— |
|
|
Deferred compensation |
|
|
22,457 |
|
|
|
— |
|
|
|
26,196 |
|
|
|
— |
|
|
Accrued expenses |
|
|
13,340 |
|
|
|
— |
|
|
|
8,478 |
|
|
|
— |
|
|
Other |
|
|
936 |
|
|
|
— |
|
|
|
1,699 |
|
|
|
— |
|
|
Impaired investment interest |
|
|
568 |
|
|
|
— |
|
|
|
810 |
|
|
|
— |
|
|
Customer relationships |
|
|
— |
|
|
|
220,780 |
|
|
|
— |
|
|
|
351,448 |
|
|
Other intangible assets |
|
|
— |
|
|
|
53,716 |
|
|
|
— |
|
|
|
38,728 |
|
|
Acquired technology |
|
|
— |
|
|
|
53,255 |
|
|
|
— |
|
|
|
100,691 |
|
|
Unremitted foreign earnings |
|
|
— |
|
|
|
7,192 |
|
|
|
— |
|
|
|
6,111 |
|
|
Trade names |
|
|
— |
|
|
|
6,299 |
|
|
|
— |
|
|
|
10,404 |
|
|
Property and equipment |
|
|
— |
|
|
|
6,268 |
|
|
|
— |
|
|
|
2,989 |
|
|
Deferred revenue |
|
|
— |
|
|
|
247 |
|
|
|
— |
|
|
|
3,166 |
|
|
Total |
|
|
87,730 |
|
|
|
347,757 |
|
|
|
93,754 |
|
|
|
513,537 |
|
|
Valuation allowance |
|
|
(21,106 |
) |
|
|
— |
|
|
|
(31,362 |
) |
|
|
— |
|
|
Total |
|
$ |
66,624 |
|
|
$ |
347,757 |
|
|
$ |
62,392 |
|
|
$ |
513,537 |
|
At December 31, 2017 and 2016, the Company had accrued a deferred income tax liability for foreign withholding taxes of $7.2 million and $6.1 million, respectively, on unremitted earnings of its Canadian subsidiary. The Company recorded an income tax expense of $33.6 million related to the one-time transition tax on the deemed repatriation of its cumulative foreign earnings as of December 31, 2017. While no incremental U.S. federal taxes would be imposed on the actual distribution of those earnings as a result of the Tax Act, the Company had not accrued any deferred income taxes for withholding, foreign local or U.S. state income taxes on the unremitted earnings of its other foreign subsidiaries as those earnings are permanently reinvested.
At December 31, 2017, the Company had domestic state net operating loss carryforwards of $29.7 million, which will begin to expire in 2020. At December 31, 2017, the Company had foreign net operating loss carryforwards of $85.8 million, of which $85.6 million can be carried forward indefinitely. The remaining $0.2 million will begin to expire in 2018.
At December 31, 2017, the Company had tax credit carryforwards of $26.3 million relating to domestic and foreign jurisdictions, of which $23.4 million relate to domestic tax credits that are expected to be utilized before they begin to expire in 2018, $1.6 million relate to domestic tax credits that are not expected to be utilized before they begin to expire in 2022 and $1.3 million relate to foreign jurisdictions, of which $1.2 million are minimum alternative tax credit carryforwards at the Company’s India operations that are expected to be utilized before they begin to expire in 2020.
The Company has recorded valuation allowances of $21.1 million at December 31, 2017 related to certain foreign net operating loss carryforwards and tax credit carryforwards and $31.4 million at December 31, 2016 related to certain foreign net operating loss carryforwards and tax credit carryforwards. Of the $21.1 million valuation allowance recorded at December 31, 2017, $19.4 million relates to foreign net operating losses that do not expire. The change in the valuation allowance from 2016 to 2017 is primarily due to the utilization of foreign net operating losses, against which valuation allowances were previously recorded, during 2017.
The following table summarizes the activity related to the Company’s unrecognized tax benefits for the years ended December 31, 2017 and 2016 (in thousands):
67
|
Balance at December 31, 2015 |
|
$ |
55,740 |
|
|
Increases related to current year tax positions |
|
|
7,567 |
|
|
Increases related to prior tax positions |
|
|
4,896 |
|
|
Increases related to acquired tax positions |
|
|
453 |
|
|
Lapse in statute of limitation |
|
|
(5,629 |
) |
|
Foreign exchange translation adjustment |
|
|
(39 |
) |
|
Balance at December 31, 2016 |
|
|
62,988 |
|
|
Increases related to current year tax positions |
|
|
7,576 |
|
|
Decreases related to prior tax positions |
|
|
(4,758 |
) |
|
Settlements |
|
|
(6,012 |
) |
|
Lapse in statute of limitation |
|
|
(2,809 |
) |
|
Foreign exchange translation adjustment |
|
|
561 |
|
|
Balance at December 31, 2017 |
|
$ |
57,546 |
|
The Company accrued potential penalties and interest on the unrecognized tax benefits of $0.5 million and $(0.3) million during 2017 and 2016, respectively, and has recorded a total liability for potential penalties and interest, including penalties and interest related to acquired unrecognized tax benefits, of $3.6 million and $3.1 million at December 31, 2017 and 2016, respectively. The Company’s unrecognized tax benefits increased from 2015 to 2016 due to increases related to current and prior tax positions, offset partially by a lapse in the statute of limitations for certain domestic tax filings. The Company’s unrecognized tax benefits decreased from 2016 to 2017 due to settlements with federal and state tax authorities, a lapse in the statute of limitations for certain domestic tax filings and decreases in prior tax positions, offset partially by increased related to current tax positions. The Company believes it is reasonably possible that the amount of unrecognized tax benefits could decrease by $6.2 million due to the closure of tax statutes within the next 12 months. The Company’s unrecognized tax benefits as of December 31, 2017 relate to domestic and foreign taxing jurisdictions and are recorded in other long-term liabilities on the Company’s Consolidated Balance Sheet at December 31, 2017.
The Company is subject to examination by tax authorities throughout the world, including such major jurisdictions as the U.S., Canada, United Kingdom, India, California, Connecticut and New York. In these major jurisdictions, the Company is no longer subject to examination by tax authorities prior to tax years ending 2010, 2013, 2014, 2015, 2012, 2012 and 2011, respectively. The Company’s U.S. federal income tax returns are currently under audit for the tax periods ended December 31, 2010 through 2012 and for the tax period ending December 31, 2015. The Company’s California state income tax returns are currently under audit for the tax periods ended December 31, 2012 through 2015. The Company’s United Kingdom tax returns are currently under audit for the tax periods ending December 31, 2014 through 2015. The Company’s New York state income tax returns are currently under audit for the tax periods ended December 31, 2012 through 2014.
Note 6—Debt
At December 31, 2017 and 2016, debt consisted of the following (in thousands):
|
|
|
December 31, |
|
|||||
|
|
|
2017 |
|
|
2016 |
|
||
|
Senior secured credit facilities, weighted-average interest rate of 3.75% and 3.94%, respectively |
|
$ |
1,492,175 |
|
|
$ |
1,865,625 |
|
|
5.875% senior notes due 2023 |
|
|
600,000 |
|
|
|
600,000 |
|
|
Senior secured credit facilities revolving portion, weighted-average interest rate of 3.50% |
|
|
— |
|
|
|
94,000 |
|
|
Unamortized original issue discount and debt issuance costs |
|
|
(46,980 |
) |
|
|
(58,495 |
) |
|
|
|
|
2,045,195 |
|
|
|
2,501,130 |
|
|
Less current portion of long-term debt |
|
|
37,863 |
|
|
|
126,144 |
|
|
Long-term debt |
|
$ |
2,007,332 |
|
|
$ |
2,374,986 |
|
Senior Secured Credit Facilities
On July 8, 2015, in connection with its acquisition of Advent Software, Inc. (“Advent”), the Company entered into a credit agreement with SS&C, SS&C European Holdings S.A.R.L., an indirect wholly-owned subsidiary of SS&C (“SS&C Sarl”) and SS&C Technologies Holdings Europe S.A.R.L., an indirect wholly-owned subsidiary of SS&C (“SS&C Tech Sarl”) as the borrowers
68
(“Credit Agreement”). The Credit Agreement has four tranches of term loans (together the “Term Loans”): (i) a $98 million term A-1 facility with a five year term for borrowings by SS&C Sarl (“Term A-1 Loan”); (ii) a $152 million term A-2 facility with a five year term for borrowings by SS&C Tech Sarl (“Term A-2 Loan”); (iii) a $1.82 billion term B-1 facility with a seven year term for borrowings by SS&C (“Term B-1 Loan”); and (iv) a $410 million term B-2 facility with a seven year term for borrowings by SS&C Sarl (“Term B-2 Loan”).
In addition, the Credit Agreement has a revolving credit facility with a five year term available for borrowings by SS&C with $150 million in available commitments (“Revolving Credit Facility”), of which $149.1 million was available as of December 31, 2017. The Revolving Credit Facility had $94.0 million drawn on it as of December 31, 2016. The Revolving Credit Facility also contains a $25 million letter of credit sub-facility, of which $0.9 million and $0.6 million was drawn as of December 31, 2017 and 2016, respectively.
On March 2, 2017, the Company entered into an amendment (the “Amendment”) to the Company’s Credit Agreement (“Amended Senior Secured Credit Agreement”). Pursuant to the Amendment, the highest (non-default) interest rate margin applicable to Term Loan A was reduced from LIBOR plus 2.75% to LIBOR plus 1.75%, and the highest (non-default) interest rate margin applicable to Term Loan B was reduced from LIBOR plus 3.25% to LIBOR plus 2.25%. The LIBOR “floor” was also amended for the Term Loan A and the Term Loan B to be 0%. No changes were made to the financial covenants, outstanding principal amounts or the scheduled amortization.
The Amendment was evaluated in accordance with FASB Accounting Standards Codification 470-50, Debt-Modifications and
Extinguishments, for modification and extinguishment accounting. The Company accounted for the debt re-pricing as a debt modification with respect to amounts that remained obligations of the same lender in the syndicate with minor changes in cash flows and as a debt extinguishment with respect to amounts that were obligations of lenders that exited the syndicate or remained in the syndicate but experienced a change in cash flows of greater than 10%.
The Company is required to make scheduled quarterly payments of approximately 0.25% of the remaining principal amount of the Term B-1 Loan and Term B-2 Loan, with the balance due and payable on the seventh anniversary of its incurrence. The Company is required to make scheduled quarterly payments of 1.25% of the original principal amount of the Term A-1 Loan and Term A-2 Loan until September 30, 2017 and quarterly payments of 2.50% of the original principal amount of the Term A-1 Loan and Term A-2 Loan from December 31, 2017 until June 30, 2020 with the balance due and payable on the fifth anniversary of the incurrence thereof. No amortization is required under the Revolving Credit Facility.
The Company’s obligations under the Term Loans are guaranteed by (i) Holdings and each of its existing and future U.S. wholly-owned restricted subsidiaries, in the case of the Term B-1 Loan and the Revolving Credit Facility and (ii) Holdings, SS&C and each of its existing and future wholly-owned restricted subsidiaries, in the case of the Term A-1 Loan, the Term A-2 Loan and the Term B-2 Loan.
The obligations of the U.S. loan parties under the Amended Senior Secured Credit Agreement are secured by substantially all of the assets of such persons (subject to customary exceptions and limitations), including a pledge of all of the capital stock of substantially all of the U.S. wholly-owned restricted subsidiaries of such persons (with customary exceptions and limitations) and 65% of the capital stock of certain foreign restricted subsidiaries of such persons (with customary exceptions and limitations). All obligations of the non-U.S. loan parties under the Amended Senior Secured Credit Agreement are secured by substantially all of Holdings’ and the other guarantors’ assets (subject to customary exceptions and limitations), including a pledge of all of the capital stock of substantially all of Holdings’ wholly-owned restricted subsidiaries (with customary exceptions and limitations).
The Amended Senior Secured Credit Agreement includes negative covenants that, among other things and subject to certain thresholds and exceptions, limit the Company’s ability and the ability of its restricted subsidiaries to incur debt or liens, make investments (including in the form of loans and acquisitions), merge, liquidate or dissolve, sell property and assets, including capital stock of its subsidiaries, pay dividends on its capital stock or redeem, repurchase or retire its capital stock, alter the business the Company conducts, amend, prepay, redeem or purchase subordinated debt, or engage in transactions with its affiliates. The Amended Senior Secured Credit Agreement also contains customary representations and warranties, affirmative covenants and events of default, subject to customary thresholds and exceptions. In addition, the Amended Senior Secured Credit Agreement contains a financial covenant for the benefit of the Revolving Credit Facility as well as the Term A-1 Loan and the Term A-2 Loan, requiring the Company to maintain a consolidated net senior secured leverage ratio. In addition, under the Amended Senior Secured Credit Agreement, certain defaults under agreements governing other material indebtedness could result in an event of default under the Amended Senior Secured Credit Agreement, in which case the lenders could elect to accelerate payments under the Amended Senior
69
Secured Credit Agreement and terminate any commitments they have to provide future borrowings. As of December 31, 2017, the Company was in compliance with the financial and non-financial covenants.
Senior Notes
On July 8, 2015, in connection with the acquisition of Advent, the Company issued $600.0 million aggregate principal amount of 5.875% Senior Notes due 2023 (“Senior Notes”). The Senior Notes are guaranteed by SS&C and each of the Company’s wholly-owned domestic subsidiaries that borrows or guarantees obligations under the Amended Senior Secured Credit Agreement. The guarantees are full and unconditional and joint and several. The Senior Notes are unsecured senior obligations that are equal in right of payments to all existing and future senior debt, including the Amended Senior Secured Credit Agreement.
On April 20, 2016, the Company commenced an offer to exchange for the Senior Notes, new notes identical in all material respects to the Senior Notes, except that the new notes have been registered under the Securities Act of 1933. The exchange offer expired on May 18, 2016 and 100% of the Senior Notes were exchanged for the new notes.
At any time after July 15, 2018, the Company may redeem some or all of the Senior Notes, in whole or in part, at the redemption prices set forth in the indenture governing the Senior Notes plus accrued and unpaid interest to the redemption date. At any time on or before July 15, 2018, the Company may redeem all or any portion of the notes at 100% of their principal amount, plus a “make whole” premium calculated pursuant to the indenture governing the Senior Notes, plus accrued and unpaid interest to, but excluding, the redemption date. In addition, prior to July 15, 2018, the Company may redeem up to 35% of the aggregate principal amount of the Senior Notes at a redemption price equal to 105.875% of the principal amount thereof, plus accrued and unpaid interest to the redemption date, with the net proceeds of one or more equity offerings.
The indenture governing the Senior Notes contains a number of covenants that restrict, subject to certain thresholds and exceptions, the Company’s ability and the ability of its restricted subsidiaries to incur debt or liens, make certain investments, pay dividends, repurchase or redeem subordinated debt, dispose of certain assets, engage in mergers or acquisitions or engage in transactions with its affiliates. Any event of default under the Amended Senior Secured Credit Agreement that leads to an acceleration of those amounts due also results in a default under the indenture governing the Senior Notes.
As of December 31, 2017, there were $600.0 million in principal amount of Senior Notes outstanding.
Debt issuance costs
In connection with the Amended Senior Secured Credit Agreement and the Senior Notes, the Company capitalized an aggregate of $45.8 million in financing costs. Capitalized financing costs of $8.3 million, $8.5 million and $6.4 million were amortized to interest expense in the years ended December 31, 2017, 2016 and 2015, respectively, and the Company amortized to interest expense $2.3 million, $2.2 million and $1.8 million of the original issue discount associated with the Amended Senior Secured Credit Agreement and Prior Facility for the years ended December 31, 2017, 2016 and 2015, respectively. The unamortized balance of capitalized financing costs is included in long-term debt in the Company’s Consolidated Balance Sheets.
Loss on extinguishment of debt
The Company recorded a $2.3 million loss on extinguishment of debt in 2017 in connection with the Amendment. The loss on early extinguishment of debt includes the write-off of a portion of the unamortized capitalized financing fees related to the Credit Agreement for amounts accounted for as a debt extinguishment, as well as new financing fees related to the Amendment for amounts accounted for as a debt modification. The Company recorded a $30.4 million loss on extinguishment of debt in 2015 in connection with the repayment and termination of its Prior Facility. The loss on early extinguishment of debt includes the write-off of a portion of the unamortized capitalized financing costs and the unamortized original issue discounts related to the Prior Facility for amounts accounted for as a debt extinguishment, as well as a portion of the financing costs related to the Credit Agreement for amounts accounted for as a debt modification.
Future maturities of debt
At December 31, 2017, annual maturities of long-term debt during the next five years and thereafter are as follows (in thousands):
70
|
|
|
|
|
|
|
2018 |
|
$ |
37,863 |
|
|
2019 |
|
|
37,863 |
|
|
2020 |
|
|
181,613 |
|
|
2021 |
|
|
12,863 |
|
|
2022 and thereafter |
|
|
1,821,973 |
|
|
Total |
|
$ |
2,092,175 |
|
Note 7—Fair Value Measurements
Fair value is defined as the exchange price that would be received for an asset or paid to transfer a liability (an exit price) in the principal or most advantageous market for the asset or liability in an orderly transaction between market participants at the measurement date.
The authoritative guidance relating to fair value measurements and disclosure establishes a valuation hierarchy for disclosure of the inputs to the valuations used to measure fair value. This hierarchy prioritizes the inputs into three broad levels as follows.
|
|
● |
Level 1 inputs are quoted prices (unadjusted) in active markets for identical assets or liabilities. |
|
|
● |
Level 2 inputs are quoted prices for similar assets and liabilities in active markets, quoted prices for identical or similar assets in markets that are not active, inputs other than quoted prices that are observable for the asset or liability, including interest rates, yield curves and credit risks, or inputs that are derived principally from or corroborated by observable market data through correlation. |
|
|
● |
Level 3 inputs are unobservable inputs based on the Company’s own assumptions used to measure assets and liabilities at fair value. |
A financial asset’s or liability’s classification within the hierarchy is determined based on the lowest level input that is significant to the fair value measurement.
As of December 31, 2017 and 2016, the Company did not have any significant nonfinancial assets and nonfinancial liabilities that are measured at fair value on a non-recurring basis.
Recurring Fair Value Measurements
The Company did not have any material financial assets or liabilities that were measured at fair value as of December 31, 2017 and 2016.
Fair value of debt
The carrying amounts and fair values of financial instruments are as follows (in thousands):
|
|
|
December 31, 2017 |
|
|
December 31, 2016 |
|
||||||||||
|
|
|
Carrying |
|
|
Fair |
|
|
Carrying |
|
|
Fair |
|
||||
|
|
|
Amount |
|
|
Value |
|
|
Amount |
|
|
Value |
|
||||
|
Financial liabilities: |
|
|
|
|
|
|
|
|
|
|
|
|
|
|
|
|
|
Senior secured credit facilities |
|
$ |
1,492,175 |
|
|
$ |
1,500,761 |
|
|
$ |
1,865,625 |
|
|
$ |
1,887,043 |
|
|
5.875% senior notes due 2023 |
|
|
600,000 |
|
|
|
631,313 |
|
|
|
600,000 |
|
|
|
619,500 |
|
|
Senior secured credit facilities, revolving portion |
|
|
— |
|
|
|
— |
|
|
|
94,000 |
|
|
|
93,883 |
|
The above fair values, which are Level 2 liabilities, were computed based on comparable quoted market prices. The fair values of cash, accounts receivable, net, short-term borrowings, and accounts payable approximate the carrying amounts due to the short-term maturities of these instruments.
Note 8—Leases
The Company is obligated under noncancelable operating leases for office space and office equipment. Total rental expense was $47.4 million, $33.3 million and $24.4 million for the years ended December 31, 2017, 2016 and 2015, respectively. Future
71
minimum lease payments under the Company’s operating leases, excluding future sublease income, as of December 31, 2017, are as follows (in thousands):
|
Year Ending December 31, |
|
|
|
|
|
2018 |
|
$ |
51,705 |
|
|
2019 |
|
|
42,112 |
|
|
2020 |
|
|
39,215 |
|
|
2021 |
|
|
37,626 |
|
|
2022 and thereafter |
|
|
209,749 |
|
|
Total |
|
$ |
380,407 |
|
The Company subleases office space to other parties under noncancelable leases. The Company received rental income under these leases of $5.4 million, $1.3 million and $0.2 million for the years ended December 31, 2017, 2016 and 2015, respectively. Future minimum lease receipts under these leases as of December 31, 2017 are as follows (in thousands):
|
Year Ending December 31, |
|
|
|
|
|
2018 |
|
$ |
4,952 |
|
|
2019 |
|
|
4,555 |
|
|
2020 |
|
|
4,668 |
|
|
2021 |
|
|
3,228 |
|
|
2022 and thereafter |
|
|
5,195 |
|
|
Total |
|
$ |
22,598 |
|
Note 9—Defined Contribution Plans
The Company has a 401(k) Retirement Plan (the “401(k) Plan”) that covers substantially all domestic employees. Each employee may elect to contribute to the 401(k) Plan, through payroll deductions, up to 50% of his or her cash compensation, subject to certain limitations. The 401(k) Plan provides for a Company match of employees’ contributions in an amount equal to 50% of an employee’s contributions up to $4,000 per year. Company matching contributions are subject to a four year graduated vesting schedule. The Company offers employees a selection of various public mutual funds and several other investment options through a brokerage account but does not include Company common stock as an investment option in its 401(k) Plan.
During the years ended December 31, 2017, 2016 and 2015, the Company incurred $10.5 million, $9.2 million and $5.8 million, respectively, of matching contribution expenses related to the 401(k) Plan.
Note 10—Stock-based Compensation
In February 2016, the Company’s Board of Directors adopted the Amended and Restated 2014 Stock Incentive Plan (the “Amended 2014 Plan”), which became effective in May 2016 upon stockholder approval and which amended and restated our 2014 Stock Option Plan (the “2014 Plan”) (together with the Amended 2014 Plan, the “2014 Plans”). The Amended 2014 Plan was adopted with an initial share capacity of 24 million shares available for the grant of awards and was adopted with the intent of being the Company’s only equity plan by authorizing the issuance of full-value awards (that is, RSAs and RSUs) and by expanding the class of participants to include non-employee directors. Since the adoption of the Amended 2014 Plan, the Company has not made any grants of equity or equity-based awards under its 2008 Stock Incentive Plan or its 2006 Equity Incentive Plan.
The 2014 Plan authorizes stock options to be granted for up to 6,000,000 shares of the Company’s common stock. Under the 2014 Plan, which became effective in May 2014 upon stockholder approval, the exercise price of stock options is set on the grant date and may not be less than the fair market value per share on such date. Generally, stock options expire ten years from the date of grant. The Company has granted time-based stock options under the 2014 Plan.
In April 2008, the Company’s Board of Directors adopted, and its stockholders approved, an equity-based incentive plan (“the 2008 Plan”), which authorizes equity awards to be granted for up to 21,829,934 shares of the Company’s common stock, which is calculated based on an initial authorization of 2,833,322 shares of the Company’s common stock and an annual increase to be added on the first day of each of the Company’s fiscal years during the term of the 2008 Plan beginning in fiscal 2009 equal to the lesser of (i) 2,833,322 shares of common stock, (ii) 2% of the outstanding shares on such date or (iii) an amount determined by the Company’s Board of Directors. Under the 2008 Plan, which became effective in July 2008, the exercise price of awards is set on the grant date
72
and may not be less than the fair market value per share on such date. Generally, awards expire ten years from the date of grant. The Company has granted time-based options and RSUs under the 2008 Plan.
In August 2006, the Company’s Board of Directors adopted an equity-based incentive plan (“the 2006 Plan”), which authorizes equity awards to be granted for up to 22,347,638 shares of the Company’s common stock. Under the 2006 Plan, the exercise price of awards is set on the grant date and may not be less than the fair market value per share on such date. Generally, awards expire ten years from the date of grant. The Company has granted RSAs of its common stock and both time-based and performance-based options under the 2006 Plan.
The Company generally settles RSUs, RSAs, SARs and stock option exercises with newly issued common shares.
Restricted stock units. The Company did not grant any RSUs during the years ended December 31, 2017 and 2016. During the year ended December 31, 2015, the Company granted 20,790 RSUs under the 2008 Plan, which vest 25% on the first anniversary of the grant date and continue to vest 1/12th of the remaining balance each quarter thereafter for three years. The RSUs vest in full upon a change in control, subject to certain conditions. At December 31, 2017 and 2016, there was approximately $1.5 million and $5.7 million, respectively, of unearned non-cash stock-based compensation related to the RSUs that the Company expects to recognize as expense over a remaining period of approximately 0.8 and 1.5 years, respectively.
Restricted stock awards. The Company did not grant any RSAs during the years ended December 31, 2017 and 2016. During the year ended December 31, 2015, the Company granted 3,000 RSAs of its common stock under the 2006 Plan, which vest 25% on the first anniversary of the grant date and continue to vest 1/12th of the remaining balance each quarter thereafter for three years. The RSAs vest in full upon a change in control, subject to certain conditions. At December 31, 2017 and 2016, there was less than $0.1 million and approximately $0.2 million, respectively, of unearned non-cash stock-based compensation related to the RSAs that the Company expects to recognize as expense over a weighted average remaining period of approximately 15 months and 13 months, respectively.
Time-based options and SARs. Time-based options and SARs granted under the 2006 Plan, the 2008 Plan, the 2014 Plans generally vest 25% on the first anniversary of the grant date and 1/36th of the remaining balance each month thereafter for 36 months. All outstanding time-based options and SARs vest upon a change in control, subject to certain conditions. Time-based options and SARs granted during 2017, 2016 and 2015 have a weighted-average grant date fair value of $7.86, $6.62 and $7.29 per share, respectively, based on the Black-Scholes option pricing model. Compensation expense is recorded on a straight-line basis over the requisite service period. The fair value of time-based options and SARs vested during the years ended December 31, 2017, 2016 and 2015 was approximately $32.1 million, $41.4 million and $43.5 million, respectively. At December 31, 2017 and 2016, there was approximately $117.9 million and $74.9 million, respectively, of unearned non-cash stock-based compensation related to time-based options and SARs that the Company expects to recognize as expense over a weighted average remaining period of approximately 3.1 and 2.6 years, respectively.
For the time-based options and SARs valued using the Black-Scholes option-pricing model, the Company used the following weighted-average assumptions:
|
|
|
Time-Based awards |
|
|||||||||
|
|
|
2017 |
|
|
2016 |
|
|
2015 |
|
|||
|
Expected term to exercise (years) |
|
|
4.0 |
|
|
|
4.0 |
|
|
|
4.0 |
|
|
Expected volatility |
|
|
25.61 |
% |
|
|
27.64 |
% |
|
|
26.63 |
% |
|
Risk-free interest rate |
|
|
1.92 |
% |
|
|
1.30 |
% |
|
|
1.42 |
% |
|
Expected dividend yield |
|
|
0.73 |
% |
|
|
0.82 |
% |
|
|
0.74 |
% |
Total stock options, SARs, RSUs and RSAs. The amount of stock-based compensation expense recognized in the Company’s Consolidated Statements of Comprehensive Income (Loss) for the years ended December 31, 2017, 2016 and 2015 was as follows (in thousands):
73
|
|
Year Ended December 31, 2017 |
|
|
Year Ended December 31, 2016 |
|
|
Year Ended December 31, 2015 |
|
|||||||||||||||||||||||||||||||
|
Consolidated Statements of Comprehensive Income (Loss) Classification |
|
Options, SARs |
|
RSUs |
|
RSAs |
|
Total |
|
|
Options, SARs |
|
RSUs |
|
RSAs |
|
Total |
|
|
Options, SARs |
|
RSUs |
|
RSAs |
|
Total |
|
||||||||||||
|
Cost of software-enabled services |
|
$ |
11,139 |
|
$ |
135 |
|
$ |
23 |
|
$ |
11,297 |
|
|
$ |
10,120 |
|
$ |
127 |
|
$ |
23 |
|
$ |
10,270 |
|
|
$ |
6,460 |
|
$ |
372 |
|
$ |
17 |
|
$ |
6,849 |
|
|
Cost of maintenance and term licenses |
|
|
1,710 |
|
|
349 |
|
|
— |
|
|
2,059 |
|
|
|
1,622 |
|
|
1,073 |
|
|
— |
|
|
2,695 |
|
|
|
1,022 |
|
|
366 |
|
|
— |
|
|
1,388 |
|
|
Cost of recurring revenues |
|
|
12,849 |
|
|
484 |
|
|
23 |
|
|
13,356 |
|
|
|
11,742 |
|
|
1,200 |
|
|
23 |
|
|
12,965 |
|
|
|
7,482 |
|
|
738 |
|
|
17 |
|
|
8,237 |
|
|
Cost of professional services |
|
|
1,890 |
|
|
206 |
|
|
— |
|
|
2,096 |
|
|
|
1,859 |
|
|
385 |
|
|
— |
|
|
2,244 |
|
|
|
1,166 |
|
|
222 |
|
|
— |
|
|
1,388 |
|
|
Cost of non-recurring revenues |
|
|
1,890 |
|
|
206 |
|
|
— |
|
|
2,096 |
|
|
|
1,859 |
|
|
385 |
|
|
— |
|
|
2,244 |
|
|
|
1,166 |
|
|
222 |
|
|
— |
|
|
1,388 |
|
|
Total cost of revenues |
|
|
14,739 |
|
|
690 |
|
|
23 |
|
|
15,452 |
|
|
|
13,601 |
|
|
1,585 |
|
|
23 |
|
|
15,209 |
|
|
|
8,648 |
|
|
960 |
|
|
17 |
|
|
9,625 |
|
|
Selling and marketing |
|
|
8,456 |
|
|
1,045 |
|
|
133 |
|
|
9,634 |
|
|
|
8,860 |
|
|
2,384 |
|
|
223 |
|
|
11,467 |
|
|
|
10,637 |
|
|
3,806 |
|
|
222 |
|
|
14,665 |
|
|
Research and development |
|
|
6,212 |
|
|
1,246 |
|
|
— |
|
|
7,458 |
|
|
|
5,972 |
|
|
2,372 |
|
|
— |
|
|
8,344 |
|
|
|
5,676 |
|
|
2,912 |
|
|
— |
|
|
8,588 |
|
|
General and administrative |
|
|
8,567 |
|
|
376 |
|
|
— |
|
|
8,943 |
|
|
|
11,300 |
|
|
4,244 |
|
|
— |
|
|
15,544 |
|
|
|
8,270 |
|
|
2,931 |
|
|
— |
|
|
11,201 |
|
|
Total operating expenses |
|
|
23,235 |
|
|
2,667 |
|
|
133 |
|
|
26,035 |
|
|
|
26,132 |
|
|
9,000 |
|
|
223 |
|
|
35,355 |
|
|
|
24,583 |
|
|
9,649 |
|
|
222 |
|
|
34,454 |
|
|
Total stock-based compensation expense |
|
$ |
37,974 |
|
$ |
3,357 |
|
$ |
156 |
|
$ |
41,487 |
|
|
$ |
39,733 |
|
$ |
10,585 |
|
$ |
246 |
|
$ |
50,564 |
|
|
$ |
33,231 |
|
$ |
10,609 |
|
$ |
239 |
|
$ |
44,079 |
|
The associated future income tax benefit recognized was $10.3 million, $18.4 million and $20.7 million for the years ended December 31, 2017, 2016 and 2015, respectively.
For the year ended December 31, 2017, the amount of cash received from the exercise of stock options was $60.2 million, with an associated tax benefit from stock awards realized of $25.0 million. The intrinsic value of options and SARs exercised during the year ended December 31, 2017 was approximately $71.1 million. For the year ended December 31, 2016, the amount of cash received from the exercise of stock options was $39.2 million, with an associated tax benefit from stock awards realized of $62.1 million. The intrinsic value of options and SARs exercised during the year ended December 31, 2016 was approximately $141.2 million. For the year ended December 31, 2015, the amount of cash received from the exercise of stock options was $30.1 million, with an associated tax benefit from stock awards realized of $44.2 million. The intrinsic value of options and SARs exercised during the year ended December 31, 2015 was approximately $120.9 million.
In connection with its acquisition of Advent in July 2015, the Company assumed Advent’s outstanding unvested equity awards which were converted into 5.0 million unvested stock options and SARs and 1.3 million unvested RSUs to receive Holdings common stock. All other terms and conditions of the awards remained unchanged. During the year ended December 31, 2015, the Company recognized stock-based compensation expense of $26.3 million related to these assumed awards, of which $11.5 million related to one-time charges for the accelerated vesting of certain awards.
The following table summarizes stock option and SAR activity as of and for the years ended December 31, 2017, 2016 and 2015:
|
|
|
|
|
|
|
Weighted |
|
|
|
|
|
|
|
|
|
Average |
|
|
|
|
|
Shares |
|
|
Exercise Price |
|
||
|
Outstanding at December 31, 2014 |
|
|
23,441,296 |
|
|
$ |
13.12 |
|
|
Equity awards assumed from Advent |
|
|
4,961,906 |
|
|
$ |
25.14 |
|
|
Granted (1) |
|
|
7,636,590 |
|
|
$ |
33.96 |
|
|
Cancelled/forfeited |
|
|
(1,261,688 |
) |
|
$ |
25.25 |
|
|
Exercised |
|
|
(4,499,740 |
) |
|
$ |
7.73 |
|
|
Outstanding at December 31, 2015 |
|
|
30,278,364 |
|
|
$ |
20.64 |
|
|
Granted (2) |
|
|
2,386,300 |
|
|
$ |
30.39 |
|
|
Cancelled/forfeited |
|
|
(1,621,260 |
) |
|
$ |
31.15 |
|
|
Exercised |
|
|
(6,015,304 |
) |
|
$ |
7.53 |
|
|
Outstanding at December 31, 2016 |
|
|
25,028,100 |
|
|
$ |
24.04 |
|
|
Granted (3) |
|
|
11,462,223 |
|
|
$ |
36.63 |
|
|
Cancelled/forfeited |
|
|
(1,358,711 |
) |
|
$ |
31.59 |
|
|
Exercised |
|
|
(3,792,097 |
) |
|
$ |
19.08 |
|
|
Outstanding at December 31, 2017 |
|
|
31,339,515 |
|
|
$ |
28.92 |
|
|
(1) |
Of the grants during 2015, 1,030,000 were granted under the 2014 Plan, 5,479,690 were granted under the 2008 Plan and 1,126,900 were granted under the 2006 Plan. |
74
|
(2) |
Of the grants during 2016, 950,000 were granted under the Amended 2014 Plan, 1,436,300 were granted under the 2008 Plan. |
|
(3) |
All of the grants during 2017 were granted under the Amended 2014 Plan. |
The following table summarizes RSU activity as of and for the years ended December 31, 2017, 2016 and 2015:
|
|
|
|
|
|
|
Weighted |
|
|
|
|
|
|
|
|
|
Average |
|
|
|
|
|
|
|
|
|
Grant Date |
|
|
|
|
|
Shares |
|
|
Fair Value |
|
||
|
Outstanding at January 1, 2015 |
|
|
— |
|
|
$ |
- |
|
|
Equity awards assumed from Advent |
|
|
1,320,034 |
|
|
$ |
30.89 |
|
|
Granted |
|
|
20,790 |
|
|
$ |
36.82 |
|
|
Cancelled/forfeited |
|
|
(138,388 |
) |
|
$ |
30.89 |
|
|
Vested |
|
|
(244,984 |
) |
|
$ |
30.88 |
|
|
Outstanding at December 31, 2015 |
|
|
957,452 |
|
|
$ |
31.01 |
|
|
Granted |
|
|
- |
|
|
$ |
- |
|
|
Cancelled/forfeited |
|
|
(72,584 |
) |
|
$ |
31.22 |
|
|
Vested |
|
|
(527,576 |
) |
|
$ |
30.95 |
|
|
Outstanding at December 31, 2016 |
|
|
357,292 |
|
|
$ |
31.06 |
|
|
Granted |
|
|
- |
|
|
$ |
- |
|
|
Cancelled/forfeited |
|
|
(25,786 |
) |
|
$ |
31.36 |
|
|
Vested |
|
|
(148,430 |
) |
|
$ |
31.03 |
|
|
Outstanding at December 31, 2017 |
|
|
183,076 |
|
|
$ |
31.04 |
|
The following table summarizes information about vested stock options and SARs outstanding that are currently exercisable and stock options and SARs outstanding that are expected to vest at December 31, 2017:
|
Outstanding, Vested Stock Options and SARs Currently Exercisable |
|
|
Outstanding Stock Options and SARs Expected to Vest |
|
||||||||||||||||||||||||||
|
|
|
|
|
|
|
|
|
|
|
|
|
Weighted |
|
|
|
|
|
|
|
|
|
|
|
|
|
|
Weighted |
|
||
|
|
|
|
|
Weighted |
|
|
|
|
|
|
Average |
|
|
|
|
|
|
Weighted |
|
|
|
|
|
|
Average |
|
||||
|
|
|
|
|
Average |
|
|
Aggregate |
|
|
Remaining |
|
|
|
|
|
|
Average |
|
|
Aggregate |
|
|
Remaining |
|
||||||
|
|
|
|
|
Exercise |
|
|
Intrinsic |
|
|
Contractual |
|
|
|
|
|
|
Exercise |
|
|
Intrinsic |
|
|
Contractual |
|
||||||
|
Shares |
|
|
Price |
|
|
Value |
|
|
Term |
|
|
Shares |
|
|
Price |
|
|
Value |
|
|
Term |
|
||||||||
|
|
|
|
|
|
|
|
|
(In thousands) |
|
|
(Years) |
|
|
|
|
|
|
|
|
|
|
(In thousands) |
|
|
(Years) |
|
||||
|
|
14,567,748 |
|
|
$ |
21.82 |
|
|
$ |
271,861 |
|
|
|
6.04 |
|
|
|
31,339,515 |
|
|
$ |
28.92 |
|
|
$ |
362,466 |
|
|
|
7.62 |
|
Note 11—Acquisitions
2017 Acquisitions
CommonWealth Fund Services Ltd.
On October 13, 2017, the Company purchased all of the outstanding stock of CommonWealth Fund Services Ltd. ("CommonWealth") for approximately $16.4 million, plus the costs of effecting the transaction and the assumption of certain liabilities. CommonWealth provides a full range of administration services to hedge funds, private equity funds, real estate funds, fund of funds, family offices and other institutions.
The net assets and results of operations of CommonWealth have been included in the Company’s Consolidated Financial Statements from October 13, 2017. The fair value of the intangible assets, consisting of customer relationships and trade names, was determined using the income approach. Specifically, the excess earnings method was utilized for the customer relationships and the relief-from-royalty method was utilized for the trade name. The intangible assets are amortized each year based on the ratio that the projected cash flows for the intangible assets bear to the total of current and expected future cash flows for the intangible assets. The customer relationships are being amortized over approximately fifteen years and the trade name is being amortized over approximately two years, in each case the estimated lives of the assets. The remainder of the purchase price was allocated to goodwill and is not tax deductible.
75
There are $1.2 million in revenues from CommonWealth’s operations included in the Consolidated Statement of Comprehensive Income (Loss) for the year ended December 31, 2017.
2016 Acquisitions
Conifer Financial Services LLC
On December 15, 2016, the Company purchased all of the outstanding stock of Conifer Financial Services LLC ("Conifer") for approximately $86.5 million, plus the costs of effecting the transaction and the assumption of certain liabilities. Conifer provides independent asset services to pensions, endowments, foundations, family offices, registered investment advisers, traditional asset managers, private equity and hedge funds.
The net assets and results of operations of Conifer have been included in the Company’s Consolidated Financial Statements from December 15, 2016. The fair value of the intangible assets, consisting of customer relationships, was determined using the income approach. Specifically, the excess earnings method was utilized for the customer relationships. The intangible assets are amortized each year based on the ratio that the projected cash flows for the intangible assets bear to the total of current and expected future cash flows for the intangible assets. The customer relationships are being amortized over approximately fifteen years, the estimated life of the assets. The remainder of the purchase price was allocated to goodwill and is tax deductible.
Wells Fargo's Global Fund Services Business
On December 1, 2016, the Company purchased all of the outstanding stock of Wells Fargo's Global Fund Services business ("GFS") for approximately $73.0 million, plus the costs of effecting the transaction and the assumption of certain liabilities. GFS is a leading provider of comprehensive administration, middle-office, operations, and cash/collateral management services.
The net assets and results of operations of GFS have been included in the Company’s Consolidated Financial Statements from December 1, 2016. The fair value of the intangible assets, consisting of customer relationships and completed technology, was determined using the income approach and cost savings method, respectively. Specifically, the excess earnings method was utilized for the customer relationships, and the cost savings method was utilized for the completed technology. The customer relationships are amortized each year based on the ratio that the projected cash flows for the intangible assets bear to the total of current and expected future cash flows for the intangible assets. Completed technology is amortized based on a straight-line basis. The customer relationships are amortized over approximately fourteen years and the completed technology is amortized over approximately two years, in each case the estimated lives of the assets. The remainder of the purchase price was allocated to goodwill and is tax deductible.
Citigroup’s Alternative Investor Services Business
On March 11, 2016, the Company purchased all of the outstanding stock of Citigroup’s Alternative Investor Services business, which includes Hedge Fund Services and Private Equity Fund Services (“Citigroup AIS”), for approximately $296.4 million, plus the costs of effecting the transaction and the assumption of certain liabilities. Citigroup AIS is a leading provider of hedge fund and private equity fund administration services.
The net assets and results of operations of Citigroup AIS have been included in the Company’s Consolidated Financial Statements from March 11, 2016. The fair value of the intangible assets, consisting of customer relationships and completed technology, was determined using the income approach and cost savings method. Specifically, the excess earnings method was utilized for the customer relationships and the cost savings method was utilized for the completed technology. The customer relationships are amortized each year based on the ratio that the projected cash flows for the intangible assets bear to the total of current and expected future cash flows for the intangible assets. Completed technology is amortized based on a straight-line basis. The customer relationships are amortized over approximately thirteen years and completed technology is amortized over approximately four years, in each case the estimated lives of the assets. The remainder of the purchase price was allocated to goodwill and is tax deductible.
The following summarizes the preliminary allocation of the purchase price for the 2017 acquisition of CommonWealth and the final allocation of the purchase price for the 2016 acquisitions of Conifer, GFS and Citigroup AIS (in thousands):
76
|
|
|
CommonWealth |
|
|
Conifer |
|
|
GFS |
|
|
Citigroup AIS |
|
||||
|
Accounts receivable |
|
$ |
871 |
|
|
$ |
2,990 |
|
|
$ |
6,118 |
|
|
$ |
58,509 |
|
|
Fixed assets |
|
|
141 |
|
|
|
2,960 |
|
|
|
356 |
|
|
|
103 |
|
|
Other assets |
|
|
176 |
|
|
|
1,243 |
|
|
|
465 |
|
|
|
1,985 |
|
|
Acquired client relationships and contracts |
|
|
6,660 |
|
|
|
40,500 |
|
|
|
37,700 |
|
|
|
124,600 |
|
|
Completed technology |
|
|
— |
|
|
|
— |
|
|
|
8,700 |
|
|
|
44,600 |
|
|
Trade names |
|
|
78 |
|
|
|
— |
|
|
|
— |
|
|
|
— |
|
|
Goodwill |
|
|
10,677 |
|
|
|
43,772 |
|
|
|
22,437 |
|
|
|
78,691 |
|
|
Deferred revenue |
|
|
— |
|
|
|
(103 |
) |
|
|
43 |
|
|
|
(3,841 |
) |
|
Deferred income taxes |
|
|
(1,822 |
) |
|
|
(3 |
) |
|
|
— |
|
|
|
— |
|
|
Other liabilities assumed |
|
|
(395 |
) |
|
|
(5,450 |
) |
|
|
(4,037 |
) |
|
|
(8,228 |
) |
|
Consideration paid, net of cash acquired |
|
$ |
16,386 |
|
|
$ |
85,909 |
|
|
$ |
71,782 |
|
|
$ |
296,419 |
|
Additionally, the Company acquired Modestspark in October 2017 for approximately $2.8 million and Salentica in October 2016 for approximately $2.0 million.
The consideration paid, net of cash acquired for Conifer and GFS includes purchase price adjustments totaling $1.8 million, which was received during the first quarter of 2017. This amount is reflected in “Cash paid for business acquisitions, net of cash acquired” for the year ended December 31, 2017 on the Company’s Consolidated Statement of Cash Flows.
The consideration paid, net of cash acquired for Citigroup AIS includes purchase price adjustments totaling $20.8 million, which was received during the third and fourth quarters of 2016. This amount is reflected in “Cash paid for business acquisitions, net of cash acquired” for the year ended December 31, 2016 on the Company’s Consolidated Statement of Cash Flows.
The fair value of acquired accounts receivable balances approximates the contractual amounts due from acquired customers, except for approximately $0.4 million and $1.7 million of contractual amounts that are not expected to be collected as of the acquisition date and that were also reserved by the companies acquired – Conifer and Citigroup AIS, respectively.
The goodwill associated with each of the transactions above is a result of expected synergies from combining the operations of businesses acquired with the Company and intangible assets that do not qualify for separate recognition, such as an assembled workforce.
The following unaudited pro forma condensed consolidated results of operations are provided for illustrative purposes only and assume that the acquisitions of CommonWealth and Modestspark occurred on January 1, 2016 and Conifer, GFS, Salentica and Citigroup AIS occurred on January 1, 2015. This unaudited pro forma information (in thousands, except per share data) should not be relied upon as being indicative of the historical results that would have been obtained if the acquisitions had actually occurred on that date, nor of the results that may be obtained in the future.
|
|
|
For the Year Ended December 31, |
|
|||||||||
|
|
|
2017 |
|
|
2016 |
|
|
2015 |
|
|||
|
Revenues |
|
$ |
1,687,328 |
|
|
$ |
1,646,064 |
|
|
$ |
1,641,100 |
|
|
Net income |
|
$ |
338,140 |
|
|
$ |
152,764 |
|
|
$ |
31,382 |
|
|
|
|
|
|
|
|
|
|
|
|
|
|
|
|
Basic EPS |
|
$ |
1.65 |
|
|
$ |
0.76 |
|
|
$ |
0.17 |
|
|
Diluted EPS |
|
$ |
1.60 |
|
|
$ |
0.74 |
|
|
$ |
0.16 |
|
|
|
|
|
|
|
|
|
|
|
|
|
|
|
|
Basic weighted average number of common shares outstanding |
|
|
204,923 |
|
|
|
200,252 |
|
|
|
182,196 |
|
|
Diluted weighted average number of common and common equivalent shares outstanding |
|
|
211,632 |
|
|
|
205,793 |
|
|
|
190,896 |
|
Note 12—Commitments and Contingencies
From time to time, the Company is subject to legal proceedings and claims. In the opinion of the Company’s management, the Company is not involved in any litigation or proceedings that would have a material adverse effect on the Company or its business.
77
Note 13—Product and Geographic Sales Information
The Company operates in one reportable segment. There were no sales to any individual clients during the periods in the three-year period ended December 31, 2017 that represented 10% or more of net sales. The Company attributes net sales to an individual country based upon location of the client.
The Company’s geographic regions consist of the United States, Canada, Americas excluding the United States and Canada, Europe and Asia Pacific and Japan. The European region includes European countries as well as the Middle East and Africa.
Revenues by geography for the years ended December 31, were (in thousands):
|
|
|
2017 |
|
|
2016 |
|
|
2015 |
|
|||
|
United States |
|
$ |
1,222,416 |
|
|
$ |
1,081,260 |
|
|
$ |
682,293 |
|
|
United Kingdom |
|
|
115,803 |
|
|
|
105,381 |
|
|
|
107,081 |
|
|
Asia-Pacific and Japan |
|
|
112,705 |
|
|
|
90,086 |
|
|
|
64,816 |
|
|
Europe, excluding United Kingdom |
|
|
102,117 |
|
|
|
101,320 |
|
|
|
68,347 |
|
|
Canada |
|
|
76,370 |
|
|
|
65,682 |
|
|
|
55,562 |
|
|
Americas, excluding United States and Canada |
|
|
45,884 |
|
|
|
37,707 |
|
|
|
22,186 |
|
|
Total |
|
$ |
1,675,295 |
|
|
$ |
1,481,436 |
|
|
$ |
1,000,285 |
|
Long-lived assets as of December 31, were (in thousands):
|
|
|
2017 |
|
|
2016 |
|
|
2015 |
|
|||
|
United States |
|
$ |
97,229 |
|
|
$ |
76,929 |
|
|
$ |
64,141 |
|
|
Canada |
|
|
7,850 |
|
|
|
6,909 |
|
|
|
5,493 |
|
|
Asia-Pacific and Japan |
|
|
6,050 |
|
|
|
6,454 |
|
|
|
5,715 |
|
|
Europe |
|
|
4,560 |
|
|
|
4,163 |
|
|
|
4,336 |
|
|
Americas, excluding United States and Canada |
|
|
386 |
|
|
|
782 |
|
|
|
1,301 |
|
|
Total |
|
$ |
116,075 |
|
|
$ |
95,237 |
|
|
$ |
80,986 |
|
Revenues by product group for the years ended December 31, were (in thousands):
|
|
|
2017 |
|
|
2016 |
|
|
2015 |
|
|||
|
Portfolio management/accounting |
|
$ |
1,546,165 |
|
|
$ |
1,347,736 |
|
|
$ |
918,888 |
|
|
Loan management/accounting |
|
|
60,824 |
|
|
|
64,267 |
|
|
|
14,205 |
|
|
Trading/treasury operations |
|
|
33,093 |
|
|
|
32,171 |
|
|
|
31,992 |
|
|
Property management |
|
|
17,218 |
|
|
|
17,833 |
|
|
|
16,176 |
|
|
Money market processing |
|
|
8,421 |
|
|
|
9,299 |
|
|
|
8,677 |
|
|
Financial modeling |
|
|
8,148 |
|
|
|
8,928 |
|
|
|
9,078 |
|
|
Training |
|
|
1,426 |
|
|
|
1,202 |
|
|
|
1,269 |
|
|
Total |
|
$ |
1,675,295 |
|
|
$ |
1,481,436 |
|
|
$ |
1,000,285 |
|
Note 14—Supplemental Guarantor Condensed Consolidating Financial Statements
On July 8, 2015, the Company issued $600.0 million aggregate principal amount of 5.875% Senior Notes due 2023. The Senior Notes are jointly and severally and fully and unconditionally guaranteed, in each case subject to certain customary release provisions, by substantially all wholly-owned domestic subsidiaries of the Company that guarantee the Company’s Amended Senior Secured Credit Agreement (collectively “Guarantors”). All of the Guarantors are 100% owned by the Company. All other subsidiaries of the Company, either direct or indirect, do not guarantee the Senior Notes (“Non-Guarantors”). The Guarantors also unconditionally guarantee the Amended Senior Secured Credit Agreement. There are no significant restrictions on the ability of the Company or any of the subsidiaries that are Guarantors to obtain funds from its subsidiaries by dividend or loan. During the three months ended March 31, 2017, the Company added certain U.S. subsidiaries as Guarantors to the Senior Notes. The condensed consolidating financial information as of December 31, 2016 and for the year ended December 31, 2016 below reflects the addition of these entities as Guarantor Subsidiaries. Condensed consolidating financial information as of December 31, 2017 and 2016 and for the years ended
78
December 31, 2017, 2016 and 2015 are presented. The condensed consolidating financial information of the Company and its subsidiaries are as follows (in thousands):
|
|
|
December 31, 2017 |
|
|||||||||||||||||
|
|
|
Parent |
|
|
Guarantor Subsidiaries |
|
|
Non-guarantor Subsidiaries |
|
|
Consolidating and Eliminating Adjustments |
|
|
Consolidated |
|
|||||
|
Cash and cash equivalents |
|
$ |
— |
|
|
$ |
21,191 |
|
|
$ |
42,866 |
|
|
$ |
— |
|
|
$ |
64,057 |
|
|
Accounts receivable, net |
|
|
— |
|
|
|
173,997 |
|
|
|
69,903 |
|
|
|
— |
|
|
|
243,900 |
|
|
Prepaid expenses and other current assets |
|
|
— |
|
|
|
19,770 |
|
|
|
18,972 |
|
|
|
— |
|
|
|
38,742 |
|
|
Prepaid income taxes |
|
|
— |
|
|
|
6,366 |
|
|
|
5,800 |
|
|
|
— |
|
|
|
12,166 |
|
|
Restricted cash |
|
|
— |
|
|
|
592 |
|
|
|
— |
|
|
|
— |
|
|
|
592 |
|
|
Net property, plant and equipment |
|
|
— |
|
|
|
60,774 |
|
|
|
40,182 |
|
|
|
— |
|
|
|
100,956 |
|
|
Investment in subsidiaries |
|
|
3,373,730 |
|
|
|
938,794 |
|
|
|
— |
|
|
|
(4,312,524 |
) |
|
|
— |
|
|
Intercompany receivables |
|
|
— |
|
|
|
199,503 |
|
|
|
74,005 |
|
|
|
(273,508 |
) |
|
|
— |
|
|
Deferred income taxes, long-term |
|
|
— |
|
|
|
— |
|
|
|
2,324 |
|
|
|
— |
|
|
|
2,324 |
|
|
Goodwill, intangible and other assets, net |
|
|
— |
|
|
|
3,871,503 |
|
|
|
1,205,276 |
|
|
|
— |
|
|
|
5,076,779 |
|
|
Total assets |
|
$ |
3,373,730 |
|
|
$ |
5,292,490 |
|
|
$ |
1,459,328 |
|
|
$ |
(4,586,032 |
) |
|
$ |
5,539,516 |
|
|
|
|
|
|
|
|
|
|
|
|
|
|
|
|
|
|
|
|
|
|
|
|
Current portion of long-term debt |
|
|
— |
|
|
|
12,626 |
|
|
|
25,237 |
|
|
|
— |
|
|
|
37,863 |
|
|
Accounts payable |
|
|
— |
|
|
|
19,223 |
|
|
|
7,864 |
|
|
|
— |
|
|
|
27,087 |
|
|
Accrued expenses |
|
|
16,157 |
|
|
|
96,540 |
|
|
|
55,381 |
|
|
|
— |
|
|
|
168,078 |
|
|
Income taxes payable |
|
|
— |
|
|
|
— |
|
|
|
6,031 |
|
|
|
— |
|
|
|
6,031 |
|
|
Deferred revenue |
|
|
— |
|
|
|
182,181 |
|
|
|
22,420 |
|
|
|
— |
|
|
|
204,601 |
|
|
Long-term debt, net of current portion |
|
|
600,000 |
|
|
|
1,197,576 |
|
|
|
209,756 |
|
|
|
— |
|
|
|
2,007,332 |
|
|
Other long-term liabilities |
|
|
— |
|
|
|
82,239 |
|
|
|
36,440 |
|
|
|
— |
|
|
|
118,679 |
|
|
Intercompany payables |
|
|
71,185 |
|
|
|
74,005 |
|
|
|
128,318 |
|
|
|
(273,508 |
) |
|
|
— |
|
|
Deferred income taxes, long-term |
|
|
— |
|
|
|
254,370 |
|
|
|
29,087 |
|
|
|
— |
|
|
|
283,457 |
|
|
Total liabilities |
|
|
687,342 |
|
|
|
1,918,760 |
|
|
|
520,534 |
|
|
|
(273,508 |
) |
|
|
2,853,128 |
|
|
Total stockholders’ equity |
|
|
2,686,388 |
|
|
|
3,373,730 |
|
|
|
938,794 |
|
|
|
(4,312,524 |
) |
|
|
2,686,388 |
|
|
Total liabilities and stockholders’ equity |
|
$ |
3,373,730 |
|
|
$ |
5,292,490 |
|
|
$ |
1,459,328 |
|
|
$ |
(4,586,032 |
) |
|
$ |
5,539,516 |
|
79
|
|
December 31, 2016 |
|
||||||||||||||||||
|
|
|
Parent |
|
|
Guarantor Subsidiaries |
|
|
Non-guarantor Subsidiaries |
|
|
Consolidating and Eliminating Adjustments |
|
|
Consolidated |
|
|||||
|
Cash and cash equivalents |
|
$ |
— |
|
|
$ |
33,723 |
|
|
$ |
83,835 |
|
|
$ |
— |
|
|
$ |
117,558 |
|
|
Accounts receivable, net |
|
|
— |
|
|
|
174,926 |
|
|
|
66,381 |
|
|
|
— |
|
|
|
241,307 |
|
|
Prepaid expenses and other current assets |
|
|
— |
|
|
|
18,129 |
|
|
|
12,990 |
|
|
|
— |
|
|
|
31,119 |
|
|
Prepaid income taxes |
|
|
— |
|
|
|
21,600 |
|
|
|
1,412 |
|
|
|
— |
|
|
|
23,012 |
|
|
Restricted cash |
|
|
— |
|
|
|
1,788 |
|
|
|
328 |
|
|
|
— |
|
|
|
2,116 |
|
|
Net property, plant and equipment |
|
|
— |
|
|
|
42,358 |
|
|
|
38,037 |
|
|
|
— |
|
|
|
80,395 |
|
|
Investment in subsidiaries |
|
|
2,910,669 |
|
|
|
767,152 |
|
|
|
— |
|
|
|
(3,677,821 |
) |
|
|
— |
|
|
Intercompany receivables |
|
|
— |
|
|
|
162,899 |
|
|
|
37,437 |
|
|
|
(200,336 |
) |
|
|
— |
|
|
Deferred income taxes, long-term |
|
|
— |
|
|
|
— |
|
|
|
2,410 |
|
|
|
— |
|
|
|
2,410 |
|
|
Goodwill, intangible and other assets, net |
|
|
— |
|
|
|
4,021,445 |
|
|
|
1,187,609 |
|
|
|
— |
|
|
|
5,209,054 |
|
|
Total assets |
|
$ |
2,910,669 |
|
|
$ |
5,244,020 |
|
|
$ |
1,430,439 |
|
|
$ |
(3,878,157 |
) |
|
$ |
5,706,971 |
|
|
|
|
|
|
|
|
|
|
|
|
|
|
|
|
|
|
|
|
|
|
|
|
Current portion of long-term debt |
|
|
— |
|
|
|
108,989 |
|
|
|
17,155 |
|
|
|
— |
|
|
|
126,144 |
|
|
Accounts payable |
|
|
— |
|
|
|
10,714 |
|
|
|
5,776 |
|
|
|
— |
|
|
|
16,490 |
|
|
Accrued expenses |
|
|
16,155 |
|
|
|
109,746 |
|
|
|
53,395 |
|
|
|
— |
|
|
|
179,296 |
|
|
Income taxes payable |
|
|
— |
|
|
|
— |
|
|
|
3,473 |
|
|
|
— |
|
|
|
3,473 |
|
|
Deferred revenue |
|
|
— |
|
|
|
212,890 |
|
|
|
22,332 |
|
|
|
— |
|
|
|
235,222 |
|
|
Long-term debt, net of current portion |
|
|
600,000 |
|
|
|
1,416,695 |
|
|
|
358,291 |
|
|
|
— |
|
|
|
2,374,986 |
|
|
Other long-term liabilities |
|
|
— |
|
|
|
29,827 |
|
|
|
29,400 |
|
|
|
— |
|
|
|
59,227 |
|
|
Intercompany payables |
|
|
35,936 |
|
|
|
37,437 |
|
|
|
126,963 |
|
|
|
(200,336 |
) |
|
|
— |
|
|
Deferred income taxes, long-term |
|
|
— |
|
|
|
407,053 |
|
|
|
46,502 |
|
|
|
— |
|
|
|
453,555 |
|
|
Total liabilities |
|
|
652,091 |
|
|
|
2,333,351 |
|
|
|
663,287 |
|
|
|
(200,336 |
) |
|
|
3,448,393 |
|
|
Total stockholders’ equity |
|
|
2,258,578 |
|
|
|
2,910,669 |
|
|
|
767,152 |
|
|
|
(3,677,821 |
) |
|
|
2,258,578 |
|
|
Total liabilities and stockholders’ equity |
|
$ |
2,910,669 |
|
|
$ |
5,244,020 |
|
|
$ |
1,430,439 |
|
|
$ |
(3,878,157 |
) |
|
$ |
5,706,971 |
|
|
|
|
Year Ended December 31, 2017 |
|
|||||||||||||||||
|
|
|
Parent |
|
|
Guarantor Subsidiaries |
|
|
Non-guarantor Subsidiaries |
|
|
Consolidating and Eliminating Adjustments |
|
|
Consolidated |
|
|||||
|
Revenues |
|
$ |
— |
|
|
$ |
1,171,163 |
|
|
$ |
505,874 |
|
|
$ |
(1,742 |
) |
|
$ |
1,675,295 |
|
|
Cost of revenues |
|
|
— |
|
|
|
590,297 |
|
|
|
297,870 |
|
|
|
(1,742 |
) |
|
|
886,425 |
|
|
Gross profit |
|
|
— |
|
|
|
580,866 |
|
|
|
208,004 |
|
|
|
— |
|
|
|
788,870 |
|
|
Operating expenses: |
|
|
|
|
|
|
|
|
|
|
|
|
|
|
|
|
|
|
|
|
|
Selling and marketing |
|
|
— |
|
|
|
87,753 |
|
|
|
30,696 |
|
|
|
— |
|
|
|
118,449 |
|
|
Research and development |
|
|
— |
|
|
|
107,618 |
|
|
|
45,716 |
|
|
|
— |
|
|
|
153,334 |
|
|
General and administrative |
|
|
— |
|
|
|
86,212 |
|
|
|
33,962 |
|
|
|
— |
|
|
|
120,174 |
|
|
Total operating expenses |
|
|
— |
|
|
|
281,583 |
|
|
|
110,374 |
|
|
|
— |
|
|
|
391,957 |
|
|
Operating income |
|
|
— |
|
|
|
299,283 |
|
|
|
97,630 |
|
|
|
— |
|
|
|
396,913 |
|
|
Interest expense, net |
|
|
(35,250 |
) |
|
|
(53,717 |
) |
|
|
(18,506 |
) |
|
|
— |
|
|
|
(107,473 |
) |
|
Other (expense) income, net |
|
|
— |
|
|
|
(83,162 |
) |
|
|
78,678 |
|
|
|
— |
|
|
|
(4,484 |
) |
|
Loss on extinguishment of debt |
|
|
— |
|
|
|
(1,743 |
) |
|
|
(583 |
) |
|
|
— |
|
|
|
(2,326 |
) |
|
Earnings from subsidiaries |
|
|
364,114 |
|
|
|
144,822 |
|
|
|
— |
|
|
|
(508,936 |
) |
|
|
— |
|
|
Income before income taxes |
|
|
328,864 |
|
|
|
305,483 |
|
|
|
157,219 |
|
|
|
(508,936 |
) |
|
|
282,630 |
|
|
(Benefit) provision for income taxes |
|
|
— |
|
|
|
(58,631 |
) |
|
|
12,397 |
|
|
|
— |
|
|
|
(46,234 |
) |
|
Net income |
|
$ |
328,864 |
|
|
$ |
364,114 |
|
|
$ |
144,822 |
|
|
$ |
(508,936 |
) |
|
$ |
328,864 |
|
|
Other comprehensive income, net of tax: |
|
|
|
|
|
|
|
|
|
|
|
|
|
|
|
|
|
|
|
|
|
Foreign currency exchange translation adjustment |
|
|
56,418 |
|
|
|
56,418 |
|
|
|
51,405 |
|
|
|
(107,823 |
) |
|
|
56,418 |
|
|
Comprehensive income |
|
$ |
385,282 |
|
|
$ |
420,532 |
|
|
$ |
196,227 |
|
|
$ |
(616,759 |
) |
|
$ |
385,282 |
|
80
|
|
Year Ended December 31, 2016 |
|
||||||||||||||||||
|
|
|
Parent |
|
|
Guarantor Subsidiaries |
|
|
Non-guarantor Subsidiaries |
|
|
Consolidating and Eliminating Adjustments |
|
|
Consolidated |
|
|||||
|
Revenues |
|
$ |
— |
|
|
$ |
1,012,587 |
|
|
$ |
470,648 |
|
|
$ |
(1,799 |
) |
|
$ |
1,481,436 |
|
|
Cost of revenues |
|
|
— |
|
|
|
526,048 |
|
|
|
276,240 |
|
|
|
(1,799 |
) |
|
|
800,489 |
|
|
Gross profit |
|
|
— |
|
|
|
486,539 |
|
|
|
194,408 |
|
|
|
— |
|
|
|
680,947 |
|
|
Operating expenses: |
|
|
|
|
|
|
|
|
|
|
|
|
|
|
|
|
|
|
|
|
|
Selling and marketing |
|
|
— |
|
|
|
88,118 |
|
|
|
28,980 |
|
|
|
— |
|
|
|
117,098 |
|
|
Research and development |
|
|
— |
|
|
|
107,664 |
|
|
|
45,025 |
|
|
|
— |
|
|
|
152,689 |
|
|
General and administrative |
|
|
— |
|
|
|
87,759 |
|
|
|
34,706 |
|
|
|
— |
|
|
|
122,465 |
|
|
Total operating expenses |
|
|
— |
|
|
|
283,541 |
|
|
|
108,711 |
|
|
|
— |
|
|
|
392,252 |
|
|
Operating income |
|
|
— |
|
|
|
202,998 |
|
|
|
85,697 |
|
|
|
— |
|
|
|
288,695 |
|
|
Interest expense, net |
|
|
(35,086 |
) |
|
|
(68,312 |
) |
|
|
(25,056 |
) |
|
|
— |
|
|
|
(128,454 |
) |
|
Other (expense) income, net |
|
|
— |
|
|
|
(63,444 |
) |
|
|
66,819 |
|
|
|
— |
|
|
|
3,375 |
|
|
Earnings from subsidiaries |
|
|
166,082 |
|
|
|
105,441 |
|
|
|
— |
|
|
|
(271,523 |
) |
|
|
— |
|
|
Income before income taxes |
|
|
130,996 |
|
|
|
176,683 |
|
|
|
127,460 |
|
|
|
(271,523 |
) |
|
|
163,616 |
|
|
Provision for income taxes |
|
|
— |
|
|
|
10,601 |
|
|
|
22,019 |
|
|
|
— |
|
|
|
32,620 |
|
|
Net income |
|
$ |
130,996 |
|
|
$ |
166,082 |
|
|
$ |
105,441 |
|
|
$ |
(271,523 |
) |
|
$ |
130,996 |
|
|
Other comprehensive loss, net of tax: |
|
|
|
|
|
|
|
|
|
|
|
|
|
|
|
|
|
|
|
|
|
Foreign currency exchange translation adjustment |
|
|
(55,903 |
) |
|
|
(55,903 |
) |
|
|
(57,783 |
) |
|
|
113,686 |
|
|
|
(55,903 |
) |
|
Comprehensive income |
|
$ |
75,093 |
|
|
$ |
110,179 |
|
|
$ |
47,658 |
|
|
$ |
(157,837 |
) |
|
$ |
75,093 |
|
|
|
|
Year Ended December 31, 2015 |
|
|||||||||||||||||
|
|
|
Parent |
|
|
Guarantor Subsidiaries |
|
|
Non-guarantor Subsidiaries |
|
|
Consolidating and Eliminating Adjustments |
|
|
Consolidated |
|
|||||
|
Revenues |
|
$ |
— |
|
|
$ |
596,497 |
|
|
$ |
405,371 |
|
|
$ |
(1,583 |
) |
|
$ |
1,000,285 |
|
|
Cost of revenues |
|
|
— |
|
|
|
290,979 |
|
|
|
242,954 |
|
|
|
(1,583 |
) |
|
|
532,350 |
|
|
Gross profit |
|
|
— |
|
|
|
305,518 |
|
|
|
162,417 |
|
|
|
— |
|
|
|
467,935 |
|
|
Operating expenses: |
|
|
|
|
|
|
|
|
|
|
|
|
|
|
|
|
|
|
|
|
|
Selling and marketing |
|
|
— |
|
|
|
65,157 |
|
|
|
29,793 |
|
|
|
— |
|
|
|
94,950 |
|
|
Research and development |
|
|
— |
|
|
|
70,090 |
|
|
|
40,325 |
|
|
|
— |
|
|
|
110,415 |
|
|
General and administrative |
|
|
— |
|
|
|
74,011 |
|
|
|
23,821 |
|
|
|
— |
|
|
|
97,832 |
|
|
Total operating expenses |
|
|
— |
|
|
|
209,258 |
|
|
|
93,939 |
|
|
|
— |
|
|
|
303,197 |
|
|
Operating income |
|
|
— |
|
|
|
96,260 |
|
|
|
68,478 |
|
|
|
— |
|
|
|
164,738 |
|
|
Interest expense, net |
|
|
(17,006 |
) |
|
|
(41,432 |
) |
|
|
(18,919 |
) |
|
|
— |
|
|
|
(77,357 |
) |
|
Other (expense) income, net |
|
|
— |
|
|
|
(23,985 |
) |
|
|
27,863 |
|
|
|
— |
|
|
|
3,878 |
|
|
Loss on extinguishment of debt |
|
|
— |
|
|
|
(23,375 |
) |
|
|
(7,042 |
) |
|
|
— |
|
|
|
(30,417 |
) |
|
Earnings from subsidiaries |
|
|
59,868 |
|
|
|
62,375 |
|
|
|
— |
|
|
|
(122,243 |
) |
|
|
— |
|
|
Income before income taxes |
|
|
42,862 |
|
|
|
69,843 |
|
|
|
70,380 |
|
|
|
(122,243 |
) |
|
|
60,842 |
|
|
Provision for income taxes |
|
|
— |
|
|
|
9,975 |
|
|
|
8,005 |
|
|
|
— |
|
|
|
17,980 |
|
|
Net income |
|
$ |
42,862 |
|
|
$ |
59,868 |
|
|
$ |
62,375 |
|
|
$ |
(122,243 |
) |
|
$ |
42,862 |
|
|
Other comprehensive loss, net of tax: |
|
|
|
|
|
|
|
|
|
|
|
|
|
|
|
|
|
|
|
|
|
Foreign currency exchange translation adjustment |
|
|
(68,049 |
) |
|
|
(68,049 |
) |
|
|
(54,490 |
) |
|
|
122,539 |
|
|
|
(68,049 |
) |
|
Comprehensive (loss) income |
|
$ |
(25,187 |
) |
|
$ |
(8,181 |
) |
|
$ |
7,885 |
|
|
$ |
296 |
|
|
$ |
(25,187 |
) |
81
|
|
Year Ended December 31, 2017 |
|
||||||||||||||||||
|
|
|
Parent |
|
|
Guarantor Subsidiaries |
|
|
Non-guarantor Subsidiaries |
|
|
Consolidating and Eliminating Adjustments |
|
|
Consolidated |
|
|||||
|
Cash Flow from Operating Activities: |
|
|
|
|
|
|
|
|
|
|
|
|
|
|
|
|
|
|
|
|
|
Net income |
|
$ |
328,864 |
|
|
$ |
364,114 |
|
|
$ |
144,822 |
|
|
$ |
(508,936 |
) |
|
$ |
328,864 |
|
|
Non-cash adjustments |
|
|
— |
|
|
|
84,960 |
|
|
|
56,531 |
|
|
|
— |
|
|
|
141,491 |
|
|
Intercompany transactions |
|
|
35,250 |
|
|
|
40,933 |
|
|
|
(76,183 |
) |
|
|
— |
|
|
|
— |
|
|
Earnings from subsidiaries |
|
|
(364,114 |
) |
|
|
(144,822 |
) |
|
|
— |
|
|
|
508,936 |
|
|
|
— |
|
|
Changes in operating assets and liabilities |
|
|
— |
|
|
|
(1,866 |
) |
|
|
1,873 |
|
|
|
— |
|
|
|
7 |
|
|
Net cash provided by operating activities |
|
|
— |
|
|
|
343,319 |
|
|
|
127,043 |
|
|
|
— |
|
|
|
470,362 |
|
|
Cash Flow from Investment Activities: |
|
|
|
|
|
|
|
|
|
|
|
|
|
|
|
|
|
|
|
|
|
Additions to property and equipment |
|
|
— |
|
|
|
(25,550 |
) |
|
|
(10,020 |
) |
|
|
— |
|
|
|
(35,570 |
) |
|
Proceeds from sale of property and equipment |
|
|
— |
|
|
|
1 |
|
|
|
3 |
|
|
|
— |
|
|
|
4 |
|
|
Cash paid for business acquisitions, net of cash acquired |
|
|
— |
|
|
|
(1,031 |
) |
|
|
(16,382 |
) |
|
|
— |
|
|
|
(17,413 |
) |
|
Additions to capitalized software |
|
|
— |
|
|
|
(7,066 |
) |
|
|
(3,338 |
) |
|
|
— |
|
|
|
(10,404 |
) |
|
Net cash used in investing activities |
|
|
— |
|
|
|
(33,646 |
) |
|
|
(29,737 |
) |
|
|
— |
|
|
|
(63,383 |
) |
|
Cash Flow from Financing Activities: |
|
|
|
|
|
|
|
|
|
|
|
|
|
|
|
|
|
|
|
|
|
Cash received from debt borrowings |
|
|
— |
|
|
|
45,000 |
|
|
|
— |
|
|
|
— |
|
|
|
45,000 |
|
|
Repayments of debt |
|
|
— |
|
|
|
(369,250 |
) |
|
|
(143,200 |
) |
|
|
— |
|
|
|
(512,450 |
) |
|
Transactions involving Holding's common stock |
|
|
— |
|
|
|
1,037 |
|
|
|
— |
|
|
|
— |
|
|
|
1,037 |
|
|
Intercompany transactions |
|
|
— |
|
|
|
(188 |
) |
|
|
188 |
|
|
|
— |
|
|
|
— |
|
|
Net cash used in financing activities |
|
|
— |
|
|
|
(323,401 |
) |
|
|
(143,012 |
) |
|
|
— |
|
|
|
(466,413 |
) |
|
Effect of exchange rate changes on cash, cash equivalents and restricted cash |
|
|
— |
|
|
|
— |
|
|
|
4,409 |
|
|
|
— |
|
|
|
4,409 |
|
|
Net decrease in cash, cash equivalents and restricted cash |
|
|
— |
|
|
|
(13,728 |
) |
|
|
(41,297 |
) |
|
|
— |
|
|
|
(55,025 |
) |
|
Cash, cash equivalents and restricted cash, beginning of period |
|
|
— |
|
|
|
35,511 |
|
|
|
84,163 |
|
|
|
— |
|
|
|
119,674 |
|
|
Cash, cash equivalents and restricted cash, end of period |
|
$ |
— |
|
|
$ |
21,783 |
|
|
$ |
42,866 |
|
|
$ |
— |
|
|
$ |
64,649 |
|
82
|
|
Year Ended December 31, 2016 |
|
||||||||||||||||||
|
|
|
Parent |
|
|
Guarantor Subsidiaries |
|
|
Non-guarantor Subsidiaries |
|
|
Consolidating and Eliminating Adjustments |
|
|
Consolidated |
|
|||||
|
Cash Flow from Operating Activities: |
|
|
|
|
|
|
|
|
|
|
|
|
|
|
|
|
|
|
|
|
|
Net income |
|
$ |
130,996 |
|
|
$ |
166,082 |
|
|
$ |
105,441 |
|
|
$ |
(271,523 |
) |
|
$ |
130,996 |
|
|
Non-cash adjustments |
|
|
— |
|
|
|
135,841 |
|
|
|
63,691 |
|
|
|
— |
|
|
|
199,532 |
|
|
Intercompany transactions |
|
|
35,935 |
|
|
|
(159,874 |
) |
|
|
123,939 |
|
|
|
— |
|
|
|
— |
|
|
Earnings from subsidiaries |
|
|
(166,082 |
) |
|
|
(105,441 |
) |
|
|
— |
|
|
|
271,523 |
|
|
|
— |
|
|
Changes in operating assets and liabilities |
|
|
(849 |
) |
|
|
86,894 |
|
|
|
1,834 |
|
|
|
— |
|
|
|
87,879 |
|
|
Net cash provided by operating activities |
|
|
— |
|
|
|
123,502 |
|
|
|
294,905 |
|
|
|
— |
|
|
|
418,407 |
|
|
Cash Flow from Investment Activities: |
|
|
|
|
|
|
|
|
|
|
|
|
|
|
|
|
|
|
|
|
|
Additions to property and equipment |
|
|
— |
|
|
|
(14,655 |
) |
|
|
(13,271 |
) |
|
|
— |
|
|
|
(27,926 |
) |
|
Proceeds from sale of property and equipment |
|
|
— |
|
|
|
68 |
|
|
|
3 |
|
|
|
— |
|
|
|
71 |
|
|
Cash paid for business acquisitions, net of cash acquired |
|
|
— |
|
|
|
(433,747 |
) |
|
|
(23,764 |
) |
|
|
— |
|
|
|
(457,511 |
) |
|
Additions to capitalized software |
|
|
— |
|
|
|
(5,231 |
) |
|
|
(4,390 |
) |
|
|
— |
|
|
|
(9,621 |
) |
|
Purchase of long-term investment |
|
|
— |
|
|
|
(1,000 |
) |
|
|
— |
|
|
|
— |
|
|
|
(1,000 |
) |
|
Net cash used in investing activities |
|
|
— |
|
|
|
(454,565 |
) |
|
|
(41,422 |
) |
|
|
— |
|
|
|
(495,987 |
) |
|
Cash Flow from Financing Activities: |
|
|
|
|
|
|
|
|
|
|
|
|
|
|
|
|
|
|
|
|
|
Cash received from debt borrowings, net of original issue discount |
|
|
— |
|
|
|
120,000 |
|
|
|
— |
|
|
|
— |
|
|
|
120,000 |
|
|
Repayments of debt |
|
|
— |
|
|
|
(265,800 |
) |
|
|
(117,636 |
) |
|
|
— |
|
|
|
(383,436 |
) |
|
Transactions involving Holding's common stock |
|
|
— |
|
|
|
27,861 |
|
|
|
— |
|
|
|
— |
|
|
|
27,861 |
|
|
Intercompany transactions |
|
|
— |
|
|
|
121,959 |
|
|
|
(121,959 |
) |
|
|
— |
|
|
|
— |
|
|
Payment of fees related to refinancing activities |
|
|
— |
|
|
|
(519 |
) |
|
|
— |
|
|
|
— |
|
|
|
(519 |
) |
|
Net cash used in financing activities |
|
|
— |
|
|
|
3,501 |
|
|
|
(239,595 |
) |
|
|
— |
|
|
|
(236,094 |
) |
|
Effect of exchange rate changes on cash, cash equivalents and restricted cash |
|
|
— |
|
|
|
— |
|
|
|
(3,629 |
) |
|
|
— |
|
|
|
(3,629 |
) |
|
Net (decrease) increase in cash, cash equivalents and restricted cash |
|
|
— |
|
|
|
(327,562 |
) |
|
|
10,259 |
|
|
|
— |
|
|
|
(317,303 |
) |
|
Cash, cash equivalents and restricted cash, beginning of period |
|
|
— |
|
|
|
363,073 |
|
|
|
73,904 |
|
|
|
— |
|
|
|
436,977 |
|
|
Cash, cash equivalents and restricted cash, end of period |
|
$ |
— |
|
|
$ |
35,511 |
|
|
$ |
84,163 |
|
|
$ |
— |
|
|
$ |
119,674 |
|
83
|
|
Year Ended December 31, 2015 |
|
||||||||||||||||||
|
|
|
Parent |
|
|
Guarantor Subsidiaries |
|
|
Non-guarantor Subsidiaries |
|
|
Consolidating and Eliminating Adjustments |
|
|
Consolidated |
|
|||||
|
Cash Flow from Operating Activities: |
|
|
|
|
|
|
|
|
|
|
|
|
|
|
|
|
|
|
|
|
|
Net income |
|
$ |
42,862 |
|
|
$ |
59,868 |
|
|
$ |
62,375 |
|
|
$ |
(122,243 |
) |
|
$ |
42,862 |
|
|
Non-cash adjustments |
|
|
— |
|
|
|
97,829 |
|
|
|
37,871 |
|
|
|
— |
|
|
|
135,700 |
|
|
Intercompany transactions |
|
|
— |
|
|
|
(11,122 |
) |
|
|
11,122 |
|
|
|
— |
|
|
|
— |
|
|
Earnings from subsidiaries |
|
|
(59,868 |
) |
|
|
(62,375 |
) |
|
|
— |
|
|
|
122,243 |
|
|
|
— |
|
|
Changes in operating assets and liabilities |
|
|
17,006 |
|
|
|
56,657 |
|
|
|
(21,601 |
) |
|
|
— |
|
|
|
52,062 |
|
|
Net cash provided by operating activities |
|
|
— |
|
|
|
140,857 |
|
|
|
89,767 |
|
|
|
— |
|
|
|
230,624 |
|
|
Cash Flow from Investment Activities: |
|
|
|
|
|
|
|
|
|
|
|
|
|
|
|
|
|
|
|
|
|
Additions to property and equipment |
|
|
— |
|
|
|
(7,878 |
) |
|
|
(5,722 |
) |
|
|
— |
|
|
|
(13,600 |
) |
|
Proceeds from sale of property and equipment |
|
|
— |
|
|
|
5 |
|
|
|
59 |
|
|
|
— |
|
|
|
64 |
|
|
Cash paid for business acquisitions, net of cash acquired |
|
|
— |
|
|
|
(2,721,374 |
) |
|
|
(7,779 |
) |
|
|
— |
|
|
|
(2,729,153 |
) |
|
Additions to capitalized software |
|
|
— |
|
|
|
(1,651 |
) |
|
|
(2,622 |
) |
|
|
— |
|
|
|
(4,273 |
) |
|
Net cash used in investing activities |
|
|
— |
|
|
|
(2,730,898 |
) |
|
|
(16,064 |
) |
|
|
— |
|
|
|
(2,746,962 |
) |
|
Cash Flow from Financing Activities: |
|
|
|
|
|
|
|
|
|
|
|
|
|
|
|
|
|
|
|
|
|
Cash received from debt borrowings, net of original issue discount |
|
|
— |
|
|
|
2,410,527 |
|
|
|
657,548 |
|
|
|
— |
|
|
|
3,068,075 |
|
|
Repayments of debt |
|
|
— |
|
|
|
(554,604 |
) |
|
|
(348,844 |
) |
|
|
— |
|
|
|
(903,448 |
) |
|
Transactions involving Holding's common stock |
|
|
— |
|
|
|
726,689 |
|
|
|
1,775 |
|
|
|
— |
|
|
|
728,464 |
|
|
Intercompany transactions |
|
|
— |
|
|
|
373,832 |
|
|
|
(373,832 |
) |
|
|
— |
|
|
|
— |
|
|
Payment of fees related to refinancing activities |
|
|
— |
|
|
|
(39,130 |
) |
|
|
(6,895 |
) |
|
|
— |
|
|
|
(46,025 |
) |
|
Net cash provided by (used in) financing activities |
|
|
— |
|
|
|
2,917,314 |
|
|
|
(70,248 |
) |
|
|
— |
|
|
|
2,847,066 |
|
|
Effect of exchange rate changes on cash, cash equivalents and restricted cash |
|
|
— |
|
|
|
— |
|
|
|
(4,805 |
) |
|
|
— |
|
|
|
(4,805 |
) |
|
Net increase (decrease) in cash, cash equivalents and restricted cash |
|
|
— |
|
|
|
327,273 |
|
|
|
(1,350 |
) |
|
|
— |
|
|
|
325,923 |
|
|
Cash, cash equivalents and restricted cash, beginning of period |
|
|
— |
|
|
|
35,800 |
|
|
|
75,254 |
|
|
|
— |
|
|
|
111,054 |
|
|
Cash, cash equivalents and restricted cash, end of period |
|
$ |
— |
|
|
$ |
363,073 |
|
|
$ |
73,904 |
|
|
$ |
— |
|
|
$ |
436,977 |
|
Note 15—Selected Quarterly Financial Data (Unaudited)
Unaudited quarterly results for 2017 and 2016 were:
|
|
|
First |
|
|
Second |
|
|
Third |
|
|
Fourth |
|
||||
|
|
|
Quarter |
|
|
Quarter |
|
|
Quarter |
|
|
Quarter |
|
||||
|
|
|
($ in thousands, except per share data) |
|
|||||||||||||
|
2017 |
|
|
|
|
|
|
|
|
|
|
|
|
|
|
|
|
|
Revenues |
|
$ |
407,699 |
|
|
$ |
410,980 |
|
|
$ |
418,251 |
|
|
$ |
438,365 |
|
|
Gross profit |
|
|
190,240 |
|
|
|
187,288 |
|
|
|
198,449 |
|
|
|
212,893 |
|
|
Operating income |
|
|
89,717 |
|
|
|
89,985 |
|
|
|
103,917 |
|
|
|
113,294 |
|
|
Net income |
|
|
48,147 |
|
|
|
51,151 |
|
|
|
64,227 |
|
|
|
165,339 |
|
|
Basic earnings per share |
|
$ |
0.24 |
|
|
$ |
0.25 |
|
|
$ |
0.31 |
|
|
$ |
0.80 |
|
|
Diluted earnings per share |
|
$ |
0.23 |
|
|
$ |
0.24 |
|
|
$ |
0.30 |
|
|
$ |
0.77 |
|
|
Cash dividends declared and paid per common share |
|
$ |
0.0625 |
|
|
$ |
0.0625 |
|
|
$ |
0.07 |
|
|
$ |
0.07 |
|
84
|
|
|
First |
|
|
Second |
|
|
Third |
|
|
Fourth |
|
||||
|
|
|
Quarter |
|
|
Quarter |
|
|
Quarter |
|
|
Quarter |
|
||||
|
|
|
($ in thousands, except per share data) |
|
|||||||||||||
|
2016 |
|
|
|
|
|
|
|
|
|
|
|
|
|
|
|
|
|
Revenues |
|
$ |
324,131 |
|
|
$ |
373,077 |
|
|
$ |
383,304 |
|
|
$ |
400,924 |
|
|
Gross profit |
|
|
147,447 |
|
|
|
162,598 |
|
|
|
175,277 |
|
|
|
195,625 |
|
|
Operating income |
|
|
50,444 |
|
|
|
66,037 |
|
|
|
76,903 |
|
|
|
95,311 |
|
|
Net income |
|
|
7,005 |
|
|
|
28,221 |
|
|
|
38,747 |
|
|
|
57,023 |
|
|
Basic earnings per share |
|
$ |
0.04 |
|
|
$ |
0.14 |
|
|
$ |
0.19 |
|
|
$ |
0.28 |
|
|
Diluted earnings per share |
|
$ |
0.03 |
|
|
$ |
0.14 |
|
|
$ |
0.19 |
|
|
$ |
0.28 |
|
|
Cash dividends declared and paid per common share |
|
$ |
0.0625 |
|
|
$ |
0.0625 |
|
|
$ |
0.0625 |
|
|
$ |
0.0625 |
|
Note 16—Subsequent Event
Dividend declared. On February 15, 2018, the Company’s Board of Directors declared a quarterly cash dividend of $0.07 per share of common stock payable on March 15, 2018 to stockholders of record as of the close of business on March 1, 2018.
Pending acquisition. On January 11, 2018, the Company and DST Systems, Inc. (“DST”) announced that they had entered into a definitive agreement wherein the Company will acquire DST. Under the terms of the agreement, the Company will acquire DST for an enterprise value of approximately $5.4 billion comprising $84 per share of DST common stock in cash plus the assumption of debt. The closing, which is expected to occur by the third quarter of 2018, remains subject to DST stockholder approval, clearances by relevant regulatory authorities and satisfaction of customary closing conditions. The Company plans to fund the acquisition and refinance certain of the Company’s existing debt and all of DST’s existing debt with a combination of debt and equity. DST is a global provider of specialized technology, strategic advisory and business operations outsourcing to the financial services and healthcare industries.
85
None.
Disclosure Controls and Procedures
Our management, with the participation of our Chief Executive Officer and Chief Financial Officer (our principal executive officer and principal financial officer, respectively), evaluated the effectiveness of our disclosure controls and procedures as of December 31, 2017. The term “disclosure controls and procedures,” as defined in Rules 13a-15(e) and 15d-15(e) under the Securities Exchange Act of 1934, as amended, or Exchange Act, means controls and other procedures of a company that are designed to ensure that information required to be disclosed by a company in the reports that it files or submits under the Exchange Act is recorded, processed, summarized and reported, within the time periods specified in the rules and forms of the Securities and Exchange Commission. Disclosure controls and procedures include, without limitation, controls and procedures designed to ensure that information required to be disclosed by a company in the reports that it files or submits under the Exchange Act is accumulated and communicated to the company’s management, including its principal executive and principal financial officers, as appropriate to allow timely decisions regarding required disclosure. Management recognizes that any controls and procedures, no matter how well designed and operated, can provide only reasonable assurance of achieving their objectives, and management necessarily applies its judgment in evaluating the cost-benefit relationship of possible controls and procedures. Based on the evaluation of our disclosure controls and procedures as of December 31, 2017, our Chief Executive Officer and Chief Financial Officer concluded that, as of such date, our disclosure controls and procedures were effective at the reasonable assurance level.
Report of Management on Internal Control Over Financial Reporting
Our management is responsible for establishing and maintaining adequate internal control over financial reporting for the Company. Internal control over financial reporting is a process designed to provide reasonable assurance regarding the reliability of our financial reporting and the preparation of financial statements for external purposes in accordance with generally accepted accounting principles. Internal control over financial reporting includes policies and procedures that: 1) pertain to maintaining records that in reasonable detail accurately and fairly reflect our transactions and dispositions of assets; 2) provide reasonable assurance that transactions are recorded as necessary to permit preparation of our financial statements in accordance with generally accepted accounting principles and that receipts and expenditures are made in accordance with management and board of director authorization; and 3) provide reasonable assurance regarding the prevention or timely detection of unauthorized acquisition, use or disposition of company assets that could have a material effect on our financial statements. Because of its inherent limitations, internal control over financial reporting may not prevent or detect misstatements. Also, projections of any evaluation of effectiveness to future periods are subject to the risk that controls may become inadequate because of changes in conditions, or that the degree of compliance with the policies or procedures may deteriorate.
Management conducted an evaluation of the effectiveness of our internal control over financial reporting based on the framework in Internal Control – Integrated Framework (2013) issued by the Committee of Sponsoring Organizations of the Treadway Commission. Based on this evaluation, management concluded that our internal control over financial reporting was effective as of December 31, 2017.
The effectiveness of our internal control over financial reporting as of December 31, 2017 has been audited by PricewaterhouseCoopers LLP, an independent registered public accounting firm, as stated in their report, which is included herein.
Changes in Internal Control Over Financial Reporting
There have not been any changes in our internal control over financial reporting (as defined in Rules 13a-15(f) and 15d-15(f) under the Exchange Act) that occurred during the fiscal quarter ended December 31, 2017, that have materially affected, or are reasonably likely to materially affect, our internal control over financial reporting.
None.
86
Incorporated by reference from the information in the Company’s proxy statement for the 2018 annual meeting of stockholders, which the Company intends to file within 120 days after the end of the fiscal year to which this annual report on Form 10-K relates.
Incorporated by reference from the information in the Company’s proxy statement for the 2018 annual meeting of stockholders, which the Company intends to file within 120 days after the end of the fiscal year to which this annual report on Form 10-K relates.
|
Item 12. |
SECURITY OWNERSHIP OF CERTAIN BENEFICIAL OWNERS AND MANAGEMENT AND RELATED STOCKHOLDER MATTERS |
Incorporated by reference from the information in the Company’s proxy statement for the 2018 annual meeting of stockholders, which the Company intends to file within 120 days after the end of the fiscal year to which this annual report on Form 10-K relates.
Incorporated by reference from the information in the Company’s proxy statement for the 2018 annual meeting of stockholders, which the Company intends to file within 120 days after the end of the fiscal year to which this annual report on Form 10-K relates.
Incorporated by reference from the information in the Company’s proxy statement for the 2018 annual meeting of stockholders, which the Company intends to file within 120 days after the end of the fiscal year to which this annual report on Form 10-K relates.
87
|
|
(a) |
The following documents are filed as part of this Report. |
|
|
(1) |
Financial Statements — See Index to Financial Statements in Item 8 of this Report. |
|
|
(2) |
Financial Statement Schedules — All financial statement schedules are not submitted because they are not applicable, not required or the information is included in our Consolidated Financial Statements. |
|
|
(3) |
Exhibits — See the Exhibit listing below. |
|
Exhibit Number |
|
Description of Exhibit |
|
|
|
|
|
2.1† |
|
|
|
|
|
|
|
2.2† |
|
|
|
|
|
|
|
3.1 |
|
|
|
|
|
|
|
3.2 |
|
Amended and Restated Bylaws of the Registrant are incorporated herein by reference to Exhibit 3.4 to the Form S-1, as amended (File No. 333-164043) (the “2010 Form S-1”) |
|
|
|
|
|
4.1 |
|
|
|
|
|
|
|
4.2 |
|
|
|
|
|
|
|
4.3 |
|
|
|
|
|
|
|
10.1 |
|
|
|
|
|
|
|
10.2 |
|
|
|
|
|
|
|
10.3 |
|
|
|
|
|
|
|
10.4 |
|
|
|
|
|
|
88
|
Exhibit Number |
|
Description of Exhibit |
|
|
||
|
|
|
|
|
10.6 |
|
|
|
|
|
|
|
10.7 |
|
|
|
|
|
|
|
10.8 |
|
|
|
|
|
|
|
10.9* |
|
|
|
|
|
|
|
10.10* |
|
|
|
|
|
|
|
10.11 |
|
2008 Stock Incentive Plan is incorporated herein by reference to Exhibit 10.26 to the 2008 Form S-1 |
|
|
|
|
|
10.12* |
|
|
|
|
|
|
|
10.13* |
|
|
|
|
|
|
|
10.14* |
|
|
|
|
|
|
|
10.15 (P) |
|
Lease Agreement, dated September 23, 1997, by and between SS&C Technologies, Inc. and Monarch Life Insurance Company, as amended by First Amendment to Lease dated as of November 18, 1997, is incorporated herein by reference to Exhibit 10.15 to SS&C Technologies, Inc.’s Annual Report on Form 10-K for the year ended December 31, 1997 (File No. 000-28430) |
|
|
|
|
|
10.16 |
|
|
|
|
|
|
|
10.17 |
|
|
|
|
|
|
|
10.18 |
|
|
|
|
|
|
|
10.19 |
|
|
|
|
|
|
|
10.20 |
|
|
|
|
|
|
89
|
Exhibit Number |
|
Description of Exhibit |
|
|
||
|
|
|
|
|
10.22 |
|
|
|
|
|
|
|
10.23* |
|
|
|
|
|
|
|
10.24* |
|
|
|
|
|
|
|
10.25* |
|
|
|
|
|
|
|
10.26* |
|
|
|
|
|
|
|
10.27* |
|
|
|
|
|
|
|
10.28* |
|
|
|
|
|
|
|
10.29* |
|
|
|
|
|
|
|
10.30 |
|
|
|
|
|
|
|
10.31 |
|
|
|
|
|
|
|
21** |
|
|
|
|
|
|
|
23.1** |
|
|
|
|
|
|
|
31.1** |
|
|
|
|
|
|
|
31.2** |
|
|
|
|
|
|
|
32** |
|
|
|
|
|
|
|
101.INS** |
|
XBRL Instance Document. |
|
|
|
|
|
101.SCH** |
|
XBRL Taxonomy Extension Schema Document. |
|
|
|
|
|
101.CAL** |
|
XBRL Taxonomy Calculation Linkbase Document. |
|
|
|
|
|
101.LAB** |
|
XBRL Taxonomy Label Linkbase Document. |
|
|
|
|
|
101.PRE** |
|
XBRL Taxonomy Presentation Linkbase Document. |
|
|
|
|
|
101.DEF** |
|
XBRL Taxonomy Extension Definition Linkbase Document. |
90
|
Exhibit Number |
|
Description of Exhibit |
|
|
|
|
|
101.REF** |
|
XBRL Taxonomy Reference Linkbase Document. |
|
* |
Management contract or compensatory plan or arrangement filed herewith in response to Item 15(a)(3) of the Instructions to the Annual Report on Form 10-K. |
|
† |
Schedules have been omitted from this filing pursuant to Item 601(b)(2) of Regulation S-K. The Registrant agrees to furnish supplementally a copy of any omitted schedule to the Securities and Exchange Commission upon its request; provided, however, that the Registrant may request confidential treatment pursuant to Rule 24b-2 of the Exchange Act for any schedule so furnished. |
|
** |
Submitted electronically herewith. |
|
(P) |
Originally filed with the Securities and Exchange Commission in paper form. |
Attached as Exhibit 101 to this report are the following formatted in XBRL (Extensible Business Reporting Language): (i) Consolidated Balance Sheets at December 31, 2017 and 2016, (ii) Consolidated Statements of Comprehensive Income (Loss) for the years ended December 31, 2017, 2016 and 2015, (iii) Consolidated Statements of Cash Flows for the years ended December 31, 2017, 2016 and 2015, (iv) Consolidated Statements of Changes in Stockholders’ Equity for the years ended December 31, 2017, 2016 and 2015 and (v) Notes to Consolidated Financial Statements.
None.
91
Pursuant to the requirements of Section 13 or 15(d) of the Securities Exchange Act of 1934, the registrant has duly caused this report to be signed on its behalf by the undersigned, thereunto duly authorized.
|
|
|
SS&C TECHNOLOGIES HOLDINGS, INC. |
|
|
|
|
|
By: |
|
/s/ William C. Stone |
|
|
|
William C. Stone |
|
|
|
Chairman of the Board and Chief Executive Officer |
Date: February 28, 2018
Pursuant to the requirements of the Securities Exchange Act of 1934, this report has been signed below by the following persons on behalf of the registrant and in the capacities and on the dates indicated.
|
Signatures |
|
Title |
|
Date |
|
|
|
|
|
|
|
/s/ William C. Stone |
|
Chairman of the Board and Chief |
|
February 28, 2018 |
|
William C. Stone |
|
Executive Officer |
|
|
|
|
|
(Principal Executive Officer) |
|
|
|
|
|
|
|
|
|
/s/ Patrick J. Pedonti |
|
Senior Vice President and Chief |
|
February 28, 2018 |
|
Patrick J. Pedonti |
|
Financial Officer |
|
|
|
|
|
(Principal Financial and Accounting Officer) |
|
|
|
|
|
|
|
|
|
/s/ Normand A. Boulanger |
|
Director |
|
February 28, 2018 |
|
Normand A. Boulanger |
|
|
|
|
|
|
|
|
|
|
|
/s/ Smita Conjeevaram |
|
Director |
|
February 28, 2018 |
|
Smita Conjeevaram |
|
|
|
|
|
|
|
|
|
|
|
/s/ Michael E. Daniels |
|
Director |
|
February 28, 2018 |
|
Michael E. Daniels |
|
|
|
|
|
|
|
|
|
|
|
/s/ Jonathan E. Michael |
|
Director |
|
February 28, 2018 |
|
Jonathan E. Michael |
|
|
|
|
|
|
|
|
|
|
|
/s/ David A. Varsano |
|
Director |
|
February 28, 2018 |
|
David A. Varsano |
|
|
|
|
|
|
|
|
|
|
|
/s/ Michael J. Zamkow |
|
Director |
|
February 28, 2018 |
|
Michael J. Zamkow |
|
|
|
|
92