Attached files
| file | filename |
|---|---|
| EX-95 - EX-95 - TUTOR PERINI CORP | tpc-20171231xex95.htm |
| EX-32.2 - EX-32.2 - TUTOR PERINI CORP | tpc-20171231xex32_2.htm |
| EX-32.1 - EX-32.1 - TUTOR PERINI CORP | tpc-20171231xex32_1.htm |
| EX-31.2 - EX-31.2 - TUTOR PERINI CORP | tpc-20171231xex31_2.htm |
| EX-31.1 - EX-31.1 - TUTOR PERINI CORP | tpc-20171231xex31_1.htm |
| EX-24 - EX-24 - TUTOR PERINI CORP | tpc-20171231xex24.htm |
| EX-23 - EX-23 - TUTOR PERINI CORP | tpc-20171231xex23.htm |
| EX-21 - EX-21 - TUTOR PERINI CORP | tpc-20171231xex21.htm |
UNITED STATES
SECURITIES AND EXCHANGE COMMISSION
Washington, DC 20549
FORM 10-K
|
☑ |
Annual Report Pursuant to Section 13 or 15(d) of the Securities Act of 1934. |
|
|
|
|
|
For the fiscal year ended December 31, 2017. |
|
☐ |
Transition Report Pursuant to Section 13 or 15(d) of the Securities Exchange Act of 1934. |
|
|
|
|
|
For the transition period from-to- |
Commission File No. 1-6314
Tutor Perini Corporation
(Exact name of registrant as specified in its charter)
|
Massachusetts |
|
04-1717070 |
|
(State of Incorporation) |
|
(IRS Employer Identification No.) |
|
15901 Olden Street, Sylmar, California |
|
91342 |
|
(Address of principal executive offices) |
|
(Zip Code) |
|
(818) 362-8391 |
|
(Registrant’s telephone number, including area code) |
Securities registered pursuant to Section 12(b) of the Act:
|
Title of Each Class |
|
Name of each exchange on which registered |
|
Common Stock, $1.00 par value |
|
The New York Stock Exchange |
Securities registered pursuant to Section 12(g) of the Act: None
Indicate by check mark if the registrant is a well-known seasoned issuer, as defined in Rule 405 of the Securities Act. Yes ☑ No ☐
Indicate by check mark if the registrant is not required to file reports pursuant to Section 13 or Section 15(d) of the Act. Yes ☐ No ☑
Indicate by check mark whether the registrant (1) has filed all reports required to be filed by Section 13 or 15(d) of the Securities Exchange Act of 1934 during the preceding 12 months (or for such shorter period that the registrant was required to file such reports), and (2) has been subject to such filing requirements for the past 90 days. Yes ☑ No ☐
Indicate by check mark whether the registrant has submitted electronically and posted on its corporate website, if any, every Interactive Data File required to be submitted and posted pursuant to Rule 405 of Regulation S-T (§232.405 of this chapter) during the preceding 12 months (or for such shorter period that the registrant was required to submit and post such files). Yes ☑ No ☐
Indicate by check mark if disclosure of delinquent filers pursuant to Item 405 of Regulation S-K (§ 229.405 of this chapter) is not contained herein, and will not be contained, to the best of registrant’s knowledge, in definitive proxy or information statements incorporated by reference in Part III of this Form 10-K or any amendment to this Form 10-K. ☑
Indicate by check mark whether the registrant is a large accelerated filer, an accelerated filer, a non-accelerated filer, a smaller reporting company or an emerging growth company. See definition of “accelerated filer,” “large accelerated filer,” “smaller reporting company” and “emerging growth company” in Rule 12b-2 of the Exchange Act. (Check one):
|
|
||||
|
Large accelerated filer ☑ |
|
Accelerated filer ☐ |
|
Non-accelerated filer ☐ |
|
Smaller reporting company ☐ |
|
Emerging growth company ☐ |
|
(Do not check if a smaller reporting company) |
If an emerging growth company, indicate by check mark if the registrant has elected not to use the extended transition period for complying with any new or revised financial accounting standards provided pursuant to Section 13(a) of the Exchange Act ☐
Indicate by check mark whether the registrant is a shell company (as defined in Rule 12b-2 of the Exchange Act). Yes ☐ No ☑
The aggregate market value of voting Common Stock held by non-affiliates of the registrant was $1,116,725,095 as of June 30, 2017, the last business day of the registrant’s most recently completed second fiscal quarter.
The number of shares of Common Stock, $1.00 par value per share, outstanding at February 21, 2018 was 49,791,010.
Documents Incorporated by Reference
Portions of the definitive proxy statement relating to the registrant’s annual meeting of stockholders are incorporated by reference into Part III of this Annual Report on Form 10-K.
TUTOR PERINI CORPORATION
2017 ANNUAL REPORT ON FORM 10-K
|
|
PAGE |
|
|
PART I. |
||
|
Item 1. |
3 | |
|
Item 1A. |
11 | |
|
Item 1B. |
15 | |
|
Item 2. |
16 | |
|
Item 3. |
16 | |
|
Item 4. |
16 | |
|
|
||
|
PART II. |
||
|
Item 5. |
17 | |
|
Item 6. |
19 | |
|
Item 7. |
Management’s Discussion and Analysis of Financial Condition and Results of Operations |
20 |
|
Item 7A. |
28 | |
|
Item 8. |
28 | |
|
Item 9. |
Changes in and Disagreements with Accountants on Accounting and Financial Disclosure |
28 |
|
Item 9A. |
29 | |
|
Item 9B. |
31 | |
|
|
||
|
PART III. |
||
|
Item 10. |
31 | |
|
Item 11. |
31 | |
|
Item 12. |
Security Ownership of Certain Beneficial Owners and Management and Related Stockholder Matters |
31 |
|
Item 13. |
Certain Relationships and Related Transactions, and Director Independence |
31 |
|
Item 14. |
31 | |
|
|
||
|
PART IV. |
||
|
Item 15. |
32 | |
|
|
34 |
2
Forward-Looking Statements
The statements contained in this Annual Report on Form 10-K that are not purely historical are forward-looking statements within the meaning of Section 27A of the Securities Act of 1933 and Section 21E of the Securities Exchange Act of 1934 (the “Exchange Act”), including without limitation, statements regarding our management’s expectations, hopes, beliefs, intentions or strategies regarding the future and statements regarding future guidance or estimates and non-historical performance. These forward-looking statements are based on our current expectations and beliefs concerning future developments and their potential effects on us. Our expectations, beliefs and projections are expressed in good faith, and we believe there is a reasonable basis for them. There can be no assurance that future developments affecting us will be those that we have anticipated. These forward-looking statements involve a number of risks, uncertainties (some of which are beyond our control) or other assumptions that may cause actual results or performance to be materially different from those expressed or implied by such forward-looking statements. These risks and uncertainties are listed and discussed in Item 1A. Risk Factors, below. We undertake no obligation to update or revise any forward-looking statements, whether as a result of new information, future events or otherwise, except as may be required under applicable securities laws.
General
Tutor Perini Corporation, formerly known as Perini Corporation, was incorporated in 1918 as a successor to businesses that had been engaged in providing construction services since 1894. Tutor Perini Corporation (together with its consolidated subsidiaries, “Tutor Perini,” the “Company,” “we,” “us,” and “our,” unless the context indicates otherwise) is a leading construction company, based on revenue as ranked by Engineering News-Record (“ENR”), offering diversified general contracting, construction management and design-build services to private customers and public agencies throughout the world. Our corporate headquarters are in Los Angeles (Sylmar), California, and we have various other principal offices throughout the United States and its territories (see Item 2. Properties for a listing of our major facilities). Our common stock (“Common Stock”) is listed on the New York Stock Exchange under the symbol “TPC.” We are incorporated in the Commonwealth of Massachusetts.
We have established a strong reputation within our markets for executing large, complex projects on time and within budget while adhering to strict quality control measures. We offer general contracting, pre-construction planning and comprehensive project management services, including the planning and scheduling of the manpower, equipment, materials and subcontractors required for a project. We also offer self-performed construction services including site work; concrete forming and placement; steel erection; electrical; mechanical; plumbing; heating, ventilation and air conditioning (HVAC); and fire protection. During 2017, we performed work on approximately 1,500 construction projects.
In 2017, ENR ranked Tutor Perini as the ninth largest domestic contractor. We are recognized as one of the leading civil contractors in the United States, as evidenced by our past and current performance on several of the country’s largest mass-transit and transportation projects, such as the East Side Access project in New York City, the California High-Speed Rail System, the Alaskan Way Viaduct Replacement (SR 99) project in Seattle, McCarran International Airport Terminal 3 in Las Vegas, major portions of the Red Line and Purple Line segments of the Los Angeles subway system, and the San Francisco Central Subway extension to Chinatown. We are also recognized as one of the leading building contractors in the United States, as evidenced by our performance on several of the country’s largest building development projects, including CityCenter and the Cosmopolitan in Las Vegas and Hudson Yards in New York City.
Since the 2008 merger between our predecessor companies, Tutor-Saliba Corporation (“Tutor-Saliba”) and Perini Corporation, we have experienced significant growth supported by our increased size, scale, bonding capacity, access to broader geographic regions, expanded management capabilities, complementary assets and particular expertise in large, complex projects. In 2010 and 2011, we expanded vertically and geographically through the strategic acquisitions of seven companies with demonstrated success in their respective markets. These acquisitions further strengthened our geographic presence in our Building and Civil segments and also significantly increased our specialty contracting capabilities. In 2011, we completed an internal reorganization of our reporting segments with the creation of the Specialty Contractors segment, which we describe below.
Our acquisitions have enabled us to provide customers with a vertically integrated service offering. This vertical integration is a unique capability and competitive advantage that allows us to self-perform a greater amount of work than our competitors. Our vertical integration increases our competitiveness in bidding and our efficiency in managing and executing large, complex projects. It also provides us with significant cross-selling opportunities across a broad geographic footprint.
3
Business Segment Overview
Our business is conducted through three segments: Civil, Building and Specialty Contractors.
Civil Segment
Our Civil segment specializes in public works construction and the replacement and reconstruction of infrastructure across most of the major geographic regions of the United States. Our civil contracting services include construction and rehabilitation of highways, bridges, tunnels, mass-transit systems, and water management and wastewater treatment facilities.
The Civil segment is comprised of the Company’s legacy heavy civil construction operations (civil operations of our predecessors, Tutor-Saliba, its subsidiary Black Construction, and Perini Corporation), as well as Frontier-Kemper, Lunda Construction and Becho. The Company’s legacy heavy civil units operate primarily on the West Coast and East Coast of the United States and are engaged in a variety of large mass-transit, transportation, bridge and highway projects. Frontier-Kemper is a heavy civil contractor engaged in the construction of tunnels for highways, railroads, subways and rapid transit systems; the construction of shafts and other facilities for water supply, wastewater transport and hydroelectric projects; and the development and equipping of mines with innovative hoisting, elevator and vertical conveyance systems. Lunda Construction is a heavy civil contractor specializing in the construction, rehabilitation and maintenance of bridges, railroads and other civil structures throughout the United States. Becho is engaged in drilling, foundation and excavation support for shoring, bridges, piers, roads and highway projects, primarily in the southwestern United States. We believe that the Company has benefitted from these acquisitions by an expanded geographic presence, enhanced civil construction capabilities and the addition of experienced management with proven, successful track records.
Our Civil segment’s customers primarily award contracts through one of two methods: the traditional public “competitive bid” method, in which price is the major determining factor, or through a request for proposal, where contracts are awarded based on a combination of technical qualifications, proposed project team, schedule, past performance on similar projects and price.
Traditionally, our Civil segment’s customers require each contractor to pre-qualify for construction business by meeting criteria that include technical capabilities and financial strength. Our financial strength and outstanding record of performance on challenging civil works projects often enable us to pre-qualify for projects in situations where smaller, less diversified contractors are unable to meet the qualification requirements. We believe this is a competitive advantage that makes us an attractive partner on the largest, most complex infrastructure projects and prestigious design-build, or DBOM (design-build-operate-maintain) or P3 (public-private partnership) projects.
In its 2017 rankings, ENR ranked us as the nation’s third largest domestic heavy contractor and fourth largest contractor in the transportation market.
We believe the Civil segment provides us with significant opportunities for growth due to the age and condition of existing infrastructure coupled with large government funding sources aimed at the replacement and reconstruction of aging U.S. infrastructure and popular, often bipartisan, support from the public and elected officials for infrastructure improvement programs. Funding for major civil infrastructure projects is typically provided through a combination of one or more of the following: local, regional, state and federal loans; grants; other direct allocations sourced through tax revenue; bonds; user fees; and, for certain projects, private capital.
We have been active in civil construction since 1894 and believe we have a particular expertise in large, complex civil construction projects. We have completed or are currently working on some of the most significant civil construction projects in the United States. For example, we are currently working on various portions of the East Side Access project in New York City, the first phase of the California High-Speed Rail project, the Alaskan Way Viaduct Replacement (SR 99) project in Seattle, the Purple Line Segment 2 expansion project in Los Angeles, the San Francisco Central Subway extension to Chinatown, the platform over the eastern rail yard and the Amtrak tunnel at Hudson Yards in New York City, and the rehabilitation of the Verrazano-Narrows Bridge in New York. We have also completed projects at the John F. Kennedy International Airport in New York, the Los Angeles International Airport, the Fort Lauderdale-Hollywood International Airport, the New Irvington Tunnel in Fremont, California, the Caldecott Tunnel Fourth Bore project near Oakland, California and express toll lanes along I-95 in Maryland.
Building Segment
Our Building segment has significant experience providing services to a number of specialized building markets for private and public works customers, including hospitality and gaming, transportation, health care, commercial offices, government facilities, sports and entertainment, education, correctional facilities, biotech, pharmaceutical, industrial and high-tech. We believe the success of the Building segment results from our proven ability to manage and perform large, complex projects with aggressive fast-track schedules; elaborate designs; and advanced mechanical, electrical and life safety systems, while providing accurate budgeting and strict quality
4
control. Although price is a key competitive factor, we believe our strong reputation, long-standing customer relationships and significant level of repeat and referral business have enabled us to achieve a leading position in the marketplace.
The Building segment is comprised of several operating units that provide general contracting, design-build, preconstruction and construction services in various regions of the United States. Tutor Perini Building Corp. focuses on large, complex building projects nationwide, including significant projects in the hospitality and gaming, commercial office, education, government facilities, and multi-unit residential markets. Rudolph and Sletten focuses on large, complex projects in California in the health care, commercial office, technology, industrial, education, and government facilities markets. Roy Anderson Corp. provides its services, including disaster rapid response services, to public and private customers primarily throughout the southeastern United States. Perini Management Services provides diversified construction and design-build services internationally to U.S. government agencies, as well as to surety companies and multi-national corporations. We believe that our expertise and strong résumé of notable projects positions us well to win additional large, complex building projects.
In its 2017 rankings, ENR ranked us as the ninth largest domestic building contractor. We are a recognized leader in the hospitality and gaming market, specializing in the construction of high-end resorts and casinos. We work with hotel operators, Native American tribal councils, developers and architectural firms to provide diversified construction services to meet the challenges of new construction and renovation of hotel and resort properties. We believe that our reputation for completing projects on time is a significant competitive advantage in this market, as any delay in project completion could result in significant loss of revenue for the customer.
We have recently completed, or are currently working on, large private and public building projects across a wide array of building end markets, including commercial offices, multi-unit residential, health care, hospitality and gaming, transportation, education, and entertainment. Specific projects include a large corporate office building in northern California for a confidential technology customer; Tower C (commercial) and Tower D (multi-unit residential) at Hudson Yards in New York City; the Washington Hospital expansion in Fremont, California; the Graton Rancheria Resort and Casino in Rohnert Park, California; the Pechanga Resort and Casino expansion in Temecula, California; the Maryland Live! Casino expansion in Hanover, Maryland; the Broadway Plaza retail development in Walnut Creek, California; Kaiser Hospital Buildings in San Leandro and Redwood City, California; and courthouses in San Bernardino and San Diego, California and Broward County, Florida. As a result of our reputation and track record, we were previously awarded and completed contracts for several marquee projects in the hospitality and gaming market, including the Resorts World New York Casino in Jamaica, New York, as well as CityCenter, the Cosmopolitan, the Wynn Encore Hotel, Trump International Hotel and Tower, Paris Las Vegas and Planet Hollywood in Las Vegas. The above projects span a wide array of building end markets and illustrate our Building segment’s résumé of successfully completed large-scale public and private projects.
Specialty Contractors Segment
Our Specialty Contractors segment specializes in electrical, mechanical, plumbing, HVAC, fire protection systems and pneumatically placed concrete for a full range of civil and building construction projects in the industrial, commercial, hospitality and gaming, and mass-transit end markets. This segment provides unique strengths and capabilities that position us as a full-service contractor with greater control over project bids and costs, scheduled work, project delivery and risk management.
The Specialty Contractors segment is comprised of several operating units that provide unique services in various regions of the United States. Five Star Electric has established itself as an industry leader and is one of the largest electrical contractors in New York City. Five Star Electric provides construction services in the electrical sector, including power, lighting, fire alarm, security, telecommunications, low voltage and wireless systems to both the public and private sectors. These services are provided across end markets that include multi-unit residential, hotels, commercial offices, industrial, mass transit, education, retail, sports and entertainment, health care and water treatment. Fisk Electric covers many of the major commercial, transportation and industrial electrical construction markets in California and the southern United States, with the ability to cover other attractive markets nationwide. Fisk’s expertise is in technology design and the development of electrical and technology systems for major projects spanning a broad variety of project types, including commercial office buildings, sports arenas, hospitals, research laboratories, hotels and casinos, convention centers, manufacturing plants, refineries, and water and wastewater treatment facilities. WDF, Nagelbush and Desert Mechanical each provide mechanical, plumbing, HVAC and fire protection services to a range of customers in a wide variety of markets, including transportation, commercial/industrial, schools and universities and residential. WDF is one of the largest mechanical contractors servicing the New York City metropolitan region. Nagelbush operates primarily in Florida and Desert Mechanical operates primarily in the western United States. Superior Gunite specializes in pneumatically placed structural concrete utilized in infrastructure projects nationwide, such as bridges, dams, tunnels and retaining walls.
In its 2017 rankings, ENR ranked us as the fifth largest electrical contractor1, twelfth largest mechanical contractor1 and tenth largest specialty contractor1 in the United States. Through Five Star Electric and WDF, collectively, we are also the largest specialty contractor in the New York City metropolitan area.
1 This ranking represents the collective revenue of the Company’s specialty contracting subsidiaries as reported to ENR.
5
Our Specialty Contractors units have recently completed, or are currently working on, various portions of the East Side Access project in New York City, various projects at the World Trade Center and at Hudson Yards in New York City, two signal system modernization projects in New York City and electrical work for the new hospital at the University of Texas Southwestern Medical Center in Dallas. This Specialty Contractors segment has also supported, or is currently supporting, several large projects in our Civil and Building segments, including the Alaskan Way Viaduct Replacement (SR 99) project in Seattle; McCarran International Airport Terminal 3 in Las Vegas; the Resorts World New York Casino in Jamaica, New York; the Caldecott Tunnel Fourth Bore project near Oakland, California; and several marquee projects in the hospitality and gaming market, including CityCenter, the Cosmopolitan, the Wynn Encore Hotel, Trump International Hotel and Tower, and Planet Hollywood in Las Vegas.
The majority of work performed by the Specialty Contractors segment is contracted directly with state and local municipal agencies, real estate developers, general contractors, school districts and commercial and industrial customers. A smaller, but growing, component of its work is performed for our Civil and Building segments.
Markets and Customers
We provide diversified construction services to a variety of end markets and customers. The following tables set forth certain reportable segment information relating to the Company’s operations for the years ended December 31, 2017, 2016 and 2015.
|
|
||||||||
|
Revenue by Business Segment |
Year Ended December 31, |
|||||||
|
(in thousands) |
2017 |
2016 |
2015 |
|||||
|
Civil |
$ |
1,602,175 |
$ |
1,668,963 |
$ |
1,889,907 | ||
|
Building |
1,941,325 | 2,069,841 | 1,802,535 | |||||
|
Specialty Contractors |
1,213,708 | 1,234,272 | 1,228,030 | |||||
|
Total |
$ |
4,757,208 |
$ |
4,973,076 |
$ |
4,920,472 | ||
|
|
||||||||
|
Civil Segment Revenue by End Market |
Year Ended December 31, |
|||||||
|
(in thousands) |
2017 |
2016 |
2015 |
|||||
|
Mass Transit |
$ |
733,059 |
$ |
547,913 |
$ |
450,436 | ||
|
Bridges |
432,177 | 533,762 | 662,553 | |||||
|
Highways |
250,850 | 290,745 | 388,963 | |||||
|
Other |
186,089 | 296,543 | 387,955 | |||||
|
Total |
$ |
1,602,175 |
$ |
1,668,963 |
$ |
1,889,907 | ||
|
|
||||||||
|
Building Segment Revenue by End Market |
Year Ended December 31, |
|||||||
|
(in thousands) |
2017 |
2016 |
2015 |
|||||
|
Office |
$ |
470,017 |
$ |
441,591 |
$ |
226,928 | ||
|
Hospitality and Gaming |
430,757 | 216,224 | 250,757 | |||||
|
Health Care Facilities |
264,403 | 235,005 | 164,963 | |||||
|
Mixed Use |
156,497 | 163,454 | 112,737 | |||||
|
Municipal and Government |
149,225 | 262,022 | 335,762 | |||||
|
Education Facilities |
142,784 | 157,808 | 186,944 | |||||
|
Condominiums |
106,513 | 193,755 | 125,949 | |||||
|
Industrial and Commercial |
70,747 | 271,480 | 266,921 | |||||
|
Other |
150,382 | 128,502 | 131,574 | |||||
|
Total |
$ |
1,941,325 |
$ |
2,069,841 |
$ |
1,802,535 | ||
6
|
|
||||||||
|
Specialty Contractors Segment Revenue by End Market |
Year Ended December 31, |
|||||||
|
(in thousands) |
2017 |
2016 |
2015 |
|||||
|
Mass Transit |
$ |
279,524 |
$ |
204,398 |
$ |
107,120 | ||
|
Mixed Use |
212,780 | 159,286 | 96,072 | |||||
|
Industrial and Commercial |
177,605 | 186,769 | 164,480 | |||||
|
Education Facilities |
131,606 | 80,476 | 195,647 | |||||
|
Condominiums |
123,152 | 239,937 | 266,648 | |||||
|
Transportation |
96,715 | 164,468 | 149,971 | |||||
|
Health Care Facilities |
80,456 | 60,233 | 40,228 | |||||
|
Wastewater Treatment |
26,709 | 58,479 | 73,094 | |||||
|
Other |
85,161 | 80,226 | 134,770 | |||||
|
Total |
$ |
1,213,708 |
$ |
1,234,272 |
$ |
1,228,030 | ||
|
|
||||||||
|
|
Year Ended December 31, |
|||||||
|
Revenue by Customer Type |
2017 |
2016 |
2015 |
|||||
|
State and Local Agencies |
47 |
% |
49 |
% |
55 |
% |
||
|
Private Owners |
46 |
% |
45 |
% |
40 |
% |
||
|
Federal Agencies |
7 |
% |
6 |
% |
5 |
% |
||
|
Total |
100 |
% |
100 |
% |
100 |
% |
||
State and Local Agencies. Our state and local government customers include state transportation departments, metropolitan authorities, cities, municipal agencies, school districts and public universities. We provide services to our state and local customers primarily pursuant to contracts awarded through competitive bidding processes. Our building construction services for state and local government customers have included judicial and correctional facilities, schools and dormitories, health care facilities, convention centers, parking structures and other municipal buildings. The vast majority of our civil contracting and building construction services are provided in locations throughout the United States and its territories.
Private Owners. Our private customers include real estate developers, health care companies, technology companies, hospitality and gaming resort owners, Native American sovereign nations, public corporations and private universities. We provide services to our private customers through negotiated contract arrangements, as well as through competitive bids.
Federal Agencies. Our federal government customers include the U.S. State Department, the U.S. Navy, the U.S. Army Corps of Engineers, the U.S. Air Force and the National Park Service. We provide services to federal agencies primarily pursuant to contracts for specific or multi-year assignments that involve new construction or infrastructure repairs or improvements. A portion of our revenue from federal agencies is derived from projects in overseas locations, which we expect to continue for the foreseeable future as a result of our experience and strong relationships with federal agencies, together with anticipated expenditures for defense, diplomatic and security-related construction work.
Most federal, state and local government contracts contain provisions that permit the termination of contracts, in whole or in part, for the convenience of the government, among other reasons.
For additional information on revenue and total assets by geographic location, see Note 12 of the Notes to Consolidated Financial Statements.
7
Backlog
Backlog in our industry is a measure of the total value of work that is remaining to be performed on projects that have been awarded. We include a construction project in our backlog when a contract is awarded or when we have otherwise received written definitive notice that the project has been awarded to us and there are no remaining major uncertainties that the project will proceed (e.g., we believe adequate funding is in place). As a result, we believe our backlog is firm, and although cancellations or scope adjustments may occur, historically they have not been material. Our backlog by segment, end market and customer type is presented in the following tables:
|
|
|||||||||||
|
Backlog by Business Segment |
As of December 31, |
||||||||||
|
(in thousands) |
2017 |
2016 |
|||||||||
|
Civil |
$ |
4,118,243 | 57 |
% |
$ |
2,672,126 | 43 |
% |
|||
|
Building |
1,701,378 | 23 |
% |
1,981,193 | 32 |
% |
|||||
|
Specialty Contractors |
1,463,813 | 20 |
% |
1,573,818 | 25 |
% |
|||||
|
Total |
$ |
7,283,434 | 100 |
% |
$ |
6,227,137 | 100 |
% |
|||
We estimate that approximately $3.6 billion, or 49%, of our backlog as of December 31, 2017 will be recognized as revenue in 2018.
|
|
|||||||||||
|
Civil Segment Backlog by End Market |
As of December 31, |
||||||||||
|
(in thousands) |
2017 |
2016 |
|||||||||
|
Mass Transit |
$ |
2,562,725 | 62 |
% |
$ |
1,853,117 | 69 |
% |
|||
|
Bridges |
617,084 | 15 |
% |
297,810 | 11 |
% |
|||||
|
Highways |
480,918 | 12 |
% |
379,630 | 14 |
% |
|||||
|
Other |
457,516 | 11 |
% |
141,569 | 6 |
% |
|||||
|
Total |
$ |
4,118,243 | 100 |
% |
$ |
2,672,126 | 100 |
% |
|||
|
|
|||||||||||
|
Building Segment Backlog by End Market |
As of December 31, |
||||||||||
|
(in thousands) |
2017 |
2016 |
|||||||||
|
Health Care Facilities |
$ |
377,768 | 22 |
% |
$ |
192,280 | 10 |
% |
|||
|
Municipal and Government |
332,073 | 20 |
% |
206,164 | 10 |
% |
|||||
|
Industrial and Commercial |
252,081 | 15 |
% |
74,787 | 4 |
% |
|||||
|
Hospitality and Gaming |
229,220 | 13 |
% |
517,017 | 26 |
% |
|||||
|
Mixed Use |
162,291 | 10 |
% |
249,088 | 13 |
% |
|||||
|
Education Facilities |
105,585 | 6 |
% |
168,634 | 9 |
% |
|||||
|
Office |
101,306 | 6 |
% |
342,034 | 17 |
% |
|||||
|
Condominiums |
49,427 | 3 |
% |
169,366 | 9 |
% |
|||||
|
Other |
91,627 | 5 |
% |
61,823 | 2 |
% |
|||||
|
Total |
$ |
1,701,378 | 100 |
% |
$ |
1,981,193 | 100 |
% |
|||
|
|
|||||||||||
|
Specialty Contractors Segment Backlog by End Market |
As of December 31, |
||||||||||
|
(in thousands) |
2017 |
2016 |
|||||||||
|
Mass Transit |
$ |
780,457 | 53 |
% |
$ |
612,688 | 39 |
% |
|||
|
Mixed Use |
128,669 | 9 |
% |
239,763 | 15 |
% |
|||||
|
Condominiums |
115,612 | 8 |
% |
153,354 | 10 |
% |
|||||
|
Industrial and Commercial |
107,927 | 7 |
% |
130,028 | 8 |
% |
|||||
|
Education Facilities |
96,533 | 7 |
% |
83,897 | 5 |
% |
|||||
|
Health Care Facilities |
66,537 | 5 |
% |
101,494 | 6 |
% |
|||||
|
Transportation |
58,819 | 4 |
% |
105,990 | 7 |
% |
|||||
|
Other |
109,259 | 7 |
% |
146,604 | 10 |
% |
|||||
|
Total |
$ |
1,463,813 | 100 |
% |
$ |
1,573,818 | 100 |
% |
|||
8
|
|
|||||
|
|
As of December 31, |
||||
|
Backlog by Customer Type |
2017 |
2016 |
|||
|
State and Local Agencies |
66 |
% |
57 |
% |
|
|
Private Owners |
26 |
% |
36 |
% |
|
|
Federal Agencies |
8 |
% |
7 |
% |
|
|
Total |
100 |
% |
100 |
% |
|
Types of Contracts
The contracting and management services we provide consist of planning and scheduling the manpower, equipment, materials and subcontractors required for the timely completion of a project in accordance with the terms, plans and specifications contained in a construction contract. We provide these services by entering into traditional contracting arrangements as follows:
|
· |
Fixed price or lump sum contracts are most commonly used for projects in the Civil and Specialty Contractors segments and generally commit the Company to provide all of the resources required to complete a project for a fixed sum. Usually, fixed price contracts transfer more risk to the Company, but offer the opportunity for greater profits. |
|
· |
Guaranteed maximum price (“GMP”) contracts provide for a cost plus fee arrangement up to a maximum agreed upon price. These contracts place risks on the Company for amounts in excess of the GMP, but may permit an opportunity for greater profits than under cost plus fee contracts through sharing agreements with the owner on any cost savings that may be realized. Services provided by our Building segment to various private customers are often performed under GMP contracts. |
|
· |
Unit price contracts are most prevalent for projects in the Civil and Specialty Contractors segments and generally commit the Company to provide an undetermined number of units or components that comprise a project at a fixed price per unit. This approach shifts the risk of estimating the quantity of units required to the project owner, but the risk of increased cost per unit is borne by the Company, unless otherwise allowed for in the contract. |
|
· |
Cost plus fee contracts are used for many projects in the Building and Specialty Contractors segments. Cost plus fee contracts include cost plus fixed fee contracts and cost plus award fee contracts. Cost plus fixed fee contracts provide for reimbursement of approved project costs plus a fixed fee. Cost plus award fee contracts provide for reimbursement of the project costs plus a base fee, as well as an incentive fee based on cost and/or schedule performance. Cost plus fee contracts serve to minimize the Company’s financial risk, but may also limit profits. |
Fixed price contracts account for a substantial portion of our revenue and are expected to continue to represent a sizeable percentage of both total revenue and backlog. The composition of revenue and backlog by type of contract for 2017, 2016 and 2015 is as follows:
|
|
||||||||
|
|
Year Ended December 31, |
|||||||
|
Revenue |
2017 |
2016 |
2015 |
|||||
|
Fixed price |
51 |
% |
47 |
% |
44 |
% |
||
|
Guaranteed maximum price |
24 |
% |
28 |
% |
32 |
% |
||
|
Unit price |
10 |
% |
11 |
% |
12 |
% |
||
|
Cost plus fee and other |
15 |
% |
14 |
% |
12 |
% |
||
|
|
100 |
% |
100 |
% |
100 |
% |
||
|
|
|||||
|
|
As of December 31, |
||||
|
Backlog |
2017 |
2016 |
|||
|
Fixed price |
67 |
% |
63 |
% |
|
|
Guaranteed maximum price |
12 |
% |
21 |
% |
|
|
Unit price |
13 |
% |
6 |
% |
|
|
Cost plus fee and other |
8 |
% |
10 |
% |
|
|
|
100 |
% |
100 |
% |
|
9
Competition
While the construction markets include numerous competitors, especially for small to mid-sized projects, much of the work that we target is for larger, more complex projects where, typically, there are fewer active market participants due to the greater capabilities and resources required to perform the work. Despite this, over the past several years we have seen increased competition, particularly from foreign competitors that have been pursuing major projects in the United States due to the relatively larger size and significant number of U.S. opportunities. We anticipate that the increased level of foreign competition will persist for the foreseeable future.
In our Civil segment, we compete principally with large civil construction firms, including (alphabetically) Dragados USA; Fluor Corporation; Granite Construction; Kiewit Corporation; Skanska USA; Traylor Bros., Inc.; and The Walsh Group. In our Building segment, we compete with a variety of national and regional contractors. Our primary competitors are (alphabetically) AECOM (through its acquisitions of Tishman Construction and Hunt Construction Group); Balfour Beatty Construction; Clark Construction Group; DPR Construction; Gilbane, Inc.; Hensel Phelps Construction Co.; McCarthy Building Companies, Inc.; Skanska USA; Suffolk Construction; and Turner Construction Company. In our Specialty Contractors segment, we compete principally with various regional and local electrical, mechanical and plumbing subcontractors. We believe price, experience, reputation, responsiveness, customer relationships, project completion track record, schedule control, risk management and quality of work are key factors customers consider when awarding contracts.
Construction Costs
If prices for materials, labor or equipment increase excessively, provisions in certain types of contracts often shift all or a major portion of any adverse impact to the customer. In our fixed price contracts, we attempt to insulate ourselves from the unfavorable effects of inflation, when possible, by incorporating escalating wage and price assumptions into our construction cost estimates, by obtaining firm fixed price quotes from major subcontractors and material suppliers, and by entering into purchase commitments for materials early in the project schedule. Construction and other materials used in our construction activities are generally available locally from multiple sources and have been in adequate supply during recent years. Labor resources for our domestic projects are largely obtained through various labor unions. We have not experienced significant labor shortages in recent years, nor do we expect to in the near future, though a significant, rapid growth in our backlog may lead to situations in which labor resources become constrained. We employ expatriate and local labor in selected overseas areas.
Environmental Matters
Our properties and operations are subject to federal, state and municipal laws and regulations relating to the protection of the environment, including requirements for water discharges; air emissions; the use, management and disposal of solid or hazardous materials or wastes; and the cleanup of contamination. In certain circumstances, we may also be required to hire subcontractors to dispose of hazardous materials encountered on a project in accordance with a plan approved in advance by the owner. We continually evaluate our compliance with all applicable environmental laws and regulations, and believe that we are in substantial compliance with those laws and regulations. However, future requirements or amendments to current laws or regulations imposing more stringent requirements could require us to incur additional costs to maintain or achieve compliance.
In addition, some environmental laws, such as the U.S. federal “Superfund” law and similar state statutes, can impose liability for the entire cost of cleanup of contaminated sites upon any of the current or former owners or operators or upon parties who generated waste at, or sent waste to, these sites, regardless of who owned the site at the time of the release or the lawfulness of the original disposal activity. Contaminants have been detected at some of the sites that we own and where we have worked as a contractor in the past, and we have incurred costs for the investigation and remediation of hazardous substances. We believe that our liabilities for these sites are not material, either individually or in the aggregate. We have pollution liability insurance coverage for such matters, and if applicable, we seek indemnification from customers to cover the risks associated with environmental remediation.
Insurance and Bonding
All of our properties and equipment, as well as those of our joint ventures, are covered by insurance in amounts that we believe are consistent with our risk of loss and industry practice. Our wholly owned subsidiary, PCR Insurance Company, issues policies for subcontractor default insurance, auto liability, general liability and workers’ compensation insurance, allowing us to centralize our claims and risk management functions to reduce our insurance-related costs.
As a normal part of the construction business, we are often required to provide various types of surety bonds as an additional level of security of our performance. We also require many of our higher-risk subcontractors to provide surety bonds as security for payment of subcontractors and suppliers and to guarantee their performance. As an alternative to traditional surety bonds, we also have purchased subcontractor default insurance for certain construction projects to insure against the risk of subcontractor default.
10
Employees
The number of our employees varies based on the number of active projects, the type and magnitude of those projects, as well as our position within the lifecycle of those projects. Our total number of employees as of December 31, 2017 was 10,061.
We are signatory to numerous local and regional collective bargaining agreements, both directly and through trade associations, as a union contractor. These agreements cover all necessary union crafts and are subject to various renewal dates. Estimated amounts for wage escalation related to the expiration of union contracts are included in our bids on various projects; accordingly, the expiration of any union contract in the next year is not expected to have any material impact on us. During the past several years, we have not experienced any significant work stoppages caused by our union employees.
Financial information about geographic areas is discussed in Note 12 to the Consolidated Financial Statements under the heading “Geographic Information.”
Available Information
Our website address is www.tutorperini.com. In the “Investor Relations” portion of our website, under “Financial Reports,” subsection “SEC Filings,” you may obtain free electronic copies of our annual reports on Form 10-K, quarterly reports on Form 10‑Q, current reports on Form 8-K and all amendments to those reports, as well as reports under Section 16 of the Exchange Act of transactions in our stock by our directors and executive officers. These reports are made available on our website as soon as reasonably practicable after we electronically file them with the Securities and Exchange Commission (“SEC”). These reports, and any amendments to them, are also available at the Internet website of the SEC, www.sec.gov. The public may also read and copy any materials we file with the SEC at the SEC’s Public Reference Room located at 100 F Street, N.E., Washington, D.C. 20549. In order to obtain information about the operation of the Public Reference Room, you may call 1-800-732-0330. We also maintain various documents, including our Code of Business Conduct and Ethics, Corporate Governance Guidelines and the charters of the Committees of our Board of Directors in the “Corporate Governance” portion of our website.
We are subject to a number of known and unknown risks and uncertainties that could have a material adverse effect on our operations. Set forth below, and elsewhere in this report, are descriptions of the risks and uncertainties that could cause our actual results to differ materially from the results contemplated by the forward-looking statements contained in this report and could have a material adverse effect on our financial condition, results of operations and cash flows.
If we are unable to accurately estimate contract risks, revenue or costs, the timing of new awards, or the pace of project execution, we may incur a loss or achieve lower than anticipated profit.
Accounting for contract-related revenue and costs requires management to make significant estimates and assumptions that may change significantly throughout the project lifecycle, which could result in a material impact to our consolidated financial statements. In addition, cost overruns on fixed price and GMP contracts may result in lower profits or losses. Our results of operations can also fluctuate quarterly and annually depending on when new awards occur and the commencement and progress of work on projects already awarded.
Our contracts require us to perform extra, or change order, work, which can result in disputes or claims and adversely affect our working capital, profits and cash flows.
Our contracts generally require us to perform extra, or change order, work as directed by the customer even if the customer has not agreed in advance on the scope and/or price of the work to be performed. This process may result in disputes or claims over whether the work performed is beyond the scope of work directed by the customer and/or exceeds the price the customer is willing to pay for the work performed. To the extent we do not recover our costs for this work or there are delays in the recovery of these costs, our cash flows and working capital could be adversely impacted.
We are subject to significant legal proceedings which, if determined adversely to us, could harm our reputation, preclude us from bidding on future projects and/or have a material effect on us. We also may invest significant working capital on projects while legal proceedings are being settled.
We are involved in various lawsuits, including the legal proceedings described under Note 6 of the Notes to Consolidated Financial Statements. Litigation is inherently uncertain, and it is not possible to accurately predict what the final outcome will be of any legal proceeding. We must make certain assumptions and rely on estimates, which are inherently subject to risks and uncertainties, regarding potential outcomes of legal proceedings in order to determine an appropriate contingent liability and charge to income. Any result that is materially different than our estimates could have a material adverse effect on our financial condition, results of
11
operations and cash flows. In addition, any adverse judgments could harm our reputation and preclude us from bidding on future projects.
We occasionally bring claims against project owners for additional cost exceeding the contract price or for amounts not included in the original contract price. When these types of events occur and unresolved claims are pending, we may invest significant working capital in projects to cover cost overruns pending the resolution of the relevant claims. A failure to promptly recover on these types of claims could have a material effect on our liquidity and financial results.
A significant slowdown or decline in economic conditions could adversely affect our operations.
Any significant decline in economic conditions in any of the markets we serve or uncertainty regarding the economic outlook, could result in a decline in demand for infrastructure projects and commercial building developments. In addition, any instability in the financial and credit markets could negatively impact our customers’ ability to pay us on a timely basis, or at all, for work on projects already under construction, could cause our customers to delay or cancel construction projects in our backlog or could create difficulties for customers to obtain adequate financing to fund new construction projects. Such consequences could have an adverse impact on our future operating results. Lastly, we are more susceptible to adverse economic conditions in New York and California, as a significant portion of our operations are concentrated in those states.
Competition for new project awards is intense, and our failure to compete effectively could reduce our market share and profits.
New project awards are determined through either a competitive bid basis or on a negotiated basis. Projects may be awarded based solely upon price, but often take into account other factors, such as technical qualifications, proposed project team, schedule and past performance on similar projects. Within our industry, we compete with many international, regional and local construction firms. Some of these competitors have achieved greater market penetration than we have in the markets in which we compete, and some have greater resources than we do. If we are unable to compete successfully in such markets, our relative market share and profits could be reduced.
We may not fully realize the revenue value reported in our backlog due to cancellations or reductions in scope.
As of December 31, 2017, our backlog of uncompleted construction work was approximately $7.3 billion. The revenue projected in our backlog may not be realized or, if realized, may not result in profits. For example, the cancellation or reduction in scope of certain projects in our backlog could have a material adverse effect on our financial condition, results of operations and cash flows.
Our actual results could differ from the assumptions and estimates used to prepare our financial statements.
In preparing our financial statements, we are required under accounting principles generally accepted in the United States (“GAAP”) to make estimates and assumptions as of the date of the financial statements. These estimates and assumptions affect the reported values of assets, liabilities, revenue and expenses, and the disclosure of contingent assets and liabilities. Areas requiring significant estimates by our management include, but are not limited to:
• recognition of contract revenue, costs, profits or losses in applying the principles of percentage-of-completion accounting;
• recognition of revenue related to project incentives or awards we expect to receive;
• recognition of recoveries under contract change orders or claims;
• estimated amounts for expected project losses, warranty costs, contract close-out or other costs;
• collectability of billed and unbilled accounts receivable;
• asset valuations;
• income tax provisions and related valuation allowances;
• determination of expense and potential liabilities under pension and other post-retirement benefit programs; and
• accruals for other estimated liabilities, including litigation and insurance revenue/reserves.
Our actual business and financial results could differ from our estimates of such results, which could have a material negative impact on our financial condition and reported results of operations.
The construction services industry is highly schedule driven, and our failure to meet the schedule requirements of our contracts could adversely affect our reputation and/or expose us to financial liability.
Many of our contracts are subject to specific completion schedule requirements. Any failure to meet contractual schedule requirements could subject us to liquidated damages, liability for our customer’s actual cost arising out of our delay and damage to our reputation.
12
The level of federal, state and local government spending for infrastructure and other public projects could adversely affect the number of projects available to us in the future.
The civil construction and public-works building markets are dependent on the amount of work funded by various government agencies, which depends on many factors, including the condition of the existing infrastructure and buildings; the need for new or expanded infrastructure and buildings; and federal, state and local government spending levels. As a result, our future operating results could be negatively impacted by any decrease in demand for public projects or decrease or delay in government funding, which could result from a variety of factors, including delays in the sale of voter-approved bonds, budget shortfalls, credit rating downgrades or long-term impairment in the ability of state and local governments to raise capital in the municipal bond market.
Our participation in construction joint ventures exposes us to liability and/or harm to our reputation for failures by our partners.
As part of our business, we enter into joint venture arrangements typically to jointly bid on and execute particular projects, thereby reducing our risk profile while enhancing the execution capability and financial reward of project teams. Success on these joint projects depends in large part on whether our joint venture partners satisfy their contractual obligations. Generally, we and our joint venture partners are jointly and severally liable for all liabilities and obligations of our joint ventures. If a joint venture partner fails to perform or is financially unable to bear its portion of required capital contributions or other obligations, including liabilities stemming from lawsuits, we could be required to make additional investments, provide additional services or pay more than our proportionate share of a liability to make up for our partner’s shortfall. Further, if we are unable to adequately address our partner’s performance issues, the customer may terminate the project, which could result in legal liability to us, harm our reputation, reduce our profit on a project or, in some cases, result in a loss.
We require substantial personnel, including construction and project managers and specialty subcontractor resources to execute and perform our contracts in backlog. The successful execution of our business strategies is also dependent upon our ability to attract and retain our key officers, as well as adequately plan for their succession.
Our ability to execute and perform on our contracts in backlog depends in large part upon our ability to hire and retain highly skilled personnel, including project and construction management and trade labor resources, such as carpenters, masons and other skilled workers. In the event we are unable to attract, hire and retain the requisite personnel and subcontractors necessary to execute and perform our backlog, we may experience delays in completing projects in accordance with project schedules or an increase in expected costs, both of which could have a material adverse effect on our financial results, our reputation and our relationships. In addition, if we lack the personnel and specialty subcontractors necessary to perform on our current contract backlog, we may find it necessary to curtail our pursuit of new projects. A significant, rapid growth in our backlog may lead to situations in which labor resources become constrained.
The execution of our business strategies also substantially depends on our ability to retain several key members of our management. Losing any of these individuals could adversely affect our business. The majority of these key officers are not bound by employment agreements. Volatility or lack of positive performance in our stock price may adversely affect our ability to retain key staff to whom we have provided share-based compensation. Additionally, because a substantial portion of our key executives' compensation is placed "at risk" and linked to the performance of our business, when our operating results are negatively impacted, we are at greater risk of employee turnover. If we lose our key executives and do not have qualified successors in place, our operating results would likely be harmed.
Systems and information technology interruption and breaches in data security could adversely impact our ability to operate and negatively impact our operating results.
We are reliant on computer and other information technology that could be interrupted or damaged by a variety of factors including, but not limited to, cyber-attacks, natural disasters, power loss, telecommunications failures, acts of war, computer viruses and physical damage. The resulting consequences could include a loss of critical data, a delay in operations or an unintentional disclosure of confidential information, any of which could have a material impact to our Company and its consolidated financial statements.
We dedicate considerable attention and resources to the safeguarding of our information technology systems. Our systems may, nevertheless, continue to be at risk for cyber-attacks. Consequently, we may need to engage significant resources in the future to remediate the impact of, or further mitigate the risk of, such an attack. Any successful cyber-attack could result in the criminal, or otherwise illegitimate use of, confidential data, including the Company’s data or third-party data for which the Company has the responsibility for safekeeping. Additionally, such an attack could adversely affect our operations, reputation and financial results.
13
We are subject to a number of risks as a U.S. government contractor, which could harm our reputation, result in fines or penalties against us and/or adversely impact our financial condition.
Failure to comply with laws and regulations related to government contracts could result in contract termination, suspension or debarment from contracting with the U.S. government, civil fines and criminal prosecution, any of which could have a material impact on our consolidated financial statements and future financial condition and performance.
We have a substantial amount of indebtedness which could adversely affect our financial position and prevent us from fulfilling our obligations under our debt agreements.
We currently have, and expect to continue to have, a substantial amount of indebtedness. As of December 31, 2017, we had total debt of $736.3 million. If we are unable to meet the terms of the financial covenants or fail to comply with any of the other restrictions contained in the agreements governing our indebtedness, an event of default could occur, causing the debt related to such agreement to become immediately due. If such acceleration occurs, we may not be able to repay such indebtedness as required. Since indebtedness under our 2017 Credit Facility is secured by substantially all of our assets, acceleration of this debt could result in foreclosure of those assets and a negative impact on our operations. In addition, a failure to meet the terms of our 2017 Credit Facility could result in a reduction of future borrowing capacity under the 2017 Credit Facility, causing a loss of liquidity. A loss of liquidity could adversely impact our ability to execute projects in our backlog, obtain new projects, engage subcontractors, and attract and retain key employees.
Conversion of our outstanding Convertible Notes could dilute ownership interests of existing stockholders and could adversely affect the market price of our Common Stock.
Based on the terms of the indenture for the Convertible Notes, we may redeem the Convertible Notes in cash, shares of our Common Stock or a combination of the two. As a result, a conversion of some or all of the Convertible Notes may dilute the ownership interests of existing stockholders. Any sales in the public market of our Common Stock issuable upon such conversion of the Convertible Notes could cause the price of our Common Stock to decline. In addition, the existence of the Convertible Notes may encourage short selling by market participants because a conversion of the Convertible Notes could depress the price of our Common Stock.
We may need to include the potential dilutive impact of our Convertible Notes in our diluted earnings per share calculation.
We currently intend to pay the principal amount of our Convertible Notes in cash; therefore, we have not included the potential dilutive effect of our Convertible Notes in our diluted earnings per share calculations. If, however, there is a change in future circumstances as a result of a decline in our projected cash flow, available cash/liquidity or other reasons, we may conclude at such time that it will be preferable to use shares to satisfy the Convertible Notes. Such a change in our intentions would result in the inclusion of the potential dilutive impact of the Convertible Notes in our diluted earnings per share calculation, which would result in a decrease in our diluted earnings per share.
Weather can significantly affect our revenue and profitability.
Inclement weather conditions, such as significant storms and unusual temperatures, can impact our ability to perform work. Adverse weather conditions can cause delays and increases in project costs, resulting in variability in our revenue and profitability.
Our international operations expose us to economic, political and other risks, as well as uncertainty related to U.S. Government funding, which could adversely affect our revenue and earnings. In addition, we could be adversely affected by violations of the U.S. Foreign Corrupt Practices Act and similar worldwide anti-bribery laws.
For the year ended December 31, 2017, we derived approximately $143.6 million of revenue from our work on projects located outside of the United States. Our international operations expose us to risks inherent in doing business in certain hostile regions outside the United States, including political risks; risks of loss due to acts of war; unstable economic, financial and market conditions; potential incompatibility with foreign subcontractors and vendors; foreign currency controls and fluctuations; trade restrictions; logistical challenges; variations in taxes; and changes in labor conditions, labor strikes and difficulties in staffing and managing international operations. Failure to successfully manage risks associated with our international operations could result in higher operating costs than anticipated or could delay or limit our ability to generate revenue and income from construction operations in key international markets.
The U.S. federal government has approved various spending bills for the construction of defense- and diplomacy-related projects and has allocated significant funds to the defense of U.S. interests around the world from the threat of terrorism. The federal government has also approved funds for development in conjunction with the relocation of military personnel into Guam. However, federal government funding levels for construction projects in the Middle East have decreased significantly over the past several years as the
14
U.S. government has reduced the number of military troops and support personnel in the region. As a result, we have seen a decrease in the number and size of federal government projects available to us in this region. Any decrease in U.S. federal government funding for projects in Guam or in other U.S. Territories or countries in which we are pursuing work may result in project delays or cancellations, which could reduce our revenue and earnings.
Finally, the U.S. Foreign Corrupt Practices Act (“FCPA”), the U.K. Bribery Act of 2010, and similar anti-bribery laws in other jurisdictions generally prohibit companies and their intermediaries from making improper payments for the purpose of obtaining or retaining business. While our policies mandate compliance with these anti-bribery laws, there is no assurance that our internal control policies and procedures will protect us from circumstances or actions that could result in possible criminal penalties or other sanctions, including contract cancellations or debarment and loss of reputation, any of which could have a material adverse impact on our business, financial condition, and results of operations.
Our chairman and chief executive officer could exert influence over the Company due to his position and significant ownership interest.
As of December 31, 2017, our chairman and chief executive officer, Ronald N. Tutor, and three trusts controlled by Mr. Tutor (the “Tutor Group”) owned approximately 18% of the outstanding shares of our Common Stock. Additionally, one of our current directors was appointed by Mr. Tutor pursuant to his right to nominate one member to our Board of Directors, so long as the Tutor Group owns at least 11.25% of the outstanding shares of our Common Stock. Accordingly, Mr. Tutor could exert influence over the outcome of a range of corporate matters, including the election of directors and the approval or rejection of other extraordinary transactions, such as a takeover attempt or sale of the Company or its assets.
In connection with mergers and acquisitions, we have recorded goodwill and other intangible assets that could become impaired and adversely affect our operating results. Assessing whether impairment has occurred requires us to make significant judgments and assumptions about the future, which are inherently subject to risks and uncertainties, and if actual events turn out to be materially less favorable than the judgments we make and the assumptions we use, we may be required to record impairment charges in the future.
We had approximately $635.4 million of goodwill and indefinite-lived intangible assets recorded on our Consolidated Balance Sheet as of December 31, 2017. We assess these assets for impairment annually, or more often if required. Our assessments involve a number of estimates and assumptions that are inherently subjective, require significant judgment and regard highly uncertain matters that are subject to change. The use of different assumptions or estimates could materially affect the determination as to whether or not an impairment has occurred. In addition, if future events are less favorable than what we assumed or estimated in our impairment analysis, we may be required to record impairment charge, which could have a material impact on our consolidated financial statements.
ITEM 1B. UNRESOLVED STAFF COMMENTS
None.
15
We have office facilities and equipment yards in the following locations, which we believe are suitable and adequate for our current needs:
|
|
||||
|
Offices |
Owned or Leased by Tutor Perini |
Business Segment(s) |
||
|
Los Angeles (Sylmar), CA |
Leased |
Corporate, Civil & Specialty Contractors |
||
|
Barrigada, Guam |
Owned |
Civil |
||
|
Black River Falls, WI |
Owned |
Civil |
||
|
Evansville, IN |
Owned |
Civil |
||
|
Fort Lauderdale, FL |
Leased |
Building & Specialty Contractors |
||
|
Framingham, MA |
Owned |
Building |
||
|
Gulfport, MS |
Owned |
Building |
||
|
Henderson, NV |
Owned |
Building & Specialty Contractors |
||
|
Houston, TX |
Owned |
Specialty Contractors |
||
|
Jessup, MD |
Owned |
Civil |
||
|
Lakeview Terrace, CA |
Leased |
Specialty Contractors |
||
|
Mount Vernon, NY |
Leased |
Specialty Contractors |
||
|
New Rochelle, NY |
Owned |
Civil |
||
|
Ozone Park, NY |
Leased |
Specialty Contractors |
||
|
Philadelphia, PA |
Leased |
Building |
||
|
San Carlos, CA |
Leased |
Building |
||
|
|
||||
|
|
||||
|
Equipment Yards |
Owned or Leased by Tutor Perini |
Business Segment(s) |
||
|
Black River Falls, WI |
Owned |
Civil |
||
|
Evansville, IN |
Owned |
Civil |
||
|
Fontana, CA |
Leased |
Civil |
||
|
Jessup, MD |
Owned |
Civil |
||
|
Lakeview Terrace, CA |
Leased |
Specialty Contractors |
||
|
Peekskill, NY |
Owned |
Civil |
||
|
San Leandro, CA |
Leased |
Specialty Contractors |
||
|
Stockton, CA |
Owned |
Building |
Legal Proceedings are set forth in Note 6 of the Notes to Consolidated Financial Statements and are incorporated herein by reference.
ITEM 4. MINE SAFETY DISCLOSURES
We do not own or operate any mines; however, we may be considered a mine operator under the Federal Mine Safety and Health Act of 1977 because we provide construction services to customers in the mining industry. Accordingly, we provide information regarding mine-safety violations and other mining-regulation matters in Exhibit 95 to this Form 10-K.
16
ITEM 5. MARKET FOR THE REGISTRANT’S COMMON EQUITY, RELATED STOCKHOLDER MATTERS AND ISSUER PURCHASES OF EQUITY SECURITIES
Market Information
Our Common Stock is traded on the New York Stock Exchange under the symbol “TPC.” The quarterly high and low prices for our Common Stock in 2017 and 2016 were as follows:
|
|
|||||||||||
|
|
2017 |
2016 |
|||||||||
|
|
High |
Low |
High |
Low |
|||||||
|
Quarter Ended |
|||||||||||
|
March 31 |
$ |
33.00 |
$ |
26.75 |
$ |
16.64 |
$ |
10.16 | |||
|
June 30 |
$ |
32.70 |
$ |
25.35 |
$ |
24.17 |
$ |
14.35 | |||
|
September 30 |
$ |
29.65 |
$ |
23.30 |
$ |
25.98 |
$ |
19.80 | |||
|
December 31 |
$ |
29.90 |
$ |
22.60 |
$ |
30.20 |
$ |
18.05 | |||
Holders
At February 21, 2018, there were 401 holders of record of our Common Stock, including holders of record on behalf of an indeterminate number of beneficial owners.
Dividends and Issuer Purchases of Equity Securities
We did not pay dividends or repurchase our Common Stock during 2017, nor do we have any immediate plans to do so. Furthermore, some of our debt agreements restrict us from paying dividends or repurchasing stock.
Issuance of Unregistered Securities
None.
17
Performance Graph
The following graph compares the cumulative five-year total return to shareholders on our Common Stock relative to the cumulative total returns of the NYSE Composite Index and the Dow Jones U.S. Heavy Construction Index. We selected the Dow Jones U.S. Heavy Construction Index because we believe the index reflects the market conditions within the industry in which we primarily operate. The comparison of total return on investment, defined as the change in year-end stock price plus reinvested dividends, for each of the periods assumes that $100 was invested on December 31, 2012 in each of our Common Stock, the NYSE Composite Index and the Dow Jones U.S. Heavy Construction Index, with investment weighted on the basis of market capitalization.
The comparisons in the following graph are based on historical data and are not intended to forecast the possible future performance of our Common Stock.
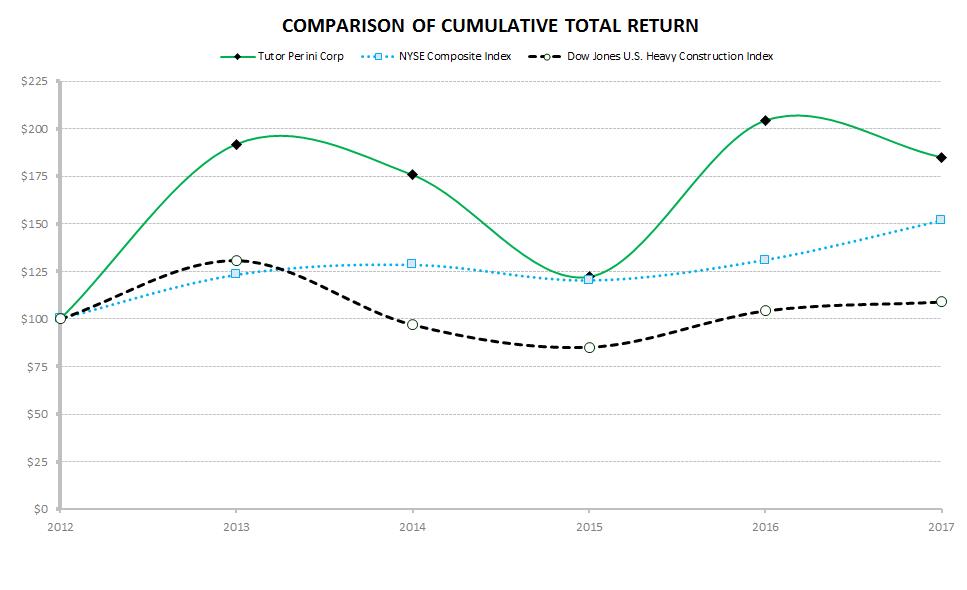
COMPARISON OF CUMULATIVE TOTAL RETURN
Tutor Perini Corp NYSE Composite Index Dow Jones U.S. Heavy Construction Index
$225 $220 $175 $150 $125 $100 $75 $50 $25 $0
2012 2013 2014 2015 20
16 2017
18
ITEM 6. SELECTED FINANCIAL DATA
Selected Consolidated Financial Information
The following selected financial data should be read in conjunction with Item 7. Management’s Discussion and Analysis of Financial Condition and Results of Operations and Item 15. Exhibits and Financial Statement Schedules in this Annual Report. The following tables present selected financial data for the last five years. This selected financial data should be read in conjunction with the consolidated financial statements and related notes included in Item 15. Exhibits and Financial Statement Schedules.
|
|
||||||||||||||
|
CONSOLIDATED OPERATING RESULTS |
Year Ended December 31, |
|||||||||||||
|
(In thousands, except per common share data) |
2017 |
2016 |
2015 |
2014 |
2013 |
|||||||||
|
Revenue: |
||||||||||||||
|
Civil |
$ |
1,602,175 |
$ |
1,668,963 |
$ |
1,889,907 |
$ |
1,687,144 |
$ |
1,441,416 | ||||
|
Building |
1,941,325 | 2,069,841 | 1,802,535 | 1,503,837 | 1,551,979 | |||||||||
|
Specialty Contractors |
1,213,708 | 1,234,272 | 1,228,030 | 1,301,328 | 1,182,277 | |||||||||
|
Total |
4,757,208 | 4,973,076 | 4,920,472 | 4,492,309 | 4,175,672 | |||||||||
|
Cost of operations |
(4,302,803) | (4,515,886) | (4,564,219) | (3,986,867) | (3,708,768) | |||||||||
|
Gross profit |
454,405 | 457,190 | 356,253 | 505,442 | 466,904 | |||||||||
|
General and administrative expenses |
(274,928) | (255,270) | (250,840) | (263,752) | (263,082) | |||||||||
|
Income from construction operations(c) |
179,477 | 201,920 | 105,413 | 241,690 | 203,822 | |||||||||
|
Other income (expense), net(b) |
43,882 | 6,977 | 13,569 | (8,217) | (16,692) | |||||||||
|
Interest expense |
(69,384) | (59,782) | (45,143) | (46,035) | (47,515) | |||||||||
|
Income before income taxes |
153,975 | 149,115 | 73,839 | 187,438 | 139,615 | |||||||||
|
Income tax benefit (provision)(a) |
569 | (53,293) | (28,547) | (79,502) | (52,319) | |||||||||
|
Net income |
154,544 | 95,822 | 45,292 | 107,936 | 87,296 | |||||||||
|
Less: Net income attributable to noncontrolling interests |
(6,162) |
— |
— |
— |
— |
|||||||||
|
Net income attributable to Tutor Perini Corporation |
$ |
148,382 |
$ |
95,822 |
$ |
45,292 |
$ |
107,936 |
$ |
87,296 | ||||
|
|
||||||||||||||
|
Earnings per common share:(a)(b)(c) |
||||||||||||||
|
Basic |
$ |
2.99 |
$ |
1.95 |
$ |
0.92 |
$ |
2.22 |
$ |
1.82 | ||||
|
Diluted |
$ |
2.92 |
$ |
1.92 |
$ |
0.91 |
$ |
2.20 |
$ |
1.80 | ||||
|
|
||||||||||||||
|
Weighted-average common shares outstanding: |
||||||||||||||
|
Basic |
49,647 | 49,150 | 48,981 | 48,562 | 47,851 | |||||||||
|
Diluted |
50,759 | 49,864 | 49,666 | 49,114 | 48,589 | |||||||||
|
(a) |
In December 2017, the Tax Cuts and Jobs Act of 2017 was enacted reducing the U.S. corporate income tax rate from 35% to 21%, effective in 2018. As a result, the Company recognized a favorable tax adjustment of $53.3 million ($1.05 per diluted share) primarily due to the revaluation of its deferred tax assets and liabilities. |
|
(b) |
On June 6, 2017, the Company received $37.0 million ($0.43 per diluted share) in a cash settlement with Merrill Lynch, Pierce, Fenner & Smith Incorporated (“Merrill Lynch”), as successor in interest to Banc of America Securities LLC and Bank of America, N.A. (collectively “BofA”). The settlement pertained to litigation, which was filed by the Company in 2011, and related to the purchase by the Company of certain auction-rate securities from BofA. The Company recognized the settlement as a gain during the second quarter of 2017. For additional information, see Note 7 of the Notes to Consolidated Financial Statements. |
|
(c) |
During the year ended December 31, 2015, the Company had a decrease of $45.6 million in income from construction operations ($0.53 per diluted share) due to unfavorable adjustments on various Five Star Electric projects in the Specialty Contractors segment. In addition, that same year there was a decrease of $24.3 million in income from construction operations ($0.28 per diluted share) due to unfavorable adjustments to the estimated cost to complete a Building segment project in New York. The Company’s 2015 results were also impacted by an unfavorable adjustment for an adverse legal decision related to a long-standing litigation matter in the Civil segment, which resulted in a decrease of $23.9 million in income from construction operations ($0.28 per diluted share). Furthermore, the Company recorded favorable adjustments for a Civil segment runway reconstruction project, which resulted in an increase of $13.7 million in income from construction operations ($0.16 per diluted share) in 2015. |
The Company's results for the year ended December 31, 2014 included a positive impact related to changes in the estimated recoveries for two Civil segment projects and a Building segment hospitality and gaming project. With respect to the two Civil segment projects, there was an increase of $25.9 million in income from construction operations ($0.30 per diluted share) and a $9.4 million decrease in income from construction operations ($0.11 per diluted share). The Building project change in estimate resulted in an $11.4 million increase in income from construction operations ($0.14 per diluted share).
19
The Company's income from construction operations during the year ended December 31, 2013 was positively impacted by $13.8 million ($0.18 per diluted share) because of changes in the estimated recovery for the above-mentioned hospitality and gaming project.
|
|
|||||||||||||||
|
|
As of and For the Year Ended December 31, |
||||||||||||||
|
(In thousands, except ratios and percentages) |
2017 |
2016 |
2015 |
2014 |
2013 |
||||||||||
|
CONSOLIDATED FINANCIAL POSITION |
|||||||||||||||
|
Current assets |
$ |
3,074,392 |
$ |
2,837,756 |
$ |
2,608,939 |
$ |
2,454,594 |
$ |
2,077,680 | |||||
|
Current liabilities |
1,581,846 | 1,518,943 | 1,448,819 | 1,344,447 | 1,288,235 | ||||||||||
|
Working capital |
$ |
1,492,546 |
$ |
1,318,813 |
$ |
1,160,120 |
$ |
1,110,147 |
$ |
789,445 | |||||
|
Current ratio |
1.94 | 1.87 | 1.80 | 1.83 | 1.61 | ||||||||||
|
|
|||||||||||||||
|
Property and equipment, net |
$ |
467,499 |
$ |
477,626 |
$ |
523,525 |
$ |
527,602 |
$ |
498,125 | |||||
|
Total assets |
4,264,123 | 4,038,620 | 3,861,300 | 3,711,450 | 3,358,663 | ||||||||||
|
Capitalization: |
|||||||||||||||
|
Total debt |
736,276 | 759,519 | 817,684 | 857,791 | 726,171 | ||||||||||
|
Stockholders’ equity |
1,713,275 | 1,553,023 | 1,420,227 | 1,365,505 | 1,247,535 | ||||||||||
|
Total capitalization |
$ |
2,449,551 |
$ |
2,312,542 |
$ |
2,237,911 |
$ |
2,223,296 |
$ |
1,973,706 | |||||
|
Total debt as a percentage of total capitalization |
30 |
% |
33 |
% |
37 |
% |
39 |
% |
37 |
% |
|||||
|
Ratio of debt to equity |
0.43 | 0.49 | 0.58 | 0.63 | 0.58 | ||||||||||
|
Stockholders' equity per common share |
$ |
34.42 |
$ |
31.56 |
$ |
28.94 |
$ |
28.06 |
$ |
25.76 | |||||
|
OTHER DATA |
|||||||||||||||
|
Backlog at year end |
$ |
7,283,434 |
$ |
6,227,137 |
$ |
7,465,129 |
$ |
7,831,725 |
$ |
6,954,287 | |||||
|
New awards |
5,813,505 | 3,735,084 | 4,553,877 | 5,369,747 | 5,526,335 | ||||||||||
|
Capital expenditures |
30,280 | 15,743 | 35,912 | 75,829 | 59,049 | ||||||||||
|
Net cash provided by (used in) operating activities |
163,550 | 113,336 | 14,072 | (56,678) | 50,728 | ||||||||||
|
Net cash used in investing activities |
(41,409) | (18,495) | (32,415) | (26,957) | (43,574) | ||||||||||
|
Net cash (used in) provided by financing activities |
(75,376) | (24,190) | (41,788) | 99,295 | (55,287) | ||||||||||
ITEM 7. MANAGEMENT’S DISCUSSION AND ANALYSIS OF FINANCIAL CONDITION AND RESULTS OF OPERATIONS
The following discussion and analysis of our financial condition and results of operations should be read in conjunction with our Consolidated Financial Statements and the accompanying Notes to Consolidated Financial Statements included in Item 15. Exhibits and Financial Statement Schedules in this Annual Report. This discussion contains forward-looking statements, which involve risks and uncertainties. For cautions about relying on such forward-looking statements, please refer to the section entitled “Forward-Looking Statements” at the beginning of this Annual Report immediately prior to Item 1. Our actual results could differ materially from those anticipated in the forward-looking statements as a result of certain factors, including but not limited to those discussed in Item 1A. Risk Factors and elsewhere in this Annual Report.
Executive Overview
Consolidated revenue for 2017 was $4.8 billion compared to $5.0 billion for 2016. The slight reduction was primarily due to decreased volume in our Building and Civil segments attributed to various projects that are completed or nearing completion. The decrease was partially offset by higher volume on certain Civil segment projects in California and New York, as well as certain Building segment projects in California and Maryland. In addition, revenue in 2017 was negatively impacted by the timing of certain Building and Civil projects that are in ramp-up stages.
Consolidated revenue for 2016 was $5.0 compared to $4.9 billion for 2015. The modest improvement was attributable to higher volume in our Building segment, driven by various Building projects primarily in California.
Income from construction operations for 2017 was $179.5 million compared to $201.9 million for 2016. The decrease was driven by net unfavorable adjustments primarily related to certain mechanical projects, none of which were individually material, the above-mentioned volume changes, and higher compensation-related general and administrative expenses in anticipation of a greater volume of new work. The decrease was partially offset by work performed on certain higher margin Civil and Building projects.
Income from construction operations for 2016 was $201.9 million compared to $105.4 million for 2015. The increase was primarily due to significantly improved operating performance in all segments, as income from construction operations in 2015 included the impact of significant project charges recorded for various Five Star Electric projects in New York in the Specialty Contractors
20
segment, decreased activity on certain higher-margin civil projects, unfavorable adjustments related to the estimate of costs to complete an office building project in New York and the adverse Brightwater litigation-related charge for a legacy civil project.
The effective tax rate was (0.4)%, 35.7% and 38.7% for 2017, 2016 and 2015, respectively. The effective tax rate for 2017 was positively impacted by the enactment of the Tax Cuts and Jobs Act of 2017 (the “TCJA”), which was signed into law on December 22, 2017. The TCJA includes a number of provisions, including the lowering of the U.S. corporate tax rate from 35% to 21%, effective January 1, 2018. As a result of the TCJA, we recognized an income tax benefit of $53.3 million related primarily to the adjustments resulting from the remeasurement of deferred tax assets and liabilities. The 2016 rate was favorably impacted by rate changes associated with a shift in revenue mix between states affecting state apportionment, as well as various return-to-provision and deferred tax adjustments related to depreciation. The 2015 rate was favorably impacted by the resolution of certain state tax matters.
Earnings per diluted share was $2.92, $1.92 and $0.91 in 2017, 2016 and 2015, respectively. Earnings per diluted share in 2017 included the above-mentioned tax benefit of $53.3 million ($1.05 per diluted share), as well as a gain on a $37.0 million ($0.43 per diluted share) legal settlement (see Note 7 of the Notes to Consolidated Financial Statements). The substantial earnings growth in 2016 was due to significantly improved operating performance in all segments, as discussed above.
Cash flow from operations was $163.6 million in 2017 (a record high for the Company since the 2008 merger) compared to $113.1 million in 2016, and compared to a cash flow from operations of $14.1 million in 2015. The record operating cash generated in 2017 was due to continued improvements in the Company’s billing and collection cycle as a result of management’s intense focus on working capital management.
Consolidated new awards in 2017 were $5.8 billion compared to $3.7 billion in 2016 and $4.6 billion in 2015. The Civil segment was the predominant contributor of new awards during 2017. The Civil and Building segments were both major contributor of new awards during 2016. The Building segment was the primary contributor of new awards during 2015.
Consolidated backlog was $7.3 billion, $6.2 billion and $7.5 billion as of December 31, 2017, 2016 and 2015, respectively. The Company experienced backlog growth of 17% in 2017, driven by the Civil segment. As of December 31, 2017, the mix of backlog by segment was 57% for Civil, 23% for Building and 20% for Specialty Contractors. The reduced level of backlog at the end of 2016 was the result of revenue burn during the year that outpaced new awards in the Building and Specialty Contractors segments. The relatively higher backlog at the end of 2015 was primarily due to significant new awards in the Building segment, partially offset by revenue burn that outpaced new awards in the Civil and Specialty Contractors segments.
Most projects in the Civil segment’s backlog typically convert to revenue over a period of three to five years and in the Building and Specialty Contractors segments over a period of one to three years. We estimate that approximately $3.6 billion, or 49%, of our backlog as of December 31, 2017 will be recognized as revenue in 2018.
The following table presents the changes in backlog in 2017:
|
|
|||||||||||
|
|
Backlog at |
Revenue |
Backlog at |
||||||||
|
|
December 31, |
New Awards |
Recognized |
December 31, |
|||||||
|
(in millions) |
2016 |
in 2017 (a) |
in 2017 |
2017 |
|||||||
|
Civil |
$ |
2,672.1 |
$ |
3,048.3 |
$ |
(1,602.2) |
$ |
4,118.2 | |||
|
Building |
1,981.2 | 1,661.5 | (1,941.3) | 1,701.4 | |||||||
|
Specialty Contractors |
1,573.8 | 1,103.7 | (1,213.7) | 1,463.8 | |||||||
|
Total |
$ |
6,227.1 |
$ |
5,813.5 |
$ |
(4,757.2) |
$ |
7,283.4 | |||
|
(a) |
New awards consist of the original contract price of projects added to our backlog plus or minus subsequent changes to the estimated total contract price of existing contracts. |
The outlook for our Company’s growth over the next several years continues to be the most favorable it has been in many years, particularly in the Civil segment. In addition to our substantial backlog, we expect significant new award activity based on long-term capital spending plans by state, local and federal customers, as well as bipartisan support for infrastructure investments. In recent U.S. elections, voters in numerous states approved dozens of long-term transportation funding measures totaling approximately $200 billion in long-term funding. The largest of these were in Los Angeles County, where Measure M, a half-cent sales tax increase, was approved and is expected to generate $120 billion of funding over 40 years and in Seattle, Washington, where Sound Transit 3 was passed and is expected to generate $54 billion of funding over 25 years. In addition, the Trump Administration has proposed a significant infrastructure investment program. Also, several large, long-duration civil infrastructure programs with which we are already involved are progressing, such as California’s High-Speed Rail system and New York City’s East Side Access project. Planning and permitting activities continue on Amtrak’s Northeast Corridor Improvements, including the Gateway Program, which is expected to eventually bring new rail tunnels beneath the Hudson River to connect service between New Jersey and New York’s Penn Station. Finally, sustained low interest rates and capital costs are anticipated to drive high demand and continued spending by private and public customers on infrastructure projects.
21
For a more detailed discussion of operating performance of each business segment, corporate general and administrative expenses and other items, see “Results of Segment Operations,” “Corporate, Tax and Other Matters” and “Liquidity and Financial Condition” below.
Results of Segment Operations
The following presents the Company’s results of operations by segment:
Civil Segment
Revenue and income from construction operations for the Civil segment are summarized as follows:
|
|
||||||||
|
|
Year Ended December 31, |
|||||||
|
(in millions) |
2017 |
2016 |
2015 |
|||||
|
Revenue |
$ |
1,602.2 |
$ |
1,669.0 |
$ |
1,889.9 | ||
|
Income from construction operations |
192.2 | 172.7 | 145.2 | |||||
Revenue for 2017 decreased a modest 4% compared to 2016. The decrease was primarily due to the impact of certain projects in New York, Washington and the Midwest that are completed or nearing completion. The decrease was partially offset by increased activity on certain mass-transit projects in California and New York that are ramping up. Revenue for 2016 decreased 12% compared to 2015, principally due to the prior-year completion of a large runway reconstruction project in New York and reduced activity in 2016 on a platform project at Hudson Yards in New York, which is nearing completion. The decrease was partially offset by increased activity on various projects, including a large tunnel project in Seattle, Washington and a large mass-transit project in California.
Despite the revenue reduction mentioned above, income from construction operations increased 11% in 2017 compared to 2016, principally due to increased project execution activity on certain higher-margin projects in California and New York. Income from construction operations increased 19% in 2016 compared to 2015, due to improved operating performance and because the 2015 results included the Brightwater litigation-related charge of $23.9 million. The increase was partially offset by the impact of the reduced volume discussed above.
Operating margin was 12.0% in 2017 compared to 10.3% in 2016 and 7.7% in 2015. The operating margin increases in 2017 and 2016 were primarily due to the reasons discussed above that impacted revenue and income from construction operations.
New awards in the Civil segment totaled $3.0 billion in 2017, $1.6 billion in 2016 and $1.1 billion in 2015. New awards in 2017 included a $1.4 billion joint venture mass-transit project in California; a bridge project in Iowa valued at $323 million; a mass-transit project in New York worth $292 million; a joint venture tunnel project for a hydroelectric generating station in British Columbia, Canada, valued at $274 million; a bridge project in New York valued at $189 million; $97 million of additional scope for a platform project in New York; a joint venture bridge project in Minnesota, for which the Company’s portion is valued at $90 million; a bridge project in New York valued at $82 million; a highway project in Maryland worth $78 million; and a military training range project in Guam worth $78 million.
New awards in 2016 included a $663 million mass-transit project in New York, approximately $277 million of new bridge projects in the Midwest, the Company’s share of $244 million of additional contract scope for a mass-transit project in California, a $107 million highway project in Virginia and a $97 million airport terminal expansion project in Guam. New awards in 2015 included a mass-transit project in New York valued at $80 million; highway projects in Delaware, Maryland and Pennsylvania valued at $70 million, $60 million and $58 million, respectively; and a tunnel extension project in New York worth $56 million.
Backlog for the Civil segment was $4.1 billion as of December 31, 2017, compared to $2.7 billion as of both December 31, 2016 and 2015. Civil segment backlog grew 54% year-over-year in 2017 as a result of significant new award activity, including the above-mentioned $1.4 billion mass-transit project in California. The segment continues to experience strong demand reflected in a large pipeline of prospective projects and substantial anticipated funding from various voter-approved transportation measures; the Trump Administration’s considerable proposed infrastructure investment program; and public agencies’ long-term spending plans. The Civil segment is well-positioned to capture its share of these prospective projects. The segment, however, continues to face considerable competition, including occasional aggressive bids from foreign competitors.
22
Building Segment
Revenue and income from construction operations for the Building segment are summarized as follows:
|
|
||||||||
|
|
Year Ended December 31, |
|||||||
|
(in millions) |
2017 |
2016 |
2015 |
|||||
|
Revenue |
$ |
1,941.3 |
$ |
2,069.8 |
$ |
1,802.5 | ||
|
Income (Loss) from construction operations |
34.2 | 51.6 | (1.2) | |||||
Revenue for 2017 decreased slightly compared to 2016, principally due to decreased project execution activity on certain projects in California and Florida that are substantially complete, partially offset by increased activity on certain hospitality and gaming projects and a large technology project. Revenue for 2016 increased 15% compared to 2015, principally due to increased activity on various commercial office, technology, health care, hospitality and gaming, and retail building projects in California. This increase was partially offset by the completion in 2015 of a hospitality and gaming project in Mississippi.
Income from construction operations decreased 34% in 2017 compared to 2016, primarily due to favorable close-out activities in 2016 on two projects in New York and the volume changes mentioned above. The decrease was partially offset by improved performance on a large technology project in California that is nearing completion. Income from construction operations increased considerably in 2016 compared to 2015 due to improved operating performance and the above-mentioned favorable close-out activities on the two New York projects, as well as unfavorable adjustments in 2015, totaling $24.3 million, to the estimated cost to complete an office building project in New York.
Operating margin was 1.8% in 2017 compared to 2.5% in 2016 and (0.1)% in 2015. The operating margin changes in 2017 and 2016 were due to the factors mentioned above that drove the changes in revenue and income from construction operations.
New awards in the Building segment totaled $1.7 billion in 2017, $1.3 billion in 2016 and $2.4 billion in 2015. New awards in 2017 included four health care projects in California collectively worth $328 million; $250 million of initial funding for a new technology office building in California, which is eventually anticipated to be worth approximately $500 million; additional scope of work valued at $121 million for a technology office project in California; a U.S. embassy renovation project in Uruguay valued at $87 million; and an $80 million military facility project in Saudi Arabia. New awards in 2016 included a hospitality and gaming project in California and another in Maryland, collectively valued at $372 million; a hospitality project in California valued at $120 million; and a multi-unit residential project in Florida valued at $72 million. New awards in 2015 included a technology research and development office project valued at $800 million and $230 million of incremental funding for a biotechnology project, both in California, and a hospitality project in Pennsylvania worth $239 million.
Backlog for the Building segment was $1.7 billion as of December 31, 2017, compared to $2.0 billion as of December 31, 2016 and $2.8 billion as of December 31, 2015. The decline in backlog for both 2017 and 2016 was due to revenue burn that outpaced new awards during each year. Building segment backlog is anticipated to grow in 2018, as the segment continues to have a large volume of prospective projects, some of which have already been bid and are expected to be selected and awarded by customers during the first half of 2018. Elevated demand is expected to continue due to ongoing customer spending supported by a low interest rate environment. The Building segment is well-positioned to capture its share of prospective projects based on its strong customer relationships and long-term reputation for excellence in delivering high-quality projects on time and within budget.
Specialty Contractors Segment
Revenue and income from construction operations for the Specialty Contractors segment are summarized as follows:
|
|
||||||||
|
|
Year Ended December 31, |
|||||||
|
(in millions) |
2017 |
2016 |
2015 |
|||||
|
Revenue |
$ |
1,213.7 |
$ |
1,234.3 |
$ |
1,228.0 | ||
|
Income from construction operations |
18.9 | 37.9 | 15.7 | |||||
Revenue for 2017 decreased modestly compared to 2016. Decreased activity on various electrical projects in New York was largely offset by increased activity on various electrical projects in the southern U.S. and California. Revenue for 2016 was virtually level with 2015.
Income from construction operations decreased 50% in 2017 compared to 2016, principally due to the impact of unfavorable project adjustments on certain mechanical projects in New York and California, none of which were individually material. The decrease was partially offset by improved profitability on various electrical projects in New York and increased activity on various electrical projects in the southern U.S. and California. Income from construction operations increased 141% in 2016 because 2015 included
23
unfavorable adjustments totaling $45.6 million for several Five Star Electric projects in New York, none of which were individually material.
Operating margin was 1.6% in 2017 compared to 3.1% in 2016 and 1.3% in 2015. The margin changes in 2017 and 2016 were due to the factors mentioned above that impacted income from construction operations for both years.
New awards in the Specialty Contractors segment totaled $1.1 billion in 2017, $867 million in 2016 and $1.1 billion in 2015. New awards in 2017 included approximately $426 million for various electrical projects in the southern U.S. and California, two electrical subcontracts for mass-transit projects in New York collectively valued at $158 million, and four mechanical contracts in New York with a total value of $131 million. New awards in 2016 included various mechanical projects in New York collectively valued at approximately $146 million, several electrical projects in the southern United States totaling approximately $93 million and an electrical subcontract for a mass-transit project in New York valued at $86 million. New awards in 2015 included an electrical subcontract valued at $90 million for a mass-transit project in New York and an electrical subcontract valued at $73 million for a Hudson Yards office tower in New York.
Backlog for the Specialty Contractors segment was $1.5 billion as of December 31, 2017 compared to $1.6 billion as of December 31, 2016 and $1.9 billion as of December 31, 2015. The Specialty Contractors segment continues to have a substantial volume of prospective projects, with demand for its services supported by sustained spending on civil and building projects. The Specialty Contractors segment is well-positioned to capture its share of prospective projects based on the size and scale of our business units that operate in New York, Texas, Florida and California and the strong reputation held by these business units for high-quality work on large, complex projects.
Corporate, Tax and Other Matters
Corporate General and Administrative Expenses
Corporate general and administrative expenses were $65.9 million in 2017, $60.2 million in 2016 and $54.2 million in 2015. The increase in 2017 was primarily due to higher compensation-related expenses pertaining to the employment and retention of certain key executives. In 2016, the increase in corporate general and administrative expenses compared to 2015 was predominantly due to increased compensation expense attributable to improved financial results and the hiring of several key executives.
Other Income, Net, Interest Expense and Income Tax Benefit (Provision)
|
|
||||||||
|
|
Year Ended December 31, |
|||||||
|
(in millions) |
2017 |
2016 |
2015 |
|||||
|
Other income, net |
$ |
43.9 |
$ |
7.0 |
$ |
13.6 | ||
|
Interest expense |
(69.4) | (59.8) | (45.1) | |||||
|
Income tax benefit (provision) |
0.6 | (53.3) | (28.5) | |||||
Other income, net, increased by $36.9 million in 2017 compared to 2016, and decreased $6.6 million in 2016 compared to 2015. The increase in 2017 was due to a $37.0 million legal settlement, as discussed in Note 7 of the Notes to Consolidated Financial Statements. Other income in 2015 included adjustments to decrease contingent earn-out liabilities related to prior business acquisitions.
Interest expense increased $9.6 million in 2017 compared to the prior year, principally due to non-cash extinguishment costs related to our debt restructuring transactions in April 2017, as well as increased non-cash interest charges from the amortization of debt discount and issuance costs. Interest expense in 2016 increased $14.7 million compared to 2015 primarily due to cash and non-cash interest expense related to the Convertible Notes issued in June 2016, as well as an increase in non-cash interest expense associated with fees related to two amendments to the Company’s 2014 Credit Facility. The year ended December 31, 2016 was also impacted by higher net borrowing rates.
The effective income tax rate was (0.4)% for 2017, 35.7% for 2016 and 38.7% for 2015. As discussed in the Executive Overview, we recognized an income tax benefit of $53.3 million in 2017 related primarily to the adjustments resulting from the remeasurement of deferred tax assets and liabilities due to the enactment of the TCJA. Excluding the benefit resulting from the enactment of the TCJA, the effective income tax rate for 2017 would have been 34.3%. The effective tax rate for 2016 compared to 2015 was favorably impacted by rate changes associated with a shift in revenue mix between states affecting state apportionment, as well as various return-to-provision and depreciation adjustments.
Liquidity and Financial Condition
Liquidity is provided by available cash and cash equivalents, cash generated from operations, credit facilities and access to capital markets. On April 20, 2017, we issued $500 million of senior notes and entered into a new credit facility with a $350 million revolver.
24
We used the net proceeds to repurchase or redeem our 7.625% Senior Notes due 2018, (the “2010 Senior Notes”) in full and repay all borrowings under our Sixth Amended and Restated Credit Agreement (with subsequent amendments, the “2014 Credit Facility”, with Bank of America, N.A. as Administrative Agent, Swing Line Lender and L/C Issuer and a syndicate of other lenders. The 2014 Credit Facility provides for a $300 million revolving credit facility (the “2014 Revolver”), a $250 million term loan (the “Term Loan”) and a sublimit for the issuance of letters of credit up to the aggregate amount of $150 million, all maturing on May 1, 2018. We believe that the increased liquidity that resulted from this refinancing will help fund any working capital needs for the significant number of project opportunities that we see over the next several years.
Cash and Working Capital
Cash and cash equivalents were $192.9 million as of December 31, 2017 compared to $146.1 million as of December 31, 2016. Cash available for general corporate purposes was $94.7 million and $49.5 million as of December 31, 2017 and 2016, respectively, with the remainder being our proportionate share of cash held by our unconsolidated joint ventures and also amounts held by our consolidated joint ventures, which, in both cases, were available only for joint venture-related uses, including distributions to joint venture partners of $98.2 million and $96.6 million, respectively. In addition, our restricted cash and restricted investments, held primarily to secure insurance-related contingent obligations, were $4.8 million and $53.0 million, respectively, as of December 31, 2017 compared to restricted cash of $50.5 million as of December 31, 2016.
During the year ended December 31, 2017, net cash provided by operating activities was $163.6 million, due primarily to cash generated from income sources partially offset by changes in net investment in working capital. The change in working capital primarily reflects an increase in accounts receivable and costs and estimated earnings in excess of billings, which was mostly offset by an increase in billings in excess of costs and estimated earnings. During the year ended December 31, 2016, $113.3 million in cash was provided from operating activities, primarily due to favorable operating results, somewhat offset by changes in net investment in working capital. The change in working capital primarily reflected increases in accounts receivable (both trade accounts receivable and retention) related to billing activity, offset by a reduction of costs and estimated earnings in excess of billings.
Cash flow from operations for 2017 was a record high for the Company since the 2008 merger. In addition, for the second consecutive year the Company’s cash flow from operations exceeded its net income. The $50.2 million improvement in cash flow from operations for 2017 compared to 2016 was due to a lower net investment in working capital, which reflects management’s continued focus on improving the Company’s billing and collection cycle. Cash flow from operations for 2016 increased $99.3 million compared to 2015. The increase reflected improved year-over-year profitability and lower net investment in working capital resulting from a significant reduction in costs and estimated earnings in excess of billings. The improvement in cash generation in 2016 compared to 2015 was even more pronounced when considering there were significant collections by the Company in the first quarter of 2015 related to the settlements of past disputes over the CityCenter project in Las Vegas, Nevada and a hospital project in Santa Monica, California.
During 2017 and 2016, we used $41.4 million and $18.5 million of cash from investing activities, respectively. Net cash used in both years was primarily due to the acquisition of property and equipment.
During 2017, we utilized $75.4 million of cash from financing activities, primarily due to the net paydown of debt, $17.5 million distributions paid to noncontrolling interests and the payment of $15.3 million in debt issuance and extinguishment costs related to the debt restructuring transactions. Net cash used in financing activities for 2016 was $24.2 million, which was primarily due to the net pay down of debt and the payment of $15.1 million in debt issuance costs associated with two amendments to the 2014 Credit Facility and the issuance of $200.0 million of Convertible Notes.
As of December 31, 2017, we had working capital of $1.5 billion, a ratio of current assets to current liabilities of 1.94 and a ratio of debt to equity of 0.43 compared to working capital of $1.3 billion, a ratio of current assets to current liabilities of 1.87 and a ratio of debt to equity of 0.49 at December 31, 2016.
Due to the enactment of the TCJA, as discussed in Corporate, Tax and Other Matters, we expect that our future cash requirements for income taxes will decrease as a result of the reduction of the U.S. corporate tax rate from 35% to 21% that became effective January 1, 2018.
Debt
Summarized below are the key terms of our debt as of December 31, 2017. For additional information, refer to Note 5 of the Notes to Consolidated Financial Statements, as applicable.
2017 Credit Facility
On April 20, 2017, we entered into a credit agreement (the “2017 Credit Facility”) with SunTrust Bank as Administrative Agent, Swing Line Lender and L/C Issuer and a syndicate of other lenders. The 2017 Credit Facility provides for a $350 million revolving
25
credit facility (the “2017 Revolver”) and a sublimit for the issuance of letters of credit and swingline loans up to the aggregate amount of $150 million and $10 million, respectively, both maturing on April 20, 2022 unless any of the Convertible Notes are outstanding on December 17, 2020, in which case all such borrowings will mature on December 17, 2020 (subject to certain further exceptions). In addition, the 2017 Credit Facility permits additional borrowings in an aggregate amount of $150 million, which can be in the form of increased capacity on the 2017 Revolver or the establishment of one or more term loans.
The table below presents our actual and required consolidated fixed charge coverage ratio and consolidated leverage ratio under the 2017 Credit Facility for the period, which are calculated on a rolling four-quarter basis:
|
|
||||
|
|
Twelve Months Ended December 31, 2017 |
|||
|
|
Actual |
Required |
||
|
Fixed charge coverage ratio |
2.63 to 1.00 |
> or = 1.25 : 1.00 |
||
|
Leverage ratio |
2.45 to 1.00 |
< or = 4.00 : 1.00 |
||
As of the filing date of this Form 10-K, we are in compliance and expect to continue to be in compliance with the financial covenants under the 2017 Credit Facility.
2017 Senior Notes
On April 20, 2017, we issued $500 million in aggregate principal amount of 6.875% Senior Notes due 2025 (the “2017 Senior Notes”) in a private placement. Interest on the 2017 Senior Notes is payable in arrears semi-annually on May 1 and November 1 of each year, beginning on November 1, 2017.
Repurchase and Redemption of 2010 Senior Notes and Termination of 2014 Credit Facility
We used proceeds from the 2017 Senior Notes and 2017 Revolver to repurchase or redeem our 2010 Senior Notes, to pay off our Term Loan and 2014 Revolver, as well as to pay accrued but unpaid interest and fees. In addition, we satisfied and discharged the indenture governing the 2010 Senior Notes and terminated the 2014 Credit Facility.
Convertible Notes
On June 15, 2016, we completed an offering of $200 million of 2.875% Convertible Senior Notes due June 15, 2021 (the “Convertible Notes”). The Convertible Notes are senior unsecured obligations of the Company. Interest on the Convertible Notes is payable on June 15 and December 15 of each year, commencing on December 15, 2016, until the maturity date. As of December 31, 2017, none of the conversion provisions of our Convertible Notes have been triggered.
Equipment financing and mortgages
We have certain loans entered into for the purchase of specific property, plant and equipment and secured by the assets purchased. The aggregate balance of equipment financing loans was approximately $61.1 million and $84.9 million at December 31, 2017 and 2016, respectively, with interest rates ranging from 1.90% to 5.93% with equal monthly installment payments over periods up to ten years with additional balloon payments of $12.4 million in 2021 and $6.3 million in 2022 on the remaining loans outstanding at December 31, 2017. The aggregate balance of mortgage loans was approximately $15.7 million and $16.7 million at December 31, 2017 and 2016, respectively, with interest rates ranging from a fixed 2.50% to LIBOR plus 3% and equal monthly installment payments over periods up to seven years with additional balloon payments of $2.6 million in 2018, $2.9 million in 2021 and $7.0 million in 2023.
Off-Balance Sheet Arrangements
None
26
Contractual Obligations
Our outstanding contractual obligations as of December 31, 2017 are summarized in the following table:
|
|
||||||||||||||
|
|
Payments Due |
|||||||||||||
|
(in thousands) |
Total |
1 year or less |
2-3 years |
4-5 years |
Over 5 years |
|||||||||
|
Debt(a) |
$ |
781,907 |
$ |
30,748 |
$ |
17,515 |
$ |
226,325 |
$ |
507,319 | ||||
|
Interest on debt(a) |
478,045 | 42,279 | 83,143 | 272,307 | 80,316 | |||||||||
|
Operating leases |
66,486 | 18,420 | 21,404 | 11,764 | 14,898 | |||||||||
|
Pension benefit payments(b) |
3,569 | 2,899 | 670 |
— |
— |
|||||||||
|
Other |
9,612 | 5,666 | 3,946 |
— |
— |
|||||||||
|
Total |
$ |
1,339,619 |
$ |
100,012 |
$ |
126,678 |
$ |
510,396 |
$ |
602,533 | ||||
|
|
||||||||||||||
|
(a) |
Debt and interest on debt exclude unamortized debt discount and deferred debt issuance costs. Amounts for interest on debt are based on interest rates in effect as of December 31, 2017. |
|
(b) |
The Company utilizes current actuarial assumptions in determining the expected minimum contributions to fund our defined benefit pension and other post-retirement plans. Estimated contributions for periods beyond the scope of the actuarial assumptions have not been included because, in management’s judgment, such estimates may not be reliable. |
Critical Accounting Policies
Our discussion and analysis of our financial condition and results of operations is based upon our Consolidated Financial Statements, which have been prepared in accordance with GAAP. Our significant accounting policies are described in Note 1 of the Notes to Consolidated Financial Statements. The preparation of the Consolidated Financial Statements requires us to make estimates and judgments that affect the reported amounts of assets, liabilities, revenue and expenses, and related disclosure of contingent assets and liabilities. Estimates are based on information available through the date of the issuance of the financial statements; accordingly, actual results in future periods could differ from these estimates. Significant judgments and estimates used in the preparation of the Consolidated Financial Statements apply to the following critical accounting policies:
Method of Accounting for Contracts — Contract revenue is recognized on the percentage-of-completion method based on contract cost incurred to date compared to total estimated contract cost. The estimates used in the percentage-of-completion method during the contract performance period require judgment and assumptions regarding both future events and the evaluation of contingencies such as the impact of change orders, liability claims, other contract disputes, the achievement of contractual performance standards, and potential variances in project schedule and costs. Changes to the total estimated contract cost, either due to unexpected events or revisions to management’s initial estimates, for a given project are recognized in the period in which they are determined.
In certain instances, we provide guaranteed completion dates and/or achievement of other performance criteria. Failure to meet schedule or performance guarantees could result in unrealized incentive fees and/or liquidated damages. In addition, depending on the type of contract, unexpected increases in contract cost may be unrecoverable, resulting in total cost exceeding revenue realized from the projects. The Company generally provides limited warranties for work performed, with warranty periods typically extending for a limited duration following substantial completion of the Company’s work on a project. Historically, warranty claims have not resulted in material costs incurred.
Claims arising from construction contracts have been made against the Company by customers, and the Company has made claims against customers for cost incurred in excess of current contract provisions. The Company recognizes revenue, but not profit, for claims when it is determined that recovery of incurred cost is probable and the amounts can be reliably estimated. These requirements are satisfied under GAAP’s Accounting Standards Codification (“ASC”) 605-35, Construction-Type and Production-Type Contracts, when the contract or other evidence provides a legal basis for the claim, additional costs were caused by circumstances that were unforeseen at the contract date and not the result of deficiencies in the Company’s performance, claim-related costs are identifiable and considered reasonable in view of the work performed, and evidence supporting the claim is objective and verifiable.
Construction Joint Ventures — Certain contracts are executed through joint ventures. The arrangements are often formed for the single business purpose of executing a specific project and allow the Company to share risks and secure specialty skills required for project execution.
In accordance with ASC 810, Consolidation (“ASC 810”) the Company assesses its joint ventures at inception to determine if any meet the qualifications of a variable interest entity (“VIE”). The Company considers a joint venture a VIE if either (a) the total equity investment is not sufficient to permit the entity to finance its activities without additional subordinated financial support, (b) characteristics of a controlling financial interest are missing (either the ability to make decisions through voting or other rights, the obligation to absorb the expected losses of the entity or the right to receive the expected residual returns of the entity), or (c) the voting rights of the equity holders are not proportional to their obligations to absorb the expected losses of the entity and/or their rights to
27
receive the expected residual returns of the entity and substantially all of the entity’s activities either involve or are conducted on behalf of an investor that has disproportionately few voting rights. Upon the occurrence of certain events outlined in ASC 810, the Company reassesses its initial determination of whether the joint venture is a VIE.
The Company also evaluates whether it is the primary beneficiary of each VIE and consolidates the VIE if the Company has both (a) the power to direct the economically significant activities of the entity and (b) the obligation to absorb losses of, or the right to receive benefits from, the entity that could potentially be significant to the VIE. The Company considers the contractual agreements that define the ownership structure, distribution of profits and losses, risks, responsibilities, indebtedness, voting rights and board representation of the respective parties in determining whether it qualifies as the primary beneficiary. The Company also considers all parties that have direct or implicit variable interests when determining whether it is the primary beneficiary. When the Company is determined to be the primary beneficiary, the VIE is consolidated. As required by ASC 810, management’s assessment of whether the Company is the primary beneficiary of a VIE is continuously performed.
For construction joint ventures that do not need to be fully consolidated, the Company accounts for its interest in the joint ventures using the proportionate consolidation method, whereby the Company’s proportionate share of the joint ventures’ assets, liabilities, revenue and cost of operations are included in the appropriate classifications in the Company’s consolidated financial statements. All intercompany transactions and balances have been eliminated in consolidation. See Note 1(b) and Note 11 for additional discussion regarding VIEs.
Recoverability of Goodwill — Goodwill represents the excess of amounts paid over the fair value of net assets acquired from an acquisition. In order to determine the amount of goodwill resulting from an acquisition, we perform an assessment to determine the value of the acquired company's tangible and identifiable intangible assets and liabilities. In our assessment, we determine whether identifiable intangible assets exist, which typically include backlog, customer relationships and trade name.
We test goodwill for impairment annually in the fourth quarter of the fiscal year for each of our Civil, Building and Specialty Contractors operating segments, which are the same as our reporting units for goodwill impairment analysis. This test requires us to estimate the fair value of each reporting unit, using income and market approaches and to compare the calculated fair value of each reporting unit to its carrying value, which is equal to the reporting unit’s net assets. If the calculated fair value of a reporting unit is less than its carrying value, we perform a second step involving a hypothetical purchase allocation for that reporting unit resulting in an implied fair value of the reporting unit’s goodwill. If the implied fair value is less than the carrying value of goodwill, an impairment charge equal to the difference is recognized. Additionally, in the quarters preceding the fourth quarter, we evaluate events and circumstances, such as changes in the legal environment and business climate, the operating performance of the reporting units and general industry trends, to determine if such factors indicate that it is likely that the goodwill for one or more of our reporting units is impaired, thus warranting the performance of the annual impairment test sooner than the fourth quarter of the year.
During the fourth quarter of 2017, we conducted our annual goodwill impairment test and determined that our goodwill was not impaired. The impairment evaluation process requires assumptions that are subject to a high degree of judgement about variables such as revenue growth rates, profitability levels, discount rates, industry market multiples and weighted average cost of capital (WACC). Changes in these variables would impact the results of our impairment tests. For example, as of October 1, 2017, changes of 0.5% in the WACC would have resulted in changes in the fair value of reporting units ranging from $(30.0) million to $40.0 million, which would not have changed the conclusions reached in our annual goodwill impairment test.
New Accounting Pronouncements — For discussion of recently adopted accounting standards and updates, see Note 1 of the Notes to Consolidated Financial Statements.
ITEM 7A. QUANTITATIVE AND QUALITATIVE DISCLOSURES ABOUT MARKET RISK
Interest rate risk is our primary market risk exposure. Borrowing under our 2017 Credit Facility and certain other debt obligations have variable interest rates subject to interest rate risk. As of December 31, 2017, we had approximately $8.4 million of net borrowings with variable interest rates. If short-term floating interest rates were to increase by 0.50%, the change in interest on these borrowings would increase by approximately $50,000.
ITEM 8. FINANCIAL STATEMENTS AND SUPPLEMENTARY DATA
The Report of Independent Registered Public Accounting Firm, Consolidated Financial Statements and Supplementary Schedules are set forth in Item 15 in this Annual Report on Form 10-K and are incorporated herein by reference.
ITEM 9. CHANGES IN AND DISAGREEMENTS WITH ACCOUNTANTS ON ACCOUNTING AND FINANCIAL DISCLOSURE
None.
28
ITEM 9A. CONTROLS AND PROCEDURES
Evaluation of Disclosure Controls and Procedures — An evaluation of the effectiveness of the design and operation of our disclosure controls and procedures as defined by Rule 13a-15(e) under the Securities Exchange Act of 1934, as amended (“Exchange Act”), as of December 31, 2017 was made under the supervision and with the participation of our management, including our Chief Executive Officer and Chief Financial Officer. Based upon that evaluation, the Chief Executive Officer and Chief Financial Officer concluded that, as of December 31, 2017, our disclosure controls and procedures were effective, in that they provide reasonable assurance that information required to be disclosed in our reports filed or submitted under the Exchange Act were recorded, processed, summarized and reported within the time periods specified in the SEC’s rules. Our disclosure controls and procedures are designed to ensure that information we are required to disclose in such reports is accumulated and communicated to management, including our Chief Executive Officer and Chief Financial Officer, as appropriate, to allow timely decisions regarding required disclosures.
Management’s Report on Internal Control over Financial Reporting — Our management, under the supervision of our Chief Executive Officer and Chief Financial Officer, is responsible for establishing and maintaining an adequate system of internal control over financial reporting as such term is defined in Exchange Act Rules 13a-15(f). In designing and evaluating our system of internal control over financial reporting, we recognize that inherent limitations exist in any control system no matter how well designed and operated, and we can only provide reasonable, not absolute, assurance of achieving the desired control objectives. In making this assessment, management utilized the criteria issued in Internal Control — Integrated Framework (2013) issued by the Committee of Sponsoring Organizations of the Treadway Commission. Based on this assessment, management concluded that, as of December 31, 2017, our internal control over financial reporting was effective based on those criteria.
Because of its inherent limitations, internal control over financial reporting may not prevent or detect misstatements. In addition, projections of any evaluation of the effectiveness to future periods are subject to the risk that controls may become inadequate due to changes in conditions, or that the degree of compliance with policies and procedures may deteriorate.
Deloitte & Touche LLP, the independent registered public accounting firm that audited our consolidated financial statements included in this Annual Report on Form 10-K, has issued an attestation report on the Company’s internal control over financial reporting as of December 31, 2017.
Changes in Internal Control over Financial Reporting — There were no changes in our internal control over financial reporting for the quarter ended December 31, 2017 that have materially affected, or are reasonably likely to materially affect, our internal control over financial reporting.
29
REPORT OF INDEPENDENT REGISTERED PUBLIC ACCOUNTING FIRM
To the Stockholders and the Board of Directors of
Tutor Perini Corporation
Sylmar, California
Opinion on Internal Control over Financial Reporting
We have audited the internal control over financial reporting of Tutor Perini Corporation and subsidiaries (the “Company”) as of December 31, 2017, based on criteria established in Internal Control — Integrated Framework (2013) issued by the Committee of Sponsoring Organizations of the Treadway Commission (COSO). In our opinion, the Company maintained, in all material respects, effective internal control over financial reporting as of December 31, 2017, based on criteria established in Internal Control — Integrated Framework (2013) issued by COSO.
We have also audited, in accordance with the standards of the Public Company Accounting Oversight Board (United States) (PCAOB), the consolidated financial statements as of and for the year ended December 31, 2017, of the Company and our report dated February 27, 2018, expressed an unqualified opinion on those financial statements.
Basis for Opinion
The Company’s management is responsible for maintaining effective internal control over financial reporting and for its assessment of the effectiveness of internal control over financial reporting, included in the accompanying Management’s Report on Internal Control over Financial Reporting. Our responsibility is to express an opinion on the Company’s internal control over financial reporting based on our audit. We are a public accounting firm registered with the PCAOB and are required to be independent with respect to the Company in accordance with the U.S. federal securities laws and the applicable rules and regulations of the Securities and Exchange Commission and the PCAOB.
We conducted our audit in accordance with the standards of the PCAOB. Those standards require that we plan and perform the audit to obtain reasonable assurance about whether effective internal control over financial reporting was maintained in all material respects. Our audit included obtaining an understanding of internal control over financial reporting, assessing the risk that a material weakness exists, testing and evaluating the design and operating effectiveness of internal control based on the assessed risk, and performing such other procedures as we considered necessary in the circumstances. We believe that our audit provides a reasonable basis for our opinion.
Definition and Limitations of Internal Control over Financial Reporting
A company’s internal control over financial reporting is a process designed to provide reasonable assurance regarding the reliability of financial reporting and the preparation of financial statements for external purposes in accordance with generally accepted accounting principles. A company’s internal control over financial reporting includes those policies and procedures that (1) pertain to the maintenance of records that, in reasonable detail, accurately and fairly reflect the transactions and dispositions of the assets of the company; (2) provide reasonable assurance that transactions are recorded as necessary to permit preparation of financial statements in accordance with generally accepted accounting principles, and that receipts and expenditures of the company are being made only in accordance with authorizations of management and directors of the company; and (3) provide reasonable assurance regarding prevention or timely detection of unauthorized acquisition, use, or disposition of the company’s assets that could have a material effect on the financial statements.
Because of its inherent limitations, internal control over financial reporting may not prevent or detect misstatements. Also, projections of any evaluation of effectiveness to future periods are subject to the risk that controls may become inadequate because of changes in conditions, or that the degree of compliance with the policies or procedures may deteriorate.
/s/ Deloitte & Touche LLP
Los Angeles, California
February 27, 2018
30
Departure of Director
On February 21, 2018, Thomas C. Leppert notified the Board of Directors (the “Board”) of Tutor Perini Corporation of his decision to resign from the Board, effective immediately.
Concurrent with Mr. Leppert’s departure, the Board approved a reduction in the size of the Board from twelve to eleven members.
ITEM 10. DIRECTORS, EXECUTIVE OFFICERS AND CORPORATE GOVERNANCE
The information required by this Item 10 is hereby incorporated by reference from our definitive proxy statement to be filed within 120 days after the end of 2017.
ITEM 11. EXECUTIVE COMPENSATION
The information required by this Item 11 is hereby incorporated by reference from our definitive proxy statement to be filed within 120 days after the end of 2017.
ITEM 12. SECURITY OWNERSHIP OF CERTAIN BENEFICIAL OWNERS AND MANAGEMENT AND RELATED STOCKHOLDER MATTERS
The information required by this Item 12 is hereby incorporated by reference from our definitive proxy statement to be filed within 120 days after the end of 2017.
ITEM 13. CERTAIN RELATIONSHIPS AND RELATED TRANSACTIONS, AND DIRECTOR INDEPENDENCE
The information required by this Item 13 is hereby incorporated by reference from our definitive proxy statement to be filed within 120 days after the end of 2017.
ITEM 14. PRINCIPAL ACCOUNTANT FEES AND SERVICES
The information required by this Item 14 is hereby incorporated by reference from our definitive proxy statement to be filed within 120 days after the end of 2017.
31
ITEM 15. EXHIBITS AND FINANCIAL STATEMENT SCHEDULES
TUTOR PERINI CORPORATION AND SUBSIDIARIES
1. Financial Statements:
Our consolidated financial statements as of December 31, 2017 and 2016 and for each of the three years in the period ended December 31, 2017 and the notes thereto, together with the report of the independent registered public accounting firm on those consolidated financial statements are hereby filed as part of this Annual Report on Form 10-K, beginning on page F-1.
2. Financial Statement Schedules:
All consolidated financial statement schedules are omitted because of the absence of the conditions under which they are required or because the required information is included in the Consolidated Financial Statements and in the Notes thereto.
3. Exhibits:
EXHIBIT INDEX
The following designated exhibits are, as indicated below, either filed herewith or have heretofore been filed with the SEC under the Securities Act of 1933 or the Securities Act of 1934 and are referred to and incorporated herein by reference to such filings.
|
Exhibit 3. |
Articles of Incorporation and By-laws |
|
3.1 |
|
|
3.2 |
|
|
3.3 |
|
|
3.4 |
|
|
3.5 |
|
|
Exhibit 4. |
Instruments Defining the Rights of Security Holders, Including Indentures |
|
4.1 |
|
|
4.2 |
|
|
4.3 |
|
|
4.4 |
|
|
4.5 |
|
|
4.6 |
|
|
4.7 |
|
|
Exhibit 10. |
Material Contracts |
|
10.1* |
|
|
10.2* |
32
|
10.3* |
|
|
10.4* |
|
|
10.5* |
|
|
10.6* |
|
|
10.7 |
|
|
10.8 |
|
|
10.9* |
|
|
10.10* |
|
|
10.11 |
|
|
Exhibit 21 |
|
|
Exhibit 23 |
|
|
Exhibit 24 |
|
|
Exhibit 31.1 |
|
|
Exhibit 31.2 |
|
|
Exhibit 32.1 |
|
|
Exhibit 32.2 |
|
|
Exhibit 95 |
|
|
Exhibit 101.INS |
XBRL Instance Document. |
|
Exhibit 101.SCH |
XBRL Taxonomy Extension Schema Document. |
|
Exhibit 101.CAL |
XBRL Taxonomy Extension Calculation Linkbase Document. |
|
Exhibit 101.LAB |
XBRL Taxonomy Extension Label Linkbase Document. |
|
Exhibit 101.PRE |
XBRL Taxonomy Extension Presentation Linkbase Document. |
|
Exhibit 101.DEF |
XBRL Taxonomy Extension Definition Linkbase Document. |
*Management contract or compensatory arrangement required to be filed as an exhibit pursuant to Item 15(a)(3) of Form 10-K
33
Pursuant to the requirements of Section 13 or 15(d) of the Securities Exchange Act of 1934, the Company has duly caused this report to be signed on its behalf by the undersigned, thereunto duly authorized.
|
|
Tutor Perini Corporation |
|
|
|
(Registrant) |
|
|
|
|
|
|
Dated: February 27, 2018 |
By: |
/s/ Gary G. Smalley |
|
|
Gary G. Smalley |
|
|
|
Executive Vice President and Chief Financial Officer |
|
Pursuant to the requirements of the Securities Exchange Act of 1934, this report has been signed below by the following persons on behalf of the Company and in the capacities and on the dates indicated.
|
|
||||
|
Signature |
|
Title |
|
Date |
|
|
|
|
|
|
|
Principal Executive Officer and Director |
|
|
|
|
|
|
|
|
|
|
|
|
|
|
|
|
|
/s/ Ronald N. Tutor |
|
|
|
|
|
Ronald N. Tutor |
|
Chairman and Chief Executive Officer |
|
February 27, 2018 |
|
|
|
|
|
|
|
Principal Financial Officer |
|
|
|
|
|
|
|
|
|
|
|
|
|
|
|
|
|
/s/ Gary G. Smalley |
|
|
|
|
|
Gary G. Smalley |
|
Executive Vice President and Chief Financial Officer |
|
February 27, 2018 |
|
|
|
|
|
|
|
Principal Accounting Officer |
|
|
|
|
|
|
|
|
|
|
|
|
|
|
|
|
|
/s/ Ryan J. Soroka |
|
|
|
|
|
Ryan J. Soroka |
|
Vice President and Chief Accounting Officer |
|
February 27, 2018 |
|
Other Directors |
|
|
|
|
|
|
|
|
|
|
|
|
|
|
Peter Arkley |
) |
|
|
|
Sidney J. Feltenstein |
) |
|
|
|
James A. Frost |
) |
|
/s/ Gary G. Smalley |
|
Michael R. Klein |
) |
|
Gary G. Smalley |
|
Robert C. Lieber |
) |
|
Attorney in Fact |
|
Dennis D. Oklak |
) |
|
|
|
Raymond R. Oneglia |
) |
|
|
|
Dale A. Reiss |
) |
|
|
|
Donald D. Snyder |
) |
|
|
|
Dickran M. Tevrizian, Jr. |
) |
|
Dated: February 27, 2018 |
34
TUTOR PERINI CORPORATION AND SUBSIDIARIES
INDEX TO CONSOLIDATED FINANCIAL STATEMENTS
TABLE OF CONTENTS
|
|
|
|
|
Pages |
|
Consolidated Financial Statements of the Registrant |
|
|
F-2 |
|
|
F-3 |
|
|
F-4 |
|
|
F-5 |
|
|
F-6 |
|
|
F-7 |
|
|
F-8 |
F-1
REPORT OF INDEPENDENT REGISTERED PUBLIC ACCOUNTING FIRM
To the Stockholders and the Board of Directors of
Tutor Perini Corporation
Sylmar, California
Opinion on the Financial Statements
We have audited the accompanying consolidated balance sheets of Tutor Perini Corporation and subsidiaries (the "Company") as of December 31, 2017 and 2016, the related consolidated statements of income, comprehensive income, changes in equity, and cash flows, for each of the three years in the period ended December 31, 2017, and the related notes (collectively referred to as the "financial statements"). In our opinion, the financial statements present fairly, in all material respects, the financial position of the Company as of December 31, 2017 and 2016, and the results of its operations and its cash flows for each of the three years in the period ended December 31, 2017, in conformity with accounting principles generally accepted in the United States of America.
We have also audited, in accordance with the standards of the Public Company Accounting Oversight Board (United States) (PCAOB), the Company's internal control over financial reporting as of December 31, 2017, based on criteria established in Internal Control — Integrated Framework (2013) issued by the Committee of Sponsoring Organizations of the Treadway Commission and our report dated February 27, 2018, expressed an unqualified opinion on the Company's internal control over financial reporting.
Basis for Opinion
These financial statements are the responsibility of the Company's management. Our responsibility is to express an opinion on the Company's financial statements based on our audits. We are a public accounting firm registered with the PCAOB and are required to be independent with respect to the Company in accordance with the U.S. federal securities laws and the applicable rules and regulations of the Securities and Exchange Commission and the PCAOB.
We conducted our audits in accordance with the standards of the PCAOB. Those standards require that we plan and perform the audit to obtain reasonable assurance about whether the financial statements are free of material misstatement, whether due to error or fraud. Our audits included performing procedures to assess the risks of material misstatement of the financial statements, whether due to error or fraud, and performing procedures that respond to those risks. Such procedures included examining, on a test basis, evidence regarding the amounts and disclosures in the financial statements. Our audits also included evaluating the accounting principles used and significant estimates made by management, as well as evaluating the overall presentation of the financial statements. We believe that our audits provide a reasonable basis for our opinion.
/s/ Deloitte & Touche LLP
Los Angeles, California
February 27, 2018
We have served as the Company's auditor since 2002.
F-2
TUTOR PERINI CORPORATION AND SUBSIDIARIES
CONSOLIDATED STATEMENTS OF INCOME
(in thousands, except per common share data)
|
|
||||||||
|
|
Year Ended December 31, |
|||||||
|
|
2017 |
2016 |
2015 |
|||||
|
REVENUE |
$ |
4,757,208 |
$ |
4,973,076 |
$ |
4,920,472 | ||
|
COST OF OPERATIONS |
(4,302,803) | (4,515,886) | (4,564,219) | |||||
|
GROSS PROFIT |
454,405 | 457,190 | 356,253 | |||||
|
General and administrative expenses |
(274,928) | (255,270) | (250,840) | |||||
|
INCOME FROM CONSTRUCTION OPERATIONS |
179,477 | 201,920 | 105,413 | |||||
|
Other income, net |
43,882 | 6,977 | 13,569 | |||||
|
Interest expense |
(69,384) | (59,782) | (45,143) | |||||
|
INCOME BEFORE INCOME TAXES |
153,975 | 149,115 | 73,839 | |||||
|
Income tax benefit (provision) |
569 | (53,293) | (28,547) | |||||
|
NET INCOME |
$ |
154,544 |
$ |
95,822 |
$ |
45,292 | ||
|
LESS: NET INCOME ATTRIBUTABLE TO NONCONTROLLING INTERESTS |
(6,162) |
— |
— |
|||||
|
NET INCOME ATTRIBUTABLE TO TUTOR PERINI CORPORATION |
148,382 | 95,822 | 45,292 | |||||
|
BASIC EARNINGS PER COMMON SHARE |
$ |
2.99 |
$ |
1.95 |
$ |
0.92 | ||
|
DILUTED EARNINGS PER COMMON SHARE |
$ |
2.92 |
$ |
1.92 |
$ |
0.91 | ||
|
WEIGHTED-AVERAGE COMMON SHARES OUTSTANDING: |
||||||||
|
BASIC |
49,647 | 49,150 | 48,981 | |||||
|
DILUTED |
50,759 | 49,864 | 49,666 | |||||
The accompanying notes are an integral part of these consolidated financial statements.
F-3
TUTOR PERINI CORPORATION AND SUBSIDIARIES
CONSOLIDATED STATEMENTS OF COMPREHENSIVE INCOME
(in thousands)
|
|
||||||||
|
|
Year Ended December 31, |
|||||||
|
|
2017 |
2016 |
2015 |
|||||
|
NET INCOME |
$ |
154,544 |
$ |
95,822 |
$ |
45,292 | ||
|
|
||||||||
|
OTHER COMPREHENSIVE INCOME (LOSS), NET OF TAX: |
||||||||
|
Defined benefit pension plan adjustments |
1,424 | (2,623) | 2,026 | |||||
|
Foreign currency translation adjustments |
1,273 | (261) | (3,214) | |||||
|
Unrealized gain (loss) in fair value of investments |
(2) | (340) | 766 | |||||
|
Unrealized loss in fair value of interest rate swap |
— |
(24) | (125) | |||||
|
TOTAL OTHER COMPREHENSIVE INCOME (LOSS), NET OF TAX |
2,695 | (3,248) | (547) | |||||
|
|
||||||||
|
COMPREHENSIVE INCOME |
157,239 | 92,574 | 44,745 | |||||
|
LESS: COMPREHENSIVE INCOME ATTRIBUTABLE TO NONCONTROLLING INTERESTS |
(6,162) |
— |
— |
|||||
|
COMPREHENSIVE INCOME ATTRIBUTABLE TO TUTOR PERINI CORPORATION |
$ |
151,077 |
$ |
92,574 |
$ |
44,745 | ||
The accompanying notes are an integral part of these consolidated financial statements.
F-4
TUTOR PERINI CORPORATION AND SUBSIDIARIES
(in thousands, except share data)
|
|
|||||
|
|
As of December 31, |
||||
|
|
2017 |
2016 |
|||
|
ASSETS |
|||||
|
CURRENT ASSETS: |
|||||
|
Cash, including cash equivalents of $1,481 and $15,302 ($53,067 and $0 related to VIEs) |
$ |
192,868 |
$ |
146,103 | |
|
Restricted cash |
4,780 | 50,504 | |||
|
Restricted investments |
53,014 |
— |
|||
|
Accounts receivable, including retainage of $535,939 and $569,391 (AR of $42,413 and $0 related to VIEs) |
|
1,801,656 |
|
|
1,743,300 |
|
Costs and estimated earnings in excess of billings |
932,758 | 831,826 | |||
|
Other current assets |
89,316 | 66,023 | |||
|
Total current assets |
3,074,392 | 2,837,756 | |||
|
PROPERTY AND EQUIPMENT: |
|||||
|
Land |
41,382 | 41,382 | |||
|
Building and improvements |
125,029 | 124,157 | |||
|
Construction equipment |
477,988 | 444,153 | |||
|
Other equipment |
182,288 | 181,717 | |||
|
|
826,687 | 791,409 | |||
|
Less accumulated depreciation |
(359,188) | (313,783) | |||
|
Total property and equipment, net ($11,641 and $0 related to VIEs) |
467,499 | 477,626 | |||
|
GOODWILL |
585,006 | 585,006 | |||
|
INTANGIBLE ASSETS, NET |
89,454 | 92,997 | |||
|
OTHER ASSETS |
47,772 | 45,235 | |||
|
TOTAL ASSETS |
$ |
4,264,123 |
$ |
4,038,620 | |
|
LIABILITIES AND EQUITY |
|||||
|
CURRENT LIABILITIES: |
|||||
|
Current maturities of long-term debt |
$ |
30,748 |
$ |
85,890 | |
|
Accounts payable, including retainage of $261,820 and $258,294 (AP of $19,243 and $0 related to VIEs) |
961,791 | 994,016 | |||
|
Billings in excess of costs and estimated earnings ($120,952 and $0 related to VIEs) |
456,869 | 331,112 | |||
|
Accrued expenses and other current liabilities |
132,438 | 107,925 | |||
|
Total current liabilities |
1,581,846 | 1,518,943 | |||
|
LONG-TERM DEBT, less current maturities, net of unamortized discounts and debt issuance costs totaling $45,631 and $56,072 |
705,528 | 673,629 | |||
|
DEFERRED TAX LIABILITIES |
108,504 | 131,007 | |||
|
OTHER LONG-TERM LIABILITIES |
163,465 | 162,018 | |||
|
TOTAL LIABILITIES |
2,559,343 | 2,485,597 | |||
|
CONTINGENCIES AND COMMITMENTS (Note 6) |
|||||
|
EQUITY |
|||||
|
Stockholders' equity: |
|||||
|
Preferred stock – authorized 1,000,000 shares ($1 par value), none issued |
— |
— |
|||
|
Common stock – authorized 75,000,000 shares ($1 par value), issued and outstanding 49,781,010 and 49,211,353 shares |
49,781 | 49,211 | |||
|
Additional paid-in capital |
1,084,205 | 1,075,600 | |||
|
Retained earnings |
622,007 | 473,625 | |||
|
Accumulated other comprehensive loss |
(42,718) | (45,413) | |||
|
Total stockholders' equity |
1,713,275 | 1,553,023 | |||
|
Noncontrolling interests |
(8,495) |
— |
|||
|
TOTAL EQUITY |
1,704,780 | 1,553,023 | |||
|
TOTAL LIABILITIES AND EQUITY |
$ |
4,264,123 |
$ |
4,038,620 | |
The accompanying notes are an integral part of these consolidated financial statements.
F-5
TUTOR PERINI CORPORATION AND SUBSIDIARIES
CONSOLIDATED STATEMENTS OF CASH FLOWS
(in thousands)
|
|
||||||||
|
|
Year Ended December 31, |
|||||||
|
|
2017 |
2016 |
2015 |
|||||
|
Cash Flows from Operating Activities: |
||||||||
|
Net income |
$ |
154,544 |
$ |
95,822 |
$ |
45,292 | ||
|
Adjustments to reconcile net income to net cash provided by operating activities: |
||||||||
|
Depreciation |
48,387 | 63,759 | 37,919 | |||||
|
Amortization of intangible assets |
3,543 | 3,543 | 3,715 | |||||
|
Share-based compensation expense |
21,174 | 13,423 | 9,477 | |||||
|
Excess income tax benefit from share-based compensation |
— |
(269) | (186) | |||||
|
Change in debt discounts and deferred debt issuance costs |
17,595 | 10,968 | 2,095 | |||||
|
Deferred income taxes |
(23,096) | (10,169) | 22,214 | |||||
|
Loss (gain) on sale of property and equipment |
1,131 | 453 | (2,909) | |||||
|
Changes in other components of working capital |
(60,214) | (90,530) | (128,777) | |||||
|
Other long-term liabilities |
3,656 | 28,210 | 28,912 | |||||
|
Other, net |
(3,170) | (1,874) | (3,680) | |||||
|
NET CASH PROVIDED BY OPERATING ACTIVITIES |
163,550 | 113,336 | 14,072 | |||||
|
|
||||||||
|
Cash Flows from Investing Activities: |
||||||||
|
Acquisition of property and equipment |
(30,280) | (15,743) | (35,912) | |||||
|
Proceeds from sale of property and equipment |
2,744 | 1,899 | 4,980 | |||||
|
Investments in securities, restricted |
(54,504) |
— |
— |
|||||
|
Investments in securities |
(6,463) |
— |
— |
|||||
|
Proceeds from maturities of investments in securities |
1,370 |
— |
— |
|||||
|
Change in restricted cash |
45,724 | (4,651) | (1,483) | |||||
|
NET CASH USED IN INVESTING ACTIVITIES |
(41,409) | (18,495) | (32,415) | |||||
|
|
||||||||
|
Cash Flows from Financing Activities: |
||||||||
|
Proceeds from debt |
2,161,384 | 1,353,895 | 1,013,205 | |||||
|
Repayment of debt |
(2,195,068) | (1,562,684) | (1,054,371) | |||||
|
Debt issuance and extinguishment costs |
(15,266) | (15,086) |
— |
|||||
|
Issuance of convertible notes |
— |
200,000 |
— |
|||||
|
Cash payments related to share-based compensation |
(11,769) | (584) | (808) | |||||
|
Excess income tax benefit from share-based compensation |
— |
269 | 186 | |||||
|
Distributions paid to noncontrolling interests |
(17,499) |
— |
— |
|||||
|
Contributions from noncontrolling interests |
2,842 |
— |
— |
|||||
|
NET CASH USED IN FINANCING ACTIVITIES |
(75,376) | (24,190) | (41,788) | |||||
|
|
||||||||
|
Net increase (decrease) in cash and cash equivalents |
46,765 | 70,651 | (60,131) | |||||
|
Cash and cash equivalents at beginning of year |
146,103 | 75,452 | 135,583 | |||||
|
Cash and cash equivalents at end of year |
$ |
192,868 |
$ |
146,103 |
$ |
75,452 | ||
The accompanying notes are an integral part of these consolidated financial statements.
F-6
TUTOR PERINI CORPORATION AND SUBSIDIARIES
CONSOLIDATED STATEMENTS OF CHANGES IN EQUITY
(in thousands)
|
|
|||||||||||||||||
|
|
|||||||||||||||||
|
|
Accumulated |
||||||||||||||||
|
|
Additional |
Other |
|||||||||||||||
|
|
Common |
Paid-in |
Retained |
Comprehensive |
Noncontrolling |
||||||||||||
|
|
Stock |
Capital |
Earnings |
Loss |
Interests |
Total |
|||||||||||
|
Balance - December 31, 2014 |
$ |
48,671 |
$ |
1,025,941 |
$ |
332,511 |
$ |
(41,618) |
$ |
— |
$ |
1,365,505 | |||||
|
Net income |
— |
— |
45,292 |
— |
— |
45,292 | |||||||||||
|
Other comprehensive loss |
— |
— |
— |
(547) |
— |
(547) | |||||||||||
|
Tax effect of share-based compensation |
— |
(186) |
— |
— |
— |
(186) | |||||||||||
|
Share-based compensation expense |
— |
9,477 |
— |
— |
— |
9,477 | |||||||||||
|
Issuance of common stock, net |
402 | 284 |
— |
— |
— |
686 | |||||||||||
|
Balance - December 31, 2015 |
$ |
49,073 |
$ |
1,035,516 |
$ |
377,803 |
$ |
(42,165) |
$ |
— |
$ |
1,420,227 | |||||
|
Net income |
— |
— |
95,822 |
— |
— |
95,822 | |||||||||||
|
Other comprehensive loss |
— |
— |
— |
(3,248) |
— |
(3,248) | |||||||||||
|
Tax effect of share-based compensation |
— |
(457) |
— |
— |
— |
(457) | |||||||||||
|
Share-based compensation expense |
— |
13,423 |
— |
— |
— |
13,423 | |||||||||||
|
Issuance of common stock, net |
138 | 676 |
— |
— |
— |
814 | |||||||||||
|
Convertible note proceeds allocated to conversion option, net |
— |
26,442 |
— |
— |
— |
26,442 | |||||||||||
|
Balance - December 31, 2016 |
$ |
49,211 |
$ |
1,075,600 |
$ |
473,625 |
$ |
(45,413) |
$ |
— |
$ |
1,553,023 | |||||
|
Net income |
— |
— |
148,382 |
— |
6,162 | 154,544 | |||||||||||
|
Other comprehensive income |
— |
— |
— |
2,695 |
— |
2,695 | |||||||||||
|
Share-based compensation expense |
— |
20,877 |
— |
— |
— |
20,877 | |||||||||||
|
Issuance of common stock, net |
570 | (12,272) |
— |
— |
— |
(11,702) | |||||||||||
|
Contributions from noncontrolling interests |
— |
— |
— |
— |
2,842 | 2,842 | |||||||||||
|
Distributions to noncontrolling interests |
— |
— |
— |
— |
(17,499) | (17,499) | |||||||||||
|
Balance - December 31, 2017 |
$ |
49,781 |
$ |
1,084,205 |
$ |
622,007 |
$ |
(42,718) |
$ |
(8,495) |
$ |
1,704,780 | |||||
|
|
|||||||||||||||||
The accompanying notes are an integral part of these consolidated financial statements.
F-7
TUTOR PERINI CORPORATION AND SUBSIDIARIES
NOTES TO CONSOLIDATED FINANCIAL STATEMENTS
1. Summary of Significant Accounting Policies
(a) Basis of Presentation
The accompanying consolidated financial statements have been prepared in compliance with accounting principles generally accepted in the United States of America (“GAAP”) as codified in the Financial Accounting Standards Board’s (“FASB”) Accounting Standards Codification (“ASC”).
(b) Principles of Consolidation
The consolidated financial statements include the accounts of Tutor Perini Corporation and its wholly owned subsidiaries (the “Company”). The Company occasionally forms joint ventures with unrelated third parties for the execution of single contracts or projects. The Company assesses its joint ventures at inception to determine if they meet the qualifications of a variable interest entity (“VIE”) in accordance with ASC 810, Consolidation (“ASC 810”). If a joint venture is a VIE and the Company is the primary beneficiary, the joint venture is fully consolidated (See Note 11 below). For construction joint ventures that do not need to be consolidated, the Company accounts for its interest in the joint ventures using the proportionate consolidation method, whereby the Company’s proportionate share of the joint ventures’ assets, liabilities, revenue and cost of operations are included in the appropriate classifications in the Company’s consolidated financial statements. All intercompany transactions and balances have been eliminated in consolidation.
(c) Use of Estimates
The preparation of financial statements in accordance with GAAP requires management to make estimates and assumptions that affect reported amounts. These estimates are based on information available through the date of the issuance of the financial statements; therefore, actual results could differ from those estimates.
(d) Construction Contracts
The Company and its affiliated entities recognize construction contract revenue using the percentage-of-completion method, based primarily on contract cost incurred to date compared to total estimated contract cost. Cost of revenue includes an allocation of depreciation and amortization. Pre-contract costs are expensed as incurred. Changes to total estimated contract cost or losses, if any, are recognized in the period in which they are determined.
The Company generally provides limited warranties for work performed under its construction contracts with periods typically extending for a limited duration following substantial completion of the Company’s work on a project. Historically, warranty claims have not resulted in material costs incurred.
The Company classifies as current construction-related assets and liabilities that may be settled beyond one year from the balance sheet date, consistent with the length of time of the Company’s project operating cycle. Included in these balances are the following: costs and estimated earnings in excess of billings, which represent the excess of contract costs and profits (or contract revenue) over the amount of contract billings to date; billings in excess of costs and estimated earnings, which represent the excess of contract billings to date over the amount of contract costs and profits (or contract revenue) recognized to date; and contract retainage receivables and payables, which represent amounts invoiced to customers and amounts invoiced to the Company by subcontractors where payments have been withheld pending the completion of certain milestones, other contractual conditions or upon the completion of the project.
Costs and estimated earnings in excess of billings result when either: 1) the appropriate contract revenue amount has been recognized in accordance with the percentage-of-completion accounting method, but a portion of the revenue recorded cannot be billed currently due to the billing terms defined in the contract, or 2) costs are incurred related to certain claims and unapproved change orders. Claims occur when there is a dispute regarding both a change in the scope of work and the price associated with that change. Unapproved change orders occur when a change in the scope of work results in additional work being performed before the parties have agreed on the corresponding change in the contract price. For both claims and unapproved change orders, the Company recognizes revenue, but not profit, when it is determined that recovery of incurred cost is probable and the amounts can be reliably estimated. For claims, these requirements are satisfied under ASC 605-35, Construction-Type and Production-Type Contracts, when the contract or other evidence provides a legal basis for the claim, additional costs were caused by circumstances that were unforeseen at the contract date and not the result of deficiencies in the Company’s performance, claim-related costs are identifiable and considered reasonable in view of the work performed, and evidence supporting the claim or change order is objective and verifiable.
F-8
TUTOR PERINI CORPORATION AND SUBSIDIARIES
NOTES TO CONSOLIDATED FINANCIAL STATEMENTS (Continued)
Costs and estimated earnings in excess of billings, as reported on the Balance Sheet, consisted of the following:
|
|
|||||
|
|
As of December 31, |
||||
|
(in thousands) |
2017 |
2016 |
|||
|
Claims |
$ |
549,849 |
$ |
477,425 | |
|
Unapproved change orders |
296,591 | 207,475 | |||
|
Other unbilled costs and profits |
86,318 | 146,926 | |||
|
Total costs and estimated earnings in excess of billings |
$ |
932,758 |
$ |
831,826 | |
Claims and unapproved change orders are billable upon the resolution of any disputed or open items between the contractual parties and the execution of contractual amendments. Increases in claims and unapproved change orders typically result from costs being incurred against existing or new positions where recovery is concluded to be both probable and reliably estimable; decreases normally result from resolutions and subsequent billings. For both claims and unapproved change orders, the Company recognizes revenue, but not profit. Other unbilled costs and profits are billable in accordance with the billing terms of each of the existing contractual arrangements and, as such, the timing of contract billing cycles can cause fluctuations in the balance of unbilled costs and profits. Ultimate resolution of other unbilled costs and profits typically involves the passage of time and, often, incremental progress toward contractual requirements or milestones. The amount of costs and estimated earnings in excess of billings as of December 31, 2017 estimated by management to be collected beyond one year is approximately $443.7 million.
Retainage agreements vary from project to project and balances could be outstanding for several months or years depending on a number of circumstances, such as contract-specific terms, project performance and other variables that may arise as the Company makes progress towards completion. Generally, retainage payables are not remitted to the Company’s subcontractors until the associated retainage receivables from the customer are collected. As of December 31, 2017, the amount of retainage receivables and payables estimated by management to be collected or remitted beyond one year is approximately 30% and 19% of the balances, respectively.
(e) Changes in Estimates on Construction Contracts
The Company’s estimates of contract revenue and cost are highly detailed and many factors change during a contract performance period that result in a change to contract profitability. These factors include, but are not limited to, differing site conditions; availability of skilled contract labor; performance of major material suppliers and subcontractors; on-going subcontractor negotiations and buyout provisions; unusual weather conditions; changes in the timing of scheduled work; change orders; accuracy of the original bid estimate; changes in estimated labor productivity and costs based on experience to date; achievement of incentive-based income targets; and the expected, or actual, resolution terms for claims. The factors that cause changes in estimates vary depending on the maturation of the project within its lifecycle. For example, in the ramp-up phase, these factors typically consist of revisions in anticipated project costs and during the peak and close-out phases, these factors include the impact of change orders and claims, as well as additional revisions in remaining anticipated project costs. Generally, if the contract is at an early stage of completion, the current period impact is smaller than if the same change in estimate is made to the contract at a later stage of completion. Management evaluates changes in estimates on a contract by contract basis and discloses significant changes, if material, in the notes to the consolidated financial statements. The cumulative catch-up method is used to account for revisions in estimates.
(f) Depreciation of Property and Equipment and Amortization of Long-Lived Intangible Assets
Property and equipment and long-lived intangible assets are depreciated or amortized on a straight-line basis over their estimated useful lives ranging from three to forty years.
(g) Recoverability of Long-Lived Assets
Long-lived assets are reviewed for impairment whenever circumstances indicate that the future cash flows generated by the assets might be less than the assets’ net carrying value. In such circumstances, an impairment loss will be recognized by the amount the assets’ net carrying value exceeds their fair value.
(h) Recoverability of Goodwill
The Company tests goodwill for impairment annually for each reporting unit in the fourth quarter of the fiscal year, and between annual tests if events occur or circumstances change which suggest that goodwill should be reevaluated. Such events or circumstances include significant changes in legal factors and business climate, recent losses at a reporting unit, and industry trends, among other factors. The Civil, Building and Specialty Contractors segments each represent a reporting unit. The Company performs its annual
F-9
TUTOR PERINI CORPORATION AND SUBSIDIARIES
NOTES TO CONSOLIDATED FINANCIAL STATEMENTS (Continued)
quantitative impairment assessment during the fourth quarter of each year using a weighted-average of an income and a market approach. The income approach is based on estimated present value of future cash flows for each reporting unit. The market approach is based on assumptions about how market data relates to the Company. The weighting of these two approaches is based on their individual correlation to the economics of each reporting unit. The quantitative assessment performed in 2017 resulted in an estimated fair value for each of the Company’s reporting units that exceeded their respective net book values; therefore, no impairment charge was necessary for 2017.
(i) Recoverability of Non-Amortizable Trade Names
Certain trade names have an estimated indefinite life and are not amortized to earnings, but instead are reviewed for impairment annually, or more often if events occur or circumstances change which suggest that the non-amortizable trade names should be reevaluated. The Company performs its annual quantitative impairment assessment during the fourth quarter of each year using an income approach (relief from royalty method). The quantitative assessment performed in 2017 resulted in an estimated fair value for the non-amortizable trade names that exceeded their respective net book values; therefore, no impairment charge was necessary for 2017.
(j) Income Taxes
Deferred income tax assets and liabilities are recognized for the effects of temporary differences between the financial statement carrying amounts and the income tax basis of assets and liabilities using tax rates expected to be in effect when such differences reverse. Income tax positions must meet a more-likely-than-not threshold to be recognized. The Company recognizes interest and penalties related to uncertain tax positions as a component of the income tax provision.
(k) Earnings Per Common Share
Basic EPS and diluted EPS are calculated by dividing net income attributable to Tutor Perini Corporation by the following: for basic EPS, the weighted-average number of common shares outstanding during the period; and for diluted EPS, the sum of the weighted-average number of both outstanding common shares and potentially dilutive securities, which for the Company can include restricted stock units, unexercised stock options and the Convertible Notes, as defined in Note 5. The Company calculates the effect of these potentially dilutive securities using the treasury stock method.
|
|
||||||||
|
|
Year Ended December 31, |
|||||||
|
(in thousands, except per common share data) |
2017 |
2016 |
2015 |
|||||
|
Net income attributable to Tutor Perini Corporation |
$ |
148,382 |
$ |
95,822 |
$ |
45,292 | ||
|
|
||||||||
|
Weighted-average common shares outstanding, basic |
49,647 | 49,150 | 48,981 | |||||
|
Effect of dilutive stock options and unvested restricted stock |
1,112 | 714 | 685 | |||||
|
Weighted-average common shares outstanding, diluted |
50,759 | 49,864 | 49,666 | |||||
|
|
||||||||
|
Net income attributable to Tutor Perini Corporation per common share: |
||||||||
|
Basic |
$ |
2.99 |
$ |
1.95 |
$ |
0.92 | ||
|
Diluted |
$ |
2.92 |
$ |
1.92 |
$ |
0.91 | ||
|
Anti-dilutive securities not included above |
798 | 1,132 | 1,372 | |||||
With regard to diluted EPS and the impact of the Convertible Notes on the diluted EPS calculation, because the Company has the intent and ability to settle the principal amount of the Convertible Notes in cash, per ASC 260, Earnings Per Share, the settlement of the principal amount has no impact on diluted EPS.
(l) Cash and Cash Equivalents
Cash equivalents include short-term, highly liquid investments with maturities of three months or less when acquired. Cash and cash equivalents, as reported in the accompanying Consolidated Balance Sheets, consist of amounts available for the Company’s general purposes, as well as the Company’s proportionate share of cash held by the Company’s unconsolidated joint ventures and also amounts held by the Company’s consolidated joint ventures. In both cases, cash held by joint ventures is available only for joint venture-related uses, including future distributions to joint venture partners.
F-10
TUTOR PERINI CORPORATION AND SUBSIDIARIES
NOTES TO CONSOLIDATED FINANCIAL STATEMENTS (Continued)
Cash and cash equivalents consisted of the following:
|
|
|||||
|
|
As of December 31, |
||||
|
(in thousands) |
2017 |
2016 |
|||
|
Cash and cash equivalents |
$ |
94,713 |
$ |
49,539 | |
|
Joint venture cash and cash equivalents |
98,155 | 96,564 | |||
|
Total cash and cash equivalents |
$ |
192,868 |
$ |
146,103 | |
|
|
|||||
(m) Restricted Cash and Restricted Investments
The Company has restricted cash and restricted investments primarily held as collateral to secure insurance-related contingent obligations, such as insurance claim deductibles, in lieu of letters of credit. Restricted investments are comprised of various corporate bonds and bank notes that are rated A3 or better and have maturities within the Company’s operating cycle. These restricted investments are held-to-maturity securities carried at amortized cost.
(n) Share-Based Compensation
The Company’s long-term incentive plans allow the Company to grant share-based compensation awards in a variety of forms, including restricted and unrestricted stock units and stock options. Restricted stock units and stock options generally vest subject to service and/or performance requirements, with related compensation expense equal to the fair value of the award on the date of grant and recognized on a straight-line basis over the requisite service period. Unrestricted stock units vest immediately and are generally issued to the directors as part of their annual retainer fees, in which case they are expensed over a 12-month service period.
For share-based awards that have a service requirement, the Company accounts for forfeitures upon occurrence, rather than estimating the probability of forfeiture at the date of grant. Accordingly, the Company recognizes the full grant-date fair value of these awards on a straight-line basis throughout the requisite service period, reversing any expense if, and only if, there is a forfeiture.
For share-based awards that have a performance-based vesting requirement, the Company evaluates the probability of achieving the performance criterion throughout the performance period, and will adjust share-based compensation expense if it estimates that the achievement of the performance criterion, the achievement of which is ultimately determined by the Compensation Committee, is not probable.
(o) Insurance Liabilities
The Company typically utilizes third-party insurance coverage subject to varying deductible levels with aggregate caps on losses retained. The Company assumes the risk for the amount of the deductible portion of the losses and liabilities primarily associated with workers’ compensation and general liability coverage. In addition, on certain projects, the Company assumes the risk for the amount of the deductible portion of losses that arise from any subcontractor defaults. Losses are accrued based upon the Company’s estimates of the aggregate liability for claims incurred using historical experience and certain actuarial assumptions followed in the insurance industry. The estimate of insurance liability within the deductible limits includes an estimate of incurred but not reported claims based on data compiled from historical experience.
(p) Other Comprehensive Income (Loss)
ASC 220, Comprehensive Income, establishes standards for reporting and displaying comprehensive income and its components in the consolidated financial statements. The Company reports the change in pension benefit plan assets/liabilities, cumulative foreign currency translation, change in fair value of investments and change in fair value of an interest rate swap as components of accumulated other comprehensive loss (“AOCI”).
F-11
TUTOR PERINI CORPORATION AND SUBSIDIARIES
NOTES TO CONSOLIDATED FINANCIAL STATEMENTS (Continued)
The tax effects of the components of other comprehensive income (loss) are as follows:
|
|
||||||||||||||||||||||||||
|
|
Year Ended December 31, |
|||||||||||||||||||||||||
|
|
2017 |
2016 |
2015 |
|||||||||||||||||||||||
|
(in thousands) |
Before-Tax Amount |
Tax (Expense) Benefit |
Net-of-Tax Amount |
Before-Tax Amount |
Tax Benefit |
Net-of-Tax Amount |
Before-Tax Amount |
Tax Benefit (Expense) |
Net-of-Tax Amount |
|||||||||||||||||
|
Other comprehensive income (loss): |
||||||||||||||||||||||||||
|
Defined benefit pension plan adjustments |
$ |
2,416 |
$ |
(992) |
$ |
1,424 |
$ |
(4,452) |
$ |
1,829 |
$ |
(2,623) |
$ |
31 |
$ |
1,995 |
$ |
2,026 | ||||||||
|
Foreign currency translation adjustment |
2,159 | (886) | 1,273 | (439) | 178 | (261) | (5,897) | 2,683 | (3,214) | |||||||||||||||||
|
Unrealized (loss) gain in fair value of investments |
(4) | 2 | (2) | (576) | 236 | (340) | 1,123 | (357) | 766 | |||||||||||||||||
|
Unrealized loss in fair value of interest rate swap |
— |
— |
— |
(45) | 21 | (24) | (37) | (88) | (125) | |||||||||||||||||
|
Total other comprehensive income (loss) |
$ |
4,571 |
$ |
(1,876) |
$ |
2,695 |
$ |
(5,512) |
$ |
2,264 |
$ |
(3,248) |
$ |
(4,780) |
$ |
4,233 |
$ |
(547) | ||||||||
|
Total other comprehensive income (loss) attributable to Tutor Perini Corporation |
$ |
4,571 |
$ |
(1,876) |
$ |
2,695 |
$ |
(5,512) |
$ |
2,264 |
$ |
(3,248) |
$ |
(4,780) |
$ |
4,233 |
$ |
(547) | ||||||||
The changes in AOCI balances by component (after tax) for each of the three years ended December 31, 2017 are as follows:
|
|
||||||||||||||
|
(in thousands) |
Defined Benefit Pension Plan |
Foreign Currency Translation |
Unrealized (Loss) Gain in Fair Value of Investments |
Unrealized Gain (Loss) in Fair Value of Interest Rate Swap |
Accumulated Other Comprehensive Loss |
|||||||||
|
Attributable to Tutor Perini Corporation: |
||||||||||||||
|
Balance as of December 31, 2014 |
$ |
(40,268) |
$ |
(1,389) |
$ |
(110) |
$ |
149 |
$ |
(41,618) | ||||
|
Other comprehensive income (loss) |
2,026 | (3,214) | 766 | (125) | (547) | |||||||||
|
Balance as of December 31, 2015 |
$ |
(38,242) |
$ |
(4,603) |
$ |
656 |
$ |
24 |
$ |
(42,165) | ||||
|
Other comprehensive loss before reclassifications |
(3,722) | (261) | (340) | (24) | (4,347) | |||||||||
|
Amounts reclassified from AOCI |
1,099 |
— |
— |
— |
1,099 | |||||||||
|
Balance as of December 31, 2016 |
$ |
(40,865) |
$ |
(4,864) |
$ |
316 |
$ |
— |
$ |
(45,413) | ||||
|
Other comprehensive income (loss) before reclassifications |
306 | 1,273 | (2) |
— |
1,577 | |||||||||
|
Amounts reclassified from AOCI |
1,118 |
— |
— |
— |
1,118 | |||||||||
|
Balance as of December 31, 2017 |
$ |
(39,441) |
$ |
(3,591) |
$ |
314 |
$ |
— |
$ |
(42,718) | ||||
The significant items reclassified out of AOCI and the corresponding location and impact on the Consolidated Statements of Income are as follows:
|
|
||||||||||
|
|
Location in Consolidated |
Year Ended December 31, |
||||||||
|
(in thousands) |
Statements of Income |
2017 |
2016 |
2015 |
||||||
|
Defined benefit pension plan adjustments |
Various accounts(a) |
$ |
1,897 |
$ |
1,745 |
$ |
— |
|||
|
Income tax benefit |
Income tax benefit (provision) |
(779) | (646) |
— |
||||||
|
Net of tax |
$ |
1,118 |
$ |
1,099 |
$ |
— |
||||
(a)Defined benefit pension plan adjustments were reclassified to cost of operations and general and administrative expenses.
(q) New Accounting Pronouncements
In May 2014, the FASB issued Accounting Standards Update (“ASU”) 2014-09, Revenue from Contracts with Customers (Topic 606), as amended by subsequent ASUs (collectively, “ASU 2014-09”). ASU 2014-09 amends the existing accounting standards for revenue recognition and establishes principles for recognizing revenue upon the transfer of promised goods or services to customers based on the expected consideration to be received in exchange for those goods or services. The guidance is effective for interim and annual reporting periods beginning after December 15, 2017. The amendments may be applied retrospectively to each prior period presented or with the cumulative effect recognized as of the date of initial application (modified retrospective method). The Company will adopt this new standard using the modified retrospective method. The Company has reviewed its contract portfolio in order to determine the impact that the adoption of ASU 2014-09 will have on its consolidated financial statements. Based on the Company’s evaluation of ASU 2014-09, the Company expects an immaterial reduction to beginning retained earnings, with an immaterial impact to net income on an ongoing basis. The Company has implemented changes to its business processes, systems and internal controls to support the adoption of this new standard and the related disclosure requirements. The adoption of the standard is also expected to impact the presentation of the consolidated balance sheet. The impact primarily relates to reclassifications among project working capital financial statement accounts to align with the new standard.
F-12
TUTOR PERINI CORPORATION AND SUBSIDIARIES
NOTES TO CONSOLIDATED FINANCIAL STATEMENTS (Continued)
In February 2016, the FASB issued ASU 2016-02, Leases (Topic 842), which amends the existing guidance in ASC 840, Leases. This amendment requires the recognition of lease assets and lease liabilities by lessees for those leases currently classified as operating leases. Other significant provisions of the amendment include (i) defining the “lease term” to include the non-cancellable period together with periods for which there is a significant economic incentive for the lessee to extend or not terminate the lease; (ii) defining the initial lease liability to be recorded on the balance sheet to contemplate only those variable lease payments that depend on an index or that are in substance “fixed”; and (iii) a dual approach for determining whether lease expense is recognized on a straight-line or accelerated basis, depending on whether the lessee is expected to consume more than an insignificant portion of the leased asset’s economic benefits. This guidance will be effective for interim and annual reporting periods beginning after December 15, 2018 and will be applied using the modified retrospective transition method for existing leases. The Company is currently evaluating the effect that the adoption of this ASU will have on its consolidated financial statements.
In March 2016, the FASB issued ASU 2016-09, Compensation—Stock Compensation (Topic 718): Improvements to Employee Share-Based Payment Accounting (“ASU 2016-09”), which simplifies several aspects of the accounting for share-based payment transactions, including the accounting for the income tax effect of share-based transactions and the forfeiture of share-based instruments. The Company prospectively adopted this ASU effective January 1, 2017. Upon this adoption, the Company changed its accounting policy for share-based awards that have service requirements such that the impact for failure to meet service requirements will only be recognized upon occurrence. The adoption of this ASU did not have a material impact on the Company’s consolidated financial statements.
In August 2016, the FASB issued ASU 2016-15, Statement of Cash Flows (Topic 230): Classification of Certain Cash Receipts and Cash Payments (“ASU 2016-15”), seeking to eliminate diversity in practice related to how certain cash receipts and cash payments are presented and classified in the statement of cash flows. The amendments in ASU 2016-15 address eight specific cash flow issues including the classification of debt prepayment and extinguishment costs in the cash flow statement. The amendments in ASU 2016-15 are effective for public business entities for fiscal years beginning after December 15, 2017, and interim periods within those fiscal years. Early adoption is permitted, including adoption in an interim period provided any adjustments should be reflected as of the beginning of the fiscal year that includes the interim period. The Company adopted this accounting standard in 2017 and has applied the provisions retrospectively to the beginning of the fiscal years presented in the Consolidated Financial Statements. The adoption of this guidance did not have a material impact on the Company’s consolidated financial statements.
In November 2016, the FASB issued ASU 2016-18, Statement of Cash Flows (Topic 230): Restricted Cash, which requires restricted cash to be included with cash and cash equivalent balances in the statement of cash flows. The guidance is effective for interim and annual reporting periods beginning after December 15, 2017. The adoption of this ASU will result in an increase of net cash used in investing activities of $45.7 million for the year ended December 31, 2017 and a decrease of net cash used in investing activities of $4.7 million and $1.5 million for the years ended December 31, 2016 and 2015.
In January 2017, the FASB issued ASU 2017-04, Intangibles—Goodwill and Other (Topic 350): Simplifying the Test for Goodwill Impairment (“ASU 2017-04”). This ASU simplifies the calculation of goodwill impairment by eliminating Step 2 of the impairment test prescribed by ASC 350. Step 2 requires companies to calculate the implied fair value of their goodwill by estimating the fair value of their assets, other than goodwill, and liabilities, including unrecognized assets and liabilities, following the procedure that would be required in determining the fair value of assets acquired and liabilities assumed in a business combination. The calculated net fair value of the assets would then be compared to the fair value of the reporting unit to determine the implied fair value of goodwill, and to the extent that the carrying value of goodwill was less than the implied fair value, a loss would be recognized. Under ASU 2017-04, however, goodwill is impaired when the calculated fair value of a reporting unit is less than its carrying value, and the impairment charge will equal that difference (i.e., impairment will be calculated at the reporting unit level and there will be no need to estimate the fair value of individual assets and liabilities). This guidance will be effective for any goodwill impairment tests performed in fiscal years beginning after December 15, 2019; however, early adoption is permitted for tests performed on testing dates after January 1, 2017. The Company does not expect the adoption of this ASU to have a material impact on its consolidated financial statements.
In May 2017, the FASB issued ASU 2017-09, Compensation—Stock Compensation (Topic 718): Scope of Modification Accounting. This ASU clarifies the scope of modification accounting under Topic 718 with respect to changes to the terms or conditions of a share-based payments award. Under this new guidance, modification accounting would not apply if a change to an award does not affect the total current fair value, vesting conditions or the classification of the award. This guidance is effective for interim and annual reporting periods beginning after December 15, 2017, with early adoption permitted. The Company does not expect the adoption of this ASU to have a material impact on its consolidated financial statements.
In February 2018, the FASB issued ASU 2018-02, Income Statement—Reporting Comprehensive Income (Topic 220): Reclassification of Certain Tax Effects from the Accumulated Other Comprehensive Income. This ASU gives entities the option to
F-13
TUTOR PERINI CORPORATION AND SUBSIDIARIES
NOTES TO CONSOLIDATED FINANCIAL STATEMENTS (Continued)
reclassify to retained earnings tax effects related to items in accumulated other comprehensive income that the FASB refers to as having been stranded in accumulated other comprehensive income as a result of tax reform. Entities can apply the provisions of this ASU either in the period of adoption or retrospectively. The guidance is effective for interim and annual reporting periods beginning after December 15, 2018, with early adoption permitted. The Company is currently evaluating the effect that the adoption of this ASU will have on its consolidated financial statements.
2. Consolidated Statement of Cash Flows
Below are the changes in other components of working capital, as shown in the Consolidated Statements of Cash Flows, and the supplemental disclosure of cash paid for interest and income taxes:
|
|
||||||||
|
|
Year Ended December 31, |
|||||||
|
(in thousands) |
2017 |
2016 |
2015 |
|||||
|
(Increase) Decrease in: |
||||||||
|
Accounts receivable |
$ |
(57,609) |
$ |
(269,900) |
$ |
4,734 | ||
|
Costs and estimated earnings in excess of billings |
(100,932) | 73,349 | (178,774) | |||||
|
Other current assets |
(19,718) | 39,480 | (38,616) | |||||
|
(Decrease) Increase in: |
||||||||
|
Accounts payable |
(32,225) | 56,552 | 139,290 | |||||
|
Billings in excess of costs and estimated earnings |
125,757 | 42,926 | (30,985) | |||||
|
Accrued expenses |
24,513 | (32,937) | (24,426) | |||||
|
Changes in other components of working capital |
$ |
(60,214) |
$ |
(90,530) |
$ |
(128,777) | ||
|
|
||||||||
|
Cash paid during the year for: |
||||||||
|
Interest |
$ |
50,443 |
$ |
47,403 |
$ |
45,055 | ||
|
Income taxes |
$ |
39,776 |
$ |
26,908 |
$ |
35,299 | ||
3. Income Taxes
Income before taxes is summarized as follows:
|
|
|||||||||
|
|
Year Ended December 31, |
||||||||
|
(in thousands) |
2017 |
2016 |
2015 |
||||||
|
United States operations |
$ |
135,177 |
$ |
128,072 |
$ |
69,822 | |||
|
Foreign operations |
18,798 | 21,043 | 4,017 | ||||||
|
Total |
$ |
153,975 |
$ |
149,115 |
$ |
73,839 | |||
The income tax (benefit) provision is as follows:
|
|
|||||||||
|
|
Year Ended December 31, |
||||||||
|
(in thousands) |
2017 |
2016 |
2015 |
||||||
|
Current expense: |
|||||||||
|
Federal |
$ |
12,329 |
$ |
43,850 |
$ |
5,465 | |||
|
State |
6,763 | 13,039 | (362) | ||||||
|
Foreign |
3,435 | 6,573 | 1,126 | ||||||
|
Total current |
22,527 | 63,462 | 6,229 | ||||||
|
|
|||||||||
|
Deferred (benefit) expense: |
|||||||||
|
Federal |
(30,021) | (3,054) | 19,583 | ||||||
|
State |
5,560 | (5,302) | 2,735 | ||||||
|
Foreign |
1,365 | (1,813) |
— |
||||||
|
Total deferred |
(23,096) | (10,169) | 22,318 | ||||||
|
Total (benefit) provision |
$ |
(569) |
$ |
53,293 |
$ |
28,547 | |||
F-14
TUTOR PERINI CORPORATION AND SUBSIDIARIES
NOTES TO CONSOLIDATED FINANCIAL STATEMENTS (Continued)
The following table is a reconciliation of the Company’s income tax provision at the statutory rates to the income tax (benefit) provision at the Company’s effective rate:
|
|
||||||||||||||||||
|
|
||||||||||||||||||
|
|
Year Ended December 31, |
|||||||||||||||||
|
|
2017 |
2016 |
2015 |
|||||||||||||||
|
(dollars in thousands) |
Amount |
Rate |
Amount |
Rate |
Amount |
Rate |
||||||||||||
|
Federal income tax expense at statutory tax rate |
$ |
53,892 | 35.0 |
% |
$ |
52,190 | 35.0 |
% |
$ |
25,844 | 35.0 |
% |
||||||
|
State income taxes, net of federal tax benefit |
7,753 | 5.0 | 4,614 | 3.1 | 3,685 | 5.0 | ||||||||||||
|
Impact of federal tax law change |
(53,348) | (34.6) |
— |
— |
— |
— |
||||||||||||
|
Officers' compensation |
2,622 | 1.7 | 3,807 | 2.6 | 2,900 | 3.9 | ||||||||||||
|
Domestic production activities deduction |
(2,668) | (1.7) | (4,018) | (2.7) | (1,499) | (2.0) | ||||||||||||
|
Noncontrolling interest |
(2,137) | (1.4) |
— |
— |
— |
— |
||||||||||||
|
Reversal of taxes payable due to statute expiration |
(4,337) | (2.8) |
— |
— |
— |
— |
||||||||||||
|
Other |
(2,346) | (1.6) | (3,300) | (2.3) | (2,383) | (3.2) | ||||||||||||
|
Income tax (benefit) provision |
$ |
(569) | (0.4) |
% |
$ |
53,293 | 35.7 |
% |
$ |
28,547 | 38.7 |
% |
||||||
On December 22, 2017, the U.S. government enacted significant tax legislation commonly referred to as the Tax Cuts and Jobs Act of 2017 (the “TCJA”). The TCJA makes broad and complex changes to the U.S. tax code that will impact the Company’s financial statements, including but not limited to a permanent decrease in the corporate federal statutory income tax rate from 35% to 21%, effective January 1, 2018, and a one-time transition tax from the inclusion of foreign earnings, which the Company can elect to pay over eight years. Future distributions from foreign subsidiaries, however, will no longer be subject to federal income tax.
As a result of the TCJA, the Company recognized an income tax benefit of $53.3 million in 2017, primarily due to the remeasurement of deferred tax assets and liabilities based on the reduced corporate federal statutory income tax rate of 21%.
The Securities and Exchange Commission staff issued Staff Accounting Bulletin No. 118 (“SAB 118”), which provides guidance on accounting for the tax effects of the TCJA. SAB 118 provides a measurement period that should not extend beyond one year from the TCJA enactment date for companies to complete the accounting under ASC 740, Income Taxes (“ASC 740”). In accordance with SAB 118, a company must reflect the income tax effects of those aspects of the TCJA for which the accounting under ASC 740 is complete. To the extent that a company’s accounting for certain income tax effects of the TCJA is incomplete but it is able to determine a reasonable estimate, it must record a provisional estimate in the financial statements. If a company cannot determine a provisional estimate to be included in the financial statements, it should continue to apply ASC 740 on the basis of the provisions of the tax laws that were in effect immediately before the enactment of the TCJA.
The one-time transition tax is based on the Company’s total post-1986 earnings and profits (“E&P”) that it previously deferred from U.S. income taxes. The Company recorded a provisional amount for its one-time transition tax liability for its foreign subsidiaries, resulting in an increase in income tax expense of $0.5 million. The Company has not yet completed its calculation of the total post-1986 E&P for these foreign subsidiaries. Further, the transition tax is based in part on the amount of those earnings held in cash and other specified assets. This amount may change when the Company finalizes the calculation of post-1986 foreign E&P previously deferred from U.S. federal taxation and finalizes the amounts held in cash or other specified assets.
F-15
TUTOR PERINI CORPORATION AND SUBSIDIARIES
NOTES TO CONSOLIDATED FINANCIAL STATEMENTS (Continued)
The following is a summary of the significant components of the deferred tax assets and liabilities:
|
|
||||||
|
|
As of December 31, |
|||||
|
(in thousands) |
2017 |
2016 |
||||
|
Deferred tax assets: |
||||||
|
Timing of expense recognition |
$ |
22,730 |
$ |
36,055 | ||
|
Net operating losses |
8,590 | 10,140 | ||||
|
Other, net |
15,618 | 33,507 | ||||
|
Deferred tax assets |
46,938 | 79,702 | ||||
|
Valuation allowance |
(381) | (460) | ||||
|
Net deferred tax assets |
46,557 | 79,242 | ||||
|
Deferred tax liabilities: |
||||||
|
Intangible assets, due primarily to purchase accounting |
(30,019) | (34,679) | ||||
|
Fixed assets, due primarily to purchase accounting |
(73,833) | (107,081) | ||||
|
Construction contract accounting |
(17,539) | (12,564) | ||||
|
Joint ventures |
(11,343) | (29,609) | ||||
|
Other |
(22,263) | (24,970) | ||||
|
Deferred tax liabilities |
(154,997) | (208,903) | ||||
|
|
||||||
|
Net deferred tax liabilities |
$ |
(108,440) |
$ |
(129,661) | ||
The net deferred tax liabilities are presented in the Consolidated Balance Sheets as follows:
|
|
||||||
|
|
As of December 31, |
|||||
|
(in thousands) |
2017 |
2016 |
||||
|
Deferred tax assets |
$ |
64 |
$ |
1,346 | ||
|
Deferred tax liabilities |
(108,504) | (131,007) | ||||
|
Net deferred tax liabilities |
$ |
(108,440) |
$ |
(129,661) | ||
Prior to 2017, the Company did not provide for deferred income taxes or foreign withholding tax on basis differences in its non-U.S. subsidiaries that result from undistributed earnings which the Company had the intent and the ability to reinvest in its foreign operations. Due to the enactment of the TCJA, the Company no longer intends to permanently reinvest in its foreign subsidiaries. Any tax on future distributions will be limited to certain state taxes, which would be immaterial.
The Company’s policy is to record interest and penalties on unrecognized tax benefits as an element of income tax expense. The cumulative amounts related to interest and penalties are added to the total unrecognized tax liabilities on the balance sheet. The total amount of gross unrecognized tax benefits as of December 31, 2017 that, if recognized, would affect the effective tax rate is $6.5 million. During 2017, the Company recognized a net decrease of $1.1 million in liabilities. The amount of gross unrecognized tax benefits as of December 31, 2016 was $7.6 million. During 2016, the Company recognized a net increase of $4.0 million in liabilities. The amount of gross unrecognized tax benefits as of December 31, 2015 was $3.6 million. During 2015, the Company recognized a net decrease of $4.0 million in liabilities. The Company does not expect any significant release of unrecognized tax benefits within the next twelve months.
The Company accounts for its uncertain tax positions in accordance with GAAP. A reconciliation of the beginning and ending amounts of these tax benefits for the three years ended December 31, 2017 is as follows:
|
|
|||||||||
|
|
As of December 31, |
||||||||
|
(in thousands) |
2017 |
2016 |
2015 |
||||||
|
Beginning balance |
$ |
7,574 |
$ |
3,612 |
$ |
7,636 | |||
|
Change in tax positions of prior years |
(1,207) | 3,543 | (3,073) | ||||||
|
Change in tax positions of current year |
128 | 419 | 169 | ||||||
|
Reduction in tax positions for statute expirations |
— |
— |
(1,120) | ||||||
|
Ending Balance |
$ |
6,495 |
$ |
7,574 |
$ |
3,612 | |||
The Company conducts business internationally and, as a result, one or more of its subsidiaries files income tax returns in U.S. federal, U.S. state and certain foreign jurisdictions. Accordingly, in the normal course of business, the Company is subject to examination by taxing authorities principally throughout the United States, Guam and Canada. The Company is no longer under examination by the
F-16
TUTOR PERINI CORPORATION AND SUBSIDIARIES
NOTES TO CONSOLIDATED FINANCIAL STATEMENTS (Continued)
taxing authority regarding any U.S. federal income tax returns for years before 2011 while the years open for examination under various state and local jurisdictions vary.
4. Goodwill and Other Intangible Assets
As of December 31, 2017, 2016 and 2015, the Company had $585.0 million of goodwill allocated to its reporting units as follows: Civil, $415.3 million; Building, $13.5 million; and Specialty Contractors, $156.2 million. The balances presented include historical accumulated impairment of $76.7 million for the Civil segment and $411.3 million for the Building segment.
In addition, as of December 31, 2017 and 2016, the Company had the following: (1) non-amortizable trade names with a carrying value of $50.4 million; (2) amortizable trade names with a gross carrying value of $51.1 million and accumulated amortization as of December 31, 2017 and 2016 of $16.3 million and $13.8 million, respectively; and (3) amortizable customer relationships with a gross carrying value of $23.2 million and accumulated amortization as of December 31, 2017 and 2016 of $18.9 million and $17.9 million, respectively.
Amortization expense related to amortizable intangible assets for the years ended December 31, 2017, 2016 and 2015 totaled $3.5 million, $3.5 million and $3.7 million, respectively. Future amortization expense related to amortizable intangible assets will be approximately $3.5 million per year for the years 2018 through 2021 and $2.6 million for the year 2022.
The weighted-average amortization period for amortizable trade names and customer relationships is 20 years and 12 years, respectively.
5. Financial Commitments
Long-Term Debt
Long-term debt consisted of the following as of the dates of the Consolidated Balance Sheets presented:
|
|
|||||
|
|
As of December 31, |
||||
|
(in thousands) |
2017 |
2016 |
|||
|
2017 Senior Notes |
$ |
492,734 |
$ |
— |
|
|
2017 Credit Facility |
— |
— |
|||
|
2010 Senior Notes |
— |
298,120 | |||
|
2014 Revolver |
— |
147,990 | |||
|
Term Loan |
— |
54,650 | |||
|
Convertible Notes |
161,635 | 152,668 | |||
|
Equipment financing and mortgages |
76,820 | 101,558 | |||
|
Other indebtedness |
5,087 | 4,533 | |||
|
Total debt |
736,276 | 759,519 | |||
|
Less: Current maturities |
(30,748) | (85,890) | |||
|
Long-term debt, net |
$ |
705,528 |
$ |
673,629 | |
The following table reconciles the outstanding debt balance to the reported debt balances as of December 31, 2017 and 2016:
|
|
|||||||||||||||||
|
|
As of December 31, 2017 |
As of December 31, 2016 |
|||||||||||||||
|
(in thousands) |
Outstanding Long-Term Debt |
Unamortized Discount and Issuance Costs |
Long-Term Debt, as reported |
Outstanding Long-Term Debt |
Unamortized Discounts and Issuance Costs |
Long-Term Debt, |
|||||||||||
|
2017 Senior Notes |
$ |
500,000 |
$ |
(7,266) |
$ |
492,734 |
$ |
— |
$ |
— |
$ |
— |
|||||
|
2010 Senior Notes |
— |
— |
— |
300,000 | (1,880) | 298,120 | |||||||||||
|
2014 Revolver |
— |
— |
— |
152,500 | (4,510) | 147,990 | |||||||||||
|
Term Loan |
— |
— |
— |
57,000 | (2,350) | 54,650 | |||||||||||
|
Convertible Notes |
200,000 | (38,365) | 161,635 | 200,000 | (47,332) | 152,668 | |||||||||||
The unamortized issuance cost related to the 2017 Credit Facility was $6.2 million as of December 31, 2017 and is included in other assets in the Consolidated Balance Sheet.
F-17
TUTOR PERINI CORPORATION AND SUBSIDIARIES
NOTES TO CONSOLIDATED FINANCIAL STATEMENTS (Continued)
2017 Senior Notes
On April 20, 2017, the Company issued $500 million in aggregate principal amount of 6.875% Senior Notes due 2025 (the “2017 Senior Notes”) in a private placement. Interest on the 2017 Senior Notes is payable in arrears semi-annually in May and November of each year, beginning in November 2017.
Prior to May 1, 2020, the Company may redeem the 2017 Senior Notes at a redemption price equal to 100% of their principal amount plus a “make-whole” premium described in the indenture. In addition, prior to May 1, 2020, the Company may redeem up to 40% of the original aggregate principal amount of the notes at a redemption price of 106.875% of their principal amount with the proceeds received by the Company from any offering of the Company’s equity. After May 1, 2020, the Company may redeem the 2017 Senior Notes at specified redemption prices described in the indenture. Upon a change of control, holders of the 2017 Senior Notes may require the Company to repurchase all or part of the 2017 Senior Notes at 101% of the principal amount thereof, plus accrued and unpaid interest to the redemption date.
The 2017 Senior Notes are senior unsecured obligations of the Company and are guaranteed by substantially all of the Company’s existing and future subsidiaries that also guarantee obligations under the Company’s 2017 Credit Facility, as defined below. In addition, the indenture for the 2017 Senior Notes provides for customary covenants, including events of default and restrictions on the payment of dividends and share repurchases.
2017 Credit Facility
On April 20, 2017, the Company entered into a credit agreement (the “2017 Credit Facility”) with SunTrust Bank as Administrative Agent, Swing Line Lender and L/C Issuer and a syndicate of other lenders. The 2017 Credit Facility provides for a $350 million revolving credit facility (the “2017 Revolver”) and a sublimit for the issuance of letters of credit and swingline loans up to the aggregate amount of $150 million and $10 million, respectively, both maturing on April 20, 2022, unless any of the Convertible Notes, as defined below, are outstanding on December 17, 2020, in which case all such borrowings will mature on December 17, 2020 (subject to certain further exceptions). In addition, the 2017 Credit Facility permits additional borrowings in an aggregate amount of $150 million, which can be in the form of increased capacity on the 2017 Revolver or the establishment of one or more term loans.
Borrowings under the 2017 Revolver bear interest, at the Company’s option, at a rate equal to a margin over (a) the London Interbank Offered Rate (“LIBOR”) plus a margin of between 1.50% and 3.00% or (b) a base rate (determined by reference to the highest of (i) the administrative agent’s prime lending rate, (ii) the federal funds effective rate plus 50 basis points, (iii) the LIBOR rate for a one-month interest period plus 100 basis points and (iv) 0%), plus a margin of between 0.50% and 2.00%, in each case based on the Consolidated Leverage Ratio (as defined in the 2017 Credit Facility). In addition to paying interest on outstanding principal under the 2017 Credit Facility, the Company will pay a commitment fee to the lenders under the 2017 Revolver in respect of the unutilized commitments thereunder. The Company will pay customary letter of credit fees. If an event of default occurs and is continuing, the otherwise applicable margin and letter of credit fees will be increased by 2% per annum. The weighted-average annual interest rate on borrowings under the 2017 Revolver was approximately 3.89% during the year ended December 31, 2017.
The 2017 Credit Facility contains customary covenants for credit facilities of this type, including maximum consolidated leverage ratios ranging from 4.00:1.00 to 3.25:1.00 over the life of the facility and a minimum consolidated fixed charge coverage ratio of 1.25:1.00. Substantially all of the Company’s subsidiaries unconditionally guarantee the obligations of the Company under the 2017 Credit Facility; additionally, the obligations are secured by a lien on all personal property of the Company and its subsidiaries guaranteeing these obligations.
As of December 31, 2017, there was $350.0 million available under the 2017 Revolver, and the Company had not utilized the 2017 Credit Facility for letters of credit. The Company was in compliance with the financial covenants under the 2017 Credit Facility as of December 31, 2017.
Repurchase and Redemption of 2010 Senior Notes and Termination of 2014 Credit Facility
On April 20, 2017, the Company used proceeds from the 2017 Senior Notes and 2017 Revolver to repurchase or redeem its 2010 Senior Notes, to pay off its Term Loan and 2014 Revolver, and to pay accrued but unpaid interest and fees. In addition, the indenture governing the 2010 Senior Notes was satisfied and discharged, and the Company terminated the 2014 Credit Facility.
F-18
TUTOR PERINI CORPORATION AND SUBSIDIARIES
NOTES TO CONSOLIDATED FINANCIAL STATEMENTS (Continued)
2010 Senior Notes
On October 20, 2010, the Company issued $300 million of 7.625% Senior Notes due November 1, 2018 (the “2010 Senior Notes”) in a private placement offering. As discussed above, on April 20, 2017, the Company repurchased or redeemed the 2010 Senior Notes in full and the related indenture was satisfied and discharged.
2014 Credit Facility
On June 5, 2014, the Company entered into a Sixth Amended and Restated Credit Agreement, as amended (the “2014 Credit Facility”), with Bank of America, N.A. as Administrative Agent, Swing Line Lender and L/C Issuer and a syndicate of other lenders. The 2014 Credit Facility provided for a $300 million revolving credit facility (the “2014 Revolver”), a $250 million term loan (the “Term Loan”) and a sublimit for the issuance of letters of credit up to the aggregate amount of $150 million, all maturing on May 1, 2018. Borrowings under both the 2014 Revolver and the Term Loan bore interest based either on Bank of America’s prime lending rate or the London Interbank Offered Rate (“LIBOR”), each plus an applicable margin ranging from 1.25% to 3.00%, contingent upon the latest Consolidated Leverage Ratio.
As discussed above, on April 20, 2017, the Company repaid all borrowings under the 2014 Credit Facility and concurrently terminated the facility.
Convertible Notes
On June 15, 2016, the Company issued $200 million of 2.875% Convertible Senior Notes due June 15, 2021 (the “Convertible Notes”) in a private placement offering. The Convertible Notes are unsecured obligations and do not contain any financial covenants or restrictions on the payments of dividends, the incurrence of indebtedness or the issuance or repurchase of securities by the Company. The Convertible Notes bear interest at a rate of 2.875% per year, payable in cash semi-annually in June and December.
To account for the Convertible Notes, the Company applied the provisions of ASC 470-20, Debt with Conversion and Other Options (“ASC 470-20”). ASC 470-20 requires issuers of certain convertible debt instruments that may be settled in cash upon conversion to separately account for the liability (debt) and equity (conversion option) components of the instrument in a manner that reflects the issuer’s nonconvertible debt borrowing rate. This is done by allocating the proceeds from issuance to the liability component based on the fair value of the debt instrument excluding the conversion feature, with the residual allocated to the equity component and classified in additional paid in capital. The $46.8 million difference between the principal amount of the Convertible Notes ($200.0 million) and the proceeds initially allocated to the liability component ($153.2 million) is treated as a discount on the Convertible Notes. This difference is being amortized as non-cash interest expense using the interest method, as discussed below under Interest Expense. The equity component, however, is not subject to amortization nor subsequent remeasurement.
In addition, ASC 470-20 requires that the debt issuance costs associated with a convertible debt instrument be allocated between the liability and equity components in proportion to the allocation of the debt proceeds between these two components. The debt issuance costs attributable to the liability component of the Convertible Notes ($5.1 million) are also treated as a discount on the Convertible Notes and amortized as non-cash interest expense. The debt issuance costs attributable to the equity component ($1.5 million) were netted with the equity component and will not be amortized.
The following table presents information related to the liability and equity components of the Convertible Notes:
|
(in thousands) |
December 31, |
December 31, |
|||
|
Liability component: |
|||||
|
Principal |
$ |
200,000 |
$ |
200,000 | |
|
Conversion feature |
(46,800) | (46,800) | |||
|
Allocated debt issuance costs |
(5,051) | (5,051) | |||
|
Amortization of discount and debt issuance costs (non-cash interest expense) |
13,486 | 4,519 | |||
|
Net carrying amount |
$ |
161,635 |
$ |
152,668 | |
|
|
|||||
|
Equity component: |
|||||
|
Conversion feature |
$ |
46,800 |
$ |
46,800 | |
|
Allocated debt issuance costs |
(1,543) | (1,543) | |||
|
Deferred taxes |
(18,815) | (18,815) | |||
|
Net carrying amount |
$ |
26,442 |
$ |
26,442 | |
F-19
TUTOR PERINI CORPORATION AND SUBSIDIARIES
NOTES TO CONSOLIDATED FINANCIAL STATEMENTS (Continued)
Prior to January 15, 2021, the Convertible Notes will be convertible only under the following circumstances: (1) during the five business day period after any ten consecutive trading day period in which the trading price per $1,000 principal amount of Convertible Notes for such trading day was less than 98% of the product of the last reported sale price of the Company’s Common Stock and the conversion rate on each such trading day; (2) if the last reported sale price of the Common Stock for at least 20 trading days (whether or not consecutive) during a period of 30 consecutive trading days ending on the last trading day of the immediately preceding calendar quarter is greater than or equal to 130% of the conversion rate of 33.0579 (or $39.32) on each applicable trading day; or (3) upon the occurrence of specified corporate events. On or after January 15, 2021 until the close of business on the second scheduled trading day immediately preceding the maturity date, holders may convert all or any portion of their notes, in multiples of $1,000 principal amount, at the option of the holder regardless of the foregoing circumstances.
The Convertible Notes will be convertible at an initial conversion rate of 33.0579 shares of the Company’s Common Stock per $1,000 principal amount of the Convertible Notes, which is equivalent to an initial conversion price of approximately $30.25. The conversion rate will be subject to adjustment for some events but will not be adjusted for any accrued and unpaid interest. In addition, following certain corporate events that occur prior to the maturity date, the Company is required to increase, in certain circumstances, the conversion rate for a holder who elects to convert their Convertible Notes in connection with such a corporate event including customary conversion rate adjustments in connection with a “make-whole fundamental change” described in the indenture. Upon conversion, and at the Company’s election, the Company may satisfy its conversion obligation by paying or delivering, as applicable, cash, shares of its Common Stock or a combination of cash and shares of its Common Stock. As of December 31, 2017, the conversion provisions of the Convertible Notes have not been triggered.
Equipment Financing and Mortgages
The Company has certain loans entered into for the purchase of specific property, plant and equipment and secured by the assets purchased. The aggregate balance of equipment financing loans was approximately $61.1 million and $84.9 million at December 31, 2017 and 2016, respectively, with interest rates ranging from 1.90% to 5.93% with equal monthly installment payments over periods up to ten years with additional balloon payments of $12.4 million in 2021 and $6.3 million in 2022 on the remaining loans outstanding at December 31, 2017. The aggregate balance of mortgage loans was approximately $15.7 million and $16.7 million at December 31, 2017 and 2016, respectively, with interest rates ranging from a fixed 2.50% to LIBOR plus 3% and equal monthly installment payments over periods up to seven years with additional balloon payments of $2.6 million in 2018, $2.9 million in 2021 and $7.0 million in 2023.
The following table presents the future principal payments required under all of the Company’s debt obligations, discussed above:
|
|
|||
|
Year (in thousands) |
|||
|
2018 |
$ |
30,748 | |
|
2019 |
12,194 | ||
|
2020 |
5,321 | ||
|
2021 |
218,868 | ||
|
2022 |
7,457 | ||
|
Thereafter |
507,319 | ||
|
|
781,907 | ||
|
Less: Unamortized discount and issuance costs |
(45,631) | ||
|
Total |
$ |
736,276 | |
F-20
TUTOR PERINI CORPORATION AND SUBSIDIARIES
NOTES TO CONSOLIDATED FINANCIAL STATEMENTS (Continued)
Interest Expense
Interest Expense as reported in the Consolidated Statements of Income consists of the following:
|
|
||||||||
|
|
For the year ended December 31, |
|||||||
|
(in thousands) |
2017 |
2016 |
2015 |
|||||
|
Cash interest expense: |
||||||||
|
Interest on 2017 Senior Notes |
$ |
23,967 |
$ |
— |
$ |
— |
||
|
Interest on 2017 Credit Facility |
5,517 |
— |
— |
|||||
|
Interest on 2010 Senior Notes |
6,926 | 22,875 | 22,875 | |||||
|
Interest on 2014 Credit Facility |
4,455 | 19,201 | 14,368 | |||||
|
Interest on Convertible Notes |
5,750 | 3,115 |
— |
|||||
|
Other interest |
3,261 | 3,623 | 5,805 | |||||
|
Cash portion of loss on extinguishment |
1,913 |
— |
— |
|||||
|
Total cash interest expense |
51,789 | 48,814 | 43,048 | |||||
|
Non-cash interest expense(a): |
||||||||
|
Amortization of debt issuance costs on 2017 Senior Notes |
516 |
— |
— |
|||||
|
Amortization of debt issuance costs on 2017 Credit Facility |
962 |
— |
— |
|||||
|
Amortization of discount and debt issuance costs on 2010 Senior Notes |
308 | 1,002 | 979 | |||||
|
Amortization of debt issuance costs on 2014 Credit Facility |
1,703 | 5,447 | 1,116 | |||||
|
Amortization of discount and debt issuance costs on Convertible Notes |
8,967 | 4,519 |
— |
|||||
|
Non-cash portion of loss on extinguishment |
5,139 |
— |
— |
|||||
|
Total non-cash interest expense |
17,595 | 10,968 | 2,095 | |||||
|
Total interest expense |
$ |
69,384 |
$ |
59,782 |
$ |
45,143 | ||
(a) The combination of cash and non-cash interest expense produces effective interest rates that are higher than contractual rates. Accordingly, the effective interest rates for the 2017 Senior Notes and the Convertible Notes were 7.13% and 9.39%, respectively, for the year ended December 31, 2017.
Leases
The Company leases certain construction equipment, vehicles and office space under non-cancellable operating leases, with future minimum rent payments as of December 31, 2017 as follows:
|
|
|||
|
Year (in thousands) |
|||
|
2018 |
$ |
18,420 | |
|
2019 |
12,424 | ||
|
2020 |
8,980 | ||
|
2021 |
6,240 | ||
|
2022 |
5,524 | ||
|
Thereafter |
14,898 | ||
|
|
66,486 | ||
|
Less: Sublease rental agreements |
(2,291) | ||
|
Total |
$ |
64,195 | |
Rental expense under operating leases of construction equipment, vehicles and office space was $27.4 million in 2017, $28.2 million in 2016 and $17.4 million in 2015.
6. Contingencies and Commitments
The Company and certain of its subsidiaries are involved in litigation and are contingently liable for commitments and performance guarantees arising in the ordinary course of business. The Company and certain of its customers have made claims arising from the performance under their contracts. The Company recognizes certain significant claims for recovery of incurred cost when it is probable that the claim will result in additional contract revenue and when the amount of the claim can be reliably estimated. These assessments require judgments concerning matters such as litigation developments and outcomes, the anticipated outcome of negotiations, the number of future claims, and the cost of both pending and future claims. In addition, because most contingencies are resolved over long periods of time, assets and liabilities may change in the future due to various factors. Management believes that,
F-21
TUTOR PERINI CORPORATION AND SUBSIDIARIES
NOTES TO CONSOLIDATED FINANCIAL STATEMENTS (Continued)
based on current information and discussions with the Company’s legal counsel, the ultimate resolution of these matters is not expected to have a material adverse effect on the Company’s financial position, results of operations or cash flows.
Several matters are in the litigation and dispute resolution process. The following discussion provides a background and current status of the more significant matters.
Long Island Expressway/Cross Island Parkway Matter
The Company reconstructed the Long Island Expressway/Cross Island Parkway Interchange for the New York State Department of Transportation (the “NYSDOT”). The $130 million project was substantially completed in January 2004 and was accepted by the NYSDOT as complete in February 2006. The Company incurred significant added costs in completing its work and suffered extended schedule costs due to numerous design errors, undisclosed utility conflicts, lack of coordination with local agencies and other interferences for which the Company believes the NYSDOT is responsible.
In March 2011, the Company filed its claim and complaint with the New York State Court of Claims and served to the New York State Attorney General’s Office, seeking damages in the amount of $53.8 million. In May 2011, the NYSDOT filed a motion to dismiss the Company’s claim on the grounds that the Company had not provided required documentation for project closeout and filing of a claim. In September 2011, the Company reached agreement on final payment with the Comptroller’s Office on behalf of the NYSDOT, which resulted in an amount of $0.5 million payable to the Company and formally closed out the project allowing the Company to re-file its claim. The Company re-filed its claim in the amount of $53.8 million with the NYSDOT in February 2012 and with the Court of Claims in March 2012. In May 2012, the NYSDOT served its answer and counterclaims in the amount of $151 million alleging fraud in the inducement and punitive damages related to disadvantaged business enterprise (“DBE”) requirements for the project. The Court subsequently ruled that NYSDOT’s counterclaims may only be asserted as a defense and offset to the Company’s claims and not as affirmative claims. In November 2014, the Appellate Division First Department affirmed the dismissal of the City’s affirmative defenses and affirmative counterclaims based on DBE fraud. The Company does not expect the counterclaims to have any material effect on its consolidated financial statements. Discovery was completed during 2017 and the Company is currently awaiting the establishment of a trial date.
Management has made an estimate of the total anticipated recovery on this project, and such estimate is included in revenue recorded to date. To the extent new facts become known or the final recovery included in the claim settlement varies from the estimate, the impact of the change will be reflected in the consolidated financial statements at that time.
Fontainebleau Matter
Desert Mechanical, Inc. (“DMI”) and Fisk Electric Company (“Fisk”), wholly owned subsidiaries of the Company, were subcontractors on the Fontainebleau Project in Las Vegas (“Fontainebleau”), a hotel/casino complex with approximately 3,800 rooms. In June 2009, Fontainebleau filed for bankruptcy protection, under Chapter 11 of the U.S. Bankruptcy Code, in the Southern District of Florida.
DMI and Fisk filed liens in Nevada for approximately $44 million, representing unreimbursed costs to date and lost profits, including anticipated profits. Other unaffiliated subcontractors have also filed liens. In June 2009, DMI filed suit against Turnberry West Construction, Inc., the general contractor, in the 8th Judicial District Court, Clark County, Nevada (the “District Court”), and in May 2010, the court entered an order in favor of DMI for approximately $45 million.
In January 2010, the Bankruptcy Court approved the sale of the property to Icahn Nevada Gaming Acquisition, LLC, and this transaction closed in February 2010. As a result of a July 2010 ruling relating to certain priming liens, there was approximately $125 million set aside from this sale that is available for distribution to satisfy the creditor claims based on seniority. At that time, the total estimated sustainable lien amount was approximately $350 million. The project lender filed suit against the mechanic’s lien claimants, including DMI and Fisk, alleging that certain mechanic’s liens are invalid and that all mechanic’s liens are subordinate to the lender’s claims against the property. The Nevada Supreme Court ruled in October 2012 in an advisory opinion at the request of the Bankruptcy Court that lien priorities would be determined in favor of the mechanic lien holders under Nevada law.
In October 2013, a settlement was reached by and among the Statutory Lienholders and the other interested parties. The Bankruptcy Court appointed a mediator to facilitate the execution of that settlement agreement, but the parties were unable to settle. During the third quarter of 2017, DMI filed a motion seeking permission to file an action in Nevada; the motion was granted by the Bankruptcy Court.
F-22
TUTOR PERINI CORPORATION AND SUBSIDIARIES
NOTES TO CONSOLIDATED FINANCIAL STATEMENTS (Continued)
Management has made an estimate of the total anticipated recovery on this project, and such estimate is included in revenue recorded to date. To the extent new facts become known or the final recovery included in the claim settlement varies from the estimate, the impact of the change will be reflected in the consolidated financial statements at that time.
Honeywell Street/Queens Boulevard Bridges Matter
In 1999, the Company was awarded a contract for reconstruction of the Honeywell Street/Queens Boulevard Bridges project for the City of New York (the “City”). In June 2003, after substantial completion of the project, the Company initiated an action to recover $8.8 million in claims against the City on behalf of itself and its subcontractors. In March 2010, the City filed counterclaims for $74.6 million and other relief, alleging fraud in connection with the DBE requirements for the project. In May 2010, the Company served the City with its response to the City’s counterclaims and affirmative defenses. In August 2013, the Court granted the Company’s motion to dismiss the City’s affirmative defenses and counterclaims relating to fraud.
In January 2017, the Court granted the City’s motion for summary judgment and dismissed the Company’s claim against the City. The Company has filed a notice of appeal. The Court also granted the Company’s motion for summary judgment for release of retention plus interest from 2010 for an aggregate amount of approximately $1.2 million, which the City paid during the fourth quarter of 2017.
The Company does not expect ultimate resolution of this matter to have a material effect on its consolidated financial statements.
Westgate Planet Hollywood Matter
Tutor-Saliba Corporation (“TSC”), a wholly owned subsidiary of the Company, was contracted to construct a timeshare development project in Las Vegas, which was substantially completed in December 2009. The Company’s claims against the owner, Westgate Planet Hollywood Las Vegas, LLC (“WPH”), relate to unresolved owner change orders and other claims. The Company filed a lien on the project in the amount of $23.2 million and filed its complaint with the District Court, Clark County, Nevada. Several subcontractors have also recorded liens, some of which have been released by bonds and some of which have been released as a result of subsequent payment. WPH has posted a mechanic’s lien release bond for $22.3 million.
WPH filed a cross-complaint alleging non-conforming and defective work for approximately $51 million, primarily related to alleged defects, misallocated costs and liquidated damages. WPH revised the amount of their counterclaims to approximately $45 million.
Following multiple post-trial motions, final judgment was entered in this matter on March 20, 2014. TSC was awarded total judgment in the amount of $19.7 million on its breach of contract claim, which includes an award of interest up through the date of judgment, plus attorney’s fees and costs. WPH was awarded total judgment in the amount of $3.1 million on its construction defect claims, which includes interest up through the date of judgment. WPH and its Sureties have filed a notice of appeal. TSC has filed a notice of appeal on the defect award. In July 2014, the Court ordered WPH to post an additional supersedeas bond on appeal, in the amount of $1.7 million, in addition to the lien release bond of $22.3 million, which increases the security up to $24.0 million. In May 2017, the Nevada Supreme Court issued its ruling on the appeal by WPH and its Sureties. With only minor adjustments, the Nevada Supreme Court affirmed the lower district court’s judgment, and following further proceedings in the lower district court, the anticipated final recovery to the Company is estimated to exceed $20 million, including interest and recovery of certain attorneys’ fees and costs, of which the Company collected more than $16 million in 2017. In December 2017 and in January 2018, the Court issued several post-appeal orders confirming its previous rulings.
The Company does not expect ultimate resolution of this matter to have any material effect on its consolidated financial statements. Management has made an estimate of the total anticipated recovery on this project and such estimate is included in revenue recorded to date. To the extent new facts become known or the final recovery included in the claim settlement varies from the estimate, the impact of the change will be reflected in the consolidated financial statements at that time.
U.S. Department of Commerce, National Oceanic and Atmospheric Administration Matter
Rudolph and Sletten, Inc. (“R&S”), a wholly owned subsidiary of the Company, entered into a contract with the United States Department of Commerce, National Oceanic and Atmospheric Administration (“NOAA”) for the construction of a 287,000 square-foot facility for NOAA’s Southwest Fisheries Science Center Replacement Headquarters and Laboratory in La Jolla, California. The contract work began on May 24, 2010 and was substantially completed in September 2012. R&S incurred significant additional costs as a result of design errors and omissions, NOAA’s unwillingness to correct design flaws in a timely fashion and a refusal to negotiate the time and pricing associated with change order work. R&S filed claims against NOAA for contract adjustments related to the unresolved owner change orders, delays, design deficiencies and other claims.
F-23
TUTOR PERINI CORPORATION AND SUBSIDIARIES
NOTES TO CONSOLIDATED FINANCIAL STATEMENTS (Continued)
In March 2017, the parties agreed to a proposed settlement, which was subsequently approved and paid by the government in the third quarter of 2017. The settlement did not have a material impact on the Company’s financial results for the year ended December 31, 2017.
Five Star Electric Matter
In the third quarter of 2015, Five Star Electric Corp. ("Five Star"), a wholly owned subsidiary of the Company that was acquired in 2011, entered into a tolling agreement (which has since expired) related to an ongoing investigation being conducted by the United States Attorney’s Office for the Eastern District of New York (“USAO EDNY”). Five Star has been cooperating with the USAO EDNY since late June 2014, when it was first made aware of the investigation, and has provided information requested by the government related to its use of certain minority-owned, women-owned, small and disadvantaged business enterprises and certain of Five Star’s employee compensation, benefit and tax practices.
As of December 31, 2017, the Company cannot predict the ultimate outcome of the investigation and cannot reasonably estimate the potential loss or range of loss that Five Star or the Company may incur or the impact of the results of the investigation on Five Star or the Company.
Alaskan Way Viaduct Matter
In January 2011, Seattle Tunnel Partners (“STP”), a joint venture between Dragados USA, Inc. and the Company, entered into a design-build contract with the Washington State Department of Transportation (“WSDOT”) for the construction of a large diameter bored tunnel in downtown Seattle, King County, Washington to replace the Alaskan Way Viaduct, also known as State Route 99.
The construction of the large diameter bored tunnel required the use of a tunnel boring machine (“TBM”). In December 2013, the TBM struck a steel pipe, installed by WSDOT as a well casing for an exploratory well. The TBM was damaged and was required to be shut down for repair. STP has asserted that the steel pipe casing was a differing site condition that WSDOT failed to properly disclose. The Disputes Review Board mandated by the contract to hear disputes issued a decision finding the steel casing was a Type I differing site condition. WSDOT has not accepted that finding.
The TBM was insured under a Builder’s Risk Insurance Policy (the “Policy”) with Great Lakes Reinsurance (UK) PLC and a consortium of other insurers (the “Insurers”). STP submitted the claims to the Insurers and requested interim payments under the Policy. The Insurers refused to pay and denied coverage. In June 2015, STP filed a lawsuit in the King County Superior Court, State of Washington (“Washington Superior Court”) seeking declaratory relief concerning contract interpretation, as well as damages as a result of the Insurers’ breach of their obligations under the terms of the Policy. WSDOT is deemed a plaintiff since WSDOT is an insured under the Policy and had filed its own claim for damages. Hitachi Zosen (“Hitachi”), the manufacturer of the TBM, has also joined the case as a plaintiff for costs incurred to repair the damages to the TBM. Trial is scheduled for October 2018. Discovery is ongoing.
In March 2016, WSDOT filed a complaint against STP in Thurston County Superior Court for breach of contract alleging STP’s delays and failure to perform and declaratory relief concerning contract interpretation. STP filed its answer to WSDOT’s complaint and filed a counterclaim against WSDOT and Hitachi. Trial is set for April 2019. Discovery is ongoing.
As of December 31, 2017, the Company has concluded that the potential for a material adverse financial impact due to the Insurers’ denial of coverage and WSDOT’s legal actions is neither probable nor remote, and the potential loss or range of loss is not reasonably estimable. With respect to STP’s claims against the Insurers, WSDOT and Hitachi, management has included an estimate of the total anticipated recovery, concluded to be both probable and reliably estimable, in receivables or costs and estimated earnings in excess of billings recorded to date. To the extent new facts become known or the final recoveries vary from the estimate, the impact of the change will be reflected in the financial statements at that time.
7. Other Income, Net
On May 31, 2017, the Company entered into a settlement agreement with Merrill Lynch, Pierce, Fenner & Smith Incorporated (“Merrill Lynch”), as successor in interest to Banc of America Securities LLC and Bank of America, N.A. (collectively “BofA”), to resolve the pending litigation between the Company and Merrill Lynch. The litigation, which was filed by the Company in 2011, related to the purchase by the Company of certain auction-rate securities from BofA.
F-24
TUTOR PERINI CORPORATION AND SUBSIDIARIES
NOTES TO CONSOLIDATED FINANCIAL STATEMENTS (Continued)
On June 6, 2017, the Company received the $37.0 million cash settlement payment agreed to in the settlement agreement, and the pending litigation was dismissed with prejudice. Neither party made any admission of liability or wrongdoing, and the settlement agreement includes mutual releases of all claims and liabilities related to the subject matter of the pending litigation.
The Company recognized the settlement as a gain during the second quarter of 2017 and reported it as a component of other income, net in its Consolidated Statement of Income for the year ended December 31, 2017.
8. Share-Based Compensation
On April 3, 2017, the Company adopted the Tutor Perini Corporation Incentive Compensation Plan (“Compensation Plan”), which was approved by the Company’s shareholders on May 24, 2017. Additionally, the Company’s Amended and Restated Tutor Perini Corporation Long-Term Incentive Plan (“Incentive Plan” together with Compensation Plan the “Plans”) is still active. The Plans provide for various types of share-based grants, including restricted and unrestricted stock units and stock options. Restricted and unrestricted stock units give the holder the right to exchange their stock units for shares of the Company’s Common Stock on a one-for-one basis. Per the Plans, stock options give the holder the right to purchase shares of the Company’s Common Stock subsequent to the grant date at an defined exercise price equal to or greater than the fair value of the Company’s Common Stock on the date of the stock option’s award. Restricted stock units and stock options are usually subject to certain service and performance conditions and may not be sold or otherwise transferred until those restrictions have been satisfied; however, unrestricted stock units have no such restrictions. The term for stock options is limited to 10 years from the date of grant. The Compensation Plan allows for 2,335,000 shares of the Company’s Common Stock to be issued. As of December 31, 2017, there were 1,554,364 shares available to be granted under the Compensation Plan and 405,529 shares authorized to be issued under the Incentive Plan; however, as discussed in the Company’s Definitive Proxy Statement (Schedule 14A) filed on April 13, 2017, the Company will not issue the 405,529 shares remaining in the Incentive Plan. As of December 31, 2017, the Incentive Plan had an aggregate of 4,360,018 of restricted stock units and stock options from outstanding, historical awards that either have not vested or have vested but have not been exercised.
The terms of the Plans give the Company the right to settle the vesting of share-based grants in cash or shares. During the year ended December 31, 2017, the Company paid approximately $0.6 million to settle share-based awards.
Many of the awards issued under the Plans contain separate tranches, each for a separate performance period and each with a performance target to be established subsequent to the award date; accordingly, the tranches are accounted for under ASC 718, Stock Compensation (“ASC 718”) as separate grants, with the grant date being the date the performance targets for a given tranche are established and communicated to the grantee. Similarly, for these awards, compliance with the requirements of the Plan is also based on the number of units granted in a given year, as determined by ASC 718, rather than the number of units awarded in a given year. As a result, as of December 31, 2017, the Company had outstanding awards with 214,000 restricted stock units and 194,000 stock options that had not been granted yet. These units will be granted in 2018 and 2019 when the performance targets for those respective years are established.
F-25
TUTOR PERINI CORPORATION AND SUBSIDIARIES
NOTES TO CONSOLIDATED FINANCIAL STATEMENTS (Continued)
The following table summarizes restricted stock unit and stock option activity:
|
|
|||||||||
|
|
Restricted Stock Units |
Stock Options |
|||||||
|
|
Weighted- |
Weighted- |
|||||||
|
|
Average |
Average |
|||||||
|
|
Grant Date |
Exercise/ |
|||||||
|
|
Fair Value |
(Strike) Price |
|||||||
|
|
Number |
Per Share |
Number |
Per Share |
|||||
|
Outstanding as of December 31, 2014 |
1,056,597 |
$ |
26.54 | 1,989,000 |
$ |
19.63 | |||
|
Granted |
321,500 | 23.07 | 259,000 | 16.07 | |||||
|
Expired or forfeited |
(281,560) | 23.89 | (250,000) | 15.97 | |||||
|
Vested/exercised |
(370,940) | 27.07 |
— |
— |
|||||
|
Outstanding as of December 31, 2015 |
725,597 |
$ |
25.28 | 1,998,000 |
$ |
19.62 | |||
|
Granted |
483,387 | 19.14 | 274,000 | 16.20 | |||||
|
Vested/exercised |
(52,500) | 18.74 | (97,500) | 12.72 | |||||
|
Outstanding as of December 31, 2016 |
1,156,484 |
$ |
22.64 | 2,174,500 |
$ |
19.50 | |||
|
Granted |
1,064,000 | 30.02 | 539,000 | 24.54 | |||||
|
Expired or cancelled |
(20,985) | 23.91 | (19,466) | 26.56 | |||||
|
Vested/exercised |
(801,515) | 19.38 | (140,000) | 21.41 | |||||
|
Outstanding as of December 31, 2017 |
1,397,984 |
$ |
30.11 | 2,554,034 |
$ |
20.45 | |||
The following table summarizes unrestricted stock units, which are generally issued to the non-employee members of the Company’s Board of Directors as part of their annual retainer fees:
|
|
|||||
|
|
Unrestricted Stock Units |
||||
|
|
Weighted-Average Grant |
||||
|
Year |
Number |
Date Fair Value Per Share |
|||
|
2015 |
68,160 |
$ |
21.93 | ||
|
2016 |
64,603 |
21.67 | |||
|
2017 |
99,155 |
26.26 | |||
The fair value of unrestricted stock units issued during 2017, 2016 and 2015 was approximately $2.6 million, $1.4 million and $1.5 million, respectively.
The fair value of restricted stock units that vested during 2017, 2016 and 2015 was approximately $25.3 million, $1.0 million and $8.0 million, respectively. The aggregate intrinsic value, representing the difference between the market value on the date of exercise and the option price of the stock options exercised during 2017 and 2016 was $1.3 million and $1.1 million, with a corresponding tax benefit of $0.6 million and $0.5 million, respectively. As of December 31, 2017, the balance of unamortized restricted stock and stock option expense was $22.5 million and $3.7 million, respectively, which will be recognized over weighted-average periods of 2.6 years for restricted stock units and 2.2 years for stock options.
The 2,554,034 outstanding stock options as of December 31, 2017 had an intrinsic value of $13.6 million and a weighted-average remaining contractual life of 4.4 years. Of those outstanding options: a) 1,988,034 were exercisable with an intrinsic value of $12.8 million, a weighted-average exercise price of $19.31 per share and a weighted-average remaining contractual life of 3.3 years; b) 566,000, with an intrinsic value of $0.7 million, a weighted-average exercise price of $24.27 and a weighted-average remaining contractual life of 8.2 years, have been granted but have not vested; and c) of the 566,000 granted but unvested options, 527,816 are expected to vest.
F-26
TUTOR PERINI CORPORATION AND SUBSIDIARIES
NOTES TO CONSOLIDATED FINANCIAL STATEMENTS (Continued)
The fair value on the grant date and the significant assumptions used in the Black-Scholes option-pricing model are as follows:
|
|
|||||||||||
|
|
Year Ended December 31, |
||||||||||
|
|
2017 |
2016 |
2015 |
||||||||
|
Total stock options granted |
539,000 | 274,000 | 259,000 | ||||||||
|
Weighted-average grant date fair value |
$ |
13.11 |
$ |
5.31 |
$ |
12.48 | |||||
|
Weighted-average assumptions: |
|||||||||||
|
Risk-free rate |
1.81 |
% |
1.2 |
% |
1.3 |
% |
|||||
|
Expected life of options(a) |
4.8 | 4.2 | 4.7 | ||||||||
|
Expected volatility(b) |
43.09 |
% |
40.6 |
% |
45.5 |
% |
|||||
|
Expected quarterly dividends |
$ |
— |
$ |
— |
$ |
— |
|||||
|
(a) |
Calculated using the simplified method due to the terms of the stock options and the limited pool of grantees. |
|
(b) |
Calculated using historical volatility of the Company’s Common Stock over periods commensurate with the expected life of the option. |
For the respective years ended December 31, 2017, 2016 and 2015, the Company recognized, as part of general and administrative expenses, costs for share-based payment arrangements for employees of $19.6 million, $13.4 million and $9.5 million. Additionally for the same periods, the Company also recognized as part of general and administrative expenses costs for share-based awards to non-employee directors of $1.6 million, $1.4 million and $1.5 million, respectively. The aggregate tax benefits for these awards were approximately $8.7 million, $6.1 million and $4.6 million, for the respective periods.
9. Employee Benefit Plans
Defined Benefit Pension Plan
The Company has a defined benefit pension plan that covers certain of its executive, professional, administrative and clerical employees, subject to certain specified service requirements. The plan is noncontributory and benefits are based on an employee’s years of service and “final average earnings,” as defined by the plan. The plan provides reduced benefits for early retirement and takes into account offsets for social security benefits. The Company also has an unfunded supplemental retirement plan (“Benefit Equalization Plan”) for certain employees whose benefits under the defined benefit pension plan were reduced because of compensation limitations under federal tax laws. Effective June 1, 2004, all benefit accruals under the Company’s pension plan and Benefit Equalization Plan were frozen; however, the current vested benefit was preserved. Pension disclosure as presented below includes aggregated amounts for both of the Company’s plans, except where otherwise indicated.
The Company historically has used the date of its year-end as its measurement date to determine the funded status of the plan.
The long-term investment goals of the Company’s plan are to manage the assets in accordance with the legal requirements of all applicable laws; produce investment returns which maximize return within reasonable and prudent levels of risks; and achieve a fully funded status with regard to current pension liabilities. Some risk must be assumed in order to achieve the investment goals. Investments with the ability to withstand short and intermediate term variability are considered and some interim fluctuations in market value and rates of return are tolerated in order to achieve the plan’s longer-term objectives.
The pension plan’s assets are managed by a third-party investment manager. The Company monitors investment performance and risk on an ongoing basis.
F-27
TUTOR PERINI CORPORATION AND SUBSIDIARIES
NOTES TO CONSOLIDATED FINANCIAL STATEMENTS (Continued)
A summary of net periodic benefit cost is as follows:
|
|
|||||||||||
|
|
Year Ended December 31, |
||||||||||
|
(in thousands) |
2017 |
2016 |
2015 |
||||||||
|
Interest cost |
$ |
3,919 |
$ |
4,153 |
$ |
4,055 | |||||
|
Service cost |
850 | 600 |
— |
||||||||
|
Expected return on plan assets |
(4,358) | (4,803) | (5,021) | ||||||||
|
Recognized net actuarial losses |
1,897 | 1,745 | 1,869 | ||||||||
|
Net periodic benefit cost |
$ |
2,308 |
$ |
1,695 |
$ |
903 | |||||
|
Actuarial assumptions used to determine net cost: |
|||||||||||
|
Discount rate |
3.90 |
% |
4.10 |
% |
3.75 |
% |
|||||
|
Expected return on assets |
6.00 |
% |
6.00 |
% |
6.50 |
% |
|||||
|
Rate of increase in compensation |
N/A |
N/A |
N/A |
||||||||
The target asset allocation for the Company’s pension plan by asset category for 2018 and the actual asset allocation as of December 31, 2017 and 2016 by asset category are as follows:
|
|
|||||||||||
|
|
Percentage of Plan Assets as of December 31, |
||||||||||
|
|
Target |
||||||||||
|
|
Allocation |
Actual Allocation |
|||||||||
|
Asset Category |
2018 |
2017 |
2016 |
||||||||
|
Cash |
5 |
% |
3 |
% |
4 |
% |
|||||
|
Equity funds: |
|||||||||||
|
Domestic |
37 | 41 | 47 | ||||||||
|
International |
28 | 31 | 28 | ||||||||
|
Fixed income funds |
30 | 25 | 21 | ||||||||
|
Total |
100 |
% |
100 |
% |
100 |
% |
|||||
As of December 31, 2017 and 2016, plan assets included approximately $30.7 million and $39.1 million, respectively, of investments in hedge funds and equity partnerships which do not have readily determinable fair values. The underlying holdings of the funds were comprised of a combination of assets for which the estimate of fair value is determined using information provided by fund managers.
The Company expects to contribute approximately $2.8 million to its defined benefit pension plan in 2018.
Future benefit payments under the plans are estimated as follows:
|
|
||
|
(in thousands) |
||
|
Year ended December 31, |
||
|
2018 |
$ |
6,748 |
|
2019 |
6,798 | |
|
2020 |
6,781 | |
|
2021 |
6,785 | |
|
2022 |
6,721 | |
|
2023-2027 |
32,410 | |
|
Total |
$ |
66,243 |
F-28
TUTOR PERINI CORPORATION AND SUBSIDIARIES
NOTES TO CONSOLIDATED FINANCIAL STATEMENTS (Continued)
The following tables provide a reconciliation of the changes in the fair value of plan assets and plan benefit obligations during 2017 and 2016, and a summary of the funded status as of December 31, 2017 and 2016:
|
|
|||||
|
|
Year Ended December 31, |
||||
|
(in thousands) |
2017 |
2016 |
|||
|
Change in Fair Value of Plan Assets |
|||||
|
Balance at beginning of year |
$ |
66,057 |
$ |
72,296 | |
|
Actual return on plan assets |
9,224 | (1,909) | |||
|
Company contribution |
2,838 | 2,025 | |||
|
Benefit payments |
(6,578) | (6,355) | |||
|
Balance at end of year |
$ |
71,541 |
$ |
66,057 | |
|
|
|||||
|
|
Year Ended December 31, |
||||
|
(in thousands) |
2017 |
2016 |
|||
|
Change in Benefit Obligations |
|||||
|
Balance at beginning of year |
$ |
103,681 |
$ |
105,942 | |
|
Interest cost |
3,919 | 4,153 | |||
|
Service cost |
850 | 600 | |||
|
Assumption change (gain) loss |
3,854 | 308 | |||
|
Actuarial (gain) loss |
492 | (967) | |||
|
Benefit payments |
(6,578) | (6,355) | |||
|
Balance at end of year |
$ |
106,218 |
$ |
103,681 | |
|
|
|||||
|
|
As of December 31, |
||||
|
(in thousands) |
2017 |
2016 |
|||
|
Funded status |
$ |
(34,677) |
$ |
(37,624) | |
|
Net unfunded amounts recognized in Consolidated Balance Sheets consist of: |
|||||
|
Current liabilities |
$ |
(279) |
$ |
(271) | |
|
Long-term liabilities |
(34,398) | (37,353) | |||
|
Total net unfunded amount recognized in Consolidated Balance Sheets |
$ |
(34,677) |
$ |
(37,624) | |
Amounts not yet recognized in net periodic benefit cost and included in accumulated other comprehensive loss consist of net actuarial losses before income taxes of $58.7 million and $61.1 million, for the years ended December 31, 2017 and 2016, respectively.
In 2017, net other comprehensive income of $2.4 million consisted of reclassification adjustments for the amortization of previously existing actuarial losses and net actuarial gains arising during the period. In 2016 and 2015, net actuarial losses arising during the years were partially offset by reclassification adjustments for the amortization of previously existing actuarial losses and resulted in net other comprehensive losses of $4.3 and $0.7 million, respectively.
The estimated amount of the net accumulated loss (consisting of net actuarial losses) that will be amortized from accumulated other comprehensive loss into net period benefit cost in 2018 is $2.1 million.
The discount rate used in determining the accumulated post-retirement benefit obligation was 3.5% as of December 31, 2017 and 3.9% as of December 31, 2016. The discount rate used for the accumulated post-retirement obligation was derived using a blend of U.S. Treasury and high-quality corporate bond discount rates.
The expected long-term rate of return on assets assumption was 6.0% for 2017 and 2016. The expected long-term rate of return on assets assumption was developed considering forward looking capital market assumptions and historical return expectations for each asset class assuming the plans’ target asset allocation and full availability of invested assets.
Fund strategies seek to capitalize on inefficiencies identified across different asset classes or markets. Hedge fund strategy types include long-short, event-driven, multi-strategy, equity partnerships and distressed credit.
Plan assets were measured at fair value. Registered investment companies are public investment vehicles valued using the Net Asset Value (NAV) of shares held by the plan at year-end. Equity and fixed income funds are valued based on quoted market prices in active markets. Closely held funds held by the plan, which are only available through private offerings, do not have readily determinable fair
F-29
TUTOR PERINI CORPORATION AND SUBSIDIARIES
NOTES TO CONSOLIDATED FINANCIAL STATEMENTS (Continued)
values. Estimates of fair value of these funds were determined using the information provided by the fund managers and it is generally based on the net asset value per share or its equivalent.
The following table sets forth the plan assets at fair value in accordance with the fair value hierarchy described in Note 10:
|
|
|||||||||||||||||||||||
|
|
|||||||||||||||||||||||
|
|
As of December 31, 2017 |
As of December 31, 2016 |
|||||||||||||||||||||
|
|
Fair Value Hierarchy |
Fair Value Hierarchy |
|||||||||||||||||||||
|
(in thousands) |
Level 1 |
Level 2 |
Level 3 |
Total |
Level 1 |
Level 2 |
Level 3 |
Total |
|||||||||||||||
|
Cash and cash equivalents |
$ |
2,390 |
$ |
— |
$ |
— |
$ |
2,390 |
$ |
2,437 |
$ |
— |
$ |
— |
$ |
2,437 | |||||||
|
Fixed income funds |
18,031 |
— |
— |
18,031 | 14,023 |
— |
— |
14,023 | |||||||||||||||
|
Equity funds |
20,372 |
— |
— |
20,372 | 10,489 |
— |
— |
10,489 | |||||||||||||||
|
|
$ |
40,793 |
$ |
— |
$ |
— |
$ |
40,793 |
$ |
26,949 |
$ |
— |
$ |
— |
$ |
26,949 | |||||||
|
Closely held funds(a) |
|||||||||||||||||||||||
|
Equity partnerships |
8,711 | 6,931 | |||||||||||||||||||||
|
Hedge fund investments |
22,037 | 32,177 | |||||||||||||||||||||
|
Total closely held funds(a) |
30,748 | 39,108 | |||||||||||||||||||||
|
Total |
$ |
40,793 |
$ |
— |
$ |
— |
$ |
71,541 |
$ |
26,949 |
$ |
— |
$ |
— |
$ |
66,057 | |||||||
|
(a) |
Closely held funds in private investment were measured at fair value using NAV and were not categorized in the fair value hierarchy. Although the investments were not categorized within the fair value hierarchy, the holdings of these private investment funds were comprised of a combination of Level 1, 2 and 3 investments, but were not categorized in the fair value hierarchy because they were measured at NAV using the practical expedient under ASC 820, Fair Value Measurement (“ASC 820”). |
The plans have benefit obligations in excess of the fair value of each plan’s assets detailed as follows:
|
|
|||||||||||||||||
|
|
|||||||||||||||||
|
|
As of December 31, 2017 |
As of December 31, 2016 |
|||||||||||||||
|
|
Benefit |
Benefit |
|||||||||||||||
|
|
Pension |
Equalization |
Pension |
Equalization |
|||||||||||||
|
(in thousands) |
Plan |
Plan |
Total |
Plan |
Plan |
Total |
|||||||||||
|
Projected benefit obligation |
$ |
102,806 |
$ |
3,412 |
$ |
106,218 |
$ |
100,336 |
$ |
3,345 |
$ |
103,681 | |||||
|
Accumulated benefit obligation |
$ |
102,806 |
$ |
3,412 |
$ |
106,218 |
$ |
100,336 |
$ |
3,345 |
$ |
103,681 | |||||
|
Fair value of plans' assets |
71,541 |
— |
71,541 | 66,057 |
— |
66,057 | |||||||||||
|
Projected benefit obligation greater than fair value of plans' assets |
$ |
31,265 |
$ |
3,412 |
$ |
34,677 |
$ |
34,279 |
$ |
3,345 |
$ |
37,624 | |||||
|
Accumulated benefit obligation greater than fair value of plans' assets |
$ |
31,265 |
$ |
3,412 |
$ |
34,677 |
$ |
34,279 |
$ |
3,345 |
$ |
37,624 | |||||
Section 401(k) Plan
The Company has a contributory Section 401(k) plan which covers its executive, professional, administrative and clerical employees, subject to certain specified service requirements. The cost recognized by the Company for its 401(k) plan was $4.2 million in 2017 and $4.0 million in both 2016 and 2015. The Company’s contribution is based on a non-discretionary match of employees’ contributions, as defined by the plan.
Multiemployer Plans
In addition to the Company’s defined benefit pension and contribution plans discussed above, the Company participates in multiemployer pension plans for its union construction employees. Contributions are based on the hours worked by employees covered under various collective bargaining agreements. Under the Employee Retirement Income Security Act, a contributor to a multiemployer plan is only liable for its proportionate share of a plan’s unfunded vested liability upon termination, or withdrawal from, a plan. The Company currently has no intention of withdrawing from any of the multiemployer pension plans in which it participates and, therefore, has not recognized a liability for its proportionate share of any unfunded vested liabilities associated with these plans.
F-30
TUTOR PERINI CORPORATION AND SUBSIDIARIES
NOTES TO CONSOLIDATED FINANCIAL STATEMENTS (Continued)
The following table summarize key information for the plans that the Company had significant involvement with during the years ended December 31, 2017, 2016 and 2015:
|
|
|||||||||||||||||||||
|
|
|||||||||||||||||||||
|
|
Expiration |
||||||||||||||||||||
|
|
FIP/RP |
Date of |
|||||||||||||||||||
|
|
Pension Protections Act |
Status |
Company Contributions |
Collective |
|||||||||||||||||
|
|
EIN/Pension |
Zone Status |
Pending Or |
(amounts in millions) |
Surcharge |
Bargaining |
|||||||||||||||
|
Pension Fund |
Plan Number |
2017 |
2016 |
Implemented |
2017 (b) |
2016 |
2015 |
Imposed |
Agreement |
||||||||||||
|
The Pension, Hospitalization and Benefit Plan of the Electrical Industry - Pension Trust Fund |
13-6123601/001 |
Green |
Green |
N/A |
$ 16.0 |
$ 15.8 |
(a) |
$ 13.6 |
(a) |
No |
4/30/2019 |
||||||||||
|
Carpenters Pension Trust Fund for Northern California |
94-6050970 |
Red |
Red |
Implemented |
8.2 | 4.4 | 2.7 |
No |
6/30/2019 |
||||||||||||
|
Laborers Pension Trust Fund for Northern California |
94-6277608 |
Yellow |
Yellow |
Implemented |
6.6 | 5.6 | 2.8 |
No |
6/30/2019 |
||||||||||||
|
Northern California Electrical Workers Pension Plan |
94-6062674 |
Green |
Green |
N/A |
5.2 | 1.5 | 0.3 |
No |
5/31/2018 |
||||||||||||
|
Steamfitters Industry Pension Fund |
13-6149680/001 |
Green |
Green |
N/A |
3.9 | 3.9 |
(a) |
6.2 |
(a) |
No |
6/30/2020 |
||||||||||
|
(a) |
These amounts exceeded 5% of the respective total plan contributions. |
|
(b) |
The Company's contributions as a percentage of total plan contributions were not available for any of its plans. |
In addition to the individually significant plans described above, the Company also contributed approximately $32.1 million in 2017, $52.5 million in 2016 and $55.8 million in 2015 to other multiemployer pension plans.
10. Fair Value Measurements
The fair value hierarchy established by ASC 820 prioritizes the use of inputs used in valuation techniques into the following three levels:
Level 1 inputs are observable quoted prices in active markets for identical assets or liabilities
Level 2 inputs are observable, either directly or indirectly, but are not Level 1 inputs
Level 3 inputs are unobservable
The following fair value hierarchy table presents the Company’s assets that are measured at fair value on a recurring basis as of December 31, 2017 and 2016:
|
|
||||||||||||||||||||||||
|
|
||||||||||||||||||||||||
|
|
As of December 31, 2017 |
As of December 31, 2016 |
||||||||||||||||||||||
|
|
Fair Value Hierarchy |
Fair Value Hierarchy |
||||||||||||||||||||||
|
(in thousands) |
Level 1 |
Level 2 |
Level 3 |
Total |
Level 1 |
Level 2 |
Level 3 |
Total |
||||||||||||||||
|
Cash and cash equivalents(a) |
$ |
192,868 |
$ |
— |
$ |
— |
$ |
192,868 |
$ |
146,103 |
$ |
— |
$ |
— |
$ |
146,103 | ||||||||
|
Restricted cash(a) |
4,780 |
— |
— |
4,780 | 50,504 |
— |
— |
50,504 | ||||||||||||||||
|
Investments in lieu of retainage(b) |
69,891 | 2,405 |
— |
72,296 | 46,855 | 4,411 |
— |
51,266 | ||||||||||||||||
|
Total |
$ |
267,539 |
$ |
2,405 |
$ |
— |
$ |
269,944 |
$ |
243,462 |
$ |
4,411 |
$ |
— |
$ |
247,873 | ||||||||
(a)Includes money market funds with original maturity dates of three months or less.
(b)Investments in lieu of retainage are included in accounts receivable and are comprised of money market funds and municipal bonds, the majority of which are rated A3 or better. The fair values of the money market funds are measured using quoted market prices; therefore, they are classified as Level 1 assets. The fair values of municipal bonds are measured using readily available pricing sources for comparable instruments; therefore, they are classified as Level 2 assets. All of the above investments are available-for-sale securities.
The Company did not have material transfers between Levels 1 and 2 during the years ended December 31, 2017 and 2016.
The carrying values of receivables, payables and other amounts arising out of normal contract activities, including retainage, which may be settled beyond one year, are estimated to approximate fair value. The Company’s restricted investments carried at amortized cost have an aggregate fair value of $52.5 million as of December 31, 2017, determined using Level 2 inputs. Of the Company’s long-term debt, the fair values of the 2017 Senior Notes as of December 31, 2017 was $537.5 million. The fair value of the 2010 Senior Notes as of December 31, 2016 was $302.6 million; the 2010 Senior Notes were redeemed in the second quarter of 2017, as discussed in Note 5. The fair value of the Convertible Notes was $222.2 million and $228.4 million as of December 31, 2017 and 2016, respectively. The fair values of the 2017 Senior Notes, 2010 Senior Notes and Convertible Notes were determined using Level 1 inputs, specifically current observable market prices. The reported value of the Company’s remaining borrowings as of December 31, 2017 and 2016 approximates fair value.
F-31
TUTOR PERINI CORPORATION AND SUBSIDIARIES
NOTES TO CONSOLIDATED FINANCIAL STATEMENTS (Continued)
11. Variable Interest Entities
From time to time the Company may form joint ventures with third parties for the execution of single contracts or projects. In accordance with ASC 810, the Company assesses its joint ventures at inception to determine if any meet the qualifications of a VIE. The Company considers a joint venture a VIE if either (a) the total equity investment is not sufficient to permit the entity to finance its activities without additional subordinated financial support, (b) characteristics of a controlling financial interest are missing (either the ability to make decisions through voting or other rights, the obligation to absorb the expected losses of the entity or the right to receive the expected residual returns of the entity), or (c) the voting rights of the equity holders are not proportional to their obligations to absorb the expected losses of the entity and/or their rights to receive the expected residual returns of the entity, and substantially all of the entity’s activities either involve or are conducted on behalf of an investor that has disproportionately few voting rights. Upon the occurrence of certain events outlined in ASC 810, the company reassesses its initial determination of whether the joint venture is a VIE.
ASC 810 also requires the Company to determine whether it is the primary beneficiary of the VIE. The Company concludes that it is the primary beneficiary and consolidates the VIE if the Company has both (a) the power to direct the economically significant activities of the VIE and (b) the obligation to absorb losses of, or the right to receive benefits from, the VIE that could potentially be significant to the VIE. The Company considers the contractual agreements that define the ownership structure, distribution of profits and losses, risks, responsibilities, indebtedness, voting rights and board representation of the respective parties in determining if the Company is the primary beneficiary. The Company also considers all parties that have direct or implicit variable interests when determining whether it is the primary beneficiary. In accordance with ASC 810, management’s assessment of whether the Company is the primary beneficiary of a VIE is performed continuously.
As of December 31, 2017, the Company’s Consolidated Balance Sheet included current and noncurrent assets of $95.5 million and $11.6 million, respectively, as well as current liabilities of $140.7 million related to the operations of its consolidated VIEs.
One large joint venture that the Company is consolidating was established to construct the Purple Line Segment 2 Extension project, a $1.4 billion mass-transit project in Los Angeles, California. The Company has a 75% interest in the joint venture with the remaining 25% held by O&G Industries, Inc. The joint venture was initially financed with contributions from the partners and, per the terms of the joint venture agreement, the partners may be required to provide additional capital contributions in the future.
12. Business Segments
The Company offers general contracting, pre-construction planning and comprehensive project management services, including planning and scheduling of manpower, equipment, materials and subcontractors required for the timely completion of a project in accordance with the terms and specifications contained in a construction contract. The Company also offers self-performed construction services: site work; concrete forming and placement; steel erection; electrical; mechanical; plumbing; and heating, ventilation and air conditioning (HVAC). As described below, the Company’s business is conducted through three segments: Civil, Building and Specialty Contractors. These segments are determined based on how the Company’s Chairman and Chief Executive Officer (chief operating decision maker) aggregates business units when evaluating performance and allocating resources.
The Civil segment specializes in public works construction and the replacement and reconstruction of infrastructure. The civil contracting services include construction and rehabilitation of highways, bridges, tunnels, mass-transit systems, and water management and wastewater treatment facilities.
The Building segment has significant experience providing services for private and public works customers in a number of specialized building markets, including: high-rise residential, hospitality and gaming, transportation, health care, commercial and government offices, sports and entertainment, education, correctional facilities, biotech, pharmaceutical, industrial and high-tech.
The Specialty Contractors segment specializes in electrical, mechanical, plumbing, HVAC, fire protection systems and pneumatically placed concrete for a full range of Civil and Building construction projects in the industrial, commercial, hospitality and gaming, and mass-transit end markets. This segment provides the Company with unique strengths and capabilities that allow the Company to position itself as a full-service contractor with greater control over scheduled work, project delivery and risk management.
F-32
TUTOR PERINI CORPORATION AND SUBSIDIARIES
NOTES TO CONSOLIDATED FINANCIAL STATEMENTS (Continued)
The following tables set forth certain reportable segment information relating to the Company’s operations for the years ended December 31, 2017, 2016 and 2015:
|
|
|||||||||||||||||
|
|
Reportable Segments |
||||||||||||||||
|
|
Specialty |
Segment |
Consolidated |
||||||||||||||
|
(in thousands) |
Civil |
Building |
Contractors |
Total |
Corporate |
Total |
|||||||||||
|
Year ended December 31, 2017 |
|||||||||||||||||
|
Total revenue |
$ |
1,856,164 |
$ |
1,982,857 |
$ |
1,213,708 |
$ |
5,052,729 |
$ |
— |
$ |
5,052,729 | |||||
|
Elimination of intersegment revenue |
(253,989) | (41,532) |
— |
(295,521) |
— |
(295,521) | |||||||||||
|
Revenue from external customers |
$ |
1,602,175 |
$ |
1,941,325 |
$ |
1,213,708 |
$ |
4,757,208 |
$ |
— |
$ |
4,757,208 | |||||
|
Income from construction operations |
$ |
192,207 |
$ |
34,199 |
$ |
18,938 |
$ |
245,344 |
$ |
(65,867) |
(a) |
$ |
179,477 | ||||
|
Capital expenditures |
$ |
27,694 |
$ |
267 |
$ |
721 |
$ |
28,682 |
$ |
1,598 |
$ |
30,280 | |||||
|
Depreciation and amortization(b) |
$ |
33,767 |
$ |
2,021 |
$ |
4,699 |
$ |
40,487 |
$ |
11,443 |
$ |
51,930 | |||||
|
Year ended December 31, 2016 |
|||||||||||||||||
|
Total revenue |
$ |
1,830,857 |
$ |
2,146,747 |
$ |
1,234,272 |
$ |
5,211,876 |
$ |
— |
$ |
5,211,876 | |||||
|
Elimination of intersegment revenue |
(161,894) | (76,906) |
— |
(238,800) |
— |
(238,800) | |||||||||||
|
Revenue from external customers |
$ |
1,668,963 |
$ |
2,069,841 |
$ |
1,234,272 |
$ |
4,973,076 |
$ |
— |
$ |
4,973,076 | |||||
|
Income from construction operations |
$ |
172,668 |
$ |
51,564 |
$ |
37,908 |
$ |
262,140 |
$ |
(60,220) |
(a) |
$ |
201,920 | ||||
|
Capital expenditures |
$ |
13,541 |
$ |
516 |
$ |
1,005 |
$ |
15,062 |
$ |
681 |
$ |
15,743 | |||||
|
Depreciation and amortization(b) |
$ |
48,561 |
$ |
2,186 |
$ |
5,035 |
$ |
55,782 |
$ |
11,520 |
$ |
67,302 | |||||
|
Year ended December 31, 2015 |
|||||||||||||||||
|
Total revenue |
$ |
2,005,193 |
$ |
1,900,492 |
$ |
1,228,030 |
$ |
5,133,715 |
$ |
— |
$ |
5,133,715 | |||||
|
Elimination of intersegment revenue |
(115,286) | (97,957) |
— |
(213,243) |
— |
(213,243) | |||||||||||
|
Revenue from external customers |
$ |
1,889,907 |
$ |
1,802,535 |
$ |
1,228,030 |
$ |
4,920,472 |
$ |
— |
$ |
4,920,472 | |||||
|
Income from construction operations |
$ |
145,213 |
$ |
(1,240) |
$ |
15,682 |
$ |
159,655 |
$ |
(54,242) |
(a) |
$ |
105,413 | ||||
|
Capital expenditures |
$ |
8,383 |
$ |
2,877 |
$ |
1,193 |
$ |
12,453 |
$ |
23,459 |
$ |
35,912 | |||||
|
Depreciation and amortization(b) |
$ |
22,601 |
$ |
2,728 |
$ |
5,507 |
$ |
30,836 |
$ |
10,798 |
$ |
41,634 | |||||
|
(a) |
Consists primarily of corporate general and administrative expenses. |
|
(b) |
Depreciation and amortization is included in income from construction operations. |
During the year ended December 31, 2016 the Company recorded net favorable adjustments totaling $3.0 million in income from construction operations ($0.04 per diluted share) for various Five Star Electric projects in New York in the Specialty Contractors segment. The net impact included material adjustments related to two electrical subcontract projects: a favorable adjustment of $14.0 million for a completed project ($0.17 per diluted share) and an unfavorable adjustment of $13.8 million for a project that was nearly complete ($0.16 per diluted share).
During the year ended December 31, 2015, the Company recorded unfavorable adjustments in the Specialty Contractors segment totaling $45.6 million in income from construction operations ($0.53 per diluted share) related to various Five Star Electric projects in New York, none of which were individually material. Most of these projects are complete or nearing completion. In addition, there were unfavorable adjustments to the estimated cost to complete a Building segment project, which has been completed and resulted in a decrease of $24.3 million in income from construction operations ($0.28 per diluted share). Furthermore, the Company recorded an unfavorable adjustment totaling $23.9 million ($0.28 per diluted share) in the Civil segment for an adverse legal decision related to a long-standing litigation matter, for which the Company assumed liability as part of an acquisition in 2011. Finally, the Company recorded favorable adjustments for a Civil segment runway reconstruction project, which resulted in an increase of $13.7 million in income from construction operations ($0.16 per diluted share).
The above were the only changes in estimates considered material to the Company’s results of operations during the periods presented herein.
F-33
TUTOR PERINI CORPORATION AND SUBSIDIARIES
NOTES TO CONSOLIDATED FINANCIAL STATEMENTS (Continued)
Total assets by segment are as follows:
|
|
|||||
|
|
|||||
|
|
As of December 31, |
||||
|
(in thousands) |
2017 |
2016 |
|||
|
Civil |
$ |
2,452,108 |
$ |
2,152,123 | |
|
Building |
909,207 | 917,317 | |||
|
Specialty Contractors |
767,807 | 813,851 | |||
|
Corporate and other(a) |
135,001 | 155,329 | |||
|
Total assets |
$ |
4,264,123 |
$ |
4,038,620 | |
(a) Consists principally of cash, equipment, tax-related assets and insurance-related assets, offset by the elimination of assets related to intersegment revenue.
Geographic Information
Information concerning principal geographic areas is as follows:
|
|
||||||||
|
|
Year Ended December 31, |
|||||||
|
(in thousands) |
2017 |
2016 |
2015 |
|||||
|
Revenue: |
||||||||
|
United States |
$ |
4,613,644 |
$ |
4,802,393 |
$ |
4,694,165 | ||
|
Foreign and U.S. territories |
143,564 | 170,683 | 226,307 | |||||
|
Total revenue |
$ |
4,757,208 |
$ |
4,973,076 |
$ |
4,920,472 | ||
|
|
|||||
|
|
As of December 31, |
||||
|
(in thousands) |
2017 |
2016 |
|||
|
Assets: |
|||||
|
United States |
$ |
4,093,673 |
$ |
3,911,865 | |
|
Foreign and U.S. territories |
170,450 | 126,755 | |||
|
Total assets |
$ |
4,264,123 |
$ |
4,038,620 | |
Reconciliation of Segment Information to Consolidated Amounts
A reconciliation of segment results to the consolidated income before income taxes is as follows:
|
|
||||||||
|
|
Year Ended December 31, |
|||||||
|
(in thousands) |
2017 |
2016 |
2015 |
|||||
|
Income from construction operations |
$ |
179,477 |
$ |
201,920 |
$ |
105,413 | ||
|
Other income, net |
43,882 | 6,977 | 13,569 | |||||
|
Interest expense |
(69,384) | (59,782) | (45,143) | |||||
|
Income before income taxes |
$ |
153,975 |
$ |
149,115 |
$ |
73,839 | ||
F-34
TUTOR PERINI CORPORATION AND SUBSIDIARIES
NOTES TO CONSOLIDATED FINANCIAL STATEMENTS (Continued)
13. Related Party Transactions
The Company leases, at market rates, certain facilities from an entity owned by Ronald N. Tutor, the Company’s Chairman and Chief Executive Officer. Under these leases, the Company paid $2.8 million in both 2017 and 2016, and $2.7 million for 2015, and recognized expense of $3.2 million in each of those same years.
Raymond R. Oneglia, Vice Chairman of O&G Industries, Inc. (“O&G”), is a director of the Company. The Company occasionally forms construction project joint ventures with O&G, in which each partner may provide services and equipment to these joint ventures on customary trade terms. During the three years ended December 31, 2017, the Company had three active joint ventures with O&G including two infrastructure projects in the northeastern United States that are both complete, and one for a project in Los Angeles, California in which the Company’s and O&G’s joint venture interests are 75% and 25%, respectively. Payments made by these joint ventures to O&G for services and equipment during the years ended December 31, 2017, 2016 and 2015 were immaterial.
Peter Arkley, Senior Managing Director, Construction Services Group, of Alliant Insurance Services, Inc. (“Alliant”), is a director of the Company. The Company uses Alliant for various insurance-related services. The associated expenses for services provided for the years ended December 31, 2017, 2016 and 2015 were $17.6 million, $8.9 million and $9.8 million, respectively. The Company owed Alliant $0.5 million and $5.2 million as of December 31, 2017 and 2016, respectively, for services rendered.
14. Unaudited Quarterly Financial Data
The following table presents selected unaudited quarterly financial data for each full quarterly period of 2017 and 2016:
|
|
||||||||||||
|
(in thousands, except per share amounts) |
First |
Second |
Third |
Fourth |
||||||||
|
Year Ended December 31, 2017 |
Quarter |
Quarter |
Quarter |
Quarter |
||||||||
|
Revenue |
$ |
1,117,361 |
$ |
1,247,274 |
$ |
1,199,505 |
$ |
1,193,068 | ||||
|
Gross profit |
102,720 | 102,838 | 118,251 | 130,596 | ||||||||
|
Income from construction operations |
37,017 | 34,045 | 49,072 | 59,343 | ||||||||
|
Income before income taxes |
21,870 | 52,516 | 34,396 | 45,193 | ||||||||
|
Net income |
13,764 | 32,633 | 25,300 | 82,847 | ||||||||
|
Net income attributable to Tutor Perini Corporation |
13,764 | 30,096 | 23,584 | 80,938 | ||||||||
|
Earnings per common share: |
||||||||||||
|
Basic |
$ |
0.28 |
$ |
0.61 |
$ |
0.47 |
$ |
1.63 | ||||
|
Diluted |
$ |
0.27 |
$ |
0.59 |
$ |
0.47 |
$ |
1.60 | ||||
|
|
||||||||||||
|
(in thousands, except per share amounts) |
First |
Second |
Third |
Fourth |
||||||||
|
Year Ended December 31, 2016 |
Quarter |
Quarter |
Quarter |
Quarter |
||||||||
|
Revenue |
$ |
1,085,369 |
$ |
1,308,130 |
$ |
1,332,978 |
$ |
1,246,599 | ||||
|
Gross profit |
105,092 | 109,770 | 124,668 | 117,660 | ||||||||
|
Income from construction operations |
40,122 | 48,829 | 60,919 | 52,050 | ||||||||
|
Income before income taxes |
26,724 | 35,780 | 47,926 | 38,685 | ||||||||
|
Net income |
15,400 | 21,361 | 28,801 | 30,260 | ||||||||
|
Net income attributable to Tutor Perini Corporation |
15,400 | 21,361 | 28,801 | 30,260 | ||||||||
|
Earnings per common share: |
||||||||||||
|
Basic |
$ |
0.31 |
$ |
0.43 |
$ |
0.59 |
$ |
0.62 | ||||
|
Diluted |
$ |
0.31 |
$ |
0.43 |
$ |
0.57 |
$ |
0.60 | ||||
F-35