Attached files
| file | filename |
|---|---|
| EX-32.1 - EXHIBIT 32.1 - TRINET GROUP, INC. | tnet-123117xexhibit321.htm |
| EX-31.2 - EXHIBIT 31.2 - TRINET GROUP, INC. | tnet-123117xexhibit312.htm |
| EX-31.1 - EXHIBIT 31.1 - TRINET GROUP, INC. | tnet-123117xexhibit311.htm |
| EX-23.2 - EXHIBIT 23.2 - TRINET GROUP, INC. | tnet-123117xexhibit232.htm |
| EX-23.1 - EXHIBIT 23.1 - TRINET GROUP, INC. | tnet-123117xexhibit231.htm |
| EX-21.1 - EXHIBIT 21.1 - TRINET GROUP, INC. | tnet-123117xexhibit211.htm |
| EX-10.19 - EXHIBIT 10.19 - TRINET GROUP, INC. | tnet-123117xexhibit1019.htm |
| EX-10.15 - EXHIBIT 10.15 - TRINET GROUP, INC. | tnet-123117xexhibit1015.htm |
| EX-10.7 - EXHIBIT 10.7 - TRINET GROUP, INC. | tnet-123117xexhibit107.htm |
UNITED STATES
SECURITIES AND EXCHANGE COMMISSION
WASHINGTON, DC 20549
FORM 10-K
(Mark One)
x ANNUAL REPORT PURSUANT TO SECTION 13 OR 15(d) OF THE SECURITIES EXCHANGE ACT OF 1934
For the year ended December 31, 2017
or
o TRANSITION REPORT PURSUANT TO SECTION 13 OR 15(d) OF THE SECURITIES EXCHANGE ACT OF 1934
For the transition period from to
Commission File Number: 001-36373

TRINET GROUP, INC.
(Exact Name of Registrant as Specified in its Charter)
Delaware | 95-3359658 | |
(State or other jurisdiction of incorporation or organization) | (I.R.S. Employer Identification No.) | |
1100 San Leandro Blvd., Suite 400, San Leandro, CA | 94577 | |
(Address of principal executive offices) | (Zip Code) | |
Registrant’s telephone number, including area code: (510) 352-5000
Securities registered pursuant to Section 12(b) of the Act: Common Stock, Par Value $0.000025 Per Share; Common stock traded on the New York Stock Exchange.
Securities registered pursuant to Section 12(g) of the Act: None
Indicate by check mark if the Registrant is a well-known seasoned issuer, as defined in Rule 405 of the Securities Act. Yes x No o
Indicate by check mark if the Registrant is not required to file reports pursuant to Section 13 or 15(d) of the Act. Yes o No x
Indicate by check mark whether the registrant (1) has filed all reports required to be filed by Section 13 or 15(d) of the Securities Exchange Act of 1934 during the preceding 12 months (or for such shorter period that the registrant was required to file such reports), and (2) has been subject to such filing requirements for the past 90 days. Yes x No o
Indicate by check mark whether the registrant has submitted electronically and posted on its corporate Web site, if any, every Interactive Data File required to be submitted and posted pursuant to Rule 405 of Regulation S-T (§ 232.405 of this chapter) during the preceding 12 months (or for such shorter period that the registrant was required to submit and post such files). Yes x No o
Indicate by check mark if disclosure of delinquent filers pursuant to Item 405 of Regulation S-K (§229.405) is not contained herein, and will not be contained, to the best of Registrant’s knowledge, in definitive proxy or information statements incorporated by reference in Part III of this Form 10-K or any amendment to this Form 10-K. x
Indicate by check mark whether the registrant is a large accelerated filer, an accelerated filer, a non-accelerated filer, or a smaller reporting company. See the definitions of “large accelerated filer,” “accelerated filer” and “smaller reporting company” in Rule 12b-2 of the Exchange Act. (Check one):
Large accelerated filer | x | Accelerated filer | o |
Non-accelerated filer | o (do not check if a smaller reporting company) | Smaller reporting company | o |
Emerging growth company | o | ||
If an emerging growth company, indicate by check mark if the registrant has elected not to use the extended transition period for complying with any new or revised financial accounting standards provided pursuant to Section 13(a) of the Exchange Act. Yes o No o
Indicate by check mark whether the registrant is a shell company (as defined in Rule 12b-2 of the Exchange Act). Yes o No x
The aggregate market value of the voting and non-voting common equity held by non-affiliates of the Registrant, based on the closing price of the shares of common stock on The New York Stock Exchange on June 30, 2017, was $1.4 billion.
The number of shares of Registrant’s Common Stock outstanding as of February 20, 2018 was 70,055,290.
Portions of the Registrant’s Definitive Proxy Statement to be issued in connection with its Annual Meeting of Stockholders, scheduled to be held on May 22, 2018, are incorporated by reference into Part III of this Form 10-K.
TRINET GROUP, INC.
Form 10-K - Annual Report
For the Year End December 31, 2017
TABLE OF CONTENTS
BUSINESS | |
Cautionary Note Regarding Forward-Looking Statements
For purposes of this Annual Report, the terms “TriNet," "the Company," “we,” “us” and “our" refer to TriNet Group, Inc., and its subsidiaries. This Annual Report on Form 10-K (Form 10-K) contains statements that are not historical in nature, are predictive in nature, or that depend upon or refer to future events or conditions or otherwise contain forward-looking statements within the meaning of Section 21 of the Securities Exchange Act of 1934, as amended, and the Private Securities Litigation Reform Act of 1995. Forward-looking statements are often identified by the use of words such as, but not limited to, “anticipate,” “believe,” “can,” “continue,” “could,” “design,” “estimate,” “expect,” “forecast,” “hope,” “intend,” “may,” “outlook,” “plan,” “potential,” “predict,” “project,” “seek,” “should,” “strategy,” “target,” “will,” “would” and similar expressions or variations intended to identify forward-looking statements. Examples of forward-looking statements include, among others, TriNet’s expectations regarding: the growth of our customer base, our ability to roll out additional product offerings as and when planned, our ability to make enhancements to our technology platform, our ability to remediate the material weakness in our internal controls over financial reporting, our ability to execute on our vertical market strategy, our ability to retain clients and penetrate the market for human resources (HR) solutions for small to midsize businesses, and other expectations, outlooks and forecasts on our future business, operational and financial performance.
Forward-looking statements are not guarantees of future performance, but are based on management’s expectations as of the date of this Form 10-K and assumptions that are inherently subject to uncertainties, risks and changes in circumstances that are difficult to predict. Forward-looking statements involve known and unknown risks, uncertainties and other factors that may cause actual results, performance or achievements to be materially different from our current expectations and any past results, performance or achievements. Given these risks and uncertainties, readers are cautioned not to place undue reliance on such forward-looking statements.
Important factors that could cause actual results to differ materially from those expressed or implied by these forward-looking statements are discussed throughout this Form 10-K, including those appearing under the heading “Risk Factors” in Item 1A, and under the heading “Management’s Discussion and Analysis of Financial Condition and Results of Operations” (MD&A) in Item 7, as well as in our periodic filings with the Securities and Exchange Commission (SEC). Those factors could cause our actual results to differ materially from our anticipated results.
The information provided in this Form 10-K is based upon the facts and circumstances known at this time, and any forward-looking statements made by us in this Form 10-K speak only as of the date of this Form 10-K. We undertake no obligation to revise or update any of the information provided in this Form 10-K, except as required by law.
BUSINESS | |
PART I
Item 1. Business
General
TriNet is a leading provider of human resources (HR) solutions for small to midsize businesses (SMBs). Under our co-employment model, we assume certain of the responsibilities of being an employer and help our clients mitigate certain employer-related risks and manage many of the complex and burdensome administrative and compliance responsibilities associated with employment.
Our solutions include payroll processing, tax administration, employee benefits and an HR technology platform with online and mobile tools that allow our clients and worksite employees (WSEs) to store, view and manage their core HR-related information and efficiently conduct a variety of HR-related transactions anytime and anywhere.
Leveraging our scale for the benefit of our clients is a key component of our business model. For example, we utilize our size and scale to provide our clients and WSEs access to a broad range of cost-effective employee benefit and insurance programs generally not available to individual SMBs. In addition, our service teams help with talent management, recruiting and training, performance management, employee onboarding and terminations, benefits enrollment and support, claims administration and employment practices risk management. We also monitor employer-related developments and assist clients in complying with applicable local, state and federal regulations.
Our strategy is to provide industry-specific products and services to help clients address their HR needs and allow them to focus on operating and growing their businesses. We believe our industry-oriented (vertical) approach is a key differentiator for us and delivers significant benefits to our clients. This allows our sales force, product development and service teams to tailor product and service offerings to the specific industry needs of our clients. As of December 31, 2017, we have introduced five verticals TriNet Financial Services, TriNet Life Sciences, TriNet Nonprofit, TriNet Technology, and TriNet Main Street and we intend to continue to develop and offer new industry vertical products in the future.
TriNet was founded in 1988 and has significantly grown the number of clients we serve, both organically and through strategic acquisitions. For the year ended December 31, 2017, we processed $37.1 billion in payroll payments for approximately 14,800 clients with about 325,000 WSEs in all 50 states, the District of Columbia and Canada.
Products and Services
We deliver a comprehensive suite of products and services, which allows our clients to administer and manage various HR-related functions, including compensation and benefits, payroll processing, employee data, health insurance and workers' compensation programs, and other transactional HR needs using our technology platform and HR, benefits and compliance expertise.
Our comprehensive HR products and solutions include the following common capabilities:
 |  |  |  | |||
TECHNOLOGY PLATFORM | HR EXPERTISE | BENEFITS | COMPLIANCE | |||
Technology PlatformOur technology platform includes online and mobile tools that allow our clients and WSEs to store, view, and manage core HR information and administer a variety of HR transactions, such as payroll processing, tax administration, employee onboarding and termination, compensation reporting, expense management, and benefits enrollment and administration. In 2017, we made significant investments in our technology platform to provide our users with improved functionality, including online and mobile productivity tools, and to allow our platform to integrate more effectively with third-party software applications.
BUSINESS | |
Our strategy is to continue to invest in product development and improve the functionality, experience and ease of use of our products and services for our clients and WSEs. We will continue to design additional functionality into our core platform, retire legacy software systems inherited from acquisitions, and migrate clients on those legacy systems to our TriNet platform. We believe the continued improvement of our technology platform and the consolidation of legacy systems allows us to drive operating efficiencies and improve client user experience by providing a single, streamlined experience for accessing HR information and conducting HR transactions.
We invested approximately $74 million, $53 million and $39 million, during 2017, 2016 and 2015, respectively, developing our technology solutions.
HR ExpertiseWe use the collective insights and experience of our teams of HR, benefits, risk management and compliance professionals to help clients mitigate many of the administrative, regulatory and practical risks associated with their responsibilities as employers. We assist our clients in running their business by providing a variety of HR services, from widely used services like employee onboarding and terminations, benefits enrollment and support, employment practices risk management and administration, talent management, recruiting and training, and performance management to more specialized services like immigration services. Each of our clients and WSEs have access to varying levels of service and support from our HR experts ranging from call center support for basic questions to pooled specialized resources and to onsite consulting and services, depending on the needs of the client and WSEs. In addition, our teams of in-house HR professionals can also provide additional, incremental consulting and other services upon request.
Under our vertical strategy, we seek to design our product and service offerings for specific industries by identifying common needs and leveraging scale and shared experience to provide more efficient and relevant offerings. For example, our fifth vertical product, TriNet Main Street, supports hospitality, retail, property management, and other similar industries. These industries are labor intensive and often operate from many disparate taxing and geographic locations. Based on the common needs of these industries, we have created time and attendance expertise, hiring and termination expertise, workers’ compensation safety consultants, and a compelling suite of benefit plans that are attractive to both our clients' executives and hourly workers.
Benefits We offer our WSEs access to a broad range of TriNet-sponsored benefit and insurance programs at a value that we believe most of our clients would be unable to obtain on their own. We utilize our scale to decrease costs associated with our programs and look for ways to leverage our scale to provide additional benefits to our WSEs. Our benefit and insurance programs are compliant with state, local, and federal regulations, and our benefit and insurance service offerings include plan design and administration, enrollment management, and WSE and client communications.
Under our programs, we pay premiums to third-party insurance carriers for WSE insurance benefits and reimburse the insurance carriers and third-party administrators for claims payments made on our behalf within our insurance deductible layer, where applicable.
Employee Benefit Plans: We sponsor and administer several fully insured, risk-based employee benefit plans, including group health, dental, vision, short- and long-term disability, and life insurance as an employer plan sponsor under Section 3(5) of the Employee Retirement Income Security Act (ERISA). We also offer other benefit programs to our WSEs, including flexible spending accounts, retirement plans, Consolidated Omnibus Budget Reconciliation Act (COBRA) benefits, individual life insurance, a legal services plan, commuter benefits, home insurance, critical illness insurance, pet insurance and auto insurance. For further discussion of our fully insured programs including policies where we reimburse our carriers for certain amounts relating to claims, refer to Note 1 in Part II, Item 8 of this Form 10-K.
BUSINESS | |
Workers' Compensation: We provide fully insured workers' compensation insurance coverage for our clients and WSEs through insurance policies that we negotiate with our third-party insurance carriers. Additionally, we help clients manage their risk by providing risk management services, including performing workplace assessment, safety consultation, accident investigation and other risk management services at our client locations to help prevent workplace accidents that could lead to claims. We also provide services to help remediate such claims when they occur.
We manage the deductible risk that we assume in connection with these policies by being selective in the types of businesses that we take on as new clients, by monitoring claims data and the performance of our carriers and third-party claims management services and vendors and by providing risk management services for existing clients.
Employment Practices Liability Insurance (EPLI): We provide EPLI coverage for our clients through insurance policies that we obtain from our third-party EPLI insurance carrier. These policies provide coverage for certain claims that arise in the course of the employment relationship such as discrimination, harassment, and certain other employee claims, with a per-claim retention amount. The retention amount is split between the client and TriNet, with the client generally paying its portion of the retention amount first.
While we do not provide legal representation to our clients, our clients can benefit from the extensive experience of our employment law specialists and HR professionals who assist clients in implementing HR best practices to avoid employment practices liability claims and in managing, processing and responding to such claims. For claims covered by our EPLI insurance, actual litigation defense is conducted by outside employment law firms with whom we and our EPLI carriers have previously negotiated rates, established billing guidelines and invoice review processes. We have also developed a case management protocol to efficiently and effectively defend such claims.
ComplianceOur products and services are designed to help our clients comply with local, state and federal employment and benefit laws. We monitor employment-related developments and assist clients in complying with changing regulations and requirements at all levels, from changes in state and local employment laws, such as minimum wage and family leave ordinances, to sweeping federal reforms such as the 2017 Tax Cuts and Jobs Act (TCJA) and the Patient Protection and Affordable Care Act (ACA). Often these changes are staggered and require additional guidance from a variety of local, state or federal agencies, or result in complementary or responsive changes, making compliance a continuous challenge. Each component of our HR solutions is designed with compliance in mind, whether it is payroll processing and tax administration, HR services focused on creating a compliant workplace, or offering ACA-compliant benefit plans.
Our Co-Employment Model
We operate under a co-employment business model, under which employment-related responsibilities are contractually allocated between us and our clients. This model allows WSEs to receive the full benefit of our services, including our employee benefit plan offerings. Each of our clients enters into a client service agreement with us that defines the suite of professional and insurance services and benefits to be provided by us, the fees payable to us, and the division of responsibilities between us and our clients as co-employers. The division of responsibilities under our client service agreements is typically as follows:
TriNet Responsibilities
We assume responsibility for, and manage certain risks associated with:
• | remittance to WSEs of salaries, wages and certain other compensation, as reported and paid to us by the client, related tax reporting and remittance to tax authorities and processing of garnishment and wage deduction orders. Unlike a payroll service provider, we issue each WSE a payroll check drawn on our bank accounts, |
• | report the wages, withhold and deposit the associated payroll taxes as the employer for regulatory reporting and payroll tax returns, |
• | provision and maintenance of workers' compensation insurance and workers' compensation claims processing, |
• | provision and administration of group health, welfare, and retirement benefits to WSEs under TriNet-sponsored insurance plans, |
• | compliance with applicable law for employee benefits offered to WSEs, |
BUSINESS | |
• | processing of unemployment claims, and |
• | provision of certain HR policies, including an employee handbook describing the co-employment relationship. |
Client Responsibilities
Our clients are responsible for employment-related responsibilities that we do not assume, including:
• | day-to-day management of their worksites and WSEs, |
• | compliance with laws associated with the classification of employees as exempt or non-exempt, such as overtime pay and minimum wage law compliance, |
• | accurate and timely reporting to TriNet of compensation and deduction information, including information relating to hours worked, rates of pay, salaries, wages and certain other compensation, |
• | accurate and timely reporting to TriNet of information relating to workplace injuries, employee hires and termination, and certain other information relevant to TriNet’s services, |
• | provision and administration of any employee benefits not provided by TriNet (e.g., equity incentive plans), |
• | compliance with all laws and regulations applicable to the clients' workplace and business, including work eligibility laws, laws relating to workplace safety or the environment, laws relating to family and medical leave, laws pertaining to employee organizing efforts and collective bargaining and employee termination notice requirements, |
• | payment of TriNet invoices which include wages to WSEs and applicable employment taxes and service fees, and |
• | all other matters for which TriNet does not assume responsibility under the client service agreement, such as intellectual property ownership and protection and liability for products produced and/or services provided. |
As a result of our co-employment relationship with each of our WSEs, we are liable for payment of salary, wages and certain other compensation to the WSEs as reported and paid to us by the client and are responsible for providing specified employee benefits to such persons to the extent provided in each client service agreement and under federal and state law. In most instances, clients are required to remit payment prior to the applicable payroll date by wire transfer or automated clearinghouse transaction (ACH).
We also assume responsibility for payment and liability for the withholding and remittance of federal and state income and employment taxes with respect to salaries, wages and certain other compensation paid to WSEs, although we reserve the right to seek recourse against our clients for any liabilities arising out of their conduct. We perform these functions as the statutory employer for federal employment tax purposes, since our clients transfer legal control over these payroll functions to us. The laws that govern the payment of salaries, wages and related payroll taxes for our WSEs are very complex and the various federal, state and local laws that govern such payments can have significant differences. For example, except to the extent applicable federal and state laws otherwise provide, the client may be held ultimately liable for those obligations if we fail to remit taxes and the bonding security provided by the Employer Services Assurance Corporation (ESAC) or other surety is not sufficient to satisfy the obligation.
Sales and Marketing
We sell our solutions primarily through our direct sales organization. We have aligned our sales organization by industry vertical with the goal of growing profitable market share in our targeted industries. This vertical approach deepens our network of relationships and gives us an understanding of the unique HR needs facing SMBs in those industries.
Our Vertical Approach
We believe that our vertical approach allows our sales force, product development and service teams to tailor product and service offerings to the specific industry needs of our clients. In addition to sales and marketing, our client services and product development teams are focused on specific industry verticals. We believe this vertical approach is an important competitive differentiator for TriNet and believe that it will deliver significant benefits to our clients.
BUSINESS | |
Our Sales Organization
Our sales representatives are supported by marketing, inside sales, lead generation efforts, and referral networks.
We sponsor and participate in associations and events around the country and utilize these forums to target specific vertical and geographic markets. We also generate sales opportunities within key industry verticals, through marketing alliances and other indirect channels, such accounting firms, venture capital firms, incubators, insurance brokers, and other vertical market industry associations. Additionally, we utilize digital marketing programs, including digital advertising, search and email marketing, to create awareness and interest in our products.
We have expanded our focus on various channel relationships and alliances that drive referrals to our direct sales force. Finally, our sales representatives benefit from building strong relationships with prospects during the sales and client service processes, resulting in referrals to new prospects as well as direct support through providing reference calls in regard to our products and services.
Legal and Regulatory
Our business operates in a complex environment created by the numerous federal, state and local laws and regulations relating to labor and employment matters, benefit plans and income and employment taxes. The following summarizes what we believe are the most important legal and regulatory aspects of our business:
Federal Regulations
Employer Status
We sponsor our employee benefit plan offerings as the “employer” of our WSEs under the Internal Revenue Code of 1986 (the Code), and ERISA. The multiple definitions of “employer” under both the Code and ERISA are not clear and most are defined in part by complex multi-factor tests under common law. We believe that we qualify as an “employer” of our WSEs in the U.S. under both the Code and ERISA, as well as various state regulations, but this status could be subject to challenge by various regulators. For additional information on employer status and its impact on our business and results of operations, refer to Item 1A of this Form 10-K, under the heading - If we are not recognized as an employer of worksite employees under federal and state regulations, or are deemed to be an insurance agent or third-party administrator, we and our clients could be adversely impacted.
Affordable Care Act and Health Care Reform
The Patient Protection and Affordable Care Act (ACA) was signed into law in March 2010. The ACA implemented sweeping health care reforms with staggered effective dates from 2010 through 2020, and many provisions in the Act require the issuance of additional guidance from the U.S. Department of Labor (DOL), the Internal Revenue Service (IRS), the U.S. Department of Health and Human Services and the states. Passage of the 2017 TCJA in December 2017, eliminates the individual mandate tax penalty under the ACA beginning in 2019, while retaining employer ACA obligations. Further significant changes to health care statutes, regulations and policy at the federal, state and local levels could occur in 2018 and beyond, including the potential further modification, amendment or repeal of the ACA. For additional information on the ACA and its impact on our business and results of operations, refer to Item 1A of this Form 10-K, under the heading - Our business is subject to numerous complex state and federal laws, and changes in, uncertainty regarding, or adverse application of these laws could adversely affect our business.
Health Insurance Portability and Accountability Act
Maintaining the security of our WSEs information is important to TriNet as we sponsor employee benefit plans and may have access to personal health information of our WSEs. The manner in which we manage protected health information (PHI) is subject to the Health Insurance Portability and Accountability Act of 1996 (HIPAA), and the Health Information Technology for Economic and Clinical Health Act of 2009 (HITECH Act). HIPAA contains substantial restrictions and health data privacy, security and breach notification requirements with respect to the use and disclosure of PHI. Further, under the HITECH Act there are steep penalties and fines for HIPAA violations. Our health plans are covered entities under HIPAA, and we are therefore required to comply with HIPAA's portability, privacy, and security requirements.
BUSINESS | |
To the extent possible, the health information we possess is anonymized and accessed through a secured third-party database. For additional information on the security of our clients' and WSEs' personal data and PHI and the potential impact to our business if we fail to protect our WSEs' PHI, refer to Item 1A of this Form 10-K, under the heading - Cyber-attacks or security breaches could result in reduced revenue, increased costs, liability claims or damage to our reputation.
Certified Professional Employer Organization (CPEO) Certification
With passage of the Small Business Efficiency Act in 2014, the U.S. Congress created a federal framework for professional employer organizations (PEOs) who voluntarily become certified under this law. The IRS is accepting applications for PEOs to become certified under the Code. Even though final regulations for the certification program have not yet been issued, we have applied for certification.
State Regulations
Forty-two states have adopted provisions for licensing, registration, certification or recognition of co-employers, and others are considering such regulation. Such laws vary from state to state but generally provide for monitoring or ensuring the fiscal responsibility of PEOs, and in some cases codify and clarify the co-employment relationship for unemployment, workers' compensation and other purposes under state laws. We believe we are in compliance in all material respects with the requirements in those 42 states.
We must also comply with state unemployment tax requirements where our clients are located. State unemployment taxes are based on taxable wages and tax rates assigned by each state. The tax rates vary by state and are determined, in part, based on our prior years’ compensation and unemployment claims experience in each state. Certain rates are also determined, in part, by each client’s own compensation and unemployment claims experience. In addition, states have the ability under law to increase unemployment tax rates, including retroactively, to cover deficiencies in the unemployment tax funds.
We must also comply with general state tax laws, including payroll tax laws. As noted above, tax reform may lead to significant state tax law changes in 2018 and beyond.
Strategic Acquisitions
Historically, we have pursued strategic acquisitions to both expand our product capabilities and supplement our growth across geographies and certain industry verticals. Our acquisition targets have included PEOs and other HR solution providers as well as technology companies or technology product offerings to supplement or enhance our existing HR solutions. We intend to continue to pursue strategic acquisitions that will enable us to add new clients and WSEs, expand our presence in certain geographies or industry verticals and offer our clients and WSEs more attractive products and services.
Client Industries and Geographies
Our clients are distributed across a variety of industries including technology, life sciences, not-for-profit, professional services, financial services, property management, retail, manufacturing, and hospitality. Our clients execute annual service contracts with us that automatically renew. Generally, our clients may cancel these contracts with thirty days' notice and we may cancel these contracts with thirty days' notice.
We conduct our business primarily in the United States of America (U.S.), with more than 99% of our total revenues being attributable to WSEs in the U.S. and the remainder being attributable to WSEs in Canada. Substantially all our long-lived assets are located in the U.S.
Seasonality
Our business is affected by seasonality in client business activity and WSE product selection during benefits open enrollment. Clients generally change their payroll service providers at the beginning of the payroll tax year and as a result, we have historically experienced our highest volumes of new and exiting clients in the month of January. Other periods of significant client turn-over coincide with the timing of benefit program renewals.
BUSINESS | |
Competition
We face significant competition in the form of companies serving their HR needs in both traditional and non-traditional manners. These forms of competition include:
• | Other PEOs that compete directly with us, |
• | HR and information systems departments and personnel of companies that perform their own administration of employee benefits, payroll and HR, |
• | providers of certain endpoint HR services, including payroll, employee benefits and business process outsourcers with high-volume transaction and administrative capabilities, such as Automatic Data Processing, Inc., Paychex, Inc. and other third-party administrators, |
• | employee benefit exchanges that provide benefits administration services over the Internet to companies that otherwise maintain their own employee benefit plans, |
• | insurance brokers who allow third party HR systems to integrate with their platform, and |
Our competitors include large PEOs such as the TotalSource unit of Automatic Data Processing, Inc., the PEO operations of Paychex, Inc. and Insperity, Inc., as well as specialized and smaller PEOs and similar HR service providers with PEO operations. If, and to the extent that, we and other companies providing these services are successful in growing our businesses, we anticipate that future competitors will enter this industry.
We believe that our services are attractive to many SMBs in part because of our ability to provide access to a broad range of TriNet-sponsored workers' compensation, health insurance and other benefits programs on a cost-effective basis. We compete with insurance brokers and other providers of this coverage in this regard, and our offerings must be priced competitively with those provided by these competitors in order for us to attract and retain our clients.
We believe the principal competitive factors in our market include client satisfaction, ease of client setup and on-boarding, breadth and depth of benefit plans, vertical market expertise, total cost of service, brand awareness and reputation, ability to innovate and respond to client needs rapidly, online and mobile solutions, and subject matter expertise. We believe that we compete favorably on the basis of each of these factors.
Intellectual Property
We own or license from third parties various computer software, as well as other intellectual property rights, used in our business. Generally, we protect our intellectual property rights through the use of confidentiality and non-disclosure agreements and policies with our employees and third-party partners and vendors, although we currently have one pending U.S. patent application covering our technology. We also own registered trademarks in the U.S., Canada and the European Union covering our name and other trademarks and logos that we believe are materially important to our operations.
Corporate Employees
We refer to our employees that are not co-employed with our clients as our corporate employees. We had approximately 2,700 corporate employees as of December 31, 2017. None of our corporate employees are covered by a collective bargaining agreement.
Corporate and Other Available Information
We were incorporated in 1988 as TriNet Employer Group, Inc., a California corporation. We reincorporated as TriNet Merger Corporation, a Delaware corporation, in 2000 and during that year changed our name to TriNet Group, Inc. Our principal executive offices are located at 1100 San Leandro Blvd., Suite 400, San Leandro, CA 94577 and our telephone number is (510) 352-5000. Our website address is www.trinet.com. Information contained in or accessible through our website is not a part of this report.
On the Investor Relations page of our Internet website at http://www.trinet.com, we make available, free of charge, our Annual Reports on Form 10-K, Quarterly Reports on Form 10-Q, Current Reports on Form 8-K, and amendments to those reports, as soon as reasonably practicable after such material is electronically filed with or furnished to the SEC.
BUSINESS | |
The public may read and copy any materials that we file with the SEC at the SEC’s Public Reference Room at 100 F Street, NE, Room 1580, Washington, DC 20549. The public may obtain information on the operation of the Public Reference Room by calling the SEC at 1-800-SEC-0330. The SEC also maintains an internet site that contains reports, proxy and information statements and other information regarding issuers that file electronically with the SEC at www.sec.gov. The contents of these websites are not incorporated into this report and are not part of this report.
RISK FACTORS | |
Item 1A. Risk Factors
Our business is subject to numerous complex laws, and changes in, uncertainty regarding, or adverse application of these laws could negatively affect our business.
The products and services we provide to our clients are subject to numerous complex federal, state and local laws and regulations, including those described under the heading "Legal and Regulatory" in Item 1 of this Form10-K. Many of these laws (such as ERISA, the ACA and state healthcare laws, and other federal and state employment tax laws, such as wage and hour laws, anti-discrimination laws, etc.) may not result in a consistent approach at the federal, state and local level, may not specifically address PEOs and co-employment relationships or may allow significant regulatory interpretation and discretion in enforcement. As a result, there is uncertainty in how they might be applied to our operations and those of our clients and WSEs.
New laws, changes in existing laws, or adverse application or interpretation of new or existing laws regarding our co-employment relationship with our clients and WSEs (in courts, agencies or otherwise) could reduce or eliminate the need for, or benefit provided by, some or all of the services we provide or require us to make significant changes in our methods of doing business and providing services. Regulatory changes could also affect the extent and type of employee benefits employers can or must provide employees, the amount and type of taxes employers and employees are required to pay or the time within which employers must remit taxes to applicable tax authorities. Any such new laws, changes in laws or adverse application or interpretation of laws could have a material adverse effect on our financial condition and results of operations. Changes in, or uncertainty regarding, the TCJA, ACA and other health care reforms or tax reforms could materially impact our business and we are not able to predict the direction or ultimate impact of such reforms on our business operations.
For example, the newly passed TCJA will result in sweeping changes to the taxation of individuals and businesses in 2018 and beyond. Federal implementation of these tax reforms, and the changes to state tax laws that may result from federal tax reforms, may materially change the way in which we provide payroll tax services for our clients, as well as the business incentives that matter to our clients. Our ability to timely comply with the numerous changes under the TCJA and to continue to provide services that take advantage of new business incentives created by the TCJA could have a materially adverse effect on our ability to attract and retain clients.
Similarly, changes to and continued uncertainty regarding the implementation and future of health care reform in the United States under the ACA, any successor to the ACA, or related or similar state laws, has the potential to substantially change the health insurance market for SMBs and how such employers provide health insurance to their employees, which could have a materially adverse effect on our ability to attract and retain our clients. For example, the TCJA's elimination of the ACA individual mandate tax penalty beginning in 2019 may reduce the number of WSEs who participate in our insurance programs, and proposed rule changes by the DOL may increase the availability of "association health plans," which may compete with the health plans we provide, or impact the operation of other types of health plans, including the plans that we sponsor. There may also be significant additional changes to the ACA in 2018 and beyond, including the potential modification, amendment or repeal of the ACA. Tax reform changes brought about by the TCJA and changes to federal health care laws, including to the ACA, could also result in new or amended laws being introduced at the state or local level. In addition, state tax regulators may engage in their own tax reforms as a result of the passage of the TCJA. Our ability to comply with, and adapt our product offerings to take advantage of, any such changes could require significant additional costs and divert management attention, which could result in a material adverse effect on our financial condition and results of operations.
If we are not recognized as an employer of worksite employees under federal and state regulations, or are deemed to be an insurance agent or third-party administrator, we and our clients could be adversely impacted.
In order to sponsor our employee benefit plan offerings for WSEs, we must qualify as an employer of WSEs for certain purposes under the Code and ERISA. In addition, our status as an employer is important for purposes of ERISA’s preemption of certain state laws. The definition of employer under various laws is not uniform, and under both the Code and ERISA, the term is defined in part by complex multi-factor tests.
Generally, these tests are designed to evaluate whether an individual is an independent contractor or employee and they provide substantial weight to whether a purported employer has the right to direct and control the details of an individual's work. Some factors that the IRS has considered important in the past in evaluating this issue have included the employer’s degree of behavioral control (the extent of instructions, training and the nature of the work), financial control and the economic aspects of the work relationship, the intent of the parties, as evidenced by the specific benefit,
RISK FACTORS | |
contract, termination and other similar arrangements between the parties and the on-going versus project-oriented nature of the work to be performed. However, a definitive judicial interpretation of “employer” in the context of PEOs has not been established. For ERISA purposes, for example, courts have held that test factors relating to ability to control and supervise an individual are less important, while the U.S. Department of Labor has issued guidance that certain entities in the HR outsourcing industry do not qualify as common law employers for ERISA purposes. Although we believe that we qualify as an employer of WSEs under ERISA and the U.S. Department of Labor has not provided guidance otherwise, we are not able to predict the outcome of any future regulatory challenge.
If we were found not to be an employer for ERISA purposes, it could adversely affect the manner in which we are able to provide employee benefits to WSEs. Similarly, to qualify for favorable tax treatment under the Code, certain employee benefit plans, such as 401(k) retirement plans and cafeteria plans must be established and maintained by an employer for the exclusive benefit of its employees. All of our 401(k) retirement plans are operated pursuant to guidance provided by the IRS and we have received favorable determination letters from the IRS confirming the qualified status of the plans. However, the IRS uses its own complex, multi-factor test to ascertain whether an employment relationship exists between a worker and a purported employer. Although we believe that we qualify as an employer of WSEs under the Code, we cannot assure you that the IRS will not challenge this position or continue to provide favorable determination letters. Moreover, the IRS' 401(k) guidance and qualification requirements are not applicable to the operation of our cafeteria plans.
If we are not recognized as an employer under the Code or ERISA, we may be required to change the method by which we report and remit payroll taxes to the tax authorities and the method by which we provide, or discontinue providing, certain employee benefits to WSEs, which could have a material adverse effect on our business and results of operations.
We must also qualify as co-employers of WSEs and comply with state licensing, certification and registration requirements for the regulation of PEOs. Forty-two states have passed such laws and other states may implement such requirements in the future. While we believe that we satisfy these state regulations, these requirements vary from state to state and change frequently and if we are not able to satisfy existing or future licensing requirements or other applicable regulations in any state, we may be prohibited from doing business in that state.
In addition, state regulatory authorities generally impose licensing requirements on companies acting as insurance agents or third-party administrators, such as those that handle health or retirement plan funding and claim processing. We do not believe that our current activities require such licensing, but if regulatory authorities in any state determine that we are acting as an insurance agent or as a third-party administrator, we may need to hire additional personnel to manage regulatory compliance and become obligated to pay annual regulatory fees, which could have a material adverse effect on our financial condition and results of operations.
Our co-employment relationship with our worksite employees exposes us to business risks.
We are the co-employer of our WSEs. As the co-employer of our WSEs, we assume certain obligations and responsibilities of an employer. For instance, we are responsible for providing health benefits to our WSEs regardless of whether the cost of providing benefits exceeds the fees received from our clients. However, the extent of our responsibility for other aspects of our co-employer relationship with our WSEs remains subject to regulatory uncertainty at the state and federal level. For example, under certain circumstances, we may be found to be responsible for paying salaries, wages and related payroll taxes of our WSEs, even if our clients have not timely remitted payments to us.
We co-employ people in our clients' workplaces. Our ability to control the workplace environment of our clients is limited. As a co-employer of WSEs, there is a possibility that we may be subject to liability for violations of employment or other laws and other acts and omissions by our clients or WSEs even if we do not participate in any such acts or omissions. State and federal regulations interpreting co-employment relationships are in a constant state of flux and we cannot predict when changes will occur or forecast whether any particular future changes will be favorable to our operations or not.
We seek to mitigate these risks through our client agreements and insurance coverage. Our agreements with our clients establish the contractual division of responsibilities between us and our clients and that they will indemnify us for any liability attributable to their own or our WSEs' conduct, however, we may not be able to effectively enforce or collect on these contractual obligations. In addition, we maintain insurance coverage, including workers’ compensation, directors and officers and employment practices liability insurance coverage, to limit our and our clients' exposure to various WSE related claims, but we are still responsible for any deductible layer under such insurance and such insurance generally excludes coverage for claims relating to the classification of employees as exempt or non-exempt,
RISK FACTORS | |
other wage and hour issues, and employment contract disputes, among other things. We cannot assure you that our insurance will be sufficient in amount or scope to cover all claims that may be asserted against us and for which we are unable to obtain indemnification from our clients.
Negative publicity relating to events or activities attributed to us, our corporate employees, WSEs, or others associated with any of these parties, whether or not justified, may tarnish our reputation and reduce the value of our brand. In addition, if our brand is negatively impacted, it may have a material adverse effect on our business, including creating challenges in retaining clients or attracting new clients and hiring and retaining employees.
Cyber-attacks or security breaches could result in reduced revenue, increased costs, liability claims or damage to our reputation.
Maintaining the security of our IT infrastructure and the confidentiality of our clients' and WSEs' personal data and information is paramount for us and our clients. Clients using our technology platform rely on the security of our IT infrastructure to ensure the reliability of our products and services and the protection of sensitive client and WSE data. We use and store a large amount of personal and confidential information about our clients, WSEs and colleagues, including bank account and social security numbers, tax return data, certain medical information, retirement account information and payroll data. Threats to security can take a variety of forms. Hackers may develop and deploy viruses, worms and other malicious software programs that attack our networks and data centers. Sophisticated organizations or individuals may launch targeted attacks to gain access to our networks, applications and confidential data, such as phishing attacks.
We have implemented technical, physical, and administrative controls in order to protect personal and confidential information entrusted to us. In providing our services, we also rely on third-party service providers, such as insurance carriers, to process personal and confidential information about our clients, WSEs and employees. Through contractual provisions, we take steps to require that our service providers protect such information. However, we cannot guarantee the performance of our service providers and, ultimately, despite all of our efforts, threats to our IT infrastructure and our clients’ and WSEs’ data as these threats continue to grow in frequency, complexity and sophistication. While we, and our service providers, have programs in place to prevent, detect, and respond to data security incidents, these programs and our collective efforts may not always succeed. As a result, we may be required to invest significant additional resources to modify and enhance our information security to protect against such incidents.
Any cyber attack, unauthorized intrusion, insider theft, malicious software infiltration, network disruption or denial of service could result in disruption to our systems and services, product development delays, and the disclosure or misuse of personal and confidential information. This could have a material adverse effect on our business operations, result in liability or regulatory sanction or a loss of confidence in our ability to provide our services, or harm relationships with current or potential clients. Further, the cost of remediating any attack, breach or disclosure and costs associated with responding to litigation or regulatory investigations could have a material adverse effect on our business or reduce our operating margins. Maintaining the security of confidential WSE information is particularly important to us as a sponsor of employee benefit plans with access to certain personal health information. The manner in which we manage protected health information (PHI) is subject to HIPAA and the HITECH Act. To the extent possible, the health information we possess is anonymized and accessed through a secured third-party database. Although we maintain, and actively seek to improve, security measures and infrastructure designed to protect against unauthorized access to this sensitive data, cyber attacks and security breaches remain a significant threat to our business. Any security breach could result in the access, public disclosure, loss or theft of the confidential and personal data, including PHI, of our clients and WSEs, which could negatively affect our ability to attract new clients, cause existing clients to terminate their agreements with us, result in reputational damage and subject us to lawsuits, regulatory fines, or other actions or liabilities which could materially and adversely affect our business and operating results.
We are subject to various federal and state laws, rules, and regulations relating to the collection, use, and security of personal and confidential information. For example, most states and the District of Columbia have enacted breach notification laws that may require us to notify WSEs, clients, employees, or regulators in the event of unauthorized access to or disclosure of personal or confidential information. Complying with these various laws, and any new laws or regulations that may be promulgated, could cause us to incur substantial costs or require us to change our business practices in a manner adverse to our business. Changes or inconsistencies in interpretations of these laws and regulations and/or changes in enforcement priorities may result in significant penalties or liability for non-compliance.
RISK FACTORS | |
Unexpected changes in workers' compensation and health insurance claims by worksite employees could harm our business.
Our insurance costs, which make up a significant portion of our overall costs, are impacted significantly by our WSEs’ health and workers' compensation insurance claims experience. We establish reserves to provide for the estimated costs of reimbursing our workers' compensation and health insurance carriers under our insurance policies, relying on third-party actuaries and our own experience, but the volume and severity of claims activity is inherently unpredictable. If we experience a sudden or unexpected increase or decrease in claim activity, our costs could increase or decrease, respectively. An increase in claim activity could make it more difficult to secure replacement insurance policies on competitive terms once our current policies expire. Estimating these reserves involves our consideration of a number of factors and requires significant judgment. If there is an unexpected increase or decrease in the severity or frequency of claims activity of our WSEs (including activity arising from any of a number of factors that affect claim activity levels, such as changes in general economic conditions, claims differing significantly from expectations, and terrorism, disease outbreaks or other catastrophic events), or if we subsequently receive updated information indicating insurance claims were higher or lower than previously estimated and reported, our insurance costs could be higher or lower, respectively, in that period or subsequent periods as we adjust our reserves accordingly, which could have a material adverse effect on our business. We have experienced both favorable and unfavorable insurance cost variability due to claims activity in the past and could have similar or worse experience in the future.
Some of our health insurance policies include risk-based policies that can limit our exposure for individual claims and our maximum aggregate claims exposure in each policy year. Refer to Note 1 in Part II, Item 8 of this Form 10-K for further discussion of these policies. We have experienced variability, and may experience variability in the future, in the amounts that we are required to pay for group health insurance expenses incurred by WSEs within our deductible layer under these risk-based policies, based on continually changing trends in the frequency and severity of claims. These historical trends may change, and other seasonal trends and variability may develop, which may make it more difficult for us to manage this aspect of our business and which may have a material adverse effect on our business.
Our results of operations may fluctuate as a result of numerous factors, many of which are outside of our control.
Our future operating results are subject to quarterly variations based upon a variety of factors, many of which are not within our control, including, without limitation:
• | the volume and severity of health and workers' compensation insurance claims by our WSEs, recorded as part of our insurance costs, and the timing of related claims information provided by our insurance carriers, |
• | the amount and timing of our other insurance costs, operating expenses and capital expenditures, |
• | the number of our new clients initiating service and the number of WSEs employed by each new client, |
• | the retention, loss or merger of existing clients, |
• | reduction in the number of WSEs employed by existing clients, |
• | the timing of client payments and payment defaults by clients, |
• | costs associated with our acquisitions of companies, assets and technologies, |
• | payments or drawdowns on our credit facility, |
• | unanticipated expenses, such as litigation or other dispute-related settlement payments, |
• | expenses we incur for geographic and service expansion, |
• | changes in laws or adverse interpretation of laws increasing our regulatory compliance costs, |
• | changes in our effective tax rate, and |
• | the impact of new accounting pronouncements. |
RISK FACTORS | |
Many of the above factors are discussed in more detail elsewhere in this “Risk Factors” section and in Part II, Item 7 of this Form 10-K. Many of these factors are outside our control, and the variability and unpredictability of these factors have in the past and could in the future cause us to fail to meet our expectations and the expectations of investors and any industry analysts who cover our shares, which could result in a decline in our share price and reduced liquidity in our shares. In addition, the occurrence of one or more of these factors might cause our results of operations to vary widely, which could lead to negative impacts on our margins, short-term liquidity or ability to retain or attract key personnel, and could cause other unanticipated issues, including a downgrade of our shares by or change in opinion of industry analysts and a related decline in our share price. Accordingly, we believe that quarter-to-quarter and annual comparisons of our revenues, results of operations and cash flows may not be meaningful and should not be relied upon as an indication of our future performance.
Any failure in our business systems could reduce the quality of our business services, which could harm our reputation and expose us to liability.
Our business systems rely on the complex integration of numerous hardware and software subsystems to manage client transactions including the processing of employee, payroll and benefits data. These systems can be disrupted by, among other things, equipment failures, computer server or systems failures, network outages, malicious acts, software errors or defects, vendor performance problems, power failures, natural disasters, terrorist actions or similar events. Any delay or failure in our systems that impairs our ability to communicate electronically with our clients, employees, vendors or the government agencies to which we make tax and other filings on behalf of WSEs, or our ability to store or process data could harm our reputation and our business. For example, errors in our products and services, such as the erroneous denial of healthcare benefits or delays in making payroll, could expose our clients to liability claims from improperly serviced WSEs, for which we may be contractually obligated to provide indemnification.
In addition, the software, hardware and networking technologies we use must be frequently and rapidly upgraded in response to technological advances, competitive pressures consumer expectations and new and changing laws. To succeed, we need to effectively develop, or license from third parties, and integrate these new technologies as they become available to improve our services. We rely on enterprise software applications licensed from third parties that are upgraded from time to time. Any difficulties we encounter in adapting application upgrades to our systems could harm our performance, delay or prevent the successful development, introduction or marketing of new services.
New products or upgrades may not be released according to schedule, or may contain defects when released. Difficulties in integrating new technologies could result in adverse publicity, loss of sales, delay in market acceptance of our services, or client claims against us, any of which could harm our business. We could also incur substantial costs in modifying our services or infrastructure to adapt to these changes. In addition, we could lose market share if our competitors develop technologically superior products and services.
We have identified a material weakness in our internal control over financial reporting that could, if not remediated, result in a material misstatement in our financial statements.
In connection with the audit of our consolidated financial statements as of and for the year ended December 31, 2017, we have identified and concluded that we continue to have a material weakness relating to our internal control over financial reporting. A material weakness is a deficiency, or a combination of deficiencies, in internal control over financial reporting such that there is a reasonable possibility that a material misstatement of our annual or interim consolidated financial statements will not be prevented or detected on a timely basis. Refer to Part II, Item 9A in this Form 10-K for more details. While the material weakness described in that section creates a reasonable possibility that an error in financial reporting may go undetected, after extensive review and the performance of additional analysis and other procedures, no material adjustments, restatement or other revisions to our previously issued financial statements were required.
As further described in Part II, Item 9A of this form 10-K below, we are taking specific steps to remediate a material weakness that we identified by implementing and enhancing our control procedures. This material weakness will not be remediated until all necessary internal controls have been implemented, repeatably tested and determined to be operating effectively. In addition, we may need to take additional measures, including system migration and automation, to address the material weakness or modify the remediation steps, and we cannot be certain that the measures we have taken, and expect to take, to improve our internal controls will be sufficient to address the issues identified, to ensure that our internal controls are effective or to ensure that the identified material weakness will not result in a material misstatement of our annual or interim consolidated financial statements. Implementing any appropriate changes to our internal controls may distract our officers and employees and require material cost to implement new
RISK FACTORS | |
process or modify our existing processes. Moreover, other material weaknesses or deficiencies may develop or be identified in the future. If we are unable to correct material weaknesses or deficiencies in internal controls in a timely manner, our ability to record, process, summarize and report financial information accurately and within the time periods specified in the rules and forms of the U.S. Securities and Exchange Commission, will be adversely affected. This failure could negatively affect the market price and trading liquidity of our common stock, lead to delisting, cause investors to lose confidence in our reported financial information, subject us to civil and criminal investigations and penalties, and generally materially and adversely impact our business and financial condition.
We have acquired, and may in the future acquire, other businesses and technologies, which can divert management's attention and create integration risks and other risks for our business.
We have completed numerous acquisitions of other businesses and technologies, and we expect that we will continue to grow through similar future acquisitions. Such acquisitions involve numerous other risks, including:
• | identifying attractive acquisition candidates, |
• | over-valuing and over-paying for acquisition candidates, |
• | integrating the operations, systems, technologies, services and personnel of the acquired companies, including the migration of WSEs from an acquired company’s technology platform and legal service providers to ours, |
• | establishing or maintaining internal controls, procedures and policies relating to the acquired systems and processes, including the potential for actual or perceived control weaknesses associated with or arising from the acquisitions and integration of acquired systems, |
• | diversion of management’s attention from other business concerns, |
• | litigation resulting from activities of the acquired company, including claims from terminated employees, clients, former stockholders and other third parties, |
• | insufficient revenues to offset increased expenses associated with the acquisitions and unanticipated liabilities of the acquired companies, |
• | insufficient indemnification or security from the selling parties for legal liabilities that we may assume in connection with our acquisitions, |
• | entering markets in which we have no prior experience and may not succeed, |
• | potential loss of key employees of the acquired companies, and |
• | impairment of relationships with clients and employees of the acquired companies or our clients and employees as a result of the integration of acquired operations and new management personnel. |
If we fail to integrate newly acquired businesses effectively, we might not achieve the growth, service enhancement or operational efficiency objectives of the acquisitions, and our business, results of operations and financial condition could be harmed.
We may pay for acquisitions by issuing additional shares of our common stock, which would dilute our stockholders, or by issuing debt, which could include terms that restrict our ability to operate our business or pursue other opportunities and subject us to significant debt service obligations. We may also use significant amounts of cash to complete acquisitions. To the extent that we complete acquisitions in the future, we likely will incur future amortization expenses associated with the acquired assets. We may also record significant amounts of intangible assets, including goodwill, which could become impaired in the future. Any such impairment charges would adversely affect our results of operations.
RISK FACTORS | |
Our SMB clients are particularly affected by volatility in the financial and economic environment, which could harm our business.
Our clients are small and mid-sized businesses that we believe can be particularly susceptible to changes in the level of overall economic activity in the markets in which we operate. During periods of weak economic conditions, small business failures tend to increase and employment levels tend to decrease. Current or potential clients may react to weak or forecasted weak economic conditions by reducing employee headcount or wages, bonuses or benefits levels, any of which would affect our revenues, and may affect our margins, because we may be unable to reduce our operating expenses sufficiently enough or quickly enough to offset the drop in revenues. It is difficult for us to forecast future demand for our services due to the inherent difficulty in forecasting the direction, strength and length of economic cycles. These conditions may affect the willingness of our clients and potential clients to pay outside vendors for services like ours, and may impact their ability to pay their obligations to us on time, or at all.
For example, as a result of macroeconomic factors, interest rates may become more volatile. Increased interest rate volatility could also negatively impact our clients' and prospects' access to credit. If businesses have difficulty obtaining credit, business growth and new business formation may be impaired, which could also harm our business. Even modest downturns in economic activity on a regional or national level could have a material adverse effect on our financial condition or results of operations.
In addition, it can be difficult to predict the impact of developments that are perceived as positive for SMBs. For example, the passage of the TCJA in December 2017, may create unexpected challenges or business incentives for our clients and fail to translate into increased demand for our services.
Our business and operations have experienced rapid growth in the past, and if we are unable to effectively manage future growth, our business and results of operations may suffer.
We have experienced rapid growth and have significantly expanded our operations in recent periods, which has placed a strain on our management and our administrative, operational and financial infrastructure. Managing this growth will continue to require further refinement to our operational, financial and management controls and reporting systems and procedures while we simultaneously seek to effectively recruit, integrate, train and motivate new corporate employees, retain our existing corporate employees, maintain the beneficial aspects of our corporate culture, effectively execute our business plan, satisfy the requirements of our existing clients, acquire new clients, and enhance the quality and scope of our services. These activities will require significant operating and capital expenditures and allocation of valuable management and employee resources, and we expect that our growth will continue to place significant demands on our management and on our operational and financial infrastructure, all of which could have a material adverse effect on our business. If we fail to manage our growth effectively, our costs and expenses may increase more than we expect them to, which in turn could harm our business, financial condition and results of operations.
If our vertical strategy is unsuccessful, or if we are unable to manage our sales force effectively, we may not be able to grow our business at the rate that we anticipate.
We have developed an industry vertical business strategy and we plan to continue to devote significant resources and time in pursuit of this strategy. Under our industry vertical strategy, our sales force, product development, and service teams are focused on specific business sectors. We cannot assure you that our industry vertical approach will resonate with our existing and prospective clients, that we will target the right industries, that our vertical products will have all of the features most valuable to existing and prospective clients in those industries, or that we will implement our strategy in a timely and effective manner. If our vertical strategy is unsuccessful, our business may not grow at the rate that we anticipate, which could have a material adverse effect on our financial condition and results of operations.
We have experienced sales force attrition in the past and we rely on a well-trained sales force to promote our industry vertical strategy and sell our solutions. Competition for skilled sales personnel is intense, and we cannot assure you that we will be successful in attracting, training and retaining qualified sales personnel, or that our newly hired sales personnel, including our new sales leader, will function effectively, either individually or as a group. In addition, our newly hired sales personnel are typically not productive for some period of time following their hiring. This results in increased near-term costs to us relative to the sales contributions of these newly hired sales personnel. If we are unable to effectively train our sales force and benefit from greater productivity of our sales representatives, or if our sales force is otherwise unable to sell our solutions as we anticipate, our revenues likely will not increase at the rate that we anticipate, which could have a material adverse effect on our business, financial condition and results of operations.
RISK FACTORS | |
Most of our clients are concentrated in certain geographies and a relatively small number of industries, making us vulnerable to downturns in those geographies and industries.
Most of our clients are concentrated in certain geographies and operate in a relatively small number of industries, including the technology, life sciences, not-for-profit, professional services and financial services industries. As a result, if any of those geographic regions or specific industries suffers a downturn, the portion of our business attributable to clients in that region or industry could be adversely affected, which could have a material adverse effect on our financial condition or results of operations.
We are subject to legal proceedings that may result in adverse outcomes.
We are subject to claims, suits, government investigations, and proceedings arising from the ordinary course of our business. Refer to Note 13 in Part II, Item 8 of this Form 10-K for additional information about the legal proceedings we are currently involved in and future proceedings that we may face. Current and future legal proceedings may result in substantial costs and may divert management’s attention and resources, which may seriously harm our business, results of operations, financial condition and liquidity.
Changes in our income tax positions or adverse outcomes resulting from on-going or future tax audits, which could harm our business, operating results, financial condition and prospects.
Significant judgments and estimates are required in determining our provision for income taxes and other tax liabilities. Our provision for income taxes, results of operations and cash flows may be impacted if any of our tax positions are challenged and successfully disputed by the tax authorities. In determining the adequacy of our tax provision, we assess the likelihood of adverse outcomes that could result if our tax positions were challenged by the IRS and other tax authorities. The tax authorities in the U.S. regularly examine our income and other tax returns. Refer to Note 12 in Part II, Item 8 of this Form 10-K for additional details regarding our on-going tax examinations and disputes. The ultimate outcome of tax examinations and disputes cannot be predicted with certainty. Should the IRS or other tax authorities assess additional taxes as a result of these or other examinations, we may be required to record charges to operations that could have a material impact on our results of operations, financial position or cash flows.
Adverse changes in our insurance coverage, or in our relationships with key insurance carriers, could harm our business.
Our success depends in part on our ability to maintain competitive health and workers' compensation coverage options and insurance rates through well-known insurance carriers. If we are unable to maintain competitive insurance rates or obtain popular and desirable coverage plans through well-known insurance carriers, it could affect our ability to attract and retain clients, which would have a material adverse effect on our business. Where we sponsor insurance coverage and we are not responsible for any deductibles, our carriers set the premiums and the rates set by our carriers on these policies may not be competitive. Even where we sponsor insurance under which we are responsible for deductibles, we may not be able to control costs through the deductible layer in a way that would make our rates competitive.
In addition, broad adoption of our services in certain geographies or industries may make it more difficult for us to obtain competitive health and/or workers' compensation insurance rates due to concentration of clients within a particular geography or industry. The loss of any one or more of our key insurance vendors in these areas, or our inability to partner with certain vendors that are better-known or more desirable to our clients or potential clients, could have a material adverse effect on our financial condition and results of operations.
There is significant competition for our clients and clients may terminate our services based on a variety of factors that are difficult for us to control, which can negatively impact our business.
We regularly experience client attrition due to a variety of factors, including cost, client merger and acquisition activity, increases in administrative and insurance service fees, client business failure, effects of competition and clients deciding to bring their HR administration in-house. Our standard client service agreement can be cancelled by us or by the client without penalty with 30 days’ prior written notice. Clients who intend to cease doing business with us often elect to do so effective as of the beginning of a calendar year. As a result, we have historically experienced our largest concentration of client attrition in the first quarter of each year. In addition, we experience higher levels of client attrition in connection with renewals of the health insurance coverage we sponsor for WSEs in the event that such renewals result in increased costs. If we were to experience client attrition in excess of our historic annual attrition rate, it could have a material adverse effect on our business, financial condition and results of operations.
RISK FACTORS | |
We believe the principal competitive factors in our market include client satisfaction, ease of client setup and on-boarding, breadth and depth of benefit plans, vertical market expertise, total cost of service, brand awareness and reputation, ability to innovate and respond to client needs rapidly, online and mobile solutions, and subject matter expertise. If we are unable to develop products that appeal to our clients, and that respond to the specific needs of our clients, on a cost-effective basis, our overall client satisfaction may decline and our reputation may suffer, which could lead us to experience greater rates of attrition and lower rates for on-boarding new clients, which could have a material adverse effect on our business.
The terms of our credit facility may restrict our current and future operations, which would impair our ability to respond to changes in our business and to manage our business.
Our credit facility contains, and any future indebtedness of ours would likely contain, a number of restrictive covenants that impose significant operating and financial restrictions on us subject to customary exceptions, including restricting our ability to:
• | incur, assume or guarantee additional debt, |
• | pay dividends or distributions or redeem or repurchase capital stock, |
• | incur or assume liens, |
• | make loans, investments and acquisitions, |
• | engage in sales of assets and subsidiary stock, |
• | enter into sale-leaseback transactions, |
• | enter into certain transactions with affiliates, |
• | enter into certain hedging agreements, |
• | enter into new lines of business, |
• | prepay certain indebtedness, |
• | transfer all or substantially all of our assets or enter into merger or consolidation transactions with another person, and |
• | enter into agreements that prohibit the incurrence of liens or the payment by our subsidiaries of dividends and distributions. |
Our failure to comply with these restrictions and the other terms and conditions under our credit facility could result in a default, which in turn could result in the termination of the lenders’ commitments to extend further credit to us under our credit facility and acceleration of a substantial portion of our indebtedness then outstanding under our credit facility. If that were to happen, we may not be able to repay all of the amounts that would become due under our indebtedness or refinance our debt, which could materially harm our business and force us to seek bankruptcy protection.
Atairos, our largest stockholder, may have significant influence over our Company, and the existing ownership of capital stock, and thus the voting control, remains concentrated in our executive officers, directors and their affiliates, which limits your ability to influence corporate matters.
On February 1, 2017, an entity affiliated with Atairos Group, Inc. (together with its affiliates, “Atairos”) became our largest stockholder when it acquired the shares of TriNet common stock previously held by General Atlantic. In connection with this transaction, we appointed Michael J. Angelakis, the Chairman and CEO of Atairos, to our board of directors and agreed to nominate Mr. Angelakis or another designee of Atairos reasonably acceptable to our Nominating and Corporate Governance Committee for election at future annual meetings until Atairos’ beneficial ownership falls below 15% of our common stock. As of February 20, 2018, Atairos beneficially owned approximately 28% of our outstanding common stock, and all of our directors, officers and their affiliates, including Atairos, beneficially own, in the aggregate, approximately 38% of our outstanding common stock. As a result, of the foregoing, Atairos, particularly when acting with our executive officers, directors and their affiliates who beneficially owned in the aggregate, approximately 38% of our outstanding common stock, will be able to exert substantial influence on all matters requiring
RISK FACTORS | |
stockholder approval, including the election of directors and approval of significant corporate transactions, such as a merger or other sale of our company or its assets. This concentration of ownership could limit the ability of other stockholders to influence corporate matters and may have the effect of delaying or preventing a third party from acquiring control over us.
Our industry is highly competitive, which may limit our ability to maintain or increase our market share or improve our results of operations.
We face significant competition on a national and regional level from other professional employer organizations, as well as other existing, and potential, companies and industries that service, or may in the future service, client HR needs. Refer to the heading “Competition” under Item 1, Business, above for more details. Our competitors, regardless of industry, may have greater marketing and financial resources than we have, and may be better positioned than we are in certain markets. Increased competition in our industry could result in price reductions or loss of market share, any of which could harm our business. We expect that we will continue to experience competitive pricing pressure.
Moreover, we may not be successful in convincing potential clients that the use of our services is a superior, cost-effective means of satisfying their HR obligations relative to the way in which they currently satisfy these obligations either by themselves or by using the services of our competitors. If we cannot compete effectively against other professional employer organizations or against the alternative means by which companies meet their HR obligations, or if we are unable to convince clients or potential clients of the advantages of our offerings, our market share and business may suffer, resulting in a material, adverse effect on our financial condition and results of operations.
Item 1B. Unresolved Staff Comments
None.
PROPERTIES, LEGAL PROCEEDINGS AND MINE SAFETY DISCLOSURES | |
Item 2. Properties
We lease space for 49 offices in various states in the U.S., including the following:
Corporate: | Client Service Centers: |
• San Leandro, California | • Pleasanton, California |
• Bradenton, Florida | |
Technology Center: | • Reno, Nevada |
• Austin, Texas | • Fort Mill, South Carolina |
• New York, New York | |
All of these leases expire at various times up through 2028. We believe that our leases are sufficient for our current purposes and long-term growth and expansion goals.
Item 3. Legal Proceedings
For the information required in this section, refer to Note 13 in Part II, Item 8 of this Form 10-K.
Item 4. Mine Safety Disclosures
Not applicable.
STOCK ACTIVITIES | |
PART II
Item 5. Market for Registrant’s Common Equity, Related Stockholder Matters and Issuer Purchases of Equity Securities
Market Information and Holders of Record
Our common stock has been listed on the New York Stock Exchange under the symbol “TNET” since March 2014. The following table sets forth for the periods indicated the high and low sales prices per share of our common stock as reported on the New York Stock Exchange for the quarters indicated below:
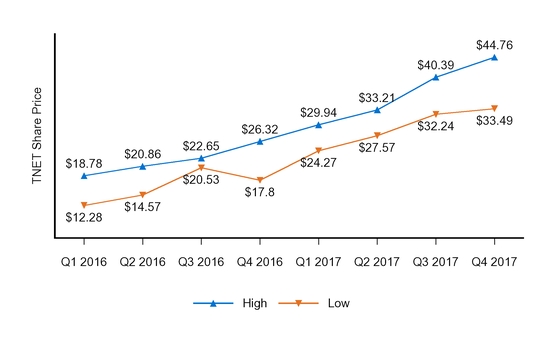
On February 20, 2018, the last reported sales price of our common stock on the New York Stock Exchange was $41.02 per share. As of February 20, 2018, we had 34 holders of record of our common stock per Computershare Trust Company N.A., our transfer agent. The actual number of stockholders is greater than this number of record holders, and includes stockholders who are beneficial owners, but whose shares are held in street name by brokers and other nominees. This number of holders of record also does not include stockholders whose shares may be held in trust by other entities.
For information regarding our equity-based incentive plans, please refer to Part III, Item 12 of this Form 10-K.
Dividend Policy
We did not declare or pay cash dividends in 2017 or 2016. Payment of cash dividends, if any, in the future will be at the discretion of our board of directors and will depend on then-existing conditions, including our financial condition, operating results, contractual restrictions under our credit facility (refer to Note 8 in Item 8 of this Form 10-K), capital requirements, business prospects and other factors our board of directors may deem relevant.
STOCK ACTIVITIES | |
Performance Graph
The following graph compares the cumulative return on our common stock since the initial public offering in March 2014 with the cumulative return on the S&P 500 Index and a Peer Group Index (1). The cumulative return is based on the assumption that $100 had been invested in TriNet Group, Inc. common stock, the Standard & Poor's 500 Stock Index (S&P 500) and common stock of members of the Peer Group Index, all on the date of TriNet's initial public offering in March 2014 and that all quarterly dividends were reinvested. The cumulative dollar returns shown on the graph represent the value that such investments would have had at each quarter end.
COMPARISON OF 45 MONTH CUMULATIVE TOTAL RETURN
Among TriNet Group, Inc., the S&P 500 Index, and a Peer Group(1)
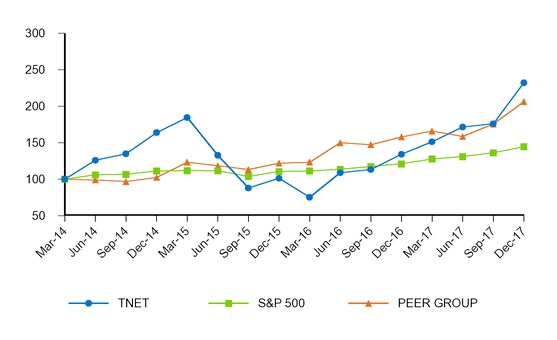
(1) The Peer Group Index consists of the following companies:
Automatic Data Processing, Inc. | Insperity, Inc. | Paychex, Inc. |
Barrett Business Services, Inc. | Intuit, Inc. | |
STOCK ACTIVITIES | |
Issuer Purchases of Equity Securities
We repurchased a total of approximately $44 million of our outstanding common stock in 2017 using existing cash and cash equivalents balances through our Rule 10b5-1 plan. In December 2017, our board of directors approved a $120 million incremental increase to our ongoing stock repurchase program, resulting in approximately $136 million remaining available for repurchases under all authorizations approved by the board of directors as of December 31, 2017. Stock repurchases under the program are primarily intended to offset the dilutive effect of share-based employee incentive compensation.
The following table provides information about our purchases of TriNet common stock during the fourth quarter of 2017:
Period | Total Number of Shares Purchased (1) | Average Price Paid Per Share | Total Number of Shares Purchased as Part of Publicly Announced Plans (2) | Approximate Dollar Value of Shares that May Yet Be Purchased Under the Plans (in millions) (2) | ||||||
October 1 - October 31, 2017 | 90,793 | $ | 34.41 | 89,407 | $ | 18 | ||||
November 1 - November 30, 2017 | 112,208 | $ | 41.02 | 31,070 | $ | 16 | ||||
December 1 - December 31, 2017 | 410 | $ | 43.13 | — | $ | 136 | ||||
Total | 203,411 | 120,477 | ||||||||
(1) Includes shares surrendered by employees to us to satisfy tax withholding obligations that arose upon vesting of restricted stock units granted pursuant to approved plans.
(2) We repurchased a total of approximately $4 million of our outstanding stock during the three months ended December 31, 2017.
Our stock repurchases and dividends are subject to certain restrictions under the terms of our credit facility. For more information about our stock repurchases and dividend restrictions, refer to Note 8 and Note 9 in Item 8 of this Form 10-K.
SELECTED FINANCIAL DATA | |
Item 6. Selected Financial Data
The following selected consolidated financial and other data should be read in conjunction with Item 7. Management’s Discussion and Analysis of Financial Condition and Results of Operations as well as our audited consolidated financial statements and related notes included in Item 8 of this Form 10-K.
Year Ended December 31, | |||||||||||||||
(in millions, except per share data) | 2017 | 2016 | 2015 | 2014 | 2013 | ||||||||||
Income Statement Data: | |||||||||||||||
Total revenues | $ | 3,275 | $ | 3,060 | $ | 2,659 | $ | 2,194 | $ | 1,644 | |||||
Operating income | 217 | 124 | 78 | 87 | 66 | ||||||||||
Net income | 178 | 61 | 32 | 15 | 13 | ||||||||||
Diluted net income per share of common stock | 2.49 | 0.85 | 0.44 | 0.22 | 0.24 | ||||||||||
Non-GAAP measures (1): | |||||||||||||||
Net Service Revenues (1) | 809 | 646 | 547 | 508 | 417 | ||||||||||
Net Insurance Service Revenues (1) | 351 | 199 | 146 | 166 | 145 | ||||||||||
Adjusted EBITDA (1) | 285 | 185 | 151 | 165 | 136 | ||||||||||
Adjusted Net income (1) | 142 | 87 | 71 | 74 | 57 | ||||||||||
Balance Sheet Data: | |||||||||||||||
Cash and cash equivalents | $ | 336 | $ | 184 | $ | 166 | $ | 134 | $ | 94 | |||||
Working capital | 234 | 156 | 112 | 121 | 82 | ||||||||||
Total assets | 2,593 | 2,095 | 2,092 | 2,341 | 1,435 | ||||||||||
Notes payable | 423 | 459 | 494 | 545 | 819 | ||||||||||
Total liabilities | 2,387 | 2,060 | 2,084 | 2,366 | 1,705 | ||||||||||
Convertible preferred stock | — | — | — | — | 123 | ||||||||||
Total stockholders’ equity (deficit) | 206 | 35 | 8 | (25 | ) | (393 | ) | ||||||||
Cash Flow Data: | |||||||||||||||
Net cash provided by operating activities (2) | $ | 253 | $ | 149 | $ | 151 | $ | 162 | $ | 116 | |||||
Net cash used in investing activities | (24 | ) | (27 | ) | (38 | ) | (45 | ) | (212 | ) | |||||
Net cash provided by (used in) financing activities (2) | (77 | ) | (104 | ) | (81 | ) | (76 | ) | 127 | ||||||
(1) | Refer to Non-GAAP Financial Measures section on the following pages for definitions and reconciliations from GAAP measures. |
(2) | Prior years' balances have been retrospectively adjusted for Accounting Standards Update (ASU) 2016-09. Refer to Note 1 in Item 8 of this Form 10-K for details. |
SELECTED FINANCIAL DATA | |
Significant Transactions Affecting Comparability Between Periods
Business Acquisitions | Equity and Debt Activities | ||
2014 | None | • In March, we completed our initial public offering (IPO) by issuing 15,000,000 shares of common stock and received $217 million net proceeds. • As a result of the IPO, all our shares of preferred stock were converted into common stock. • With the IPO proceeds, the outstanding second lien term loan of $190 million was fully paid off. | |
2013 | • We acquired Ambrose for a total of $195 million. | • The board of directors declared and paid total special dividends of $358 million. • In August, the outstanding credit facility was amended and restated with: - A $750 million first lien credit facility including a $175 million three- year term loan (B-1 term loan), a $455 million seven-year term loan (B-2 term loan) and a $75 million revolving facility, and - A $190 million second lien seven-year-six-month term loan. | |
Non-GAAP Financial Measures
In addition to financial measures presented in accordance with U.S. Generally Accepted Accounting Principles (GAAP), we monitor other non-GAAP financial measures that we use to manage our business, make planning decisions, allocate resources and as performance measures in our executive compensation plan. These key financial measures provide an additional view of our operational performance over the long-term and provide useful information that we use in order to maintain and grow our business.
The presentation of these non-GAAP financial measures is used to enhance the understanding of certain aspects of our financial performance. It is not meant to be considered in isolation, superior to, or as a substitute for the directly comparable financial measures prepared in accordance with GAAP.
SELECTED FINANCIAL DATA | |
Non-GAAP Measure | Definition | How We Use The Measure |
Net Service Revenues | • Sum of professional service revenues and Net Insurance Service Revenues, or total revenues less insurance costs. | • Provides a comparable basis of revenues on a net basis. Professional service revenues are represented net of client payroll costs whereas insurance service revenues are presented gross of insurance costs for financial reporting purposes. • Acts as the basis to allocate resources to different functions and evaluates the effectiveness of our business strategies by each business function. • Provides a measure, among others, used in the determination of incentive compensation for management. |
Net Insurance Service Revenues | • Insurance revenues less insurance costs. | • Is a component of Net Service Revenues. • Provides a comparable basis of revenues on a net basis. Professional service revenues are represented net of client payroll costs whereas insurance service revenues are presented gross of insurance costs for financial reporting purposes. Promotes an understanding of our insurance services business by evaluating insurance service revenues net of WSE related costs which are substantially pass-through for the benefit of WSEs. Under GAAP, insurance service revenues and costs are recorded gross as we have latitude in establishing the price, service and supplier specifications. |
Adjusted EBITDA | • Net income, excluding the effects of: - income tax provision, - interest expense, - depreciation, - amortization of intangible assets, - stock-based compensation expense and, - in 2014, secondary offering costs related to offering of shares from existing stockholders. | • Provides period-to-period comparisons on a consistent basis and an understanding as to how our management evaluates the effectiveness of our business strategies by excluding certain non-cash charges such as depreciation and amortization that have fluctuated significantly over the past five years, and stock-based compensation recognized based on the estimated fair values. We believe these charges are not directly resulting from our core operations or indicative of our ongoing operations. • Enhances comparisons to prior periods and, accordingly, facilitates the development of future projections and earnings growth prospects. • Provides a measure, among others, used in the determination of incentive compensation for management. |
Adjusted Net Income | • Net income, excluding the effects of: - effective income tax rate (1), - stock-based compensation, - amortization of intangible assets, - non-cash interest expense (2), - debt prepayment premium, - in 2014, secondary offering costs related to offering of shares from existing stockholders, and - the income tax effect (at our effective tax rate (1)) of these pre-tax adjustments. | • Provides information to our stockholders and board of directors to understand how our management evaluates our business, to monitor and evaluate our operating results, and analyze profitability of our ongoing operations and trends on a consistent basis by excluding certain non-cash charges as described above, debt payment premiums and our secondary offering costs as these are not directly resulting from our core operations or indicative of our ongoing operations. |
(1) | As a of result changes in state income taxes from an increase in excludable income for state income tax purposes or state legislative changes, we have adjusted our non-GAAP effective tax rate to 41%, 43%, 42%, 40% and 40% for 2017, 2016, 2015, 2014 and 2013, respectively. These non-GAAP effective tax rates exclude the income tax impact from stock-based compensation, changes in uncertain tax positions and nonrecurring benefits or expenses from federal legislative changes. |
(2) | Non-cash interest expense represents amortization and write-off of our debt issuance costs. |
SELECTED FINANCIAL DATA | |
Reconciliation of GAAP to Non-GAAP Measures
The table below presents a reconciliation of total revenues to Net Service Revenues:
Year Ended December 31, | |||||||||||||||
(in millions) | 2017 | 2016 | 2015 | 2014 | 2013 | ||||||||||
Total revenues | $ | 3,275 | $ | 3,060 | $ | 2,659 | $ | 2,194 | $ | 1,644 | |||||
Less: Insurance costs | 2,466 | 2,414 | 2,112 | 1,686 | 1,227 | ||||||||||
Net Service Revenues | $ | 809 | $ | 646 | $ | 547 | $ | 508 | $ | 417 | |||||
The table below presents a reconciliation of insurance service revenues to Net Insurance Service Revenues:
Year Ended December 31, | |||||||||||||||
(in millions) | 2017 | 2016 | 2015 | 2014 | 2013 | ||||||||||
Insurance service revenues | $ | 2,817 | $ | 2,613 | $ | 2,258 | $ | 1,852 | $ | 1,372 | |||||
Less: Insurance costs | 2,466 | 2,414 | 2,112 | 1,686 | 1,227 | ||||||||||
Net Insurance Service Revenues | $ | 351 | $ | 199 | $ | 146 | $ | 166 | $ | 145 | |||||
The table below presents a reconciliation of net income to Adjusted EBITDA and Adjusted EBITDA Margin:
Year Ended December 31, | |||||||||||||||
(in millions) | 2017 | 2016 | 2015 | 2014 | 2013 | ||||||||||
Net income | $ | 178 | $ | 61 | $ | 32 | $ | 15 | $ | 13 | |||||
Provision for income taxes | 22 | 43 | 28 | 18 | 8 | ||||||||||
Stock-based compensation | 32 | 26 | 18 | 11 | 6 | ||||||||||
Interest expense and bank fees | 20 | 20 | 19 | 54 | 46 | ||||||||||
Depreciation | 28 | 19 | 15 | 14 | 12 | ||||||||||
Amortization of intangible assets | 5 | 16 | 39 | 52 | 51 | ||||||||||
Secondary offering costs | — | — | — | 1 | — | ||||||||||
Adjusted EBITDA | $ | 285 | $ | 185 | $ | 151 | $ | 165 | $ | 136 | |||||
Adjusted EBITDA Margin (1) | 35 | % | 29 | % | 28 | % | 33 | % | 33 | % | |||||
(1) Adjusted EBITDA Margin is calculated as the ratio of Adjusted EBITDA to Net Service Revenues
The table below presents a reconciliation of net income to Adjusted Net Income:
Year Ended December 31, | |||||||||||||||
(in millions) | 2017 | 2016 | 2015 | 2014 | 2013 | ||||||||||
Net income | $ | 178 | $ | 61 | $ | 32 | $ | 15 | $ | 13 | |||||
Effective income tax rate adjustment | (59 | ) | (1 | ) | 3 | 5 | — | ||||||||
Stock-based compensation | 32 | 26 | 18 | 11 | 6 | ||||||||||
Amortization of intangible assets | 5 | 16 | 39 | 52 | 51 | ||||||||||
Non-cash interest expense | 2 | 4 | 4 | 22 | 14 | ||||||||||
Debt prepayment premium | — | — | — | 4 | — | ||||||||||
Secondary offering costs | — | — | — | 1 | — | ||||||||||
Income tax impact of pre-tax adjustments | (16 | ) | (19 | ) | (25 | ) | (36 | ) | (27 | ) | |||||
Adjusted Net Income | $ | 142 | $ | 87 | $ | 71 | $ | 74 | $ | 57 | |||||
MANAGEMENT'S DISCUSSION AND ANALYSIS | |
Item 7. Management’s Discussion and Analysis of Financial Condition and Results of Operations
Significant Developments in 2017
Our consolidated results for our 2017 fiscal year reflect continued progress for our vertical products and insurance service offerings combined with higher WSE enrollment growth within our medical plans and slower growth in insurance costs, which were primarily attributable to reduced health and workers' compensation costs.
In summary, we:
• | Made significant investments in our technology platform to provide our users with improved functionality, including online and mobile productivity tools, and to allow our platform to integrate more effectively with third party software applications. This improves our client experience and permits further operational scale in the future. |
• | Launched and began on-boarding clients to TriNet Main Street, our vertical offering designed for clients in the hospitality, retail and manufacturing industries. During the third quarter, we started migrating existing clients from our legacy (SOI) platform onto our common TriNet platform. |
• | Leveraged our scale by decreasing administrative costs associated with our insurance programs. As a result of these efforts and our 2017 favorable insurance experience, we launched a fee credit initiative that was designed to reward certain clients. The total amount of credit was less than 0.5% of total 2017 revenue. Eligible clients will receive the fee credit in the first quarter of 2018. |
• | Changed the contract terms with one of our health insurance carriers from a guaranteed-cost arrangement to an arrangement that continues to be fully insured, but where we will be responsible for reimbursement of claim payments within our deductible layer as further discussed below. |
• | Invested significantly in improving our internal control environment to support the compliance requirements of Sarbanes-Oxley Act of 2002 (SOX). |
Performance Highlights
Our financial revenue and earnings performance exceeded our expectations, which was primarily attributable to slower than expected growth in insurance costs. The insurance cost savings were driven by reduced administrative costs and lower than forecast per enrollee medical costs. Our per enrollee aggregate trailing twelve month medical cost trend (medical cost trend) was in the range of 3.5% to 4%. We attribute the lower medical cost trend to both lower medical utilization and reduced prescription drug price increases.
Our insurance service revenues benefited from 5% additional enrollment in our health insurance offerings. Insurance service revenue also benefited from our workers' compensation service revenue repricing efforts for certain clients based on their long term claim experience.
We experienced a decline in Average WSEs compared to 2016 due to our continued migration from legacy platforms to our common TriNet platform and due to moderated new customer growth as we launched and expanded the functionality of TriNet Main Street.
Our other operating expenses reflect our continued focus on developing new vertical products and platform integrations, and additional expenses associated with our internal control remediation efforts.
In 2017, we:
• | served approximately 14,800 clients, co-employed approximately 325,000 WSEs, and our Total WSEs decreased 4% over 2016 |
• | processed over $37.1 billion in payroll and payroll tax payments for our clients in 2017 with an increase of 8% over 2016, |
MANAGEMENT'S DISCUSSION AND ANALYSIS | |
Our financial highlights for the 2017 year include:
• | Total revenues increased 7% to $3.3 billion, while Net Service Revenues increased 25% to $809 million, |
• | Operating income increased 75% to $217 million, |
• | our effective tax rate decreased to 11%, |
• | Net income increased 190% to $178 million, or $2.49 per diluted share, while Adjusted Net Income increased 62% to $142 million, |
• | Adjusted EBITDA increased 53% to $285 million, and |
• | Cash provided by operating activities increased 70% to $253 million. |
Our Technology
We made significant investments in our technology platform to provide our users with improved functionality, including online and mobile productivity tools, and to allow our platform to integrate more effectively with third party software applications. In addition, we invested in a common technology platform as it allows us to offer industry–specific solutions in a scalable manner while delivering frequent enhancements that benefit all clients. We continued to consolidate our remaining legacy acquired platform (SOI) onto our common TriNet platform.
For 2017, our systems development and programming costs were $45 million, representing 1% of our total revenues and 6% of our Net Service Revenues. Combined with our technology related capital expenditures, our total technology investment was $74 million, representing 2% of our total revenues and 9% of our Net Service Revenues.
We plan to continue to invest to upgrade and improve technology offerings, including enhancements of our online interface and mobile applications to provide better client and individual WSE experience.
Insurance
We are committed to utilizing our scale to improve the cost and service offerings in our competitive insurance services.
We leverage the size and scale of our installed WSE-base to negotiate with both incumbent and new insurance providers in our major medical programs as well as property and casualty lines. Our negotiations with insurance providers and a one year suspension of a tax on health insurance premiums resulted in our reduction in our administrative costs.
While we continue to leverage our size with insurance carriers to negotiate further reductions in our administrative costs, we expect our medical cost trends to revert to long term averages in 2018. We will also expect the re-introduction of the healthcare tax on premiums we pay our insurance providers.
Our fully insured insurance plans are provided by third-party insurance carriers under risk-based or guaranteed-cost insurance policies. Under risk-based policies, we agree to reimburse our carriers for any claims paid within an agreed-upon per-person deductible layer up to a maximum aggregate exposure limit per policy. These deductible dollar limits and maximum limits vary by carrier and year. Under guaranteed-cost policies, our carriers establish the premiums and we are not responsible for any deductible.
Approximately 70% of our group health insurance costs related to risk-based plans. The remaining 30% of our group health insurance costs related to guaranteed-cost plans.
In October, we changed the contract terms with one of our health insurance carriers from a guaranteed-cost to a risk-based plan. In 2018, with this new arrangement in effect, we expect that risk-based policies will represent approximately 85% of our health insurance costs and guaranteed cost policies will represent approximately 15% of our health insurance costs.
We also introduced additional service and benefit offerings including a premier medical second opinion program as well as a new suite of complementary voluntary benefits. These voluntary benefits are intended to provide our WSEs with additional protections for unexpected life events.
MANAGEMENT'S DISCUSSION AND ANALYSIS | |
Our Vertical Approach
We introduced our fifth TriNet vertical product, TriNet Main Street, to service the needs of industries such as hospitality, retail, and manufacturing. TriNet Main Street is designed to accommodate organizations with employee bases which include salaried, hourly, part time and seasonal workers, and typically operate in multiple states, locations, and facility types. TriNet Main Street delivers time and attendance expertise, hiring and termination expertise, workers’ compensation safety consultants, and attractive benefit plans.
We believe our vertical approach is an important competitive differentiator for TriNet and delivers significant benefits to our clients.
Revenues diverge by industry vertical due to pricing differences across our HR solutions and services and the degree to which clients and WSEs elect to participate in our solutions. We also focus on pricing strategies and product differentiation to maximize our revenue opportunities.
Our People
As we grow, we continue to invest in our corporate employees and their capabilities.
We increased headcount in our technology and client service functions to support product delivery and platform integration and support our migration of clients from legacy platforms to the TriNet platform. We also continued to invest in growing our sales functions, hiring and retaining sales representatives with industry experience. From 2016 to 2017, we incurred additional compensation costs of $41 million.
We will continue to search, select and hire people to serve our current clients and find new clients as our business grows and add to our skills and capabilities in order to provide innovative HR solutions for our clients.
MANAGEMENT'S DISCUSSION AND ANALYSIS | |
Results of Operations
The following table summarizes our results of operations for the three years ended December 31, 2017, 2016 and 2015. For details of the critical accounting judgments and estimates that could affect the Results of Operations, see the Critical Accounting Judgments and Estimates section within Management's Discussion and Analysis (MD&A).
Year Ended December 31, | % Change | ||||||||||||
(in millions, except operating metrics data) | 2017 | 2016 | 2015 | 2017 vs. 2016 | 2016 vs. 2015 | ||||||||
Income Statement Data: | |||||||||||||
Professional service revenues | $ | 458 | $ | 447 | $ | 401 | 3 | % | 11 | % | |||
Insurance service revenues | 2,817 | 2,613 | 2,258 | 8 | 16 | ||||||||
Total revenues | 3,275 | 3,060 | 2,659 | 7 | 15 | ||||||||
Insurance costs | 2,466 | 2,414 | 2,112 | 2 | 14 | ||||||||
Other Operating Expenses | 559 | 487 | 415 | 15 | 18 | ||||||||
Depreciation | 28 | 19 | 15 | 45 | 32 | ||||||||
Amortization of intangible assets | 5 | 16 | 39 | (67 | ) | (59 | ) | ||||||
Total costs and operating expenses | 3,058 | 2,936 | 2,581 | 4 | 14 | ||||||||
Operating income | 217 | 124 | 78 | 75 | 58 | ||||||||
Other income (expense) | (17 | ) | (20 | ) | (18 | ) | (10 | ) | 7 | ||||
Income before provision for income taxes | 200 | 104 | 60 | 91 | 74 | ||||||||
Income tax expense | 22 | 43 | 28 | (50 | ) | 52 | |||||||
Net income | $ | 178 | $ | 61 | $ | 32 | 190 | % | 94 | % | |||
Non-GAAP measures (1): | |||||||||||||
Net Service Revenues | $ | 809 | $ | 646 | $ | 547 | 25 | % | 18 | % | |||
Net Insurance Service Revenues | 351 | 199 | 146 | 76 | 37 | ||||||||
Adjusted EBITDA | 285 | 185 | 151 | 53 | 23 | ||||||||
Adjusted Net income | 142 | 87 | 71 | 62 | 24 | ||||||||
Operating Metrics: | |||||||||||||
Total WSEs payroll and payroll taxes processed (in millions) | $ | 37,115 | $ | 34,281 | $ | 30,559 | 8 | % | 12 | % | |||
Total WSEs | 325,370 | 337,885 | 324,399 | (4 | ) | 4 | |||||||
Average WSEs | 324,679 | 326,850 | 303,917 | (1 | ) | 8 | |||||||
(1) | Refer to Non-GAAP measures definitions and reconciliations from GAAP measures in Item 6. Selected Financial Data. |
MANAGEMENT'S DISCUSSION AND ANALYSIS | |
Operating Metrics
Worksite Employees (WSE)
Historically, Total WSEs comparisons have served as an indicator of our success in growing our business and retaining clients. Average WSE change is another volume measure we use to monitor the performance of our business.
Average WSEs decreased 1% in 2017 but increased 8% in 2016. The decline in our Average WSE growth rate is a result of attrition, including attrition from migrating our clients to a common platform, partially offset by WSE growth in our established customer base. Furthermore, we moderated our new customer growth as we expanded the functionality of our new industry vertical, TriNet Main Street.
Anticipated revenues for future periods can diverge from Total WSEs due to pricing differences across our HR solutions and services and the degree to which clients and WSEs elect to participate in our solutions. As we present our growth by WSE, the additional volume growth we obtain from the different WSE participation in our major services or vertical products is reported as a change in mix.
In addition to driving the growth in WSE count, we also focus on pricing strategies and product differentiation to maximize our revenue opportunities. Average monthly total revenues per WSE, as a measure to monitor the success of such pricing strategies, has increased 8% in 2017 versus an increase of 7% in 2016.
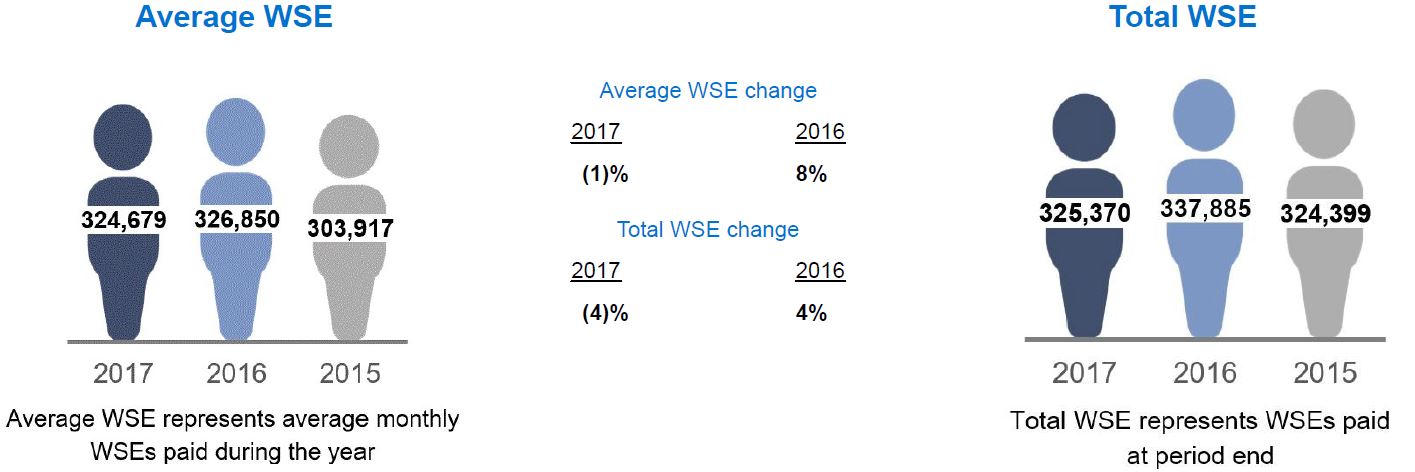
MANAGEMENT'S DISCUSSION AND ANALYSIS | |
Revenues and Income
Our revenues consist of professional service revenues (PSR) and insurance service revenues (ISR). Professional service revenues represent fees charged to clients for processing payroll-related transactions on behalf of our clients, access to our HR expertise, employment and benefit law compliance services and other HR related services. Insurance service revenues consist of insurance-related billings and administrative fees collected from clients and withheld from WSEs for workers' compensation insurance and health benefit insurance plans provided by third-party insurance carriers.
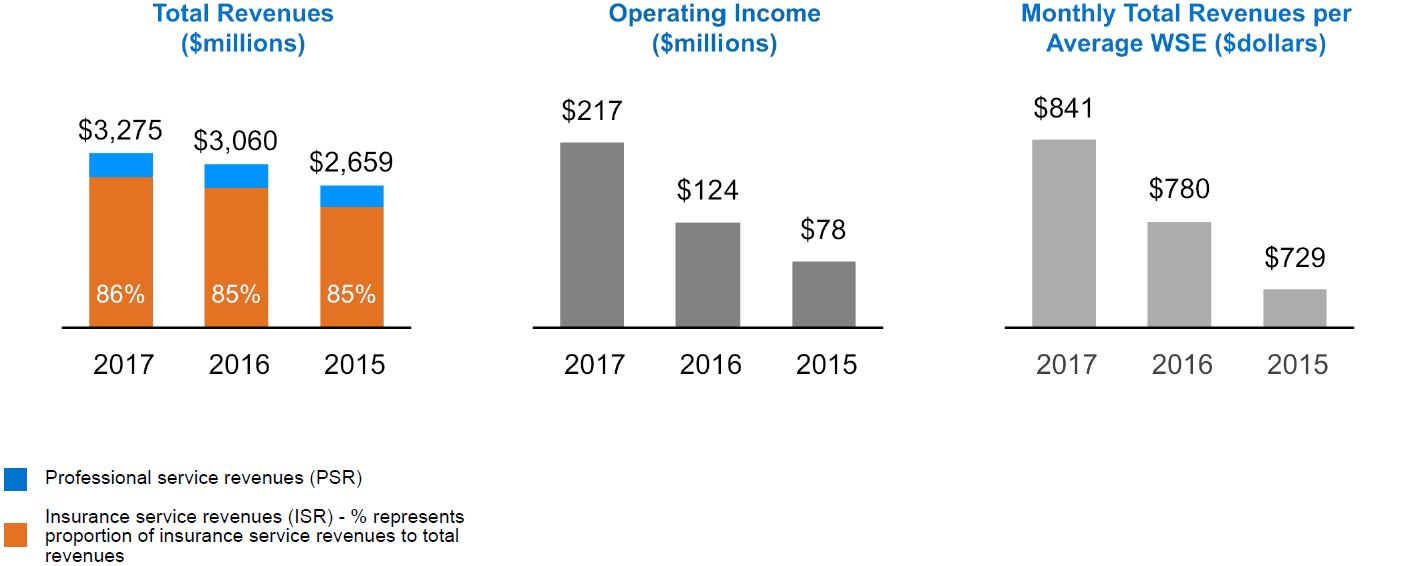
2017 - 2016 Commentary
Total revenues were $3.3 billion, a 7% increase from 2016:
• | Insurance service revenues increased 8% over 2016 to $2.8 billion due to increased participation in our health plans combined with an increase in health insurance service fees per plan participant. |
• | Professional service revenues were $458 million, an increase of 3% over 2016. |
Operating income was $217 million, a 75% increase from 2016, primarily due to improvement in our Net Insurance Service Revenues, partially offset by a 15% increase in other operating expenses to support our initiatives and additional costs associated with our internal control remediation efforts. Refer to the Other Operating Expenses section in this Results of Operations for further detail.
2016 - 2015 Commentary
Total revenues in 2016 were $3.1 billion, a 15% increase from 2015:
• | Insurance service revenues grew 16% over 2015 to $2.6 billion. |
• | Professional service revenues were $447 million, an increase of 11% over 2015. |
Operating income was $124 million and 58% better than 2015, primarily due to improvement in our insurance service revenues, partially offset by an 18% increase in other operating expenses used to support our growth. Refer to the Other Operating Expenses section in this Results of Operations for further detail.
MANAGEMENT'S DISCUSSION AND ANALYSIS | |
Net Service Revenues
Net Service Revenues (total revenues less insurance costs) provides a comparable basis of revenues on a net basis, acts as the basis to allocate resources to different functions and helps us evaluate the effectiveness of our business strategies by each business function.
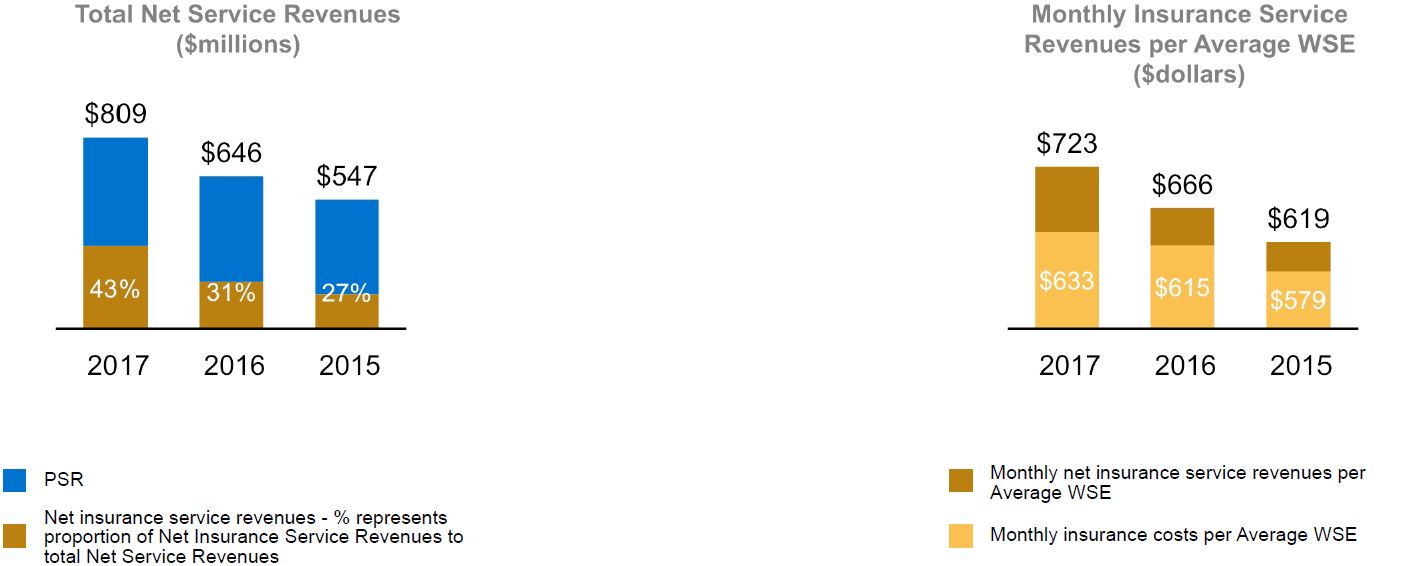
2017 - 2016 Commentary
Net Service Revenues were $809 million for 2017 representing a 25% increase from 2016. This was driven by an increase in Net Insurance Service Revenues, which grew 76% over 2016. Insurance service revenues per Average WSE increased 9%, while insurance costs per Average WSE increased 3%.
2016 - 2015 Commentary
Net Service Revenues was $646 million representing an 18% increase from 2015. Net Insurance Service Revenues represented 31% of Net Service Revenues and grew 37% over 2015 with insurance service revenues per Average WSE increasing by 8% but Insurance Costs per Average WSE increasing by only 6%.
MANAGEMENT'S DISCUSSION AND ANALYSIS | |
Professional Service Revenues (PSR)
Our clients are billed either based on a fee per WSE per month per transaction or on a percentage of the WSEs’ payroll. Payroll and payroll taxes processed is also an indicator of our PSR growth.
Our investment in a vertical approach provides us the flexibility to offer clients in different industries with different services at different prices.
We believe that this vertical approach will allow us to address specific needs for clients in different industries, which we believe will improve our revenue retention rate, but potentially reduces the value of using WSEs as the only leading indicator of future revenue performance.
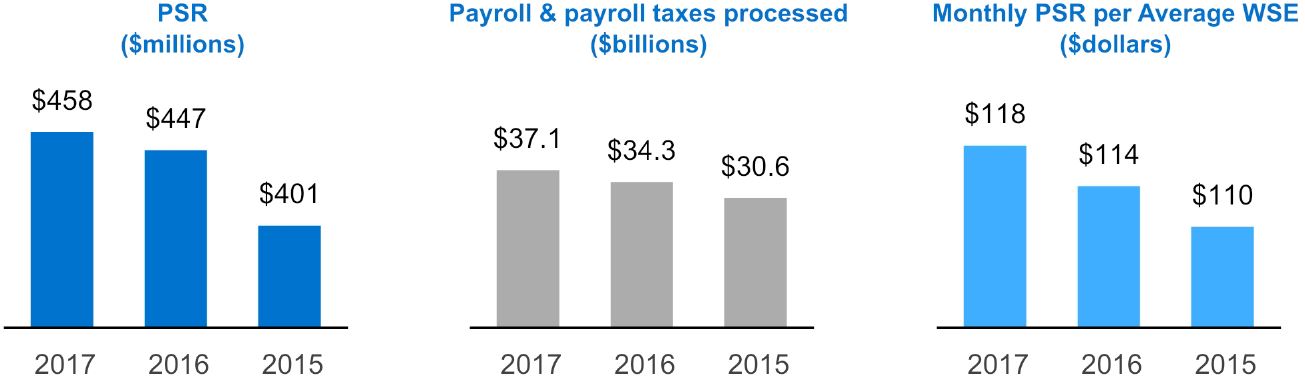
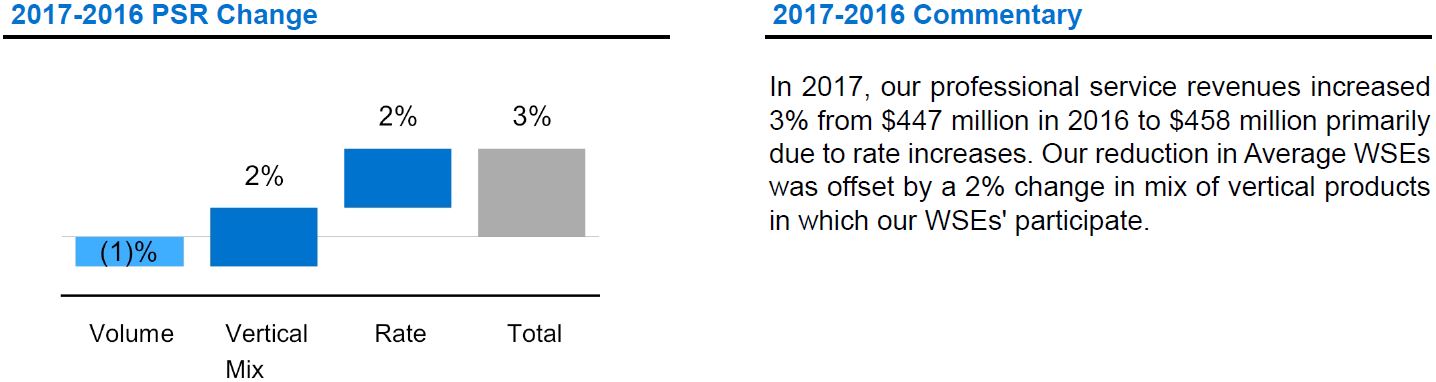
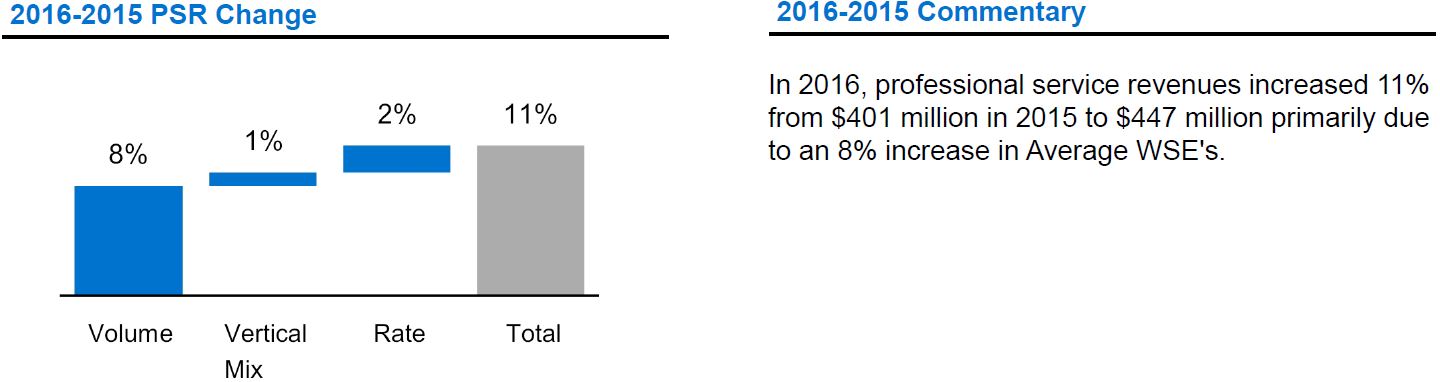
MANAGEMENT'S DISCUSSION AND ANALYSIS | |
Insurance Service Revenues (ISR)
Insurance service revenues consist of insurance-related billings and administrative fees collected from clients and withheld from WSEs for workers' compensation insurance and health benefit insurance plans provided by third-party insurance carriers.
Insurance service revenues represented 86% of total revenues with growth of 8% in 2017 versus 16% in 2016.
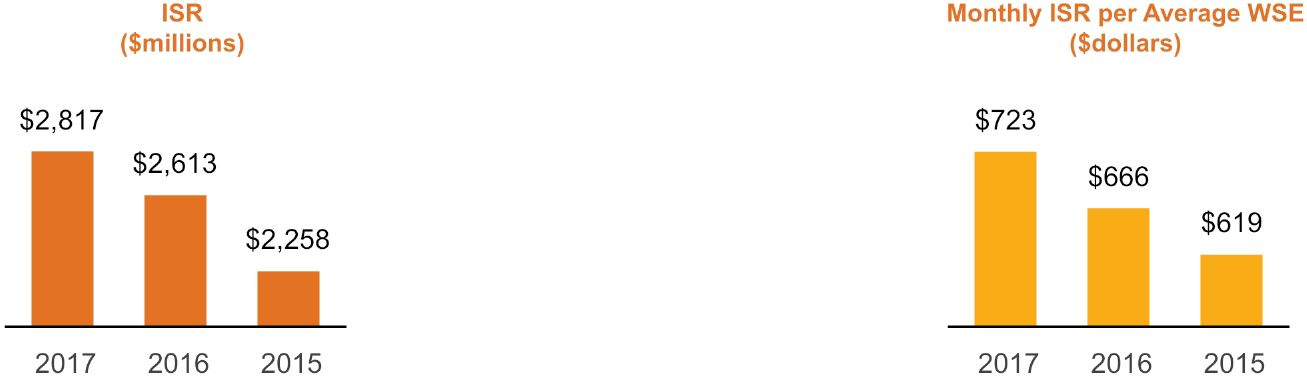
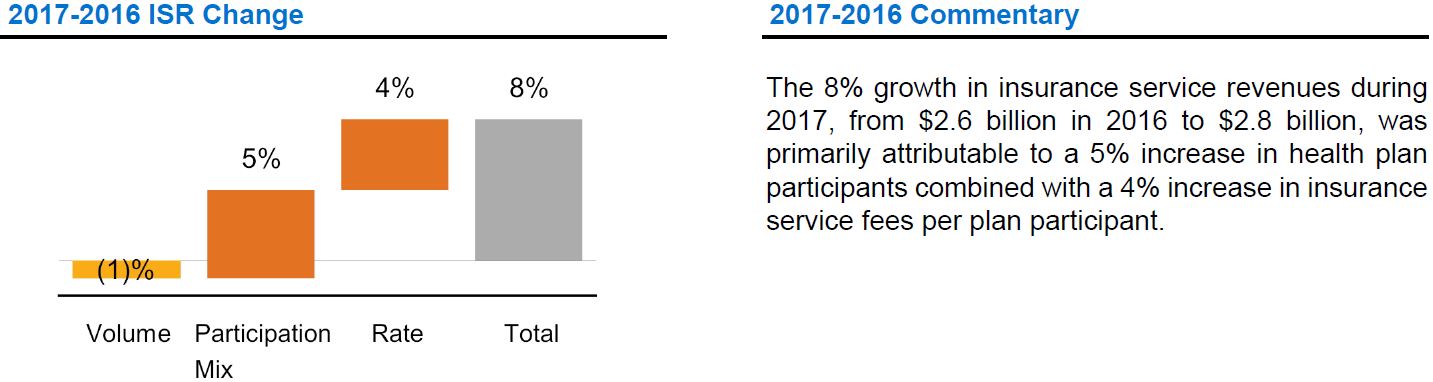
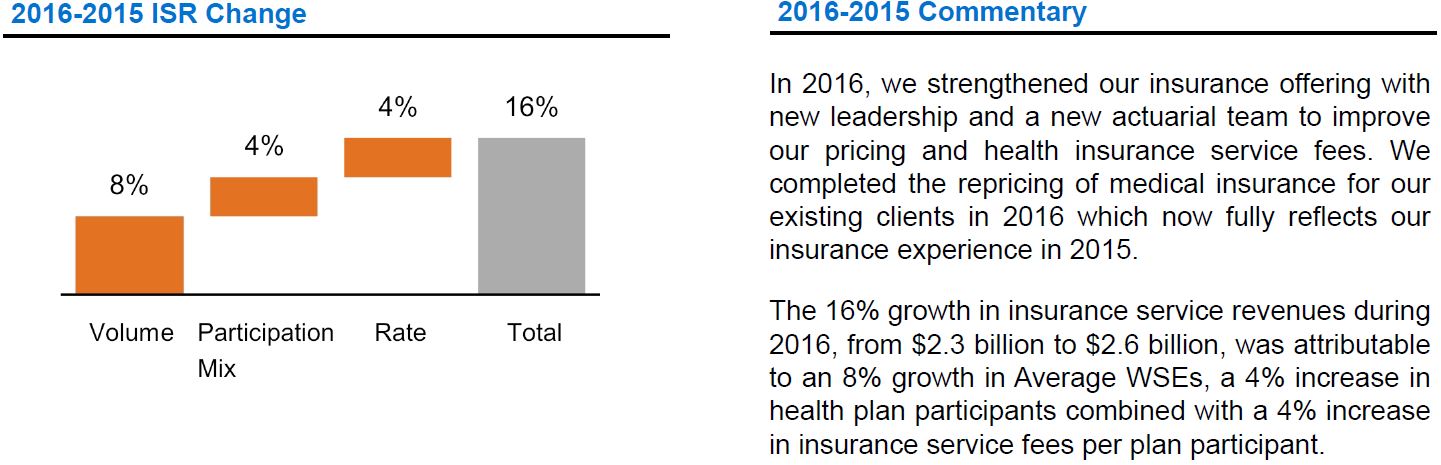
MANAGEMENT'S DISCUSSION AND ANALYSIS | |
Insurance Costs
Insurance costs include insurance premiums for coverage provided by insurance carriers, reimbursement of claims payments made by insurance carriers or third-party administrators, and changes in loss reserves related to our workers' compensation and health benefit insurance.
Insurance costs as a percentage of insurance service revenues decreased to 88% in 2017 from 92% and 94% in 2016 and 2015, respectively.
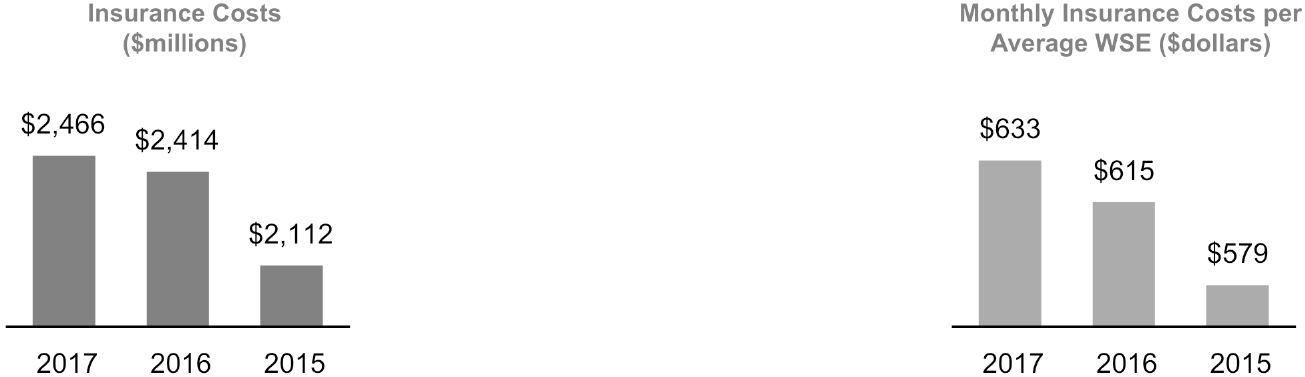
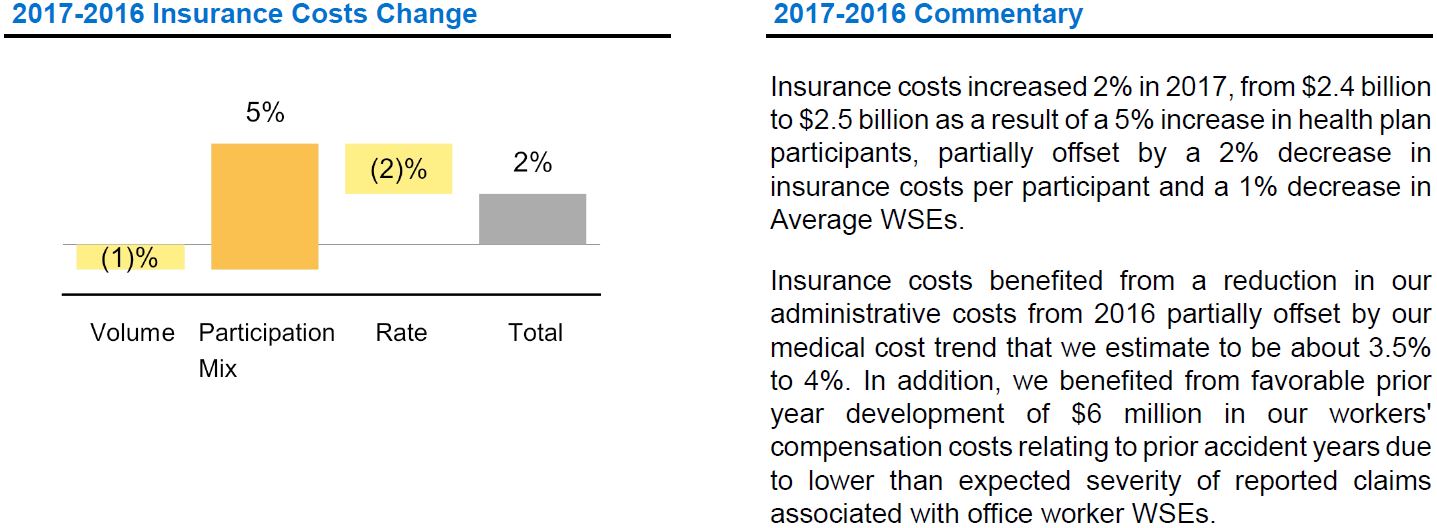
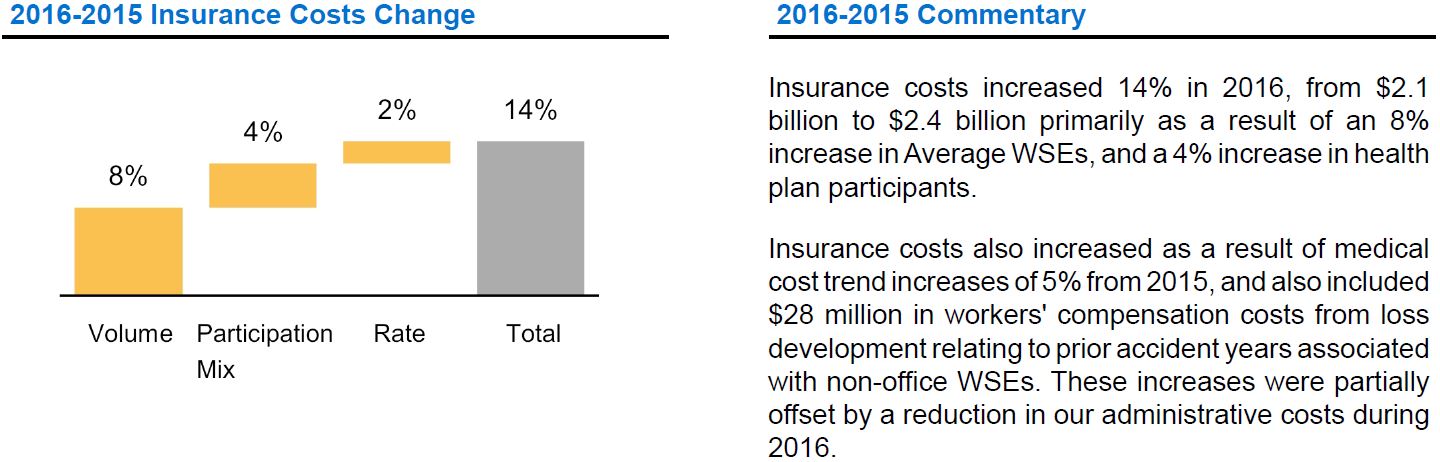
MANAGEMENT'S DISCUSSION AND ANALYSIS | |
Other Operating Expenses (OOE)
Other operating expenses includes cost of providing services (COPS), sales and marketing (S&M), general and administrative (G&A), and systems development and programming (SD&P) expenses.
We manage our other operating expenses and allocate resources across different business functions based on percentage of Net Service Revenues which has decreased to 69% in 2017 from 75% and 76% in 2016 and 2015, respectively.
We have approximately 2,700 corporate employees as of December 31, 2017 in 49 offices across the U.S. Our corporate employees' compensation related expenses represent a majority of our operating expenses. Compensation costs for our corporate employees include payroll, payroll taxes, stock-based compensation, bonuses, commissions and other payroll and benefits related costs. The percentage of compensation related expense to other operating expense represents 65% of our operating expenses in 2017 and 70% in 2016 and 2015. These decreases are primarily due to increased non-compensation related costs associated with our vertical product development, platform integrations, and internal control remediation efforts.
We expect our operating expenses to increase in the foreseeable future due to expected growth, our continued strategy to develop new vertical products, continued platform integrations, and additional costs associated with our process improvement efforts. We will continue to improve our systems, processes, and internal controls. These expenses may fluctuate as a percentage of our total revenues from period-to-period depending on the timing of when expenses are incurred.
We also expect commission expense, which is included in sales and marketing, to decrease in 2018 with the planned adoption of new Accounting Standards Update (ASU) 2016-10 in the first quarter of 2018. We anticipate that incremental, non-perpetual client acquisition costs will be deferred and amortized to expense over the expected client tenure. Refer to Note 1, Item 8 of this Form 10-K for additional details surrounding the impact of this adoption.
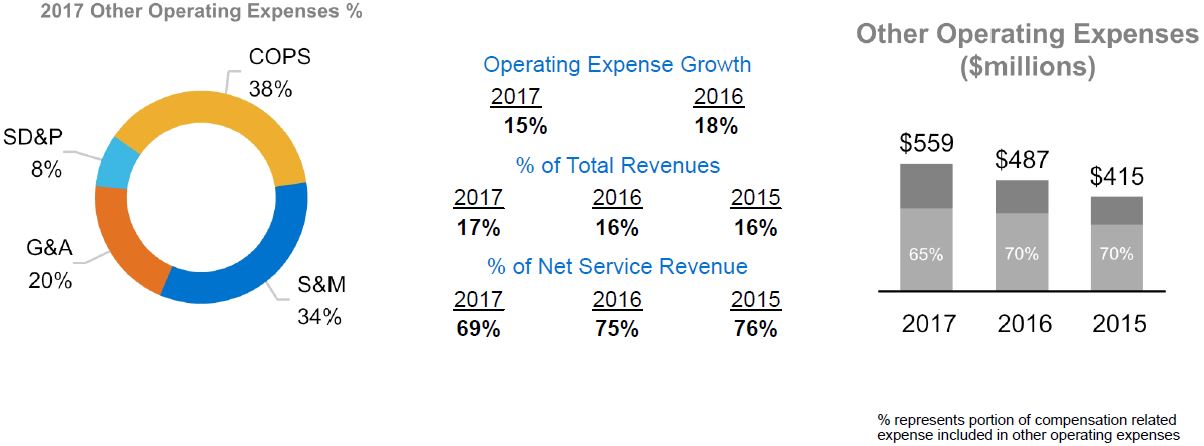
MANAGEMENT'S DISCUSSION AND ANALYSIS | |
2017 - 2016 Commentary
Other operating expenses increased $72 million or 15% as part of our continued investment in supporting our infrastructure and our client service capabilities. Specific costs increased as follows:
• | Total compensation costs increased $41 million or 13% primarily due to an increase in sales related compensation costs associated with a new sales performance incentive program as well as increased headcount related to investments in technology to support product delivery and platform integration. |
• | Consulting expenses increased $12 million and included costs associated with enhancing our product offerings |
• | Accounting and other professional fees increased $11 million in connection with significant time and resources required for our internal control remediation efforts and audit of our internal controls as required by Section 404 of the Sarbanes-Oxley Act of 2002. |
• | Other expenses increased $8 million in 2017 due to additional compliance costs and external sales costs. |
2016 - 2015 Commentary
Other operating expenses increased $72 million or 18% as part of our continued investment in supporting our infrastructure and our our client service capabilities. Specific costs increased as follows:
• | Total compensation costs increased $41 million or 15% primarily due to increases in our |
◦ | client services functions to support the growth and migration of clients from legacy platforms to TriNet platform, |
◦ | risk services functions to strengthen our insurance business management by hiring new leaders and actuarial teams, |
◦ | technology function to support product delivery and platform integration, and |
◦ | other supporting functions as a result of increased operational and compliance requirements for a growing public company. |
• | Consulting expenses increased $9 million and included costs associated with reviewing and administering our insurance programs, as well as consulting firms engaged in enhancing our product offerings. |
• | Accounting and other professional fees increased $8 million in primarily as a result of the professional fees to support our internal control remediation efforts. |
• | Other expenses increased $14 million in 2016 and included office leases and IT infrastructure costs to support the increased operational requirements. |
MANAGEMENT'S DISCUSSION AND ANALYSIS | |
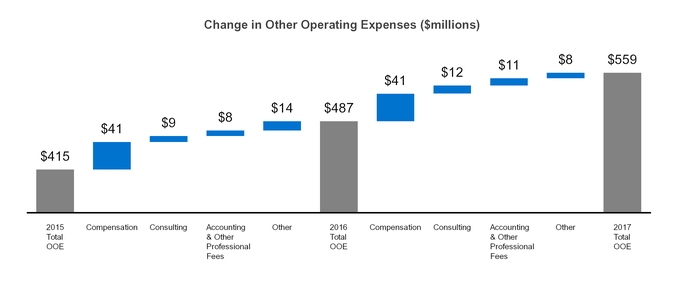
Depreciation
Depreciation expense increased 45% to $28 million in 2017 and 32% to $19 million in 2016, as a result of our additional investment in technology products and platforms and the associated depreciation of those assets.
Amortization of Intangible Assets
Amortization of intangible assets represents costs associated with acquired companies' developed technologies, client lists, trade names and contractual agreements. Amortization expense decreased 67% to $5 million in 2017 and 59% to $16 million in 2016, as a result of the 2016 revision to the expected useful life of certain client lists and trademarks primarily related to our previous acquisitions.
Other Income (Expense)
Other income (expense) which consists primarily of interest expense under our credit facility offset by interest and dividend income from investments, decreased 10% to $17 million in 2017 and increased 7% to $20 million in 2016. The decrease in 2017 was primarily due to an increase in yields on our invested cash and cash equivalents , while the increase in 2016 was primarily due to the write-off of debt issuance costs resulting from the refinance of our term loan in July 2016.
We may seek to amend our credit facility when appropriate and if available terms become more favorable. We may also seek additional borrowings to fund acquisitions, accelerate the payment of principal on outstanding debt, or for other business purposes. As such, our interest expense may fluctuate as a percentage of our total revenues from period to period depending on the timing of those borrowing and or repayment activities.
MANAGEMENT'S DISCUSSION AND ANALYSIS | |
Provision for Income Taxes
Our effective tax rates (ETR) were 11%, 41% and 47% for the years ended December 31, 2017, 2016 and 2015, respectively.
2017 - 2016 Commentary
Our ETR decreased 30% in 2017 from 41% in 2016 primarily due to the following:
• | 20% decrease attributable to revaluation of deferred taxes resulting from federal legislative changes pursuant to the TCJA additionally described in Note 12, Item 8 of this Form 10-K, |
• | 8% decrease due to a discrete tax benefit from recognizing excess tax benefits from stock-based compensation, |
• | 5% increase due to changes in uncertain tax positions (UTP) and exposures to ongoing tax examinations, |
• | 4% decrease resulting from the recognition of Section 199 benefits and decreased nondeductible expenses, and |
• | 3% decrease related to tax credits and excludable income for state tax purposes. |
2016 - 2015 Commentary
Our ETR decreased 6% in 2016 from 47% in 2015 primarily due to the following:
• | 6% decrease attributable to revaluation of deferred taxes resulting from state legislative changes enacted in 2015, |
• | 2% decrease in state income taxes from an increase in excludable income for state income tax purposes, |
• | 1% decrease from discrete benefits recorded in 2016 associated with prior year state income tax expense resulting from a state tax return to provision (RTP) adjustment relating to audit premiums paid for workers' compensation insurance, partially offset by |
• | 2% increase from net operating loss adjustment recorded in 2015. |
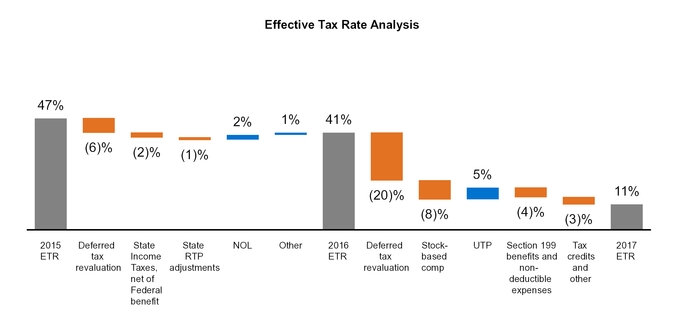
MANAGEMENT'S DISCUSSION AND ANALYSIS | |
Liquidity and Capital Resources
Liquidity
We manage our liquidity separately between assets and liabilities that are WSE related from our corporate assets and liabilities.
WSE related assets and liabilities primarily consist of current assets and current liabilities resulting from transactions directly or indirectly associated with WSEs, including payroll and related taxes and withholdings, our sponsored insurance programs, and other benefit programs. Our cash flows related to WSE payroll and benefits is generally matched by advance collection from our clients which is reported as payroll funds collected within WSE related assets.
We report our corporate cash and cash equivalents on the consolidated balance sheets separately from WSE related assets. We rely on our corporate cash and cash equivalents and cash from operations to satisfy our operational and regulatory requirements and to fund capital expenditures. We believe that we have sufficient corporate liquidity and capital resources to satisfy future requirements and meet our obligations to clients, creditors and debt holders.
Our liquid assets are as follows:
Year Ended December 31, | ||||||
(in millions) | 2017 | 2016 | ||||
Cash and cash equivalents | $ | 336 | $ | 184 | ||
Working capital: | ||||||
Corporate working capital | 227 | 151 | ||||
WSE related assets, net of WSE related liabilities | 7 | 5 | ||||
We had corporate cash and cash equivalents of $336 million and $184 million as of December 31, 2017 and 2016, respectively. The increase was primarily due to the cash generated from operations during 2017. We believe that our existing corporate cash and cash equivalents, working capital and cash provided by operating activities will be sufficient to meet our working capital and capital expenditure needs for at least the next 12 months.
We manage our sponsored benefit and workers' compensation insurance obligations by maintaining funds in restricted cash, cash equivalents and investments as collateral. As of December 31, 2017, we had $170 million of restricted cash, cash equivalents and investments included in WSE related assets and $162 million of marketable securities designated as long-term restricted cash, cash equivalents and investments on the consolidated balance sheets. These collateral amounts are generally determined at the beginning of each plan year and we may be required by our insurance carriers to adjust the balance when facts and circumstances change. We regularly review our collateral balances with our insurance carriers, and anticipate funding further collateral as needed based on program development.
Capital Resources
Sources of Funds
We believe that we can meet our present and reasonably foreseeable operating cash needs and future commitments through existing liquid assets, continuing cash flows from operations, our borrowing capacity under our revolving credit facility and the potential issuance of debt or equity securities through our filed shelf registration statement.
In July 2016, we refinanced our existing tranche B term loan, originally scheduled to mature in July 2017, with tranche A-2 term loans, pursuant to an amendment to the Amended and Restated First Lien Credit Agreement (Credit Agreement). As of December 31, 2017, $425 million of the term loans were outstanding including a $303 million term loan A at 3.95% per annum and $122 million term loan A-2 at 3.83% per annum maturing in July 2019.
We also have available a $75 million revolving credit facility. The total unused portion of the revolving credit facility was $60 million as of December 31, 2017. This revolving credit facility is expected to be used for working capital and other general corporate purposes.
MANAGEMENT'S DISCUSSION AND ANALYSIS | |
Uses of Funds
In 2017, we repurchased approximately 1,549,434 shares of our common stock for $44 million. As of December 31, 2017, $136 million remained available for repurchase under the program, which is not subject to an expiration date. We also used $38 million for debt repayment and $38 million to fund capital expenditures, primarily associated with software and hardware investments, in 2017.
Cash Flows
We generated positive cash flows from operating activities during 2017, 2016 and 2015. We also have borrowing capacity under our revolving credit facility and the potential to generate cash through the issuance of our debt or equity securities, to meet short-term funding requirements. The following table presents our cash flow activities for the stated periods:
Year Ended December 31, | |||||||||
(in millions) | 2017 | 2016 | 2015 | ||||||
Net cash provided by (used in): | |||||||||
Operating activities | $ | 253 | $ | 149 | $ | 151 | |||
Investing activities | (24 | ) | (27 | ) | (38 | ) | |||
Financing activities | (77 | ) | (104 | ) | (81 | ) | |||
Net increase in cash and cash equivalents | $ | 152 | $ | 18 | $ | 32 | |||
Operating Activities
Components of net cash provided by operating activities are as follows:
Year Ended December 31, | |||||||||
(in millions) | 2017 | 2016 | 2015 | ||||||
Net income | $ | 178 | $ | 61 | $ | 32 | |||
Depreciation and amortization | 35 | 39 | 53 | ||||||
Stock-based compensation expense | 32 | 26 | 18 | ||||||
Payment of interest | (16 | ) | (15 | ) | (15 | ) | |||
Income tax (payments) refunds, net | (2 | ) | (39 | ) | (2 | ) | |||
Collateral (paid to) refunded from insurance carriers, net | (3 | ) | (25 | ) | 10 | ||||
Changes in deferred taxes | (25 | ) | 42 | 15 | |||||
Changes in other operating assets and liabilities | 54 | 60 | 40 | ||||||
Net cash provided by operating activities | $ | 253 | $ | 149 | $ | 151 | |||
2017 - 2016 Commentary
The period-to-period fluctuation in cash provided by operating activities is primarily driven by the 192% increase in our net income, a decrease in payments of our tax liabilities, decreases in collateral paid to our insurance carriers, partially offset by changes in deferred tax liabilities primarily associated with the revaluation of deferred taxes resulting from federal legislative changes pursuant to the TCJA.
2016 - 2015 Commentary
Cash provided by operating activities remained fairly consistent. The period-to-period fluctuation included an increase in payments of our tax liabilities, an increase of collateral paid to insurance carriers, an increase in our net income, increases in our deferred tax liabilities, and changes in other operating assets and liabilities. Changes in other operating assets and liabilities is primarily driven by the timing of payments related to WSE related assets and liabilities, and our accounts payable and accrued expenses related to our trade creditors, and corporate employee compensation related payables.
MANAGEMENT'S DISCUSSION AND ANALYSIS | |
We expect our net cash provided by operating activities to fluctuate significantly with the planned adoption of ASU 2016-18 - Statement of Cash Flows (Topic 230): Restricted Cash in the first quarter of 2018 as changes in our restricted cash and cash equivalents balances will no longer be included within operating cash activities. For more information about the effects of this planned adoption, refer to Note 1 in Item 8 of this Form 10-K.
Furthermore, we expect our tax payments to increase in 2018 due to our inability to defer taxes as a result of new restrictions in TCJA that recognize income for tax purposes in the same period as our financial statements.
Investing Activities
Net cash used in investing activities primarily consisted of cash paid for capital expenditures, offset partially by proceeds from the maturity of investments.
Year Ended December 31, | |||||||||
(in millions) | 2017 | 2016 | 2015 | ||||||
Capital expenditures: | |||||||||
Software and hardware | $ | 28 | $ | 31 | $ | 13 | |||
Office furniture, equipment and leasehold improvements | 10 | 9 | 6 | ||||||
Cash used in capital expenditures | $ | 38 | $ | 40 | $ | 19 | |||
Investments: | |||||||||
Purchases of restricted investments | $ | — | $ | (15 | ) | $ | (42 | ) | |
Proceeds from maturity of restricted investments | 14 | 28 | 28 | ||||||
Cash provided by (used in) investments | $ | 14 | $ | 13 | $ | (14 | ) | ||
Capital expenditures have been investments in our software and hardware to introduce new products, enhance existing products and platforms, as well as platform integrations. In 2017, we made significant investments in our technology platform to provide our users with improved functionality, including online and mobile productivity tools, and to allow our platform to integrate more effectively with third party software applications. In July 2017, we launched and began onboarding clients to TriNet Main Street, our vertical offering designed for clients in the hospitality, retail and manufacturing industries. In 2016, we introduced TriNet Technology, TriNet Nonprofit, and TriNet Financial Services vertical products. In addition, we completed integrating our legacy platforms from acquisitions into the TriNet platform. We expect capital investments in our software and hardware to continue in the future.
We primarily invest funds held as collateral to satisfy our long-term obligation towards the workers' compensation liabilities in U.S. long-term treasuries. Such investments are classified as available for sale investments and included as restricted cash, cash equivalents and investments in the balance sheet. We review the amount of investment and the anticipated holding period is regularly in conjunction with our estimated long-term workers' compensation liabilities and anticipated claims payment trend.
As of December 31, 2017, we held approximately $1.4 billion in restricted long-term and short-term accounts. We intend to prudently invest some or all of these funds and other amounts available to us within the framework of our investment policy and guidelines to generate interest income.
Financing Activities
Net cash used in financing activities consisted primarily of repurchases of our common stock and repayment of debt.
The board of directors from time to time authorizes stock repurchases of our outstanding common stock primarily to offset dilution from the issuance of stock under our equity-based incentive plan and employee stock purchase plan. Refer to Note 9 in Item 8 of this Form 10-K for details of our equity plans. As of December 31, 2017, approximately $136 million remained available for repurchase under all authorizations by the board of directors.
MANAGEMENT'S DISCUSSION AND ANALYSIS | |
Year Ended December 31, | |||||||||
2017 | 2016 | 2015 | |||||||
Shares repurchased under the plan | 1,549,434 | 3,414,675 | 1,895,625 | ||||||
Amounts (in millions) | $ | 44 | $ | 72 | $ | 48 | |||
Historically we funded business acquisitions and special dividends through borrowings under credit facilities which may fluctuate from period to period. We will seek to amend the current credit facilities as they expire, as needed by the business or if market conditions become more favorable, with interest rates or terms that may not necessarily be more favorable than the current interest rates or terms.
Year Ended December 31, | |||||||||
(in millions) | 2017 | 2016 | 2015 | ||||||
Repayment of notes payable | $ | 38 | $ | 36 | $ | 45 | |||
Covenants
The Credit Agreement contains customary representations and warranties and customary affirmative and negative covenants applicable to us and our subsidiaries. It also contains financial covenants that require us to maintain: (1) a minimum consolidated interest coverage ratio of at least 3.50 to 1.00 and (2) a maximum total leverage ratio of 3.75 to 1.00 through December 31, 2017 and 3.50 to 1.00 thereafter. As of December 31, 2017, we were in compliance with these financial covenants.
In order to meet various states’ licensing requirements and maintain accreditation by the ESAC, we are subject to various minimum working capital and net worth requirements. As of December 31, 2017 and 2016, we believe we have fully complied in all material respects with all applicable state regulations regarding minimum net worth, working capital and all other financial and legal requirements. Further, we have maintained positive working capital throughout each of the periods covered by the financial statements.
Contractual Obligations
The following table summarizes our significant contractual obligations as of December 31, 2017:
Payments Due by Period | |||||||||||||||
(in millions) | Total | Less than 1 year | 1-3 years | 3-5 years | More than 5 years | ||||||||||
Debt obligations (1) | $ | 451 | $ | 59 | $ | 392 | $ | — | $ | — | |||||
Workers' compensation obligations (2) | 258 | 76 | 62 | 36 | 84 | ||||||||||
Operating lease obligations (3) | 72 | 17 | 29 | 16 | 10 | ||||||||||
Purchase obligations (4) | 28 | 27 | 1 | ||||||||||||
Uncertain tax positions (5) | 6 | — | 6 | — | — | ||||||||||
Total | $ | 815 | $ | 179 | $ | 490 | $ | 52 | $ | 94 | |||||
(1) Includes principal and the projected interest payments of our term loans, see Note 8 in Item 8 of this Form 10-K for details.
(2) Represents estimated payments that are expected to be made to carriers for various workers' compensation program under the contractual obligations. These obligations include the costs of reimbursing the carriers for paying claims within the deductible layer in accordance with the workers' compensation insurance policy as well as other liabilities.
(3) Includes various facilities and equipment leases under various operating lease agreements.
(4) Our purchase obligations primarily consist of software licenses, consulting and maintenance agreements, and sales and marketing events pertaining to various contractual agreements.
(5) Our uncertain tax positions primarily pertain to tax credits and other related reserves, including interest and penalties.
In the normal course of business, we make representations and warranties that guarantee the performance of services under service arrangements with clients. Historically, there have been no material losses related to such guarantees. In addition, we have entered into indemnification agreements with our officers and directors, which require us to defend and, if necessary, indemnify these individuals for certain pending or future legal claims as they relate to their services provided to us. Such indemnification obligations are not included in the table above.
MANAGEMENT'S DISCUSSION AND ANALYSIS | |
Off-Balance Sheet Arrangements
As of December 31, 2017, we did not have any material off-balance sheet arrangements that are reasonably likely to have a current or future effect on our financial condition, results of operations, liquidity, capital expenditures or capital resources.
Critical Accounting Judgments and Estimates
Our consolidated financial statements are prepared in accordance with U.S. GAAP, which require us to make estimates, judgments, and assumptions that affect reported amounts of assets, liabilities, revenues and expenses, and the related disclosures of contingent assets and liabilities. These estimates are based on historical experience and on various other assumptions that we believe to be reasonable under the circumstances. Some of the assumptions are highly uncertain at the time of estimation. To the extent actual experience differs from the assumptions used, our consolidated financial statements could be materially affected. For additional information about our accounting policies, refer to Note 1 in Item 8 of this Form 10-K.
Recent Accounting Pronouncements
Refer to Note 1 in Item 8 of this Form 10-K for additional information related to recent accounting pronouncements.
Insurance Loss Reserves
We purchase fully insured workers' compensation and health benefits coverage for our employees and WSEs. As part of these insurance policies, we bear claims costs up to a defined deductible amount and as a result, we establish insurance reserves including both known and incurred but not reported (IBNR) costs.
As workers' compensation costs for a particular period are not known for many years after the losses have occurred these loss reserves represent our best estimate of unpaid claim losses and loss adjustment expenses within the deductible layer in accordance with our insurance policies.
We use external actuaries to evaluate, review and recommend estimates of our workers' compensation and health benefits loss reserves. The loss reserve studies performed by these qualified actuaries analyze historical claims data to develop a range of potential ultimate losses using loss development, expected loss ratio and frequency/severity methods in accordance with Actuarial Standards of Practice. Loss methods are applied to classes or segments of the loss data organized by policy year and risk class.
Key judgments and evaluations in arriving at loss estimates by segment and the reserve selection overall include:
• | the selection of method used and the relative weights given to selecting the method used for each policy year, |
• | the underlying assumptions of loss development factor (LDF) used in these models, |
• | the effect of any changes to claims handling and payment processes, |
• | evaluation of loss (medical and indemnity) cost trends, costs from changes in the risk exposure being evaluated and any applicable changes in legal, regulatory or judicial environment. |
We review and evaluate these judgments and the associated recommendations in concluding the adequacy of loss reserves. Where adjustments are necessary these are recorded in the period in which the adjustments are identified.
Workers' Compensation Loss Reserves
Under our policies, we are responsible for reimbursing the insurance carriers for workers' compensation losses up to $1 million per claim occurrence (Deductible Layer). We use external actuaries to evaluate, review and recommend workers' compensation loss reserves on a quarterly basis. The data is segmented by class and state and analyzed by policy year; states where we have small exposure are aggregated into a single segment.
We use a combination of loss development, expected loss ratio and frequency/severity methods which include the following inputs, assumptions and analytical techniques:
• | TriNet's historical frequency and severity of workers' compensation claims experience, exposure data and industry loss experience, |
MANAGEMENT'S DISCUSSION AND ANALYSIS | |
• | inputs of WSEs’ job responsibilities and location, |
• | estimates of future cost trends to establish expected loss ratios for subsequent accident years, |
• | expected loss ratios for the latest accident year or prior accident years, adjusted for the loss trend, the effect of rate changes and other quantifiable factors, and |
• | loss development factors to project the reported losses for each accident year to an ultimate basis. |
Final claim settlements may vary materially from the present estimates, particularly when those payments may not occur until well into the future. In our experience, plan years related to workers' compensation programs may take 10 years or more to be fully settled. Certain assumptions used in estimating these reserves are highly judgmental. Our loss reserves, results of operations and financial condition can be materially impacted if actual experience differs from the assumptions used in establishing these reserves.
We believe that our estimate of workers' compensation loss reserves are most sensitive to loss development factors given the long reporting and paid development patterns for our workers' compensation loss costs. Our reserving methods rely on these loss development factors and an estimate of future cost trend.
The following table illustrates the sensitivity of changes in the loss development factor on our year end estimate of insurance reserves (in millions of dollars):
Change in loss development factor | Change in insurance costs |
-5.0% | ($37) |
-2.5% | ($19) |
+2.5% | $18 |
+5.0% | $37 |
Health Benefits Loss Reserves
We sponsor and administer a number of fully insured, risk based employee benefit plans, including group health, dental, vision and life insurance as an employer plan sponsor under section 3(5) of the ERISA. Approximately 70% of our 2017 group health insurance costs relate to risk-based plans in which we agree to reimburse our carriers for any claims paid within an agreed-upon per-person deductible layer up to a maximum aggregate exposure limit per policy. These deductible dollar limits and maximum limits vary by carrier and year.
Costs covered by these insurance plans generally develop on average within three to six months so loss reserves include estimates of reported losses and claims incurred but not yet paid (IBNP). Data is segmented and analyzed by insurance carrier.
To estimate health benefits loss reserves we use a number of inputs, assumptions and analytical techniques:
• | TriNet historical loss claims payment patterns and medical cost trend rates, |
• | current period claims costs and claims reporting patterns (completion factors), and |
• | plan enrollment. |
These reserves may vary in subsequent quarters from the amount estimated. Our loss reserves, results of operations and financial condition can be materially impacted if actual experience differs from our key assumptions used in establishing these reserves.
We believe that our year end estimate of health benefits loss reserves are most sensitive to changes in medical claim costs in the markets in which participating WSEs reside (medical cost trend) and our estimate of paid costs to carriers as a percentage of the expected ultimate costs to carriers (completion factors).
A 250 basis point increase in the medical cost trend would increase our year end health benefit loss reserves by approximately $11 million, and a 50 basis point decrease in completion factors would increase our year end health benefit loss reserves by approximately $8 million.
QUANTITATIVE AND QUALITATIVE DISCLOSURES | |
Item 7A. Quantitative and Qualitative Disclosures About Market Risk
We had restricted cash equivalents, investments and interest bearing receivables in connection with workers' compensation premiums totaling $261 million as of December 31, 2017. Included in this amount were $257 million in money market mutual funds, U.S. Treasuries and commercial paper. Our investments are made for capital preservation purposes and these interest-earning instruments carry a degree of interest rate risk. Our future investment income may fall short of expectations due to changes in interest rates or we may suffer losses in principal if we are forced to sell securities prior to maturity or declines in fair value are determined to be other-than-temporary. Fluctuations in the value of our investment securities caused by a change in interest rates (gains or losses on the carrying value) are recorded in other comprehensive income, and are realized only if we sell the underlying securities. To date, fluctuations in interest income have not been significant.
We had total outstanding indebtedness of $425 million as of December 31, 2017, of which $42 million is due within 12 months. We are exposed to market risk from changes in interest rates on our debt. Depending upon the borrowing option chosen, the interest charged is generally based upon the prime lending rate or London Inter-bank Offered Rate (LIBOR) plus an applicable margin. If interest rates in effect at December 31, 2017 increased or decreased 100 basis points, our interest expense for 2018 and 2019 would correspondingly increase or decrease by $5 million, respectively.
FINANCIAL STATEMENTS | |
Item 8. Financial Statements and Supplementary Data
TRINET GROUP, INC.
Consolidated Financial Statements
FINANCIAL STATEMENTS | |
REPORT OF INDEPENDENT REGISTERED PUBLIC ACCOUNTING FIRM
To the shareholders and the Board of Directors of TriNet Group, Inc.
Opinion on the Financial Statements
We have audited the accompanying consolidated balance sheets of TriNet Group, Inc. and subsidiaries (the "Company") as of December 31, 2017 and 2016, and the related consolidated statements of income and comprehensive income, stockholders’ equity (deficit), and cash flows for the years then ended, and the related notes and the schedule listed in the Index at Item 15 (collectively referred to as the "financial statements"). In our opinion, the financial statements present fairly, in all material respects, the financial position of the Company as of December 31, 2017 and 2016, and the results of operations and its cash flows for the years then ended, in conformity with accounting principles generally accepted in the United States of America.
We have also audited, in accordance with the standards of the Public Company Accounting Oversight Board (United States) (PCAOB), the Company's internal control over financial reporting as of December 31, 2017, based on criteria established in Internal Control - Integrated Framework (2013) issued by the Committee of Sponsoring Organizations of the Treadway Commission and our report dated February 27, 2018, expressed an adverse opinion on the Company's internal control over financial reporting because of a material weakness.
Basis for Opinion
These financial statements are the responsibility of the Company's management. Our responsibility is to express an opinion on the Company's financial statements based on our audits. We are a public accounting firm registered with the PCAOB and are required to be independent with respect to the Company in accordance with the U.S. federal securities laws and the applicable rules and regulations of the Securities and Exchange Commission and the PCAOB.
We conducted our audits in accordance with the standards of the PCAOB. Those standards require that we plan and perform the audit to obtain reasonable assurance about whether the financial statements are free of material misstatement, whether due to error or fraud. Our audits included performing procedures to assess the risks of material misstatement of the financial statements, whether due to error or fraud, and performing procedures that respond to those risks. Such procedures included examining, on a test basis, evidence regarding the amounts and disclosures in the financial statements. Our audits also included evaluating the accounting principles used and significant estimates made by management, as well as evaluating the overall presentation of the financial statements. We believe that our audits provide a reasonable basis for our opinion.
/s/ DELOITTE & TOUCHE LLP
San Francisco, California
February 27, 2018
We have served as the Company's auditor since 2016.
FINANCIAL STATEMENTS | |
REPORT OF INDEPENDENT REGISTERED PUBLIC ACCOUNTING FIRM
The Board of Directors and Stockholders of TriNet Group, Inc.
We have audited the accompanying consolidated statements of income and comprehensive income, stockholders’ equity (deficit) and cash flows of TriNet Group, Inc. for the year ended December 31, 2015. Our audits also included the financial statement schedule listed at Item 15(a). These financial statements and schedule are the responsibility of the Company’s management. Our responsibility is to express an opinion on these financial statements and schedule based on our audits.
We conducted our audits in accordance with the standards of the Public Company Accounting Oversight Board (United States). Those standards require that we plan and perform the audit to obtain reasonable assurance about whether the financial statements are free of material misstatement. An audit includes examining, on a test basis, evidence supporting the amounts and disclosures in the financial statements. An audit also includes assessing the accounting principles used and significant estimates made by management, as well as evaluating the overall financial statement presentation. We believe that our audits provide a reasonable basis for our opinion.
In our opinion, the financial statements referred to above present fairly, in all material respects, the consolidated results of operations and cash flows of TriNet Group, Inc. for the year ended December 31, 2015, in conformity with U.S. generally accepted accounting principles. Also, in our opinion, the related financial statement schedule, when considered in relation to the basic financial statements taken as a whole, presents fairly in all material respects the information set forth therein.
/s/ Ernst & Young LLP
San Francisco, California
March 31, 2016
FINANCIAL STATEMENTS | |
TRINET GROUP, INC.
CONSOLIDATED BALANCE SHEETS
(In millions, except share and per share data) | December 31, 2017 | December 31, 2016 | ||||
Assets | ||||||
Current assets: | ||||||
Cash and cash equivalents | $ | 336 | $ | 184 | ||
Restricted cash and cash equivalents | 15 | 15 | ||||
Prepaid income taxes | 5 | 42 | ||||
Prepaid expenses | 8 | 11 | ||||
Other current assets | 2 | 2 | ||||
Worksite employee related assets | 1,625 | 1,281 | ||||
Total current assets | 1,991 | 1,535 | ||||
Workers' compensation collateral receivable | 39 | 32 | ||||
Restricted cash, cash equivalents and investments | 162 | 131 | ||||
Property and equipment, net | 70 | 59 | ||||
Goodwill | 289 | 289 | ||||
Other intangible assets, net | 26 | 31 | ||||
Deferred and other long term income taxes | 2 | — | ||||
Other assets | 14 | 18 | ||||
Total assets | $ | 2,593 | $ | 2,095 | ||
Liabilities and stockholders’ equity | ||||||
Current liabilities: | ||||||
Accounts payable | $ | 45 | $ | 23 | ||
Accrued corporate wages | 40 | 31 | ||||
Notes payable | 40 | 37 | ||||
Other current liabilities | 14 | 12 | ||||
Worksite employee related liabilities | 1,618 | 1,276 | ||||
Total current liabilities | 1,757 | 1,379 | ||||
Notes payable, noncurrent | 383 | 422 | ||||
Workers' compensation loss reserves (net of collateral paid $17 and $22 at December 31, 2017 and 2016, respectively) | 165 | 159 | ||||
Deferred income taxes | 68 | 92 | ||||
Other liabilities | 14 | 8 | ||||
Total liabilities | 2,387 | 2,060 | ||||
Commitments and contingencies (see Note 13) | ||||||
Stockholders’ equity: | ||||||
Preferred stock ($0.000025 par value per share; 20,000,000 shares authorized; no shares issued and outstanding at December 31, 2017 and 2016) | — | — | ||||
Common stock and additional paid-in capital ($0.000025 par value per share; 750,000,000 shares authorized; 69,818,392 and 69,015,690 shares issued and outstanding at December 31, 2017 and 2016, respectively) | 583 | 535 | ||||
Accumulated deficit | (377 | ) | (500 | ) | ||
Total stockholders’ equity | 206 | 35 | ||||
Total liabilities and stockholders’ equity | $ | 2,593 | $ | 2,095 | ||
See accompanying notes.
FINANCIAL STATEMENTS | |
TRINET GROUP, INC.
CONSOLIDATED STATEMENTS OF INCOME AND COMPREHENSIVE INCOME
Year Ended December 31, | |||||||||
(In millions, except share and per share data) | 2017 | 2016 | 2015 | ||||||
Professional service revenues | $ | 458 | $ | 447 | $ | 401 | |||
Insurance service revenues | 2,817 | 2,613 | 2,258 | ||||||
Total revenues | 3,275 | 3,060 | 2,659 | ||||||
Insurance costs | 2,466 | 2,414 | 2,112 | ||||||
Cost of providing services (exclusive of depreciation and amortization of intangible assets) | 213 | 190 | 151 | ||||||
Sales and marketing | 187 | 174 | 167 | ||||||
General and administrative | 114 | 92 | 69 | ||||||
Systems development and programming | 45 | 31 | 28 | ||||||
Depreciation | 28 | 19 | 15 | ||||||
Amortization of intangible assets | 5 | 16 | 39 | ||||||
Total costs and operating expenses | 3,058 | 2,936 | 2,581 | ||||||
Operating income | 217 | 124 | 78 | ||||||
Other income (expense): | |||||||||
Interest expense and bank fees | (20 | ) | (20 | ) | (19 | ) | |||
Other, net | 3 | — | 1 | ||||||
Income before provision for income taxes | 200 | 104 | 60 | ||||||
Income tax expense | 22 | 43 | 28 | ||||||
Net income | $ | 178 | $ | 61 | $ | 32 | |||
Other comprehensive income (loss), net of tax | — | 1 | (1 | ) | |||||
Comprehensive income | 178 | 62 | 31 | ||||||
Net income per share: | |||||||||
Basic | $ | 2.57 | $ | 0.88 | $ | 0.45 | |||
Diluted | $ | 2.49 | $ | 0.85 | $ | 0.44 | |||
Weighted average shares: | |||||||||
Basic | 69,175,377 | 70,159,696 | 70,228,159 | ||||||
Diluted | 71,385,280 | 71,972,486 | 72,618,069 | ||||||
See accompanying notes.
FINANCIAL STATEMENTS | |
TRINET GROUP, INC.
CONSOLIDATED STATEMENTS OF STOCKHOLDERS’ EQUITY (DEFICIT)
Common Stock and Additional Paid-In Capital | Accumulated Deficit | Accumulated Other Comprehensive Loss | Total Stockholders’ Equity (Deficit) | |||||||||||
(In millions, except share data) | Shares | Amount | ||||||||||||
Balance at December 31, 2014 | 69,811,326 | $ | 443 | $ | (468 | ) | $ | — | $ | (25 | ) | |||
Net income | — | — | 32 | — | 32 | |||||||||
Other comprehensive income | — | — | — | (1 | ) | (1 | ) | |||||||
Issuance of common stock for vested restricted stock units | 106,136 | — | — | — | — | |||||||||
Issuance of common stock under employee stock purchase plan | 272,836 | 5 | — | — | 5 | |||||||||
Issuance of common stock from exercise of stock options | 2,112,131 | 7 | — | — | 7 | |||||||||
Stock-based compensation expense | — | 18 | — | — | 18 | |||||||||
Repurchase of common stock | (1,895,625 | ) | — | (48 | ) | — | (48 | ) | ||||||
Awards effectively repurchased for required employee withholding taxes | (35,379 | ) | — | (1 | ) | — | (1 | ) | ||||||
Excess tax benefit from equity incentive plan activity | — | 20 | — | — | 20 | |||||||||
Realized tax benefit of deductible IPO transaction costs | — | 1 | — | 1 | ||||||||||
Balance at December 31, 2015 | 70,371,425 | 494 | (485 | ) | (1 | ) | 8 | |||||||
Net income | — | — | 61 | — | 61 | |||||||||
Other comprehensive income | — | — | — | 1 | 1 | |||||||||
Issuance of common stock for vested restricted stock units | 695,253 | — | — | — | — | |||||||||
Issuance of common stock under employee stock purchase plan | 283,644 | 4 | — | — | 4 | |||||||||
Issuance of common stock from exercise of stock options | 1,297,812 | 5 | — | — | 5 | |||||||||
Stock-based compensation expense | — | 26 | — | — | 26 | |||||||||
Repurchase of common stock | (3,414,675 | ) | — | (72 | ) | — | (72 | ) | ||||||
Awards effectively repurchased for required employee withholding taxes | (217,769 | ) | — | (4 | ) | — | (4 | ) | ||||||
Excess tax benefit from equity incentive plan activity | — | 6 | — | — | 6 | |||||||||
Balance at December 31, 2016 | 69,015,690 | 535 | (500 | ) | — | 35 | ||||||||
Net income | — | — | 178 | — | 178 | |||||||||
Issuance of common stock from vested restricted stock units | 1,020,352 | — | — | — | — | |||||||||
Issuance of common stock for employee stock purchase plan | 224,928 | 5 | — | — | 5 | |||||||||
Issuance of common stock from exercise of stock options | 1,441,957 | 11 | — | — | 11 | |||||||||
Stock-based compensation expense | — | 32 | — | — | 32 | |||||||||
Repurchase of common stock | (1,549,434 | ) | — | (44 | ) | — | (44 | ) | ||||||
Awards effectively repurchased for required employee withholding taxes | (335,101 | ) | — | (11 | ) | — | (11 | ) | ||||||
Balance at December 31, 2017 | 69,818,392 | $ | 583 | $ | (377 | ) | $ | — | $ | 206 | ||||
See accompanying notes.
FINANCIAL STATEMENTS | |
TRINET GROUP, INC.
CONSOLIDATED STATEMENTS OF CASH FLOWS
Year Ended December 31, | |||||||||
(in millions) | 2017 | 2016 | 2015 | ||||||
Operating activities | |||||||||
Net income | $ | 178 | $ | 61 | $ | 32 | |||
Adjustments to reconcile net income to net cash provided by operating activities: | |||||||||
Depreciation and amortization | 35 | 39 | 53 | ||||||
Stock-based compensation | 32 | 26 | 18 | ||||||
Deferred income taxes | (25 | ) | 42 | 15 | |||||
Accretion of workers' compensation and leases fair value adjustment | — | — | (1 | ) | |||||
Changes in operating assets and liabilities: | |||||||||
Restricted cash and cash equivalents | (46 | ) | (42 | ) | (18 | ) | |||
Prepaid income taxes | 37 | (38 | ) | 24 | |||||
Prepaid expenses and other current assets | 1 | (2 | ) | 1 | |||||
Workers' compensation collateral receivable | (7 | ) | (3 | ) | 3 | ||||
Other assets | 4 | — | (15 | ) | |||||
Accounts payable | 22 | 9 | — | ||||||
Accrued corporate wages and other current liabilities | 11 | 4 | 6 | ||||||
Workers' compensation loss reserves and other non-current liabilities | 12 | 55 | 32 | ||||||
Worksite employee related assets | (343 | ) | 92 | 262 | |||||
Worksite employee related liabilities | 342 | (94 | ) | (261 | ) | ||||
Net cash provided by operating activities | 253 | 149 | 151 | ||||||
Investing activities | |||||||||
Acquisitions of businesses | — | — | (5 | ) | |||||
Purchases of marketable securities | — | (15 | ) | (42 | ) | ||||
Proceeds from maturity of marketable securities | 14 | 28 | 28 | ||||||
Purchase of property and equipment | (38 | ) | (40 | ) | (19 | ) | |||
Net cash used in investing activities | (24 | ) | (27 | ) | (38 | ) | |||
Financing activities | |||||||||
Repurchase of common stock | (44 | ) | (72 | ) | (48 | ) | |||
Proceeds from issuance of common stock on exercised options | 11 | 5 | 7 | ||||||
Proceeds from issuance of common stock on employee stock purchase plan | 5 | 4 | 5 | ||||||
Awards effectively repurchased for required employee withholding taxes | (11 | ) | (4 | ) | (1 | ) | |||
Proceeds from issuance of notes payable | — | 58 | — | ||||||
Payments for extinguishment of debt | — | (58 | ) | — | |||||
Repayment of notes payable | (38 | ) | (36 | ) | (45 | ) | |||
Payment of debt issuance costs | — | (1 | ) | — | |||||
Tax credit received for deductible IPO transaction costs | — | — | 1 | ||||||
Net cash used in financing activities | (77 | ) | (104 | ) | (81 | ) | |||
Net increase in cash and cash equivalents | 152 | 18 | 32 | ||||||
Cash and cash equivalents at beginning of year | 184 | 166 | 134 | ||||||
Cash and cash equivalents at end of year | $ | 336 | $ | 184 | $ | 166 | |||
Supplemental disclosures of cash flow information | |||||||||
Interest paid | $ | 16 | $ | 15 | $ | 15 | |||
Income taxes paid (refund), net | 2 | 39 | 2 | ||||||
Supplemental schedule of noncash investing and financing activities | |||||||||
Payable for purchase of property and equipment | $ | 2 | $ | 1 | $ | — | |||
Allowance for tenant improvements | — | — | 1 | ||||||
See accompanying notes.
FINANCIAL STATEMENTS | |
TRINET GROUP, INC.
NOTES TO CONSOLIDATED FINANCIAL STATEMENTS
NOTE 1. DESCRIPTION OF BUSINESS AND SIGNIFICANT ACCOUNTING POLICIES
Description of Business
TriNet Group Inc. (TriNet or we, our and us), a professional employer organization (PEO) founded in 1988, provides comprehensive human resources (HR) solutions for small to midsize businesses (SMBs) under a co-employment model. These HR solutions include bundled services, such as multi-state payroll processing and tax administration, employee benefits programs, including health insurance and retirement plans, workers' compensation insurance and claims management, employment and benefit law compliance, and other services. Through the co-employment relationship, we are the employer of record for most administrative and regulatory purposes, including:
• | compensation through wages and salaries, |
• | employer payroll-related taxes payment, |
• | employee payroll-related taxes withholding and payment, |
• | employee benefit programs including health and life insurance, and others, and |
• | workers' compensation coverage. |
Our clients are responsible for the day-to-day job responsibilities of the worksite employees (WSEs).
We operate in one reportable segment. All of our service revenues are generated from external clients. Less than 1% of revenue is generated outside of the U.S.
Basis of Presentation
Our consolidated financial statements are prepared in conformity with generally accepted accounting principles in the United States of America (GAAP). All intercompany accounts and transactions have been eliminated in consolidation.
Use of Estimates
The preparation of financial statements in conformity with GAAP requires us to make estimates and assumptions that affect certain reported amounts and related disclosures. Significant estimates include:
• | liability for unpaid losses and loss adjustment expenses (loss reserves) related to workers' compensation and workers' compensation collateral receivable, |
• | health insurance loss reserves, |
• | liability for insurance premiums payable, |
• | impairments of goodwill and other intangible assets, |
• | income tax assets and liabilities, and |
• | liability for legal contingencies. |
These estimates are based on historical experience and on various other assumptions that we believe to be reasonable from the facts available to us. Some of the assumptions are highly uncertain at the time of estimation. To the extent actual experience differs from the assumptions used, our consolidated financial statements could be materially affected.
FINANCIAL STATEMENTS | |
Revenue Recognition
Professional service revenues represent fees charged to clients for processing payroll-related transactions on behalf of our clients, access to our HR expertise, employment and benefit law compliance services and other HR related services. Professional service revenues are recognized in the period the services are rendered and earned under service arrangements with clients, where service fees are fixed or determinable, and collectability is reasonably assured. Clients execute annual service contracts with us that automatically renew. Generally, our clients may cancel these contracts with thirty days' notice and we may cancel these contracts with thirty days' notice.
We are not considered the primary obligor with respect to WSEs payroll and payroll tax payments and therefore, these payments are not reflected as either revenue or expense in our consolidated statements of income and comprehensive income.
We generally charge an upfront non-refundable set-up fee which is recognized on a straight-line basis over the estimated average client tenure.
Insurance service revenues consist of insurance-related billings and administrative fees collected from clients and withheld from WSEs for workers' compensation insurance and health benefit insurance plans provided by third-party insurance carriers. Insurance service revenues are recognized over the period the insurance coverage is provided and where collectability is reasonably assured.
The professional service revenues and insurance service revenues are each considered separate units of accounting for administrative services and insurance related benefits billed to the majority of our clients. For clients billed through a bundled invoice, the selling price of significant deliverables is determined based on the best estimate of the selling price.
Insurance Costs
Our fully insured insurance plans are provided by third-party insurance carriers under risk-based or guaranteed-cost insurance policies. Under risk-based policies, we agree to reimburse our carriers for any claims paid within an agreed-upon per-person deductible layer up to a maximum aggregate exposure limit per policy. These deductible dollar limits and maximum limits vary by carrier and year. Under guaranteed-cost policies, our carriers establish the premiums and we are not responsible for any deductible.
Insurance costs include insurance premiums for coverage provided by insurance carriers, reimbursement of claims payments made by insurance carriers or third-party administrators, and changes in loss reserves related to our workers' compensation and health benefit insurance.
At policy inception, annual workers' compensation premiums are estimated by the insurance carriers based on projected wages over the duration of the policy period and the risk categories of the WSEs. As actual wages are realized, premium expense recorded may differ from estimated premium expense, creating an asset or liability throughout the policy year. Such asset or liability is reported on our consolidated balance sheets as prepaid insurance premiums or insurance premiums payable, respectively.
Workers' Compensation Loss Reserves
We have secured fully insured workers' compensation insurance policies with insurance carriers for our clients and WSEs that obligate us to reimburse the insurance carriers for losses up to $1 million per claim occurrence (deductible layer). Workers' compensation insurance reserves represent our liability for unpaid losses and loss adjustment expenses. These reserves are established to provide for the estimated ultimate costs of paying claims within the deductible layer in accordance with worker's compensation insurance policies. These reserves include estimates for reported and incurred but not reported (IBNR) losses, case reserves on reported claims, and expenses associated with processing and settling the claims. In establishing these reserves, we use an independent actuary to provide an estimate of undiscounted future cash payments that would be made to settle the claims based upon:
• | TriNet's historical loss experience, exposure data, and industry loss experience, |
• | inputs including WSE job responsibilities and location, |
• | historical frequency and severity of workers' compensation claims, |
• | an estimate of future cost trends to establish expected loss ratios for subsequent accident years, |
FINANCIAL STATEMENTS | |
• | expected loss ratios for the latest accident year or prior accident years, adjusted for the loss trend, the effect of rate changes and other quantifiable factors, and |
• | loss development factors to project the reported losses for each accident year to an ultimate basis. |
We assess the workers' compensation loss reserves on a quarterly basis. For each reporting period, changes in the actuarial methods and assumptions resulting from changes in actual claims experience and other trends are incorporated into the workers' compensation loss reserves. Adjustments to previously established reserves are reflected in the results of operations for the period in which the adjustment is identified. Such adjustments could be significant, reflecting any variety of new adverse or favorable trends. Accordingly, final claim settlements may vary materially from the present estimates, particularly when those payments may not occur until well into the future. In our experience, plan years related to workers' compensation programs may take ten years or more to be settled.
We do not discount workers' compensation loss reserves. Claim costs expected to be paid within one year are recorded as workers' compensation reserves included in short-term WSE related liabilities. Claim costs expected to be paid beyond one year are included in long-term liabilities.
Insurance carriers are responsible for administering and paying claims. We are responsible for reimbursing each carrier up to a deductible limit per occurrence.
We have collateral agreements with various insurance carriers where either we retain custody of funds in trust accounts which we record as restricted cash and cash equivalents, or remit funds to carriers. Collateral whether held by us, or the carriers, is used to settle our insurance and claim deductible obligations to them. Collateral requirements are established at the policy year and are re-assessed by each carrier annually. Based on the results of each assessment, additional collateral may be required for or paid to the carrier or collateral funds may be released or returned to the company. Collateral paid to carriers, by agreement permits net settlement of obligations against collateral held, which we record net of our loss reserves (Carrier Collateral Offset). We offset Carrier Collateral Offset against our obligation due within the next 12 months before applying against long term obligations. Collateral balances in excess of loss reserves are recorded as workers' compensation collateral receivable, in WSE related assets or in long-term assets.
Health Benefits Loss Reserves
We sponsor and administer a number of fully insured, risk based employee benefit plans, including group health, dental, and vision as an employer plan sponsor under section 3(5) of the Employee Retirement Income Security Act (ERISA). In 2017, a majority of our group health insurance costs related to risk-based plans. Our remaining group health insurance costs were for guaranteed-cost policies.
Health benefits loss reserves are established to provide for the estimated unpaid costs of reimbursing the carriers for paying claims within the deductible layer in accordance with risk-based health insurance policies. These reserves include estimates for reported losses, plus estimates for claims incurred but not paid. We assess reserves regularly based upon independent actuarial studies that include other relevant factors such as current and historical claims payment patterns, plan enrollment and medical trend rates.
In certain carrier contracts we are required to prepay the expected claims activity for the subsequent period. These prepaid balances by agreement permit net settlement of obligations and offset the health benefits loss reserves or when the prepaid is in excess of our recorded liability the net asset position is included in WSE related assets.
Under certain policies, based on plan performance, we may be entitled to receive refunds of premiums which we recognize in accordance with the policy terms. We estimate these refunds based on premium and claims data and record as a reduction in the insurance costs on the consolidated statements of income and comprehensive income and prepaid health plan expenses in WSE related assets on the consolidated balance sheets. As of December 31, 2017 and 2016, we had $11 million and $9 million, respectively, included within WSE related assets as prepaid insurance premiums.
Cash and Cash Equivalents
Cash and cash equivalents include bank deposits and short-term, highly liquid investments. Investments with original maturity dates of three months or less are considered cash equivalents.
FINANCIAL STATEMENTS | |
Restricted Cash, Cash Equivalents and Investments
Restricted cash and cash equivalents presented on our consolidated balance sheets represents our corporate cash and cash equivalents in trust accounts functioning as security deposits for our insurance carriers. These deposits are not used for settling insurance premiums or claims payments.
WSE related assets also includes restricted cash, cash equivalents and investments held in trust for current and future premium and claim obligations with our insurance carriers. Amounts are held in trust according to the terms of the relevant insurance policies and by the local insurance regulations of the jurisdictions in which the policies are in force.
Investments
We have investments primarily in marketable securities including U.S. treasuries, which are classified as available for sale and are carried at estimated fair value. Unrealized gains and losses are reported as a component of accumulated other comprehensive income (loss), net of deferred income taxes. The amortized cost of marketable securities is adjusted for amortization of premiums and accretion of discounts from the date of purchase to maturity or sale. Such amortization is included in interest income as an addition to or deduction from the coupon interest earned on the investments. We use the specific identification method to determine the realized gains and losses on the sale of available for sale securities. Realized gains and losses are included in other income in the accompanying consolidated statements of income and comprehensive income.
We assess our investments for an other-than-temporary impairment loss due to a decline in fair value or other market conditions. We review several factors to determine whether a loss is other than temporary, such as the length and extent of the fair value decline, the financial condition and near-term prospects of the issuer and whether we have the intent to sell or will more likely than not be required to sell before the securities' anticipated recovery, which may be at maturity. If management determines that a security is impaired under these circumstances, the impairment recognized in earnings is measured as the entire difference between the amortized cost and the then-current fair value.
Fair Value of Financial Instruments
Fair value is an exit price, representing the amount that would be received to sell an asset or paid to transfer a liability in an orderly transaction between market participants at the measurement date. As such, fair value is a market-based measurement that should be determined based on assumptions that market participants would use in pricing an asset or a liability.
Our financial assets recorded at fair value on a recurring basis comprise of available for sale marketable securities and certificates of deposits. We measure certain financial assets at fair value for disclosure purposes, as well as on a nonrecurring basis when they are deemed to be other-than-temporarily impaired. Our other current financial assets and our other current financial liabilities, including cash and cash equivalents, restricted cash and cash equivalents, WSE related assets and liabilities excluding insurance loss reserves, line of credit and accrued corporate wages, have fair values that approximate their carrying value due to their short-term nature.
Assets and liabilities recorded at fair value are measured and classified in accordance with a three-tier fair value hierarchy based on the observability of the inputs available in the market to measure fair value, summarized as follows:
• | Level I—observable inputs for identical assets or liabilities, such as quoted prices in active markets, |
• | Level II—inputs other than the quoted prices in active markets that are observable either directly or indirectly, |
• | Level III—unobservable inputs in which there is little or no market data, which requires that we develop our own assumptions. |
The fair value hierarchy requires us to maximize the use of observable inputs and minimize the use of unobservable inputs when measuring fair value. We classify our cash equivalents, debt securities and notes payable in the fair value hierarchy based on the lowest level input that is significant to the fair value measurement in its entirety.
FINANCIAL STATEMENTS | |
WSE related Assets and Liabilities
Current assets and liabilities resulted from transactions directly or indirectly associated with WSEs, including payroll and related taxes and withholdings, our sponsored workers' compensation and health insurance programs, and other benefit programs, are reported in WSE related assets and liabilities on the consolidated balance sheets. These assets and liabilities are reported separately from our corporate assets and liabilities to better distinguish our corporate position from those assets and liabilities held by us to fund client payrolls.
Unbilled Revenue
We recognize WSE payroll and payroll tax liabilities in the period in which the WSEs perform work. When clients' pay periods cross reporting periods, we accrue the portion of the unpaid WSE payroll where we assume, under state regulations, the obligation for the payment of wages and the corresponding payroll tax liabilities associated with the work performed prior to period-end. These estimated payroll and payroll taxes liabilities are accrued wages in WSE related liabilities. The associated receivables, including estimated revenues, offset by advance collections from clients, are recorded as unbilled revenues in WSE related assets.
Accounts Receivable
Our accounts receivable recorded in WSE related assets, represent outstanding gross billings to clients, net of an allowance for doubtful accounts. We establish an allowance for doubtful accounts based on historical experience, the age of the accounts receivable balances, credit quality of clients, current economic conditions and other factors that may affect clients’ ability to pay, and charge-off amounts when they are deemed uncollectible.
Property and Equipment
We record property and equipment at historical cost and compute depreciation using the straight-line method over the estimated useful lives of the assets or the lease terms, generally three to five years for software and office equipment, five to seven years for furniture and fixtures, and the shorter of the asset life or the remaining lease term for leasehold improvements. We expense the cost of maintenance and repairs as incurred and capitalize leasehold improvements.
We capitalize internal and external costs incurred to develop internal-use computer software during the application development stage. Application development stage costs include license fee paid to third-parties for software use, software configuration, coding, and installation. Capitalized costs are amortized on a straight-line basis over the estimated useful life, typically ranging from three to five years, commencing when the software is placed into service. We expense costs incurred during the preliminary project stage, as well as general and administrative, overhead, maintenance and training costs, and costs that do not add functionality to existing systems. For the years ended December 31, 2017, 2016 and 2015, internally developed software costs capitalized were $29 million, $21 million and $11 million respectively.
We periodically assess the likelihood of unsuccessful completion of projects in progress, as well as monitor events or changes in circumstances, which might suggest that impairment has occurred and recoverability should be evaluated. An impairment loss is recognized if the carrying amount of the asset is not recoverable and exceeds the future net cash flows expected to be generated by the asset.
Goodwill and Other Intangible Assets
Our goodwill and identifiable intangible assets with indefinite useful lives are not amortized, but are tested for impairment on an annual basis or when an event occurs or circumstances change in a way to indicate that there has been a potential decline in the fair value of the reporting unit. Goodwill impairment is determined by comparing the estimated fair value of the reporting unit to its carrying amount, including goodwill. All goodwill is associated with one reporting unit within our reportable segment.
Annually, we perform a qualitative assessment to determine whether it is more likely than not that the fair value of the reporting unit has declined below carrying value. This assessment considers various financial, macroeconomic, industry, and reporting unit specific qualitative factors. We perform our annual impairment testing in the fourth quarter. Based on the results of our reviews, no impairment loss was recognized in the results of operations for the years ended December 31, 2017, 2016 and 2015.
FINANCIAL STATEMENTS | |
Intangible assets with finite useful lives are amortized over their respective estimated useful lives ranging from two to ten years using either the straight-line method or an accelerated method. Intangible assets are reviewed for indicators of impairment at least annually and evaluated for impairment whenever events or changes in circumstances indicate that the carrying amount of an asset may not be recoverable. Based on the results of our reviews, no impairment loss was recognized in the results of operations for the years ended December 31, 2017, 2016 and 2015.
Impairment of Long-Lived Assets
We evaluate our long-lived assets for impairment whenever events or changes in circumstances indicate that the carrying amount of an asset may not be recoverable. An asset is considered impaired if the carrying amount exceeds the undiscounted future net cash flows the asset is expected to generate. An impairment charge is recognized for the amount by which the carrying amount of the assets exceeds its fair value. Assets to be disposed of are reported at the lower of the carrying amount or fair value, less selling costs.
Advertising Costs
We expense the costs of producing advertisements at the time production occurs, and expense the cost of running advertisements in the period in which the advertising space or airtime is used as sales and marketing expense. Advertising costs were $8 million, $6 million, and $8 million for the years ended December 31, 2017, 2016 and 2015, respectively.
Stock-Based Compensation
We have three types of stock-based awards to employees: restricted stock units (time based and performance based), stock options and an employee stock purchase plan. Compensation expense associated with restricted stock units is based on the fair value of common stock on the date of grant. Compensation expense associated with stock options and employee stock purchase plan are based on the estimated grant date fair value method using the Black-Scholes option pricing model. Expense is recognized using a straight-line amortization method over the respective vesting period for awards that are ultimately expected to vest, with adjustments to expense recognized in the period in which forfeitures occur.
Income Taxes
We account for our provision for income taxes using the asset and liability method, under which we recognize income taxes payable or refundable for current year and deferred tax assets and liabilities for future tax effect of events that have been recognized in our financial statements or tax returns. We measure our current and deferred tax assets and liabilities based on provision of enacted tax laws of those jurisdictions in which we operate. The effect of changes in tax laws and regulations, or interpretations, is recognized in our consolidated financial statements in the period that includes the enactment date.
We recognize deferred tax assets and liabilities based on temporary differences between the carrying amounts of assets and liabilities for financial reporting purposes and amounts used for income tax purposes, as well as the expected benefits of using net operating loss and other carryforwards. We are required to establish a valuation allowance when it is determined more likely than not that the deferred tax assets will not be realized. Provision for income taxes may change when estimates used in determining valuation allowances change or when receipt of new information indicates the need for adjustment in valuation allowances. Changes in valuation allowances are reflected as a component of provision for income taxes in the period the change is enacted.
We recognize a reserve for uncertain tax positions taken or expected to be taken in a tax return when it is concluded that tax positions are not more likely than not to be sustained upon examination by taxing authorities, including resolution of any related appeals or litigation processes, based on the technical merits of the positions. Assumptions, judgment and the use of estimates are required in determining if the more likely than not standard has been met when developing the provision for income taxes and in determining the expected benefit. The tax benefits of the position recognized in the financial statements are then measured based on the largest amount of benefit that is greater than 50% likely to be realized upon settlement with a taxing authority. Unrecognized tax benefits due to tax uncertainties that do not meet the minimum probability threshold are included as other liabilities and are charged to earnings in the period that such determination is made. We recognize interest and penalties related to uncertain tax positions as a component of income tax expense. Accrued interest and penalties are included in other liabilities on the consolidated balance sheet.
FINANCIAL STATEMENTS | |
Concentrations of Credit Risk
Financial instruments subject to concentrations of credit risk include cash, cash equivalents and investments (including payroll funds collected), accounts receivable, and amounts due from insurance carriers. We maintain these financial assets principally in domestic financial institutions. We perform periodic evaluations of the relative credit standing of these institutions. Our exposure to credit risk in the event of default by the financial institutions holding these funds is limited to amounts currently held by the institution in excess of insured amounts.
Under the terms of professional services agreements, clients agree to maintain sufficient funds or other satisfactory credit at all times to cover the cost of their current payroll, all accrued paid time off, vacation or sick leave balances, and other vested wage and benefit obligations for all their work site employees. We generally require payment from our clients on or before the applicable payroll date.
For certain clients, we require an indemnity guarantee payment (IGP) supported by a letter of credit, bond, or a certificate of deposit from certain financial institutions. The IGP typically equals the total payroll and service fee for one average payroll period.
As of December 31, 2017, one client accounted for 47% of total accounts receivable. No client accounted for more than 10% of accounts receivable as of December 31, 2016. No client accounted for more than 10% of total revenues in the years ended December 31, 2017, 2016 and 2015. Bad debt expense, net of recoveries was $1 million, $1 million and $2 million for the years ended December 31, 2017, 2016 and 2015, respectively.
Recent Accounting Pronouncements
Recently adopted accounting guidance
Share-based payments - In March 2016, the FASB issued ASU 2016-09-Stock Compensation (Topic 718): Improvements to Employee Share-Based Payment Accounting, as part of the Simplification Initiative to simplify certain aspects of the accounting for share-based payment transactions to employees. The new standard requires excess tax benefits and tax deficiencies to be recorded in the statements of income and comprehensive income as a component of the provision for income taxes when stock awards vest or are settled. In addition, it eliminates the requirement to reclassify cash flows related to excess tax benefits from operating activities to financing activities on the condensed consolidated statements of cash flows. The standard also provides an accounting policy election to account for forfeitures as they occur, allows us to withhold more of an employee’s vesting shares for tax withholding purposes without triggering liability accounting, and clarifies that all cash payments made to tax authorities on an employee’s behalf for withheld shares should be presented as a financing activity on our cash flows statement. The new standard was effective for us beginning January 1, 2017.
Upon adoption, excess tax benefits or deficiencies from share-based award activity were reflected in the condensed consolidated statements of income and comprehensive income as a component of the provision for income taxes, whereas they previously were recognized in equity. We also elected to account for forfeitures as they occur, rather than estimate expected forfeitures. The adoption of ASU 2016-09 resulted in an immaterial net cumulative-effect adjustment, reflected as an increase to retained earnings as of January 1, 2017, mostly related to the recognition of the previously unrecognized excess tax benefits using the modified retrospective method. The previously unrecognized excess tax effects were recorded as an increase to deferred tax assets.
We adopted the aspects of the standard affecting the cash flow presentation retrospectively, and accordingly, to conform to the current year presentation, we reclassified $5 million and $21 million of tax deficiencies under financing activities to operating activities for the years ended December 31, 2016 and 2015, respectively, on our condensed consolidated statements of cash flows. The presentation requirements for cash flows related to employee taxes paid for withheld shares had no impact to any of the periods presented on our condensed consolidated statements of cash flows since such cash flows have historically been presented as a financing activity.
FINANCIAL STATEMENTS | |
Recent issued accounting pronouncements
Lease arrangements - In February 2016, the FASB, issued ASU 2016-02-Leases. The amendment requires that lease arrangements longer than 12 months result in an entity recognizing lease assets and lease liabilities. Most significant impact is on those leases classified as operating leases under previous U.S. GAAP. Under the new standard, disclosures are required to meet the objective of enabling users of financial statements to assess the amount, timing, and uncertainty of cash flows arising from leases.
The amendment is effective for annual reporting periods, and interim periods within those years beginning after December 15, 2018. Early adoption is permitted. We plan to adopt beginning January 1, 2019 and are currently in the process of evaluating the impact of the adoption of this standard on our consolidated financial statements. It is anticipated that there will be a material increase to assets and lease liabilities for existing property leases representing our nationwide office locations not already included on our consolidated balance sheets.
Financial Instruments - In January 2016, the FASB issued ASU 2016-01-Recognition and Measurement of Financial Assets and Financial Liabilities. The amendment addresses various aspects of the recognition, measurement, presentation, and disclosure for financial instruments. The amendment is effective for annual reporting periods, and interim periods within those years beginning after December 15, 2017. Early adoption by public entities is permitted only for certain provisions. We are currently in the process of evaluating the impact of the adoption of this standard on our consolidated financial statements.
Revenue Recognition - In May 2014, the FASB issued ASU 2014-09-Revenue from Contracts with Customers, which will replace most existing revenue recognition guidance under GAAP. The core principle of the guidance is that an entity should recognize revenue for the transfer of promised goods or services to customers that reflects the consideration to which the entity expects to be entitled in exchange for those goods or services. The standard provides a five-step analysis of transactions to determine when and how revenue is recognized. In July 2015, the FASB deferred the effective date to annual reporting periods, and interim periods within those years, beginning after December 15, 2017. The guidance permits two methods of adoption: retrospectively to each prior reporting period presented (full retrospective method), or retrospectively with the cumulative effect of initially applying the guidance recognized at the date of initial application (the modified retrospective method).
We will adopt the new standard effective January 1, 2018 using the modified retrospective method. Under the modified retrospective method, the new standard will be applied to all contracts initiated on or after the effective date. For contracts with remaining obligations as of the effective date, opening retained earnings will be adjusted for the cumulative effect of the change to the new standard as of the effective date.
Impacts on our revenue recognition includes:
• | Our annual service contracts with our clients that are cancellable with thirty days' notice will be considered 30-days contracts under the new standard; |
• | Professional service revenues will be recognized on a completed contract basis which results in recognition at the time payroll is processed; |
• | Our non-refundable set up fees will no longer be deferred but recognized as revenue when set up service is complete and will be allocated among professional service revenues and insurance revenues; |
• | The majority of sales commissions that are currently expensed will be capitalized as contract assets and amortized over the estimated customer life. |
FINANCIAL STATEMENTS | |
The consolidated balance sheet as of December 31, 2017, will be adjusted to reflect adoption of the standard:
(in millions) | Increase (Decrease) under new guidance | |||
Deferred revenue related to upfront recognition of non-refundable set up fees | ||||
Other current liabilities | $ | (4 | ) | |
Other liabilities | $ | (3 | ) | |
Derecognition of previously accrued Professional Service Fees in unbilled revenue | ||||
Worksite employee related assets | $ | (7 | ) | |
Contract assets related to deferral of sales commission expense associated with incomplete contracts as of December 31, 2017 | ||||
Other current assets | $ | 2 | ||
Other assets | $ | 1 | ||
Deferred tax liabilities, net of adjustment to deferred tax assets | $ | 2 | ||
Retained earnings | $ | 1 | ||
Statement of Cash Flows - In November 2016, the FASB issued ASU No. 2016-18, Statement of Cash Flows (Topic 230): Restricted Cash. ASU 2016-18 addresses diversity in practice from entities classifying and presenting transfers between cash and restricted cash as operating, investing or financing activities or as a combination of those activities in the statement of cash flows. The ASU requires entities to show the changes in the total of cash, cash equivalents, restricted cash and restricted cash equivalents in the Statement of Cash Flows. As a result, transfers between such categories will no longer be presented in the Statement of Cash Flows. ASU 2016-18 is effective for the Company on January 1, 2018 using the retrospective method. As of December 31, 2017 and 2016, we had total restricted cash, restricted cash equivalents and payroll funds collected of $1.4 billion and $1.0 billion, respectively.
In August 2016, the FASB issued ASU No. 2016-15, Statement of Cash Flows (Topic 230): Classification of Certain Cash Receipts and Cash Payments). ASU 2016-15 addresses diversity in practice in how certain cash receipts and cash payments are presented and classified in the statement of cash flows. This standard addresses the following eight specific cash flow issues: Debt prepayment or debt extinguishment costs; settlement of zero-coupon debt instruments or other debt instruments with coupon interest rates that are insignificant in relation to the effective interest rate of the borrowing; contingent consideration payments made after a business combination; proceeds from the settlement of insurance claims; proceeds from the settlement of corporate-owned life insurance policies; distributions received from equity method investees; beneficial interests in securitization transactions; and separately identifiable cash flows and application of the predominance principle. ASU 2016-15 is effective for the Company on January 1, 2018. We are evaluating the effect that this guidance will have on the consolidated financial statements and related disclosures and do not expect the impact to be material.
FINANCIAL STATEMENTS | |
NOTE 2. CASH, CASH EQUIVALENTS AND INVESTMENTS
Under the terms of the agreements with certain of our workers' compensation and health benefit insurance carriers, we are required to maintain collateral in trust accounts for the benefit of specified insurance carriers and to reimburse the carriers’ claim payments within our deductible layer. We invest a portion of the collateral amounts in marketable securities. We report the current portion of these trust accounts as restricted cash and cash equivalents in WSE related assets, and long term portion as restricted cash, cash equivalents and investments on the consolidated balance sheets.
We require our clients to prefund their payroll and related taxes and other withholding liabilities before payroll is processed or due for payment. This prefund is included in WSE related assets as payroll funds collected which is designated to pay pending payrolls and other WSE related liabilities.
Our total corporate and WSE related cash, cash equivalents and investments are summarized below:
December 31, 2017 | December 31, 2016 | |||||||||||||||||||||||
(in millions) | Cash and cash equivalents | Available for sale marketable securities | Certificate of deposits | Total | Cash and cash equivalents | Available for sale marketable securities | Certificate of deposits | Total | ||||||||||||||||
Cash and cash equivalents | $ | 336 | $ | — | $ | — | $ | 336 | $ | 184 | $ | — | $ | — | $ | 184 | ||||||||
Restricted cash and cash equivalents | 15 | — | — | 15 | 15 | — | — | 15 | ||||||||||||||||
Restricted cash, cash equivalents and investments, noncurrent | ||||||||||||||||||||||||
Collateral for workers' compensation claims | 125 | 37 | — | 162 | 79 | 52 | — | 131 | ||||||||||||||||
Worksite employee related assets | ||||||||||||||||||||||||
Restricted cash, cash equivalents and investments, current | ||||||||||||||||||||||||
Collateral for health benefits claims | 69 | — | — | 69 | 64 | — | — | 64 | ||||||||||||||||
Collateral for workers' compensation claims | 98 | 1 | — | 99 | 65 | — | — | 65 | ||||||||||||||||
Collateral to secure standby letter of credit | — | — | 2 | 2 | — | — | 2 | 2 | ||||||||||||||||
Total WSE related restricted cash, cash equivalents and investments, current | 167 | 1 | 2 | 170 | 129 | — | 2 | 131 | ||||||||||||||||
Payroll funds collected | 1,095 | — | — | 1,095 | 826 | — | — | 826 | ||||||||||||||||
Total | $ | 1,738 | $ | 38 | $ | 2 | $ | 1,778 | $ | 1,233 | $ | 52 | $ | 2 | $ | 1,287 | ||||||||
The amortized cost, gross unrealized gains, gross unrealized losses, fair values, and related maturities of securities available for sale as of December 31, 2017 and 2016 are presented below:
(in millions) | Maturity (in years) | Amortized Cost | Gross Unrealized Gains | Gross Unrealized Losses | Fair Value | ||||||||
December 31, 2017 | |||||||||||||
U.S. treasuries | >1-5 years | $ | 37 | $ | — | $ | — | $ | 37 | ||||
Exchange traded fund | N/A | 1 | — | — | 1 | ||||||||
Total | $ | 38 | $ | — | $ | — | $ | 38 | |||||
December 31, 2016 | |||||||||||||
U.S. treasuries | >1-5 years | $ | 51 | $ | — | $ | — | $ | 51 | ||||
Exchange traded fund | N/A | 1 | — | — | 1 | ||||||||
Total | $ | 52 | $ | — | $ | — | $ | 52 | |||||
There were immaterial realized gains or losses for the years ended December 31, 2017 and 2016. The fair value of our U.S. Treasury securities in an unrealized loss position represented 78% and 58% of the total fair value of all U.S. Treasury securities as of December 31, 2017 and 2016, respectively.
Unrealized losses are principally caused by changes in interest rates. In analyzing an issuer's financial condition, we consider whether the securities are issued by the federal government or its agencies, whether downgrades by bond rating agencies have occurred, and industry analysts' reports. As we have the ability to hold these available for sale marketable securities until maturity, or for the foreseeable future, no decline was deemed to be other-than-temporary.
FINANCIAL STATEMENTS | |
NOTE 3. WORKSITE EMPLOYEE RELATED ASSETS AND LIABILITIES
WSE related assets and WSE related liabilities are intended to be reviewed together when considering the financial position of the Company. Our clients direct the price and service specifications for payroll and payroll taxes and as a result, we are not the primary obligor for payroll and payroll tax payments and therefore record these amounts net in our statements of income and comprehensive income. However, we record without offset, accrued wages and payroll tax liabilities for WSEs in WSE related liabilities with the related payroll funds collected and unbilled revenues in WSE related assets. We have classified these assets and liabilities and other service related amounts collectively as WSE related, to present a clearer picture of the inter-relationship of the balances and distinguish these from our other corporate assets and liabilities.
In addition to unbilled revenues, accrued wages and payroll tax liabilities, other significant balances included in the WSE related assets and liabilities include:
• | Payroll funds collected represents cash collected from clients in advance to fund payroll and payroll taxes, and other payroll related liabilities; |
• | Other payroll assets, which primarily include payroll tax receivables; |
• | Client deposits, which represents indemnity guarantee payments received from clients and collections from clients in excess of payroll and other payroll related liabilities; |
• | Other payroll withholdings, which primarily includes withholdings under 401(k) plans and flexible benefit plans. |
(in millions) | December 31, 2017 | December 31, 2016 | ||||
Worksite employee related assets: | ||||||
Restricted cash, cash equivalents and investments | $ | 170 | $ | 131 | ||
Payroll funds collected | 1,095 | 826 | ||||
Unbilled revenues (net of advance collections of $12 and $9 at December 31, 2017 and 2016, respectively) | 297 | 293 | ||||
Accounts receivable | 20 | 5 | ||||
Prepaid insurance premiums | 25 | 13 | ||||
Workers' compensation collateral receivable | 1 | 2 | ||||
Other payroll assets | 17 | 11 | ||||
Total worksite employee related assets | $ | 1,625 | $ | 1,281 | ||
Worksite employee related liabilities: | ||||||
Accrued wages | $ | 289 | $ | 273 | ||
Client deposits | 52 | 56 | ||||
Payroll tax liabilities | 981 | 692 | ||||
Unpaid losses and loss adjustment expenses (less than 1 year): | ||||||
Health benefits loss reserves (net of prepayments of $19 and $0 at December 31, 2017 and 2016, respectively) | 151 | 129 | ||||
Workers' compensation loss reserves (net of collateral paid of $6 and $10 at December 31, 2017 and 2016, respectively) | 67 | 64 | ||||
Insurance premiums and other payables | 25 | 14 | ||||
Other payroll withholdings | 53 | 48 | ||||
Total worksite employee related liabilities | $ | 1,618 | $ | 1,276 | ||
Included in the payroll tax liabilities and insurance premiums and other payables were amounts relating to approximately 2,700 and 2,600 of our corporate employees at December 31, 2017 and 2016, respectively.
FINANCIAL STATEMENTS | |
NOTE 4. WORKERS' COMPENSATION LOSS RESERVES
The following summarizes the activities in the consolidated balance sheets for unpaid claims and claims adjustment expenses within workers' compensation assets and liabilities:
Year Ended December 31, | |||||||||
(in millions) | 2017 | 2016 | 2015 | ||||||
Total loss reserves, beginning of year | $ | 255 | $ | 190 | $ | 148 | |||
Incurred | |||||||||
Current year | 98 | 113 | 89 | ||||||
Prior years | (6 | ) | 28 | 27 | |||||
Total incurred | 92 | 141 | 116 | ||||||
Paid | |||||||||
Current year | (14 | ) | (14 | ) | (16 | ) | |||
Prior years | (78 | ) | (62 | ) | (58 | ) | |||
Total paid | (92 | ) | (76 | ) | (74 | ) | |||
Total loss reserves, end of year | $ | 255 | $ | 255 | $ | 190 | |||
The following summarizes workers' compensation liabilities on the consolidated balance sheets:
(in millions) | December 31, 2017 | December 31, 2016 | |||||
Total loss reserves, end of year | $ | 255 | $ | 255 | |||
Collateral paid to carriers and offset against loss reserves | (23 | ) | (32 | ) | |||
Total loss reserves, net of carrier collateral offset | $ | 232 | $ | 223 | |||
Payable in less than 1 year (1) (net of collateral paid to carriers of $6 and $10 as of December 31, 2017 and 2016, respectively) | 67 | 64 | |||||
Payable in more than 1 year (net of collateral paid to carriers of $17 and $22 as of December 31, 2017 and 2016, respectively) | 165 | 159 | |||||
Workers' Compensation Loss Reserves | $ | 232 | $ | 223 | |||
(1) Included under WSE related liabilities within Note 3 to these consolidated financial statements.
Incurred claims related to prior years represent changes in estimates for ultimate losses on workers' compensation claims. For the year ended December 31, 2017, the favorable development was primarily due to lower than expected severity of reported claims associated with office worker WSEs in recent accident years. For the year ended December 31, 2016, the adverse development was primarily due to higher than expected severity of reported claims associated with non-office WSEs in recent accident years. For the year ended December 31, 2015, the adverse development resulted from changes in estimates for ultimate losses associated with non-office WSEs.
As of December 31, 2017 and 2016, we had $63 million and $66 million, respectively, of collateral held by insurance carriers of which $23 million and $32 million was offset against workers' compensation loss reserves as the agreements permit and are net settled of insurance obligations against collateral held.
FINANCIAL STATEMENTS | |
NOTE 5. PROPERTY AND EQUIPMENT, NET
Property and equipment, net, consists of the following:
(in millions) | December 31, 2017 | December 31, 2016 | ||||
Software | $ | 114 | $ | 88 | ||
Office equipment, including data processing equipment | 23 | 21 | ||||
Leasehold improvements | 15 | 12 | ||||
Furniture, fixtures, and equipment | 15 | 11 | ||||
Projects in progress | 7 | 11 | ||||
Total | 174 | 143 | ||||
Less: Accumulated depreciation | (104 | ) | (84 | ) | ||
Property and equipment, net | $ | 70 | $ | 59 | ||
Projects in progress consist primarily of development costs for internally developed software, which we capitalize and amortize on a straight-line basis over the estimated useful life. We recognized depreciation expense for capitalized internally developed software of $17 million, $10 million, and $5 million for the years ended December 31, 2017, 2016 and 2015, respectively.
NOTE 6. GOODWILL AND OTHER INTANGIBLE ASSETS
The following summarizes goodwill and other intangible assets:
December 31, 2017 | December 31, 2016 | ||||||||||||||||||
(in millions) | Weighted Average Amortization Period | Gross Carrying Amount | Accumulated Amortization | Net Carrying Amount | Gross Carrying Amount | Accumulated Amortization | Net Carrying Amount | ||||||||||||
Goodwill | $ | 289 | $ | — | $ | 289 | $ | 289 | $ | — | $ | 289 | |||||||
Amortizable intangibles: | |||||||||||||||||||
Customer contracts | 10 years | 210 | (187 | ) | 23 | 210 | (182 | ) | 28 | ||||||||||
Trademark | 3 years | 17 | (17 | ) | — | 17 | (17 | ) | — | ||||||||||
Developed technology | 5 years | 6 | (3 | ) | 3 | 5 | (2 | ) | 3 | ||||||||||
Noncompete agreements | 3 years | 2 | (2 | ) | — | 2 | (2 | ) | — | ||||||||||
Total | $ | 235 | $ | (209 | ) | $ | 26 | $ | 234 | $ | (203 | ) | $ | 31 | |||||
We evaluate the remaining useful life of intangible assets annually to determine whether events and circumstances warrant a revision to the estimated remaining useful life. On October 1, 2016, we adjusted the estimated useful lives of customer contracts acquired from Ambrose, from a previously estimated useful life of 5 years to 10 years.
Expense related to intangibles amortization in future periods as of December 31, 2017 is expected to be as follows:
Year ending December 31: | Amount (in millions) | ||
2018 | $ | 5 | |
2019 | 5 | ||
2020 | 5 | ||
2021 | 4 | ||
2022 and thereafter | 7 | ||
Total | $ | 26 | |
FINANCIAL STATEMENTS | |
NOTE 7. FINANCIAL INSTRUMENTS AND FAIR VALUE MEASUREMENTS
Fair Value Measurements on a Recurring Basis
The following table summarizes our financial instruments by significant categories and fair value measurement on a recurring basis as of December 31, 2017 and 2016:
(in millions) | Level 1 | Level 2 | Total | ||||||
December 31, 2017 | |||||||||
Restricted cash equivalents: | |||||||||
Money market mutual funds | $ | 199 | $ | — | $ | 199 | |||
Commercial paper | 21 | — | 21 | ||||||
Total restricted cash equivalents | 220 | — | 220 | ||||||
Restricted investments: | |||||||||
U.S. Treasuries | 37 | — | 37 | ||||||
Exchange traded fund | 1 | — | 1 | ||||||
Certificate of deposit | — | 2 | 2 | ||||||
Total restricted investments | 38 | 2 | 40 | ||||||
Total restricted cash equivalents and investments | $ | 258 | $ | 2 | $ | 260 | |||
December 31, 2016 | |||||||||
Restricted cash equivalents: | |||||||||
Money market mutual funds | $ | 117 | $ | — | $ | 117 | |||
Commercial paper | 23 | — | 23 | ||||||
Total restricted cash equivalents | 140 | — | 140 | ||||||
Restricted investments: | |||||||||
U.S. Treasuries | 51 | — | 51 | ||||||
Exchange traded fund | 1 | — | 1 | ||||||
Certificate of deposit | — | 2 | 2 | ||||||
Total restricted investments | 52 | 2 | 54 | ||||||
Total restricted cash equivalents and investments | $ | 192 | $ | 2 | $ | 194 | |||
Restricted Cash Equivalents
The Company's restricted cash equivalents include money market mutual funds and commercial paper. The carrying value of cash equivalents approximate their fair values due to the short-term maturities and are classified as Level 1 in the fair value hierarchy because we use quoted market prices that are readily available in an active market to determine the fair value.
Restricted Investments
The Company's restricted investments include U.S. Treasuries, an exchange traded fund and a certificate of deposit. The U.S. Treasuries and exchange traded fund are classified as Level 1 securities in the fair value hierarchy as we use active quoted market prices that are readily available in an active market to determine fair value. The certificate of deposit is classified as Level 2 in the fair value hierarchy as we use a market approach that compares the fair values on certificates with similar maturities.
The Company did not have any Level 3 financial instruments as of December 31, 2017. There were no transfers between levels as of December 31, 2017 and 2016.
FINANCIAL STATEMENTS | |
Fair Value of Financial Instruments Disclosures
Notes Payable
The carrying value of our notes payable at December 31, 2017 and 2016 was $425 million and $462 million, respectively. The estimated fair values of our notes payable at December 31, 2017 and 2016 were $428 million and $463 million, respectively. These valuations are considered Level 2 in the hierarchy for fair value measurement and are based upon quoted market prices.
NOTE 8. NOTES PAYABLE
As of December 31, 2017 and 2016, notes payable consisted of the following:
(in millions) | December 31, 2017 | December 31, 2016 | Annual Contractual Interest Rate | Effective Interest Rate | Maturity Date | |||||||
Term loan A | $ | 303 | $ | 330 | 3.95 | % | (1) | 4.07 | % | July 2019 | ||
Term loan A-2 | 122 | 132 | 3.83 | % | (2) | 3.90 | % | July 2019 | ||||
Total term loans | 425 | 462 | ||||||||||
Deferred loan costs | (2 | ) | (3 | ) | ||||||||
Less: current portion | (40 | ) | (37 | ) | ||||||||
Non-current term portion | $ | 383 | $ | 422 | ||||||||
(1) | Bears interest at LIBOR plus 2.25% or the prime rate plus 1.25% at our option, subject to certain rate adjustments based upon our total leverage ratio. |
(2) | Bears interest at LIBOR plus 2.125% or the prime rate plus 1.125% at our option, subject to certain rate adjustments based upon our total leverage ratio. |
In July 2016, we refinanced our Amended and Restated First Lien Credit Agreement (Credit Agreement). We replaced $135 million of outstanding tranche B term loans maturing July 2017 with substantially the same amount of new tranche A-2 term loans maturing July 2019. The $342 million of existing tranche A term loans and the $75 million revolving credit facility were not refinanced. As part of the $135 million refinancing transaction, $58 million was recorded as an extinguishment, and $77 million was rolled over into the new tranche A-2 term loans and was treated as a debt modification.
The proceeds of the tranche A-2 term loans were used to: (i) refinance the remaining tranche B term loans outstanding under the Credit Agreement and (ii) pay related fees and expenses. As a result of refinancing our syndicated loan, approximately $1 million in fees and costs were incurred, of which a portion was recorded as deferred loan costs for continuing lenders with the remainder expensed for those lenders no longer included in the loan syndicate.
Interest on term loans is payable quarterly. We are required to pay a quarterly commitment fee of 0.50% which may decrease to 0.38% based on our total leverage ratio, on the daily unused amount of the commitments under the revolving credit facility, as well as fronting fees and other customary fees for letters of credit issued under the revolving credit facility.
We are permitted to make voluntary prepayments at any time without payment of a premium. We are required to make mandatory prepayments of term loans (without payment of a premium) with (i) net cash proceeds from issuances of debt (other than certain permitted debt), and (ii) net cash proceeds from certain non-ordinary course asset sales and casualty and condemnation proceeds (subject to reinvestment rights and other exceptions).
FINANCIAL STATEMENTS | |
The tranche A and A-2 term loans will be repaid in quarterly installments in aggregate annual amounts as follows (in millions):
Year ending December 31, | |||||||||
2018 | 2019 | Total | |||||||
Term loan repayments | $ | 42 | $ | 383 | $ | 425 | |||
The Credit Agreement contains customary representations and warranties, and customary affirmative and negative covenants applicable to us, including, among other things, restrictions on indebtedness, liens, investments, mergers, and other dispositions.
Our credit facility is free of net income restrictions. In addition, our credit facility permits us to make customary payments that would otherwise be restricted, such as day-to-day intragroup payments or dividends and repurchase of shares granted under our equity plans.
The Credit Agreement restricts our ability to make certain types of payments including dividends and stock repurchases and other similar distributions, though such payments may generally be made as long as our total leverage ratio remains below 3.00 to 1.00 and there exists no default under the Credit Agreement.
The financial covenants under the Credit Agreement require us to maintain a minimum consolidated interest coverage ratio of at least 3.50 to 1.00 at December 31, 2017 and 2016 and a maximum total leverage ratio of 3.75 to 1.00 and 4.25 to 1.00 at December 31, 2017 and 2016, respectively. We were in compliance with these financial covenants under the credit facilities at December 31, 2017 and 2016.
The credit facility is secured by substantially all of our assets, other than excluded assets as defined in the Credit Agreement, which includes certain customary assets, assets held in trusts as collateral and WSE related assets.
The Company has a $75 million revolving credit facility. For additional information regarding these facilities, refer to Note 13 in this Form 10-K.
NOTE 9. STOCKHOLDERS’ EQUITY
Common Stock
Upon closing of our IPO in March 2014, we issued 15,000,000 shares of common stock at a public offering price $16 per share, for an aggregate offering price of $240 million, resulting in net proceeds to us of $217 million, after deducting underwriting discounts and commissions of approximately $17 million and offering expenses of approximately $6 million.
Equity-Based Incentive Plans
In December 2009, the board of directors approved the 2009 Equity Incentive Plan (the 2009 Plan) which provides for the grant of various equity awards to eligible employees, directors, and consultants including stock options, restricted stock unit (time-based and performance-based) and other stock awards. Shares available for grant as of December 31, 2017 were 9 million.
Stock Options
Stock options are granted to employees under the 2009 Plan at exercise prices equal to the fair market value of our common stock on the dates of grant. Options generally have a maximum contractual term of 10 years. Options are generally vested over four years, based on continued service. Stock options are forfeited if the employee ceases to be employed by us prior to vesting.
FINANCIAL STATEMENTS | |
The following table summarizes stock option activity under our equity-based plans for the year ended December 31, 2017:
Number of Shares | Weighted Average Exercise Price | Weighted Average Remaining Contractual Term (in years) | Aggregate Intrinsic Value (in millions) | ||||||
Balance at December 31, 2016 | 2,815,224 | $ | 9.96 | 6.66 | $ | 46 | |||
Granted | — | — | |||||||
Exercised | (1,441,957 | ) | 7.43 | ||||||
Forfeited | (64,107 | ) | 15.95 | ||||||
Expired | (12,297 | ) | 33.51 | ||||||
Balance at December 31, 2017 | 1,296,863 | $ | 12.27 | 5.87 | $ | 41 | |||
Exercisable at December 31, 2017 | 1,140,450 | $ | 10.85 | 5.75 | $ | 38 | |||
Vested and expected to vest at December 31, 2017 | 1,296,863 | $ | 12.27 | 5.87 | $ | 41 | |||
Year Ended December 31, | |||||||||
Additional Disclosures for Stock Options | 2017 | 2016 | 2015 | ||||||
Weighted-average grant date fair value of stock options | N/A | N/A | $ | 12.73 | |||||
Total fair value of options vested (in millions) | $ | 7 | $ | 7 | $ | 12 | |||
Total intrinsic value of options exercised (in millions) | $ | 36 | $ | 21 | $ | 53 | |||
Cash received from options exercised (in millions) | $ | 11 | $ | 5 | $ | 7 | |||
Restricted Stock Units
Restricted stock units are subject to time-based or performance-based vesting conditions:
• | The time-based restricted stock units (RSUs) granted to non-employee directors generally fully vest on the first anniversary of the grant date; |
• | The RSU granted to employees are generally subject to vesting ratably on a quarterly basis over four years; |
◦ | For new hires, one quarter of the total RSUs granted are subject to vesting on the first anniversary of the grant date. The remaining RSUs vest ratably on a quarterly basis over three years; |
• | The performance-based restricted stock units (PSUs) are subject to vesting based on our achievement of the financial performance metrics and other goals that are established at the grant date. Depending on the results achieved, the actual number of shares to be granted may range from 0% to 200% of the target share value. Compensation expense is recognized ratably over the vesting period based on the probability of the number of awards expected to vest at each reporting date. |
◦ | The financial performance metric established for the PSUs granted during fiscal year 2015, represents cumulative annual growth rate in our Net Service Revenues as defined in the grant notice over three-year performance periods. |
◦ | The financial performance metric established for the PSUs granted during fiscal year 2017, represents annual growth rates in our Net Service Revenues and our Cash from Operations as defined in the grant notice. The PSUs will vest 50% in 2018 and the remaining in 2019. |
Unvested restricted stock units are forfeited if the employee ceases to be employed by us prior to vesting.
FINANCIAL STATEMENTS | |
The following table summarizes RSU and PSU activity under our equity-based plans for the year ended December 31, 2017:
RSUs | PSUs | |||||||||
Number of Units | Weighted-Average Grant Date Fair Value | Number of Units | Weighted-Average Grant Date Fair Value | |||||||
Nonvested at December 31, 2016 | 2,323,051 | $ | 20.32 | 149,412 | $ | 33.51 | ||||
Granted | 1,231,507 | 29.73 | 330,674 | 29.69 | ||||||
Vested | (1,012,834 | ) | 20.93 | (7,518 | ) | 33.51 | ||||
Forfeited | (292,063 | ) | 23.14 | (18,894 | ) | 33.51 | ||||
Nonvested at December 31, 2017 | 2,249,661 | $ | 24.83 | 453,674 | $ | 30.72 | ||||
RSUs | PSUs | ||||||||||||||||||
Year Ended December 31, | Year Ended December 31, | ||||||||||||||||||
Additional Disclosures for equity-based plans | 2017 | 2016 | 2015 | 2017 | 2016 | 2015 | |||||||||||||
Total grant date fair value of shares granted (in millions) | $ | 37 | $ | 42 | $ | 31 | $ | 10 | $ | — | $ | 6 | |||||||
Total grant date fair value of shares vested (in millions) | $ | 21 | $ | 16 | $ | 4 | $ | — | $ | — | $ | — | |||||||
Shares withheld to settle payroll tax liabilities related to vesting of shares held by employees | 332,857 | 217,769 | 35,379 | 2,244 | — | — | |||||||||||||
Employee Stock Purchase Plan
Our 2014 Employee Stock Purchase plan (ESPP) offers eligible employees an option to purchase shares of our common stock through a payroll deduction. The purchase price is equal to the lesser of 85% of the fair market value of our common stock on the offering date or 85% of the fair market value of our common stock on the applicable purchase date. Offering periods are approximately six months in duration and will end on or about May 15 and November 15 of each year. Employees may contribute a minimum of 1% and a maximum of 15% of their earnings. The plan is considered to be a compensatory plan. We issued 224,928, 283,644, and 272,836 shares under the ESPP during 2017, 2016 and 2015, respectively. As of December 31, 2017, approximately 2 million shares were reserved for future issuances under the ESPP.
Stock-Based Compensation
The fair value of our RSUs and PSUs is equal to the fair value of our common stock on the grant date. The fair value of stock options and the ESPP is estimated on the date of grant using the Black-Scholes option-pricing model with the following weighted-average assumptions:
Stock Option Assumptions | ESPP Assumptions | |||||||||||
Year Ended December 31, | Expected Term (in Years) | Expected Volatility | Risk-Free Interest Rate | Expected Dividend Yield | Expected Term (in Years) | Expected Volatility | Risk-Free Interest Rate | Expected Dividend Yield | ||||
2017 | N/A | N/A | N/A | N/A | 0.50 | 28-37% | 0.62-1.42% | 0 | % | |||
2016 | N/A | N/A | N/A | N/A | 0.50 | 32-76% | 0.33-0.62% | 0 | % | |||
2015 | 6.08 | 39 | % | 1.73 | % | 0 | % | 0.50 | 34-76% | 0.07-0.33% | 0 | % |
FINANCIAL STATEMENTS | |
Compensation expense is measured based on the fair value of the stock option on the grant date and recognized over the requisite service period for each separately vesting portion of the stock option award. Stock-based compensation expense and other disclosures for stock-based awards made to our employees pursuant to the equity plans was as follows:
Year Ended December 31, | |||||||||
(in millions) | 2017 | 2016 | 2015 | ||||||
Cost of providing services | $ | 8 | $ | 7 | $ | 4 | |||
Sales and marketing | 6 | 6 | 4 | ||||||
General and administrative | 14 | 11 | 8 | ||||||
Systems development and programming costs | 4 | 2 | 2 | ||||||
Total stock-based compensation expense | $ | 32 | $ | 26 | $ | 18 | |||
Income tax benefit related to stock-based compensation expense | $ | 7 | $ | 9 | $ | 6 | |||
Tax benefit realized from stock options exercised and similar awards | $ | 28 | $ | 7 | $ | 20 | |||
The table below summarizes unrecognized compensation expense for the year ended December 31, 2017 associated with the following:
Amount (in millions) | Weighted-Average Period (in Years) | |||
Nonvested stock options | $ | 1 | 0.76 | |
Nonvested RSUs | $ | 50 | 2.43 | |
Nonvested PSUs | $ | 7 | 1.50 | |
Stock Repurchases
During 2017, 2016, and 2015, the board of directors authorized $120 million, $100 million and $50 million, respectively of outstanding common stock to be repurchased with no expiration from the date of authorization. As of December 31, 2017, approximately $136 million remained available for repurchase pursuant to our stock repurchase program. During 2017, 2016 and 2015, we repurchased 1,549,434 shares, 3,414,675 shares and 1,895,625 shares, respectively.
NOTE 10. EARNINGS PER SHARE (EPS)
Basic EPS is computed based on the weighted average number of common stocks outstanding during the period. Diluted EPS is computed based on those shares used in the basic EPS computation, plus potentially dilutive shares issuable under our equity-based compensation plans using the treasury stock method. Shares that are potentially anti-dilutive are excluded.
FINANCIAL STATEMENTS | |
The following table presents the computation of our basic and diluted EPS attributable to our common stock:
Year Ended December 31, | |||||||||
(In millions, except per share data) | 2017 | 2016 | 2015 | ||||||
Net income | $ | 178 | $ | 61 | $ | 32 | |||
Weighted average shares of common stock outstanding | 69 | 70 | 70 | ||||||
Basic EPS | $ | 2.57 | $ | 0.88 | $ | 0.45 | |||
Net income | $ | 178 | $ | 61 | $ | 32 | |||
Weighted average shares of common stock | 69 | 70 | 70 | ||||||
Dilutive effect of stock options and restricted stock units | 2 | 2 | 3 | ||||||
Weighted average shares of common stock outstanding | 71 | 72 | 73 | ||||||
Diluted EPS | $ | 2.49 | $ | 0.85 | $ | 0.44 | |||
Common stock equivalents excluded from income per diluted share because of their anti-dilutive effect | 2 | 1 | 1 | ||||||
NOTE 11. 401(k) PLAN
Under our 401(k) plan, corporate participants may direct the investment of contributions to their accounts among certain investments. We match individual employee 401(k) plan contributions at the rate of $0.50 for every dollar contributed by employees subject to a cap. We recorded matching contributions to the 401(k) plan of $6 million, $5 million, and $5 million during the years ended December 31, 2017, 2016, and 2015, respectively, which are reflected in various operating expense lines within the accompanying consolidated statements of income and comprehensive income.
We also maintain multiple employer defined contribution plans, which cover WSEs for client companies electing to participate in the plan and for their internal staff employees. We contribute, on behalf of each participating client, varying amounts based on the clients’ policies and serviced employee elections.
NOTE 12. INCOME TAXES
Provision for Income Taxes
The provision for income taxes consists of the following:
Year Ended December 31, | |||||||||
(in millions) | 2017 | 2016 | 2015 | ||||||
Current: | |||||||||
Federal | $ | 46 | $ | 1 | $ | 9 | |||
State | 1 | — | 4 | ||||||
Total Current | 47 | 1 | 13 | ||||||
Deferred: | |||||||||
Federal | 12 | 38 | 12 | ||||||
State | 3 | 5 | — | ||||||
Revaluation due to legislative changes | (40 | ) | (1 | ) | 3 | ||||
Total Deferred | (25 | ) | 42 | 15 | |||||
Total | $ | 22 | $ | 43 | $ | 28 | |||
FINANCIAL STATEMENTS | |
The U.S. federal statutory income tax rate reconciled to our effective tax rate is as follows:
Year Ended December 31, | ||||||||||||||||||||||||
2017 | 2016 | 2015 | ||||||||||||||||||||||
(In millions, except percent) | Pre-Tax Income | Tax Expense/(Benefit) | Percent of Pre-Tax Income (Loss) | Pre-Tax Income | Tax Expense/(Benefit) | Percent of Pre-Tax Income (Loss) | Pre-Tax Income | Tax Expense/(Benefit) | Percent of Pre-Tax Income (Loss) | |||||||||||||||
$ | 200 | $ | 104 | $ | 60 | |||||||||||||||||||
U.S. federal statutory tax rate | $ | 70 | 35 | % | $ | 37 | 35 | % | $ | 21 | 35 | % | ||||||||||||
State income taxes, net of federal benefit | 10 | 5 | 4 | 4 | 4 | 7 | ||||||||||||||||||
Tax rate change | (40 | ) | (20 | ) | (1 | ) | (1 | ) | 3 | 5 | ||||||||||||||
Nondeductible meals, entertainment and penalties | 1 | — | 4 | 4 | 2 | 3 | ||||||||||||||||||
Stock-based compensation | (15 | ) | (7 | ) | 1 | 1 | 1 | 1 | ||||||||||||||||
Uncertain tax positions | 4 | 2 | — | — | — | — | ||||||||||||||||||
Tax credits | (3 | ) | (1 | ) | (1 | ) | (1 | ) | (2 | ) | (2 | ) | ||||||||||||
State and tax return to provision adjustment | (5 | ) | (3 | ) | (1 | ) | (1 | ) | — | — | ||||||||||||||
Sec 199 benefits | (3 | ) | (1 | ) | — | — | — | — | ||||||||||||||||
Other | 3 | 1 | — | — | (1 | ) | (2 | ) | ||||||||||||||||
Total | $ | 22 | 11 | % | $ | 43 | 41 | % | $ | 28 | 47 | % | ||||||||||||
Our effective income tax rate decreased by 30% from 41% in 2016 to 11% in 2017. The decrease was primarily attributable to a revaluation of deferred taxes due to federal legislative changes enacted in the fourth quarter ended December 31, 2017. The remaining decrease consisted of tax benefits recognized from excess tax benefits related to stock-based compensation, qualified production activities deduction for certain software offerings pursuant to Internal Revenue Code Section 199 and an increase in tax credits, partially offset by an increase in uncertain tax positions.
The revaluation of deferred taxes resulted in discrete tax (benefit)/expense representing (20)%, (1)% and 5% of the effective tax rate for the years ended December 31, 2017, 2016 and 2015, respectively.
78
FINANCIAL STATEMENTS | |
Deferred Income Taxes
Significant components of our deferred tax assets and liabilities are as follows:
Year Ended December 31, | ||||||
(in millions) | 2017 | 2016 | ||||
Deferred tax assets: | ||||||
Net operating losses (federal and state) | $ | 4 | $ | 4 | ||
Accrued expenses | 6 | 11 | ||||
Accrued workers' compensation costs | 8 | 13 | ||||
Stock-based compensation | 8 | 6 | ||||
Tax benefits relating to uncertain positions | 1 | — | ||||
Tax credits (federal and state) | 9 | 6 | ||||
Total | 36 | 40 | ||||
Valuation allowance | (7 | ) | (6 | ) | ||
Total deferred tax assets | 29 | 34 | ||||
Deferred tax liabilities: | ||||||
Depreciation and amortization | (13 | ) | (8 | ) | ||
Deferred service revenues | (79 | ) | (114 | ) | ||
Prepaid health plan expenses | (3 | ) | (4 | ) | ||
Total deferred tax liabilities | (95 | ) | (126 | ) | ||
Net deferred tax liabilities | $ | (66 | ) | $ | (92 | ) |
We recorded a change of $1 million to the valuation allowance to $7 million in 2017 from $6 million in 2016, related to certain state net operating loss and state tax credit carryforwards adjusted in the current year that may not be utilized prior to expiration. We have $78 million in multiple state net operating loss carryforwards as of December 31, 2017 and have utilized all of the federal net operating loss carryforwards. The state net operating loss carryforwards will begin expiring in 2018.
Excess tax benefits or deficiencies from share-based award activities are now reflected as a component of the provision for income taxes instead of equity. The provision for income taxes for the year ended December 31, 2017 included $16 million of excess tax benefits resulting from equity incentive plan activities.
We have $9 million (net of federal benefit) state tax credit carryforwards available that will begin expiring in 2021, which are partially offset by a valuation allowance of $6 million and $5 million as of December 31, 2017 and 2016, respectively.
We are subject to tax in U.S. federal and various state and local jurisdictions, as well as Canada. We are not subject to any material income tax examinations in federal or state jurisdictions for tax years prior to January 1, 2011. We paid Notices of Proposed Assessments disallowing employment tax credits totaling $11 million, plus interest and penalties of $4 million in connection with the IRS examination of Gevity HR, Inc. and its subsidiaries, which was acquired by TriNet in June 2009. This issue is being resolved through the litigation process. Currently, we anticipate our recovery of the refund is likely less than the total amount.
Pursuant to the Tax Cuts and Jobs Act (TCJA), the approach to the taxation of foreign earnings fundamentally changed to require a mandatory deemed repatriation of undistributed foreign earnings and profits at a repatriation toll charge. As such a toll charge of less than $1 million will be assessed on our Canadian subsidiary's undistributed earnings of $4 million as of December 31, 2017.
Uncertain Tax Positions
As of December 31, 2017 and 2016, the total unrecognized tax benefits related to uncertain income tax positions, which would affect the effective tax rate if recognized, were $5 million and $1 million, respectively.
A reconciliation of the beginning and ending amount of unrecognized tax benefits (excluding interest and penalties) is as follows:
79
FINANCIAL STATEMENTS | |
Year Ended December 31, | |||||||||
(in millions) | 2017 | 2016 | 2015 | ||||||
Unrecognized tax benefits at January 1 | $ | 1 | $ | 3 | $ | 2 | |||
Additions for tax positions of prior periods | 4 | — | — | ||||||
Additions for tax positions of current period | 1 | — | 1 | ||||||
Reductions for tax positions of prior period: | |||||||||
Settlements with taxing authorities | — | (2 | ) | — | |||||
Unrecognized tax benefits at December 31 | $ | 6 | $ | 1 | $ | 3 | |||
As of December 31, 2017, the total amount of gross interest and penalties accrued was immaterial and $1 million as of December 31, 2016. The unrecognized tax benefit, including accrued interest and penalties are included in other liabilities on the consolidated balance sheet.
It is reasonably possible the amount of the unrecognized benefit could increase or decrease within the next twelve months, which would have an impact on net income.
NOTE 13. COMMITMENTS AND CONTINGENCIES
Lease Commitments
We lease office facilities, including our headquarters and other facilities under non-cancelable operating leases. The schedule of minimum future rental payments under non-cancelable operating leases having initial terms in excess of one year at December 31, 2017, is as follows:
(in millions) | Operating Leases | ||
Year ending December 31: | |||
2018 | $ | 17 | |
2019 | 15 | ||
2020 | 14 | ||
2021 | 9 | ||
2022 | 7 | ||
Thereafter | 10 | ||
Minimum lease payments | $ | 72 | |
The lease agreements generally provide for rental payments on a graduated basis and for options to renew, which could increase future minimum lease payments if exercised. We recognize rent expense on a straight-line basis over the lease period and accrue for rent expense incurred but not paid. Rent expense for the years ended December 31, 2017, 2016 and 2015 was $18 million, $17 million and $13 million, respectively.
Credit Facilities
We maintain a $75 million revolving credit facility which includes capacity for a $40 million letter of credit facility and a $10 million swingline facility. Letters of credit issued pursuant to the revolving credit facility reduce the amount available for borrowing under the revolving credit facility. The total unused portion of the revolving credit facility was $60 million as of December 31, 2017.
The terms of the credit agreement governing the revolving credit facility require us to maintain certain financial ratios at each quarter end. We were in compliance with these covenants as of December 31, 2017.
We also have a $5 million line of credit facility to secure standby letters of credit related to our workers' compensation obligation. At December 31, 2017, the total unused portion of the credit facility was $3 million.
80
FINANCIAL STATEMENTS | |
Standby Letters of Credit
We have two standby letters of credit up to an aggregate of $18 million provided as collateral for our workers’ compensation obligations. At December 31, 2017, the facilities were not drawn down.
Contingencies
In August 2015, Howard Welgus, a purported stockholder filed a putative securities class action lawsuit, Welgus v. TriNet Group, Inc. et. al., under the Securities Exchange Act of 1934 in the United States District Court (the Court) for the Northern District of California. The complaint was later amended in April 2016 and again in March 2017. On December 19, 2017, the Court granted TriNet’s motion to dismiss the amended complaint in its entirety, without leave to amend. Plaintiff filed a notice of appeal of the district court’s order on January 17, 2018. We will defend the appeal of the district court’s decision vigorously as we see no basis for reversal. We are unable to reasonably estimate the possible loss or expense, or range of losses and expenses, if any, arising from this litigation.
We are and, from time to time, have been and may in the future become involved in various litigation matters, legal proceedings and claims arising in the ordinary course of its business, including disputes with our clients or various class action, collective action, representative action and other proceedings arising from the nature of our co-employment relationship with our clients and WSEs in which we are named as a defendant. In addition, due to the nature of our co-employment relationship with our clients and WSEs, we could be subject to liability for federal and state law violations, even if we do not participate in such violations. While our agreements with our clients contain indemnification provisions related to the conduct of our clients, we may not be able to avail ourselves of such provisions in every instance. We have accrued our current best estimates of probable losses with respect to these matters which are individually and in aggregate immaterial to our consolidated financial statements.
While the outcome of the matters described above cannot be predicted with certainty, management currently does not believe that any such claims or proceedings or the above mentioned securities class action will have a materially adverse effect on our consolidated financial position, results of operations or cash flows. However, the unfavorable resolution of any particular matter or our reassessment of our exposure for any of the above matters based on additional information obtained in the future could have a material impact on our consolidated financial position, results of operations or cash flows.
NOTE 14. RELATED PARTY TRANSACTIONS
We have service agreements with certain stockholders that we process their employees' payrolls and payroll taxes. From time to time, we also enter into sales and purchases agreements with various companies that have a relationship with our executive officers or members of our board of directors. The relationships are typically an equity investment by the executive officer or board member in the customer / vendor company or our executive officer or board member is a member of the customer / vendor company's board of directors. We have received $22 million, $10 million, and $6 million in total revenues from such related parties during the years ended December 31, 2017, 2016 and 2015, respectively.
We have also entered into various software license agreements with software service providers who have board members in common with us. We paid the software service providers $6 million, $7 million, and $4 million during the years ended December 31, 2017, 2016 and 2015, for services we received, respectively.
FINANCIAL STATEMENTS | |
NOTE 15. QUARTERLY FINANCIAL DATA (UNAUDITED)
Quarter ended | ||||||||||||
(In millions, except per share data) | March 31 | June 30 | September 30 | December 31 | ||||||||
2017 | ||||||||||||
Total revenues | $ | 808 | $ | 801 | $ | 818 | $ | 848 | ||||
Insurance costs | 609 | 600 | 613 | 644 | ||||||||
Operating income | 49 | 57 | 63 | 48 | ||||||||
Net income (1) | 29 | 40 | 43 | 66 | ||||||||
Basic net income per share (1) | $ | 0.42 | $ | 0.58 | $ | 0.62 | $ | 0.95 | ||||
Diluted net income per share (1) | $ | 0.41 | $ | 0.56 | $ | 0.60 | $ | 0.92 | ||||
2016 | ||||||||||||
Total revenues | $ | 733 | $ | 746 | $ | 770 | $ | 811 | ||||
Insurance costs | 570 | 597 | 609 | 638 | ||||||||
Operating income | 26 | 26 | 29 | 43 | ||||||||
Net income | 11 | 12 | 15 | 23 | ||||||||
Basic net income per share | $ | 0.16 | $ | 0.17 | $ | 0.21 | $ | 0.34 | ||||
Diluted net income per share | $ | 0.16 | $ | 0.17 | $ | 0.20 | $ | 0.32 | ||||
(1) Results of the quarter ended December 31, 2017 included a $40 million benefit due to tax rate change as a result of the TCJA enactment. Refer to Note 12 in these consolidated financial statements for additional discussion.
DISCLOSURE CONTROLS AND PROCEDURES | |
Item 9. Changes in and Disagreements with Accountants on Accounting and Financial Disclosure.
None.
Item 9A. Controls and Procedures
Evaluation of Disclosure Controls and Procedures
We have, with the participation of our Chief Executive Officer (CEO) and our Chief Financial Officer (CFO), evaluated the effectiveness of our disclosure controls and procedures as of December 31, 2017 as defined in Rules 13a-15(e) and 15d-15(e) under the Securities Exchange Act of 1934, as amended, or the Exchange Act.
Based on the evaluation of our disclosure controls and procedures as of December 31, 2017, our Chief Executive Officer and Chief Financial Officer concluded that, as of such date, our disclosure controls and procedures were not effective as a result of the material weakness in our internal control over financial reporting, as further described below.
A material weakness is a deficiency, or a combination of deficiencies, in internal control over financial reporting such that there is a reasonable possibility that a material misstatement of our annual or interim financial statements will not be prevented or detected on a timely basis.
Notwithstanding the material weakness in our internal control over financial reporting, we have concluded that the consolidated financial statements included in this Annual Report on Form 10-K fairly present, in all material respects, our financial position, results of operations and cash flows for the periods presented in conformity with accounting principles generally accepted in the United States of America. Additionally, the material weakness did not result in any restatements of our consolidated financial statements or disclosures for any prior period.
Management’s Report on Internal Control Over Financial Reporting
We are responsible for establishing and maintaining adequate internal control over financial reporting as defined in Rules 13a-15(f) and 15d-15(f) promulgated under the Exchange Act to provide reasonable assurance regarding the reliability of financial reporting and the preparation of financial statements for external purposes in accordance with GAAP.
Due to inherent limitations, internal control over financial reporting is not intended to provide absolute assurance that a misstatement of our financial statements would be prevented or detected. Also, projections of any evaluation of effectiveness to future periods are subject to the risk that controls may become inadequate because of changes in conditions or that the degree of compliance with policies or procedures may deteriorate.
We, conducted an evaluation of the effectiveness of our internal control over financial reporting as of December 31, 2017 based on the Integrated Framework (2013) issued by the Committee of Sponsoring Organizations of the Treadway Commission. Based on the foregoing, we concluded that our internal controls over financial reporting as of December 31, 2017 were not effective as a result of the material weakness described below.
Deloitte & Touche LLP, our independent registered public accounting firm, has issued an audit report on the effectiveness of our internal control over financial reporting as of December 31, 2017. This audit report appears below.
Revenue
We have determined that we have several control deficiencies aggregating to a material weakness related to the operating effectiveness of controls over professional service and workers' compensation insurance services revenues as of December 31, 2017. This was primarily caused by control deficiencies related to the lack of complete review and available support for our renewal rate price changes.
DISCLOSURE CONTROLS AND PROCEDURES | |
Changes in Internal Control over Financial Reporting
As of December 31, 2017, our testing of both the design and operating effectiveness of new and re-designed controls was completed, and we have concluded that the following material weaknesses existing at December 31, 2016 have been remediated:
• | Entity Level Controls - Control Activities and Monitoring |
• | Information Technology General Controls (ITGC) |
• | Payroll Tax Liabilities |
• | Insurance Costs and Insurance Liabilities |
• | Payroll Operations and controls over price changes to Health Services revenue |
Except for the changes described above there were no changes in our internal control over financial reporting identified in our evaluation pursuant to Rules 13a-15(d) or 15d-15(d) of the Exchange Act during the fourth quarter ended December 31, 2017 that materially affected, or are reasonably likely to materially affect, our internal control over financial reporting.
Planned Remediation Activities
We will continue to further strengthen controls around the accuracy and completeness of invoice rate verification processes and implement improved documentation processes to evidence our controls. We will continue to consolidate platforms in 2018 and retire our legacy SOI platform which will reduce a significant number of manual business process controls.
We will continue to test and evaluate the implementation of these new processes and internal controls during 2018 to ascertain whether they are designed and operating effectively to provide reasonable assurance that they would prevent or detect a material error in our financial statements.
While we intend to resolve all of the material control deficiencies, we cannot provide any assurance that these remediation efforts will be successful or that our internal control over financial reporting will be effective as a result of these efforts by any particular date.
DISCLOSURE CONTROLS AND PROCEDURES | |
REPORT OF INDEPENDENT REGISTERED PUBLIC ACCOUNTING FIRM
To the shareholders and Board of Directors of TriNet Group, Inc.
Opinion on Internal Control over Financial Reporting
We have audited the internal control over financial reporting of TriNet Group, Inc. and subsidiaries (the "Company”) as of December 31, 2017, based on criteria established in Internal Control - Integrated Framework (2013) issued by the Committee of Sponsoring Organizations of the Treadway Commission (COSO). In our opinion, because of the effect of the material weakness identified below on the achievement of the objectives of the control criteria, the Company has not maintained effective internal control over financial reporting as of December 31, 2017, based on criteria established in Internal Control - Integrated Framework (2013) issued by COSO.
We have also audited, in accordance with the standards of the Public Company Accounting Oversight Board (United States) (PCAOB), the consolidated financial statements and financial statement schedule as of and for the year ended December 31, 2017, of the Company and our report dated February 27, 2018 expressed an unqualified opinion on those financial statements and financial statement schedule.
Basis for Opinion
The Company’s management is responsible for maintaining effective internal control over financial reporting and for its assessment of the effectiveness of internal control over financial reporting, included in the accompanying Management's Report on Internal Control Over Financial Reporting. Our responsibility is to express an opinion on the Company’s internal control over financial reporting based on our audit. We are a public accounting firm registered with the PCAOB and are required to be independent with respect to the Company in accordance with the U.S. federal securities laws and the applicable rules and regulations of the Securities and Exchange Commission and the PCAOB.
We conducted our audit in accordance with the standards of the PCAOB. Those standards require that we plan and perform the audit to obtain reasonable assurance about whether effective internal control over financial reporting was maintained in all material respects. Our audit included obtaining an understanding of internal control over financial reporting, assessing the risk that a material weakness exists, testing and evaluating the design and operating effectiveness of internal control based on the assessed risk, and performing such other procedures as we considered necessary in the circumstances. We believe that our audit provides a reasonable basis for our opinion.
Definition and Limitations of Internal Control over Financial Reporting
A company's internal control over financial reporting is a process designed to provide reasonable assurance regarding the reliability of financial reporting and the preparation of financial statements for external purposes in accordance with generally accepted accounting principles. A company's internal control over financial reporting includes those policies and procedures that (1) pertain to the maintenance of records that, in reasonable detail, accurately and fairly reflect the transactions and dispositions of the assets of the company; (2) provide reasonable assurance that transactions are recorded as necessary to permit preparation of financial statements in accordance with generally accepted accounting principles, and that receipts and expenditures of the company are being made only in accordance with authorizations of management and directors of the company; and (3) provide reasonable assurance regarding prevention or timely detection of unauthorized acquisition, use, or disposition of the company's assets that could have a material effect on the financial statements.
Because of its inherent limitations, internal control over financial reporting may not prevent or detect misstatements. Also, projections of any evaluation of the effectiveness to future periods are subject to the risk that controls may become inadequate because of changes in conditions, or that the degree of compliance with the policies or procedures may deteriorate.
DISCLOSURE CONTROLS AND PROCEDURES | |
Material Weakness
A material weakness is a deficiency, or a combination of deficiencies, in internal control over financial reporting, such that there is a reasonable possibility that a material misstatement of the company’s annual or interim financial statements will not be prevented or detected on a timely basis. The following material weakness has been identified and included in management's assessment:
• | Ineffective controls over revenue from professional service and workers’ compensation insurance services due to the lack of complete review and available support for the Company’s renewal rate price changes |
This material weakness was considered in determining the nature, timing, and extent of audit tests applied in our audit of the consolidated financial statements and financial statement schedule as of and for the year ended December 31, 2017, of the Company, and this report does not affect our report on such financial statements.
/s/ DELOITTE & TOUCHE LLP
San Francisco, California
February 27, 2018
Item 9B. Other Information.
Not applicable.
MANAGEMENT AND CERTAIN SECURITY HOLDERS | |
PART III
Item 10. Directors, Executive Officers and Corporate Governance.
Information required by this item is incorporated by reference to TriNet Group Inc.’s Proxy Statement for its 2018 Annual Meeting of Shareholders to be filed with the SEC within 120 days after the end of the year ended December 31, 2017.
Item 11. Executive Compensation.
Information required by this item is incorporated by reference to TriNet Group Inc.’s Proxy Statement for its 2018 Annual Meeting of Shareholders to be filed with the SEC within 120 days after the end of the year ended December 31, 2017.
Item 12. Security Ownership of Certain Beneficial Owners and Management and Related Stockholder Matters.
Information required by this item is incorporated by reference to TriNet Group Inc.’s Proxy Statement for its 2018 Annual Meeting of Shareholders to be filed with the SEC within 120 days after the end of the year ended December 31, 2017.
Item 13. Certain Relationships and Related Transactions, and Director Independence.
Information required by this item is incorporated by reference to TriNet Group Inc.’s Proxy Statement for its 2018 Annual Meeting of Shareholders to be filed with the SEC within 120 days after the end of the year ended December 31, 2017.
Item 14. Principal Accounting Fees and Services.
Information required by this item is incorporated by reference to TriNet Group Inc.’s Proxy Statement for its 2018 Annual Meeting of Shareholders to be filed with the SEC within 120 days after the end of the year ended December 31, 2017.
FINANCIAL STATEMENT SCHEDULES | |
PART IV
Item 15. Exhibits, Financial Statement Schedules.
(a) The following documents are filed as a part of the report:
(1) The financial statements filed as part of this report are listed in the “Index to Financial Statements” under Part II, Item 8 of this report.
(2) Financial statement schedules.
SCHEDULE II-VALUATION AND QUALIFYING ACCOUNTS
Balance at | Credited/ | Charges | Balance at | |||||||
Beginning of | Charged to | Utilized/ | End of | |||||||
(in millions) | Period | Net Income | Write-Offs | Period | ||||||
Allowances for Doubtful Accounts and Authorized Credits | ||||||||||
Year ended December 31, 2017 | $ | — | 1 | (1 | ) | $ | — | |||
Year ended December 31, 2016 | $ | 1 | 1 | (2 | ) | $ | — | |||
Year ended December 31, 2015 | $ | — | 2 | (1 | ) | $ | 1 | |||
Tax Valuation Allowance | ||||||||||
Year ended December 31, 2017 | $ | 6 | 1 | — | $ | 7 | ||||
Year ended December 31, 2016 | $ | 5 | 1 | — | $ | 6 | ||||
Year ended December 31, 2015 | $ | 7 | — | (2 | ) | $ | 5 | |||
Item 16. Exhibits, Financial Statement Schedules.
None.
EXHIBITS | |
EXHIBIT INDEX
Incorporated by Reference | |||||||||||||
Exhibit No. | Description of Exhibit | Form | File No. | Exhibit | Filing | Filed Herewith | |||||||
2.1 | S-1 | 333-192465 | 2.1 | 11/21/2013 | |||||||||
2.2 | S-1 | 333-192465 | 2.2 | 11/21/2013 | |||||||||
3.1 | 8-K | 001-36373 | 3.1 | 4/1/2014 | |||||||||
3.2 | 10-Q | 001-36373 | 3.1 | 11/2/2017 | |||||||||
3.3 | S-1/A | 333-192465 | 3.4 | 3/4/2014 | |||||||||
4.1 | 8-K | 001-36373 | 4.1 | 2/2/2017 | |||||||||
10.1* | S-1/A | 333-192465 | 10.3 | 3/14/2014 | |||||||||
10.2* | 10-Q | 001-36373 | 10.1 | 5/8/2015 | |||||||||
10.3* | S-1/A | 333-192465 | 10.4 | 3/4/2014 | |||||||||
10.4* | S-1/A | 333-192465 | 10.6 | 3/4/2014 | |||||||||
10.5* | S-1/A | 333-192465 | 10.7 | 3/14/2014 | |||||||||
10.6* | 8-K | 001-36373 | N/A | 3/11/2015 | |||||||||
10.7* | X | ||||||||||||
10.8* | 10-K | 001-36373 | 10.10 | 4/1/2016 | |||||||||
10.9* | 8-K | 001-36373 | 10.1 | 5/23/2017 | |||||||||
10.10* | S-1/A | 333-192465 | 10.8 | 3/4/2014 | |||||||||
10.11* | S-1/A | 333-192465 | 10.9 | 2/13/2014 | |||||||||
EXHIBITS | |
Incorporated by Reference | |||||||||||||
Exhibit No. | Description of Exhibit | Form | File No. | Exhibit | Filing | Filed Herewith | |||||||
10.12* | 10-Q | 001-36373 | 10.1 | 8/1/2017 | |||||||||
10.13* | 10-Q | 001-36373 | 10.2 | 8/6/2015 | |||||||||
10.14* | 10-Q | 001-36373 | 10.2 | 8/1/2017 | |||||||||
10.15* | X | ||||||||||||
10.16* | S-1/A | 333-192465 | 10.12 | 2/13/2014 | |||||||||
10.17* | S-1/A | 333-192465 | 10.11 | 2/13/2014 | |||||||||
10.18* | 8-K | 001-36373 | 10.1 | 10/3/2016 | |||||||||
10.19* | X | ||||||||||||
10.20 | 8-K | 001-36373 | 10.1 | 12/22/2016 | |||||||||
10.21 | 8-K | 001-36373 | 10.1 | 7/10/2014 | |||||||||
10.22 | 8-K | 001-36373 | 10.1 | 8/1/2016 | |||||||||
16.1 | 8-K | 001-36373 | 16.1 | 5/10/2016 | |||||||||
21.1 | X | ||||||||||||
23.1 | X | ||||||||||||
23.2 | X | ||||||||||||
EXHIBITS | |
Incorporated by Reference | |||||||||||||
Exhibit No. | Description of Exhibit | Form | File No. | Exhibit | Filing | Filed Herewith | |||||||
24.1 | |||||||||||||
31.1 | X | ||||||||||||
31.2 | X | ||||||||||||
32.1** | X | ||||||||||||
101.INS | XBRL Instance Document. | X | |||||||||||
101.SCH | XBRL Taxonomy Extension Schema Document. | X | |||||||||||
101.CAL | XBRL Taxonomy Extension Calculation Linkbase Document. | X | |||||||||||
101.DEF | XBRL Taxonomy Extension Definition Linkbase Document. | X | |||||||||||
101.LAB | XBRL Taxonomy Extension Label Linkbase Document. | X | |||||||||||
101.PRE | XBRL Taxonomy Extension Presentation Linkbase Document. | X | |||||||||||
* | Constitutes a management contract or compensatory plan or arrangement. | ||||||||||||
** | Document has been furnished, is deemed not filed and is not to be incorporated by reference into any of the Company’s filings under the Securities Act of 1933, as amended, or the Securities Exchange Act of 1934, as amended, irrespective of any general incorporation language contained in any such filing. | ||||||||||||
SIGNATURES | |
SIGNATURES
Pursuant to the requirements of Section 13 or 15(d) of the Securities Exchange Act of 1934, the Registrant has duly caused this report to be signed on its behalf by the undersigned, thereunto duly authorized, in the City of San Leandro, State of California, on the day of 27th February, 2018.
TRINET GROUP, INC. | |||
Date: February 27, 2018 | By: | /s/ Burton M. Goldfield | |
Burton M. Goldfield | |||
Chief Executive Officer | |||
KNOW ALL PERSONS BY THESE PRESENTS, that each person whose signature appears below constitutes and appoints Burton M. Goldfield, Richard Beckert and Brady Mickelsen, and each of them, as his or her true and lawful attorneys-in-fact and agents, each with the full power of substitution, for him or her and in his or her name, place or stead, in any and all capacities, to sign any amendments to this report and to file the same, with exhibits thereto, and other documents in connection therewith, with the Securities and Exchange Commission, hereby ratifying and confirming all that any of said attorneys-in-fact and agents, or their or his substitute or substitutes, may lawfully do or cause to be done by virtue hereof.
SIGNATURES | |
Pursuant to the requirements of the Securities Exchange Act of 1934, this report has been signed by the following persons on behalf of the Registrant and in the capacities and on the dates indicated.
Signature | Title | Date | ||
/s/ Burton M. Goldfield | Chief Executive Officer (principal executive officer) | February 27, 2018 | ||
Burton M. Goldfield | ||||
/s/ Richard Beckert | Chief Financial Officer (principal financial officer) | February 27, 2018 | ||
Richard Beckert | ||||
/s/ Michael P. Murphy | Chief Accounting Officer (principal accounting officer) | February 27, 2018 | ||
Michael P. Murphy | ||||
/s/ Michael J. Angelakis | Director | February 27, 2018 | ||
Michael J. Angelakis | ||||
/s/ Katherine August-deWilde | Director | February 27, 2018 | ||
Katherine August-deWilde | ||||
/s/ Martin Babinec | Director | February 27, 2018 | ||
Martin Babinec | ||||
/s/ H. Raymond Bingham | Director | February 27, 2018 | ||
H. Raymond Bingham | ||||
/s/ Paul Chamberlain | Director | February 27, 2018 | ||
Paul Chamberlain | ||||
/s/ Kenneth Goldman | Director | February 27, 2018 | ||
Kenneth Goldman | ||||
/s/ David C. Hodgson | Director | February 27, 2018 | ||
David C. Hodgson | ||||
/s/ Wayne B. Lowell | Director | February 27, 2018 | ||
Wayne B. Lowell | ||||