Attached files
| file | filename |
|---|---|
| EX-10.26 - EXHIBIT 10.26 JANET LINK SEVERANCE AGREEMENT - STANLEY BLACK & DECKER, INC. | ex1026janetlinkseveranceag.htm |
| EX-32.2 - EXHIBIT 32.2 - STANLEY BLACK & DECKER, INC. | ex-10kx32210k2017.htm |
| EX-32.1 - EXHIBIT 32.1 - STANLEY BLACK & DECKER, INC. | ex-10kx32110k2017.htm |
| EX-31.1B - EXHIBIT 31.1B - STANLEY BLACK & DECKER, INC. | ex-10kx311b10k2017.htm |
| EX-31.1A - EXHIBIT 31.1A - STANLEY BLACK & DECKER, INC. | ex-10kx311a10k2017.htm |
| EX-24 - EXHIBIT 24 POWER OF ATTORNEY - STANLEY BLACK & DECKER, INC. | ex24-powerofattorney10k2017.htm |
| EX-23 - EXHIBIT 23 CONSENT - STANLEY BLACK & DECKER, INC. | ex23-consent10k2017.htm |
| EX-21 - EXHIBIT 21 SUBSIDIARIES LIST - STANLEY BLACK & DECKER, INC. | ex21-subsidiariesofstanley.htm |
| EX-12 - EXHIBIT 12 ETFC - STANLEY BLACK & DECKER, INC. | ex12computationofratioofea.htm |
| EX-10.25 - EXHIBIT 10.25 JANET LINK OFFER LETTER - STANLEY BLACK & DECKER, INC. | ex1025janetlinkofferletter.htm |
| EX-10.16B - EXHIBIT 10.16B - STANLEY BLACK & DECKER, INC. | ex1016bformofawardl3andup.htm |
UNITED STATES
SECURITIES AND EXCHANGE COMMISSION
WASHINGTON, D.C. 20549
ANNUAL REPORT
PURSUANT TO SECTIONS 13 OR 15(d)
OF THE SECURITIES EXCHANGE ACT OF 1934
þ | ANNUAL REPORT PURSUANT TO SECTION 13 OR 15(d) OF THE SECURITIES EXCHANGE ACT OF 1934 |
For the fiscal year ended December 30, 2017
OR
¨ | TRANSITION REPORT PURSUANT TO SECTION 13 OR 15(d) OF THE SECURITIES EXCHANGE ACT OF 1934 |
For the transition period from ___________ to ___________
COMMISSION FILE 1-5224
STANLEY BLACK & DECKER, INC.
(Exact Name Of Registrant As Specified In Its Charter)
Connecticut | 06-0548860 | |
(State Or Other Jurisdiction Of Incorporation Or Organization) | (I.R.S. Employer Identification Number) | |
1000 Stanley Drive New Britain, Connecticut | 06053 | |
(Address Of Principal Executive Offices) | (Zip Code) | |
860-225-5111
(Registrant’s Telephone Number)
Securities Registered Pursuant To Section 12(b) Of The Act:
Title Of Each Class | Name Of Each Exchange On Which Registered | |
Common Stock-$2.50 Par Value per Share | New York Stock Exchange | |
Securities Registered Pursuant To Section 12(g) Of The Act:
None
Indicate by check mark if the registrant is a well-known seasoned issuer, as defined in Rule 405 of the Securities Act of 1933.
Yes þ No ¨
Indicate by check mark if the registrant is not required to file reports pursuant to Section 13 or 15(d) of the Securities Exchange Act of 1934.
Yes ¨ No þ
Indicate by check mark whether the registrant (1) has filed all reports required to be filed by Section 13 or 15(d) of the Securities Exchange Act of 1934 during the preceding 12 months and (2) has been subject to such filing requirements for the past 90 days.
Yes þ No ¨
Indicate by check mark whether the registrant has submitted electronically and posted on its corporate Web site, if any, every Interactive Data File required to be submitted and posted pursuant to Rule 405 of Regulation S-T (§ 232.405 of this chapter) during the preceding 12 months (or for such shorter period that the registrant was required to submit and post such files). Yes þ No ¨
Indicate by check mark if disclosure of delinquent filers pursuant to Item 405 of Regulation S-K is not contained herein, and will not be contained, to the best of registrant’s knowledge, in definitive proxy or information statements incorporated by reference in Part III of this Form 10-K or any amendment to this Form 10-K.¨
Indicate by check mark whether the registrant is a large accelerated filer, an accelerated filer, a non-accelerated filer, or a smaller reporting company. See the definitions of “large accelerated filer,” “accelerated filer” and “smaller reporting company” in Rule 12b-2 of the Exchange Act. (Check one):
Large accelerated filer | þ | Accelerated filer | ¨ | |
Non-accelerated filer | ¨ (Do not check if a smaller reporting company) | Smaller reporting company | ¨ | |
Emerging growth company | ¨ | |||
If an emerging growth company, indicate by check mark if the registrant has elected not to use the extended transition period for complying with any new or revised financial accounting standards provided pursuant to Section 13(a) of the Exchange Act. ¨
Indicate by check mark whether the registrant is a shell company (as defined in Exchange Act Rule 12b-2).
Yes ¨ No þ
As of June 30, 2017, the aggregate market values of voting common equity held by non-affiliates of the registrant was $21.6 billion based on the New York Stock Exchange closing price for such shares on that date. On February 22, 2018, the registrant had 154,111,483 shares of common stock outstanding.
DOCUMENTS INCORPORATED BY REFERENCE
Portions of the registrant’s definitive proxy statement to be filed pursuant to Regulation 14A within 120 days after the end of the registrant’s fiscal year are incorporated by reference in Part III of the Annual Report on Form 10-K.
TABLE OF CONTENTS
ITEM 1. | |||
ITEM 1A. | |||
ITEM 1B. | |||
ITEM 2. | |||
ITEM 3. | |||
ITEM 4. | |||
ITEM 5. | |||
ITEM 6. | |||
ITEM 7. | |||
ITEM 7A. | |||
ITEM 8. | |||
ITEM 9. | |||
ITEM 9A. | |||
ITEM 9B. | |||
ITEM 10. | |||
ITEM 11. | |||
ITEM 12. | |||
ITEM 13. | |||
ITEM 14. | |||
ITEM 15. | |||
ITEM 16. | |||
SIGNATURES | |||
EX-10.16.b | |||
EX-10.25 | |||
EX-10.26 | |||
EX-12 | |||
EX-21 | |||
EX-23 | |||
EX-24 | |||
EX-31.1.a | |||
EX-31.1.b | |||
EX-32.1 | |||
EX-32.2 | |||
2
FORM 10-K
PART I
ITEM 1. BUSINESS
General
Stanley Black & Decker, Inc. ("the Company") was founded 175 years ago, in 1843, by Frederick T. Stanley and incorporated in Connecticut in 1852. In March 2010, the Company completed a merger ("the Merger") with The Black & Decker Corporation (“Black & Decker”), a company founded by S. Duncan Black and Alonzo G. Decker and incorporated in Maryland in 1910. At that time, the Company changed its name from The Stanley Works ("Stanley") to Stanley Black & Decker, Inc.
The Company is a diversified global provider of hand tools, power tools and related accessories, engineered fastening systems and products, services and equipment for oil & gas and infrastructure applications, commercial electronic security and monitoring systems, healthcare solutions, and mechanical access solutions (primarily automatic doors), with 2017 consolidated annual revenues of $12.7 billion. Approximately 54% of the Company’s 2017 revenues were generated in the United States, with the remainder largely from Europe (22%), emerging markets (14%) and Canada (5%).
The Company continues to pursue a growth and acquisition strategy that involves industry, geographic and customer diversification to foster sustainable revenue, earnings and cash flow growth. The Company remains focused on organic growth, including increasing its presence in emerging markets, and leveraging the Stanley Fulfillment System ("SFS 2.0"), which focuses on digital excellence, commercial excellence, breakthrough innovation, core SFS operating principles, and functional transformation. In addition, the Company continues to make strides towards achieving its 22/22 Vision of reaching $22 billion in revenue by 2022 while expanding the margin rate, by becoming known as one of the world’s leading innovators, delivering top-quartile financial performance and elevating its commitment to social responsibility.
Execution of the above strategy has already resulted in approximately $8.9 billion of acquisitions since 2002 (excluding the Black & Decker merger and pending acquisition of the Nelson Fastener Systems industrial business, as discussed below), which was enabled by strong cash flow generation and increased debt capacity. This strategy is further exemplified by the Company's March 2017 acquisitions of the Tools business of Newell Brands ("Newell Tools") for approximately $1.84 billion and the Craftsman® brand from Sears Holdings Corporation ("Sears Holdings") for an estimated cash purchase price of approximately $900 million on a discounted basis. The Newell Tools acquisition, which includes the industrial cutting, hand tool and power tool accessory brands Irwin® and Lenox®, enhances the Company’s position within the global tools & storage industry and broadens the Company’s product offerings and solutions to customers and end users, particularly within power tool accessories. The Craftsman acquisition provides the Company with the rights to develop, manufacture and sell Craftsman®-branded products in non-Sears Holdings channels. Furthermore, on December 22, 2017, the Company reached an agreement to purchase the industrial business of Nelson Fastener Systems ("Nelson") from the Doncasters Group, which excludes Nelson's automotive stud welding business, for approximately $440 million in cash. This acquisition is complementary to the Company's product offerings, enhances its presence in the general industrial end markets and expands its portfolio of highly engineered fastening solutions. This transaction, which is subject to customary closing conditions including regulatory approval, is expected to close in the first half of 2018. Refer to Note E, Acquisitions, of the Notes to Consolidated Financial Statements in Item 8 for further discussion.
In February 2017, the Company completed the sale of the majority of its mechanical security businesses, which included the commercial hardware brands of Best Access, phi Precision and GMT, for net proceeds of approximately $717 million. This sale allowed the Company to deploy capital in a more accretive and growth-oriented manner. The Company has also divested several smaller businesses in recent years that did not fit into its long-term strategic objectives. Refer to Note T, Divestitures, of the Notes to Consolidated Financial Statements in Item 8 for further discussion.
At December 30, 2017, the Company employed 57,765 people worldwide. The Company’s principal executive office is located at 1000 Stanley Drive, New Britain, Connecticut 06053 and its telephone number is (860) 225-5111.
Description of the Business
The Company’s operations are classified into three reportable business segments, which also represent its operating segments: Tools & Storage, Industrial and Security. All segments have significant international operations and are exposed to translational and transactional impacts from fluctuations in foreign currency exchange rates.
Additional information regarding the Company’s business segments and geographic areas is incorporated herein by reference to the material captioned “Business Segment Results” in Item 7 and Note P, Business Segments and Geographic Areas, of the Notes to Consolidated Financial Statements in Item 8.
3
Tools & Storage
The Tools & Storage segment is comprised of the Power Tools and Equipment ("PTE") and Hand Tools, Accessories & Storage ("HTAS") businesses. The segment sells its products to professional end users, distributors, retail consumers and industrial customers in a wide variety of industries and geographies. The majority of sales are distributed through retailers, including home centers, mass merchants, hardware stores, and retail lumber yards, as well as third-party distributors and a direct sales force. Annual revenues in the Tools & Storage segment were $8.9 billion in 2017, representing 70% of the Company’s total revenues.
The PTE business includes both professional and consumer products. Professional products include professional grade corded and cordless electric power tools and equipment including drills, impact wrenches and drivers, grinders, saws, routers and sanders, as well as pneumatic tools and fasteners including nail guns, nails, staplers and staples, concrete and masonry anchors. Consumer products include corded and cordless electric power tools sold primarily under the BLACK+DECKER® brand, lawn and garden products, including hedge trimmers, string trimmers, lawn mowers, edgers and related accessories, and home products such as hand-held vacuums, paint tools and cleaning appliances.
The HTAS business sells hand tools, power tool accessories and storage products. Hand tools include measuring, leveling and layout tools, planes, hammers, demolition tools, clamps, vises, knives, saws, chisels and industrial and automotive tools. Power tool accessories include drill bits, screwdriver bits, router bits, abrasives, saw blades and threading products. Storage products include tool boxes, sawhorses, medical cabinets and engineered storage solution products.
Industrial
The Industrial segment is comprised of the Engineered Fastening and Infrastructure businesses. Annual revenues in the Industrial segment were $1.9 billion in 2017, representing 15% of the Company’s total revenues.
The Engineered Fastening business primarily sells engineered fastening products and systems designed for specific applications. The product lines include blind rivets and tools, blind inserts and tools, drawn arc weld studs and systems, engineered plastic and mechanical fasteners, self-piercing riveting systems and precision nut running systems, micro fasteners, and high-strength structural fasteners. The business sells to customers in the automotive, manufacturing, electronics, and aerospace industries, amongst others, and its products are distributed through direct sales forces and, to a lesser extent, third-party distributors.
The Infrastructure business consists of the Oil & Gas and Hydraulics businesses. The Oil & Gas business sells and rents custom pipe handling, joint welding and coating equipment used in the construction of large and small diameter pipelines, and provides pipeline inspection services. The Hydraulics business sells hydraulic tools and accessories. The Infrastructure businesses sell to the oil and natural gas pipeline industry and other industrial customers. The products and services are primarily distributed through a direct sales force and, to a lesser extent, third-party distributors.
Security
The Security segment is comprised of the Convergent Security Solutions ("CSS") and Mechanical Access Solutions ("MAS") businesses. Annual revenues in the Security segment were $1.9 billion in 2017, representing 15% of the Company’s total revenues.
The CSS business designs, supplies and installs commercial electronic security systems and provides electronic security services, including alarm monitoring, video surveillance, fire alarm monitoring, systems integration and system maintenance. Purchasers of these systems typically contract for ongoing security systems monitoring and maintenance at the time of initial equipment installation. The business also sells healthcare solutions, which include asset tracking, infant protection, pediatric protection, patient protection, wander management, fall management, and emergency call products. The CSS business sells to consumers, retailers, educational, financial and healthcare institutions, as well as commercial, governmental and industrial customers. The MAS business primarily sells automatic doors to commercial customers. Products for both businesses are sold predominantly on a direct sales basis.
4
Other Information
Competition
The Company competes on the basis of its reputation for product quality, its well-known brands, its commitment to customer service, strong customer relationships, the breadth of its product lines and its innovative products and customer value propositions.
The Company encounters active competition in the Tools & Storage and Industrial segments from both larger and smaller companies that offer the same or similar products and services. Certain large customers offer private label brands (“house brands”) that compete across a wider spectrum of the Company’s Tools & Storage segment product offerings. Competition in the Security segment is generally fragmented via both large international players and regional companies. Competition tends to be based primarily on price, the quality of service and comprehensiveness of the services offered to the customers.
Major Customers
A significant portion of the Company’s Tools & Storage products are sold to home centers and mass merchants in the U.S. and Europe. A consolidation of retailers both in North America and abroad has occurred over time. While this consolidation and the domestic and international expansion of these large retailers have provided the Company with opportunities for growth, the increasing size and importance of individual customers creates a certain degree of exposure to potential sales volume loss. One customer, Lowe's, accounted for 11.7% of the Company's consolidated sales in 2017. No other customer exceeded 10% of consolidated sales in 2017, 2016 or 2015.
Working Capital
The Company continues to practice the five operating principles encompassed by Core SFS, one component of the SFS 2.0 operating system, which work in concert: sales and operations planning ("S&OP"), operational lean, complexity reduction, global supply management, and order-to-cash excellence. The Company develops standardized business processes and system platforms to reduce costs and provide scalability. Core SFS is instrumental in the reduction of working capital as evidenced by the 51% improvement in the Company's working capital turns from 5.9 at the end of 2010 (directly after the Black & Decker merger) to 8.9 at the end of 2017. Excluding the 2017 acquisitions and divestitures, working capital turns were consistent with the record in the prior year of 10.6 turns. The continued efforts to deploy Core SFS across the entire Company and increase working capital turns have created significant opportunities to generate incremental free cash flow (defined as cash flow from operations less capital and software expenditures). The Company plans to continue leveraging Core SFS to generate ongoing improvements, both in the existing business and future acquisitions, in working capital turns, cycle times, complexity reduction and customer service levels, with a long-term goal of sustaining 10+ working capital turns.
Raw Materials
The Company’s products are manufactured using ferrous and non-ferrous metals including, but not limited to, steel, zinc, copper, brass, aluminum and nickel as well as resins. The Company also purchases components such as batteries, motors, and electronic components to use in manufacturing and assembly operations along with resin-based molded parts. The raw materials required are procured globally and generally available from multiple sources at competitive prices. As part of the Company's Enterprise Risk Management, the Company has implemented a supplier risk mitigation strategy in order to identify and address any potential supply disruption associated with commodities, components, finished goods and critical services. The Company does not anticipate difficulties in obtaining supplies for any raw materials or energy used in its production processes.
Backlog
Due to short order cycles and rapid inventory turnover primarily in the Company's Tools & Storage segment, backlog is generally not considered a significant indicator of future performance. At February 3, 2018, the Company had approximately $929 million in unfilled orders, which mainly relate to the Engineered Fastening and Security businesses. Substantially all of these orders are reasonably expected to be filled within the current fiscal year. As of February 4, 2017 and February 6, 2016 unfilled orders amounted to $838 million and $783 million, respectively.
Patents and Trademarks
No business segment is solely dependent, to any significant degree, on patents, licenses, franchises or concessions, and the loss of one or several of these patents, licenses, franchises or concessions would not have a material adverse effect on any of the Company's businesses. The Company owns numerous patents, none of which individually is material to the Company's operations as a whole. These patents expire at various times over the next 20 years. The Company holds licenses, franchises
5
and concessions, none of which individually or in the aggregate are material to the Company's operations as a whole. These licenses, franchises and concessions vary in duration, but generally run from one to 40 years.
The Company has numerous trademarks that are used in its businesses worldwide. In the Tools & Storage segment, significant trademarks include STANLEY®, BLACK+DECKER®, DEWALT®, FLEXVOLT®, Irwin®, Lenox®, Craftsman®, Porter-Cable®, BOSTITCH®, FatMax®, Powers®, Guaranteed Tough®, Innerspace®, Mac Tools®, Proto®, Vidmar®, Facom®, USAG™, DIYZ®, Lista®, and the yellow & black color scheme for power tools and accessories. Significant trademarks in the Industrial segment include STANLEY®, CRC®, LaBounty®, Dubuis®, AeroScout®, Cribmaster®, Expert®, SIDCHROME™, POP®, Warren®, GRIPCO®, Avdel®, HeliCoil®, MasterFix®, Tucker®, NPR®, Dodge®, and Spiralock®. The Security segment includes significant trademarks such as STANLEY®, Blick™, HSM®, Sargent & Greenleaf®, S&G®, SONITROL®, Stanley Access Technologies™, AeroScout®, Hugs®, WanderGuard®, Roam Alert®, MyCall®, Arial® and Bed-Check®. The terms of these trademarks typically vary from 10 to 20 years, with most trademarks being renewable indefinitely for like terms.
Environmental Regulations
The Company is subject to various environmental laws and regulations in the U.S. and foreign countries where it has operations. In the normal course of business, the Company is involved in various legal proceedings relating to environmental issues. The Company’s policy is to accrue environmental investigatory and remediation costs for identified sites when it is probable that a liability has been incurred and the amount of loss can be reasonably estimated. In the event that no amount in the range of probable loss is considered most likely, the minimum loss in the range is accrued. The amount of liability recorded is based on an evaluation of currently available facts with respect to each individual site and includes such factors as existing technology, presently enacted laws and regulations, and prior experience in remediation of contaminated sites. The liabilities recorded do not take into account any claims for recoveries from insurance or third parties. As assessments and remediation progress at individual sites, the amounts recorded are reviewed periodically and adjusted to reflect additional technical and legal information that becomes available. As of December 30, 2017 and December 31, 2016, the Company had reserves of $176.1 million and $160.9 million, respectively, for remediation activities associated with Company-owned properties, as well as for Superfund sites, for losses that are probable and estimable. Of the 2017 amount, $22.5 million is classified as current and $153.6 million as long-term, which is expected to be paid over the estimated remediation period. As of December 30, 2017, the Company has recorded $12.2 million in other assets related to funding by the Environmental Protection Agency ("EPA") and monies received have been placed in trust in accordance with the Consent Decree associated with the West Coast Loading Corporation ("WCLC") proceedings, as further discussed in Note S, Contingencies, of the Notes to Consolidated Financial Statements in Item 8. Accordingly, the Company's cash obligation as of December 30, 2017 associated with the aforementioned remediation activities is $163.9 million. The range of environmental remediation costs that is reasonably possible is $143.4 million to $277.1 million, which is subject to change in the near term. The Company may be liable for environmental remediation of sites it no longer owns. Liabilities have been recorded on those sites in accordance with policy.
The amount recorded for identified contingent liabilities is based on estimates. Amounts recorded are reviewed periodically and adjusted to reflect additional technical and legal information that becomes available. Actual costs to be incurred in future periods may vary from the estimates, given the inherent uncertainties in evaluating certain exposures. Subject to the imprecision in estimating future contingent liability costs, the Company does not expect that any sum it may have to pay in connection with these matters in excess of the amounts recorded will have a materially adverse effect on its financial position, results of operations or liquidity. Additional information regarding environmental matters is available in Note S, Contingencies, of the Notes to Consolidated Financial Statements in Item 8.
Employees
At December 30, 2017, the Company had 57,765 employees, 16,055 of whom are employed in the U.S. Employees in the U.S. totaling 1,237 are covered by collective bargaining agreements negotiated with 27 different local labor unions who are, in turn, affiliated with approximately 6 different international labor unions. The majority of the Company’s hourly-paid and weekly-paid employees outside the U.S. are not covered by collective bargaining agreements. The Company’s labor agreements in the U.S. expire between 2018 and 2021. There have been no significant interruptions of the Company’s operations in recent years due to labor disputes. The Company believes that its relationship with its employees is good.
Research and Development Costs
Research and development costs, which are classified in SG&A, were $252.3 million, $204.4 million and $188.0 million for fiscal years 2017, 2016 and 2015, respectively. The increase in 2017 reflects the Company's continued focus on growth investments and its commitment to the SFS 2.0 Breakthrough Innovation initiative.
6
Available Information
The Company’s website is located at http://www.stanleyblackanddecker.com. This URL is intended to be an inactive textual reference only. It is not intended to be an active hyperlink to the Company's website. The information on the Company's website is not, and is not intended to be, part of this Form 10-K and is not incorporated into this report by reference. The Company makes its Forms 10-K, 10-Q, 8-K and amendments to each available free of charge on its website as soon as reasonably practicable after filing them with, or furnishing them to, the U.S. Securities and Exchange Commission. Also available on the Company's website is the Company's Code of Ethics for CEO and Senior Financial Officers.
ITEM 1A. RISK FACTORS
The Company’s business, operations and financial condition are subject to various risks and uncertainties. You should carefully consider the risks and uncertainties described below, together with all of the other information in this Annual Report on Form 10-K, including those risks set forth under the heading entitled "Cautionary Statements Under the Private Securities Litigation Reform Act of 1995," and in other documents that the Company files with the U.S. Securities and Exchange Commission ("SEC"), before making any investment decision with respect to its securities. If any of the risks or uncertainties actually occur or develop, the Company’s business, financial condition, results of operations and future growth prospects could change. Under these circumstances, the trading prices of the Company’s securities could decline, and you could lose all or part of your investment in the Company’s securities.
Changes in customer preferences, the inability to maintain mutually beneficial relationships with large customers, inventory reductions by customers, and the inability to penetrate new channels of distribution could adversely affect the Company’s business.
The Company has certain significant customers, particularly home centers and major retailers. The two largest customers comprised approximately 21% of net sales, with U.S. and international mass merchants and home centers collectively comprising approximately 29% of net sales. The loss or material reduction of business, the lack of success of sales initiatives, or changes in customer preferences or loyalties, for the Company’s products related to any such significant customer could have a material adverse impact on the Company’s results of operations and cash flows. In addition, the Company’s major customers are volume purchasers, a few of which are much larger than the Company and have strong bargaining power with suppliers. This limits the ability to recover cost increases through higher selling prices. Furthermore, unanticipated inventory adjustments by these customers can have a negative impact on net sales.
If customers in the Convergent Security Solutions ("CSS") business are dissatisfied with services and switch to competitive services, or disconnect for other reasons such as preference for digital technology products or other technology enhancements not then offered by CSS, the Company's attrition rates may increase. In periods of increasing attrition rates, recurring revenue and results of operations may be materially adversely affected. The risk is more pronounced in times of economic uncertainty, as customers may reduce amounts spent on the products and services the Company provides.
In times of tough economic conditions, the Company has experienced significant distributor inventory corrections reflecting de-stocking of the supply chain associated with difficult credit markets. Such distributor de-stocking exacerbated sales volume declines pertaining to weak end user demand and the broader economic recession. The Company’s results may be adversely impacted in future periods by such customer inventory adjustments. Further, the inability to continue to penetrate new channels of distribution may have a negative impact on the Company’s future results.
The Company faces active global competition and if it does not compete effectively, its business may suffer.
The Company faces active competition and resulting pricing pressures. The Company’s products compete on the basis of, among other things, its reputation for product quality, its well-known brands, price, innovation and customer service capabilities. The Company competes with both larger and smaller companies that offer the same or similar products and services or that produce different products appropriate for the same uses. These companies are often located in countries such as China, Taiwan and India where labor and other production costs are substantially lower than in the U.S., Canada and Western Europe. Also, certain large customers offer house brands that compete with some of the Company’s product offerings as a lower-cost alternative. To remain profitable and defend market share, the Company must maintain a competitive cost structure, develop new products and services, lead product innovation, respond to competitor innovations and enhance its existing products in a timely manner. The Company may not be able to compete effectively on all of these fronts and with all of its competitors, and the failure to do so could have a material adverse effect on its sales and profit margins.
Core SFS is a continuous operational improvement process applied to many aspects of the Company’s business such as procurement, quality in manufacturing, maximizing customer fill rates, integrating acquisitions and other key business
7
processes. In the event the Company is not successful in effectively applying the Core SFS principles to its key business processes, including those of acquired businesses, its ability to compete and future earnings could be adversely affected.
In addition, the Company may have to reduce prices on its products and services, or make other concessions, to stay competitive and retain market share. Price reductions taken by the Company in response to customer and competitive pressures, as well as price reductions and promotional actions taken to drive demand that may not result in anticipated sales levels, could also negatively impact its business. The Company engages in restructuring actions, sometimes entailing shifts of production to low-cost countries, as part of its efforts to maintain a competitive cost structure. If the Company does not execute restructuring actions well, its ability to meet customer demand may decline, or earnings may otherwise be adversely impacted. Similarly, if such efforts to reform the cost structure are delayed relative to competitors or other market factors, the Company may lose market share and profits.
Customer consolidation could have a material adverse effect on the Company’s business.
A significant portion of the Company’s products are sold through home centers and mass merchant distribution channels in the U.S. and Europe. A consolidation of retailers in both North America and abroad has occurred over time and the increasing size and importance of individual customers creates risk of exposure to potential volume loss. The loss of certain larger home centers as customers would have a material adverse effect on the Company’s business until either such customers were replaced or the Company made the necessary adjustments to compensate for the loss of business.
Low demand for new products and the inability to develop and introduce new products at favorable margins could adversely impact the Company’s performance and prospects for future growth.
The Company’s competitive advantage is due in part to its ability to develop and introduce new products in a timely manner at favorable margins. The uncertainties associated with developing and introducing new products, such as market demand and costs of development and production may impede the successful development and introduction of new products on a consistent basis. Introduction of new technology may result in higher costs to the Company than that of the technology replaced. That increase in costs, which may continue indefinitely or until increased demand and greater availability in the sources of the new technology drive down its cost, could adversely affect the Company’s results of operations. Market acceptance of the new products introduced in recent years and scheduled for introduction in future years may not meet sales expectations due to various factors, such as the failure to accurately predict market demand, end-user preferences, and evolving industry standards. Moreover, the ultimate success and profitability of the new products may depend on the Company’s ability to resolve technical and technological challenges in a timely and cost-effective manner, and to achieve manufacturing efficiencies. The Company’s investments in productive capacity and commitments to fund advertising and product promotions in connection with these new products could erode profits if those expectations are not met.
The Company’s brands are important assets of its businesses and violation of its trademark rights by imitators, or the failure of its licensees or vendors to comply with the Company’s product quality, manufacturing requirements, marketing standards, and other requirements could negatively impact revenues and brand reputation.
The Company’s trademarks have a reputation for quality and value and are important to the Company's success and competitive position. Unauthorized use of the Company’s trademark rights may not only erode sales of the Company’s products, but may also cause significant damage to its brand name and reputation, interfere with its ability to effectively represent the Company to its customers, contractors, suppliers, and/or licensees, and increase litigation costs. Similarly, failure by licensees or vendors to adhere to the Company’s standards of quality and other contractual requirements could result in loss of revenue, increased litigation, and/or damage to the Company’s reputation and business. There can be no assurance that the Company’s ongoing efforts to protect its brand and trademark rights and ensure compliance with its licensing and vendor agreements will prevent all violations.
Successful sales and marketing efforts depend on the Company’s ability to recruit and retain qualified employees.
The success of the Company’s efforts to grow its business depends on the contributions and abilities of key executives, its sales force and other personnel, including the ability of its sales force to adapt to any changes made in the sales organization and achieve adequate customer coverage. The Company must therefore continue to recruit, retain and motivate management, sales and other personnel sufficiently to maintain its current business and support its projected growth. A shortage of these key employees might jeopardize the Company’s ability to implement its growth strategy.
8
The Company has significant operations outside of the United States, which are subject to political, economic and other risks inherent in operating outside of the United States.
The Company generates a significant portion of its total revenue outside of the United States. Business operations outside of the United States are subject to political, economic and other risks inherent in operating in certain countries, such as:
• | the difficulty of enforcing agreements and protecting assets through legal systems outside the U.S.; |
• | managing widespread operations and enforcing internal policies and procedures such as compliance with U.S. and foreign anti-bribery and anti-corruption regulations; |
• | trade protection measures and import or export licensing requirements; |
• | the application of certain labor regulations outside of the United States, including data privacy; |
• | compliance with a wide variety of non-U.S. laws and regulations; |
• | changes in the general political and economic conditions in the countries where the Company operates, particularly in emerging markets; |
• | the threat of nationalization and expropriation; |
• | increased costs and risks of doing business in a wide variety of jurisdictions; |
• | government controls limiting importation of goods; |
• | government controls limiting payments to suppliers for imported goods; |
• | limitations on repatriation of earnings; and |
• | exposure to wage, price and capital controls. |
Changes in the political or economic environments in the countries in which the Company operates could have a material adverse effect on its financial condition, results of operations or cash flows.
The Company’s business is subject to risks associated with sourcing and manufacturing overseas.
The Company imports large quantities of finished goods, component parts and raw materials. Substantially all of its import operations are subject to customs requirements and to tariffs and quotas set by governments through mutual agreements, bilateral actions or, in some cases unilateral action. In addition, the countries in which the Company’s products and materials are manufactured or imported from (including importation into the U.S. of our products manufactured overseas) may from time to time impose additional quotas, duties, tariffs or other restrictions on its imports (including restrictions on manufacturing operations) or adversely modify existing restrictions. Furthermore, imported products and materials may be subject to future tariffs or other trade measures in the U.S. Imports are also subject to unpredictable foreign currency variation which may increase the Company’s cost of goods sold. Adverse changes in these import costs and restrictions, or the Company’s suppliers’ failure to comply with customs regulations or similar laws, could harm the Company’s business.
The Company’s operations are also subject to the effects of international trade agreements and regulations such as the North American Free Trade Agreement, and the activities and regulations of the World Trade Organization. Although these trade agreements generally have positive effects on trade liberalization, sourcing flexibility and cost of goods by reducing or eliminating the duties and/or quotas assessed on products manufactured in a particular country, trade agreements can also impose requirements that adversely affect the Company’s business, such as setting quotas on products that may be imported from a particular country into key markets including the U.S. or the European Union, or making it easier for other companies to compete, by eliminating restrictions on products from countries where the Company’s competitors source products.
The Company’s ability to import products in a timely and cost-effective manner may also be affected by conditions at ports or issues that otherwise affect transportation and warehousing providers, such as port and shipping capacity, labor disputes, severe weather or increased homeland security requirements in the U.S. and other countries. These issues could delay importation of products or require the Company to locate alternative ports or warehousing providers to avoid disruption to customers. These alternatives may not be available on short notice or could result in higher transit costs, which could have an adverse impact on the Company’s business and financial condition.
9
The Company’s success depends on its ability to improve productivity and streamline operations to control or reduce costs.
The Company is committed to continuous productivity improvement and evaluating opportunities to reduce fixed costs, simplify or improve processes, and eliminate excess capacity. The Company has undertaken restructuring actions, the savings of which may be mitigated by many factors, including economic weakness, competitive pressures, and decisions to increase costs in areas such as sales promotion or research and development above levels that were otherwise assumed. Failure to achieve, or delays in achieving, projected levels of efficiencies and cost savings from such measures, or unanticipated inefficiencies resulting from manufacturing and administrative reorganization actions in progress or contemplated, would adversely affect the Company’s results.
The performance of the Company may suffer from business disruptions or other costs associated with information technology, cyber attacks, system implementations, data privacy, or catastrophic losses affecting distribution centers and other infrastructure.
The Company relies heavily on computer systems to manage and operate its businesses, and record and process transactions. Computer systems are important to production planning, customer service and order fulfillment among other business-critical processes. Consistent and efficient operation of the computer hardware and software systems is imperative to the successful sales and earnings performance of the various businesses in many countries.
Despite efforts to prevent such situations, insurance policies and loss control and risk management practices that partially mitigate these risks, the Company’s systems may be affected by damage or interruption from, among other causes, power outages, system failures or computer viruses. Computer hardware and storage equipment that is integral to efficient operations, such as e-mail, telephone and other functionality, is concentrated in certain physical locations in the various continents in which the Company operates. Additionally, the Company relies on software applications and enterprise cloud storage systems and cloud computing services provided by third-party vendors, and our business may be adversely affected by service disruptions or security breaches in such third-party systems.
Security threats and sophisticated computer crime pose a potential risk to the security of the Company’s information technology systems, cloud storage systems, networks, services and assets, as well as the confidentiality and integrity of the Company’s customers' data. If the Company suffers a loss or disclosure of business or stakeholder information due to security breaches, including as a result of human error and technological failures, and business continuity plans do not effectively address these issues on a timely basis, the Company may suffer interruptions in its ability to manage operations as well as reputational, competitive or business harm, which may adversely impact the Company’s results of operations and financial condition.
In addition, the Company is in the process of system conversions to SAP as well as other applications to provide a common platform across most of its businesses. There can be no assurances that expected expense synergies will be achieved or that there will not be delays to the expected timing of such synergies. It is possible the costs to complete the system conversions may exceed current expectations, and that significant costs may be incurred that will require immediate expense recognition as opposed to capitalization. The risk of disruption to key operations is increased when complex system changes such as SAP conversions are undertaken. If systems fail to function effectively, or become damaged, operational delays may ensue and the Company may be forced to make significant expenditures to remedy such issues. Any significant disruption in the Company’s computer operations could have a material adverse impact on its business and results.
The Company’s operations are significantly dependent on infrastructure, notably certain distribution centers and security alarm monitoring facilities, which are concentrated in various geographic locations. If any of these were to experience a catastrophic loss, such as a fire, earthquake, hurricane, or flood, it could disrupt operations, delay production, shipments and revenue and result in large expenses to repair or replace the facility. The Company maintains business interruption insurance, but it may not fully protect the Company against all adverse effects that could result from significant disruptions.
The Company is also subject to U.S. and international data privacy and cybersecurity laws and regulations, which may impose fines and penalties for noncompliance and may have an adverse effect on the Company's operations. For example, the European Union’s General Data Protection Regulation (the “GDPR”), which becomes effective in May 2018, extends the scope of the EU data protection law to all companies processing data of EU residents, regardless of the company's location, and imposes significant new requirements on how the Company collects, processes and transfers personal data.
Unforeseen events, including war, terrorism and other international conflicts and public health issues, whether occurring in the United States or abroad, could disrupt the Company's operations, disrupt the operations of its suppliers or customers, or result in political or economic instability. These events could reduce demand for the Company's products and make it difficult or impossible to manufacture products, deliver products to customers, or receive materials from suppliers.
10
The Company’s results of operations could be negatively impacted by inflationary or deflationary economic conditions which could affect the ability to obtain raw materials, component parts, freight, energy, labor and sourced finished goods in a timely and cost-effective manner.
The Company’s products are manufactured using both ferrous and non-ferrous metals including, but not limited to, steel, zinc, copper, brass, aluminum, and nickel. Additionally, the Company uses other commodity-based materials for components and packaging including, but not limited to, plastics, resins, wood and corrugated products. The Company’s cost base also reflects significant elements for freight, energy and labor. The Company also sources certain finished goods directly from vendors. If the Company is unable to mitigate any inflationary increases through various customer pricing actions and cost reduction initiatives, its profitability may be adversely affected.
Conversely, in the event there is deflation, the Company may experience pressure from its customers to reduce prices, and there can be no assurance that the Company would be able to reduce its cost base (through negotiations with suppliers or other measures) to offset any such price concessions which could adversely impact results of operations and cash flows.
Further, as a result of inflationary or deflationary economic conditions, the Company believes it is possible that a limited number of suppliers may either cease operations or require additional financial assistance from the Company in order to fulfill their obligations. In a limited number of circumstances, the magnitude of the Company’s purchases of certain items is of such significance that a change in established supply relationships with suppliers or increase in the costs of purchased raw materials, component parts or finished goods could result in manufacturing interruptions, delays, inefficiencies or an inability to market products. Changes in value-added tax rebates, currently available to the Company or to its suppliers, could also increase the costs of the Company’s manufactured products as well as purchased products and components and could adversely affect the Company’s results.
In addition, many of the Company’s products incorporate battery technology. As other industries begin to adopt similar battery technology for use in their products, the increased demand could place capacity constraints on the Company’s supply chain. In addition, increased demand for battery technology may also increase the costs to the Company for both the battery cells as well as the underlying raw materials. If the Company is unable to mitigate any possible supply constraints or related increased costs, its profitably and financial results could be negatively impacted.
Uncertainty about the financial stability of economies outside the U.S. could have a significant adverse effect on the Company's business, results of operations and financial condition.
The Company generates approximately 46% of its revenues from outside the U.S., including 22% of its revenues from Europe and 14% from various emerging market countries. Each of the Company’s segments generates sales from these marketplaces. While the Company believes any downturn in the European or emerging marketplaces might be offset to some degree by the relative stability in North America, the Company’s future growth, profitability and financial liquidity could be affected, in several ways, including but not limited to the following:
• | depressed consumer and business confidence may decrease demand for products and services; |
• | customers may implement cost-reduction initiatives or delay purchases to address inventory levels; |
• | significant declines of foreign currency values in countries where the Company operates could impact both the revenue growth and overall profitability in those geographies; |
• | a slowing or contracting Chinese economy could reduce China’s consumption and negatively impact the Company’s sales in that region, as well as globally; |
• | a devaluation of foreign currencies could have an effect on the credit worthiness (as well as the availability of funds) of customers in those regions impacting the collectability of receivables; |
• | a devaluation of foreign currencies could have an adverse effect on the value of financial assets of the Company in the effected countries; |
• | the impact of an event (individual country default, Brexit, or break up of the Euro) could have an adverse impact on the global credit markets and global liquidity potentially impacting the Company’s ability to access these credit markets and to raise capital. |
11
The Company is exposed to market risk from changes in foreign currency exchange rates which could negatively impact profitability.
The Company manufactures and sells its products in many countries throughout the world. As a result, there is exposure to foreign currency risk as the Company enters into transactions and makes investments denominated in multiple currencies. The Company’s predominant currency exposures are related to the Euro, Canadian Dollar, British Pound, Australian Dollar, Brazilian Real, Argentine Peso, Chinese Renminbi (“RMB”) and the Taiwan Dollar. In preparing its financial statements, for foreign operations with functional currencies other than the U.S. dollar, asset and liability accounts are translated at current exchange rates, while income and expenses are translated using average exchange rates. With respect to the effects on translated earnings, if the U.S. dollar strengthens relative to local currencies, the Company’s earnings could be negatively impacted. In 2017, translational and transactional foreign currency fluctuations negatively impacted pre-tax earnings by approximately $12.4 million and diluted earnings per share by approximately $0.07. The translational and transactional impacts will vary over time and may be more material in the future. Although the Company utilizes risk management tools, including hedging, as it deems appropriate, to mitigate a portion of potential market fluctuations in foreign currencies, there can be no assurance that such measures will result in all market fluctuation exposure being eliminated. The Company generally does not hedge the translation of its non-U.S. dollar earnings in foreign subsidiaries, but may choose to do so in certain instances.
The Company sources many products from China and other low-cost countries for resale in other regions. To the extent the RMB or other currencies appreciate, the Company may experience cost increases on such purchases. The Company may not be successful at implementing customer pricing or other actions in an effort to mitigate the related cost increases and thus its profitability may be adversely impacted.
The Company has incurred, and may incur in the future, significant indebtedness, or issue additional equity securities, in connection with mergers or acquisitions which may impact the manner in which it conducts business or the Company’s access to external sources of liquidity. The potential issuance of such securities may limit the Company’s ability to implement elements of its growth strategy and may have a dilutive effect on earnings.
As described in Note H, Long-Term Debt and Financing Arrangements, of the Notes to Consolidated Financial Statements in Item 8, the Company has a five-year $1.75 billion committed credit facility and a 364-day $1.25 billion committed credit facility. No amounts were outstanding against either of these facilities at December 30, 2017.
The instruments and agreements governing certain of the Company’s current indebtedness contain requirements or restrictive covenants that include, among other things:
• | a limitation on creating liens on certain property of the Company and its subsidiaries; |
• | a restriction on entering into certain sale-leaseback transactions; |
• | customary events of default. If an event of default occurs and is continuing, the Company might be required to repay all amounts outstanding under the respective instrument or agreement; and |
• | maintenance of a specified financial ratio. The Company has an interest coverage covenant that must be maintained to permit continued access to its committed revolving credit facilities. The interest coverage ratio tested for covenant compliance compares adjusted Earnings Before Interest, Taxes, Depreciation and Amortization to adjusted Interest Expense (“adjusted EBITDA”/”adjusted Interest Expense”); such adjustments to interest or EBITDA include, but are not limited to, removal of non-cash interest expense and stock-based compensation expense. The interest coverage ratio must not be less than 3.5 times and is computed quarterly, on a rolling twelve months (last twelve months) basis. Under this covenant definition, the interest coverage ratio was 10 times EBITDA or higher in each of the 2017 quarterly measurement periods. Management does not believe it is reasonably likely the Company will breach this covenant. Failure to maintain this ratio could adversely affect further access to liquidity. |
Future instruments and agreements governing indebtedness may impose other restrictive conditions or covenants. Such covenants could restrict the Company in the manner in which it conducts business and operations as well as in the pursuit of its growth and repositioning strategies.
12
The Company is exposed to counterparty risk in its hedging arrangements.
From time to time, the Company enters into arrangements with financial institutions to hedge exposure to fluctuations in currency and interest rates, including forward contracts, options and swap agreements. The failure of one or more counterparties to the Company’s hedging arrangements to fulfill their obligations could adversely affect the Company’s results of operations.
Tight capital and credit markets or the failure to maintain credit ratings could adversely affect the Company by limiting the Company’s ability to borrow or otherwise access liquidity.
The Company’s long-term growth plans are dependent on, among other things, the availability of funding to support corporate initiatives and complete appropriate acquisitions and the ability to increase sales of existing product lines. While the Company has not encountered financing difficulties to date, the capital and credit markets have experienced extreme volatility and disruption in the past and may again in the future. Market conditions could make it more difficult for the Company to borrow or otherwise obtain the cash required for significant new corporate initiatives and acquisitions. In addition, there could be a number of follow-on effects from a credit crisis on the Company’s businesses, including insolvency of key suppliers resulting in product delays; inability of customers to obtain credit to finance purchases of the Company’s products and services and/or customer insolvencies.
In addition, the major rating agencies regularly evaluate the Company for purposes of assigning credit ratings. The Company’s ability to access the credit markets, and the cost of these borrowings, is affected by the strength of its credit ratings and current market conditions. Failure to maintain credit ratings that are acceptable to investors may adversely affect the cost and other terms upon which the Company is able to obtain financing, as well as its access to the capital markets.
The Company’s acquisitions, as well as general business reorganizations, may result in significant costs and certain risks for its business and operations.
In 2017, the Company completed the acquisitions of Newell Tools and the Craftsman brand, as well as a number of other smaller acquisitions. In addition, the Company recently reached an agreement to purchase the Nelson Fastener Systems industrial business, which is expected to close in the first half of 2018, and may make additional acquisitions in the future.
Acquisitions involve a number of risks, including:
• | the failure to identify the most suitable candidates for acquisitions; |
• | the ability to identify and close on appropriate acquisition opportunities within desired time frames at reasonable cost; |
• | the anticipated additional revenues from the acquired companies do not materialize, despite extensive due diligence; |
• | the possibility that the acquired companies will not be successfully integrated or that anticipated cost savings, synergies, or other benefits will not be realized; |
• | the acquired businesses will lose market acceptance or profitability; |
• | the diversion of Company management’s attention and other resources; |
• | the incurrence of unexpected costs and liabilities, including those associated with undisclosed pre-closing regulatory violations by the acquired business; and |
• | the loss of key personnel and clients or customers of acquired companies. |
In addition, the success of the Company’s long-term growth and repositioning strategy will depend in part on successful general reorganization including its ability to:
• | combine businesses and operations; |
• | integrate departments, systems and procedures; and |
• | obtain cost savings and other efficiencies from such reorganizations, including the Company's functional transformation initiative. |
Failure to effectively consummate or manage the pending acquisition and any future acquisitions or general business reorganizations, and mitigate the related risks, may adversely affect the Company’s existing businesses and harm its operational results due to large write-offs, significant restructuring costs, contingent liabilities, substantial depreciation, adverse tax or other consequences. The Company cannot ensure that such integrations and reorganizations will be successfully completed or that all of the planned synergies and other benefits will be realized.
13
Expansion of the Company's activity in emerging markets may result in risks due to differences in business practices and cultures.
The Company's growth plans include efforts to increase revenue from emerging markets through both organic growth and acquisitions. Local business practices in these regions may not comply with U.S. laws, local laws or other laws applicable to the Company. When investigating potential acquisitions, the Company seeks to identify historical practices of target companies that would create liability or other exposures for the Company were they to continue post-completion or as a successor to the target. Where such practices are discovered, the Company assesses the risk to determine whether it is prepared to proceed with the transaction. In assessing the risk, the Company looks at, among other factors, the nature of the violation, the potential liability, including any fines or penalties that might be incurred, the ability to avoid, minimize or obtain indemnity for the risks, and the likelihood that the Company would be able to ensure that any such practices are discontinued following completion of the acquisition through implementation of its own policies and procedures. Due diligence and risk assessment are, however, imperfect processes, and it is possible that the Company will not discover problematic practices until after completion, or that the Company will underestimate the risks associated with historical activities. Should that occur, the Company may incur fees, fines, penalties, injury to its reputation or other damage that could negatively impact the Company's earnings.
Significant judgment and certain estimates are required in determining the Company’s worldwide provision for income taxes. Future tax law changes and audit results may materially increase the Company’s prospective income tax expense.
The Company is subject to income taxation in the U.S. as well as numerous foreign jurisdictions. Significant judgment is required in determining the Company’s worldwide income tax provision and accordingly there are many transactions and computations for which the final income tax determination is uncertain. The Company considers many factors when evaluating and estimating its tax positions and tax benefits, which may require periodic adjustments and which may not accurately anticipate actual outcomes. The Company periodically assesses its liabilities and contingencies for all tax years still subject to audit based on the most currently available information, which involves inherent uncertainty. The Company is routinely audited by income tax authorities in many tax jurisdictions. Although management believes the recorded tax estimates are reasonable, the ultimate outcome of any audit (or related litigation) could differ materially from amounts reflected in the Company’s income tax accruals. Additionally, the global income tax provision can be materially impacted due to foreign currency fluctuations against the U.S. dollar since a significant amount of the Company’s earnings are generated outside the United States. Lastly, it is possible that future income tax legislation may be enacted that could have a material impact on the Company’s worldwide income tax provision beginning with the period that such legislation becomes enacted.
On December 22, 2017, the U.S. government enacted comprehensive tax legislation commonly referred to as the Tax Cuts and Jobs Act (the “Act”). The Act makes broad and complex changes to the U.S. tax code, including, but not limited to, (1) reducing the U.S. federal corporate tax rate from 35 percent to 21 percent; (2) requiring companies to pay a one-time transition tax on certain unrepatriated earnings of foreign subsidiaries; (3) generally eliminating U.S. federal income taxes on dividends from foreign subsidiaries; (4) requiring a tax on global intangible low-taxed income (“GILTI”) which is a current inclusion in U.S. federal taxable income of certain earnings of controlled foreign corporations; (5) eliminating the corporate alternative minimum tax ("AMT") and changing how existing AMT credits can be realized; (6) creating the base erosion anti-abuse tax ("BEAT"); (7) creating a new limitation on deductible interest expense; and (8) changing rules related to uses and limitations of net operating loss carryforwards created in tax years beginning after December 31, 2017.
Pursuant to Staff Accounting Bulletin No. 118 (“SAB 118”) issued by the SEC in December 2017, issuers are permitted up to one year from the enactment of the Act to complete the accounting for the income tax effects of the Act. See Note A, Significant Accounting Policies, of the Notes to Consolidated Financial Statements in Item 8, for further information about SAB 118. As of December 30, 2017, the Company has not completed its accounting for the tax effects of the enactment of the Act; however, in certain cases, as described in Note Q, Income Taxes, of the Notes to Consolidated Financial Statements in Item 8, the Company has made a reasonable estimate of the effects on its existing deferred tax balances and the one-time transition tax. In other cases, the Company has not been able to make a reasonable estimate and continues to account for those items based on existing accounting guidance under Accounting Standards Codification ("ASC") 740, Income Taxes, and the provisions of the tax laws that were in effect immediately prior to enactment. During the fourth quarter of 2017, a provisional net charge of $23.6 million was recognized for the items the Company was able to reasonably estimate, which has been included as a component of income taxes on continuing operations. The final impacts of the Act may be materially different from current estimates, which are based on management’s preliminarily analysis of currently available information. In all cases, estimates of the impact of the Act may be updated to account for changes in interpretations of the Act, any legislative action to address questions that arise because of the Act, and any changes in accounting standards for income taxes or related interpretations in response to the Act. The Company will continue to examine the impact that the Act may have on its operations in future periods. Notwithstanding the reduction in the corporate income tax rate, the overall net impact of the legislation remains uncertain and could adversely impact the Company's results of operations or financial condition.
14
The Company’s failure to continue to successfully avoid, manage, defend, litigate and accrue for claims and litigation could negatively impact its results of operations or cash flows.
The Company is exposed to and becomes involved in various litigation matters arising out of the ordinary routine conduct of its business, including, from time to time, actual or threatened litigation relating to such items as commercial transactions, product liability, workers compensation, the Company’s distributors and franchisees, intellectual property claims and regulatory actions.
In addition, the Company is subject to environmental laws in each jurisdiction in which business is conducted. Some of the Company’s products incorporate substances that are regulated in some jurisdictions in which it conducts manufacturing operations. The Company could be subject to liability if it does not comply with these regulations. In addition, the Company is currently, and may in the future be held responsible for remedial investigations and clean-up costs resulting from the discharge of hazardous substances into the environment, including sites that have never been owned or operated by the Company but at which it has been identified as a potentially responsible party under federal and state environmental laws and regulations. Changes in environmental and other laws and regulations in both domestic and foreign jurisdictions could adversely affect the Company’s operations due to increased costs of compliance and potential liability for non-compliance.
The Company manufactures products, configures and installs security systems and performs various services that create exposure to product and professional liability claims and litigation. If such products, systems and services are not properly manufactured, configured, installed, designed or delivered, personal injuries, property damage or business interruption could result, which could subject the Company to claims for damages. The costs associated with defending product liability claims and payment of damages could be substantial. The Company’s reputation could also be adversely affected by such claims, whether or not successful.
There can be no assurance that the Company will be able to continue to successfully avoid, manage and defend such matters. In addition, given the inherent uncertainties in evaluating certain exposures, actual costs to be incurred in future periods may vary from the Company’s estimates for such contingent liabilities.
The Company’s products could be recalled.
The Consumer Product Safety Commission or other applicable regulatory bodies may require the recall, repair or replacement of the Company’s products if those products are found not to be in compliance with applicable standards or regulations. A recall could increase costs and adversely impact the Company’s reputation.
The Company is exposed to credit risk on its accounts receivable.
The Company’s outstanding trade receivables are not generally covered by collateral or credit insurance. While the Company has procedures to monitor and limit exposure to credit risk on its trade and non-trade receivables, there can be no assurance such procedures will effectively limit its credit risk and avoid losses, which could have an adverse effect on the Company’s financial condition and operating results.
If the Company were required to write-down all or part of its goodwill, indefinite-lived trade names, or other definite-lived intangible assets, its net income and net worth could be materially adversely affected.
As a result of the Black and Decker merger and other acquisitions, the Company has $8.8 billion of goodwill, $2.2 billion of indefinite-lived trade names and $1.3 billion of net definite-lived intangible assets at December 30, 2017. The Company is required to periodically, at least annually, determine if its goodwill or indefinite-lived trade names have become impaired, in which case it would write down the impaired portion of the asset. The definite-lived intangible assets, including customer relationships, are amortized over their estimated useful lives and are evaluated for impairment when appropriate. Impairment of intangible assets may be triggered by developments outside of the Company’s control, such as worsening economic conditions, technological change, intensified competition or other factors resulting in deleterious consequences.
If the investments in employee benefit plans do not perform as expected, the Company may have to contribute additional amounts to these plans, which would otherwise be available to cover operating expenses or other business purposes.
The Company sponsors pension and other post-retirement defined benefit plans. The Company’s defined benefit plan assets are currently invested in equity securities, government and corporate bonds and other fixed income securities, money market instruments and insurance contracts. The Company’s funding policy is generally to contribute amounts determined annually on an actuarial basis to provide for current and future benefits in accordance with applicable law which require, among other things, that the Company make cash contributions to under-funded pension plans. During 2017, the Company made cash contributions to its defined benefit plans of $67 million and it expects to contribute $41 million to its defined benefit plans in 2018.
15
There can be no assurance that the value of the defined benefit plan assets, or the investment returns on those plan assets, will be sufficient in the future. It is therefore possible that the Company may be required to make higher cash contributions to the plans in future years which would reduce the cash available for other business purposes, and that the Company will have to recognize a significant pension liability adjustment which would decrease the net assets of the Company and result in higher expense in future years. The fair value of the defined benefit plan assets at December 30, 2017 was $2.213 billion.
Risks associated with hostilities involving North Korea.
The Company has a number of key suppliers in South Korea. Escalation of hostilities with North Korea and/or military action in the region could cause disruptions in the Company's supply chain which could, in turn, cause product shortages, delays in delivery and/or increases in the Company's cost incurred to produce and deliver products to its customers.
16
ITEM 1B. UNRESOLVED STAFF COMMENTS
None.
17
ITEM 2. PROPERTIES
As of December 30, 2017, the Company and its subsidiaries owned or leased significant facilities used for manufacturing, distribution and sales offices in 19 states and 18 foreign countries. The Company leases its corporate headquarters in New Britain, Connecticut. The Company has 84 other facilities that are larger than 100,000 square feet, as follows:
Owned | Leased | Total | |||
Tools & Storage | 42 | 16 | 58 | ||
Industrial | 13 | 5 | 18 | ||
Security | 2 | 2 | 4 | ||
Corporate | 2 | 2 | 4 | ||
Total | 59 | 25 | 84 | ||
The combined size of these facilities is approximately 22 million square feet. The buildings are in good condition, suitable for their intended use, adequate to support the Company’s operations, and generally fully utilized.
ITEM 3. LEGAL PROCEEDINGS
In the normal course of business, the Company is involved in various lawsuits and claims, including product liability, environmental and distributor claims, and administrative proceedings. The Company does not expect that the resolution of these matters will have a materially adverse effect on the Company’s consolidated financial position, results of operations or liquidity.
ITEM 4. MINE SAFETY DISCLOSURES
Not applicable.
18
PART II
ITEM 5. MARKET FOR THE REGISTRANT’S COMMON EQUITY, RELATED STOCKHOLDER MATTERS AND ISSUER PURCHASES OF EQUITY SECURITIES
The Company’s common stock is listed and traded on the New York Stock Exchange, Inc. (“NYSE”) under the abbreviated ticker symbol “SWK”, and is a component of the Standard & Poor’s (“S&P”) 500 Composite Stock Price Index. The Company’s high and low quarterly stock prices on the NYSE for the years ended December 30, 2017 and December 31, 2016 follow:
2017 | 2016 | |||||||||||||||||||||||
High | Low | Dividend Per Common Share | High | Low | Dividend Per Common Share | |||||||||||||||||||
QUARTER: | ||||||||||||||||||||||||
First | $ | 132.87 | $ | 115.75 | $ | 0.58 | $ | 106.64 | $ | 90.14 | $ | 0.55 | ||||||||||||
Second | $ | 143.05 | $ | 130.57 | $ | 0.58 | $ | 115.05 | $ | 104.24 | $ | 0.55 | ||||||||||||
Third | $ | 152.30 | $ | 137.07 | $ | 0.63 | $ | 124.46 | $ | 111.40 | $ | 0.58 | ||||||||||||
Fourth | $ | 170.03 | $ | 154.53 | $ | 0.63 | $ | 125.78 | $ | 113.49 | $ | 0.58 | ||||||||||||
Total | $ | 2.42 | $ | 2.26 | ||||||||||||||||||||
As of February 1, 2018, there were 9,976 holders of record of the Company’s common stock. Information required by Item 201(d) of Regulation S-K concerning securities authorized for issuance under equity compensation plans can be found under Item 12 of this Annual Report on Form 10-K.
Issuer Purchases of Equity Securities
The following table provides information about the Company’s purchases of equity securities that are registered by the Company pursuant to Section 12 of the Exchange Act for the three months ended December 30, 2017:
2017 | (a) Total Number Of Shares Purchased | Average Price Paid Per Share | Total Number Of Shares Purchased As Part Of A Publicly Announced Plan or Program | (b) Maximum Number Of Shares That May Yet Be Purchased Under The Program | |||||||||
October 1 - November 4 | 2,943 | $ | 160.34 | — | 15,000,000 | ||||||||
November 5 - December 2 | 18,516 | $ | 168.24 | — | 15,000,000 | ||||||||
December 3 - December 30 | 52,653 | $ | 169.58 | — | 15,000,000 | ||||||||
Total | 74,112 | $ | 168.88 | — | 15,000,000 | ||||||||
(a) | The shares of common stock in this column were deemed surrendered to the Company by participants in various benefit plans of the Company to satisfy the participants’ taxes related to vesting or delivery of time-vesting restricted share units under those plans. |
(b) | On July 20, 2017, the Board of Directors approved a new repurchase program for up to 15.0 million shares of the Company’s common stock and terminated its previously approved repurchase program. As of December 30, 2017, the authorized shares available for repurchase under the new repurchase program totaled 15.0 million shares. The currently authorized shares available for repurchase do not include approximately 3.6 million shares reserved and authorized for purchase under the Company’s previously approved repurchase program relating to a forward share purchase contract entered into in March 2015. Refer to Note J, Capital Stock, of the Notes to Consolidated Financial Statements in Item 8 for further discussion. |
19
Stock Performance Graph
The following line graph compares the yearly percentage change in the Company’s cumulative total shareholder return for the last five years to that of the Standard & Poor’s (S&P) 500 Index and the S&P 500 Industrials Index. The Company has decided to use the S&P 500 Industrials Index, which is utilized by a number of the Company’s industrial peers, for the purpose of this disclosure.
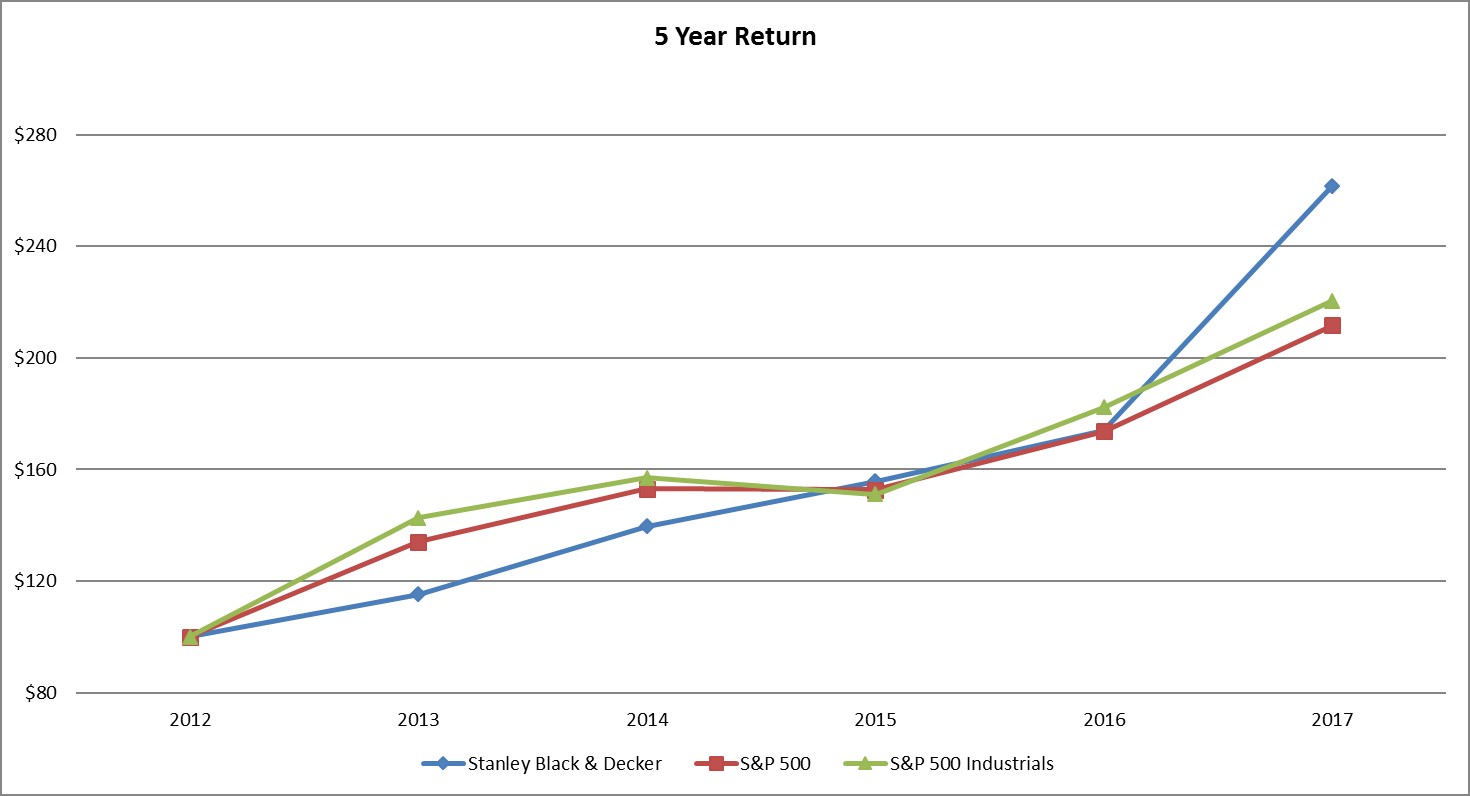
THE POINTS IN THE ABOVE TABLE ARE AS FOLLOWS: | 2012 | 2013 | 2014 | 2015 | 2016 | 2017 | |||||||||||||||||
Stanley Black & Decker | $ | 100.00 | $ | 115.20 | $ | 139.71 | $ | 155.80 | $ | 173.88 | $ | 261.65 | |||||||||||
S&P 500 | $ | 100.00 | $ | 134.09 | $ | 153.00 | $ | 152.80 | $ | 173.68 | $ | 211.58 | |||||||||||
S&P 500 Industrials | $ | 100.00 | $ | 142.63 | $ | 157.09 | $ | 151.13 | $ | 182.19 | $ | 220.47 | |||||||||||
The comparison assumes $100 invested at the closing price on December 28, 2012 in the Company’s common stock, S&P 500 Index, and S&P 500 Industrials Index. Total return assumes reinvestment of dividends.
20
ITEM 6. SELECTED FINANCIAL DATA
Acquisitions and divestitures completed by the Company during the five-year period presented below affect comparability of results. Refer to Note E, Acquisitions, and Note T, Divestitures, of the Notes to Consolidated Financial Statements in Item 8 and prior year 10-K filings for further information.
(Millions of Dollars, Except Per Share Amounts) | 2017 (a) | 2016 | 2015 | 2014 (b) | 2013 (c) | |||||||||||||||
Net sales | $ | 12,747 | $ | 11,407 | $ | 11,172 | $ | 11,339 | $ | 10,890 | ||||||||||
Net earnings from continuing operations attributable to common shareowners | $ | 1,226 | $ | 965 | $ | 904 | $ | 857 | $ | 520 | ||||||||||
Net loss from discontinued operations(d) | $ | — | $ | — | $ | (20 | ) | $ | (96 | ) | $ | (30 | ) | |||||||
Net Earnings Attributable to Common Shareowners | $ | 1,226 | $ | 965 | $ | 884 | $ | 761 | $ | 490 | ||||||||||
Basic earnings (loss) per share: | ||||||||||||||||||||
Continuing operations | $ | 8.19 | $ | 6.61 | $ | 6.10 | $ | 5.49 | $ | 3.35 | ||||||||||
Discontinued operations(d) | $ | — | $ | — | $ | (0.14 | ) | $ | (0.62 | ) | $ | (0.19 | ) | |||||||
Total basic earnings per share | $ | 8.19 | $ | 6.61 | $ | 5.96 | $ | 4.87 | $ | 3.16 | ||||||||||
Diluted earnings (loss) per share: | ||||||||||||||||||||
Continuing operations | $ | 8.04 | $ | 6.51 | $ | 5.92 | $ | 5.37 | $ | 3.28 | ||||||||||
Discontinued operations(d) | $ | — | $ | — | $ | (0.13 | ) | $ | (0.60 | ) | $ | (0.19 | ) | |||||||
Total diluted earnings per share | $ | 8.04 | $ | 6.51 | $ | 5.79 | $ | 4.76 | $ | 3.09 | ||||||||||
Percent of net sales (Continuing operations): | ||||||||||||||||||||
Cost of sales | 62.5 | % | 62.6 | % | 63.6 | % | 63.8 | % | 64.2 | % | ||||||||||
Selling, general and administrative(e) | 23.4 | % | 23.0 | % | 22.3 | % | 22.9 | % | 24.7 | % | ||||||||||
Other, net | 2.3 | % | 1.7 | % | 2.0 | % | 2.1 | % | 2.6 | % | ||||||||||
Restructuring charges and asset impairments | 0.4 | % | 0.4 | % | 0.4 | % | 0.2 | % | 1.6 | % | ||||||||||
Interest, net | 1.4 | % | 1.5 | % | 1.5 | % | 1.4 | % | 1.4 | % | ||||||||||
Earnings before income taxes | 12.0 | % | 10.7 | % | 10.3 | % | 9.6 | % | 5.4 | % | ||||||||||
Net earnings from continuing operations attributable to common shareowners | 9.6 | % | 8.5 | % | 8.1 | % | 7.6 | % | 4.8 | % | ||||||||||
Balance sheet data: | ||||||||||||||||||||
Total assets(f) | $ | 19,080 | $ | 15,635 | $ | 15,128 | $ | 15,803 | $ | 16,486 | ||||||||||
Long-term debt, including current maturities(f) | $ | 3,826 | $ | 3,815 | $ | 3,797 | $ | 3,800 | $ | 3,760 | ||||||||||
Stanley Black & Decker, Inc.’s shareowners’ equity | $ | 8,297 | $ | 6,367 | $ | 5,812 | $ | 6,429 | $ | 6,799 | ||||||||||
Ratios: | ||||||||||||||||||||
Total debt to total capital | 31.6 | % | 37.5 | % | 39.5 | % | 37.2 | % | 37.9 | % | ||||||||||
Income tax rate - continuing operations | 19.7 | % | 21.3 | % | 21.6 | % | 20.9 | % | 11.7 | % | ||||||||||
Common stock data: | ||||||||||||||||||||
Dividends per share | $ | 2.42 | $ | 2.26 | $ | 2.14 | $ | 2.04 | $ | 1.98 | ||||||||||
Equity per basic share at year-end | $ | 55.17 | $ | 42.76 | $ | 39.08 | $ | 41.34 | $ | 43.73 | ||||||||||
Market price per share — high | $ | 170.03 | $ | 125.78 | $ | 110.17 | $ | 97.36 | $ | 92.36 | ||||||||||
Market price per share — low | $ | 115.75 | $ | 90.14 | $ | 90.51 | $ | 75.64 | $ | 73.97 | ||||||||||
Weighted-average shares outstanding (in 000’s): | ||||||||||||||||||||
Basic | 149,629 | 146,041 | 148,234 | 156,090 | 155,237 | |||||||||||||||
Diluted | 152,449 | 148,207 | 152,706 | 159,737 | 158,776 | |||||||||||||||
Other information: | ||||||||||||||||||||
Average number of employees | 57,076 | 53,231 | 51,815 | 50,375 | 49,445 | |||||||||||||||
Shareowners of record at end of year | 10,014 | 10,313 | 10,603 | 10,932 | 11,235 | |||||||||||||||
(a) | The Company's 2017 results include $156 million of pre-tax acquisition-related charges and a $264 million pre-tax gain on sales of businesses, primarily related to the divestiture of the mechanical security businesses. As a result, as a percentage of Net sales, Cost of sales was 37 basis points higher, Selling, general, & administrative was 30 basis points higher, Other, net was 46 basis points higher, Restructuring charges and asset impairments was 11 basis points higher, and Earnings before income taxes was 85 basis points higher. The net tax benefit of the acquisition-related charges and gain on sales of businesses was $7 million. Income taxes on continuing operations for 2017 also includes |
21
a one-time net tax charge of $24 million related to the recently enacted U.S. tax legislation. Overall, the acquisition-related charges, gain on sales of businesses, and one-time net tax charge related to the recently enacted U.S. tax legislation resulted in a net increase to the Company's 2017 net earnings from continuing operations attributable to common shareowners of $91 million (or $0.59 per diluted share).
(b) | The Company's 2014 results include $54 million of pre-tax charges related to merger and acquisition-related charges. As a result of these charges, net earnings attributable to common shareowners were reduced by $49 million (or $0.30 per diluted share). As a percentage of Net sales, Cost of sales was 2 basis points higher, Selling, general & administrative was 28 basis points higher, Other-net was 2 basis points higher, Earnings before income taxes was 48 basis points lower, and Net earnings attributable to common shareowners was 43 basis points lower. The Income tax rate - continuing operations ratio was 53 basis points higher. |
(c) | The Company's 2013 results include $390 million of pre-tax charges related to merger and acquisition-related charges, as well as the charges associated with the extinguishment of debt during the fourth quarter of 2013. As a result of these charges, net earnings attributable to common shareowners were reduced by $270 million (or $1.70 per diluted share). As a percentage of Net sales, Cost of sales was 27 basis points higher, Selling, general & administrative was 125 basis points higher, Other, net was 47 basis points higher, Earnings before income taxes was 358 basis points lower, and Net earnings attributable to common shareowners was 248 basis points lower. The Income tax rate - continuing operations ratio was 761 basis points lower. |
(d) | Discontinued operations in 2015 reflects a $20 million loss, or $0.13 per diluted share, primarily related to operating losses associated with the Security segment’s Spain and Italy operations (“Security Spain and Italy”), which were classified as held for sale in the fourth quarter of 2014 and subsequently sold in 2015. Amounts in 2014 reflect a $96 million loss, or $0.60 per diluted share, associated with Security Spain and Italy as well as two small businesses that were divested in 2014. Amounts in 2013 reflect a $30 million loss, or $0.19 per diluted share, associated with Security Spain and Italy, Hardware & Home Improvement business ("HHI"), and two small businesses that were divested in 2014. Refer to Note T, Divestitures, of the Notes to Consolidated Financial Statements in Item 8 for further discussion of the Company's divestitures. |
(e) | SG&A is inclusive of the Provision for Doubtful Accounts. |
(f) | In the first quarter of 2016, the Company adopted ASU 2015-03, Interest - Imputation of Interest (Subtopic 835-30): Simplifying the Presentation of Debt Issuance Costs. ASU 2015-03 requires debt issuance costs related to recognized debt liabilities to be presented in the balance sheet as a direct reduction from the debt liability rather than an asset. Accordingly, amounts reported in prior years have been reclassified to conform to the new presentation. |
22
ITEM 7. MANAGEMENT’S DISCUSSION AND ANALYSIS OF FINANCIAL CONDITION AND RESULTS OF OPERATIONS
The financial and business analysis below provides information which the Company believes is relevant to an assessment and understanding of its consolidated financial position, results of operations and cash flows. This financial and business analysis should be read in conjunction with the Consolidated Financial Statements and related notes. All references to “Notes” in this Item 7 refer to the Notes to Consolidated Financial Statements included in Item 8 of this Annual Report.
The following discussion and certain other sections of this Annual Report on Form 10-K contain statements reflecting the Company’s views about its future performance that constitute “forward-looking statements” under the Private Securities Litigation Reform Act of 1995. These forward-looking statements are based on current expectations, estimates, forecasts and projections about the industry and markets in which the Company operates as well as management’s beliefs and assumptions. Any statements contained herein (including without limitation statements to the effect that Stanley Black & Decker, Inc. or its management “believes,” “expects,” “anticipates,” “plans” and similar expressions) that are not statements of historical fact should be considered forward-looking statements. These statements are not guarantees of future performance and involve certain risks, uncertainties and assumptions that are difficult to predict. There are a number of important factors that could cause actual results to differ materially from those indicated by such forward-looking statements. These factors include, without limitation, those set forth, or incorporated by reference, below under the heading “Cautionary Statements.” The Company does not intend to update publicly any forward-looking statements whether as a result of new information, future events or otherwise.
Strategic Objectives
The Company continues to pursue a growth and acquisition strategy, which involves industry, geographic and customer diversification to foster sustainable revenue, earnings and cash flow growth, and employ the following strategic framework in pursuit of its vision to reach $22 billion in revenue by 2022 while expanding its margin rate ("22/22 Vision"):
• | Continue organic growth momentum by utilizing the SFS 2.0 operating system, diversifying toward higher-growth, higher-margin businesses, and increasing the relative weighting of emerging markets; |
• | Be selective and operate in markets where brand is meaningful, the value proposition is definable and sustainable through innovation and global cost leadership is achievable; and |
• | Pursue acquisitive growth on multiple fronts by building upon its existing global tools platform, expanding the Industrial platform in Engineered Fastening and Infrastructure, consolidating the commercial electronic security industry and pursuing adjacencies with sound industrial logic. |
Execution of the above strategy has resulted in approximately $8.9 billion of acquisitions since 2002 (excluding the Black & Decker merger and pending acquisition of the Nelson Fastener Systems industrial business discussed below), several divestitures, improved efficiency in the supply chain and manufacturing operations, and enhanced investments in organic growth, enabled by cash flow generation and increased debt capacity. In addition, the Company's continued focus on diversification and organic growth has resulted in improved financial results and an increase in its global presence. The Company also remains focused on increasing its presence in emerging markets, with a goal of generating greater than 20% of annual revenues from those markets over time, and leveraging SFS 2.0 to upgrade innovation and digital capabilities, maintain commercial and supply chain excellence, and focus on reducing SG&A, in part, through functional transformation.
The Company’s long-term financial objectives are as follows:
• | 4-6% organic revenue growth; |
• | 10-12% total revenue growth; |
• | 10-12% total EPS growth (7-9% organically) excluding acquisition-related charges; |
• | Free cash flow equal to, or exceeding, net income; and |
• | Sustain 10+ working capital turns. |
In terms of capital allocation, the Company remains committed, over time, to returning approximately 50% of free cash flow to shareholders through a strong and growing dividend as well as opportunistically repurchasing shares. The remaining free cash flow (approximately 50%) will be deployed towards acquisitions.
The following represents recent examples of the Company executing its strategic objectives:
23
Acquisitions of Newell Tools and Craftsman® Brand
In March 2017, the Company acquired the Tools business of Newell Brands ("Newell Tools") for approximately $1.84 billion and acquired the Craftsman® brand from Sears Holdings Corporation ("Sears Holdings") for an estimated cash purchase price of approximately $900 million on a discounted basis.
The Newell Tools acquisition, which includes the industrial cutting, hand tool and power tool accessory brands Irwin® and Lenox®, enhances the Company’s position within the global tools & storage industry and broadens the Company’s product offerings and solutions to customers and end users, particularly within power tool accessories. The results of Newell Tools are being consolidated into the Company's Tools & Storage segment.
The Craftsman brand acquisition provides the Company with the rights to develop, manufacture and sell Craftsman®-branded products in non-Sears Holdings channels. The Company plans to significantly increase the availability of Craftsman®-branded products to consumers in previously underpenetrated channels, enhance innovation, and add manufacturing jobs in the U.S. to support growth. The results of Craftsman are being consolidated into the Company's Tools & Storage segment.
Pending Acquisition
On December 22, 2017, the Company reached an agreement to purchase the industrial business of Nelson Fastener Systems ("Nelson") from the Doncasters Group, which excludes Nelson's automotive stud welding business, for approximately $440 million in cash. Nelson is complementary to the Company's product offerings, enhances its presence in the general industrial end markets, expands its portfolio of highly engineered fastening solutions and will deliver cost synergies. This transaction is expected to close in the first half of 2018 subject to customary closing conditions, including regulatory approvals.
Refer to Note E, Acquisitions, for further discussion of the Company's acquisitions.
Divestitures
On February 22, 2017, the Company sold the majority of its mechanical security businesses, which included the commercial hardware brands of Best Access, phi Precision and GMT, for net proceeds of approximately $717 million. The sale allowed the Company to deploy capital in a more accretive and growth-oriented manner.
Refer to Note T, Divestitures, for further discussion of the Company's divestitures.
Certain Items Impacting Earnings
Throughout MD&A, the Company has provided a discussion of the outlook and results both inclusive and exclusive of acquisition-related charges, gains on sales of businesses, and a one-time net tax charge related to the recently enacted U.S. tax legislation. The acquisition-related charges relate primarily to the Newell Tools and Craftsman brand acquisitions, while the gain on sales of businesses primarily related to the divestiture of the mechanical security businesses. The amounts and measures, including gross profit and segment profit, on a basis excluding such charges are considered relevant to aid analysis and understanding of the Company's results aside from the material impact of these charges. In addition, these measures are utilized internally by management to understand business trends, as once the anticipated cost synergies from these acquisitions, as applicable, are realized, such charges are not expected to recur.
During 2017, the Company reported $156 million in pre-tax acquisition-related charges, which were comprised of the following:
• | $47 million reducing Gross Profit primarily pertaining to amortization of the inventory step-up adjustment for the Newell Tools acquisition; |
• | $38 million in SG&A primarily for integration-related costs and consulting fees; |
• | $58 million in Other, net primarily for deal transaction and consulting costs; and |
• | $13 million in Restructuring charges pertaining to facility closures and employee severance. |
The Company also reported a $264 million pre-tax gain on sales of businesses in 2017, primarily relating to the previously discussed sale of the majority of the mechanical security businesses. The net tax benefit of the acquisition-related charges and gain on sales of businesses was $7 million. Furthermore, in the fourth quarter of 2017, the Company recorded a $24 million net tax charge relating to the recently enacted U.S. tax legislation.
24
The acquisition-related charges, gain on sales of businesses, and one-time net tax charge resulted in a net after-tax gain of $91 million, or $0.59 per diluted share.
Driving Further Profitable Growth by Fully Leveraging Our Core Franchises
Each of the Company's franchises share common attributes: they have world-class brands and attractive growth characteristics, they are scalable and defensible, they can differentiate through innovation, and they are powered by our SFS 2.0 operating system.
• | The Tools & Storage business is the tool company to own, with strong brands, proven innovation, global scale, and a broad offering of power tools, hand tools, accessories, and storage & digital products across many channels in both developed and developing markets. |
• | The Engineered Fastening business is a highly profitable, GDP+ growth business offering highly engineered, value-added innovative solutions with recurring revenue attributes and global scale. |
• | The Security business, with its attractive recurring revenue, presents a significant margin accretion opportunity over the longer term and has historically provided a stable revenue stream through economic cycles, is a gateway into the digital world and an avenue to capitalize on rapid digital changes. |
While diversifying the business portfolio through strategic acquisitions remains important, management recognizes that the core franchises described above are important foundations that continue to provide strong cash flow and growth prospects. Management is committed to growing these businesses through innovative product development, brand support, continued investment in emerging markets and a sharp focus on global cost-competitiveness.
Continuing to Invest in the Stanley Black & Decker Brands
The Company has a strong portfolio of brands associated with high-quality products including STANLEY®, BLACK+DECKER®, DEWALT®, FLEXVOLT®, Irwin®, Lenox®, Craftsman®, Porter-Cable®, Bostitch®, Proto®, Mac Tools®, FACOM®, AeroScout®, Powers®, Lista®, SIDCHROME®, Vidmar®, SONITROL®, DIYZ® and GQ®. The STANLEY®, BLACK+DECKER® and DEWALT® brands are recognized as three of the world's great brands and are amongst the Company's most valuable assets.
During 2017, the STANLEY® and DEWALT® brands had prominent signage in Major League Baseball (MLB) stadiums appearing in 47% of all MLB games. The Company has also maintained long-standing NASCAR and NHRA racing sponsorships, which provided brand exposure during 60 events in 2017 with the STANLEY®, DEWALT®, Irwin® and Mac Tools® brands. The Company has continued its ten-year alliance agreement with the Walt Disney World Resort® whereby STANLEY® logos are displayed on construction walls throughout the theme parks. Brand logos and/or products are featured in various attractions where they are seen by millions of visitors each year. The Company also advertises in the English Premier League, which is the number one soccer league in the world, featuring STANLEY®, BLACK+DECKER® and DEWALT® brands to a global audience. Starting in 2014, the Company became a sponsor for one of the world’s most popular football clubs, FC Barcelona, including player image rights, hospitality assets and stadium signage. The Company also advertises in televised Professional Bull Riding events, and sponsors three riders in 'The Built Ford Tough Series,' one of the fastest growing sports in the U.S. with over 48 million fans. Additionally, the Company sponsors Moto GP, the world's premiere motorcycle racing series reaching 150 million fans per year and airing in over 200 countries, and the Monster Yamaha Tech3 team. In 2017, STANLEY®, BLACK+DECKER® and DEWALT®, continued to partner with three of the fastest growing and thrilling extreme sports categories, BMX, Freeride Mountain Biking (MTB) and Skateboarding, supporting over 18 athletes from grass-roots to professional level, to drive the Company's generation Z marketing objectives.
The above marketing initiatives highlight the Company's strong emphasis on brand building and support, which has resulted in more than 240 billion brand impressions annually and a steady improvement across the spectrum of brand awareness measures. The Company will continue allocating its brand and advertising spend wisely to capture the emerging digital landscape, whilst continuing to evolve proven marketing programs.
25
The Stanley Fulfillment System and SFS 2.0
Over the years, the Company has successfully leveraged the Stanley Fulfillment System ("SFS") to drive efficiency throughout the supply chain and improve working capital performance in order to generate incremental free cash flow. Historically, SFS focused on streamlining operations, which helped reduce lead times, realize synergies during acquisition integrations, and mitigate material and energy price inflation. In 2015, the Company launched a refreshed and revitalized SFS operating system, entitled SFS 2.0, to drive from a more programmatic growth mentality to a true organic growth culture by more deeply embedding breakthrough innovation and commercial excellence into its businesses, and at the same time, becoming a significantly more digitally-enabled enterprise.
The positive impacts of SFS 2.0 began in 2016, as evidenced by the launch of the FLEXVOLT® battery system in June 2016, and have continued into 2017 as demonstrated by the robust levels of organic growth and margin expansion. Additionally, in 2017, the Company opened the Stanley Engineered Fastening Breakthrough Innovation Center in Friedrichsdorf, Germany and launched the Futures Innovation Factory, housed in one of Boston's centers for start-up activity and advanced research. The Engineered Fastening facility is the first Europe-based Breakthrough Innovation Center within the Company and will serve as the Center of Excellence for Engineered Fastening's "FIRST Innovation" team focusing on bringing disruptive technologies to the fastening industry. The Futures Innovation Factory is dedicated to advancing technological innovation in STANLEY Security's business. This group focuses on uncovering disruptive business models and exploring technologies to transform and secure the world.
The Company has made a significant commitment to SFS 2.0 and management believes that its success will be characterized by continued organic growth in the 4-6% range as well as expanded operating margin rates over the next 3 to 5 years as the Company leverages the growth and reduces structural SG&A levels.
SFS 2.0 is transforming the Company by focusing its employees on the following five key pillars:
• | Digital Excellence uses the power of digital to contemporize, be disruptive, and create value throughout the Company's array of products, processes and business models. Digital Excellence means leveraging the power of emerging technologies across the Company's businesses to connected devices, the Internet of Things ("IoT"), and big data, as well as social and mobile, even more than what is being done today. Digital is penetrating all aspects of the organization and feeds into and supports the other elements of SFS 2.0 - enabling better asset efficiency through Core SFS, greater cost effectiveness via the Company's support functions, and improving revenues and margins via customer-facing opportunities. |
• | Commercial Excellence is about how the Company becomes more effective and efficient in its customer-facing processes resulting in continued share gains and margin expansion throughout its businesses. The Company views Commercial Excellence as world-class execution across seven areas: customer insights, innovation and portfolio management, pricing and promotion, brand and marketing, sales force deployment and effectiveness, channel programs, and the customer experience. |
• | Breakthrough Innovation is aimed at developing a culture to identify and commercialize market disrupting innovations, each with revenue generation potential greater than $100 million annually. The Company's focus remains on utilizing technologies to come up with major breakthroughs in the industries in which the Company operates which, when combined with its existing strong core innovation machine, will drive outsized share gains and margin expansion. |
• | Core SFS / Industry 4.0, which targets cost and asset efficiency, remains as the foundation for the Company's operating system and has yielded significant advances in improving working capital turns and free cash flow generation. The five operating principles encompassed by Core SFS, which work in concert, include: sales and operations planning ("S&OP"), operational lean, complexity reduction, global supply management, and order-to-cash excellence. The Company plans to continue leveraging these principles to further enhance the Company's already strong asset efficiency performance. Additionally, the Company is making investments behind the adoption of Industry 4.0 and advancing the Company's capabilities surrounding the automation of manufacturing that includes IoT, cloud computing, Artificial Intelligence ("AI"), 3-D printing, robotics, and advanced materials, among others. |
• | Functional Transformation takes a clean-sheet approach to redesigning the Company's key support functions such as Finance, HR, IT and others, which although highly effective, after roughly a hundred acquisitions are not as efficient as they can be based on external benchmarks. This presents the Company with an opportunity to realize the benefits from scale, reduce its SG&A as a percent of sales, and become a cost effectiveness enabler with the side benefit of helping to fund the other aspects of SFS 2.0 and to support margin expansion. |
26
These five pillars will serve as a powerful value driver in the years ahead, feeding the Company's new product innovation machine, embracing outstanding commercial and supply chain excellence, embedding digital into the various business models, and funding it with world-class functional efficiency. Taken together, these pillars will directly support achievement of the Company's long-term financial objectives, including its 22/22 Vision, and further enable its shareholder-friendly capital allocation approach, which has served the Company well in the past and will continue to do so in the future.
Outlook for 2018
This outlook discussion is intended to provide broad insight into the Company’s near-term earnings and cash flow generation prospects. The Company expects 2018 diluted earnings per share to approximate $7.80 to $8.00 ($8.30 to $8.50 excluding acquisition-related charges), and free cash flow conversion, defined as free cash flow divided by net income, to approximate 100%. The 2018 outlook assumes organic sales growth of approximately 5% resulting in approximately $0.50 to $0.60 of diluted earnings per share accretion. Commodity inflation of approximately $150 million, partially offset by price actions, is expected to negatively impact diluted earnings per share by $0.25 to $0.30. The net impact of closed acquisitions, cost actions and improved productivity, partially offset by higher share count, is expected to result in approximately $0.45 to $0.50 of diluted earnings per share accretion. The tax rate is expected to approximate 18%, reflecting the recently enacted U.S. tax legislation, which would result in approximately $0.20 of diluted earnings per share accretion. Embedded core restructuring charges are expected to be approximately $50 million.
RESULTS OF OPERATIONS
Below is a summary of the Company’s operating results at the consolidated level, followed by an overview of business segment performance.
Terminology: The term “organic” is utilized to describe results aside from the impacts of foreign currency fluctuations, acquisitions during their initial 12 months of ownership, and divestitures. This ensures appropriate comparability to operating results of prior periods.
Net Sales: Net sales were $12.747 billion in 2017 compared to $11.407 billion in 2016, representing an increase of 12% fueled by strong organic growth of 7%. In addition, acquisitions, primarily Newell Tools, and foreign currency increased sales by 7% and 1%, respectively, while the impact of divestitures decreased sales by 3%. Tools & Storage net sales increased 19% compared to 2016 due to strong innovation-fueled organic growth of 9%, with solid growth across all regions, and acquisition growth of 10%. Industrial net sales increased 6% relative to 2016 due to a 6% increase in sales volume, which was mainly driven by strong automotive system shipments in the Engineered Fastening business and successful commercial actions and higher inspection and onshore pipeline project activity in the Infrastructure business. Net sales in the Security segment decreased 8% compared to 2016 primarily due to a 12% decline from the sale of the majority of the mechanical security businesses, which more than offset increases from organic growth and small bolt-on commercial electronic security acquisitions of 1% and 3%, respectively.
Net sales were $11.407 billion in 2016, up 2% compared to $11.172 billion in 2015. Organic sales volume and pricing provided increases of 3% and 1%, respectively, partially offset by a 2% decrease due to negative impacts from foreign currency. In the Tools & Storage segment, net sales increased 5% compared to 2015 due to strong organic growth of 7%, driven by solid growth across all regions, bolstered by the launch of the FLEXVOLT® battery system, partially offset by foreign currency pressures of 2%. Industrial net sales declined 5% relative to 2015 primarily due to a 4% decrease in organic sales volume, which was mainly driven by weaker electronics volumes attributable to a major customer and pressured industrial volumes in the Engineered Fastening business as well as fewer off-shore pipeline projects and an ongoing difficult scrap steel market in the Infrastructure business. Excluding the impact of the electronics customer, the Industrial segment's organic growth was relatively flat in 2016. Net sales in the Security segment were relatively flat compared to 2015 as organic growth of 1% and small bolt-on electronic acquisitions of 1% were offset by foreign currency headwinds of 2%.
Gross Profit: The Company reported gross profit of $4.778 billion, or 37.5% of net sales, in 2017 compared to $4.267 billion, or 37.4% of net sales, in 2016. Acquisition-related charges, which reduced gross profit, were $46.8 million in 2017, primarily relating to the amortization of the inventory step-up adjustment for the Newell Tools acquisition. Excluding acquisition-related charges, gross profit was 37.8% of net sales in 2017, compared to 37.4% in 2016. The year-over-year increase in the profit rate was attributable to volume leverage, productivity and cost control, which more than offset increasing commodity inflation and the impact from the mechanical security business divestiture.
The Company reported gross profit of $4.267 billion, or 37.4% of net sales, in 2016 compared to $4.072 billion, or 36.4% of net sales, in 2015. The increase in the profit rate reflects favorable impacts from price, productivity, cost actions and commodity deflation, which more than offset unfavorable foreign currency.
27
SG&A Expense: Selling, general and administrative expenses, inclusive of the provision for doubtful accounts (“SG&A”), were $2.980 billion, or 23.4% of net sales, in 2017 compared to $2.624 billion, or 23.0% of net sales, in 2016. Within SG&A, acquisition-related integration and consulting costs totaled $37.7 million in 2017. Excluding these charges, SG&A was 23.1% of net sales in 2017 compared to 23.0% in 2016, as investments in growth initiatives were partially offset by continued tight cost management.
SG&A expenses were $2.624 billion, or 23.0% of net sales, in 2016 compared to $2.486 billion, or 22.3% of net sales in 2015. The increase in the SG&A rate was driven by investments in key SFS 2.0 initiatives moderated by continued tight management of costs.
Distribution center costs (i.e. warehousing and fulfillment facility and associated labor costs) are classified within SG&A. This classification may differ from other companies who may report such expenses within cost of sales. Due to diversity in practice, to the extent the classification of these distribution costs differs from other companies, the Company’s gross margins may not be comparable. Such distribution costs classified in SG&A amounted to $280.1 million in 2017, $235.6 million in 2016 and $229.3 million in 2015.
Corporate Overhead: The corporate overhead element of SG&A and gross profit, which is not allocated to the business segments, amounted to $216.8 million in 2017, $197.2 million in 2016 and $164.0 million in 2015. The year-over-year increases in both 2017 and 2016 were primarily due to growth investments in SFS 2.0 initiatives. Corporate overhead represented 1.7% of net sales in both 2017 and 2016 and 1.5% of net sales in 2015.
Other, net: Other, net totaled $289.7 million in 2017. Excluding acquisition-related transaction costs of $58.2 million, Other, net totaled $231.5 million in 2017 compared to $196.9 million in 2016 and $222.0 million in 2015. The increase in 2017 compared to 2016 was primarily driven by higher amortization expense related to the 2017 acquisitions, negative impacts of foreign currency and a one-time environmental remediation charge of $17 million recorded in the first quarter of 2017 relating to a legacy Black & Decker site. The decrease in 2016 compared to 2015 was primarily driven by lower unfavorable impacts of foreign currency and lower amortization expense, partially offset by higher acquisition due diligence costs.
Gain on Sales of Businesses: During 2017, the Company reported a $264.1 million pre-tax gain primarily relating to the sale of the majority of the mechanical security businesses, as previously discussed.
Pension Settlement: Pension settlement of $12.2 million in 2017 reflects losses previously reported in Accumulated other comprehensive loss related to a non-U.S. pension plan for which the Company settled its obligation by purchasing an annuity and making lump sum payments to participants.
Interest, net: Net interest expense in 2017 was $182.5 million compared to $171.3 million in 2016 and $165.2 million in 2015. The increase in net interest expense in 2017 versus 2016 was primarily due to the termination of interest rate swaps in June 2016 hedging the Company's fixed rate debt. The increase in net interest expense in 2016 versus 2015 was primarily due to amortization of debt issuance costs partially offset by an increase in interest income as a result of higher average cash balances during 2016.
Income Taxes: The Company's effective tax rate was 19.7% in 2017, 21.3% in 2016, and 21.6% in 2015. The 2017 effective tax rate includes a one-time net charge of $23.6 million relating to the provisional amounts recorded in the fourth quarter of 2017 associated with the recently enacted U.S. tax legislation. The net charge primarily relates to the re-measurement of existing deferred tax balances and the one-time transition tax. Excluding the impact of the divestitures, acquisition-related charges, and the one-time net charge related to the recently enacted U.S. tax legislation, the effective tax rate was 20.0% in 2017. This effective tax rate differed from the U.S. statutory rate primarily due to a portion of the Company's earnings being realized in lower-taxed foreign jurisdictions, the favorable settlement of certain income tax audits, and the acceleration of certain tax credits resulting in a tax benefit. The effective tax rate in both 2016 and 2015 differed from the U.S. statutory rate primarily due to a portion of the Company's earnings being realized in lower-taxed foreign jurisdictions, adjustments to tax positions relating to undistributed foreign earnings, and reversals of valuation allowances for certain foreign and U.S. state net operating losses, which had become realizable.
Business Segment Results
The Company’s reportable segments are aggregations of businesses that have similar products, services and end markets, among other factors. The Company utilizes segment profit which is defined as net sales minus cost of sales and SG&A inclusive of the provision for doubtful accounts (aside from corporate overhead expense), and segment profit as a percentage of net sales to assess the profitability of each segment. Segment profit excludes the corporate overhead expense element of SG&A, other, net (inclusive of intangible asset amortization expense), restructuring charges and asset impairments, gains on
28
sales of businesses, pension settlement, interest income, interest expense, and income tax expense. Corporate overhead is comprised of world headquarters facility expense, cost for the executive management team and the expense pertaining to certain centralized functions that benefit the entire Company but are not directly attributable to the businesses, such as legal and corporate finance functions. Refer to Note O, Restructuring Charges and Asset Impairments, and Note F, Goodwill and Intangible Assets, for the amount of net restructuring charges and asset impairments and intangible assets amortization expense, respectively, attributable to each segment.
The Company classifies its business into three reportable segments, which also represent its operating segments: Tools & Storage, Industrial and Security.
Tools & Storage:
The Tools & Storage segment is comprised of the Power Tools & Equipment ("PTE") and Hand Tools, Accessories & Storage ("HTAS") businesses. The PTE business includes both professional and consumer products. Professional products include professional grade corded and cordless electric power tools and equipment including drills, impact wrenches and drivers, grinders, saws, routers and sanders, as well as pneumatic tools and fasteners including nail guns, nails, staplers and staples, concrete and masonry anchors. Consumer products include corded and cordless electric power tools sold primarily under the BLACK+DECKER® brand, lawn and garden products, including hedge trimmers, string trimmers, lawn mowers, edgers and related accessories, and home products such as hand-held vacuums, paint tools and cleaning appliances. The HTAS business sells hand tools, power tool accessories and storage products. Hand tools include measuring, leveling and layout tools, planes, hammers, demolition tools, clamps, vises, knives, saws, chisels and industrial and automotive tools. Power tool accessories include drill bits, screwdriver bits, router bits, abrasives, saw blades and threading products. Storage products include tool boxes, sawhorses, medical cabinets and engineered storage solution products.
(Millions of Dollars) | 2017 | 2016 | 2015 | ||||||||
Net sales | $ | 8,862 | $ | 7,469 | $ | 7,141 | |||||
Segment profit | $ | 1,450 | $ | 1,267 | $ | 1,170 | |||||
% of Net sales | 16.4 | % | 17.0 | % | 16.4 | % | |||||
Tools & Storage net sales increased $1.393 billion, or 19%, in 2017 compared to 2016. Organic sales increased 9%, with strong organic growth in each of the regions, and acquisitions, primarily Newell, increased net sales by 10%. North America growth was supported by share gains from strong commercial execution and market-leading innovation, including sales from the FLEXVOLT® system, as well as a healthy U.S. tool market. Europe delivered above-market organic growth enabled by successful commercial actions and new product launches. The strong organic growth in emerging markets was supported by mid-price-point product releases, higher e-commerce volumes and strong commercial execution. Foreign currency increased sales by 1% while the sales of two small businesses in 2017 resulted in a 1% decrease.
Segment profit amounted to $1.450 billion, or 16.4% of net sales, in 2017 compared to $1.267 billion, or 17.0% of net sales, in 2016. Excluding acquisition-related charges of $81.8 million, segment profit amounted to 17.3% of net sales in 2017 compared to 17.0% in 2016, as volume leverage and productivity more than offset growth investments and increased commodity inflation.
Tools & Storage net sales increased $328.5 million, or 5%, in 2016 compared to 2015. Organic sales increased 7% primarily due to organic growth of 7% in North America, 8% in Europe, and 5% in emerging markets, while unfavorable effects of foreign currency decreased net sales by 2%. North America growth was fueled by share gains from the successful launch of the FLEXVOLT® system, core product innovation and strong commercial execution. Europe achieved above-market organic growth leveraging the benefits of new products, growth investments and an expanded retail footprint. Growth in emerging markets, led by Latin America and Asia, was driven by successful commercial execution surrounding mid-price point products and regional pricing actions.
Segment profit amounted to $1.267 billion, or 17.0% of net sales, in 2016 compared to $1.170 billion, or 16.4% of net sales, in 2015. The increase in segment profit year-over-year was primarily driven by volume leverage, price, productivity, cost management and lower commodity prices, which more than offset currency and growth investments.
Industrial:
The Industrial segment is comprised of the Engineered Fastening and Infrastructure businesses. The Engineered Fastening business primarily sells engineered fastening products and systems designed for specific applications. The product lines include blind rivets and tools, blind inserts and tools, drawn arc weld studs and systems, engineered plastic and mechanical fasteners, self-piercing riveting systems, precision nut running systems, micro fasteners, and high-strength structural fasteners. The Infrastructure business consists of the Oil & Gas and Hydraulics businesses. The Oil & Gas business sells and rents custom
29
pipe handling, joint welding and coating equipment used in the construction of large and small diameter pipelines, and provides pipeline inspection services. The Hydraulics business sells hydraulic tools and accessories.
(Millions of Dollars) | 2017 | 2016 | 2015 | ||||||||
Net sales | $ | 1,946 | $ | 1,840 | $ | 1,938 | |||||
Segment profit | $ | 352 | $ | 304 | $ | 340 | |||||
% of Net sales | 18.1 | % | 16.5 | % | 17.5 | % | |||||
Industrial net sales increased $105.7 million, or 6%, in 2017 compared with 2016, due to a 6% increase in organic sales. Engineered Fastening organic sales increased 4% as strong automotive system shipments and volume growth in general industrial markets more than offset lower volumes within electronics. Infrastructure organic sales increased 12% due to successful commercial actions and improved market conditions in the Hydraulics business and higher inspection and North American onshore pipeline project activity in the Oil & Gas business.
Segment profit totaled $352.3 million, or 18.1% of net sales, in 2017 compared to $304.4 million, or 16.5% of net sales, in 2016. The year-over-year increase in segment profit rate was primarily due to volume leverage, productivity gains and cost control.
Industrial net sales decreased $97.9 million, or 5%, in 2016 compared with 2015, due to a 4% decline in organic sales and a 1% decrease from foreign currency. Engineered Fastening organic revenues declined 4% primarily due to weaker electronics volumes attributable to a major customer and pressured industrial volumes, which more than offset higher automotive growth. Excluding the impact of the major electronics customer, Engineered Fastening's organic sales were slightly positive in 2016. Infrastructure organic revenues decreased 5% due to a slowdown in Oil & Gas off-shore project activity as well as ongoing difficult scrap steel market conditions in the Hydraulics business.
Segment profit totaled $304.4 million, or 16.5% of net sales, in 2016 compared to $339.9 million, or 17.5% of net sales, in 2015. The year-over-year decrease in segment profit rate was primarily driven by lower volumes and currency, which more than offset productivity gains and cost control actions.
Security:
The Security segment is comprised of the Convergent Security Solutions ("CSS") and the Mechanical Access Solutions ("MAS") businesses. The CSS business designs, supplies and installs commercial electronic security systems and provides electronic security services, including alarm monitoring, video surveillance, fire alarm monitoring, systems integration and system maintenance. Purchasers of these systems typically contract for ongoing security systems monitoring and maintenance at the time of initial equipment installation. The business also sells healthcare solutions, which include asset tracking, infant protection, pediatric protection, patient protection, wander management, fall management, and emergency call products. The MAS business primarily sells automatic doors.
(Millions of Dollars) | 2017 | 2016 | 2015 | ||||||||
Net sales | $ | 1,939 | $ | 2,097 | $ | 2,093 | |||||
Segment profit | $ | 212 | $ | 269 | $ | 240 | |||||
% of Net sales | 11.0 | % | 12.8 | % | 11.4 | % | |||||
Security net sales decreased $158.6 million, or 8%, in 2017 compared to 2016, primarily due to a 12% decline from the sale of the majority of the mechanical security businesses. Organic sales and small bolt-on commercial electronic security acquisitions provided increases of 1% and 3%, respectively. North America organic sales increased 2% on higher installation volumes within the commercial electronic security and automatic doors businesses and growth within healthcare. Europe organic growth was relatively flat as strength within the U.K. and the Nordics was mostly offset by anticipated ongoing weakness in France.
Segment profit amounted to $212.3 million, or 11.0%, of net sales, in 2017 compared to $269.2 million, or 12.8% of net sales, in 2016. Excluding acquisition-related charges of $2.0 million, segment profit amounted to 11.1% of net sales in 2017 compared to 12.8% in 2016. The decrease in segment profit year-over-year reflects an approximate 90 basis point decline related to the sale of the mechanical security businesses, as well as impacts from mix and funding growth investments.
Security net sales increased $4.5 million in 2016 compared to 2015. Organic sales and small bolt-on electronic acquisitions each provided increases of 1%, while foreign currency decreased net sales by 2%. Europe posted positive organic growth of 2% on higher installation revenues, while North America declined 1% organically primarily due to lower sales volume within the commercial electronic security business partially offset by higher prices and volumes in the automatic doors business. The
30
Security segment's organic growth in 2016 was also bolstered by double-digit growth within the emerging markets on easing comparables.
Segment profit amounted to $269.2 million, or 12.8% of net sales, in 2016 compared to $239.6 million, or 11.4% of net sales, in 2015. The increase in segment profit year-over-year was mainly due to improved operating performance in both North America and Europe, driven by a more disciplined assessment of new commercial opportunities, improved field productivity, and cost actions, which in the aggregate more than offset currency headwinds.
RESTRUCTURING ACTIVITIES
A summary of the restructuring reserve activity from December 31, 2016 to December 30, 2017 is as follows:
(Millions of Dollars) | 12/31/2016 | Net Additions | Usage | Currency | 12/30/2017 | ||||||||||||||
Severance and related costs | $ | 21.4 | $ | 40.6 | $ | (43.8 | ) | $ | 1.8 | $ | 20.0 | ||||||||
Facility closures and asset impairments | 14.2 | 10.9 | (22.1 | ) | 0.2 | 3.2 | |||||||||||||
Total | $ | 35.6 | $ | 51.5 | $ | (65.9 | ) | $ | 2.0 | $ | 23.2 | ||||||||
During 2017, the Company recognized net restructuring charges and asset impairments of $51.5 million. This amount reflects $40.6 million of net severance charges associated with the reduction of 1,584 employees and $10.9 million of facility closure and other restructuring costs. The Company expects the 2017 actions to result in annual net cost savings of approximately $45 million by the end of 2018.
The majority of the $23.2 million of reserves remaining as of December 30, 2017 is expected to be utilized within the next twelve months.
During 2016, the Company recognized net restructuring charges and asset impairments of $49.0 million. This amount reflects $27.3 million of net severance charges associated with the reduction of 1,326 employees. The Company also recognized $11.0 million of facility closure costs and $10.7 million of asset impairments. The 2016 actions resulted in annual net cost savings of approximately $20 million in each segment in 2017.
During 2015, the Company recognized net restructuring charges and asset impairments of $47.6 million. Net severance charges totaled $32.7 million relating to the reduction of approximately 1,300 employees. The Company also recognized $5.1 million of facility closure costs and $9.8 million of asset impairments. The 2015 actions resulted in annual net cost savings of approximately $40 million in 2016, primarily in the Industrial and Security segments.
Segments: The $52 million of net restructuring charges for the year ended December 30, 2017 includes: $25 million of net charges pertaining to the Tools & Storage segment; $8 million of net charges pertaining to the Industrial segment; $18 million of net charges pertaining to the Security segment; and $1 million of net charges pertaining to Corporate.
The anticipated annual net cost savings of approximately $45 million related to the 2017 restructuring actions include: $20 million pertaining to the Tools & Storage segment; $8 million pertaining to the Industrial segment; $16 million relating to the Security segment; and $1 million relating to Corporate.
FINANCIAL CONDITION
Liquidity, Sources and Uses of Capital: The Company’s primary sources of liquidity are cash flows generated from operations and available lines of credit under various credit facilities. The Company's cash flows are presented on a consolidated basis and include cash flows from discontinued operations in 2015.
Operating Activities: Cash flows from operations were $1.419 billion in 2017 compared to $1.485 billion in 2016. The year-over-year decrease was primarily driven by higher cash outflows from working capital (accounts receivable, inventory, accounts payable and deferred revenue) to support outsized organic growth in the Tools & Storage segment, partially offset by higher earnings excluding the impacts of non-cash items (gain on sales of businesses and amortization of inventory step-up).
In 2016, cash flows from operations were $1.485 billion compared to $1.182 billion in 2015, representing a $303 million increase. The year-over-year increase was primarily due to higher earnings and cash flows from working capital.
In 2015, cash flows from operations were $1.182 billion, a $114 million decrease compared to $1.296 billion in 2014. The year-over-year decrease was primarily due to higher outflows from working capital as a result of lower than expected sales volumes in the fourth quarter of 2015.
31
Free Cash Flow: Management considers free cash flow an important indicator of its liquidity, as well as its ability to fund future growth and provide dividends to shareowners. Free cash flow does not include deductions for mandatory debt service, other borrowing activity, discretionary dividends on the Company’s common stock and business acquisitions, among other items.
(Millions of Dollars) | 2017 | 2016 | 2015 | ||||||||
Net cash provided by operating activities | $ | 1,419 | $ | 1,485 | $ | 1,182 | |||||
Less: capital and software expenditures | (443 | ) | (347 | ) | (311 | ) | |||||
Free cash flow | $ | 976 | $ | 1,138 | $ | 871 | |||||
Investing Activities: Cash flows used in investing activities totaled $2.289 billion in 2017, primarily due to business acquisitions of $2.601 billion, mainly related to the Newell Tools and Craftsman acquisitions, and capital and software expenditures of $443 million, partially offset by net cash proceeds from sales of businesses of $757 million. The increase in capital and software expenditures in 2017 was due to growth in the Company's supply chain and investments related to functional transformation.
Cash flows used in investing activities in 2016 totaled $284 million, which primarily consisted of capital and software expenditures of $347 million and business acquisitions of $59 million, partially offset by $105 million of cash proceeds related to net investment hedge settlements, which were primarily driven by the significant fluctuations in foreign currency rates during 2016 associated with foreign exchange contracts hedging a portion of the Company's pound sterling, Canadian dollar, and Euro denominated net investments.
Cash flows used in investing activities in 2015 totaled $205 million, which primarily consisted of capital and software expenditures of $311 million partially offset by $138 million of cash proceeds related to net investment hedge settlements, which were primarily driven by the significant fluctuations in foreign currency rates during 2015 associated with foreign exchange contracts hedging a portion of the Company's pound sterling and Canadian dollar denominated net investments.
Financing Activities: Cash flows provided by financing activities totaled $295 million in 2017 mainly due to $726 million in proceeds from the issuance of equity units, partially offset by $363 million of cash dividend payments. The higher dividend payments in 2017 were driven by the increase in quarterly dividends per common share to $0.63. The dividend paid in December 2017 to shareholders of record extended the Company's record for the longest consecutive annual and quarterly dividend payments among industrial companies listed on the New York Stock Exchange.
Cash flows used in financing activities totaled $433 million in 2016 primarily due to share repurchases of $374 million, cash payments for dividends of $331 million, and the settlement of the October 2014 forward share purchase contract for $147 million, partially offset by proceeds from issuances of common stock of $419 million, which mainly related to the issuance of 3.5 million shares associated with the settlement of the 2013 Equity Purchase Contracts.
Cash flows used in financing activities in 2015 totaled $876 million, primarily due to the repurchase of 6.6 million common shares for $650 million and cash payments for dividends of $320 million, partially offset by proceeds from issuances of common stock of $164 million, which mainly related to the exercises of stock options. The Company also paid approximately $34 million in December 2015 to purchase the remaining 40% interest in GQ.
Fluctuations in foreign currency rates positively impacted cash by $81 million in 2017 due to the weakening of the U.S. Dollar against the Company's other currencies. Foreign currency negatively impacted cash by $102 million and $133 million in 2016 and 2015, respectively, due to the strengthening of the U.S. Dollar during those years.
Refer to Note H, Long-Term Debt and Financing Arrangements, and Note J, Capital Stock, for further discussion regarding the Company's debt and equity arrangements.
Credit Ratings and Liquidity:
The Company maintains strong investment grade credit ratings from the major U.S. rating agencies on its senior unsecured debt (S&P A, Fitch A-, Moody's Baa1), as well as its commercial paper program (S&P A-1, Fitch F2, Moody's P-2). There have been no changes to any of the ratings during 2017. Failure to maintain strong investment grade rating levels could adversely affect the Company’s cost of funds, liquidity and access to capital markets, but would not have an adverse effect on the Company’s ability to access its existing committed credit facilities.
32
Cash and cash equivalents totaled $638 million as of December 30, 2017, comprised of $54 million in the U.S. and $584 million in foreign jurisdictions. As of December 31, 2016, cash and cash equivalents totaled $1.132 billion, which was predominantly held in foreign jurisdictions.
As a result of the Tax Cuts and Jobs Act signed into law on December 22, 2017 (the "Act"), the Company recorded a provisional tax liability of $466 million for the one-time transition tax associated with unremitted foreign earnings and profits, which includes $5 million of foreign withholding taxes that will become payable upon distribution. The Company is still analyzing certain aspects of the Act and refining its estimate, which may change materially due to changes in interpretations and assumptions the Company has made, new guidance that may be issued in the future, and actions the Company may take as a result of the new legislation. The Act permits a U.S. company to elect to pay the net tax liability interest-free over a period of up to eight years. See the Contractual Obligations table below for the estimated amounts due by period. The Company has considered the implications of paying the required one-time transition tax, and believes it will not have a material impact on its liquidity. The Company is continuing to evaluate the impact of remitting foreign earnings and profits and may adjust its provisional estimate, upon completion of its evaluation, in its Consolidated Financial Statements within the measurement period provided for in Staff Accounting Bulletin No. 118 (“SAB 118”). Refer to Note A, Significant Accounting Policies, for further discussion of SAB 118, and Note Q, Income Taxes, for further discussion of the impacts of the Act.
In May 2017, the Company issued 7,500,000 Equity Units with a total notional value of $750.0 million ("$750 million Equity Units"). Each unit has a stated amount of $100 and initially consisted of a three-year forward stock purchase contract for the purchase of a variable number of shares of common stock, on May 15, 2020, for a price of $100, and a 10% beneficial ownership interest in one share of 0% Series C Cumulative Perpetual Convertible Preferred Stock, without par, with a liquidation preference of $1,000 per share ("Series C Preferred Stock"). The Company received approximately $727.5 million in cash proceeds from the $750 million Equity Units, net of underwriting costs and commissions, before offering expenses, and issued 750,000 shares of Series C Preferred Stock, recording $750.0 million in preferred stock. The proceeds were used for general corporate purposes, including repayment of short-term borrowings. The Company also used $25.1 million of the proceeds to enter into capped call transactions utilized to hedge potential economic dilution.
In January 2017, the Company amended its existing $2.0 billion commercial paper program to increase the maximum amount of notes authorized to be issued to $3.0 billion and to include Euro denominated borrowings in addition to U.S. Dollars. As of December 30, 2017, the Company had no borrowings outstanding against the $3.0 billion commercial paper program. At December 31, 2016, the Company had no borrowings outstanding against the Company’s $2.0 billion commercial paper program.
The Company has a five-year $1.75 billion committed credit facility (the “Credit Agreement”). Borrowings under the Credit Agreement may include U.S. Dollars up to the $1.75 billion commitment or in Euro or Pounds Sterling subject to a foreign currency sub-limit of $400.0 million and bear interest at a floating rate dependent upon the denomination of the borrowing. Repayments must be made on December 18, 2020 or upon an earlier termination date of the Credit Agreement, at the election of the Company. The Credit Agreement is designated to be a liquidity back-stop for the Company's $3.0 billion U.S. Dollar and Euro commercial paper program. As of December 30, 2017 and December 31, 2016, the Company has not drawn on this commitment.
The Company also has a 364-day $1.25 billion committed credit facility (the "2017 Credit Agreement") executed in December 2017. The 2017 Credit Agreement consists of a $1.25 billion revolving credit loan and a sub-limit of an amount equal to the Euro equivalent of $400 million for swing line advances. Borrowings under the 2017 Credit Agreement may be made in U.S. Dollars or Euros, pursuant to the terms of the agreement, and bear interest at a floating rate dependent on the denomination of the borrowing. Repayments must be made by December 19, 2018 or upon an earlier termination of the 2017 Credit Agreement at the election of the Company. The Company also has the option at the termination date to convert all advances into a term loan provided certain requirements are met. The 2017 Credit Agreement serves as a liquidity back-stop for the Company’s $3.0 billion U.S. Dollar and Euro commercial paper program. As of December 30, 2017, the Company had not drawn on this commitment.
In January 2017, the Company executed a 364-day $1.3 billion committed credit facility which consisted of a $1.3 billion revolving credit loan and a sub-limit of an amount equal to the Euro equivalent of $400 million for swing line advances. Borrowings under this credit agreement could be made in U.S. Dollars or Euros, pursuant to the terms of the agreement, and bore interest at a floating rate dependent on the denomination of the borrowing. This credit agreement was terminated in December 2017 at the election of the Company.
33
In addition, the Company has short-term lines of credit that are primarily uncommitted, with numerous banks, aggregating $624.9 million, of which $429.8 million was available at December 30, 2017. Short-term arrangements are reviewed annually for renewal.
At December 30, 2017, the aggregate amount of committed and uncommitted, long- and short-term lines was $3.6 billion. At December 30, 2017, $5.3 million was recorded as short-term borrowings and amounts outstanding against uncommitted lines excluding commercial paper. In addition, $195.1 million of the short-term credit lines was utilized primarily pertaining to outstanding letters of credit for which there are no required or reported debt balances. The weighted-average interest rates on U.S. Dollar denominated short-term borrowings, primarily commercial paper, for the fiscal years ended December 30, 2017 and December 31, 2016 were 1.2% and 0.6%, respectively. The weighted-average interest rates on Euro denominated short-term borrowings, primarily commercial paper, for fiscal year ended December 30, 2017 was negative 0.3%.
In March 2015, the Company entered into a forward share purchase contract with a financial institution counterparty for 3,645,510 shares of common stock. The contract obligates the Company to pay $350.0 million, plus an additional amount related to the forward component of the contract. In November 2016, the Company amended the settlement date to April 2019, or earlier at the Company's option.
In October 2014, the Company entered into a forward share purchase contract on its common stock. The contract obligated the Company to pay $150.0 million, plus an additional amount related to the forward component of the contract, to the financial institution counterparty not later than October 2016, or earlier at the Company’s option, for the 1,603,822 shares purchased. In October 2016, the Company physically settled the contract, receiving 1,603,822 shares for a settlement amount of $147.4 million.
On February 10, 2015, the Company net-share settled 9.1 million of the 12.2 million capped call options on its common stock and received 911,077 shares using an average reference price of $96.46 per common share. Additionally, the Company purchased 3,381,162 shares directly from the counterparties participating in the net-share settlement of the capped call options for $326.1 million, equating to an average price of $96.46 per share. In February 2016, the Company net-share settled the remaining 3.1 million capped call options on its common stock and received 293,142 shares using an average reference price of $94.34 per common share. Additionally, the Company purchased 1,316,858 shares directly from the counterparty participating in the net-share settlement for $124.2 million. The Company also repurchased 2,446,287 shares of common stock in February 2016 for $230.9 million, equating to an average price of $94.34.
In December 2013, the Company issued $400.0 million 5.75% fixed-to-floating rate junior subordinated debentures maturing December 15, 2053 (“2053 Junior Subordinated Debentures”) that bear interest at a fixed rate of 5.75% per annum, up to, but excluding December 15, 2018. From and including December 15, 2018, the 2053 Junior Subordinated Debentures will bear interest at an annual rate equal to three-month LIBOR plus 4.304%. The debentures subordination and long tenor provides significant credit protection measures for senior creditors and as a result, the debentures were awarded a 50% equity credit by S&P and Fitch, and 25% equity credit by Moody's. The net proceeds from the offering were primarily used to repay commercial paper borrowings.
In December 2013, the Company issued 3,450,000 Equity Units (the “Equity Units”), each with a stated value of $100. The Equity Units were initially comprised of a 1/10, or 10%, undivided beneficial ownership in a $1,000 principal amount 2.25% junior subordinated note due 2018 (the “2018 Junior Subordinated Note”) and a forward common stock purchase contract (the “Equity Purchase Contract”). The Company received approximately $334.7 million in cash proceeds from the Equity Units, net of underwriting discounts and commissions, before offering expenses, and recorded $345.0 million for the 2018 Junior Subordinated Note in long-term debt. The $345.0 million aggregate principal amount is due on November 17, 2018, and is included in Current maturities of long-term debt as of December 30, 2017, on the Consolidated Balance Sheets. The proceeds from the Equity Units were used primarily to repay commercial paper borrowings. The Company also used $9.7 million of the proceeds to enter into capped call transactions utilized to hedge potential economic dilution associated with the common shares issuable upon settlement of the Equity Purchase Contracts. The Company successfully remarketed the 2018 Junior Subordinated Note on November 17, 2016 ("Subordinated Notes"), which resulted in the interest rate being reset, effective on the settlement date, to a rate of 1.622% per annum, payable semi-annually in arrears on May 17 and November 17 of each year, commencing May 17, 2017 and maturing on November 17, 2018. Following settlement of the remarketing, the Subordinated Notes remain the Company’s direct, unsecured general obligations and are subordinated and junior in right of payment to the Company’s existing and future senior indebtedness, but the Subordinated Notes rank senior in right of payment to specified junior indebtedness on the terms and to the extent set forth in the indentures governing such junior indebtedness. In addition, the Company settled all Equity Purchase Contracts on November 17, 2016 by issuing 3,504,165 common shares and receiving $345.0 million in cash proceeds, generated from the remarketing described above. Lastly, in October and November 2016, the
34
Company’s capped call options on its common stock expired and were net-share settled resulting in the Company receiving 418,234 shares of common stock.
In November 2010, the Company issued 6,325,000 Convertible Preferred Units (the “Convertible Preferred Units”), each with a stated amount of $100. The Convertible Preferred Units were comprised of a 1/10, or 10%, undivided beneficial ownership in a $1,000 principal amount junior subordinated note (the “Note”) and a Purchase Contract (the “Purchase Contract”) obligating holders to purchase one share of the Company’s 4.75% Series B Perpetual Cumulative Convertible Preferred Stock (the “Convertible Preferred Stock”). The Company successfully remarketed the Notes on November 5, 2015, which resulted in the interest rate on the notes being reset, effective on the November 17, 2015 settlement date of the remarketing, to a rate of 2.45% per annum, payable semi-annually in arrears on May 17 and November 17 of each year, commencing May 17, 2016. Following settlement of the remarketing, the Notes remain the Company’s direct, unsecured general obligations subordinated and junior in right of payment to the Company’s existing and future senior indebtedness, but the Notes rank senior in right of payment to specified junior indebtedness on the terms and to the extent set forth in the indentures governing such junior indebtedness. In addition, the Company settled the Purchase Contracts on November 17, 2015 by issuing 6.3 million shares of Convertible Preferred Stock and receiving cash proceeds of $632.5 million. On November 18, 2015, the Company informed holders that it would redeem all outstanding shares of Convertible Preferred Stock on December 24, 2015 (the “Redemption Date”) at $100.49 per share in cash (the “Redemption Price”), which was equal to the liquidation preference of $100 per share of Convertible Preferred Stock, plus all accrued and unpaid dividends thereon to, but excluding, the Redemption Date. The Company redeemed the Convertible Preferred Stock and settled all conversions on December 24, 2015 by paying cash for the $100 par value per share of Convertible Preferred Stock, or $632.5 million in total, and issuing 2.9 million common shares for the excess value of the conversion feature above the $100 face value per share of Convertible Preferred Stock. The $632.5 million principal amount of the Notes is due November 17, 2018, and is included in Current maturities of long-term debt as of December 30, 2017, on the Consolidated Balance Sheets.
Refer to Note H, Long-Term Debt and Financing Arrangements, and Note J, Capital Stock, for further discussion regarding the Company's debt and equity arrangements.
Contractual Obligations: The following table summarizes the Company’s significant contractual obligations and commitments that impact its liquidity:
Payments Due by Period | |||||||||||||||||||
(Millions of Dollars) | Total | 2018 | 2019-2020 | 2021-2022 | Thereafter | ||||||||||||||
Long-term debt (a) | $ | 3,857 | $ | 984 | $ | 13 | $ | 1,160 | $ | 1,700 | |||||||||
Interest payments on long-term debt (b) | 3,078 | 152 | 266 | 248 | 2,412 | ||||||||||||||
Operating leases | 473 | 125 | 166 | 93 | 89 | ||||||||||||||
Inventory purchase commitments (c) | 410 | 410 | — | — | — | ||||||||||||||
Deferred compensation | 26 | 1 | 3 | 1 | 21 | ||||||||||||||
Marketing obligations | 51 | 31 | 20 | — | — | ||||||||||||||
Derivatives (d) | 96 | 91 | 5 | — | — | ||||||||||||||
Forward stock purchase contract (e) | 350 | — | 350 | — | — | ||||||||||||||
Pension funding obligations (f) | 41 | 41 | — | — | — | ||||||||||||||
Contract adjustment fees (g) | 101 | 40 | 61 | — | — | ||||||||||||||
Purchase price (h) | 250 | — | 250 | — | — | ||||||||||||||
U.S. income tax (i) | 466 | 36 | 73 | 73 | 284 | ||||||||||||||
Total contractual cash obligations | $ | 9,199 | $ | 1,911 | $ | 1,207 | $ | 1,575 | $ | 4,506 | |||||||||
(a) | Future payments on long-term debt encompass all payments related to aggregate debt maturities, excluding certain fair value adjustments included in long-term debt, as discussed further in Note H, Long-Term Debt and Financing Arrangements. |
(b) | Future interest payments on long-term debt reflect the applicable fixed interest rate or variable rate for floating rate debt in effect at December 30, 2017. |
(c) | Inventory purchase commitments primarily consist of open purchase orders to purchase raw materials, components, and sourced products. |
(d) | Future cash flows on derivative instruments reflect the fair value and accrued interest as of December 30, 2017. The ultimate cash flows on these instruments will differ, perhaps significantly, based on applicable market interest and foreign currency rates at their maturity. |
35
(e) | In March 2015, the Company entered into a forward share purchase contract with a financial institution counterparty which obligates the Company to pay $350 million, plus an additional amount related to the forward component of the contract. In November 2016, the Company amended the final settlement date to April 2019, or earlier at the Company's option. See Note J, Capital Stock, for further discussion. |
(f) | This amount principally represents contributions either required by regulations or laws or, with respect to unfunded plans, necessary to fund current benefits. The Company has not presented estimated pension and post-retirement funding beyond 2018 as funding can vary significantly from year to year based upon changes in the fair value of the plan assets, actuarial assumptions, and curtailment/settlement actions. |
(g) | These amounts represent future contract adjustment payments to holders of the Company's 2020 Purchase Contracts. See Note J, Capital Stock, for further discussion. |
(h) | The Company acquired the Craftsman® brand from Sears Holdings in March 2017. As part of the purchase price, the Company is obligated to pay $250 million in March 2020. See Note E, Acquisitions, for further discussion. |
(i) | Provisional income tax liability for the one-time deemed repatriation tax on unremitted foreign earnings and profits, including foreign withholding taxes of $5 million which will become payable upon distribution. |
To the extent the Company can reliably determine when payments will occur, the related amounts will be included in the table above. However, due to the high degree of uncertainty regarding the timing of potential future cash flows associated with the contingent consideration liability of $114 million related to the Craftsman acquisition and the unrecognized tax liabilities of $458 million at December 30, 2017, the Company is unable to make a reliable estimate of when (if at all) these amounts may be paid. Refer to Note E, Acquisitions, and Note Q, Income Taxes, for further discussion.
Payments of the above contractual obligations (with the exception of payments related to debt principal, the forward stock purchase contract, contract adjustment fees, the March 2020 purchase price, and tax obligations) will typically generate a cash tax benefit such that the net cash outflow will be lower than the gross amounts summarized above.
Other Significant Commercial Commitments:
Amount of Commitment Expirations Per Period | ||||||||||||||||||||
(Millions of Dollars) | Total | 2018 | 2019-2020 | 2021-2022 | Thereafter | |||||||||||||||
U.S. lines of credit | $ | 3,000 | $ | 1,250 | $ | 1,750 | $ | — | $ | — | ||||||||||
Short-term borrowings, long-term debt and lines of credit are explained in detail within Note H, Long-Term Debt and Financing Arrangements.
MARKET RISK
Market risk is the potential economic loss that may result from adverse changes in the fair value of financial instruments, currencies, commodities and other items traded in global markets. The Company is exposed to market risk from changes in foreign currency exchange rates, interest rates, stock prices, bond prices and commodity prices, amongst others.
Exposure to foreign currency risk results because the Company, through its global businesses, enters into transactions and makes investments denominated in multiple currencies. The Company’s predominant currency exposures are related to the Euro, Canadian Dollar, British Pound, Australian Dollar, Brazilian Real, Argentine Peso, Chinese Renminbi (“RMB”) and the Taiwan Dollar. Certain cross-currency trade flows arising from both trade and affiliate sales and purchases are consolidated and netted prior to obtaining risk protection through the use of various derivative financial instruments which may include: purchased basket options, purchased options, collars, cross-currency swaps and currency forwards. The Company is thus able to capitalize on its global positioning by taking advantage of naturally offsetting exposures and portfolio efficiencies to reduce the cost of purchasing derivative protection. At times, the Company also enters into foreign exchange derivative contracts to reduce the earnings and cash flow impact of non-functional currency denominated receivables and payables, primarily for affiliate transactions. Gains and losses from these hedging instruments offset the gains or losses on the underlying net exposures. Management determines the nature and extent of currency hedging activities, and in certain cases, may elect to allow certain currency exposures to remain un-hedged. The Company may also enter into cross-currency swaps and forward contracts to hedge the net investments in certain subsidiaries and better match the cash flows of operations to debt service requirements. Management estimates the foreign currency impact from its derivative financial instruments outstanding at the end of 2017 would have been an incremental pre-tax loss of approximately $50 million based on a hypothetical 10% adverse movement in all net derivative currency positions. The Company follows risk management policies in executing derivative financial instrument transactions, and does not use such instruments for speculative purposes. The Company generally does not hedge the translation of its non-U.S. dollar earnings in foreign subsidiaries, but may choose to do so in certain instances in future periods.
36
As mentioned above, the Company routinely has cross-border trade and affiliate flows that cause an impact on earnings from foreign exchange rate movements. The Company is also exposed to currency fluctuation volatility from the translation of foreign earnings into U.S. dollars and the economic impact of foreign currency volatility on monetary assets held in foreign currencies. It is more difficult to quantify the transactional effects from currency fluctuations than the translational effects. Aside from the use of derivative instruments, which may be used to mitigate some of the exposure, transactional effects can potentially be influenced by actions the Company may take. For example, if an exposure occurs from a European entity sourcing product from a U.S. supplier it may be possible to change to a European supplier. Management estimates the combined translational and transactional impact, on pre-tax earnings, of a 10% overall movement in exchange rates is approximately $147 million, or approximately $0.77 per diluted share. In 2017, translational and transactional foreign currency fluctuations negatively impacted pre-tax earnings by approximately $12.4 million and diluted earnings per share by approximately $0.07.
The Company’s exposure to interest rate risk results from its outstanding debt and derivative obligations, short-term investments, and derivative financial instruments employed in the management of its debt portfolio. The debt portfolio including both trade and affiliate debt, is managed to achieve capital structure targets and reduce the overall cost of borrowing by using a combination of fixed and floating rate debt as well as interest rate swaps, and cross-currency swaps.
The Company’s primary exposure to interest rate risk comes from its floating rate debt in the U.S. which is based on LIBOR rates. At December 30, 2017, the impact of a hypothetical 10% increase in the interest rates associated with the Company’s floating rate debt instruments would have an immaterial effect on the Company’s financial position and results of operations.
The Company has exposure to commodity prices in many businesses, particularly brass, nickel, resin, aluminum, copper, zinc, steel, and energy used in the production of finished goods. Generally, commodity price exposures are not hedged with derivative financial instruments, but instead are actively managed through customer product and service pricing actions, procurement-driven cost reduction initiatives and other productivity improvement projects.
Fluctuations in the fair value of the Company’s common stock affect domestic retirement plan expense as discussed below in the Employee Stock Ownership Plan ("ESOP") section of MD&A. Additionally, the Company has $87 million of liabilities as of December 30, 2017 pertaining to unfunded defined contribution plans for certain U.S. employees for which there is mark-to-market exposure.
The assets held by the Company’s defined benefit plans are exposed to fluctuations in the market value of securities, primarily global stocks and fixed-income securities. The funding obligations for these plans would increase in the event of adverse changes in the plan asset values, although such funding would occur over a period of many years. In 2017, 2016, and 2015, investment returns on pension plan assets resulted in a $217 million increase, a $260 million increase, and an $11 million decrease, respectively. The Company expects funding obligations on its defined benefit plans to be approximately $41 million in 2018. The Company employs diversified asset allocations to help mitigate this risk. Management has worked to minimize this exposure by freezing and terminating defined benefit plans where appropriate.
The Company has access to financial resources and borrowing capabilities around the world. There are no instruments within the debt structure that would accelerate payment requirements due to a change in credit rating.
The Company’s existing credit facilities and sources of liquidity, including operating cash flows, are considered more than adequate to conduct business as normal. Accordingly, based on present conditions and past history, management believes it is unlikely that operations will be materially affected by any potential deterioration of the general credit markets that may occur. The Company believes that its strong financial position, operating cash flows, committed long-term credit facilities and borrowing capacity, and ability to access equity markets, provide the financial flexibility necessary to continue its record of annual dividend payments, to invest in the routine needs of its businesses, to make strategic acquisitions and to fund other initiatives encompassed by its growth strategy and maintain its strong investment grade credit ratings.
OTHER MATTERS
Employee Stock Ownership Plan As detailed in Note L, Employee Benefit Plans, the Company has an ESOP under which the ongoing U.S. Core and 401(k) defined contribution plans are funded. Overall ESOP expense is affected by the market value of the Company’s stock on the monthly dates when shares are released, among other factors. The Company’s net ESOP activity resulted in expense of $1.3 million in 2017, income of $3.1 million in 2016, and expense of $0.8 million in 2015. ESOP expense could increase in the future if the market value of the Company’s common stock declines.
CRITICAL ACCOUNTING ESTIMATES — Preparation of the Company’s Consolidated Financial Statements requires management to make estimates and assumptions that affect the reported amounts of assets, liabilities, revenues and expenses. Significant accounting policies used in the preparation of the Consolidated Financial Statements are described in Note A,
37
Significant Accounting Policies. Management believes the most complex and sensitive judgments, because of their significance to the Consolidated Financial Statements, result primarily from the need to make estimates about the effects of matters with inherent uncertainty. The most significant areas involving management estimates are described below. Actual results in these areas could differ from management’s estimates.
ALLOWANCE FOR DOUBTFUL ACCOUNTS — The Company’s estimate for its allowance for doubtful accounts related to trade receivables is based on two methods. The amounts calculated from each of these methods are combined to determine the total amount reserved. First, a specific reserve is established for individual accounts where information indicates the customers may have an inability to meet financial obligations. In these cases, management uses its judgment, based on the surrounding facts and circumstances, to record a specific reserve for those customers against amounts due to reduce the receivable to the amount expected to be collected. These specific reserves are reevaluated and adjusted as additional information is received. Second, a reserve is determined for all customers based on a range of percentages applied to receivable aging categories. These percentages are based on historical collection and write-off experience.
If circumstances change, for example, due to the occurrence of higher-than-expected defaults or a significant adverse change in a major customer’s ability to meet its financial obligation to the Company, estimates of the recoverability of receivable amounts due could be reduced.
INVENTORIES - LOWER OF COST OR MARKET, SLOW MOVING AND OBSOLETE — Inventories in the U.S. are primarily valued at the lower of Last-In First-Out (“LIFO”) cost or market, while non-U.S. inventories are primarily valued at the lower of First-In, First-Out (“FIFO”) cost and net realizable value. The calculation of LIFO reserves, and therefore the net inventory valuation, is affected by inflation and deflation in inventory components. The Company continually reviews the carrying value of discontinued product lines and stock-keeping-units (“SKUs”) to determine that these items are properly valued. The Company also continually evaluates the composition of its inventory and identifies obsolete and/or slow-moving inventories. Inventory items identified as obsolete and/or slow-moving are evaluated to determine if write-downs are required. The Company assesses the ability to dispose of these inventories at a price greater than cost. If it is determined that cost is less than market or net realizable value, as applicable, cost is used for inventory valuation. If market value or net realizable value, as applicable, is less than cost, the Company writes down the related inventory to that value.
GOODWILL AND INTANGIBLE ASSETS — The Company acquires businesses in purchase transactions that result in the recognition of goodwill and intangible assets. The determination of the value of intangible assets requires management to make estimates and assumptions. In accordance with ASC 350-20, Goodwill, acquired goodwill and indefinite-lived intangible assets are not amortized but are subject to impairment testing at least annually or when an event occurs or circumstances change that indicate it is more likely than not an impairment exists. Definite-lived intangible assets are amortized and are tested for impairment when an event occurs or circumstances change that indicate it is more likely than not that an impairment exists. Goodwill represents costs in excess of fair values assigned to the underlying net assets of acquired businesses. At December 30, 2017, the Company reported $8.776 billion of goodwill, $2.206 billion of indefinite-lived trade names and $1.302 billion of net definite-lived intangibles.
Management tests goodwill for impairment at the reporting unit level. A reporting unit is an operating segment as defined in ASC 280, Segment Reporting, or one level below an operating segment (component level) as determined by the availability of discrete financial information that is regularly reviewed by operating segment management or an aggregate of component levels of an operating segment having similar economic characteristics. If the carrying value of a reporting unit (including the value of goodwill) is greater than its estimated fair value, an impairment may exist. An impairment charge would be recorded to the extent that the recorded value of goodwill exceeded the implied fair value.
As required by the Company’s policy, goodwill was tested for impairment in the third quarter of 2017. Beginning in 2013, the Company adopted ASU 2011-08, Intangibles - Goodwill and Other (Topic 350): Testing Goodwill for Impairment, for its goodwill impairment testing. ASU 2011-08 permits companies to first assess qualitative factors to determine whether it is more likely than not that the fair value of a reporting unit is less than its carrying amount as a basis for determining whether it is necessary to perform the two-step quantitative goodwill impairment test. Under the two-step quantitative goodwill impairment test, the fair value of the reporting unit is compared to its respective carrying amount including goodwill. If the fair value exceeds the carrying amount, then no impairment exists. If the carrying amount exceeds the fair value, further analysis is performed to assess impairment. Such tests are completed separately with respect to the goodwill of each of the Company’s reporting units. Accordingly, the Company applied the qualitative assessment for two of its reporting units, while performing the quantitative test for three of its reporting units. Based on the results of the annual impairment testing performed in the third quarter of 2017, the Company determined that the fair values of each of its reporting units exceeded their respective carrying amounts.
38
In performing the qualitative assessments, the Company identified and considered the significance of relevant key factors, events, and circumstances that could affect the fair value of each reporting unit. These factors include external factors such as macroeconomic, industry, and market conditions, as well as entity-specific factors, such as actual and planned financial performance. The Company also assessed changes in each reporting unit's fair value and carrying value since the most recent date a fair value measurement was performed. As a result of the qualitative assessments performed, the Company concluded that it is more likely than not that the fair value of each reporting unit exceeded its respective carrying value and therefore, no additional quantitative impairment testing was performed.
With respect to the quantitative tests, the Company assessed the fair values of the three reporting units based on a discounted cash flow valuation model. The key assumptions applied to the cash flow projections were discount rates, which ranged from 8.5% to 9.0%, near-term revenue growth rates over the next five years, which represented cumulative annual growth rates ranging from approximately 4% to 7%, and perpetual growth rates of 3%. These assumptions contemplated business, market and overall economic conditions. Based on the results of this testing, the Company determined that the fair values of each of the three reporting units exceeded their respective carrying amounts. Furthermore, management performed sensitivity analyses on the estimated fair values from the discounted cash flow valuation models utilizing more conservative assumptions that reflect reasonably likely future changes in the discount rate and perpetual growth rate. The discount rate was increased by 100 basis points with no impairment indicated. The perpetual growth rate was decreased by 150 basis points with no impairment indicated.
As previously disclosed in the Company's Form 10-Q for the third quarter of 2017, the fair value of the Infrastructure reporting unit exceeded its carrying amount by 18%. In connection with the preparation of the Consolidated Financial Statements for the year ended December 30, 2017, the Company performed an updated impairment analysis with respect to the Infrastructure reporting unit, which included approximately $271 million of goodwill at year-end. Based on this analysis, which included updated assumptions of near-term revenue and profitability levels, it was determined that the fair value of the Infrastructure reporting unit exceeded its carrying value by 37%. The increase in excess fair value is reflective of an improved near-term outlook due to solid results in 2017, including robust organic growth of 12%. Management remains confident in the long-term viability and success of the Infrastructure reporting unit based on its leading market position in its respective industries and the Company's continued commitment to, and investments in, organic growth initiatives (including solid progress being made with respect to Breakthrough Innovation projects under SFS 2.0).
The Company also tested its indefinite-lived trade names for impairment during the third quarter of 2017, utilizing both qualitative assessments and quantitative tests. For the qualitative assessments, the Company identified and considered the significance of relevant key factors, events, and circumstances that could affect the fair value of each trade name. These factors primarily included macroeconomic, industry, and market conditions, as well as the trade names' actual and planned financial performance. As a result of the qualitative assessments performed, the Company concluded that it is more likely than not that the fair values of the trade names exceeded their respective carrying values and therefore, no additional quantitative impairment testing was performed. For the quantitative impairment tests, the Company utilized a discounted cash flow model. The key assumptions used included discount rates, royalty rates, and perpetual growth rates applied to the projected sales. Based on these quantitative impairment tests, the Company determined that the fair values of the indefinite-lived trade names exceeded their respective carrying amounts.
In the event that future operating results of any of the Company's reporting units or indefinite-lived trade names do not meet current expectations, management, based upon conditions at the time, would consider taking restructuring or other strategic actions, as necessary, to maximize revenue growth and profitability. A thorough analysis of all the facts and circumstances existing at that time would need to be performed to determine if recording an impairment loss would be appropriate.
DEFINED BENEFIT OBLIGATIONS — The valuation of pension and other postretirement benefits costs and obligations is dependent on various assumptions. These assumptions, which are updated annually, include discount rates, expected return on plan assets, future salary increase rates, and health care cost trend rates. The Company considers current market conditions, including interest rates, to establish these assumptions. Discount rates are developed considering the yields available on high-quality fixed income investments with maturities corresponding to the duration of the related benefit obligations. The Company’s weighted-average discount rates used to determine benefit obligations at December 30, 2017 for the United States and international pension plans were 3.53% and 2.24%, respectively. The Company’s weighted-average discount rates used to determine benefit obligations at December 31, 2016 for the United States and international pension plans were 3.95% and 2.38%, respectively. As discussed further in Note L, Employee Benefit Plans, the Company develops the expected return on plan assets considering various factors, which include its targeted asset allocation percentages, historic returns, and expected future returns. The Company’s expected rate of return assumptions for the United States and international pension plans were 6.25% and 4.41%, respectively, at December 30, 2017. The Company will use a 5.30% weighted-average expected rate of return assumption to determine the 2018 net periodic benefit cost. A 25 basis point reduction in the expected rate of return assumption would increase 2018 net periodic benefit cost by approximately $5 million on a pre-tax basis.
39
The Company believes that the assumptions used are appropriate; however, differences in actual experience or changes in the assumptions may materially affect the Company’s financial position or results of operations. To the extent that actual (newly measured) results differ from the actuarial assumptions, the difference is recognized in accumulated other comprehensive loss, and, if in excess of a specified corridor, amortized over future periods. The expected return on plan assets is determined using the expected rate of return and the fair value of plan assets. Accordingly, market fluctuations in the fair value of plan assets can affect the net periodic benefit cost in the following year. The projected benefit obligation for defined benefit plans exceeded the fair value of plan assets by $650 million at December 30, 2017. A 25 basis point reduction in the discount rate would have increased the projected benefit obligation by approximately $98 million at December 30, 2017. The primary Black & Decker U.S pension and post employment benefit plans were curtailed in late 2010, as well as the only material Black & Decker international plan, and in their place the Company implemented defined contribution benefit plans. The vast majority of the projected benefit obligation pertains to plans that have been frozen; the remaining defined benefit plans that are not frozen are predominantly small domestic union plans and those that are statutorily mandated in certain international jurisdictions. The Company recognized $19 million of defined benefit plan expense in 2017, which may fluctuate in future years depending upon various factors including future discount rates and actual returns on plan assets.
ENVIRONMENTAL — The Company incurs costs related to environmental issues as a result of various laws and regulations governing current operations as well as the remediation of previously contaminated sites. The Company’s policy is to accrue environmental investigatory and remediation costs for identified sites when it is probable that a liability has been incurred and the amount of loss can be reasonably estimated. The amount of liability recorded is based on an evaluation of currently available facts with respect to each individual site and includes such factors as existing technology, presently enacted laws and regulations, and prior experience in remediation of contaminated sites. The liabilities recorded do not take into account any claims for recoveries from insurance or third parties. As assessments and remediation progress at individual sites, the amounts recorded are reviewed periodically and adjusted to reflect additional technical and legal information that becomes available.
As of December 30, 2017, the Company had reserves of $176.1 million for remediation activities associated with Company-owned properties as well as for Superfund sites, for losses that are probable and estimable. The range of environmental remediation costs that is reasonably possible is $143.4 million to $277.1 million which is subject to change in the near term. The Company may be liable for environmental remediation of sites it no longer owns. Liabilities have been recorded on those sites in accordance with this policy.
INCOME TAXES — The Company accounts for income taxes under the asset and liability method in accordance with ASC 740, Income Taxes, which requires the recognition of deferred tax assets and liabilities for the expected future tax consequences of events that have been included in the financial statements. Deferred tax assets and liabilities are determined based on the differences between the financial statements and tax basis of assets and liabilities using the enacted tax rates in effect for the year in which the differences are expected to reverse. Any changes in tax rates on deferred tax assets and liabilities are recognized in income in the period that includes the enactment date.
The Company records net deferred tax assets to the extent that it is more likely than not that these assets will be realized. In making this determination, management considers all available positive and negative evidence, including future reversals of existing temporary differences, estimates of future taxable income, tax-planning strategies, and the realizability of net operating loss carryforwards. In the event that it is determined that an asset is not more likely that not to be realized, a valuation allowance is recorded against the asset. Valuation allowances related to deferred tax assets can be impacted by changes to tax laws, changes to statutory tax rates and future taxable income levels. In the event the Company were to determine that it would not be able to realize all or a portion of its deferred tax assets in the future, the unrealizable amount would be charged to earnings in the period in which that determination is made. Conversely, if the Company were to determine that it would be able to realize deferred tax assets in the future in excess of the net carrying amounts, it would decrease the recorded valuation allowance through a favorable adjustment to earnings in the period that the determination was made.
The Company records uncertain tax positions in accordance with ASC 740, which requires a two-step process. First, management determines whether it is more likely than not that a tax position will be sustained based on the technical merits of the position and second, for those tax positions that meet the more likely than not threshold, management recognizes the largest amount of the tax benefit that is greater than 50 percent likely to be realized upon ultimate settlement with the related taxing authority. The Company maintains an accounting policy of recording interest and penalties on uncertain tax positions as a component of Income taxes on continuing operations in the Consolidated Statements of Operations.
The Company is subject to income tax in a number of locations, including many state and foreign jurisdictions. Significant judgment is required when calculating the worldwide provision for income taxes. Many factors are considered when evaluating and estimating the Company's tax positions and tax benefits, which may require periodic adjustments and which may not accurately anticipate actual outcomes. It is reasonably possible that the amount of the unrecognized benefit with respect to
40
certain of the Company's unrecognized tax positions will significantly increase or decrease within the next twelve months. These changes may be the result of settlements of ongoing audits or final decisions in transfer pricing matters. The Company periodically assesses its liabilities and contingencies for all tax years still subject to audit based on the most current available information, which involves inherent uncertainty.
On December 22, 2017, the U.S. government enacted comprehensive tax legislation commonly referred to as the Tax Cuts and Jobs Act (the “Act”). The Act contains a new tax law that may subject the Company to a tax on global intangible low-taxed income (“GILTI”) beginning in 2018. GILTI is a tax on foreign income in excess of a deemed return on tangible assets of foreign corporations. Companies subject to GILTI have the option to account for the GILTI tax as a period cost if and when incurred, or to recognize deferred taxes for temporary differences including outside basis differences expected to reverse as GILTI. The Company has elected to account for GILTI as a period cost.
Additional information regarding income taxes is available in Note Q, Income Taxes.
RISK INSURANCE — To manage its insurance costs efficiently, the Company self insures for certain U.S. business exposures and generally has low deductible plans internationally. For domestic workers’ compensation, automobile and product liability (liability for alleged injuries associated with the Company’s products), the Company generally purchases insurance coverage only for severe losses that are unlikely, and these lines of insurance involve the most significant accounting estimates. While different self insured retentions, in the form of deductibles and self insurance through its captive insurance company, exist for each of these lines of insurance, the maximum self insured retention is set at no more than $5 million per occurrence. The process of establishing risk insurance reserves includes consideration of actuarial valuations that reflect the Company’s specific loss history, actual claims reported, and industry trends among statistical and other factors to estimate the range of reserves required. Risk insurance reserves are comprised of specific reserves for individual claims and additional amounts expected for development of these claims, as well as for incurred but not yet reported claims discounted to present value. The cash outflows related to risk insurance claims are expected to occur over a period of approximately 14 years. The Company believes the liabilities recorded for these U.S. risk insurance reserves, totaling $87 million and $89 million as of December 30, 2017, and December 31, 2016, respectively, are adequate. Due to judgments inherent in the reserve estimation process, it is possible the ultimate costs will differ from this estimate.
WARRANTY — The Company provides product and service warranties which vary across its businesses. The types of warranties offered generally range from one year to limited lifetime, and certain branded products recently acquired carry a lifetime warranty. There are also certain products with no warranty. Further, the Company sometimes incurs discretionary costs to service its products in connection with product performance issues. Historical warranty and service claim experience forms the basis for warranty obligations recognized. Adjustments are recorded to the warranty liability as new information becomes available. The Company believes the $176 million reserve for expected warranty claims as of December 30, 2017 is adequate, but due to judgments inherent in the reserve estimation process, including forecasting future product reliability levels and costs of repair as well as the estimated age of certain products submitted for claims, the ultimate claim costs may differ from the recorded warranty liability. The Company also establishes a reserve for product recalls on a product-specific basis during the period in which the circumstances giving rise to the recall become known and estimable for both company-initiated actions and those required by regulatory bodies.
OFF-BALANCE SHEET ARRANGEMENT
SYNTHETIC LEASES — The Company is a party to synthetic leasing programs for certain locations, including one of its major distribution centers and two of its office buildings. The programs qualify as operating leases for accounting purposes, where only the monthly lease expense is recorded in the Consolidated Statements of Operations and the liability and value of the underlying assets are off-balance sheet.
These lease programs are utilized primarily to reduce overall cost and to retain flexibility. The cash outflows for lease payments approximate the $2 million of rent expense recognized in fiscal 2017. As of December 30, 2017, the estimated fair value of the underlying assets and lease guarantees of the residual values for these properties were $119 million and $103 million, respectively.
41
CAUTIONARY STATEMENTS UNDER THE PRIVATE SECURITIES LITIGATION
REFORM ACT OF 1995
Certain statements contained in this Annual Report on Form 10-K that are not historical, including but not limited to those regarding the Company’s ability to: (i) close the Nelson transaction in the first half of 2018; (ii) achieve its long-term financial objectives including: 4-6% organic revenue growth; 10-12% total revenue growth; 10-12% total earnings per share growth (7-9% organically) excluding acquisition-related charges; free cash flow equal to, or exceeding, net income; sustain 10+ working capital turns; and $22 billion in revenue by 2022 while expanding the margin rate; (iii) return approximately 50% of free cash flow to shareholders through a strong and growing dividend as well as opportunistically repurchasing shares and deploying the remaining 50% toward acquisitions; (iv) significantly increase the availability of Craftsman®-branded products to consumers in previously underpenetrated channels, enhance innovation, and add manufacturing jobs in the U.S. to support growth; (v) achieve 2018 diluted earnings per share of approximately $7.80 to $8.00 ($8.30 to $8.50 excluding acquisition-related charges); (vi) achieve free cash flow conversion, defined as free cash flow divided by net income, of approximately 100% in 2018 (collectively, the “Results”); are “forward-looking statements” and subject to risk and uncertainty.
The Company’s ability to deliver the Results as described above is based on current expectations and involves inherent risks and uncertainties, including factors listed below and other factors that could delay, divert, or change any of them, and could cause actual outcomes and results to differ materially from current expectations. In addition to the risks, uncertainties and other factors discussed elsewhere herein, the risks, uncertainties and other factors that could cause or contribute to actual results differing materially from those expressed or implied in the forward-looking statements include, without limitation, those set forth under Item 1A Risk Factors hereto and any material changes thereto set forth in any subsequent Quarterly Reports on Form 10-Q, or those contained in the Company’s other filings or other submissions with the Securities and Exchange Commission, and those set forth below.
The Company’s ability to deliver the Results is dependent, or based, upon: (i) the Company’s ability to generate organic sales growth of approximately 5% resulting in approximately $0.50 to $0.60 of diluted earnings per share accretion in 2018; (ii) commodity inflation of approximately $150 million, partially offset by price actions, negatively impacting diluted earnings per share by $0.25 to $0.30 in 2018; (iii) the net impact of closed acquisitions, cost actions and improved productivity, partially offset by higher share count, resulting in approximately $0.45 to $0.50 of diluted earnings per share accretion in 2018; (iv) core (excluding acquisitions) restructuring charges being approximately $50 million; (v) the Company’s 2018 tax rate being approximately 18%, which would result in approximately $0.20 of diluted earnings per share accretion; (vi) the Company’s ability to capitalize on operational improvements in both Security Europe and North America; (vii) the Company’s ability to identify and realize cost and revenue synergies associated with acquisitions; (viii) successful identification of appropriate acquisition opportunities and completing them within time frames and at reasonable costs as well as the integration of completed acquisitions and reorganization of existing businesses; (ix) the continued acceptance of technologies used in the Company’s products and services including FLEXVOLT® product; (x) the Company’s ability to manage existing Sonitrol franchisee and Mac Tools relationships; (xi) the Company’s ability to minimize costs associated with any sale or discontinuance of a business or product line, including any severance, restructuring, legal or other costs; (xii) the proceeds realized with respect to any business or product line disposals; (xiii) the extent of any asset impairments with respect to any businesses or product lines that are sold or discontinued; (xiv) the success of the Company’s efforts to manage freight costs, steel and other commodity costs as well as capital expenditures; (xv) the Company’s ability to sustain or increase prices in order to, among other things, offset or mitigate the impact of steel, freight, energy, non-ferrous commodity and other commodity costs and any inflation increases and/or currency impacts; (xvi) the Company’s ability to generate free cash flow, maintain a conservative credit profile, and a strong investment grade rating; (xvii) the Company’s ability to identify and effectively execute productivity improvements and cost reductions, while minimizing any associated restructuring charges; (xviii) the Company’s ability to obtain favorable settlement of tax audits; (xix) the ability of the Company to generate earnings sufficient to realize future income tax benefits during periods when temporary differences become deductible; (xx) the continued ability of the Company to access credit markets under satisfactory terms; (xxi) the Company’s ability to negotiate satisfactory payment terms under which the Company buys and sells goods, services, materials and products; (xxii) the Company’s ability to successfully develop, market and achieve sales from new products and services; (xxiii) the availability of cash to repurchase shares when conditions are right, as well as the Company's ability to effectively use equity derivative transactions to reduce the capital requirement associated with share repurchases; and (xxiv) the impact of the enacted U.S. Tax Cuts and Jobs Act on the provisional estimate recorded in 2017 based on legislative developments and refined calculations.
The Company’s ability to deliver the Results is also dependent upon: (i) the success of the Company’s marketing and sales efforts, including the ability to develop and market new and innovative products and solutions in both existing and new markets including emerging markets; (ii) the ability of the Company to maintain or improve production rates in the Company’s manufacturing facilities, respond to significant changes in product demand and fulfill demand for new and existing products; (iii) the Company’s ability to continue improvements in working capital through effective management of accounts receivable
42
and inventory levels; (iv) the ability to continue successfully managing and defending claims and litigation; (v) the success of the Company’s efforts to mitigate adverse earnings impact resulting from any cost increases generated by, for example, increases in the cost of energy or significant Euro, Canadian Dollar, Chinese Renminbi or other currency fluctuations; (vi) the geographic distribution of the Company’s earnings; (vii) the commitment to, and success of, the Stanley Fulfillment System, SFS 2.0 and focusing its employees on the related five key pillars of digital excellence, commercial excellence, breakthrough innovation, Core SFS / Industry 4.0, and functional transformation; and (viii) successful implementation with expected results of cost reduction programs.
The Company’s ability to achieve the Results will also be affected by external factors. These external factors include: challenging global geopolitical and macroeconomic environment possibly including impact from "Brexit" or other similar actions from other EU member states; the economic environment of emerging markets, particularly Latin America, Russia, China and Turkey; pricing pressure and other changes within competitive markets; the continued consolidation of customers particularly in consumer channels; inventory management pressures on the Company’s customers; the impact the tightened credit markets may have on the Company or its customers or suppliers; the extent to which the Company has to write off accounts receivable or assets or experiences supply chain disruptions in connection with bankruptcy filings by customers or suppliers; increasing competition; changes in laws, regulations and policies that affect the Company, including, but not limited to trade, monetary, tax and fiscal policies and laws; the timing and extent of any inflation or deflation; the impact of poor weather conditions on sales; currency exchange fluctuations; the impact of dollar/foreign currency exchange and interest rates on the competitiveness of products and the Company’s debt program; the strength of the U.S. and European economies; the extent to which world-wide markets associated with homebuilding and remodeling stabilize and rebound; the impact of events that cause or may cause disruption in the Company’s supply, manufacturing, distribution and sales networks such as war, terrorist activities, political unrest and possible hostilities on the Korean Peninsula; and recessionary or expansive trends in the economies of the world in which the Company operates.
Unless required by applicable federal securities laws, the Company undertakes no obligation to publicly update or revise any forward-looking statements to reflect events or circumstances that may arise after the date hereof. Investors are advised, however, to consult any further disclosures made on related subjects in the Company's reports filed with the Securities and Exchange Commission.
In addition to the foregoing, some of the agreements included as exhibits to this Annual Report on Form 10-K (whether incorporated by reference to earlier filings or otherwise) may contain representations and warranties, recitals or other statements that appear to be statements of fact. These agreements are included solely to provide investors with information regarding their terms and are not intended to provide any other factual or disclosure information about the Company or the other parties to the agreements. Representations and warranties, recitals, and other common disclosure provisions have been included in the agreements solely for the benefit of the other parties to the applicable agreements and often are used as a means of allocating risk among the parties.
Accordingly, such statements (i) should not be treated as categorical statements of fact; (ii) may be qualified by disclosures that were made to the other parties in connection with the negotiation of the applicable agreements, which disclosures are not necessarily reflected in the agreement or included as exhibits hereto; (iii) may apply standards of materiality in a way that is different from what may be viewed as material by or to investors in or lenders to the Company; and (iv) were made only as of the date of the applicable agreement or such other date or dates as may be specified in the agreement and are subject to more recent developments. Accordingly, representations and warranties, recitals or other disclosures contained in agreements may not describe the actual state of affairs as of the date they were made or at any other time and should not be relied on by any person other than the parties thereto in accordance with their terms. Additional information about the Company may be found in this Annual Report on Form 10-K and the Company's other public filings, which are available without charge through the SEC's website at http://www.sec.gov.
43
ITEM 7A. QUANTITATIVE AND QUALITATIVE DISCLOSURES ABOUT MARKET RISK
The Company incorporates by reference the material captioned “Market Risk” in Item 7 and in Note I, Financial Instruments, of the Notes to Consolidated Financial Statements in Item 8.
ITEM 8. FINANCIAL STATEMENTS AND SUPPLEMENTARY DATA
See Item 15 for an index to Financial Statements and Financial Statement Schedules. Such Financial Statements and Financial Statement Schedules are incorporated herein by reference.
ITEM 9. CHANGES IN AND DISAGREEMENTS WITH ACCOUNTANTS ON ACCOUNTING AND FINANCIAL DISCLOSURE
None.
44
ITEM 9A. CONTROLS AND PROCEDURES
The management of Stanley Black & Decker (the “Company”) is responsible for establishing and maintaining adequate internal control over financial reporting. Internal control over financial reporting is a process designed to provide reasonable assurance regarding the reliability of financial reporting and the preparation of financial statements for external reporting purposes in accordance with accounting principles generally accepted in the United States of America. Because of its inherent limitations, internal control over financial reporting may not prevent or detect misstatements.
In March 2017, Stanley Black & Decker acquired Newell Tools for approximately $1.84 billion. Since Stanley Black & Decker has not yet fully incorporated the internal controls and procedures of Newell Tools into Stanley Black & Decker Inc.'s internal control over financial reporting, management excluded this business from its assessment of the effectiveness of internal control over financial reporting as of December 30, 2017. Newell Tools accounted for 12% of Stanley Black & Decker Inc.'s total assets as of December 30, 2017 and 5% of Stanley Black & Decker Inc.'s net sales for the year then ended.
Management has assessed the effectiveness of the Company’s internal control over financial reporting as of December 30, 2017. In making its assessment, management has utilized the criteria set forth by the Committee of Sponsoring Organizations (COSO) of the Treadway Commission in Internal Control — Integrated Framework (2013 Framework). Management concluded that based on its assessment, the Company’s internal control over financial reporting was effective as of December 30, 2017. Ernst & Young LLP, the auditor of the financial statements included in this annual report, has issued an attestation report on the registrant’s internal control over financial reporting, a copy of which appears on page 56.
Under the supervision and with the participation of management, including the Company’s President and Chief Executive Officer and its Executive Vice President and Chief Financial Officer, the Company has, pursuant to Rule 13a-15(b) of the Securities Exchange Act of 1934, as amended (the “Exchange Act”), evaluated the effectiveness of the design and operation of its disclosure controls and procedures (as defined under Rule 13a-15(e) of the Exchange Act). Based upon that evaluation, the Company’s President and Chief Executive Officer and its Executive Vice President and Chief Financial Officer have concluded that, as of December 30, 2017, the Company’s disclosure controls and procedures are effective. There has been no change in the Company’s internal control over financial reporting that occurred during the fiscal year ended December 30, 2017 that has materially affected, or is reasonably likely to materially affect, the Company’s internal control over financial reporting aside from the previously mentioned acquisition of Newell Tools. As part of the ongoing integration activities, the Company will complete an assessment of existing controls and incorporate its controls and procedures into Newell Tools.
ITEM 9B. OTHER INFORMATION
None.
45
PART III
ITEM 10. DIRECTORS, EXECUTIVE OFFICERS AND CORPORATE GOVERNANCE OF THE REGISTRANT
The information required by this Item, except for certain information with respect to the Company’s Code of Ethics, the identification of the executive officers of the Company and any material changes to the procedures by which security holders may recommend nominees to the Company’s Board of Directors, as set forth below, is incorporated herein by reference to the information set forth in the section of the Company’s definitive proxy statement (which will be filed pursuant to Regulation 14A under the Exchange Act within 120 days after the close of the Company’s fiscal year) under the headings “Information Concerning Nominees for Election as Directors,” “Board of Directors,” and “Section 16(a) - Beneficial Ownership Reporting Compliance.”
In addition to Business Conduct Guidelines that apply to all directors and employees of the Company, the Company has adopted a Code of Ethics that applies to the Company’s Chief Executive Officer and all senior financial officers, including the Chief Financial Officer and principal accounting officer. A copy of the Company’s Code of Ethics is available on the Company’s website at www.stanleyblackanddecker.com.
46
The following is a list of the executive officers of the Company as of February 27, 2018:
Name and Age | Office | Date Elected to Office | ||
James M. Loree (59) | President & Chief Executive Officer since August 2016. President & Chief Operating Officer (2013); Executive Vice President and Chief Operating Officer (2009); Executive Vice President Finance and Chief Financial Officer (1999). | 7/19/1999 | ||
Donald Allan, Jr. (53) | Executive Vice President & Chief Financial Officer since October 2016. Senior Vice President & Chief Financial Officer (2010); Vice President & Chief Financial Officer (2009); Vice President & Corporate Controller (2002); Corporate Controller (2000); Assistant Controller (1999). | 10/24/2006 | ||
Jeffery D. Ansell (50) | Executive Vice President & President, Tools & Storage since October 2016. Senior Vice President and Group Executive, Global Tools & Storage (2015); Senior Vice President and Group Executive, Construction and DIY (2010). Vice President & President, Stanley Consumer Tools Group; President - Consumer Tools and Storage (2004); President of Industrial Tools & Storage (2002); Vice President - Global Consumer Tools Marketing (2001); Vice President Consumer Sales America (1999). | 2/22/2006 | ||
Jocelyn S. Belisle (55) | Vice President, Chief Accounting Officer since July 2009. | 4/19/2017 | ||
Janet M. Link (48) | Senior Vice President, General Counsel and Secretary since July 17, 2017. Executive Vice President, General Counsel, JC Penney Company, Inc. (2015); Vice President, Deputy General Counsel, JC Penney Company, Inc. (2014); Vice President, Deputy General Counsel, Clear Channel Companies (2013). | 7/19/2017 | ||
Jaime A. Ramirez (50) | Senior Vice President & President, Global Emerging Markets, since October 2012. President, Construction & DIY, Latin America (2010); Vice President and General Manager - Latin America, Power Tools & Accessories, The Black & Decker Corporation (2008); Vice President and General Manager - Andean Region The Black & Decker Corporation (2007). | 3/12/2010 | ||
Joseph R. Voelker (62) | Senior Vice President, Chief Human Resources Officer, since April 1, 2013. VP Human Resources (2009); VP Human Resources - ITG/Corporate Staff (2006); VP Human Resources - Tools Group/Operations (2004); HR Director, Tools Group (2003); HR Director, Operations (1999). | 4/1/2013 | ||
John H. Wyatt (59) | President, Stanley Engineered Fastening since January 2016. President, Sales & Marketing - Global Tools & Storage (2015). President, Construction & DIY, Europe and ANZ (2012). President, Construction & DIY, EMEA (2010); President-Europe, Middle East, and Africa, Power Tools and Accessories, The Black & Decker Corporation (2008); Vice President-Consumer Products (Europe, Middle East and Africa), The Black & Decker Corporation (2006). | 3/12/2010 | ||
47
ITEM 11. EXECUTIVE COMPENSATION
The information required by this Item is incorporated herein by reference to the information set forth under the section entitled “Executive Compensation” of the Company’s definitive proxy statement, which will be filed pursuant to Regulation 14A under the Exchange Act within 120 days after the end of the fiscal year covered by this Annual Report on Form 10-K.
ITEM 12. SECURITY OWNERSHIP OF CERTAIN BENEFICIAL OWNERS AND MANAGEMENT AND RELATED STOCKHOLDER MATTERS
The information required by Item 403 of Regulation S-K, is incorporated herein by reference to the information set forth under the sections entitled “Security Ownership of Certain Beneficial Owners,” “Security Ownership of Directors and Officers,” and “Executive Compensation” of the Company’s definitive proxy statement, which will be filed pursuant to Regulation 14A under the Exchange Act within 120 days after the end of the fiscal year covered by this Annual Report on Form 10-K.
EQUITY COMPENSATION PLAN INFORMATION
Compensation plans under which the Company’s equity securities are authorized for issuance at December 30, 2017 follow:
(A) | (B) | (C) | |||||||||
Plan Category | Number of securities to be issued upon exercise of outstanding options and stock awards | Weighted-average exercise price of outstanding options | Number of securities remaining available for future issuance under equity compensation plans (excluding securities reflected in column (A)) | ||||||||
Equity compensation plans approved by security holders | 8,419,930 | (1) | $ | 102.56 | (2) | 4,272,276 | (3) | ||||
Equity compensation plans not approved by security holders (4) | — | — | — | ||||||||
Total | 8,419,930 | $ | 102.56 | 4,272,276 | |||||||
(1) | Consists of 6,561,404 shares underlying outstanding stock options (whether vested or unvested) with a weighted-average exercise price of $102.56 and a weighted-average term of 6.63 years; 1,777,588 shares underlying time-vesting restricted stock units that have not yet vested and the maximum number of shares that will be issued pursuant to outstanding long-term performance awards if all established goals are met; and 80,938 of shares earned but related to which participants elected deferral of delivery. All stock-based compensation plans are discussed in Note J, Capital Stock, of the Notes to Consolidated Financial Statements in Item 8. |
(2) | There is no cost to the recipient for shares issued pursuant to time-vesting restricted stock units or long-term performance awards. Because there is no strike price applicable to these stock awards they are excluded from the weighted-average exercise price which pertains solely to outstanding stock options. |
(3) | Consists of 1,745,939 of shares available for purchase under the employee stock purchase plan ("ESPP") at the election of employees and 2,526,337 securities available for future grants by the board of directors under stock-based compensation plans. |
(4) | U.S. employees are eligible to contribute from 1% to 25% of their salary to a qualified tax deferred savings plan as described in the Employee Stock Ownership Plan ("ESOP") section of Note L, Employee Benefit Plans, of the Notes to the Consolidated Financial Statements in Item 8. The Company contributes an amount equal to one half of the employee contribution up to the first 7% of salary. There is a non-qualified tax deferred savings plan for highly compensated salaried employees which mirrors the qualified plan provisions, but was not specifically approved by security holders. Eligible highly compensated salaried U.S. employees are eligible to contribute from 1% to 50% of their salary to the non-qualified tax deferred savings plan. The same matching arrangement was provided for highly compensated salaried employees in the non-qualified plan, to the extent the match was not fully met in the qualified plan, except that the arrangement for these employees is outside of the ESOP, and is not funded in advance of distributions. For both qualified and non-qualified plans, the investment of the employee’s contribution and the Company’s contribution is controlled by the employee and may include an election to invest in Company stock. Shares of the Company’s common stock may be issued at the time of a distribution from the qualified plan. The number of securities remaining available for issuance under the plans at December 30, 2017 is not determinable, since the plans do not authorize a maximum number of securities. |
48
ITEM 13. CERTAIN RELATIONSHIPS AND RELATED TRANSACTIONS, AND DIRECTOR INDEPENDENCE
The information required by Items 404 and 407(a) of Regulation S-K is incorporated by reference to the information set forth under the section entitled “Board of Directors — Related Party Transactions” of the Company’s definitive proxy statement, which will be filed pursuant to Regulation 14A under the Exchange Act within 120 days after the end of the fiscal year covered by this Annual Report on Form 10-K.
ITEM 14. PRINCIPAL ACCOUNTANT FEES AND SERVICES
The information required by Item 9(e) of Schedule 14A is incorporated herein by reference to the information set forth under the section entitled “Fees of Independent Auditors” of the Company’s definitive proxy statement, which will be filed pursuant to Regulation 14A under the Exchange Act within 120 days after the end of the fiscal year covered by this Annual Report on Form 10-K.
PART IV
ITEM 15. EXHIBITS AND FINANCIAL STATEMENT SCHEDULES
(a) Index to documents filed as part of this report:
1. and 2. Financial Statements and Financial Statement Schedules.
The response to this portion of Item 15 is submitted as a separate section of this report beginning with an index thereto on page 50.
3. Exhibits
See Exhibit Index in this Form 10-K on page 112.
(b) See Exhibit Index in this Form 10-K on page 112.
(c) The response in this portion of Item 15 is submitted as a separate section of this Form 10-K with an index thereto beginning on page 50.
49
FORM 10-K
ITEM 15(a) (1) AND (2)
STANLEY BLACK & DECKER, INC. AND SUBSIDIARIES
INDEX TO FINANCIAL STATEMENTS AND FINANCIAL STATEMENT SCHEDULE
Schedule II — Valuation and Qualifying Accounts is included in Item 15 (page 53). |
Management’s Report on Internal Control Over Financial Reporting (page 54). |
Report of Independent Registered Public Accounting Firm — Financial Statement Opinion (page 55). |
Report of Independent Registered Public Accounting Firm — Internal Control Opinion (page 56). |
Consolidated Statements of Operations — fiscal years ended December 30, 2017, December 31, 2016, and January 2, 2016 (page 57). |
Consolidated Statements of Comprehensive Income — fiscal years ended December 30, 2017, December 31, 2016, and January 2, 2016 (page 58). |
Consolidated Balance Sheets — December 30, 2017 and December 31, 2016 (page 59). |
Consolidated Statements of Cash Flows — fiscal years ended December 30, 2017, December 31, 2016, and January 2, 2016 (page 60). |
Consolidated Statements of Changes in Shareowners’ Equity — fiscal years ended December 30, 2017, December 31, 2016, and January 2, 2016 (page 61). |
Notes to Consolidated Financial Statements (page 62). |
Selected Quarterly Financial Data (Unaudited) (page 112). |
Consent of Independent Registered Public Accounting Firm (Exhibit 23). |
All other schedules are omitted because either they are not applicable or the required information is shown in the financial statements or the notes thereto.
50
ITEM 16. FORM 10-K SUMMARY
Not applicable.
51
SIGNATURES
Pursuant to the requirements of Section 13 or 15(d) of the Securities Exchange Act of 1934, the Company has duly caused this report to be signed on its behalf by the undersigned, thereunto duly authorized.
STANLEY BLACK & DECKER, INC. | ||
By: | /s/ James M. Loree | |
James M. Loree, President and Chief Executive Officer | ||
Date: | February 27, 2018 | |
Pursuant to the requirements of the Securities Exchange Act of 1934, this report has been signed below by the following persons on behalf of the Company and in the capacities and on the dates indicated.
Signature | Title | Date | |||
/s/ James M. Loree | President and Chief Executive Officer | February 27, 2018 | |||
James M. Loree | |||||
/s/ Donald Allan, Jr. | Executive Vice President and Chief Financial Officer | February 27, 2018 | |||
Donald Allan, Jr. | |||||
/s/ Jocelyn S. Belisle | Vice President and Chief Accounting Officer | February 27, 2018 | |||
Jocelyn S. Belisle | |||||
* | Director | February 27, 2018 | |||
Andrea J. Ayers | |||||
* | Director | February 27, 2018 | |||
George W. Buckley | |||||
* | Director | February 27, 2018 | |||
Patrick D. Campbell | |||||
* | Director | February 27, 2018 | |||
Carlos M. Cardoso | |||||
* | Director | February 27, 2018 | |||
Robert B. Coutts | |||||
* | Director | February 27, 2018 | |||
Debra A. Crew | |||||
* | Director | February 27, 2018 | |||
Michael D. Hankin | |||||
* | Director | February 27, 2018 | |||
Marianne M. Parrs | |||||
* | Director | February 27, 2018 | |||
Robert L. Ryan | |||||
* | Director | February 27, 2018 | |||
James H. Scholefield | |||||
*By: /s/ Janet M. Link |
Janet M. Link (As Attorney-in-Fact) |
52
Schedule II — Valuation and Qualifying Accounts
Stanley Black & Decker, Inc. and Subsidiaries
Fiscal years ended December 30, 2017, December 31, 2016, and January 2, 2016
(Millions of Dollars)
ADDITIONS | |||||||||||||||||||
Beginning Balance | Charged To Costs And Expenses | Charged To Other Accounts (b) | (a) Deductions | Ending Balance | |||||||||||||||
Allowance for Doubtful Accounts: | |||||||||||||||||||
Year Ended 2017 | $ | 77.5 | $ | 14.4 | $ | 10.6 | $ | (23.3 | ) | $ | 79.2 | ||||||||
Year Ended 2016 | $ | 72.9 | $ | 21.9 | $ | 4.8 | $ | (22.1 | ) | $ | 77.5 | ||||||||
Year Ended 2015 | $ | 60.7 | $ | 27.3 | $ | 0.7 | $ | (15.8 | ) | $ | 72.9 | ||||||||
Tax Valuation Allowance: | |||||||||||||||||||
Year Ended 2017 (c) | $ | 525.5 | $ | 262.4 | $ | 22.8 | $ | (294.0 | ) | $ | 516.7 | ||||||||
Year Ended 2016 | $ | 480.7 | $ | 74.5 | $ | 4.4 | $ | (34.1 | ) | $ | 525.5 | ||||||||
Year Ended 2015 | $ | 551.9 | $ | 30.5 | $ | 1.7 | $ | (103.4 | ) | $ | 480.7 | ||||||||
(a) | With respect to the allowance for doubtful accounts, deductions represent amounts charged-off less recoveries of accounts previously charged-off. |
(b) | Amounts represent the impact of foreign currency translation, acquisitions and net transfers to/from other accounts. |
(c) | Refer to Note Q, Income Taxes, of the Notes to Consolidated Financial Statements in Item 8 for further discussion. |
53
MANAGEMENT’S REPORT ON INTERNAL CONTROL OVER FINANCIAL REPORTING
The management of Stanley Black & Decker, Inc. is responsible for establishing and maintaining adequate internal control over financial reporting. Internal control over financial reporting is a process designed to provide reasonable assurance regarding the reliability of financial reporting and the preparation of financial statements for external reporting purposes in accordance with accounting principles generally accepted in the United States of America. Because of its inherent limitations, internal control over financial reporting may not prevent or detect misstatements.
In March 2017, Stanley Black & Decker acquired Newell Tools for approximately $1.84 billion. Since Stanley Black & Decker has not yet fully incorporated the internal controls and procedures of Newell Tools into Stanley Black & Decker Inc.'s internal control over financial reporting, management excluded this business from its assessment of the effectiveness of internal control over financial reporting as of December 30, 2017. Newell Tools accounted for 12% of Stanley Black & Decker Inc.'s total assets as of December 30, 2017 and 5% of Stanley Black & Decker Inc.'s net sales for the year then ended.
Management has assessed the effectiveness of Stanley Black & Decker Inc.’s internal control over financial reporting as of December 30, 2017. In making its assessment, management has utilized the criteria set forth by the Committee of Sponsoring Organizations (COSO) of the Treadway Commission in Internal Control — Integrated Framework (2013 Framework). Management concluded that based on its assessment, Stanley Black & Decker, Inc.’s internal control over financial reporting was effective as of December 30, 2017. Ernst & Young LLP, Registered Public Accounting Firm included in this annual report, has issued an attestation report on the registrant’s internal control over financial reporting, a copy of which appears on page 56.
/s/ James M. Loree | |
James M. Loree, President and Chief Executive Officer | |
/s/ Donald Allan, Jr. | |
Donald Allan, Jr., Executive Vice President and Chief Financial Officer | |
54
Report of Independent Registered Public Accounting Firm
To the Shareowners and Board of Directors of Stanley Black & Decker, Inc.
Opinion on the Financial Statements
We have audited the accompanying consolidated balance sheets of Stanley Black & Decker, Inc. (the Company) as of December 30, 2017 and December 31, 2016, and the related consolidated statements of operations, comprehensive income, shareowners' equity and cash flows for each of the three fiscal years in the period ended December 30, 2017, and the related notes (collectively referred to as the “financial statements”). Our audits also included the financial statement schedule listed in the Index at Item 15(a). In our opinion, the financial statements and schedule present fairly, in all material respects, the consolidated financial position of the Company at December 30, 2017 and December 31, 2016, and the consolidated results of its operations and its cash flows for each of the three fiscal years in the period ended December 30, 2017, in conformity with U.S. generally accepted accounting principles.
We also have audited, in accordance with the standards of the Public Company Accounting Oversight Board (United States) (PCAOB), the Company’s internal control over financial reporting as of December 30, 2017, based on criteria established in Internal Control-Integrated Framework issued by the Committee of Sponsoring Organizations of the Treadway Commission (2013 framework) and our report dated February 27, 2018 expressed an unqualified opinion thereon.
Basis for Opinion
These financial statements are the responsibility of the Company’s management. Our responsibility is to express an opinion on the Company’s financial statements based on our audits. We are a public accounting firm registered with the PCAOB and are required to be independent with respect to the Company in accordance with the U.S. federal securities laws and the applicable rules and regulations of the Securities and Exchange Commission and the PCAOB.
We conducted our audits in accordance with the standards of the PCAOB. Those standards require that we plan and perform the audit to obtain reasonable assurance about whether the financial statements are free of material misstatement, whether due to error or fraud. Our audits included performing procedures to assess the risks of material misstatement of the financial statements, whether due to error or fraud, and performing procedures that respond to those risks. Such procedures included examining, on a test basis, evidence regarding the amounts and disclosures in the financial statements. Our audits also included evaluating the accounting principles used and significant estimates made by management, as well as evaluating the overall presentation of the financial statements. We believe that our audits provide a reasonable basis for our opinion.
/s/ Ernst & Young LLP
We have served as the Company’s auditor since 1932.
Hartford, Connecticut
February 27, 2018
55
Report of Independent Registered Public Accounting Firm
To the Shareowners and Board of Directors of Stanley Black & Decker, Inc.
Opinion on Internal Control over Financial Reporting
We have audited Stanley Black & Decker, Inc.’s internal control over financial reporting as of December 30, 2017, based on criteria established in Internal Control-Integrated Framework issued by the Committee of Sponsoring Organizations of the Treadway Commission (2013 framework) (the COSO criteria). In our opinion, Stanley Black & Decker, Inc. (the Company) maintained, in all material respects, effective internal control over financial reporting as of December 30, 2017, based on the COSO criteria.
As indicated in the accompanying Management’s Report on Internal Control over Financial Reporting, management’s assessment of and conclusion on the effectiveness of internal control over financial reporting did not include the internal controls of Newell Tools, which is included in the 2017 consolidated financial statements of the Company and constituted 12% of total assets as of December 30, 2017 and 5% of net sales for the fiscal year then ended. Our audit of internal control over financial reporting of the Company also did not include an evaluation of the internal control over financial reporting of Newell Tools.
We also have audited, in accordance with the standards of the Public Company Accounting Oversight Board (United States) (PCAOB), the consolidated balance sheets of the Company as of December 30, 2017 and December 31, 2016, and the related consolidated statements of operations, comprehensive income, shareowners' equity and cash flows for each of the three fiscal years in the period ended December 30, 2017, and the related notes (collectively referred to as the “financial statements”). Our audits also included the financial statement schedule listed in the Index at Item 15(a) and our report dated February 27, 2018 expressed an unqualified opinion thereon.
Basis for Opinion
The Company’s management is responsible for maintaining effective internal control over financial reporting and for its assessment of the effectiveness of internal control over financial reporting included in the accompanying Management’s Report on Internal Control over Financial Reporting. Our responsibility is to express an opinion on the Company's internal control over financial reporting based on our audit. We are a public accounting firm registered with the PCAOB and are required to be independent with respect to the Company in accordance with the U.S. federal securities laws and the applicable rules and regulations of the Securities and Exchange Commission and the PCAOB. We conducted our audit in accordance with the standards of the PCAOB. Those standards require that we plan and perform the audit to obtain reasonable assurance about whether effective internal control over financial reporting was maintained in all material respects.
Our audit included obtaining an understanding of internal control over financial reporting, assessing the risk that a material weakness exists, testing and evaluating the design and operating effectiveness of internal control based on the assessed risk, and performing such other procedures as we considered necessary in the circumstances. We believe that our audit provides a reasonable basis for our opinion.
Definition and Limitations of Internal Control Over Financial Reporting
A company's internal control over financial reporting is a process designed to provide reasonable assurance regarding the reliability of financial reporting and the preparation of financial statements for external purposes in accordance with generally accepted accounting principles. A company's internal control over financial reporting includes those policies and procedures that (1) pertain to the maintenance of records that, in reasonable detail, accurately and fairly reflect the transactions and dispositions of the assets of the company; (2) provide reasonable assurance that transactions are recorded as necessary to permit preparation of financial statements in accordance with generally accepted accounting principles, and that receipts and expenditures of the company are being made only in accordance with authorizations of management and directors of the company; and (3) provide reasonable assurance regarding prevention or timely detection of unauthorized acquisition, use, or disposition of the company's assets that could have a material effect on the financial statements.
Because of its inherent limitations, internal control over financial reporting may not prevent or detect misstatements. Also, projections of any evaluation of effectiveness to future periods are subject to the risk that controls may become inadequate because of changes in conditions, or that the degree of compliance with the policies or procedures may deteriorate.
/s/ Ernst & Young LLP
Hartford, Connecticut
February 27, 2018
56
Consolidated Statements of Operations
Fiscal years ended December 30, 2017, December 31, 2016, and January 2, 2016
(Millions of Dollars, Except Per Share Amounts)
2017 | 2016 | 2015 | |||||||||
Net Sales | $ | 12,747.2 | $ | 11,406.9 | $ | 11,171.8 | |||||
Costs and Expenses | |||||||||||
Cost of sales | $ | 7,969.2 | $ | 7,139.7 | $ | 7,099.8 | |||||
Selling, general and administrative | 2,965.7 | 2,602.0 | 2,459.1 | ||||||||
Provision for doubtful accounts | 14.4 | 21.9 | 27.3 | ||||||||
Other, net | 289.7 | 196.9 | 222.0 | ||||||||
Gain on sales of businesses | (264.1 | ) | — | — | |||||||
Pension settlement | 12.2 | — | — | ||||||||
Restructuring charges and asset impairments | 51.5 | 49.0 | 47.6 | ||||||||
Interest income | (40.1 | ) | (23.2 | ) | (15.2 | ) | |||||
Interest expense | 222.6 | 194.5 | 180.4 | ||||||||
$ | 11,221.1 | $ | 10,180.8 | $ | 10,021.0 | ||||||
Earnings from continuing operations before income taxes | 1,526.1 | 1,226.1 | 1,150.8 | ||||||||
Income taxes on continuing operations | 300.5 | 261.2 | 248.6 | ||||||||
Earnings from continuing operations | $ | 1,225.6 | $ | 964.9 | $ | 902.2 | |||||
Less: Net loss attributable to non-controlling interests | (0.4 | ) | (0.4 | ) | (1.6 | ) | |||||
Net earnings from continuing operations attributable to common shareowners | $ | 1,226.0 | $ | 965.3 | $ | 903.8 | |||||
Loss from discontinued operations before income taxes | — | — | (19.3 | ) | |||||||
Income taxes on discontinued operations | — | — | 0.8 | ||||||||
Net loss from discontinued operations | $ | — | $ | — | $ | (20.1 | ) | ||||
Net Earnings Attributable to Common Shareowners | $ | 1,226.0 | $ | 965.3 | $ | 883.7 | |||||
Basic earnings (loss) per share of common stock: | |||||||||||
Continuing operations | $ | 8.19 | $ | 6.61 | $ | 6.10 | |||||
Discontinued operations | — | — | (0.14 | ) | |||||||
Total basic earnings per share of common stock | $ | 8.19 | $ | 6.61 | $ | 5.96 | |||||
Diluted earnings (loss) per share of common stock: | |||||||||||
Continuing operations | $ | 8.04 | $ | 6.51 | $ | 5.92 | |||||
Discontinued operations | — | — | (0.13 | ) | |||||||
Total diluted earnings per share of common stock | $ | 8.04 | $ | 6.51 | $ | 5.79 | |||||
See Notes to Consolidated Financial Statements.
57
Consolidated Statements of Comprehensive Income
Fiscal years ended December 30, 2017, December 31, 2016, and January 2, 2016
(Millions of Dollars)
2017 | 2016 | 2015 | |||||||||
Net Earnings Attributable to Common Shareowners | $ | 1,226.0 | $ | 965.3 | $ | 883.7 | |||||
Other comprehensive income (loss): | |||||||||||
Currency translation adjustment and other | 481.3 | (285.4 | ) | (504.1 | ) | ||||||
Unrealized (losses) gains on cash flow hedges, net of tax | (66.3 | ) | 5.8 | (1.2 | ) | ||||||
Unrealized (losses) gains on net investment hedges, net of tax | (85.2 | ) | 76.8 | 49.0 | |||||||
Pension gains (losses), net of tax | 5.5 | (24.2 | ) | 32.3 | |||||||
Other comprehensive income (loss) | $ | 335.3 | $ | (227.0 | ) | $ | (424.0 | ) | |||
Comprehensive income attributable to common shareowners | $ | 1,561.3 | $ | 738.3 | $ | 459.7 | |||||
See Notes to Consolidated Financial Statements.
58
Consolidated Balance Sheets
December 30, 2017 and December 31, 2016
(Millions of Dollars)
2017 | 2016 | ||||||
ASSETS | |||||||
Current Assets | |||||||
Cash and cash equivalents | $ | 637.5 | $ | 1,131.8 | |||
Accounts and notes receivable, net | 1,635.9 | 1,302.8 | |||||
Inventories, net | 2,018.4 | 1,478.0 | |||||
Prepaid expenses | 234.6 | 193.2 | |||||
Assets held for sale | — | 523.4 | |||||
Other current assets | 39.7 | 159.3 | |||||
Total Current Assets | 4,566.1 | 4,788.5 | |||||
Property, Plant and Equipment, net | 1,742.5 | 1,451.2 | |||||
Goodwill | 8,776.1 | 6,694.0 | |||||
Customer Relationships, net | 1,170.7 | 635.7 | |||||
Trade Names, net | 2,248.9 | 1,560.1 | |||||
Other Intangible Assets, net | 87.8 | 103.7 | |||||
Other Assets | 487.8 | 401.7 | |||||
Total Assets | $ | 19,079.9 | $ | 15,634.9 | |||
LIABILITIES AND SHAREOWNERS' EQUITY | |||||||
Current Liabilities | |||||||
Short-term borrowings | $ | 5.3 | $ | 4.3 | |||
Current maturities of long-term debt | 983.4 | 7.8 | |||||
Accounts payable | 2,021.0 | 1,640.4 | |||||
Accrued expenses | 1,352.1 | 1,101.5 | |||||
Liabilities held for sale | — | 53.5 | |||||
Total Current Liabilities | 4,361.8 | 2,807.5 | |||||
Long-Term Debt | 2,843.0 | 3,815.3 | |||||
Deferred Taxes | 434.2 | 735.4 | |||||
Post-Retirement Benefits | 629.9 | 644.3 | |||||
Other Liabilities | 2,511.1 | 1,258.8 | |||||
Commitments and Contingencies (Notes R and S) | |||||||
Shareowners’ Equity | |||||||
Stanley Black & Decker, Inc. Shareowners’ Equity | |||||||
Preferred stock, without par value: Authorized 10,000,000 shares in 2017 and 2016 Issued and outstanding 750,000 shares in 2017 | 750.0 | — | |||||
Common stock, par value $2.50 per share: Authorized 300,000,000 shares in 2017 and 2016 Issued 176,902,738 shares in 2017 and 2016 | 442.3 | 442.3 | |||||
Retained earnings | 5,990.4 | 5,127.3 | |||||
Additional paid in capital | 4,643.2 | 4,774.4 | |||||
Accumulated other comprehensive loss | (1,585.9 | ) | (1,921.2 | ) | |||
ESOP | (18.8 | ) | (25.9 | ) | |||
10,221.2 | 8,396.9 | ||||||
Less: cost of common stock in treasury (22,864,707 shares in 2017 and 24,342,971 shares in 2016) | (1,924.1 | ) | (2,029.9 | ) | |||
Stanley Black & Decker, Inc. Shareowners’ Equity | 8,297.1 | 6,367.0 | |||||
Non-controlling interests | 2.8 | 6.6 | |||||
Total Shareowners’ Equity | 8,299.9 | 6,373.6 | |||||
Total Liabilities and Shareowners’ Equity | $ | 19,079.9 | $ | 15,634.9 | |||
See Notes to Consolidated Financial Statements.
59
Consolidated Statements of Cash Flows
Fiscal years ended December 30, 2017, December 31, 2016, and January 2, 2016
(Millions of Dollars)
2017 | 2016 | 2015 | |||||||||
Operating Activities: | |||||||||||
Net Earnings Attributable to Common Shareowners | $ | 1,226.0 | $ | 965.3 | $ | 883.7 | |||||
Adjustments to reconcile net earnings to net cash provided by operating activities: | |||||||||||
Depreciation and amortization of property, plant and equipment | 296.9 | 263.6 | 256.9 | ||||||||
Amortization of intangibles | 163.8 | 144.4 | 157.1 | ||||||||
Inventory step-up amortization | 43.2 | — | — | ||||||||
Gain on sales of businesses | (264.1 | ) | — | — | |||||||
Stock-based compensation expense | 78.7 | 81.2 | 67.9 | ||||||||
Provision for doubtful accounts | 14.4 | 21.9 | 29.5 | ||||||||
Deferred tax benefit | (103.0 | ) | (25.7 | ) | (1.3 | ) | |||||
Other non-cash items | 24.4 | 40.0 | 28.6 | ||||||||
Changes in operating assets and liabilities: | |||||||||||
Accounts receivable | (200.6 | ) | (69.4 | ) | (41.3 | ) | |||||
Inventories | (303.0 | ) | (23.9 | ) | (54.7 | ) | |||||
Accounts payable | 240.4 | 159.7 | (9.7 | ) | |||||||
Deferred revenue | 2.1 | (9.2 | ) | 7.7 | |||||||
Other current assets | 42.8 | 26.0 | 19.8 | ||||||||
Long-term receivables | 10.8 | 1.2 | (12.6 | ) | |||||||
Other long-term assets | 72.4 | (47.5 | ) | (11.5 | ) | ||||||
Accrued expenses | 120.1 | (28.1 | ) | (59.0 | ) | ||||||
Defined benefit liabilities | (66.5 | ) | (56.8 | ) | (65.8 | ) | |||||
Other long-term liabilities | 19.8 | 42.5 | (13.0 | ) | |||||||
Net cash provided by operating activities | 1,418.6 | 1,485.2 | 1,182.3 | ||||||||
Investing Activities: | |||||||||||
Capital and software expenditures | (442.4 | ) | (347.0 | ) | (311.4 | ) | |||||
Proceeds from sales of assets | 50.2 | 10.6 | 29.1 | ||||||||
Business acquisitions, net of cash acquired | (2,601.1 | ) | (59.3 | ) | (17.6 | ) | |||||
Proceeds from sales of businesses, net of cash sold | 756.9 | 24.0 | — | ||||||||
(Payments) proceeds from net investment hedge settlements | (23.3 | ) | 104.7 | 137.7 | |||||||
Other | (29.4 | ) | (17.0 | ) | (42.8 | ) | |||||
Net cash used in investing activities | (2,289.1 | ) | (284.0 | ) | (205.0 | ) | |||||
Financing Activities: | |||||||||||
Net short-term (repayments) borrowings | (76.7 | ) | 1.9 | 1.2 | |||||||
Stock purchase contract fees | (20.0 | ) | (13.8 | ) | (17.0 | ) | |||||
Purchases of common stock for treasury | (28.7 | ) | (374.1 | ) | (649.8 | ) | |||||
Proceeds from issuances of preferred stock | 726.0 | — | 632.5 | ||||||||
Redemption of preferred stock for treasury | — | — | (632.5 | ) | |||||||
Cash settlement on forward stock purchase contracts | — | (147.4 | ) | — | |||||||
Premium paid on equity option | (25.1 | ) | — | — | |||||||
Non-controlling interest buyouts | (3.2 | ) | (12.5 | ) | (33.5 | ) | |||||
Termination of interest rate swaps | — | 27.0 | — | ||||||||
Proceeds from issuances of common stock | 90.8 | 418.5 | 163.5 | ||||||||
Cash dividends on common stock | (362.9 | ) | (330.9 | ) | (319.9 | ) | |||||
Other | (5.0 | ) | (1.8 | ) | (20.1 | ) | |||||
Net cash provided by (used in) financing activities | 295.2 | (433.1 | ) | (875.6 | ) | ||||||
Effect of exchange rate changes on cash and cash equivalents | 81.0 | (101.7 | ) | (132.9 | ) | ||||||
Change in cash and cash equivalents | (494.3 | ) | 666.4 | (31.2 | ) | ||||||
Cash and cash equivalents, beginning of year | 1,131.8 | 465.4 | 496.6 | ||||||||
Cash and cash equivalents, end of year | $ | 637.5 | $ | 1,131.8 | $ | 465.4 | |||||
See Notes to Consolidated Financial Statements.
60
Consolidated Statements of Changes in Shareowners’ Equity
Fiscal years ended December 30, 2017, December 31, 2016, and January 2, 2016
(Millions of Dollars, Except Per Share Amounts)
Preferred Stock | Common Stock | Additional Paid In Capital | Retained Earnings | Accumulated Other Comprehensive Loss | ESOP | Treasury Stock | Non- Controlling Interests | Shareowners’ Equity | |||||||||||||||||||||||||||
Balance January 3, 2015 | $ | — | $ | 442.3 | $ | 4,727.1 | $ | 3,926.3 | $ | (1,270.2 | ) | $ | (43.6 | ) | $ | (1,352.8 | ) | $ | 82.8 | $ | 6,511.9 | ||||||||||||||
Net earnings | 883.7 | (1.6 | ) | 882.1 | |||||||||||||||||||||||||||||||
Other comprehensive loss | (424.0 | ) | (424.0 | ) | |||||||||||||||||||||||||||||||
Cash dividends declared — $2.14 per share | (319.9 | ) | (319.9 | ) | |||||||||||||||||||||||||||||||
Issuance of common stock | (96.1 | ) | 231.4 | 135.3 | |||||||||||||||||||||||||||||||
Forward obligation to purchase treasury shares | (350.0 | ) | (350.0 | ) | |||||||||||||||||||||||||||||||
Repurchase of common stock (9,227,564 shares) | 263.9 | (913.7 | ) | (649.8 | ) | ||||||||||||||||||||||||||||||
Issuance of preferred stock | 632.5 | 632.5 | |||||||||||||||||||||||||||||||||
Redemption and conversion of preferred stock | (632.5 | ) | (220.1 | ) | 220.1 | (632.5 | ) | ||||||||||||||||||||||||||||
Non-controlling interest buyout | 0.8 | (33.6 | ) | (32.8 | ) | ||||||||||||||||||||||||||||||
Stock-based compensation related | 67.9 | 67.9 | |||||||||||||||||||||||||||||||||
Tax benefit related to stock options exercised | 28.2 | 28.2 | |||||||||||||||||||||||||||||||||
ESOP and related tax benefit | 1.6 | 8.7 | 10.3 | ||||||||||||||||||||||||||||||||
Balance January 2, 2016 | $ | — | $ | 442.3 | $ | 4,421.7 | $ | 4,491.7 | $ | (1,694.2 | ) | $ | (34.9 | ) | $ | (1,815.0 | ) | $ | 47.6 | $ | 5,859.2 | ||||||||||||||
Net earnings | 965.3 | (0.4 | ) | 964.9 | |||||||||||||||||||||||||||||||
Other comprehensive loss | (227.0 | ) | (227.0 | ) | |||||||||||||||||||||||||||||||
Cash dividends declared — $2.26 per share | (330.9 | ) | (330.9 | ) | |||||||||||||||||||||||||||||||
Issuance of common stock | 20.9 | 386.1 | 407.0 | ||||||||||||||||||||||||||||||||
Settlement of forward share repurchase contract | 150.0 | (150.0 | ) | — | |||||||||||||||||||||||||||||||
Repurchase of common stock (4,651,463 shares) | 76.9 | (451.0 | ) | (374.1 | ) | ||||||||||||||||||||||||||||||
Non-controlling interest buyout | 12.2 | (40.6 | ) | (28.4 | ) | ||||||||||||||||||||||||||||||
Stock-based compensation related | 81.2 | 81.2 | |||||||||||||||||||||||||||||||||
Tax benefit related to stock options exercised | 11.5 | 11.5 | |||||||||||||||||||||||||||||||||
ESOP and related tax benefit | 1.2 | 9.0 | 10.2 | ||||||||||||||||||||||||||||||||
Balance December 31, 2016 | $ | — | $ | 442.3 | $ | 4,774.4 | $ | 5,127.3 | $ | (1,921.2 | ) | $ | (25.9 | ) | $ | (2,029.9 | ) | $ | 6.6 | $ | 6,373.6 | ||||||||||||||
Net earnings | 1,226.0 | (0.4 | ) | 1,225.6 | |||||||||||||||||||||||||||||||
Other comprehensive income | 335.3 | 335.3 | |||||||||||||||||||||||||||||||||
Cash dividends declared — $2.42 per share | (362.9 | ) | (362.9 | ) | |||||||||||||||||||||||||||||||
Issuance of common stock | (43.7 | ) | 134.5 | 90.8 | |||||||||||||||||||||||||||||||
Repurchase of common stock (202,075 shares) | (28.7 | ) | (28.7 | ) | |||||||||||||||||||||||||||||||
Issuance of preferred stock (750,000 shares) | 750.0 | (24.0 | ) | 726.0 | |||||||||||||||||||||||||||||||
Equity units - stock contract fees | (117.1 | ) | (117.1 | ) | |||||||||||||||||||||||||||||||
Premium paid on equity option | (25.1 | ) | (25.1 | ) | |||||||||||||||||||||||||||||||
Non-controlling interest buyout | (3.4 | ) | (3.4 | ) | |||||||||||||||||||||||||||||||
Stock-based compensation related | 78.7 | 78.7 | |||||||||||||||||||||||||||||||||
ESOP | 7.1 | 7.1 | |||||||||||||||||||||||||||||||||
Balance December 30, 2017 | $ | 750.0 | $ | 442.3 | $ | 4,643.2 | $ | 5,990.4 | $ | (1,585.9 | ) | $ | (18.8 | ) | $ | (1,924.1 | ) | $ | 2.8 | $ | 8,299.9 | ||||||||||||||
See Notes to Consolidated Financial Statements.
61
Notes to Consolidated Financial Statements
A. SIGNIFICANT ACCOUNTING POLICIES
BASIS OF PRESENTATION — The Consolidated Financial Statements include the accounts of Stanley Black & Decker, Inc. and its majority-owned subsidiaries (collectively the “Company”) which require consolidation, after the elimination of intercompany accounts and transactions. The Company’s fiscal year ends on the Saturday nearest to December 31. There were 52 weeks in each of the fiscal years 2017, 2016 and 2015.
In the first quarter of 2017, the Company sold the majority of its mechanical security businesses within the Security segment, which included the commercial hardware brands of Best Access, phi Precision and GMT, and sold a small business within the Tools & Storage segment. The Company also sold a small business in the Industrial segment in the third quarter of 2017 and a small business in the Tools & Storage segment in the fourth quarter of 2017. The operating results of these businesses have been reported within continuing operations in the Consolidated Financial Statements through their respective dates of sale in 2017 and for the year ended December 31, 2016. In addition, the assets and liabilities related to the businesses sold in the first quarter of 2017 were classified as held for sale on the Company's Consolidated Balance Sheets as of December 31, 2016. Refer to Note T, Divestitures, for further discussion.
In March 2017, the Company acquired the Tools business of Newell Brands ("Newell Tools") and the Craftsman brand, which are both being accounted for as business combinations. The results of these acquisitions are being consolidated into the Company's Tools & Storage segment. Refer to Note E, Acquisitions, for further discussion.
During the fourth quarter of 2014, the Company classified the Security segment’s Spain and Italy operations as held for sale based on management's intention to sell these businesses. In July 2015, the Company completed the sale of these businesses. The operating results of these businesses have been reported as discontinued operations through the date of sale in the Consolidated Financial Statements. Refer to Note T, Divestitures, for further discussion.
The preparation of financial statements in conformity with accounting principles generally accepted in the United States of America requires management to make estimates and assumptions that affect the amounts reported in the financial statements. While management believes that the estimates and assumptions used in the preparation of the financial statements are appropriate, actual results could differ from these estimates. Certain amounts reported in previous years have been reclassified to conform to the 2017 presentation.
FOREIGN CURRENCY — For foreign operations with functional currencies other than the U.S. dollar, asset and liability accounts are translated at current exchange rates, while income and expenses are translated using average exchange rates. Translation adjustments are reported in a separate component of shareowners’ equity and exchange gains and losses on transactions are included in earnings.
CASH EQUIVALENTS — Highly liquid investments with original maturities of three months or less are considered cash equivalents.
ACCOUNTS AND FINANCING RECEIVABLE — Trade receivables are stated at gross invoice amounts less discounts, other allowances and provisions for uncollectible accounts. Financing receivables are initially recorded at fair value, less impairments or provisions for credit losses. Interest income earned from financing receivables that are not delinquent is recorded on the effective interest method. The Company considers any financing receivable that has not been collected within 90 days of original billing date as past-due or delinquent. Additionally, the Company considers the credit quality of all past-due or delinquent financing receivables as nonperforming.
ALLOWANCE FOR DOUBTFUL ACCOUNTS — The Company estimates its allowance for doubtful accounts using two methods. First, a specific reserve is established for individual accounts where information indicates the customers may have an inability to meet financial obligations. Second, a reserve is determined for all customers based on a range of percentages applied to aging categories. These percentages are based on historical collection and write-off experience. Actual write-offs are charged against the allowance when collection efforts have been unsuccessful.
INVENTORIES — U.S. inventories are primarily valued at the lower of Last-In First-Out (“LIFO”) cost or market because the Company believes it results in better matching of costs and revenues. Other inventories are primarily valued at the lower of First-In, First-Out (“FIFO”) cost and net realizable value because LIFO is not permitted for statutory reporting outside the U.S. See Note C, Inventories, for a quantification of the LIFO impact on inventory valuation.
62
PROPERTY, PLANT AND EQUIPMENT — The Company generally values property, plant and equipment (“PP&E”), including capitalized software, at historical cost less accumulated depreciation and amortization. Costs related to maintenance and repairs which do not prolong the asset's useful life are expensed as incurred. Depreciation and amortization are provided using straight-line methods over the estimated useful lives of the assets as follows:
Useful Life (Years) | ||
Land improvements | 10 —20 | |
Buildings | 40 | |
Machinery and equipment | 3 — 15 | |
Computer software | 3 — 7 | |
Leasehold improvements are depreciated over the shorter of the estimated useful life or the term of the lease.
The Company reports depreciation and amortization of property, plant and equipment in cost of sales and selling, general and administrative expenses based on the nature of the underlying assets. Depreciation and amortization related to the production of inventory and delivery of services are recorded in cost of sales. Depreciation and amortization related to distribution center activities, selling and support functions are reported in selling, general and administrative expenses.
The Company assesses its long-lived assets for impairment when indicators that the carrying amounts may not be recoverable are present. In assessing long-lived assets for impairment, the Company groups its long-lived assets with other assets and liabilities at the lowest level for which identifiable cash flows are generated (“asset group”) and estimates the undiscounted future cash flows that are directly associated with, and expected to be generated from, the use of and eventual disposition of the asset group. If the carrying value is greater than the undiscounted cash flows, an impairment loss must be determined and the asset group is written down to fair value. The impairment loss is quantified by comparing the carrying amount of the asset group to the estimated fair value, which is determined using weighted-average discounted cash flows that consider various possible outcomes for the disposition of the asset group.
GOODWILL AND INTANGIBLE ASSETS — Goodwill represents costs in excess of fair values assigned to the underlying net assets of acquired businesses. Intangible assets acquired are recorded at estimated fair value. Goodwill and intangible assets deemed to have indefinite lives are not amortized, but are tested for impairment annually during the third quarter, and at any time when events suggest an impairment more likely than not has occurred.
To assess goodwill for impairment, the Company, depending on relevant facts and circumstances, performs either a qualitative assessment, as permitted by Accounting Standards Update ("ASU") 2011-08, Intangibles - Goodwill and Other (Topic 350): Testing Goodwill for Impairment, or a quantitative analysis utilizing a discounted cash flow valuation model. In performing a qualitative assessment, the Company first assesses relevant factors to determine whether it is more likely than not that the fair value of a reporting unit is less than its carrying amount as a basis for determining whether it is necessary to perform the two-step quantitative goodwill impairment test. The Company identifies and considers the significance of relevant key factors, events, and circumstances that could affect the fair value of each reporting unit. These factors include external factors such as macroeconomic, industry, and market conditions, as well as entity-specific factors, such as actual and planned financial performance. The Company also considers changes in each reporting unit's fair value and carrying amount since the most recent date a fair value measurement was performed. In performing a quantitative analysis, the Company determines the fair value of a reporting unit using management’s assumptions about future cash flows based on long-range strategic plans. This approach incorporates many assumptions including discount rates, future growth rates and expected profitability. In the event the carrying amount of a reporting unit exceeded its fair value, an impairment loss would be recognized to the extent the carrying amount of the reporting unit’s goodwill exceeded the implied fair value of the goodwill.
Indefinite-lived intangible assets are tested for impairment utilizing either a qualitative assessment or a quantitative analysis. For the qualitative assessments, the Company identifies and considers relevant key factors, events, and circumstances to determine whether it is necessary to perform a quantitative impairment test. The key factors considered include macroeconomic, industry, and market conditions, as well as the asset's actual and forecasted results. For the quantitative impairment tests, the Company compares the carrying amounts to the current fair market values, usually determined by the estimated cost to lease the assets from third parties. Intangible assets with definite lives are amortized over their estimated useful lives generally using an accelerated method. Under this accelerated method, intangible assets are amortized reflecting the pattern over which the economic benefits of the intangible assets are consumed. Definite-lived intangible assets are also evaluated for impairment when impairment indicators are present. If the carrying amount exceeds the total undiscounted future cash flows, a discounted cash flow analysis is performed to determine the fair value of the asset. If the carrying amount of the asset was to exceed the fair value, it would be written down to fair value. No significant goodwill or other intangible asset impairments were recorded during 2017, 2016 or 2015.
63
FINANCIAL INSTRUMENTS — Derivative financial instruments are employed to manage risks, including foreign currency, interest rate exposures and commodity prices and are not used for trading or speculative purposes. The Company recognizes all derivative instruments, such as interest rate swap agreements, foreign currency options, commodity contracts and foreign exchange contracts, in the Consolidated Balance Sheets at fair value. Changes in the fair value of derivatives are recognized periodically either in earnings or in shareowners’ equity as a component of other comprehensive income (loss), depending on whether the derivative financial instrument is undesignated or qualifies for hedge accounting, and if so, whether it represents a fair value, cash flow, or net investment hedge. Changes in the fair value of derivatives accounted for as fair value hedges are recorded in earnings in the same caption as the changes in the fair value of the hedged items. Gains and losses on derivatives designated as cash flow hedges, to the extent they are effective, are recorded in other comprehensive income (loss), and subsequently reclassified to earnings to offset the impact of the hedged items when they occur.
In the event it becomes probable the forecasted transaction to which a cash flow hedge relates will not occur, the derivative would be terminated and the amount in other comprehensive income (loss) would generally be recognized in earnings. Changes in the fair value of derivatives used as hedges of the net investment in foreign operations, to the extent they are effective, are reported in other comprehensive income (loss) and are deferred until the subsidiary is sold. Changes in the fair value of derivatives designated as hedges under Accounting Standards Codification ("ASC") 815, Derivatives and Hedging, including any portion that is considered ineffective, are reported in earnings in the same caption where the hedged items are recognized. Changes in the fair value of derivatives not designated as hedges under ASC 815 are reported in earnings in Other, net. Refer to Note I, Financial Instruments, for further discussion.
The net interest paid or received on interest rate swaps is recognized as interest expense. Gains and losses resulting from the early termination of interest rate swap agreements are deferred and amortized as adjustments to interest expense over the remaining period of the debt originally covered by the terminated swap.
REVENUE RECOGNITION — General: The majority of the Company’s revenues result from the sale of tangible products, where revenue is recognized when the earnings process is complete, collectability is reasonably assured, and the risks and rewards of ownership have transferred to the customer, which generally occurs upon shipment of the finished product, but sometimes is upon delivery to customer facilities.
Provisions for customer volume rebates, product returns, discounts and allowances are recorded as a reduction of revenue in the same period the related sales are recorded. Consideration given to customers for cooperative advertising is recognized as a reduction of revenue except to the extent that there is an identifiable benefit and evidence of the fair value of the advertising, in which case the expense is classified as selling, general, and administrative expense.
Multiple-Element Arrangements: Approximately seven percent of the Company’s revenues are generated from multiple-element arrangements, primarily in the Security segment. When a sales agreement involves multiple elements, deliverables are separately identified and consideration is allocated based on their relative selling price in accordance with ASC 605-25, Revenue Recognition — Multiple-Element Arrangements.
Sales of security monitoring systems may have multiple elements, including equipment, installation and monitoring services. For these arrangements, the Company assesses its revenue arrangements to determine the appropriate units of accounting, with each deliverable provided under the arrangement considered a separate unit of accounting. Amounts assigned to each unit of accounting are based on an allocation of total arrangement consideration using a hierarchy of estimated selling price for the deliverables. The selling price used for each deliverable will be based on Vendor Specific Objective Evidence (“VSOE”) if available, Third Party Evidence (“TPE”) if VSOE is not available, or estimated selling price if neither VSOE nor TPE is available. Revenue recognized for equipment and installation is limited to the lesser of their allocated amounts under the estimated selling price hierarchy or the non-contingent up-front consideration received at the time of installation, since collection of future amounts under the arrangement with the customer is contingent upon the delivery of monitoring services.
The Company’s contract sales for the installation of security intruder systems and other construction-related projects are recorded under the percentage-of-completion method. Profits recognized on security contracts in process are based upon estimated contract revenue and related total cost of the project at completion. The extent of progress toward completion is generally measured using input methods based on labor metrics. Revisions to these estimates as contracts progress have the effect of increasing or decreasing profits each period. Provisions for anticipated losses are made in the period in which they become determinable. For certain short duration and less complex installation contracts, revenue is recognized upon contract completion and customer acceptance. The revenues for monitoring and monitoring-related services are recognized as services are rendered over the contractual period.
Customer billings for services not yet rendered are deferred and recognized as revenue as the services are rendered. The associated deferred revenue is included in Accrued expenses or Other liabilities on the Consolidated Balance Sheets, as appropriate.
64
COST OF SALES AND SELLING, GENERAL & ADMINISTRATIVE — Cost of sales includes the cost of products and services provided reflecting costs of manufacturing and preparing the product for sale. These costs include expenses to acquire and manufacture products to the point that they are allocable to be sold to customers and costs to perform services pertaining to service revenues (e.g. installation of security systems, automatic doors, and security monitoring costs). Cost of sales is primarily comprised of inbound freight, direct materials, direct labor as well as overhead which includes indirect labor and facility and equipment costs. Cost of sales also includes quality control, procurement and material receiving costs as well as internal transfer costs. SG&A costs include the cost of selling products as well as administrative function costs. These expenses generally represent the cost of selling and distributing the products once they are available for sale and primarily include salaries and commissions of the Company’s sales force, distribution costs, notably salaries and facility costs, as well as administrative expenses for certain support functions and related overhead.
ADVERTISING COSTS — Television advertising is expensed the first time the advertisement airs, whereas other advertising is expensed as incurred. Advertising costs are classified in SG&A and amounted to $123.3 million in 2017, $124.1 million in 2016, and $101.7 million in 2015. Expense pertaining to cooperative advertising with customers reported as a reduction of Net Sales was $297.4 million in 2017, $232.5 million in 2016, and $211.9 million in 2015. Cooperative advertising with customers classified as SG&A expense amounted to $6.1 million in 2017, $6.6 million in 2016, and $6.4 million in 2015.
SALES TAXES — Sales and value added taxes collected from customers and remitted to governmental authorities are excluded from Net Sales reported in the Consolidated Statements of Operations.
SHIPPING AND HANDLING COSTS — The Company generally does not bill customers for freight. Shipping and handling costs associated with inbound freight are reported in Cost of sales. Shipping costs associated with outbound freight are reported as a reduction of Net Sales and amounted to $218.1 million, $184.0 million, and $183.0 million in 2017, 2016, and 2015, respectively. Distribution costs are classified as SG&A and amounted to $280.1 million, $235.6 million and $229.3 million in 2017, 2016 and 2015, respectively.
STOCK-BASED COMPENSATION — Compensation cost relating to stock-based compensation grants is recognized on a straight-line basis over the vesting period, which is generally four years. The expense for stock options and restricted stock units awarded to retirement eligible employees (those aged 55 and over, and with 10 or more years of service) is recognized on the grant date, or (if later) by the date they become retirement-eligible.
POSTRETIREMENT DEFINED BENEFIT PLAN — The Company uses the corridor approach to determine expense recognition for each defined benefit pension and other postretirement plan. The corridor approach defers actuarial gains and losses resulting from variances between actual and expected results (based on economic estimates or actuarial assumptions) and amortizes them over future periods. For pension plans, these unrecognized gains and losses are amortized when the net gains and losses exceed 10% of the greater of the market-related value of plan assets or the projected benefit obligation at the beginning of the year. For other postretirement benefits, amortization occurs when the net gains and losses exceed 10% of the accumulated postretirement benefit obligation at the beginning of the year. For ongoing, active plans, the amount in excess of the corridor is amortized on a straight-line basis over the average remaining service period for active plan participants. For plans with primarily inactive participants, the amount in excess of the corridor is amortized on a straight-line basis over the average remaining life expectancy of inactive plan participants.
INCOME TAXES — The Company accounts for income taxes under the asset and liability method in accordance with ASC 740, Income Taxes, which requires the recognition of deferred tax assets and liabilities for the expected future tax consequences of events that have been included in the financial statements. Deferred tax assets and liabilities are determined based on the differences between the financial statements and tax basis of assets and liabilities using the enacted tax rates in effect for the year in which the differences are expected to reverse. Any changes in tax rates on deferred tax assets and liabilities are recognized in income in the period that includes the enactment date.
The Company records net deferred tax assets to the extent that it is more likely than not that these assets will be realized. In making this determination, management considers all available positive and negative evidence, including future reversals of existing temporary differences, estimates of future taxable income, tax-planning strategies, and the realizability of net operating loss carryforwards. In the event that it is determined that an asset is not more likely that not to be realized, a valuation allowance is recorded against the asset. Valuation allowances related to deferred tax assets can be impacted by changes to tax laws, changes to statutory tax rates and future taxable income levels. In the event the Company were to determine that it would not be able to realize all or a portion of its deferred tax assets in the future, the unrealizable amount would be charged to earnings in the period in which that determination is made. Conversely, if the Company were to determine that it would be able to realize deferred tax assets in the future in excess of the net carrying amounts, it would decrease the recorded valuation allowance through a favorable adjustment to earnings in the period that the determination was made. The Company records uncertain tax positions in accordance with ASC 740, which requires a two-step process. First, management determines whether
65
it is more likely than not that a tax position will be sustained based on the technical merits of the position and second, for those tax positions that meet the more likely than not threshold, management recognizes the largest amount of the tax benefit that is greater than 50 percent likely to be realized upon ultimate settlement with the related taxing authority. The Company maintains an accounting policy of recording interest and penalties on uncertain tax positions as a component of Income taxes on continuing operations in the Consolidated Statements of Operations.
The Company is subject to income tax in a number of locations, including many state and foreign jurisdictions. Significant judgment is required when calculating the worldwide provision for income taxes. Many factors are considered when evaluating and estimating the Company's tax positions and tax benefits, which may require periodic adjustments and which may not accurately anticipate actual outcomes. It is reasonably possible that the amount of the unrecognized benefit with respect to certain of the Company's unrecognized tax positions will significantly increase or decrease within the next twelve months. These changes may be the result of settlements of ongoing audits or final decisions in transfer pricing matters. The Company periodically assesses its liabilities and contingencies for all tax years still subject to audit based on the most current available information, which involves inherent uncertainty.
On December 22, 2017, the U.S. government enacted comprehensive tax legislation commonly referred to as the Tax Cuts and Jobs Act (the “Act”). The Act makes broad and complex changes to the U.S. tax code, including, but not limited to: (1) reducing the U.S. federal corporate tax rate from 35 percent to 21 percent; (2) requiring companies to pay a one-time transition tax on certain unrepatriated earnings of foreign subsidiaries; (3) generally eliminating U.S. federal income taxes on dividends from foreign subsidiaries; (4) requiring a tax on global intangible low-taxed income (“GILTI”) which is a current inclusion in U.S. federal taxable income of certain earnings of controlled foreign corporations; (5) eliminating the corporate alternative minimum tax ("AMT") and changing how existing AMT credits can be realized; (6) creating the base erosion anti-abuse tax ("BEAT"), a new minimum tax; (7) creating a new limitation on deductible interest expense; and (8) changing rules related to uses and limitations of net operating loss carryforwards created in tax years beginning after December 31, 2017.
As of December 30, 2017, the Company has not completed its accounting for the tax effects of the enactment of the Act; however, in certain cases, as described in Note Q, Income Taxes, the Company has made a reasonable estimate of the effects on its existing deferred tax balances and the one-time transition tax. In other cases, the Company has not been able to make a reasonable estimate and continues to account for those items based on its existing accounting under ASC 740, and the provisions of the tax laws that were in effect immediately prior to enactment. During the fourth quarter of 2017, the Company recognized a provisional net charge of $23.6 million for items it was able to reasonably estimate, which has been included as a component of income taxes on continuing operations. The Company operates in many countries throughout the world through numerous subsidiaries. In order to complete the accounting associated with the Act, the Company will continue to accumulate the relevant data, refine computational elements, monitor and analyze U.S. federal and state guidance if and when issued, and adjust its provisional estimates accordingly within the measurement period prescribed by Staff Accounting Bulletin No. 118 ("SAB 118").
EARNINGS PER SHARE — Basic earnings per share equals net earnings attributable to common shareowners divided by weighted-average shares outstanding during the year. Diluted earnings per share include the impact of common stock equivalents using the treasury stock method when the effect is dilutive.
NEW ACCOUNTING STANDARDS — In February 2018, the Financial Accounting Standards Board ("FASB") issued ASU 2018-02, Income Statement - Reporting Comprehensive Income (Topic 220): Reclassification of Certain Tax Effects from Accumulated Other Comprehensive Income. The new guidance permits companies to reclassify the stranded tax effects of the Act on items within accumulated other comprehensive income to retained earnings. This ASU is effective for fiscal years beginning after December 15, 2018, including interim periods within those fiscal years. Early adoption is permitted. The Company is currently evaluating this guidance to determine the impact it may have on its consolidated financial statements.
In December 2017, the U.S. Securities and Exchange Commission ("SEC") staff issued SAB 118, which provides guidance on accounting for the tax effects of the Act. SAB 118 provides a measurement period that should not extend beyond one year from the Act enactment date for companies to complete the accounting under ASC 740 (the "measurement period"). In accordance with SAB 118, a company must reflect the income tax effects of those aspects of the Act for which the accounting under ASC 740 is complete. To the extent that a company’s accounting for certain income tax effects of the Act is incomplete but it can determine a reasonable estimate, it must record a provisional estimate in the financial statements. If a company cannot determine a provisional estimate to be included in the financial statements, it should continue to apply ASC 740 based on the provisions of the tax laws that were in effect immediately before the enactment of the Act. The measurement period for accounting for the Act begins in the period of enactment and ends when an entity has obtained, prepared and analyzed the information necessary to complete the accounting requirements under ASC 740, but in no event can the measurement period extend beyond one year. Any provisional amount or adjustment to a provisional amount included in a company’s financial
66
statements during the measurement period should be included in income from continuing operations as an adjustment to tax expense or benefit in the reporting period the amounts are determined.
In August 2017, the FASB issued ASU 2017-12, Derivatives and Hedging (Topic 815). The new standard amends the hedge accounting recognition and presentation requirements in ASC 815. This ASU is effective for fiscal years beginning after December 15, 2018, including interim periods within those fiscal years. Early adoption is permitted. The Company will adopt this guidance in the first quarter of 2018 and does not expect it to have a material impact on its consolidated financial statements.
In March 2017, the FASB issued ASU 2017-07, Compensation-Retirement Benefits (Topic 715). The new standard improves the presentation of Net Periodic Pension Cost and Net Periodic Postretirement Benefit Cost. This ASU is effective for fiscal years beginning after December 15, 2017, including interim periods within those fiscal years. The impacts to the financial statements are related to classification of Pension and Postretirement Cost on the income statement. The Company will apply the full retrospective method of adoption starting with the first interim period after December 15, 2017. Subsequent to adoption, income of approximately $20.5 million and $11.1 million for the years ended December 30, 2017 and December 31, 2016, respectively, will be reclassified from cost of sales or selling, general and administrative (as applicable) to other, net, with no impact to net earnings in either year.
In February 2017, the FASB issued ASU 2017-05, Other Income-Gains and Losses from the Derecognition of Nonfinancial Assets (Subtopic 610). The new standard provides guidance for recognizing gains and losses of nonfinancial assets in contracts with non-customers. This ASU is effective for fiscal years beginning after December 15, 2017, including interim periods within those fiscal years. The Company will adopt this guidance in the first quarter of 2018 and does not expect it to have a material impact on its consolidated financial statements.
In January 2017, the FASB issued ASU 2017-04, Intangibles-Goodwill and Other (Topic 350): Simplifying the Test for Goodwill Impairment. The new standard simplifies the subsequent measurement of goodwill by eliminating the second step of the goodwill impairment test. This ASU will be applied prospectively and is effective for annual or interim goodwill impairment tests in fiscal years beginning after December 15, 2019. Early adoption is permitted for interim or annual goodwill impairment tests performed on testing dates after January 1, 2017. The Company is currently evaluating the timing of adopting this standard.
In January 2017, the FASB issued ASU 2017-01, Business Combinations (Topic 805): Clarifying the Definition of a Business. The new standard narrows the definition of a business and provides a framework for evaluation. This ASU is effective prospectively for fiscal years beginning after December 15, 2017, including interim periods within those fiscal years.
In October 2016, the FASB issued ASU 2016-16, Income Taxes (Topic 740): Intra-Entity Transfers of Assets Other Than Inventory. The new standard eliminates the exception to the principle in ASC 740, for all intra-entity sales of assets other than inventory, to be deferred, until the transferred asset is sold to a third party or otherwise recovered through use. This ASU is effective for financial statements issued for fiscal years beginning after December 15, 2017, including interim periods within those fiscal years. The Company will adopt this guidance in the first quarter of 2018 and does not expect it to have a material impact on its consolidated financial statements.
In August 2016, the FASB issued ASU 2016-15, Statement of Cash Flows (Topic 230). The objective of this update is to provide additional guidance and reduce diversity in practice when classifying certain transactions within the statement of cash flows. In November 2016, the FASB issued ASU 2016-18, Statement of Cash Flows (Topic 230): Restricted Cash. The new standard requires that the statement of cash flows explain the change during the period in the total of cash, cash equivalents, and amounts generally described as restricted cash or restricted cash equivalents. These standards are effective for financial statements issued for fiscal years beginning after December 15, 2017, including interim periods within those fiscal years. The Company will adopt both ASUs in the first quarter of 2018 and expects the impact to be related to the presentation of restricted cash as well as cash flows from its accounts receivable sale program, as described more fully in Note B, Accounts and Notes Receivable.
In June 2016, the FASB issued ASU 2016-13, Financial Instruments - Credit Losses (Topic 326). The new standard amends guidance on reporting credit losses for assets held at amortized cost basis and available-for-sale debt securities. This ASU is effective for financial statements issued for fiscal years beginning after December 15, 2019, including interim periods within those fiscal years. The Company is currently evaluating this guidance to determine the impact it may have on its consolidated financial statements.
In March 2016, the FASB issued ASU 2016-09, Stock Compensation (Topic 718): Improvements to Employee Share-Based Payment Accounting. The objective of this update is to simplify several aspects of the accounting for employee share-based payment transactions, including the income tax consequences, classification of awards as either equity or liabilities, and
67
classification on the statement of cash flows. This ASU was effective for fiscal years beginning after December 15, 2016, including interim periods within those fiscal years. The Company adopted this standard prospectively in the first quarter of 2017 and it did not have a material impact on its consolidated financial statements. Prior periods were not adjusted. The 2017 excess tax benefits have been reported within operating activities on the statement of cash flows upon adoption of ASU 2016-09 in the first quarter of 2017. Prior to the adoption of this ASU, the Company reported the excess tax benefits as a financing cash flow within the proceeds from issuance of common stock caption.
In February 2016, the FASB issued ASU 2016-02, Leases (Topic 842). The objective of this update is to increase transparency and comparability among organizations by recognizing lease assets and lease liabilities on the balance sheet and disclosing key information about leasing arrangements. This ASU is effective for fiscal years beginning after December 15, 2018, including interim periods within those annual periods and is to be applied utilizing a modified retrospective approach. The Company is currently evaluating this guidance to determine the impact it may have on its consolidated financial statements.
In January 2016, the FASB issued ASU 2016-01, Financial Instruments - Overall (Subtopic 825-10): Recognition and Measurement of Financial Assets and Financial Liabilities. The main objective of this update is to enhance the reporting model for financial instruments to provide users of financial statements with more decision-useful information. The new guidance addresses certain aspects of recognition, measurement, presentation, and disclosure of financial instruments. This ASU is effective for fiscal years beginning after December 15, 2017, including interim periods within those fiscal years. The Company will adopt this guidance in the first quarter of 2018 and does not expect it to have a material impact on its consolidated financial statements.
In July 2015, the FASB issued ASU 2015-11, Inventory (Topic 330): Simplifying the Measurement of Inventory. This ASU changes the measurement principle for certain inventory methods from the lower of cost or market to the lower of cost and net realizable value. Net realizable value is defined as the estimated selling price in the ordinary course of business, less reasonably predictable costs of completion, disposal, and transportation. This ASU does not apply to inventory that is measured using Last-in First-out ("LIFO") or the retail inventory method. The provisions of ASU 2015-11 were effective for fiscal years beginning after December 15, 2016, including interim periods within those fiscal years. The Company adopted this standard in the first quarter of 2017 and it did not have an impact on its consolidated financial statements.
In May 2014, the FASB issued ASU 2014-09, Revenue from Contracts with Customers (Topic 606). The new revenue recognition standard outlines a comprehensive model for companies to use in accounting for revenue arising from contracts with customers and supersedes most current revenue recognition guidance. The new model provides a five-step analysis in determining when and how revenue is recognized. The core principle of the new guidance is that a company should recognize revenue to depict the transfer of promised goods or services to customers in an amount that reflects the consideration to which the entity expects to be entitled in exchange for those goods or services. In July 2015, the FASB affirmed its proposal to defer the effective date of the standard to annual reporting periods (and interim reporting periods within those years) beginning after December 15, 2017. Entities are permitted to apply the new revenue standard early, but not before the original effective date of annual periods beginning after December 15, 2016. The standard shall be applied retrospectively to each period presented or as a cumulative-effect adjustment as of the date of adoption. In March, April, May and December 2016, the FASB clarified the implementation guidance on principal versus agent, identifying performance obligations, licensing, collectability and made technical corrections on various topics. The impacts to the Company's financial statements are primarily related to classification of outbound freight on the income statement and presentation of returns reserve. The Company will apply the full retrospective method of adoption starting with the first interim period after December 15, 2017. Subsequent to adoption, net revenue and net income will increase by $219.4 million and $1.3 million (or $0.01 per diluted share), respectively, for the year ended December 30, 2017, and $186.6 million and $2.7 million (or $0.02 per diluted share), respectively, for the year ended December 31, 2016.
B. ACCOUNTS AND NOTES RECEIVABLE
(Millions of Dollars) | 2017 | 2016 | |||||
Trade accounts receivable | $ | 1,421.8 | $ | 1,137.2 | |||
Trade notes receivable | 164.7 | 140.1 | |||||
Other accounts receivable | 128.6 | 103.0 | |||||
Gross accounts and notes receivable | 1,715.1 | 1,380.3 | |||||
Allowance for doubtful accounts | (79.2 | ) | (77.5 | ) | |||
Accounts and notes receivable, net | $ | 1,635.9 | $ | 1,302.8 | |||
Long-term receivable, net | $ | 191.7 | $ | 180.9 | |||
Trade receivables are dispersed among a large number of retailers, distributors and industrial accounts in many countries. Adequate reserves have been established to cover anticipated credit losses. Long-term receivables of $191.7 million and $180.9
68
million at December 30, 2017 and December 31, 2016, respectively, are reported within Other Assets in the Consolidated Balance Sheets. The Company's financing receivables are predominantly related to certain security equipment leases with commercial businesses. Generally, the Company retains legal title to any equipment leases and bears the right to repossess such equipment in an event of default. All financing receivables are interest bearing and the Company has not classified any financing receivables as held-for-sale. Interest income earned from financing receivables that are not delinquent is recorded on the effective interest method. The Company considers any financing receivable that has not been collected within 90 days of original billing date as past-due or delinquent. Additionally, the Company considers the credit quality of all past-due or delinquent financing receivables as nonperforming.
Prior to January 2018, the Company had an accounts receivable sale program. According to the terms of that program, the Company was required to sell certain of its trade accounts receivables at fair value to a wholly owned, consolidated, bankruptcy-remote special purpose subsidiary (“BRS”). The BRS, in turn, was required to sell such receivables to a third-party financial institution (“Purchaser”) for cash and a deferred purchase price receivable. The Purchaser’s maximum cash investment in the receivables at any time was $100.0 million. The purpose of the program was to provide liquidity to the Company. The Company accounted for these transfers as sales under ASC 860, Transfers and Servicing. Receivables were derecognized from the Company’s Consolidated Balance Sheets when the BRS sold those receivables to the Purchaser. The Company had no retained interests in the transferred receivables, other than collection and administrative responsibilities and its right to the deferred purchase price receivable. At December 30, 2017, the Company did not record a servicing asset or liability related to its retained responsibility, based on its assessment of the servicing fee, market values for similar transactions and its cost of servicing the receivables sold. In January 2018, the Company signed an amendment that changes the structure of this program which eliminates the deferred purchase price receivable from the Purchaser and results in the BRS retaining ownership of the trade accounts receivables. This program was then terminated on February 1, 2018.
At December 30, 2017 and December 31, 2016, $100.8 million and $100.5 million, respectively, of net receivables were derecognized. Gross receivables sold amounted to $2.181 billion ($1.830 billion, net) for the year ended December 30, 2017 and $1.833 billion ($1.548 billion, net) for the year ended December 31, 2016. These sales resulted in a pre-tax loss of $7.5 million and $4.8 million, respectively, for the years ended December 30, 2017 and December 31, 2016, respectively. These pre-tax losses include servicing fees of $1.4 million and $0.9 million, respectively, for the years ended December 30, 2017 and December 31, 2016. Proceeds from transfers of receivables to the Purchaser totaled $1.023 billion and $1.068 billion for the years ended December 30, 2017 and December 31, 2016, respectively. Collections of previously sold receivables, including deferred purchase price receivables, and all fees, which are settled one month in arrears, resulted in payments to the Purchaser of $1.785 billion and $1.501 billion for the years ended December 30, 2017 and December 31, 2016, respectively.
The Company’s risk of loss following the sale of the receivables is limited to the deferred purchase price receivable, which was $106.9 million at December 30, 2017 and $83.2 million at December 31, 2016. The deferred purchase price receivable was settled in full in January 2018, and historically was repaid in cash as receivables were collected, generally within 30 days. As such, the carrying value of the receivable recorded at December 30, 2017 and December 31, 2016 approximated fair value. Delinquencies and credit losses on receivables sold were $0.2 million and $0.1 million for the years ended December 30, 2017 and December 31, 2016, respectively. Cash inflows related to the deferred purchase price receivable totaled $704.7 million and $345.1 million for the years ended December 30, 2017 and December 31, 2016, respectively. All cash flows under the program are reported as a component of changes in accounts receivable within operating activities in the Consolidated Statements of Cash Flows since all the cash from the Purchaser is either: 1) received upon the initial sale of the receivable; or 2) from the ultimate collection of the underlying receivables and the underlying receivables are not subject to significant risks, other than credit risk, given their short-term nature.
C. INVENTORIES
(Millions of Dollars) | 2017 | 2016 | |||||
Finished products | $ | 1,461.4 | $ | 1,044.2 | |||
Work in process | 155.5 | 133.3 | |||||
Raw materials | 401.5 | 300.5 | |||||
Total | $ | 2,018.4 | $ | 1,478.0 | |||
Net inventories in the amount of $896.9 million at December 30, 2017 and $662.8 million at December 31, 2016 were valued at the lower of LIFO cost or market. If the LIFO method had not been used, inventories would have been $2.9 million lower than reported at December 30, 2017 and $11.3 million higher than reported at December 31, 2016.
69
In the first quarter of 2017, the Company acquired inventory with estimated fair values of $195.8 million and $15.7 million related to the Newell Tools and Craftsman brand acquisitions, respectively. Refer to Note E, Acquisitions, for further discussion of these acquisitions.
D. PROPERTY, PLANT AND EQUIPMENT
(Millions of Dollars) | 2017 | 2016 | |||||
Land | $ | 110.9 | $ | 107.3 | |||
Land improvements | 53.0 | 37.0 | |||||
Buildings | 611.8 | 519.3 | |||||
Leasehold improvements | 140.0 | 114.2 | |||||
Machinery and equipment | 2,343.7 | 2,008.5 | |||||
Computer software | 400.1 | 373.9 | |||||
Property, plant & equipment, gross | $ | 3,659.5 | $ | 3,160.2 | |||
Less: accumulated depreciation and amortization | (1,917.0 | ) | (1,709.0 | ) | |||
Property, plant & equipment, net | $ | 1,742.5 | $ | 1,451.2 | |||
Depreciation and amortization expense associated with property, plant and equipment was as follows:
(Millions of Dollars) | 2017 | 2016 | 2015 | ||||||||
Depreciation | $ | 253.6 | $ | 221.8 | $ | 219.2 | |||||
Amortization | 43.3 | 41.8 | 37.7 | ||||||||
Depreciation and amortization expense | $ | 296.9 | $ | 263.6 | $ | 256.9 | |||||
E. ACQUISITIONS
PENDING ACQUISITION
On December 22, 2017, the Company reached an agreement to purchase the industrial business of Nelson Fastener Systems ("Nelson") from the Doncasters Group, which excludes Nelson's automotive stud welding business, for approximately $440 million in cash. Nelson is complementary to the Company' product offerings, enhances its presence in the general industrial end markets and expands its portfolio of highly engineered fastening solutions. The transaction is expected to close in the first half of 2018 subject to customary closing conditions, including regulatory approvals. Nelson will be consolidated into the Industrial segment.
2017 ACQUISITIONS
Newell Tools
On March 9, 2017, the Company acquired the Tools business of Newell Brands ("Newell Tools"), which includes the industrial cutting, hand tool and power tool accessory brands Irwin® and Lenox®, for approximately $1.84 billion, net of cash acquired and an estimated working capital adjustment. This acquisition enhances the Company’s position within the global tools & storage industry and broadens the Company’s product offerings and solutions to customers and end users, particularly within power tool accessories. The results of Newell Tools are being consolidated into the Company's Tools & Storage segment.
The Newell Tools acquisition is being accounted for as a business combination, which requires, among other things, the assets acquired and liabilities assumed to be recognized at their fair values as of the acquisition date. The following table summarizes the estimated fair values of major assets acquired and liabilities assumed:
70
(Millions of Dollars) | |||
Cash and cash equivalents | $ | 20.0 | |
Accounts and notes receivable, net | 26.9 | ||
Inventories, net | 195.8 | ||
Prepaid expenses and other current assets | 21.1 | ||
Property, plant and equipment, net | 116.5 | ||
Trade names | 283.0 | ||
Customer relationships | 548.0 | ||
Other assets | 8.8 | ||
Accounts payable | (70.3 | ) | |
Accrued expenses | (34.4 | ) | |
Deferred taxes | (272.8 | ) | |
Other liabilities | (7.9 | ) | |
Total identifiable net assets | $ | 834.7 | |
Goodwill | 1,022.7 | ||
Total consideration paid | $ | 1,857.4 | |
The trade names were determined to have indefinite lives. The weighted-average useful life assigned to the customer relationships is 15 years.
Goodwill is calculated as the excess of the consideration transferred over the net assets recognized and represents the expected revenue and cost synergies of the combined business, assembled workforce, and the going concern nature of Newell Tools. It is estimated that $15.7 million of goodwill, relating to the pre-acquisition historical tax basis of goodwill, will be deductible for tax purposes.
The purchase price allocation for Newell Tools is substantially complete with the exception of certain opening balance sheet liabilities and tax matters. The Company will complete its purchase price allocation in the first quarter of 2018. Any measurement period adjustments resulting from the finalization of the Company’s purchase accounting assessment are not expected to be material.
A single estimate of fair value results from a complex series of judgments about future events and uncertainties and relies heavily on estimates and assumptions. The Company’s judgments used to determine the estimated fair values assigned to each class of assets acquired and liabilities assumed, as well as asset lives, can materially impact the Company’s results from operations.
Craftsman Brand
On March 8, 2017, the Company purchased the Craftsman® brand from Sears Holdings Corporation ("Sears Holdings"), which provides the Company with the rights to develop, manufacture and sell Craftsman®-branded products in non-Sears Holdings channels. The total estimated cash purchase price is $917.4 million on a discounted basis, consisting of an initial cash payment of $569.4 million, which reflects the impact of working capital adjustments, a cash payment due in March 2020 with an estimated present value at acquisition date of $234.0 million, and future payments to Sears Holdings of between 2.5% and 3.5% on sales of Craftsman products in new Stanley Black & Decker channels through March 2032, which was valued at $114.0 million as of the acquisition date based on estimated future sales projections. Refer to Note M, Fair Value Measurements, for additional details. In addition, as part of the acquisition the Company also granted a perpetual license to Sears Holdings to continue selling Craftsman®-branded products in Sears Holdings-related channels. The perpetual license will be royalty-free until March 2032, which represents an estimated value of approximately $293.0 million, and 3% thereafter. The Craftsman results are being consolidated into the Company's Tools & Storage segment.
The Craftsman brand acquisition is being accounted for as a business combination which requires, among other things, the assets acquired and liabilities assumed to be recognized at their fair values as of the acquisition date. The estimated fair value of the identifiable net assets acquired, which includes $43.9 million of working capital and $418.0 million of intangible assets, is $502.1 million. The related goodwill is $708.3 million. The amount allocated to intangible assets includes $396.0 million of an indefinite-lived trade name. The useful life assigned to the customer relationships is 17 years.
71
Goodwill is calculated as the excess of the consideration transferred over the net assets recognized and represents the expected revenue and cost synergies of the combined business and the going concern nature of the Craftsman brand. It is estimated that $426.9 million of goodwill will be deductible for tax purposes.
The purchase price allocation for Craftsman is substantially complete with the exception of certain opening balance sheet liabilities. The Company will complete its purchase price allocation in the first quarter of 2018. Any measurement period adjustments resulting from the finalization of the Company’s purchase accounting assessment are not expected to be material.
A single estimate of fair value results from a complex series of judgments about future events and uncertainties and relies heavily on estimates and assumptions. The Company’s judgments used to determine the estimated fair values assigned to each class of assets acquired and liabilities assumed, as well as asset lives, can materially impact the Company’s results from operations.
Other Acquisitions
During 2017, the Company completed four smaller acquisitions for a total purchase price of $181.7 million, net of cash acquired, which are being consolidated into the Company's Tools & Storage and Security segments. The estimated fair value of the identifiable net assets acquired, which includes $38.1 million of working capital and $57.6 million of customer relationships intangible assets, is $92.2 million. The related goodwill is $89.5 million. The useful life assigned to the customer relationships ranges between 10 and 15 years.
During the measurement period, the Company expects to record adjustments relating to the finalization of valuations for intangible assets, working capital accounts, and various opening balance sheet contingencies. These adjustments are not expected to have a material impact on the Company’s consolidated statement of operations, balance sheet or cash flows.
2016 ACQUISITIONS
During 2016, the Company completed five acquisitions for a total purchase price of $59.3 million, net of cash acquired, which have been consolidated into the Company’s Tools & Storage and Security segments. The total purchase price for the acquisitions was allocated to the assets and liabilities assumed based on their estimated fair values. The purchase accounting for these acquisitions is complete.
2015 ACQUISITIONS
During 2015, the Company completed two acquisitions for a total purchase price of $17.2 million, net of cash acquired, which have been consolidated into the Company's Security segment.
ACTUAL AND PRO-FORMA IMPACT FROM ACQUISITIONS
Actual Impact from Acquisitions
The net sales and net loss from 2017 acquisitions included in the Company's Consolidated Statements of Operations for the year ended December 30, 2017 are shown in the table below. The net loss includes amortization relating to inventory step-up and intangible assets recorded upon acquisition, transaction costs, and other integration-related costs.
Year-to-Date | |||
(Millions of Dollars) | 2017 | ||
Net sales | $ | 803.0 | |
Net loss attributable to common shareowners | $ | (25.0 | ) |
Pro-forma Impact from Acquisitions
The following table presents supplemental pro-forma information as if the 2017 acquisitions had occurred on January 3, 2016. The pro-forma consolidated results are not necessarily indicative of what the Company’s consolidated net sales and net earnings would have been had the Company completed the acquisitions on January 3, 2016. In addition, the pro-forma consolidated results do not purport to project the future results of the Company.
72
Year-to-Date | |||||||
(Millions of Dollars, except per share amounts) | 2017 | 2016 | |||||
Net sales | $ | 12,983.6 | $ | 12,355.9 | |||
Net earnings attributable to common shareowners | 1,330.7 | 925.5 | |||||
Diluted earnings per share | $ | 8.73 | $ | 6.24 | |||
2017 Pro-forma Results
The 2017 pro-forma results were calculated by combining the results of Stanley Black & Decker with the stand-alone results of the 2017 acquisitions for their respective pre-acquisition periods. Accordingly the following adjustments were made:
• | Elimination of the historical pre-acquisition intangible asset amortization expense and the addition of intangible asset amortization expense related to intangibles valued as part of the purchase price allocation that would have been incurred from January 1, 2017 to the acquisition dates. |
• | Additional depreciation expense for the property, plant, and equipment fair value adjustments that would have been incurred from January 1, 2017 to the acquisition date of Newell Tools. |
• | Because the 2017 acquisitions were assumed to occur on January 3, 2016, there were no deal costs or inventory step-up amortization factored into the 2017 pro-forma year, as such expenses would have occurred in the first year following the acquisition. |
2016 Pro-forma Results
The 2016 pro-forma results were calculated by taking the historical financial results of Stanley Black & Decker and adding the historical results of the 2017 acquisitions for their respective pre-acquisition periods. Accordingly the following adjustments were made assuming the acquisitions commenced on January 3, 2016:
• | Elimination of the historical pre-acquisition intangible asset amortization expense and the addition of intangible asset amortization expense related to intangibles valued as part of the purchase price allocation that would have been incurred for the year ended December 31, 2016. |
• | Additional expense for deal costs and inventory step-up, which would have been amortized as the corresponding inventory was sold. |
• | Additional depreciation expense for the property, plant, and equipment fair value adjustments that would have been incurred for the year ended December 31, 2016 for Newell Tools. |
F. GOODWILL AND INTANGIBLE ASSETS
GOODWILL — The changes in the carrying amount of goodwill by segment are as follows:
(Millions of Dollars) | Tools & Storage | Industrial | Security | Total | |||||||||||
Balance December 31, 2016 | $ | 3,247.8 | $ | 1,439.2 | $ | 2,007.0 | $ | 6,694.0 | |||||||
Acquisitions | 1,762.7 | — | 60.5 | 1,823.2 | |||||||||||
Foreign currency translation and other | 179.2 | 15.2 | 64.5 | 258.9 | |||||||||||
Balance December 30, 2017 | $ | 5,189.7 | $ | 1,454.4 | $ | 2,132.0 | $ | 8,776.1 | |||||||
In 2017, goodwill increased by approximately $2.1 billion, which primarily related to the Newell Tools and Craftsman brand acquisitions. The goodwill amounts for these and other 2017 acquisitions are subject to change based upon the allocation of the consideration transferred to the assets acquired and liabilities assumed. Refer to Note E, Acquisitions, for further discussion.
As required by the Company's policy, goodwill and indefinite-lived trade names were tested for impairment in the third quarter of 2017. The Company assessed the fair values of three of its reporting units utilizing a discounted cash flow valuation model and determined that the fair values exceeded the respective carrying amounts. The key assumptions used were discount rates and perpetual growth rates applied to cash flow projections. Also inherent in the discounted cash flow valuations were near-
73
term revenue growth rates over the next five years. These assumptions contemplated business, market and overall economic conditions.
For the remaining two reporting units, the Company determined qualitatively that it was not more likely than not that goodwill was impaired, and thus, the quantitative goodwill impairment test was not required. In making this determination, the Company considered the significant excess of fair value over carrying amount as calculated in the most recent quantitative analysis, each reporting unit's 2017 performance compared to prior year and their respective industries, analyst multiples and other positive qualitative information, all of which indicated that it was more likely than not that the fair values of the two reporting units were greater than their respective carrying amounts.
As previously disclosed in the Company's Form 10-Q for the third quarter of 2017, the fair value of the Infrastructure reporting unit exceeded its carrying amount by 18%. In connection with the preparation of the Consolidated Financial Statements for the year ended December 30, 2017, the Company performed an updated impairment analysis with respect to the Infrastructure reporting unit, which included approximately $271 million of goodwill at year-end. Based on this analysis, which included updated assumptions of near-term revenue and profitability levels, it was determined that the fair value of the Infrastructure reporting unit exceeded its carrying value by 37%. The increase in excess fair value is reflective of an improved near-term outlook due to solid results in 2017, including robust organic growth of 12%. Management remains confident in the long-term viability and success of the Infrastructure reporting unit based on its leading market position in its respective industries and the Company's continued commitment to, and investments in, organic growth initiatives (including solid progress being made with respect to Breakthrough Innovation projects under SFS 2.0).
The fair values of the Company's indefinite-lived trade names were assessed using both qualitative assessments, which considered relevant key external and internal factors, and quantitative analyses, which utilized discounted cash flow valuation models taking into consideration appropriate discount rates, royalty rates and perpetual growth rates applied to projected sales. Based on the results of this testing, the Company determined that the fair values of each of its indefinite-lived trade names exceeded their respective carrying amounts.
In the event that future operating results of any of the Company's reporting units or indefinite-lived trade names do not meet current expectations, management, based upon conditions at the time, would consider taking restructuring or other strategic actions, as necessary, to maximize revenue growth and profitability. A thorough analysis of all the facts and circumstances existing at that time would need to be performed to determine if recording an impairment loss would be appropriate.
INTANGIBLE ASSETS — Intangible assets at December 30, 2017 and December 31, 2016 were as follows:
2017 | 2016 | ||||||||||||||
(Millions of Dollars) | Gross Carrying Amount | Accumulated Amortization | Gross Carrying Amount | Accumulated Amortization | |||||||||||
Amortized Intangible Assets — Definite lives | |||||||||||||||
Patents and copyrights | $ | 44.1 | $ | (41.0 | ) | $ | 40.7 | $ | (36.5 | ) | |||||
Trade names | 154.0 | (111.0 | ) | 152.0 | (100.4 | ) | |||||||||
Customer relationships | 2,326.1 | (1,155.4 | ) | 1,614.6 | (978.9 | ) | |||||||||
Other intangible assets | 260.3 | (175.6 | ) | 258.2 | (158.7 | ) | |||||||||
Total | $ | 2,784.5 | $ | (1,483.0 | ) | $ | 2,065.5 | $ | (1,274.5 | ) | |||||
Indefinite-lived trade names totaled $2.206 billion at December 30, 2017 and $1.509 billion at December 31, 2016. The year-over-year increase relates to the indefinite-lived trade names acquired in the Newell Tools and Craftsman acquisitions.
Aggregate intangible assets amortization expense by segment was as follows:
(Millions of Dollars) | 2017 | 2016 | 2015 | ||||||||
Tools & Storage | $ | 68.0 | $ | 36.8 | $ | 39.0 | |||||
Industrial | 45.4 | 49.8 | 56.8 | ||||||||
Security | 50.4 | 57.8 | 61.3 | ||||||||
Consolidated | $ | 163.8 | $ | 144.4 | $ | 157.1 | |||||
Future amortization expense in each of the next five years amounts to $167.1 million for 2018, $158.2 million for 2019, $139.7 million for 2020, $131.0 million for 2021, $122.0 million for 2022 and $583.5 million thereafter.
74
G. ACCRUED EXPENSES
Accrued expenses at December 30, 2017 and December 31, 2016 were as follows:
(Millions of Dollars) | 2017 | 2016 | |||||
Payroll and related taxes | $ | 339.5 | $ | 268.0 | |||
Income and other taxes | 142.1 | 117.6 | |||||
Customer rebates and sales returns | 95.0 | 68.2 | |||||
Insurance and benefits | 73.7 | 87.4 | |||||
Accrued restructuring costs | 23.2 | 35.6 | |||||
Derivative financial instruments | 103.1 | 49.8 | |||||
Warranty costs | 71.3 | 68.8 | |||||
Deferred revenue | 98.9 | 81.9 | |||||
Other | 405.3 | 324.2 | |||||
Total | $ | 1,352.1 | $ | 1,101.5 | |||
H. LONG-TERM DEBT AND FINANCING ARRANGEMENTS
Long-term debt and financing arrangements at December 30, 2017 and December 31, 2016 were as follows:
December 30, 2017 | December 31, 2016 | ||||||||||||||||||||||
(Millions of Dollars) | Interest Rate | Original Notional | Unamortized Discount | Unamortized Gain/(Loss) Terminated Swaps (1) | Purchase Accounting FV Adjustment | Deferred Financing Fees | Carrying Value | Carrying Value | |||||||||||||||
Notes payable due 2018 | 2.45% | $ | 632.5 | $ | — | $ | — | $ | — | $ | (1.6 | ) | $ | 630.9 | $ | 629.2 | |||||||
Notes payable due 2018 | 1.62% | 345.0 | — | — | — | (0.9 | ) | 344.1 | 343.1 | ||||||||||||||
Notes payable due 2021 | 3.40% | 400.0 | (0.2 | ) | 13.6 | — | (1.3 | ) | 412.1 | 415.2 | |||||||||||||
Notes payable due 2022 | 2.90% | 754.3 | (0.3 | ) | — | — | (3.1 | ) | 750.9 | 750.3 | |||||||||||||
Notes payable due 2028 | 7.05% | 150.0 | — | 11.5 | 11.1 | — | 172.6 | 174.7 | |||||||||||||||
Notes payable due 2040 | 5.20% | 400.0 | (0.2 | ) | (33.4 | ) | — | (3.1 | ) | 363.3 | 361.7 | ||||||||||||
Notes payable due 2052 (junior subordinated) | 5.75% | 750.0 | — | — | — | (19.0 | ) | 731.0 | 730.4 | ||||||||||||||
Notes payable due 2053 (junior subordinated) | 5.75% | 400.0 | — | 4.7 | — | (8.1 | ) | 396.6 | 396.5 | ||||||||||||||
Other, payable in varying amounts through 2022 | 0.00% - 3.06% | 24.9 | — | — | — | — | 24.9 | 22.0 | |||||||||||||||
Total long-term debt, including current maturities | $ | 3,856.7 | $ | (0.7 | ) | $ | (3.6 | ) | $ | 11.1 | $ | (37.1 | ) | $ | 3,826.4 | $ | 3,823.1 | ||||||
Less: Current maturities of long-term debt | (983.4 | ) | (7.8 | ) | |||||||||||||||||||
Long-term debt | $ | 2,843.0 | $ | 3,815.3 | |||||||||||||||||||
(1) Unamortized gain/loss associated with interest rate swaps are more fully discussed in Note I, Financial Instruments.
Aggregate annual principal maturities of long-term debt for each of the years from 2018 to 2022 are $983.8 million, $8.1 million, $4.9 million, $404.0 million, $755.9 million, respectively, and $1.700 billion thereafter. These maturities represent the principal amounts to be paid and accordingly exclude the remaining $11.1 million of unamortized fair value adjustments made in purchase accounting, which increased the Black & Decker note payable due 2028, as well as a net loss of $4.3 million pertaining to unamortized termination gain/loss on interest rate swaps and unamortized discount on the notes as described in Note I, Financial Instruments, and $37.1 million of unamortized deferred financing fees. Interest paid during 2017, 2016 and 2015 amounted to $198.3 million, $176.6 million and $161.5 million, respectively.
In the first quarter of 2016, the Company adopted ASU 2015-03, Interest - Imputation of Interest (Subtopic 835-30); Simplifying the Presentation of Debt Issuance Costs. ASU 2015-03 requires debt issuance costs related to recognized debt liabilities to be presented in the balance sheet as a direct deduction from the debt liability rather than an asset. Accordingly, at December 30, 2017 and December 31, 2016, approximately $37.1 million and $41.7 million, respectively, of deferred debt costs were presented as a direct deduction within Long-Term Debt on the Company's Consolidated Balance Sheets.
75
In December 2013, the Company issued $400.0 million aggregate principal amount of 5.75% fixed-to-floating rate junior subordinated debentures maturing December 15, 2053 (“2053 Junior Subordinated Debentures”). The 2053 Junior Subordinated Debentures bears interest at a fixed rate of 5.75% per annum, payable semi-annually in arrears to, but excluding December 15, 2018. From and including December 15, 2018, the 2053 Junior Subordinated Debentures will bear interest at an annual rate equal to three-month LIBOR plus 4.304% payable quarterly in arrears. The 2053 Junior Subordinated Debentures are unsecured and rank subordinate and junior in right of payment to all of the Company’s existing and future senior debt. The 2053 Junior Subordinated Debentures rank equally in right of payment with all of the Company’s other unsecured junior subordinated debt. The Company received proceeds from the offering of $392.0 million, net of $8.0 million of underwriting discounts and commissions, before offering expenses. The Company used the net proceeds primarily to repay commercial paper borrowings. The Company may, so long as there is no event of default with respect to the debentures, defer interest payments on the debentures, from time to time, for one or more Optional Deferral Periods (as defined in the indenture governing the 2053 Junior Subordinated Debentures) of up to five consecutive years. Deferral of interest payments cannot extend beyond the maturity date of the debentures. The 2053 Junior Subordinated Debentures include an optional redemption provision whereby the Company may elect to redeem the debentures, in whole or in part, at a "make-whole" premium based on United States Treasury rates, plus accrued and unpaid interest if redeemed before December 15, 2018, or at 100% of their principal amount plus accrued and unpaid interest if redeemed after December 15, 2018. In addition, the Company may redeem the debentures in whole, but not in part, before December 15, 2018, if certain changes in tax laws, regulations or interpretations occur at 100% of their principal amount plus accrued and unpaid interest.
In November 2012, the Company issued $800.0 million of senior unsecured term notes, maturing on November 1, 2022 (“2022 Term Notes”) with fixed interest payable semi-annually, in arrears, at a rate of 2.90% per annum. The 2022 Term Notes are unsecured and rank equally with all of the Company's existing and future unsecured and unsubordinated debt. The Company received net proceeds of $793.9 million which reflects a discount of $0.7 million and $5.4 million of underwriting expenses and other fees associated with the transaction. The Company used the net proceeds from the offering for general corporate purposes, including repayment of short-term borrowings. The 2022 Term Notes include a Change of Control provision that would apply should a Change of Control event (as defined in the Indenture governing the 2022 Term Notes) occur. The Change of Control provision states that the holders of the 2022 Term Notes may require the Company to repurchase, in cash, all of the outstanding 2022 Term Notes for a purchase price at 101.0% of the original principal amount, plus any accrued and unpaid interest outstanding up to the repurchase date. In December 2014, the Company repurchased $45.7 million of the 2022 Term Notes and paid $45.3 million cash and recognized a net pre-tax gain of less than $0.1 million after expensing $0.3 million of related loan discount costs and deferred financing fees. At December 30, 2017, the carrying value of the 2022 Term Notes includes $0.3 million of unamortized discount.
In July 2012, the Company issued $750.0 million of junior subordinated debentures, maturing on July 25, 2052 (“2052 Junior Subordinated Debentures”) with fixed interest payable quarterly, in arrears, at a rate of 5.75% per annum. The 2052 Junior Subordinated Debentures are unsecured and rank subordinate and junior in right of payment to all of the Company's existing and future senior debt. The Company received net proceeds of $729.4 million and paid $20.6 million of fees associated with the transaction. The Company used the net proceeds from the offering for general corporate purposes, including repayment of debt and refinancing of near term debt maturities. The Company may, so long as there is no event of default with respect to the debentures, defer interest payments on the debentures, from time to time, for one or more Optional Deferral Periods (as defined in the indenture governing the 2052 Junior Subordinated Debentures) of up to five consecutive years per period. Deferral of interest payments cannot extend beyond the maturity date of the debentures. Additionally, the 2052 Junior Subordinated Debentures include an optional redemption whereby the Company may elect to redeem the debentures at 100% of their principal amount plus accrued and unpaid interest.
Commercial Paper and Credit Facilities
In January 2017, the Company amended its existing $2.0 billion commercial paper program to increase the maximum amount of notes authorized to be issued to $3.0 billion and to include Euro denominated borrowings in addition to U.S. Dollars. As of December 30, 2017, the Company had no borrowings outstanding against the $3.0 billion commercial paper program. At December 31, 2016, the Company had no borrowings outstanding against the Company’s $2.0 billion commercial paper program.
The Company has a five-year $1.75 billion committed credit facility (the “Credit Agreement”). Borrowings under the Credit Agreement may include U.S. Dollars up to the $1.75 billion commitment or in Euro or Pounds Sterling subject to a foreign currency sub-limit of $400.0 million and bear interest at a floating rate dependent upon the denomination of the borrowing. Repayments must be made on December 18, 2020 or upon an earlier termination date of the Credit Agreement, at the election of the Company. The Credit Agreement is designated to be a liquidity back-stop for the Company's $3.0 billion U.S. Dollar and
76
Euro commercial paper program. As of December 30, 2017 and December 31, 2016, the Company had not drawn on this commitment.
The Company also has a 364-day $1.25 billion committed credit facility (the "2017 Credit Agreement") executed in December 2017. The 2017 Credit Agreement consists of a $1.25 billion revolving credit loan and a sub-limit of an amount equal to the Euro equivalent of $400 million for swing line advances. Borrowings under the 2017 Credit Agreement may be made in U.S. Dollars or Euros, pursuant to the terms of the agreement, and bear interest at a floating rate dependent on the denomination of the borrowing. Repayments must be made by December 19, 2018 or upon an earlier termination of the 2017 Credit Agreement at the election of the Company. The Company also has the option at the termination date to convert all advances into a term loan provided certain requirements are met. The 2017 Credit Agreement serves as a liquidity back-stop for the Company’s $3.0 billion U.S. Dollar and Euro commercial paper program. As of December 30, 2017, the Company had not drawn on this commitment.
In January 2017, the Company executed a 364-day $1.3 billion committed credit facility which consisted of a $1.3 billion revolving credit loan and a sub-limit of an amount equal to the Euro equivalent of $400 million for swing line advances. Borrowings under this credit agreement could be made in U.S. Dollars or Euros, pursuant to the terms of the agreement, and bore interest at a floating rate dependent on the denomination of the borrowing. This credit agreement was terminated in December 2017 at the election of the Company.
In addition, the Company has short-term lines of credit that are primarily uncommitted, with numerous banks, aggregating $624.9 million, of which $429.8 million was available at December 30, 2017. Short-term arrangements are reviewed annually for renewal.
At December 30, 2017, the aggregate amount of committed and uncommitted, long- and short-term lines was $3.6 billion. At December 30, 2017, $5.3 million was recorded as short-term borrowings and amounts outstanding against uncommitted lines excluding commercial paper. In addition, $195.1 million of the short-term credit lines was utilized primarily pertaining to outstanding letters of credit for which there are no required or reported debt balances. The weighted-average interest rates on U.S. dollar denominated short-term borrowings for the years ended December 30, 2017 and December 31, 2016 were 1.2% and 0.6%, respectively. The weighted-average interest rate on Euro denominated short-term borrowings for the year ended December 30, 2017 was negative 0.3%.
Equity Units
In December 2013, the Company issued 3,450,000 Equity Units (the “Equity Units”), each with a stated value of $100. The Equity Units were initially comprised of a 1/10, or 10%, undivided beneficial ownership in a $1,000 principal amount 2.25% junior subordinated note due 2018 (the “2018 Junior Subordinated Note”) and a forward common stock purchase contract (the “Equity Purchase Contract”). The Company received approximately $334.7 million in cash proceeds from the Equity Units, net of underwriting discounts and commissions, before offering expenses, and recorded $345.0 million in long-term debt. The $345.0 million aggregate principal amount is due on November 17, 2018, and is included in Current maturities of long-term debt as of December 30, 2017, on the Consolidated Balance Sheets. The proceeds were used primarily to repay commercial paper borrowings. The Company also used $9.7 million of the proceeds to enter into capped call transactions utilized to hedge potential economic dilution as described in more detail below.
Equity Purchase Contracts:
On November 17, 2016, the Company settled all Equity Purchase Contracts by issuing 3,504,165 common shares and received $345.0 million in cash proceeds generated from the remarketing described in detail below. The number of shares of common stock issuable upon settlement of each purchase contract (the “settlement rate”) was rounded to the nearest ten-thousandth of a share and was determined by calculating the applicable market value, equal to the average of the daily volume-weighted average price of common stock for each of the 20 consecutive trading days during the market value averaging period, October 21, 2016 through November 17, 2016. The conversion rate used in calculating the average of the daily volume-weighted average price of common stock during the market value averaging period was 1.0157 (equivalent to the purchase contract settlement rate and a conversion price of $98.45 per common share).
Holders of the Equity Purchase Contracts were paid contract adjustment payments (“contract adjustment payments”) at a rate of 4.00% per annum, payable quarterly in arrears on February 17, May 17, August 17 and November 17 of each year, commencing February 17, 2014. The $40.2 million present value of the Contract Adjustment Payments reduced Shareowners’ Equity upon issuance of the Equity Units and a related liability for the present value of the cash payments of $40.2 million was recorded. As each quarterly contract adjustment payment was made, the related liability was relieved with the difference
77
between the cash payment and the present value accreted to interest expense over the three-year term. On November 17, 2016, the Company made the final contract adjustment payment.
2018 Junior Subordinated Notes:
The $345.0 million aggregate principal amount of the 2018 Junior Subordinated Notes will mature on November 17, 2018. Prior to November 17, 2016, the 2018 Junior Subordinated Notes bore interest at a rate of 2.25% per annum, payable quarterly in arrears on February 17, May 17, August 17 and November 17 of each year, commencing February 17, 2014. The 2018 Junior Subordinated Notes were unsecured and ranked subordinate and junior in right of payment to the Company’s existing and future senior indebtedness. The 2018 Junior Subordinated Notes initially ranked equally in right of payment with all of the Company’s other unsecured junior subordinated debt.
The Company successfully remarketed the 2018 Junior Subordinated Notes on November 17, 2016 ("Subordinated Notes"). In connection with the remarketing, the interest rate on the notes was reset, effective on the settlement date to a rate of 1.622% per annum, payable semi-annually in arrears on May 17 and November 17 of each year, commencing May 17, 2017 and maturing on November 17, 2018. Following settlement of the remarketing, the Subordinated Notes remain the Company’s direct, unsecured general obligations and are subordinated and junior in right of payment to the Company’s existing and future senior indebtedness, but the Subordinated Notes rank senior in right of payment to specified junior indebtedness on the terms and to the extent set forth in the indentures governing such junior indebtedness.
The remarketing resulted in proceeds of $345.0 million, which the Company did not directly receive, and were automatically applied to satisfy in full the related unit holders’ obligations to purchase common stock under their Equity Purchase Contracts.
Interest expense of $5.6 million for 2017 and $0.7 million for 2016 was recorded related to the contractual interest coupon on the Subordinated Notes based on the annual rate of 1.622%. Interest expense of $6.8 million in 2016, and $7.8 million for 2015 was recorded related to the 2.25% contractual interest coupon on the 2018 Junior Subordinated Notes.
The unamortized deferred remarketing costs of the Subordinated Notes at December 30, 2017 is $0.9 million and will be recorded to interest expense over the term of the underlying notes.
Capped Call Transactions:
In order to offset the potential economic dilution associated with the common shares issuable upon settlement of the Equity Purchase Contracts, the Company entered into capped call transactions with a major financial institution (the “counterparty”). The capped call transactions covered, subject to customary anti-dilution adjustments, the number of shares equal to the number of shares issuable upon settlement of the Equity Purchase Contracts. The capped call transactions have a term of approximately three years and initially had a lower strike price of $98.80, which corresponds to the minimum settlement rate of the Equity Purchase Contracts, and an upper strike price of $112.91, which is approximately 40% higher than the closing price of the Company's common stock on November 25, 2013, and are subject to customary anti-dilution adjustments. The Company paid $9.7 million of cash to fund the cost of the capped call transactions, which was recorded as a reduction of Shareowners’ Equity. In October and November 2016, the Company’s capped call options on its common stock expired and were net-share settled resulting in the Company receiving 418,234 shares of common stock.
Convertible Preferred Units
In November 2010, the Company issued 6,325,000 Convertible Preferred Units (the “Convertible Preferred Units”), each with a stated amount of $100. The Convertible Preferred Units were comprised of a 1/10, or 10%, undivided beneficial ownership in a $1,000 principal amount junior subordinated note (the “Note”) and a Purchase Contract (the “Purchase Contract”) obligating holders to purchase one share of the Company’s 4.75% Series B Perpetual Cumulative Convertible Preferred Stock (the “Convertible Preferred Stock”). The Company received $613.5 million in cash proceeds from the Convertible Preferred Units offering, net of underwriting fees.
Purchase Contracts:
Each Purchase Contract obligated the holder to purchase, on November 17, 2015, for $100, one newly-issued share of Convertible Preferred Stock.
Holders of the Purchase Contracts were paid contract adjustment payments at a rate of 0.50% per annum, payable quarterly in arrears on February 17, May 17, August 17 and November 17 of each year. The $14.9 million present value of the contract adjustment payments reduced Shareowners’ Equity at inception. As each quarterly contract adjustment payment was made, the
78
related liability was relieved with the difference between the cash payment and the present value of the contract adjustment payment recorded as interest expense.
In accordance with the Purchase Contracts, on November 17, 2015, the Company issued 6,325,000 shares of Convertible Preferred Stock and made the final contract adjustment payment on the Purchase Contracts. The purchase price for the Convertible Preferred Stock was paid using the proceeds of the remarketing described below.
Convertible Preferred Stock:
Holders of the Convertible Preferred Stock were entitled to receive cumulative cash dividends at the rate of 4.75% per annum of the $100 liquidation preference per share of the Convertible Preferred Stock. Dividends on the Convertible Preferred Stock were payable, when, as and if declared by the Company’s board of directors, quarterly in arrears in conjunction with the contract adjustment payments.
On November 18, 2015, the Company informed holders that it would redeem, on December 24, 2015 (the “Redemption Date”), all outstanding shares of Convertible Preferred Stock that had not previously been converted at a redemption price of $100.49 per share in cash (the “Redemption Price”), which was equal to the liquidation preference per share of Convertible Preferred Stock of $100, plus accrued and unpaid dividends thereon to, but excluding, the Redemption Date.
Substantially all of the holders of Convertible Preferred Stock elected to convert their shares of Convertible Preferred Stock prior to the Redemption Date. The Company elected to settle all conversions of Convertible Preferred Stock through combination settlement, with a specified dollar amount of $100. The amounts due upon conversion were equal to the sum of the Daily Settlement Amounts for each of the 20 consecutive trading days during the observation period, November 23, 2015 through December 21, 2015. Daily Settlement Amount means, for each of the 20 consecutive trading days during the observation period: (1) cash equal to the lesser of (A) $5.00 and (B) 1/20th of the product of the (i) applicable conversion rate on such trading day and (ii) the daily volume-weighted average price of common stock on such trading day (the “Daily Conversion Value”); and (2) to the extent the Daily Conversion Value for such trading day exceeds $5.00, a number of shares of common stock equal to (A) the difference between such Daily Conversion Value and $5.00, divided by (B) the daily volume-weighted average price for such trading day.
The Company settled all conversions on December 24, 2015 by paying $632.5 million in cash for the $100 par value per share of Convertible Preferred Stock and issuing 2.9 million common shares for the excess value of the conversion feature above the $100 face value per share of Convertible Preferred Stock. The conversion rates used in calculating the Daily Conversion Value during the observation period, were 1.3763 (equivalent to a conversion price set at $72.66 per common share) prior to December 2, 2015 and 1.3789 (equivalent to a conversion price set at $72.52 per common share) on and after December 2, 2015.
Notes:
The $632.5 million principal amount of the Notes is due November 17, 2018, and is included in Current maturities of long-term debt as of December 30, 2017 on the Consolidated Balance Sheets. At maturity, the Company is obligated to repay the principal in cash. The Notes initially bore interest at an initial rate of 4.25% per annum, payable quarterly in arrears on the same dates as the contract adjustment payments. The Notes are the Company’s direct, unsecured general obligations and are subordinated and junior in right of payment to the Company’s existing and future senior indebtedness. The Notes initially ranked equally in right of payment with all of the Company’s other junior subordinated debt. The interest rate, payment dates and ranking of the notes were reset in connection with the remarketing, as described below. The Notes were initially pledged as collateral to guarantee the obligations of holders of Purchase Contracts to purchase Convertible Preferred Stock. Upon completion of the remarketing, the Notes were released from that pledge arrangement.
The Company successfully remarketed the Notes on November 5, 2015. In connection with the remarketing, the interest rate on the notes was reset, effective on the November 17, 2015 settlement date of the remarketing, to a rate of 2.45% per annum, payable semi-annually in arrears on May 17 and November 17 of each year, commencing May 17, 2016. Following settlement of the remarketing, the Notes remain the Company’s direct, unsecured general obligations subordinated and junior in right of payment to the Company’s existing and future senior indebtedness, but the Notes rank senior in right of payment to specified junior indebtedness on the terms and to the extent set forth in the indentures governing such junior indebtedness.
The remarketing resulted in proceeds of $632.5 million. The Company did not directly receive any proceeds from the remarketing. Instead, the proceeds of remarketing were automatically applied to satisfy in full the related unit holders’ obligations to purchase Convertible Preferred Stock under their Purchase Contracts.
79
Interest expense of $15.5 million in 2017 and 2016 and $1.9 million in 2015 was recorded related to the contractual interest coupon on the 2018 Subordinated Notes based upon the 2.45% annual rate and $23.3 million was recorded in 2015 related to the contractual interest coupon on the Notes based upon the 4.25% annual rate.
The unamortized deferred issuance cost of the Notes was $1.6 million at December 30, 2017, and will be recorded to interest expense over the term of the underlying Notes.
Equity Option:
In order to offset the common shares that were deliverable upon conversion of shares of Convertible Preferred Stock, the Company entered into capped call transactions (equity options) with certain major financial institutions (the “capped call counterparties”). The capped call transactions cover, subject to anti-dilution adjustments, the number of shares of common stock equal to the number of shares of common stock underlying the maximum number of shares of Convertible Preferred Stock issuable upon settlement of the Purchase Contracts. Each of the capped call transactions had an original term of approximately five years and initially had a lower strike price of $75.00, which corresponded to the initial conversion price of the Convertible Preferred Stock, and an upper strike price of $97.95, which was approximately 60% higher than the closing price of the common stock on November 1, 2010. The Company paid $50.3 million of cash to fund the cost of the capped call transactions, which was recorded as a reduction of Shareowners’ Equity. On August 5, 2015, the Company terminated the capped call options on its common stock and received 1,692,778 shares of common stock.
I. FINANCIAL INSTRUMENTS
The Company is exposed to market risk from changes in foreign currency exchange rates, interest rates, stock prices and commodity prices. As part of the Company’s risk management program, a variety of financial instruments such as interest rate swaps, currency swaps, purchased currency options, foreign exchange contracts and commodity contracts, may be used to mitigate interest rate exposure, foreign currency exposure and commodity price exposure.
If the Company elects to do so and if the instrument meets the criteria specified in ASC 815, Derivatives and Hedging, management designates its derivative instruments as cash flow hedges, fair value hedges or net investment hedges. Generally, commodity price exposures are not hedged with derivative financial instruments and instead are actively managed through customer pricing initiatives, procurement-driven cost reduction initiatives and other productivity improvement projects. Financial instruments are not utilized for speculative purposes.
A summary of the fair values of the Company’s derivatives recorded in the Consolidated Balance Sheets at December 30, 2017 and December 31, 2016 follows:
(Millions of Dollars) | Balance Sheet Classification | 2017 | 2016 | Balance Sheet Classification | 2017 | 2016 | ||||||||||||||
Derivatives designated as hedging instruments: | ||||||||||||||||||||
Interest Rate Contracts Cash Flow | Other current assets | $ | — | $ | — | Accrued expenses | $ | 55.7 | $ | — | ||||||||||
LT other assets | — | — | LT other liabilities | — | 47.3 | |||||||||||||||
Foreign Exchange Contracts Cash Flow | Other current assets | 4.1 | 37.6 | Accrued expenses | 33.4 | 1.6 | ||||||||||||||
LT other assets | — | — | LT other liabilities | 5.2 | — | |||||||||||||||
Net Investment Hedge | Other current assets | 6.6 | 44.1 | Accrued expenses | 7.0 | 1.8 | ||||||||||||||
LT other assets | — | — | LT other liabilities | 5.8 | 0.5 | |||||||||||||||
$ | 10.7 | $ | 81.7 | $ | 107.1 | $ | 51.2 | |||||||||||||
Derivatives not designated as hedging instruments: | ||||||||||||||||||||
Foreign Exchange Contracts | Other current assets | $ | 7.3 | $ | 28.5 | Accrued expenses | $ | 6.9 | $ | 46.4 | ||||||||||
$ | 7.3 | $ | 28.5 | $ | 6.9 | $ | 46.4 | |||||||||||||
The counterparties to all of the above mentioned financial instruments are major international financial institutions. The Company is exposed to credit risk for net exchanges under these agreements, but not for the notional amounts. The credit risk is limited to the asset amounts noted above. The Company limits its exposure and concentration of risk by contracting with diverse financial institutions and does not anticipate non-performance by any of its counterparties. Further, as more fully
80
discussed in Note M, Fair Value Measurements, the Company considers non-performance risk of its counterparties at each reporting period and adjusts the carrying value of these assets accordingly. The risk of default is considered remote.
In 2017, 2016 and 2015, cash flows related to derivatives, including those that are separately discussed below, resulted in net cash received of $2.6 million, $94.7 million, and $144.4 million, respectively.
CASH FLOW HEDGES — There were after-tax mark-to-market losses of $112.6 million and $46.3 million as of December 30, 2017 and December 31, 2016, respectively, reported for cash flow hedge effectiveness in Accumulated other comprehensive loss. An after-tax loss of $54.5 million is expected to be reclassified to earnings as the hedged transactions occur or as amounts are amortized within the next twelve months. The ultimate amount recognized will vary based on fluctuations of the hedged currencies and interest rates through the maturity dates.
The tables below detail pre-tax amounts reclassified from Accumulated other comprehensive loss into earnings for active derivative financial instruments during the periods in which the underlying hedged transactions affected earnings for 2017, 2016 and 2015:
Year-to-date 2017 (Millions of Dollars) | (Loss) Gain Recorded in OCI | Classification of Gain (Loss) Reclassified from OCI to Income | Gain (Loss) Reclassified from OCI to Income (Effective Portion) | Gain (Loss) Recognized in Income (Ineffective Portion*) | ||||||||||
Interest Rate Contracts | $ | (8.4 | ) | Interest Expense | $ | — | $ | — | ||||||
Foreign Exchange Contracts | $ | (66.6 | ) | Cost of sales | $ | 8.4 | $ | — | ||||||
Year-to-date 2016 (Millions of Dollars) | (Loss) Gain Recorded in OCI | Classification of Gain (Loss) Reclassified from OCI to Income | Gain (Loss) Reclassified from OCI to Income (Effective Portion) | Gain (Loss) Recognized in Income (Ineffective Portion*) | ||||||||||
Interest Rate Contracts | $ | (6.2 | ) | Interest Expense | $ | — | $ | — | ||||||
Foreign Exchange Contracts | $ | 19.3 | Cost of sales | $ | 21.7 | $ | — | |||||||
Year-to-date 2015 (Millions of Dollars) | (Loss) Gain Recorded in OCI | Classification of Gain (Loss) Reclassified from OCI to Income | Gain (Loss) Reclassified from OCI to Income (Effective Portion) | Gain (Loss) Recognized in Income (Ineffective Portion*) | ||||||||||
Interest Rate Contracts | $ | (6.8 | ) | Interest Expense | $ | — | $ | — | ||||||
Foreign Exchange Contracts | $ | 52.5 | Cost of sales | $ | 57.4 | $ | — | |||||||
* Includes ineffective portion and amount excluded from effectiveness testing on derivatives.
For 2017, 2016 and 2015, the hedged items’ impact to the Consolidated Statement of Operations were losses of $8.4 million, $21.7 million and $57.4 million, respectively, in Cost of Sales which are offsetting the amounts shown above. There was no impact related to the interest rate contracts’ hedged items for any period presented.
For 2017, an after-tax loss of $4.7 million, and for 2016 and 2015, after-tax gains of $3.3 million and $22.4 million, respectively, were reclassified from Accumulated other comprehensive loss into earnings (inclusive of the gain/loss amortization on terminated derivative financial instruments) during the periods in which the underlying hedged transactions affected earnings.
Interest Rate Contracts: The Company enters into interest rate swap agreements in order to obtain the lowest cost source of funds within a targeted range of variable to fixed-rate debt proportions. As of December 30, 2017, and December 31, 2016, the Company had $400 million of forward starting swaps outstanding which were executed in 2014. The objective of the hedges is to offset the expected variability on future payments associated with the interest rate on debt instruments expected to be issued in 2018. Gains or losses on the swaps are recorded in Accumulated other comprehensive loss and will be subsequently reclassified into earnings as the future interest expense is recognized in earnings or as ineffectiveness occurs.
Foreign Currency Contracts
Forward Contracts: Through its global businesses, the Company enters into transactions and makes investments denominated in multiple currencies that give rise to foreign currency risk. The Company and its subsidiaries regularly purchase inventory
81
from subsidiaries with functional currencies different than their own, which creates currency-related volatility in the Company’s results of operations. The Company utilizes forward contracts to hedge these forecasted purchases and sales of inventory. Gains and losses reclassified from Accumulated other comprehensive loss for the effective portion of the hedge are recorded in Cost of sales. The ineffective portion, if any, as well as gains and losses incurred after a hedge has been de-designated are not recorded in Accumulated other comprehensive loss, but are recorded directly to the Consolidated Statements of Operations in Other, net. At December 30, 2017, the notional value of the forward currency contracts outstanding was $559.9 million, maturing on various dates through 2018. As of December 31, 2016, the notional values of the forward currency contracts outstanding was $503.8 million, maturing on various dates through 2017.
Purchased Option Contracts: The Company and its subsidiaries enter into various intercompany transactions whereby the notional values are denominated in currencies other than the functional currencies of the party executing the trade. In order to better match the cash flows of its intercompany obligations with cash flows from operations, the Company enters into purchased option contracts. Gains and losses reclassified from Accumulated other comprehensive loss for the effective portions of the hedge are recorded in Cost of sales. The ineffective portion, if any, as well as gains and losses incurred after a hedge has been de-designated are not recorded in Accumulated other comprehensive loss, but are recorded directly to the Consolidated Statements of Operations in Other, net. At December 30, 2017, the notional value of option contracts outstanding was $400.0 million, maturing on various dates through 2019. As of December 31, 2016, the notional value of purchased option contracts was $252.0 million, maturing on various dates in 2017.
FAIR VALUE HEDGES
Interest Rate Risk: In an effort to optimize the mix of fixed versus floating rate debt in the Company’s capital structure, the Company enters into interest rate swaps. In previous years, the Company entered into interest rate swaps on the first five years of the Company's $400 million 5.75% notes due 2053, interest rate swaps with notional values which equaled the Company's $400 million 3.40% notes due 2021 and the Company's $150 million 7.05% notes due 2028. These interest rate swaps effectively converted the Company's fixed rate debt to floating rate debt based on LIBOR, thereby hedging the fluctuation in fair value resulting from changes in interest rates. In 2016, the Company terminated all of the above interest rate swaps and there were no open contracts as of December 30, 2017 and December 31, 2016. The terminations resulted in cash receipts of $27.0 million. This gain was deferred and is being amortized to earnings over the remaining life of the notes.
Prior to termination of the Company's interest rate swaps discussed above, the changes in fair value of the swaps and the offsetting changes in fair value related to the underlying notes were recognized in earnings. A summary of the fair value adjustments relating to these swaps is as follows:
Year-to-Date 2017 | Year-to-Date 2016 | Year-to-Date 2015 | |||||||||||||||||||||
Income Statement Classification (Millions of Dollars) | Gain/(Loss) on Swaps* | Gain /(Loss) on Borrowings | (Loss)/Gain on Swaps* | Gain /(Loss) on Borrowings | Gain/(Loss) on Swaps* | (Loss)/Gain on Borrowings | |||||||||||||||||
Interest Expense | $ | — | $ | — | $ | (3.3 | ) | $ | 3.8 | $ | 11.8 | $ | (11.8 | ) | |||||||||
* Includes ineffective portion and amount excluded from effectiveness testing on derivatives.
Amortization of the gain/loss on terminated swaps of $3.2 million is reported as a reduction of interest expense in 2017. In addition to the fair value adjustments in the table above, net swap accruals and amortization of the gain/loss on terminated swaps of $6.9 million and $14.2 million are reported as a reduction of interest expense in 2016 and 2015, respectively. There was no interest expense on the underlying debt in 2017. Interest expense on the underlying debt was $19.9 million in 2016 and $47.1 million in 2015 when the hedges were active.
NET INVESTMENT HEDGES
Foreign Exchange Contracts: The Company utilizes net investment hedges to offset the translation adjustment arising from re-measurement of its investment in the assets and liabilities of its foreign subsidiaries. The total after-tax amounts in Accumulated other comprehensive loss were a gain of $3.4 million and $88.6 million at December 30, 2017 and December 31, 2016, respectively.
As of December 30, 2017, the Company had foreign exchange contracts that mature on various dates through 2018 with notional values totaling $751.2 million outstanding hedging a portion of its British pound sterling, Mexican peso, Swedish krona, Euro and Canadian dollar denominated net investments, and a cross currency swap with a notional value totaling $250.0 million maturing 2023 hedging a portion of its Japanese yen denominated net investment. As of December 31, 2016, the Company had foreign exchange contracts maturing on various dates through 2017 with notional values totaling $1.0 billion outstanding hedging a portion of its British pound sterling, Mexican peso, Swedish krona, Euro and Canadian denominated net investment and a cross currency swap with a notional value totaling $250.0 million maturing 2023 hedging a portion of its
82
Japanese yen denominated net investment. Of the $1.0 billion discussed above, $136.1 million hedging a portion of the British pound sterling net investments had been de-designated as of December 31, 2016. Maturing foreign exchange contracts resulted in net cash paid of $23.3 million during 2017, and net cash received of $104.7 million and $137.7 million during 2016 and 2015, respectively.
Gains and losses on net investment hedges remain in Accumulated other comprehensive loss until disposal of the underlying assets. Gains and losses after a hedge has been de-designated are recorded directly to the Consolidated Statements of Operations in Other, net.
The pre-tax gain or loss from fair value changes was as follows:
Year-to-Date 2017 | Year-to-Date 2016 | Year-to-Date 2015 | |||||||||||||||||||||||||||||||||
Income Statement Classification (Millions of Dollars) | Amount Recorded in OCI (Loss) Gain | Effective Portion Recorded in Income Statement | Ineffective Portion* Recorded in Income Statement | Amount Recorded in OCI Gain (Loss) | Effective Portion Recorded in Income Statement | Ineffective Portion* Recorded in Income Statement | Amount Recorded in OCI Gain (Loss) | Effective Portion Recorded in Income Statement | Ineffective Portion* Recorded in Income Statement | ||||||||||||||||||||||||||
Other-net | $ | (131.3 | ) | $ | — | $ | — | $ | 117.8 | $ | — | $ | — | $ | 75.5 | $ | — | $ | — | ||||||||||||||||
*Includes ineffective portion and amount excluded from effectiveness testing.
As discussed in Note H, Long-Term Debt and Financing Arrangements, the Company amended its existing $2.0 billion commercial paper program in 2017 to increase the maximum amount of notes authorized to be issued to $3.0 billion and to include Euro denominated borrowings in addition to U.S. Dollars. Euro denominated borrowings against this commercial paper program during 2017 were designated as a Net Investment Hedge against a portion of its Euro denominated net investment. As of December 30, 2017, the Company has no borrowings outstanding against this commercial paper program.
UNDESIGNATED HEDGES
Foreign Exchange Contracts: Currency swaps and foreign exchange forward contracts are used to reduce risks arising from the change in fair value of certain foreign currency denominated assets and liabilities (such as affiliate loans, payables and receivables). The objective of these practices is to minimize the impact of foreign currency fluctuations on operating results. The total notional amount of the forward contracts outstanding at December 30, 2017 was $1.0 billion maturing on various dates through 2018. The total notional amount of the forward contracts outstanding at December 31, 2016 was $1.5 billion maturing on various dates through 2017. The income statement impacts related to derivatives not designated as hedging instruments for 2017, 2016 and 2015 are as follows:
Derivatives Not Designated as Hedging Instruments under ASC 815 (Millions of Dollars) | Income Statement Classification | Year-to-Date 2017 Amount of Gain (Loss) Recorded in Income on Derivative | Year-to-Date 2016 Amount of (Loss) Gain Recorded in Income on Derivative | Year-to-Date 2015 Amount of (Loss) Gain Recorded in Income on Derivative | |||||||||
Foreign Exchange Contracts | Other-net | $ | 51.5 | $ | (21.1 | ) | $ | (8.9 | ) | ||||
J. CAPITAL STOCK
EARNINGS PER SHARE — The following table reconciles net earnings attributable to common shareowners and the weighted-average shares outstanding used to calculate basic and diluted earnings per share for the fiscal years ended December 30, 2017, December 31, 2016, and January 2, 2016.
83
2017 | 2016 | 2015 | |||||||||
Numerator (in millions): | |||||||||||
Net earnings from continuing operations attributable to common shareowners | $ | 1,226.0 | $ | 965.3 | $ | 903.8 | |||||
Net loss from discontinued operations | — | — | (20.1 | ) | |||||||
Net Earnings Attributable to Common Shareowners | $ | 1,226.0 | $ | 965.3 | $ | 883.7 | |||||
Denominator (in thousands): | ||||||||
Basic weighted-average shares | 149,629 | 146,041 | 148,234 | |||||
Dilutive effect of stock contracts and awards | 2,820 | 2,166 | 4,472 | |||||
Diluted weighted-average shares | 152,449 | 148,207 | 152,706 | |||||
Earnings (loss) per share of common stock: | |||||||||||
Basic earnings (loss) per share of common stock: | |||||||||||
Continuing operations | $ | 8.19 | $ | 6.61 | $ | 6.10 | |||||
Discontinued operations | — | — | (0.14 | ) | |||||||
Total basic earnings per share of common stock | $ | 8.19 | $ | 6.61 | $ | 5.96 | |||||
Diluted earnings (loss) per share of common stock: | |||||||||||
Continuing operations | $ | 8.04 | $ | 6.51 | $ | 5.92 | |||||
Discontinued operations | — | — | (0.13 | ) | |||||||
Total dilutive earnings per share of common stock | $ | 8.04 | $ | 6.51 | $ | 5.79 | |||||
The following weighted-average stock options were not included in the computation of diluted shares outstanding because the effect would be anti-dilutive (in thousands):
2017 | 2016 | 2015 | ||||||
Number of stock options | 389 | 734 | 646 | |||||
As described in detail below, under "Other Equity Arrangements," the Company issued $750 million Equity Units in May 2017 comprised of $750.0 million of convertible preferred stock and forward stock purchase contracts. On and after May 15, 2020, the convertible preferred stock may be converted into common stock at the option of the holder. At the election of the Company, upon conversion, the Company may deliver cash, common stock, or a combination thereof. The conversion rate was initially 6.1627 shares of common stock per one share of convertible preferred stock, which is equivalent to an initial conversion price of approximately $162.27 per share of common stock. As of December 30, 2017, due to the customary anti-dilution provisions, the conversion rate was 6.1667, equivalent to a conversion price of approximately $162.16 per share of common stock. The convertible preferred stock is excluded from the denominator of the diluted earnings per share calculation on the basis that the convertible preferred stock will be settled in cash except to the extent that the conversion value of the convertible preferred stock exceeds its liquidation preference. Therefore, before any redemption or conversion, the common shares that would be required to settle the applicable conversion value in excess of the liquidation preference, if the Company elects to settle such excess in common shares, are included in the denominator of diluted earnings per share in periods in which they are dilutive. The shares related to the convertible preferred stock were anti-dilutive during certain months in 2017.
As described in detail below, under "Other Equity Arrangements," the Company issued Equity Units in December 2013 comprised of $345.0 million of Notes and Equity Purchase Contracts, which obligated the holders to purchase on November 17, 2016, for $100, between 1.0122 and 1.2399 shares of the Company’s common stock. The shares related to the Equity Purchase Contracts were anti-dilutive during certain months in 2015 and 2016. Upon the November 17, 2016 settlement date, the Company issued 3,504,165 shares of common stock and received cash proceeds of $345.0 million.
84
COMMON STOCK ACTIVITY — Common stock activity for 2017, 2016 and 2015 was as follows:
2017 | 2016 | 2015 | ||||||
Outstanding, beginning of year | 152,559,767 | 153,944,291 | 157,125,450 | |||||
Issued from treasury | 1,680,339 | 4,870,761 | 6,046,405 | |||||
Returned to treasury | (202,075 | ) | (6,255,285 | ) | (9,227,564 | ) | ||
Outstanding, end of year | 154,038,031 | 152,559,767 | 153,944,291 | |||||
Shares subject to the forward share purchase contract | (3,645,510 | ) | (3,645,510 | ) | (5,249,332 | ) | ||
Outstanding, less shares subject to the forward share purchase contract | 150,392,521 | 148,914,257 | 148,694,959 | |||||
In 2016, the Company repurchased 3,940,087 shares of common stock for approximately $374.1 million. Additionally, the Company net-share settled capped call options on its common stock and received 711,376 shares during 2016.
In November 2016, the Company issued 3,504,165 shares of common stock to settle the purchase contracts of the 2013 Equity Units.
In December 2015, the Company issued 2,869,169 shares of common stock to settle the conversion feature of the Convertible Preferred Stock issued and redeemed through a combination settlement.
See "Other Equity Arrangements" below for further details of the above transactions.
In March 2015, the Company entered into a forward share purchase contract with a financial institution counterparty for 3,645,510 shares of common stock. The contract obligates the Company to pay $350.0 million, plus an additional amount related to the forward component of the contract. In November 2016, the Company amended the settlement date to April 2019, or earlier at the Company's option. The reduction of common shares outstanding was recorded at the inception of the forward share purchase contract in March 2015 and factored into the calculation of weighted-average shares outstanding at that time.
In October 2014, the Company entered into a forward share purchase contract on its common stock. The contract obligated the Company to pay $150.0 million, plus an additional amount related to the forward component of the contract, to the financial institution counterparty not later than October 2016, or earlier at the Company’s option, for the 1,603,822 shares purchased. The reduction of common shares outstanding was recorded at the inception of the forward share purchase contract in October 2014 and factored into the calculation of weighted-average shares outstanding at that time. In October 2016, the Company physically settled the contract, receiving 1,603,822 shares for a settlement amount of $147.4 million. These shares are reflected as "Returned to treasury" in the table above.
COMMON STOCK RESERVED — Common stock shares reserved for issuance under various employee and director stock plans at December 30, 2017 and December 31, 2016 are as follows:
2017 | 2016 | ||||
Employee stock purchase plan | 1,745,939 | 1,936,093 | |||
Other stock-based compensation plans | 2,526,337 | 4,998,983 | |||
Total shares reserved | 4,272,276 | 6,935,076 | |||
PREFERRED STOCK PURCHASE RIGHTS — Prior to March 10, 2016, each outstanding share of common stock had a 1 share purchase right. Each purchase right could be exercised to purchase one two-hundredth of a share of Series A Junior Participating Preferred Stock at an exercise price of $220.00, subject to adjustment. The rights, which did not have voting rights, expired on March 10, 2016. There were no outstanding rights or shares of Series A Junior Participating Preferred Stock as of December 30, 2017.
85
STOCK-BASED COMPENSATION PLANS — The Company has stock-based compensation plans for salaried employees and non-employee members of the Board of Directors. The plans provide for discretionary grants of stock options, restricted stock units and other stock-based awards.
The plans are generally administered by the Compensation and Talent Development Committee of the Board of Directors, consisting of non-employee directors.
Stock Option Valuation Assumptions:
Stock options are granted at the fair market value of the Company’s stock on the date of grant and have a 10-year term. Generally, stock option grants vest ratably over 4 years from the date of grant.
The following describes how certain assumptions affecting the estimated fair value of stock options are determined: the dividend yield is computed as the annualized dividend rate at the date of grant divided by the strike price of the stock option; expected volatility is based on an average of the market implied volatility and historical volatility for the 5.25 year expected life; the risk-free interest rate is based on U.S. Treasury securities with maturities equal to the expected life of the option; and a seven percent forfeiture rate is assumed. The Company uses historical data in order to estimate forfeitures and holding period behavior for valuation purposes.
The fair value of stock option grants is estimated on the date of grant using the Black-Scholes option pricing model. The following weighted average assumptions were used to value grants made in 2017, 2016 and 2015.
2017 | 2016 | 2015 | |||||||||
Average expected volatility | 20.0 | % | 24.1 | % | 25.0 | % | |||||
Dividend yield | 1.5 | % | 2.0 | % | 2.0 | % | |||||
Risk-free interest rate | 2.2 | % | 2.0 | % | 1.9 | % | |||||
Expected term | 5.2 years | 5.3 years | 5.3 years | ||||||||
Fair value per option | $ | 30.71 | $ | 23.41 | $ | 21.94 | |||||
Weighted average vesting period | 2.9 years | 2.4 years | 2.8 years | ||||||||
Stock Options:
The number of stock options and weighted-average exercise prices as of December 30, 2017 are as follows:
Options | Price | |||||
Outstanding, beginning of year | 6,433,586 | $ | 86.33 | |||
Granted | 1,191,246 | 169.21 | ||||
Exercised | (945,473 | ) | 73.96 | |||
Forfeited | (117,955 | ) | 110.62 | |||
Outstanding, end of year | 6,561,404 | $ | 102.56 | |||
Exercisable, end of year | 3,937,798 | $ | 78.72 | |||
At December 30, 2017, the range of exercise prices on outstanding stock options was $30.03 to $168.78. Stock option expense was $21.3 million, $22.8 million and $16.7 million for the years ended December 30, 2017, December 31, 2016 and January 2, 2016, respectively. At December 30, 2017, the Company had $48.9 million of unrecognized pre-tax compensation expense for stock options. This expense will be recognized over the remaining vesting periods which are 1.9 years on a weighted average basis.
During 2017, the Company received $69.9 million in cash from the exercise of stock options. The related tax benefit from the exercise of these options was $25.8 million. During 2017, 2016 and 2015, the total intrinsic value of options exercised was $72.7 million, $35.9 million and $102.7 million, respectively. When options are exercised, the related shares are issued from treasury stock.
86
An excess tax benefit is generated on the extent to which the actual gain, or spread, an optionee receives upon exercise of an option exceeds the fair value determined at the grant date; that excess spread over the fair value of the option times the applicable tax rate represents the excess tax benefit. During 2017, the excess tax benefit arising from tax deductions in excess of recognized compensation cost totaled $18.3 million and was recorded in income tax expense due to the adoption of ASU 2016-09 in the first quarter of 2017. In 2016 and 2015, the excess tax benefits of $9.1 million and $21.2 million, respectively, were recorded in additional paid-in capital.
Outstanding and exercisable stock option information at December 30, 2017 follows:
Outstanding Stock Options | Exercisable Stock Options | ||||||||||||||||
Exercise Price Ranges | Options | Weighted- Average Remaining Contractual Life | Weighted- Average Exercise Price | Options | Weighted- Average Remaining Contractual Life | Weighted- Average Exercise Price | |||||||||||
$35.00 and below | 22,040 | 0.97 | $ | 33.11 | 22,040 | 0.97 | $ | 33.11 | |||||||||
$35.01 — 50.00 | 17,956 | 1.08 | 46.97 | 17,956 | 1.08 | 46.97 | |||||||||||
$50.01 — higher | 6,521,408 | 6.67 | 102.95 | 3,897,802 | 5.05 | 79.12 | |||||||||||
6,561,404 | 6.63 | $ | 102.56 | 3,937,798 | 5.01 | $ | 78.72 | ||||||||||
Compensation cost for new grants is recognized on a straight-line basis over the vesting period. The expense for retirement eligible employees (those aged 55 and over and with 10 or more years of service) is recognized by the date they become retirement eligible, as such employees may retain their options for the 10 year contractual term in the event they retire prior to the end of the vesting period stipulated in the grant.
As of December 30, 2017, the aggregate intrinsic value of stock options outstanding and stock options exercisable was $440.5 million and $358.2 million, respectively.
Employee Stock Purchase Plan:
The Employee Stock Purchase Plan (“ESPP”) enables eligible employees in the United States and Canada to subscribe at any time to purchase shares of common stock on a monthly basis at the lower of 85.0% of the fair market value of the shares on the grant date ($103.35 per share for fiscal year 2017 purchases) or 85.0% of the fair market value of the shares on the last business day of each month. A maximum of 6,000,000 shares are authorized for subscription. During 2017, 2016 and 2015, 190,154 shares, 168,233 shares and 182,039 shares, respectively, were issued under the plan at average prices of $103.35, $84.46, and $71.80 per share, respectively, and the intrinsic value of the ESPP purchases was $8.7 million, $4.8 million and $5.4 million, respectively. For 2017, the Company received $19.7 million in cash from ESPP purchases, and there was no related tax benefit. The fair value of ESPP shares was estimated using the Black-Scholes option pricing model. ESPP compensation cost is recognized ratably over the one-year term based on actual employee stock purchases under the plan. The fair value of the employees’ purchase rights under the ESPP was estimated using the following assumptions for 2017, 2016 and 2015, respectively: dividend yield of 1.8%, 2.1% and 2.2%; expected volatility of 21.0%, 20.0% and 19.0%; risk-free interest rates of 0.9%, 0.5%, and 0.1%; and expected lives of one year. The weighted-average fair value of those purchase rights granted in 2017, 2016 and 2015 was $35.70, $29.68 and $31.41, respectively. Total compensation expense recognized for ESPP amounted to $6.7 million for 2017, $4.7 million for 2016, and $5.4 million for 2015.
Restricted Share Units and Awards:
Compensation cost for restricted share units and awards, including restricted shares granted to French employees in lieu of RSUs, (collectively “RSUs”) granted to employees is recognized ratably over the vesting term, which varies but is generally 4 years. RSU grants totaled 304,976 shares, 445,155 shares and 349,768 shares in 2017, 2016 and 2015, respectively. The weighted-average grant date fair value of RSUs granted in 2017, 2016 and 2015 was $160.04, $118.20 and $107.43 per share, respectively.
Total compensation expense recognized for RSUs amounted to $31.7 million, $32.6 million and $30.9 million in 2017, 2016 and 2015, respectively. The actual tax benefit received in the period the shares were delivered was $14.7 million. The excess tax benefit recognized was $4.9 million, $2.4 million, and $7.0 million in 2017, 2016 and 2015, respectively. As of December 30, 2017, unrecognized compensation expense for RSUs amounted to $87.5 million and this cost will be recognized over a weighted-average period of 2.1 years.
87
A summary of non-vested restricted stock unit and award activity as of December 30, 2017, and changes during the twelve month period then ended is as follows:
Restricted Share Units & Awards | Weighted Average Grant Date Fair Value | |||||
Non-vested at December 31, 2016 | 1,132,024 | $ | 100.53 | |||
Granted | 304,976 | 160.04 | ||||
Vested | (290,980 | ) | 100.31 | |||
Forfeited | (61,345 | ) | 104.98 | |||
Non-vested at December 30, 2017 | 1,084,675 | $ | 121.89 | |||
The total fair value of shares vested (market value on the date vested) during 2017, 2016 and 2015 was $46.6 million, $37.0 million and $72.2 million, respectively.
Non-employee members of the Board of Directors received restricted share-based grants which must be cash settled and accordingly mark-to-market accounting is applied. The expense recognized for these awards amounted to $7.0 million, $2.2 million, and $2.1 million for 2017, 2016 and 2015, respectively. Additionally, the Board of Directors were granted restricted share units for which compensation expense of $1.0 million, $1.1 million, and $1.1 million was recognized for 2017, 2016 and 2015, respectively.
Long-Term Performance Awards:
The Company has granted Long-Term Performance Awards under its 2009 and 2013 Long Term Incentive Plans (“LTIP”) to senior management employees for achieving Company performance measures. Awards are payable in shares of common stock, which may be restricted if the employee has not achieved certain stock ownership levels, and generally no award is made if the employee terminates employment prior to the payout date. LTIP grants were made in 2015, 2016 and 2017. Each grant has separate annual performance goals for each year within the respective three year performance period. Earnings per share and cash flow return on investment represent 75% of the share payout of each grant. There is a third market-based element, representing 25% of the total grant, which measures the Company’s common stock return relative to peers over the performance period. The ultimate delivery of shares will occur in 2018, 2019 and 2020 for the 2015, 2016 and 2017 grants, respectively. Total payouts are based on actual performance in relation to these goals.
Expense recognized for these performance awards amounted to $18.0 million in 2017, $20.0 million in 2016, and $13.8 million in 2015. With the exception of the market-based award, in the event performance goals are not met, compensation cost is not recognized and any previously recognized compensation cost is reversed.
A summary of the activity pertaining to the maximum number of shares that may be issued is as follows:
Share Units | Weighted-Average Grant Date Fair Value | |||||
Non-vested at December 31, 2016 | 801,074 | $ | 84.03 | |||
Granted | 201,575 | 119.34 | ||||
Vested | (242,898 | ) | 75.13 | |||
Forfeited | (66,838 | ) | 80.12 | |||
Non-vested at December 30, 2017 | 692,913 | $ | 97.80 | |||
OTHER EQUITY ARRANGEMENTS
In November 2013, the Company purchased from certain financial institutions “out-of-the-money” capped call options on 12.2 million shares of its common stock (subject to customary anti-dilution adjustments) for an aggregate premium of $73.5 million, or an average of $6.03 per share. The purpose of the capped call options is to hedge the risk of stock price appreciation between the lower and upper strike prices of the capped call options for a future share repurchase. The premium paid was recorded as a reduction of Shareowners’ equity. The contracts for the options provide that they may, at the Company’s election, subject to certain conditions, be cash settled, physically settled, modified-physically settled, or net-share settled (the default settlement method). The capped call options had various expiration dates and initially had an average lower strike price of $86.07 and an average upper strike price of $106.56, subject to customary market adjustments. In February 2015, the Company net-share settled 9.1 million of the 12.2 million capped call options on its common stock and received 911,077 shares using an average reference price of $96.46 per common share. Additionally, the Company purchased directly from the counterparties
88
participating in the net-share settlement, 3,381,162 shares for $326.1 million, equating to an average price of $96.46 per share. In February 2016, the Company net-share settled the remaining 3.1 million capped call options on its common stock and received 293,142 shares using an average reference price of $94.34 per common share. Additionally, the Company purchased 1,316,858 shares directly from the counterparty participating in the net-share settlement for $124.2 million. The Company also repurchased 2,446,287 shares of common stock in February 2016 for $230.9 million, equating to an average price of $94.34.
Equity Units and Capped Call Transactions
As described more fully in Note H, Long-Term Debt and Financing Arrangements, in December 2013, the Company issued Equity Units comprised of $345.0 million of Notes and Equity Purchase Contracts. The Equity Purchase Contracts obligated the holders to purchase on November 17, 2016, for $100, between 1.0122 and 1.2399 shares of the Company’s common stock, which are equivalent to an initial settlement price of $98.80 and $80.65, respectively, per share of common stock.
In accordance with the Equity Purchase Contracts, on November 17, 2016, the Company issued 3,504,165 shares of common shares and received additional cash proceeds of $345.0 million. The conversion rate used in calculating the average of the daily volume-weighted average price of common stock during the market value averaging period, was 1.0157 (equivalent to the minimum settlement rate and a conversion price of $98.45 per common share) on November 17, 2016.
Contemporaneously with the issuance of the Equity Units described above, the Company paid $9.7 million, or an average of $2.77 per option, to enter into capped call transactions on 3.5 million shares of common stock with a major financial institution. The purpose of the capped call transactions is to offset the potential economic dilution associated with the common shares issuable upon the settlement of the Equity Purchase Contracts. Refer to Note H, Long-Term Debt and Financing Arrangements, for further discussion. The $9.7 million premium paid was recorded as a reduction to equity.
The capped call transactions cover, subject to customary anti-dilution adjustments, the number of shares equal to the number of shares issuable upon settlement of the Equity Purchase Contracts at the 1.0122 minimum settlement rate. In October and November 2016, the Company’s capped call options on its common stock expired and were net-share settled resulting in the Company receiving 418,234 shares using an average reference price of $117.84 per common share.
Convertible Preferred Units and Equity Option
As described more fully in Note H, Long-Term Debt and Financing Arrangements, in November 2010, the Company issued Convertible Preferred Units comprised of $632.5 million of Notes due November 17, 2018 and Purchase Contracts. The Purchase Contracts obligated the holders to purchase, on November 17, 2015, 6.3 million shares, for $100 per share, of the Company’s 4.75% Series B Cumulative Convertible Preferred Stock (the “Convertible Preferred Stock”).
In accordance with the Purchase Contracts, on November 17, 2015, the Company issued 6.3 million shares of Convertible Preferred Stock resulting in cash proceeds to the Company of $632.5 million. On November 18, 2015, the Company informed holders that it would redeem all outstanding shares of Convertible Preferred Stock on December 24, 2015 (the “Redemption Date”) at $100.49 per share in cash (the “Redemption Price”), which is equal to the liquidation preference of $100 per share of Convertible Preferred Stock, plus accrued and unpaid dividends thereon to, but excluding, the Redemption Date.
The Company settled all conversions on December 24, 2015 by paying cash for the $100 par value, or $632.5 million in total, and issuing 2.9 million common shares for the excess value of the conversion feature above the $100 face value per share of Convertible Preferred Stock. The conversion rates used in calculating the Daily Conversion during the observation period, were 1.3763 (equivalent to a conversion price set at $72.66 per common share) prior to December 2, 2015 and 1.3789 (equivalent to a conversion price set at $72.52 per common share) on and after December 2, 2015.
In November 2010, contemporaneously with the issuance of the Convertible Preferred Units described above, the Company paid $50.3 million, or an average of $5.97 per option, to enter into capped call transactions (equity options) on 8.4 million shares of common stock with certain major financial institutions. The purpose of the capped call transactions was to offset the common shares that may be deliverable upon conversion of shares of Convertible Preferred Stock. Refer to Note H, Long-Term Debt and Financing Arrangements, for further discussion. The $50.3 million premium paid was recorded as a reduction to equity.
The capped call transactions cover, subject to customary anti-dilution adjustments, the number of shares of common stock equal to the number of shares of common stock underlying the maximum number of shares of Convertible Preferred Stock issuable upon settlement of the Purchase Contracts. Each of the capped call transactions had a term of approximately five years and initially had a lower strike price of $75.00, which corresponded to the initial conversion price of the Convertible Preferred
89
Stock, and an upper strike price of $97.95, which was approximately 60% higher than the closing price of the common stock on November 1, 2010. On August 5, 2015, the Company net-share settled the capped call options on its common stock and received 1,692,778 shares using an average reference price of $103.97 per common share.
$750 Million Equity Units and Capped Call Transactions
In May 2017, the Company issued 7,500,000 Equity Units with a total notional value of $750.0 million (“$750 million Equity Units”). Each unit has a stated amount of $100 and initially consists of a three-year forward stock purchase contract (“2020 Purchase Contracts”) for the purchase of a variable number of shares of common stock, on May 15, 2020, for a price of $100, and a 10% beneficial ownership interest in one share of 0% Series C Cumulative Perpetual Convertible Preferred Stock, without par, with a liquidation preference of $1,000 per share (“Series C Preferred Stock”). The Company received approximately $727.5 million in cash proceeds from the $750 million Equity Units, net of underwriting costs and commissions, before offering expenses, and issued 750,000 shares of Series C Preferred Stock, recording $750.0 million in preferred stock. The proceeds were used for general corporate purposes, including repayment of short-term borrowings. The Company also used $25.1 million of the proceeds to enter into capped call transactions utilized to hedge potential economic dilution as described in more detail below.
Convertible Preferred Stock
In May 2017, the Company issued 750,000 shares of Series C Preferred Stock, without par, with a liquidation preference of $1,000 per share. The convertible preferred stock will initially not bear any dividends and the liquidation preference of the convertible preferred stock will not accrete. The convertible preferred stock has no maturity date, and will remain outstanding unless converted by holders or redeemed by the Company. Holders of shares of the convertible preferred stock will generally have no voting rights.
The Series C Preferred Stock is pledged as collateral to support holders’ purchase obligations under the 2020 Purchase Contracts and can be remarketed. In connection with any successful remarketing, the Company may (but is not required to) modify certain terms of the convertible preferred stock, including the dividend rate, the conversion rate, and the earliest redemption date. After any successful remarketing in connection with which the dividend rate on the convertible preferred stock is increased, the Company will pay cumulative dividends on the convertible preferred stock, if declared by the board of directors, quarterly in arrears from the applicable remarketing settlement date.
On and after May 15, 2020, the Series C Preferred Stock may be converted into common stock at the option of the holder. The initial conversion rate was 6.1627 shares of common stock per one share of Series C Preferred Stock, which is equivalent to an initial conversion price of approximately $162.27 per share of common stock. As of December 30, 2017, due to the customary anti-dilution provisions, the conversion rate was 6.1667, equivalent to a conversion price of approximately $162.16 per share of common stock. At the election of the Company, upon conversion, the Company may deliver cash, common stock, or a combination thereof.
The Company may not redeem the Series C Preferred Stock prior to June 22, 2020. At the election of the Company, on or after June 22, 2020, the Company may redeem for cash, all or any portion of the outstanding shares of the Series C Preferred Stock at a redemption price equal to 100% of the liquidation preference, plus any accumulated and unpaid dividends. If the Company calls the Series C Preferred Stock for redemption, holders may convert their shares immediately preceding the redemption date.
2020 Purchase Contracts
The 2020 Purchase Contracts obligate the holders to purchase, on May 15, 2020, for a price of $100 in cash, a maximum number of 5.4 million shares of the Company’s common stock (subject to customary anti-dilution adjustments). The 2020 Purchase Contract holders may elect to settle their obligation early, in cash. The Series C Preferred Stock is pledged as collateral to guarantee the holders’ obligations to purchase common stock under the terms of the 2020 Purchase Contracts. The initial settlement rate determining the number of shares that each holder must purchase will not exceed the maximum settlement rate, and is determined over a market value averaging period immediately preceding May 15, 2020.
The initial maximum settlement rate of 0.7241 was calculated using an initial reference price of $138.10, equal to the last reported sale price of the Company's common stock on May 11, 2017. As of December 30, 2017, due to the customary anti-dilution provisions, the maximum settlement rate was 0.7246, equivalent to a reference price of $138.01. If the applicable market value of the Company's common stock is less than or equal to the reference price, the settlement rate will be the maximum settlement rate; and if the applicable market value of common stock is greater than the reference price, the settlement rate will be a number of shares of the Company's common stock equal to $100 divided by the applicable market value. Upon settlement of the 2020 Purchase Contracts, the Company will receive additional cash proceeds of $750 million.
The Company will pay the holders of the 2020 Purchase Contracts quarterly payments (“Contract Adjustment Payments”) at a rate of 5.375% per annum, payable quarterly in arrears on February 15, May 15, August 15 and November 15, commencing August 15, 2017. The $117.1 million present value of the Contract Adjustment Payments reduced Shareowners’ Equity at inception. As each quarterly Contract Adjustment Payment is made, the related liability is reduced and the difference between
90
the cash payment and the present value will accrete to interest expense, approximately $1.3 million per year over the three-year term. As of December 30, 2017, the present value of the Contract Adjustment Payments was $97.8 million.
The holders can settle the purchase contracts early, for cash, subject to certain exceptions and conditions in the prospectus supplement. Upon early settlement of any purchase contracts, the Company will deliver the number of shares of its common stock equal to 85% of the number of shares of common stock that would have otherwise been deliverable.
Capped Call Transactions
In order to offset the potential economic dilution associated with the common shares issuable upon conversion of the Series C Preferred Stock, to the extent that the conversion value of the convertible preferred stock exceeds its liquidation preference, the Company entered into capped call transactions with three major financial institutions (the “counterparties”).
The capped call transactions have a term of approximately three years and are intended to cover the number of shares issuable upon conversion of the Series C Preferred Stock. Subject to customary anti-dilution adjustments, the capped call has an initial lower strike price of $162.27, which corresponds to the minimum 6.1627 settlement rate of the Series C Preferred Stock, and an upper strike price of $179.53, which is approximately 30% higher than the closing price of the Company's common stock on May 11, 2017. As of December 30, 2017, due to the customary anti-dilution provisions, the capped call transactions had an adjusted lower strike price of $162.16 and an adjusted upper strike price of $179.41.
The capped call transactions may be settled by net share settlement (the default settlement method) or, at the Company’s option and subject to certain conditions, cash settlement, physical settlement or modified physical settlement. The number of shares the Company will receive will be determined by the terms of the contracts using a volume-weighted average price calculation for the market value of the Company's common stock, over an averaging period. The market value determined will then be measured against the applicable strike price of the capped call transactions. The Company expects the capped call transactions to offset the potential dilution upon conversion of the Series C Preferred Stock if the calculated market value is greater than the lower strike price but less than or equal to the upper strike price of the capped call transactions. Should the calculated market value exceed the upper strike price of the capped call transactions, the dilution mitigation will be limited based on such capped value as determined under the terms of the contracts.
With respect to the impact on the Company, the capped call transactions and $750 million Equity Units, when taken together, result in the economic equivalent of having the conversion price on $750 million Equity Units at $179.41, the upper strike of the capped call as of December 30, 2017.
The Company paid $25.1 million, or an average of $5.43 per option, to enter into capped call transactions on 4.6 million shares of common stock. The $25.1 million premium paid was a reduction of Shareowners’ Equity. The aggregate fair value of the options at December 30, 2017 was $40.6 million.
K. ACCUMULATED OTHER COMPREHENSIVE LOSS
The following table summarizes the changes in the accumulated balances for each component of accumulated other comprehensive loss:
(Millions of Dollars) | Currency translation adjustment and other | Unrealized (losses) gains on cash flow hedges, net of tax | Unrealized gains (losses) on net investment hedges, net of tax | Pension (losses) gains, net of tax | Total | ||||||||||||||
Balance - January 2, 2016 | $ | (1,300.9 | ) | $ | (52.1 | ) | $ | 11.8 | $ | (353.0 | ) | $ | (1,694.2 | ) | |||||
Other comprehensive (loss) income before reclassifications | (285.4 | ) | 9.1 | 76.8 | (36.3 | ) | (235.8 | ) | |||||||||||
Reclassification adjustments to earnings | — | (3.3 | ) | — | 12.1 | 8.8 | |||||||||||||
Net other comprehensive (loss) income | (285.4 | ) | 5.8 | 76.8 | (24.2 | ) | (227.0 | ) | |||||||||||
Balance - December 31, 2016 | $ | (1,586.3 | ) | $ | (46.3 | ) | $ | 88.6 | $ | (377.2 | ) | $ | (1,921.2 | ) | |||||
Other comprehensive income (loss) before reclassifications | 476.6 | (71.0 | ) | (85.2 | ) | (19.1 | ) | 301.3 | |||||||||||
Adjustments related to sales of businesses | 4.7 | — | — | 2.6 | 7.3 | ||||||||||||||
Reclassification adjustments to earnings | — | 4.7 | — | 22.0 | 26.7 | ||||||||||||||
Net other comprehensive income (loss) | 481.3 | (66.3 | ) | (85.2 | ) | 5.5 | 335.3 | ||||||||||||
Balance - December 30, 2017 | $ | (1,105.0 | ) | $ | (112.6 | ) | $ | 3.4 | $ | (371.7 | ) | $ | (1,585.9 | ) | |||||
91
(Millions of Dollars) | 2017 | 2016 | ||||||||
Components of accumulated other comprehensive loss | Reclassification adjustments | Reclassification adjustments | Affected line item in Consolidated Statements of Operations | |||||||
Realized gains on cash flow hedges | $ | 8.4 | $ | 21.7 | Cost of sales | |||||
Realized losses on cash flow hedges | (15.1 | ) | (15.1 | ) | Interest Expense | |||||
Total before taxes | $ | (6.7 | ) | $ | 6.6 | |||||
Tax effect | 2.0 | (3.3 | ) | Income taxes on continuing operations | ||||||
Realized (loss) gain on cash flow hedges, net of tax | $ | (4.7 | ) | $ | 3.3 | |||||
Amortization of defined benefit pension items: | ||||||||||
Actuarial losses and prior service costs / credits | $ | (9.7 | ) | $ | (10.4 | ) | Cost of sales | |||
Actuarial losses and prior service costs / credits | (6.5 | ) | (6.9 | ) | Selling, general and administrative | |||||
Settlement loss (1) | (12.2 | ) | — | Pension Settlement | ||||||
Settlement losses (1) | (3.4 | ) | — | Other, net | ||||||
Total before taxes | (31.8 | ) | (17.3 | ) | ||||||
Tax effect | 9.8 | 5.2 | Income taxes on continuing operations | |||||||
Amortization of defined benefit pension items, net of tax | $ | (22.0 | ) | $ | (12.1 | ) | ||||
(1) Pension settlement losses are more fully discussed in Note L, Employee Benefit Plans.
L. EMPLOYEE BENEFIT PLANS
EMPLOYEE STOCK OWNERSHIP PLAN (“ESOP”) — Most U.S. employees may make contributions that do not exceed 25% of their eligible compensation to a tax-deferred 401(k) savings plan, subject to restrictions under tax laws. Employees generally direct the investment of their own contributions into various investment funds. An employer match benefit is provided under the plan equal to one-half of each employee’s tax-deferred contribution up to the first 7% of their compensation. Participants direct the entire employer match benefit such that no participant is required to hold the Company’s common stock in their 401(k) account. The employer match benefit totaled $24.8 million, $21.9 million and $21.1 million in 2017, 2016 and 2015, respectively. In addition to the regular employer match, $4.3 million was allocated to the employee's accounts for forfeitures and a surplus resulting from appreciation of the Company's share value in 2016. There was no additional allocation for 2017.
In addition, approximately 9,650 U.S. salaried and non-union hourly employees are eligible to receive a non-contributory benefit under the Core benefit plan. Core benefit allocations range from 2% to 6% of eligible employee compensation based on age. Core transition benefit allocations and additional Core transition benefit allocations were made under the plan for the years 2011-2015 for certain employees who were previously eligible for Cornerstone account allocations (the predecessor to the Core benefit plan) and certain employees who were previously eligible to accrue benefits under specified defined benefit plans. No Core transition benefit allocations or additional Core transition benefit allocations were made after December 31, 2015. Allocations for benefits earned under the Core plan were $25.4 million in 2017, $17.6 million in 2016 and $22.1 million in 2015. Assets held in participant Core accounts are invested in target date retirement funds which have an age-based allocation of investments.
Shares of the Company's common stock held by the ESOP were purchased with the proceeds of borrowings from the Company in 1991 ("1991 internal loan"). Shareowners' equity reflects a reduction equal to the cost basis of unearned (unallocated) shares purchased with the internal borrowings. In 2017, 2016 and 2015, the Company made additional contributions to the ESOP for $4.8 million, $7.9 million, and $7.2 million, respectively, which were used by the ESOP to make additional payments on the 1991 internal loan. These payments triggered the release of 133,694, 219,492 and 184,753 shares of unallocated stock, respectively.
Net ESOP activity recognized is comprised of the cost basis of shares released, the cost of the aforementioned Core and 401(k) match defined contribution benefits, less the fair value of shares released and dividends on unallocated ESOP shares. The Company’s net ESOP activity resulted in expense of $1.3 million in 2017, income of $3.1 million in 2016 and expense of $0.8 million in 2015. ESOP expense is affected by the market value of the Company’s common stock on the monthly dates when
92
shares are released. The weighted-average market value of shares released was $138.60 per share in 2017, $103.88 per share in 2016 and $99.60 per share in 2015.
Unallocated shares are released from the trust based on current period debt principal and interest payments as a percentage of total future debt principal and interest payments. Dividends on both allocated and unallocated shares may be used for debt service and to credit participant accounts for dividends earned on allocated shares. Dividends paid on the shares acquired with the 1991 internal loan were used solely to pay internal loan debt service in all periods. Dividends on ESOP shares, which are charged to shareowners’ equity as declared, were $8.4 million in 2017, $9.0 million in 2016 and $9.7 million in 2015, net of the tax benefit which is recorded in earnings in 2017 and within equity for 2016 and 2015. Dividends on ESOP shares were utilized entirely for debt service in all years. Interest costs incurred by the ESOP on the 1991 internal loan, which have no earnings impact, were $2.2 million, $3.1 million and $3.8 million for 2017, 2016 and 2015, respectively. Both allocated and unallocated ESOP shares are treated as outstanding for purposes of computing earnings per share. As of December 30, 2017, the cumulative number of ESOP shares allocated to participant accounts was 14,527,070, of which participants held 2,252,098 shares, and the number of unallocated shares was 1,014,287. At December 30, 2017, there were 20,665 released shares in the ESOP trust holding account pending allocation. The Company made cash contributions totaling $1.8 million in 2017, $4.2 million in 2016 and $4.4 million in 2015 excluding additional contributions of $4.8 million, $7.9 million and $7.2 million in 2017, 2016 and 2015, respectively, as discussed previously.
PENSION AND OTHER BENEFIT PLANS — The Company sponsors pension plans covering most domestic hourly and certain executive employees, and approximately 16,200 foreign employees. Benefits are generally based on salary and years of service, except for U.S. collective bargaining employees whose benefits are based on a stated amount for each year of service.
The Company contributes to a number of multi-employer plans for certain collective bargaining U.S. employees. The risks of participating in these multiemployer plans are different from single-employer plans in the following aspects:
a. Assets contributed to the multiemployer plan by one employer may be used to provide benefit to employees of other participating employers.
b. If a participating employer stops contributing to the plan, the unfunded obligations of the plan may be inherited by the remaining participating employers.
c. If the Company chooses to stop participating in some of its multiemployer plans, the Company may be required to pay those plans an amount based on the underfunded status of the plan, referred to as a withdrawal liability.
In addition, the Company also contributes to a number of multiemployer plans outside of the U.S. The foreign plans are insured, therefore, the Company’s obligation is limited to the payment of insurance premiums.
The Company has assessed and determined that none of the multiemployer plans to which it contributes are individually significant to the Company’s financial statements. The Company does not expect to incur a withdrawal liability or expect to significantly increase its contributions over the remainder of the contract period.
In addition to the multiemployer plans, various other defined contribution plans are sponsored worldwide.
The expense for such defined contribution plans, aside from the earlier discussed ESOP plans, is as follows:
(Millions of Dollars) | 2017 | 2016 | 2015 | ||||||||
Multi-employer plan expense | $ | 7.2 | $ | 5.1 | $ | 4.0 | |||||
Other defined contribution plan expense | $ | 27.5 | $ | 15.4 | $ | 11.7 | |||||
The components of net periodic pension (benefit) expense are as follows:
U.S. Plans | Non-U.S. Plans | ||||||||||||||||||||||
(Millions of Dollars) | 2017 | 2016 | 2015 | 2017 | 2016 | 2015 | |||||||||||||||||
Service cost | $ | 8.7 | $ | 9.4 | $ | 7.0 | $ | 13.7 | $ | 12.5 | $ | 14.4 | |||||||||||
Interest cost | 43.2 | 45.3 | 54.0 | 29.1 | 37.0 | 46.8 | |||||||||||||||||
Expected return on plan assets | (64.4 | ) | (67.9 | ) | (74.9 | ) | (45.5 | ) | (44.5 | ) | (56.5 | ) | |||||||||||
Amortization of prior service cost (credit) | 1.1 | 5.2 | 1.8 | (1.2 | ) | 0.3 | 0.9 | ||||||||||||||||
Actuarial loss amortization | 8.3 | 7.1 | 7.2 | 9.4 | 5.9 | 7.5 | |||||||||||||||||
Settlement / curtailment loss | 2.9 | — | — | 12.7 | 0.7 | 1.5 | |||||||||||||||||
Net periodic pension (benefit) expense | $ | (0.2 | ) | $ | (0.9 | ) | $ | (4.9 | ) | $ | 18.2 | $ | 11.9 | $ | 14.6 | ||||||||
93
The Company provides medical and dental benefits for certain retired employees in the United States and Canada. Approximately 13,800 participants are covered under these plans. Net periodic post-retirement benefit expense was comprised of the following elements:
Other Benefit Plans | |||||||||||
(Millions of Dollars) | 2017 | 2016 | 2015 | ||||||||
Service cost | $ | 0.6 | $ | 0.6 | $ | 0.5 | |||||
Interest cost | 1.7 | 1.7 | 2.1 | ||||||||
Amortization of prior service credit | (1.4 | ) | (1.2 | ) | (1.3 | ) | |||||
Net periodic post-retirement expense | $ | 0.9 | $ | 1.1 | $ | 1.3 | |||||
In the first quarter of 2016, the Company changed the method used to estimate the service and interest cost components of net periodic pension (benefit) expense. The new estimation method uses a full yield curve approach by applying specific spot rates along the yield curve used in the determination of the pension benefit obligation, to their underlying projected cash flows, and provides a more precise measurement of the service and interest cost components. Previously, the Company used a single weighted average discount rate derived from the corresponding yield curve used to measure the pension benefit obligation. The change is applied prospectively as a change in estimate that is inseparable from a change in accounting principle and reduced service and interest cost for the year ended December 31, 2016 by approximately $13.9 million.
For the year ended December 30, 2017, the Company recorded pre-tax charges of approximately $12.2 million, reflecting losses previously reported in accumulated other comprehensive loss, related to a non-U.S. pension plan for which the Company settled its obligation by purchasing an annuity and making lump sum payments to participants. Also, in accordance with policy, $2.9 million and $0.5 million in pre-tax settlement and curtailment losses were recorded for other U.S. and non-U.S. plans respectively, due to standard lump sum benefit payments elected exceeding the sum of service cost and interest cost.
Changes in plan assets and benefit obligations recognized in accumulated other comprehensive loss in 2017 are as follows:
(Millions of Dollars) | 2017 | ||
Current year actuarial gain | $ | (2.2 | ) |
Amortization of actuarial loss | (16.2 | ) | |
Prior service cost from plan amendments | 0.5 | ||
Settlement / curtailment loss | (15.6 | ) | |
Currency / other | 25.7 | ||
Total decrease recognized in accumulated other comprehensive loss (pre-tax) | $ | (7.8 | ) |
94
The amounts in Accumulated other comprehensive loss expected to be recognized as components of net periodic benefit costs during 2018 total $15.2 million, representing amortization of actuarial losses.
The changes in the pension and other post-retirement benefit obligations, fair value of plan assets, as well as amounts recognized in the Consolidated Balance Sheets, are shown below.
U.S. Plans | Non-U.S. Plans | Other Benefits | |||||||||||||||||||||
(Millions of Dollars) | 2017 | 2016 | 2017 | 2016 | 2017 | 2016 | |||||||||||||||||
Change in benefit obligation | |||||||||||||||||||||||
Benefit obligation at end of prior year | $ | 1,359.0 | $ | 1,385.7 | $ | 1,359.8 | $ | 1,374.2 | $ | 54.2 | $ | 61.0 | |||||||||||
Service cost | 8.7 | 9.4 | 13.7 | 12.5 | 0.6 | 0.6 | |||||||||||||||||
Interest cost | 43.2 | 45.3 | 29.1 | 37.0 | 1.7 | 1.7 | |||||||||||||||||
Settlements/curtailments | (16.7 | ) | — | (35.9 | ) | (5.7 | ) | — | — | ||||||||||||||
Actuarial loss (gain) | 98.1 | 41.5 | 11.4 | 229.7 | (2.1 | ) | (0.7 | ) | |||||||||||||||
Plan amendments | 0.5 | 1.8 | — | (40.4 | ) | — | (0.8 | ) | |||||||||||||||
Foreign currency exchange rates | — | — | 136.0 | (190.0 | ) | 0.7 | 0.3 | ||||||||||||||||
Participant contributions | — | — | 0.3 | 0.3 | — | — | |||||||||||||||||
Expenses paid from assets and other | (7.0 | ) | (5.5 | ) | (11.6 | ) | (2.0 | ) | 2.1 | — | |||||||||||||
Benefits paid | (120.5 | ) | (119.2 | ) | (56.7 | ) | (55.8 | ) | (4.9 | ) | (7.9 | ) | |||||||||||
Benefit obligation at end of year | $ | 1,365.3 | $ | 1,359.0 | $ | 1,446.1 | $ | 1,359.8 | $ | 52.3 | $ | 54.2 | |||||||||||
Change in plan assets | |||||||||||||||||||||||
Fair value of plan assets at end of prior year | $ | 1,067.1 | $ | 1,081.5 | $ | 1,015.3 | $ | 1,047.3 | $ | — | $ | — | |||||||||||
Actual return on plan assets | 153.5 | 90.9 | 63.5 | 169.4 | — | — | |||||||||||||||||
Participant contributions | — | — | 0.3 | 0.3 | — | — | |||||||||||||||||
Employer contributions | 37.6 | 19.4 | 24.0 | 29.5 | 4.9 | 7.9 | |||||||||||||||||
Settlements | (16.7 | ) | — | (35.9 | ) | (5.5 | ) | — | — | ||||||||||||||
Foreign currency exchange rate changes | — | — | 96.4 | (167.9 | ) | — | — | ||||||||||||||||
Expenses paid from assets and other | (6.9 | ) | (5.5 | ) | (7.7 | ) | (2.0 | ) | — | — | |||||||||||||
Benefits paid | (120.5 | ) | (119.2 | ) | (56.7 | ) | (55.8 | ) | (4.9 | ) | (7.9 | ) | |||||||||||
Fair value of plan assets at end of plan year | $ | 1,114.1 | $ | 1,067.1 | $ | 1,099.2 | $ | 1,015.3 | $ | — | $ | — | |||||||||||
Funded status — assets less than benefit obligation | $ | (251.2 | ) | $ | (291.9 | ) | $ | (346.9 | ) | $ | (344.5 | ) | $ | (52.3 | ) | $ | (54.2 | ) | |||||
Unrecognized prior service cost (credit) | 5.2 | 5.8 | (37.0 | ) | (35.0 | ) | (4.8 | ) | (6.2 | ) | |||||||||||||
Unrecognized net actuarial loss | 264.9 | 267.2 | 294.7 | 296.7 | (1.7 | ) | 0.5 | ||||||||||||||||
Unrecognized net transition obligation | — | — | — | 0.1 | — | — | |||||||||||||||||
Net amount recognized | $ | 18.9 | $ | (18.9 | ) | $ | (89.2 | ) | $ | (82.7 | ) | $ | (58.8 | ) | $ | (59.9 | ) | ||||||
95
U.S. Plans | Non-U.S. Plans | Other Benefits | |||||||||||||||||||||
(Millions of Dollars) | 2017 | 2016 | 2017 | 2016 | 2017 | 2016 | |||||||||||||||||
Amounts recognized in the Consolidated Balance Sheets | |||||||||||||||||||||||
Prepaid benefit cost (non-current) | $ | — | $ | — | $ | 1.8 | $ | 0.2 | $ | — | $ | — | |||||||||||
Current benefit liability | (8.2 | ) | (25.8 | ) | (8.9 | ) | (10.0 | ) | (5.2 | ) | (5.9 | ) | |||||||||||
Non-current benefit liability | (243.0 | ) | (266.1 | ) | (339.8 | ) | (334.7 | ) | (47.1 | ) | (48.3 | ) | |||||||||||
Net liability recognized | $ | (251.2 | ) | $ | (291.9 | ) | $ | (346.9 | ) | $ | (344.5 | ) | $ | (52.3 | ) | $ | (54.2 | ) | |||||
Accumulated other comprehensive loss (pre-tax): | |||||||||||||||||||||||
Prior service cost (credit) | $ | 5.2 | $ | 5.8 | $ | (37.0 | ) | $ | (35.0 | ) | $ | (4.8 | ) | $ | (6.2 | ) | |||||||
Actuarial loss (gain) | 264.9 | 267.2 | 294.7 | 296.7 | (1.7 | ) | 0.5 | ||||||||||||||||
Transition liability | — | — | — | 0.1 | — | — | |||||||||||||||||
$ | 270.1 | $ | 273.0 | $ | 257.7 | $ | 261.8 | $ | (6.5 | ) | $ | (5.7 | ) | ||||||||||
Net amount recognized | $ | 18.9 | $ | (18.9 | ) | $ | (89.2 | ) | $ | (82.7 | ) | $ | (58.8 | ) | $ | (59.9 | ) | ||||||
The accumulated benefit obligation for all defined benefit pension plans was $2.754 billion at December 30, 2017 and $2.667 billion at December 31, 2016. Information regarding pension plans in which accumulated benefit obligations exceed plan assets follows:
U.S. Plans | Non-U.S. Plans | ||||||||||||||
(Millions of Dollars) | 2017 | 2016 | 2017 | 2016 | |||||||||||
Projected benefit obligation | $ | 1,365.3 | $ | 1,359.0 | $ | 1,415.9 | $ | 1,334.1 | |||||||
Accumulated benefit obligation | $ | 1,358.4 | $ | 1,353.0 | $ | 1,368.7 | $ | 1,290.7 | |||||||
Fair value of plan assets | $ | 1,114.1 | $ | 1,067.1 | $ | 1,068.5 | $ | 990.5 | |||||||
Information regarding pension plans in which projected benefit obligations (inclusive of anticipated future compensation increases) exceed plan assets follows:
U.S. Plans | Non-U.S. Plans | ||||||||||||||
(Millions of Dollars) | 2017 | 2016 | 2017 | 2016 | |||||||||||
Projected benefit obligation | $ | 1,365.3 | $ | 1,359.0 | $ | 1,445.1 | $ | 1,359.0 | |||||||
Accumulated benefit obligation | $ | 1,358.4 | $ | 1,353.0 | $ | 1,395.1 | $ | 1,313.2 | |||||||
Fair value of plan assets | $ | 1,114.1 | $ | 1,067.1 | $ | 1,096.5 | $ | 1,014.4 | |||||||
The major assumptions used in valuing pension and post-retirement plan obligations and net costs were as follows:
Pension Benefits | ||||||||||||||||||||||||||
U.S. Plans | Non-U.S. Plans | Other Benefits | ||||||||||||||||||||||||
2017 | 2016 | 2015 | 2017 | 2016 | 2015 | 2017 | 2016 | 2015 | ||||||||||||||||||
Weighted-average assumptions used to determine benefit obligations at year end: | ||||||||||||||||||||||||||
Discount rate | 3.53 | % | 3.95 | % | 4.25 | % | 2.24 | % | 2.38 | % | 3.25 | % | 3.53 | % | 3.51 | % | 3.75 | % | ||||||||
Rate of compensation increase | 3.00 | % | 3.00 | % | 6.00 | % | 3.45 | % | 3.63 | % | 3.25 | % | 3.50 | % | 3.50 | % | 3.50 | % | ||||||||
Weighted-average assumptions used to determine net periodic benefit cost: | ||||||||||||||||||||||||||
Discount rate* | 3.75 | % | 3.25 | % | 3.25 | % | ||||||||||||||||||||
Discount rate - service cost | 4.10 | % | 4.32 | % | 2.27 | % | 2.54 | % | 4.53 | % | 4.27 | % | ||||||||||||||
Discount rate - interest cost | 3.30 | % | 3.39 | % | 2.31 | % | 2.94 | % | 2.93 | % | 2.94 | % | ||||||||||||||
Rate of compensation increase | 3.00 | % | 6.00 | % | 6.00 | % | 3.63 | % | 3.24 | % | 3.50 | % | 3.50 | % | 3.50 | % | 3.50 | % | ||||||||
Expected return on plan assets | 6.25 | % | 6.50 | % | 6.50 | % | 4.41 | % | 4.68 | % | 5.25 | % | ||||||||||||||
96
*As mentioned above under net periodic pension (benefit) expense, in 2015 the Company used a single weighted-average discount rate derived from the corresponding yield curve used to measure the pension benefit obligation. The 2016 and 2017 weighted-average assumptions represent a more precise measurement due to the change in method used to estimate the service and interest cost components.
The expected rate of return on plan assets is determined considering the returns projected for the various asset classes and the relative weighting for each asset class. The Company will use a 5.30% weighted-average expected rate of return assumption to determine the 2018 net periodic benefit cost.
PENSION PLAN ASSETS — Plan assets are invested in equity securities, government and corporate bonds and other fixed income securities, money market instruments and insurance contracts. The Company’s worldwide asset allocations at December 30, 2017 and December 31, 2016 by asset category and the level of the valuation inputs within the fair value hierarchy established by ASC 820 are as follows:
Asset Category (Millions of Dollars) | 2017 | Level 1 | Level 2 | ||||||||
Cash and cash equivalents | $ | 42.0 | $ | 19.5 | $ | 22.5 | |||||
Equity securities | |||||||||||
U.S. equity securities | 342.8 | 103.5 | 239.3 | ||||||||
Foreign equity securities | 329.3 | 111.8 | 217.5 | ||||||||
Fixed income securities | |||||||||||
Government securities | 707.8 | 213.3 | 494.5 | ||||||||
Corporate securities | 698.3 | — | 698.3 | ||||||||
Insurance contracts | 39.2 | — | 39.2 | ||||||||
Other | 53.9 | — | 53.9 | ||||||||
Total | $ | 2,213.3 | $ | 448.1 | $ | 1,765.2 | |||||
Asset Category (Millions of Dollars) | 2016 | Level 1 | Level 2 | ||||||||
Cash and cash equivalents | $ | 50.8 | $ | 35.3 | $ | 15.5 | |||||
Equity securities | |||||||||||
U.S. equity securities | 303.8 | 100.7 | 203.1 | ||||||||
Foreign equity securities | 254.1 | 75.8 | 178.3 | ||||||||
Fixed income securities | |||||||||||
Government securities | 687.0 | 227.0 | 460.0 | ||||||||
Corporate securities | 687.9 | — | 687.9 | ||||||||
Insurance contracts | 35.0 | — | 35.0 | ||||||||
Other | 63.8 | — | 63.8 | ||||||||
Total | $ | 2,082.4 | $ | 438.8 | $ | 1,643.6 | |||||
U.S. and foreign equity securities primarily consist of companies with large market capitalizations and to a lesser extent mid and small capitalization securities. Government securities primarily consist of U.S. Treasury securities and foreign government securities with de minimus default risk. Corporate fixed income securities include publicly traded U.S. and foreign investment grade and to a small extent high yield securities. Assets held in insurance contracts are invested in the general asset pools of the various insurers, mainly debt and equity securities with guaranteed returns. Other investments include diversified private equity holdings. The level 2 investments are primarily comprised of institutional mutual funds that are not publicly traded; the investments held in these mutual funds are generally level 1 publicly traded securities.
The Company's investment strategy for pension assets focuses on a liability-matching approach with gradual de-risking taking place over a period of many years. The Company utilizes the current funded status to transition the portfolio toward investments that better match the duration and cash flow attributes of the underlying liabilities. Assets approximating 50% of the Company's current pension liabilities have been invested in fixed income securities, using a liability / asset matching duration strategy, with the primary goal of mitigating exposure to interest rate movements and preserving the overall funded status of the underlying plans. Plan assets are broadly diversified and are invested to ensure adequate liquidity for immediate and medium term benefit payments. The Company’s target asset allocations include 25%-45% in equity securities, 50%-70% in fixed income securities and up to 10% in other securities. In 2017, the funded status percentage (total plan assets divided by total projected benefit obligation) of all global pension plans was 79%, improved from 77% in 2016 and 2015.
97
CONTRIBUTIONS — The Company’s funding policy for its defined benefit plans is to contribute amounts determined annually on an actuarial basis to provide for current and future benefits in accordance with federal law and other regulations. The Company expects to contribute approximately $41 million to its pension and other post-retirement benefit plans in 2018.
EXPECTED FUTURE BENEFIT PAYMENTS — Benefit payments, inclusive of amounts attributable to estimated future employee service, are expected to be paid as follows over the next 10 years:
(Millions of Dollars) | Total | Year 1 | Year 2 | Year 3 | Year 4 | Year 5 | Years 6-10 | |||||||||||||||||||||
Future payments | $ | 1,414.4 | $ | 138.2 | $ | 137.5 | $ | 140.1 | $ | 142.5 | $ | 140.9 | $ | 715.2 | ||||||||||||||
These benefit payments will be funded through a combination of existing plan assets, the returns on those assets, and amounts to be contributed in the future by the Company.
HEALTH CARE COST TRENDS — The weighted average annual assumed rate of increase in the per-capita cost of covered benefits (i.e., health care cost trend rate) is assumed to be 7.0% for 2018, reducing gradually to 4.6% by 2028 and remaining at that level thereafter. A one percentage point change in the assumed health care cost trend rate would affect the post-retirement benefit obligation as of December 30, 2017 by approximately $1.9 million to $2.2 million, and would have an immaterial effect on the net periodic post-retirement benefit cost.
M. FAIR VALUE MEASUREMENTS
FASB ASC 820, Fair Value Measurement, defines, establishes a consistent framework for measuring, and expands disclosure requirements about fair value. ASC 820 requires the Company to maximize the use of observable inputs and minimize the use of unobservable inputs when measuring fair value. Observable inputs reflect market data obtained from independent sources, while unobservable inputs reflect the Company’s market assumptions. These two types of inputs create the following fair value hierarchy:
Level 1 — Quoted prices for identical instruments in active markets.
Level 2 — Quoted prices for similar instruments in active markets; quoted prices for identical or similar instruments in markets that are not active; and model-derived valuations whose inputs and significant value drivers are observable.
Level 3 — Instruments that are valued using unobservable inputs.
The Company holds various derivative financial instruments that are employed to manage risks, including foreign currency and interest rate exposures. These financial instruments are carried at fair value and are included within the scope of ASC 820. The Company determines the fair value of derivatives through the use of matrix or model pricing, which utilizes observable inputs such as market interest and currency rates. When determining the fair value of these financial instruments for which Level 1 evidence does not exist, the Company considers various factors including the following: exchange or market price quotations of similar instruments, time value and volatility factors, the Company’s own credit rating and the credit rating of the counter-party.
The following table presents the Company’s financial assets and liabilities that are measured at fair value on a recurring basis for each of the hierarchy levels:
(Millions of Dollars) | Total Carrying Value | Level 1 | Level 2 | Level 3 | |||||||||||
December 30, 2017 | |||||||||||||||
Money market fund | $ | 11.6 | $ | 11.6 | $ | — | $ | — | |||||||
Derivative assets | $ | 18.0 | $ | — | $ | 18.0 | $ | — | |||||||
Derivative liabilities | $ | 114.0 | $ | — | $ | 114.0 | $ | — | |||||||
Contingent consideration liability | $ | 114.0 | $ | — | $ | — | $ | 114.0 | |||||||
December 31, 2016 | |||||||||||||||
Money market fund | $ | 4.3 | $ | 4.3 | $ | — | $ | — | |||||||
Derivative assets | $ | 110.2 | $ | — | $ | 110.2 | $ | — | |||||||
Derivative liabilities | $ | 97.6 | $ | — | $ | 97.6 | $ | — | |||||||
98
The following table presents the carrying values and fair values of the Company's financial assets and liabilities, as well as the Company's debt, as of December 30, 2017 and December 31, 2016:
December 30, 2017 | December 31, 2016 | ||||||||||||||
(Millions of Dollars) | Carrying Value | Fair Value | Carrying Value | Fair Value | |||||||||||
Other investments | $ | 7.6 | $ | 7.9 | $ | 8.9 | $ | 9.2 | |||||||
Derivative assets | $ | 18.0 | $ | 18.0 | $ | 110.2 | $ | 110.2 | |||||||
Derivative liabilities | $ | 114.0 | $ | 114.0 | $ | 97.6 | $ | 97.6 | |||||||
Long-term debt, including current portion | $ | 3,826.4 | $ | 4,012.0 | $ | 3,823.1 | $ | 3,967.4 | |||||||
As discussed in Note E, Acquisitions, the Company recorded a contingent consideration liability relating to the Craftsman brand acquisition representing the Company's obligation to make future payments to Sears Holdings of between 2.5% and 3.5% on sales of Craftsman products in new Stanley Black & Decker channels through March 2032, which was valued at $114.0 million as of the acquisition date. The first payment is due the first quarter of 2020 relating to royalties owed for the previous eleven quarters, and future payments will be due quarterly through the first quarter of 2032. The estimated fair value was determined using a discounted cash flow analysis based on future sales projections and contractual royalty rates. A 100 basis point reduction in the discount rate would have resulted in an increase to the liability of approximately $8 million. The liability may fluctuate in the future if there are changes to sales projections or the discount rate as a result of actual sales levels or changes in market conditions. There was no significant change in the fair value of the contingent consideration as of December 30, 2017.
The Company had no significant non-recurring fair value measurements, nor any other financial assets or liabilities measured using Level 3 inputs, during 2017 or 2016.
The money market fund and other investments related to the West Coast Loading Corporation ("WCLC") trust are considered Level 1 instruments within the fair value hierarchy. The long-term debt instruments are considered Level 2 instruments and are measured using a discounted cash flow analysis based on the Company’s marginal borrowing rates. The differences between the carrying values and fair values of long-term debt are attributable to the stated interest rates differing from the Company's marginal borrowing rates. The fair values of the Company's variable rate short-term borrowings approximate their carrying values at December 30, 2017 and December 31, 2016. The fair values of foreign currency and interest rate swap agreements, comprising the derivative assets and liabilities in the table above, are based on current settlement values.
As discussed in Note B, Accounts and Notes Receivable, the Company had a deferred purchase price receivable related to sales of trade receivables. The deferred purchase price receivable was settled in full in January 2018, and historically was repaid in cash as receivables were collected, generally within 30 days. As such, the carrying value of the receivable as of December 30, 2017 and December 31, 2016 approximated fair value.
Refer to Note I, Financial Instruments, for more details regarding derivative financial instruments, Note S, Contingencies, for more details regarding the other investments related to the WCLC trust, and Note H, Long-Term Debt and Financing Arrangements, for more information regarding the carrying values of the long-term debt.
N. OTHER COSTS AND EXPENSES
Other, net is primarily comprised of intangible asset amortization expense (see Note F, Goodwill and Intangible Assets), currency-related gains or losses, environmental remediation expense and acquisition-related transaction and consulting costs. Acquisition-related transaction and consulting costs of $58.2 million were included in Other, net for the year ended December 30, 2017.
Research and development costs, which are classified in SG&A, were $252.3 million, $204.4 million and $188.0 million for fiscal years 2017, 2016 and 2015, respectively. The increase in 2017 reflects the Company's continued focus on growth investments and its commitment to the SFS 2.0 Breakthrough Innovation initiative.
O. RESTRUCTURING CHARGES AND ASSET IMPAIRMENTS
A summary of the restructuring reserve activity from December 31, 2016 to December 30, 2017 is as follows:
99
(Millions of Dollars) | December 31, 2016 | Net Additions | Usage | Currency | December 30, 2017 | ||||||||||||||
Severance and related costs | $ | 21.4 | $ | 40.6 | $ | (43.8 | ) | $ | 1.8 | $ | 20.0 | ||||||||
Facility closures and asset impairments | 14.2 | 10.9 | (22.1 | ) | 0.2 | 3.2 | |||||||||||||
Total | $ | 35.6 | $ | 51.5 | $ | (65.9 | ) | $ | 2.0 | $ | 23.2 | ||||||||
During 2017, the Company recognized net restructuring charges and asset impairments of $51.5 million. This amount reflects $40.6 million of net severance charges associated with the reduction of 1,584 employees and $10.9 million of facility closure and other restructuring costs.
The majority of the $23.2 million of reserves remaining as of December 30, 2017 is expected to be utilized within the next twelve months.
Segments: The $52 million of net restructuring charges and asset impairments for the year ended December 30, 2017 includes: $25 million of net charges pertaining to the Tools & Storage segment; $8 million of net charges pertaining to the Industrial segment; $18 million of net charges pertaining to the Security segment; and $1 million of net charges pertaining to Corporate.
P. BUSINESS SEGMENTS AND GEOGRAPHIC AREAS
The Company classifies its business into three reportable segments, which also represent its operating segments: Tools & Storage, Industrial and Security.
The Tools & Storage segment is comprised of the Power Tools & Equipment ("PTE") and Hand Tools, Accessories & Storage ("HTAS") businesses. The PTE business includes both professional and consumer products. Professional products include professional grade corded and cordless electric power tools and equipment including drills, impact wrenches and drivers, grinders, saws, routers and sanders, as well as pneumatic tools and fasteners including nail guns, nails, staplers and staples, concrete and masonry anchors. Consumer products include corded and cordless electric power tools sold primarily under the BLACK+DECKER® brand, lawn and garden products, including hedge trimmers, string trimmers, lawn mowers, edgers and related accessories, and home products such as hand-held vacuums, paint tools and cleaning appliances. The HTAS business sells hand tools, power tool accessories and storage products. Hand tools include measuring, leveling and layout tools, planes, hammers, demolition tools, clamps, vises, knives, saws, chisels and industrial and automotive tools. Power tool accessories include drill bits, screwdriver bits, router bits, abrasives, saw blades and threading products. Storage products include tool boxes, sawhorses, medical cabinets and engineered storage solution products.
The Industrial segment is comprised of the Engineered Fastening and Infrastructure businesses. The Engineered Fastening business primarily sells engineered fastening products and systems designed for specific applications. The product lines include blind rivets and tools, blind inserts and tools, drawn arc weld studs and systems, engineered plastic and mechanical fasteners, self-piercing riveting systems, precision nut running systems, micro fasteners, and high-strength structural fasteners. The Infrastructure business consists of the Oil & Gas and Hydraulics businesses. The Oil & Gas business sells and rents custom pipe handling, joint welding and coating equipment used in the construction of large and small diameter pipelines, and provides pipeline inspection services. The Hydraulics business sells hydraulic tools and accessories.
The Security segment is comprised of the Convergent Security Solutions ("CSS") and Mechanical Access Solutions ("MAS") businesses. The CSS business designs, supplies and installs commercial electronic security systems and provides electronic security services, including alarm monitoring, video surveillance, fire alarm monitoring, systems integration and system maintenance. Purchasers of these systems typically contract for ongoing security systems monitoring and maintenance at the time of initial equipment installation. The business also sells healthcare solutions, which include asset tracking, infant protection, pediatric protection, patient protection, wander management, fall management, and emergency call products. The MAS business primarily sells automatic doors.
The Company utilizes segment profit, which is defined as net sales minus cost of sales and SG&A inclusive of the provision for doubtful accounts (aside from corporate overhead expense), and segment profit as a percentage of net sales to assess the profitability of each segment. Segment profit excludes the corporate overhead expense element of SG&A, interest income, interest expense, other, net (inclusive of intangible asset amortization expense), restructuring charges and asset impairments, gain on sales of businesses, pension settlement and income taxes. Refer to Note O, Restructuring Charges and Asset Impairments, for the amount of net restructuring charges by segment, and Note F, Goodwill and Intangible Assets, for intangible asset amortization expense by segment. Corporate overhead is comprised of world headquarters facility expense, cost for the executive management team and cost for certain centralized functions that benefit the entire Company but are not directly attributable to the businesses, such as legal and corporate finance functions. Transactions between segments are not
100
material. Segment assets primarily include cash, accounts receivable, inventory, other current assets, property, plant and equipment, intangible assets and other miscellaneous assets.
Net sales and long-lived assets are attributed to the geographic regions based on the geographic locations of the end customer and the Company subsidiary, respectively.
BUSINESS SEGMENTS
(Millions of Dollars) | 2017 | 2016 | 2015 | ||||||||
Net Sales | |||||||||||
Tools & Storage | $ | 8,862.4 | $ | 7,469.2 | $ | 7,140.7 | |||||
Industrial | 1,946.0 | 1,840.3 | 1,938.2 | ||||||||
Security | 1,938.8 | 2,097.4 | 2,092.9 | ||||||||
Consolidated | $ | 12,747.2 | $ | 11,406.9 | $ | 11,171.8 | |||||
Segment Profit | |||||||||||
Tools & Storage | $ | 1,450.1 | $ | 1,266.9 | $ | 1,170.1 | |||||
Industrial | 352.3 | 304.4 | 339.9 | ||||||||
Security | 212.3 | 269.2 | 239.6 | ||||||||
Segment Profit | 2,014.7 | 1,840.5 | 1,749.6 | ||||||||
Corporate overhead | (216.8 | ) | (197.2 | ) | (164.0 | ) | |||||
Other, net | (289.7 | ) | (196.9 | ) | (222.0 | ) | |||||
Gain on sales of businesses | 264.1 | — | — | ||||||||
Pension settlement | (12.2 | ) | — | — | |||||||
Restructuring charges and asset impairments | (51.5 | ) | (49.0 | ) | (47.6 | ) | |||||
Interest income | 40.1 | 23.2 | 15.2 | ||||||||
Interest expense | (222.6 | ) | (194.5 | ) | (180.4 | ) | |||||
Earnings from continuing operations before income taxes | $ | 1,526.1 | $ | 1,226.1 | $ | 1,150.8 | |||||
Capital and Software Expenditures | |||||||||||
Tools & Storage | $ | 327.2 | $ | 227.3 | $ | 191.7 | |||||
Industrial | 76.2 | 81.1 | 83.8 | ||||||||
Security | 39.0 | 38.6 | 35.9 | ||||||||
Consolidated | $ | 442.4 | $ | 347.0 | $ | 311.4 | |||||
Depreciation and Amortization | |||||||||||
Tools & Storage | $ | 271.9 | $ | 203.0 | $ | 196.5 | |||||
Industrial | 107.4 | 106.8 | 112.3 | ||||||||
Security | 81.4 | 98.2 | 105.2 | ||||||||
Consolidated | $ | 460.7 | $ | 408.0 | $ | 414.0 | |||||
Segment Assets | |||||||||||
Tools & Storage | $ | 12,800.2 | $ | 8,512.4 | $ | 8,492.9 | |||||
Industrial | 3,412.8 | 3,359.0 | 3,438.7 | ||||||||
Security | 3,406.9 | 3,139.0 | 3,741.6 | ||||||||
19,619.9 | 15,010.4 | 15,673.2 | |||||||||
Assets held for sale | — | 523.4 | — | ||||||||
Corporate assets | (540.0 | ) | 101.1 | (545.4 | ) | ||||||
Consolidated | $ | 19,079.9 | $ | 15,634.9 | $ | 15,127.8 | |||||
Corporate assets primarily consist of cash, deferred taxes, and property, plant and equipment. Based on the nature of the Company's cash pooling arrangements, at times corporate-related cash accounts will be in a net liability position.
Sales to The Home Depot were 13%, 14%, and 13% of the Tools & Storage segment net sales in 2017, 2016 and 2015, respectively. Sales to Lowe's were 17%, 15% and 14% of the Tools & Storage segment net sales in 2017, 2016 and 2015, respectively.
101
GEOGRAPHIC AREAS
(Millions of Dollars) | 2017 | 2016 | 2015 | ||||||||
Net Sales | |||||||||||
United States | $ | 6,915.7 | $ | 6,135.6 | $ | 5,882.0 | |||||
Canada | 577.8 | 515.3 | 516.3 | ||||||||
Other Americas | 774.4 | 635.6 | 706.5 | ||||||||
France | 609.0 | 582.7 | 595.7 | ||||||||
Other Europe | 2,742.0 | 2,468.6 | 2,371.5 | ||||||||
Asia | 1,128.3 | 1,069.1 | 1,099.8 | ||||||||
Consolidated | $ | 12,747.2 | $ | 11,406.9 | $ | 11,171.8 | |||||
Property, Plant & Equipment | |||||||||||
United States | $ | 850.2 | $ | 663.4 | $ | 676.0 | |||||
Canada | 30.0 | 29.3 | 19.1 | ||||||||
Other Americas | 111.2 | 95.8 | 82.6 | ||||||||
France | 65.1 | 57.5 | 64.8 | ||||||||
Other Europe | 378.0 | 322.3 | 328.4 | ||||||||
Asia | 308.0 | 282.9 | 279.3 | ||||||||
Consolidated | $ | 1,742.5 | $ | 1,451.2 | $ | 1,450.2 | |||||
Q. INCOME TAXES
On December 22, 2017, the U.S. government enacted comprehensive tax legislation commonly referred to as the Tax Cuts and Jobs Act (the “Act”). The Act makes broad and complex changes to the U.S. tax code, including, but not limited to, (1) reducing the U.S. federal corporate tax rate from 35 percent to 21 percent; (2) requiring companies to pay a one-time transition tax on certain unrepatriated earnings of foreign subsidiaries; (3) generally eliminating U.S. federal income taxes on dividends from foreign subsidiaries; (4) requiring a tax on global intangible low-taxed income (“GILTI”) which is a current inclusion in U.S. federal taxable income of certain earnings of controlled foreign corporations; (5) eliminating the corporate alternative minimum tax ("AMT") and changing how existing AMT credits can be realized; (6) creating the base erosion anti-abuse tax ("BEAT"), a new minimum tax; (7) creating a new limitation on deductible interest expense; and (8) changing rules related to uses and limitations of net operating loss carryforwards created in tax years beginning after December 31, 2017.
As of December 30, 2017, the Company has not completed its accounting for the tax effects of the enactment of the Act; however, in certain cases (described below) the Company has made a reasonable estimate of the effects on its existing deferred tax balances and the one-time transition tax. In other cases, the Company has not been able to make a reasonable estimate and continues to account for those items based on its existing accounting under ASC 740, Income Taxes, and the provisions of the tax laws that were in effect immediately prior to enactment. During the fourth quarter, the Company recognized a provisional net charge of $23.6 million for the items it was able to reasonably estimate, which has been included as a component of income tax expense from continuing operations. The Company operates in many countries throughout the world through numerous subsidiaries. In order to complete the accounting associated with the Act, the Company will continue to accumulate the relevant data, refine computational elements, monitor and analyze U.S. federal and state guidance if and when issued, and adjust its provisional estimates accordingly within the measurement period prescribed by SAB 118.
Provisional amounts
Deferred tax assets and liabilities: The Company remeasured certain deferred tax assets and liabilities based on the U.S. tax rates at which they are expected to become realized in the future. However, the Company is still analyzing certain aspects of the Act and refining its calculations, which could potentially affect the measurement of these balances or potentially give rise to new deferred tax amounts. The provisional amount recorded related to the re-measurement of its deferred tax balance resulted in a decrease to income tax expense of approximately $252.5 million.
102
International provision tax effects: The Company recorded a provisional amount for the one-time transition tax on undistributed foreign earnings, resulting in an increase to income tax expense of $276.1 million comprised of an accrued provisional income tax payable of approximately $460.7 million, partially offset by the reversal of the deferred tax liability of approximately $184.6 million associated with certain legacy Black & Decker unremitted foreign earnings and profits which were previously designated as not being indefinitely reinvested. The remaining deferred tax liability on unremitted foreign earnings of $4.9 million represents withholding taxes which will become payable upon distribution. The Company is still analyzing certain aspects of the Act and refining its estimate, which may change, possibly materially, due to changes in interpretations and assumptions the Company has made, guidance that may be issued and actions the Company may take as a result of the Act.
Significant components of the Company’s deferred tax assets and liabilities at the end of each fiscal year were as follows:
(Millions of Dollars) | 2017 | 2016 | |||||
Deferred tax liabilities: | |||||||
Depreciation | $ | 98.4 | $ | 108.7 | |||
Amortization of intangibles | 668.0 | 851.2 | |||||
Liability on undistributed foreign earnings | 4.9 | 260.7 | |||||
Deferred revenue | 24.6 | 27.3 | |||||
Other | 62.2 | 74.1 | |||||
Total deferred tax liabilities | $ | 858.1 | $ | 1,322.0 | |||
Deferred tax assets: | |||||||
Employee benefit plans | $ | 256.4 | $ | 362.5 | |||
Doubtful accounts and other customer allowances | 16.3 | 19.3 | |||||
Basis differences in liabilities | 84.5 | 110.4 | |||||
Operating loss, capital loss and tax credit carryforwards | 632.2 | 590.3 | |||||
Currency and derivatives | 48.5 | 45.1 | |||||
Other | 88.6 | 131.6 | |||||
Total deferred tax assets | $ | 1,126.5 | $ | 1,259.2 | |||
Net Deferred Tax Asset (Liability) before Valuation Allowance | $ | 268.4 | $ | (62.8 | ) | ||
Valuation allowance | $ | (516.7 | ) | $ | (525.5 | ) | |
Net Deferred Tax Liability after Valuation Allowance | $ | (248.3 | ) | $ | (588.3 | ) | |
A valuation allowance is recorded on certain deferred tax assets if it has been determined it is more likely than not that all or a portion of these assets will not be realized. The Company recorded a valuation allowance of $516.7 million and $525.5 million on deferred tax assets existing as of December 30, 2017 and December 31, 2016, respectively. The valuation allowance in 2017 was primarily attributable to foreign and state net operating loss carryforwards and foreign capital loss carryforwards. The valuation allowance in 2016 was primarily attributable to foreign and state net operating loss carryforwards and a U.S. federal capital loss carryforward, the majority of which was realized upon the sale of the HHI business. During 2016, the Company recorded a valuation allowance of $27.9 million against a deferred tax asset established for the excess of the outside tax basis over the financial reporting basis for investments in businesses to be sold in 2017, which were classified as Held for Sale on the Company's Consolidated Balance Sheets as of December 31, 2016.
As of December 30, 2017, the Company has approximately $5.7 billion of unremitted foreign earnings and profits. Except for $823.3 million of certain legacy Black & Decker foreign earnings and profits, all remaining unremitted foreign earnings and profits are considered to be invested indefinitely or will be remitted substantially free of additional tax. As a result of the Act, the Company recognized income tax expense of $276.1 million for the one-time transition tax on all of its unremitted foreign earnings and profits. This amount is comprised of an accrued provisional income tax payable of approximately $460.7 million, partially offset by the reversal of the deferred tax liability of approximately $184.6 million established on certain legacy Black & Decker unremitted foreign earnings and profits which were previously designated as not being indefinitely reinvested. The remaining deferred tax liability on unremitted foreign earnings of $4.9 million represents withholding taxes which will become payable upon distribution. The Company is continuing to analyze certain aspects of the Act, and may refine its estimate, potentially materially, due to future guidance that may be issued, clarification of existing law, assumptions made, or actions the Company may take as a result of the Act, including the remittance of foreign earnings and profits currently considered to be invested indefinitely (as described above).
Net operating loss carryforwards of $2.3 billion as of December 30, 2017, are available to reduce future tax obligations of certain U.S. and foreign companies. The net operating loss carryforwards have various expiration dates beginning in 2018 with
103
certain jurisdictions having indefinite carryforward periods. The foreign capital loss carryforwards of $52.1 million of December 30, 2017 have indefinite carryforward periods. There was no U.S. federal capital loss carryforward as of December 30, 2017 primarily due to utilization related to the sale of the mechanical security business in the first quarter of 2017.
The components of earnings from continuing operations before income taxes consisted of the following:
(Millions of Dollars) | 2017 | 2016 | 2015 | ||||||||
United States | $ | 714.1 | $ | 305.9 | $ | 405.5 | |||||
Foreign | 812.0 | 920.2 | 745.3 | ||||||||
Earnings from continuing operations before income taxes | $ | 1,526.1 | $ | 1,226.1 | $ | 1,150.8 | |||||
Income tax expense (benefit) attributable to continuing operations consisted of the following:
(Millions of Dollars) | 2017 | 2016 | 2015 | ||||||||
Current: | |||||||||||
Federal | $ | 590.6 | $ | 84.8 | $ | 64.4 | |||||
Foreign | 224.6 | 191.5 | 171.4 | ||||||||
State | 25.4 | 10.6 | 14.1 | ||||||||
Total current | $ | 840.6 | $ | 286.9 | $ | 249.9 | |||||
Deferred: | |||||||||||
Federal | $ | (513.4 | ) | $ | 18.2 | $ | 64.2 | ||||
Foreign | (33.0 | ) | (26.1 | ) | (47.3 | ) | |||||
State | 6.3 | (17.8 | ) | (18.2 | ) | ||||||
Total deferred | (540.1 | ) | (25.7 | ) | (1.3 | ) | |||||
Income taxes on continuing operations | $ | 300.5 | $ | 261.2 | $ | 248.6 | |||||
Included in the U.S. Federal and State current income tax expense are provisional income tax liabilities of approximately $455.4 million and $5.3 million, respectively, which have been recorded as a result of the one-time transition tax on unremitted foreign earnings pursuant to the Act. Included in U.S. Federal deferred income tax expense are provisional income tax benefits of approximately $252.5 million related to the re-measurement of existing U.S. Federal deferred tax balances and $184.6 million associated with the reversal of the deferred tax liability for unremitted foreign earnings and profits which were designated as not being indefinitely reinvested.
Net income taxes paid during 2017, 2016 and 2015 were $273.6 million, $233.3 million and $191.6 million, respectively. The 2017, 2016 and 2015 amounts include refunds of $28.5 million, $30.5 million and $31.0 million, respectively, primarily related to prior year overpayments and closing of tax audits.
The reconciliation of the U.S. federal statutory income tax provision to the income tax provision on continuing operations is as follows:
(Millions of Dollars) | 2017 | 2016 | 2015 | ||||||||
Tax at statutory rate | $ | 534.1 | $ | 429.1 | $ | 402.9 | |||||
State income taxes, net of federal benefits | 13.3 | 12.5 | 14.9 | ||||||||
Foreign tax rate differential | (149.0 | ) | (166.3 | ) | (166.9 | ) | |||||
Uncertain tax benefits | 64.4 | 32.0 | 43.9 | ||||||||
Tax audit settlements | (16.5 | ) | (10.5 | ) | 1.3 | ||||||
Change in valuation allowance | (5.4 | ) | 38.9 | (21.6 | ) | ||||||
Change in deferred tax liabilities on undistributed foreign earnings | (94.1 | ) | (38.7 | ) | (31.0 | ) | |||||
Basis difference for businesses Held for Sale | 27.9 | (27.9 | ) | — | |||||||
Stock-based compensation | (23.2 | ) | — | — | |||||||
Sale of businesses | (47.3 | ) | — | — | |||||||
U.S. Federal tax reform | 23.6 | — | — | ||||||||
Other-net | (27.3 | ) | (7.9 | ) | 5.1 | ||||||
Income taxes on continuing operations | $ | 300.5 | $ | 261.2 | $ | 248.6 | |||||
104
The Company conducts business globally and, as a result, files income tax returns in the U.S. federal jurisdiction and various state, and foreign jurisdictions. In the normal course, the Company is subject to examinations by taxing authorities throughout the world. The Internal Revenue Service is currently examining its consolidated U.S. income tax returns for the 2010-2013 tax years. With few exceptions, as of December 30, 2017, the Company is no longer subject to U.S. federal, state, local, or foreign examinations by tax authorities for years before 2010.
The Company’s liabilities for unrecognized tax benefits relate to U.S. and various foreign jurisdictions. The following table summarizes the activity related to the unrecognized tax benefits:
(Millions of Dollars) | 2017 | 2016 | 2015 | ||||||||
Balance at beginning of year | $ | 309.8 | $ | 283.1 | $ | 280.8 | |||||
Additions based on tax positions related to current year | 34.6 | 14.9 | 23.2 | ||||||||
Additions based on tax positions related to prior years | 82.5 | 53.9 | 24.3 | ||||||||
Reductions based on tax positions related to prior years | (4.2 | ) | (34.2 | ) | (14.3 | ) | |||||
Settlements | (0.3 | ) | 5.4 | (21.5 | ) | ||||||
Statute of limitations expirations | (34.6 | ) | (13.3 | ) | (9.4 | ) | |||||
Balance at end of year | $ | 387.8 | $ | 309.8 | $ | 283.1 | |||||
The gross unrecognized tax benefits at December 30, 2017 and December 31, 2016 includes $368.7 million and $291.1 million, respectively, of tax benefits that, if recognized, would impact the effective tax rate. The liability for potential penalties and interest related to unrecognized tax benefits was increased by $3.8 million in 2017, increased by $4.6 million in 2016 and decreased by $0.1 million in 2015. The liability for potential penalties and interest totaled $67.9 million as of December 30, 2017, $64.1 million as of December 31, 2016, and $59.5 million as of January 2, 2016. The Company classifies all tax-related interest and penalties as income tax expense.
The Company considers many factors when evaluating and estimating its tax positions and the impact on income tax expense, which may require periodic adjustments and which may not accurately anticipate actual outcomes. It is reasonably possible that the amount of the unrecognized benefit with respect to certain of the Company's unrecognized tax positions will significantly increase or decrease within the next 12 months. These changes may be the result of settlement of ongoing audits or final decisions in transfer pricing matters. The Company cannot reasonably estimate the range of the potential change.
R. COMMITMENTS AND GUARANTEES
COMMITMENTS — The Company has non-cancelable operating lease agreements, principally related to facilities, vehicles, machinery and equipment. Minimum payments have not been reduced by minimum sublease rentals of $4.7 million due in the future under non-cancelable subleases. Rental expense, exclusive of sublease income, for operating leases was $150.4 million in 2017, $124.2 million in 2016, and $121.5 million in 2015.
The following is a summary of the Company’s future commitments which span more than one future fiscal year:
(Millions of Dollars) | Total | 2018 | 2019 | 2020 | 2021 | 2022 | Thereafter | ||||||||||||||||||||
Operating lease obligations | $ | 473.3 | $ | 124.7 | $ | 96.2 | $ | 70.5 | $ | 53.3 | $ | 39.5 | $ | 89.1 | |||||||||||||
Marketing commitments | 50.5 | 30.9 | 17.7 | 1.9 | — | — | — | ||||||||||||||||||||
Total | $ | 523.8 | $ | 155.6 | $ | 113.9 | $ | 72.4 | $ | 53.3 | $ | 39.5 | $ | 89.1 | |||||||||||||
The Company has numerous assets, predominantly real estate, vehicles and equipment, under various lease arrangements. The Company routinely exercises various lease renewal options and from time to time purchases leased assets for fair value at the end of lease terms.
The Company is a party to synthetic leases for one of its major distribution centers and two of its office buildings. The programs qualify as operating leases for accounting purposes, where only the monthly lease cost is recorded in earnings and the liability and value of the underlying assets are off-balance sheet.
GUARANTEES — The Company's financial guarantees at December 30, 2017 are as follows:
105
(Millions of Dollars) | Term | Maximum Potential Payment | Carrying Amount of Liability | ||||||
Guarantees on the residual values of leased properties | One to four years | $ | 102.6 | $ | — | ||||
Standby letters of credit | Up to three years | 72.9 | — | ||||||
Commercial customer financing arrangements | Up to six years | 74.1 | 26.2 | ||||||
Total | $ | 249.6 | $ | 26.2 | |||||
The Company has guaranteed a portion of the residual value arising from its previously mentioned synthetic leases. The lease guarantees aggregate $102.6 million while the fair value of the underlying assets is estimated at $118.9 million. The related assets would be available to satisfy the guarantee obligations and therefore it is unlikely the Company will incur any future loss associated with these lease guarantees.
The Company has issued $72.9 million in standby letters of credit that guarantee future payments which may be required under certain insurance programs.
The Company provides various limited and full recourse guarantees to financial institutions that provide financing to U.S. and Canadian Mac Tool distributors and franchisees for their initial purchase of the inventory and truck necessary to function as a distributor and franchisee. In addition, the Company provides limited and full recourse guarantees to financial institutions that extend credit to certain end retail customers of its U.S. Mac Tool distributors and franchisees. The gross amount guaranteed in these arrangements is $74.1 million and the $26.2 million carrying value of the guarantees issued is recorded in debt and other liabilities as appropriate in the Consolidated Balance Sheets.
The Company provides product and service warranties which vary across its businesses. The types of warranties offered generally range from one year to limited lifetime, and certain branded products recently acquired carry a lifetime warranty. There are also certain products with no warranty. Further, the Company sometimes incurs discretionary costs to service its products in connection with product performance issues. Historical warranty and service claim experience forms the basis for warranty obligations recognized. Adjustments are recorded to the warranty liability as new information becomes available.
Following is a summary of the warranty liability activity for the years ended December 30, 2017, December 31, 2016, and January 2, 2016:
(Millions of Dollars) | 2017 | 2016 | 2015 | ||||||||
Balance beginning of period | $ | 103.4 | $ | 105.4 | $ | 109.6 | |||||
Warranties and guarantees issued | 105.3 | 97.2 | 91.8 | ||||||||
Liability assumed from acquisitions | 67.5 | — | — | ||||||||
Warranty payments and currency | (100.2 | ) | (99.2 | ) | (96.0 | ) | |||||
Balance end of period | $ | 176.0 | $ | 103.4 | $ | 105.4 | |||||
S. CONTINGENCIES
The Company is involved in various legal proceedings relating to environmental issues, employment, product liability, workers’ compensation claims and other matters. The Company periodically reviews the status of these proceedings with both inside and outside counsel, as well as an actuary for risk insurance. Management believes that the ultimate disposition of these matters will not have a material adverse effect on operations or financial condition taken as a whole.
In connection with the 2010 merger with Black & Decker, the Company assumed certain commitments and contingent liabilities. Black & Decker is a party to litigation and administrative proceedings with respect to claims involving the discharge of hazardous substances into the environment. Some of these assert claims for damages and liability for remedial investigations and clean-up costs with respect to sites that have never been owned or operated by Black & Decker but at which Black & Decker has been identified as a potentially responsible party ("PRP"). Other matters involve current and former manufacturing facilities.
The Environmental Protection Agency (“EPA”) has asserted claims in federal court in Rhode Island against certain current and former affiliates of Black & Decker related to environmental contamination found at the Centredale Manor Restoration Project Superfund ("Centredale") site, located in North Providence, Rhode Island. The EPA has discovered a variety of contaminants at the site, including but not limited to, dioxins, polychlorinated biphenyls, and pesticides. The EPA alleges that Black & Decker and certain of its current and former affiliates are liable for site clean-up costs under the Comprehensive Environmental
106
Response, Compensation, and Liability Act ("CERCLA") as successors to the liability of Metro-Atlantic, Inc., a former operator at the site, and demanded reimbursement of the EPA’s costs related to this site. Black & Decker and certain of its current and former affiliates contest the EPA's allegation that they are responsible for the contamination, and have asserted contribution claims, counterclaims and cross-claims against a number of other PRPs, including the federal government as well as insurance carriers. The EPA released its Record of Decision ("ROD") in September 2012, which identified and described the EPA's selected remedial alternative for the site. Black & Decker and certain of its current and former affiliates are contesting the EPA's selection of the remedial alternative set forth in the ROD, on the grounds that the EPA's actions were arbitrary and capricious and otherwise not in accordance with law, and have proposed other equally-protective, more cost-effective alternatives. On June 10, 2014, the EPA issued an Administrative Order under Sec. 106 of CERCLA, instructing Emhart Industries, Inc. and Black & Decker to perform the remediation of Centredale pursuant to the ROD. Black & Decker and Emhart Industries, Inc. dispute the factual, legal and scientific bases cited by the EPA for such an Order and have provided the EPA with numerous good-faith bases for Black & Decker’s and Emhart Industries, Inc.’s declination to comply with the Order at this time. Black & Decker and Emhart Industries, Inc. continue to vigorously litigate the issue of their liability for environmental conditions at the Centredale site, including the completion of the Phase 1 trial in late July, 2015 and the completion of the Phase 2 trial in April, 2017. The Court in Phase 1 of the trial found that dioxin contamination at the Centredale site was not "divisible," and that Emhart was jointly and severally liable for dioxin contamination at the site. In its Phase 2 Findings of Fact and Conclusions of Law, entered on August 17, 2017, the Court found that certain components of the EPA's selected remedy were arbitrary and capricious, however, and remanded the matter to the EPA while retaining jurisdiction over the ongoing remedy selection and implementation process. The Court also held in Phase 2 that Black and Decker had sufficient cause for its declination to comply with EPA's June 10, 2014 order and that no associated civil penalties or fines were warranted. The United States has filed a Motion for Reconsideration concerning the Court's Phase 2 rulings, and a ruling on that motion is not expected until early in 2018. The United States has also appealed the ruling to the United States Court of Appeals for the First Circuit. Emhart has filed a Motion to Dismiss the Appeal. The 3rd Phase of the litigation/trial, which is in its very early stages, will address the potential allocation of liability to other parties who may have contributed to contamination of the Site with dioxins, PCB's and other contaminants of concern. The Company's estimated remediation costs related to the Centredale site (including the EPA’s past costs as well as costs of additional investigation, remediation, and related costs such as EPA’s oversight costs, less escrowed funds contributed by primary PRPs who have reached settlement agreements with the EPA), which the Company considers to be probable and reasonably estimable, range from approximately $68.1 million to $139.8 million, with no amount within that range representing a more likely outcome until such time as the litigation is resolved through judgment or compromise. The Company’s reserve for this environmental remediation matter of $68.1 million reflects the fact that the EPA considers Metro-Atlantic, Inc. to be a primary source of contamination at the site. As the specific nature of the environmental remediation activities that may be mandated by the EPA at this site have not yet been finally determined through the on-going litigation, the ultimate remedial costs associated with the site may vary from the amount accrued by the Company at December 30, 2017.
In the normal course of business, the Company is involved in various lawsuits and claims. In addition, the Company is a party to a number of proceedings before federal and state regulatory agencies relating to environmental remediation. Also, the Company, along with many other companies, has been named as a PRP in a number of administrative proceedings for the remediation of various waste sites, including 27 active Superfund sites. Current laws potentially impose joint and several liabilities upon each PRP. In assessing its potential liability at these sites, the Company has considered the following: whether responsibility is being disputed, the terms of existing agreements, experience at similar sites, and the Company’s volumetric contribution at these sites.
The Company’s policy is to accrue environmental investigatory and remediation costs for identified sites when it is probable that a liability has been incurred and the amount of loss can be reasonably estimated. In the event that no amount in the range of probable loss is considered most likely, the minimum loss in the range is accrued. The amount of liability recorded is based on an evaluation of currently available facts with respect to each individual site and includes such factors as existing technology, presently enacted laws and regulations, and prior experience in remediation of contaminated sites. The liabilities recorded do not take into account any claims for recoveries from insurance or third parties. As assessments and remediation progress at individual sites, the amounts recorded are reviewed periodically and adjusted to reflect additional technical and legal information that becomes available. As of December 30, 2017 and December 31, 2016, the Company had reserves of $176.1 million and $160.9 million, respectively, for remediation activities associated with Company-owned properties, as well as for Superfund sites, for losses that are probable and estimable. Of the 2017 amount, $22.5 million is classified as current and $153.6 million as long-term which is expected to be paid over the estimated remediation period. As of December 30, 2017, the Company has recorded $12.2 million in other assets related to funding received by the EPA and placed in a trust in accordance with the final settlement with the EPA, embodied in a Consent Decree approved by the United States District Court for the Central District of California on July 3, 2013. Per the Consent Decree, Emhart Industries, Inc. (a dissolved, former indirectly wholly-owned subsidiary of The Black & Decker Corporation) (“Emhart”) has agreed to be responsible for an interim remedy at a site located in Rialto, California and formerly operated by West Coast Loading Corporation (“WCLC”), a defunct company
107
for which Emhart was alleged to be liable as a successor. The remedy will be funded by (i) the amounts received from the EPA as gathered from multiple parties, and, to the extent necessary, (ii) Emhart's affiliate. The interim remedy requires the construction of a water treatment facility and the filtering of ground water at or around the site for a period of approximately 30 years or more. Accordingly, as of December 30, 2017, the Company's cash obligation associated with the aforementioned remediation activities including WCLC is $163.9 million. The range of environmental remediation costs that is reasonably possible is $143.4 million to $277.1 million which is subject to change in the near term. The Company may be liable for environmental remediation of sites it no longer owns. Liabilities have been recorded on those sites in accordance with policy.
The Company and approximately 47 other companies comprise the Lower Passaic Cooperating Parties Group (the “CPG”). The CPG members and other companies are parties to a May 2007 Administrative Settlement Agreement and Order on Consent (“AOC”) with the EPA to perform a remedial investigation/feasibility study (“RI/FS”) of the lower seventeen miles of the Lower Passaic River in New Jersey (the “River”). The Company’s potential liability stems from former operations in Newark, New Jersey. As an interim step related to the 2007 AOC, on June 18, 2012, the CPG members voluntarily entered into an AOC with the EPA for remediation actions focused solely at mile 10.9 of the River. The Company’s estimated costs related to the RI/FS and focused remediation action at mile 10.9, based on an interim allocation, are included in its environmental reserves. On April 11, 2014, the EPA issued a Focused Feasibility Study (“FFS”) and proposed plan which addressed various early action remediation alternatives for the lower 8.3 miles of the River. The EPA received public comment on the FFS and proposed plan (including comments from the CPG and other entities asserting that the FFS and proposed plan do not comply with CERCLA) which public comment period ended on August 20, 2014. The CPG submitted to the EPA a draft RI report in February 2015 and draft FS report in April 2015 for the entire lower seventeen miles of the River. On March 4, 2016, the EPA issued a Record of Decision selecting the remedy for the lower 8.3 miles of the River. The cleanup plan adopted by the EPA is now considered a final action for the lower 8.3 miles of the River and will include the removal of 3.5 million cubic yards of sediment, placement of a cap over the entire lower 8.3 miles of the River, and, according to the EPA, will cost approximately $1.4 billion and take 6 years to implement after the remedial design is completed. (The EPA estimates that the remedial design will take four years to complete.) The Company and 105 other parties received a letter dated March 31, 2016 from the EPA notifying such parties of potential liability for the costs of the cleanup of the lower 8.3 miles of the River and a letter dated March 30, 2017 stating that the EPA had offered 20 of the parties (not including the Company) an early cash out settlement. In a letter dated May 17, 2017, the EPA stated that these 20 parties did not discharge any of the eight hazardous substances identified in the lower 8.3 mile ROD as the contaminants of concern. In the March 30, 2017 letter, the EPA stated that other parties who did not discharge dioxins, furans or polychlorinated biphenyls (which are considered the contaminants of concern posing the greatest risk to human health or the environment) may also be eligible for cash out settlement, but expects those parties' allocation to be determined through a complex settlement analysis using a third party allocator. The Company asserts that it did not discharge dioxins, furans or polychlorinated biphenyls and should be eligible for a cash out settlement. There has been no determination as to how the RI/FS will be modified in light of the EPA's decision to implement a final action for the lower 8.3 miles of the River. At this time, the Company cannot reasonably estimate its liability related to the remediation efforts, excluding the RI/FS and remediation actions at mile 10.9, as the RI/FS is ongoing, the ultimate remedial approach and associated cost for the upper portion of the River has not yet been determined, and the parties that will participate in funding the remediation and their respective allocations are not yet known. On September 30, 2016, Occidental Chemical Corporation entered into an agreement with the EPA to perform the remedial design for the cleanup plan for the lower 8.3 miles of the river.
Per the terms of a Final Order and Judgment approved by the United States District Court for the Middle District of Florida on January 22, 1991, Emhart is responsible for a percentage of remedial costs arising out of the Kerr McGee Chemical Corporation Superfund Site located in Jacksonville, Florida. On March 15, 2017, the Company received formal notification from the EPA that the EPA had issued a ROD selecting the preferred alternative identified in the Proposed Cleanup Plan. The cleanup adopted by the EPA is currently estimated to cost approximately $68.7 million. Accordingly, in the first quarter of 2017, the Company increased its reserve by $17.1 million which was recorded in Other, net in the Consolidated Statements of Operations.
The environmental liability for certain sites that have cash payments beyond the current year that are fixed or reliably determinable have been discounted using a rate of 1.1% to 2.9%, depending on the expected timing of disbursements. The discounted and undiscounted amount of the liability relative to these sites is $46.3 million and $55.4 million, respectively. The payments relative to these sites are expected to be $7.0 million in 2018, $8.7 million in 2019, $2.6 million in 2020, $2.6 million in 2021, $2.6 million in 2022, and $31.9 million thereafter.
The amount recorded for identified contingent liabilities is based on estimates. Amounts recorded are reviewed periodically and adjusted to reflect additional technical and legal information that becomes available. Actual costs to be incurred in future periods may vary from the estimates, given the inherent uncertainties in evaluating certain exposures. Subject to the imprecision in estimating future contingent liability costs, the Company does not expect that any sum it may have to pay in
108
connection with these matters in excess of the amounts recorded will have a materially adverse effect on its financial position, results of operations or liquidity.
T. DIVESTITURES
In the first quarter of 2015, the Company adopted ASU 2014-08, Presentation of Financial Statements (Topic 205) and Property, Plant and Equipment (Topic 360): Reporting Discontinued Operations and Disclosures of Disposals of Components of an Entity. This guidance changed the criteria for reporting discontinued operations and enhanced the reporting requirements for both discontinued operations and individually significant disposals that do not qualify as a discontinued operation.
Disposals Subsequent to Adoption of ASU 2014-08
On January 3, 2017, the Company sold a business within the Tools & Storage segment for $25.6 million. During the second quarter of 2017, the Company received additional proceeds of $0.5 million as a result of the finalization of the purchase price. On February 22, 2017, the Company sold the majority of its mechanical security businesses within the Security segment, which included the commercial hardware brands of Best Access, phi Precision and GMT, for net proceeds of $717.1 million. The Company also sold a small business in the Industrial segment during the third quarter of 2017 and a small business in the Tools & Storage segment during the fourth quarter of 2017 for total proceeds of approximately $13.7 million. As a result of these sales, the Company recognized a net pre-tax gain of $264.1 million in 2017, primarily related to the sale of the mechanical security businesses. These disposals do not qualify as discontinued operations in accordance with ASU 2014-08, and therefore, are included in the Company's continuing operations for all periods presented through their respective dates of sale in 2017.
The following table summarizes the pre-tax income for these businesses for the years ended December 30, 2017, December 31, 2016, and January 2, 2016:
(Millions of Dollars) | 2017 | 2016 | 2015 | ||||||||
Pre-tax income | $ | 7.0 | $ | 50.0 | $ | 33.3 | |||||
The carrying amounts of the assets and liabilities that were expected to be included in the sales of the mechanical security business and the Tools & Storage business sold in the first quarter of 2017 were classified as held for sale as of December 31, 2016, as follows:
(Millions of Dollars) | December 31, 2016 | ||
Accounts and notes receivable, net | $ | 35.3 | |
Inventories, net | 33.2 | ||
Property, Plant and Equipment, net | 52.3 | ||
Goodwill and other intangibles, net | 399.8 | ||
Other Assets | 2.8 | ||
Total assets | $ | 523.4 | |
Accounts payable and accrued expenses | $ | 38.0 | |
Other liabilities | 15.5 | ||
Total liabilities | $ | 53.5 | |
Disposals Prior to Adoption of ASU 2014-08
In the fourth quarter of 2014, the Company classified the Security segment’s Spain and Italy operations (“Security Spain and Italy”) as held for sale based on management's intention to sell these businesses. In July 2015, the Company completed the sale of these businesses resulting in an insignificant incremental loss.
Security Spain and Italy operations have been reported as discontinued operations in the Company's Consolidated Financial Statements for the year ended January 2, 2016 as follows:
109
(Millions of Dollars) | 2015 | ||
Net Sales | $ | 39.4 | |
Loss from discontinued operations before income taxes | (19.3 | ) | |
Income tax expense on discontinued operations | 0.8 | ||
Net loss from discontinued operations | $ | (20.1 | ) |
110
SELECTED QUARTERLY FINANCIAL DATA (unaudited)
Quarter | ||||||||||||||||||||
(Millions of Dollars, except per share amounts) | First | Second | Third | Fourth | Year | |||||||||||||||
2017 | ||||||||||||||||||||
Net sales | $ | 2,805.6 | $ | 3,229.5 | $ | 3,298.6 | $ | 3,413.5 | $ | 12,747.2 | ||||||||||
Gross profit | 1,065.3 | 1,212.2 | 1,252.1 | 1,248.4 | 4,778.0 | |||||||||||||||
Selling, general and administrative (1) | 684.7 | 738.7 | 763.4 | 793.3 | 2,980.1 | |||||||||||||||
Earnings from continuing operations | 393.1 | 277.2 | 274.2 | 281.1 | 1,225.6 | |||||||||||||||
Less: Net loss attributable to non-controlling interest | — | — | — | (0.4 | ) | (0.4 | ) | |||||||||||||
Net Earnings Attributable to Common Shareowners | $ | 393.1 | $ | 277.2 | $ | 274.2 | $ | 281.5 | $ | 1,226.0 | ||||||||||
Basic earnings per common share | $ | 2.63 | $ | 1.85 | $ | 1.83 | $ | 1.88 | $ | 8.19 | ||||||||||
Diluted earnings per common share | $ | 2.59 | $ | 1.82 | $ | 1.80 | $ | 1.84 | $ | 8.04 | ||||||||||
2016 | ||||||||||||||||||||
Net sales | $ | 2,672.1 | $ | 2,932.4 | $ | 2,882.0 | $ | 2,920.4 | $ | 11,406.9 | ||||||||||
Gross profit | 977.6 | 1,128.9 | 1,084.1 | 1,076.6 | 4,267.2 | |||||||||||||||
Selling, general and administrative (1) | 627.8 | 666.9 | 645.4 | 683.8 | 2,623.9 | |||||||||||||||
Earnings from continuing operations | 188.6 | 271.5 | 249.0 | 255.8 | 964.9 | |||||||||||||||
Less: Net (loss) earnings attributable to non-controlling interest | (0.8 | ) | — | 0.1 | 0.3 | (0.4 | ) | |||||||||||||
Net Earnings Attributable to Common Shareowners | $ | 189.4 | $ | 271.5 | $ | 248.9 | $ | 255.5 | $ | 965.3 | ||||||||||
Basic earnings per common share | $ | 1.30 | $ | 1.87 | $ | 1.71 | $ | 1.74 | $ | 6.61 | ||||||||||
Diluted earnings per common share | $ | 1.28 | $ | 1.84 | $ | 1.68 | $ | 1.71 | $ | 6.51 | ||||||||||
(1) Includes provision for doubtful accounts.
The 2017 year-to-date results above include $156 million of pre-tax acquisition-related charges, a $264 million pre-tax gain on sales of businesses, primarily related to the sale of the mechanical security businesses in the first quarter, and a one-time net tax charge of $24 million recorded in the fourth quarter related to the recently enacted U.S. tax legislation. The net impact of the above items and effect on diluted earnings per share by quarter was as follows:
Acquisition-Related Charges & Other | Diluted EPS Impact | |
• Q1 2017 — $211 million gain ($197 million after-tax) | $1.30 per diluted share | |
• Q2 2017 — $43 million loss ($29 million after-tax) | ($0.20) per diluted share | |
• Q3 2017 — $33 million loss ($24 million after-tax) | ($0.16) per diluted share | |
• Q4 2017 — $27 million loss ($53 million after-tax) | ($0.34) per diluted share | |
111
EXHIBIT INDEX
STANLEY BLACK & DECKER, INC.
EXHIBIT LIST
Some of the agreements included as exhibits to this Annual Report on Form 10-K (whether incorporated by reference to earlier filings or otherwise) may contain representations and warranties, recitals or other statements that appear to be statements of fact. These agreements are included solely to provide investors with information regarding their terms and are not intended to provide any other factual or disclosure information about the Company or the other parties to the agreements. Representations and warranties, recitals, and other common disclosure provisions have been included in the agreements solely for the benefit of the other parties to the applicable agreements and often are used as a means of allocating risk among the parties. Accordingly, such statements (i) should not be treated as categorical statements of fact; (ii) may be qualified by disclosures that were made to the other parties in connection with the negotiation of the applicable agreements, which disclosures are not necessarily reflected in the agreement or included as exhibits hereto; (iii) may apply standards of materiality in a way that is different from what may be viewed as material by or to investors in or lenders to the Company; and (iv) were made only as of the date of the applicable agreement or such other date or dates as may be specified in the agreement and are subject to more recent developments.
Accordingly, representations and warranties, recitals or other disclosures contained in agreements may not describe the actual state of affairs as of the date they were made or at any other time and should not be relied on by any person other than the parties thereto in accordance with their terms. Additional information about the Company may be found in this Annual Report on Form 10-K and the Company’s other public filings, which are available without charge through the SEC’s website at http://www.sec.gov.
112
3.1 | (a) | ||
(b) | |||
(c) | |||
(d) | |||
(e) | |||
(f) | |||
3.2 | (a) | ||
4.1 | (a) | ||
(b) | |||
4.2 | (a) | ||
(b) | |||
113
(c) | |||
(d) | |||
(e) | |||
4.3 | (a) | ||
(b) | |||
(c) | |||
(d) | |||
(e) | |||
(f) | |||
(g) | |||
(h) | |||
4.4 | |||
4.5 | |||
4.6 | |||
4.7 | |||
4.8 | |||
10.1 | (a) | ||
(b) | |||
10.2 | (a) | ||
(b) | |||
10.3 | |||
10.4 | |||
10.5 | |||
10.6 | |||
10.7 | |||
10.8 | |||
10.9 | |||
10.10 | (a) | ||
(b) | |||
10.11 | |||
10.12 | |||
10.13 | The Stanley Works Non-Employee Directors’ Benefit Trust Agreement dated December 27, 1989 and amended as of January 1, 1991 by and between The Stanley Works and Fleet National Bank, as successor trustee (incorporated by reference to Exhibit (10)(xvii)(a) to the Company’s Annual Report on Form 10-K for year ended December 29, 1990). P | ||
10.14 | (a) | ||
(b) | |||
10.15 | (a) | ||
(b) | |||
(c) | |||
(d) | |||
10.16 | (a) | ||
(b) | |||
(c) | |||
(d) | |||
(e) | |||
10.17 | (a) | ||
(b) | |||
10.18 | |||
10.19 | |||
10.20 | |||
10.21 | |||
10.22 | |||
10.23 | (a) | ||
(b) | |||
10.24 | |||
10.25 | |||
10.26 | |||
11 | |||
12 | |||
21 | |||
23 | |||
24 | |||
31.1 | (a) | ||
31.1 | (b) | ||
32.1 | |||
32.2 | |||
99.1 | Policy on Confidential Proxy Voting and Independent Tabulation and Inspection of Elections as adopted by The Board of Directors October 23, 1991 (incorporated by reference to Exhibit (28)(i) to the Quarterly Report on Form 10-Q for the quarter ended September 28, 1991). P | ||
* | Management contract or compensation plan or arrangement. |
P | Paper Filing |
114