Attached files
UNITED STATES
SECURITIES AND EXCHANGE COMMISSION
Washington, D.C. 20549
FORM 10-K
T ANNUAL REPORT PURSUANT TO SECTION 13 OR 15(d) OF THE SECURITIES EXCHANGE ACT OF 1934
For the fiscal year ended December 31, 2017
or
£ TRANSITION REPORT PURSUANT TO SECTION 13 OR 15(d) OF THE SECURITIES EXCHANGE ACT OF 1934
For the transition period from __________ to _________
Commission File Number 001-37419

PDC ENERGY, INC.
(Exact name of registrant as specified in its charter)
Delaware | 95-2636730 |
(State of incorporation) | (I.R.S. Employer Identification No.) |
1775 Sherman Street, Suite 3000
Denver, Colorado 80203
(Address of principal executive offices) (Zip code)
Registrant's telephone number, including area code: (303) 860-5800
Securities registered pursuant to Section 12(b) of the Act:
Title of each class | Name of each exchange on which registered | |
Common Stock, par value $0.01 per share | NASDAQ Global Select Market | |
Securities registered pursuant to Section 12(g) of the Act: None
Indicate by check mark if the registrant is a well-known seasoned issuer, as defined in Rule 405 of the Securities Act. Yes T No £
Indicate by check mark if the registrant is not required to file reports pursuant to Section 13 or Section 15(d) of the Act. Yes £ No T
Indicate by check mark whether the registrant (1) has filed all reports required to be filed by Section 13 or 15(d) of the Securities Exchange Act of 1934 during the preceding 12 months (or for such shorter period that the registrant was required to file such reports), and (2) has been subject to such filing requirements for the past 90 days. Yes T No £
Indicate by check mark whether the registrant has submitted electronically and posted on its corporate Website, if any, every Interactive Data File required to be submitted and posted pursuant to Rule 405 of Regulation S-T (§232.405 of this chapter) during the preceding 12 months (or for such shorter period that the registrant was required to submit and post such files). Yes T No £
Indicate by check mark if disclosure of delinquent filers pursuant to Item 405 of Regulation S-K (§229.405 of this chapter) is not contained herein, and will not be contained, to the best of registrant's knowledge, in definitive proxy or information statements incorporated by reference in Part III of this Form 10-K or any amendment to this Form 10-K. T
Indicate by check mark whether the registrant is a large accelerated filer, an accelerated filer, a non-accelerated filer, or a smaller reporting company. See definitions of "large accelerated filer," "accelerated filer" and "smaller reporting company" in Rule 12b-2 of the Exchange Act.
Large accelerated filer x | Accelerated filer o |
Non-accelerated filer £ (Do not check if a smaller reporting company) | Smaller reporting company o |
Emerging growth company o | |
If an emerging growth company, indicate by check mark if the registrant has elected not to use the extended transition period for complying with any new or revised financial accounting standards provided pursuant to Section 13(a) of the Exchange Act. £
Indicate by check mark whether the registrant is a shell company (as defined in Rule 12b-2 of the Act). Yes £ No T
The aggregate market value of our common stock held by non-affiliates on June 30, 2017 was $2.8 billion (based on the closing price of $43.11 per share as of the last business day of the fiscal quarter ending June 30, 2017).
As of February 15, 2018, there were 65,965,374 shares of our common stock outstanding.
DOCUMENTS INCORPORATED BY REFERENCE
We hereby incorporate by reference into this document the information required by Part III of this Form, which will appear in our definitive proxy statement to be filed pursuant to Regulation 14A for our 2018 Annual Meeting of Stockholders.
PDC ENERGY, INC.
2017 ANNUAL REPORT ON FORM 10-K
TABLE OF CONTENTS
PART I | Page | ||
PART II | |||
PART III | |||
PART IV | |||
PART I
REFERENCES TO THE REGISTRANT
Unless the context otherwise requires, references in this report to "PDC," the "Company," "we," "us," "our," or "ours" refer to the registrant, PDC Energy, Inc., our wholly-owned subsidiaries consolidated for the purposes of its financial statements, including our proportionate share of the financial position, results of operations, cash flows and operating activities of our affiliated partnerships.
GLOSSARY OF UNITS OF MEASUREMENTS AND INDUSTRY TERMS
Units of measurements and industry terms are defined in the Glossary of Units of Measurements and Industry Terms, included at the end of this report.
SPECIAL NOTE REGARDING FORWARD-LOOKING STATEMENTS
This report contains forward-looking statements within the meaning of Section 27A of the Securities Act of 1933 ("Securities Act") and Section 21E of the Securities Exchange Act of 1934 ("Exchange Act") regarding our business, financial condition, results of operations, and prospects. All statements other than statements of historical facts included in this report are "forward-looking statements" within the meaning of the safe harbor provisions of the United States ("U.S.") Private Securities Litigation Reform Act of 1995. Words such as expect, anticipate, intend, plan, believe, seek, estimate and similar expressions or variations of such words are intended to identify forward-looking statements herein. Forward-looking statements include, among other things, statements regarding future: reserves, production, costs, cash flows and earnings; drilling locations and zones and growth opportunities; capital expenditures and projects, including expected lateral lengths of wells, drill times and number of rigs employed; rates of return; operational enhancements and efficiencies; management of lease expiration issues; financial ratios; our anticipated sale of our Utica Shale assets; certain accounting and tax change impacts; midstream capacity and related curtailments; and the closing of pending, and the nature of future, transactions.
The above statements are not the exclusive means of identifying forward-looking statements herein. Although forward-looking statements contained in this report reflect our good faith judgment, such statements can only be based on facts and factors currently known to us. Forward-looking statements are always subject to risks and uncertainties, and become subject to greater levels of risk and uncertainty as they address matters further into the future. Throughout this report or accompanying materials, we may use the term “projection” or similar terms or expressions, or indicate that we have “modeled” certain future scenarios. We typically use these terms to indicate our current thoughts on possible outcomes relating to our business or the industry in periods beyond the current fiscal year. Because such statements relate to events or conditions further in the future, they are subject to increased levels of uncertainty.
Important factors that could cause actual results to differ materially from the forward-looking statements include, but are not limited to:
• | changes in worldwide production volumes and demand, including economic conditions that might impact demand and prices for products we produce; |
• | volatility of commodity prices for crude oil, natural gas, and natural gas liquids ("NGLs") and the risk of an extended period of depressed prices; |
• | reductions in the borrowing base under our revolving credit facility; |
• | impact of governmental policies and/or regulations, including changes in environmental and other laws, the interpretation and enforcement related to those laws and regulations, liabilities arising thereunder, and the costs to comply with those laws and regulations; |
• | declines in the value of our crude oil, natural gas, and NGLs properties resulting in further impairments; |
• | changes in estimates of proved reserves; |
• | inaccuracy of estimated reserves and production rates; |
• | production decline rates from our wells being greater than expected; |
• | timing and extent of our success in discovering, acquiring, developing, and producing reserves; |
• | availability of sufficient pipeline, gathering and other transportation facilities and related infrastructure to process and transport our production and the impact of these facilities and regional capacity on the prices we receive for our production; |
• | timing and receipt of necessary regulatory permits; |
• | risks incidental to the drilling and operation of crude oil and natural gas wells; |
• | losses from our gas marketing business exceeding our expectations; |
1
• | difficulties in integrating our operations as a result of any significant acquisitions and acreage exchanges; |
• | increases or changes in expenses; |
• | availability of supplies, materials, contractors, and services that may delay the drilling or completion of our wells; |
• | potential losses of acreage or zones due to partial or complete lease expirations or otherwise; |
• | increases or adverse changes in construction costs and procurement costs associated with future build out of mid-stream related assets; |
• | future cash flows, liquidity, and financial condition; |
• | possibility that the sale of the Utica Shale properties will not close as expected; |
• | competition within the oil and gas industry; |
• | availability and cost of capital; |
• | our success in marketing crude oil, natural gas, and NGLs; |
• | effect of crude oil and natural gas derivatives activities; |
• | impact of environmental events, governmental and other third-party responses to such events, and our ability to insure adequately against such events; |
• | cost of pending or future litigation; |
• | effect that acquisitions we may pursue have on our capital requirements; |
• | our ability to retain or attract senior management and key technical employees; and |
• | success of strategic plans, expectations and objectives for our future operations. |
Further, we urge you to carefully review and consider the cautionary statements and disclosures, specifically those under Item 1A, Risk Factors, made in this report and our other filings with the U.S. Securities and Exchange Commission ("SEC") for further information on risks and uncertainties that could affect our business, financial condition, results of operations and cash flows. We caution you not to place undue reliance on forward-looking statements, which speak only as of the date of this report. We undertake no obligation to update any forward-looking statements in order to reflect any event or circumstance occurring after the date of this report or currently unknown facts or conditions or the occurrence of unanticipated events. All forward-looking statements are qualified in their entirety by this cautionary statement.
ITEMS 1. AND 2. BUSINESS AND PROPERTIES
The Company
We are a domestic independent exploration and production company that acquires, explores, and develops properties for the production of crude oil, natural gas, and NGLs. Our primary operations are located in the Wattenberg Field in Colorado and the Delaware Basin in Texas. Our operations in the Wattenberg Field are focused on the Niobrara and Codell formations and our Delaware Basin operations are currently focused on the Wolfcamp zones. We also have operations in the Utica Shale in Southeastern Ohio; however, in February 2018, we entered into a definitive purchase and sale agreement ("PSA") for the sale of these properties for net cash proceeds of approximately $40.0 million, subject to certain customary closing adjustments. This transaction is expected to close in the first quarter of 2018.
As of December 31, 2017, we own an interest in approximately 2,800 gross (2,300 net) productive wells, of which approximately 32 percent are horizontal. We operate 87 percent of the wells in which we have an interest. We produced 31.8 MMBoe in 2017, a 44 percent increase compared to 2016, including 4.2 MMBoe from the Delaware Basin assets that we acquired in December 2016. For the month ended December 31, 2017, we maintained an average production rate of 97 MBoe per day, representing a 33 percent increase from December 2016. We were able to achieve this strong growth rate while maintaining a robust liquidity position, comprised of cash and cash equivalents and available capacity under our revolving credit facility totaling $880.7 million as of December 31, 2017. Our leverage ratio as of December 31, 2017, as defined in our revolving credit facility agreement, was 1.9 to 1.0. As of December 31, 2017, we had 452.9 MMBoe of proved reserves, 32 percent of which are proved developed reserves. Approximately 58 percent of our reserves at December 31, 2017 are liquids, which includes crude oil and NGLs. Our 452.9 MMBoe of total proved reserves as of December 31, 2017, represented an increase of 111.5 MMBoe, or 33 percent, relative to December 31, 2016. The additions to our proved reserves were primarily a result of extending the average lateral length of newly-drilled and expected future wells, combined with an increase in our working interest ownership in wells in areas with established reserves, and the addition of proved undeveloped locations in the Delaware Basin.
On January 5, 2018, we closed an acquisition of properties from Bayswater Exploration and Production, LLC and certain related parties in the core Wattenberg Field (the "Bayswater Acquisition") for approximately $186 million, subject to certain customary post-closing adjustments. In addition to the approximately $186 million of cash paid at closing, we invested approximately $15 million during 2017 to complete certain drilled uncompleted wells ("DUCs") acquired in the transaction.
2
Our Strengths
• | Multi-year project inventory in premier crude oil, natural gas, and NGL plays. We have a significant operational presence in two premier U.S. onshore basins, the Wattenberg Field in Weld County, Colorado, and the Delaware Basin in Reeves and Culberson Counties, Texas. The company has identified a significant inventory of horizontal drilling locations in each basin which will allow us to continue to grow our proved reserves and production at attractive rates of return based on our current internal long-term commodity price projections and our current expected cost structure. Our 2018 drilling and completion operations are expected to focus on the Kersey area of the Wattenberg Field and in our oilier eastern and north central areas of the Delaware Basin, where we expect to deliver our strongest economic results. |
In the Wattenberg Field, we have identified a gross operated inventory of approximately 1,500 horizontal drilling locations, including locations acquired in the Bayswater Acquisition, that consist of an average lateral length of approximately 6,300 feet per well. Our Wattenberg Field horizontal drilling locations have been substantially de-risked through multiple years of successful development from the field. In the Delaware Basin, we have identified a gross operated inventory of approximately 450 horizontal Wolfcamp drilling locations, primarily within our oilier eastern and north central focus areas, that consist of an average lateral length of approximately 7,500 feet per well. Some of these 450 locations are subject to a higher degree of uncertainty as they reflect assumptions primarily related to future downspacing that we are either in the process of testing, or have not yet tested. Our other Delaware Basin leaseholds that are not currently in our primary focus area contain an estimated 240 additional potential horizontal Wolfcamp drilling locations that typically have a higher gas to oil ratio, contain less contiguous acreage for long lateral development, or may require additional technical assessments. We believe that our inventory in the Delaware Basin may increase over time, depending upon, among other variables, successful trades to consolidate leaseholds, additional exploration and development activity in other potential zones, service cost efficiencies, and improved commodity and netback pricing.
• | Strong liquidity position. As of December 31, 2017, we had a total liquidity position of $880.7 million, comprised of $180.7 million of cash and cash equivalents and $700.0 million available for borrowing under our revolving credit facility. In November 2017, we issued $600 million principal amount of 5.75 percent unsecured senior notes due in 2026 (the "2026 Senior Notes"). The net proceeds from the offering were used to redeem our $500 million 7.75 percent senior notes due in 2022 (the "2022 Senior Notes"), fund a portion of the Bayswater Acquisition, which closed in early January 2018, and for general corporate purposes. If the Bayswater Acquisition had closed in December 2017, our liquidity position as of December 31, 2017 would have been approximately $700 million. We intend to continue to manage our liquidity position through investment in projects with attractive rates of return, protection of cash flows on a portion of our anticipated sales through the use of an active commodity derivative program, and access to capital markets from time to time. |
• | Balanced and diversified portfolio across two premier U.S. onshore basins. Having drilling opportunities in both the Wattenberg Field and the Delaware Basin allows us to allocate capital between the two basins to diversify our risk. We believe this will improve overall economic results and drive our future production and reserve growth. Additionally, we believe the geographical diversity of our portfolio aids in the mitigation of risks associated with a single dominant producing area, as each basin has its own operating and competitive dynamic in terms of commodity price markets, service costs, takeaway capacity, and regulatory and political considerations. |
• | Significant operational control in our core areas. We have, and expect to continue to have, a substantial degree of operational control over our properties. As a result of successfully executing our strategy of acquiring and consolidating largely concentrated acreage positions with high working interests, we operate and manage approximately 87 percent of all wells in which we have an interest across all of our operating basins. Our control allows us to manage our drilling, production, operating and administrative costs, and to leverage our technical expertise in our core operating areas. Our leaseholds that are held by production further enhance our operational control by providing us flexibility in selecting drilling locations based upon various operational criteria. |
In the Wattenberg Field, our operational control is attributable to our high working interest leasehold and large contiguous acreage blocks, which have been significantly enhanced as a result of our 2016 and 2017 acreage exchanges and the Bayswater Acquisition, and because substantially all of our Wattenberg Field acreage is held by production. We remain flexible in terms of rig activity and capital deployment due to short-term rig contracts and we are confident in our ability to manage our acreage in the Wattenberg Field in order to maintain our current level of operational control. As a result, we can adjust our drilling plans if commodity prices deteriorate in order to manage cash flows from operations relative to cash flows from investing activities.
3
In the Delaware Basin, our average working interest in our properties that we operate is approximately 90 percent. We own and operate certain midstream assets in the Delaware Basin and believe this will allow for timely system expansion, well connections, fresh water supply for completion operations, and produced water disposal. Our leasehold in the Delaware Basin requires a more active drilling program and we have less flexibility than we do in the Wattenberg Field, in terms of managing lease expiration issues. In some cases, continuous operations will be required to maintain the underlying leasehold in the Delaware Basin. However, with our high percentage of operated leasehold in the area, we expect to have adequate control over the location and pace of our development to manage lease expirations and meet our drilling obligations in the central and eastern parts of the basin. See Item 1A. Risk Factors - Our undeveloped acreage must be drilled before lease expiration to hold the acreage by production. In highly competitive markets for acreage, failure to drill sufficient wells to hold acreage could result in a substantial lease renewal cost or, if renewal is not feasible, loss of our lease and prospective drilling opportunities.
• | Utilizing technology to focus on efficiency. In the Wattenberg Field, we have a proven track record of continuing improvement in both costs and productivity of our existing operations. Our efficiencies have historically been driven by a focus on the use of multi-well pad drilling, extended-reach lateral well development, increased fracture stimulation stage density, enhanced fracture stimulation completion design, and improved drilling efficiencies. In 2017, approximately 65 percent of our horizontal well spuds were mid- or extended-reach laterals that ranged from approximately 6,000 to 10,000 horizontal feet in length. We also use a mono-bore drilling design to reduce drill times and well costs. Through the combination of these techniques, our drilling team has improved our drilling efficiencies with average drill results increasing to approximately 2,700 feet drilled per day in 2017 from approximately 2,200 feet drilled per day in 2016. |
• | Strong environmental, health and safety compliance programs, and community outreach. We have focused on establishing effective environmental, health and safety programs that are intended to promote safe working practices for our employees and contractors and to help earn the trust and respect of land owners, regulatory agencies, and public officials. This is an important part of our strategy and in competing in today’s intensive regulatory and public debate climate. We are also dedicated to being an active and contributing member of the communities in which we operate. We share our success with these communities in various ways, including charitable giving and community event sponsorships. |
• | Commodity derivative program. Our active use of commodity derivative instruments to protect our investment returns and cash flows was particularly important through the recent commodity price downturns. We have continued this program and entered into commodity derivative instruments to mitigate a portion of our short-term future exposure to commodity price fluctuations, including fixed-price swaps, crude oil and natural gas collars, basis swaps, and rollfactor swap contracts. While our commodity derivative program limits the upside benefits we may otherwise receive during periods of higher commodity prices, the program helps protect a portion of our cash flows, borrowing base, and liquidity during periods of depressed commodity prices. We strive to scale our overall hedging position to be appropriate relative to our current and expected level of indebtedness and consistent with our goals of preserving balance sheet strength and substantial liquidity, as well as our internal price view. |
As of December 31, 2017, we had commodity derivatives positions covering approximately 11.9 MMBbls and 6.6 MMBbls of crude oil production for 2018 and 2019, respectively. As of the same date, we had hedged approximately 56.5 Bcf of natural gas and 1.1 MMBbls of propane for 2018. The details of these transactions are described in Item 7a. - Quantitative and Qualitative Disclosures About Market Risk.
• | Strong management team and operational capabilities. We have strong and stable management, led by our executive management team. Each member of the team has between 10 and 30 years of experience in the energy and natural resource industry. This experience collectively spans expertise in land, reservoir analysis, operations, accounting, strategy, and general operations, and has helped us continue our growth through periods of commodity price pressure and cost inflation, and other challenging environments. |
4
Business Strategy
Our long-term business strategy focuses on generating stockholder value through the acquisition, exploration, and development of crude oil and natural gas properties. We are focused on the growth of our reserves, production, and cash flows through organic exploration and development of our existing and acquired leasehold through horizontal drilling. Our operational focus is concentrated within two basins. We pursue various midstream, marketing, and cost reduction initiatives designed to increase our per unit operating margins, while maintaining a disciplined financial strategy focused on providing sufficient liquidity and balance sheet strength to execute our business strategy.
We focus on horizontal development drilling programs in resource plays that offer repeatable results and the potential for attractive returns on investment in a range of commodity price environments. Our inventory of drilling locations supports our planned organic growth over the next several years. We expect our drilling and completion activity to drive increases in proved reserves, production, and cash flows. In addition to development drilling, we routinely review acquisition and acreage swap opportunities in our core areas of operations. We believe we can extract additional value from such transactions through production optimization opportunities and increases in our working interests in our development drilling locations afforded by more concentrated acreage positions. As a result, once we have established a significant presence in an area, the use of bolt-on acquisitions and acreage exchanges can potentially provide synergies that result in additional economies of scale. We also pursue a limited and disciplined exploration program with the goal of replenishing our portfolio with new exploration projects capable of positioning us for significant production and reserve growth in future years.
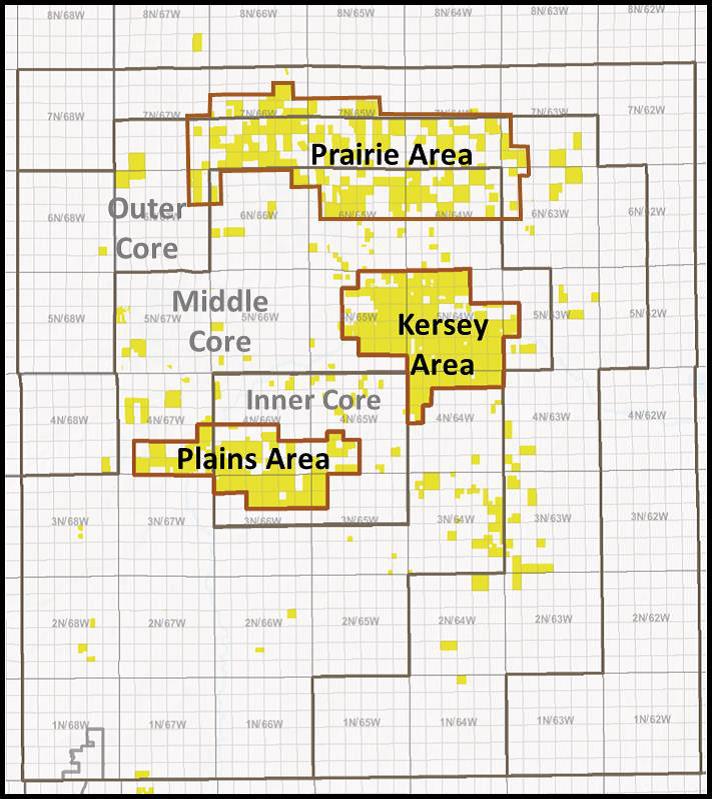
In 2017, we completed two significant acreage exchanges that consolidated certain acreage positions in the core area of the Wattenberg Field, creating two development areas that we refer to as Prairie and Plains. Both transactions involved the exchange of leasehold acreage with a limited number of wells that were in the process of being drilled and completed. Upon closing the transactions, we received an aggregate of approximately 15,900 net acres in exchange for an aggregate of approximately 16,200 net acres. The difference in net acres is primarily due to variances in working and net revenue interests and in midstream contracts.
As referenced above, we closed the Bayswater Acquisition in January 2018, acquiring approximately 7,400 net acres, 24 operated horizontal wells that were either DUCs or in-process wells at the time of closing and an estimated 220 gross drilling locations at the time of closing.
Development drilling
The following map presents the general locations of our development and production activities as of December 31, 2017:
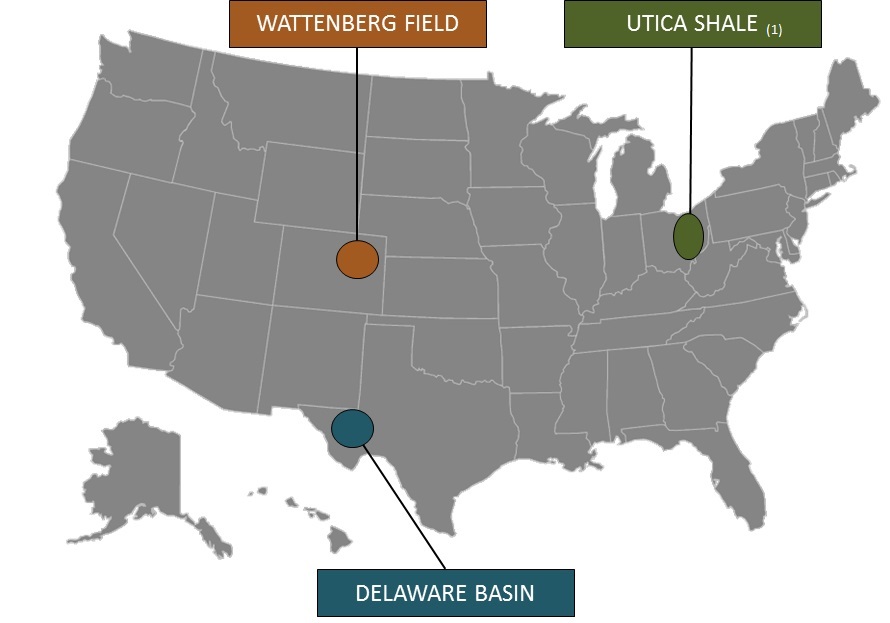
(1) In February 2018, we entered into a PSA to sell the Utica Shale properties.
5
Our leasehold interests cover properties with developed and undeveloped crude oil, natural gas, and NGLs resources. We own approximately 2,800 gross (2,300 net) wells in our two primary operating basins. Our 2018 capital investment program, which contemplates expenditures of between $850 million and $920 million, is primarily focused on continued execution in the Wattenberg Field and Delaware Basin using three drilling rigs and one completion crew in each basin throughout the year.
Based on our current production forecast for 2018 and assuming an average $57.50 New York Mercantile Exchange ("NYMEX") crude oil price for the year and a $3.00 NYMEX natural gas price, we expect 2018 capital investments to exceed our 2018 cash flows from operations by approximately less than $90 million. We anticipate that the proceeds received from the sale of our Utica Shale assets and a midstream dedication agreement (see the footnote titled Subsequent Events to the consolidated financial statements included elsewhere in this report), will fund approximately two-thirds of this outspend. We expect this outspend to occur during the first half of 2018, with cash flows exceeding capital investment during the second half of the year. Our leverage ratio, as defined in our revolving credit facility agreement, is expected to decrease by the end of 2018 based on production and operational cash flow growth. However, a significant deterioration in commodity prices could negatively impact our results of operations, financial condition, and future development plans. We may increase or decrease our 2018 capital investment program during the year as a result of, among other things, changes in commodity prices or our internal long-term outlook for commodity prices, requirements to hold acreage, the cost of services for drilling and well completion activities, drilling results, changes in our borrowing capacity, a significant change in cash flows, regulatory issues, requirements to maintain continuous activity on leaseholds or acquisition and/or divestiture opportunities. If such changes result in our election to deploy additional capital, amounts invested may further exceed our cash flow from operations.
Wattenberg Field. We are drilling in the horizontal Niobrara and Codell plays in the core Wattenberg Field, which is further delineated between the Kersey, Prairie and Plains development areas. We plan to drill standard-reach lateral (“SRL”), mid-reach lateral (“MRL”), and extended-reach lateral (“XRL”) wells in 2018, the majority of which will be in the Kersey area of the field. Wells in the Wattenberg Field typically have productive horizons at depths of approximately 6,500 to 7,500 feet below the surface. In 2018, we anticipate spudding and turning-in-line between approximately 135 to 150 operated wells, as outlined below:
SRL | MRL | XRL | ||||
Estimated average lateral length (in feet) | 4,200 | 6,900 | 9,500 | |||
Expected drilling days (spud-to-spud) | 6 | 8 | 10 | |||
Estimated percentage of 2018 wells spud | 25% | 45% | 30% | |||
Estimated percentage of 2018 wells turned-in-line | 50% | 35% | 15% | |||
Estimated cost per well (in millions) | $2.6 | $3.5 | $4.4 | |||
Our 2018 capital investment program for the Wattenberg Field is approximately $470 million to $500 million, of which approximately 90 percent is expected to be invested in operated drilling and completion activity. The remainder of the Wattenberg Field capital investment program is expected to be used for non-operated drilling, land, and miscellaneous workover and capital projects.
6
The following map presents the general locations of our development areas in the Niobrara and Codell plays of the Wattenberg Field as of December 31, 2017:
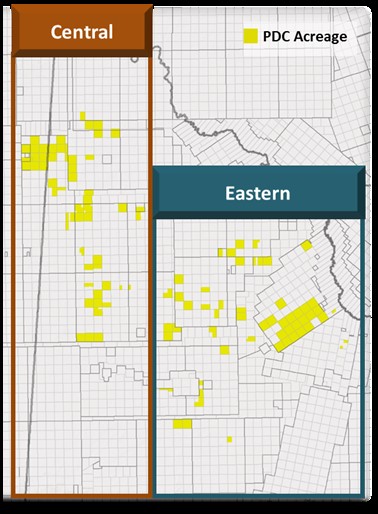
Delaware Basin. Our 2018 capital investment program for the Delaware Basin contemplates operating at a three-rig pace throughout the year. Total capital investment in the Delaware Basin for 2018 is expected to be approximately $380 million to $420 million, of which approximately 75 percent is allocated to both spud and turn-in-line approximately 25 to 30 operated wells. Based on the timing of our operations and requirements to hold acreage, we may elect to drill wells different from or in addition to those currently anticipated, as we are continuing to analyze the terms of the relevant leases. Our anticipated Delaware Basin drilling program is outlined below:
SRL | MRL | XRL | |||
Estimated average lateral length (in feet) | 5,000 | 8,000 | 10,000 | ||
Expected drilling days (spud-to-rig release) | 30 | 31 | 36 | ||
Estimated percentage of 2018 wells spud | 10% | 40% | 50% | ||
Estimated percentage of 2018 wells turned-in-line | 25% | 45% | 30% | ||
Estimated cost per well (in millions) | $9.2 | $10.8 | $13.2 | ||
Wells in the Delaware Basin typically have productive horizons at depths of approximately 8,000 to 11,000 feet below the surface. We plan to use approximately 10 percent of our budgeted capital for leasing, non-operated capital, seismic, and technical studies, with the remaining 15 percent for midstream-related projects, including oil and gas gathering systems and water supply and disposal systems.
7
The following map presents the general locations of our Wolfcamp formation development areas in the Delaware Basin as of December 31, 2017:
Utica Shale. In 2017, as part of our plan to divest the Utica Shale properties, we engaged an investment banking firm and began actively marketing the properties for sale; therefore, these properties are classified as held-for-sale as of December 31, 2017. In February 2018, we entered into a PSA to sell these properties for net cash proceeds of approximately $40.0 million, subject to certain customary closing adjustments.
Strategic acquisitions
As part of our overall growth strategy, we examine and evaluate acquisition opportunities as they present themselves and pursue those that meet our strategic plan and that we believe will increase stockholder value. We seek properties with large undeveloped drilling upside where we believe we can utilize our operational expertise to grow production and proved reserves. In addition, we may pursue opportunities to exchange acreage with other producers or complete small bolt-on acquisitions in order to optimize our portfolio by consolidating and concentrating on our core assets. The creation of large, contiguous acreage blocks through the trading of properties or bolt-on acquisitions provides the opportunity to optimize drilling activities and add more extended-reach lateral wells to our drilling program, while increasing our working interests in the related wells. We have an experienced team of management, engineering, geosciences, and commercial professionals who identify and evaluate acquisition opportunities. We believe the Bayswater Acquisition and the acreage exchanges executed in 2016 and 2017 met the criteria. Any acquisition activity we may pursue in 2018 is expected to be focused on the Wattenberg Field and Delaware Basin.
Selective exploration
Historically, we have pursued a disciplined exploration program intended to replenish our portfolio of potential drilling locations and position us for production and reserve growth in future years. When doing so, we attempt to accumulate significant leasehold positions prior to competitive forces driving up the cost of entry and to invest in leasehold positions that are near existing or emerging midstream infrastructure. Our recent exploration activity has been in the Delaware Basin as there are multiple zones that have not seen development sufficient to record proved reserves. We believe such zones could provide
8
us with additional potential drilling locations and/or proved reserves, based upon the results of our exploratory wells. See the footnote titled Properties and Equipment - Suspended Well Costs to our consolidated financial statements included elsewhere in this report for additional details regarding our exploratory wells.
Business Segments
We are engaged in two operating segments: our oil and gas exploration and production segment and our gas marketing segment. Beginning in 2017, our gas marketing segment did not meet the quantitative thresholds to require disclosure as a separate reportable segment. All of our material operations are attributable to our exploration and production business; therefore, all of our operations are presented as a single segment for all periods presented.
The results of our Oil and Gas Exploration and Production segment primarily reflect revenues and expenses from the production and sale of crude oil, natural gas, and NGLs, commodity price risk management, and well operations. The exploration for and production of crude oil, natural gas, and NGLs involves the acquisition or leasing of mineral and related surface rights. Prior to development of these properties, we assess the economic viability of potential well development opportunities. We then develop the reserves through the permitting, drilling and completion of crude oil and natural gas wells, which are then turned-in-line to production. We operate and maintain the producing wells, while managing associated production, operating, and transportation costs. At the end of a well's economic life, the well is plugged and surface disturbances surrounding the well and producing facilities are remediated. The Oil and Gas Exploration and Production segment's most significant customers are Suncor Energy Marketing, Inc. and DCP Midstream, LP ("DCP"). Sales to each of these parties constituted more than 10 percent of our 2017 revenues. Given the liquidity in the market for the sale of hydrocarbons, we believe that the loss of any purchaser or the aggregate loss of several customers could be managed by selling to alternative purchasers. See Part II, Item 7,Management's Discussion and Analysis of Financial Condition and Results of Operations - Results of Operations, Summary Operating Results, for sales, pricing, production, and operating cost data.
9
Properties
Productive Wells
The following table presents our productive wells:
Productive Wells | ||||||||||||||||||
As of December 31, 2017 | ||||||||||||||||||
Crude Oil | Natural Gas | Total | ||||||||||||||||
Operating Region/Area | Gross | Net | Gross | Net | Gross | Net | ||||||||||||
Wattenberg Field (1) | 811 | 551.6 | 1,893 | 1,660.7 | 2,704 | 2,212.3 | ||||||||||||
Delaware Basin (2) | 47 | 43.1 | 4 | 4.0 | 51 | 47.1 | ||||||||||||
Utica Shale (3) | 27 | 22.2 | 3 | 3.0 | 30 | 25.2 | ||||||||||||
Total productive wells | 885 | 616.9 | 1,900 | 1,667.7 | 2,785 | 2,284.6 | ||||||||||||
_________
(1) Additionally, the Bayswater Acquisition, which closed in January 2018, included 56 gross (19.7 net) productive crude oil
wells and 164 gross (118.7 net) productive natural gas wells.
(2) During 2017, we submitted applications to the Railroad Commission of Texas ("RRC of Texas") requesting that the
designation for 20 wells in the Delaware Basin be changed from crude oil to natural gas per their GOR analysis. The
applications are currently pending review by the RRC of Texas.
(3) In February 2018, we entered into a PSA to sell the Utica Shale properties.
Proved Reserves
The following table presents our proved reserve estimates as of December 31, 2017, based on reserve reports prepared by our independent petroleum engineering consulting firms, Ryder Scott Company, L.P. ("Ryder Scott"), and Netherland, Sewell & Associates, Inc. ("NSAI"), and related information:
Proved Reserves at December 31, 2017 | |||||||||||||||
Proved Reserves (MMBoe) | % of Total Proved Reserves | % Proved Developed | % Liquids | Proved Reserves to Production Ratio (in years)(1) | 2017 Production (MBoe) | ||||||||||
Wattenberg Field | 350.8 | 77 | % | 33 | % | 55 | % | 13.1 | 26,815 | ||||||
Delaware Basin | 97.9 | 22 | % | 23 | % | 67 | % | 23.4 | 4,184 | ||||||
Utica Shale (2) | 4.2 | 1 | % | 100 | % | 51 | % | 5.1 | 831 | ||||||
Total proved reserves | 452.9 | 100 | % | 32 | % | 58 | % | 14.2 | 31,830 | ||||||
_________
(1) Based on production during 2017.
(2) In February 2018, we entered into a PSA to sell the Utica Shale properties.
Our proved reserves are sensitive to future crude oil, natural gas, and NGLs sales prices and the related effect on the economic productive life of producing properties. Increases in commodity prices may result in a longer economic productive life of a property or result in recognition of more economically viable proved undeveloped reserves, while decreases in commodity prices may result in negative impacts of this nature.
All of our proved reserves are located onshore in the U.S. Our proved reserve estimates are prepared using the definitions for proved reserves set forth in SEC Regulation S-X, Rule 4-10(a) and other applicable SEC rules. Our proved reserves in the Wattenberg Field and Utica Shale as of December 31, 2017 were estimated by Ryder Scott and our reserves in the Delaware Basin as of that date were estimated by NSAI. Both Ryder Scott and NSAI are independent professional engineering firms.
We have a comprehensive process that governs the determination and reporting of our proved reserves. As part of our internal control process, our reserves are reviewed annually by an internal team composed of reservoir engineers, geologists, land, and accounting personnel for adherence to SEC guidelines through a detailed review of land and accounting records,
10
available geological and reservoir data, and production performance data. The internal team compiles the reviewed data and forwards the data to Ryder Scott and NSAI, as applicable.
When preparing our reserve estimates, neither Ryder Scott nor NSAI independently verifies the accuracy and completeness of information and data furnished by us with respect to ownership interests, production volumes, well test data, historical costs of operations and development, product prices or any agreements relating to current and future operations of properties, or sales of production. Ryder Scott and NSAI prepare estimates of our reserves in conjunction with an ongoing review by our engineers. A final comparison of data is performed to ensure that the reserve estimates are complete, determined pursuant to acceptable industry methods, and with a level of detail we deem appropriate. The final estimated reserve reports are prepared by Ryder Scott and NSAI and reviewed by our engineering staff and management prior to issuance by those firms.
The professional qualifications of our internal lead engineer primarily responsible for overseeing the preparation of our reserve estimates, as defined in the Standards Pertaining to the Estimating and Auditing of Oil and Gas Reserves Information as promulgated by the Society of Petroleum Engineers, qualifies this individual as a Reserve Estimator. This person holds a Bachelor of Science degree in Petroleum and Chemical Refining Engineering with a minor in Petroleum Engineering, has over 40 years of experience in reservoir engineering, is a member of the Society of Petroleum Engineers and the Society of Petroleum Evaluation Engineers, and is a registered Professional Engineer in the State of Colorado.
The SEC's reserve rules allow the use of techniques that have been proved effective by evaluation of actual production from projects in the same reservoir or an analogous reservoir or by other observational evidence using reliable technology that establishes reasonable certainty. Reliable technology is a grouping of one or more technologies (including computational methods) that has been field tested and has been demonstrated to provide reasonably certain results with consistency and repeatability in the formation being evaluated or in an analogous formation. We used a combination of performance methods, including decline curve analysis and other computational methods, offset analogies, and seismic data and interpretation to calculate our reserve estimates. All of our proved undeveloped reserves conform to the SEC five-year rule requirement as all proved undeveloped locations are scheduled, according to an adopted development plan, to be drilled within five years of the location’s initial booking date. Per SEC rules, the pricing used to prepare the proved reserves is based on the unweighted arithmetic average of the first of the month prices for the preceding 12 months. The NYMEX prices used in preparing the reserves are then adjusted based on energy content, location and basis differentials and other marketing deductions to arrive at the net realized price. The SEC NYMEX prices used in the preparation of reserves are as follows:
As of December 31, | ||||||||||||
2017 | 2016 | 2015 | ||||||||||
Crude oil (SEC NYMEX - $/Bbl) | $ | 51.34 | $ | 42.75 | $ | 50.28 | ||||||
Natural gas (SEC NYMEX - $/MMBtu) | $ | 2.98 | $ | 2.48 | $ | 2.59 | ||||||
Reserve estimates involve judgments and cannot be measured exactly. The estimates must be reviewed periodically and adjusted to reflect additional information gained from reservoir performance, new geologic and geophysical data, and economic changes. Neither the estimated future net cash flows nor the standardized measure of discounted future net cash flows ("standardized measure") is intended to represent the current market value of our proved reserves. For additional information regarding both of these measures, as well as other information regarding our proved reserves, see the Supplemental Information Unaudited - Crude Oil and Natural Gas Information provided with our consolidated financial statements included elsewhere in this report.
11
The following tables provide information regarding our estimated proved reserves:
As of December 31, | |||||||||||
2017 | 2016 | 2015 | |||||||||
Proved reserves | |||||||||||
Crude oil and condensate (MMBbls) | 155 | 118 | 99 | ||||||||
Natural gas (Bcf) | 1,154 | 834 | 661 | ||||||||
NGLs (MMBbls) | 106 | 84 | 64 | ||||||||
Total proved reserves (MMBoe) | 453 | 341 | 273 | ||||||||
Proved developed reserves (MMBoe) | 143 | 98 | 70 | ||||||||
Estimated undiscounted future net cash flows (in millions) (1) | $ | 5,453 | $ | 2,681 | $ | 2,259 | |||||
Standardized measure (in millions) | $ | 2,880 | $ | 1,421 | $ | 1,097 | |||||
PV-10 (in millions) (2) (3) | $ | 3,212 | $ | 1,675 | $ | 1,338 | |||||
___________
(1) | Amount represents aggregate undiscounted future net cash flows, before income taxes, estimated by Ryder Scott and NSAI, of approximately $6.2 billion, $3.3 billion, and $2.8 billion as of December 31, 2017, 2016, and 2015, respectively, less an internally-estimated undiscounted future income tax expense of approximately $0.7 billion, $0.6 billion, and $0.5 billion, respectively. |
(2) | PV-10 is a non-U.S. GAAP financial measure. It is not intended to represent the current market value of our estimated reserves. PV-10 should not be considered in isolation or as a substitute for the standardized measure reported in accordance with U.S. GAAP, but rather should be considered in addition to the standardized measure. See Part II, Item 7, Management's Discussion and Analysis of Financial Condition and Results of Operations - Reconciliation of Non-U.S. GAAP Financial Measures, for a definition of PV-10 and a reconciliation of our PV-10 value to the standardized measure. |
(3) | Of the PV-10 amounts, $31.6 million, $21.6 million, and $26.6 million represent amounts attributable to our Utica Shale properties as of December 31, 2017, 2016, and 2015, respectively. In February 2018, we entered into a PSA to sell these properties. |
The following table presents our estimated proved developed and undeveloped reserves by category and area:
As of December 31, 2017 | |||||||||||||||
Operating Region/Area | Crude Oil and Condensate (MMBbls) | Natural Gas (Bcf) | NGLs (MMBbls) | Crude Oil Equivalent (MMBoe) | Percent | ||||||||||
Proved developed | |||||||||||||||
Wattenberg Field | 36.3 | 301.9 | 29.2 | 115.9 | 26 | % | |||||||||
Delaware Basin | 9.5 | 50.6 | 4.9 | 22.9 | 5 | % | |||||||||
Utica Shale (1) | 1.0 | 12.8 | 1.1 | 4.2 | 1 | % | |||||||||
Total proved developed | 46.8 | 365.3 | 35.2 | 143.0 | 32 | % | |||||||||
Proved undeveloped | |||||||||||||||
Wattenberg Field | 69.7 | 644.5 | 57.8 | 234.9 | 51 | % | |||||||||
Delaware Basin | 38.3 | 144.5 | 12.7 | 75.0 | 17 | % | |||||||||
Total proved undeveloped | 108.0 | 789.0 | 70.5 | 309.9 | 68 | % | |||||||||
Total proved reserves | |||||||||||||||
Wattenberg Field | 106.0 | 946.4 | 87.0 | 350.8 | 77 | % | |||||||||
Delaware Basin | 47.8 | 195.1 | 17.6 | 97.9 | 22 | % | |||||||||
Utica Shale (1) | 1.0 | 12.8 | 1.1 | 4.2 | 1 | % | |||||||||
Total proved reserves | 154.8 | 1,154.3 | 105.7 | 452.9 | 100 | % | |||||||||
________
(1) In February 2018, we entered into a PSA to sell the Utica Shale properties.
12
We have performed an analysis of our proved reserve estimates as of December 31, 2017 to present sensitivity associated with a lower crude oil price as the value of crude oil influences the value of our proved reserves and PV-10 most significantly. Replacing the 2017 NYMEX price for crude oil used in estimating our reported proved reserves with $30.00 as shown on the table below, and leaving all other parameters unchanged, results in changes to our estimated proved reserves as shown.
Pricing Scenario - NYMEX | ||||||||||||||||||
Crude Oil (per Bbl) | Natural Gas (per MMBtu) | Proved Reserves (MMBoe) | % Change from December 31, 2017 Estimated Reserves | PV-10 (in Millions) | PV-10 % Change from December 31, 2017 Estimate Reserves | |||||||||||||
2017 SEC Reserve Report (1) | $ | 51.34 | $ | 2.98 | 452.9 | — | $ | 3,212.0 | — | |||||||||
Alternate Price Scenario | $ | 30.00 | $ | 2.98 | 424.9 | (6 | )% | $ | 1,021.0 | (68 | )% | |||||||
__________
(1) | These prices are the SEC NYMEX prices applied to the calculation of the PV-10 value. Such prices have been applied consistently in the alternate pricing scenario to include the impact of adjusting for deductions for any basin differentials, transportation fees, contractual adjustments, and any Btu adjustments we experienced for the respective commodity. |
Developed and Undeveloped Acreage
The following table presents our developed and undeveloped lease acreage:
As of December 31, 2017 | ||||||||||||||||||
Developed | Undeveloped | Total | ||||||||||||||||
Operating Region/Area | Gross | Net | Gross | Net | Gross | Net | ||||||||||||
Wattenberg Field (1) (2) | 114,200 | 109,200 | 8,800 | 7,600 | 123,000 | 116,800 | ||||||||||||
Delaware Basin (3) | 31,900 | 29,500 | 36,600 | 30,400 | 68,500 | 59,900 | ||||||||||||
Utica Shale (4) | 5,300 | 4,500 | 44,600 | 41,100 | 49,900 | 45,600 | ||||||||||||
Total acreage | 151,400 | 143,200 | 90,000 | 79,100 | 241,400 | 222,300 | ||||||||||||
___________
(1) Of the amounts shown, 91,600 gross (87,400 net) developed lease acres and 4,700 gross (3,900 net) undeveloped
lease acres are associated with our approximately 1,500 operated horizontal Wattenberg Field drilling locations targeting
the Niobrara or Codell plays. The remaining acres are associated with other zones within the field that we do not
currently estimate to be economic to develop; therefore, we have not currently identified any potential drilling
locations on these acres.
(2) The Bayswater Acquisition, which closed in January 2018, included 9,100 gross (7,200 net) developed lease acres and
200 gross and net undeveloped lease acres, providing us a total of 132,300 gross (124,200 net) total acres in the Wattenberg
Field.
(3) See below regarding Culberson County acreage expirations.
(4) In February 2018, we entered into a PSA to sell the Utica Shale properties.
13
Substantially all of our undeveloped acreage in the Wattenberg Field is related to leaseholds that are held by production. In the Wattenberg Field, the leaseholds at risk to expire in 2018, 2019, and 2020 are not material. In the Delaware Basin, there are drilling obligations or continuous drilling clauses associated with the majority of our acreage. While we believe that our current Delaware Basin drilling plan should provide sufficient development to meet these obligations for the next few years, in the event that we do not meet the obligations for certain leases, we anticipate that, when development plans dictate or when our analysis of the acreage supports such a decision, we will make any necessary bonus extension payments, changes to drilling schedules, or will seek to renew or re-lease in order to retain the leases in the eastern and central areas. However, the payments necessary to extend or retain certain leases may be significant and we may not be successful in such efforts or may elect not to pursue them. We expect that approximately 3,200 gross and net Delaware Basin acres in our western area block located in Culberson County will expire during the first half of 2019 as a result of normal course lease expirations that we do not anticipate renewing due to an expected lack of economically recoverable production quantities. These acres were impaired to an immaterial value in 2017. In total for the Delaware Basin, approximately 12 percent, 35 percent, and two percent of the leaseholds are at risk to expire in 2018, 2019, and 2020, respectively. See Item 1A. Risk Factors - Our undeveloped acreage must be drilled before lease expiration to hold the acreage by production. In highly competitive markets for acreage, failure to drill sufficient wells to hold acreage could result in a substantial lease renewal cost or, if renewal is not feasible, loss of our lease and prospective drilling opportunities.
14
Drilling Activity. The following tables set forth a summary of our developmental and exploratory well drilling activity for the periods presented. There is no necessary correlation between the number of productive wells completed during any period and the aggregate reserves attributable to those wells. Productive wells consist of wells that were turned-in-line and commenced production during the period, regardless of when drilling was initiated. In-process wells represent wells that are in the process of being drilled or have been drilled and are waiting to be fractured and/or for gas pipeline connection as of the date shown. The in-process wells are a normal part of our activity. The Wattenberg Field activity is comprised of pad drilling operations where multiple wells are developed from the same well pad. Because we operate multiple drilling rigs in the area, we expect to have in-process wells at any given time. Wells may be in-process for anywhere from days to several months. This normal in-process inventory also exists in the development of our Delaware Basin leasehold.
Gross Development Well Drilling Activity | |||||||||||||||||||||||||||
Year Ended December 31, | |||||||||||||||||||||||||||
2017 | 2016 | 2015 | |||||||||||||||||||||||||
Operating Region/Area | Productive | In-Process | Non-Productive (1) | Productive | In-Process | Non-Productive (1) | Productive | In-Process | Non-Productive (1) | ||||||||||||||||||
Wattenberg Field, operated wells | 130 | 87 | — | 140 | 64 | 2 | 136 | 78 | 4 | ||||||||||||||||||
Wattenberg Field, non-operated wells | 12 | 14 | 1 | 24 | 12 | — | 58 | 19 | — | ||||||||||||||||||
Delaware Basin | 11 | 18 | — | 1 | 5 | — | — | — | — | ||||||||||||||||||
Utica Shale (2) | — | — | — | 5 | — | — | 4 | 5 | — | ||||||||||||||||||
Total gross development wells | 153 | 119 | 1 | 170 | 81 | 2 | 198 | 102 | 4 | ||||||||||||||||||
(1) | Represents mechanical failures that resulted in the plugging and abandonment of the respective wells. |
(2) | In February 2018, we entered into a PSA to sell the Utica Shale properties. |
Net Development Well Drilling Activity | |||||||||||||||||||||||||||
Year Ended December 31, | |||||||||||||||||||||||||||
2017 | 2016 | 2015 | |||||||||||||||||||||||||
Operating Region/Area | Productive | In-Process | Non-Productive (1) | Productive | In-Process | Non-Productive (1) | Productive | In-Process | Non-Productive (1) | ||||||||||||||||||
Wattenberg Field, operated wells | 112.8 | 80.1 | — | 109.7 | 52.7 | 1.7 | 110.8 | 54.6 | 2.7 | ||||||||||||||||||
Wattenberg Field, non-operated wells | 1.6 | 2.6 | 0.1 | 5.0 | 2.8 | — | 9.3 | 4.3 | — | ||||||||||||||||||
Delaware Basin | 10.5 | 10.4 | — | 1.0 | 4.8 | — | — | — | — | ||||||||||||||||||
Utica Shale (2) | — | — | — | 4.5 | — | — | 3.0 | 4.5 | — | ||||||||||||||||||
Total net development wells | 124.9 | 93.1 | 0.1 | 120.2 | 60.3 | 1.7 | 123.1 | 63.4 | 2.7 | ||||||||||||||||||
__________
(1) | Represents mechanical failures that resulted in the plugging and abandonment of the respective wells. |
(2) | In February 2018, we entered into a PSA to sell the Utica Shale properties. |
15
Gross Exploratory Well Drilling Activity | |||||||||||||||||||||||||||
Year Ended December 31, | |||||||||||||||||||||||||||
2017 | 2016 | 2015 | |||||||||||||||||||||||||
Operating Region/Area | Productive | In-Process | Non-Productive | Productive | In-Process | Non-Productive | Productive | In-Process | Non-Productive | ||||||||||||||||||
Wattenberg Field, operated wells | — | — | — | — | — | — | — | — | — | ||||||||||||||||||
Wattenberg Field, non-operated wells | — | — | — | — | — | — | — | — | — | ||||||||||||||||||
Delaware Basin | 5 | 3 | 2 | — | — | — | — | — | — | ||||||||||||||||||
Utica Shale | — | — | — | — | — | — | — | — | — | ||||||||||||||||||
Total gross development wells | 5 | 3 | 2 | — | — | — | — | — | — | ||||||||||||||||||
Net Exploratory Well Drilling Activity | |||||||||||||||||||||||||||
Year Ended December 31, | |||||||||||||||||||||||||||
2017 | 2016 | 2015 | |||||||||||||||||||||||||
Operating Region/Area | Productive | In-Process | Non-Productive | Productive | In-Process | Non-Productive | Productive | In-Process | Non-Productive | ||||||||||||||||||
Wattenberg Field, operated wells | — | — | — | — | — | — | — | — | — | ||||||||||||||||||
Wattenberg Field, non-operated wells | — | — | — | — | — | — | — | — | — | ||||||||||||||||||
Delaware Basin | 3.1 | 2.8 | 2.0 | — | — | — | — | — | — | ||||||||||||||||||
Utica Shale | — | — | — | — | — | — | — | — | — | ||||||||||||||||||
Total gross development wells | 3.1 | 2.8 | 2.0 | — | — | — | — | — | — | ||||||||||||||||||
Title to Properties
We believe that we hold good and defensible leasehold title to substantially all of our crude oil and natural gas properties in accordance with standards generally accepted in the industry. A preliminary title examination is typically conducted at the time the undeveloped properties are acquired. Prior to the commencement of drilling operations, a title examination is conducted and remedial curative work is performed, as necessary, with respect to discovered defects which we deem to be significant, in order to procure division order title opinions. Title examinations have been performed with respect to substantially all of our producing properties.
The properties we own are subject to royalty, overriding royalty, and other outstanding interests. The properties may also be subject to additional burdens, liens, or encumbrances customary in the industry, including items such as operating agreements, current taxes, development obligations under crude oil and natural gas leases, farm-out agreements, and other restrictions. We do not believe that any of these burdens will materially interfere with our use of the properties.
Substantially all of our crude oil and natural gas properties, excluding our share of properties held by the limited
partnerships that we sponsor, have been mortgaged or pledged as security for our revolving credit facility. See the footnote titled Long-Term Debt to our consolidated financial statements included elsewhere in this report.
Facilities
We lease 87,000 square feet of office space in Denver, Colorado, which serves as our corporate office, through February 2023 and 47,000 square feet of office space in Evans, Colorado through November 2025. We own a 32,000 square foot administrative office building located in Bridgeport, West Virginia.
We own or lease field operating facilities in or near Evans, Colorado and Midland, Texas.
Governmental Regulation
The U.S. crude oil and natural gas industry is extensively regulated at the federal, state and local levels. The following is a summary of certain laws, rules and regulations currently in force that apply to us. The regulatory environment in which we operate changes frequently and we cannot predict the timing or nature of such changes or their effects on us.
16
Regulation of Crude Oil and Natural Gas Exploration and Production. Our exploration and production activities are subject to a variety of rules and regulations concerning drilling permits, the spacing and density of wells, rates of production, water discharge, prevention of waste, bonding requirements, surface use and restoration and well plugging and abandonment. The primary state-level regulatory authority regarding these matters is the Colorado Oil and Gas Conservation Commission (the “COGCC”). For example, prior to commencing drilling activities for a well, we must procure permits and/or approvals for the various stages of the drilling process from the relevant state and local agencies. Similarly, our operations must comply with rules governing the size of drilling and spacing units or proration units and the unitization or pooling of lands and leases. Some states, such as Colorado, allow the forced pooling or integration of tracts to facilitate exploration while other states, such as Texas, rely primarily or exclusively on voluntary pooling of lands and leases. In states, such as Texas, where pooling is primarily or exclusively voluntary, it may be more difficult to form units and therefore to drill and develop our leases in circumstances where we do not own all of the leases in the proposed unit. State laws may also establish maximum rates of production from crude oil and natural gas wells, prohibit the venting or flaring of natural gas, and impose requirements regarding the ratability of production. Leases covering state or federal lands often include additional regulations and conditions. These laws, regulations and conditions can limit the number of wells we can drill and the permissible production from successful wells and can increase our costs.
Regulation of Transportation of Natural Gas. We move natural gas through pipelines owned by other companies and sell natural gas to other companies that also utilize common carrier pipeline facilities. Natural gas pipeline interstate transmission and storage activities are subject to regulation by the Federal Energy Regulatory Commission ("FERC") under the Natural Gas Act of 1938 ("NGA") and under the Natural Gas Policy Act of 1978. Rates and charges for the transportation of natural gas in interstate commerce, and the extension, enlargement or abandonment of jurisdictional facilities, among other things, are subject to regulation. Natural gas pipeline companies hold certificates of public convenience and necessity issued by FERC authorizing ownership and operation of certain pipelines, facilities and properties. Each natural gas pipeline company is also subject to the Natural Gas Pipeline Safety Act of 1968, as amended, which imposes safety requirements in the design, construction, operation, and maintenance of interstate natural gas transmission facilities. Under the Energy Policy Act of 2005, FERC has substantial enforcement authority to prohibit the manipulation of natural gas markets and enforce its rules and orders, including the ability to assess substantial civil penalties. Interstate pipelines may not operate their pipeline systems to preferentially benefit their marketing affiliates.
Transportation and safety of natural gas is also subject to regulation by the United States Department of Transportation under the Pipeline Inspection, Protection, Enforcement and Safety Act of 2006 and the Pipeline Safety, Regulatory Certainty and Job Creation Act of 2012.
The availability, terms, and cost of transportation affect our natural gas sales. Historically, producers were able to flow supplies into interstate pipelines on an interruptible basis; however, recently we have seen the increased need to acquire firm transportation on pipelines in order to avoid curtailments or shut-in gas, which could adversely affect cash flows from the affected area. Gathering is exempt from regulation under the NGA, thus allowing gatherers to charge negotiated rates. Gathering lines are subject to state regulation, however, which includes various safety, environmental, and in some circumstances, nondiscriminatory take requirements.
Environmental Matters
Our operations are subject to numerous laws and regulations relating to environmental protection. These laws and regulations change frequently, and the effect of these changes is often to impose additional costs or other restrictions on our operations. We cannot predict the occurrence, timing, nature or effect of these changes.
Hazardous Substances and Wastes
We generate wastes that may be subject to the Federal Resource Conservation and Recovery Act (“RCRA”) and comparable state statutes. The U.S. Environmental Protection Agency (“EPA”) and various state agencies have adopted requirements that limit the approved disposal methods for certain hazardous and non-hazardous wastes. Furthermore, certain wastes generated by our operations that are currently exempt from treatment as “hazardous wastes” may in the future be designated as hazardous wastes, and therefore may subject us to more rigorous and costly operating and disposal requirements. In December 2016, the U.S. District Court for the District of Columbia approved a consent decree between the EPA and a coalition of environmental groups. The consent decree requires the EPA to review and determine whether it will revise the RCRA regulations for exploration and production waste to treat such waste as hazardous waste. The EPA must complete its review and make its decision regarding revision by March 2019. If the EPA chooses to revise the applicable RCRA regulations, it must sign a notice taking final action related to the new regulation by July 2021.
17
We currently own or lease numerous properties that have been used for the exploration and production of crude oil and natural gas for many years. If hydrocarbons or other wastes have been disposed of or released on or under the properties that we own or lease or on or under locations where such wastes have been taken for disposal by us or prior owners or operators of such properties, we could be subject to liability under the Comprehensive Environmental Response, Compensation and Liability Act (“CERCLA”), RCRA and analogous state laws, as well as state laws governing the management of crude oil and natural gas wastes. CERCLA and similar state laws impose liability, without regard to fault or the legality of the original conduct, on certain classes of persons that are considered to have contributed to the release of a “hazardous substance” into the environment. These persons include the owner or operator of the disposal site or sites where the release occurred and companies that disposed of, transported, or arranged for the disposal of the hazardous substances found at the site. Persons who are or were responsible for release of hazardous substances under CERCLA may be subject to full liability for the costs of cleaning up the hazardous substances that have been released into the environment or remediation to prevent future contamination and for damages to natural resources. Under state laws, it is not uncommon for neighboring landowners and other third parties to file claims for personal injury and property damage allegedly caused by the hazardous substances released into the environment.
In October 2015, the EPA granted, in part, a petition filed by several national environmental advocacy groups to add the oil and gas extraction industry to the list of industries required to report releases of certain “toxic chemicals” under the Toxics Release Inventory (“TRI”) program under the Emergency Planning and Community Right-to-Know Act.
Hydraulic Fracturing
Hydraulic fracturing is commonly used to stimulate production of crude oil and/or natural gas from dense subsurface rock formations. We consistently utilize hydraulic fracturing in our crude oil and natural gas development programs. The process involves the injection of water, sand, and additives under pressure into a targeted subsurface formation. The water and pressure create fractures in the rock formations which are held open by the grains of sand, enabling the crude oil or natural gas to more easily flow to the wellbore. The process is generally subject to regulation by state oil and gas commissions, but is also the subject of various other regulatory initiatives at the federal, state and local levels.
Federal Regulation
Beginning in 2012, the EPA implemented Clean Air Act (“CAA”) standards (New Source Performance Standards (“NSPS”) and National Emission Standards for Hazardous Air Pollutants) applicable to hydraulically fractured natural gas wells and certain storage vessels. The standards require, among other things, use of reduced emission completions, or “green” completions, to reduce volatile organic compound emissions during well completions as well as new controls applicable to a wide variety of storage tanks and other equipment, including compressors, controllers, and dehydrators.
In February 2014, the EPA issued permitting guidance under the Safe Drinking Water Act ("SDWA") for the underground injection of liquids from hydraulically fractured and other wells where diesel is used. Depending upon how it is implemented, this guidance may create duplicative requirements in certain areas, further slow the permitting process in certain areas, increase the costs of operations, and result in expanded regulation of hydraulic fracturing activities by the EPA, and may therefore adversely affect even companies, such as PDC, that do not use diesel fuel in hydraulic fracturing activities.
In May 2014, the EPA issued an advance notice of proposed rulemaking under the Toxic Substances Control Act pursuant to which it will collect extensive information on the chemicals used in hydraulic fracturing fluid, as well as other health-related data, from chemical manufacturers and processors.
The U.S. Department of the Interior, through the Bureau of Land Management (the “BLM”), finalized a rule in 2015 requiring the disclosure of chemicals used, mandating well integrity measures and imposing other requirements relating to hydraulic fracturing on federal lands. The BLM rescinded the rule in December 2017.
In June 2016, the EPA finalized pretreatment standards for indirect discharges of wastewater from the oil and gas extraction industry. The regulation prohibits sending wastewater pollutants from onshore unconventional oil and gas extraction facilities to publicly-owned treatment works.
In December 2016, the EPA released a report titled “Hydraulic Fracturing for Oil and Gas: Impacts from the Hydraulic Fracturing Water Cycle on Drinking Water Resources.” The report concluded that activities involved in hydraulic fracturing can have impacts on drinking water under certain circumstances. In addition, the U.S. Department of Energy has investigated practices the agency could recommend to better protect the environment from drilling using hydraulic fracturing completion methods. These
18
and similar studies, depending on their degree of development and nature of results obtained, could spur initiatives to further regulate hydraulic fracturing under the SDWA or other regulatory mechanisms.
State Regulation
Each of the states in which we currently operate, Colorado, Texas, and Ohio, have adopted or are considering adopting laws and regulations that impose or could impose, among other requirements, stringent permitting or air emission control requirements, disclosure, wastewater disposal, baseline sampling, seismic monitoring, well construction and well location requirements on hydraulic fracturing operations and/or more stringent notification or consultation processes. The Ohio Department of Natural Resources (“ODNR”) has required the suspension of certain activities relating to hydraulic fracturing in the past in response to earthquakes occurring near development operations. Similarly, the Railroad Commission of Texas has implemented rules requiring the submission of detailed information related to seismicity in connection with permit applications. In addition, some states have banned the treatment of fracturing wastewater at publicly owned treatment facilities.
Colorado and Texas require that all chemicals used in the hydraulic fracturing of a well be reported in a publicly searchable registry website developed and maintained by the Ground Water Protection Council and Interstate Oil and Gas Compact Commission (“Frac Focus”).
Concerns about hydraulic fracturing have contributed to support for proposed ballot initiatives in Colorado that would dramatically limit the areas of the state in which drilling would be permitted to occur. See Item 1A. Risk Factors-Risks Relating to Our Business and the Industry-Changes in laws and regulations applicable to us could increase our costs, impose additional operating restrictions or have other adverse effects on us.
Local Regulation
Various local and municipal bodies in each of the states in which we operate have purported to impose drilling moratoria and other restrictions on hydraulic fracturing activities. The cities purporting to ban hydraulic fracturing currently include Fort Collins, Boulder, Lafayette, Longmont and Brighton in Colorado and Denton in Texas. Ballot initiatives have been proposed in Colorado that would authorize local governmental authorities to implement hydraulic fracturing bans or other regulations. See Item 1A. Risk Factors-Risks Relating to Our Business and the Industry-Changes in laws and regulations applicable to us could increase our costs, impose additional operating restrictions or have other adverse effects on us.
Private Lawsuits
Lawsuits have been filed against other operators in several states, including Colorado and Ohio, alleging contamination of drinking water as a result of hydraulic fracturing activities.
Greenhouse Gases
In December 2009, the EPA published its findings that emissions of carbon dioxide, methane, and other greenhouse gases (“GHGs”) present an endangerment to public health and the environment because such emissions are, according to the EPA, contributing to warming of the earth’s atmosphere and other climatic changes. These findings provide the basis for the EPA to adopt and implement regulations that would restrict emissions of GHGs under existing provisions of the CAA. In June 2010, the EPA began regulating GHG emissions from stationary sources.
In the past, Congress has considered proposed legislation to reduce emissions of GHGs. Congress has not adopted any significant legislation in this respect to date, but could do so in the future. In addition, many states and regions have taken legal measures to reduce emissions of GHGs, primarily through the planned development of GHG emission inventories and/or regional GHG cap and trade programs. In February 2014 and November 2017, Colorado adopted rules regulating methane emissions from the oil and gas sector.
The Obama administration reached an agreement during the December 2015 United Nations climate change conference in Paris pursuant to which the United States initially pledged to make a 26-28 percent reduction in its GHG emissions by 2025 against a 2005 baseline and committed to periodically update this pledge every five years starting in 2020 (the Paris Agreement). In June 2017, President Trump announced that the United States would initiate the formal process to withdraw from the Paris Agreement.
19
Air Quality
Our operations are subject to the CAA and comparable state and local requirements. The CAA contains provisions that may result in the gradual imposition of certain pollution control requirements with respect to air emissions from our operations. The EPA and state governments continue to develop regulations to implement these requirements. We may be required to incur certain capital investments in the next several years for air pollution control equipment in connection with maintaining or obtaining operating permits and approvals addressing other air emission-related issues. See the footnote titled Commitments and Contingencies - Litigation and Legal Items to our consolidated financial statements included elsewhere in this report for further information regarding the Clean Air Act Section 114 Information Request that we received from the EPA in August 2015.
In June 2016, the EPA implemented new requirements focused on achieving additional methane and volatile organic compound reductions from the oil and natural gas industry. The rules imposed, among other things, new requirements for leak detection and repair, control requirements for oil well completions, replacement of certain pneumatic pumps and controllers, and additional control requirements for gathering, boosting, and compressor stations. The EPA has proposed a two-year stay of the effective dates of several requirements of the rules. Also in 2016, the EPA issued guidelines for reducing volatile organic compound emissions from existing oil and natural gas equipment and processes in ozone non-attainment areas, including the Denver Metro North Front Range Ozone 8-Hour Non-Attainment (“Denver Metro/North Front Range NAA”) area discussed below.
In November 2016, the BLM finalized rules to further regulate venting, flaring, and leaks during oil and natural gas production activities on onshore federal and Indian leases. The rules require additional controls and impose new emissions and other standards on certain operations on applicable leases, including committed state or private tracts in a federally approved unit or communitized agreement that drains federal minerals. The rules are the subject of litigation in federal court. In December 2017, the BLM published a rule to temporarily suspend or delay certain rule requirements until January 2019; that rule is also the subject of litigation in federal court.
In 2016, the EPA increased the state of Colorado’s non-attainment ozone classification for the Denver Metro/North Front Range NAA area from “marginal” to “moderate” under the 2008 national ambient air quality standard (“NAAQS”). This increase in non-attainment status triggered significant additional obligations for the state under the CAA and resulted in Colorado adopting new and more stringent air quality control requirements in November 2017 that are applicable to our operations. The Denver Metro/North Front Range NAA is at risk of being reclassified again to “serious” if it does not meet the 2008 NAAQS by 2018 or obtain an extension of the deadline from the EPA. A “serious” classification would trigger significant additional obligations for the state under the CAA and could result in new and more stringent air quality control requirements applicable to our operations and significant costs and delays in obtaining necessary permits.
State-level rules applicable to our operations include regulations imposed by the Colorado Department of Public Health and Environment’s Air Quality Control Commission, including stringent requirements relating to monitoring, recordkeeping, and reporting matters.
Water Quality
The federal Clean Water Act (“CWA”) and analogous state laws impose strict controls concerning the discharge of pollutants and fill material, including spills and leaks of crude oil and other substances. The CWA also requires approval and/or permits prior to construction, where construction will disturb wetlands or other waters of the United States. The scope of what areas constitute jurisdictional waters of the United States regulated under the CWA is currently the subject of ongoing litigation and related administrative matters that are not expected to be resolved for several years. In January 2017, the Army Corps of Engineers issued revised and renewed streamlined general nationwide permits that are available to satisfy permitting requirements for certain work in streams, wetlands and other waters of the United States under Section 404 of the CWA and the Rivers and Harbors Act. The new nationwide permits took effect in March 2017, or when certified by each state, whichever was later. The oil and gas industry broadly utilizes nationwide permits 12, 14, and 39 for the construction, maintenance and repairs of pipelines, roads, and drill pads, respectively, and related structures in waters of the United States that impact less than a half-acre of waters of the United States and meet the other criteria of each nationwide permit.
The CWA also regulates storm water run-off from crude oil and natural gas facilities and requires storm water discharge permits for certain activities. Spill Prevention, Control, and Countermeasure (“SPCC”) requirements of the CWA require appropriate secondary containment load out controls, piping controls, berms, and other measures to help prevent the contamination of navigable waters in the event of a petroleum hydrocarbon spill, rupture, or leak.
20
Endangered Species
The Endangered Species Act restricts activities that may affect endangered or threatened species or their habitats. Similar protections are offered to migratory birds under the Migratory Bird Treaty Act and bald and golden eagles under the Bald and Golden Eagle Protection Act. Some of our operations may be located in areas that are or may be designated as habitats for endangered or threatened species or that may attract migratory birds, bald eagles, or golden eagles.
Safety and Spill Prevention
In October 2015, the U.S. Department of Transportation Pipeline and Hazardous Materials Safety Administration proposed to expand its regulations in a number of ways, including increased regulation of gathering lines, even in rural areas, and proposed additional standards to revise safety regulations applicable to onshore gas transmission and gathering pipelines in 2016.
Crude oil production is subject to many of the same operating hazards and environmental concerns as natural gas production, but is also subject to the risk of crude oil spills. In addition to SPCC requirements, the Oil Pollution Act of 1990 (“OPA”) subjects owners of facilities to strict joint and several liability for all containment and cleanup costs and certain other damages arising from crude oil spills. Noncompliance with OPA may result in varying civil and criminal penalties and liabilities. Historically, we have not experienced any significant crude oil discharge or crude oil spill problems.
In May 2015, the U.S. Department of Transportation issued a final rule regarding the safe transportation of flammable liquids by rail. The final rule imposes certain requirements on “offerors” of crude oil, including sampling, testing, and certification requirements.
We are also subject to rules regarding worker safety and similar matters promulgated by the U.S. Occupational Safety and Health Administration (“OSHA”) and other governmental authorities. OSHA has established workplace safety standards that provide guidelines for maintaining a safe workplace in light of potential hazards, such as employee exposure to hazardous substances. The COGCC has adopted or amended numerous rules in recent years, including rules relating to safety matters, and currently is pursuing a rulemaking process relating to flowline safety and leak detection.
WHERE YOU CAN FIND ADDITIONAL INFORMATION
We file annual, quarterly, and current reports, proxy statements and other information with the SEC. Our SEC filings are available free of charge from the SEC’s website at www.sec.gov or from our website at www.pdce.com. You may also read or copy any document we file at the SEC’s public reference room in Washington, D.C., located at 100 F Street, N.E., Washington, D.C. 20549. Please call the SEC at (800) SEC-0330 for further information on the public reference room. We also make available free of charge any of our SEC filings by mail. For a mailed copy of a report, please contact PDC Energy, Inc., Investor Relations, 1775 Sherman Street, Suite 3000, Denver, CO 80203, or call (800) 624-3821.
We recommend that you view our website for additional information, as we routinely post information that we believe is important for investors. Our website can be used to access such information as our recent news releases, committee charters, code of business conduct and ethics, stockholder communication policy, director nomination procedures, and our whistle blower hotline. While we recommend that you view our website, the information available on our website is not part of this report and is not incorporated by reference.
21
ITEM 1A. RISK FACTORS
You should carefully consider the following risk factors in addition to the other information included in this report. Each of these risk factors could adversely affect our business, operating results, and financial condition, as well as adversely affect the value of an investment in our common stock or other securities.
Risks Relating to Our Business and the Industry
Crude oil, natural gas, and NGL prices fluctuate and declines in these prices, or an extended period of low prices, can significantly affect the value of our assets and our financial results and may impede our growth.
Our revenue, profitability, cash flows and liquidity depend in large part upon the prices we receive for our crude oil, natural gas, and NGLs. Changes in prices affect many aspects of our business, including:
• | our revenue, profitability and cash flows; |
• | our liquidity; |
• | the quantity and present value of our reserves; |
• | the borrowing base under our revolving credit facility and access to other sources of capital; and |
• | the nature and scale of our operations. |
The markets for crude oil, natural gas, and NGLs are often volatile, and prices may fluctuate in response to, among other things:
• | relatively minor changes in regional, national, or global supply and demand; |
• | regional, national, or global economic conditions, and perceived trends in those conditions; |
• | geopolitical factors, such as events that may reduce or increase production from particular oil-producing regions and/or from members of the Organization of Petroleum Exporting Countries, or ("OPEC"); and |
• | regulatory changes. |
The price of oil has been volatile since mid-2014, with a high over $100 per barrel in June 2014 to lows below $30 per barrel in 2016, in each case based on West Texas Intermediate (“WTI”) prices, due to a combination of factors including increased U.S. supply and global economic concerns. Prices for natural gas and NGLs have experienced similar volatility. If we reduce our capital expenditures due to low prices, natural declines in production from our wells will likely result in reduced production and therefore reduced cash flow from operations, which would in turn further limit our ability to make the capital expenditures necessary to replace our reserves and production.
In addition to factors affecting the price of crude oil, natural gas, and NGLs generally, the prices we receive for our production are affected by factors specific to us and to the local markets where the production occurs. The prices that we receive for our production are generally lower than the relevant benchmark prices that are used for calculating commodity derivative positions. These differences, or differentials, are difficult to predict and may widen or narrow in the future based on market forces. Differentials can be influenced by, among other things, local or regional supply and demand factors and the terms of our sales contracts. Over the longer term, differentials will be significantly affected by factors such as investment decisions made by providers of midstream facilities and services, refineries and other industry participants, and the overall regulatory and economic climate. For example, increases in U.S. domestic oil production generally, or in production from particular basins, may result in widening differentials. We may be materially and adversely impacted by widening differentials on our production and decreasing commodity prices.
The marketability of our production is dependent upon transportation and processing facilities the capacity and operation of which we do not control. Market conditions or operational impediments affecting midstream facilities and services could hinder our access to crude oil, natural gas, and NGL markets, increase our costs or delay production. Our efforts to address midstream issues may not be successful.
Our ability to market our production depends in substantial part on the availability, proximity and capacity of gathering systems, pipelines and processing facilities owned and operated by third parties. If adequate midstream facilities and services are not available to us on a timely basis and at acceptable costs, our production and results of operations will be adversely affected. For example, in recent periods, due to ongoing drilling activities by us and third parties and seasonal changes in temperatures, our principal third-party provider in the Wattenberg Field for midstream facilities and services has experienced significantly increased gathering system pressures. The resulting capacity constraints reduced the productivity of some of our older vertical wells and limited incremental production from some of our newer horizontal wells. This constrained our production volumes and reduced our revenue from the affected wells. Capacity constraints affecting natural gas production
22
also impacted the associated NGLs. While this has not been a problem for us in the Delaware Basin to date, some operators in the Delaware Basin have also experienced similar issues from time to time, in part due to significant increases in production in the area. The use of alternative forms of transportation for oil production, such as trucks or rail, involve risks, including the risk that increased regulation could lead to increased costs or shortages of trucks or rail-cars. In addition to causing production curtailments, capacity constraints can also reduce the price we receive for the crude oil, natural gas, and NGLs we produce.
We rely on third parties to continue to construct additional midstream facilities and related infrastructure to accommodate our growth, and the ability and willingness of those parties to do so is subject to a variety of risks. For example:
• | Decreases in commodity prices in recent years have resulted in reduced investment in midstream facilities by some third parties; |
• | Various interest groups have protested the construction of new pipelines, and particularly pipelines near water bodies, in various places throughout the country, and protests have at times physically interrupted pipeline construction activities; and |
• | Some upstream energy companies have recently sought to reject volume commitment agreements with midstream providers in bankruptcy proceedings, and the risk that such efforts will succeed, or that upstream energy company counterparties will otherwise be unable or unwilling to satisfy their volume commitments, may have the effect of reducing investment in midstream infrastructure. |
Like other producers, we from time to time enter into volume commitments with midstream providers in order to induce them to provide increased capacity. If our production falls below the level required under these agreements, we could be subject to substantial penalties.
In order to attempt to alleviate some of the risks associated with the midstream services and facilities upon which we rely, we have pursued various means of addressing our midstream needs, including by entering into facility expansion agreements with our primary midstream provider in the Wattenberg Field in 2017. We may pursue additional options with respect to midstream matters, possibly through one or more joint ventures or monetization transactions. There can be no assurance that we will be able to negotiate and complete the transactions contemplated by our chosen strategy or that such transactions will provide us with the benefits we expect to obtain.
Our undeveloped acreage must be drilled before lease expiration to hold the acreage by production. In highly competitive markets for acreage, failure to drill sufficient wells to hold acreage could result in substantial lease renewal costs or, if renewal is not feasible, loss of our lease and prospective drilling opportunities.
Unless production is established within the spacing units covering our undeveloped acreage, our leases for such acreage will expire. The cost to renew such leases may increase significantly, and we may not be able to renew such leases on commercially reasonable terms or at all. As such, our actual drilling activities may differ materially from our current expectations, which could adversely affect our business. These risks are greater at times and in areas where the pace of our exploration and development activity slows. Our ability to drill and develop these locations depends on a number of uncertainties, including oil and natural gas prices, the availability and cost of capital, drilling and production costs, availability of drilling services and equipment, drilling results, lease expirations, gathering system and pipeline transportation constraints, access to and availability of water sourcing and distribution systems, regulatory approvals and other factors. These risks are currently greater for us in the Delaware Basin area than in our other operating areas as approximately one-third of our Delaware Basin acreage is currently scheduled to expire by mid-2019 unless the relevant leases are extended or adequate production is established.
A substantial part of our crude oil, natural gas, and NGLs production is located in the Wattenberg Field, making us vulnerable to risks associated with operating primarily in a single geographic area. In addition, we have a large amount of proved reserves attributable to a small number of producing formations.
Although we have significant leasehold positions in the Delaware Basin in Texas, our current production is primarily located in the Wattenberg Field in Colorado. Because our production is not as diversified geographically as many of our competitors, the success of our operations and our profitability may be disproportionately exposed to the effect of any regional events, including:
• | fluctuations in prices of crude oil, natural gas, and NGLs produced from the wells in the area; |
• | natural disasters such as the flooding that occurred in northern Colorado in September 2013; |
• | restrictive governmental regulations; and |
• | curtailment of production or interruption in the availability of gathering, processing, or transportation infrastructure and services, and any resulting delays or interruptions of production from existing or planned new wells. |
23
For example, bottlenecks in processing and transportation that have occurred in some recent periods in the Wattenberg Field have negatively affected our results of operations, and these adverse effects may be disproportionately severe to us compared to our more geographically diverse competitors. Similarly, the concentration of our producing assets within a small number of producing formations exposes us to risks, such as changes in field-wide rules that could adversely affect development activities or production relating to those formations. Such an event could have a material adverse effect on our results of operations and financial condition. In addition, in areas where exploration and production activities are increasing, as has been the case in recent years in the Wattenberg Field and the Delaware Basin, the demand for, and cost of, drilling rigs, equipment, supplies, chemicals, personnel, and oilfield services increase. Shortages or the high cost of drilling rigs, equipment, supplies, chemicals, personnel, or oilfield services could delay or adversely affect our development and exploration operations or cause us to incur significant expenditures that are not provided for in our capital forecast, which could have a material adverse effect on our business, financial condition or results of operations.
Certain of our properties are subject to land use restrictions, which could limit the manner in which we conduct our business.
Certain of our properties are subject to land use restrictions, including city ordinances, which could limit the manner in which we conduct our business. Such restrictions could affect, among other things, our access to and the permissible uses of our facilities as well as the manner in which we produce oil and natural gas, and may restrict or prohibit drilling in general. The costs we incur to comply with such restrictions may be significant, and we may experience delays or curtailment in the pursuit of development activities and may be precluded from drilling wells in some areas.
We may incur losses as a result of title defects in the properties in which we invest or acquire.
It is our practice in acquiring oil and gas leases or interests not to incur the expense of retaining lawyers to examine the title to the mineral interest at the time of acquisition. Rather, we rely upon the judgment of oil and gas lease brokers or landmen who perform record title examinations before we acquire oil and gas leases and related interests. The existence of a material title deficiency can render a lease worthless and can adversely affect our results of operations and financial condition. While we typically obtain title opinions prior to commencing drilling operations on a lease or in a unit, the failure of title may not be discovered until after a well is drilled, in which case we may lose the lease and the right to produce all or a portion of the minerals under the property.
We are subject to complex federal, state, local, and other laws and regulations that adversely affect the cost and manner of doing business.
Our exploration, development, production, and marketing operations are regulated extensively at the federal, state, and local levels. Environmental and other governmental laws and regulations have increased the costs of planning, designing, drilling, installing, operating, and abandoning crude oil and natural gas wells and associated facilities. Under these laws and regulations, we could also be liable for personal injuries, property damage, and natural resource or other damages, and could be required to change, suspend or terminate operations. Similar to our competitors, we incur substantial operating and capital costs to comply with such laws and regulations. These costs may put us at a competitive disadvantage compared to larger companies in the industry which can more easily capture economies of scale with respect to compliance. A summary of certain laws and regulations that apply to us is set forth in Items 1 and 2 - Business and Properties - Governmental Regulation.
In June 2017, the U.S. Department of Justice, on behalf of the EPA and the State of Colorado, filed a complaint against us, claiming that we failed to operate and maintain certain condensate collection equipment at 65 facilities so as to minimize leakage of volatile organic compounds in compliance with applicable law. In October 2017, we entered into a consent decree to resolve the lawsuit. Pursuant to the consent decree, we agreed to implement a variety of operational enhancements and mitigation and similar projects, including vapor control system modifications and verification, increased inspection and monitoring, and installation of tank pressure monitors. If we fail to comply fully with the requirements of the consent decree with respect to those matters, we could be subject to additional liability. In addition, we could be the subject of other enforcement actions by regulatory authorities in the future relating to our past, present or future operations. See the footnote titled Commitments and Contingencies - Litigation and Legal Items to our consolidated financial statements included elsewhere in this report for further information regarding this litigation.
A major risk inherent in our drilling plans is the possibility that we will be unable to obtain needed drilling permits from relevant governmental authorities in a timely manner. Our ability to obtain the permits needed to pursue our development plans may be impacted by a variety of factors, including opposition by landowners or interest groups. Delays in obtaining regulatory approvals or drilling permits, the failure to obtain a drilling permit for a well, or the receipt of a permit with
24
unreasonable or unexpected conditions or costs could have a material adverse effect on our ability to explore or develop our properties.
Changes in laws and regulations applicable to us could increase our costs, impose additional operating restrictions or have other adverse effects on us.
The regulatory environment in which we operate changes frequently, often through the imposition of new or more stringent environmental and other requirements. We cannot predict the nature, timing or effect of such additional requirements, but they may have a variety of adverse effects on us. The types of regulatory changes that could impact our operations vary widely and include, but are not limited to, the following:
• | Substantially all of our drilling activities involve the use of hydraulic fracturing, and proposals are made from time to time at the federal, state and local levels to further regulate, or to ban, hydraulic fracturing practices. Additional laws or regulations regarding hydraulic fracturing could, among other things, increase our costs, reduce our inventory of economically viable drilling locations and reduce our reserves. |
• | Federal and various state, local and regional governmental authorities have implemented, or considered implementing, regulations that seek to limit or discourage the emission of carbon, methane and other greenhouse gases ("GHGs"). For example, the EPA has made findings and issued regulations that require us to establish and report an inventory of greenhouse gas emissions, and the state of Colorado has adopted rules regulating methane emissions from oil and gas operations. In addition, the Obama administration reached an agreement during the December 2015 United Nations climate change conference in Paris pursuant to which the United States initially pledged to make a 26 percent to 28 percent reduction in its GHG emissions by 2025 against a 2005 baseline (although President Trump subsequently announced that the United States is withdrawing from the Paris Agreement). Additional laws or regulations intended to restrict the emission of GHGs could require us to incur additional operating costs and could adversely affect demand for the oil, natural gas and NGLs that we sell. These new laws or rules could, among other things, require us to install new emission controls on our equipment and facilities, acquire allowances to authorize our GHG emissions, pay taxes related to our emissions and administer and manage a GHG emissions program. |
• | From time to time ballot initiatives have been proposed in Colorado that would adversely affect our operations. For example, during 2016, interest groups in Colorado opposed to oil and natural gas development generally, and hydraulic fracturing in particular, advanced two initiatives: (i) a “local control” initiative that would have amended the state constitution to give city, town, and county governments the right to regulate, or to ban, oil and gas development and production within their boundaries, notwithstanding rules and approvals to the contrary at the state level, and (ii) a “setback” initiative that would have amended the state constitution to require all new oil and gas development facilities to be located at least 2,500 feet away from any occupied structure or broadly defined “area of special concern”. If implemented, the setback initiative would have effectively prohibited the vast majority of our planned future drilling activities in Colorado and would therefore have made it impossible to pursue our current development plans. The local control proposal would potentially have had a similar effect, depending on the nature and extent of regulations implemented by relevant local governmental authorities. These proposals ultimately did not appear on the November 2016 ballot but it is likely that similar proposals will be made in 2018 and in future years. Similar proposals may also be made in other states. |
• | A recently-adopted ballot initiative that would make it more difficult to implement certain types of ballot initiatives in the future is currently the subject of a legal challenge and may be invalidated. |
• | Proposals are made from time to time to amend U.S. federal and state income tax laws in ways that would be adverse to us, including by eliminating certain key U.S. federal income tax preferences currently available with respect to crude oil and natural gas exploration and production. The changes could include (i) the repeal of the percentage depletion deduction for crude oil and natural gas properties, (ii) the elimination of current deductions for intangible drilling and development costs, (iii) the elimination of the deduction for certain U.S. production activities and (iv) an extension of the amortization period for certain geological and geophysical expenditures. Also, state severance taxes may increase in the states in which we operate. This could adversely affect our existing operations in the relevant state and the economic viability of future drilling. |
• | The development of new environmental initiatives or regulations related to the acquisition, withdrawal, storage, and use of surface water or groundwater, or treatment and discharge of water waste, may limit our ability to use techniques such as hydraulic fracturing, increase our development and operating costs and cause delays, |
25
interruptions or termination of our operations, any of which could have an adverse effect on our operations and financial condition.
See Items 1 and 2, Business and Properties - Governmental Regulation for a summary of certain laws and regulations that currently apply to us. Any of such laws and regulations could be amended, and new laws or regulations could be implemented, in a way that adversely affects our operations.
In addition, the election of President Trump has resulted in uncertainty with respect to the future regulatory environment affecting the oil and natural gas industry. This uncertainty may affect how our industry is regulated as well as the level of public interest in environmental protection and may result in new or different pressures being exerted. For example, public interest groups may increase their use of litigation as a means of continuing to exert pressure on the oil and natural gas industry. Accordingly, while we expect regulatory and enforcement pressures on our business to continue at federal, state, and local levels, the nature, level, and source of such pressures may change.
Our ability to produce crude oil, natural gas, and NGLs economically and in commercial quantities could be impaired if we are unable to acquire adequate supplies of water for our drilling and completion operations or are unable to dispose of or recycle the water we use at a reasonable cost and within applicable environmental rules.
Drilling and development activities such as hydraulic fracturing require the use of water and result in the production of wastewater. Our operations could be adversely impacted if we are unable to locate sufficient amounts of water or dispose of or recycle water used in our exploration and production operations. The quantity of water required in certain completion operations, such as hydraulic fracturing, and changing regulations governing usage may lead to water constraints and supply concerns, particularly in relatively arid climates such as eastern Colorado and western Texas.
As we turn-in-line wells in the Delaware Basin, we are seeing a greater volume of water recovery and production than originally anticipated. Our operations depend on being able to reuse or dispose of wastewater in a timely and economic fashion. Wastewater from oil and gas operations is often disposed of through underground injection. An increased number of earthquakes have been detected in the Delaware Basin in recent years. Some studies have linked earthquakes, or induced seismicity, in certain areas to underground injection, which is leading to increased public and regulatory scrutiny of injection safety.
Reduced commodity prices could result in significant impairment charges and significant downward revisions of proved reserves.
Commodity prices are volatile. Significant and rapid declines in prices have occurred in the past and may occur in the future. Low commodity prices could result in, among other things, significant impairment charges. The cash flow model we use to assess properties for impairment includes numerous assumptions, such as management’s estimates of future oil and gas production and commodity prices, the outlook for forward commodity prices and operating and development costs. All inputs to the cash flow model must be evaluated at each date the estimate of future cash flows for each producing basin is calculated. However, a significant decrease in long-term forward prices alone could result in a significant impairment for our properties that are sensitive to declines in prices. We have incurred impairment charges in a number of recent periods, including charges of $251.6 million to write down assets and $75.1 million to impair goodwill associated with our acquisition in the Delaware Basin in 2017 and $150.3 million to write down our Utica Shale producing and non-producing crude oil and natural gas properties to their estimated fair value in 2015. Similar charges could occur in the future.
Our estimated reserves are based on many assumptions that may turn out to be inaccurate. Any material inaccuracies in these reserve estimates or underlying assumptions may materially affect the quantities and present value of our reserves.
Calculating reserves for crude oil, natural gas, and NGLs requires subjective estimates of remaining volumes of underground accumulations of hydrocarbons. Assumptions are also made concerning commodity prices, production levels, and operating and development costs over the economic life of the properties. As a result, estimated quantities of proved reserves and projections of future production rates and the timing of development expenditures may be inaccurate. Independent petroleum engineers prepare our estimates of crude oil, natural gas, and NGLs reserves using pricing, production, cost, tax and other information that we provide. The reserve estimates are based on assumptions regarding commodity prices, production levels, and operating and development costs that may prove to be incorrect. Any significant variance from these assumptions to actual results could greatly affect:
• | the economically recoverable quantities of crude oil, natural gas, and NGLs attributable to any particular group of properties; |
26
• | future depreciation, depletion, and amortization (“DD&A”) rates and amounts; |
• | impairments in the value of our assets; |
• | the classifications of reserves based on risk of recovery; |
• | estimates of future net cash flows; |
• | timing of our capital expenditures; and |
• | the amount of funds available for us to borrow under our revolving credit facility. |
Some of our reserve estimates must be made with limited production histories, which renders these estimates less reliable than those based on longer production histories. Further, reserve estimates are based on the volumes of crude oil, natural gas, and NGLs that are anticipated to be economically recoverable from a given date forward based on economic conditions that exist at that date. The actual quantities of crude oil, natural gas, and NGLs recovered will be different than the reserve estimates since they will not be produced under the same economic conditions as are used for the reserve calculations. In addition, quantities of probable and possible reserves by definition are inherently more risky than proved reserves, in part because they have greater uncertainty associated with the recoverable quantities of hydrocarbons.
At December 31, 2017, approximately 68 percent of our estimated proved reserves were undeveloped. These reserve estimates reflect our plans to make significant capital expenditures to convert our PUDs into proved developed reserves, including approximately $2.8 billion during the five years ending December 31, 2022, as estimated in the calculation of the standardized measure of oil and gas activity. The estimated development costs may not be accurate, development may not occur as scheduled and results may not be as estimated. If we choose not to develop PUDs, or if we are not otherwise able to successfully develop them, we will be required to remove the associated volumes from our reported proved reserves. In addition, under the SEC’s reserve reporting rules, PUDs generally may be booked only if they relate to wells scheduled to be drilled within five years of the date of initial booking, and we may therefore be required to downgrade any PUDs that are not developed within this five-year time frame.
The present value of the estimated future net cash flows from our proved reserves is not necessarily the same as the current market value of those reserves. Pursuant to SEC rules, the estimated discounted future net cash flows from our proved reserves, and the estimated quantity of those reserves, are based on the prior year’s first day of the month 12-month average crude oil and natural gas index prices. However, factors such as actual prices we receive for crude oil and natural gas and hedging instruments, the amount and timing of actual production, the amount and timing of future development costs, the supply of and demand for crude oil, natural gas, and NGLs, and changes in governmental regulations or taxation, also affect our actual future net cash flows from our properties. The timing of both our production and incurrence of expenses in connection with the development and production of crude oil and natural gas properties will affect the timing of actual future net cash flows from proved reserves, and thus their actual present value. In addition, the 10 percent discount factor we use when calculating discounted future net cash flows (the rate required by the SEC) may not be the most appropriate discount factor based on interest rates currently in effect and risks associated with our properties or the industry in general.
Unless reserves are replaced as they are produced, our reserves and production will decline, which would adversely affect our future business, financial condition and results of operations. We may not be able to develop our identified drilling locations as planned.
Producing crude oil, natural gas, and NGL reservoirs are generally characterized by declining production rates that vary depending upon reservoir characteristics and other factors. The rate of decline may change over time and may exceed our estimates. Our future reserves and production and, therefore, our cash flows and income, are highly dependent on our ability to efficiently develop and exploit our current reserves and to economically find or acquire additional recoverable reserves. We may not be able to develop, discover, or acquire additional reserves to replace our current and future production at acceptable costs. Our failure to do so would adversely affect our future operations, financial condition and results of operations.
We have identified a number of well locations as an estimation of our future multi-year drilling activities on our existing acreage. These well locations represent a significant part of our growth strategy. Our ability to drill and develop these locations depends on a number of uncertainties, including:
• | crude oil, natural gas, and NGL prices; |
• | the availability and cost of capital; |
• | drilling and production costs; |
• | availability of drilling services and equipment; |
• | drilling results; |
• | lease expirations or limitations as to depth; |
• | midstream constraints; |
27
• | access to and availability of water sourcing and distribution systems; |
• | regulatory approvals; and |
• | other factors. |
Because of these factors, we do not know if the numerous potential well locations we have identified will ever be drilled or if we will be able to produce crude oil, natural gas, or NGLs from these or any other potential well locations. In addition, the number of drilling locations available to us will depend in part on the spacing of wells in our operating areas. An increase in well density in an area could result in additional locations in that area, but a reduced production performance from the area on a per-well basis. Further, certain of the horizontal wells we intend to drill in the future may require pooling of our lease interests with the interests of third parties. Some states, including Colorado, allow the involuntary pooling of tracts in a relatively broad number of circumstances in order to facilitate exploration. Other states, including Texas, restrict involuntary pooling to a narrower set of circumstances and consequently these states rely primarily on voluntary pooling of lands and leases. In states where pooling is accomplished primarily on a voluntary basis, it may be more difficult to form units and, therefore, more difficult to fully develop a project if we own less than all the leasehold or one or more of our leases does not provide the necessary pooling authority. If third parties are unwilling to pool their interests with ours, we may be unable to require such pooling on a timely basis or at all, and this would limit the total locations we can drill. Further, the number of available locations will depend in part on the expected lateral lengths of the wells we drill. Because the intended lateral length of a well is subject to change for a variety of reasons, our estimated drilling locations will change over time. For this or numerous other reasons, our actual drilling activities may materially differ from those presently identified.
Our inventory of drilling projects includes locations in addition to those that we currently classify as proved, probable, and possible. The development of and results from these additional projects are more uncertain than those relating to probable and possible locations, and significantly more uncertain than those relating to proved locations. We have generally accelerated the pace of our development activities in the Wattenberg Field over the past several years, and this has reduced our related inventory of drilling locations.
The wells we drill may not yield crude oil, natural gas, or NGLs in commercially viable quantities and productive wells may be less successful than we expect.
A prospect is a property on which our geologists have identified what they believe, based on available information, to be indications of hydrocarbon-bearing rocks. However, given the limitations of available data and technology, our geologists cannot know conclusively prior to drilling and testing whether crude oil, natural gas, or NGLs will be present in sufficient quantities to repay drilling or completion costs and generate a profit. Furthermore, even when properly used and interpreted, 2-D and 3-D seismic data and visualization techniques do not enable our geologists to be certain as to the quantity of the hydrocarbons in those structures. In addition, the use of 3-D seismic and other advanced technologies requires greater pre-drilling expenditures than traditional drilling strategies, and we could incur greater drilling and testing expenses as a result of such expenditures, which may result in a reduction in our returns or losses. As a result, our drilling activities may not be successful or economical, and our overall drilling success rate or our drilling success rate for activities in a particular area could decline. If a well is determined to be dry or uneconomic, which can occur even though it contains some crude oil, natural gas, or NGLs, it is classified as a dry hole and must be plugged and abandoned in accordance with applicable regulations. This generally results in the loss of the entire cost of drilling and completion to that point, the cost of plugging, and lease costs associated with the prospect. Even wells that are completed and placed into production may not produce sufficient crude oil, natural gas, and NGLs to be profitable, or they may be less productive and/or profitable than we expected. In some recent periods we have been able to achieve reductions in drilling and completion costs in connection with lower commodity prices. However, as commodity prices have increased since mid-2016, many of these costs have increased, and further increases are expected. If we drill a dry hole or unprofitable well on a current or future prospect, or if drilling or completion costs increase, the profitability of our operations will decline and the value of our properties will likely be reduced. Exploratory drilling is typically subject to substantially greater risk than development drilling. In addition, initial results from a well are not necessarily indicative of its performance over a longer period.
Drilling for and producing crude oil, natural gas, and NGLs are high risk activities with many uncertainties that could adversely affect our business, financial condition and results of operations.
28
Drilling activities are subject to many risks, including the risk that we will not discover commercially productive reservoirs. Drilling can be unprofitable, not only due to dry holes, but also due to curtailments, delays, or cancellations as a result of other factors, including:
• | unusual or unexpected geological formations; |
• | pressures; |
• | fires; |
• | floods; |
• | loss of well control; |
• | loss of drilling fluid circulation; |
• | title problems; |
• | facility or equipment malfunctions; |
• | unexpected operational events; |
• | shortages or delays in the delivery of equipment and services; |
• | unanticipated environmental liabilities; |
• | compliance with environmental and other governmental requirements; and |
• | adverse weather conditions. |
Any of these risks can cause substantial losses, including personal injury or loss of life, damage to or destruction of property, natural resources and equipment, pollution, environmental contamination or loss of wells, and regulatory penalties. For example, a loss of containment of hydrocarbons during drilling activities could potentially subject us to civil and/or criminal liability and the possibility of substantial costs, including for environmental remediation. We maintain insurance against various losses and liabilities arising from our operations; however, insurance against certain operational risks may not be available or may be prohibitively expensive relative to the perceived risks presented. For example, we may not have coverage with respect to a pollution event if we are unaware of the event while it is occurring and are therefore unable to report the occurrence of the event to our insurance company within the time frame required under our insurance policy. Thus, losses could occur for uninsurable or uninsured risks or for amounts in excess of existing insurance coverage. The occurrence of an event that is not fully covered by insurance and/or governmental or third party responses to an event could have a material adverse effect on our business activities, financial condition and results of operations. We are currently involved in various remedial and investigatory activities at some of our wells and related sites.
Prior to 2012, most of the wells we drilled were vertical wells. Since 2012, however, we have devoted the majority of our capital to drilling horizontal wells. Drilling horizontal wells is technologically more difficult than drilling vertical wells - including as a result of risks relating to our ability to fracture stimulate the planned number of stages and to successfully run casing the length of the well bore - and the risk of failure is therefore greater than the risk involved in drilling vertical wells. Additionally, drilling a horizontal well is typically far costlier than drilling a vertical well. This means that the risks of our drilling program will be spread over a smaller number of wells, and that, in order to be economic, each horizontal well will need to produce at a higher level in order to cover the higher drilling costs. Similarly, the average lateral length of the horizontal wells we drill has generally been increasing. Longer-lateral wells are typically more expensive and require more time for preparation and permitting. In addition, we have transitioned to the use of multi-well pads instead of single-well sites. The use of multi-well pad drilling increases some operational risks because problems affecting the pad or a single well could adversely affect production from all of the wells on the pad. Pad drilling can also make our overall production, and therefore our revenue and cash flows, more volatile, because production from multiple wells on a pad will typically commence simultaneously. While we believe that we will be better served by drilling horizontal wells using multi-well pads, the risk component involved in such drilling will be increased in some respects, with the result that we might find it more difficult to achieve economic success in our drilling program.
The inability of one or more of our customers or other counterparties to meet their obligations may adversely affect our financial results.
Substantially all of our accounts receivable result from our crude oil, natural gas, and NGLs sales or joint interest billings to a small number of third parties in the energy industry. This concentration of customers and joint interest owners may affect our overall credit risk in that these entities may be similarly affected by changes in economic and other conditions. In addition, our commodity derivatives expose us to credit risk in the event of nonperformance by counterparties. Nonperformance by our customers or derivative counterparties may adversely affect our financial condition and profitability. We face similar risks with respect to our other counterparties, including the lenders under our revolving credit facility and the providers of our insurance coverage.
Seasonal weather conditions and lease stipulations can adversely affect our operations.
29
Seasonal weather conditions and lease stipulations designed to prohibit or limit operations during crop-growing seasons and to protect wildlife affect operations in some areas. In certain areas drilling and other activities may be restricted or prohibited by lease stipulations, or prevented by weather conditions, for significant periods of time. This limits our operations in those areas and can intensify competition during the active months for drilling rigs, equipment, supplies, chemicals, personnel, and oilfield services, which may lead to additional or increased costs or periodic shortages. These constraints, and the resulting high costs or shortages, could delay our operations and materially increase operating and capital costs and therefore adversely affect our profitability. Similarly, hot weather during some recent periods adversely impacted the operation of certain midstream facilities, and therefore our production. Similar events could occur in the future and could negatively impact our results of operations and cash flows.
We have limited control over activities on properties in which we own an interest but we do not operate, which could reduce our production and revenues.
We operate approximately 87 percent of the wells in which we own an interest. If we do not operate a property, we do not have control over normal operating procedures, expenditures or future development of the property. The success and timing of drilling and development activities on properties operated by others therefore depends upon a number of factors outside of our control, including the operator’s timing and amount of capital expenditures, expertise (including safety and environmental compliance) and financial resources, inclusion of other participants in drilling wells, and use of technology. The failure by an operator to adequately perform operations, or an operator’s breach of the applicable agreements, could reduce production and revenues and adversely affect our profitability. These risks may be heightened during periods of depressed commodity prices as operators may propose operations that we believe to be economically unattractive, leading us to incur non-consent penalties. Our lack of control over non-operated properties also makes it more difficult for us to forecast capital expenditures, production and related matters
We participate in oil and gas leases with third parties who may not be able to fulfill their commitments to our projects.
We frequently own less than all of the working interest in the oil and gas leases on which we conduct operations. Financial risks are inherent in any operation where the cost of drilling, equipping, completing and operating wells is shared by more than one person. We could be held liable for joint activity obligations of other working interest owners, such as nonpayment of costs and liabilities, arising from the actions of the other owners. In addition, declines in oil, natural gas, and NGL prices may increase the likelihood that some of these working interest owners, particularly those that are smaller and less established, are not able to fulfill their joint activity obligations. A partner may be unable or unwilling to pay its share of project costs, and, in some cases, may declare bankruptcy. In the event any of our project partners does not pay their share of such costs, we would likely have to pay those costs, and we may be unsuccessful in any efforts to recover the costs from the partner. This could materially adversely affect our financial position.
We may not be able to keep pace with technological developments in our industry.
Our industry is characterized by rapid and significant technological advancements. As our competitors use or develop new technologies, we may be placed at a competitive disadvantage, and competitive pressures may force us to implement those or other new technologies at substantial cost. In addition, our competitors may have greater financial, technical, and personnel resources that allow them to enjoy technological advantages and may in the future allow them to implement new technologies before we can. We may not be able to respond to these competitive pressures and implement new technologies on a timely basis or at an acceptable cost. If one or more of the technologies we use now or in the future were to become obsolete or if we were unable to use the most advanced technology, our business, financial condition and results of operations could be materially adversely affected.
Competition in our industry is intense, which may adversely affect our ability to succeed.
Our industry is intensely competitive, and we compete with other companies that have greater resources. Many of these companies not only explore for and produce crude oil, natural gas, and NGLs, but also carry on refining operations and market petroleum and other products on a regional, national, or worldwide basis. These companies may be able to pay more for productive properties and exploratory prospects or define, evaluate, bid for and purchase a greater number of properties and prospects than we can. Our ability to acquire additional properties and to discover reserves in the future will be dependent upon our ability to evaluate and select suitable properties and to consummate transactions in a highly competitive environment. In addition, larger companies may have a greater ability to continue exploration activities during periods of low commodity prices. Larger competitors may also be able to absorb the burden of present and future federal, state, local, and other laws and regulations more easily than we can, which could adversely affect our competitive position. These factors could adversely affect our operations and our profitability.
30
Our success depends on key members of our management and our ability to attract and retain experienced technical and other professional personnel.
Our future success depends to a large extent on the services of our key employees. The loss of one or more of these individuals could have a material adverse effect on our business. Furthermore, competition for experienced technical and other professional personnel remains strong. If we cannot retain our current personnel or attract additional experienced personnel, our ability to compete could be adversely affected. Also, the loss of experienced personnel could lead to a loss of technical expertise.
A failure to complete successful acquisitions would limit our growth.
Because our crude oil and natural gas properties are depleting assets, our future reserves, production volumes, and cash flows depend on our success in developing and exploiting our current reserves efficiently and finding or acquiring additional recoverable reserves economically. In addition, we continue to strive to achieve greater efficiencies in our drilling program, and our ability to do so is dependent in part on our ability to complete asset exchanges and other acquisitions that allow us to increase our working interests in particular properties. When attractive opportunities arise, acquiring additional crude oil and natural gas properties, or businesses that own or operate such properties, is a significant component of our strategy. We may not be able to identify attractive acquisition opportunities. If we do identify an appropriate acquisition candidate, we may be unable to negotiate mutually acceptable terms with the seller, finance the acquisition or obtain the necessary regulatory approvals. It may be difficult to agree on the economic terms of a transaction, as a potential seller may be unwilling to accept a price that we believe to be appropriately reflective of prevailing economic conditions. If we are unable to complete suitable acquisitions, it will be more difficult to replace our reserves, and an inability to replace our reserves would have a material adverse effect on our financial condition and results of operations.
Acquisitions of properties are subject to the uncertainties of evaluating recoverable reserves and potential liabilities, including environmental uncertainties.
Acquisitions of producing and undeveloped properties have been an important part of our growth over time. We expect acquisitions will also contribute to our future growth. Successful acquisitions require an assessment of a number of factors, many of which are beyond our control. These factors include recoverable reserves, development potential, future commodity prices, operating costs, title issues, and potential environmental and other liabilities. Such assessments are inexact and their accuracy is inherently uncertain. In connection with our assessments, we generally perform engineering, environmental, geological, and geophysical reviews of the acquired properties that we believe are generally consistent with customary industry practices. However, such reviews are not likely to permit us to become sufficiently familiar with the properties to fully assess their deficiencies and capabilities. We do not inspect every well prior to an acquisition and our ability to evaluate undeveloped acreage is inherently imprecise. Even when we inspect a well, we may not always discover structural, subsurface, and environmental problems that may exist or arise. In some cases, our review prior to signing a definitive purchase agreement may be even more limited. In addition, we often acquire acreage without any warranty of title except as to claims made by, through or under the transferor.
When we acquire properties, we will generally have potential exposure to liabilities and costs for environmental and other problems existing on the acquired properties, and these liabilities may exceed our estimates. We may not be entitled to contractual indemnification associated with acquired properties. We often acquire interests in properties on an “as is” basis with no or limited remedies for breaches of representations and warranties. Therefore, we could incur significant unknown liabilities, including environmental liabilities or losses due to title defects, in connection with acquisitions for which we have limited or no contractual remedies or insurance coverage. In addition, the acquisition of undeveloped acreage is subject to many inherent risks and we may not be able to realize efficiently, or at all, the assumed or expected economic benefits of acreage that we acquire.
Additionally, significant acquisitions can change the nature of our operations depending upon the character of the acquired properties, which may have substantially different operating and geological characteristics or may be in different geographic locations than our existing properties. These factors can increase the risks associated with an acquisition. Acquisitions also present risks associated with the additional indebtedness that may be required to finance the purchase price, and any related increase in interest expense or other related charges.
Some of our acquisitions are structured as asset trades or exchanges. These transactions may give rise to any or all of the foregoing risks. In addition, transactions of this type create a risk that we will undervalue the properties we transfer to the counterparty in the trade or exchange or overvalue the properties we receive. Such an undervaluation or overvaluation would result in the transaction being less favorable to us than we expected.
31
We operate in a litigious environment. The cost of defending any suits brought against us, and any judgments or settlements resulting from such suits, could have an adverse effect on our results of operations and financial condition.
Like many oil and gas companies, we are from time to time involved in various legal and other proceedings, such as title, royalty or contractual disputes, employment litigation, regulatory compliance matters, and personal injury or property damage matters, in the ordinary course of our business. For example, in recent years, we have been subject to lawsuits regarding royalty practices and payments and matters relating to certain of our affiliated partnerships. As discussed in the footnote titled Commitments and Contingencies to our consolidated financial statements included elsewhere in this report, we are the subject of a recently filed lawsuit relating to our two remaining affiliated partnerships, and the strained financial condition of those partnerships makes additional litigation more likely. The outcome of legal proceedings is inherently uncertain. Regardless of the outcome, such proceedings could have an adverse impact on us because of legal costs, diversion of management attention and other factors. In addition, the resolution of such a proceeding could result in penalties or sanctions, settlement costs and/or judgments, consent decrees, or orders requiring a change in our business practices, any of which could materially and adversely affect our business, operating results and financial condition. Accruals for such liability, penalties, sanctions or costs may be insufficient. Judgments and estimates to determine accruals or the anticipated range of potential losses related to legal and other proceedings could change from one period to the next, and such changes could be material. Information regarding our legal proceedings can found in the footnote titled Commitments and Contingencies - Litigation and Legal Items to our consolidated financial statements included elsewhere in this report.
Our business could be negatively impacted by security threats, including cybersecurity threats, and other disruptions.
We face various security threats, including attempts by third parties to gain unauthorized access to competitive information or to render data or systems unusable; threats to the safety of our employees; threats to the security of our infrastructure or third party facilities and infrastructure, such as processing plants and pipelines; and threats from terrorist acts. There can be no assurance that the procedures and controls we use to monitor these threats and mitigate our exposure to them will be sufficient in preventing them from materializing.
Our industry has become increasingly dependent on digital technologies to conduct day-to-day operations, including certain exploration, development, and production activities. We depend on digital technology, including information systems and related infrastructure, as well as cloud applications and services, to store, transmit, process, and record sensitive information (including but not limited to trade secrets, employee information, and financial and operating data), communicate with our employees and business partners, and for many other activities related to our business. The complexity of the technologies needed to explore for and develop crude oil, natural gas, and NGLs make certain information more attractive to thieves.
As dependence on digital technologies has increased in our industry, cyber incidents, including deliberate attacks and unintentional events, have also increased. A cyber-attack could include an attempt to gain unauthorized access to digital systems for purposes of misappropriating assets or sensitive information, corrupting data, or causing operational disruption. “Phishing” and other types of attempts to obtain unauthorized information or access are often sophisticated and difficult to detect or defeat.
Our business partners, including vendors, service providers, operating partners, purchasers of our production, and financial institutions, are also dependent on digital technology. A vulnerability in the cybersecurity of one or more of our vendors could facilitate an attack on our systems.
Our technologies, systems and networks, and those of our business partners, may become the target of cyber-attacks or information security breaches that could result in the unauthorized release, gathering, monitoring, misuse, loss or destruction of proprietary and other information, theft of property or other disruption of our business operations. In addition, certain cyber incidents, such as surveillance, may remain undetected for an extended period. Although we have not suffered material losses related to cyber-attacks to date, if we were successfully attacked, we could incur substantial remediation and other costs or suffer other negative consequences, such as a loss of competitive information, critical infrastructure, personnel or capabilities essential to our operations. Events of this nature could have a material adverse effect on our reputation, financial condition, results of operations, or cash flows. Moreover, as the sophistication of cyber-attacks continues to evolve, we may be required to expend significant additional resources to further enhance our digital security or to remediate vulnerabilities.
The physical effects of climate change could disrupt our production and cause us to incur significant costs in preparing for or responding to those effects.
32
Many scientists believe that increasing concentrations of carbon dioxide, methane, and other GHGs in the Earth's atmosphere are changing global climate patterns. One consequence of climate change could be increased severity of extreme weather, such as increased hurricanes and floods. Flooding that occurred in Colorado in 2013 is an example of an extreme weather event that negatively impacted our operations. If such events were to continue to occur, or become more frequent, our operations could be adversely affected in various ways, including through damage to our facilities or from increased costs for insurance.
Another possible consequence of climate change is increased volatility in seasonal temperatures. The market for natural gas is generally improved by periods of colder weather and impaired by periods of warmer weather, so any changes in climate could affect the market for the fuels that we produce. Despite the use of the term “global warming” as a shorthand for climate change, some studies indicate that climate change could cause some areas to experience temperatures substantially colder than their historical averages. As a result, it is difficult to predict how the market for our production could be affected by increased temperature volatility, although if there is an overall trend of warmer temperatures, it would be expected to have an adverse effect on our business.
Risks Relating to Financial Matters
Our development and exploration operations require substantial capital, and we may be unable to obtain needed capital or financing on satisfactory terms, which could lead to a loss of properties and a decline in our production and reserves, and ultimately our profitability.
Our industry is capital intensive. We expect to continue to make substantial capital expenditures for the exploration, development, production and acquisition of crude oil, natural gas, and NGL reserves. To date, we have financed capital expenditures primarily with bank borrowings under our revolving credit facility, cash generated by operations and proceeds from capital markets transactions and the sale of properties. We intend to finance our future capital expenditures utilizing similar financing sources. Our cash flows from operations and access to capital are subject to a number of variables, including:
• | our proved reserves; |
• | the amount of crude oil, natural gas, and NGLs we are able to produce from existing wells; |
• | the prices at which crude oil, natural gas, and NGLs are sold; |
• | the costs to produce crude oil, natural gas, and NGLs; and |
• | our ability to acquire, locate and produce new reserves. |
If our revenues or the borrowing base under our revolving credit facility decrease as a result of lower commodity prices, operating difficulties or for any other reason, our need for capital from other sources could increase, and there can be no assurance that such other sources of capital would be available at that time on reasonable terms or at all. If we raise funds by issuing additional equity securities, this would have a dilutive effect on existing shareholders. If we raise funds through the incurrence of debt, the risks we face with respect to our indebtedness would increase and we would incur additional interest expense. Our inability to obtain sufficient financing on acceptable terms would adversely affect our financial condition and profitability.
We have a substantial amount of debt and the cost of servicing, and risks related to refinancing, that debt could adversely affect our business. Those risks could increase if we incur more debt.
We have a substantial amount of indebtedness outstanding. As a result, a significant portion of our cash flows will be required to pay interest and principal on our indebtedness, and we may not generate sufficient cash flows from operations, or have future borrowing capacity available, to enable us to repay our indebtedness or to fund other liquidity needs.
Servicing our indebtedness and satisfying our other obligations will require a significant amount of cash. Our cash flow from operating activities and other sources may not be sufficient to fund our liquidity needs. Our ability to pay interest and principal on our indebtedness and to satisfy our other obligations will depend on our future operating performance, our financial condition and the availability of refinancing indebtedness, which will be affected by prevailing economic conditions and financial, business and other factors, many of which are beyond our control. We cannot assure you that our business will generate sufficient cash flow from operations, or that sufficient future borrowings will be available to us under our revolving credit facility or otherwise, to fund our liquidity needs.
A substantial decrease in our operating cash flow or an increase in our expenses could make it difficult for us to meet debt service requirements and could require us to modify our operations, including by curtailing our exploration and drilling programs, selling assets, reducing our capital expenditures, refinancing all or a portion of our existing debt or obtaining
33
additional financing. These alternative measures may not be successful and may not permit us to meet our scheduled debt service obligations. Our ability to restructure or refinance our debt will depend on the condition of the capital markets and our financial condition at such time. Any refinancing of our debt could be at higher interest rates and may require us to comply with more onerous covenants, which could further restrict our business operations.
In addition, the terms of our debt agreements could restrict us from implementing some of these alternatives. In the absence of adequate cash from operations and other available capital resources, we could face substantial liquidity problems and might be required to dispose of material assets or operations to meet our debt service and other obligations. We may not be able to consummate these dispositions for fair market value, in a timely manner or at all. Furthermore, any proceeds that we could realize from any dispositions may not be adequate to meet our debt service obligations then due.
Covenants in our debt agreements currently impose, and future financing agreements may impose, significant operating and financial restrictions.
Our current debt agreements contain restrictions, and future financing agreements may contain additional restrictions, on our activities, including covenants that restrict our and our restricted subsidiaries’ ability to:
• | incur additional debt; |
• | pay dividends on, redeem or repurchase stock; |
• | create liens; |
• | make specified types of investments; |
• | apply net proceeds from certain asset sales; |
• | engage in transactions with our affiliates; |
• | engage in sale and leaseback transactions; |
• | merge or consolidate; |
• | restrict dividends or other payments from restricted subsidiaries; |
• | sell equity interests of restricted subsidiaries; and |
• | sell, assign, transfer, lease, convey or dispose of assets. |
Our revolving credit facility is secured by substantially all of our oil and gas properties as well as a pledge of all ownership interests in operating subsidiaries. The restrictions contained in our debt agreements may prevent us from taking actions that we believe would be in the best interest of our business, and may make it difficult for us to successfully execute our business strategy or effectively compete with companies that are not similarly restricted. We may also incur future debt obligations that subject us to additional restrictive covenants.
Our revolving credit facility has substantial restrictions and financial covenants and our ability to comply with those restrictions and covenants is uncertain. Our lenders can unilaterally reduce our borrowing availability based on anticipated commodity prices.
We expect to depend on our revolving credit facility for part of our future capital needs. The terms of the credit agreement require us to comply with certain financial covenants. Our ability to comply with these covenants in the future is uncertain and will be affected by the levels of cash flows from operations and events or circumstances beyond our control. Our failure to comply with any of the restrictions and covenants under the revolving credit facility or other debt agreements could result in a default under those agreements, which could cause all of our existing indebtedness to become immediately due and payable.
The revolving credit facility limits the amounts we can borrow to a borrowing base amount, determined by the lenders in their sole discretion based upon projected revenues from the properties securing their loan. Decreases in the price of crude oil, natural gas, or NGLs can be expected to have an adverse effect on the borrowing base. The lenders can unilaterally adjust the borrowing base and the borrowings permitted to be outstanding under the revolving credit facility. Outstanding borrowings in excess of the borrowing base must be repaid immediately unless we pledge other crude oil and natural gas properties as additional collateral. We do not currently have any substantial unpledged properties, and we may not have the financial resources in the future to make any mandatory principal prepayments required under the revolving credit facility. Our inability to borrow additional funds under our revolving credit facility could adversely affect our operations and our financial results.
34
If we are unable to comply with the restrictions and covenants in our debt agreements, the resulting default could lead to an acceleration of payment of funds that we have borrowed and we may not have or be able to obtain the funds necessary to repay those amounts.
Any default under the agreements governing our indebtedness, including a default under our revolving credit facility that is not waived by the required lenders, and the remedies sought by the holders of any such indebtedness, could make us unable to pay principal and interest on our indebtedness and satisfy our other obligations. If we are unable to generate sufficient cash flows and are otherwise unable to obtain the funds necessary to meet required payments of principal and interest on our indebtedness, or if we otherwise fail to comply with the various covenants, including financial and operating covenants, in the instruments governing our indebtedness, we could be in default under the terms of the agreements governing such indebtedness. In the event of such a default, the holders of such indebtedness could elect to declare all the funds borrowed thereunder to be due and payable, together with accrued and unpaid interest, the lenders under our revolving credit facility could elect to terminate their commitments, cease making further loans and institute foreclosure proceedings against our assets, and we could be forced into bankruptcy or liquidation. In addition, the default could result in a cross-default under other debt agreements. If our operating performance declines, we may in the future need to seek waivers from the required lenders under our revolving credit facility to avoid being in default and we may not be able to obtain such a waiver. If this occurs and no waiver is obtained, we would be in default under our revolving credit facility, the lenders could exercise their rights as described above, and we could be forced into bankruptcy or liquidation. We cannot assure you that we will be granted waivers or amendments to our debt agreements if for any reason we are unable to comply with these agreements, or that we will be able to refinance our debt on terms acceptable to us, or at all.
Our variable rate indebtedness subjects us to interest rate risk, which could cause our debt service obligations to increase significantly.
Borrowings under our revolving credit facility bear interest at variable rates and expose us to interest rate risk. If interest rates increase, our debt service obligations on the variable rate indebtedness would increase although the amount borrowed remained the same, and our net income and cash available for servicing our indebtedness and for other purposes would decrease.
Notwithstanding our current indebtedness levels and restrictive covenants, we may still be able to incur substantial additional debt, which could exacerbate the risks described above.
We may be able to incur additional debt in the future. Although our debt agreements contain restrictions on our ability to incur indebtedness, those restrictions are subject to a number of exceptions. In particular, we may borrow under the revolving credit facility. We may also consider investments in joint ventures or acquisitions that may increase our indebtedness. Adding new debt to current debt levels could intensify the related risks that we and our subsidiaries now face.
Under the “successful efforts” accounting method that we use, unsuccessful exploratory wells must be expensed in the period in which they are determined to be non-productive, which reduces our net income in such periods.
We conduct exploratory drilling in order to identify additional opportunities for future development. Under the “successful efforts” method of accounting that we use, the cost of unsuccessful exploratory wells must be charged to expense in the period in which the wells are determined to be unsuccessful. In addition, lease costs for acreage condemned by the unsuccessful well must also be expensed. In contrast, unsuccessful development wells are capitalized as a part of the investment in the field where they are located. The costs of unsuccessful exploratory wells could result in a significant reduction in our profitability in periods in which the costs are required to be expensed.
Our commodity derivative activities could result in financial losses or reduced income from failure to perform by our counterparties, could limit our potential gains from increases in prices and could result in volatility in our net income.
We use commodity derivatives for a portion of the production from our own wells and for natural gas purchases and sales by our marketing subsidiary to achieve more predictable cash flows, to reduce exposure to adverse fluctuations in commodity prices, and to allow our natural gas marketing company to offer pricing options to natural gas sellers and purchasers. These arrangements expose us to the risk of financial loss in some circumstances, including when purchases or sales are different than expected or the counterparty to the commodity derivative contract defaults on its contractual obligations. In addition, many of our commodity derivative contracts are based on WTI or another crude oil or natural gas index price. The risk that the differential between the index price and the price we receive for the relevant production may change unexpectedly makes it more difficult to hedge effectively and increases the risk of a hedging-related loss. Also, commodity derivative arrangements may limit the benefit we would otherwise receive from increases in the prices for the relevant commodity, and they may require the use of our resources to meet cash margin requirements.
35
At December 31, 2017, we had hedged a total of 18,484 MBbls of crude oil and 56,510 BBtu of natural gas for 2018 and 2019. These hedges may be inadequate to protect us from continuing and prolonged declines in crude oil and natural gas prices, and our current hedge position is smaller, and its estimated fair value is lower, than our hedge position in some recent periods.
Since we do not designate our commodity derivatives as cash flow hedges, we do not currently qualify for use of hedge accounting; therefore, changes in the fair value of commodity derivatives are recorded in our income statements, and our net income is subject to greater volatility than it would be if our commodity derivative instruments qualified for hedge accounting. For instance, if commodity prices rise significantly, this could result in significant non-cash charges during the relevant period, which could have a material negative effect on our net income.
Our insurance coverage may not be sufficient to cover some liabilities or losses that we may incur.
The occurrence of a significant accident or other event that is not fully covered by insurance, not properly or timely noticed to our carrier, or that is in excess of our insurance coverage could have a material adverse effect on our operations and financial condition. Insurance does not protect us against all operational risks. We do not carry business interruption insurance at levels that would provide enough funds for us to continue operating without access to other funds. In addition, pollution and environmental risks are generally not fully insurable.
The price of our common stock has been and may continue to be highly volatile, which may make it difficult for shareholders to sell our common stock when desired or at attractive prices.
The market price of our common stock is highly volatile, and we expect it to continue to be volatile for the foreseeable future. Adverse events could trigger declines in the price of our common stock, including, among others:
• | changes in production volumes, worldwide demand and prices for crude oil and natural gas; |
• | changes in market prices of crude oil and natural gas; |
• | inability to hedge future production at the same pricing level as our current or prior hedges; |
• | changes in securities analysts’ estimates of our financial performance; |
• | fluctuations in stock market prices and volumes, particularly among securities of energy companies; |
• | changes in market valuations and valuation multiples of similar companies; |
• | changes in interest rates; |
• | announcements regarding adverse timing or lack of success in discovering, acquiring, developing, and producing crude oil and natural gas resources; |
• | announcements by us or our competitors of significant contracts, new acquisitions, discoveries, commercial relationships, joint ventures, or capital commitments; |
• | decreases in the amount of capital available to us, including as a result of borrowing base reductions and/or lenders ceasing to participate in our revolving credit facility syndicate; |
• | operating results that fall below market expectations or variations in our quarterly operating results; |
• | loss of a major customer; |
• | loss of a relationship with a partner; |
• | the identification of and severity of environmental events and governmental and other third-party responses to the events; or |
• | additions or departures of key personnel. |
External events, such as news concerning economic conditions, counterparties to our natural gas or crude oil derivatives arrangements, changes in government regulations impacting the crude oil and natural gas exploration and production industry or the movement of capital into or out of our industry, are also likely to affect the price of our common stock, regardless of our operating performance. For example, there have been recent efforts by some investment advisers, sovereign wealth funds, public pension funds, universities, and other investment groups to divest themselves from investments in companies involved in fossil fuel extraction, and these efforts could reduce the trading prices of our securities. Similarly, our stock price could be adversely affected by changes in the way that analysts and investors assess the geological and economic characteristics of the basins in which we operate. Furthermore, general market conditions, including the level of, and fluctuations in, the trading prices of stocks generally could affect the price of our common stock. The stock markets regularly experience price and volume volatility that affects many companies’ stock prices without regard to the operating performance of those companies. Volatility of this type may affect the trading price of our common stock. Similar factors could also affect the trading prices of our senior notes.
36
We have identified material weaknesses in our internal control over financial reporting which could, if not remediated, result in material misstatements in our financial statements.
As disclosed in Item 9A - Controls and Procedures, management identified certain material weaknesses in our internal control over precision of the review of supporting documentation regarding the completeness and accuracy of certain land administrative records. Because of these material weaknesses, our management concluded that we did not maintain effective internal control over financial reporting as of December 31, 2017. A material weakness is a deficiency, or combination of deficiencies, in internal control over financial reporting, such that there is a reasonable possibility that a material misstatement of the annual or interim financial statements will not be prevented or detected on a timely basis.
With the oversight of the audit committee, we have begun taking steps to remediate the underlying cause of these material weaknesses and improve the design of controls. We cannot assure you that we will adequately remediate the material weaknesses or that additional material weaknesses in our internal controls will not be identified in the future. Any failure to maintain or implement required new or improved controls, or any difficulties we encounter in their implementation, could result in additional material weaknesses, or could result in material misstatements in our financial statements. These misstatements could result in restatements of our financial statements, cause us to fail to meet our reporting obligations, or cause investors to lose confidence in our reported financial information. Further and continued determinations that there are material weaknesses in the effectiveness of our internal controls could reduce our ability to obtain financing or could increase the cost of any financing we obtain and require additional expenditures of resources to comply with applicable requirements.
Derivatives legislation and regulation could adversely affect our ability to hedge crude oil and natural gas prices and increase our costs and adversely affect our profitability.
In July 2010, the Dodd-Frank Wall Street Reform and Consumer Protection Act (the “Dodd-Frank Act”) was enacted into law. The Dodd-Frank Act regulates derivative transactions, including our commodity hedging swaps, and could have a number of adverse effects on us, including the following:
• | The Dodd-Frank Act may limit our ability to enter into hedging transactions, thus exposing us to additional risks related to commodity price volatility; commodity price decreases would then have an increased adverse effect on our profitability and revenues. Reduced hedging may also impair our ability to have certainty with respect to a portion of our cash flows, which could lead to decreases in capital spending and, therefore, decreases in future production and reserves. |
• | If, as a result of the Dodd-Frank Act or its implementing regulations, we are required to post cash collateral in connection with our derivative positions, this would likely make it impracticable to implement our current hedging strategy. |
• | Our derivatives counterparties are subject to significant requirements imposed as a result of the Dodd-Frank Act. We expect that these requirements will increase the cost to hedge because there will be fewer counterparties in the market and increased counterparty costs will be passed on to us. |
The above factors could also affect the pricing of derivatives and make it more difficult for us to enter into hedging transactions on favorable terms.
37
ITEM 1B. UNRESOLVED STAFF COMMENTS
None.
ITEM 3. LEGAL PROCEEDINGS
Information regarding our legal proceedings can found in the footnote titled Commitments and Contingencies - Litigation and Legal Items to our consolidated financial statements included elsewhere in this report.
ITEM 4. MINE SAFETY DISCLOSURES
Not applicable.
38
PART II
ITEM 5. MARKET FOR THE REGISTRANT'S COMMON EQUITY, RELATED STOCKHOLDERS MATTERS, AND ISSUER PURCHASES OF EQUITY SECURITIES
Our common stock, par value $0.01 per share, is traded on the NASDAQ Global Select Market under the symbol PDCE. The following table sets forth the range of high and low sales prices for our common stock based on intra-day trading for each of the periods presented:
High | Low | ||||||
January 1 - March 31, 2016 | $ | 60.56 | $ | 42.68 | |||
April 1 - June 30, 2016 | 65.86 | 51.92 | |||||
July 1 - September 30, 2016 | 71.00 | 50.12 | |||||
October 1 - December 31, 2016 | 84.88 | 59.82 | |||||
January 1 - March 31, 2017 | 78.61 | 60.27 | |||||
April 1 - June 30, 2017 | 65.99 | 40.12 | |||||
July 1 - September 30, 2017 | 50.51 | 36.74 | |||||
October 1 - December 31, 2017 | 53.41 | 41.13 | |||||
As of February 15, 2018, we had approximately 589 stockholders of record. Since inception, no cash dividends have been declared on our common stock. Cash dividends are restricted under the terms of our revolving credit facility as well as the indentures governing our 6.125% senior notes due September 15, 2024 (the "2024 Senior Notes") and our 2026 Senior Notes, and we presently intend to continue a policy of using retained earnings for the expansion of our business.
The following table presents information about our purchases of our common stock during the three months ended December 31, 2017:
Period | Total Number of Shares Purchased (1) | Average Price Paid per Share | |||||
October 1 - 31, 2017 | 5,636 | $ | 48.88 | ||||
November 1 - 30, 2017 | — | — | |||||
December 1 - 31, 2017 | 21,301 | 50.68 | |||||
Total fourth quarter 2017 purchases | 26,937 | 50.30 | |||||
__________
(1) | Purchases primarily represent shares purchased from employees for the payment of their tax liabilities related to the vesting of securities issued pursuant to our stock-based compensation plans. |
39
STOCKHOLDER PERFORMANCE GRAPH
The performance graph below compares the cumulative total return of our common stock over the five-year period ended December 31, 2017 with the cumulative total returns for the same period for the Standard and Poor's ("S&P") 500 Index and the Standard Industrial Code ("SIC") Index. The SIC Index is a weighted composite of 233 crude petroleum and natural gas companies. The cumulative total stockholder return assumes that $100 was invested, including reinvestment of dividends, if any, in our common stock on December 31, 2012, and in the S&P 500 Index and the SIC Index on the same date. The results shown in the graph below are not necessarily indicative of future performance.
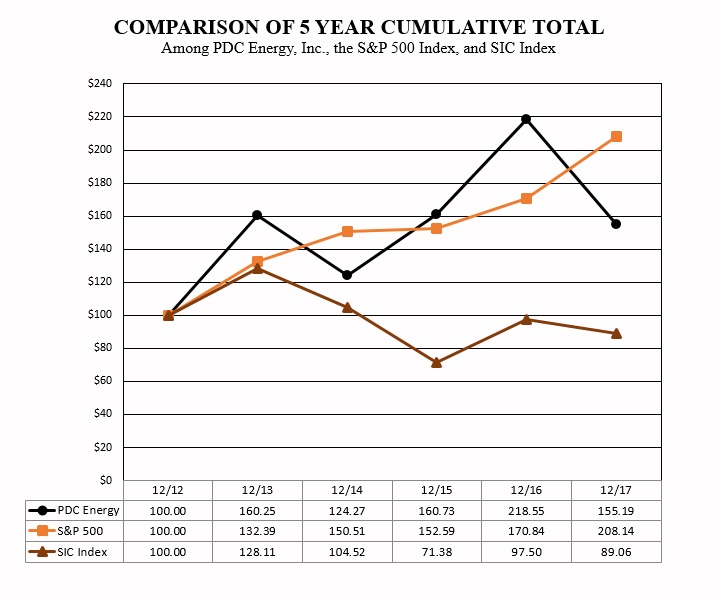
40
ITEM 6. SELECTED FINANCIAL DATA
Year Ended/As of December 31, | ||||||||||||||||||||
2017 | 2016 (1) | 2015 | 2014 | 2013 | ||||||||||||||||
(in millions, except per share data and as noted) | ||||||||||||||||||||
Statement of Operations (From Continuing Operations) (2): | ||||||||||||||||||||
Crude oil, natural gas, and NGLs sales | $ | 913.1 | $ | 497.4 | $ | 378.7 | $ | 471.4 | $ | 340.8 | ||||||||||
Commodity price risk management gain (loss), net | (3.9 | ) | (125.7 | ) | 203.2 | 310.3 | (23.9 | ) | ||||||||||||
Total revenues | 921.6 | 382.9 | 595.3 | 856.2 | 392.7 | |||||||||||||||
Income (loss) from continuing operations | (127.5 | ) | (245.9 | ) | (68.3 | ) | 107.3 | (21.1 | ) | |||||||||||
Earnings per share from continuing operations: | ||||||||||||||||||||
Basic | $ | (1.94 | ) | $ | (5.01 | ) | $ | (1.74 | ) | $ | 3.00 | $ | (0.65 | ) | ||||||
Diluted | (1.94 | ) | (5.01 | ) | (1.74 | ) | 2.93 | (0.65 | ) | |||||||||||
Statement of Cash Flows: | ||||||||||||||||||||
Net cash flows from: | ||||||||||||||||||||
Operating activities | $ | 588.6 | $ | 486.3 | $ | 411.1 | $ | 236.7 | $ | 159.2 | ||||||||||
Investing activities | (717.0 | ) | (1,509.1 | ) | (604.3 | ) | (474.1 | ) | (217.1 | ) | ||||||||||
Financing activities | 65.0 | 1,266.1 | 178.0 | 60.3 | 248.7 | |||||||||||||||
Capital expenditures from development and exploration activities (3) | 737.2 | 436.9 | 599.5 | 623.8 | 384.7 | |||||||||||||||
Acquisitions of crude oil and natural gas properties, including settlement adjustments and deposit for pending acquisition | 15.6 | 1,073.7 | — | — | 9.7 | |||||||||||||||
Balance Sheet: | ||||||||||||||||||||
Total assets | $ | 4,419.9 | $ | 4,485.8 | $ | 2,370.5 | $ | 2,331.1 | $ | 1,991.7 | ||||||||||
Working capital (deficit) | (16.4 | ) | 129.2 | 30.7 | 89.5 | 90.0 | ||||||||||||||
Total debt, net of unamortized discount and debt issuance costs | 1,151.9 | 1,044.0 | 642.4 | 655.5 | 593.9 | |||||||||||||||
Total equity | 2,507.6 | 2,622.8 | 1,287.2 | 1,137.4 | 967.6 | |||||||||||||||
Average Pricing and Production Expenses From Continuing Operations (per Boe and as a percent of sales for production taxes): | ||||||||||||||||||||
Sales price (excluding net settlements on derivatives) | $ | 28.69 | $ | 22.43 | $ | 24.64 | $ | 50.72 | $ | 52.23 | ||||||||||
Lease operating expenses | $ | 2.82 | $ | 2.70 | $ | 3.71 | $ | 4.56 | $ | 5.18 | ||||||||||
Transportation, gathering, and processing | $ | 1.04 | $ | 0.83 | $ | 0.66 | $ | 0.49 | $ | 0.79 | ||||||||||
Production taxes | $ | 1.91 | $ | 1.42 | $ | 1.20 | $ | 2.76 | $ | 3.33 | ||||||||||
Production taxes as a percent of sales | 6.6 | % | 6.3 | % | 4.9 | % | 5.4 | % | 6.4 | % | ||||||||||
Production (MBoe): | ||||||||||||||||||||
Production from continuing operations | 31,830 | 22,176 | 15,369 | 9,294 | 6,525 | |||||||||||||||
Production from discontinued operations | — | — | — | 1,093 | 2,032 | |||||||||||||||
Total production | 31,830 | 22,176 | 15,369 | 10,387 | 8,557 | |||||||||||||||
Total proved reserves (MMBoe) (4) | 452.9 | 341.4 | 272.8 | 250.1 | 265.8 | |||||||||||||||
______________
(1) | In 2016, we closed an acquisition in the Delaware Basin for aggregate consideration of approximately $1.76 billion. See footnotes titled Properties and Equipment - Delaware Basin Acreage Acquisition and Business Combination to our consolidated financial statements included elsewhere in this report for further information regarding this acquisition. |
(2) | In 2014, we completed the sale of our ownership interest in PDC Mountaineer, LLC ("PDCM"). Our proportionate share of PDCM's Marcellus Shale results of operations have been separately reported as discontinued operations. |
(3) | Includes impact of change in accounts payable related to capital expenditures. |
(4) | Includes total proved reserves related to our Marcellus Shale and shallow Upper Devonian Appalachian Basin assets of 40 MMBoe as of December 31, 2013. PDCM, which owned these reserves, was sold in late 2014. |
41
ITEM 7. MANAGEMENT'S DISCUSSION AND ANALYSIS OF FINANCIAL CONDITION AND RESULTS OF OPERATIONS
The following discussion and analysis should be read in conjunction with our consolidated financial statements and related notes thereto included elsewhere in this report. Further, we encourage you to revisit the Special Note Regarding Forward-Looking Statements in Part I of this report.
SUMMARY
2017 Financial Overview of Operations and Liquidity
Production volumes increased 44 percent to 31.8 MMBoe in 2017 compared to 2016, including 4.2 MMBoe contributed from the Delaware Basin assets that we acquired in December 2016. The increase in production volumes was primarily attributable to the continued success of our horizontal Niobrara and Codell drilling program in the Wattenberg Field and growing production from our horizontal Wolfcamp drilling program in our Delaware Basin properties. Crude oil production increased 48 percent in 2017, which comprised approximately 41 percent of our total production. Natural gas production increased 39 percent and NGLs increased 45 percent in 2017 compared to 2016. On a combined basis, total liquids production of crude oil and NGLs comprised 62 percent of production in 2017. For the month ended December 31, 2017, we maintained an average production rate of approximately 97,000 Boe per day, including approximately 18,000 Boe per day from the Delaware Basin, up from approximately 73,200 Boe per day, including approximately 6,000 Boe per day from the Delaware Basin, for the month ended December 31, 2016.
Crude oil, natural gas, and NGLs sales increased to $913.1 million in 2017 compared to $497.4 million in 2016, due to a 44 percent increase in production, combined with a 28 percent increase in the weighted average realized commodity prices. Crude oil, natural gas, and NGLs sales increased 31 percent in 2016 as compared to 2015 due to a 44 percent increase in production, partially offset by a nine percent decrease in average realized commodity prices.
We had positive net settlements from our commodity derivative contracts of $13.3 million for 2017, $208.1 million for 2016, and $238.9 million for 2015. We entered into agreements for the derivative instruments that settled throughout 2016 and 2015 prior to commodity prices becoming depressed in late 2014. Substantially all of these higher-value derivatives settled by the end of 2016. Net settlements for 2017 reflect derivative instruments entered into since 2015, which more closely approximate recent realized prices. See Results of Operations - Commodity Price Risk Management, Net for further details of our settlements of derivatives and changes in the fair value of unsettled derivatives.
The combined revenue from crude oil, natural gas, and NGLs sales and net settlements received on our commodity derivative instruments increased 31 percent to $926.4 million in 2017 from $705.5 million in 2016. Such combined revenue of $705.5 million in 2016 increased 14 percent from $617.6 million in 2015.
During 2017, we recorded exploratory dry hole well expense of $41.3 million and an unproved and proved property impairment charge of $285.5 million, and we impaired all of the goodwill associated with the assets acquired in the Delaware Basin, which resulted in an impairment charge of $75.1 million. The majority of these charges are a result of our western Culberson County acreage not meeting our performance expectations. In addition, we recorded a loss on extinguishment of debt of $24.7 million related to the redemption of our 2022 Senior Notes. For more information regarding these expenses and charges see Results of Operations - Exploration, Geologic, and Geophysical Expense, Results of Operations - Impairments of Properties, Results of Operations - Impairment of Goodwill, and Results of Operations - Loss on Extinguishment of Debt.
In December 2017, the President of the United States signed into law the 2017 Tax Cuts and Jobs Act (the "2017 Tax Act"). We recorded the effects of changes in tax law in the period of enactment. The 2017 Tax Act reduces the corporate tax rate from 35 percent to 21 percent effective January 1, 2018. Consequently, we have decreased our deferred tax assets and deferred tax liabilities as of December 31, 2017. Since we are in a net deferred liability position at 2017 year end, the tax rate change resulted in a deferred tax benefit and corresponding reduction of our net deferred tax liability of approximately $114 million in 2017.
42
In 2017, we generated a net loss of $127.5 million or $1.94 per diluted share. Our net income was negatively impacted by the aforementioned impairment charges, expensing of exploratory dry hole well costs, and extinguishment of debt. During the same period, our adjusted EBITDAX, a non-U.S. GAAP financial measure, was $682.1 million, up 48 percent relative to 2016. The increase in our 2017 adjusted EBITDAX as compared to 2016 was primarily the result of the increase in crude oil, natural gas, and NGLs sales of $415.7 million, as well as the recording of a provision for a note receivable in 2016 of $44.0 million and the subsequent sale of the note in 2017 to a third-party for $40.2 million. These increases were partially offset by a decrease in derivative commodity settlements of $194.8 million and increases in operating costs of $81.7 million and interest expense of $16.7 million. Beginning in 2017, we have included non-cash stock-based compensation and exploration, geologic, and geophysical expense in our reconciliation of adjusted EBITDAX. In prior periods, we reported adjusted EBITDA, a non-U.S. GAAP financial measure that did not include these adjustments. All prior periods have been conformed for comparability of this updated EBITDAX presentation. In 2016 and 2015, our net loss per diluted share was $5.01 and $1.74, respectively, and our adjusted EBITDAX was $459.8 million and $464.3 million, respectively. Our net cash flows from operating activities in 2017, 2016, and 2015 were $588.6 million, $486.3 million, and $411.1 million, respectively, and our adjusted cash flow from operations, a non-U.S. GAAP financial measure, were $582.1 million, $466.8 million, and $420.8 million, respectively. See Reconciliation of Non-U.S. GAAP Financial Measures, below, for a more detailed discussion of these non-U.S. GAAP financial measures and a reconciliation of these measures to the most comparable U.S. GAAP measures.
Liquidity
Available liquidity as of December 31, 2017 was $880.7 million, which was comprised of $180.7 million of cash and cash equivalents and $700.0 million available for borrowing under our revolving credit facility at our current commitment level. In October 2017, we entered into a Sixth Amendment to the Third Amended and Restated Credit Agreement. The amendment allowed the borrowing base to be set above the $1.0 billion borrowing capacity of the facility. The borrowing base for our November 2017 redetermination was confirmed at $1.1 billion and we elected to maintain a $700 million commitment level. Assuming that the Bayswater Acquisition had closed in December 2017, our liquidity position as of December 31, 2017, would have been approximately $700 million.
In November 2017, we issued $600 million principal amount of our 2026 Senior Notes. The net proceeds from the offering were used to fund the redemption of our $500 million 2022 Senior Notes and a portion of the purchase price of the January 2018 Bayswater Acquisition, and for general corporate purposes.
We intend to continue to manage our liquidity position by a variety of means, including through the generation of cash flows from operations, investment in projects with attractive rates of return, protection of cash flows on a portion of our anticipated sales through the use of an active commodity derivative hedging program, potential utilization of our borrowing capacity under our revolving credit facility, and if warranted, capital markets transactions from time to time.
Acquisition
On January 5, 2018, we closed the Bayswater Acquisition for approximately $186 million, subject to certain customary post-closing adjustments. In addition to the approximately $186 million of cash paid at closing, we invested approximately $15 million during 2017 to complete certain DUCs acquired in the transaction.
Acreage Exchanges
In 2017, we completed two significant acreage exchanges that consolidated certain acreage positions in the core area of the Wattenberg Field. Both transactions involved the exchange of leasehold acreage with a limited number of wells that were in the process of being drilled and completed. Upon closing the transactions, we received an aggregate of approximately 15,900 net acres in exchange for an aggregate of approximately 16,200 net acres. The difference in net acres is primarily due to variances in working and net revenue interests and midstream contracts.
43
2017 Drilling Overview
During the year ended December 31, 2017, we continued to execute our strategic plan to grow production while preserving our financial strength and liquidity. Our drilling efficiency in the Wattenberg Field over the last year has resulted in shorter drill times; as a result, we decreased our rig count from four to three in the fourth quarter of 2017. Due to the decreased drill times, the impact of the reduced rig count on our expected turn-in-line count in the Wattenberg Field was minimal in 2017. During the three months ended December 31, 2017, we briefly ran four rigs in the Delaware Basin as we swapped out rigs to focus on improving drill times. During the fourth quarter of 2017, we turned-in-line 19 wells in the Wattenberg Field and five wells in the Delaware Basin. We did not complete or turn-in-line any wells in the Utica Shale during 2017.
The following tables summarizes our drilling and completion activity for the year ended December 31, 2017:
Wells Operated by PDC | ||||||||||||||||||
Wattenberg Field | Delaware Basin | Total | ||||||||||||||||
Gross | Net | Gross | Net | Gross | Net | |||||||||||||
In-process as of December 31, 2016 | 64 | 52.7 | 5 | 4.8 | 69 | 57.5 | ||||||||||||
Wells spud | 153 | 140.2 | 26 | 22.7 | 179 | 162.9 | ||||||||||||
Wells turned-in-line | (130 | ) | (112.8 | ) | (16 | ) | (15.2 | ) | (146 | ) | (128.0 | ) | ||||||
Exploratory dry holes | — | — | (2 | ) | (2.0 | ) | (2 | ) | (2.0 | ) | ||||||||
In-process as of December 31, 2017 | 87 | 80.1 | 13 | 10.3 | 100 | 90.4 | ||||||||||||
Wells Operated by Others | ||||||||||||||||||
Wattenberg Field | Delaware Basin | Total | ||||||||||||||||
Gross | Net | Gross | Net | Gross | Net | |||||||||||||
In-process as of December 31, 2016 | 18 | 3.4 | — | — | 18 | 3.4 | ||||||||||||
Wells spud | 94 | 13.1 | 10 | 1.5 | 104 | 14.5 | ||||||||||||
Wells turned-in-line | (12 | ) | (1.6 | ) | (2 | ) | (0.4 | ) | (14 | ) | (2.0 | ) | ||||||
Wells interest exchanged | (85 | ) | (12.2 | ) | — | — | (85 | ) | (12.2 | ) | ||||||||
Exploratory dry holes | (1 | ) | (0.1 | ) | — | — | (1 | ) | (0.1 | ) | ||||||||
In-process as of December 31, 2017 | 14 | 2.6 | 8 | 1.1 | 22 | 3.6 | ||||||||||||
Our in-process wells represent wells that are in the process of being drilled and/or have been drilled and are waiting to be fractured and/or for gas pipeline connection. Our DUCs are generally completed and turned-in-line within three to nine months of drilling. The majority of the PDC-operated in-process wells at each period end are DUCs, as we do not begin the completion process until the entire well pad is drilled. All appropriate costs incurred through the end of the period have been capitalized, while the capital investment to complete the wells will be incurred in the period in which the wells are completed.
2018 Operational and Financial Outlook
We expect our production for 2018 to range between 38 MMBoe to 42 MMBoe, or approximately 104,000 Boe to 115,000 Boe per day for the year. We expect that approximately 42 to 45 percent of our 2018 production will be comprised of crude oil and approximately 19 to 22 percent will be NGLs, for total liquids of approximately 64 to 67 percent. Our 2018 capital forecast of between $850 million and $920 million is focused on continued execution in the Wattenberg Field and Delaware Basin with three drilling rigs and one completion crew in each basin throughout the year.
We believe that we maintain significant operational flexibility to control the pace of our capital spending. As we execute our capital investment program, we continually monitor, among other things, commodity prices, development costs, midstream capacity, and offset and continuous drilling obligations. Should commodity pricing or the operating environment deteriorate, we may determine that an adjustment to our development plan is appropriate. We believe we have ample opportunities to reduce capital spending in order to stay within the range of our capital investment plan, including but not limited to reducing the number of rigs being utilized in our drilling program and/or managing our completion schedule. This flexibility is more limited in the Delaware Basin given leasehold maintenance requirements.
44
Wattenberg Field. We are drilling in the Niobrara and Codell plays within the field and anticipate spudding and turning-in-line between approximately 135 to 150 operated wells in 2018. Our 2018 capital investment program is estimated to be approximately $470 million to $500 million in the Wattenberg Field, of which approximately 90 percent is anticipated to be invested in operated drilling and completion activity. The remainder of the Wattenberg Field capital investment program is expected to be used for non-operated wells and miscellaneous workover and capital projects.
Delaware Basin. Total capital investment in the Delaware Basin in 2018 is estimated to be approximately $380 million to $420 million, of which approximately 75 percent is allocated to both spud and turn-in-line approximately 25 to 30 operated wells targeting the Wolfcamp formation. Based on the timing of our operations and requirements to hold acreage, we may adapt our capital investment program to drill wells different from or in addition to those currently anticipated, as we are continuing to analyze the terms of the relevant leases. We plan to invest approximately 10 percent of our capital in leasing, non-operated capital, seismic, and technical studies with an additional approximately 15 percent for midstream related projects including oil and gas gathering systems and water supply and disposal systems.
Utica Shale. In 2017, as part of plans to divest the Utica Shale properties, we engaged an investment banking firm and began actively marketing the properties for sale; therefore, these properties are classified as held-for-sale as of December 31, 2017. In February 2018, we entered into a definitive PSA to sell these properties for net cash proceeds of approximately $40.0 million. The transaction is expected to close in the first quarter of 2018, subject to certain customary closing conditions.
Financial Guidance. Based on our current production forecast for 2018 and assuming averages of approximately $57.50 NYMEX crude oil price for the year and a $3.00 NYMEX natural gas price, we expect 2018 capital investments to exceed our 2018 cash flows from operations by approximately less than $90 million. We anticipate that the proceeds received from the sale of our Utica Shale assets and a midstream dedication agreement (see the footnote titled Subsequent Events to the consolidated financial statements included elsewhere in this report), will fund approximately two-thirds of this outspend. We expect this capital investment outspend to occur during the first half of 2018, with cash flows exceeding capital investment during the second half of the year. Our leverage ratio, as defined in our revolving credit facility agreement, is expected to decrease in 2018 to 1.4 based on production and operational cash flow growth.
The following table provides projected financial guidance for 2018:
Low | High | ||||||
Operating Expenses | |||||||
Lease operating expenses ($/Boe) | $ | 2.75 | $ | 3.00 | |||
Transportation, gathering, and processing expenses ("TGP") ($/Boe) | $ | 0.60 | $ | 0.80 | |||
Production taxes (% of crude oil, natural gas, and NGL sales) | 6 | % | 8 | % | |||
General and administrative expense ($/Boe) | $ | 3.40 | $ | 3.70 | |||
Estimated Price Realizations (% of NYMEX, excludes TGP) | |||||||
Crude oil | 91% | 95% | |||||
Natural gas | 55% | 60% | |||||
NGLs | 30% | 35% | |||||
45
Results of Operations
Summary Operating Results
The following table presents selected information regarding our operating results from continuing operations:
Year Ended December 31, | |||||||||||||||||
Percent Change | |||||||||||||||||
2017 | 2016 | 2015 | 2017-2016 | 2016-2015 | |||||||||||||
(dollars in millions, except per unit data) | |||||||||||||||||
Production | |||||||||||||||||
Crude oil (MBbls) | 12,902 | 8,728 | 6,984 | 47.8 | % | 25.0 | % | ||||||||||
Natural gas (MMcf) | 71,689 | 51,730 | 33,302 | 38.6 | % | 55.3 | % | ||||||||||
NGLs (MBbls) | 6,981 | 4,826 | 2,835 | 44.7 | % | 70.2 | % | ||||||||||
Crude oil equivalent (MBoe) | 31,830 | 22,176 | 15,369 | 43.5 | % | 44.3 | % | ||||||||||
Average Boe per day (Boe) | 87,206 | 60,590 | 42,108 | 43.9 | % | 43.9 | % | ||||||||||
Crude Oil, Natural Gas and NGLs Sales | |||||||||||||||||
Crude oil | $ | 625.0 | $ | 348.9 | $ | 280.3 | 79.1 | % | 24.5 | % | |||||||
Natural gas | 158.3 | 91.6 | 68.0 | 72.8 | % | 34.7 | % | ||||||||||
NGLs | 129.8 | 56.9 | 30.4 | 128.1 | % | 87.2 | % | ||||||||||
Total crude oil, natural gas, and NGLs sales | $ | 913.1 | $ | 497.4 | $ | 378.7 | 83.6 | % | 31.3 | % | |||||||
Net Settlements on Commodity Derivatives | |||||||||||||||||
Crude oil | $ | (2.7 | ) | $ | 165.2 | $ | 208.9 | (101.6 | )% | (20.9 | )% | ||||||
Natural gas | 23.3 | 42.9 | 30.0 | (45.7 | )% | 43.0 | % | ||||||||||
NGLs (propane portion) | (7.3 | ) | — | — | * | * | |||||||||||
Total net settlements on derivatives | $ | 13.3 | $ | 208.1 | $ | 238.9 | (93.6 | )% | (12.9 | )% | |||||||
Average Sales Price (excluding net settlements on derivatives) | |||||||||||||||||
Crude oil (per Bbl) | $ | 48.45 | $ | 39.96 | $ | 40.14 | 21.2 | % | (0.4 | )% | |||||||
Natural gas (per Mcf) | 2.21 | 1.77 | 2.04 | 24.9 | % | (13.2 | )% | ||||||||||
NGLs (per Bbl) | 18.59 | 11.80 | 10.72 | 57.5 | % | 10.1 | % | ||||||||||
Crude oil equivalent (per Boe) | 28.69 | 22.43 | 24.64 | 27.9 | % | (9.0 | )% | ||||||||||
Average Costs and Expenses (per Boe) | |||||||||||||||||
Lease operating expenses | $ | 2.82 | $ | 2.70 | $ | 3.71 | 4.4 | % | (27.2 | )% | |||||||
Production taxes | 1.91 | 1.42 | 1.20 | 34.5 | % | 18.3 | % | ||||||||||
Transportation, gathering, and processing expenses | 1.04 | 0.83 | 0.66 | 25.3 | % | 25.8 | % | ||||||||||
General and administrative expense | 3.78 | 5.07 | 5.85 | (25.4 | )% | (13.3 | )% | ||||||||||
Depreciation, depletion, and amortization | 14.74 | 18.80 | 19.73 | (21.6 | )% | (4.7 | )% | ||||||||||
Lease Operating Expenses by Operating Region (per Boe) | |||||||||||||||||
Wattenberg Field | $ | 2.48 | $ | 2.70 | $ | 3.78 | (8.1 | )% | (28.6 | )% | |||||||
Delaware Basin | 5.16 | 8.79 | * | (41.3 | )% | * | |||||||||||
Utica Shale (1) | 1.66 | 1.75 | 2.78 | (5.1 | )% | (37.1 | )% | ||||||||||
* | Percentage change is not meaningful or equal to or greater than 300% or not applicable. |
Amounts may not recalculate due to rounding.
______________
(1) In February 2018, we entered into a PSA to sell the Utica Shale properties.
46
Crude Oil, Natural Gas, and NGLs Sales
The year-over-year change in crude oil, natural gas, and NGLs sales revenue were primarily due to the following:
Year Ended December 31, | |||||||
2017 | 2016 | ||||||
(in millions) | |||||||
Increase in production | $ | 227.5 | $ | 129.0 | |||
Increase (decrease) in average crude oil price | 109.6 | (1.6 | ) | ||||
Increase (decrease) in average natural gas price | 31.2 | (14.0 | ) | ||||
Increase in average NGLs price | 47.4 | 5.2 | |||||
Total increase in crude oil, natural gas and NGLs sales revenue | $ | 415.7 | $ | 118.6 | |||
Crude Oil, Natural Gas, and NGLs Production
The following tables present crude oil, natural gas, and NGLs production. Our acquisition of assets in the Delaware Basin closed in December 2016; therefore, there is no comparative data for 2015.
Year Ended December 31, | |||||||||||||||
Change | |||||||||||||||
Production by Operating Region | 2017 | 2016 | 2015 | 2017-2016 | 2016-2015 | ||||||||||
Crude oil (MBbls) | |||||||||||||||
Wattenberg Field | 10,922 | 8,230 | 6,490 | 32.7 | % | 26.8 | % | ||||||||
Delaware Basin | 1,699 | 79 | — | * | * | ||||||||||
Utica Shale (1) | 281 | 419 | 494 | (32.9 | )% | (15.2 | )% | ||||||||
Total | 12,902 | 8,728 | 6,984 | 47.8 | % | 25.0 | % | ||||||||
Natural gas (MMcf) | |||||||||||||||
Wattenberg Field | 60,106 | 48,889 | 30,753 | 22.9 | % | 59.0 | % | ||||||||
Delaware Basin | 9,410 | 373 | — | * | * | ||||||||||
Utica Shale (1) | 2,173 | 2,468 | 2,549 | (12.0 | )% | (3.2 | )% | ||||||||
Total | 71,689 | 51,730 | 33,302 | 38.6 | % | 55.3 | % | ||||||||
NGLs (MBbls) | |||||||||||||||
Wattenberg Field | 5,876 | 4,568 | 2,616 | 28.6 | % | 74.6 | % | ||||||||
Delaware Basin | 917 | 36 | — | * | * | ||||||||||
Utica Shale (1) | 188 | 222 | 219 | (15.3 | )% | 1.4 | % | ||||||||
Total | 6,981 | 4,826 | 2,835 | 44.7 | % | 70.2 | % | ||||||||
Crude oil equivalent (MBoe) | |||||||||||||||
Wattenberg Field | 26,815 | 20,945 | 14,231 | 28.0 | % | 47.2 | % | ||||||||
Delaware Basin | 4,184 | 178 | — | * | * | ||||||||||
Utica Shale (1) | 831 | 1,053 | 1,138 | (21.1 | )% | (7.5 | )% | ||||||||
Total | 31,830 | 22,176 | 15,369 | 43.5 | % | 44.3 | % | ||||||||
Average crude oil equivalent per day (Boe) | |||||||||||||||
Wattenberg Field | 73,466 | 57,227 | 38,990 | 28.4 | % | 46.8 | % | ||||||||
Delaware Basin | 11,463 | 486 | — | * | * | ||||||||||
Utica Shale (1) | 2,277 | 2,877 | 3,118 | (20.9 | )% | (7.7 | )% | ||||||||
Total | 87,206 | 60,590 | 42,108 | 43.9 | % | 43.9 | % | ||||||||
*Percentage change is not meaningful or equal to or greater than 300%.
Amounts may not recalculate due to rounding.
______________
(1) In February 2018, we entered into a PSA to sell the Utica Shale properties.
47
In the Wattenberg Field, we rely on third-party midstream service providers to construct gathering, compression, and processing facilities to keep pace with our and the overall field's natural gas production growth. In 2017 and during 2018, our production has been adversely affected by high line pressures on the gas gathering facilities, primarily due to increases in field-wide production volumes. As a result, we experienced some production curtailments during the second half of 2017. The gathering system of our primary midstream service provider, DCP Midstream, LP ("DCP"), is currently at capacity. We believe that our 2018 production guidance range appropriately reflects the impact of anticipated gathering system line pressures and the resulting temporary limitations on the gathering system’s capacity, but curtailments may be greater than anticipated. For 2017, 94 percent of our production in the Wattenberg Field was delivered from horizontal wells, with the remaining six percent coming from vertical wells. The horizontal wells are less prone to curtailments than the vertical wells because they are newer and have greater producing capacity and higher formation pressures and therefore tend to be more resilient to gas system pressure issues; however, all of our wells in the field are currently experiencing some impact. We expect to continue to operate in a constrained environment into the third quarter of 2018, at which time additional processing capacity is scheduled to be brought into operation by DCP.
We continue to work closely with our third-party midstream providers in an effort to ensure that adequate midstream system capacity is available going forward in the Wattenberg Field. We, along with other operators, have made a commitment with DCP to support its construction of two additional processing facilities with associated gathering pipe and compression in the field. These expansions are expected to increase DCP's system capacity, assist in the control of line pressures on its natural gas gathering facilities, and reduce production curtailments in the field. We will be bound to the incremental volume requirements in these agreements on the first day of the calendar month after the actual in-service dates of the plants for a period of seven years, which are currently scheduled to occur in the third quarter of 2018 and in the second quarter of 2019, respectively. The agreements impose a baseline volume commitment and guarantee a certain target profit margin to DCP on those volumes during the initial three years of the contracts. Under our current drilling plans, we expect to meet both the baseline and incremental volume commitments, and we believe that the contractual target profit margin will be achieved without additional payment from us. See the footnote titled Commitments and Contingencies to our consolidated financial statements included elsewhere in this report for additional details regarding the agreements. In addition, we have begun early discussions with DCP with respect to further increasing its processing facilities in the Wattenberg Field. We also continue to work with all of our midstream service providers in the field in an effort to ensure all of the existing infrastructure is fully utilized and that all options for system expansions are evaluated and implemented, where possible. The ultimate timing and availability of adequate infrastructure is not within our control and if our midstream service providers' construction projects are delayed, we could experience higher gathering line pressures that would negatively impact our ability to meet our production targets.
48
Crude Oil, Natural Gas, and NGLs Pricing
Our results of operations depend upon many factors. Key factors include the price of crude oil, natural gas, and NGLs and our ability to market our production effectively. Crude oil, natural gas, and NGL prices have a high degree of volatility and our realizations can change substantially. Our sales prices for crude oil, natural gas, and NGLs increased during 2017 compared to 2016. NYMEX crude oil prices increased 18 percent and NYMEX natural gas prices increased 26 percent as compared to 2016. Our sales prices for crude oil and natural gas decreased and prices for NGLs increased during 2016 compared to 2015. NYMEX crude oil prices decreased 12 percent and NYMEX natural gas prices decreased 8 percent as compared to 2015. The majority of our NGL prices in the Wattenberg Field are reflected in the tables below, net of the processing and transport costs that are embedded in the applicable percent-of-proceeds contracts.
The following tables present weighted-average sales prices of crude oil, natural gas, and NGLs for the periods presented. Our acquisition of assets in the Delaware Basin closed in December 2016; therefore, there is no comparative data for 2015:
Year Ended December 31, | ||||||||||||||||||
Weighted-Average Sales Price by Operating Region | Change | |||||||||||||||||
(excluding net settlements on derivatives) | 2017 | 2016 | 2015 | 2017-2016 | 2016-2015 | |||||||||||||
Crude oil (per Bbl) | ||||||||||||||||||
Wattenberg Field | $ | 48.48 | $ | 39.99 | $ | 40.03 | 21.2 | % | (0.1 | )% | ||||||||
Delaware Basin | 48.68 | 49.28 | — | (1.2 | )% | * | ||||||||||||
Utica Shale (1) | 45.63 | 37.62 | 41.59 | 21.3 | % | (9.5 | )% | |||||||||||
Weighted-average price | 48.45 | 39.96 | 40.14 | 21.2 | % | (0.4 | )% | |||||||||||
Natural gas (per Mcf) | ||||||||||||||||||
Wattenberg Field | 2.19 | 1.77 | 2.06 | 23.7 | % | (14.1 | )% | |||||||||||
Delaware Basin | 2.26 | 2.78 | — | (18.7 | )% | * | ||||||||||||
Utica Shale (1) | 2.40 | 1.58 | 1.85 | 51.9 | % | (14.6 | )% | |||||||||||
Weighted-average price | 2.21 | 1.77 | 2.04 | 24.9 | % | (13.2 | )% | |||||||||||
NGLs (per Bbl) | ||||||||||||||||||
Wattenberg Field | 17.75 | 11.59 | 10.58 | 53.1 | % | 9.5 | % | |||||||||||
Delaware Basin | 22.64 | 17.87 | — | 26.7 | % | * | ||||||||||||
Utica Shale (1) | 25.06 | 15.11 | 12.43 | 65.9 | % | 21.6 | % | |||||||||||
Weighted-average price | 18.59 | 11.80 | 10.72 | 57.5 | % | 10.1 | % | |||||||||||
Crude oil equivalent (per Boe) | ||||||||||||||||||
Wattenberg Field | 28.55 | 22.38 | 24.64 | 27.6 | % | (9.2 | )% | |||||||||||
Delaware Basin | 29.80 | 31.50 | — | (5.4 | )% | * | ||||||||||||
Utica Shale (1) | 27.36 | 21.88 | 24.59 | 25.0 | % | (11.0 | )% | |||||||||||
Weighted-average price | 28.69 | 22.43 | 24.64 | 27.9 | % | (9.0 | )% | |||||||||||
* | Percentage change is not meaningful or equal to or greater than 300%. |
Amounts may not recalculate due to rounding.
______________
(1) In February 2018, we entered into a PSA to sell the Utica Shale properties.
Our crude oil, natural gas, and NGLs sales are recorded using either the “net-back” or "gross" method of accounting, depending upon the related purchase agreement. We use the net-back method when the purchasers of these commodities also provide transportation, gathering, or processing services. In these situations, the purchaser pays us proceeds based on a percent of the proceeds or have fixed our sales price at index less specified deductions. The net-back method results in the recognition of a net sales price that is lower than the indices for which the production is based because the operating costs and profit of the midstream facilities are embedded in the net price we are paid.
We use the gross method of accounting when the purchasers do not provide transportation, gathering, or processing services as a function of the price we receive. Rather, we contract separately with midstream providers for the applicable transport and processing on a per unit basis. Under this method, we recognize revenues based on the gross selling price and recognize transportation, gathering, and processing expenses.
49
The following table summarizes how we recognize revenue related to the sales of our crude oil, natural gas, and NGLs:
Years Ended December 31, 2015 through 2017 | ||||
Net-Back | Gross | |||
Wattenberg Field | ||||
Crude oil | Yes | Yes | ||
Natural gas | Yes | No | ||
NGLs | Yes | No | ||
Delaware Basin | ||||
Crude oil | Yes | Yes | ||
Natural gas | Yes | Yes | ||
NGLs | Yes | No | ||
As discussed above, we enter into agreements for the sale, transportation, gathering, and processing of our production. The terms of these agreements can result in variances in the per unit realized prices that we receive for our crude oil, natural gas and NGLs. Information related to the components and classifications in the consolidated statements of operations is shown below. For crude oil, the average NYMEX prices shown below are based upon average daily prices throughout each month and our natural gas average NYMEX pricing is based upon first-of-the-month index prices as this is how the majority of each of these commodities are sold pursuant to terms of the respective sales agreements. For NGLs, we use the NYMEX crude oil price as a reference for presentation purposes. For NGLs, the average realized price both before and after transportation, gathering, and processing expenses shown in the table below represents our approximate composite per barrel price.
2017 | Average NYMEX Price | Average Realized Price Before Transportation, Gathering and Processing Expenses | Average Realization Percentage Before Transportation, Gathering and Processing Expenses | Average Transportation, Gathering and Processing Expenses | Average Realized Price After Transportation, Gathering and Processing Expenses | Average Realization Percentage After Transportation, Gathering and Processing Expenses | ||||||||||||||||
Crude oil (per Bbl) | $ | 50.95 | $ | 48.45 | 95 | % | $ | 1.41 | $ | 47.04 | 92 | % | ||||||||||
Natural gas (per MMBtu) | 3.11 | 2.21 | 71 | % | 0.17 | 2.04 | 66 | % | ||||||||||||||
NGLs (per Bbl) | 50.95 | 18.59 | 36 | % | 0.30 | 18.29 | 36 | % | ||||||||||||||
Crude oil equivalent (per Boe) | 38.83 | 28.69 | 74 | % | 1.04 | 27.65 | 71 | % | ||||||||||||||
We adopted a new revenue recognition accounting standard effective January 1, 2018. Under the guidance of the new revenue recognition standard, certain crude oil sales in the Wattenberg Field that were recognized using the gross method prior to the adoption of the new revenue standard will be recognized using the net-back method and in the Delaware Basin certain crude oil and natural gas sales that were recognized using the gross method prior to the adoption of the new revenue standard will be recognized using the net-back method. If we had adopted the standard on January 1, 2017, we estimate that the average realization percentage before transportation, gathering, and processing expenses would have been 94 percent, 70 percent, 36 percent, and 73 percent for crude oil, natural gas, NGLs, and crude oil equivalent, respectively, as $11.3 million in expenses currently recorded in transportation, gathering, and processing on our consolidated statements of operations would, in that case, have been reflected as a reduction to the sales price. However, the net realized price would remain unchanged.
50
2016 | Average NYMEX Price | Average Realized Price Before Transportation, Gathering and Processing Expenses | Average Realization Percentage Before Transportation, Gathering and Processing Expenses | Average Transportation, Gathering and Processing Expenses | Average Realized Price After Transportation, Gathering and Processing Expenses | Average Realization Percentage After Transportation, Gathering and Processing Expenses | ||||||||||||||||
Crude oil (per Bbl) | $ | 43.32 | $ | 39.96 | 92 | % | $ | 1.51 | $ | 38.45 | 89 | % | ||||||||||
Natural gas (per MMBtu) | 2.46 | 1.77 | 72 | % | 0.07 | 1.70 | 69 | % | ||||||||||||||
NGLs (per Bbl) | 43.32 | 11.80 | 27 | % | 0.28 | 11.52 | 27 | % | ||||||||||||||
Crude oil equivalent (per Boe) | 32.22 | 22.43 | 70 | % | 0.83 | 21.60 | 67 | % | ||||||||||||||
2015 | Average NYMEX Price | Average Realized Price Before Transportation, Gathering and Processing Expenses | Average Realization Percentage Before Transportation, Gathering and Processing Expenses | Average Transportation, Gathering and Processing Expenses | Average Realized Price After Transportation, Gathering and Processing Expenses | Average Realization Percentage After Transportation, Gathering and Processing Expenses | ||||||||||||||||
Crude oil (per Bbl) | $ | 48.80 | $ | 40.14 | 82 | % | $ | 0.67 | $ | 39.47 | 81 | % | ||||||||||
Natural gas (per MMBtu) | 2.66 | 2.04 | 77 | % | 0.12 | 1.92 | 72 | % | ||||||||||||||
NGLs (per Bbl) | 48.80 | 10.72 | 22 | % | 0.55 | 10.17 | 21 | % | ||||||||||||||
Crude oil equivalent (per Boe) | 36.94 | 24.64 | 67 | % | 0.66 | 23.98 | 65 | % | ||||||||||||||
Commodity Price Risk Management, Net
We use commodity derivative instruments to manage fluctuations in crude oil and natural gas prices. We have in place a variety of collars, fixed-price swaps, and basis swaps on a portion of our estimated crude oil, natural gas, and propane production. Because we sell all of our crude oil, natural gas, and NGLs production at prices related to the indexes inherent in our underlying derivative instruments, we ultimately realize value related to our collars of no less than the floor and no more than the ceiling. For our commodity swaps, we ultimately realize the fixed price value related to our swaps. See the footnote titled Commodity Derivative Financial Instruments for a detailed presentation of our derivative positions as of December 31, 2017.
Commodity price risk management, net, includes cash settlements upon maturity of our derivative instruments, as well as the change in fair value of unsettled commodity derivatives related to our crude oil, natural gas, and propane production. Commodity price risk management, net, does not include derivative transactions related to our gas marketing, which are included in other income and other expenses.
Net settlements of commodity derivative instruments are based on the difference between the crude oil, natural gas, and propane index prices at the settlement date of our commodity derivative instruments compared to the respective strike prices. The net change in fair value of unsettled commodity derivatives is comprised of the net value increase or decrease in the beginning-of-period fair value of commodity derivative instruments that settled during the period, and the net change in fair value of unsettled commodity derivatives during the period or from inception of any new contracts entered into during the applicable period. The net change in fair value of unsettled commodity derivatives during the period is primarily related to shifts in the crude oil, natural gas, and NGLs forward curves and changes in certain differentials.
51
The following table presents net settlements and net change in fair value of unsettled commodity derivatives included in commodity price risk management, net:
Year Ended December 31, | |||||||||||
2017 | 2016 | 2015 | |||||||||
(in millions) | |||||||||||
Commodity price risk management gain (loss), net: | |||||||||||
Net settlements of commodity derivative instruments: | |||||||||||
Crude oil fixed price swaps and collars | $ | (2.7 | ) | $ | 165.2 | $ | 208.9 | ||||
Natural gas fixed price swaps and collars | 19.5 | 41.9 | 31.0 | ||||||||
Natural gas basis protection swaps | 3.8 | 1.0 | (1.0 | ) | |||||||
NGLs (propane portion) fixed price swaps | (7.3 | ) | — | — | |||||||
Total net settlements of commodity derivative instruments | 13.3 | 208.1 | 238.9 | ||||||||
Change in fair value of unsettled commodity derivative instruments: | |||||||||||
Reclassification of settlements included in prior period changes in fair value of commodity derivative instruments | 44.8 | (220.0 | ) | (186.9 | ) | ||||||
Crude oil fixed price swaps, collars, and rollfactors | (77.9 | ) | (78.6 | ) | 99.3 | ||||||
Natural gas fixed price swaps and collars | 14.7 | (37.1 | ) | 53.3 | |||||||
Natural gas basis protection swaps | 5.7 | 1.9 | (1.4 | ) | |||||||
NGLs (propane portion) fixed price swaps | (4.6 | ) | — | — | |||||||
Net change in fair value of unsettled commodity derivative instruments | (17.3 | ) | (333.8 | ) | (35.7 | ) | |||||
Total commodity price risk management gain (loss), net | $ | (4.0 | ) | $ | (125.7 | ) | $ | 203.2 | |||
Lease Operating Expenses
Lease operating expenses were $89.6 million in 2017 compared to $60.0 million in 2016. Aggregate lease operating expenses during 2017 increased $29.6 million, of which $20.1 million related to our properties in the Delaware Basin. The $29.6 million increase in the total lease operating expenses in 2017 as compared to 2016 was primarily due to increases of $9.4 million for payroll and employee benefits related to increases in headcount, $5.6 million for produced water disposal, $5.6 million for increased workover projects, $3.9 million related to additional compressor rentals, and $2.2 million for equipment rentals. The increases were slightly offset by a $1.5 million decrease in environmental remediation costs. Lease operating expense per Boe increased by four percent to $2.82 for 2017 from $2.70 for 2016, primarily due to expected higher per Boe costs in the Delaware Basin compared to our other areas of operation.
Lease operating expenses were $60.0 million in 2016 compared to $57.0 million in 2015. The $3.0 million increase in lease operating expenses in 2016 as compared to 2015 was primarily due to an increase of $3.7 million for increases in wages and employee benefits related to an increase in headcount, including costs for additional contract labor, $1.8 million for additional leased compressors to address line pressures, and an increase of $1.5 million related to lease operating expenses for the acquisition in the Delaware Basin. These increases were partially offset by a decrease in environmental remediation and regulatory compliance projects of $3.2 million due to a reduction in new remediation projects, and a decrease of $1.4 million related to fewer workover and maintenance related projects. Lease operating expenses per Boe decreased significantly to $2.70 for 2016 from $3.71 in 2015 as a result of increased production.
Production Taxes
Production taxes were $60.7 million, $31.4 million, and $18.4 million in 2017, 2016, and 2015, respectively. Production taxes are comprised mainly of severance tax and ad valorem tax and are directly related to crude oil, natural gas, and NGLs sales as the taxes are generally assessed as a percentage of net revenues. From time to time, there are adjustments to the statutory rates for these taxes based upon certain credits that are determined based upon activity levels and relative commodity prices from year to year. The $29.3 million and $13.0 million increases in production taxes during 2017 and 2016, respectively, were primarily related to the 84 percent and 31 percent increases in crude oil, natural gas, and NGLs sales in 2017 and 2016, respectively, and to a lesser extent, an increase in tax rates. Our overall production tax rates were 6.6 percent, 6.3 percent, and 4.9 percent in 2017, 2016, and 2015, respectively.
52
Transportation, Gathering and Processing Expenses
Transportation expenses were $33.2 million in 2017 compared to $18.4 million in 2016. The increase was mainly attributable to a $5.0 million increase in oil transportation costs due to additional volumes delivered through pipelines in the Wattenberg Field and an increase of $9.7 million related to natural gas gathering and transportation operations in the Delaware Basin. Transportation expenses were $18.4 million in 2016 compared to $10.2 million in 2015. The increase was mainly attributable to the costs associated with certain pipelines in the Wattenberg Field as we began delivering crude oil on these pipelines in July and December 2015, respectively. Transportation, gathering, and processing expenses per Boe increased to $1.04 for 2017 compared to $0.83 for 2016 and $0.66 for 2015. As discussed in — Crude Oil, Natural Gas, and NGLs Pricing, whether transportation, gathering, and processing costs are presented separately or are reflected as a reduction to net revenue is a function of the terms of the relevant marketing contract. The tables at the end of that section show our net realized prices for the periods shown after the relevant costs are deducted, regardless of where those costs appear on our income statement (see in particular the columns titled “Average Realized Price After Transportation, Gathering and Processing Expenses” and “Average Realization Percentage After Transportation, Gathering and Processing Expenses”). We expect that our transportation, gathering, and processing expenses will decrease beginning in 2018 with the adoption of a new revenue recognition standard as a portion of our current transportation, gathering, and processing expense will be recorded as a reduction to the sales price.
Exploration, Geologic, and Geophysical Expense
The following table presents the major components of exploration, geologic, and geophysical expense:
Year Ended December 31, | ||||||||||||
2017 | 2016 | 2015 | ||||||||||
(in millions) | ||||||||||||
Exploratory dry hole costs | $ | 41.3 | $ | — | $ | — | ||||||
Geological and geophysical costs | 3.9 | 3.5 | — | |||||||||
Operating, personnel and other | 2.1 | 1.2 | 1.1 | |||||||||
Total exploration expense | $ | 47.3 | $ | 4.7 | $ | 1.1 | ||||||
Exploratory dry hole costs. During 2017, two exploratory dry hole wells, associated lease costs, and related infrastructure assets in the Delaware Basin were expensed at a cost of $41.3 million. The conclusion to expense these items was based on our determination that the acreage on which these wells were drilled was exploratory in nature and, following drilling, that the hydrocarbon production was insufficient for the wells to be deemed economically viable.
Geological and geophysical costs. Geological and geophysical costs in 2017 and 2016 were primarily related to the portion of the purchase of seismic data related to unproved acreage in the Delaware Basin.
53
Impairment of Properties and Equipment
The following table sets forth the major components of our impairments of properties and equipment expense:
Year Ended December 31, | |||||||||||
2017 | 2016 | 2015 | |||||||||
(in millions) | |||||||||||
Impairment of proved and unproved properties | $ | 285.5 | $ | 5.6 | $ | 154.6 | |||||
Amortization of individually insignificant unproved properties | 0.4 | 1.4 | 7.0 | ||||||||
Land and buildings | — | 3.0 | — | ||||||||
Total impairment of properties and equipment | $ | 285.9 | $ | 10.0 | $ | 161.6 | |||||
Impairment of proved and unproved properties. Amounts represent the retirement or expiration of certain leases that are no longer part of our development plan or that we do not plan to extend and will allow to expire. Deterioration of commodity prices or other operating circumstances could result in additional impairment charges.
During 2017, we recorded a charge related to two exploratory dry holes we had drilled in the western area of our Culberson County acreage in the Delaware Basin, as referenced previously. We then assessed the impact of the dry holes and various factors related thereto, including (i) the operational and geologic data obtained, (ii) the current increased cost environment for drilling and completion services in the Delaware Basin, (iii) our future commodity price outlook, and (iv) the terms of the related lease agreements. Based on the results of this assessment, we concluded that the underlying geologic risk and the challenged economics of future capital expenditures reduced the likelihood that we would perform future development in this area over the remaining lease term for this acreage. Accordingly, we recorded an impairment of $251.6 million covering approximately 13,400 acres during 2017. The amount of the impairment was based on the value assigned to individual lease acres in the final purchase price allocation of our Delaware Basin acquisition. This allocation included the consideration paid to the sellers, including the effect of the non-cash impact from the deferred tax liability created at the time of the acquisition. We recorded approximately $29 million of additional lease impairments in the Delaware Basin and an impairment charge of $2.1 million related to the Utica Shale properties that are classified as held-for-sale during 2017. Due to the aforementioned events and circumstances, we also evaluated our proved property for possible impairment and concluded that no further impairments were necessary at this time.
During 2015, due to a significant decline in commodity prices and decreases in our net realized sales prices, we experienced triggering events that required us to assess our crude oil and natural gas properties for possible impairment. As a result of our assessments, we recorded impairment charges of $150.3 million in 2015 to write-down our Utica Shale proved and unproved properties. Of these impairment charges, $24.7 million were recorded in 2015 to write-down certain capitalized well costs on our Utica Shale proved producing properties. In 2015, we also recorded impairment charges of $125.6 million to write-down our Utica Shale lease acquisition costs. The impairment charges, which are included in the consolidated statements of operations line item impairment of properties and equipment, represented the amount by which the carrying value of these crude oil and natural gas properties exceeded the estimated fair values.
Amortization of individually insignificant unproved properties. The decrease in 2016 as compared to 2015 is due to the impairment of leases in the Utica Shale in 2015.
Impairment of Goodwill
The final goodwill that resulted from the purchase price allocation of the assets acquired in the Delaware Basin was determined to be $75.1 million. With the creation of goodwill from this transaction, we expected to perform our evaluation of goodwill for impairment annually in the fourth quarter. However, primarily due to a combination of increases in per well development and operational costs and our drilling of two exploratory dry holes in the Delaware Basin subsequent to the acquisition, in conjunction with our lower future commodity price outlook, we determined that a triggering event had occurred in the quarter ended September 30, 2017. In addition to the factors mentioned above, we also considered our recent impairments of certain unproven leasehold costs and the impact of these items on our internal expectations for acceptable rates of return. We evaluated goodwill for impairment by performing a quantitative test, which involves comparing the estimated fair value of the goodwill reporting unit, which we define as the Delaware Basin, to the carrying value. We determined the fair
54
value of the goodwill at September 30, 2017 by using an estimated after-tax future discounted cash flow analysis, along with a combination of market-based pricing factors for similar acreage, reserve valuation techniques, and other fair value considerations. The discounted cash flow analysis used to estimate fair value was based on known or knowable information at the interim measurement date. Fair value determinations require considerable judgment and are sensitive to changes in underlying assumptions and factors. The quantitative test resulted in a determination that a full impairment charge of $75.1 million was required; therefore, the charge was recorded in third quarter of 2017.
General and Administrative Expense
General and administrative expense increased $7.9 million, or seven percent, in 2017 compared to 2016. The increase was primarily attributable to an $8.1 million increase in payroll and employee benefits due to an increase in headcount in 2017 as compared to 2016, $4.4 million related to professional services, $4.2 million related to legal expenses, $1.4 million related to software license and maintenance agreements, and $1.3 million for the rental of additional office space. The increases were partially offset by the $12.2 million of legal and professional fees related to the acquisition in the Delaware Basin that were incurred in 2016.
General and administrative expense increased $22.5 million, or 25 percent, in 2016 compared to 2015. The increase in cash based general and administrative costs was primarily attributable to $12.2 million of legal and professional fees related to the acquisition in the Delaware Basin and a $7.7 million increase in payroll and employee benefits due to increases in wages and increases in headcount.
Depreciation, Depletion, and Amortization
Crude oil and natural gas properties. During 2017, 2016, and 2015, we invested $788.0 million, $396.4 million, and $554.3 million, net of changes in accounts payable related to capital expenditures, in the development of our crude oil and natural gas properties, respectively. We also incurred $1.76 billion to acquire reserves during 2016 in the Delaware Basin. We did not invest in any acquisitions of proved reserves in 2015. DD&A expense related to crude oil and natural gas properties is directly related to proved reserves and production volumes. DD&A expense related to crude oil and natural gas properties was $462.5 million, $413.1 million, and $298.8 million in 2017, 2016, and 2015, respectively. The year-over-year changes in DD&A expense related to crude oil and natural gas properties were primarily due to the following:
Year Ended December 31, | ||||||||
2017 - 2016 | 2016 - 2015 | |||||||
(in millions) | ||||||||
Increase in production | $ | 144.7 | $ | 132.3 | ||||
Decrease in weighted-average depreciation, depletion and amortization rates | (95.3 | ) | (18.0 | ) | ||||
Total increase in DD&A expense related to crude oil and natural gas properties | $ | 49.4 | $ | 114.3 | ||||
The following table presents our DD&A expense rates for crude oil and natural gas properties:
Year Ended December 31, | ||||||||||||
Operating Region/Area | 2017 | 2016 | 2015 | |||||||||
(per Boe) | ||||||||||||
Wattenberg Field | $ | 14.67 | $ | 19.11 | $ | 20.13 | ||||||
Delaware Basin (1) | 14.89 | 8.34 | — | |||||||||
Utica Shale (2) | 8.09 | 10.66 | 10.74 | |||||||||
Total weighted-average | 14.53 | 18.63 | 19.44 | |||||||||
____________
(1) The 2016 Delaware Basin rate represents one month of DD&A expense. Accordingly, the comparison of the 2017 rate
to the 2016 rate is not meaningful.
(2) In February 2018, we entered into a PSA to sell the Utica Shale properties.
55
The 2017 rate in the Wattenberg Field decreased as compared to the 2016 rate due to a decrease in per well development costs, and an increase in 2017 year-end reserves. The slight decrease in the Wattenberg Field rate for 2016 as compared to 2015 was primarily due to the impact of our 2016 year-end reserves.
Provision for Uncollectible Notes Receivable
In 2016, we recorded a provision for uncollectible notes receivable of $44.0 million to impair two third-party notes receivable whose collection was not reasonably assured. As described in the footnote titled Note Receivable included elsewhere in this report, in April 2017, we signed a definitive agreement and simultaneously closed on the sale of one of the associated notes receivable to an unrelated third-party for $40.2 million. Accordingly, we reversed $40.2 million of the provision for uncollectible notes receivable during 2017.
Accretion of Asset Retirement Obligations
Accretion of asset retirement obligations for 2017 decreased by $0.8 million, or 11 percent, compared to 2016, and increased by $0.8 million, or 13 percent, in 2016 compared to 2015. The decrease in 2017 was due to the replacement of vertical wells that have been plugged and abandoned with horizontal wells, which have a longer expected life. The increase in 2016 was due to adding new wells and the associated increase in amortization expense.
Interest Expense
Interest expense increased by $16.7 million in 2017 compared to 2016. The increase is primarily attributable to an $18.0 million increase in interest for the issuance of our 2024 Senior Notes, a $7.4 million increase in interest expense for the issuance of $200 million principal amount of our 1.125% convertible notes due 2021 (the "2021 Convertible Notes") in September 2016, a $3.1 million increase in interest expense for the issuance of our 2026 Notes in November 2017, and a $3.0 million increase in the utilization fee of our revolving credit facility. The increases were partially offset by a $9.3 million charge for a bridge loan commitment related to the 2016 acquisition of properties in the Delaware Basin, a $3.5 million decrease in interest expense resulting from the net settlement of our 2016 Convertible Notes in May 2016, and a $1.8 million decrease in interest expense resulting from the net settlement of our 2022 Notes in December 2017.
Interest expense increased by approximately $14.4 million in 2016 compared to 2015. The increase is primarily attributable to a $9.3 million charge for the bridge loan commitment related to the acquisition of properties in the Delaware Basin, a $7.4 million increase in interest for the issuance of our 2024 Senior Notes, and a $2.9 million increase in interest expense for the issuance of our 2021 Convertible Notes in September 2016. The increases were partially offset by a $5.1 million decrease in interest expense resulting from the net settlement of our 2016 Convertible Notes in May 2016. The entire $9.3 million of interest expense attributed to the bridge loan facility was expensed in 2016 as the bridge loan was not used.
Interest costs capitalized in 2017, 2016, and 2015 were $5.0 million, $4.5 million, and $5.1 million, respectively.
Loss on Extinguishment of Debt
The $24.7 million pre-tax loss on extinguishment of debt relates to the redemption of the 2022 Senior Notes during the fourth quarter of 2017. The pretax loss consists of a $19.4 million make-whole premium and the write-off of unamortized debt issuance costs of $5.4 million.
Provision for Income Taxes
Current income tax (expense) benefit in 2017, 2016, and 2015 was $8.2 million, $9.9 million, and $(3.1) million, respectively. Current income taxes generally relate to the cash that is paid or recovered for income taxes associated with the applicable period. The remaining portion of the total income tax provision is comprised of deferred income taxes, which are a result of differences in the timing of deductions from our U.S. GAAP presentation of financial statements and the income tax regulations.
Our effective income tax rates for 2017, 2016, and 2015 were 62.4 percent, 37.4 percent, and 35.9 percent, respectively, on income (loss) from operations. The 2017 rate differs from the statutory rate of 35 percent primarily due to the reduction in the federal corporate income tax rate resulting from the 2017 Tax Act increasing the tax rate on our 2017 loss from operations by 33.7 percent. Additionally, the nondeductible goodwill impairment charge in 2017 reduced the 2017 rate by 7.7 percent. The 2017 rate was also impacted by state taxes. The 2016 and 2015 rates differ from the federal statutory tax rate
56
primarily due to state taxes and excess stock compensation benefits, offset by nondeductible expenses that consist primarily of officers' compensation cost and government lobbying expenses.
In 2016, we recorded a net deferred tax liability of $379.9 million due to book versus tax accounting basis differences of assets acquired and deferred tax liabilities assumed from the acquisition in the Delaware Basin, resulting in a material increase in our deferred tax liability on the balance sheet as of December 31, 2016. In 2017, the deferred tax liability was reduced by $94.1 million as a result of recording an impairment charge related to a portion of these Delaware Basin assets.
As of the date of this report, we are current with our income tax filings in all applicable state jurisdictions. We continue to voluntarily participate in the Internal Revenue Service’s ("IRS") Compliance Assurance Program (the "CAP Program") for the 2016 through 2018 tax years. We have received a partial acceptance notice from the IRS for our filed 2016 federal tax return and the IRS's post filing review is currently ongoing.
Net Income (Loss)/Adjusted Net Income (Loss)
The factors resulting in changes in net loss in 2017, 2016, and 2015 are discussed above. These same reasons similarly impacted adjusted net income (loss), a non-U.S. GAAP financial measure, with the exception of the net change in fair value of unsettled derivatives, adjusted for taxes, of $13.1 million, $208.9 million, and $22.2 million in 2017, 2016, and 2015, respectively. Adjusted net loss, a non-U.S. GAAP financial measure, was $114.4 million, $37.0 million, and $46.2 million in 2017, 2016, and 2015 respectively. See Reconciliation of Non-U.S. GAAP Financial Measures, below, for a more detailed discussion of this non-U.S. GAAP financial measure.
Financial Condition, Liquidity and Capital Resources
Historically, our primary sources of liquidity have been cash flows from operating activities, our revolving credit facility, proceeds from debt and equity capital market transactions, and asset sales. In 2017, our primary sources of liquidity were net cash flows from operating activities of $588.6 million, net proceeds from issuance of the 2026 Senior Notes of approximately $592.4 million, and $40.2 million of proceeds from the sale of a promissory note.
We used a portion of the net proceeds from the 2026 Senior Notes to fund the redemption our 2022 Senior Notes and a portion of the purchase price of the Bayswater Acquisition in early 2018, and for general corporate purposes.
Our primary source of cash flows from operating activities is the sale of crude oil, natural gas, and NGLs. Fluctuations in our operating cash flows are principally driven by commodity prices and changes in our production volumes. Commodity prices have historically been volatile and we manage a portion of this volatility through our use of derivative instruments. We enter into commodity derivative instruments with maturities of no greater than five years from the date of the instrument. Our revolving credit facility imposes limits on the amount of our production we can hedge, and we may choose not to hedge the maximum amounts permitted. Therefore, we may still have fluctuations in our cash flows from operating activities due to the remaining non-hedged portion of our future production. Based upon our hedge position and assuming forward strip pricing as of December 31, 2017, our derivatives are not expected to be a significant source of cash flow in the near term.
Our working capital fluctuates for various reasons, including, but not limited to, changes in the fair value of our commodity derivative instruments and changes in our cash and cash equivalents due to our practice of utilizing excess cash to reduce the outstanding borrowings under our revolving credit facility. At December 31, 2017, we had a working capital deficit of $16.4 million compared to working capital of $129.2 million at December 31, 2016. The decrease in working capital as of December 31, 2017 is primarily the result of a decrease in cash and cash equivalents of $63.4 million related to capital investment exceeding operating cash flows, an increase in accounts payable of $83.7 million related to increased development and exploration activity, and a decrease in the net fair value of our unsettled commodity derivatives of $20.2 million, which was partially offset by an increase in our net accounts receivable balance of $54.2 million.
Our cash and cash equivalents were $180.7 million at December 31, 2017 and availability under our revolving credit facility was $700.0 million, providing for total liquidity of $880.7 million as of December 31, 2017. Our liquidity was augmented in 2017 by the net proceeds from the 2026 Senior Notes and the proceeds from the sale of a promissory note, described previously.
57
Based on our expectations of cash flows from operations, our cash and cash equivalent balance and availability under our revolving credit facility, we believe that we have sufficient capital to fund our planned activities through the 12-month period following the filing of this report.
Our revolving credit facility is a borrowing base facility and availability under the facility is subject to redetermination generally each May and November, based upon a quantification of our proved reserves at each December 31 and June 30, respectively. The maturity date of our revolving credit facility is May 2020.
In May and October 2017, we entered into the Fifth and Sixth Amendments, respectively, to the Third Amended and Restated Credit Agreement to amend the revolving credit facility to reflect increases in the borrowing base. The Fifth amendment reflected an increase of the borrowing base from $700 million to $950 million and the Sixth Amendment amended the revolving credit facility to allow the borrowing base to increase above the borrowing capacity of $1.0 billion. In addition, the Fifth Amendment made changes to certain of the covenants in the existing agreement as well as other administrative changes. We elected to increase the borrowing base to $1.1 billion for our November 2017 borrowing base redetermination and have elected to maintain a $700 million commitment level as of the date of this report.
Amounts borrowed under the revolving credit facility bear interest at either an alternate base rate option or a LIBOR option as defined in the revolving credit facility plus an applicable margin, depending on the percentage of the commitment that has been utilized. As of December 31, 2017, the applicable margin is 1.25 percent for the alternate base rate option or 2.25 percent for the LIBOR option, and the unused commitment fee is 0.5 percent.
We had no amounts outstanding under our revolving credit facility as of December 31, 2017. In May 2017, we replaced our $11.7 million irrevocable standby letter of credit that we held in favor of a third-party transportation service provider to secure a firm transportation obligation with a $9.3 million deposit, which is classified as restricted cash and is included in other assets on the consolidated balance sheet. As of December 31, 2017, the available funds under our revolving credit facility were $700 million based on our elected commitment level.
Our revolving credit facility contains financial maintenance covenants. The covenants require that we maintain (i) a leverage ratio defined as total debt of less than 4.0 times the trailing 12 months earnings before interest, taxes, depreciation, depletion and amortization, change in fair value of unsettled commodity derivatives, exploration expense, gains (losses) on sales of assets and other non-cash gains (losses) and (ii) an adjusted current ratio of at least 1.0:1.0. Our adjusted current ratio is adjusted by eliminating the impact on our current assets and liabilities of recording the fair value of crude oil and natural gas commodity derivative instruments. Additionally, available borrowings under our revolving credit facility are added to the current asset calculation and the current portion of our revolving credit facility debt is eliminated from the current liabilities calculation. At December 31, 2017, we were in compliance with all debt covenants, as defined by the revolving credit agreement, with a leverage ratio of 1.9 and a current ratio of 3.2. We expect to remain in compliance throughout the 12-month period following the filing of this report.
The indentures governing our 2024 Senior Notes and 2026 Senior Notes contain customary restrictive covenants that, among other things, limit our ability and the ability of our restricted subsidiaries to: (a) incur additional debt including under our revolving credit facility, (b) make certain investments or pay dividends or distributions on our capital stock or purchase, redeem, or retire capital stock, (c) sell assets, including capital stock of our restricted subsidiaries, (d) restrict the payment of dividends or other payments by restricted subsidiaries to us, (e) create liens that secure debt, (f) enter into transactions with affiliates, and (g) merge or consolidate with another company. At December 31, 2017, we were in compliance with all covenants and expect to remain in compliance throughout the next 12-month period.
In January 2017, pursuant to the filing of the supplemental indentures for the 2021 Convertible Senior Notes and the 2024 Senior Notes, our subsidiary PDC Permian, Inc. became a guarantor of the notes. PDC Permian, Inc. is also the guarantor of our 2026 Senior Notes issued in November 2017.
58
Cash Flows
Operating Activities. Our net cash flows from operating activities are primarily impacted by commodity prices, production volumes, net settlements from our commodity derivative positions, operating costs, and general and administrative expenses. Cash flows provided by operating activities increased in 2017 as compared to 2016. The $102.3 million increase was primarily due to the increase in crude oil, natural gas, and NGLs sales of $415.7 million. The increase was partially offset by a decrease in derivative commodity settlements of $194.8 million and increases in lease operating expenses of $29.7 million, production taxes of $29.3 million, interest expense of $16.7 million, transportation, gathering, and processing expenses of $14.8 million, and increases in general and administrative expense of $7.9 million as well as a decrease in the changes in assets and liabilities of $13.0 million.
Cash flows provided by operating activities increased in 2016 compared to 2015. The $75.2 million increase was primarily due to the increase in crude oil, natural gas, and NGLs sales of $118.7 million. We also realized an increase in the change of funds held for distribution of $36.5 million, and an increase in the deferral of income taxes of $13.1 million. The increases were partially offset by a decrease in derivative commodity settlements of $30.8 million, and increases in general and administrative expense of $22.5 million, interest expense of $14.4 million, production taxes of $13.0 million and transportation, gathering, and processing expenses of $8.3 million.
Adjusted cash flows from operations, a non-U.S. GAAP financial measure, increased by $115.3 million in 2017 to $582.1 million, and $46.0 million to $466.8 million in 2016, when compared to the respective prior years. These changes were primarily due to the same factors mentioned above for changes in cash flows provided by operating activities, without regard to changes in assets and liabilities.
Adjusted EBITDAX, a non-U.S. GAAP financial measure, increased by $222.3 million in 2017 to $682.1 million from $459.8 million in 2016, primarily as the result of the increase in crude oil, natural gas, and NGLs sales of $415.7 million, as well as the recording of a provision for a note receivable in 2016 of $44.0 million, and the subsequent sale of the note in 2017 to a third-party for $40.2 million. The increase was partially offset by a decrease in derivative commodity settlements of $194.8 million, and increases in lease operating expenses of $29.7 million, production taxes of $29.3 million, interest expense of $16.7 million, transportation, gathering, and processing expenses of $14.8 million, and general and administrative expense of $7.9 million.
Adjusted EBITDAX, a non-U.S. GAAP financial measure, decreased by $4.5 million in 2016 to $459.8 million from $464.3 million in 2015, primarily as a result of the provision for uncollectible notes receivable of $44.0 million, the decrease in net settlements from our monthly derivative commodity settlements of $30.8 million, an increase in general and administrative expense of $22.5 million, and a $13.0 million increase in production taxes. The decrease was partially offset by the increase in crude oil, natural gas, and NGLs sales of $118.7 million.
See Item 7. Reconciliation of Non-U.S. GAAP Financial Measures for a reconciliation of our U.S. GAAP to non-U.S. GAAP financial measures.
Investing Activities. Because crude oil and natural gas production from a well declines rapidly in the first few years of production, we continue to invest significant amounts of capital in order to maintain and grow our production and replace our reserves. If capital markets are not available in the future, we will be limited to our cash flows from operations and liquidity under our revolving credit facility as the sources for funding our capital investments.
Cash flows from investing activities primarily consist of the acquisition, exploration, and development of crude oil and natural gas properties, net of dispositions of crude oil and natural gas properties. Net cash used in investing activities of $717.0 million during 2017 was primarily related to cash utilized for our drilling operations, including completion activities of $737.2 million, a $21.0 million deposit toward the Bayswater Acquisition, purchases of short-term investments of $49.9 million, and a $9.3 million deposit with a third-party transportation service provider for surety of an existing firm transportation obligation. Partially offsetting these investments was the receipt of approximately $49.9 million related to the sale of short-term investments, $40.2 million from the sale of a promissory note, and $5.4 million related to post-closing settlements of properties acquired in 2016. During 2016, our acquisition in the Delaware Basin comprised the majority of our cash flows used in investing activities. Net cash used in the Delaware Basin acquisition was $1.1 billion and we used cash of $436.9 million for our crude oil and gas operations. Our total cash used in investing activities during 2016 was approximately $1.5 billion.
Financing Activities. Net cash from financing activities in 2017 was primarily related to $592.4 million of net proceeds from issuance of the 2026 Senior Notes, partially offset by the $519.4 million used to redeem our 2022 Senior Notes.
59
Net cash from financing activities in 2016 was primarily related to the $855.1 million of net proceeds received from the issuance of 9.4 million shares of our common stock, $392.2 million of net proceeds from issuance of the 2024 Senior Notes, and $193.9 million of net proceeds from issuance of the 2021 Convertible Notes, partially offset by the $115.0 million payment upon the maturity of the 2016 Convertible Notes and net payments of approximately $37.0 million to pay down amounts borrowed under our revolving credit facility.
Contractual Obligations and Contingent Commitments
The following table presents our contractual obligations and contingent commitments as of December 31, 2017:
Payments due by period | ||||||||||||||||||||
Less than | 1-3 | 3-5 | More than | |||||||||||||||||
Contractual Obligations and Contingent Commitments | Total | 1 year | years | years | 5 years | |||||||||||||||
(in millions) | ||||||||||||||||||||
Long-term liabilities reflected on the consolidated balance sheet (1) | ||||||||||||||||||||
Long-term debt (2) | $ | 1,200 | $ | — | $ | — | $ | 200 | $ | 1,000 | ||||||||||
Commodity derivative contracts (3) | 101 | 79 | 22 | — | — | |||||||||||||||
Capital leases (4) | 4 | 1 | 3 | — | — | |||||||||||||||
Production tax liability | 85 | 38 | 47 | — | — | |||||||||||||||
Asset retirement obligations | 87 | 16 | 32 | 32 | 7 | |||||||||||||||
Other liabilities (5) | 8 | 2 | 2 | 2 | 2 | |||||||||||||||
1,485 | 136 | 106 | 234 | 1,009 | ||||||||||||||||
Commitments, contingencies and other arrangements (6) | ||||||||||||||||||||
Interest on long-term debt (7) | 552 | 87 | 172 | 135 | 158 | |||||||||||||||
Operating leases | 23 | 4 | 8 | 8 | 3 | |||||||||||||||
Firm transportation and processing agreements (8) | 262 | 23 | 86 | 66 | 87 | |||||||||||||||
837 | 114 | 266 | 209 | 248 | ||||||||||||||||
Total | $ | 2,322 | $ | 250 | $ | 372 | $ | 443 | $ | 1,257 | ||||||||||
__________
(1) | Table does not include deferred income tax liability to taxing authorities of $192.0 million due to the uncertainty surrounding the ultimate settlement of amounts and timing of these obligations. |
(2) | Amount presented does not agree with the consolidated balance sheets in that it excludes $30.3 million of unamortized debt discount and $17.7 million of unamortized debt issuance costs. |
(3) | Represents our gross liability related to the fair value of derivative positions. |
(4) | Short-term capital lease obligations are included in other accrued expenses on the consolidated balance sheets. Long-term capital lease obligations are included in other liabilities on the consolidated balance sheets. |
(5) | Includes deferred compensation to former executive officers and deferred payments related to firm transportation agreements. |
(6) | The table does not include termination benefits related to employment agreements with our executive officers, due to the uncertainty surrounding the ultimate settlement of amounts and timing of these obligations. |
(7) | Amounts presented include $288.9 million to the holders of our 2026 Senior Notes, $164.2 million to the holders of our 2024 Senior Notes, and $90.7 million payable to the holders of our 2021 Convertible Notes. Amounts also include interest of $8.4 million related to unutilized commitments at a rate of 0.50 percent per annum. |
(8) | Represents our gross commitment which includes volumes produced by us, purchased from third parties and produced by our affiliated partnerships and other third-party working, royalty and overriding royalty interest owners whose volumes we market on their behalf. This includes anticipated and estimated commitments associated with two new gas processing facilities by our primary mid-stream provider. The timing of such payments has been estimated and is subject to change based on the completion of construction and the commencement of operations by the midstream provider. |
From time to time, we are a party to various legal proceedings in the ordinary course of business. We are not currently a party to any litigation that we believe would have a materially adverse effect on our business, financial condition, results of operations, or liquidity. Information regarding our legal proceedings can found in the footnote titled Commitments and Contingencies - Litigation and Legal Items to our consolidated financial statements included elsewhere in this report.
Critical Accounting Policies and Estimates
We have identified the following policies as critical to business operations and the understanding of our results of operations. This is not a comprehensive list of all of the accounting policies. In many cases, the accounting treatment of a particular transaction is specifically dictated by U.S. GAAP, with no need for our judgment in the application. There are also
60
areas in which our judgment in selecting available alternatives would not produce a materially different result. However, certain of our accounting policies are particularly important to the presentation of our financial position and results of operations and we may use significant judgment in their application. As a result, they are subject to an inherent degree of uncertainty. In applying those policies, we use our judgment to determine the appropriate assumptions to be used in the determination of certain estimates. Those estimates are based on historical experience, observation of trends in the industry and information available from other outside sources, as appropriate. For a more detailed discussion on the application of these and other accounting policies, see the footnote titled Summary of Significant Accounting Policies to our consolidated financial statements included elsewhere in this report.
Crude Oil and Natural Gas Properties. We account for our crude oil and natural gas properties under the successful efforts method of accounting. Costs of proved developed producing properties, successful exploratory wells and developmental dry hole costs are capitalized and depreciated or depleted by the unit-of-production method based on estimated proved developed producing reserves. Property acquisition costs are depreciated or depleted on the unit-of-production method based on estimated proved reserves.
Annually, we engage independent petroleum engineers to prepare reserve and economic evaluations of all our properties on a well-by-well basis as of December 31. We adjust our crude oil and natural gas reserves for major acquisitions, new drilling, and divestitures during the year as needed. The process of estimating and evaluating crude oil and natural gas reserves is complex, requiring significant decisions in the evaluation of available geological, geophysical, engineering, and economic data. The data for a given property may also change substantially over time as a result of numerous factors, including additional development activity, evolving production history and a continual reassessment of the viability of production under changing economic conditions. As a result, revisions in existing reserve estimates occur. Although every reasonable effort is made to ensure that reserve estimates reported represent our most accurate assessments possible, the subjective decisions and variances in available data for various properties increase the likelihood of significant changes in these estimates over time. Because estimates of reserves significantly affect our DD&A expense, a change in our estimated reserves could have an effect on our net income (loss).
Exploration costs, including geological and geophysical expenses, the acquisition of seismic data covering unproved acreage, and delay rentals, are charged to expense as incurred. Exploratory well drilling costs, including the cost of stratigraphic test wells, are initially capitalized, but are charged to expense if the well is determined to be nonproductive. The status of each in-progress well is reviewed quarterly to determine the proper accounting treatment under the successful efforts method of accounting. Exploratory well costs continue to be capitalized as long as the well has found a sufficient quantity of reserves to justify completion as a producing well and we are making sufficient progress assessing our reserves and economic and operating viability. If an in-progress exploratory well is found to be unsuccessful prior to the issuance of the financial statements, the costs incurred prior to the end of the reporting period are charged to exploration expense. If we are unable to make a final determination about the productive status of a well prior to issuance of the financial statements, the well is classified as a "suspended well" until we have had sufficient time to conduct additional completion or testing operations to evaluate the pertinent geological and engineering data obtained. At the time when we are able to make a final determination of a well’s productive status, the well is removed from suspended well status and the proper accounting treatment is applied.
The acquisition costs of unproved properties are capitalized when incurred until such properties are transferred to proved properties or charged to expense when expired, impaired, or amortized. Unproved crude oil and natural gas properties with individually significant acquisition costs are periodically assessed, and any impairment in value is charged to impairment of crude oil and natural gas properties. The amount of impairment recognized on unproved properties which are not individually significant is determined by amortizing the costs of such properties within appropriate fields based on our historical experience, acquisition dates and average lease terms, with the amortization recognized in impairment of crude oil and natural gas properties. The valuation of unproved properties is subjective and requires us to make estimates and assumptions which, with the passage of time, may prove to be materially different from actual realizable values.
We assess our crude oil and natural gas properties for possible impairment upon a triggering event, including when general industry conditions warrant, by comparing net capitalized costs to estimated undiscounted future net cash flows on a field-by-field basis using estimated production based upon prices at which we reasonably estimate the commodity will be sold. Any impairment in value is charged to impairment of properties and equipment. The estimates of future prices may differ from current market prices of crude oil and natural gas. Any downward revisions in estimates to our reserve quantities, expectations of falling commodity prices, or rising operating costs could result in a triggering event, and therefore, a reduction in undiscounted future net cash flows and an impairment of our crude oil and natural gas properties. Although our cash flow estimates are based on the relevant information available at the time the estimates are made, estimates of future cash flows are, by nature, highly uncertain and may vary significantly from actual results.
61
Crude Oil, Natural Gas, and NGLs Sales Revenue Recognition. Crude oil, natural gas, and NGLs sales are recognized when production is sold to a purchaser at a determinable price, delivery has occurred, rights and responsibility of ownership have transferred and collection of revenue is reasonably assured. We record sales revenue based on an estimate of the volumes delivered at estimated prices as determined by the applicable sales agreement. We estimate our sales volumes based on company-measured volume readings. We then adjust our crude oil, natural gas, and NGLs sales in subsequent periods based on the data received from our purchasers that reflects actual volumes and prices received. We receive payment for sales from one to two months after actual delivery has occurred. The differences in sales estimates and actual sales are recorded one to two months later. Historically, these differences have been immaterial. If a sale is deemed uncollectible, an allowance for doubtful collection is recorded. There is a new revenue standard effective for annual reporting periods beginning after December 15, 2017. See the footnote titled Summary of Significant Accounting Policies - Recently Issued Accounting Standards.
Fair Value of Financial Instruments. Our fair value measurements are estimated pursuant to a fair value hierarchy that requires us to maximize the use of observable inputs and minimize the use of unobservable inputs when measuring fair value. The valuation hierarchy is based upon the transparency of inputs to the valuation of an asset or liability as of the measurement date, giving the highest priority to quoted prices in active markets (Level 1) and the lowest priority to unobservable data (Level 3). In some cases, the inputs used to measure fair value might fall in different levels of the fair value hierarchy. The lowest level input that is significant to a fair value measurement in its entirety determines the applicable level in the fair value hierarchy. Assessing the significance of a particular input to the fair value measurement in its entirety requires judgment, considering factors specific to the asset or liability, and may affect the valuation of the assets and liabilities and their placement within the fair value hierarchy levels. The three levels of inputs that may be used to measure fair value are defined as:
Level 1 – Quoted prices (unadjusted) for identical assets or liabilities in active markets.
Level 2 – Inputs other than quoted prices included within Level 1 that are either directly or indirectly observable for the asset or liability, including quoted prices for similar assets or liabilities in active markets, quoted prices for identical or similar assets or liabilities in inactive markets, inputs other than quoted prices that are observable for the asset or liability, and inputs that are derived from observable market data by correlation or other means.
Level 3 – Unobservable inputs for the asset or liability, including situations where there is little, if any, market activity.
Commodity Derivative Financial Instruments. We measure the fair value of our commodity derivative instruments based on a pricing model that utilizes market-based inputs, including but not limited to the contractual price of the underlying position, current market prices, natural gas, and crude oil forward curves, discount rates such as the LIBOR curve for a similar duration of each outstanding position, volatility factors and nonperformance risk. Nonperformance risk considers the effect of our credit standing on the fair value of commodity derivative liabilities and the effect of our counterparties' credit standings on the fair value of commodity derivative assets. Both inputs to the model are based on published credit default swap rates and the duration of each outstanding commodity derivative position.
We validate our fair value measurement through the review of counterparty statements and other supporting documentation, the determination that the source of the inputs is valid, the corroboration of the original source of inputs through access to multiple quotes, if available, or other information and monitoring changes in valuation methods and assumptions. While we use common industry practices to develop our valuation techniques, changes in our pricing methodologies or the underlying assumptions could result in significantly different fair values. While we believe our valuation method is appropriate and consistent with those used by other market participants, the use of a different methodology, or assumptions to determine the fair value of certain financial instruments could result in a different estimate of fair value.
Net settlements on our commodity derivative instruments are initially recorded to accounts receivable or payable, as applicable, and may not be received from or paid to counterparties to our commodity derivative contracts within the same accounting period. Such settlements typically occur the month following the maturity of the commodity derivative instrument. We have evaluated the credit risk of the counterparties holding our commodity derivative assets, which are primarily financial institutions who are also major lenders in our revolving credit facility, giving consideration to amounts outstanding for each counterparty and the duration of each outstanding commodity derivative position. Based on our evaluation, we have determined that the potential impact of nonperformance of our counterparties on the fair value of our commodity derivative instruments is not significant.
Deferred Income Tax Asset Valuation Allowance. Deferred income tax assets are recognized for deductible temporary differences, net operating loss carry-forwards and credit carry-forwards if it is more likely than not that the tax
62
benefits will be realized. To the extent a deferred tax asset is not expected to be realized under the preceding criteria, we establish a valuation allowance. The factors which we consider in assessing whether we will realize the value of deferred income tax assets involve judgments and estimates of both amount and timing. The judgments used in applying these policies are based on our evaluation of the relevant facts and circumstances as of the date of the financial statements. Actual results may differ from those estimates.
Accounting for Business Combinations. We utilize the purchase method to account for acquisitions of businesses and assets. The value of the purchase consideration takes into account the degree to which the consideration is objective and measurable such as cash consideration paid to a seller. With the issuance of equity, restrictions upon the sale of the issued stock are taken into consideration. Pursuant to purchase method accounting, we allocate the cost of the acquisition to assets acquired and liabilities assumed based on fair values as of the acquisition date. The purchase price allocations are based on appraisals, discounted cash flows, quoted market prices, and estimates by management. When appropriate, we review comparable purchases and sales of crude oil and natural gas properties within the same regions and use that data as a basis for fair market value as such sales represent the amount at which a willing buyer and seller would enter into an exchange for such properties.
In estimating the fair values of assets acquired and liabilities assumed, we make various assumptions. The most significant assumptions relate to the estimated fair values assigned to proved developed producing, proved developed non-producing, proved undeveloped and unproved crude oil and natural gas properties, and other non-crude oil and natural gas properties. To estimate the fair values of these properties, we prepare estimates of crude oil and natural gas reserves. When appropriate, we review comparable purchases and sales of crude oil and natural gas properties within the same regions and use that data as a basis for fair market value; for example, the amount at which a willing buyer and seller would enter into an exchange for such properties. We estimate future prices by using the applicable forward pricing strip to apply to our estimate of reserve quantities acquired, and estimates of future operating and development costs, to arrive at an estimate of future net revenues. For estimated proved reserves, the future net revenues are discounted using a market-based weighted-average cost of capital rate determined appropriate at the time of the acquisition. The market-based weighted-average cost of capital rate is subject to additional project-specific risking factors. To compensate for the inherent risk of estimating and valuing unproved properties, we reduce the discounted future net revenues of probable and possible reserves by additional risk-weighting factors.
We record deferred taxes for any differences between the assigned values and tax basis of assets and liabilities. Estimated deferred taxes are based on available information concerning the tax basis of assets acquired and liabilities assumed and loss carryforwards at the acquisition date, although such estimates may change in the future as additional information becomes known.
Recent Accounting Standards
See the footnote titled Summary of Significant Accounting Policies - Recently Adopted Accounting Standards to our consolidated financial statements included elsewhere in this report.
Reconciliation of Non-U.S. GAAP Financial Measures
We use "adjusted cash flows from operations," "adjusted net income (loss)" and "adjusted EBITDAX," non-U.S. GAAP financial measures, for internal management reporting, when evaluating period-to-period changes and, in some cases, providing public guidance on possible future results. Beginning in 2017, we have included non-cash stock-based compensation and exploration, geologic and geophysical expense in our reconciliation of adjusted EBITDAX calculation. In prior periods, we disclosed adjusted EBITDA, a non-U.S. GAAP financial measure that did not include these adjustments. We have elected to disclose Adjusted EBITDAX rather than Adjusted EBITDA in this report and other public disclosures because we believe it is more comparable to similar metrics presented by others in the industry. All prior periods have been conformed for comparability of this information. These measures are not measures of financial performance under U.S. GAAP and should be considered in addition to, not as a substitute for, net income (loss) or cash flows from operations, investing or financing activities, and should not be viewed as liquidity measures or indicators of cash flows reported in accordance with U.S. GAAP. The non-U.S. GAAP financial measures that we use may not be comparable to similarly titled measures reported by other companies. Also, in the future, we may disclose different non-U.S. GAAP financial measures in order to help our investors more meaningfully evaluate and compare our future results of operations to our previously reported results of operations. We strongly encourage investors to review our financial statements and publicly filed reports in their entirety and not rely on any single financial measure.
Adjusted cash flows from operations. We define adjusted cash flows from operations as the cash flows earned or incurred from operating activities, without regard to changes in operating assets and liabilities. We believe it is important to consider adjusted cash flows from operations, as well as cash flows from operations, as we believe it often provides more
63
transparency into what drives the changes in our operating trends, such as production, prices, operating costs, and related operational factors, without regard to whether the related asset or liability was received or paid during the same period. We also use this measure because the timing of cash received from our assets, cash paid to obtain an asset or payment of our obligations has generally been a timing issue from one period to the next as we have not had significant accounts receivable collection problems, nor been unable to purchase assets or pay our obligations.
Adjusted net income (loss). We define adjusted net income (loss) as net income (loss), plus loss on commodity derivatives, less gain on commodity derivatives, and net settlements on commodity derivatives, each adjusted for tax effect. We believe it is important to consider adjusted net income (loss), as well as net income (loss). We believe this measure often provides more transparency into our operating trends, such as production, prices, operating costs, net settlements from derivatives, and related factors, without regard to changes in our net income (loss) from our mark-to-market adjustments resulting from net changes in the fair value of unsettled derivatives. Additionally, other items which are not indicative of future results may be excluded to clearly identify operating trends.
Adjusted EBITDAX. We define adjusted EBITDAX as net income (loss), plus loss on commodity derivatives, interest expense, net of interest income, income taxes, impairment of properties and equipment, exploration, geologic, and geophysical expense, depreciation, depletion and amortization expense, accretion of asset retirement obligations, and non-cash stock-based compensation, less gain on commodity derivatives and net settlements on commodity derivatives. Adjusted EBITDAX is not a measure of financial performance or liquidity under U.S. GAAP and should be considered in addition to, not as a substitute for, net income (loss), and should not be considered an indicator of cash flows reported in accordance with U.S. GAAP. Adjusted EBITDAX includes certain non-cash costs incurred by us and does not take into account changes in operating assets and liabilities. Other companies in our industry may calculate adjusted EBITDAX differently than we do, limiting its usefulness as a comparative measure. We believe adjusted EBITDAX is relevant because it is a measure of our operational and financial performance, as well as a measure of our liquidity, and is used by our management, investors, commercial banks, research analysts, and others to analyze such things as:
• | operating performance and return on capital as compared to our peers; |
• | financial performance of our assets and our valuation without regard to financing methods, capital structure, or historical cost basis; |
• | our ability to generate sufficient cash to service our debt obligations; and |
• | the viability of acquisition opportunities and capital expenditure projects, including the related rate of return. |
PV-10. We define PV-10 as the estimated present value of the future net cash flows from our proved reserves before income taxes, discounted using a 10 percent discount rate. We believe that PV-10 provides useful information to investors as it is widely used by professional analysts and sophisticated investors when evaluating oil and gas companies. We believe that PV-10 is relevant and useful for evaluating the relative monetary significance of our reserves. Professional analysts, investors, and other users of our financial statements may utilize the measure as a basis for comparison of the relative size and value of our reserves to other companies' reserves. Because there are many unique factors that can impact an individual company when estimating the amount of future income taxes to be paid, we believe the use of a pre-tax measure is valuable in evaluating us and our reserves. PV-10 is not intended to represent the current market value of our estimated reserves.
64
The following table presents a reconciliation of our non-U.S. GAAP financial measures to its most comparable U.S. GAAP measure:
Year Ended December 31, | |||||||||||
2017 | 2016 | 2015 | |||||||||
(in millions) | |||||||||||
Adjusted cash flows from operations: | |||||||||||
Net cash from operating activities | $ | 588.6 | $ | 486.3 | $ | 411.1 | |||||
Changes in assets and liabilities | (6.5 | ) | (19.5 | ) | 9.7 | ||||||
Adjusted cash flows from operations | $ | 582.1 | $ | 466.8 | $ | 420.8 | |||||
Adjusted net loss: | |||||||||||
Net loss | $ | (127.5 | ) | $ | (245.9 | ) | $ | (68.3 | ) | ||
(Gain) loss on commodity derivative instruments | 3.9 | 125.7 | (203.2 | ) | |||||||
Net settlements on commodity derivative instruments | 13.3 | 208.1 | 238.9 | ||||||||
Tax effect of above adjustments | (4.1 | ) | (124.9 | ) | (13.6 | ) | |||||
Adjusted net loss | $ | (114.4 | ) | $ | (37.0 | ) | $ | (46.2 | ) | ||
Net loss to adjusted EBITDAX: | |||||||||||
Net loss | $ | (127.5 | ) | $ | (245.9 | ) | $ | (68.3 | ) | ||
(Gain) loss on commodity derivative instruments | 3.9 | 125.7 | (203.2 | ) | |||||||
Net settlements on commodity derivative instruments | 13.3 | 208.1 | 238.9 | ||||||||
Non-cash stock-based compensation | 19.4 | 19.5 | 20.1 | ||||||||
Interest expense, net | 76.4 | 61.0 | 42.8 | ||||||||
Income tax benefit | (211.9 | ) | (147.2 | ) | (38.3 | ) | |||||
Impairment of properties and equipment | 285.9 | 10.0 | 161.6 | ||||||||
Impairment of goodwill | 75.1 | — | — | ||||||||
Exploration, geologic, and geophysical expense | 47.3 | 4.7 | 1.1 | ||||||||
Depreciation, depletion, and amortization | 469.1 | 416.9 | 303.3 | ||||||||
Accretion of asset retirement obligations | 6.4 | 7.0 | 6.3 | ||||||||
Loss on extinguishment of debt | 24.7 | — | — | ||||||||
Adjusted EBITDAX | $ | 682.1 | $ | 459.8 | $ | 464.3 | |||||
Cash from operating activities to adjusted EBITDAX: | |||||||||||
Net cash from operating activities | $ | 588.6 | $ | 486.3 | $ | 411.1 | |||||
Interest expense, net | 76.4 | 61.0 | 42.8 | ||||||||
Amortization of debt discount and issuance costs | (12.9 | ) | (16.2 | ) | (7.0 | ) | |||||
Gain on sale of properties and equipment | 0.7 | — | 0.4 | ||||||||
Exploration, geologic, and geophysical expense | 47.3 | 4.7 | 1.1 | ||||||||
Exploratory dry hole expense | (41.3 | ) | — | — | |||||||
Other | 29.8 | (56.5 | ) | 6.2 | |||||||
Changes in assets and liabilities | (6.5 | ) | (19.5 | ) | 9.7 | ||||||
Adjusted EBITDAX | $ | 682.1 | $ | 459.8 | $ | 464.3 | |||||
PV-10: | |||||||||||
PV-10 | $ | 3,212.0 | $ | 1,675.0 | $ | 1,337.5 | |||||
Present value of estimated future income tax discounted at 10% | (331.9 | ) | (254.4 | ) | (240.6 | ) | |||||
Standardized measure of discounted future net cash flows | $ | 2,880.1 | $ | 1,420.6 | $ | 1,096.9 | |||||
Amounts above include results from continuing and discontinued operations.
65
ITEM 7A. QUANTITATIVE AND QUALITATIVE DISCLOSURES ABOUT MARKET RISK
Market-Sensitive Instruments and Risk Management
We are exposed to market risks associated with interest rate risks, commodity price risk, and credit risk. We have established risk management processes to monitor and manage these market risks.
Interest Rate Risk
Changes in interest rates affect the amount of interest we earn on our interest bearing cash and cash equivalents and the interest we pay on borrowings under our revolving credit facility. Our 2021 Convertible Notes, 2024 Senior Notes, and 2026 Senior Notes have fixed rates and, therefore, near-term changes in interest rates do not expose us to risk of earnings or cash flow loss; however, near-term changes in interest rates may affect the fair value of our fixed-rate debt.
As of December 31, 2017, our interest-bearing deposit accounts included money market accounts and checking accounts with various banks. The amount of our interest-bearing cash and cash equivalents as of December 31, 2017 was $179.6 million, with a weighted-average interest rate of one percent. Based on a sensitivity analysis of our interest bearing deposits as of December 31, 2017 and assuming we had $179.6 million outstanding throughout the period, we estimate that a one percent increase in interest rates would have increased interest income for the twelve months ended December 31, 2017 by approximately $1.8 million.
As of December 31, 2017, we had no outstanding balance on our revolving credit facility.
Commodity Price Risk
We are exposed to the potential risk of loss from adverse changes in the market price of crude oil, natural gas, and NGLs. Pursuant to established policies and procedures, we manage a portion of the risks associated with these market fluctuations using commodity derivative instruments. These instruments help us predict with greater certainty the effective crude oil, natural gas, and propane prices we will receive for our hedged production. We believe that our commodity derivative policies and procedures are effective in achieving our risk management objectives.
66
The following table presents our commodity derivative positions related to crude oil, natural gas, and NGLs in effect as of December 31, 2017:
Collars | Fixed-Price Swaps | |||||||||||||||||||||
Commodity/ Index/ Maturity Period | Quantity (Gas - BBtu Oil - MBbls) | Weighted-Average Contract Price | Quantity (Oil - MBbls Gas and Basis- BBtu Propane - MBbls) | Weighted- Average Contract Price | Fair Value December 31, 2017 (1) (in millions) | |||||||||||||||||
Floors | Ceilings | |||||||||||||||||||||
Crude Oil | ||||||||||||||||||||||
NYMEX | ||||||||||||||||||||||
2018 | 1,512.0 | $ | 41.85 | $ | 54.31 | 10,372.0 | $ | 52.93 | $ | (73.4 | ) | |||||||||||
2019 | — | — | — | 6,600.0 | 52.47 | (22.3 | ) | |||||||||||||||
Total Crude Oil | 1,512.0 | 16,972.0 | $ | (95.7 | ) | |||||||||||||||||
Natural Gas | ||||||||||||||||||||||
NYMEX | ||||||||||||||||||||||
2018 | 5,230.0 | $ | 3.00 | $ | 3.54 | 51,280.0 | $ | 2.95 | $ | 7.3 | ||||||||||||
Total Natural Gas | 5,230.0 | 51,280.0 | $ | 7.3 | ||||||||||||||||||
Basis Protection - Crude Oil | ||||||||||||||||||||||
Midland Cushing | ||||||||||||||||||||||
2018 | — | — | — | 1,809.9 | (0.10 | ) | $ | (0.2 | ) | |||||||||||||
Total Basis Protection - Crude Oil | — | 1,809.9 | (0.2 | ) | ||||||||||||||||||
Basis Protection - Natural Gas | ||||||||||||||||||||||
CIG | ||||||||||||||||||||||
2018 | — | — | — | 35,200.0 | $ | (0.36 | ) | $ | 5.2 | |||||||||||||
Waha | ||||||||||||||||||||||
2018 | — | — | — | 6,000.0 | (0.50 | ) | 1.3 | |||||||||||||||
El Paso | ||||||||||||||||||||||
2018 | — | — | — | 3,000.0 | (0.62 | ) | $ | 0.5 | ||||||||||||||
Total Basis Protection - Natural Gas | — | 44,200.0 | $ | 7.0 | ||||||||||||||||||
Propane | ||||||||||||||||||||||
Mont Belvieu | ||||||||||||||||||||||
2018 | — | — | — | 1,095.3 | $ | 32.08 | $ | (4.6 | ) | |||||||||||||
Total Propane | — | 1,095.3 | $ | (4.6 | ) | |||||||||||||||||
Rollfactor (2) | ||||||||||||||||||||||
Crude Oil CMA | ||||||||||||||||||||||
2018 | — | — | — | 5,333.9 | 0.12 | $ | (1.1 | ) | ||||||||||||||
Total Rollfactor | — | 5,333.9 | (1.1 | ) | ||||||||||||||||||
Commodity Derivatives Fair Value | $ | (87.3 | ) | |||||||||||||||||||
_____________
(1) | Approximately ten percent of the fair value of our commodity derivative assets and 11 percent of the fair value of our commodity derivative liabilities were measured using significant unobservable inputs (Level 3). |
(2) | These positions hedge the timing risk associated with our physical sales. We generally sell crude oil for the delivery month at a sales price based on the average NYMEX West Texas Intermediate price during that month, plus an adjustment calculated as a spread between the weighted average prices of the delivery month, the next month and the following month during the period when the delivery month is the first month (the "trade month roll"). |
67
Our realized prices vary regionally based on local market differentials and our transportation agreements. The following table presents average market index prices for crude oil and natural gas for the periods identified, as well as the average sales prices we realized for our crude oil, natural gas, and NGLs production:
Year Ended December 31, | |||||||
2017 | 2016 | ||||||
Average NYMEX Index Price: | |||||||
Crude oil (per Bbl) | |||||||
NYMEX | $ | 50.95 | $ | 43.32 | |||
Natural gas (per MMBtu) | |||||||
NYMEX | $ | 3.11 | $ | 2.46 | |||
Average Sales Price Realized: | |||||||
Excluding net settlements on commodity derivatives | |||||||
Crude oil (per Bbl) | $ | 48.45 | $ | 39.96 | |||
Natural gas (per Mcf) | 2.21 | 1.77 | |||||
NGLs (per Bbl) | 18.59 | 11.80 | |||||
Based on a sensitivity analysis as of December 31, 2017, it was estimated that a 10 percent increase in natural gas, crude oil prices, and the propane portion of NGLs prices, inclusive of basis, over the entire period for which we have commodity derivatives in place would have resulted in a decrease in the fair value of our derivative positions of $119.3 million, whereas a 10 percent decrease in prices would have resulted in an increase in fair value of $118.0 million.
Credit Risk
Credit risk represents the loss that we would incur if a counterparty fails to perform under its contractual obligations. We attempt to reduce credit risk by diversifying our counterparty exposure and entering into transactions with high-quality counterparties. When exposed to significant credit risk, we analyze the counterparties’ financial condition prior to entering into an agreement, establish credit limits and monitor the appropriateness of those limits on an ongoing basis. We monitor the creditworthiness of significant counterparties through our credit committee, which utilizes a number of qualitative and quantitative tools to assess credit risk and takes mitigative actions if deemed necessary. While we believe that our credit risk analysis and monitoring procedures are reasonable, no amount of analysis can assure financial performance by our counterparties.
Our oil and gas exploration and production business's crude oil, natural gas, and NGLs sales are concentrated with a few predominately large customers. This concentrates our credit risk exposure with a small number of large customers.
Amounts due to our gas marketing business are from a diverse group of entities. The underlying operations of these entities are geographically concentrated in the same region, which increases the credit risk associated with this business. As natural gas prices continue to remain depressed, certain third-party producers committed to providing natural gas to our gas marketing business continue to experience financial distress, which has led to certain contractual defaults and litigation; however, to date, we have had no material counterparty default losses. We have initiated several legal actions for breach of contract and collection claims against certain third-party producers that are delinquent in their payment obligations. We expect this trend to continue for this business segment.
We primarily use financial institutions which are lenders in our revolving credit facility as counterparties for our derivative financial instruments. Disruption in the credit markets, changes in commodity prices and other factors may have a significant adverse impact on a number of financial institutions. To date, we have had no material counterparty default losses from our commodity derivative financial instruments. See the footnote titled Commodity Derivative Financial Instruments to our consolidated financial statements included elsewhere in this report for more detail on our commodity derivative financial instruments.
Disclosure of Limitations
Because the information above included only those exposures that existed at December 31, 2017, it does not consider those exposures or positions which could arise after that date. Our ultimate realized gain or loss with respect to interest rate
68
and commodity price fluctuations will depend on the exposures that arise during the period, our commodity price risk management strategies at the time and interest rates and commodity prices at the time.
69
ITEM 8. FINANCIAL STATEMENTS AND SUPPLEMENTARY DATA
Index to Consolidated Financial Statements, Financial Statement Schedule and Supplemental Information | ||
Financial Statements: | ||
Consolidated Statements of Operations - Years Ended December 31, 2017, 2016, and 2015 | ||
Consolidated Statements of Cash Flows - Years Ended December 31, 2017, 2016, and 2015 | ||
Consolidated Statements of Equity - Years Ended December 31, 2017, 2016, and 2015 | ||
Supplemental Information - Unaudited: | ||
Financial Statement Schedule: | ||
Schedule II - Valuation and Qualifying Accounts - Years Ended December 31, 2017, 2016, and 2015 | ||
70
Report of Independent Registered Public Accounting Firm
To the Board of Directors and Shareholders of PDC Energy, Inc.
Opinions on the Financial Statements and Internal Control over Financial Reporting
We have audited the accompanying consolidated balance sheets of PDC Energy, Inc. and its subsidiaries as of December 31, 2017 and 2016, and the related consolidated statements of operations, equity and cash flows for each of the three years in the period ended December 31, 2017, including the related notes and financial statement schedule listed in the accompanying index (collectively referred to as the “consolidated financial statements”). We also have audited the Company's internal control over financial reporting as of December 31, 2017, based on criteria established in Internal Control - Integrated Framework (2013) issued by the Committee of Sponsoring Organizations of the Treadway Commission (COSO).
In our opinion, the consolidated financial statements referred to above present fairly, in all material respects, the financial position of the Company as of December 31, 2017 and 2016, and the results of their operations and their cash flows for each of the three years in the period ended December 31, 2017 in conformity with accounting principles generally accepted in the United States of America. Also in our opinion, the Company did not maintain, in all material respects, effective internal control over financial reporting as of December 31, 2017 based on criteria established in Internal Control - Integrated Framework (2013) issued by the COSO because material weaknesses in internal control over financial reporting existed as of that date related to not maintaining a sufficient complement of personnel within the Land Department as a result of increased volume of leases, which contributed to the ineffective design and maintenance of controls to verify the completeness and accuracy of land administrative records associated with unproved leases.
A material weakness is a deficiency, or a combination of deficiencies, in internal control over financial reporting, such that there is a reasonable possibility that a material misstatement of the annual or interim financial statements will not be prevented or detected on a timely basis. The material weaknesses referred to above are described in Management's Report on Internal Control over Financial Reporting appearing under Item 9A. We considered these material weaknesses in determining the nature, timing, and extent of audit tests applied in our audit of the 2017 consolidated financial statements, and our opinion regarding the effectiveness of the Company’s internal control over financial reporting does not affect our opinion on those consolidated financial statements.
Basis for Opinions
The Company's management is responsible for these consolidated financial statements, for maintaining effective internal control over financial reporting, and for its assessment of the effectiveness of internal control over financial reporting, included in management's report referred to above. Our responsibility is to express opinions on the Company’s consolidated financial statements and on the Company's internal control over financial reporting based on our audits. We are a public accounting firm registered with the Public Company Accounting Oversight Board (United States) ("PCAOB") and are required to be independent with respect to the Company in accordance with the U.S. federal securities laws and the applicable rules and regulations of the Securities and Exchange Commission and the PCAOB.
We conducted our audits in accordance with the standards of the PCAOB. Those standards require that we plan and perform the audits to obtain reasonable assurance about whether the consolidated financial statements are free of material misstatement, whether due to error or fraud, and whether effective internal control over financial reporting was maintained in all material respects.
Our audits of the consolidated financial statements included performing procedures to assess the risks of material misstatement of the consolidated financial statements, whether due to error or fraud, and performing procedures that respond to those risks. Such procedures included examining, on a test basis, evidence regarding the amounts and disclosures in the consolidated financial statements. Our audits also included evaluating the accounting principles used and significant estimates made by management, as well as evaluating the overall presentation of the consolidated financial statements. Our audit of internal control over financial reporting included obtaining an understanding of internal control over financial reporting, assessing the risk that a material weakness exists, and testing and evaluating the design and operating effectiveness of internal control based on the assessed risk. Our audits also included performing such other procedures as we considered necessary in the circumstances. We believe that our audits provide a reasonable basis for our opinions.
71
Definition and Limitations of Internal Control over Financial Reporting
A company’s internal control over financial reporting is a process designed to provide reasonable assurance regarding the reliability of financial reporting and the preparation of financial statements for external purposes in accordance with generally accepted accounting principles. A company’s internal control over financial reporting includes those policies and procedures that (i) pertain to the maintenance of records that, in reasonable detail, accurately and fairly reflect the transactions and dispositions of the assets of the company; (ii) provide reasonable assurance that transactions are recorded as necessary to permit preparation of financial statements in accordance with generally accepted accounting principles, and that receipts and expenditures of the company are being made only in accordance with authorizations of management and directors of the company; and (iii) provide reasonable assurance regarding prevention or timely detection of unauthorized acquisition, use, or disposition of the company’s assets that could have a material effect on the financial statements.
Because of its inherent limitations, internal control over financial reporting may not prevent or detect misstatements. Also, projections of any evaluation of effectiveness to future periods are subject to the risk that controls may become inadequate because of changes in conditions, or that the degree of compliance with the policies or procedures may deteriorate.
/s/PricewaterhouseCoopers LLP
Denver, Colorado
February 26, 2018
We have served as the Company’s auditor since 2007.
72
PDC ENERGY, INC.
Consolidated Balance Sheets
(in thousands, except share and per share data)
As of December 31, | 2017 | 2016 | ||||||
Assets | ||||||||
Current assets: | ||||||||
Cash and cash equivalents | $ | 180,675 | $ | 244,100 | ||||
Accounts receivable, net | 197,598 | 143,392 | ||||||
Fair value of derivatives | 14,338 | 8,791 | ||||||
Prepaid expenses and other current assets | 8,613 | 3,542 | ||||||
Total current assets | 401,224 | 399,825 | ||||||
Properties and equipment, net | 3,933,467 | 4,002,994 | ||||||
Assets held-for-sale, net | 40,084 | 5,272 | ||||||
Fair value of derivatives | — | 2,386 | ||||||
Goodwill | — | 62,041 | ||||||
Other assets | 45,116 | 13,324 | ||||||
Total Assets | $ | 4,419,891 | $ | 4,485,842 | ||||
Liabilities and Stockholders' Equity | ||||||||
Liabilities | ||||||||
Current liabilities: | ||||||||
Accounts payable | $ | 150,067 | $ | 66,322 | ||||
Production tax liability | 37,654 | 24,767 | ||||||
Fair value of derivatives | 79,302 | 53,595 | ||||||
Funds held for distribution | 95,811 | 71,339 | ||||||
Accrued interest payable | 11,815 | 15,930 | ||||||
Other accrued expenses | 42,987 | 38,625 | ||||||
Total current liabilities | 417,636 | 270,578 | ||||||
Long-term debt | 1,151,932 | 1,043,954 | ||||||
Deferred income taxes | 191,992 | 400,867 | ||||||
Asset retirement obligations | 71,006 | 82,612 | ||||||
Fair value of derivatives | 22,343 | 27,595 | ||||||
Other liabilities | 57,333 | 37,482 | ||||||
Total liabilities | 1,912,242 | 1,863,088 | ||||||
Commitments and contingent liabilities | ||||||||
Stockholders' equity | ||||||||
Common shares - par value $0.01 per share, 150,000,000 authorized, 65,955,080 and 65,704,568 issued as of December 31, 2017 and 2016, respectively | 659 | 657 | ||||||
Additional paid-in capital | 2,503,294 | 2,489,557 | ||||||
Retained earnings | 6,704 | 134,208 | ||||||
Treasury shares - at cost, 55,927 and 28,763 as of December 31, 2017 and 2016, respectively | (3,008 | ) | (1,668 | ) | ||||
Total stockholders' equity | 2,507,649 | 2,622,754 | ||||||
Total Liabilities and Stockholders' Equity | $ | 4,419,891 | $ | 4,485,842 | ||||
See accompanying Notes to Consolidated Financial Statements
73
PDC ENERGY, INC.
Consolidated Statements of Operations
(in thousands, except per share data)
Year Ended December 31, | 2017 | 2016 | 2015 | |||||||||
Revenues | ||||||||||||
Crude oil, natural gas, and NGLs sales | $ | 913,084 | $ | 497,353 | $ | 378,713 | ||||||
Commodity price risk management gain (loss), net | (3,936 | ) | (125,681 | ) | 203,183 | |||||||
Other income | 12,468 | 11,243 | 13,430 | |||||||||
Total revenues | 921,616 | 382,915 | 595,326 | |||||||||
Costs, expenses and other | ||||||||||||
Lease operating expenses | 89,641 | 59,950 | 56,992 | |||||||||
Production taxes | 60,717 | 31,410 | 18,443 | |||||||||
Transportation, gathering, and processing expenses | 33,220 | 18,415 | 10,151 | |||||||||
Exploration, geologic, and geophysical expense | 47,334 | 4,669 | 1,102 | |||||||||
Impairment of properties and equipment | 285,887 | 9,973 | 161,620 | |||||||||
Impairment of goodwill | 75,121 | — | — | |||||||||
General and administrative expense | 120,370 | 112,470 | 89,959 | |||||||||
Depreciation, depletion and amortization | 469,084 | 416,874 | 303,258 | |||||||||
Provision for uncollectible notes receivable | (40,203 | ) | 44,038 | — | ||||||||
Accretion of asset retirement obligations | 6,306 | 7,080 | 6,293 | |||||||||
Gain on sale of properties and equipment | (766 | ) | (43 | ) | (385 | ) | ||||||
Other expenses | 13,157 | 10,193 | 11,717 | |||||||||
Total costs, expenses and other | 1,159,868 | 715,029 | 659,150 | |||||||||
Loss from operations | (238,252 | ) | (332,114 | ) | (63,824 | ) | ||||||
Loss on extinguishment of debt | (24,747 | ) | — | — | ||||||||
Interest expense | (78,694 | ) | (61,972 | ) | (47,571 | ) | ||||||
Interest income | 2,261 | 963 | 4,807 | |||||||||
Loss before income taxes | (339,432 | ) | (393,123 | ) | (106,588 | ) | ||||||
Income tax benefit | 211,928 | 147,195 | 38,308 | |||||||||
Net loss | $ | (127,504 | ) | $ | (245,928 | ) | $ | (68,280 | ) | |||
Earnings per share: | ||||||||||||
Basic | $ | (1.94 | ) | $ | (5.01 | ) | $ | (1.74 | ) | |||
Diluted | $ | (1.94 | ) | $ | (5.01 | ) | $ | (1.74 | ) | |||
Weighted-average common shares outstanding: | ||||||||||||
Basic | 65,837 | 49,052 | 39,153 | |||||||||
Diluted | 65,837 | 49,052 | 39,153 | |||||||||
See accompanying Notes to Consolidated Financial Statements
74
PDC ENERGY, INC.
Consolidated Statements of Cash Flows
(in thousands)
Year Ended December 31, | 2017 | 2016 | 2015 | |||||||||
Cash flows from operating activities: | ||||||||||||
Net loss | $ | (127,504 | ) | $ | (245,928 | ) | $ | (68,280 | ) | |||
Adjustments to net loss to reconcile to net cash from operating activities: | ||||||||||||
Net change in fair value of unsettled commodity derivatives | 17,260 | 333,770 | 35,791 | |||||||||
Depreciation, depletion and amortization | 469,084 | 416,874 | 303,258 | |||||||||
Provision for uncollectible notes receivable | (40,203 | ) | 44,038 | — | ||||||||
Impairment of properties and equipment | 285,887 | 9,973 | 161,620 | |||||||||
Impairment of goodwill | 75,121 | — | — | |||||||||
Exploratory dry hole costs | 41,297 | — | — | |||||||||
Loss on extinguishment of debt | 24,747 | — | — | |||||||||
Accretion of asset retirement obligations | 6,306 | 7,080 | 6,293 | |||||||||
Non-cash stock-based compensation | 19,353 | 19,502 | 20,068 | |||||||||
Gain on sale of properties and equipment | (766 | ) | (43 | ) | (385 | ) | ||||||
Amortization of debt discount and issuance costs | 12,907 | 16,167 | 7,040 | |||||||||
Deferred income taxes | (203,685 | ) | (137,249 | ) | (41,415 | ) | ||||||
Other | 2,265 | 2,603 | (3,216 | ) | ||||||||
Total adjustments to net loss to reconcile to net cash from operating activities: | 709,573 | 712,715 | 489,054 | |||||||||
Changes in assets and liabilities: | ||||||||||||
Accounts receivable | (60,546 | ) | (32,627 | ) | 24,815 | |||||||
Other assets | (5,886 | ) | 2,303 | (2,264 | ) | |||||||
Production tax liability | 31,316 | 9,223 | (1,629 | ) | ||||||||
Accounts payable and accrued expenses | 31,378 | (162 | ) | (30,310 | ) | |||||||
Funds held for future distribution | 24,472 | 36,510 | 2,699 | |||||||||
Asset retirement obligations | (10,176 | ) | (4,109 | ) | (4,458 | ) | ||||||
Other liabilities | (4,064 | ) | 8,338 | 1,446 | ||||||||
Total changes in assets and liabilities | 6,494 | 19,476 | (9,701 | ) | ||||||||
Net cash from operating activities | 588,563 | 486,263 | 411,073 | |||||||||
Cash flows from investing activities: | ||||||||||||
Capital expenditures for development of crude oil and natural gas properties | (737,208 | ) | (436,884 | ) | (599,546 | ) | ||||||
Capital expenditures for other properties and equipment | (5,094 | ) | (3,464 | ) | (5,122 | ) | ||||||
Acquisition of crude oil and natural gas properties, including settlement adjustments and deposit for pending acquisition | (15,628 | ) | (1,073,723 | ) | — | |||||||
Proceeds from sale of properties and equipment | 9,991 | 4,945 | 405 | |||||||||
Sale of promissory note | 40,203 | — | — | |||||||||
Restricted cash | (9,250 | ) | — | — | ||||||||
Sale of short-term investments | 49,890 | — | — | |||||||||
Purchase of short-term investments | (49,890 | ) | — | — | ||||||||
Net cash from investing activities | (716,986 | ) | (1,509,126 | ) | (604,263 | ) | ||||||
Cash flows from financing activities: | ||||||||||||
Proceeds from issuance of equity, net of issuance costs | — | 855,074 | 202,851 | |||||||||
Proceeds from issuance of senior notes | 592,366 | 392,172 | — | |||||||||
Proceeds from issuance of convertible senior notes | — | 193,935 | — | |||||||||
Proceeds from revolving credit facility | — | 85,000 | 397,000 | |||||||||
Repayment of revolving credit facility | — | (122,000 | ) | (416,000 | ) | |||||||
Redemption of senior notes | (519,375 | ) | — | — | ||||||||
Redemption of convertible notes | — | (115,000 | ) | — | ||||||||
Payment of debt issuance costs | (50 | ) | (15,556 | ) | (974 | ) | ||||||
Purchase of treasury shares | (6,672 | ) | (6,935 | ) | (6,055 | ) | ||||||
Other | (1,271 | ) | (577 | ) | 1,152 | |||||||
Net cash from financing activities | 64,998 | 1,266,113 | 177,974 | |||||||||
Net change in cash and cash equivalents | (63,425 | ) | 243,250 | (15,216 | ) | |||||||
Cash and cash equivalents, beginning of year | 244,100 | 850 | 16,066 | |||||||||
Cash and cash equivalents, end of year | $ | 180,675 | $ | 244,100 | $ | 850 | ||||||
See accompanying Notes to Consolidated Financial Statements
75
Supplemental cash flow information: | ||||||||||||
Cash payments (receipts) for: | ||||||||||||
Interest, net of capitalized interest | $ | 69,880 | $ | 43,406 | $ | 45,642 | ||||||
Income taxes | (13,925 | ) | 167 | 10,049 | ||||||||
Non-cash investing activities: | ||||||||||||
Issuance of common stock for acquisition of crude oil and natural gas properties | — | 690,702 | — | |||||||||
Change in accounts payable related to capital expenditures | 50,761 | (40,448 | ) | (45,230 | ) | |||||||
Change in asset retirement obligation, with a corresponding change to crude oil and natural gas properties, net of disposal | 839 | 4,894 | 14,030 | |||||||||
Purchase of properties and equipment under capital leases | 3,497 | 1,404 | 1,601 | |||||||||
See footnote titled Business Combinations for non-cash transactions related to our acquisitions. | ||||||||||||
See accompanying Notes to Consolidated Financial Statements
76
PDC ENERGY, INC.
Consolidated Statements of Equity
(in thousands, except share data)
Common Stock | Treasury Stock | ||||||||||||||||||||||||
Shares | Amount | Additional Paid-in Capital | Shares | Amount | Retained Earnings | Total Stockholders' Equity | |||||||||||||||||||
Balances, January 1, 2015 | 35,927,985 | $ | 359 | $ | 689,209 | (21,643 | ) | $ | (911 | ) | $ | 448,702 | $ | 1,137,359 | |||||||||||
Net loss | — | — | — | — | — | (68,280 | ) | (68,280 | ) | ||||||||||||||||
Issuance pursuant to sale of equity | 4,002,000 | 40 | 202,811 | — | — | — | 202,851 | ||||||||||||||||||
Purchase of treasury shares | — | — | — | (120,864 | ) | (6,055 | ) | — | (6,055 | ) | |||||||||||||||
Issuance of treasury shares | — | — | (6,206 | ) | 127,159 | 6,206 | — | — | |||||||||||||||||
Non-employee directors' deferred compensation plan | — | — | — | (4,872 | ) | (249 | ) | — | (249 | ) | |||||||||||||||
Issuance of stock awards, net of forfeitures | 244,791 | 3 | — | — | — | — | 3 | ||||||||||||||||||
Stock-based compensation expense, including tax impact | — | — | 21,568 | — | — | — | 21,568 | ||||||||||||||||||
Balances, December 31, 2015 | 40,174,776 | $ | 402 | $ | 907,382 | (20,220 | ) | $ | (1,009 | ) | $ | 380,422 | $ | 1,287,197 | |||||||||||
Net loss | — | — | — | — | — | (245,928 | ) | (245,928 | ) | ||||||||||||||||
Issuance pursuant to acquisition | 9,386,768 | 94 | 690,608 | — | — | — | 690,702 | ||||||||||||||||||
Issuance pursuant to sale of equity | 15,007,500 | 150 | 854,933 | — | — | — | 855,083 | ||||||||||||||||||
Convertible debt discount, net of issuance costs and tax | — | — | 23,518 | — | — | — | 23,518 | ||||||||||||||||||
Purchase of treasury shares | — | — | — | (116,085 | ) | (6,935 | ) | — | (6,935 | ) | |||||||||||||||
Issuance pursuant to note conversion | 792,406 | 8 | (8 | ) | — | — | — | — | |||||||||||||||||
Issuance of treasury shares | (114,697 | ) | (6,661 | ) | 114,697 | 6,661 | — | — | |||||||||||||||||
Non-employee directors' deferred compensation plan | — | — | — | (7,155 | ) | (385 | ) | — | (385 | ) | |||||||||||||||
Issuance of stock awards, net of forfeitures | 411,731 | 3 | (3 | ) | — | — | — | — | |||||||||||||||||
Exercise of stock options | 46,084 | — | — | — | — | — | — | ||||||||||||||||||
Stock-based compensation expense | — | — | 19,502 | — | — | — | 19,502 | ||||||||||||||||||
Other | — | — | 286 | — | — | (286 | ) | — | |||||||||||||||||
Balances, December 31, 2016 | 65,704,568 | $ | 657 | $ | 2,489,557 | (28,763 | ) | $ | (1,668 | ) | $ | 134,208 | $ | 2,622,754 | |||||||||||
Net loss | — | — | — | — | — | (127,504 | ) | (127,504 | ) | ||||||||||||||||
Purchase of treasury shares | — | — | — | (107,357 | ) | (6,672 | ) | — | (6,672 | ) | |||||||||||||||
Issuance of treasury shares | — | — | (5,517 | ) | 83,228 | 5,517 | — | — | |||||||||||||||||
Non-employee directors' deferred compensation plan | — | — | — | (3,035 | ) | (185 | ) | — | (185 | ) | |||||||||||||||
Issuance of stock awards, net of forfeitures | 250,512 | 2 | (2 | ) | — | — | — | — | |||||||||||||||||
Stock-based compensation expense | — | — | 19,353 | — | — | — | 19,353 | ||||||||||||||||||
Other | — | — | (97 | ) | — | — | — | (97 | ) | ||||||||||||||||
Balance, December 31, 2017 | 65,955,080 | $ | 659 | $ | 2,503,294 | (55,927 | ) | $ | (3,008 | ) | $ | 6,704 | $ | 2,507,649 | |||||||||||
See accompanying Notes to Consolidated Financial Statements
77
PDC ENERGY, INC.
NOTES TO CONSOLIDATED FINANCIAL STATEMENTS
NOTE 1 - NATURE OF OPERATIONS AND BASIS OF PRESENTATION
PDC Energy, Inc. ("PDC", the "Company," "we," "us," or "our") is a domestic independent exploration and production company that acquires, explores and develops properties for the production of crude oil, natural gas, and NGLs, with primary operations in the Wattenberg Field in Colorado and the Delaware Basin in Texas. Our operations in the Wattenberg Field are focused in the horizontal Niobrara and Codell plays and our Delaware Basin operations are currently focused in the Wolfcamp zones. We also have operations in the Utica Shale in Southeastern Ohio; however, in 2017, we began actively marketing the Utica Shale properties for sale; therefore, these properties are classified as held-for-sale as they met the criteria for such classification during the third quarter of 2017. In February 2018, we entered into a PSA for the sale of these properties for net cash proceeds of approximately $40.0 million, subject to the terms and conditions of the agreement. As of December 31, 2017, we owned an interest in approximately 2,800 productive gross wells. We are engaged in two operating segments: our oil and gas exploration and production segment and our gas marketing segment. Beginning in 2017, our gas marketing segment does not meet the quantitative thresholds to require disclosure as a separate reportable segment. All of our material operations are attributable to our exploration and production business; therefore, all of our operations are presented as a single segment for all periods presented.
The audited consolidated financial statements include the accounts of PDC, our wholly-owned subsidiaries, and our proportionate share of our two affiliated partnerships. All intercompany accounts and transactions have been eliminated in consolidation.
The preparation of our consolidated financial statements in accordance with U.S. GAAP requires us to make estimates and assumptions that affect the amounts reported in our consolidated financial statements and accompanying notes. Actual results could differ from those estimates. Estimates which are particularly significant to our consolidated financial statements include estimates of crude oil, natural gas and NGLs sales revenue; crude oil, natural gas, and NGLs reserves; estimates of unpaid revenues and unbilled costs; future cash flows from crude oil and natural gas properties; valuation of commodity derivative instruments; exploratory dry hole costs; impairment of proved and unproved properties; impairment of goodwill; valuation and allocations of purchased businesses and assets; estimates of fair value of our fixed rate debt instruments; and valuation of deferred income tax assets.
Certain immaterial reclassifications have been made to our prior period balance sheet and statement of operations to conform to the current period presentation. The reclassifications had no impact on previously reported cash flows, net earnings, earnings per share, or stockholders' equity.
NOTE 2 - SUMMARY OF SIGNIFICANT ACCOUNTING POLICIES
Cash Equivalents. We consider all highly liquid investments with original maturities of three months or less to be cash equivalents.
Commodity Derivative Financial Instruments. We are exposed to the effect of market fluctuations in the prices of crude oil, natural gas, and NGLs. We employ established policies and procedures to manage a portion of the risks associated with these market fluctuations using commodity derivative instruments. Our policy and our revolving credit facility prohibit the use of crude oil and natural gas derivative instruments for speculative purposes.
All derivative assets and liabilities are recorded on our consolidated balance sheets at fair value. We have elected not to designate any of our commodity derivative instruments as cash flow hedges. Accordingly, changes in the fair value of our commodity derivative instruments are recorded in the consolidated statements of operations. We use the normal purchase, normal sale exception for our crude oil and natural gas contracts. Classification of net settlements resulting from maturities and changes in fair value of unsettled commodity derivatives depends on the purpose for issuing or holding the derivative. Net settlements and changes in the fair value of commodity derivative instruments related to our Oil and Gas Exploration and Production segment are recorded in commodity price risk management, net. Net settlements and changes in the fair value of commodity derivative instruments related to our Gas Marketing segment are recorded in other income and other expenses. The consolidated statements of cash flows reflects the net settlement of commodity derivative instruments in operating cash flows.
The calculation of the commodity derivative instrument's fair value is performed internally and, while we use common industry practices to develop our valuation techniques, changes in our pricing methodologies or the underlying assumptions could result in significantly different fair values.
78
PDC ENERGY, INC.
NOTES TO CONSOLIDATED FINANCIAL STATEMENTS - Continued
Properties and Equipment. Significant accounting polices related to our properties and equipment are discussed below.
Crude Oil and Natural Gas Properties. We account for our crude oil and natural gas properties under the successful efforts method of accounting. Costs of proved developed producing properties, successful exploratory wells, and developmental dry hole costs are capitalized and depreciated or depleted by the unit-of-production method, based on estimated proved developed producing reserves. Property acquisition costs are depreciated or depleted on the unit-of-production method based on estimated proved reserves. We have determined that we have three units-of-production fields: the Wattenberg Field, the Delaware Basin, and the Utica Shale. In making these conclusions we consider the geographic concentration, operating similarities within the areas, geologic considerations, and common cost environments in these areas. We calculate quarterly depreciation, depletion, and amortization ("DD&A") expense by using our estimated prior period-end reserves as the denominator, with the exception of our fourth quarter where we use the year-end reserve estimate adjusted to add back fourth quarter production. Upon the sale or retirement of significant portions of or complete fields of depreciable or depletable property, the net book value thereof, less proceeds or salvage value, is recognized in the consolidated statement of operations as a gain or loss. Upon the sale of individual wells or a portion of a field, the proceeds are credited to accumulated DD&A.
Exploration costs, including geologic and geophysical expenses, seismic costs on unproved leasehold, and delay rentals, are charged to expense as incurred. Exploratory well drilling costs, including the cost of stratigraphic test wells, are initially capitalized, but charged to expense if the well is determined to be economically nonproductive. The status of each in-progress well is reviewed quarterly to determine the proper accounting treatment under the successful efforts method of accounting. Exploratory well costs continue to be capitalized as long as we have found a sufficient quantity of reserves to justify completion as a producing well, we are making sufficient progress assessing our reserves and economic and operating viability, or we have not made sufficient progress to allow for final determination of productivity. If an in-progress exploratory well is found to be economically unsuccessful prior to the issuance of the financial statements, the costs incurred prior to the end of the reporting period are charged to exploration expense. If we are unable to make a final determination about the productive status of a well prior to issuance of the financial statements, the costs associated with the well are classified as "suspended well costs" until we have had sufficient time to conduct additional completion or testing operations to evaluate the pertinent geological and engineering data obtained. At the time we are able to make a final determination of a well’s productive status, the well is removed from suspended well status and the proper accounting treatment is recorded.
Proved Property Impairment. Upon a triggering event, including when general industry conditions warrant review, we assess our producing crude oil and natural gas properties for possible impairment by comparing net capitalized costs, or carrying value, to estimated undiscounted future net cash flows on a field-by-field basis using estimated production based upon prices at which we reasonably estimate the commodity will be sold. The estimates of future prices may differ from current market prices of crude oil, natural gas, and NGLs. Certain events, including but not limited to downward revisions in estimates of our reserve quantities, expectations of falling commodity prices, or rising operating costs, could result in a triggering event, and therefore a possible impairment of our proved crude oil and natural gas properties. If net capitalized costs exceed undiscounted future net cash flows, the measurement of impairment is based on estimated fair value utilizing a future discounted cash flows analysis. The impairment recorded is the amount by which the net capitalized costs exceed fair value. Impairments are included in the consolidated statements of operations line item impairment of properties and equipment, with a corresponding impact on accumulated DD&A.
Unproved Property Impairment. The acquisition costs of unproved properties are capitalized when incurred, until such properties are transferred to proved properties or charged to expense when expired, impaired, or amortized. Unproved crude oil and natural gas properties with individually significant acquisition costs are periodically assessed for impairment. Unproved crude oil and natural gas properties which are not individually significant are amortized, by field, based on our historical experience, acquisition dates, and average lease terms. Impairment and amortization charges related to unproved crude oil and natural gas properties are charged to the consolidated statements of operations line item impairment of properties and equipment.
79
PDC ENERGY, INC.
NOTES TO CONSOLIDATED FINANCIAL STATEMENTS - Continued
Other Property and Equipment. Other property and equipment is carried at cost. Depreciation is provided principally on the straight-line method over the assets' estimated useful lives. We review these long-lived assets for impairment whenever events or changes in circumstances indicate that the carrying amount of an asset may not be recoverable. Recoverability of assets to be held and used is measured by a comparison of the carrying amount of the asset to estimated undiscounted future cash flows expected to be generated by the asset. If the carrying amount of the asset exceeds our estimated future cash flows, an impairment charge is recognized in the amount by which the carrying amount of the asset exceeds the fair value of the asset. Impairment and amortization charges related to other property and equipment are charged to the consolidated statements of operations line item impairment of properties and equipment.
The following table presents the estimated useful lives of our other property and equipment:
Transportation, pipeline, and other equipment | 2 - 30 years |
Buildings | 20 - 40 years |
Maintenance and repair costs on other property and equipment are charged to expense as incurred. Major renewals and improvements are capitalized and depreciated over the remaining useful life of the asset. Upon the sale or other disposition of assets, the cost and related accumulated DD&A are removed from the accounts, the proceeds are applied thereto, and any resulting gain or loss is reflected in income. Total depreciation expense related to other property and equipment was $6.6 million, $3.8 million, and $4.5 million in 2017, 2016, and 2015, respectively.
Capitalized Interest. Interest costs are capitalized as part of the historical cost of acquiring assets. Investments in unproved crude oil and natural gas properties and major development projects, on which DD&A expense is not currently recorded and on which exploration or development activities are in progress, qualify for capitalization of interest. Major construction projects also qualify for interest capitalization until the asset is ready to be placed into service. Capitalized interest is calculated by multiplying our weighted-average interest rate on our outstanding debt by the qualifying costs. Interest capitalized may not exceed gross interest expense for the period. As the qualifying asset is placed into service, we begin amortizing the related capitalized interest over the useful life of the asset. Capitalized interest totaled $5.0 million, $4.5 million, and $5.1 million in 2017, 2016, and 2015, respectively.
Goodwill. Goodwill represents the excess of the purchase price over the fair value of net assets acquired, including the additional value resulting from the creation of the deferred tax liability, and represents the future economic benefits arising from other assets acquired that could not be individually identified and separately recognized. Among the factors that could contribute to a purchase price in excess of the fair value of the net tangible and intangible assets acquired is the acquisition of an element of a workforce and the expected value from operations of the acquisition to be derived in the future, such as production from future development of additional producing zones.
We evaluate goodwill for impairment by performing a quantitative test, which involves comparing the estimated fair value of the goodwill reporting unit to the carrying value. We determine the fair value of the goodwill at the impairment evaluation date by using an estimated after-tax future discounted cash flow analysis, along with a combination of market-based pricing factors for similar acreage, reserve valuation techniques, and other fair value considerations. The discounted cash flow analysis used to estimate fair value is based on known or knowable information at the interim measurement date. Fair value determinations require considerable judgment and are sensitive to changes in underlying assumptions and factors.
Assets Held-for-Sale. Assets held-for-sale are valued at the lower of their carrying amount or estimated fair value, less costs to sell. If the carrying amount of the assets exceeds their estimated fair value, an impairment loss is recognized. Fair values are estimated using accepted valuation techniques, such as a discounted cash flow model, valuations performed by third parties, earnings multiples, or indicative bids, when available. Management considers historical experience and all available information at the time the estimates are made; however, the fair value that is ultimately realized upon the sale of the assets to be divested may differ from the estimated fair values reflected in the consolidated financial statements. DD&A expense is not recorded on assets to be divested once they are classified as held-for-sale. Assets classified as held-for-sale are expected to be disposed of within one year. Assets to be divested are classified in the consolidated financial statements as held-for-sale.
Production Tax Liability. Production tax liability represents estimated taxes, primarily severance, ad valorem, and property taxes, to be paid to the states and counties in which we produce crude oil, natural gas, and NGLs. These taxes are expensed and included in the statements of operations line item production taxes. The long-term portion of the production tax liability is included in other liabilities on the consolidated balance sheets and was $50.5 million and $29.0 million in December 31, 2017 and 2016, respectively.
80
PDC ENERGY, INC.
NOTES TO CONSOLIDATED FINANCIAL STATEMENTS - Continued
Income Taxes. We account for income taxes under the asset and liability method. We recognize deferred tax assets and liabilities for the future tax consequences attributable to operating loss and credit carryforwards and differences between the financial statement carrying amounts of existing assets and liabilities and their respective tax basis. Deferred tax assets and liabilities are measured using enacted tax rates. The effect on deferred tax assets and liabilities of a change in tax rates is recognized in income in the period that includes the enactment date. If we determine that it is more likely than not that some portion or all of the deferred tax assets will not be realized, we record a valuation allowance, thereby reducing the deferred tax assets to what we consider realizable. As of December 31, 2017 and 2016, we had no valuation allowance.
Debt Issuance Costs. Debt issuance costs are capitalized and amortized over the life of the respective borrowings using the effective interest method. Debt issuance costs for the 2021 Convertible Notes, the 2024 Senior Notes, and the 2026 Senior Notes are included in long-term debt on the consolidated balance sheets and the debt issuance costs for the revolving credit facility are included in other assets on the consolidated balance sheets.
Asset Retirement Obligations. We account for asset retirement obligations by recording the fair value of our plugging and abandonment obligations when incurred, which is at the time the related well is completed. Upon initial recognition of an asset retirement obligation, we increase the carrying amount of the associated long-lived asset by the same amount as the liability. Over time, the liability is accreted for the change in the present value. The initial capitalized cost, net of salvage value, is depleted over the useful life of the related asset through a charge to DD&A expense. If the fair value of the estimated asset retirement obligation changes, an adjustment is recorded to both the asset retirement obligation and the asset retirement cost. Revisions in estimated liabilities can result from, among other things, changes in retirement costs or the estimated timing of settling asset retirement obligations.
Treasury Shares. We record treasury share purchases at cost, which includes incremental direct transaction costs. Amounts are recorded as a reduction in shareholders’ equity in the consolidated balance sheets. When we retire treasury shares, we charge any excess of cost over the par value to additional paid-in-capital ("APIC"), to the extent we have amounts in APIC, with any remaining excess cost being charged to retained earnings.
Revenue Recognition. Significant accounting polices related to our revenue recognition are discussed below.
Crude oil, natural gas, and NGLs sales. Crude oil, natural gas, and NGLs revenues are recognized when production is sold to a purchaser at a fixed or determinable price, delivery has occurred, rights and responsibility of ownership have transferred, and collection of revenue is reasonably assured. Our crude oil, natural gas, and NGLs sales are recorded using either the “net-back” or "gross" method of accounting, depending upon the related purchase agreement. We use the net-back method when the purchasers of these commodities also provide transportation, gathering, or processing services. In these situations, the purchaser pays us proceeds based on a percent of the proceeds or have fixed our sales price at index less specified deductions. The net-back method results in the recognition of a net sales price that is lower than the indices for which the production is based because the operating costs and profit of the midstream facilities are embedded in the net price we are paid.
We use the gross method of accounting when the purchasers do not provide transportation, gathering, or processing services as a function of the price we receive. Rather, we contract separately with midstream providers for the applicable transport and processing on a per unit basis. Under this method, we recognize revenues based on the gross selling price and recognize transportation, gathering, and processing expenses.
There is a new revenue standard effective for annual reporting periods beginning after December 15, 2017. See Recently Issued Accounting Standards below.
Accounting for Business Combinations. We utilize the purchase method to account for acquisitions of businesses. Pursuant to purchase method accounting, we allocate the cost of the acquisition to assets acquired and liabilities assumed based upon respective fair values as of the acquisition date. The purchase price allocations are based upon appraisals, discounted cash flows, quoted market prices, and estimates by management, which are Level 3 inputs. When appropriate, we review comparable purchases and sales of crude oil and natural gas properties within the same regions and use that data as a basis for fair market value; for example, the amount at which a willing buyer and seller would enter into an exchange for such properties.
In estimating the fair values of assets acquired and liabilities assumed, we make various assumptions. The most significant assumptions relate to the estimated fair values assigned to proved developed producing, proved developed non-
81
PDC ENERGY, INC.
NOTES TO CONSOLIDATED FINANCIAL STATEMENTS - Continued
producing, proved undeveloped, unproved crude oil and natural gas properties, and other non-crude oil and natural gas properties. To estimate the fair value of these properties, we prepare estimates of crude oil and natural gas reserves. We estimate future prices by using the applicable forward pricing strip to apply to our estimate of reserve quantities acquired, and estimates of future operating and development costs, to arrive at an estimate of future net revenues. For estimated proved reserves, the future net revenues are discounted using a market-based weighted-average cost of capital rate determined appropriate at the time of the acquisition. The market-based weighted-average cost of capital rate is subject to additional project-specific risk factors. To compensate for the inherent risk of estimating and valuing unproved properties, we reduce the discounted future net revenues of probable and possible reserves by additional risk-weighting factors. Additionally, for acquisitions with significant unproved properties, we complete an analysis of comparable purchased properties to determine an estimation of fair value.
We record deferred taxes for any differences between the assigned values and tax basis of assets and liabilities, except goodwill. Estimated deferred taxes are based on available information concerning the tax basis of assets acquired and liabilities assumed and loss carryforwards at the acquisition date, although such estimates may change in the future as additional information becomes known.
Stock-Based Compensation. Stock-based compensation is recognized in our financial statements based on the grant-date fair value of the equity instrument awarded. Stock-based compensation expense is recognized in the financial statements on a straight-line basis over the vesting period for the entire award. To the extent compensation cost relates to employees directly involved in crude oil and natural gas exploration and development activities, such amounts may be capitalized to properties and equipment. Amounts not capitalized to properties and equipment are recognized in the related cost and expense line item in the consolidated statements of operations. No amounts for stock-based compensation were capitalized in 2017, 2016, or 2015.
Credit Risk and Allowance for Doubtful Accounts. Inherent to our industry is the concentration of crude oil, natural gas, and NGLs sales to a limited number of customers. This concentration has the potential to impact our overall exposure to credit risk in that our customers may be similarly affected by changes in economic and financial conditions, commodity prices, or other conditions. We record an allowance for doubtful accounts representing our best estimate of probable losses from our existing accounts receivable. In making our estimate, we consider, among other things, our historical write-offs and the overall creditworthiness of our customers. Further, consideration is given to well production data for receivables related to well operations.
Recently Adopted Accounting Standards.
In January 2017, the FASB issued an accounting update to simplify the measurement of goodwill. The update eliminates the two-step process that required identification of potential impairment and a separate measure of actual impairment. The annual and/or interim assessments are still required to be completed. The guidance is effective for fiscal years beginning after December 15, 2019, and interim periods within those fiscal years, with early adoption permitted. We elected to early adopt this standard in the second quarter of 2017. Our annual evaluation of goodwill for impairment was expected to occur in the fourth quarter of 2017; however, we experienced an impairment triggering event as of September 30, 2017 and implemented the new guidance as part of the impairment evaluation. See the footnote titled Goodwill for a detailed description of the results of our impairment testing.
In August 2016, the FASB issued an accounting update on statements of cash flows to address diversity in practice in how certain cash receipts and cash payments are presented and classified in the statement of cash flows. The update addresses eight specific cash flow issues with the objective of reducing the existing diversity in practice. The guidance is effective for fiscal years beginning after December 15, 2017, and interim periods within those fiscal years, with early adoption permitted. We elected to early adopt this standard in the fourth quarter of 2017. Adoption of this standard did not have an impact on our consolidated financial statements or related disclosures.
In January 2017, the FASB issued an accounting update clarifying the definition of a business, with the objective of adding guidance to assist entities with evaluating whether transactions should be accounted for as acquisitions or disposals of assets or businesses. This guidance is to be applied using a prospective method and is effective for fiscal years beginning after December 15, 2017, and interim periods within those fiscal years, with early adoption permitted. We elected to early adopt this standard in the fourth quarter of 2017. Adoption of this standard did not have an impact on our consolidated financial statements or related disclosures.
82
PDC ENERGY, INC.
NOTES TO CONSOLIDATED FINANCIAL STATEMENTS - Continued
In May 2017, the FASB issued an accounting update clarifying when to account for a change to the terms or conditions of a share-based payment award as a modification. The guidance is effective for fiscal years beginning on or after December 15, 2017, and interim periods within those fiscal years, with early adoption permitted. We elected to early adopt this standard in the fourth quarter of 2017. Adoption of this standard did not have an impact on our consolidated financial statements or related disclosures.
Recently Issued Accounting Standards
In May 2014, the FASB and the International Accounting Standards Board issued their converged standard on revenue recognition that provides a single, comprehensive model that entities will apply to determine the measurement of revenue and timing of when it is recognized. The standard has been updated and now includes technical corrections. The underlying principle is that an entity will recognize revenue to depict the transfer of goods or services to customers at an amount that the entity expects to be entitled to in exchange for those goods or services. The standard outlines a five-step approach to apply the underlying principle: (1) identify the contract with the customer, (2) identify the separate performance obligations in the contract, (3) determine the transaction price, (4) allocate the transaction price to separate performance obligations, and (5) recognize revenue when or as each performance obligation is satisfied. The revenue standard is effective for annual reporting periods beginning after December 15, 2017, including interim periods within that reporting period; we are adopting the standard effective January 1, 2018. The revenue standard can be adopted under the full retrospective method or modified retrospective method. In order to evaluate the impact that the adoption of the revenue standard will have on our consolidated financial statements, we have performed a comprehensive review of our significant revenue streams. The focus of this review included, among other things, the identification of the significant contracts and other arrangements we have with our customers to identify performance obligations and principal versus agent considerations, and factors affecting the determination of the transaction price. We are also reviewing our current accounting policies, procedures, and controls with respect to these contracts and arrangements to determine what changes, if any, may be required by the adoption of the revenue standard. We have determined that we will adopt the standard under the modified retrospective method. Based upon our review, we currently estimate that adoption of the standard would have reduced our crude oil, natural gas, and NGLs sales by approximately $11.3 million in 2017 with corresponding decreases in transportation, gathering, and processing expenses and no impact on net earnings. Upon adoption, no adjustment to our opening balance of retained earnings was deemed necessary.
In February 2016, the FASB issued an accounting update aimed at increasing the transparency and comparability among organizations by recognizing lease assets and liabilities on the balance sheet and disclosing key information about related leasing arrangements. For leases with terms of more than 12 months, the accounting update requires lessees to recognize a right-of-use asset and lease liability for its right to use the underlying asset and the corresponding lease obligation. Both the lease asset and liability will initially be measured at the present value of the future minimum lease payments over the lease term. Subsequent measurement, including the presentation of expenses and cash flows, will depend upon the classification of the lease as either a finance or operating lease. The guidance is effective for fiscal years beginning after December 15, 2018, and interim periods within those years, with early adoption permitted, and is to be applied as of the beginning of the earliest period presented using a modified retrospective approach. The update does not apply to leases of mineral rights to explore for or use crude oil and natural gas. We are currently evaluating the impact these changes may have on our consolidated financial statements.
In November 2016, the FASB issued an accounting update on statements of cash flows to address diversity in practice in the classification and presentation of changes in restricted cash. The accounting update requires that a statement of cash flows explain the change during the period in the total of cash, cash equivalents, and amounts generally described as restricted cash or restricted cash equivalents. Therefore, amounts generally described as restricted cash or restricted cash equivalents should be included with cash and cash equivalents when reconciling beginning-of-period and end-of-period amounts shown on the statement of cash flows. The guidance is effective for fiscal years beginning after December 15, 2017, and interim periods within those fiscal years, with early adoption permitted. We are currently evaluating the impact these changes may have on our consolidated financial statements.
In August 2017, the FASB issued an accounting update to provide guidance for various components of hedge accounting, including hedge ineffectiveness, the expansion of types of permissible hedging strategies, reduced complexity in the application of the long-haul method for fair value hedges and reduced complexity in assessment of effectiveness. The guidance is effective for fiscal years beginning after December 15, 2018, and interim periods within those fiscal years, with early adoption permitted. We are currently evaluating the impact these changes may have on our consolidated financial statements.
83
PDC ENERGY, INC.
NOTES TO CONSOLIDATED FINANCIAL STATEMENTS - Continued
NOTE 3 - BUSINESS COMBINATIONS
Delaware Basin Acquisition. On December 6, 2016, we closed on an acquisition which was accounted for as a business combination. The acquisition consisted of the purchase of stock of an entity and assets of other entities under common control. The transaction was for the purchase of approximately 57,900 net acres, approximately 30 completed and producing wells and related midstream infrastructure in Reeves and Culberson Counties, Texas, for an aggregate consideration to the sellers of approximately $1.64 billion, after preliminary post-closing adjustments. The total consideration to sellers was comprised of approximately $946.0 million in cash, including the payment of $40.0 million of debt of the sellers at closing and other purchase price adjustments, and 9.4 million shares of our common stock valued at approximately $690.7 million at the time the acquisition closed. The purchase accounting for the entity, the stock of which we acquired, reflected oil and gas assets for which we did not receive a fair value step-up of the tax basis. As a result, a significant deferred income tax liability was calculated based on the acquired allocated fair value of the assets in excess of the tax basis of assets inside the entity. This calculation resulted in approximately $375.0 million of non-cash basis needing to be allocated to the acquired assets. No deferred tax liability was established for the calculated goodwill as it did not qualify as tax goodwill.
The final fair value allocation of the assets acquired and liabilities assumed in the acquisition are presented below and include customary post-closing adjustments. The most significant item to be completed during the final purchase price allocation in the third quarter of 2017 was the final allocation of value to the unproved oil and gas properties associated with the acquired acreage. Adjustments to the preliminary purchase price primarily stem from additional information we obtained about facts and circumstances that existed at the acquisition date that impact the underlying value of certain assets acquired and liabilities assumed, including detailed lease terms, location of the acreage, and intent to develop the acreage as of the date of closing. There were a significant number of leases acquired with complex lease terms and evaluation of these terms and the timing of the lease expirations impacted the manner in which the final purchase price was allocated. Our final determination of the value of goodwill has been adjusted for all post-closing adjustments.
The details of the final purchase price and the allocation of the purchase price for the transaction, are presented below (in thousands):
Year Ended December 31, 2016 | |||
Acquisition costs: | |||
Cash, net of cash acquired | $ | 905,962 | |
Retirement of seller's debt | 40,000 | ||
Total cash consideration | 945,962 | ||
Common stock | 690,702 | ||
Other purchase price adjustments | 426 | ||
Total acquisition costs | $ | 1,637,090 | |
Recognized amounts of identifiable assets acquired and liabilities assumed: | |||
Assets acquired: | |||
Current Assets | $ | 6,401 | |
Crude oil and natural gas properties - proved | 216,000 | ||
Crude oil and natural gas properties - unproved | 1,697,000 | ||
Infrastructure, pipeline, and other | 33,153 | ||
Construction in progress | 12,323 | ||
Goodwill | 75,121 | ||
Total assets acquired | 2,039,998 | ||
Liabilities assumed: | |||
Current liabilities | (24,496 | ) | |
Asset retirement obligations | (3,705 | ) | |
Deferred tax liabilities, net | (374,707 | ) | |
Total liabilities assumed | (402,908 | ) | |
Total identifiable net assets acquired | $ | 1,637,090 | |
84
PDC ENERGY, INC.
NOTES TO CONSOLIDATED FINANCIAL STATEMENTS - Continued
The fair value measurements of assets acquired and liabilities assumed are based on inputs that are not observable in the market, and therefore represent Level 3 inputs. The fair values of crude oil and natural gas properties and asset retirement obligations were measured using valuation techniques that convert future cash flows to a single discounted amount. Significant inputs to the valuation of crude oil and natural gas properties include estimates of reserves, future operating and development costs, future commodity prices, estimated future cash flows, lease terms and expirations, and a market-based weighted-average cost of capital rate. Within the unproven properties, the allocation of the value to the underlying leases also required significant judgment and was based on a combination of comparable market transactions, the terms and conditions associated with the individual leases, our ability and intent to develop specific leases, and our initial assessment of the underlying relative value of the leases given our knowledge of the geology at the time of closing. These inputs require significant judgments and estimates by management at the time of the valuation and were the most sensitive and subject to change.
This acquisition was accounted for under the acquisition method. Accordingly, we conducted assessments of net assets acquired and recognized amounts for identifiable assets acquired and liabilities assumed at their estimated acquisition date fair values, while transaction and integration costs associated with the acquisition were expensed as incurred.
Pro Forma Information. The results of operations for the Delaware Basin acquisition have been included in our consolidated financial statements since the December 6, 2016 closing date, including approximately $5.6 million of total revenue and $1.7 million of loss from operations in our statements of operations for the year ended December 31, 2016. The following unaudited pro forma financial information represents a summary of the consolidated results of operations for the years ended December 31, 2016 and December 31, 2015, assuming the acquisition had been completed as of January 1, 2015. This pro forma financial information includes proceeds from the sale of 9,085,000 shares of our common stock, the 2021 Convertible Notes, and the 2024 Senior Notes in September 2016, the shares issued to the sellers, and other acquisition costs. The pro forma financial information is not necessarily indicative of the results of operations that would have been achieved if the acquisition had been effective as of these dates, or of future results.
Years Ended December 31, | |||||||
2016 | 2015 | ||||||
(in thousands, except per share amounts) | |||||||
Total revenue | $ | 412,746 | $ | 598,932 | |||
Net loss | $ | (270,942 | ) | $ | (138,904 | ) | |
Earnings per share: | |||||||
Basic and diluted | $ | (4.22 | ) | $ | (2.41 | ) | |
Goodwill. Goodwill was calculated as the excess of the purchase price over the fair value of net assets acquired, including the additional value resulting from the creation of the deferred tax liability, and represents the future economic benefits arising from other assets acquired that could not be individually identified and separately recognized. Among the factors that contributed to a purchase price in excess of the fair value of the net tangible and intangible assets acquired were the acquisition of an element of a workforce and the expected value from operations of the Delaware Basin acquisition to be derived in the future, such as production from future development of additional producing zones. The amount of the final goodwill that was recorded in the third quarter of 2017 related to the Delaware Basin acquisition was $75.1 million, which was higher than the initial estimated amount recorded as of December 31, 2016. The increase primarily related to finalization of the aggregate acreage position acquired and the related lease terms and a final settlement with the sellers in connection with a revised valuation of certain acquired leases and the retirement of estimated environmental remediation liabilities. Any value assigned to goodwill was not expected to be deductible for income tax purposes.
The following table presents the changes in goodwill from the preliminary allocation at December 31, 2016, and the final allocation determined during the third quarter of 2017:
Amount | |||
(in thousands) | |||
Preliminary purchase price allocation | $ | 62,041 | |
Adjustments | 13,080 | ||
Final purchase price allocation | $ | 75,121 | |
85
PDC ENERGY, INC.
NOTES TO CONSOLIDATED FINANCIAL STATEMENTS - Continued
See the footnote titled Goodwill for the details regarding the impairment of goodwill related to the Delaware Basin acquisition.
86
PDC ENERGY, INC.
NOTES TO CONSOLIDATED FINANCIAL STATEMENTS - Continued
NOTE 4 - FAIR VALUE OF FINANCIAL INSTRUMENTS
Commodity Derivative Financial Instruments
Determination of fair value. Our fair value measurements are estimated pursuant to a fair value hierarchy that requires us to maximize the use of observable inputs and minimize the use of unobservable inputs when measuring fair value. The valuation hierarchy is based upon the transparency of inputs to the valuation of an asset or liability as of the measurement date, giving the highest priority to quoted prices in active markets (Level 1) and the lowest priority to unobservable data (Level 3). In some cases, the inputs used to measure fair value might fall in different levels of the fair value hierarchy. The lowest level input that is significant to a fair value measurement in its entirety determines the applicable level in the fair value hierarchy. Assessing the significance of a particular input to the fair value measurement in its entirety requires judgment, considering factors specific to the asset or liability, and may affect the valuation of the assets and liabilities and their placement within the fair value hierarchy levels. The three levels of inputs that may be used to measure fair value are defined as:
Level 1 – Quoted prices (unadjusted) for identical assets or liabilities in active markets.
Level 2 – Inputs other than quoted prices included within Level 1 that are either directly or indirectly observable for the asset or liability, including quoted prices for similar assets or liabilities in active markets, quoted prices for identical or similar assets or liabilities in inactive markets, inputs other than quoted prices that are observable for the asset or liability, and inputs that are derived from observable market data by correlation or other means.
Level 3 – Unobservable inputs for the asset or liability, including situations where there is little, if any, market activity.
Commodity Derivative Financial Instruments. We measure the fair value of our commodity derivative instruments based on a pricing model that utilizes market-based inputs, including, but not limited to, the contractual price of the underlying position, current market prices, crude oil and natural gas forward curves, discount rates such as the LIBOR curve for a similar duration of each outstanding position, volatility factors, and nonperformance risk. Nonperformance risk considers the effect of our credit standing on the fair value of derivative liabilities and the effect of our counterparties' credit standings on the fair value of derivative assets. Both inputs to the model are based on published credit default swap rates and the duration of each outstanding derivative position.
We validate our fair value measurement through the review of counterparty statements and other supporting documentation, the determination that the source of the inputs is valid, the corroboration of the original source of inputs through access to multiple quotes, if available, or other information and monitoring changes in valuation methods and assumptions. While we use common industry practices to develop our valuation techniques and believe our valuation method is appropriate and consistent with those used by other market participants, changes in our pricing methodologies or the underlying assumptions could result in significantly different fair values.
Our crude oil and natural gas fixed-price swaps are included in Level 2. Our collars and propane fixed-price swaps are included in Level 3. Our basis swaps are included in Level 2 and Level 3. The following table presents, for each applicable level within the fair value hierarchy, our derivative assets and liabilities, including both current and non-current portions, measured at fair value on a recurring basis:
As of December 31, | |||||||||||||||||||||||
2017 | 2016 | ||||||||||||||||||||||
Significant Other Observable Inputs (Level 2) | Significant Unobservable Inputs (Level 3) | Total | Significant Other Observable Inputs (Level 2) | Significant Unobservable Inputs (Level 3) | Total | ||||||||||||||||||
(in thousands) | |||||||||||||||||||||||
Total assets | $ | 12,949 | $ | 1,389 | $ | 14,338 | $ | 6,350 | $ | 4,827 | $ | 11,177 | |||||||||||
Total liabilities | 90,569 | 11,076 | 101,645 | 66,789 | 14,401 | 81,190 | |||||||||||||||||
Net liability | $ | (77,620 | ) | $ | (9,687 | ) | $ | (87,307 | ) | $ | (60,439 | ) | $ | (9,574 | ) | $ | (70,013 | ) | |||||
87
PDC ENERGY, INC.
NOTES TO CONSOLIDATED FINANCIAL STATEMENTS - Continued
The following table presents a reconciliation of our Level 3 commodity derivative instruments measured at fair value:
2017 | 2016 | 2015 | ||||||||||
(in thousands) | ||||||||||||
Fair value of Level 3 instruments, net asset (liability) beginning of period | $ | (9,574 | ) | $ | 91,288 | $ | 62,356 | |||||
Changes in fair value included in consolidated statements of operations line item: | ||||||||||||
Commodity price risk management gain (loss), net | 6,241 | (28,550 | ) | 65,164 | ||||||||
Settlements included in consolidated statements of operations line items: | ||||||||||||
Commodity price risk management (loss), net | (6,354 | ) | (72,312 | ) | (36,232 | ) | ||||||
Fair value of Level 3 instruments, net asset (liability) end of period | $ | (9,687 | ) | $ | (9,574 | ) | $ | 91,288 | ||||
Net change in fair value of Level 3 unsettled derivatives included in consolidated statements of operations line item: | ||||||||||||
Commodity price risk management gain (loss), net | $ | (866 | ) | $ | (12,905 | ) | $ | 43,540 | ||||
Total | $ | (866 | ) | $ | (12,905 | ) | $ | 43,540 | ||||
The significant unobservable input used in the fair value measurement of our derivative contracts is the implied volatility curve, which is provided by a third-party vendor. A significant increase or decrease in the implied volatility, in isolation, would have a directionally similar effect resulting in a significantly higher or lower fair value measurement of our Level 3 derivative contracts. There has been no change in the methodology we apply to measure the fair value of our Level 3 derivative contracts during the periods covered by the financial statements.
Non-Derivative Financial Assets and Liabilities
The carrying value of the financial instruments included in current assets and current liabilities approximate fair value due to the short-term maturities of these instruments.
We utilize fair value on a nonrecurring basis to review our crude oil and natural gas properties and goodwill for possible impairment when events and circumstances indicate a possible decline in the recoverability of the carrying value of such assets. The fair value of the properties is determined based upon estimated future discounted cash flow, a Level 3 input, using estimated production and prices at which we reasonably expect the crude oil and natural gas will be sold. The fair value of the goodwill is determined using either a qualitative method or a quantitative method, both of which utilize market data, a Level 3 input, in the derivation of the value estimation.
The portion of our long-term debt related to our revolving credit facility approximates fair value due to the variable nature of related interest rates. We have not elected to account for the portion of our debt related to our senior notes under the fair value option; however, we have determined an estimate of the fair values based on measurements of trading activity and broker and/or dealer quotes, respectively, which are published market prices, and therefore are Level 2 inputs. The table below presents these estimates of the fair value of the portion of our long-term debt related to our senior notes and convertible notes as of December 31, 2017:
Estimated Fair Value | % of Par | |||||
(in millions) | ||||||
Senior notes: | ||||||
2021 Convertible Notes | $ | 195.6 | 97.8 | % | ||
2024 Senior Notes | 416.0 | 104.0 | % | |||
2026 Senior Notes | 616.5 | 102.8 | % | |||
The carrying value of our capital lease obligations approximates fair value due to the variable nature of the imputed interest rates and the duration of the related vehicle lease.
88
PDC ENERGY, INC.
NOTES TO CONSOLIDATED FINANCIAL STATEMENTS - Continued
NOTE 5 - COMMODITY DERIVATIVE FINANCIAL INSTRUMENTS
Our results of operations and operating cash flows are affected by changes in market prices for crude oil, natural gas, and NGLs. To manage a portion of our exposure to price volatility from producing crude oil, natural gas, and propane, which is an element of our NGLs, we enter into commodity derivative contracts to protect against price declines in future periods. While we structure these commodity derivatives to reduce our exposure to decreases in commodity prices, they also limit the benefit we might otherwise receive from price increases.
We believe our commodity derivative instruments continue to be effective in achieving the risk management objectives for which they were intended. As of December 31, 2017, we had commodity derivatives positions covering approximately 11.9 MMBbls and 6.6 MMBbls of crude oil production for 2018 and 2019, respectively. As of the same date, we had hedged approximately 56.5 Bcf of natural gas and 1.1 MMBbls of propane for 2018. Our commodity derivative contracts have been entered into at no cost to us as we hedge our anticipated production at the then-prevailing commodity market prices, without adjustment for premium or discount.
As of December 31, 2017, our derivative instruments were comprised of collars, fixed-price commodity swaps, and basis protection swaps.
• | Collars contain a fixed floor price (put) and ceiling price (call). If the index price falls below the fixed put strike price, we receive the market price from the purchaser and receive the difference between the put strike price and index price from the counterparty. If the index price exceeds the fixed call strike price, we receive the market price from the purchaser and pay the difference between the call strike price and index price to the counterparty. If the index price is between the put and call strike price, no payments are due to or from the counterparty; |
• | Fixed-price commodity swaps are arrangements that guarantee a fixed price. If the index price is below the fixed contract price, we receive the market price from the purchaser and receive the difference between the index price and the fixed contract price from the counterparty. If the index price is above the fixed contract price, we receive the market price from the purchaser and pay the difference between the index price and the fixed contract price to the counterparty. If the index price and contract price are the same, no payment is due to or from the counterparty; |
• | Basis protection swaps are arrangements that guarantee a price differential for natural gas from a specified delivery point. For basis protection swaps, we receive a payment from the counterparty if the price differential is greater than the stated terms of the contract and pay the counterparty if the price differential is less than the stated terms of the contract. If the market price and contract price are the same, no payment is due to or from the counterparty. See Item 7a. - Quantitative and Qualitative Disclosures About Market Risk - Derivative Positions Table found elsewhere in this report for a detailed list of our basis protection swaps. |
We have elected not to designate any of our derivative instruments as cash flow hedges, and therefore do not qualify for the use of hedge accounting. Accordingly, changes in the fair value of our derivative instruments are recorded in the statements of operations.
89
PDC ENERGY, INC.
NOTES TO CONSOLIDATED FINANCIAL STATEMENTS - Continued
The following table presents the balance sheet location and fair value amounts of our commodity derivative instruments on the consolidated balance sheets as of December 31, 2017 and 2016:
Derivative instruments: | Consolidated balance sheet line item | 2017 | 2016 | ||||||||
(in thousands) | |||||||||||
Derivative assets: | Current | ||||||||||
Commodity derivative contracts | Fair value of derivatives | $ | 7,340 | $ | 8,490 | ||||||
Basis protection derivative contracts | Fair value of derivatives | 6,998 | 301 | ||||||||
14,338 | 8,791 | ||||||||||
Non-current | |||||||||||
Commodity derivative contracts | Fair value of derivatives | — | 1,123 | ||||||||
Basis protection derivative contracts | Fair value of derivatives | — | 1,263 | ||||||||
— | 2,386 | ||||||||||
Total derivative assets | $ | 14,338 | $ | 11,177 | |||||||
Derivative liabilities: | Current | ||||||||||
Commodity derivative contracts | Fair value of derivatives | $ | 77,999 | 53,565 | |||||||
Basis protection derivative contracts | Fair value of derivatives | 234 | 30 | ||||||||
Rollfactor derivative contracts | Fair value of derivatives | 1,069 | — | ||||||||
79,302 | 53,595 | ||||||||||
Non-current | |||||||||||
Commodity derivative contracts | Fair value of derivatives | 22,343 | 27,595 | ||||||||
Total derivative liabilities | $ | 101,645 | $ | 81,190 | |||||||
90
PDC ENERGY, INC.
NOTES TO CONSOLIDATED FINANCIAL STATEMENTS - Continued
The following table presents the impact of our derivative instruments on our consolidated statements of operations:
Year Ended December 31, | ||||||||||||
Consolidated statements of operations line item | 2017 | 2016 | 2015 | |||||||||
(in thousands) | ||||||||||||
Commodity price risk management gain (loss), net | ||||||||||||
Net settlements | $ | 13,324 | $ | 208,103 | $ | 238,935 | ||||||
Net change in fair value of unsettled derivatives | (17,260 | ) | (333,784 | ) | (35,752 | ) | ||||||
Total commodity price risk management gain (loss), net | $ | (3,936 | ) | $ | (125,681 | ) | $ | 203,183 | ||||
All of our financial derivative agreements contain master netting provisions that provide for the net settlement of all contracts through a single payment in the event of early termination. We have elected not to offset the fair value positions recorded on our consolidated balance sheets.
The following table reflects the impact of netting agreements on gross derivative assets and liabilities:
As of December 31, 2017 | Derivative instruments, gross | Effect of master netting agreements | Derivative instruments, net | |||||||||
(in thousands) | ||||||||||||
Asset derivatives: | ||||||||||||
Derivative instruments, at fair value | $ | 14,338 | $ | (14,173 | ) | $ | 165 | |||||
Liability derivatives: | ||||||||||||
Derivative instruments, at fair value | $ | 101,645 | $ | (14,173 | ) | $ | 87,472 | |||||
As of December 31, 2016 | Derivative instruments, gross | Effect of master netting agreements | Derivative instruments, net | |||||||||
(in thousands) | ||||||||||||
Asset derivatives: | ||||||||||||
Derivative instruments, at fair value | $ | 11,177 | $ | (10,930 | ) | $ | 247 | |||||
Liability derivatives: | ||||||||||||
Derivative instruments, at fair value | $ | 81,190 | $ | (10,930 | ) | $ | 70,260 | |||||
91
PDC ENERGY, INC.
NOTES TO CONSOLIDATED FINANCIAL STATEMENTS - Continued
NOTE 6 - CONCENTRATION OF RISK
Accounts Receivable. The following table presents the components of accounts receivable, net of allowance for doubtful accounts:
As of December 31, | |||||||
2017 | 2016 | ||||||
(in thousands) | |||||||
Crude oil, natural gas, and NGLs sales | $ | 154,260 | $ | 97,520 | |||
Joint interest billings (1) | 34,576 | 20,118 | |||||
Derivative counterparties | (18 | ) | 10,266 | ||||
Income tax receivable | 6,015 | 11,505 | |||||
Other | 5,893 | 6,173 | |||||
Allowance for doubtful accounts | (3,128 | ) | (2,190 | ) | |||
Accounts receivable, net | $ | 197,598 | $ | 143,392 | |||
_________
(1) The December 31, 2017 amount includes $13.9 million of pre-closing contracted completion costs of wells associated
with the Bayswater Acquisition, which closed in January 2018. Upon closing, the $13.9 million was capitalized and
included in properties and equipment, net on the consolidated balance sheet.
Our accounts receivable primarily relate to sales of our crude oil, natural gas, and NGLs production, receivable balances from other third parties that own working interests in the properties we operate, and derivative counterparties. For the years ended December 31, 2017 and 2016, amounts written off to allowance for doubtful accounts were not material. As of December 31, 2017 and 2016, none of our customers represented 10 percent or greater of our accounts receivable balance.
Major Customers. The following table presents the individual customers constituting 10 percent or more of total revenues:
Year Ended December 31, | |||||||||
Customer | 2017 | 2016 | 2015 | ||||||
DCP Midstream, LP | 19.6 | % | 20.2 | % | 13.2 | % | |||
Suncor Energy Marketing, Inc. | 16.4 | % | 22.3 | % | 14.3 | % | |||
Aka Energy Group, LLC | — | % | 13.4 | % | — | % | |||
Concord Energy, LLC | — | % | 13.4 | % | 23.2 | % | |||
Bridger Energy, LLC | — | % | 11.5 | % | — | % | |||
Shell Trading Company | — | % | — | % | 13.8 | % | |||
Derivative Counterparties. A portion of our liquidity relates to commodity derivative instruments that enable us to manage a portion of our exposure to price volatility from producing crude oil, natural gas, and NGLs. These arrangements expose us to credit risk of nonperformance by our counterparties. We primarily use financial institutions who are also major lenders under our revolving credit facility as counterparties to our commodity derivative contracts; however, an insignificant portion of our commodity derivative instruments may be with other counterparties. To date, we have had no derivative counterparty default losses. We have evaluated the credit risk of our derivative assets from our counterparties using relevant credit market default rates, giving consideration to amounts outstanding for each counterparty and the duration of each outstanding derivative position. Based on our evaluation, we have determined that the potential impact of nonperformance of our current counterparties on the fair value of our derivative instruments is not significant at December 31, 2017, taking into account the estimated likelihood of nonperformance.
Note Receivable. In October 2014, we sold our entire 50 percent ownership interest in PDC Mountaineer, LLC to an unrelated third-party. As part of the consideration, we received a promissory note (the “Promissory Note”) for a principal sum of $39.0 million, bearing variable interest rates. The interest was to be paid quarterly, in arrears and at the option of the issuer could be paid-in-kind (“PIK Interest”). Any such PIK Interest would be subject to the then current interest rate.
We regularly analyzed the Promissory Note for evidence of collectibility, evaluating factors such as the creditworthiness of the issuer of the Promissory Note and the value of the issuer's assets. Based upon this analysis, during the quarter ended March 31, 2016, we recognized a provision and recorded an allowance for uncollectible notes receivable for the
92
PDC ENERGY, INC.
NOTES TO CONSOLIDATED FINANCIAL STATEMENTS - Continued
$44.0 million accumulated outstanding balance, including interest. Commencing in the second quarter of 2016, we ceased recognizing interest income on the Promissory Note and began accounting for the interest on the Promissory Note under the cash basis method.
We performed this analysis as of March 31, 2017 and evaluated preliminary 2016 year-end financial statements of the note issuer which were available at such time, related information about the operations of the issuer, and existing market conditions for natural gas. Based upon this evaluation, it was determined that collection of the Promissory Note and the PIK Interest continued to be doubtful and the full valuation allowance on the Promissory Note remained appropriate as of that date. This evaluation assumed that repayment of the Promissory Note would be made exclusively from the existing operations of the issuer of the Promissory Note based on the latest available information.
In April 2017, we sold the Promissory Note to an unrelated third-party buyer for approximately $40.2 million in cash. The sales agreement transferred all of our legal rights to collect from the issuer of the Promissory Note. Accordingly, we reversed $40.2 million of the provision for uncollectible notes receivable during the second quarter of 2017.
Other Accrued Expenses. The following table presents the components of other accrued expenses:
As of December 31, | |||||||
2017 | 2016 | ||||||
(in thousands) | |||||||
Employee benefits | $ | 22,383 | $ | 22,282 | |||
Asset retirement obligations | 15,801 | 9,775 | |||||
Environmental expenses | 1,374 | 3,238 | |||||
Other | 3,429 | 3,330 | |||||
Other accrued expenses | $ | 42,987 | $ | 38,625 | |||
NOTE 7 - PROPERTIES AND EQUIPMENT
The following table presents the components of properties and equipment, net of accumulated DD&A:
As of December 31, | |||||||
2017 | 2016 | ||||||
(in thousands) | |||||||
Properties and equipment, net: | |||||||
Crude oil and natural gas properties | |||||||
Proved | $ | 4,356,922 | $ | 3,499,718 | |||
Unproved | 1,097,317 | 1,874,671 | |||||
Total crude oil and natural gas properties | 5,454,239 | 5,374,389 | |||||
Infrastructure, pipeline, and other | 109,359 | 62,093 | |||||
Land and buildings | 10,960 | 6,392 | |||||
Construction in progress | 196,024 | 122,591 | |||||
Properties and equipment, at cost | 5,770,582 | 5,565,465 | |||||
Accumulated DD&A | (1,837,115 | ) | (1,562,471 | ) | |||
Properties and equipment, net | $ | 3,933,467 | $ | 4,002,994 | |||
Acreage Exchanges. In the fourth quarter of 2017, we completed two significant acreage exchanges that consolidated certain acreage positions in the core area of the Wattenberg Field. Pursuant to the transactions, we exchanged leasehold acreage with a limited number of wells that were in the process of being drilled and completed. Upon closing, we received an aggregate of approximately 15,900 net acres in exchange for an aggregate of approximately 16,200 net acres with minimal cash exchanged between the parties. The differences in net acres are primarily due to variances in working and net revenue interests and in midstream contracts. The assets exchanged were all in the same unit-of-production for property considerations, so it was concluded that this transaction was outside of the scope of the accounting requirements for recording the transaction at fair
93
PDC ENERGY, INC.
NOTES TO CONSOLIDATED FINANCIAL STATEMENTS - Continued
value and determining gain or loss on the non-monetary exchanges. The new acreage and underlying property costs were recorded at the previous historical cost of the assets we exchanged.
In September 2016, we closed on an acreage exchange transaction with Noble Energy, Inc. and certain of its subsidiaries ("Noble") to consolidate certain acreage positions in the core area of the Wattenberg Field. Pursuant to the transaction, we exchanged leasehold acreage and, to a lesser extent, interests in certain development wells. Upon closing, we received approximately 13,500 net acres in exchange for approximately 11,700 net acres, with no cash exchanged between the parties. The assets exchanged were all in the same unit of production for property considerations, so it was concluded that this transaction was outside of the scope of the accounting requirements for recording the transaction at fair value and determining gain or loss on the non-monetary exchanges. The new acreage and underlying property costs were recorded at the previous historical cost of the assets we exchanged.
Delaware Basin Acreage Acquisition. On December 30, 2016, we closed the purchase of approximately 4,600 net bolt-on acres in Reeves and Culberson Counties, Texas, for consideration to the sellers of approximately $120.6 million in cash, subject to post-closing adjustments. The transaction was accounted for as an acquisition of assets.
Classification of Assets as Held-for-Sale. During the third quarter of 2017, as part of our plan to divest the Utica Shale properties, we engaged an investment banking firm and began actively marketing the properties for sale; therefore, these properties are classified as held-for-sale as they met the criteria for such classification beginning in the third quarter of 2017. In February 2018, we entered into a PSA for the sale of these properties for net cash proceeds of approximately $40.0 million, subject to certain customary closing adjustments. Based upon multiple offers received for the sale of our Utica Shale properties, we recorded an impairment charge of $2.1 million in 2017 to reflect their fair value. Assets held-for-sale as of December 31, 2017 included $36.8 million and $3.3 million, representing of our Utica Shale properties and field office facilities and a parcel of land, respectively. Assets held-for-sale as of December 31, 2016 of $5.3 million represented field office facilities and a parcel of land at that time.
The following table presents balance sheet data related to assets held-for-sale, which include the Utica Shale properties, field office facilities, and a parcel of land that are being marketed for sale. Assets held-for-sale represents the assets that are expected to be sold, net of liabilities that are expected to be assumed by the purchasers:
December 31, 2017 | December 31, 2016 | ||||||
(in thousands) | |||||||
Assets | |||||||
Properties and equipment, net | $ | 40,583 | $ | 5,272 | |||
Total assets | $ | 40,583 | $ | 5,272 | |||
Liabilities | |||||||
Asset retirement obligation | $ | 499 | $ | — | |||
Total liabilities | $ | 499 | $ | — | |||
Net assets | $ | 40,084 | $ | 5,272 | |||
Impairment of Properties and Equipment
The following table presents impairment charges recorded for properties and equipment:
Year Ended December 31, | |||||||||||
2017 | 2016 | 2015 | |||||||||
(in thousands) | |||||||||||
Impairment of proved and unproved properties | $ | 285,465 | $ | 5,562 | $ | 154,608 | |||||
Amortization of individually insignificant unproved properties | 422 | 1,379 | 7,012 | ||||||||
Land and buildings | — | 3,032 | — | ||||||||
Total impairment of properties and equipment | $ | 285,887 | $ | 9,973 | $ | 161,620 | |||||
During the third quarter of 2017, we recorded a charge related to two exploratory dry holes we had drilled in the western area of our Culberson County acreage in the Delaware Basin. We then assessed the impact of the dry holes and various factors related thereto, including (i) the operational and geologic data obtained, (ii) the current increased cost environment for
94
PDC ENERGY, INC.
NOTES TO CONSOLIDATED FINANCIAL STATEMENTS - Continued
drilling and completion services in the Delaware Basin, (iii) our decreased future commodity price outlook, and (iv) the terms of the related lease agreements. Based on the results of this assessment, we concluded that the underlying geologic risk and the challenged economics of future capital expenditures reduced the likelihood that we would perform future development in this area over the remaining lease term for this acreage. Accordingly, we recorded an impairment of $251.6 million covering approximately 13,400 acres during the third quarter of 2017. The amount of the impairment was based on the value assigned to individual lease acres in the final purchase price allocation of the Delaware Basin acquisition. This allocation had included the consideration paid to the sellers, including the effect of the non-cash impact from the deferred tax liability created at the time of the acquisition. We recorded approximately $29 million of additional lease impairments in the Delaware Basin and an impairment charge of $2.1 million related to the Utica Shale properties that are classified as held-for-sale during 2017. Due to the aforementioned events and circumstances, we also evaluated our proved property for possible impairment and concluded that no further impairments were necessary. Future deterioration of commodity prices or other operating circumstances could result in additional impairment charges to our properties and equipment.
During 2015, due to a significant decline in commodity prices and decreases in our net realized sales prices, we experienced triggering events that required us to assess our crude oil and natural gas properties for possible impairment. As a result of our assessments, we recorded impairment charges of $150.3 million in 2015 to write-down our Utica Shale proved and unproved properties. Of these impairment charges, $24.7 million were recorded in 2015 to write-down certain capitalized well costs on our Utica Shale proved producing properties. We also recorded impairment charges of $125.6 million to write-down our Utica Shale lease acquisition costs. The impairment charges, which are included in the consolidated statements of operations line item impairment of properties and equipment, represented the amount by which the carrying value of these crude oil and natural gas properties exceeded the estimated fair values.
Suspended Well Costs. We have spud three wells in the Delaware Basin for which we are unable to make a final determination regarding whether proved reserves can be associated with the wells as of December 31, 2017 as the wells had not been completed as of that date. Therefore, we have classified the capitalized costs of the wells as suspended well costs as of December 31, 2017 while we continue to conduct completion and testing operations to determine the existence of proved reserves.
The following table presents the capitalized exploratory well cost pending determination of proved reserves and included in properties and equipment, net on the consolidated balance sheet:
2017 | |||
(in thousands, except for number of wells) | |||
Beginning balance | $ | — | |
Additions to capitalized exploratory well costs pending the determination of proved reserves | 51,776 | ||
Reclassifications to proved properties | (36,328 | ) | |
Balance at December 31, | $ | 15,448 | |
Number of wells pending determination at December 31, | 3 | ||
We did not have any suspended well costs as of December 31, 2016 or 2015.
Exploration Expenses. The following table presents the major components of exploration, geologic, and geophysical expense:
95
PDC ENERGY, INC.
NOTES TO CONSOLIDATED FINANCIAL STATEMENTS - Continued
Year Ended December 31, | |||||||||||
2017 | 2016 | 2015 | |||||||||
(in thousands) | |||||||||||
Exploratory dry hole costs | $ | 41,297 | $ | — | $ | — | |||||
Geological and geophysical costs, including seismic purchases | 3,881 | 3,472 | — | ||||||||
Operating, personnel and other | 2,156 | 1,197 | 1,102 | ||||||||
Total exploration, geologic, and geophysical expense | $ | 47,334 | $ | 4,669 | $ | 1,102 | |||||
Exploratory dry hole costs. During the third quarter of 2017, two exploratory dry hole wells, associated lease costs, and related infrastructure assets in the Delaware Basin were expensed at a cost of $41.3 million. The conclusion to expense these items was based on our determination that the acreage on which these wells were drilled was exploratory in nature and, following drilling, that the hydrocarbon production was insufficient for the wells to be deemed economically viable.
NOTE 8 - GOODWILL
The final goodwill that resulted from the purchase price allocation of the business combination in the Delaware Basin in December 2016 was determined to be $75.1 million. With the creation of goodwill from this transaction, we expected to perform our evaluation of goodwill for impairment annually in the fourth quarter. However, primarily due to a combination of increases in per well development and operational costs and our drilling of two exploratory dry holes in the Delaware Basin subsequent to the acquisition, in conjunction with the then current lower future commodity price outlook, we determined that a triggering event had occurred in the third quarter of 2017. In addition to the factors mentioned above, we also considered our impairments of certain unproven leasehold costs during the third quarter of 2017 and the impact of these items on our internal expectations for acceptable rates of return. We evaluated goodwill for impairment by performing a quantitative test, which involves comparing the estimated fair value of the goodwill reporting unit, which we define as the Delaware Basin, to the carrying value. We determined the fair value of the goodwill at September 30, 2017 by using an estimated after-tax future discounted cash flow analysis, along with a combination of market-based pricing factors for similar acreage, reserve valuation techniques, and other fair value considerations. The discounted cash flow analysis used to estimate fair value was based on known or knowable information at the interim measurement date. Fair value determinations require considerable judgment and are sensitive to changes in underlying assumptions and factors. The quantitative test resulted in a determination that a full impairment charge of $75.1 million was required; therefore, the charge was recorded in the third quarter of 2017.
96
PDC ENERGY, INC.
NOTES TO CONSOLIDATED FINANCIAL STATEMENTS - Continued
NOTE 9 - LONG-TERM DEBT
Long-term debt consists of the following:
As of December 31, | |||||||
2017 | 2016 | ||||||
(in thousands) | |||||||
Senior notes: | |||||||
1.125% Convertible Notes due 2021: | |||||||
Principal amount | $ | 200,000 | $ | 200,000 | |||
Unamortized discount | (30,328 | ) | (37,475 | ) | |||
Unamortized debt issuance costs | (3,615 | ) | (4,584 | ) | |||
1.125% Convertible Notes due 2021, net of unamortized discount and debt issuance costs | 166,057 | 157,941 | |||||
6.125% Senior Notes due 2024: | |||||||
Principal amount | 400,000 | 400,000 | |||||
Unamortized debt issuance costs | (6,570 | ) | (7,544 | ) | |||
6.125% Senior Notes due 2024, net of unamortized debt issuance costs | 393,430 | 392,456 | |||||
5.75% Senior Notes due 2026: | |||||||
Principal amount | 600,000 | — | |||||
Unamortized debt issuance costs | (7,555 | ) | — | ||||
5.75% Senior Notes due 2026, net of unamortized debt issuance costs | 592,445 | — | |||||
7.75% Senior notes redeemed 2017: | |||||||
Principal amount | — | 500,000 | |||||
Unamortized debt issuance costs | — | (6,443 | ) | ||||
7.75% Senior notes redeemed 2017, net of unamortized debt issuance costs | — | 493,557 | |||||
Total senior notes | 1,151,932 | 1,043,954 | |||||
Revolving credit facility | — | — | |||||
Total long-term debt, net of unamortized discount and debt issuance costs | 1,151,932 | 1,043,954 | |||||
Less current portion of long-term debt | — | — | |||||
Long-term debt | $ | 1,151,932 | $ | 1,043,954 | |||
Senior Notes
2026 Senior Notes. In November 2017, we issued $600.0 million aggregate principal amount 5.75% senior notes due May 15, 2026, in a private placement to qualified institutional buyers. The 2026 Senior Notes are governed by an indenture dated November 29, 2017 between us and the U.S. Bank National Association, as trustee. The maturity for the payment of principal is May 15, 2026. Interest at the rate of 5.75% per year is payable in cash semiannually in arrears on each May 15 and November 15, commencing on May 15, 2018. Approximately $7.6 million in costs associated with the issuance of the 2026 Senior Notes have been capitalized as debt issuance costs and are being amortized as interest expense over the life of the notes using the effective interest method. The 2026 Senior Notes are senior unsecured obligations and rank senior in right of payment to our future indebtedness that is expressly subordinated to the notes; equal in right of payment to all our existing and future indebtedness that is not so subordinated; effectively junior in right of payment to all of our secured indebtedness to the extent of the value of the collateral securing such indebtedness, including borrowings under our revolving credit facility; and structurally junior to all existing and future indebtedness (including trade payables) incurred by our non-guarantor subsidiaries.
The 2026 Senior Notes are redeemable after May 15, 2021, at fixed redemption prices beginning at 104.313 percent of the principal amount redeemed. At any time prior to May 15, 2021, we may redeem all or part of the 2026 Senior Notes at a
97
PDC ENERGY, INC.
NOTES TO CONSOLIDATED FINANCIAL STATEMENTS - Continued
make-whole price set forth in the indenture which generally approximates the present value of the redemption price at May 15, 2021 and remaining interest payments on the 2026 Senior Notes at the time of redemption.
At any time prior to May 15, 2021 we may redeem up to 35 percent of the outstanding 2026 Senior Notes with proceeds from certain equity offerings at a redemption price of 105.75 percent of the principal amount of the notes redeemed, plus accrued and unpaid interest, if at least 65 percent of the aggregate principal amount of the 2026 Senior Notes remains outstanding after each such redemption and the redemption occurs within 180 days after the closing of the equity offering.
Upon the occurrence of a "change of control," as defined in the indenture for the 2026 Senior Notes, holders will have the right to require us to repurchase all or a portion of the notes at a price equal to 101 percent of the aggregate principal amount of the notes repurchased, together with any accrued and unpaid interest to the date of purchase. In connection with certain asset sales, we may, under certain circumstances, be required to use the net cash proceeds of such asset sale to make an offer to purchase the notes at 100 percent of the principal amount, together with any accrued and unpaid interest to the date of purchase.
The indenture governing the 2026 Senior Notes contains covenants that, among other things, limit our ability and the ability of our subsidiaries to incur additional indebtedness; pay dividends or make distributions on our stock; purchase or redeem stock or subordinated indebtedness; make investments; create certain liens; enter into agreements that restrict distributions or other payments by restricted subsidiaries to us; enter into transactions with affiliates; sell assets; consolidate or merge with or into other companies or transfer all or substantially of our assets; and create unrestricted subsidiaries.
2021 Convertible Notes. In September 2016, we issued $200.0 million of 1.125% convertible senior notes due 2021 in a public offering. The 2021 Convertible Notes are governed by an indenture dated September 14, 2016 between us and the U.S. Bank National Association, as trustee. The maturity for the payment of principal is September 15, 2021. Interest at the rate of 1.125% per year is payable in cash semiannually in arrears on each March 15 and September 15, commencing on March 15, 2017. The 2021 Convertible Notes are senior unsecured obligations and rank senior in right of payment to our future indebtedness that is expressly subordinated to the 2021 Convertible Notes; equal in right of payment to our existing and future indebtedness that is not so subordinated; effectively junior in right of payment to all of our secured indebtedness to the extent of the value of the assets securing such indebtedness; and structurally junior to all existing and future indebtedness (including trade payables) incurred by our non-guarantor subsidiaries. The proceeds from the issuance of the 2021 Convertible Notes, after deducting offering expenses and underwriting discounts, were used to fund a portion of the purchase price of acquisitions in the Delaware Basin, to pay related fees and expenses, and for general corporate purposes.
The 2021 Convertible Notes are convertible prior to March 15, 2021 only upon specified events and during specified periods and, thereafter, at any time, in each case at an initial conversion rate of 11.7113 shares of our common stock per $1,000 principal amount of the 2021 Convertible Notes, which is equal to an initial conversion price of approximately $85.39 per share. The conversion rate is subject to adjustment upon certain events. Upon conversion, the 2021 Convertible Notes may be settled, at our sole election, in shares of our common stock, cash, or a combination of cash and shares of our common stock. We have initially elected a combination settlement method to satisfy our conversion obligation, which allows us to settle the principal amount of the 2021 Convertible Notes in cash and to settle the excess conversion value, if any, in shares, as well as cash in lieu of fractional shares.
We may not redeem the 2021 Convertible Notes prior to their maturity date. If we undergo a "fundamental change", as defined in the indenture for the 2021 Convertible Notes, subject to certain conditions, holders of the 2021 Convertible Notes may require us to repurchase all or part of the 2021 Convertible Notes for cash at a price equal to 100 percent of the principal amount of the 2021 Convertible Notes to be repurchased, plus any accrued and unpaid interest to, but excluding, the fundamental change repurchase date. The occurrence of a fundamental change will also result in the 2021 Convertible Notes becoming convertible.
We allocated the gross proceeds of the 2021 Convertible Notes between the liability and equity components of the debt. The initial $160.5 million liability component was determined based on the fair value of similar debt instruments excluding the conversion feature for similar terms and priced on the same day we issued the 2021 Convertible Notes. The initial $39.5 million equity component represents the debt discount and was calculated as the difference between the fair value of the debt and the gross proceeds of the 2021 Convertible Notes. Approximately $4.8 million in costs associated with the issuance of the 2021 Convertible Notes have been capitalized as debt issuance costs and are being amortized as interest expense over the life of the notes using the effective interest method. As of December 31, 2017, the unamortized debt discount will be amortized over the remaining contractual term to maturity of the 2021 Convertible Notes using an effective interest rate of
98
PDC ENERGY, INC.
NOTES TO CONSOLIDATED FINANCIAL STATEMENTS - Continued
5.8%. Based upon the December 31, 2017 stock price of $51.54 per share, the “if-converted” value of the 2021 Convertible Notes did not exceed the principal amount.
2024 Senior Notes. In September 2016, we issued $400.0 million aggregate principal amount of 6.125% senior notes due September 2024 in a private placement to qualified institutional buyers. In May 2017, in accordance with the registration rights agreement that we entered into with the initial purchasers when we issued the 2024 Senior Notes, we filed a registration statement with the SEC relating to an offer to exchange the 2024 Senior Notes for registered notes with substantially identical terms, and we completed the exchange offer in September 2017. The proceeds from the issuance of the 2024 Senior Notes, after deducting offering expenses and underwriting discounts, were used to fund a portion of the purchase price of acquisitions in the Delaware Basin (see the footnotes titled Business Combination and Properties and Equipment), to pay related fees and expenses, and for general corporate purposes.
The 2024 Senior Notes began accruing interest from the date of issuance and interest is payable semi-annually in arrears on March 15 and September 15. Approximately $7.8 million in costs associated with the issuance of the 2024 Senior Notes have been capitalized as debt issuance costs and are being amortized as interest expense over the life of the notes using the effective interest method. The 2024 Senior Notes are senior unsecured obligations and rank senior in right of payment to our future indebtedness that is expressly subordinated to the notes; equal in right of payment to all our existing and future indebtedness that is not so subordinated; effectively junior in right of payment to all of our secured indebtedness to the extent of the value of the collateral securing such indebtedness, including borrowings under our revolving credit facility; and structurally junior to all existing and future indebtedness (including trade payables) incurred by our non-guarantor subsidiaries.
The 2024 Senior Notes are redeemable after September 15, 2019, at fixed redemption prices beginning at 104.594 percent of the principal amount redeemed. At any time prior to September 15, 2019, we may redeem all or part of the 2024 Senior Notes at a make-whole price set forth in the indenture which generally approximates the present value of the redemption price at September 15, 2019 and remaining interest payments on the 2024 Senior Notes at the time of redemption.
At any time prior to September 15, 2019, we may redeem up to 35 percent of the outstanding 2024 Senior Notes with proceeds from certain equity offerings at a redemption price of 106.125 percent of the principal amount of the notes redeemed, plus accrued and unpaid interest, if at least 65 percent of the aggregate principal amount of the 2024 Senior Notes remains outstanding after each such redemption and the redemption occurs within 180 days after the closing of the equity offering.
Upon the occurrence of a "change of control," as defined in the indenture for the 2024 Senior Notes, holders will have the right to require us to repurchase all or a portion of the notes at a price equal to 101 percent of the aggregate principal amount of the notes repurchased, together with any accrued and unpaid interest to the date of purchase. In connection with certain asset sales, we may, under certain circumstances, be required to use the net cash proceeds of such asset sale to make an offer to purchase the notes at 100 percent of the principal amount, together with any accrued and unpaid interest to the date of purchase.
The indenture governing the 2024 Senior Notes contains covenants that, among other things, limit our ability and the ability of our subsidiaries to incur additional indebtedness; pay dividends or make distributions on our stock; purchase or redeem stock or subordinated indebtedness; make investments; create certain liens; enter into agreements that restrict distributions or other payments by restricted subsidiaries to us; enter into transactions with affiliates; sell assets; consolidate or merge with or into other companies or transfer all or substantially of our assets; and create unrestricted subsidiaries.
2022 Senior Notes. In October 2012, we issued $500 million aggregate principal amount of 7.75% senior notes due October 15, 2022 (the "2022 Senior Notes") in a private placement to qualified institutional buyers. On November 14, 2017, we issued a notice to redeem the notes on December 13, 2017 for a total redemption price of $519.4 million, including a $19.4 million make-whole premium. The make-whole provision was based upon terms set forth in the related indenture. On December 14, 2017, upon the redemption of the 2022 Senior Notes, the $19.4 million make-whole premium and the remaining unamortized debt issuance costs of $5.4 million were recognized as a $24.7 million pre-tax loss on debt extinguishment in the consolidated statements of operations. The amount paid to bond holders for the make-whole premium has been included as a financing activity in our statement of cash flows.
Our wholly-owned subsidiary PDC Permian, Inc. has been a guarantor of our obligations under the 2026 Senior Notes since the issuance of those notes. In January 2017, pursuant to the filing of the supplemental indentures for the 2021 Convertible Notes, 2024 Senior Notes, and the 2022 Senior Notes, PDC Permian, Inc. became a guarantor of our obligations under each of those notes.
99
PDC ENERGY, INC.
NOTES TO CONSOLIDATED FINANCIAL STATEMENTS - Continued
As of December 31, 2017, we were in compliance with all covenants related to the 2021 Convertible Notes, 2024 Convertible Notes, and the 2026 Senior Notes, and expect to remain in compliance throughout the foreseeable future.
Revolving Credit Facility
Our revolving credit facility matures in May 2020. The revolving credit facility is available for working capital requirements, capital investments, acquisitions, general corporate purposes and to support letters of credit. The revolving credit facility provides for a maximum of $1 billion in allowable borrowing capacity, but allows the borrowing base to exceed this capacity. The amount available under the revolving credit facility is based on, among other things, the loan value assigned to the proved reserves attributable to our crude oil and natural gas interests, excluding proved reserves attributable to our affiliated partnerships. The borrowing base is subject to a semi-annual size redetermination on November 1 and May 1 based upon quantification of our reserves at June 30 and December 31, and is also subject to a redetermination upon the occurrence of certain events. The revolving credit facility is secured by a pledge of the stock of certain of our subsidiaries, mortgages of certain producing crude oil and natural gas properties and substantially all of our and such subsidiaries' other assets. Our affiliated partnerships are not guarantors of our obligations under the revolving credit facility.
In May and October 2017, we entered into the Fifth and Sixth Amendments, respectively, to the Third Amended and Restated Credit Agreement to amend the revolving credit facility to reflect increases in the borrowing base. The Fifth amendment reflected an increase of the borrowing base from $700 million to $950 million and the Sixth Amendment amended the revolving credit facility to allow the borrowing base to increase above the borrowing capacity of $1.0 billion. In addition, the Fifth Amendment made changes to certain of the covenants in the existing agreement as well as other administrative changes. We elected to increase the borrowing base to $1.1 billion for our November 2017 borrowing base redetermination and have elected to maintain a $700 million commitment level as of the date of this report.
The weighted-average borrowing rate on our revolving credit facility, exclusive of fees on the unused commitment and the letter of credit noted below, was 2.7 percent per annum for the year ended December 31, 2016. We did not borrow any amounts under our revolving credit facility during 2017. We capitalized $6.2 million and $8.8 million of debt issuance costs as of December 31, 2017 and 2016, respectively, related to our revolving credit facility which is included in other assets on the consolidated balance sheets.
We had no outstanding balance on our revolving credit facility as of December 31, 2017 or 2016. The outstanding principal amount under the revolving credit facility accrues interest at a varying interest rate that fluctuates with an alternate base rate (equal to the greater of JPMorgan Chase Bank, N.A.'s prime rate, the federal funds rate plus an applicable margin and the rate for dollar deposits in the London interbank market (“LIBOR”) for one month plus a premium), or at our election, a rate equal to LIBOR for certain time periods. Additionally, commitment fees, interest margin, and other bank fees, charged as a component of interest, vary with our utilization of the facility. As of December 31, 2017, the applicable margin is 1.25 percent and the unused commitment fee is 0.50 percent. No principal payments are generally required until the credit agreement expires in May 2020, or in the event that the borrowing base falls below the outstanding balance.
The revolving credit facility contains covenants customary for agreements of this type, with the most restrictive being certain financial tests on a quarterly basis. The financial tests, as defined per the revolving credit facility, include requirements to: (a) maintain a minimum current ratio of 1.0:1.0 and (b) not exceed a maximum leverage ratio of 4.0:1.0. As of December 31, 2017, we were in compliance with all the revolving credit facility covenants and expect to remain in compliance throughout the next 12-month period. As defined by the revolving credit facility, our leverage ratio was 1.9 and our current ratio was 3.2 as of December 31, 2017.
In May 2017, we replaced our $11.7 million irrevocable standby letter of credit that we held in favor of a third-party transportation service provider to secure a firm transportation obligation with a $9.3 million deposit, which is classified as restricted cash and is included in other assets on the consolidated balance sheets. As of December 31, 2017, the available funds under our revolving credit facility were $700 million based on our elected commitment level.
NOTE 10 - CAPITAL LEASES
We periodically enter into non-cancelable lease agreements for vehicles utilized by our operations and field personnel. These leases are being accounted for as capital leases, as the present value of minimum monthly lease payments, including the residual value guarantee, exceeds 90 percent of the fair value of the leased vehicles at inception of the lease.
100
PDC ENERGY, INC.
NOTES TO CONSOLIDATED FINANCIAL STATEMENTS - Continued
The following table presents leased vehicles under capital leases:
As of December 31, | ||||||||
2017 | 2016 | |||||||
(in thousands) | ||||||||
Vehicles | $ | 6,249 | $ | 2,975 | ||||
Accumulated depreciation | (1,882 | ) | (776 | ) | ||||
$ | 4,367 | $ | 2,199 | |||||
Future minimum lease payments by year and in the aggregate, under non-cancelable capital leases with terms of one year or more, consist of the following:
For the Twelve Months Ending December 31, | Amount | |||
(in thousands) | ||||
2018 | $ | 2,075 | ||
2019 | 1,623 | |||
2020 | 1,507 | |||
5,205 | ||||
Less executory cost | (235 | ) | ||
Less amount representing interest | (537 | ) | ||
Present value of minimum lease payments | $ | 4,433 | ||
Short-term capital lease obligations | $ | 1,672 | ||
Long-term capital lease obligations | 2,761 | |||
$ | 4,433 | |||
Short-term capital lease obligations are included in other accrued expenses on the consolidated balance sheets. Long-term capital lease obligations are included in other liabilities on the consolidated balance sheets.
NOTE 11 - INCOME TAXES
The table below presents the components of our provision for income taxes from continuing operations for the years presented:
Year Ended December 31, | |||||||||||
2017 | 2016 | 2015 | |||||||||
(in thousands) | |||||||||||
Current: | |||||||||||
Federal | $ | 8,443 | $ | 9,646 | $ | (2,944 | ) | ||||
State | (200 | ) | 300 | (163 | ) | ||||||
Total current income tax (expense) benefit | 8,243 | 9,946 | (3,107 | ) | |||||||
Deferred: | |||||||||||
Federal | 193,809 | 118,427 | 37,352 | ||||||||
State | 9,876 | 18,822 | 4,063 | ||||||||
Total deferred income tax benefit | 203,685 | 137,249 | 41,415 | ||||||||
Income tax benefit from continuing operations | $ | 211,928 | $ | 147,195 | $ | 38,308 | |||||
101
PDC ENERGY, INC.
NOTES TO CONSOLIDATED FINANCIAL STATEMENTS - Continued
The following table presents a reconciliation of the statutory rate to the effective tax rate related to our benefit for income taxes from continuing operations:
Year Ended December, 31, | ||||||||
2017 | 2016 | 2015 | ||||||
Statutory tax rate | 35.0 | % | 35.0 | % | 35.0 | % | ||
State income tax, net | 1.8 | 2.6 | 2.7 | |||||
Effect of state income tax rate changes | — | 0.6 | (0.3 | ) | ||||
Percentage depletion | — | — | 0.3 | |||||
Non-deductible compensation | (0.3 | ) | (0.5 | ) | (1.2 | ) | ||
Federal tax reform rate reduction | 33.7 | — | — | |||||
Non-deductible goodwill impairment | (7.7 | ) | — | — | ||||
Other | (0.1 | ) | (0.3 | ) | (0.6 | ) | ||
Effective tax rate | 62.4 | % | 37.4 | % | 35.9 | % | ||
Tax effects of temporary differences that give rise to significant portions of deferred tax assets and deferred tax liabilities at December 31, 2017 and 2016 are presented below. The 2017 amounts include the reduction of our deferred tax assets and liabilities to a projected combined federal and state deferred tax rate of 23.9 percent as a result of the 2017 Tax Act. Also in 2017, deferred tax liability for properties and equipment was reduced by $94.1 million as a result of recording an impairment charge related to a portion of the Delaware Basin assets. The 2016 amounts include the $403.7 million effect of including the deferred tax liability for the difference in the book and tax basis of the oil and gas properties acquired in a 2016 business combination and $23.8 million of acquired deferred tax assets:
As of December 31, | |||||||
2017 | 2016 | ||||||
(in thousands) | |||||||
Deferred tax assets: | |||||||
Deferred compensation | $ | 6,059 | $ | 9,338 | |||
Asset retirement obligations | 21,760 | 34,359 | |||||
Federal NOL carryforward | 19,386 | 29,988 | |||||
State NOL and tax credit carryforwards, net | 7,815 | 5,189 | |||||
Federal tax - credit carryforwards | 4,366 | 5,184 | |||||
Allowance for note receivable | — | 17,292 | |||||
Net change in fair value of unsettled derivatives | 20,929 | 26,262 | |||||
Other | 2,453 | 4,716 | |||||
Total gross deferred tax assets | 82,768 | 132,328 | |||||
Deferred tax liabilities: | |||||||
Properties and equipment | 267,498 | 518,964 | |||||
Convertible debt | 7,262 | 14,231 | |||||
Total gross deferred tax liabilities | 274,760 | 533,195 | |||||
Net deferred tax liability | $ | 191,992 | $ | 400,867 | |||
The 2017 Tax Act, enacted into law in December 2017, reduces the corporate income tax rate to 21 percent, effective January 1, 2018. Consequently, we have decreased our deferred tax assets and deferred tax liabilities by $43.8 million and $158.2 million, respectively, with a corresponding income tax benefit of $114.4 million. Our accounting for the deferred income tax effects of the 2017 Tax Act is complete.
Prior to the decrease of deferred tax assets for the federal rate change noted above, the deferred tax assets would have decreased primarily due to the utilization of the deferred tax benefit of an allowance for note receivable, partially offset by a decrease in the value of unsettled derivatives and an increase in federal and state net operating loss (“NOL”) and tax credit carryforwards.
In addition to the decrease of deferred tax liabilities for the tax rate change and our impairment in the Delaware Basin, deferred tax liabilities also decreased for the amortization of the discount and debt issuance costs for the 2021 Convertible
102
PDC ENERGY, INC.
NOTES TO CONSOLIDATED FINANCIAL STATEMENTS - Continued
Notes, which were issued in 2016. These decreases were partially offset by accelerated deductions on properties and equipment and deductions for lease expirations.
During the year ending December 31, 2017, we generated a federal NOL of $28 million, of which $10.1 million will be utilized as a carryback leaving a federal NOL carryforward of $17.9 million that will begin to expire in 2037. We have a marginal gas well credit of $1.2 million that can be carried forward five years and we have alternative minimum tax credits of $3.2 million that may be carried forward, and pursuant to the new tax law will be refunded over the next four years. Also, we acquired a federal NOL of $60.1 million as a component of our 2016 acquisition in the Delaware Basin that will begin to expire in 2034 and is subject to an annual limitation of $15.1 million as a result of the acquisition, which constitutes a change of ownership as defined under IRS Code Section 382.
As of December 31, 2017, we have state NOL carryforwards of $158.0 million that begin to expire in 2030 and state credit carryforwards of $2.4 million that begin to expire in 2022.
Unrecognized tax benefits and related accrued interest and penalties were immaterial for the three-year period ended December 31, 2017. The statutes of limitations for most of our state tax jurisdictions are open from 2013 forward.
The IRS partially accepted our recently-filed 2016 tax return. The 2016 tax return is currently going through the IRS CAP post-filing review process, with no significant tax adjustments currently proposed. We are currently participating in the CAP Program for the review of our 2017 and 2018 tax years. Participation in the CAP Program has enabled us to have minimal uncertain tax benefits associated with our federal tax return filings.
As of December 31, 2017, we were current with our income tax filings in all applicable state jurisdictions.
NOTE 12 - ASSET RETIREMENT OBLIGATIONS
The following table presents the changes in carrying amounts of the asset retirement obligations associated with our crude oil and natural gas properties and midstream assets:
2017 | 2016 | ||||||
(in thousands) | |||||||
Beginning balance | $ | 92,387 | $ | 89,492 | |||
Obligations incurred with development activities | 3,638 | 4,894 | |||||
Accretion expense | 6,306 | 7,080 | |||||
Revisions in estimated cash flows | (2,860 | ) | — | ||||
Obligations discharged with asset retirements | (12,165 | ) | (9,079 | ) | |||
Balance at December 31 | 87,306 | 92,387 | |||||
Less liabilities held-for-sale | (499 | ) | — | ||||
Less current portion | (15,801 | ) | (9,775 | ) | |||
Long-term portion | $ | 71,006 | $ | 82,612 | |||
Our estimated asset retirement obligations liability is based on historical experience in plugging and abandoning wells, estimated economic lives, estimated plugging and abandonment cost and federal and state regulatory requirements. The liability is discounted using the credit-adjusted risk-free rate estimated at the time the liability is incurred or revised. In 2017, the credit-adjusted risk-free rates used to discount our plugging and abandonment liabilities ranged from 6.5 percent to 7.5 percent. In periods subsequent to initial measurement of the liability, we must recognize period-to-period changes in the liability resulting from the passage of time, revisions to either the amount of the original estimate of undiscounted cash flows or changes in inflation factors, and changes to our credit-adjusted risk-free rate as market conditions warrant.
The revisions in estimated cash flows during 2017 were primarily due to changes in estimates of costs for materials and services related to the plugging and abandonment of vertical and horizontal wells and the shortening of the estimated expected lives of vertical wells in the Wattenberg Field.
NOTE 13 - EMPLOYEE BENEFIT PLANS
We sponsor a qualified retirement plan covering substantially all of our employees. The plan consists of both a traditional and a Roth 401(k) component, as well as a profit sharing component. The 401(k) components enable eligible employees to contribute a portion of their compensation through payroll deductions in accordance with specific guidelines. We provide a discretionary matching contribution based on a percentage of the employees' contributions up to certain limits. Additionally, our contribution to the profit sharing component is discretionary. Our total combined expense for the plan was $6.2 million, $4.8 million, and $4.9 million for 2017, 2016, and 2015, respectively.
NOTE 14 - COMMITMENTS AND CONTINGENCIES
Firm Transportation and Processing Agreements. We enter into contracts that provide firm transportation and processing on pipeline systems through which we transport or sell crude oil and natural gas. Satisfaction of the volume requirements includes volumes produced by us, purchased from third parties, and produced by our affiliated partnerships and other third-party working, royalty, and overriding royalty interest owners, whose volumes we market on their behalf. Our consolidated statements of operations reflect our share of these firm transportation and processing costs. These contracts require us to pay these transportation and processing charges whether or not the required volumes are delivered.
103
PDC ENERGY, INC.
NOTES TO CONSOLIDATED FINANCIAL STATEMENTS - Continued
The following table presents gross volume information related to our long-term firm transportation, sales, and processing agreements for pipeline capacity:
Year Ending December 31, | ||||||||||||||||||||||||||
Area | 2018 | 2019 | 2020 | 2021 | 2022 and Through Expiration | Total | Expiration Date | |||||||||||||||||||
Natural gas (MMcf) | ||||||||||||||||||||||||||
Wattenberg Field | 3,541 | 23,934 | 31,110 | 31,025 | 121,922 | 211,532 | April 30, 2026 | |||||||||||||||||||
Delaware Basin | 14,600 | 14,600 | 14,640 | — | — | 43,840 | December 31, 2020 | |||||||||||||||||||
Gas Marketing | 7,117 | 7,117 | 7,136 | 7,056 | 4,495 | 32,921 | August 31, 2022 | |||||||||||||||||||
Utica Shale (1) | 2,738 | 2,738 | 2,745 | 2,738 | 4,326 | 15,285 | July 31, 2023 | |||||||||||||||||||
Total | 27,996 | 48,389 | 55,631 | 40,819 | 130,743 | 303,578 | ||||||||||||||||||||
Crude oil (MBbls) | ||||||||||||||||||||||||||
Wattenberg Field | 3,638 | 4,239 | 1,808 | — | — | 9,685 | June 30, 2020 | |||||||||||||||||||
Dollar commitment (in thousands) | $ | 23,176 | $ | 43,855 | $ | 42,496 | $ | 33,226 | $ | 118,927 | $ | 261,680 | ||||||||||||||
(1) In February 2018, we entered into a PSA to sell the Utica Shale properties. This commitment would be assumed by the purchaser of the
Utica Shale properties.
In anticipation of our future drilling activities in the Wattenberg Field, we entered into two facilities expansion agreements in 2016 and 2017 with our primary midstream provider to expand and improve its natural gas gathering pipelines and processing facilities. The midstream provider is expected to construct two new 200 MMcfd cryogenic plants. We will be bound to the volume requirements in these agreements on the first day of the calendar month following after the actual in-service date of the plants, which in the above table is scheduled to be in the third quarter of 2018 for the first plant and the second quarter of 2019 for the second plant. Both agreements require baseline volume commitments, consisting of our gross wellhead volume delivered in November 2016, to this midstream provider, and incremental wellhead volume commitments of 51.5 MMcfd and 33.5 MMcfd for the first and second agreements, respectively, for seven years. We may be required to pay shortfall fees for any volumes under the 51.5 MMcfd and 33.5 MMcfd incremental commitments. Any shortfall of these volume commitments may be offset by additional third party producers’ volumes sold to the midstream provider that are greater than a certain total baseline volume. We are also required for the first three years of the contracts to guarantee a certain target profit margin to the midstream provider on these incremental volumes. We currently expect that our future development plans will meet both baseline and incremental volumes, and we believe that the contractual target profit margin will be achieved without additional payment from us.
In April 2017, we entered into a transportation service agreement for delivery of 40,000 dekatherms per day of our Delaware Basin natural gas production to the Waha market hub in West Texas.
For the years 2017, 2016, and 2015, commitments for long-term transportation volumes for Wattenberg Field crude oil, Delaware Basin natural gas, and Utica Shale natural gas were $10.0 million, $10.0 million, and $4.7 million, respectively, and were recorded in transportation, gathering and processing expense in our consolidated statements of operations.
Litigation and Legal Items. We are involved in various legal proceedings. We review the status of these proceedings on an ongoing basis and, from time to time, may settle or otherwise resolve these matters on terms and conditions that management believes are in our best interests. We have provided the necessary estimated accruals in the accompanying balance sheets where deemed appropriate for litigation and legal related items that are ongoing and not yet concluded. Although the results cannot be known with certainty, we currently believe that the ultimate results of such proceedings will not have a material adverse effect on our financial position, results of operations, or liquidity.
Action Regarding Partnerships. In December 2017, we received an action entitled Dufresne, et al. v. PDC Energy, et al., filed in the United States District Court for the District of Colorado. The complaint states that it is a derivative action brought by a number of limited partner investors seeking to assert claims on behalf of our two affiliated partnerships, Rockies Region 2006 LP and Rockies Region 2007 LP, against PDC and alleging claims for breach of fiduciary duty and breach of contract. The plaintiffs also included claims against two of our senior officers for alleged breach of fiduciary duty. The lawsuit accuses PDC, as the managing general partner of the two partnerships, of, among other things, failing to maximize the
104
PDC ENERGY, INC.
NOTES TO CONSOLIDATED FINANCIAL STATEMENTS - Continued
productivity of the partnerships’ crude oil and natural gas wells. We filed a motion to dismiss the lawsuit on February 1, 2018, on the grounds that the complaint is deficient, including because the plaintiffs failed to allege that PDC refused a demand to take action on their claims. That motion is still pending. We are unable to estimate any potential damages as a result of this recent lawsuit.
Action Regarding Firm Transportation Contracts. In June 2016, a group of 42 independent West Virginia natural gas producers filed a lawsuit in Marshall County, West Virginia, naming Dominion Transmission, Inc. (“Dominion”), certain entities affiliated with Dominion, and our subsidiary Riley Natural Gas ("RNG") as defendants, alleging various contractual, fiduciary and related claims against the defendants, all of which are associated with firm transportation contracts entered into by plaintiffs and relating to pipelines owned and operated by Dominion and its affiliates. The case has been transferred to the Business Court Division of the Circuit Court of Marshall County, West Virginia. RNG is unable to estimate any potential damages associated with the claims, but believes the complaint is without merit and intends to vigorously pursue its defenses.
Environmental. Due to the nature of the natural gas and oil industry, we are exposed to environmental risks. We have various policies and procedures designed to minimize and mitigate the risks from environmental contamination. We conduct periodic reviews and simulated drills to identify changes in our environmental risk profile. Liabilities are recorded when environmental damages resulting from past events are probable and the costs can be reasonably estimated. Except as discussed herein, we are not aware of any material environmental claims existing as of December 31, 2017 which have not been provided for or would otherwise have a material impact on our financial statements; however, there can be no assurance that current regulatory requirements will not change or that unknown potential past non-compliance with environmental laws or other environmental liabilities will not be discovered on our properties. Accrued environmental liabilities are recorded in other accrued expenses on the condensed consolidated balance sheets. The liability ultimately incurred with respect to a matter may exceed the related accrual.
Clean Air Act Agreement and Related Consent Decree. In August 2015, we received a Clean Air Act Section 114 Information Request (the “Information Request”) from the U.S. Environmental Protection Agency (“EPA”). The Information Request sought, among other things, information related to the design, operation, and maintenance of our Wattenberg Field production facilities in the Denver-Julesburg Basin of Colorado (“DJ Basin”). The Information Request focused on historical operation and design information for 46 of our production facilities and requested sampling and analyses at the identified 46 facilities. We responded to the Information Request with the requested data in January 2016.
In addition, in December 2015, we received a Compliance Advisory pursuant to C.R.S. 25-7-115(2) from the Colorado Department of Public Health and Environment’s Air Quality Control Commission’s Air Pollution Control Division alleging that we failed to design, operate, and maintain certain condensate collection, storage, processing, and handling operations to minimize leakage of volatile organic compounds at 65 facilities consistent with applicable standards under Colorado law.
In June 2017, the U.S. Department of Justice, on behalf of the EPA and the state of Colorado, filed a complaint against us in the U.S. District Court for the District of Colorado, claiming that we failed to operate and maintain certain condensate collection facilities at 65 facilities so as to minimize leakage of volatile organic compounds in compliance with applicable law. In October 2017, we entered into a consent decree to resolve the lawsuit. Pursuant to the consent decree, we agreed to implement a variety of operational enhancements and mitigation and similar projects, including vapor control system modifications and verification, increased inspection and monitoring, and installation of tank pressure monitors. The three primary elements of the consent decree are: (i) fine/supplemental environmental projects ($1.5 million cash fine, plus $1 million in supplemental environmental projects) which have been accrued in other accrued expenses on our consolidated balance sheet as of December 31, 2017; (ii) injunctive relief with an estimated cost of approximately $18 million, primarily representing capital enhancements to our operations; and (iii) mitigation with an estimated cost of $1.7 million. We continue to incur costs associated with these activities. If we fail to comply fully with the requirements of the consent decree with respect to those matters, we could be subject to additional liability. In addition, we could be the subject of other enforcement actions by regulatory authorities in the future relating to our past, present or future operations. We do not believe that the expenditures resulting from the settlement will have a material adverse effect on our consolidated financial statements.
Lease Agreements. We entered into operating leases, principally for the leasing of natural gas compressors, office space, and general office equipment.
105
PDC ENERGY, INC.
NOTES TO CONSOLIDATED FINANCIAL STATEMENTS - Continued
The following table presents the minimum future lease payments under the non-cancelable operating leases as of December 31, 2017:
Year Ending December 31, | ||||||||||||||||||||||||||||
2018 | 2019 | 2020 | 2021 | 2022 | Thereafter | Total | ||||||||||||||||||||||
(in thousands) | ||||||||||||||||||||||||||||
Minimum Lease Payments | $ | 3,865 | $ | 3,865 | $ | 3,932 | $ | 3,998 | $ | 4,078 | $ | 3,515 | $ | 23,253 | ||||||||||||||
Operating lease expense for 2017, 2016, and 2015 was $17.2 million, $10.2 million, and $9.8 million, respectively.
106
PDC ENERGY, INC.
NOTES TO CONSOLIDATED FINANCIAL STATEMENTS - Continued
NOTE 15 - COMMON STOCK
Issuance of Equity Securities
In December 2016, we issued 9.4 million shares of our common stock as partial consideration for 100 percent of the common stock of Arris Petroleum and for the acquisition of certain Delaware Basin properties. Pursuant to the terms of previously disclosed lock-up agreements, the resale of these shares was restricted. The lock-up period ended in June 2017. We have registered the 9.4 million shares of our common stock for resale under the Securities Act of 1933.
Sales of Equity Securities
The following table provides a summary of our public offerings of common stock in 2016 and 2015:
Date | Shares Issued | Price per Share | Net Proceeds | ||||||||
(in millions) | |||||||||||
September 2016 | 9,085,000 | $ | 61.51 | $ | 558.5 | ||||||
March 2016 | 5,922,500 | 50.11 | 296.6 | ||||||||
March 2015 | 4,002,000 | 50.73 | 202.9 | ||||||||
Stock-Based Compensation Plans
2010 Long-Term Equity Compensation Plan. In June 2010, our stockholders approved a long-term equity compensation plan for our employees and non-employee directors (the "2010 Plan"). The plan was amended in June 2013. In accordance with the 2010 Plan, up to 3,000,000 new shares of our common stock are authorized for issuance. Shares issued may be either authorized but unissued shares, treasury shares, or any combination. Additionally, the 2010 Plan permits the reuse or reissuance of shares of common stock which were canceled, expired, forfeited, paid out in the form of cash, or withheld for the payment of taxes. Awards may be issued to our employees in the form of stock appreciation rights ("SARs"), restricted stock, restricted stock units ("RSUs"), performance shares, and performance units ("PSUs"), and to our non-employee directors in the form of non-qualified stock options, SARs, restricted stock, and RSUs. Awards may vest over periods set at the discretion of the Compensation Committee of our Board of Directors (the "Compensation Committee") with certain minimum vesting periods. With regard to SARs, awards have a maximum exercisable period of ten years. In no event may an award be granted under the 2010 Plan on or after June 5, 2023. As of December 31, 2017, 689,206 shares remain available for issuance pursuant to the 2010 Plan.
The following table provides a summary of the impact of our outstanding stock-based compensation plans on the results of operations for the periods presented:
Year Ended December 31, | ||||||||||||
2017 | 2016 | 2015 | ||||||||||
(in thousands) | ||||||||||||
Stock-based compensation expense | $ | 19,353 | $ | 19,502 | $ | 20,068 | ||||||
Income tax benefit | (7,372 | ) | (7,296 | ) | (7,636 | ) | ||||||
Net stock-based compensation expense | $ | 11,981 | $ | 12,206 | $ | 12,432 | ||||||
SARs
The SARs vest ratably over a three-year period and may be exercised at any point after vesting through ten years from the date of issuance. Pursuant to the terms of the awards, upon exercise, the holders of the SARs will receive, in shares of common stock, the excess of the market price of the award on the date of exercise over the market price of the award on the date of issuance.
107
PDC ENERGY, INC.
NOTES TO CONSOLIDATED FINANCIAL STATEMENTS - Continued
The Compensation Committee has awarded SARs to our executive officers in 2017, 2016, and 2015. The fair value of each SAR award was estimated on the date of grant using a Black-Scholes pricing model using the following assumptions:
Year Ended December 31, | |||||||||||
2017 | 2016 | 2015 | |||||||||
Expected term of award (in years) | 6.0 years | 6.0 years | 5.2 years | ||||||||
Risk-free interest rate | 2.0 | % | 1.8 | % | 1.4 | % | |||||
Expected volatility | 53.3 | % | 54.5 | % | 58.0 | % | |||||
Weighted-average grant date fair value per share | $ | 38.58 | $ | 26.96 | $ | 22.23 | |||||
The expected term of the award was estimated using historical stock option exercise behavior data. The risk-free interest rate was based on the U.S. Treasury yields approximating the expected life of the award in effect at the time of grant. Expected volatilities were based on our historical volatility. We do not expect to pay or declare dividends in the foreseeable future.
The following table presents the changes in our SARs for all periods presented (in thousands, except per share data):
Year Ended December 31, | |||||||||||||||||||||||||||||||||||
2017 | 2016 | 2015 | |||||||||||||||||||||||||||||||||
Number of SARs | Weighted-Average Exercise Price | Average Remaining Contractual Term (in years) | Aggregate Intrinsic Value | Number of SARs | Weighted-Average Exercise Price | Aggregate Intrinsic Value | Number of SARs | Weighted-Average Exercise Price | Aggregate Intrinsic Value | ||||||||||||||||||||||||||
Outstanding at January 1, | 244,078 | $ | 41.36 | 6.9 | $ | 7,620 | 326,453 | $ | 38.99 | $ | 4,697 | 279,011 | $ | 38.77 | $ | 1,472 | |||||||||||||||||||
Awarded | 54,142 | 74.57 | — | — | 58,709 | 51.63 | — | 68,274 | 39.63 | — | |||||||||||||||||||||||||
Exercised | — | — | — | — | (141,084 | ) | 40.16 | 2,770 | (20,832 | ) | 38.05 | 473 | |||||||||||||||||||||||
Outstanding at December 31 | 298,220 | 47.39 | 6.5 | 2,490 | 244,078 | 41.36 | 7,620 | 326,453 | 38.99 | 4,697 | |||||||||||||||||||||||||
Exercisable at December 31 | 223,865 | 43.28 | 5.9 | 2,267 | 174,919 | 38.72 | 5,924 | 222,489 | 37.70 | 3,489 | |||||||||||||||||||||||||
We expect all SARs outstanding as of December 31, 2017 to vest. Total compensation cost related to SARs granted and not yet recognized in our consolidated statements of operations as of December 31, 2017 was $1.9 million. The cost is expected to be recognized over a weighted-average period of 1.8 years.
Restricted Stock Unit Awards
Time-Based Awards. The fair value of the time-based RSUs is amortized ratably over the requisite service period, primarily three years. The time-based RSUs generally vest ratably on each anniversary following the grant date that a participant is continuously employed.
The following table presents the changes in non-vested time-based RSUs during 2017:
Shares | Weighted-Average Grant Date Fair Value per Share | |||||
Non-vested at December 31, 2016 | 479,642 | $ | 56.09 | |||
Granted | 273,941 | 65.14 | ||||
Vested | (266,809 | ) | 57.67 | |||
Forfeited | (14,642 | ) | 62.92 | |||
Non-vested at December 31, 2017 | 472,132 | 60.23 | ||||
108
PDC ENERGY, INC.
NOTES TO CONSOLIDATED FINANCIAL STATEMENTS - Continued
The following table presents the weighted-average grant date fair value per share and related information as of/for the periods presented:
As of/Year Ended December 31, | |||||||||||
2017 | 2016 | 2015 | |||||||||
(in thousands, except per share data) | |||||||||||
Total intrinsic value of time-based awards vested | $ | 16,303 | $ | 18,973 | $ | 17,077 | |||||
Total intrinsic value of time-based awards non-vested | 24,334 | 34,812 | 28,029 | ||||||||
Market price per common share as of December 31, | 51.54 | 72.58 | 53.38 | ||||||||
Weighted-average grant date fair value per share | 65.14 | 58.52 | 48.88 | ||||||||
Total compensation cost related to non-vested time-based awards and not yet recognized in our consolidated statements of operations as of December 31, 2017 was $18.5 million. This cost is expected to be recognized over a weighted-average period of 1.8 years.
Market-Based Awards. The fair value of the market-based PSUs is amortized ratably over the requisite service period, primarily three years. The market-based PSUs vest if the participant is continuously employed throughout the performance period and the market-based performance measure is achieved, with a maximum vesting period of three years. All compensation cost related to the market-based awards will be recognized if the requisite service period is fulfilled, even if the market condition is not achieved.
In January 2017, the Compensation Committee awarded a total of 28,069 market-based PSUs to our executive officers. In addition to continuous employment, the vesting of these PSUs is contingent on our total stockholder return ("TSR"), which is essentially our stock price change including any dividends, as compared to the TSR of a group of peer companies. The shares are measured over a three-year period ending on December 31, 2019 and can result in a payout between 0 percent and 200 percent of the target PSUs awarded. As of December 31, 2017, we had approximately 52,000 non-vested market based PSUs that could result in a payout between 0 and approximately 105,000 shares of our common stock. The weighted-average grant date fair value per PSU granted was computed using the Monte Carlo pricing model using the following assumptions:
Year Ended December 31, | ||||||||||||
2017 | 2016 | 2015 | ||||||||||
Expected term of award (in years) | 3 years | 3 years | 3 years | |||||||||
Risk-free interest rate | 1.4 | % | 1.2 | % | 0.9 | % | ||||||
Expected volatility | 51.4 | % | 52.3 | % | 53.0 | % | ||||||
Weighted-average grant date fair value per share | $ | 94.02 | $ | 72.54 | $ | 66.16 | ||||||
The expected term of the awards was based on the requisite service period. The risk-free interest rate was based on the U.S. Treasury yields in effect at the time of grant and extrapolated to approximate the life of the award. The expected volatility was based on our historical volatility.
The following table presents the change in non-vested market-based awards during 2017:
Shares | Weighted-Average Grant Date Fair Value per Share | ||||||
Non-vested at December 31, 2016 | 48,420 | $ | 64.97 | ||||
Granted | 28,069 | 94.02 | |||||
Vested | (24,140 | ) | 57.35 | ||||
Non-vested at December 31, 2017 | 52,349 | 84.06 | |||||
109
PDC ENERGY, INC.
NOTES TO CONSOLIDATED FINANCIAL STATEMENTS - Continued
The following table presents the weighted-average grant date fair value per share and related information as of/for the periods presented:
As of/Year Ended December 31, | |||||||||||
2017 | 2016 | 2015 | |||||||||
(in thousands, except per share data) | |||||||||||
Total intrinsic value of market-based awards vested | $ | 2,687 | $ | 6,562 | $ | 4,293 | |||||
Total intrinsic value of market-based awards non-vested | 2,698 | 3,514 | 3,819 | ||||||||
Market price per common share as of December 31, | 51.54 | 72.58 | 53.38 | ||||||||
Weighted-average grant date fair value per share | 94.02 | 72.54 | 66.16 | ||||||||
Total compensation cost related to non-vested market-based awards and not yet recognized in our consolidated statements of operations as of December 31, 2017 was $2.4 million. This cost is expected to be recognized over a weighted-average period of 1.8 years.
Treasury Share Purchases
In accordance with our stock-based compensation plans, employees may surrender shares of our common stock to pay tax withholding obligations upon the vesting and exercise of share-based awards. Shares acquired that had been issued pursuant to the 2010 Plan are withheld for reissuance for new grants. For shares reissued for new grants under the 2010 Plan, shares are recorded at cost and upon reissuance we reduce the carrying value of shares acquired and held pursuant to the 2010 Plan by the weighted-average cost per share with an offsetting charge to APIC. During the year ended December 31, 2017, we acquired 107,357 shares pursuant to our stock-based compensation plans for payment of tax liabilities, of which 83,228 shares were reissued and 34,526 are available for reissuance pursuant to our 2010 Plan. During the year ended December 31, 2016, we acquired 116,085 shares pursuant to our stock-based compensation plans for payment of tax liabilities, of which 114,697 were reissued and 10,397 are available for reissuance pursuant to our 2010 Plan. As of December 31, 2017 and 2016, we had 21,401 and 18,366, respectively, shares of treasury stock related to a rabbi trust.
Preferred stock
We are authorized to issue 50,000,000 shares of preferred stock, par value $0.01, in one or more series, with such rights, preferences, privileges, and restrictions as shall be fixed by our Board of Directors at the time of issuance. As of December 31, 2017, no preferred shares had been issued.
NOTE 16 - EARNINGS PER SHARE
Basic earnings per share is computed by dividing net earnings by the weighted-average number of common shares outstanding for the period. Diluted earnings per share is similarly computed except that the denominator includes the effect, using the treasury stock method, of unvested restricted stock, outstanding SARs, stock options, convertible notes, and shares held pursuant to our non-employee director deferred compensation plan, if including such potential shares of common stock is dilutive.
The following table presents a reconciliation of the weighted-average diluted shares outstanding:
Year Ended December 31, | ||||||||
2017 | 2016 | 2015 | ||||||
(in thousands) | ||||||||
Weighted-average common shares outstanding - basic | 65,837 | 49,052 | 39,153 | |||||
Weighted-average common shares and equivalents outstanding - diluted | 65,837 | 49,052 | 39,153 | |||||
For 2017, 2016, and 2015, we reported a net loss. As a result, our basic and diluted weighted-average common shares outstanding were the same because the effect of the common share equivalents was anti-dilutive.
110
PDC ENERGY, INC.
NOTES TO CONSOLIDATED FINANCIAL STATEMENTS - Continued
The following table presents the weighted-average common share equivalents excluded from the calculation of diluted earnings per share due to their anti-dilutive effect:
Year Ended December 31, | ||||||||
2017 | 2016 | 2015 | ||||||
(in thousands) | ||||||||
Weighted-average common share equivalents excluded from diluted earnings per share due to their anti-dilutive effect: | ||||||||
Restricted stock | 590 | 689 | 831 | |||||
Convertible notes | — | 292 | 562 | |||||
Other equity-based awards | 75 | 109 | 101 | |||||
Total anti-dilutive common share equivalents | 665 | 1,090 | 1,494 | |||||
In September 2016, we issued the 2021 Convertible Notes, which gave the holders the right to convert the aggregate principal amount into 2.3 million shares of our common stock at a conversion price of $85.39 per share. The 2021 Convertible Notes would be included in the diluted earnings per share calculation using the treasury stock method if the average market share price had exceeded the $85.39 conversion price during the periods presented.
In November 2010, we issued the 2016 Convertible Notes, which give the holders the right to convert the aggregate principal amount into 2.7 million shares of our common stock at a conversion price of $42.40 per share. The 2016 Convertible Notes matured and were redeemed in May 2016. Prior to maturity, the 2016 Convertible Notes were included in the diluted earnings per share calculation using the treasury stock method when the average market share price exceeded the $42.40 conversion price during the period presented. Shares issuable upon conversion of the Convertible Notes were excluded from the diluted earnings per share calculation for the years ended December 31, 2016 and 2015 as the effect would have been anti-dilutive to our earnings per share.
NOTE 17 - SUBSIDIARY GUARANTOR
PDC Permian, Inc., our wholly-owned subsidiary, guarantees our obligations under our publicly-registered senior notes. The following presents the condensed consolidating financial information separately for:
(i) | PDC Energy, Inc. ("Parent"), the issuer of the guaranteed obligations, including non-material subsidiaries; |
(ii) | PDC Permian, Inc., the guarantor subsidiary ("Guarantor"), as specified in the indentures related to our senior notes; |
(iii) | Eliminations representing adjustments to (a) eliminate intercompany transactions between or among Parent, Guarantor, and our other subsidiaries and (b) eliminate the investments in our subsidiaries; and |
(iv) | Parent and subsidiaries on a consolidated basis ("Consolidated"). |
The Guarantor was 100 percent owned by the Parent beginning in December 2016. The senior notes are fully and unconditionally guaranteed on a joint and several basis by the Guarantor. The guarantee is subject to release in limited circumstances only upon the occurrence of certain customary conditions. Each entity in the consolidating financial information follows the same accounting policies as described in the notes to the consolidated financial statements.
The following consolidating financial statements have been prepared on the same basis of accounting as our consolidated financial statements. Investments in subsidiaries are accounted for under the equity method. Accordingly, the entries necessary to consolidate the Parent and Guarantor are reflected in the eliminations column.
111
PDC ENERGY, INC.
NOTES TO CONSOLIDATED FINANCIAL STATEMENTS - Continued
Consolidating Balance Sheets | ||||||||||||||||
December 31, 2017 | ||||||||||||||||
Parent | Guarantor | Eliminations | Consolidated | |||||||||||||
(in thousands) | ||||||||||||||||
Assets | ||||||||||||||||
Current assets: | ||||||||||||||||
Cash and cash equivalents | $ | 180,675 | $ | — | $ | — | $ | 180,675 | ||||||||
Accounts receivable, net | 160,490 | 37,108 | — | 197,598 | ||||||||||||
Fair value of derivatives | 14,338 | — | — | 14,338 | ||||||||||||
Prepaid expenses and other current assets | 8,284 | 329 | — | 8,613 | ||||||||||||
Total current assets | 363,787 | 37,437 | — | 401,224 | ||||||||||||
Properties and equipment, net | 1,891,314 | 2,042,153 | — | 3,933,467 | ||||||||||||
Assets held-for-sale, net | 40,084 | — | — | 40,084 | ||||||||||||
Intercompany receivable | 250,279 | — | (250,279 | ) | — | |||||||||||
Investment in subsidiaries | 1,617,537 | — | (1,617,537 | ) | — | |||||||||||
Other assets | 42,547 | 2,569 | — | 45,116 | ||||||||||||
Total Assets | $ | 4,205,548 | $ | 2,082,159 | $ | (1,867,816 | ) | $ | 4,419,891 | |||||||
Liabilities and Stockholders' Equity | ||||||||||||||||
Liabilities | ||||||||||||||||
Current liabilities: | ||||||||||||||||
Accounts payable | $ | 85,000 | $ | 65,067 | $ | — | $ | 150,067 | ||||||||
Production tax liability | 35,902 | 1,752 | — | 37,654 | ||||||||||||
Fair value of derivatives | 79,302 | — | — | 79,302 | ||||||||||||
Funds held for distribution | 83,898 | 11,913 | — | 95,811 | ||||||||||||
Accrued interest payable | 11,812 | 3 | — | 11,815 | ||||||||||||
Other accrued expenses | 42,543 | 444 | — | 42,987 | ||||||||||||
Total current liabilities | 338,457 | 79,179 | — | 417,636 | ||||||||||||
Intercompany payable | — | 250,279 | (250,279 | ) | — | |||||||||||
Long-term debt | 1,151,932 | — | — | 1,151,932 | ||||||||||||
Deferred income taxes | 62,857 | 129,135 | — | 191,992 | ||||||||||||
Asset retirement obligations | 65,301 | 5,705 | — | 71,006 | ||||||||||||
Fair value of derivatives | 22,343 | — | — | 22,343 | ||||||||||||
Other liabilities | 57,009 | 324 | — | 57,333 | ||||||||||||
Total liabilities | 1,697,899 | 464,622 | (250,279 | ) | 1,912,242 | |||||||||||
Stockholders' equity | ||||||||||||||||
Common shares | 659 | — | — | 659 | ||||||||||||
Additional paid-in capital | 2,503,294 | 1,766,775 | (1,766,775 | ) | 2,503,294 | |||||||||||
Retained earnings | 6,704 | (149,238 | ) | 149,238 | 6,704 | |||||||||||
Treasury shares | (3,008 | ) | — | — | (3,008 | ) | ||||||||||
Total stockholders' equity | 2,507,649 | 1,617,537 | (1,617,537 | ) | 2,507,649 | |||||||||||
Total Liabilities and Stockholders' Equity | $ | 4,205,548 | $ | 2,082,159 | $ | (1,867,816 | ) | $ | 4,419,891 | |||||||
112
PDC ENERGY, INC.
NOTES TO CONSOLIDATED FINANCIAL STATEMENTS - Continued
Consolidating Balance Sheets | ||||||||||||||||
December 31, 2016 | ||||||||||||||||
Parent | Guarantor | Eliminations | Consolidated | |||||||||||||
(in thousands) | ||||||||||||||||
Assets | ||||||||||||||||
Current assets: | ||||||||||||||||
Cash and cash equivalents | $ | 240,487 | $ | 3,613 | $ | — | $ | 244,100 | ||||||||
Accounts receivable, net | 134,589 | 8,803 | — | 143,392 | ||||||||||||
Fair value of derivatives | 8,791 | — | — | 8,791 | ||||||||||||
Prepaid expenses and other current assets | 3,442 | 100 | — | 3,542 | ||||||||||||
Total current assets | 387,309 | 12,516 | — | 399,825 | ||||||||||||
Properties and equipment, net | 1,884,147 | 2,118,847 | — | 4,002,994 | ||||||||||||
Assets held-for-sale, net | 5,272 | — | — | 5,272 | ||||||||||||
Intercompany receivable | 9,415 | — | (9,415 | ) | — | |||||||||||
Investment in subsidiaries | 1,765,092 | — | (1,765,092 | ) | — | |||||||||||
Fair value of derivatives | 2,386 | — | — | 2,386 | ||||||||||||
Goodwill | — | 62,041 | — | 62,041 | ||||||||||||
Other assets | 13,153 | 171 | — | 13,324 | ||||||||||||
Total Assets | $ | 4,066,774 | $ | 2,193,575 | $ | (1,774,507 | ) | $ | 4,485,842 | |||||||
Liabilities and Stockholders' Equity | ||||||||||||||||
Liabilities | ||||||||||||||||
Current liabilities: | ||||||||||||||||
Accounts payable | $ | 38,748 | $ | 27,574 | $ | — | $ | 66,322 | ||||||||
Production tax liability | 24,401 | 366 | — | 24,767 | ||||||||||||
Fair value of derivatives | 53,595 | — | — | 53,595 | ||||||||||||
Funds held for distribution | 65,022 | 6,317 | — | 71,339 | ||||||||||||
Accrued interest payable | 15,930 | — | — | 15,930 | ||||||||||||
Other accrued expenses | 37,425 | 1,200 | — | 38,625 | ||||||||||||
Total current liabilities | 235,121 | 35,457 | — | 270,578 | ||||||||||||
Intercompany payable | — | 9,415 | (9,415 | ) | — | |||||||||||
Long-term debt | 1,043,954 | — | — | 1,043,954 | ||||||||||||
Deferred income taxes | 20,971 | 379,896 | — | 400,867 | ||||||||||||
Asset retirement obligations | 78,897 | 3,715 | — | 82,612 | ||||||||||||
Fair value of derivatives | 27,595 | — | — | 27,595 | ||||||||||||
Other liabilities | 37,482 | — | — | 37,482 | ||||||||||||
Total liabilities | 1,444,020 | 428,483 | (9,415 | ) | 1,863,088 | |||||||||||
Stockholders' equity | ||||||||||||||||
Common shares | 657 | — | — | 657 | ||||||||||||
Additional paid-in capital | 2,489,557 | 1,766,775 | (1,766,775 | ) | 2,489,557 | |||||||||||
Retained earnings | 134,208 | (1,683 | ) | 1,683 | 134,208 | |||||||||||
Treasury shares | (1,668 | ) | — | — | (1,668 | ) | ||||||||||
Total stockholders' equity | 2,622,754 | 1,765,092 | (1,765,092 | ) | 2,622,754 | |||||||||||
Total Liabilities and Stockholders' Equity | $ | 4,066,774 | $ | 2,193,575 | $ | (1,774,507 | ) | $ | 4,485,842 | |||||||
113
PDC ENERGY, INC.
NOTES TO CONSOLIDATED FINANCIAL STATEMENTS - Continued
Consolidating Statements of Operations | ||||||||||||||||
Year Ended December 31, 2017 | ||||||||||||||||
Parent | Guarantor | Eliminations | Consolidated | |||||||||||||
(in thousands) | ||||||||||||||||
Revenues | ||||||||||||||||
Crude oil, natural gas, and NGLs sales | $ | 788,400 | $ | 124,684 | $ | — | $ | 913,084 | ||||||||
Commodity price risk management gain (loss), net | (3,936 | ) | — | — | (3,936 | ) | ||||||||||
Other income | 11,901 | 567 | — | 12,468 | ||||||||||||
Total revenues | 796,365 | 125,251 | — | 921,616 | ||||||||||||
Costs, expenses and other | ||||||||||||||||
Lease operating expenses | 68,031 | 21,610 | — | 89,641 | ||||||||||||
Production taxes | 53,236 | 7,481 | — | 60,717 | ||||||||||||
Transportation, gathering, and processing expenses | 23,301 | 9,919 | — | 33,220 | ||||||||||||
Exploration, geologic, and geophysical expense | 1,092 | 46,242 | — | 47,334 | ||||||||||||
Impairment of properties and equipment | 4,951 | 280,936 | — | 285,887 | ||||||||||||
Impairment of goodwill | — | 75,121 | — | 75,121 | ||||||||||||
General and administrative expense | 107,518 | 12,852 | — | 120,370 | ||||||||||||
Depreciation, depletion and amortization | 403,984 | 65,100 | — | 469,084 | ||||||||||||
Provision for uncollectible notes receivable | (40,203 | ) | — | — | (40,203 | ) | ||||||||||
Accretion of asset retirement obligations | 5,965 | 341 | — | 6,306 | ||||||||||||
Gain on sale of properties and equipment | (766 | ) | — | — | (766 | ) | ||||||||||
Other expenses | 13,157 | — | — | 13,157 | ||||||||||||
Total costs, expenses and other | 640,266 | 519,602 | — | 1,159,868 | ||||||||||||
Income (loss) from operations | 156,099 | (394,351 | ) | — | (238,252 | ) | ||||||||||
Loss on extinguishment of debt | (24,747 | ) | — | — | (24,747 | ) | ||||||||||
Interest expense | (79,919 | ) | 1,225 | — | (78,694 | ) | ||||||||||
Interest income | 2,261 | — | — | 2,261 | ||||||||||||
Income (loss) before income taxes | 53,694 | (393,126 | ) | — | (339,432 | ) | ||||||||||
Income tax (expense) benefit | (33,643 | ) | 245,571 | — | 211,928 | |||||||||||
Equity in loss of subsidiary | (147,555 | ) | — | 147,555 | — | |||||||||||
Net loss | $ | (127,504 | ) | $ | (147,555 | ) | $ | 147,555 | $ | (127,504 | ) | |||||
Net losses of the Guarantor for the year ended 2017 are primarily the result of the exploratory dry hole expense, impairment of certain unproved Delaware Basin leasehold positions, and the impairment of goodwill.
114
PDC ENERGY, INC.
NOTES TO CONSOLIDATED FINANCIAL STATEMENTS - Continued
Consolidating Statements of Operations | ||||||||||||||||
Year Ended December 31, 2016 | ||||||||||||||||
Parent | Guarantor | Eliminations | Consolidated | |||||||||||||
(in thousands) | ||||||||||||||||
Revenues | ||||||||||||||||
Crude oil, natural gas, and NGLs sales | $ | 491,750 | $ | 5,603 | $ | — | $ | 497,353 | ||||||||
Commodity price risk management gain (loss), net | (125,681 | ) | — | — | (125,681 | ) | ||||||||||
Other income | 11,241 | 2 | — | 11,243 | ||||||||||||
Total revenues | 377,310 | 5,605 | — | 382,915 | ||||||||||||
Costs, expenses and other | ||||||||||||||||
Lease operating expenses | 58,401 | 1,549 | — | 59,950 | ||||||||||||
Production taxes | 31,132 | 278 | — | 31,410 | ||||||||||||
Transportation, gathering, and processing expenses | 18,263 | 152 | — | 18,415 | ||||||||||||
Exploration, geologic, and geophysical expense | 1,197 | 3,472 | — | 4,669 | ||||||||||||
Impairment of properties and equipment | 9,973 | — | — | 9,973 | ||||||||||||
General and administrative expense | 112,166 | 304 | — | 112,470 | ||||||||||||
Depreciation, depletion and amortization | 415,321 | 1,553 | — | 416,874 | ||||||||||||
Provision for uncollectible notes receivable | 44,038 | — | — | 44,038 | ||||||||||||
Accretion of asset retirement obligations | 7,070 | 10 | — | 7,080 | ||||||||||||
Gain on sale of properties and equipment | (43 | ) | — | — | (43 | ) | ||||||||||
Other expenses | 10,193 | — | — | 10,193 | ||||||||||||
Total costs, expenses and other | 707,711 | 7,318 | — | 715,029 | ||||||||||||
Loss from operations | (330,401 | ) | (1,713 | ) | — | (332,114 | ) | |||||||||
Interest expense | (62,002 | ) | 30 | — | (61,972 | ) | ||||||||||
Interest income | 963 | — | — | 963 | ||||||||||||
Loss before income taxes | (391,440 | ) | (1,683 | ) | — | (393,123 | ) | |||||||||
Income tax benefit | 147,195 | — | — | 147,195 | ||||||||||||
Equity in loss of subsidiary | (1,683 | ) | — | 1,683 | — | |||||||||||
Net loss | $ | (245,928 | ) | $ | (1,683 | ) | $ | 1,683 | $ | (245,928 | ) | |||||
115
PDC ENERGY, INC.
NOTES TO CONSOLIDATED FINANCIAL STATEMENTS - Continued
Condensed Consolidating Statements of Cash Flows | ||||||||||||||||
Year Ended December 31, 2017 | ||||||||||||||||
Parent | Guarantor | Eliminations | Consolidated | |||||||||||||
(in thousands) | ||||||||||||||||
Cash flows from operating activities | $ | 537,704 | $ | 50,859 | $ | — | $ | 588,563 | ||||||||
Cash flows from investing activities: | ||||||||||||||||
Capital expenditures for development of crude oil and natural properties | (439,897 | ) | (297,311 | ) | — | (737,208 | ) | |||||||||
Capital expenditures for other properties and equipment | (3,539 | ) | (1,555 | ) | — | (5,094 | ) | |||||||||
Acquisition of crude oil and natural gas properties, including settlement adjustments and deposit for pending acquisition | (21,000 | ) | 5,372 | — | (15,628 | ) | ||||||||||
Proceeds from sale of properties and equipment | 10,084 | (93 | ) | — | 9,991 | |||||||||||
Sale of promissory note | 40,203 | — | — | 40,203 | ||||||||||||
Restricted cash | (9,250 | ) | — | — | (9,250 | ) | ||||||||||
Sale of short-term investments | 49,890 | — | — | 49,890 | ||||||||||||
Purchase of short-term investments | (49,890 | ) | — | — | (49,890 | ) | ||||||||||
Intercompany transfers | (239,191 | ) | — | 239,191 | — | |||||||||||
Net cash from investing activities | (662,590 | ) | (293,587 | ) | 239,191 | (716,986 | ) | |||||||||
Cash flows from financing activities: | ||||||||||||||||
Proceeds from issuance of senior notes | 592,366 | — | — | 592,366 | ||||||||||||
Redemption of senior notes | (519,375 | ) | — | — | (519,375 | ) | ||||||||||
Purchase of treasury stock | (6,672 | ) | — | — | (6,672 | ) | ||||||||||
Payment of debt issuance costs | (50 | ) | — | — | (50 | ) | ||||||||||
Other | (1,195 | ) | (76 | ) | — | (1,271 | ) | |||||||||
Intercompany transfers | — | 239,191 | (239,191 | ) | — | |||||||||||
Net cash from financing activities | 65,074 | 239,115 | (239,191 | ) | 64,998 | |||||||||||
Net change in cash and cash equivalents | (59,812 | ) | (3,613 | ) | — | (63,425 | ) | |||||||||
Cash and cash equivalents, beginning of period | 240,487 | 3,613 | — | 244,100 | ||||||||||||
Cash and cash equivalents, end of period | $ | 180,675 | $ | — | $ | — | $ | 180,675 | ||||||||
116
PDC ENERGY, INC.
NOTES TO CONSOLIDATED FINANCIAL STATEMENTS - Continued
Condensed Consolidating Statements of Cash Flows | ||||||||||||||||
Year Ended December 31, 2016 | ||||||||||||||||
Parent | Guarantor | Eliminations | Consolidated | |||||||||||||
(in thousands) | ||||||||||||||||
Cash flows from operating activities | $ | 492,893 | $ | (6,630 | ) | $ | — | $ | 486,263 | |||||||
Cash flows from investing activities: | ||||||||||||||||
Capital expenditures for development of crude oil and natural properties | (436,361 | ) | (523 | ) | — | (436,884 | ) | |||||||||
Capital expenditures for other properties and equipment | (2,282 | ) | (1,182 | ) | — | (3,464 | ) | |||||||||
Acquisition of crude oil and natural gas properties, including settlement adjustments and deposit for pending acquisition | (1,076,256 | ) | 2,533 | — | (1,073,723 | ) | ||||||||||
Proceeds from sale of properties and equipment | 4,945 | — | — | 4,945 | ||||||||||||
Intercompany transfers | (9,415 | ) | — | 9,415 | — | |||||||||||
Net cash from investing activities | (1,519,369 | ) | 828 | 9,415 | (1,509,126 | ) | ||||||||||
Cash flows from financing activities: | ||||||||||||||||
Proceeds from issuance of equity, net of issuance costs | 855,074 | — | — | 855,074 | ||||||||||||
Proceeds from issuance of senior notes | 392,172 | — | — | 392,172 | ||||||||||||
Proceeds from issuance of convertible senior notes | 193,935 | — | — | 193,935 | ||||||||||||
Proceeds from revolving credit facility | 85,000 | — | — | 85,000 | ||||||||||||
Repayment of revolving credit facility | (122,000 | ) | — | — | (122,000 | ) | ||||||||||
Redemption of convertible notes | (115,000 | ) | — | — | (115,000 | ) | ||||||||||
Payment of debt issuance costs | (15,556 | ) | — | — | (15,556 | ) | ||||||||||
Purchase of treasury shares | (6,935 | ) | — | — | (6,935 | ) | ||||||||||
Other | (577 | ) | — | — | (577 | ) | ||||||||||
Intercompany transfers | — | 9,415 | (9,415 | ) | — | |||||||||||
Net cash from financing activities | 1,266,113 | 9,415 | (9,415 | ) | 1,266,113 | |||||||||||
Net change in cash and cash equivalents | 239,637 | 3,613 | — | 243,250 | ||||||||||||
Cash and cash equivalents, beginning of period | 850 | — | — | 850 | ||||||||||||
Cash and cash equivalents, end of period | $ | 240,487 | $ | 3,613 | $ | — | $ | 244,100 | ||||||||
The condensed consolidating financial statements for the year ended December 31, 2016 represent one month of activity for the Guarantor as the Delaware Basin acquisition occurred in December 2016.
117
PDC ENERGY, INC.
NOTES TO CONSOLIDATED FINANCIAL STATEMENTS - Continued
NOTE 18 - SUBSEQUENT EVENTS
Bayswater Acquisition. On January 5, 2018, we closed the Bayswater Acquisition for approximately $186 million, subject to certain customary post-closing adjustments. After adjustments, we acquired approximately 7,400 net acres, approximately 220 gross drilling locations, and 24 operated horizontal wells that were either drilled uncompleted wells or in-process wells at the time of closing, for approximately $186 million, subject to certain customary post-closing adjustments. In addition to the approximately $186 million of cash paid at closing, we invested approximately $15 million during December 2017 to complete 12 of the 24 wells. Upon executing the PSA, we paid a $21.0 million deposit toward the purchase price into an escrow account, which is included in other assets on our December 31, 2017 consolidated balance sheet.
Utica Shale Divestiture. In February 2018, we entered into a PSA for the sale of the Utica Shale properties for net cash proceeds of approximately $40.0 million, subject to certain customary closing adjustments. These properties were classified as held-for-sale as they met the criteria for such classification beginning in the third quarter of 2017. See the footnote titled Properties and Equipment for further details regarding the assets held-for-sale.
Saddle Butte Rockies Midstream Amendment Payment. On January 31, 2018, we received a payment of approximately $24 million from Saddle Butte for the execution of an Amendment to an existing crude oil purchase and sale agreement, signed in December 2017. The Amendment was effective contingent upon certain events which occurred in late January 2018. The Amendment, among other things, dedicates the majority of our Wattenberg Field acreage for crude oil production to be gathered by Saddle Butte's gathering lines and extends the term through December 2029.
118
PDC ENERGY, INC.
SUPPLEMENTAL INFORMATION
(Unaudited)
SUPPLEMENTAL INFORMATION - UNAUDITED
CRUDE OIL AND NATURAL GAS INFORMATION - UNAUDITED
Net Proved Reserves
All of our crude oil, natural gas, and NGLs reserves are located in the U.S. We utilize the services of independent petroleum engineers to estimate our crude oil, natural gas, and NGL reserves. As of December 31, 2017, 2016, and 2015, all of our estimates of proved reserves for the Wattenberg Field and the Utica Shale were based on reserve reports prepared by Ryder Scott Company, L.P. and beginning in 2016, Netherland, Sewell & Associates, Inc. prepared the reserve reports for the Delaware Basin. These reserve estimates have been prepared in compliance with professional standards and the reserves definitions prescribed by the SEC.
Proved reserves are those quantities of crude oil, natural gas, and NGLs which can be estimated with reasonable certainty to be economically producible under existing economic conditions and operating methods. Proved developed reserves are the proved reserves that can be produced through existing wells with existing equipment and infrastructure and operating methods. Proved undeveloped reserves are proved reserves that are expected to be recovered from new wells on undrilled acreage or from existing wells where a relatively major expenditure is required for development. All of our proved undeveloped reserves conform to the SEC five-year rule requirement to be drilled within five years of each location’s initial booking date.
The indicated index prices for our reserves, by commodity, are presented below.
Average Benchmark Prices (1) | ||||||||||||
As of December 31, | Crude Oil (per Bbl) | Natural Gas (per Mcf) | NGLs (per Bbl) (2) | |||||||||
2017 | $ | 51.34 | $ | 2.98 | $ | 51.34 | ||||||
2016 | 42.75 | 2.48 | 42.75 | |||||||||
2015 | 50.28 | 2.59 | 50.28 | |||||||||
The netted back price used to estimate our reserves, by commodity, are presented below.
Price Used to Estimate Reserves (3) | ||||||||||||
As of December 31, | Crude Oil (per Bbl) | Natural Gas (per Mcf) | NGLs (per Bbl) (2) | |||||||||
2017 | $ | 48.68 | $ | 2.31 | $ | 20.21 | ||||||
2016 | 38.67 | 1.85 | 11.97 | |||||||||
2015 | 42.10 | 2.05 | 12.23 | |||||||||
___________
(1) | Per SEC rules, the pricing used to prepare the proved reserves is based on the unweighted arithmetic average of the first of the month prices for the preceding 12 months. |
(2) | For NGLs, we use the NYMEX crude oil price as a reference for presentation purposes. |
(3) | These prices are based on the index prices and are net of basin differentials, any transportation fees, contractual adjustments, and any Btu adjustments we experienced for the respective commodity. |
119
PDC ENERGY, INC.
SUPPLEMENTAL INFORMATION
(Unaudited)
The following tables present the changes in our estimated quantities of proved reserves:
Crude Oil, Condensate (MBbls) | Natural Gas (MMcf) | NGLs (MBbls) | Total (MBoe) | ||||||||
Proved Reserves: | |||||||||||
Proved reserves, January 1, 2015 | 100,515 | 536,972 | 60,119 | 250,129 | |||||||
Revisions of previous estimates | (43,268 | ) | (154,775 | ) | (24,407 | ) | (93,471 | ) | |||
Extensions, discoveries, and other additions | 48,707 | 311,709 | 30,835 | 131,494 | |||||||
Acquisition of reserves | 17 | 215 | 23 | 76 | |||||||
Dispositions | (12 | ) | (82 | ) | (8 | ) | (34 | ) | |||
Production | (6,984 | ) | (33,302 | ) | (2,835 | ) | (15,369 | ) | |||
Proved reserves, December 31, 2015 | 98,975 | 660,737 | 63,727 | 272,825 | |||||||
Revisions of previous estimates | (22,097 | ) | (80,426 | ) | (7,130 | ) | (42,631 | ) | |||
Extensions, discoveries, and other additions | 494 | 4,094 | 355 | 1,531 | |||||||
Acquisition of reserves | 50,126 | 305,224 | 32,586 | 133,583 | |||||||
Dispositions | (601 | ) | (4,202 | ) | (424 | ) | (1,725 | ) | |||
Production | (8,728 | ) | (51,730 | ) | (4,826 | ) | (22,176 | ) | |||
Proved reserves, December 31, 2016 | 118,169 | 833,697 | 84,288 | 341,407 | |||||||
Revisions of previous estimates | 28,334 | 96,119 | 8,104 | 52,457 | |||||||
Extensions, discoveries, and other additions | 2,923 | 11,541 | 1,158 | 6,005 | |||||||
Acquisition of reserves | 18,971 | 289,223 | 19,604 | 86,778 | |||||||
Dispositions | (653 | ) | (4,597 | ) | (481 | ) | (1,900 | ) | |||
Production | (12,902 | ) | (71,689 | ) | (6,981 | ) | (31,830 | ) | |||
Proved reserves, December 31, 2017 | 154,842 | 1,154,294 | 105,692 | 452,917 | |||||||
Proved Developed Reserves, as of: | |||||||||||
December 31, 2015 | 26,257 | 175,367 | 15,011 | 70,496 | |||||||
December 31, 2016 | 30,013 | 264,452 | 24,196 | 98,284 | |||||||
December 31, 2017 | 46,862 | 365,332 | 35,220 | 142,971 | |||||||
Proved Undeveloped Reserves, as of: | |||||||||||
December 31, 2015 | 72,718 | 485,370 | 48,716 | 202,329 | |||||||
December 31, 2016 | 88,156 | 569,245 | 60,092 | 243,122 | |||||||
December 31, 2017 | 107,980 | 788,962 | 70,472 | 309,946 | |||||||
120
PDC ENERGY, INC.
SUPPLEMENTAL INFORMATION
(Unaudited)
Developed | Undeveloped | Total | ||||||
(MBoe) | ||||||||
Proved reserves, January 1, 2015 | 74,905 | 175,224 | 250,129 | |||||
Undeveloped reserves converted to developed | 29,090 | (29,090 | ) | — | ||||
Revisions of previous estimates | (26,875 | ) | (66,596 | ) | (93,471 | ) | ||
Extensions, discoveries, and other additions | 8,703 | 122,791 | 131,494 | |||||
Acquisition of reserves | 76 | — | 76 | |||||
Dispositions | (34 | ) | — | (34 | ) | |||
Production | (15,369 | ) | — | (15,369 | ) | |||
Proved reserves, December 31, 2015 | 70,496 | 202,329 | 272,825 | |||||
Undeveloped reserves converted to developed | 32,192 | (32,192 | ) | — | ||||
Revisions of previous estimates | 6,112 | (48,743 | ) | (42,631 | ) | |||
Extensions, discoveries, and other additions | 1,531 | — | 1,531 | |||||
Acquisition of reserves | 10,229 | 123,354 | 133,583 | |||||
Dispositions | (99 | ) | (1,626 | ) | (1,725 | ) | ||
Production | (22,176 | ) | — | (22,176 | ) | |||
Proved reserves, December 31, 2016 | 98,285 | 243,122 | 341,407 | |||||
Undeveloped reserves converted to developed | 54,648 | (54,648 | ) | — | ||||
Revisions of previous estimates | 18,291 | 34,166 | 52,457 | |||||
Extensions, discoveries, and other additions | 2,292 | 3,713 | 6,005 | |||||
Acquisition of reserves | 1,305 | 85,473 | 86,778 | |||||
Dispositions | (20 | ) | (1,880 | ) | (1,900 | ) | ||
Production | (31,830 | ) | — | (31,830 | ) | |||
Proved reserves, December 31, 2017 | 142,971 | 309,946 | 452,917 | |||||
2017 Activity. During 2017, we increased proved reserves by 33 percent or 111.5 MMBoe, relative to December 31, 2016. This proved reserve increase was primarily a result of an increase in acquisitions and reserve additions on proved acreage in our Delaware Basin properties from our 2017 development plan. In 2017, we produced 31.8 MMboe.
Extensions, discoveries, and other additions for 2017 of 6.0 MMBoe includes the addition of five newly drilled wells and seven proved undeveloped ("PUD") locations in the Delaware Basin.
Acquisitions of reserves of 86.8 MMBoe includes proved developed producing properties and PUD locations obtained in our Wattenberg Field from acreage exchange transactions. We had minimal dispositions of 1.9 MMBoe related to the acreage disposed of in an acreage exchange. In relation to our acreage exchange transactions, we primarily divested proved acreage with future locations that were not in our proved five-year development plan as of December 31, 2016, as we do not add non-operated PUD locations to our proved five-year development plan until drilling has started as our certainty threshold is not achieved until such time.
We estimated 52.5 MMBoe in upward revisions from the following changes:
• | Negative revisions of 57.7 MMBoe were due to Wattenberg Field PUD locations being dropped from our proved five- year development plan and being replaced by PUD locations on newly-acquired properties. |
• | Positive revisions of 93.9 MMBoe for infill drilling within a proven area, with 37.3 MMBoe in our Wattenberg Field and 56.6 MMBoe in our Delaware Basin. |
• | Net negative revisions of 2.2 MMBoe were due to an increase in operating costs, partially offset by an increase in prices for crude oil, natural gas, and NGLs. |
• | Negative revisions of 0.7 MMBoe were due to locations being removed due to the SEC five-year development rule. |
• | Net positive revisions of 19.2 MMBoe includes performance revisions and other items. |
At December 31, 2016, we projected a PUD reserve conversion rate of 26 percent for 2017. As a result of drilling plans being extended in our Delaware Basin in the first half of 2017, our actual reserve conversion rate was 23 percent, resulting in 54.6 MMBoe of reserves recorded as PUDs at December 31, 2016, being converted to proved developed reserves as of December 31, 2017.
121
PDC ENERGY, INC.
SUPPLEMENTAL INFORMATION
(Unaudited)
Based on economic conditions on December 31, 2017, our approved development plan provides for the development of our remaining PUD locations within five years of the date such reserves were initially recorded. As of December 31, 2017, our 2018 PUD reserve conversion rate is expected to be approximately 16 percent. Our lower 2018 PUD conversion rate is a result of our Bayswater Acquisition that closed on January 5, 2018. We anticipate drilling acquired Bayswater locations in 2018 that are not included within our December 31, 2017 reserves. The Bayswater Acquisition is more fully described in the footnote titled Subsequent Events to the consolidated financial statements included elsewhere in this report. The balance of the PUD reserves are scheduled to be developed over the remaining four years in accordance with our current development plan. The level of capital spending necessary to achieve this drilling schedule is consistent with our recent performance and our outlook for future development activities.
2016 Activity. During 2016, we increased proved reserves by 25 percent or 68.6 MMBoe, relative to December 31, 2015. This proved reserve increase was primarily a result of the development of longer lateral length well bores in the Wattenberg Field, which was driven by technology advancements, together with the ability to consolidate our leasehold position to drill longer length laterals with increased working interests. We also acquired proved developed reserves and undeveloped reserves in the Delaware Basin. Extensions, discoveries, and other additions for 2016 of 1.5 MMBoe includes the addition of five wells in the Utica Shale.
Acquisitions of reserves of 133.6 MMBoe includes proved developed producing properties and PUD locations acquired in our Delaware Basin acquisitions, and new proved locations obtained from an acreage exchange transaction. Because of the preferential economics of the more concentrated acreage in the Wattenberg Field, we rescheduled the timing of anticipated development in the field. This resulted in a downward revision to our proved reserves in the revisions of previous estimates category. The net downward revisions were 42.6 MMBoe. The revision was most notably attributed to a 61.0 MMBoe decrease in reserves due to 2015 PUD locations being removed from our five year development plan and being replaced by PUD locations reflected in purchases of reserves. Infill reserve additions of 16.8 MMBoe in the Wattenberg Field were included as a positive revision of previous estimates. Infill reserve additions for years prior to 2016 for the Wattenberg Field were reported in extensions, discoveries, and other additions, including infill reserves in an existing proved field. Revisions also include a 0.5 MMBoe decrease on production due to pricing. The remaining 2.1 MMBoe in positive revisions of previous estimates includes performance revisions and other items.
We had minimal dispositions of 1.7 MMBoe related to the acreage we traded in the acreage exchange.
At December 31, 2015, we projected a PUD reserve conversion rate of 19 percent for 2016. As a result of revisions to our drilling plan during the last two months of 2016, our actual reserve conversion rate was 16 percent, resulting in 32.2 MMBoe of reserves recorded as PUDs at December 31, 2015, being converted to proved developed reserves as of December 31, 2016.
Based on economic conditions on December 31, 2016, our then-current development plan provided for the development of our remaining PUD locations within five years of the date such reserves were initially recorded. As of December 31, 2016, our 2017 PUD reserve conversion rate was expected to be approximately 26 percent.
2015 Activity. Overall, our proved reserves increased by 23 MMBoe as of December 31, 2015 as compared to December 31, 2014. In 2015, we produced 15.4 MMBoe. At December 31, 2014, we projected a PUD conversion rate of 16 percent for 2015. Our actual conversion rate was 17 percent, resulting in 29 MMBoe of reserves booked as PUDs at December 31, 2014 being converted to proved developed reserves during 2015. As shown, we acquired and divested minimal volumes of proved reserves in 2015.
Extensions, discoveries, and other additions, including infill reserves, of approximately 131 MMBoe in 2015 were all added in the Wattenberg Field and primarily related to horizontal Niobrara projects being added to our development plan. The reserve additions associated with these projects were largely the result of data generated from our downspacing testing. This led to increased well density of our PUD locations year-over-year and extended the field by enabling us to book more reserves per section in the Niobrara. In general, at December 31, 2014, Niobrara PUD locations were booked at an equivalent of eight wells per section and at December 31, 2015, such locations were booked at an equivalent of 16 wells per section. Additionally, due to more efficient drilling leading to shorter spud-to-spud times, we have increased the number of wells drilled per drilling rig utilized during the course of the year. We had 791 gross PUD horizontal drilling locations at December 31, 2015, which was an increase from 774 locations at December 31, 2014. Approximately 9 MMBoe of the extensions, discoveries, and other additions to our developed reserves related to wells drilled that were not related to reserves booked as of the prior year-end.
122
PDC ENERGY, INC.
SUPPLEMENTAL INFORMATION
(Unaudited)
We recorded net downward revisions of previous estimates of proved reserves of approximately 93 MMBoe. The revision was a result of multiple factors, most notably a decrease of approximately 56 MMBoe for adjustments to our development plans in the Wattenberg Field resulting from the booking of further-downspaced PUD locations. This downspacing delayed the expected development date for many existing PUD locations beyond the limits of the SEC five-year rule. Also contributing to the downward revision was a decrease of approximately 33 MMBoe due to the significant decrease in SEC commodity prices utilized in the December 31, 2015 reserve report, including approximately 11 MMBoe specifically related to the removal of vertical re-fracs and re-completions from the proved developed reserves which no longer fall within our economic parameters. There was an additional negative revision of approximately 22 MMBoe primarily related to geology findings and leasehold factors. Partially offsetting these decreases was an upward revision approximately 18 MMBoe related to well performance and forecast adjustments.
Results of Operations for Crude Oil and Natural Gas Producing Activities
The results of operations for crude oil and natural gas producing activities are presented below. The results include activities related to both continuing and discontinued operations and exclude activities related to gas marketing and other income. Comprehensive income (loss) includes net income (loss), as well as other changes in stockholders' equity that result from transactions and economic events other than those with shareholders. There was no difference between our net income (loss) and comprehensive income (loss) for any of the periods presented in the results of operations for crude oil and natural gas producing activities shown.
Year Ended December 31, | |||||||||||
2017 | 2016 | 2015 | |||||||||
(in thousands) | |||||||||||
Revenue: | |||||||||||
Crude oil, natural gas and NGLs sales | $ | 913,084 | $ | 497,353 | $ | 378,713 | |||||
Commodity price risk management gain (loss), net | (3,936 | ) | (125,681 | ) | 203,183 | ||||||
909,148 | 371,672 | 581,896 | |||||||||
Expenses: | |||||||||||
Lease operating expenses | 89,641 | 59,950 | 56,992 | ||||||||
Production taxes | 60,717 | 31,410 | 18,443 | ||||||||
Transportation, gathering and processing expenses | 33,220 | 18,415 | 10,151 | ||||||||
Exploration expense | 47,334 | 4,669 | 1,102 | ||||||||
Impairment of properties and equipment | 285,887 | 9,973 | 161,620 | ||||||||
Depreciation, depletion, and amortization | 462,482 | 413,105 | 298,760 | ||||||||
Accretion of asset retirement obligations | 6,306 | 7,080 | 6,293 | ||||||||
Gain on sale of properties and equipment | (766 | ) | (43 | ) | (385 | ) | |||||
984,821 | 544,559 | 552,976 | |||||||||
Results of operations for crude oil and natural gas producing activities before provision for income taxes | (75,673 | ) | (172,887 | ) | 28,920 | ||||||
Provision for income taxes | 47,247 | 64,733 | (10,394 | ) | |||||||
Results of operations for crude oil and natural gas producing activities, excluding corporate overhead and interest costs | $ | (28,426 | ) | $ | (108,154 | ) | $ | 18,526 | |||
Production costs include those costs incurred to operate and maintain productive wells and related equipment, including costs such as labor, repairs, maintenance, materials, supplies, fuel consumed, insurance, production and severance taxes, and associated administrative expenses. DD&A expense includes those costs associated with capitalized acquisition, exploration, and development costs, but does not include the depreciation applicable to support equipment. The provision for income taxes is computed using effective tax rates.
123
PDC ENERGY, INC.
SUPPLEMENTAL INFORMATION
(Unaudited)
Costs Incurred in Crude Oil and Natural Gas Property Acquisition, Exploration, and Development Activities
Costs incurred in crude oil and natural gas property acquisition, exploration, and development are presented below.
Year Ended December 31, | |||||||||||
2017 | 2016 | 2015 | |||||||||
(in thousands) | |||||||||||
Acquisition of properties: (1) | |||||||||||
Proved properties | $ | 172 | $ | 268,567 | $ | 3,561 | |||||
Unproved properties | 18,914 | 1,843,985 | 15 | ||||||||
Development costs (2) | 688,165 | 383,336 | 552,104 | ||||||||
Exploration costs: (3) | |||||||||||
Exploratory drilling | 80,103 | — | — | ||||||||
Geological and geophysical | 3,881 | 4,669 | — | ||||||||
Total costs incurred (4) | $ | 791,235 | $ | 2,500,557 | $ | 555,680 | |||||
__________
(1) | Property acquisition costs represent costs incurred to purchase, lease, or otherwise acquire a property. Proved properties |
include approximately $40.9 million of infrastructure and pipeline costs in 2016.
(2) | Development costs represent costs incurred to gain access to and prepare development well locations for drilling, drill and equip development wells, recomplete wells, and provide facilities to extract, treat, gather, and store crude oil, natural gas, and NGLs. Of these costs incurred for the years ended December 31, 2017, 2016, and 2015, $463.4 million, $204.6 million, and $207.8 million, respectively, were incurred to convert proved undeveloped reserves to proved developed reserves from the prior year end. These costs also include approximately $32.8 million of infrastructure and pipeline costs in 2017. |
(3) | Exploration costs represent costs incurred in identifying areas that may warrant examination and in examining specific areas that are considered to have prospects of containing crude oil, natural gas, and NGLs. These costs include, but are not limited to, dry hole contributions and costs of drilling and equipping exploratory wells. |
(4) | During the year ended 2017, we finalized our purchase price allocation for the 2016 Delaware Basin acquisition within the one year measurement period. The finalization included a reduction to our proved, undeveloped and development costs of $24.6 million. We excluded this reduction from our 2017 costs incurred as it did not relate to any cash acquisitions in 2017. |
Capitalized Costs Related to Crude Oil and Natural Gas Producing Activities
Aggregate capitalized costs related to crude oil and natural gas exploration and production activities with applicable accumulated DD&A are presented below:
As of December 31, | |||||||
2017 | 2016 | ||||||
(in thousands) | |||||||
Proved crude oil and natural gas properties | $ | 4,356,922 | $ | 3,499,718 | |||
Unproved crude oil and natural gas properties | 1,097,317 | 1,874,671 | |||||
Uncompleted wells, equipment and facilities | 265,526 | 150,424 | |||||
Capitalized costs | 5,719,765 | 5,524,813 | |||||
Less accumulated DD&A | (1,803,847 | ) | (1,534,678 | ) | |||
Capitalized costs, net | $ | 3,915,918 | $ | 3,990,135 | |||
Standardized Measure of Discounted Future Net Cash Flows and Changes Therein Relating to Proved Reserves
The standardized measure below has been prepared in accordance with U.S. GAAP. Future estimated cash flows were based on a 12-month average price calculated as the unweighted arithmetic average of the prices on the first day of each month, January through December, applied to our year-end estimated proved reserves. Prices for each of the three years were adjusted by field for Btu content, transportation and regional price differences; however, they were not adjusted to reflect the value of our commodity derivatives. Production and development costs were based on prices as of December 31 for each of the respective years presented. The amounts shown do not give effect to non-property related expenses, such as corporate general and administrative expenses, debt service or to depreciation, depletion, and amortization expense. Production and development costs include those cash flows associated with the expected ultimate settlement of our asset retirement obligations. Future
124
PDC ENERGY, INC.
SUPPLEMENTAL INFORMATION
(Unaudited)
estimated income tax expense is computed by applying the statutory rate in effect at the end of each year to the projected future pre-tax net cash flows, less the tax basis of the properties and gives effect to permanent differences, tax credits, and allowances related to the properties.
The following table presents information with respect to the standardized measure of discounted future net cash flows relating to proved reserves. Changes in the demand for crude oil, natural gas, and NGLs, inflation and other factors make such estimates inherently imprecise and subject to substantial revision. This table should not be construed to be an estimate of the current market value of our proved reserves.
As of December 31, | |||||||||||
2017 | 2016 | 2015 | |||||||||
(in thousands) | |||||||||||
Future estimated cash flows | $ | 12,340,407 | $ | 7,122,525 | $ | 6,297,298 | |||||
Future estimated production costs* | (3,245,627 | ) | (1,624,167 | ) | (1,493,040 | ) | |||||
Future estimated development costs | (2,893,335 | ) | (2,219,914 | ) | (2,036,685 | ) | |||||
Future estimated income tax expense | (748,494 | ) | (597,476 | ) | (508,332 | ) | |||||
Future net cash flows | 5,452,951 | 2,680,968 | 2,259,241 | ||||||||
10% annual discount for estimated timing of cash flows | (2,572,846 | ) | (1,260,339 | ) | (1,162,377 | ) | |||||
Standardized measure of discounted future estimated net cash flows | $ | 2,880,105 | $ | 1,420,629 | $ | 1,096,864 | |||||
___________
* | Represents future estimated lease operating expenses, production taxes, transportation, gathering, and processing expenses. |
The following table presents the principal sources of change in the standardized measure of discounted future estimated net cash flows:
Year Ended December 31, | |||||||||||
2017 | 2016 | 2015 | |||||||||
(in thousands) | |||||||||||
Beginning of period | $ | 1,420,629 | $ | 1,096,864 | $ | 2,306,465 | |||||
Sales of crude oil, natural gas and NGLs production, net of production costs | (729,506 | ) | (387,576 | ) | (293,127 | ) | |||||
Net changes in prices and production costs (1) | 841,713 | (205,760 | ) | (1,752,921 | ) | ||||||
Extensions, discoveries, and improved recovery, less related costs | 47,240 | 15,128 | 489,178 | ||||||||
Sales of reserves | (2,613 | ) | (3,745 | ) | (463 | ) | |||||
Purchases of reserves | 224,483 | 487,636 | 374 | ||||||||
Development costs incurred during the period | 419,047 | 268,672 | 368,840 | ||||||||
Revisions of previous quantity estimates | 484,431 | (320,286 | ) | (1,286,462 | ) | ||||||
Changes in estimated income taxes | (138,560 | ) | (13,630 | ) | 902,994 | ||||||
Net changes in future development costs | 25,183 | 391,145 | 112,958 | ||||||||
Accretion of discount | 167,487 | 133,747 | 345,007 | ||||||||
Timing and other | 120,571 | (41,566 | ) | (95,979 | ) | ||||||
End of period | $ | 2,880,105 | $ | 1,420,629 | $ | 1,096,864 | |||||
__________
(1) | Our weighted-average price, net of production costs per Boe, in our 2017 reserve report increased to $20.08 as compared to $15.73 for 2016 and $17.30 for 2015. |
The data presented should not be viewed as representing the expected cash flows from, or current value of, existing proved reserves since the computations are based on a large number of estimates and arbitrary assumptions. Reserve quantities cannot be measured with precision and their estimation requires many judgmental determinations and frequent revisions. The required projection of production and related expenditures over time requires further estimates with respect to pipeline availability, rates of demand and governmental control. Actual future prices and costs are likely to be substantially different from the recent average prices and current costs utilized in the computation of reported amounts. Any analysis or evaluation of the reported amounts should give specific recognition to the computational methods utilized and the limitations inherent therein.
125
PDC ENERGY, INC.
QUARTERLY FINANCIAL INFORMATION - UNAUDITED
Quarterly financial data for the years ended December 31, 2017 and 2016 is presented below. The quarterly consolidated statements of operations below reflect our revised presentation. The sum of the quarters may not equal the total of the year's net income or loss per share due to changes in the weighted-average shares outstanding throughout the year.
2017 | |||||||||||||||
Quarter Ended | |||||||||||||||
March 31 | June 30 | September 30 | December 31 | ||||||||||||
(in thousands, except per share data) | |||||||||||||||
Total revenues | $ | 273,707 | $ | 275,158 | $ | 183,235 | $ | 189,516 | |||||||
Total costs, expenses and other | 182,004 | 190,522 | 579,326 | 208,016 | |||||||||||
Income (loss) from operations | 91,703 | 84,636 | (396,091 | ) | (18,500 | ) | |||||||||
Income (loss) before income taxes | 72,476 | 65,787 | (414,887 | ) | (62,808 | ) | |||||||||
Net income (loss) (1) | $ | 46,146 | $ | 41,250 | $ | (292,537 | ) | $ | 77,637 | ||||||
Earnings per share: | |||||||||||||||
Basic | $ | 0.70 | $ | 0.63 | $ | (4.44 | ) | $ | 1.18 | ||||||
Diluted | 0.70 | 0.62 | (4.44 | ) | 1.17 | ||||||||||
________
(1) Net income of $77.6 million for the quarter ended December 31, 2017 is primarily due to an income tax benefit of
$114.4 million resulting from a decrease in deferred tax assets and liabilities related to the 2017 Tax Act.
2016 | |||||||||||||||
Quarter Ended | |||||||||||||||
March 31 | June 30 | September 30 | December 31 | ||||||||||||
(in thousands, except per share data) | |||||||||||||||
Total revenues | $ | 90,831 | $ | 20,097 | $ | 163,890 | $ | 108,097 | |||||||
Total costs, expenses and other | 193,864 | 163,379 | 179,178 | 178,608 | |||||||||||
Loss from operations | (103,033 | ) | (143,282 | ) | (15,288 | ) | (70,511 | ) | |||||||
Loss before income taxes | (113,369 | ) | (153,777 | ) | (35,341 | ) | (90,636 | ) | |||||||
Net loss | $ | (71,530 | ) | $ | (95,450 | ) | $ | (23,309 | ) | $ | (55,639 | ) | |||
Earnings per share: | |||||||||||||||
Basic | $ | (1.72 | ) | $ | (2.04 | ) | $ | (0.48 | ) | $ | (0.94 | ) | |||
Diluted | (1.72 | ) | (2.04 | ) | (0.48 | ) | (0.94 | ) | |||||||
126
PDC ENERGY, INC.
FINANCIAL STATEMENT SCHEDULE
Schedule II -VALUATION AND QUALIFYING ACCOUNTS
Description | Beginning Balance January 1, | Charged to Costs and Expenses | Deductions (1) | Ending Balance December 31, | ||||||||||||
(in thousands) | ||||||||||||||||
2017: | ||||||||||||||||
Allowance for uncollectible notes | $ | 44,038 | $ | — | $ | 44,038 | $ | — | ||||||||
Allowance for doubtful accounts | 2,190 | 1,108 | 170 | 3,128 | ||||||||||||
Allowance for expirations of unproved crude oil and natural gas properties | 359 | 263,817 | 13,017 | 251,159 | ||||||||||||
2016: | ||||||||||||||||
Allowance for uncollectible notes | — | 44,038 | — | 44,038 | ||||||||||||
Allowance for doubtful accounts | 2,009 | 1,309 | 1,128 | 2,190 | ||||||||||||
Allowance for expirations of unproved crude oil and natural gas properties | 144 | 215 | — | 359 | ||||||||||||
2015: | ||||||||||||||||
Allowance for doubtful accounts | 486 | 1,700 | 177 | 2,009 | ||||||||||||
Allowance for expirations of unproved crude oil and natural gas properties | 9,293 | 7,012 | 16,161 | 144 | ||||||||||||
____________
(1) | For allowance for uncollectible notes, deductions represent reversals of allowances due to the collection of amounts owed. For allowance for doubtful accounts, deductions represent the write-off of accounts receivable deemed uncollectible. For allowance for expirations of unproved crude oil and natural gas properties, deductions represent either actual expired or abandoned unproved crude oil and natural gas properties or an accumulated amortization of expired or abandoned unproved crude oil and natural gas properties, with a corresponding decrease to the historical cost of the associated asset. |
127
ITEM 9. CHANGES IN AND DISAGREEMENTS WITH ACCOUNTANTS ON ACCOUNTING AND FINANCIAL DISCLOSURE
None.
ITEM 9A. CONTROLS AND PROCEDURES
Evaluation of Disclosure Controls and Procedures
As of December 31, 2017, we carried out an evaluation under the supervision and with the participation of management, including the Chief Executive Officer and the Chief Financial Officer, of the effectiveness of the design and operation of our disclosure controls and procedures pursuant to Exchange Act Rules 13a-15(e) and 15d-15(e). Based on the results of this evaluation, the Chief Executive Officer and the Chief Financial Officer concluded that our disclosure controls and procedures were not effective as of December 31, 2017 because of the material weaknesses in our internal control over financial reporting described below.
Management's Report on Internal Control over Financial Reporting
Management is responsible for establishing and maintaining adequate internal control over financial reporting as such term is defined in Rules 13a-15(f) and 15d-15(f) of the Exchange Act. Internal control over financial reporting is a process designed by, or under the supervision of, our CEO and CFO, or persons performing similar functions, and effected by our board of directors, management and other personnel to provide reasonable assurance regarding the reliability of financial reporting and the preparation of financial statements for external purposes in accordance with generally accepted accounting principles.
Because of its inherent limitations, internal control over financial reporting may not prevent or detect misstatements. Also, projections of any evaluation of effectiveness to future periods are subject to the risk that controls may become inadequate because of changes in conditions, or that the degree of compliance with policies or procedures may deteriorate.
Management has assessed the effectiveness of our internal control over financial reporting as of December 31, 2017, based upon the criteria established in "Internal Control – Integrated Framework (2013)" issued by the Committee of Sponsoring Organizations of the Treadway Commission ("COSO").
A material weakness is a deficiency, or combination of deficiencies, in internal control over financial reporting, such that there is a reasonable possibility that a material misstatement of the annual or interim financial statements will not be prevented or detected on a timely basis.
We did not maintain a sufficient complement of personnel within the Land Department as a result of increased volume of leases, which contributed to the ineffective design and maintenance of controls to verify the completeness and accuracy of land administrative records associated with unproved leases, which are used in verifying the completeness, accuracy, valuation, rights and obligations over the accounting of properties and equipment, sales and accounts receivable, and costs and expenses. These control deficiencies resulted in immaterial adjustments of our unproved properties, impairment of unproved properties, sales, accounts receivable, and depletion expense accounts and related disclosures during 2017.
Additionally, these control deficiencies could result in misstatements of substantially all accounts and disclosures that would result in a material misstatement to the annual or interim consolidated financial statements that would not be prevented or detected. Accordingly, our management has determined that these control deficiencies constitute material weaknesses.
The effectiveness of our internal control over financial reporting as of December 31, 2017, has been audited by PricewaterhouseCoopers LLP, an independent registered public accounting firm, as stated in their report which appears under Item 8.
Remediation Plan for Material Weaknesses
In response to the identified material weaknesses, our management, with the oversight of the Audit Committee of our board of directors, has begun the process of assessing a number of different remediation initiatives to improve our internal control over financial reporting for the year ended December 31, 2018. We are currently in the process of evaluating the material weaknesses and are developing a plan of remediation to strengthen our overall controls over the sufficient complement of personnel within the Land Department and the completeness and accuracy of land administration records. We are committed to continuing to improve our internal control processes and will continue to review, optimize, and enhance our internal control
128
environment. These material weaknesses will not be considered remediated until the applicable remedial controls operate for a sufficient period of time and management has concluded, through testing, that these controls are operating effectively.
Changes in Internal Control over Financial Reporting
There were no changes in our internal control over financial reporting during the quarter ended December 31, 2017 that have materially affected, or are reasonably likely to materially affect, our internal control over financial reporting.
ITEM 9B. OTHER INFORMATION
None.
129
PART III
ITEM 10. DIRECTORS, EXECUTIVE OFFICERS AND CORPORATE GOVERNANCE
Information relating to this Item will be included in an amendment to this report or the proxy statement to be filed pursuant to Regulation 14A for our 2018 Annual Stockholders' meeting and is incorporated by reference in this report.
ITEM 11. EXECUTIVE COMPENSATION
Information relating to this Item will be included in an amendment to this report or the proxy statement to be filed pursuant to Regulation 14A for our 2018 Annual Stockholders' meeting and is incorporated by reference in this report.
ITEM 12. SECURITY OWNERSHIP OF CERTAIN BENEFICIAL OWNERS AND MANAGEMENT AND RELATED STOCKHOLDER MATTERS
Information relating to this Item will be included in an amendment to this report or the proxy statement to be filed pursuant to Regulation 14A for our 2018 Annual Stockholders' meeting and is incorporated by reference in this report.
ITEM 13. CERTAIN RELATIONSHIPS AND RELATED TRANSACTIONS AND DIRECTOR INDEPENDENCE
Information relating to this Item will be included in an amendment to this report or the proxy statement to be filed pursuant to Regulation 14A for our 2018 Annual Stockholders' meeting and is incorporated by reference in this report.
ITEM 14. PRINCIPAL ACCOUNTING FEES AND SERVICES
Information relating to this Item will be included in an amendment to this report or the proxy statement to be filed pursuant to Regulation 14A for our 2018 Annual Stockholders' meeting and is incorporated by reference in this report.
PART IV
ITEM 15. EXHIBITS, FINANCIAL STATEMENT SCHEDULES
(a) | (1) | Exhibits: |
See Exhibits Index on the following page. | ||
130
ITEM 16. FORM 10-K SUMMARY
None.
Exhibits Index
Incorporated by Reference | ||||||||||||
Exhibit Number | Exhibit Description | Form | SEC File Number | Exhibit | Filing Date | Filed Herewith | ||||||
2.1 | 8-K12B | 001-37419 | 2.1 | 6/8/2015 | ||||||||
2.2 | 8-K | 001-37419 | 2.1 | 8/24/2016 | ||||||||
2.3 | 8-K | 001-37419 | 2.2 | 8/24/2016 | ||||||||
3.1 | 8-K12B | 001-37419 | 3.1 | 6/8/2015 | ||||||||
3.2 | 8-K12B | 001-37419 | 3.2 | 6/8/2015 | ||||||||
4.1 | 10-K | 001-37419 | 4.1 | 2/28/2017 | ||||||||
4.2 | 8-K | 001-37419 | 4.1 | 11/29/2017 | ||||||||
4.3 | 8-K | 001-37419 | 4.1 | 9/14/2016 | ||||||||
4.4 | 8-K | 001-37419 | 4.2 | 9/14/2016 | ||||||||
4.5 | 8-K | 001-37419 | 4.1 | 9/15/2016 | ||||||||
10.1 | 8-K | 000-07246 | 10.1 | 6/8/2015 | ||||||||
10.2 | 10-K | 001-37419 | 10.2 | 2/28/2017 | ||||||||
10.3 | 10-K | 10.3 | X | |||||||||
10.4 | 10-K | 000-07246 | 10.26 | 2/27/2009 | ||||||||
10.4.1 | 8-K | 000-07246 | 4/23/2010 | |||||||||
10.5 | 10-K | 001-37419 | 10.5 | 2/22/2016 | ||||||||
10.6 | 10-K | 001-37419 | 10.6 | 2/22/2016 | ||||||||
10.7 | 10-K | 000-07246 | 10.5.2 | 2/21/2014 | ||||||||
10.7.1 | 10-K | 000-07246 | 10.9 | 2/27/2013 | ||||||||
10.7.2 | 10-K | 000-07246 | 10.10 | 2/27/2013 | ||||||||
10.7.3 | 10-K | 000-07246 | 10.5.4 | 2/19/2015 | ||||||||
10.7.4 | 10-K | 000-07246 | 10.5.5 | 2/19/2015 | ||||||||
131
Incorporated by Reference | ||||||||||||
Exhibit Number | Exhibit Description | Form | SEC File Number | Exhibit | Filing Date | Filed Herewith | ||||||
10.7.5 | 10-K | 000-07246 | 10.5.6 | 2/19/2015 | ||||||||
10.7.6 | 10-K | 000-07246 | 10.5.7 | 2/19/2015 | ||||||||
10.7.7 | 10-K | 000-07246 | 10.5.8 | 2/19/2015 | ||||||||
10.7.8 | 10-K | 001-37419 | 10.7.8 | 2/22/2016 | ||||||||
10.9 | 8-K | 000-07246 | 10.3 | 4/23/2010 | ||||||||
10.10 | 8-K | 000-07246 | 10.4 | 4/23/2010 | ||||||||
10.11 | 8-K | 000-07246 | 10.1 | 5/28/2013 | ||||||||
10.11.1 | 10-K | 001-37419 | 10.11.1 | 2/22/2016 | ||||||||
10.11.2 | 8-K | 001-37419 | 10.1 | 9/8/2016 | ||||||||
10.11.3 | 10-Q | 001-37419 | 99.1 | 11/3/2016 | ||||||||
10.11.4 | 8-K | 001-37419 | 10.1 | 5/16/2017 | ||||||||
10.11.5 | 10-Q | 001-37419 | 10.1 | 11/7/2017 | ||||||||
10.12* | 10-K | 001-37419 | 10.14 | 2/28/2017 | ||||||||
10.12.1* | 10-K | 001-37419 | 10.14.1 | 2/28/2017 | ||||||||
10.13 | 8-K | 001-37419 | 10.2 | 9/15/2016 | ||||||||
10.14 | 8-K | 001-37419 | 10.1 | 12/7/2016 | ||||||||
10.15 | 8-K | 001-37419 | 10.2 | 12/7/2016 | ||||||||
10.16 | 8-K | 001-37419 | 10.1 | 11/17/2017 | ||||||||
10.17 | 8-K | 001-37419 | 10.1 | 11/29/2017 | ||||||||
132
Incorporated by Reference | ||||||||||||
Exhibit Number | Exhibit Description | Form | SEC File Number | Exhibit | Filing Date | Filed Herewith | ||||||
12.1 | X | |||||||||||
21.1 | X | |||||||||||
23.1 | X | |||||||||||
23.2 | X | |||||||||||
23.3 | X | |||||||||||
31.1 | X | |||||||||||
31.2 | X | |||||||||||
32.1 | X | |||||||||||
99.1 | X | |||||||||||
99.2 | X | |||||||||||
101.INS | XBRL Instance Document | X | ||||||||||
101.SCH | XBRL Taxonomy Extension Schema Document | X | ||||||||||
101.CAL | XBRL Taxonomy Extension Calculation Linkbase Document | X | ||||||||||
101.DEF | XBRL Taxonomy Extension Definition Linkbase Document | X | ||||||||||
101.LAB | XBRL Taxonomy Extension Label Linkbase Document | X | ||||||||||
101.PRE | XBRL Taxonomy Extension Presentation Linkbase Document | X | ||||||||||
133
SIGNATURES
Pursuant to the requirements of Section 13 or 15(d) of the Securities Exchange Act of 1934, the Registrant has duly caused this report to be signed on its behalf by the undersigned, thereunto duly authorized.
PDC ENERGY, INC. | |
By: /s/ Barton R. Brookman | |
Barton R. Brookman | |
President and Chief Executive Officer | |
February 26, 2018 | |
Pursuant to the requirements of the Securities Exchange Act of 1934, this report has been signed below by the following persons on behalf of the Registrant and in the capacities and on the dates indicated:
Signature | Title | Date | ||
/s/ Barton R. Brookman | President, Chief Executive Officer and Director | February 26, 2018 | ||
Barton R. Brookman | (principal executive officer) | |||
/s/ R. Scott Meyers | Senior Vice President and Chief Financial Officer | February 26, 2018 | ||
R. Scott Meyers | (principal financial officer and principal accounting officer) | |||
/s/ Jeffrey C. Swoveland | Chairman and Director | February 26, 2018 | ||
Jeffrey C. Swoveland | ||||
/s/ Anthony J. Crisafio | Director | February 26, 2018 | ||
Anthony J. Crisafio | ||||
/s/ Larry F. Mazza | Director | February 26, 2018 | ||
Larry F. Mazza | ||||
/s/ David C. Parke | Director | February 26, 2018 | ||
David C. Parke | ||||
/s/ Randy S. Nickerson | Director | February 26, 2018 | ||
Randy S. Nickerson | ||||
/s/ Mark E. Ellis | Director | February 26, 2018 | ||
Mark E. Ellis | ||||
/s/ Christina M. Ibrahim | Director | February 26, 2018 | ||
Christina M. Ibrahim | ||||
134
GLOSSARY OF UNITS OF MEASUREMENT AND INDUSTRY TERMS
UNITS OF MEASUREMENT
The following presents a list of units of measurement used throughout the document.
Bbl – One barrel of crude oil or NGL or 42 gallons of liquid volume.
Bcf – One billion cubic feet of natural gas volume.
Boe – One barrel of crude oil equivalent.
Btu – British thermal unit.
BBtu – One billion British thermal units.
MBoe – One thousand barrels of crude oil equivalent.
MBbls – One thousand barrels of crude oil.
Mcf – One thousand cubic feet of natural gas volume.
MMBoe – One million barrels of crude oil equivalent.
MMBbls – One million barrels of crude oil.
MMBtu – One million British thermal units.
MMcf – One million cubic feet of natural gas volume.
GLOSSARY OF INDUSTRY TERMS
The following are abbreviations and definitions of terms commonly used in the oil and gas industry and this report:
CIG - Colorado Interstate Gas.
Completion - Refers to the installation of permanent equipment for the production of crude oil and natural gas from a recently drilled well or, in the case of a dry well, to reporting to the appropriate authority that the well has been abandoned.
Developed acreage - Acreage assignable to productive wells.
Development well - A well drilled within the proved area of an oil or gas reservoir to the depth of a stratigraphic horizon known to be productive.
Differentials - The difference between the crude oil and natural gas index spot price and the corresponding cash spot price in a specified location.
Dry well or dry hole - A well found to be incapable of producing hydrocarbons in sufficient quantities to justify completion as an oil or gas well.
Exploratory well - A well drilled to find a new field or to find a new reservoir in a field previously found to be productive of oil or gas in another reservoir.
Extensions, discoveries, and other additions - As to any period, the increases to proved reserves from all sources other than the acquisition of proved properties or revisions of previous estimates.
Farm-out - Transfer of all or part of the operating rights from a working interest owner to an assignee, who assumes all or some of the burden of development in return for an interest in the property. The assignor usually retains an overriding royalty interest but may retain any type of interest.
Fracture or Fracturing - Procedure to stimulate production by forcing a mixture of fluid and proppant into the formation under high pressure. Fracturing creates artificial fractures in the reservoir rock to increase permeability and porosity, thereby allowing the release of trapped hydrocarbons.
Gross acres or wells - Refers to the total acres or wells in which we have a working interest.
Horizontal drilling - A drilling technique that permits the operator to drill a horizontal well shaft from the bottom of a vertical well and thereby to contact and intersect a larger portion of the producing horizon than conventional vertical drilling techniques and may, depending on the horizon, result in increased production rates and greater ultimate recoveries of hydrocarbons.
135
Joint interest billing - Process of billing/invoicing the costs related to well drilling, completions, and production operations among working interest partners.
Natural gas liquid(s) or NGL(s) - Hydrocarbons which can be extracted from natural gas and become liquid under various combinations of increasing pressure and lower temperature. NGLs include ethane, propane, butane, and other natural gasolines.
Net acres or wells - Refers to gross acres or wells we own multiplied, in each case, by our percentage working interest. References to net acres or wells include our proportionate share of PDCM's and our affiliated partnerships' net acres or wells.
Net production - Crude oil and natural gas production that we own, less royalties and production due to others.
Non-operated - A project in which we are not the operator.
NYMEX - New York Mercantile Exchange.
Operator - The individual or company responsible for the exploration, development and/or production of an oil or gas well or lease.
Overriding royalty - An interest which is created out of the operating or working interest. Its term is coextensive with that of the operating interest.
Possible reserves - This term is defined in the SEC Regulation S-X Section 4-10(a) and refers to those reserves that are less certain to be recovered than probable reserves. When deterministic methods are used, the total quantities ultimately recovered from a project have a low probability to exceed the sum of proved, probable, and possible reserves. When probabilistic methods are used, there must be at least a 10 percent probability that the actual quantities recovered will equal or exceed the sum of proved, probable and possible estimates.
Present value of future net revenues or (PV-10) - The present value of estimated future revenues to be generated from the production of proved reserves, before income taxes, of proved reserves calculated in accordance with Financial Accounting Standards Board guidelines, net of estimated production and future development costs, using pricing and costs as of the date of estimation without future escalation, without giving effect to hedging activities, non-property related expenses such as general and administrative expenses, debt service and depreciation, depletion and amortization, and discounted using an annual discount rate of 10 percent. PV-10 is pre-tax and therefore a non-U.S. GAAP financial measure.
Probable reserves - This term is defined in the SEC Regulation S-X Section 4-10(a) and refers to those reserves that are less certain to be recovered than proved reserves but which, together with proved reserves, are as likely as not to be recovered. When deterministic methods are used, it is as likely as not that actual remaining quantities recovered will exceed the sum of estimated proved plus probable reserves. Similarly, when probabilistic methods are used, there must be at least a 50 percent probability that the actual quantities recovered will equal or exceed the proved plus probable reserves estimates.
Productive well - An exploratory or developmental well that is not a dry well or dry hole, as defined above.
Proved developed non-producing reserves - Reserves that consist of (i) proved reserves from wells which have been completed and tested but are not producing due to lack of market or minor completion problems which are expected to be corrected and/or (ii) proved reserves currently behind the pipe in existing wells and which are expected to be productive due to both the well log characteristics and analogous production in the immediate vicinity of the wells.
Proved developed producing reserves or PDPs - Proved reserves that can be expected to be recovered from currently producing zones under the continuation of present operating methods.
Proved developed reserves - The combination of proved developed producing and proved developed non-producing reserves.
Proved reserves - This term means "proved oil and gas reserves" as defined in SEC Regulation S-X Section 4-10(a) and refers to those quantities of crude oil and condensate, natural gas, and NGLs, which, by analysis of geoscience and engineering data, can be estimated with reasonable certainty to be economically producible - from a given date forward, from known reservoirs, and under existing conditions, operating methods, and government regulations - prior to the time at which contracts providing the right to operate expire, unless evidence indicates that renewal is reasonably certain, regardless of whether deterministic or probabilistic methods are used for the estimation.
136
Proved undeveloped reserves or PUDs - Proved reserves that are expected to be recovered from new wells on undrilled acreage, or from existing wells where a relatively major expenditure is required for recompletion.
Recomplete or Recompletion - The modification of an existing well for the purpose of producing crude oil and natural gas from a different producing formation.
Reserves - Estimated remaining quantities of crude oil, natural gas, NGLs and related substances anticipated to be economically producible, as of a given date, by application of development projects to known accumulations. In addition, there must exist, or there must be a reasonable expectation that there will exist, the legal right to produce or a revenue interest in the production, installed means of delivering crude oil, natural gas, and NGLs or related substances to market, and all permits and financing required to implement the project.
Royalty - An interest in a crude oil and natural gas lease or mineral interest that gives the owner of the royalty the right to receive a portion of the production from the leased acreage or mineral interest (or of the proceeds of the sale thereof), but generally does not require the owner to pay any portion of the costs of drilling or operating the wells on the leased acreage. Royalties may be either landowner’s royalties, which are reserved by the owner of the leased acreage at the time the lease is granted, or overriding royalties, which are usually reserved by an owner of the leasehold in connection with a transfer to a subsequent owner.
Section - A square tract of land one mile by one mile, containing 640 acres.
Spud - To begin drilling; the act of beginning a hole.
Standardized measure of discounted future net cash flows or standardized measure - Future net cash flows discounted at a rate of 10 percent. Future net cash flows represent the estimated future revenues to be generated from the production of proved reserves determined in accordance with SEC guidelines, net of estimated production and future development costs, using prices and costs as of the date of estimation without future escalation, giving effect to (i) estimated future abandonment costs, net of the estimated salvage value of related equipment and (ii) future income tax expense.
Stratigraphic test well - A drilling effort, geologically directed, to obtain information pertaining to a specific geologic condition. Such wells customarily are drilled without the intent of being completed for hydrocarbon production.
Undeveloped acreage - Leased acreage on which wells have not been drilled or completed to a point that would permit the production of commercial quantities of crude oil and natural gas, regardless of whether such acreage contains proved reserves.
Waha - Waha West Texas natural gas prices
Working interest - An interest in a crude oil and natural gas lease that gives the owner of the interest the right to drill and produce crude oil and natural gas on the leased acreage. It requires the owner to pay its share of the costs of drilling and production operations.
Workover - Major remedial operations on a producing well to restore, maintain, or improve the well's production.
137