Attached files
| file | filename |
|---|---|
| EX-32.2 - CFO SECTION 906 CERTIFICATION - Endo International plc | ex32212312017cfo906cert.htm |
| EX-32.1 - CEO SECTION 906 CERTIFICATION - Endo International plc | ex32112312017ceo906cert.htm |
| EX-31.2 - CFO SECTION 302 CERTIFICATION - Endo International plc | ex31212312017cfo302cert.htm |
| EX-31.1 - CEO SECTION 302 CERTIFICATION - Endo International plc | ex31112312017ceo302cert.htm |
| EX-24 - POWER OF ATTORNEY - Endo International plc | ex2412312017powerofattorney.htm |
| EX-23.1 - CONSENT OF PWC - Endo International plc | ex23112312017consentofpwc.htm |
| EX-21.1 - SUBSIDIARIES - Endo International plc | ex21112312017subsidiaries.htm |
UNITED STATES
SECURITIES AND EXCHANGE COMMISSION
Washington, D.C. 20549
____________________________________________________________________________________________
FORM 10-K
____________________________________________________________________________________________
(Mark One)
x ANNUAL REPORT PURSUANT TO SECTION 13 OR 15(d) OF THE SECURITIES EXCHANGE ACT OF 1934.
FOR THE FISCAL YEAR ENDED DECEMBER 31, 2017
or
o TRANSITION REPORT PURSUANT TO SECTION 13 OR 15(d) OF THE SECURITIES EXCHANGE ACT OF 1934.
FOR THE TRANSITION PERIOD FROM TO
Commission File Number: 001-36326
____________________________________________________________________________________________
ENDO INTERNATIONAL PLC
(Exact name of registrant as specified in its charter)
____________________________________________________________________________________________
Ireland | 68-0683755 |
(State or other jurisdiction of incorporation or organization) | (I.R.S. Employer Identification Number) |
First Floor, Minerva House, Simmonscourt Road, Ballsbridge, Dublin 4, Ireland | Not Applicable |
(Address of Principal Executive Offices) | (Zip Code) |
011-353-1-268-2000
(Registrant’s telephone number, including area code)
Securities registered pursuant to Section 12(b) of the Act:
Title of each class | Name of each exchange on which registered |
Ordinary shares, nominal value $0.0001 per share | The NASDAQ Global Market |
Securities registered pursuant to Section 12(g) of the Act:
None
____________________________________________________________________________________________
Indicate by check mark if the registrant is a well-known seasoned issuer, as defined in Rule 405 of the Securities Act. | Yes þ No o |
Indicate by check mark if the registrant is not required to file reports pursuant to Section 13 or 15(d) of the Act. | Yes o No þ |
Indicate by check mark whether the registrant: (1) has filed all reports required to be filed by Section 13 or 15(d) of the Securities Exchange Act of 1934 during the preceding 12 months (or for such shorter period that the registrant was required to file such reports), and (2) has been subject to such filing requirements for the past 90 days. | Yes þ No o |
Indicate by check mark whether the registrant has submitted electronically and posted on its corporate Web site, if any, every Interactive Data File required to be submitted and posted pursuant to Rule 405 of Regulation S-T (§232.405 of this chapter) during the preceding 12 months (or for such shorter period that the registrant was required to submit and post such files). | Yes þ No o |
Indicate by check mark if disclosure of delinquent filers pursuant to Item 405 of Regulation S-K is not contained herein, and will not be contained, to the best of registrant’s knowledge, in definitive proxy or information statements incorporated by reference in Part III of this Form 10-K or any amendment to this Form 10-K. | þ |
Indicate by check mark whether the registrant is a large accelerated filer, an accelerated filer, a non-accelerated filer, a smaller reporting company or an emerging growth company. See the definitions of "large accelerated filer," "accelerated filer", "smaller reporting company" and "emerging growth company" in Rule 12b-2 of the Exchange Act. | |||||||
Large accelerated filer | þ | Accelerated filer | o | ||||
Non-accelerated filer | o (Do not check if a smaller reporting company) | Smaller reporting company | o | Emerging Growth Company | o | ||
If an emerging growth company, indicate by check mark if the registrant has elected not to use the extended transition period for complying with any new or revised financial accounting standards provided pursuant to Section 13(a) of the Exchange Act. | o |
Indicate by check mark whether the registrant is a shell company (as defined in Rule 12b-2 of the Act). | Yes o No þ |
The aggregate market value of the voting common equity held by non-affiliates as of June 30, 2017 was $2,479,193,508 based on a closing sale price of $11.17 per share as reported on the NASDAQ Global Select Market on June 30, 2017. Shares of the registrant’s ordinary shares held by each officer and director and each beneficial owner of 10% or more of the outstanding ordinary shares of the registrant have been excluded since such persons and beneficial owners may be deemed to be affiliates. This determination of affiliate status is not necessarily a conclusive determination for other purposes. The registrant has no non-voting ordinary shares authorized or outstanding. | ||
Indicate the number of shares outstanding of each of the issuer’s classes of ordinary shares, as of the latest practicable date. | ||
Ordinary shares, $0.0001 par value | Number of ordinary shares outstanding as of February 20, 2018: | 223,340,247 |
Documents Incorporated by Reference | ||
Portions of the registrant’s proxy statement to be filed with the SEC pursuant to Regulation 14A in connection with the registrant’s 2018 Annual General Meeting, to be filed subsequent to the date hereof, are incorporated by reference into Part III of this Form 10-K. Such proxy statement will be filed with the SEC not later than 120 days after the conclusion of the registrant’s fiscal year ended December 31, 2017. | ||
ENDO INTERNATIONAL PLC
INDEX TO FORM 10-K
FOR THE YEAR ENDED DECEMBER 31, 2017
Page | ||
FORWARD-LOOKING STATEMENTS
Statements contained or incorporated by reference in this document contain information that includes or is based on “forward-looking statements” within the meaning of Section 27A of the Securities Act of 1933, as amended (Securities Act) and Section 21E of the Securities Exchange Act of 1934, as amended (Exchange Act). These statements, including estimates of future revenues, future expenses, future net income and future net income per share, contained in the section titled “Management’s Discussion and Analysis of Financial Condition and Results of Operations,” which is included in this document, are subject to risks and uncertainties. Forward-looking statements include the information concerning our possible or assumed results of operations. We have tried, whenever possible, to identify such statements by words such as “believes,” “expects,” “anticipates,” “intends,” “estimates,” “plan,” “projected,” “forecast,” “will,” “may” or similar expressions. We have based these forward-looking statements on our current expectations and projections about the growth of our business, our financial performance and the development of our industry. Because these statements reflect our current views concerning future events, these forward-looking statements involve risks and uncertainties. Investors should note that many factors, as more fully described in Part I, Item 1A of this report under the caption “Risk Factors,” and as otherwise enumerated herein, could affect our future financial results and could cause our actual results to differ materially from those expressed in forward-looking statements contained or incorporated by reference in this document.
We do not undertake any obligation to update our forward-looking statements after the date of this document for any reason, even if new information becomes available or other events occur in the future, except as may be required under applicable securities law. You are advised to consult any further disclosures we make on related subjects in our reports filed with the Securities and Exchange Commission (SEC) and with securities regulators in Canada on the System for Electronic Document Analysis and Retrieval (SEDAR). Also note that, in Part I, Item 1A we provide a cautionary discussion of the risks, uncertainties and possibly inaccurate assumptions relevant to our business. These are factors that, individually or in the aggregate, we think could cause our actual results to differ materially from expected and historical results. We note these factors for investors as permitted by Section 27A of the Securities Act and Section 21E of the Exchange Act. You should understand that it is not possible to predict or identify all such factors. Consequently, you should not consider this to be a complete discussion of all potential risks or uncertainties.
i
PART I
Item 1. Business
Overview
Unless otherwise indicated or required by the context, references throughout to “Endo,” the “Company,” “we,” “our” or “us” refer to financial information and transactions of Endo International plc and its subsidiaries.
Endo International plc is an Ireland-domiciled, global specialty pharmaceutical company focused on generic and branded pharmaceuticals. We aim to be the premier partner to healthcare professionals and payment providers, delivering an innovative suite of generic and branded drugs to meet patients’ needs. Endo International plc was incorporated in Ireland in 2013 as a private limited company and re-registered effective February 18, 2014 as a public limited company.
Our ordinary shares are traded on the NASDAQ Global Market (NASDAQ) under the ticker symbol “ENDP.” References throughout to “ordinary shares” refer to Endo International plc’s ordinary shares, 1,000,000,000 authorized, par value $0.0001 per share. In addition, we have 4,000,000 euro deferred shares outstanding, par value of $0.01 each.
Our global headquarters are located at Minerva House, Simmonscourt Road, Ballsbridge, Dublin 4, Ireland (telephone number: 011-353-1-268-2000) and our U.S. headquarters are located at 1400 Atwater Drive, Malvern, Pennsylvania 19355 (telephone number: 484-216-0000).
Across all of our businesses, we generated total revenues of $3.47 billion, $4.01 billion and $3.27 billion in 2017, 2016 and 2015, respectively.
Our focus is on pharmaceutical products and we target areas where we believe we can build leading positions. We use a differentiated operating model based on a lean and nimble structure, the rational allocation of capital and an emphasis on high-value research and development (R&D) targets. While our primary focus is on organic growth, we evaluate and, where appropriate, execute on opportunities to expand through the acquisition of products and companies in areas that serve patients and customers and that we believe will offer above average growth characteristics and attractive margins. We believe our operating model and the execution of our corporate strategy will enable us to create shareholder value over the long-term.
As of December 31, 2017, the three reportable business segments in which the Company operates were: (1) U.S. Generic Pharmaceuticals, (2) U.S. Branded Pharmaceuticals and (3) International Pharmaceuticals. Differences in economic and other characteristics between our Sterile Injectables product portfolio, which is currently part of our U.S. Generic Pharmaceuticals segment, and the remaining U.S. Generic Pharmaceuticals segment products have been heightened by recent competitive pressures and other industry trends impacting sales and profitability. In response to these trends, in February 2018, we made changes to the way we manage and evaluate our business. As a result, our first quarter 2018 Quarterly Report on Form 10-Q will reflect a change in segments. Our Sterile Injectables product portfolio, which was part of our U.S. Generic Pharmaceuticals segment as of December 31, 2017, will be presented as a new segment named “U.S. Branded - Sterile Injectables.” Additionally, our current U.S. Branded Pharmaceuticals segment will be renamed “U.S. Branded - Specialty & Established Pharmaceuticals.” Subsequent to this change, we will have four reportable business segments: (1) U.S. Generic Pharmaceuticals, (2) U.S. Branded - Specialty & Established Pharmaceuticals, (3) U.S. Branded - Sterile Injectables and (4) International Pharmaceuticals. Each of these segments will represent a separate reporting unit for goodwill testing purposes. Under U.S. GAAP, we are required to test the goodwill of the reporting units impacted by the change described above both immediately before and after the segment realignment. This analysis, which we expect to complete in connection with our first quarter 2018 financial reporting close, is expected to result in an impairment to the goodwill of the new U.S. Generic Pharmaceuticals reporting unit, the amount of which could be material.
U.S. Generic Pharmaceuticals
Our U.S. Generic Pharmaceuticals segment, which accounted for 66%, 64% and 51% of total revenues in 2017, 2016 and 2015, respectively, focuses on high-barrier-to-entry products, including first-to-file or first-to-market opportunities that are difficult to formulate or manufacture or face complex legal and regulatory challenges. A first-to-file product, also known as a Paragraph IV product, refers to a generic product for which the Abbreviated New Drug Application (ANDA) containing a patent challenge to the corresponding branded product was the first to be filed with the U.S. Food and Drug Administration (FDA). A first-to-market product refers to a product that is the first marketed generic equivalent of a branded product for reasons apart from statutory marketing exclusivity, such as the generic equivalent of a branded product that is difficult to formulate or manufacture. First-to-file products offer the opportunity for 180 days of generic marketing exclusivity, except for competing authorized generic products, to the extent we are successful in litigating any patent challenges and receive final FDA approval of the products. First-to-market products allow us to mitigate risks from competitive pressure commonly associated with commoditized generic products.
1
The product offerings of this segment consist of a differentiated product portfolio including solid oral extended-release, solid oral immediate-release, abuse-deterrent products, liquids, semi-solids, patches, powders, ophthalmics, sprays and sterile injectables and include products in the pain management, urology, central nervous system disorders, immunosuppression, oncology, women’s health and cardiovascular disease markets, among others. Our U.S. Generic Pharmaceuticals segment is among the largest U.S. generics company based on market share. Our largest U.S. Generic Pharmaceuticals manufacturing sites are in Chestnut Ridge, New York; Irvine, California; Rochester, Michigan; and Chennai, India; which handle the production, assembly, quality assurance testing and packaging of our products. The majority of the products we manufacture are produced in our U.S. facilities.
This segment consists of our legacy generics business together with the generic pharmaceuticals products obtained through our September 25, 2015 acquisition of Par Pharmaceutical Holdings, Inc. (Par), which develops, licenses, manufactures, markets and distributes innovative and cost-effective pharmaceuticals that help improve patient quality of life.
U.S. Branded Pharmaceuticals
Our U.S. Branded Pharmaceuticals segment, which accounted for 28%, 29% and 39% of our total revenues in 2017, 2016 and 2015, respectively, includes a variety of branded prescription products to treat and manage conditions in urology, urologic oncology, endocrinology, pain and orthopedics. The products that are included in this segment include XIAFLEX®, SUPPRELIN® LA, TESTOPEL®, NASCOBAL® Nasal Spray, AVEED®, OPANA® ER, PERCOCET®, VOLTAREN® Gel, LIDODERM®, TESTIM® and FORTESTA® Gel, among others.
This segment consists of our legacy branded business together with the branded products obtained through our January 29, 2015 acquisition of Auxilium Pharmaceuticals, Inc. (Auxilium), a fully integrated specialty pharmaceutical company with a focus on developing and commercializing innovative products for specific patients’ needs in orthopedics, dermatology and other therapeutic areas, and our September 25, 2015 acquisition of Par.
International Pharmaceuticals
The International Pharmaceuticals segment, which accounted for 7%, 7% and 10% of total revenues in 2017, 2016 and 2015, respectively, includes a variety of specialty pharmaceutical products sold outside the U.S., primarily in Canada through our operating company Paladin Labs Inc. (Paladin). This segment’s key products serve growing therapeutic areas, including attention deficit hyperactivity disorder (ADHD), pain, women’s health and oncology.
This segment also included: (i) our South African business, which was sold in July 2017 and consisted of Litha Healthcare Group Limited (Litha) and certain assets acquired from Aspen Holdings in October 2015 and (ii) our Latin American business consisting of Grupo Farmacéutico Somar, S.A.P.I. de C.V. (Somar), which was sold in October 2017. We expect this segment’s revenues to continue to decline in 2018 due to the divestitures of Litha and Somar.
Our Strategy
Our strategy is to focus on our core assets, a leading generics business and a specialty branded pharmaceutical business, that deliver high quality medicines to patients through excellence in development, manufacturing and commercialization. Through a lean and efficient operating model, we are committed to serving patients and customers while continuing to innovate and provide products that make a difference in the lives of patients. We strive to maximize shareholder value by adapting to market realities and customer needs.
We are committed to driving organic growth at attractive margins by improving execution, optimizing cash flow and leveraging our market position, while maintaining a streamlined cost structure throughout each of our businesses. Specific areas of management’s focus include:
• | U.S. Generic Pharmaceuticals: Focusing on developing or acquiring high-barrier-to-entry products, including first-to-file or first-to-market opportunities that are difficult to formulate or manufacture or face complex legal and regulatory challenges. |
• | U.S. Branded Pharmaceuticals: Accelerating performance of organic growth drivers in our Specialty Products portfolio, expanding margin in our Established Products portfolio and investing in key pipeline development opportunities. |
• | International Pharmaceuticals: Operating in regulated markets with durable revenue streams and where physicians play a significant role in choosing the course of therapy and expanding distribution of certain of our products outside of the U.S. |
We remain committed to strategic R&D across each business unit. Going forward, while our primary focus will be on organic growth, we will evaluate and, where appropriate, execute on opportunities to expand through acquisitions of products and companies.
2
Our Competitive Strengths
To successfully execute our strategy, we must continue to capitalize on our following core strengths:
Experienced and dedicated management team. We have a highly skilled and customer-focused management team in critical leadership positions across all of Endo. Our senior management team has extensive experience in the pharmaceutical industry and a proven track record of developing businesses and value creation. This experience includes improving business performance through organic revenue growth and through the identification, consummation and integration of licensing and acquisition opportunities.
Focus on the differentiated products of our generics business. We develop high-barrier-to-entry generic products, including first-to-file or first-to-market opportunities that are difficult to formulate or manufacture or face complex legal and regulatory challenges. We believe products with these characteristics will face a lesser degree of competition and therefore provide longer product life cycles and higher profitability than commodity generic products. Our business model continues to focus on being the lowest-cost producer of products in categories with higher barriers to entry and lower levels of competition by leveraging operational efficiency. Our U.S. Generic Pharmaceuticals segment is focused on categories where there are fewer challenges from low-cost operators.
Operational excellence. We have efficient, effective and high-quality manufacturing capabilities across a diversified array of dosage forms. We believe our comprehensive suite of technology, manufacturing and development competencies increases the likelihood of success in commercializing high-barrier-to-entry products and obtaining first-to-file and first-to-market status on future products, yielding more sustainable market share and profitability. For example, our capabilities in the rapidly growing U.S. market for sterile drug products, such as injectables and ophthalmics, and sterile vial and hormonal capabilities afford us with a broader and more diversified product portfolio and a greater selection of targets for potential development.
We believe that our competitive advantages include our integrated team-based approach to product development that combines our formulation, regulatory, legal, manufacturing and commercial capabilities; our ability to introduce new generic equivalents for brand-name drugs; our quality and cost-effective production; our ability to meet customer and/or patient expectations; and the breadth of our existing generic product portfolio offerings. Through our recent strategic assessments, we have taken further steps to optimize our generic, specialty branded and international product portfolios and now look to capitalize on a much stronger and durable in-line product portfolio and R&D pipeline. We are focused only on those marketed products that deliver acceptable returns on investment, thereby leveraging our existing platform to drive operational efficiency.
Growth of our branded Specialty Products portfolio while leveraging the strength of our Established Products portfolio. We have assembled a portfolio of branded prescription products offered by our U.S. Branded Pharmaceuticals segment to treat and manage conditions in urology, urologic oncology, endocrinology, pain and orthopedics. Our Specialty Products portfolio includes, among other products: XIAFLEX®, SUPPRELIN® LA, TESTOPEL®, NASCOBAL® Nasal Spray and AVEED®. Our Established Products portfolio includes, among other products: PERCOCET®, VOLTAREN® Gel, LIDODERM®, TESTIM® and FORTESTA® Gel. For additional detail, see “Products Overview.”
Continuing proactive diversification of our business. Our primary focus is on organic growth. However, we will evaluate and, where appropriate, execute on opportunities to expand through acquisitions of products and companies in areas that will serve patients and customers and that we believe will offer above average growth characteristics and attractive margins. In particular, we will look to continue to enhance our product lines by acquiring or licensing rights to additional products and regularly evaluating selective acquisition opportunities.
Research and development expertise. Our R&D efforts are focused on the development of a balanced, diversified portfolio of innovative and clinically differentiated products. The acquisition of Auxilium added multiple, strategically-aligned programs to our branded pharmaceutical R&D pipeline with the addition of collagenase clostridium histolyticum (CCH). Through our U.S. Generics business, we seek out and develop high-barrier-to-entry generic products, including first-to-file or first-to-market opportunities. We periodically review our generic products pipeline in order to better direct investment toward those opportunities that we expect will deliver the greatest returns. We remain committed to R&D across each business unit with a particular focus on assets with inherently lower risk profiles and clearly defined regulatory pathways. Our current R&D pipeline consists of products in various stages of development. For additional detail, see “Select Development Projects.”
Our R&D and regulatory affairs staff is based primarily in Chestnut Ridge, New York, Chennai, India, at our global headquarters in Dublin, Ireland and at our U.S. headquarters in Malvern, Pennsylvania.
3
Targeted sales and marketing infrastructure. Our sales and marketing activities are primarily based in the U.S. and Canada and focus on the promotion of our Specialty Products portfolio. We market our products directly to specialty physicians, including those specializing in urology, orthopedics, pediatric endocrinology and bariatric surgery. Our sales force also targets retail pharmacies and other healthcare professionals. We distribute our products through independent wholesale distributors, but we also sell directly to retailers, clinics, government agencies, doctors, independent retail and specialty pharmacies and independent specialty distributors. Our marketing policy is designed to provide physicians, pharmacies, hospitals, public and private payers and appropriate healthcare professionals with products and relevant, appropriate medical information. We work to gain access to healthcare authority, pharmacy benefit managers and managed care organizations’ formularies (lists of recommended or approved medicines and other products), including Medicare Part D plans and reimbursement lists, by demonstrating the qualities and treatment benefits of our products within their approved indications.
Products Overview
U.S. Generic Pharmaceuticals
The U.S. Generic Pharmaceuticals segment’s product portfolio has over 280 generic prescription product families including solid oral extended-release, solid oral immediate-release, abuse-deterrent products, liquids, semi-solids, patches (which are medicated adhesive patches designed to deliver the drug through the skin), powders, ophthalmics (which are sterile pharmaceutical preparations administered for ocular conditions), sprays and sterile injectables and products in the pain management, urology, central nervous system disorders, immunosuppression, oncology, women’s health and cardiovascular disease markets, among others.
Generic drugs are the pharmaceutical and therapeutic equivalents of branded products and are generally marketed under their generic (chemical) names rather than by brand names. Generic products are substantially the same as branded products in dosage form, safety, efficacy, route of administration, quality, performance characteristics and intended use, but are generally sold at prices below those of the corresponding branded products and thus represent cost-effective alternatives for consumers.
Typically, a generic drug may not be marketed until the expiration of applicable patent(s) on the corresponding branded product, unless a resolution of patent litigation results in an earlier opportunity to enter the market. For additional detail, see “Governmental Regulation.” However, our generics portfolio also contains certain authorized generics, which are generic versions of branded drugs licensed by brand drug companies under a New Drug Application (NDA) and marketed as generics. Authorized generics do not face regulatory barriers to introduction and are not prohibited from sale during the 180-day marketing exclusivity period granted to the first-to-file ANDA applicant. Our authorized generics include lidocaine patch 5% (LIDODERM®), budesonide (Entocort® EC), and diclofenac sodium gel (VOLTAREN® Gel), among others. We believe we are a partner of choice to larger brand companies seeking an authorized generics distributor for their branded products. We have been the authorized generic distributor for such companies as AstraZeneca plc, Bristol-Myers Squibb Company, Novartis AG (Novartis) and Merck & Co., Inc.
The following table displays the product revenues to external customers in our U.S. Generic Pharmaceuticals segment for the years ended December 31, 2017, 2016 and 2015 (in thousands):
2017 | 2016 | 2015 | |||||||||
U.S. Generics Base (1) | $ | 829,729 | $ | 1,230,097 | $ | 1,083,809 | |||||
Sterile Injectables | 654,270 | 530,805 | 107,592 | ||||||||
New Launches and Alternative Dosages (2) | 797,002 | 803,711 | 481,015 | ||||||||
Total U.S. Generic Pharmaceuticals | $ | 2,281,001 | $ | 2,564,613 | $ | 1,672,416 | |||||
__________
(1) | U.S. Generics Base includes solid oral-extended release, solid oral-immediate release and pain/controlled substances products. |
(2) | New Launches and Alternative Dosages includes liquids, semi-solids, patches, powders, ophthalmics, sprays and new product launches. Products are included in New Launches during the calendar year of launch and the subsequent calendar year such that the period of time any product will be considered a New Launch will range from thirteen to twenty-four months. Subsequent to this thirteen to twenty-four month period that revenues are considered New Launches, these product revenues will be reflected as either U.S. Generics Base or Sterile Injectables, or will remain as an Alternative Dosage. |
U.S. Generics Base consists of more than 190 products, including solid oral-extended release, solid oral-immediate release and pain/controlled substances products. This category includes the antidepressant bupropion XL and a portfolio of pain products such as hydrocodone bitartrate and acetaminophen tablets.
4
Sterile Injectables consists of high-barrier-to-entry injectable products that are generally difficult to manufacture and may therefore face a lesser degree of competition. Products in this category include VASOSTRICT®, currently the first and only vasopressin injection with an NDA approved by the FDA, and ADRENALIN®. We have been issued five patents relating to VASOSTRICT® by the U.S. Patent and Trademark Office (PTO). These patents expire in January 2035 and were submitted to the FDA’s Approved Drug Products with Therapeutic Equivalence Evaluations (known as the Orange Book). These patents are presently listed in the Orange Book. The Orange Book listing requires any ANDA or 505(b)(2) applicant (as further described below under the heading “Governmental Regulation”) seeking FDA approval for a generic version of VASOSTRICT® prior to patent expiry to notify us of its ANDA or 505(b)(2) filing before it can obtain FDA approval. Any ANDA or 505(b)(2) filer seeking approval prior to patent expiry whose application was not received prior to submission of the patent information would be subject to a 30-month stay of marketing approval by the FDA upon our initiation of Hatch-Waxman litigation against the ANDA or 505(b)(2) filer within the statutory time period.
New Launches and Alternative Dosages includes liquids, semi-solids, patches, powders, ophthalmics, sprays and new product launches. Products are included in New Launches during the calendar year of launch and the subsequent calendar year such that the period of time any product will be considered a New Launch will range from thirteen to twenty-four months. Products in the New Launches category include, among others, ephedrine sulfate injection, vigabatrin powder for oral solution and neostigmine injection, which were launched in 2017, and ezetimibe tablets, quetiapine ER tablets and the authorized generic of VOLTEREN® Gel, which were launched in 2016.
U.S. Branded Pharmaceuticals
The following table displays the product revenues to external customers in our U.S. Branded Pharmaceuticals segment for the years ended December 31, 2017, 2016 and 2015 (in thousands):
2017 | 2016 | 2015 | |||||||||
Specialty Products: | |||||||||||
XIAFLEX® | $ | 213,378 | $ | 189,689 | $ | 158,115 | |||||
SUPPRELIN® LA | 86,211 | 78,648 | 70,099 | ||||||||
Other Specialty (1) | 153,384 | 138,483 | 98,025 | ||||||||
Total Specialty Products | $ | 452,973 | $ | 406,820 | $ | 326,239 | |||||
Established Products: | |||||||||||
OPANA® ER | $ | 83,826 | $ | 158,938 | $ | 175,772 | |||||
PERCOCET® | 125,231 | 139,211 | 135,822 | ||||||||
VOLTAREN® Gel | 68,780 | 100,642 | 207,161 | ||||||||
LIDODERM® | 51,629 | 87,577 | 125,269 | ||||||||
Other Established (2) | 175,086 | 273,106 | 314,344 | ||||||||
Total Established Products | $ | 504,552 | $ | 759,474 | $ | 958,368 | |||||
Total U.S. Branded Pharmaceuticals (3) | $ | 957,525 | $ | 1,166,294 | $ | 1,284,607 | |||||
__________
(1) | Products included within Other Specialty include TESTOPEL®, NASCOBAL® Nasal Spray, and AVEED®. |
(2) | Products included within Other Established include, but are not limited to, TESTIM® and FORTESTA® Gel, including the authorized generics. |
(3) | Individual products presented above represent the top two performing products in each product category and/or any product having revenues in excess of $100 million during the years ended December 31, 2017, 2016 or 2015. |
Specialty Products Portfolio
Endo commercializes a number of products within the market served by specialty distributors and specialty pharmacies, and in which healthcare practitioners (HCPs) can purchase and bill payers directly (the buy and bill market). Our current offerings primarily relate to two distinct areas: (i) urology treatments, which focus mainly on Peyronie’s disease (PD) and testosterone replacement therapies (TRT) for hypogonadism; and (ii) orthopedics/pediatric endocrinology treatments, which focus on Dupuytren’s contracture (DC) and central precocious puberty (CPP).
Key product offerings in this category include the following:
• | XIAFLEX®, which is indicated for the treatment of adult patients with DC with an abnormal buildup of collagen in the fingers which limits or disables hand function. It is also indicated for the treatment of adult men with PD with a collagen plaque and a penile curvature deformity of thirty degrees or greater at the start of therapy. XIAFLEX® is the first and only FDA-approved non-surgical treatment for PD. |
• | SUPPRELIN® LA, which is a soft, flexible 12-month hydrogel implant based on our hydrogel polymer technology that delivers histrelin acetate, a gonadotropin releasing hormone (GnRH) agonist and is indicated for the treatment of CPP in children. |
5
• | TESTOPEL®, which is a unique, long-acting implantable pellet indicated for TRT in conditions associated with a deficiency or absence of endogenous testosterone. |
• | NASCOBAL® Nasal Spray, which is a prescription medicine used as a supplement to treat vitamin B12 deficiency and is the only FDA-approved B12 nasal spray. |
• | AVEED®, which is a novel, long-acting testosterone undecanoate for injection for the treatment of hypogonadism. AVEED® is dosed only five times per year after the first month of therapy. |
Established Products Portfolio
Endo’s Established Products portfolio’s current treatment offerings primarily relate to two distinct areas: (i) pain management, including products in the opioid analgesics and osteoarthritis pain segments and for the treatment of pain associated with post-herpetic neuralgia; and (ii) urology, which focuses mainly on treatment of hypogonadism. The Company’s legacy pain portfolio products are managed as mature brands.
Key product offerings in this category include, among others, the following:
• | PERCOCET®, which is an opioid analgesic approved for the treatment of moderate-to-moderately-severe pain. |
• | VOLTAREN® Gel, which is a topical prescription treatment for the relief of joint pain of osteoarthritis in the knees, ankles, feet, elbows, wrists and hands. VOLTAREN® Gel delivers effective pain relief with a favorable safety profile. |
• | LIDODERM®, which is a topical patch product containing lidocaine, approved for the relief of pain associated with post-herpetic neuralgia, a condition thought to result after nerve fibers are damaged during a case of Herpes Zoster (commonly known as shingles). |
• | TESTIM® (and its authorized generic), which is a topical gel indicated for TRT in conditions associated with a deficiency or absence of endogenous testosterone. |
• | FORTESTA® Gel (and its authorized generic), which is a patented two percent (2%) testosterone transdermal gel and is a treatment for men suffering from hypogonadism. |
Also included within this product portfolio is OPANA® ER, an opioid agonist indicated for the management of pain severe enough to require daily, around-the-clock, long-term opioid treatment and for which alternative treatment options are inadequate. In March 2017, we announced that the FDA’s Drug Safety and Risk Management and Anesthetic and Analgesic Drug Products Advisory Committees voted that the benefits of reformulated OPANA® ER (oxymorphone hydrochloride extended release) no longer outweigh its risks. In June 2017, we became aware of the FDA’s request that we voluntarily withdraw OPANA® ER from the market, and in July 2017, after careful consideration and consultation with the FDA, we decided to voluntarily remove OPANA® ER from the market. During the second quarter of 2017, we began to work with the FDA to coordinate an orderly withdrawal of the product from the market. By September 1, 2017, we ceased shipments of OPANA® ER to customers and we expect the New Drug Application will be withdrawn in the coming months.
International Pharmaceuticals
Our International Pharmaceuticals segment includes a variety of specialty pharmaceutical products sold outside the U.S., primarily in Canada through our operating company Paladin Labs Inc. (Paladin). This segment’s key products serve growing therapeutic areas, including attention deficit hyperactivity disorder (ADHD), pain, women’s health and oncology.
Select Development Projects
U.S. Generic Pharmaceuticals Pipeline
Our primary approach to generic pharmaceutical product development is to target high-barrier-to-entry generic products, including first-to-file or first-to-market opportunities. We expect such product opportunities to result in products that are either the exclusive generic or have two or fewer generic competitors when launched, which we believe tends to lead to more sustainable market share and profitability for our product portfolio.
As of December 31, 2017, our U.S. Generic Pharmaceuticals segment has over 175 products in its pipeline, which included approximately 100 ANDAs pending with the FDA representing approximately $30 billion of combined annual sales for the corresponding branded products in 2017. Of the 100 ANDAs, approximately 40 represent first-to-file opportunities or first-to-market opportunities. We periodically review our generic products pipeline in order to better direct investment toward those opportunities that we expect will deliver the greatest returns. This process can lead to decisions to discontinue certain R&D projects that may reduce the number of products in our previously reported generic pipeline.
6
Collagenase Clostridium Histolyticum
Collagenase clostridium histolyticum (CCH) is currently approved and marketed in the U.S. under the trademark XIAFLEX® for the treatment of both DC and PD (two separate indications). We are progressing the branded cellulite treatment development program for CCH. We completed a Phase 2b clinical trial for this program, the results of which were released in November 2016. An End of Phase 2 meeting with the FDA occurred in early 2017 and, in February 2018, we initiated two identical Phase 3 clinical trials for CCH for the treatment of cellulite. The multicenter, randomized, double-blind, placebo-controlled studies will evaluate the safety and ability of CCH to reduce the appearance of cellulite.
We have global marketing rights for CCH for the treatment of cellulite. We also have the right to further develop CCH for additional indications, including Dupuytren’s nodules, adhesive capsulitis, lateral hip fat, plantar fibromatosis and human and canine lipomas.
Competition
Generic Pharmaceuticals
In the generic pharmaceutical market, we face intense competition from other generic drug manufacturers, brand name pharmaceutical companies through authorized generics, existing brand equivalents and manufacturers of therapeutically similar drugs. Our major competitors in the generics market, including Teva Pharmaceutical Industries Limited (Teva), Mylan N.V., Sandoz (a division of Novartis AG) and Impax Laboratories, Inc. (Impax), vary by product.
We make a significant portion of our sales to a relatively small number of drug wholesalers and retail drug store chains. These customers play a key role in the distribution chain of our pharmaceutical products. Drug wholesalers and retail drug store chains have undergone, and are continuing to undergo, significant consolidation, which has resulted in these groups gaining additional purchasing leverage that has increased the pricing pressures on our business. Additionally, the emergence of large buying groups representing independent retail pharmacies and other drug distributors, and the prevalence and influence of managed care organizations and similar institutions, enable those groups to demand larger price discounts on our products. For example, McKesson Corporation and Wal-Mart Stores, Inc. entered into an agreement to jointly source generic pharmaceuticals and Express Scripts, through a wholly owned subsidiary, Innovative Product Alignment, LLC, announced it will participate in Walgreens Boots Alliance Development GmbH group purchasing organization. As a result of these alliances, the consolidation among wholesale distributors and the growth of large retail drug store chains, a small number of purchasers control a significant share of purchases and have gained more purchasing power that has heightened competition among generic drug producers for the business of this consolidated customer base.
Newly introduced generic products with limited or no other generic competition typically garner higher prices relative to commoditized generic products. As such, our primary strategy is to compete in the generic product market with a focus on high-value, first-to-file or first-to-market opportunities, regardless of therapeutic category, and products that present significant barriers to entry for reasons such as complex formulation or regulatory or legal challenges. For additional detail, see “Our Competitive Strengths - Focus on the differentiated products of our generics business.”
At the expiration of any statutory generic exclusivity period, other generic distributors may enter the market, resulting in significant price declines. Consequently, maintaining profitable operations in generic pharmaceuticals depends, in part, on our continuing ability to select, develop, procure regulatory approvals of, overcome legal challenges to, launch and commercialize new generic products in a timely and cost efficient manner and to maintain efficient, high quality manufacturing capabilities. For additional detail, see “Our Competitive Strengths-Operational excellence.”
Branded Pharmaceuticals
Our branded pharmaceutical products compete with products manufactured by many other companies in highly competitive markets throughout the U.S. and internationally, primarily through Paladin. Competitors include many of the major brand name and generic manufacturers of pharmaceuticals. With respect to branded pharmaceuticals, our competitors, including Mylan N.V., Allergan plc (Allergan), Purdue Pharma, L.P. (Purdue), Jazz Pharmaceuticals plc (Jazz), Shire plc (Shire), Horizon Pharma plc (Horizon) and Mallinckrodt plc (Mallinckrodt), among others, vary depending on therapeutic and product category, dosage strength and drug-delivery systems.
We compete principally through targeted product development and our acquisition and in-licensing strategies. The competitive landscape in the acquisition and in-licensing of pharmaceutical products has intensified in recent years as a result of a reduction in the number of compounds available and an increase in competitors bidding on available assets. In addition to product development and acquisitions, other competitive factors in the pharmaceutical industry include product efficacy, safety, ease of use, price, demonstrated cost-effectiveness, marketing effectiveness, service, reputation and access to technical information.
7
Most new products that we introduce must compete with other products already on the market or products that are later developed by competitors. If competitors introduce new products, delivery systems or processes with therapeutic or cost advantages, our products can be subject to progressive price reductions and/or decreased volume of sales. Accordingly, the competitive environment of the branded product business requires us to continually seek out technological innovations and to market our products effectively. To successfully compete for business of managed care and pharmacy benefits management organizations, we must often demonstrate that our products offer not only medical benefits but also cost advantages as compared with other forms of care.
Some of our current branded products face competition not only from other brands, but also from generic versions. Such products include, among others, PERCOCET®, VOLTAREN® Gel, LIDODERM® and TESTIM®. Manufacturers of generic pharmaceuticals typically invest far less in R&D than research-based pharmaceutical companies and therefore can price their products significantly lower than branded products. Accordingly, when a branded product loses its market exclusivity, it normally faces intense price competition from generic forms of the product. Due to their significantly lower prices, generic versions, where available, may be substituted by pharmacies or required in preference to the branded version under third-party reimbursement programs.
In addition to those listed above, we are aware of certain competitive activities involving certain of our branded products. For a description of these competitive activities, including the litigation related to Paragraph IV Certification Notices, see Note 14. Commitments and Contingencies in the Consolidated Financial Statements, included in Part IV, Item 15 of this report "Exhibits, Financial Statement Schedules".
Seasonality
Although our business is affected by the purchasing patterns and concentration of our customers, our business is not materially impacted by seasonality.
Major Customers
We primarily sell our generic and branded pharmaceuticals to wholesalers, retail drug store chains, supermarket chains, mass merchandisers, distributors, mail order accounts, hospitals and government agencies. Our wholesalers and distributors purchase products from us and, in turn, supply products to retail drug store chains, independent pharmacies and managed health care organizations. Customers in the managed health care market include health maintenance organizations, nursing homes, hospitals, clinics, pharmacy benefit management companies and mail order customers. Total revenues from customers that accounted for 10% or more of our total consolidated revenues during the years ended December 31, 2017, 2016 and 2015 are as follows:
2017 | 2016 | 2015 | ||||||
Cardinal Health, Inc. | 25 | % | 26 | % | 21 | % | ||
McKesson Corporation | 25 | % | 27 | % | 31 | % | ||
AmerisourceBergen Corporation | 25 | % | 25 | % | 23 | % | ||
Revenues from these customers are included within each of our segments.
As a result of consolidation among wholesale distributors and the growth of large retail drug store chains, a small number of large wholesale distributors control a significant share of the market, and the number of independent retail drug stores and small retail drug store chains has decreased. Some wholesale distributors have demanded that pharmaceutical manufacturers, including us, enter into distribution service agreements (DSAs) pursuant to which the wholesale distributors provide the pharmaceutical manufacturers with specific services, including the provision of periodic retail demand information and current inventory levels and other information. We have entered into certain of these agreements.
8
Patents, Trademarks, Licenses and Proprietary Property
As of February 20, 2018, we held approximately: 243 U.S. issued patents, 64 U.S. patent applications pending, 551 foreign issued patents, and 150 foreign patent applications pending. In addition, as of February 20, 2018, we have licenses for approximately 41 U.S. issued patents, 36 U.S. patent applications pending, 157 foreign issued patents and 72 foreign patent applications pending. The following table sets forth information as of February 20, 2018 regarding patents relating to each of our most significant products:
Patent No. | Patent Expiration* | Relevant Product | Ownership | Jurisdiction Where Granted | ||||
7,718,640 | March 14, 2027 | AVEED® | Exclusive License | USA | ||||
8,338,395 | February 27, 2026 | AVEED® | Exclusive License | USA | ||||
RE39,941 | August 24, 2019 | XIAFLEX® | Exclusive License | USA | ||||
6,022,539 | June 3, 2019 | XIAFLEX® | Exclusive License | USA | ||||
7,811,560 | July 12, 2028 | XIAFLEX® | Owned; Exclusive License | USA | ||||
7,229,636 | August 1, 2024 | NASCOBAL® Nasal Spray | Owned | USA | ||||
7,404,489 | March 12, 2024 | NASCOBAL® Nasal Spray | Owned | USA | ||||
7,879,349 | August 1, 2024 | NASCOBAL® Nasal Spray | Owned | USA | ||||
8,003,353 | August 1, 2024 | NASCOBAL® Nasal Spray | Owned | USA | ||||
8,940,714 | February 26, 2024 | NASCOBAL® Nasal Spray | Owned | USA | ||||
9,415,007 | July 28, 2024 | NASCOBAL® Nasal Spray | Owned | USA | ||||
9,375,478 | January 30, 2035 | VASOSTRICT® | Owned | USA | ||||
9,687,526 | January 30, 2035 | VASOSTRICT® | Owned | USA | ||||
9,744,209 | January 30, 2035 | VASOSTRICT® | Owned | USA | ||||
9,744,239 | January 30, 2035 | VASOSTRICT® | Owned | USA | ||||
9,750,785 | January 30, 2035 | VASOSTRICT® | Owned | USA | ||||
9,119,876 | March 13, 2035 | ADRENALIN® | Owned | USA | ||||
9,295,657 | March 13, 2035 | ADRENALIN® | Owned | USA | ||||
__________
* | Our license agreements for the patents in the table above extend to or beyond the patent expiration dates. |
The effect of these issued patents is that they provide us with protection by virtue of our ability to exclude others from making, using, selling, offering for sale and importing that which is covered by their claims. The coverage claimed in a patent application can be significantly reduced before the patent is issued. Accordingly, we do not know whether any of the applications we acquire or license will result in the issuance of patents, or, if any patents are issued, whether they will provide significant proprietary protection or will be challenged, circumvented or invalidated. Because unissued U.S. patent applications are maintained in secrecy for a period of eighteen months and U.S. patent applications filed prior to November 29, 2000 are not disclosed until such patents are issued, and since publication of discoveries in the scientific or patent literature often lags behind actual discoveries, we cannot be certain of the priority of inventions covered by pending patent applications. Moreover, we may have to participate in interference and other inter parties proceedings declared by the PTO to determine priority of invention, or in opposition proceedings in a foreign patent office, either of which could result in substantial cost to us, even if the eventual outcome is favorable to us. There can be no assurance that any patents, if issued, will be held valid by a court of competent jurisdiction. An adverse outcome could subject us to significant liabilities to third parties, require disputed rights to be licensed from third parties or require us to cease using such technology.
We believe that our patents, the protection of discoveries in connection with our development activities, our proprietary products, technologies, processes and know-how and all of our intellectual property are important to our business. Many of our products, including certain of our generic products, are sold under trademarks. To achieve a competitive position, we rely on trade secrets, non-patented proprietary know-how and continuing technological innovation, where patent protection is not believed to be appropriate or attainable. In addition, as outlined above, we have a number of patent licenses from third parties, some of which may be important to our business. See Note 11. License and Collaboration Agreements in the Consolidated Financial Statements, included in Part IV, Item 15 of this report "Exhibits, Financial Statement Schedules". There can be no assurance that any of our patents, licenses or other intellectual property rights will afford us any protection from competition.
We rely on confidentiality agreements with our employees, consultants and other parties to protect, among other things, trade secrets and other proprietary technology. There can be no assurance that these agreements will not be breached, that we will have adequate remedies for any breach, that others will not independently develop equivalent proprietary information or that other third parties will not otherwise gain access to our trade secrets and other intellectual property.
9
We may find it necessary to initiate litigation to enforce our patent rights, to protect our intellectual property or trade secrets or to determine the scope and validity of the proprietary rights of others. Litigation is costly and time-consuming, and there can be no assurance that our litigation expenses will not be significant in the future or that we will prevail in any such litigation. See Note 14. Commitments and Contingencies in the Consolidated Financial Statements, included in Part IV, Item 15 of this report "Exhibits, Financial Statement Schedules".
Governmental Regulation
United States Food and Drug Administration and Drug Enforcement Administration
The pharmaceutical industry in the U.S. is subject to extensive and rigorous government regulation. The Federal Food, Drug, and Cosmetic Act (FFDCA), the Controlled Substances Act (CSA) and other federal and state statutes and regulations govern or influence the testing, manufacturing, packaging, labeling, storage, record keeping, approval, advertising, promotion, sale and distribution of pharmaceutical products. Noncompliance with applicable requirements can result in fines, recall or seizure of products, total or partial suspension of production and/or distribution, injunctions, refusal of the government to enter into supply contracts or to approve NDAs, ANDAs and Biologics License Applications (BLAs), civil penalties and criminal prosecution.
FDA approval is typically required before any new drug can be marketed. An NDA or BLA is a filing submitted to the FDA to obtain approval of new chemical entities and other innovations for which thorough applied research is required to demonstrate safety and effectiveness in use. The process generally involves:
• | Completion of preclinical laboratory and animal testing and formulation studies in compliance with the FDA’s Good Laboratory Practice (GLP) regulations; |
• | Submission to the FDA of an Investigational New Drug (IND) application for human clinical testing, which must become effective before human clinical trials may begin in the U.S.; |
• | Approval by an independent institutional review board (IRB) before each trial may be initiated, and continuing review during the trial; |
• | Performance of human clinical trials, including adequate and well-controlled clinical trials in accordance with good clinical practices (GCPs) to establish the safety and efficacy of the proposed drug product for each intended use; |
• | Submission of an NDA or BLA to the FDA; |
• | Satisfactory completion of an FDA pre-approval inspection of the product’s manufacturing processes and facility or facilities to assess compliance with the FDA’s current Good Manufacturing Practice (cGMP) regulations, and/or review of the Chemistry, Manufacturing and Controls (CMC) section of the NDA or BLA to require that the facilities, methods and controls are adequate to preserve the drug’s identity, strength, quality, purity and potency; |
• | Satisfactory completion of an FDA advisory committee review, if applicable; and |
• | Approval by the FDA of the NDA or BLA. |
Clinical trials are typically conducted in three sequential phases, although the phases may overlap.
• | Phase 1 trials generally involve testing the product for safety, adverse effects, dosage, tolerance, absorption, distribution, metabolism, excretion and other elements of clinical pharmacology. |
• | Phase 2 trials typically involve a small sample of the intended patient population to assess the efficacy of the compound for a specific indication, to determine dose tolerance and the optimal dose range as well as to gather additional information relating to safety and potential adverse effects. |
• | Phase 3 trials are undertaken in an expanded patient population at typically dispersed study sites, in order to determine the overall risk-benefit ratio of the compound and to provide an adequate basis for product labeling. |
Each trial is conducted in accordance with certain standards under protocols that detail the objectives of the study, the parameters to be used to monitor safety and efficacy criteria to be evaluated. Each protocol must be submitted to the FDA as part of the IND.
Data from preclinical testing and clinical trials are submitted to the FDA in an NDA or BLA for marketing approval and to foreign government health authorities in a marketing authorization application, consistent with each health authority’s specific regulatory requirements. Clinical trials are also subject to regulatory inspections by the FDA and other regulatory authorities to confirm compliance with applicable regulatory standards. The process of completing clinical trials for a new drug may take many years and require the expenditures of substantial resources. See Item 1A. Risk Factors - “The pharmaceutical industry is heavily regulated, which creates uncertainty about our ability to bring new products to market and imposes substantial compliance costs on our business” for further discussion on FDA approval. As a condition of approval, the FDA or foreign regulatory authorities may require further studies, including Phase 4 post-marketing studies or post-marketing data reporting. Results of post-marketing programs may limit or expand the further marketing of the products.
10
For some drugs, the FDA may require a Risk Evaluation and Mitigation Strategy (REMS) to confirm a drug’s benefits outweigh its risks. REMS could include medication guides, physician communication plans or other elements. See Item 1A. Risk Factors - “The pharmaceutical industry is heavily regulated, which creates uncertainty about our ability to bring new products to market and imposes substantial compliance costs on our business” for further discussion, including examples of products sold by us that have been impacted by REMS.
In most instances, FDA approval of an ANDA is required before a generic equivalent of an existing or reference-listed drug can be marketed. The ANDA process is abbreviated in that the FDA waives the requirement of conducting complete preclinical and clinical studies and generally instead relies principally on bioequivalence studies. Bioequivalence generally involves a comparison of the rate of absorption and levels of concentration of a generic drug in the body with those of the previously approved drug. When the rate and extent of absorption of systemically acting test and reference drugs are considered the same under the bioequivalence requirement, the two drugs are considered bioequivalent and are generally regarded as therapeutically equivalent, meaning that a pharmacist can substitute the product for the reference-listed drug. Under certain circumstances, an ANDA may also be submitted for a product authorized by approval of an ANDA suitability petition. Such petitions may be submitted to secure authorization to file an ANDA for a product that differs from a previously approved drug in active ingredient, route of administration, dosage form or strength. In September 2007 and July 2012, Congress re-authorized pediatric testing legislation, which now requires ANDAs approved via the suitability petition route to conduct pediatric testing. The timing of final FDA approval of ANDA applications depends on a variety of factors, including whether the applicant challenges any listed patents for the drug and whether the manufacturer of the reference listed drug is entitled to one or more statutory exclusivity periods, during which the FDA is prohibited from approving generic products. In certain circumstances, a regulatory exclusivity period can extend beyond the life of a patent, and thus block ANDAs from being approved until after the patent expiration date.
Certain of our products are or could become regulated and marketed as biologic products pursuant to BLAs. Our BLA-licensed products were licensed based on a determination by the FDA of safety, purity and potency as required under the Public Health Service Act (PHSA). Although the ANDA framework referenced above does not apply to generics of BLA-licensed biologics, there is an abbreviated licensure pathway for products deemed to be biosimilar to, or interchangeable with, FDA-licensed reference biological products pursuant to the Biologics Price Competition and Innovation Act of 2009 (BPCIA). Under the BPCIA, following the expiration of a 12-year reference exclusivity period, the FDA may license, under section 351(k) of the PHSA, a biologic that it determines is biosimilar to, or interchangeable with, a reference product licensed under section 351(a) of the PHSA. Biosimilarity is defined to mean that the section 351(k) product is highly similar to the reference product, notwithstanding minor differences in clinically inactive components, and that there are no clinically meaningful differences between the section 351(k) product and the reference product in terms of the safety, purity and potency. To be considered interchangeable, a product must be biosimilar to the reference product, be expected to produce the same clinical result as the reference product in any given patient and, if administered more than once to an individual, the risks in terms of safety or diminished efficacy of alternating or switching between use of the product and its reference product is not greater than the risk of using the reference product without such alternation or switch.
Once any regulatory exclusivity period for our BLA-licensed biologics expires, the FDA may approve another company’s BLA for a biosimilar or interchangeable version of our product. Although licensure of a biosimilar or interchangeable product is generally expected to require less than the full complement of product-specific preclinical and clinical data required for innovator products, the FDA has considerable discretion over the kind and amount of scientific evidence required to demonstrate biosimilarity and interchangeability.
Based on scientific developments, post-market experience or other legislative or regulatory changes, the current FDA standards of review for approving new pharmaceutical products are sometimes more stringent than those that were applied in the past, including for certain opioid products. As a result, the FDA does not have safety databases on these products that are as extensive as some products developed more recently. Accordingly, we believe the FDA has expressed an intention to develop such databases for certain of these products, including many opioids.
The 21st Century Cures Act (Cures Act) was signed into law on December 13, 2016. The Cures Act includes various provisions to accelerate the development and delivery of new treatments, such as those intended to expand the types of evidence manufacturers may submit to support FDA drug approval, to encourage patient-centered drug development, to liberalize the communication of healthcare economic information (HCEI) to payers and to create greater transparency with regard to manufacturer expanded access programs. Central to the Cures Act are provisions that enhance and accelerate the FDA’s processes for reviewing and approving new drugs and supplements to approved NDAs. These include, but are not limited to, provisions that (i) require the FDA to establish a program to evaluate the potential use of real world evidence to help to support the approval of a new indication for an approved drug and to help to support or satisfy post-approval study requirements, (ii) provide that the FDA may rely upon qualified data summaries to support the approval of a supplemental application with respect to a qualified indication for an already approved drug, (iii) require the FDA to issue guidance for purposes of assisting sponsors in incorporating complex adaptive and other novel trial designs into proposed clinical protocols and applications for new drugs and (iv) require the FDA to establish a process for the qualification of drug development tools for use in supporting or obtaining FDA approval for or investigational use of a drug.
11
The Cures Act also includes $1 billion in new funding to address what the act refers to as the “opioid abuse crisis.” Specifically, the Cures Act authorizes the awarding of grants to states for the purpose of addressing opioid abuse within each state, with preference to be given to states with an incidence or prevalence of opioid use disorders that is substantially higher relative to other states. Funding would be provided for states to supplement opioid abuse prevention and treatment activities, such as improving prescription drug monitoring programs, implementing prevention activities, providing training for health care providers and expanding access to opioid treatment programs. States receiving such grants would be required to report on activities funded by the grant in the substance abuse block grant report.
We cannot determine what effect changes in the FDA’s laws or regulations (including legal or regulator interpretations), when and if promulgated, or upcoming advisory committee meetings may have on our business in the future. Changes could, among other things, require expanded or different labeling, additional testing, the recall or discontinuance of certain products and additional record keeping. Such changes could have a material adverse effect on our business, financial condition, results of operations and cash flows. See Item 1A. Risk Factors - “The pharmaceutical industry is heavily regulated, which creates uncertainty about our ability to bring new products to market and imposes substantial compliance costs on our business” for further discussion.
In September 2013, the FDA announced class-wide safety labeling changes and new post-market study requirements for all extended-release and long-acting (ER/LA) opioids. Among other things, the updated indication states that, because of the risks of addiction, abuse and misuse, even at recommended doses, and because of the greater risks of overdose and death, these drugs should be reserved for use in patients for whom alternative treatment options are ineffective, not tolerated or would be otherwise inadequate to provide sufficient management of pain; ER/LA opioid analgesics are not indicated for as-needed pain relief. The FDA is also requiring drug companies that make these products to conduct further studies and clinical trials to further assess the known serious risks of misuse, abuse, increased sensitivity to pain (hyperalgesia), addiction, overdose and death. It is not presently known what impact, if any, these changes to the indications for use or results from the post-marketing studies may have on our business, financial position, results of operations and cash flows.
A sponsor of an NDA is required to identify, in its application, any patent that claims the drug or a use of the drug subject to the application. Upon NDA approval, the FDA lists these patents in a publication referred to as the Orange Book. Any person that files an NDA under Section 505(b)(2) of the FFDCA must make a certification in respect to listed patents, the type of NDA that may rely upon the data in the application for which the patents are listed or an ANDA to secure approval of a generic version of this first, or listed drug. The FDA may not approve such an application for the drug until expiration of the listed patents unless (i) the generic applicant certifies that the listed patents are invalid, unenforceable or not infringed by the proposed generic drug and gives notice to the holder of the NDA for the listed drug of the basis upon which the patents are challenged and (ii) the holder of the listed drug does not sue the later applicant for patent infringement within 45 days of receipt of notice. Under the current law, if an infringement suit is filed, the FDA may not approve the later application until the earliest of: (i) 30 months after submission, (ii) entry of an appellate court judgment holding the patent invalid, unenforceable or not infringed, (iii) such time as the court may order or (iv) expiration of the patent.
One of the key motivators for challenging patents is the 180-day marketing exclusivity period granted to the developer of a generic version of a product that is the first to have its ANDA accepted for filing by the FDA and whose filing includes a certification that the applicable patent(s) are invalid, unenforceable and/or not infringed (a Paragraph IV certification) and that otherwise does not forfeit eligibility for the exclusivity. Under the Medicare Prescription Drug, Improvement, and Modernization Act of 2003 (2003 Medicare Act), with accompanying amendments to the Hatch-Waxman Act (Drug Price Competition and Patent Term Restoration Act), this marketing exclusivity would begin to run upon the earlier of the commercial launch of the generic product or upon an appellate court decision in the generic company’s favor or in favor of another ANDA applicant who had filed with a Paragraph IV certification and has tentative approval. In addition, the holder of the NDA for the listed drug may be entitled to certain non-patent exclusivity during which the FDA cannot approve an application for a competing generic product or 505(b)(2) NDA product.
The FDA also regulates pharmacies and outsourcing facilities that prepare “compounded” drugs pursuant to section 503A and 503B of the FFDCA, respectively. For instance, pharmacies may compound drugs for an identified individual based on the receipt of a valid prescription order, or notation approved by the prescribing practitioner, that a compounded product is necessary for the identified patient. Similarly, outsourcing facilities may compound drugs and sell them to healthcare providers, but not wholesalers or distributors. Although section 503A pharmacies and section 503B outsourcing facilities are subject to many regulatory requirements, compounded drugs are not subject to premarket review by FDA and, therefore, may not have the same level of safety and efficacy assurances of drugs subject to premarket review and approval by the FDA. Because they are not subject to premarket review, compounded drugs are frequently lower cost than either branded or generic drug products.
The FDA enforces regulations to require that the methods used in, and the facilities and controls used for, the manufacture, processing, packing and holding of drugs conform to cGMPs. The cGMP regulations the FDA enforces are comprehensive and cover all aspects of manufacturing operations. Compliance with the regulations requires a continuous commitment of time, money and effort in all operational areas.
12
The FDA conducts pre-approval inspections of facilities engaged in the development, manufacture, processing, packing, testing and holding of the drugs subject to NDAs and ANDAs. In addition, manufacturers of both pharmaceutical products and active pharmaceutical ingredients (APIs) used to formulate the drug also ordinarily undergo a pre-approval inspection. Failure of any facility to pass a pre-approval inspection will result in delayed approval and could have a material adverse effect on our business, results of operations, financial condition and cash flows.
The FDA also conducts periodic inspections of drug facilities to assess the cGMP status of marketed products. Following such inspections, the FDA may issue an untitled letter as an initial correspondence that cites violations that do not meet the threshold of regulatory significance for a Warning Letter. FDA guidelines also provide for the issuance of Warning Letters for violations of “regulatory significance” for which the failure to adequately and promptly achieve correction may be expected to result in an enforcement action. Finally, the FDA could issue a Form 483 Notice of Inspectional Observations, which could cause us to modify certain activities identified during the inspection. If the FDA were to find serious cGMP non-compliance during such an inspection, it could take regulatory actions that could adversely affect our business, results of operations, financial condition and cash flows. Imported API and other components needed to manufacture our products could be rejected by U.S. Customs. In respect to domestic establishments, the FDA could initiate product seizures or request, or in some instances require, product recalls and seek to enjoin or otherwise limit a product’s manufacture and distribution. In certain circumstances, violations could support civil penalties and criminal prosecutions. In addition, if the FDA concludes that a company is not in compliance with cGMP requirements, sanctions may be imposed that include preventing that company from receiving the necessary licenses to export its products and classifying that company as an unacceptable supplier, thereby disqualifying that company from selling products to federal agencies.
Certain of our subsidiaries sell products that are “controlled substances” as defined in the CSA and implementing regulations, which establish certain security and record keeping requirements administered by the Drug Enforcement Administration (DEA). The DEA regulates controlled substances as Schedule I, II, III, IV or V substances, with Schedule I and II substances considered to present the highest risk of substance abuse and Schedule V substances the lowest risk. The active ingredients in some of our products are listed by the DEA as Schedule II or III substances under the CSA. Consequently, their manufacture, shipment, storage, sale and use are subject to a high degree of regulation.
The DEA limits the availability of the active ingredients that are subject to the CSA used in several of our products as well as the production of these products. We or our contract manufacturing organizations must annually apply to the DEA for procurement and production quotas in order to obtain and produce these substances. As a result, our quotas may not be sufficient to meet commercial demand or complete clinical trials. Moreover, the DEA may adjust these quotas from time to time during the year, although the DEA has substantial discretion in whether or not to make such adjustments. See Item 1A. Risk Factors - “The DEA limits the availability of the active ingredients used in many of our products as well as the production of these products, and, as a result, our procurement and production quotas may not be sufficient to meet commercial demand or complete clinical trials” for further discussion on DEA regulations. To meet its responsibilities, the DEA conducts periodic inspections of registered establishments that handle controlled substances. Annual registration is required for any facility that manufactures, tests, distributes, dispenses, imports or exports any controlled substance. The facilities must have the security, control and accounting mechanisms required by the DEA to prevent loss and diversion of controlled substances. Failure to maintain compliance can result in enforcement action that could have a material adverse effect on our business, results of operations, financial condition and cash flows. The DEA may seek civil penalties, refuse to renew necessary registrations, or initiate proceedings to revoke or restrict those registrations. In certain circumstances, violations could result in criminal proceedings.
Individual states also regulate controlled substances and we, as well as our third-party API suppliers and manufacturers, are subject to such regulation by several states with respect to the manufacture and distribution of these products.
Government Benefit Programs
As described further in Item 1A. Risk Factors, statutory and regulatory requirements for government healthcare programs such as Medicaid, Medicare and TRICARE govern access and provider reimbursement levels, and provide for other cost-containment measures such as requiring pharmaceutical companies to pay rebates or refunds for certain sales of products reimbursed by such programs, or subjecting sales of their products to certain price ceilings. In addition to the cost-containment measures described in Item 1A. Risk Factors, drug sales to retail pharmacies under the TRICARE Retail Pharmacy Program are subject to certain price ceilings which require manufacturers to, among other things, pay refunds for prescriptions filled based on the applicable ceiling price limits. Beginning in the first quarter of 2017, pursuant to the Bipartisan Budget Act of 2015, drug manufacturers are required to pay additional rebates to state Medicaid programs if the prices of their non-innovator drugs rise at a rate faster than inflation (as continues to be the case for innovator products).
13
The federal government may continue to pursue legislation aimed at containing or reducing payment levels for prescription pharmaceuticals paid for in whole or in part with government funds. As is the case in California and Nevada, the state governments also may continue to enact similar cost containment or transparency legislation. We cannot predict the nature of these or other such measures or their impact on our profitability and cash flows. These efforts could, however, have material consequences for the pharmaceutical industry and the Company.
From time to time, legislative changes are made to government healthcare programs that impact our business. Congress continues to examine various Medicare and Medicaid policy proposals that may result in a downward pressure on the prices of prescription drugs in these programs. See Item 1A. Risk Factors - “The availability of third party reimbursement for our products is uncertain, and thus we may find it difficult to maintain current price levels. Additionally, the market may not accept those products for which third party reimbursement is not adequately provided” for further discussion on Medicare and Medicaid reimbursements.
Under the Patient Protection and Affordable Care Act (PPACA), pharmaceutical manufacturers of branded prescription drugs must pay an annual fee to the federal government. Each individual pharmaceutical manufacturer must pay a prorated share of the total industry fee (the fee was $3 billion for 2016 and is $4 billion for 2017, $4.1 billion for 2018 and $2.8 billion for years thereafter) based on the dollar value of its branded prescription drug sales to specified federal programs. PPACA also expanded health insurance coverage to many previously uninsured Americans, through a combination of federal subsidies for lower-income individuals who enrolled in health plans through health insurance exchanges and enabling states to expand Medicaid eligibility with the federal government paying a high share of the cost.
Following the November 2016 U.S. elections, uncertainty continues to exist about the future of federal subsidies and of insurance coverage expansion; the current administration and congressional leaders continue to express interest in repealing these PPACA provisions and replacing them with alternatives that may be less costly and provide state Medicaid programs and private health plans more flexibility. The recent U.S. tax reform legislation enacted by Congress and signed into law by President Trump, The Tax Cuts and Jobs Act of 2017, repealed the requirement that individuals maintain health insurance coverage or face a penalty (known as the “individual mandate”). The removal of this provision, coupled with the threat of the repeal of other PPACA provisions, threaten the stability of the insurance marketplace and may have consequences for the coverage and accessibility of prescription drugs.
Healthcare Fraud and Abuse Laws
We are subject to various federal, state and local laws targeting fraud and abuse in the healthcare industry, violations of which can lead to civil and criminal penalties, including fines, imprisonment and exclusion from participation in federal healthcare programs. These laws are potentially applicable to us as both a manufacturer and a supplier of products reimbursed by federal healthcare programs, and they also apply to hospitals, physicians and other potential purchasers of our products.
The federal Anti-Kickback Statute (42 U.S.C. § 1320a-7b(b)) prohibits persons from knowingly and willfully soliciting, receiving, offering or providing remuneration, directly or indirectly, to induce either the referral of an individual, or the furnishing, recommending, or arranging for a good or service, for which payment may be made under a federal healthcare program such as the Medicare and Medicaid programs. Remuneration is not defined in the federal Anti-Kickback Statute and has been broadly interpreted to include anything of value, including for example, gifts, discounts, coupons, the furnishing of supplies or equipment, credit arrangements, payments of cash, waivers of payments, ownership interests and providing anything at less than its fair market value. Under the federal Anti-Kickback Statute and the applicable criminal healthcare fraud statutes contained within 42 U.S.C. § 1320a-7b, a person or entity need not have actual knowledge of this statute or specific intent to violate it in order to have committed a violation. In addition, the government may assert that a claim, including items or services resulting from a violation of 42 U.S.C. § 1320a-7b, constitutes a false or fraudulent claim for purposes of the civil False Claims Act (discussed below) or the civil monetary penalties statute, which imposes fines against any person who is determined to have presented or caused to be presented claims to a federal healthcare program that the person knows or should know is for an item or service that was not provided as claimed or is false or fraudulent. The federal Anti-Kickback Statute and implementing regulations provide for certain exceptions for “safe harbors” for certain discounting, rebating or personal services arrangements, among other things. However, the lack of uniform court interpretation of the Anti-Kickback Statute makes compliance with the law difficult. Violations of the federal Anti-Kickback Statute can result in significant criminal fines, exclusion from participation in Medicare and Medicaid and follow-on civil litigation, among other things, for both entities and individuals.
Other federal healthcare fraud-related laws also provide criminal liability for violations. The Criminal Healthcare Fraud statute, 18 U.S.C. § 1347 prohibits knowingly and willfully executing a scheme to defraud any healthcare benefit program, including private third-party payers. Federal criminal law at 18 U.S.C. § 1001, among other sections, prohibits knowingly and willfully falsifying, concealing or covering up a material fact or making any materially false, fictitious or fraudulent statement in connection with the delivery of or payment for healthcare benefits, items or services. See Item 1A. Risk Factors - “We are subject to various regulations pertaining to the marketing of our products and services” for further discussion on the Anti-Kickback Statute.
14
The civil False Claims Act and similar state laws impose liability on any person or entity who, among other things, knowingly presents, or causes to be presented, a false or fraudulent claim for payment by a federal healthcare program. The qui tam provisions of the False Claims Act and similar state laws allow a private individual to bring civil actions on behalf of the federal or state government and to share in any monetary recovery. The Federal Physician Payments Sunshine Act and similar state laws impose reporting requirements for various types of payments to physicians and teaching hospitals. Failure to comply with required reporting requirements under these laws could subject manufacturers and others to substantial civil money penalties. In addition, government entities and private litigants have asserted claims under state consumer protection statutes against pharmaceutical and medical device companies for alleged false or misleading statements in connection with the marketing, promotion and/or sale of pharmaceutical and medical device products, including state investigations of the Company regarding the Company’s vaginal mesh devices and investigations and litigation by certain government entities regarding the Company’s marketing of opioid products.
International Regulations
Through our international operations, the Company is subject to laws and regulations that differ from those under which the Company operates in the U.S. In most cases, non-U.S. regulatory agencies evaluate and monitor the safety, efficacy and quality of pharmaceutical products, govern the approval of clinical trials and product registrations and regulate pricing and reimbursement. Certain international markets have differing product preferences and requirements and operate in an environment of government-mandated, cost-containment programs, including price controls. Certain governments have placed restrictions on physician prescription levels and patient reimbursements, emphasized greater use of generic drugs and enacted across-the-board price cuts as methods of cost control.
Whether or not FDA approval has been obtained for a product, approval of the product by comparable regulatory authorities of other governments must be obtained prior to marketing the product in those jurisdictions. The approval process may be more or less rigorous than the U.S. process and the time required for approval may be longer or shorter than is required in the U.S.
Service Agreements
We contract with various third parties to provide certain critical services including manufacturing, supply, warehousing, distribution, customer service, certain financial functions, certain research and development activities and medical affairs.
For a complete description of our significant manufacturing, supply and other service agreements, see Note 11. License and Collaboration Agreements and Note 14. Commitments and Contingencies in the Consolidated Financial Statements, included in Part IV, Item 15 of this report "Exhibits, Financial Statement Schedules".
We primarily purchase our raw materials for the production and development of our products in the open market from third party suppliers. However, some raw materials are only available from one source. We attempt, when possible, to mitigate our raw material supply risks through inventory management and alternative sourcing strategies. We are required to identify the suppliers of all raw materials for our products in the drug applications that we file with the FDA. If the raw materials from an approved supplier for a particular product become unavailable, we would be required to qualify a substitute supplier with the FDA, which would likely interrupt manufacturing of the affected product. See Item 1A. Risk Factors for further discussion on the risks associated with the sourcing of our raw materials.
License & Collaboration Agreements and Acquisitions
We continue to seek to enhance our product line and develop a balanced portfolio of differentiated products through product acquisitions and in-licensing, or acquiring licenses to products, compounds and technologies from third parties. The Company enters into strategic alliances and collaborative arrangements with third parties, which give the Company rights to develop, manufacture, market and/or sell pharmaceutical products, the rights to which are primarily owned by these third parties. These alliances and arrangements can take many forms, including licensing arrangements, co-development and co-marketing agreements, co-promotion arrangements, research collaborations and joint ventures. Such alliances and arrangements enable us to share the risk of incurring all research and development expenses that do not lead to revenue-generating products; however, because profits from alliance products are shared with the counter-parties to the collaborative arrangement, the gross margins on alliance products are generally lower, sometimes substantially so, than the gross margins that could be achieved had the Company not opted for a development partner. For a discussion of material agreements and acquisitions, including agreement terms and status, see our disclosures in Note 5. Acquisitions and Note 11. License and Collaboration Agreements in the Consolidated Financial Statements, included in Part IV, Item 15 of this report "Exhibits, Financial Statement Schedules".
15
Environmental Matters
Our operations are subject to substantial federal, state and local environmental laws and regulations concerning, among other matters, the generation, handling, storage, transportation, treatment and disposal of, and exposure to, hazardous substances. Violation of these laws and regulations, which frequently change, can lead to substantial fines and penalties. Many of our operations require environmental permits and controls to prevent and limit pollution of the environment. We believe that our facilities and the facilities of our third party service providers are in substantial compliance with applicable environmental laws and regulations and we do not believe that future compliance will have a material adverse effect on our financial condition or results of operations.
Employees
As of February 20, 2018, we have 3,039 employees, of which 484 are engaged in research and development and regulatory work, 398 in sales and marketing, 1,087 in manufacturing, 558 in quality assurance and 512 in general and administrative capacities. Our employees are generally not represented by unions, with the exception of certain production personnel in our Rochester, Michigan manufacturing facility. We believe that our relations with our employees are good.
Executive Officers of the Registrant
The following table sets forth information as of February 27, 2018 regarding each of our current executive officers:
Name | Age | Position and Offices | ||
Paul V. Campanelli | 55 | President and Chief Executive Officer and Director | ||
Blaise Coleman | 44 | Executive Vice President, Chief Financial Officer | ||
Terrance J. Coughlin | 52 | Executive Vice President, Chief Operating Officer | ||
Tony Pera | 60 | President, Par Pharmaceutical | ||
Matthew J. Maletta | 46 | Executive Vice President, Chief Legal Officer | ||
Patrick Barry | 50 | Executive Vice President and Chief Commercial Officer | ||
Biographies
Our executive officers are briefly described below:
PAUL V. CAMPANELLI, 55, was appointed President, Chief Executive Officer and a Director effective September 23, 2016. Mr. Campanelli joined Endo in 2015 as the President of Par Pharmaceutical, leading Endo’s fully integrated U.S. Generics business, following Endo’s acquisition of Par Pharmaceutical. Prior to joining Endo, he had served as Chief Executive Officer of Par Pharmaceutical Companies, Inc. following the company’s September 2012 acquisition by TPG. Prior to the TPG acquisition, Mr. Campanelli served as Chief Operating Officer and President of Par Pharmaceutical, Inc. from 2011 to 2012. At Par Pharmaceutical Inc., Mr. Campanelli had also served as Senior Vice President, Business Development & Licensing; Executive Vice President and President of Par Pharmaceutical, Inc.; and was named a Corporate Officer by its board of directors. He also served on the board of directors of Sky Growth Holdings Corporation from 2012 until 2015. Mr. Campanelli joined Par Pharmaceutical Companies Inc. in 2001. Prior to joining Par Pharmaceutical Companies Inc., Mr. Campanelli served as Vice President, Business Development at Dr. Reddy’s Laboratories Ltd. where he was employed from 1992 to 2001. Mr. Campanelli earned his Bachelor of Science degree from Springfield College.
BLAISE COLEMAN, 44, was appointed Executive Vice President and Chief Financial Officer effective December 19, 2016. Mr. Coleman was serving as Endo's Interim Chief Financial Officer since November 22, 2016. He joined Endo in January 2015 as Vice President of Corporate Financial Planning & Analysis, and was then promoted to Senior Vice President, Global Finance Operations in November 2015. Prior to joining Endo, Mr. Coleman held a number of finance leadership roles with AstraZeneca, a global biopharmaceutical company, most recently as the Chief Financial Officer of the AstraZeneca/Bristol-Myers Squibb US Diabetes Alliance from January 2013 until January 2015. Prior to that, he was the Head of Finance for the AstraZeneca Global Medicines Development organization based in Mölndal, Sweden from September 2011 to January 2013. Mr. Coleman joined AstraZeneca as Senior Director Commercial Finance for the US Cardiovascular Business in November 2007. He joined AstraZeneca from Centocor, a wholly owned subsidiary of Johnson & Johnson, where he held positions in both the Licenses & Acquisitions and Commercial Finance organizations. Mr. Coleman’s move to Centocor in early 2003 followed 7 years’ experience with the global public accounting firm, PricewaterhouseCoopers LLP. Mr. Coleman is a Certified Public Accountant; he holds a Bachelor of Science degree in accounting from Widener University and an M.B.A. from the Fuqua School of Business at Duke University.
16
TERRANCE J. COUGHLIN, 52, was appointed Executive Vice President and Chief Operating Officer effective November 1, 2016. In this role, Mr. Coughlin has responsibility for Manufacturing and Technical Operations and R&D across the enterprise. Most recently, Mr. Coughlin served as Vice President, Operations of Par Pharmaceutical Companies, Inc., a subsidiary of Endo. Prior to Endo’s acquisition of Par in September 2015, Mr. Coughlin was the Chief Operating Officer of Par Pharmaceutical Companies, Inc. Prior to joining Par, Mr. Coughlin held a number of leadership roles with Glenmark Generics, Inc. USA/Glenmark Generics Limited latterly as the President and Chief Executive Officer of Glenmark Generics, Inc. USA/Glenmark Generics Limited. Prior to this, Mr. Coughlin had the overall responsibility for Glenmark’s North American, Western European and Eastern European generics businesses, as well as its global active pharmaceutical ingredient business and generics operations in India. Prior to joining Glenmark, Mr. Coughlin served as Senior Vice President at Dr. Reddy’s Laboratories, Inc. Mr. Coughlin began his career in 1988 with Wyckoff Chemical Company, Inc. Mr. Coughlin earned a B.S. in chemistry from Central Michigan University.
TONY PERA, 60, was named President, Par Pharmaceutical effective November 1, 2016. In this role, Mr. Pera leads Endo’s U.S. Generics business including responsibility and oversight of Par Generic and Par Sterile sales teams, as well as Par’s marketing & business analytics group. Most recently, Mr. Pera served as Chief Commercial Officer of Par Pharmaceutical. He joined Par in February 2014 as part of Par’s acquisition of JHP Pharmaceutical, where he held a similar position. As Chief Commercial Officer, Mr. Pera was responsible for all sales, marketing, pricing and customer operations functions for Par. Prior to JHP and Par, Mr. Pera was Senior Vice President of Supply Chain Management for AmerisourceBergen (ABC), a major U.S. pharmaceutical wholesaler, for approximately five years. Prior to ABC, he held numerous senior leadership positions with generic drug companies including APP (now Fresenius Kabi), Bedford Laboratories and LyphoMed. Mr. Pera started his career as a sales representative for the parenteral products division of Baxter. Mr. Pera holds a B.S. in Business Administration from the University of Illinois in Champaign and an M.B.A. from DePaul University.
MATTHEW J. MALETTA, 46, was appointed Executive Vice President, Chief Legal Officer effective May 4, 2015. Prior to joining Endo, Mr. Maletta served as Vice President, Associate General Counsel and Corporate Secretary of Allergan, Inc. In this position, he served as an advisor to the CEO and Board of Directors and supervised several large M&A transactions and takeover defense activities, including Allergan’s acquisition of Inamed and Actavis’ acquisition of Allergan. Mr. Maletta first joined Allergan in 2002 as Corporate Counsel and Assistant Secretary and during his tenure, held various roles of increased responsibility. Prior to joining Allergan, Mr. Maletta was in private practice, focusing on general corporate matters, finance, governance, securities and transactions. He holds a B.A. degree in political science from the University of Minnesota, summa cum laude, and a J.D. degree, cum laude, from the University of Minnesota Law School.
PATRICK BARRY, 50, was appointed Executive Vice President and Chief Commercial Officer effective February 26, 2018. In this role, he has responsibility for all commercial activities for U.S. Branded Pharmaceuticals, including strategy, new product planning, marketing, sales as well as managed care and patient access responsibilities. Mr. Barry joined Endo in December 2016 as Senior Vice President, U.S. Branded Pharmaceuticals. Prior to joining Endo, Mr. Barry worked at Sanofi S.A. from April 1992 until December 2016, holding roles of increasing responsibility in areas such as Sales Leadership, Commercial Operations, Marketing, Launch Planning and Training and Leadership Development. Most recently, he served at Sanofi S.A. as its General Manager and Head of North America General Medicines starting in September 2015 and as Vice President and Head of U.S. Specialty from April 2014 until August 2015. During this time, Mr. Barry oversaw three complex and diverse businesses with responsibility for leading sales and marketing activities for branded and generic products across the U.S. and Canada. He has a diverse therapeutic experience including aesthetics and dermatology, oncology, urology, orthopedics and medical device and surgical experience. He has an M.B.A. from Cornell University, Johnson School of Management and a B.A. in Public Relations and Marketing from McKendree University.
We have employment agreements with each of our executive officers.
Available Information
Our internet address is www.endo.com. The contents of our website are not part of this Annual Report on Form 10-K, and our internet address is included in this document as an inactive textual reference only. We make our Annual Reports on Form 10-K, Quarterly Reports on Form 10-Q, Current Reports on Form 8-K and all amendments to those reports available free of charge on our website as soon as reasonably practicable after we file such reports with, or furnish such reports to, the Securities and Exchange Commission.
You may also read and copy any materials we file with the SEC at the SEC’s Public Reference Room that is located at 100 F Street, N.E., Room 1580, Washington, DC 20549. Information about the operation of the Public Reference Room can be obtained by calling the SEC at 1-800-SEC-0330 or 1-202-551-8090. You can also access our filings through the SEC’s internet site: www.sec.gov (intended to be an inactive textual reference only).
You may also access copies of the Company’s filings with the Canadian Securities Administrators on SEDAR through their internet site: www.sedar.com (intended to be an inactive textual reference only).
17
Item 1A. Risk Factors
We operate in a highly competitive industry.
The pharmaceutical industry is intensely competitive and we face competition in both our domestic and international branded and generic pharmaceutical business. In addition to product development and technological innovation, safety, efficacy, commercialization, marketing and promotion, other competitive factors include product quality and price, cost-effectiveness, reputation, service and patient convenience and access to scientific and technical information. Many of our competitors, including Teva, Mylan N.V., Sandoz (a division of Novartis AG), Impax, Allergan, Purdue, Jazz, Shire, Horizon and Mallinckrodt, among others, and any future companies that may enter the industry or modify their existing products to compete directly with our products, may have greater resources than we do and we cannot predict with certainty the timing or impact of competitors’ products and commercialization strategies. Furthermore, recent trends in this industry are toward further market consolidation of large drug companies into a smaller number of very large entities, further concentrating financial, technical and market strength and increasing competitive pressure in the industry. It is possible that our competitors may make greater research and development investments and have more efficient or superior processes and systems and more experience in the development of new products that permit our competitors to respond more quickly to new or emerging technologies and changes in customer requirements which may make our products or technologies uncompetitive or obsolete. Furthermore, academic institutions, government agencies and other public and private organizations conducting research may seek patent protection and may establish collaborative arrangements for competitive products or programs. If we fail to compete successfully, our business, results of operations, financial condition and cash flows could be materially adversely affected.
Our branded products face competition from generic versions. Such versions are generally significantly cheaper than branded versions and, where available, may be required or encouraged in place of the branded version under third-party reimbursement programs, or substituted by pharmacies for branded versions by law. The entrance of such competition to our branded products generally reduces our market share and adversely affects our profitability and cash flows. Further, certain Asian and other overseas generic competitors may be able to produce products at costs lower than the costs of domestic manufacturers. If we experience substantial competition from Asian or other overseas generic competitors with lower production costs, our profit margins will suffer. In addition, certain of our branded products are not protected by patent rights or have limited patent life and will soon lose patent protection. Loss of patent protection for a branded product typically is followed promptly by generic substitutes. As a result, sales of many of these branded products may decline or stop growing over time. Generic competition with our branded products has had and will continue to have a material adverse effect on the market share, net sales and profitability of our branded products. In addition, legislative proposals emerge from time to time in various jurisdictions to further encourage the early and rapid approval of generic drugs. Any such proposal that is enacted into law could increase competition and worsen this negative effect on our sales and profitability.
In addition, our generics business faces competition from brand-name pharmaceutical companies, which have taken aggressive steps to thwart or delay competition from generic equivalents of their brand-name products, including bringing litigation alleging patent infringement or other violation of intellectual property rights. The actions taken by competing brand name pharmaceutical companies may increase the costs and risks associated with our efforts to introduce generic products and may delay or prevent such introduction altogether. For example, if a brand-name pharmaceutical company’s patent was held to be valid and infringed by our generic products in a particular jurisdiction, we would be required to either obtain a license from the patent holder or cease the manufacture and sale of such generic product.
Our sales may also suffer as a result of changes in consumer demand for our products, including those related to fluctuations in consumer buying patterns tied to seasonality or the introduction of new products by competitors, which could have a material adverse effect on our business, results of operations, financial conditions and cash flows. Additionally, a significant portion of our revenue from our branded business is derived from a limited number of products. The sale of our products can be significantly influenced by market conditions and regulatory actions. We may experience decreases in the sale of our products in the future as a result of actions taken by our competitors, such as price reductions, or as a result of regulatory actions related to our products or to competing products. A decline in the sales value of these products could have a material adverse effect on our business, results of operations, financial condition and cash flows.
If generic manufacturers use litigation and regulatory means to obtain approval for generic versions of our branded drugs, our sales may suffer.
Under the Hatch-Waxman Act, the U.S. Food and Drug Administration (FDA) can approve an Abbreviated New Drug Application (ANDA) for a generic bioequivalent version of a previously approved drug, without requiring the ANDA applicant to undertake the full clinical testing necessary to obtain approval to market a new drug. In place of such clinical studies, an ANDA applicant usually needs only to submit data demonstrating that its generic product is bioequivalent to the branded product.
18
Various generic manufacturers have filed ANDAs seeking FDA approval for generic versions of certain of our key pharmaceutical products, including but not limited to LIDODERM® and AVEED®. In connection with such filings, these manufacturers have challenged the validity and/or enforceability of one or more of the underlying patents protecting our products. In the case of LIDODERM®, we no longer have patent protection in the markets where we sell these products. Our revenues from LIDODERM® have been negatively affected by Actavis’s September 2013 launch and Mylan’s August 2015 launch of their lidocaine patch 5%, generic versions of LIDODERM®, and we anticipate that these revenues could decrease further should one or more additional generic versions launch. We also believe it is likely that generic manufacturers may file ANDAs in the future seeking FDA approval or may use other means to seek FDA approval for generic versions of other of our key pharmaceutical products. With respect to AVEED® and other branded pharmaceutical products, it has been and continues to be our practice to vigorously defend and pursue all available legal and regulatory avenues in defense of the intellectual property rights protecting our products. Despite our efforts to defend our products, litigation is inherently uncertain, and we cannot predict the timing or outcome of our efforts. If we are not successful in defending our intellectual property rights or opt to settle, or if a product’s marketing exclusivity rights expire or become otherwise unenforceable, our competitors could ultimately launch generic versions of our products, which would likely cause sales and revenues of the affected products to decline rapidly and materially, could require us to write off a portion or all of the intangible assets associated with the affected product and could have a material adverse effect on our business, results of operations, financial condition and cash flows as well as our share price. For a description of the material related legal proceedings, see Note 14. Commitments and Contingencies in the Consolidated Financial Statements, included in Part IV, Item 15 of this report "Exhibits, Financial Statement Schedules". As a result, there are currently ongoing legal proceedings brought by us and/or our subsidiaries, and in certain cases our third party partners, against manufacturers seeking FDA approval for generic versions of our products.
If pharmacies or outsourcing facilities produce compounded versions of our products, our sales may suffer.
Under section 503A of the FFDCA, licensed pharmacies may sell compounded versions of prescription drugs that have been prepared for individual patients based on the receipt of a valid prescription order or notation. Similarly, under section 503B of the FFDCA, outsourcing facilities may sell compounded versions of prescription drugs to healthcare providers. In January 2017, FDA revised its policy to allow outsourcing facilities to “nominate” bulk drug substances that can be used to prepare compounded drugs under section 503B, although that policy is the subject of a pending legal challenge by us. Compounded drugs do not typically require the same R&D investments as either branded or generic drugs and, therefore, can compete more favorably on price with both branded and generic versions of a drug. To the extent that pharmacies or outsourcing facilities introduce compounded versions of our products, our market share could be reduced and our profitability and cash flows could be adversely affected.
If we fail to successfully identify and develop additional generic pharmaceutical products, obtain exclusive marketing rights for our generic products or fail to introduce these generic products on a timely basis, our revenues, gross margin and operating results may decline.
We may not be successful in our efforts to continue to create a pipeline of product candidates or develop commercially successful products. Identifying, developing and obtaining regulatory approval and commercializing additional product candidates is prone to risks of failure inherent in drug development. For example, our research programs may initially show promise in identifying potential additional product candidates, yet fail to yield results for a number of reasons, including, among others, that the research methodology used may not be successful in identifying potential additional product candidates. No assurance can be given that we will be able to successfully identify additional product candidates, advance any of these additional product candidates through the development process or successfully commercialize any such additional product candidates. If we are unable to successfully identify, develop and commercialize additional product candidates, our revenues and operating results may decline significantly and our prospects and business may be materially adversely affected.
19
Even if we are able to identify and develop additional product candidates, we may fail to obtain exclusive marketing rights for such product candidates or fail to introduce such product candidates on a timely basis. Subject to certain exceptions and limitations, the Hatch-Waxman amendments to the FFDCA provide for a period of 180 days of marketing exclusivity for a generic version of a previously approved drug for any applicant that is the first to file an ANDA containing a certification of invalidity, non-infringement or unenforceability related to a patent listed with respect to the corresponding brand-name drug (commonly referred to as a “Paragraph IV certification”). A large portion of our revenues for our U.S. Generic Pharmaceuticals segment have been derived from the sales of generic drugs during such 180-day marketing exclusivity period permitted under the Hatch-Waxman Act and from the sale of other generic products for which there otherwise is limited competition. ANDAs that contain Paragraph IV certifications challenging patents, however, generally become the subject of patent litigation that can be both lengthy and costly. There is no certainty that we will prevail in any such litigation, that we will be the first-to-file and be granted the 180-day marketing exclusivity period, or, if we are granted the 180-day marketing exclusivity period, that we will not forfeit such period. Even where we are awarded marketing exclusivity, we may be required to share our exclusivity period with other ANDA applicants who submit Paragraph IV certifications. In addition, brand-name pharmaceutical companies often authorize a generic version of the corresponding brand-name drug to be sold during any period of marketing exclusivity that is awarded. Authorized generics are not prohibited from sale during the 180-day marketing exclusivity period. Furthermore, timely commencement of the litigation by the patent owner imposes an automatic stay of ANDA approval by the FDA for 30 months, unless the case is decided in the ANDA applicant’s favor during that period. Finally, if the court decision is adverse to the ANDA applicant, the ANDA approval will be delayed until the challenged patent expires, and the applicant will not be granted 180 days of marketing exclusivity.
The future profitability of our U.S. Generic Pharmaceuticals segment depends, to a significant extent, upon our ability to introduce, on a timely basis, new generic products that are either the first-to-market (or among the first-to-market) or that otherwise can gain significant market share during the 180-day marketing period as permitted by the Hatch-Waxman Act. Our ability to timely bring our products to market is dependent upon, among other things, the timing of regulatory approval of our products, which to a large extent is outside of our control, as well as the timing of competing products. Our revenues and future profitability are dependent, in large part, upon our ability or the ability of our development partners to file, timely and effectively, ANDAs with the FDA or to enter into contractual relationships with other parties that have obtained marketing exclusivity. No assurances can be given that we will be able to develop and introduce commercially successful products in the future within the time constraints necessary to be successful. If we or our development partners are unable to continue to timely and effectively file ANDAs with the FDA or to partner with other parties that have obtained marketing exclusivity, our revenues and operating results may decline significantly and our prospects and business may be materially adversely affected.
We have been, continue to be and may be the subject of product liability claims, other significant litigation matters, government investigations or product recalls for which we may be unable to obtain or maintain insurance adequate to cover potential liabilities.
Our business exposes us to significant potential risk from product liability claims, other significant litigation matters, government investigations or product recalls, including, but not limited to, such matters associated with the testing, manufacturing, marketing and sale of our products. We have been, continue to be and may be subject to various product liability cases, other significant litigations and government investigations. For example, we, along with other manufacturers of prescription opioid medications, are the subject of lawsuits and have received subpoenas and other requests for information from various state and local government agencies regarding the sales and marketing of opioid medications. In addition to direct expenditures for damages, settlement and defense costs, there is a possibility of adverse publicity, loss of revenues and disruption of business as a result of product liability claims or other litigation matters. Some plaintiffs have received substantial damage awards in some jurisdictions against pharmaceutical and/or medical device companies based upon claims for injuries allegedly caused by the use of their products. In addition, in the age of social media, plaintiffs’ attorneys have a wide variety of tools to advertise their services and solicit new clients for litigation, including using judgments obtained in litigation against other pharmaceutical companies as an advertising tool. For these or other reasons, any significant product liability or mass tort litigation in which we are a defendant could have a larger number of plaintiffs than such actions have seen historically and we could also see an increase in number of cases filed against us because of the increasing use of widespread and media-varied advertising. Furthermore, a ruling against other pharmaceutical companies in product liability or mass tort litigation in which we are not a defendant could have a negative impact on pending litigation where we are a defendant. In addition, it may be necessary for us to voluntarily or mandatorily recall or withdraw products that do not meet approved specifications or which subsequent data demonstrate may be unsafe or ineffective or misused. Any such recall or withdrawal could result in adverse publicity, costs connected to the recall and loss of revenue. Adverse publicity could also result in an increased number of additional product liability claims, whether or not these claims have a basis in scientific fact. If we are found liable on a product liability claim or series of claims, including those described below, or in connection with other litigation matters, including those related to sales, marketing or pricing practices, government investigations or product recalls, or if we incur significant expenses in defense thereof, defaults could occur and be declared under our debt agreements, we could suffer substantial costs, reputational damage and/or restrictions on our product use, and we could incur losses, any of which could materially and adversely impact our business, financial condition, results of operations and cash flows and/or the price of our ordinary shares.
20
Our pharmaceutical and medical device products may cause, or may appear to cause, serious adverse side effects or potentially dangerous drug interactions if misused, improperly prescribed or subject to faulty surgical technique. For example, we and/or certain of our subsidiaries have been named as defendants in multiple lawsuits in various federal and state courts alleging personal injury resulting from use of transvaginal surgical mesh products designed to treat pelvic organ prolapse and stress urinary incontinence. For more information regarding this litigation, see Note 14. Commitments and Contingencies in the Consolidated Financial Statements, included in Part IV, Item 15 of this report "Exhibits, Financial Statement Schedules".
We may be unable to obtain or maintain product liability insurance in the future on acceptable terms or with adequate coverage against potential liabilities or other losses such as the cost of a recall if any claim is brought against us, regardless of the success or failure of the claim. For example, we generally no longer have product liability insurance to cover the claims in connection with the mesh-related litigation described above. Additionally, we may be limited by the surviving insurance policies of our acquired subsidiaries, which may not be adequate to cover against potential liabilities or other losses. The failure to generate sufficient cash flow or to obtain other financing could affect our ability to pay the amounts due under those liabilities not covered by insurance. See Note 14. Commitments and Contingencies in the Consolidated Financial Statements, included in Part IV, Item 15 of this report "Exhibits, Financial Statement Schedules" for further discussion of our product liability claims.
Our ability to protect and maintain our proprietary and licensed third party technology, which is vital to our business, is uncertain.
Our success, competitive position and future income will depend in part on our ability to obtain and protect patent rights relating to our current and future technologies, processes and products. Our policy is to seek patent protection for technologies, processes and products we own and to enforce the intellectual property rights we own and license. The patent applications we submit and have submitted may not result in patents being issued. If an invention qualifies as a joint invention, the joint inventor may have intellectual property rights in the invention, which it might not protect. A third party may infringe upon, design around or develop uses not covered by any patent issued or licensed to us and our patents may not otherwise be commercially viable. In this regard, the patent position of pharmaceutical compounds and compositions is particularly uncertain. Even issued patents may later be modified or revoked by the PTO, by analogous foreign offices or in legal proceedings. Laws relating to such rights may in the future also be changed or withdrawn. Upon the expiration or loss of necessary intellectual property protection for a product, others may manufacture and distribute such patented product, which will result in the loss of a significant portion of our sales of that product.
In addition, our success, particularly in our branded businesses, depends in part on the ability of our partners and suppliers to obtain, maintain and enforce patents, and protect trademarks, trade secrets, know-how and other intellectual property and proprietary information. Our ability to commercialize any branded product successfully will largely depend upon our and/or our partners’ or suppliers’ ability to obtain and maintain patents and trademarks of sufficient scope to lawfully prevent third-parties from developing and/or marketing infringing products.
The degree of protection any patents will afford is uncertain, including whether the protection obtained will be of sufficient breadth and degree to protect our commercial interests in all the countries where we conduct business. These patent rights may also be challenged, revoked, invalidated, infringed or circumvented by third parties. It is possible that we could incur significant costs and management distraction if we are required to initiate litigation against others to protect or enforce our intellectual property rights. Such patent disputes may be lengthy and a potential violator of our patents may bring a potentially infringing product to market during the dispute, subjecting us to competition and damages due to infringement of the competitor product.
Furthermore, our products may infringe on the patents or other intellectual property rights held by third parties. It is also possible that third parties will obtain patent or other proprietary rights that might be necessary or useful for the development, manufacture or sale of our products. If we infringe on the intellectual property rights of others, we could lose our right to develop, manufacture or sell products or we could be required to pay monetary damages or royalties to license proprietary rights from third parties and we may not be able to obtain such licenses on commercially reasonable terms or at all. An adverse determination in a judicial or administrative proceeding or a failure to obtain necessary licenses could prevent us from manufacturing or selling our products.
21
The Company also relies on trade secrets and other unpatented proprietary information, which it generally seeks to protect by confidentiality and nondisclosure agreements with its employees, consultants, advisors and partners. These agreements may not effectively prevent disclosure of confidential information and may not provide the Company with an adequate remedy in the event of unauthorized disclosure. For example, in August 2017, we filed a complaint against QuVa Pharma, Inc. and certain individual defendants in the U.S. District Court for the District of New Jersey alleging misappropriation in violation of the federal Defend Trade Secrets Act, New Jersey’s Trade Secrets Act and New Jersey common law, as well as unfair competition, breach of contract, breach of fiduciary duty, breach of the duty of loyalty, tortious interference with contractual relations and breach of the duty of confidence in connection with VASOSTRICT®, a vasopressin-based cardiopulmonary drug. For more information regarding this litigation, see Note 14. Commitments and Contingencies in the Consolidated Financial Statements, included in Part IV, Item 15 of this report "Exhibits, Financial Statement Schedules". In addition, we may also not be able to discover or determine the extent of any unauthorized use of our proprietary rights, and we may not be able to prevent third parties from misappropriating or infringing upon our proprietary rights. In addition, if the Company’s employees, scientific consultants or partners develop inventions or processes that may be applicable to the Company’s products under development, such inventions and processes will not necessarily become the Company’s property, but may remain the property of those persons or their employers.
If we are unable to adequately protect our technology, trade secrets or proprietary know-how, or enforce our intellectual property rights, our results of operations, financial condition and cash flows could be materially adversely affected.
Our competitors or other third parties may allege that we are infringing their intellectual property, forcing us to expend substantial resources in litigation, the outcome of which is uncertain. Any unfavorable outcome of such litigation, including losses related to “at-risk” product launches, could have a material adverse effect on our business, financial position and results of operations.
Companies that produce branded pharmaceutical products routinely bring litigation against ANDA or similar applicants that seek regulatory approval to manufacture and market generic forms of their branded products, alleging patent infringement or other violations of intellectual property rights. Patent holders may also bring patent infringement suits against companies that are currently marketing and selling approved generic products. Litigation often involves significant expense and can delay or prevent introduction or sale of our generic products. If the patents of others are held valid, enforceable and infringed by our products, we would, unless we could obtain a license from the patent holder, need to delay selling our corresponding generic product and, if we are already selling our product, cease selling and potentially destroy existing product stock.
There may be situations in which we may make business and legal judgments to market and sell products that are subject to claims of alleged patent infringement prior to final resolution of those claims by the courts based upon our belief that such patents are invalid, unenforceable or are not infringed by our marketing and sale of such products. This is referred to in the pharmaceutical industry as an “at-risk” launch. The risk involved in an at-risk launch can be substantial because, if a patent holder ultimately prevails against us, the remedies available to such holder may include, among other things, damages calculated based on the profits lost by the patent holder, which can be significantly higher than the profits we make from selling the generic version of the product. Moreover, if a court determines that such infringement is willful, the damages could be subject to trebling. We could face substantial damages from adverse court decisions in such matters. We could also be at risk for the value of such inventory that we are unable to market or sell.
Agreements between branded pharmaceutical companies and generic pharmaceutical companies are facing increased government scrutiny and private litigation in the U.S. and abroad.
We are involved in numerous patent litigations in which generic companies challenge the validity or enforceability of our products’ listed patents and/or the applicability of these patents to the generic applicant’s products. Likewise, our U.S. Generic Pharmaceuticals segment is also involved in patent litigations in which we challenge the validity or enforceability of innovator companies’ listed patents and/or their applicability to our generic products. Therefore, settling patent litigations has been and is likely to continue to be part of our business. Parties to such settlement agreements in the U.S., including us, are required by law to file them with the U.S. Federal Trade Commission (FTC) and the Antitrust Division of the Department of Justice (DOJ) for review. The FTC has publicly stated that, in its view, such settlement agreements may violate the antitrust laws. In some instances, the FTC has brought actions against brand and generic companies that have entered into such agreements. Accordingly, we may receive formal or informal requests from the FTC for information about a particular settlement agreement, and there is a risk that the FTC may commence an action against us alleging violation of the antitrust laws.
22
In addition, some members of Congress have proposed legislation that would limit the types of settlement agreements generic manufacturers can enter into with brand companies. In 2013, the Supreme Court, in FTC v. Actavis, determined that reverse payment patent settlements between generic and brand companies should be evaluated under the rule of reason, but provided limited guidance beyond the selection of this standard. Because the Supreme Court did not articulate the full range of criteria upon which a determination of legality of such settlements would be based, or provide guidance on the precise circumstances under which such settlements would always qualify as legal, there may be extensive litigation over what constitutes a reasonable and lawful patent settlement between a brand and generic company. We are subject to multiple lawsuits purporting to be or certified as class actions brought by direct and indirect payers alleging that our settlement agreements respectively with Watson Pharmaceuticals, Inc. (Watson) regarding the LIDODERM® patent litigation, and with Impax regarding the OPANA® ER patent litigation, were unlawful in violation of federal antitrust laws, as well as various state laws.
We have significant goodwill and other intangible assets. Consequently, potential impairment of goodwill and other intangibles may significantly impact our profitability.
Goodwill and other intangibles represent a significant portion of our assets. As of December 31, 2017 and 2016, goodwill and other intangibles comprised approximately 75% and 74%, respectively, of our total assets. Goodwill and other indefinite-lived intangible assets are subject to an impairment test at least annually. Additionally, impairment tests must be performed whenever events or changes in circumstances indicate the carrying amount of the asset may not be recoverable. For example, as further discussed in Note 10. Goodwill and Other Intangibles in the Consolidated Financial Statements, included in Part IV, Item 15 of this report "Exhibits, Financial Statement Schedules", we recorded a $45.5 million impairment charge related to our serelaxin in-process research and development intangible asset during the three months ended March 31, 2017. This charge resulted from the announcement that a Phase 3 study of serelaxin in patients with acute heart failure (AHF) failed to meet its primary endpoints.
For the years ended December 31, 2017, 2016 and 2015, we recorded asset impairment charges of $1.2 billion, $3.8 billion and $1.1 billion, respectively, which related primarily to goodwill and other intangible assets. The procedures and assumptions used in our goodwill and intangible assets impairment testing are discussed in Part II, Item 7 of this report "Management’s Discussion and Analysis of Financial Condition and Results of Operations" under the captions “CRITICAL ACCOUNTING ESTIMATES” and “RESULTS OF OPERATIONS”.
Events giving rise to impairment of goodwill or intangible assets are an inherent risk in the pharmaceutical industry and often cannot be predicted. As a result of the significance of goodwill and other intangible assets, our results of operations and financial position in a future period could be negatively impacted should additional impairments of our goodwill or other intangible assets occur.
We are subject to various regulations pertaining to the marketing of our products and services.
We are subject to various federal and state laws pertaining to healthcare fraud and abuse involving the marketing and pricing of our products and services, including prohibitions on the offer of payment or acceptance of kickbacks or other remuneration for the purchase of our products and services, including inducements to potential patients to request our products and services and inducements to healthcare professionals to prescribe and use our products. Additionally, product promotion, educational activities, support of continuing medical education programs and other interactions with healthcare professionals must be conducted in a manner consistent with the FDA regulations and the Anti-Kickback Statute. The Anti-Kickback Statute, with certain exceptions or exemptions published by the Office of the Inspector General of the Department of Health and Human Services (HHS-OIG), prohibits persons or entities from knowingly and willfully soliciting, receiving, offering or providing remuneration, directly or indirectly, to induce either the referral of an individual, or the furnishing, recommending or arranging for a good or service, for which payment may be made under federal healthcare programs, such as the Medicare and Medicaid programs. Violations of the Anti-Kickback Statute also carry potential federal False Claims Act liability. Additionally, many states have adopted laws similar to the Anti-Kickback Statute, without identical exceptions or exemptions. Some of these state prohibitions apply to referral of patients for healthcare items or services reimbursed by any third-party payer, not only the Medicare and Medicaid programs. Any such new regulations or requirements may be difficult and expensive for us to comply with, may delay our introduction of new products, may adversely affect our total revenues and may have a material adverse effect on our business, results of operations, financial condition and cash flows.
23
Sanctions for violating these laws include criminal penalties and civil sanctions and possible exclusion from federally funded healthcare programs such as Medicare and Medicaid as well as potential liability under the False Claims Act and applicable state false claims acts. There can be no assurance that our practices will not be challenged under these laws in the future, that changes in these laws or interpretation of these laws would not give rise to new challenges of our practices or that any such challenge would not have a material adverse effect on our business or results of operations. Law enforcement agencies sometimes initiate investigations into sales, marketing and/or pricing practices based on preliminary information or evidence, and such investigations can be and often are closed without any enforcement action. Nevertheless, these types of investigations and any related litigation can result in: (i) large expenditures of cash for legal fees, payment of penalties and compliance activities; (ii) limitations on operations; (iii) diversion of management resources; (iv) injury to our reputation; and (v) decreased demand for our products.
In addition, our company is subject to statutory and regulatory restrictions on the promotion of uses of prescription drugs or devices that are not cleared or approved by the FDA. Although the FDA does not regulate a physician’s choice of medications, treatments or product uses, the FFDCA and FDA regulations and guidance significantly restrict the ability of pharmaceutical and medical device companies to communicate with patients, physicians and other third-parties about unapproved or uncleared product uses. Prohibitions on the promotion of unapproved uses and against promotional practices deemed false or misleading are actively enforced by various parties at both the federal and state level. A company that is found to have improperly promoted its products under these laws may be subject to significant liability, including significant administrative, civil and criminal sanctions, including but not limited to significant civil damages, criminal fines and exclusion from participation in Medicare, Medicaid and other federal healthcare programs. Applicable laws governing product promotion also provide for administrative, civil and criminal liability for individuals, including, in some circumstances, potential strict vicarious liability. Conduct giving rise to such liability could also form the basis for private civil litigation by third-party payers or other persons allegedly harmed by such conduct.
We have established and implemented a corporate compliance program designed to prevent, detect and correct violations of state and federal healthcare laws, including laws related to advertising and promotion of our products. Nonetheless, enforcement agencies or private plaintiffs may take the position that we are not in compliance with such requirements and, if such non-compliance is proven, the Company and, in some cases, individual employees, may be subject to significant liability, including the aforementioned administrative, civil and criminal sanctions.
Furthermore, in February 2014, Endo Pharmaceuticals Inc. (EPI) entered into a Corporate Integrity Agreement (CIA) with the U.S. Department of Health and Human Services to resolve allegations regarding the promotion of LIDODERM®. In March 2013, our subsidiary, Par Pharmaceutical Companies, Inc., entered into a CIA and a Plea Agreement with the DOJ to resolve allegations regarding the promotion of MEGACE ES®. Those agreements place certain obligations on us related to the marketing of our pharmaceutical products and our healthcare regulatory compliance program, including reporting requirements to the U.S. government; detailed requirements for our compliance program, code of conduct and policies and procedures; and the requirement to engage an Independent Review Organization. We have implemented procedures and practices to comply with the CIA, including the engagement of an Independent Review Organization. In the event we breach the Plea Agreement and/or the CIAs, there is a risk the government would seek remedies provided for in those agreements, including instituting criminal prosecution against us, seeking to impose stipulated penalties or seeking to exclude us from participation in federal health care programs.
The pharmaceutical industry is heavily regulated, which creates uncertainty about our ability to bring new products to market and imposes substantial compliance costs on our business.
Governmental authorities such as the FDA impose substantial requirements on the development, manufacture, holding, labeling, marketing, advertising, promotion, distribution and sale of therapeutic pharmaceutical products through lengthy and detailed laboratory and clinical testing and other costly and time-consuming procedures. In addition, before obtaining regulatory approvals for certain generic products, we must conduct limited bioequivalence studies and other research to show comparability to the branded products. A failure to obtain satisfactory results in required pre-marketing trials may prevent us from obtaining required regulatory approvals. The FDA may also require companies to conduct post-approval studies and post-approval surveillance regarding their drug products and to report adverse events.
24
Before obtaining regulatory approvals for the sale of any new product candidate, we must demonstrate through preclinical studies and clinical trials that such product candidate is safe and effective for each intended use. Preclinical and clinical studies may fail to demonstrate the safety and effectiveness of a product candidate. Likewise, we may not be able to demonstrate through clinical trials that a product candidate’s therapeutic benefits outweigh its risks. Even promising results from preclinical and early clinical studies do not always accurately predict results in later, large scale trials. A failure to demonstrate safety and efficacy could or would result in our failure to obtain regulatory approvals. Clinical trials can be delayed for reasons outside of our control, which can lead to increased development costs and delays in regulatory approval. For example, there is substantial competition to enroll patients in clinical trials, and such competition has delayed clinical development of our products in the past. For example, patients may not enroll in clinical trials at the rate expected or patients may drop out after enrolling in the trials or during the trials. In addition, we rely on collaboration partners that may control or make changes in trial protocol and design enhancements, or encounter clinical trial compliance-related issues, which may also delay clinical trials. Product supplies may be delayed or be insufficient to treat the patients participating in the clinical trials, or manufacturers or suppliers may not meet the requirements of the FDA or foreign regulatory authorities, such as those relating to cGMP. We also may experience delays in obtaining, or we may not obtain, required initial and continuing approval of our clinical trials from institutional review boards. We may experience delays or undesired results in these or any other of our clinical trials.
The FDA and/or foreign regulatory agencies may not approve, clear for marketing or certify any products developed by us. Any approval by regulatory agencies may subject the marketing of our products to certain limits on indicated use. The FDA or foreign regulatory authorities may not agree with our assessment of the clinical data or they may interpret it differently. Such regulatory authorities may require additional or expanded clinical trials. Any limitation on use imposed by the FDA or delay in or failure to obtain FDA approvals or clearances of products developed by us would adversely affect the marketing of these products and our ability to generate product revenue, which would adversely affect our financial condition and results of operations.
In addition, specifically with respect to pharmaceutical products, the submission of a NDA or ANDA to the FDA with supporting clinical safety and efficacy data, for example, does not guarantee that the FDA will grant approval to market the product. Meeting the FDA’s regulatory requirements to obtain approval to market a drug product, which varies substantially based on the type, complexity and novelty of the pharmaceutical product, typically takes years and is subject to uncertainty.
Additional delays may result if an FDA Advisory Committee or other regulatory authority recommends non-approval or restrictions on approval. Although the FDA is not required to follow the recommendations of its Advisory Committees, it usually does. A negative Advisory Committee meeting could signal a lower likelihood of approval, although the FDA may still end up approving our application. Regardless of an Advisory Committee meeting outcome or the FDA’s final approval decision, public presentation of our data may shed positive or negative light on our application.
With respect to our Supplemental New Drug Application for OPANA® ER, the FDA scheduled a Joint Meeting of the Drug Safety and Risk Management Advisory Committee and the Anesthetic and Analgesic Drug Products Advisory Committee in March 2017 to discuss pre- and post-marketing data about the abuse of OPANA® ER and the overall risk-benefit of this product. The Advisory Committees were also scheduled to discuss abuse of generic oxymorphone ER and oxymorphone immediate-release (IR) products. In March 2017, the Advisory Committees voted 18 to eight, with one abstention, that the benefits of reformulated OPANA® ER no longer outweigh its risks. While several of the Advisory Committee members acknowledged the role of OPANA® ER in clinical practice, others believed its benefits are now overshadowed by the continuing public health concerns around the product's misuse, abuse and diversion. In June 2017, the FDA requested that we voluntarily withdraw OPANA® ER from the market and, in July 2017, after careful consideration and consultation with the FDA, we decided to voluntarily remove OPANA® ER from the market. During the second quarter of 2017, we began to work with the FDA to coordinate an orderly withdrawal of the product from the market. By September 1, 2017, we ceased shipments of OPANA® ER to customers and we expect the New Drug Application will be withdrawn in the coming months. These actions had an adverse effect on our revenues and, as a result of these actions, we have incurred and expect to incur certain charges. These and other actions such as recalls or withdrawals could divert management time and attention, reduce market acceptance of all of our products, harm our reputation, reduce our revenues, lead to additional charges or expenses or result in product liability claims, any of which could have a material adverse effect on our results of operations and financial condition.
25
Some drugs are available in the United States that are not the subject of an FDA-approved NDA. In 2011, the FDA’s Center for Drug Evaluation and Research (CDER) Office of Compliance modified its enforcement policy with regard to the marketing of such “unapproved” marketed drugs. Under CDER’s revised guidance, the FDA encourages manufacturers to obtain NDA approvals for such drugs by requiring unapproved versions to be removed from the market after an approved version has been introduced, subject to a grace period at the FDA’s discretion. This grace period is intended to allow an orderly transition of supply to the market and to mitigate any potential related drug shortage. Depending on the length of the grace period and the time it takes for subsequent applications to be approved, this may result in a period of de facto market exclusivity to the first manufacturer that has obtained an approved NDA for the previously unapproved marketed drug. We may seek FDA approval for certain unapproved marketed drug products through the 505(b)(2) regulatory pathway. Even if we receive approval for an NDA under section 505(b)(2) of the FFDCA, the FDA may not take timely enforcement action against companies marketing unapproved versions of the drug; therefore, we cannot be sure that that we will receive the benefit of any de facto exclusive marketing period or that we will fully recoup the expenses incurred to obtain an approval. In addition, certain competitors and others have objected to the FDA’s interpretation of Section 505(b)(2). If the FDA’s interpretation of Section 505(b)(2) is successfully challenged, this could delay or even prevent the FDA from approving any NDA that we submit under Section 505(b)(2).
Moreover, even if our product candidates are approved under Section 505(b)(2), the approval may be subject to limitations on the indicated uses for which the products may be marketed or to other conditions of approval, or may contain requirements for costly post-marketing testing and surveillance to monitor the safety or efficacy of the products.
The ANDA approval process for a new product varies in time, generally requiring a minimum of 10 months following submission of the ANDA to FDA, but could also take several years from the date of application. The timing for the ANDA approval process for generic products is difficult to estimate and can vary significantly. ANDA approvals, if granted, may not include all uses (known as indications) for which a company may seek to market a product.
Further, once a product is approved or cleared for marketing, failure to comply with applicable regulatory requirements can result in, among other things, suspensions or withdrawals of approvals or clearances; seizures or recalls of products; injunctions against the manufacture, holding, distribution, marketing and sale of a product; and civil and criminal sanctions. Furthermore, changes in existing regulations or the adoption of new regulations could prevent us from obtaining, or affect the timing of, future regulatory approvals or clearances. Meeting regulatory requirements and evolving government standards may delay marketing of our new products for a considerable period of time, impose costly procedures upon our activities and result in a competitive advantage to larger companies that compete against us.
Based on scientific developments, post-market experience or other legislative or regulatory changes, the current FDA standards of review for approving new pharmaceutical products, or new indications or uses for approved or cleared products, are sometimes more stringent than those that were applied in the past.
Some new or evolving FDA review standards or conditions for approval or clearance were not applied to many established products currently on the market, including certain opioid products. As a result, the FDA does not have safety databases on these products that are as extensive as some products developed more recently. Accordingly, we believe the FDA has expressed an intention to develop such databases for certain of these products, including many opioids. In particular, the FDA has expressed interest in specific chemical structures that may be present as impurities in a number of opioid narcotic active pharmaceutical ingredients, such as oxycodone, which based on certain structural characteristics and laboratory tests may indicate the potential for having mutagenic effects. The FDA has required, and may continue to require, more stringent controls of the levels of these impurities in drug products for approval.
Also, the FDA may require labeling revisions, formulation or manufacturing changes and/or product modifications for new or existing products containing such impurities. The FDA’s more stringent requirements, together with any additional testing or remedial measures that may be necessary, could result in increased costs for, or delays in, obtaining approval for certain of our products. Although we do not believe that the FDA would seek to remove a currently marketed product from the market unless such mutagenic effects are believed to indicate a significant risk to patient health, we cannot make any such assurance.
In May of 2016, an FDA advisory panel recommended mandatory training of all physicians who prescribe opioids on the risks of prescription opioids. In 2016, the CDC also issued a guideline for prescribing opioids for chronic pain that provides recommendations for primary care clinicians who are prescribing opioids for chronic pain outside of active cancer treatment, palliative care and end-of-life care. In addition, state health departments and boards of pharmacy have authority to regulate distribution and may modify their regulations with respect to prescription narcotics in an attempt to curb abuse. In either case, any such new regulations or requirements may be difficult and expensive for us to comply with, may delay our introduction of new products, may adversely affect our total revenues and may have a material adverse effect on our business, results of operations, financial condition and cash flows.
26
The FDA has the authority to require companies to undertake additional post-approval studies to assess known or signaled safety risks, to make any labeling changes to address those risks and to formulate approved REMS to confirm a drug’s benefits outweigh its risks. For example, in 2015, the FDA sent letters to a number of manufactures, including Endo, requiring that a randomized, double-blind, placebo-controlled clinical trial be conducted to evaluate the effect of testosterone replacement therapy on the incidence of major adverse cardiovascular events in men. The letter received by Endo required that we include new safety information in the labeling and Medication Guide for certain prescription medications containing testosterone, such as TESTIM®.
The FDA’s exercise of its authority under the FFDCA could result in delays or increased costs during product development, clinical trials and regulatory review, increased costs to comply with additional post-approval regulatory requirements and potential restrictions on sales of approved products. Foreign regulatory agencies often have similar authority and may impose comparable requirements and costs. Post-marketing studies and other emerging data about marketed products, such as adverse event reports, may also adversely affect sales of our products. Furthermore, the discovery of significant safety or efficacy concerns or problems with a product in the same therapeutic class as one of our products that implicate or appear to implicate the entire class of products could have an adverse effect on sales of our product or, in some cases, result in product withdrawals. The FDA has continuing authority over the approval of an NDA or ANDA and may withdraw approval if, among other reasons, post-marketing clinical or other experience, tests or data show that a drug is unsafe for use under the conditions upon which it was approved, or if FDA determines that there is a lack of substantial evidence of the drug’s efficacy under the conditions described in its labeling. Furthermore, new data and information, including information about product misuse or abuse at the user level, may lead government agencies, professional societies, practice management groups or patient or trade organizations to recommend or publish guidance or guidelines related to the use of our products, which may lead to reduced sales of our products.
The FDA and the DEA have important and complementary responsibilities with respect to our business. The FDA administers an application and post-approval monitoring process to confirm that products that are available in the market are safe, effective and consistently of uniform, high quality. The DEA administers registration, drug allotment and accountability systems to satisfy against loss and diversion of controlled substances. Both agencies have trained investigators that routinely, or for cause, conduct inspections, and both have authority to seek to enforce their statutory authority and regulations through administrative remedies as well as civil and criminal enforcement actions.
The FDA regulates and monitors the quality of drug clinical trials to provide human subject protection and to support marketing applications. The FDA may place a hold on a clinical trial and may cause a suspension or withdrawal of product approvals if regulatory standards are not maintained. The FDA also regulates the facilities, processes and procedures used to manufacture and market pharmaceutical products in the U.S. Manufacturing facilities must be registered with the FDA and all products made in such facilities must be manufactured in accordance with the latest cGMP regulations, which are enforced by the FDA. Compliance with clinical trial requirements and cGMP regulations requires the dedication of substantial resources and requires significant expenditures. In the event an approved manufacturing facility for a particular drug is required by the FDA to curtail or cease operations, or otherwise becomes inoperable, or a third party contract manufacturing facility faces manufacturing problems, obtaining the required FDA authorization to manufacture at the same or a different manufacturing site could result in production delays, which could adversely affect our business, results of operations, financial condition and cash flow.
The FDA is authorized to perform inspections of U.S. and foreign facilities under the FFDCA. At the end of such an inspection, the FDA could issue a Form 483 Notice of Inspectional Observations, which could cause us to modify certain activities identified during the inspection. Following such inspections, the FDA may issue an untitled letter as an initial correspondence that cites violations that do not meet the threshold of regulatory significance for a Warning Letter. FDA guidelines also provide for the issuance of Warning Letters for violations of “regulatory significance” for which the failure to adequately and promptly achieve correction may be expected to result in an enforcement action. The FDA also may issue Warning Letters and untitled letters in connection with events or circumstances unrelated to an FDA inspection.
Similar to other healthcare companies, during 2017 and in prior years, our facilities, in multiple countries, across the full range of our business units, were subject to routine and new-product related inspections by the FDA, Medicines and Healthcare products Regulatory Agency, Health Products Regulatory Authority and Health Canada. Some of these inspections resulted in non-critical inspection observations (including FDA Form 483 observations). We have responded to all inspection observations within the required time frame and have implemented, or are continuing to implement, the corrective action plans as agreed with the relevant regulatory agencies.
27
Several of our core products contain controlled substances. The stringent DEA regulations on our use of controlled substances include restrictions on their use in research, manufacture, distribution and storage. A breach of these regulations could result in imposition of civil penalties, refusal to renew or action to revoke necessary registrations, or other restrictions on operations involving controlled substances. In addition, failure to comply with applicable legal requirements subjects the manufacturing facilities of our subsidiaries and manufacturing partners to possible legal or regulatory action, including shutdown. Any such shutdown may adversely affect their ability to supply us with product and thus, our ability to market affected products. This could have a negative impact on our business, results of operations, financial condition, cash flows and competitive position. See also the risk described under the caption “The DEA limits the availability of the active ingredients used in many of our products as well as the production of these products, and, as a result, our procurement and production quotas may not be sufficient to meet commercial demand or complete clinical trials.”
In addition, we are subject to the Federal Drug Supply Chain Security Act (DSCSA). The U.S. government has enacted DSCSA which requires development of an electronic pedigree to track and trace each prescription drug at the salable unit level through the distribution system, which will be effective incrementally over a 10-year period. Compliance with DSCSA and future U.S. federal or state electronic pedigree requirements may increase our operational expenses and impose significant administrative burdens.
We cannot determine what effect changes in regulations or legal interpretations or requirements by the FDA, the courts or others, when and if promulgated or issued, may have on our business in the future. Changes could, among other things, require different labeling, monitoring of patients, interaction with physicians, education programs for patients or physicians, curtailment of necessary supplies or limitations on product distribution. Any such changes could have an adverse effect on our business. The evolving and complex nature of regulatory science and regulatory requirements, the broad authority and discretion of the FDA and the generally high level of regulatory oversight results in a continuing possibility that, from time to time, we will be adversely affected by regulatory actions despite our ongoing efforts and commitment to achieve and maintain full compliance with all regulatory requirements.
The success of our acquisition and licensing strategy is subject to uncertainty and any completed acquisitions or licenses may reduce our earnings, be difficult to integrate, not perform as expected or require us to obtain additional financing.
We regularly evaluate selective acquisitions and look to continue to enhance our product line by acquiring rights to additional products and compounds. Such acquisitions may be carried out through corporate acquisitions, asset acquisitions, licensing and joint venture arrangements or by acquiring other companies. However, we may not be able to complete acquisitions that meet our target criteria on satisfactory terms, if at all. In particular, we may not be able to identify suitable acquisition candidates. In addition, any acquisition of assets and rights to products and compounds may fail to accomplish our strategic objective and may not perform as expected. Further, if we are unable to maintain, on commercially reasonable terms, product, compound or other licenses that we have acquired, our ability to develop or commercialize our products may be inhibited. In order to continue to develop and broaden our product range we must compete to acquire these assets. Our competitors may have greater resources than us and therefore be better able to complete acquisitions or may cause the ultimate price we pay for acquisitions to increase. If we fail to achieve our acquisition goals, our growth may be limited.
In addition to the risks related to acquisition of assets and products, acquisitions of companies may expose us to additional risks, which may be beyond our control and may have a material adverse effect on our profitability and cash flows. The combination of two independent businesses is a complex, costly and time-consuming process. As a result, we may be required to devote significant management attention and resources to the integration of an acquired business into our practices and operations. Any integration process may be disruptive and, if implemented ineffectively, may restrict the realization of the full expected benefits.
In addition, any acquisitions we make may result in material unanticipated problems, expenses, liabilities, competitive responses and loss or disruption of relationships with customers, suppliers, partners, regulators and others with whom we have business or other dealings. The difficulties of combining operations of companies include, among others:
• | diversion of management’s attention to integration matters; |
• | difficulties in achieving anticipated cost or tax savings, synergies, business opportunities and growth prospects from the combination of the businesses; |
• | difficulties in the integration of operations and systems; |
• | the impact of pre-existing legal and/or regulatory issues; |
• | difficulties in conforming standards, controls, procedures and accounting and other policies, business cultures and compensation structures between the companies; |
• | difficulties in the assimilation of employees and retention of key personnel; |
• | difficulties in managing the expanded operations of a significantly larger and more complex company; |
• | challenges in retaining existing customers and obtaining new customers; |
28
• | potential unknown liabilities or larger liabilities than projected, adverse consequences and unforeseen increased expenses associated with the merger; and |
• | difficulties in coordinating a geographically dispersed organization. |
The benefits of a merger are also subject to a variety of other factors, many of which are beyond our ability to control, such as changes in the rate of economic growth in jurisdictions in which the combined company will do business, the financial performance of the combined business in various jurisdictions, currency exchange rate fluctuations and significant changes in trade, monetary or fiscal policies, including changes in interest rates and tax law of the jurisdictions in which the combined company will do business. The impact of these factors, individually and in the aggregate, is difficult to predict, in part because the occurrence of the events or circumstances described in such factors may be interrelated, and the impact to the combined company of the occurrence of any one of these events or circumstances could be compounded or, alternatively, reduced, offset, or more than offset, by the occurrence of one or more of the other events or circumstances described in such factors.
In addition, based on current acquisition prices in the pharmaceutical industry, acquisitions could decrease our net income per share and add significant intangible assets and related amortization or impairment charges. Our acquisition strategy may require us to obtain additional debt or equity financing, resulting in additional debt obligations, increased interest expense or dilution of equity ownership. We may not be able to finance acquisitions on terms satisfactory to us.
We may decide to sell assets, which could adversely affect our prospects and opportunities for growth.
We may from time to time consider selling certain assets if (i) we determine that such assets are not critical to our strategy or (ii) we believe the opportunity to monetize the asset is attractive or for various other reasons, including for the reduction of indebtedness. For example, we divested both Litha, our South African business, and Somar, our Latin America business, in July 2017 and October 2017, respectively. We have explored and will continue to explore the sale of certain non-core assets. Although our expectation is to engage in asset sales only if they advance or otherwise support our overall strategy, any such sale could reduce the size or scope of our business, our market share in particular markets or our opportunities with respect to certain markets, products or therapeutic categories. As a result, any such sale could have an adverse effect on our business, prospects and opportunities for growth, results of operations, financial condition and cash flows.
Our growth and development will depend on developing, commercializing and marketing new products, including both our own products and those developed with our collaboration partners. If we do not do so successfully, our growth and development will be impaired.
Our future revenues and profitability will depend, to a significant extent, upon our ability to successfully commercialize new branded and generic pharmaceutical products protected by patent or statutory authority in a timely manner. As a result, we must continually develop, test and manufacture new products, which must meet regulatory standards to receive requisite marketing authorizations. The process of obtaining regulatory approvals for new products is time consuming and costly and inherently unpredictable. Products we are currently developing may not receive the regulatory approvals or clearances necessary for us to market them. Furthermore, the development and commercialization process is time-consuming and costly and, if and when products are developed and approved, we may be unable to successfully commercialize them on a timely basis or at all.
The successful commercialization of a product is also subject to a number of factors, including:
• | the effectiveness, ease of use and safety of our products as compared to existing products; |
• | customer demand and the willingness of physicians and customers to adopt our products over products with which they may have more loyalty or familiarity and overcoming any biases towards our products; |
• | the cost of our product compared to alternative products and the pricing and commercialization strategies of our competitors; |
• | the success of our launch and marketing efforts; |
• | adverse publicity about us, our products, our competitors and their products or the industry as a whole or favorable publicity about competitors; |
• | the advent of new and innovative alternative products; and |
• | any unforeseen issues or adverse developments in connection with a product and any resulting litigation or regulatory scrutiny and harm to our reputation. |
In addition, many risks associated with developing, commercializing and marketing new products are beyond our control. For example, some of our collaboration partners may decide to make substantial changes to a product’s formulation or design, may experience financial difficulties or may have limited financial resources. Any of the foregoing may delay the development, commercialization and/or marketing of new products. In addition, if a co-developer on a new product terminates our collaboration agreement or does not perform under the agreement, we may experience delays and additional costs in developing and marketing that product.
29
We conduct research and development of medical and technological products to enable us to manufacture and market pharmaceutical products in accordance with specific government regulations. Much of our drug development effort is focused on technically difficult-to-formulate products and/or products that require advanced manufacturing technology. Typically, expenses related to research, development and regulatory approval of compounds for our branded pharmaceutical products are significantly greater than those expenses associated with generic products. As we continue to develop new products, our research expenses will likely increase. Because of the inherent risk associated with research and development efforts in the healthcare industry, particularly with respect to new drugs, our research and development expenditures may not result in the successful regulatory approval and introduction of new pharmaceutical products and failure in the development of any new product can occur at any point in the process, including late in the process after substantial investment. Also, after we submit a regulatory application, the relevant governmental health authority may require that we conduct additional studies, including studies to assess the product’s interaction with alcohol. As a result, we may be unable to reasonably predict the total research and development costs to develop a particular product and there is a significant risk that the funds we invest in research and development will not generate financial returns. In addition, our operating results and financial condition may fluctuate as the amount we spend to research and develop, commercialize, acquire or license new products, technologies and businesses changes.
The availability of third party reimbursement for our products is uncertain, and thus we may find it difficult to maintain current price levels. Additionally, the market may not accept those products for which third party reimbursement is not adequately provided.
Our ability to commercialize our products depends, in part, on the extent to which reimbursement for the costs of these products is available from government healthcare programs, such as Medicaid and Medicare, private health insurers and others. We cannot be certain that, over time, third party reimbursements for our products will be adequate for us to maintain price levels sufficient for realization of an appropriate return on our investment. Government payers, private insurers and other third party payers are increasingly attempting to contain healthcare costs by: (i) limiting both coverage and the level of reimbursement (including adjusting co-pays) for products approved for marketing by the FDA, (ii) refusing, in some cases, to provide any coverage for uses of approved products for indications for which the FDA has not granted marketing approval and (iii) requiring or encouraging, through more favorable reimbursement levels or otherwise, the substitution of generic alternatives to branded products.
We may experience pricing pressure on the price of our products due to social or political pressure to lower the cost of drugs, which would reduce our revenue and future profitability.
We may experience downward pricing pressure on the price of our products due to social or political pressure to lower the cost of drugs, which would reduce our revenue and future profitability. Price increases have resulted in increased public and governmental scrutiny of the cost of drugs. For example, U.S. federal prosecutors have issued subpoenas to pharmaceutical companies seeking information about pricing practices in connection with an investigation into pricing practices being conducted by the U.S. Department of Justice. Several state attorneys general also have commenced drug pricing investigations and filed lawsuits against pharmaceutical companies, including Par Pharmaceutical, Inc., and the U.S. Senate has publicly investigated a number of pharmaceutical companies relating to price increases and pricing practices. Our revenue and future profitability could be negatively affected if these or other inquiries were to result in legislative or regulatory proposals that limit our ability to increase the prices of our products.
In addition, among other federal legislative initiatives aimed at drug pricing issues, in September 2016, a bipartisan group of U.S. Senators introduced legislation that would require pharmaceutical manufacturers to justify price increases of more than 10% in a 12-month period. A large number of individual states also have introduced legislation aimed at drug pricing regulation, transparency or both. California and Nevada have enacted such laws. Our revenue and future profitability could be negatively affected by the passage of these laws or similar federal or state legislation. Pressure from social activist groups and future government regulations may also put downward pressure on the price of drugs, which could result in downward pressure on the prices of our products in the future.
Our business is highly dependent upon market perceptions of us, our brands, and the safety and quality of our products, and may be adversely impacted by negative publicity or findings.
Market perceptions of us are very important to our business, especially market perceptions of our company and brands and the safety and quality of our products. If we, our partners and suppliers, or our brands suffer from negative publicity, or if any of our products or similar products which other companies distribute are subject to market withdrawal or recall or are proven to be, or are claimed to be, ineffective or harmful to consumers, then this could have a material adverse effect on our business, results of operations, financial condition and cash flows.
30
For example, the pharmaceutical drug supply has been increasingly challenged by the vulnerability of distribution channels to illegal counterfeiting and the presence of counterfeit products in a growing number of markets and over the Internet. Third parties may illegally distribute and sell counterfeit versions of our products that do not meet the rigorous manufacturing and testing standards that our products undergo. Counterfeit products are frequently unsafe or ineffective, and can be potentially life-threatening. Counterfeit medicines may contain harmful substances, the wrong dose of API or no API at all. However, to distributors and users, counterfeit products may be visually indistinguishable from the authentic version.
In addition, negative posts or comments about us on any social networking website could seriously damage our reputation. The inappropriate use of certain social media vehicles could cause brand damage or information leakage or could lead to legal implications from the improper collection and/or dissemination of personally identifiable information or the improper dissemination of material non-public information.
Furthermore, unfavorable media coverage of opioid pharmaceuticals could negatively affect our business, financial condition and results of operations. In recent years, opioid drug abuse has received a high degree of media coverage. Unfavorable publicity regarding, for example, the use or misuse of oxycodone or other opioid drugs, the limitations of abuse-deterrent forms (ADFs), public inquiries and investigations into prescription drug abuse, litigation or regulatory activity could adversely affect our reputation. Such negative publicity could have an adverse effect on the potential size of the market for our drug candidates and decrease revenues and royalties, which would adversely affect our business and financial status. Additionally, such increased scrutiny of opioids generally, whether focused on our products or otherwise, could negatively impact our relationship with healthcare providers and other members of the healthcare community.
We are dependent on market perceptions, and negative publicity associated with product quality, patient illness or other adverse effects resulting from, or perceived to be resulting from, our products, or our partners’ and suppliers’ manufacturing facilities, could have a material adverse effect on our business, results of operations, financial condition and cash flows.
Our reporting and payment obligations under the Medicaid Drug Rebate Program and other governmental drug pricing programs are complex and may involve subjective decisions. Any failure to comply with those obligations could subject us to penalties and sanctions.
We are subject to federal and state laws prohibiting the presentation (or the causing to be presented) of claims for payment (by Medicare, Medicaid or other third-party payers) that are determined to be false or fraudulent, including presenting a claim for an item or service that was not provided. These false claims statutes include the federal civil False Claims Act, which permits private persons to bring suit in the name of the government alleging false or fraudulent claims presented to or paid by the government (or other violations of the statutes) and to share in any amounts paid by the entity to the government in fines or settlement. Such suits, known as qui tam actions, have increased significantly in the healthcare industry in recent years. These actions against pharmaceutical companies, which do not require proof of a specific intent to defraud the government, may result in payment of fines to and/or administrative exclusion from the Medicare, Medicaid and/or other government healthcare programs.
We are subject to laws that require us to enter into a Medicaid Drug Rebate Agreement and a 340B Pharmaceutical Pricing Agreement as a condition for having our products eligible for payment under Medicare Part B and Medicaid. We have entered into such agreements. In addition, we are required to report certain pricing information to the Centers for Medicare and Medicaid Services (CMS) on a periodic basis to allow for accurate determination of rebates owed under the Medicaid Drug Rebate Agreement, of ceiling prices under the 340B program and certain other government pricing arrangements, and of reimbursement rates for certain drugs paid under Medicare Part B. On February 1, 2016, CMS issued a Final Rule implementing the Medicaid Drug Rebate provisions incorporated into the PPACA, effective April 1, 2016 in most instances. Implementation of the Final Rule required operational adjustments by us in order to maintain compliance with applicable law. Changes included in the Final Rule revised how manufacturers calculate Average Manufacturer Price (AMP) and Best Price and also affect the quarterly amounts that we owe to state Medicaid programs through the Medicaid Drug Rebate program. Also, CMS made changes with respect to how certain products are categorized for purposes of the Medicaid Drug Rebate program (i.e., single source, innovator multiple source, or non-innovator multiple source), which could affect the rebate calculation methodology, and thus the level of rebates incurred for affected products. In addition, CMS finalized its proposal to change the reimbursement metrics upon which Medicaid agencies are required to reimburse for covered outpatient drugs. The new reimbursement structure could adversely affect providers’ reimbursement for our products, and thus could adversely affect sales of our products. The Final Rule also expanded the scope of the Medicaid Drug Rebate program to apply to U.S. territories, effective April 1, 2020, which will require operational adjustments and may result in additional rebate liability. Finally, CMS withdrew its proposed definition of “line extension” set forth in the 2012 proposed rule regarding the Medicaid Drug Rebate program and opened a new 60-day comment period soliciting views on how to interpret the relevant PPACA provisions. Additional operational adjustments and financial implications may result upon CMS’s finalization of “line extension” provisions.
31
We and other pharmaceutical companies have been named as defendants in a number of lawsuits filed by various government entities, alleging generally that we and numerous other pharmaceutical companies reported false pricing information in connection with certain drugs that are reimbursable by state Medicaid programs, which are partially funded by the federal government. There is a risk we will be subject to similar investigations or litigations in the future, that we will suffer adverse decisions or verdicts of substantial amounts or that we will enter into monetary settlements. Any unfavorable outcomes as a result of such future litigation could have a material adverse effect on our business, financial condition, results of operations and cash flows.
Employers may seek to reduce costs by reducing or eliminating employer group healthcare plans or transferring a greater portion of healthcare costs to their employees. Job losses or other economic hardships may also result in reduced levels of coverage for some individuals, potentially resulting in lower levels of healthcare coverage for themselves or their families. Further, in addition to the fact that the Tax Cuts and Jobs Act of 2017 eliminated the Affordable Care Act’s requirement that individuals maintain insurance or face a penalty, additional steps by the Trump Administration to limit or end cost-sharing subsidies to lower-income Americans may increase instability in the insurance marketplace and the number of uninsured Americans. These economic conditions may affect patients’ ability to afford healthcare as a result of increased co-pay or deductible obligations, greater cost sensitivity to existing co-pay or deductible obligations and lost healthcare insurance coverage or for other reasons. We believe such conditions could lead to changes in patient behavior and spending patterns that negatively affect usage of certain of our products, including some patients delaying treatment, rationing prescription medications, leaving prescriptions unfilled, reducing the frequency of visits to healthcare facilities, utilizing alternative therapies or foregoing healthcare insurance coverage. Such changes may result in reduced demand for our products, which could materially and adversely affect the sales of our products, our business and results of operations.
Our customer concentration may adversely affect our financial condition and results of operations.
We primarily sell our products to a limited number of wholesale drug distributors and retail drug store chains. In turn, these wholesale drug distributors and retail drug store chains supply products to pharmacies, hospitals, governmental agencies and physicians. In addition, this distribution network is continuing to undergo significant consolidation marked by mergers and acquisitions among wholesale drug distributors and retail drug store chains. For example, McKesson Corporation and Wal-Mart Stores, Inc. entered into an agreement to jointly source generic pharmaceuticals and Express Scripts, through a wholly owned subsidiary, Innovative Product Alignment, LLC, announced it will participate in Walgreens Boots Alliance Development GmbH group purchasing organization. We expect that consolidation of wholesale drug distributors and retail drug store chains will increase pricing and other competitive pressures on pharmaceutical companies, including us. Additionally, the emergence of large buying groups representing independent retail pharmacies and the prevalence and influence of managed care organizations and similar institutions increases the negotiating power of these groups, potentially enabling them to attempt to extract price discounts, rebates and other restrictive pricing terms on our products.
Total revenues from customers who accounted for 10% or more of our total revenues during the years ended December 31, 2017, 2016 and 2015 are as follows:
2017 | 2016 | 2015 | ||||||
Cardinal Health, Inc. | 25 | % | 26 | % | 21 | % | ||
McKesson Corporation | 25 | % | 27 | % | 31 | % | ||
AmerisourceBergen Corporation | 25 | % | 25 | % | 23 | % | ||
Revenues from these customers are included within each of our segments. Accordingly, our revenues, financial condition or results of operations may also be unduly affected by fluctuations in the buying or distribution patterns of these customers. These fluctuations may result from seasonality, pricing, wholesaler inventory objectives or other factors. In addition, if we were to lose the business of any of these customers, or if any were to experience difficulty in paying us on a timely basis, our total revenues, profitability and cash flows could be materially adversely affected.
32
We are currently dependent on outside manufacturers for the manufacture of a significant amount of our products; therefore, we have and will continue to have limited control of the manufacturing process and related costs. Certain of our manufacturers currently constitute the sole source of one or more of our products.
Third party manufacturers currently manufacture a significant amount of our products pursuant to contractual arrangements. Certain of our manufacturers currently constitute the sole source of our products. For example, Teikoku Seiyaku Co., Ltd. is our sole source of LIDODERM® and Sandoz Inc. is our sole source of VOLTAREN® Gel. Because of contractual restraints and the lead-time necessary to obtain FDA approval and/or DEA registration of a new manufacturer, there are no readily accessible alternatives to these manufacturers and replacement of any of these manufacturers may be expensive and time consuming and may cause interruptions in our supply of products to customers. Our business and financial viability are dependent on these third party manufacturers for continued manufacture of our products, the continued regulatory compliance of these manufacturers and the strength, validity and terms of our various contracts with these manufacturers. Any interruption or failure by these manufacturers to meet their obligations pursuant to various agreements with us on schedule or in accordance with our expectations, which could be the result of one or many factors outside of our control, could delay or prevent our ability to achieve sales expectations, cause interruptions in our supply of products to customers, disrupt our operations or cause reputational harm to our company, any or all of which could have a material adverse effect on our business, financial condition, results of operations and cash flows.
We are dependent on third parties to supply all raw materials used in our products and to provide services for certain core aspects of our business. Any interruption or failure by these suppliers, distributors and collaboration partners to meet their obligations pursuant to various agreements with us could have a material adverse effect on our business, results of operations, financial condition and cash flows.
We rely on third parties to supply all raw materials used in our products. In addition, we rely on third party suppliers, distributors and collaboration partners to provide services for certain core aspects of our business, including manufacturing, warehousing, distribution, customer service support, medical affairs services, clinical studies, sales and other technical and financial services. All third party suppliers and contractors are subject to FDA, and very often DEA, requirements. Our business and financial viability are dependent on the continued supply of goods and services by these third party suppliers, the regulatory compliance of these third parties and on the strength, validity and terms of our various contracts with these third party manufacturers, distributors and collaboration partners. Any interruption or failure by our suppliers, distributors and collaboration partners to meet their obligations pursuant to various agreements with us on schedule or in accordance with our expectations, which could be the result of one or many factors outside of our control, could delay or prevent the development, approval, manufacture or commercialization of our products, result in non-compliance with applicable laws and regulations, disrupt our operations or cause reputational harm to our company, any or all of which could have a material adverse effect on our business, financial condition, results of operations and cash flows. We may also be unsuccessful in resolving any underlying issues with such suppliers, distributors and partners or replacing them within a reasonable time and on commercially reasonable terms.
We are dependent upon third parties to provide us with various estimates as a basis for our financial reporting. While we undertake certain procedures to review the reasonableness of this information, we cannot obtain absolute assurance over the accounting methods and controls over the information provided to us by third parties. As a result, we are at risk of them providing us with erroneous data which could have a material adverse impact on our business and or reporting.
If our manufacturing facilities are unable to manufacture our products or the manufacturing process is interrupted due to failure to comply with regulations or for other reasons, it could have a material adverse impact on our business.
If any of our manufacturing facilities fail to comply with regulatory requirements or encounter other manufacturing difficulties, it could adversely affect our ability to supply products. All facilities and manufacturing processes used for the manufacture of pharmaceutical products are subject to inspection by regulatory agencies at any time and must be operated in conformity with cGMP and, in the case of controlled substances, DEA regulations. Compliance with the FDA’s cGMP and DEA requirements applies to both drug products seeking regulatory approval and to approved drug products. In complying with cGMP requirements, pharmaceutical manufacturing facilities must continually expend significant time, money and effort in production, record-keeping and quality assurance and control so that their products meet applicable specifications and other requirements for product safety, efficacy and quality. Failure to comply with applicable legal requirements subjects our manufacturing facilities to possible legal or regulatory action, including shutdown, which may adversely affect our ability to supply the product. Additionally, our manufacturing facilities may face other significant disruptions due to labor strikes, failure to reach acceptable agreement with labor and unions, infringement of intellectual property rights, vandalism, natural disaster, storm or other environmental damage, civil or political unrest, export or import restrictions or other events. Were we not able to manufacture products at our manufacturing facilities because of regulatory, business or any other reasons, the manufacture and marketing of these products would be interrupted. This could have a material adverse impact on our business, results of operation, financial condition, cash flows and competitive position.
33
For example, our Horsham, Pennsylvania facility and the facilities of the manufacturer that has been qualified as an alternate manufacturer for CCH, which we sell under the trademark XIAFLEX® (such manufacturer, the Alternate Manufacturer and such facility, the Alternate Facility), are subject to such regulatory requirements and oversight. If we or the Alternate Manufacturer fail to comply with cGMP requirements, we may not be permitted to sell our products or may be limited in the jurisdictions in which we are permitted to sell them. Further, if an inspection by regulatory authorities indicates that there are deficiencies, including non-compliance with regulatory requirements, we could be required to take remedial actions, stop production or close our Horsham facility or the Alternate Facility, which would disrupt the manufacturing processes, limit the supply of CCH and delay clinical trials and subsequent licensure and/or limit the sale of commercial supplies. In addition, future noncompliance with any applicable regulatory requirements may result in refusal by regulatory authorities to allow use of CCH in clinical trials, refusal of the government to allow distribution of CCH within the U.S. or other jurisdictions, criminal prosecution, fines, recall or seizure of products, total or partial suspension of production, prohibitions or limitations on the commercial sale of products, refusal to allow the entering into of federal and state supply contracts and follow-on civil litigation.
The DEA limits the availability of the active ingredients used in many of our products as well as the production of these products, and, as a result, our procurement and production quotas may not be sufficient to meet commercial demand or complete clinical trials.
The DEA regulates chemical compounds as Schedule I, II, III, IV or V substances, with Schedule I substances considered to present the highest risk of substance abuse and Schedule V substances the lowest risk. The active ingredients in some of our products are listed by the DEA as Schedule II or III substances under the CSA. Consequently, their manufacture, shipment, storage, sale and use are subject to a high degree of regulation. For example, generally, all Schedule II drug prescriptions must be signed by a physician, physically presented to a pharmacist and may not be refilled without a new prescription.
Furthermore, the DEA limits the availability of the active ingredients used in many of our products and sets a quota on the production of these products. We, or our contract manufacturing organizations, must annually apply to the DEA for procurement and production quotas in order to obtain these substances and produce our products. As a result, our procurement and production quotas may not be sufficient to meet commercial demand or to complete clinical trials. Moreover, the DEA may adjust these quotas from time to time during the year. Any delay or refusal by the DEA in establishing our quotas, or modification of our quotas, for controlled substances could delay or result in the stoppage of our clinical trials or product launches, or could cause trade inventory disruptions for those products that have already been launched, which could have a material adverse effect on our business, financial position, results of operations and cash flows.
If we are unable to retain our key personnel and continue to attract additional professional staff, we may be unable to maintain or expand our business.
Because of the specialized scientific nature of our business, our ability to develop products and to compete with our current and future competitors will remain highly dependent, in large part, upon our ability to attract and retain qualified scientific, technical and commercial personnel. The loss of key scientific, technical and commercial personnel or the failure to recruit additional key scientific, technical and commercial personnel could have a material adverse effect on our business. While we have consulting agreements with certain key individuals and institutions and have employment agreements with our key executives, we may be unsuccessful in retaining personnel or their services under existing agreements. There is intense competition for qualified personnel in the areas of our activities and we may be unable to continue to attract and retain the qualified personnel necessary for the development of our business.
The trading prices of our securities may be volatile, and investments in our securities could decline in value.
The market prices for securities of Endo, and of pharmaceutical companies in general, have been highly volatile and may continue to be highly volatile in the future. For example, in 2017, our ordinary shares traded between $5.77 and $17.99 per share on the NASDAQ. The following factors, in addition to other risk factors described in this section, may cause the market value of our securities to fluctuate:
• | FDA approval or disapproval of any of the drug applications we have submitted; |
• | the success or failure of our clinical trials; |
• | new data or new analyses of older data that raises potential safety or effectiveness issues concerning our approved products; |
• | product recalls or withdrawals; |
• | competitors announcing technological innovations or new commercial products; |
• | introduction of generic or compounded substitutes for our products, including the filing of ANDAs with respect to generic versions of our branded products; |
• | developments concerning our or others’ proprietary rights, including patents; |
34
• | competitors’ publicity regarding actual or potential products under development or other activities affecting our competitors or the industry in general; |
• | regulatory developments in the U.S. and foreign countries, or announcements relating to these matters; |
• | period-to-period fluctuations in our financial results; |
• | new legislation, regulation, administrative guidance or executive orders, or changes in interpretation of existing legislation, regulation, administrative guidance or executive orders, including by virtue of new judicial decisions, that could affect the development, sale or pricing of pharmaceutical products; the number of individuals with access to affordable healthcare; the taxes we pay and/or other factors; |
• | a determination by a regulatory agency that we are engaging or have engaged in inappropriate sales or marketing activities, including promoting the “off-label” use of our products; |
• | social and political pressure to lower the cost of drugs; |
• | social and political scrutiny over increases in prices of shares of pharmaceutical companies that are perceived to be caused by a strategy of growth through acquisitions; |
• | litigation; and |
• | changes in the political and regulatory environment and international relations as a result of events such as the exit of the United Kingdom from the European Union (Brexit) and the new U.S. administration and other external factors, including market speculation or disasters and other crises. |
Our operations could be disrupted if our information systems fail, if we are unsuccessful in implementing necessary upgrades or if we are subject to cyber-attacks.
Our business depends on the efficient and uninterrupted operation of our computer and communications systems and networks, hardware and software systems and our other information technology. We collect and maintain information, which includes confidential and proprietary information as well as personal information regarding our customers and employees, in digital form. Data maintained in digital form is subject to risk of cyber-attacks, which are increasing in frequency and sophistication and are made by groups and individuals with a wide range of motives and expertise, including criminal groups, “hackers” and others. Cyber-attacks could include the deployment of harmful malware, viruses, worms, denial-of-service attacks, social engineering and other means to affect service reliability and threaten data confidentiality, integrity and availability. Despite our efforts to monitor and safeguard our systems to prevent data compromise, the possibility of a future data compromise cannot be eliminated entirely, and risks associated with intrusion, tampering, and theft remain. In addition, we do not have insurance coverage with respect to system failures or cyber-attacks. If our systems were to fail or we are unable to successfully expand the capacity of these systems, or we are unable to integrate new technologies into our existing systems, our operations and financial results could suffer.
We also have outsourced certain elements and functions of our operations, including elements of our information technology infrastructure, to third parties, some of which are outside the U.S. As a result, we are managing many independent vendor relationships with third parties who may or could have access to our confidential information. The size and complexity of our and our vendors’ systems make such systems potentially vulnerable to service interruptions. The size and complexity of our and our vendors’ systems and the large amounts of confidential information that is present on them also makes them potentially vulnerable to security breaches from inadvertent or intentional actions by our employees, our partners, our vendors or other third parties, or from attacks by malicious third parties.
The Company and its vendors’ sophisticated information technology operations are spread across multiple, sometimes inconsistent platforms, which pose difficulties in maintaining data integrity across systems. The ever-increasing use and evolution of technology, including cloud-based computing, creates opportunities for the unintentional or improper dissemination or destruction of confidential information stored in the Company’s systems.
A breach of our security measures or the accidental loss, inadvertent disclosure, unapproved dissemination, misappropriation or misuse of trade secrets, proprietary information or other confidential information, whether as a result of theft, hacking, fraud, trickery or other forms of deception, or for any other cause, could enable others to produce competing products, use our proprietary technology or information and/or adversely affect our business position. Further, any such interruption, security breach, loss or disclosure of confidential information could result in financial, legal, business and reputational harm to the Company and could have a material adverse effect on our revenues, financial condition or results of operations.
35
In addition, legislators and/or regulators in countries in which we operate are increasingly adopting or revising privacy, information security and data protection laws (Privacy Laws). In particular, the European Union’s General Data Protection Regulation, which is effective May 25, 2018, has extra-territorial scope and substantial fines for breaches (up to 4% of global annual revenue or €20 million, whichever is greater). Enforcement of Privacy Laws also has increased over the past few years. Accordingly, new and revised Privacy Laws, together with stepped-up enforcement of existing Privacy Laws, could significantly affect our current and planned privacy, data protection and information security-related practices, our collection, use, sharing, retention and safeguarding of consumer and/or employee information and some of our current or planned business activities. Any failure to comply with Privacy Laws, could lead to government enforcement actions and significant sanctions or penalties against us, adversely impact our results of operations and subject us to negative publicity.
Foreign regulatory requirements vary, including with respect to the regulatory approval process, and failure to obtain regulatory approval or maintain compliance with requirements in foreign jurisdictions would prevent or impact the marketing of our products in those jurisdictions.
We have worldwide intellectual property rights to market many of our products and product candidates and intend to seek approval to market certain of our products outside of the U.S. Approval of a product by the regulatory authorities of foreign countries is generally required prior to manufacturing or marketing that product in those countries. The approval procedure varies among countries and can involve additional testing and the time required to obtain such approval may differ from that required to obtain FDA approval. The non-U.S. regulatory approval process includes all of the risks associated with obtaining FDA approval set forth herein. Approval by the FDA does not secure approval by the regulatory authorities of any other country, nor does the approval by foreign regulatory authorities in one country secure approval by regulatory authorities in other foreign countries or by the FDA.
Outside of the U.S., regulatory agencies generally evaluate and monitor the safety, efficacy and quality of pharmaceutical products and devices and impose regulatory requirements applicable to manufacturing processes, stability testing, record keeping and quality standards, among others. These requirements vary across jurisdiction. In certain countries, including emerging and developing markets, the applicable health care and drug regulatory regimes are continuing to evolve and new requirements may be implemented. Ensuring and maintaining compliance with these evolving requirements is and will continue to be difficult, time-consuming and costly. If we fail to comply with these regulatory requirements or fail to obtain and maintain required approvals, our target market will be reduced and our ability to generate revenue from abroad will be adversely affected.
Our Astora subsidiary could be adversely affected by special risks and requirements related to its previous business of manufacturing medical products.
Our Astora subsidiary is subject to various risks and requirements associated with it previously being a medical equipment manufacturer, which could have adverse effects, including potential and actual product liability claims for any defective or allegedly defective goods that were distributed and increased government scrutiny and/or potential claims regarding the marketing of medical devices.
We are subject to health information privacy and data protection laws that include penalties for noncompliance.
We are subject to a number of privacy and data protection laws and regulations globally. The legislative and regulatory landscape for privacy and data security continues to evolve. There has been increased attention to privacy and data security issues in both developed and emerging markets with the potential to affect directly our business. This includes federal and state laws and regulations in the U.S. as well as in Europe and other markets. There has also been increased enforcement activity in the U.S. particularly related to data security breaches. A violation of these laws or regulations could subject us to penalties, fines and/or possible exclusion from Medicare or Medicaid. Such sanctions could materially and adversely affect our business, results of operations, financial condition and cash flows.
Our international operations could expose us to various risks, including risks related to fluctuations in foreign currency exchange rates.
In 2017, 7% of our total revenues were from customers outside the U.S. Some of these sales were to governmental entities and other organizations with extended payment terms. A number of factors, including differing economic conditions, changes in political climate, differing tax regimes, changes in diplomatic and trade relationships and political or economic instability in the countries where we do business, could affect payment terms and our ability to collect foreign receivables. We have little influence over these factors and changes could have a material adverse impact on our business. In particular, the risk of a debt default by one or more European countries and related European or national financial restructuring efforts may cause volatility in the value of the euro. In addition, foreign sales are influenced by fluctuations in currency exchange rates, primarily the Canadian dollar, euro and British pound.
36
We face risks relating to the expected exit of the United Kingdom from the European Union.
On June 23, 2016, the United Kingdom held a remain-or-leave referendum on the United Kingdom’s membership within the European Union, the result of which favored the Brexit. On March 29, 2017, the Prime Minister of the United Kingdom delivered a formal notice of withdrawal to the European Union. On May 22, 2017, the Council of the European Union (the Council), adopted a decision authorizing the opening of Brexit negotiations with the United Kingdom and formally nominated the European Commission as the European Union negotiator. The Council also adopted negotiating directives for the talks. The negotiation has begun and is expected to involve a process of lengthy negotiations which will likely determine the future terms of the United Kingdom’s relationship with the European Union, as well as whether the United Kingdom will be able to continue to benefit from the European Union’s free trade and similar agreements. The timing of the Brexit is uncertain and potential impact of Brexit on our market share, sales, profitability and results of operations is unclear. If the United Kingdom were to significantly alter its regulations affecting the pharmaceutical industry, we could face significant new costs. It may also be time-consuming and expensive for us to alter our internal operations in order to comply with new regulations. In addition, since a significant proportion of the regulatory framework in the United Kingdom is derived from European Union directives and regulations, the referendum could materially impact the regulatory regime with respect to the approval of our product candidates in the United Kingdom or the European Union. Any delay in obtaining, or an inability to obtain, any regulatory approvals, as a result of Brexit or otherwise, would prevent us from commercializing our product candidates in the United Kingdom and/or the European Union and restrict our ability to generate revenue and achieve and sustain profitability. If any of these outcomes occur, we may be forced to restrict or delay efforts to seek regulatory approval in the United Kingdom and/or European Union for our product candidates, which could significantly and materially harm our business. Similarly, it is unclear at this time what Brexit’s impact will have on our intellectual property rights and the process for obtaining and defending such rights. It is possible that certain intellectual property rights, such as trademarks, granted by the European Union will cease being enforceable in the United Kingdom absent special arrangements to the contrary. Additionally, depending on the terms of Brexit, economic conditions in the United Kingdom, the European Union and global markets may be adversely affected by reduced growth and volatility. The uncertainty both during and after the period of negotiation is also expected to have a negative economic impact and increase volatility in the markets, particularly in the Eurozone. Such volatility and negative economic impact could, in turn, adversely affect the Company’s business, results of operations, financial condition and cash flows.
The risks related to our global operations may adversely impact our revenues, results of operations and financial condition.
Our operations extend to numerous countries outside the U.S. and are subject to the risks of conducting business globally. Conducting business internationally, including the sale and shipping of our products and services across international borders, subjects us to extensive U.S. and foreign governmental trade regulations, such as various anti-bribery laws, including the U.S. Foreign Corrupt Practices Act (the FCPA), export control laws, customs and import laws, and anti-boycott laws. The FCPA and similar anti-corruption laws in other jurisdictions generally prohibit companies and their intermediaries from making improper payments to government officials for the purpose of obtaining or retaining business. We cannot provide assurance that our internal controls and procedures will always protect us from criminal acts committed by our employees or third parties with whom we work. If we are found liable for violations of the FCPA or other applicable laws and regulations, either due to our own acts or out of inadvertence, or due to the acts or inadvertence of others, we could suffer significant criminal, civil and administrative penalties, including, but not limited to, imprisonment of individuals, fines, denial of export privileges, seizure of shipments, restrictions on certain business activities and exclusion or debarment from government contracting. Also, the failure to comply with applicable legal and regulatory obligations could result in the disruption of our shipping and sales activities.
In addition, some countries in which our subsidiaries develop, manufacture or sell products are subject to political, economic and/or social instability. Our non-U.S. R&D, manufacturing and sales operations expose us and our employees, representatives, agents and distributors to risks inherent in operating in non-U.S. jurisdictions. For example, in early 2018, we shifted certain of our U.S. R&D functions to India, where we also manufacture certain of our products. A disruption in our Indian operations could have a material adverse effect on our results of operations and financial condition. These risks include:
• | the imposition of additional U.S. and non-U.S. governmental controls or regulations; |
• | the imposition of costly and lengthy new export licensing requirements; |
• | the imposition of U.S. and/or international sanctions against a country, company, person or entity with whom we do business that would restrict or prohibit continued business with the sanctioned country, company, person or entity; |
• | economic and political instability or disruptions, including local and regional instability, or disruptions due to natural disasters, such as severe weather and geological events, disruptions due to civil unrest and hostilities, rioting, military activity, terror attacks or armed hostilities; |
• | changes in duties and tariffs, license obligations and other non-tariff barriers to trade; |
• | the imposition of new trade restrictions; |
• | supply disruptions and increases in energy and transportation costs; |
• | the imposition of restrictions on the activities of foreign agents, representatives and distributors; |
• | changes in tax laws both in the U.S. and abroad and the imposition by non-U.S. tax authorities of significant fines, penalties and additional taxes; |
37
• | pricing pressure that we may experience internationally; |
• | fluctuations in foreign currency exchange rates; |
• | competition from local, regional and international competitors; |
• | difficulties and costs of staffing and managing foreign operations, including cultural and differences and additional employment regulations, union workforce negotiations and potential disputes in the jurisdictions in which we operate; |
• | laws and business practices favoring local companies; |
• | difficulties in enforcing or defending intellectual property rights; and |
• | exposure to different legal and political standards due to our conducting business in foreign countries. |
We also face the risk that some of our competitors have more experience with operations in such countries or with international operations generally and may be able to manage unexpected crises more easily. Furthermore, whether due to language, cultural or other differences, public and other statements that we make may be misinterpreted, misconstrued or taken out of context in different jurisdictions. Moreover, the internal political stability of, or the relationship between, any country or countries where we conduct business operations may deteriorate, including relationships between the U.S. and other countries. Changes in a country’s political stability or the state of relations between any such countries are difficult to predict and could adversely affect our operations. Any such changes could lead to a decline in our profitability and/or adversely impact our ability to do business. Any meaningful deterioration of the political or social stability in and/or diplomatic relations between any countries in which we or our partners and suppliers do business could have a material adverse effect on our operations.
We cannot provide assurance that one or more of these factors will not harm our business. Any material decrease in our non-U.S. R&D, manufacturing or sales could adversely impact our results of operations and financial condition.
We have a substantial amount of indebtedness which could adversely affect our financial position and prevent us from fulfilling our obligations under such indebtedness, which may require us to refinance all or part of our then outstanding indebtedness. Any refinancing of this substantial indebtedness could be at significantly higher interest rates. Despite our current level of indebtedness, we may still be able to incur substantially more indebtedness. This could increase the risks associated with our substantial indebtedness.
We currently have a substantial amount of indebtedness. As of December 31, 2017, we have total debt of approximately $8.38 billion in aggregate principal amount. Our substantial indebtedness may:
• | make it difficult for us to satisfy our financial obligations, including making scheduled principal and interest payments on our indebtedness; |
• | limit our ability to borrow additional funds for working capital, capital expenditures, acquisitions or other general business purposes; |
• | limit our ability to use our cash flow or obtain additional financing for future working capital, capital expenditures, acquisitions or other general business purposes; |
• | expose us to the risk of rising interest rates with respect to the borrowings under our variable rate indebtedness; |
• | require us to use a substantial portion of our cash on hand and/or from future operations to make debt service payments; |
• | limit our flexibility to plan for, or react to, changes in our business and industry; |
• | place us at a competitive disadvantage compared to our less leveraged competitors; and |
• | increase our vulnerability to the impact of adverse economic and industry conditions. |
If we are unable to pay amounts due under our outstanding indebtedness or to fund other liquidity needs, such as future capital expenditures or contingent liabilities as a result of adverse business developments, including expenses related to our ongoing and future legal proceedings and governmental investigations as well as increased pricing pressures or otherwise, we may be required to refinance all or part of our then existing indebtedness, sell assets, reduce or delay capital expenditures or seek to raise additional capital, any of which could have a material adverse effect on our operations. There can be no assurance that we will be able to accomplish any of these alternatives on terms acceptable to us, or at all. Any refinancing of this substantial indebtedness could be at significantly higher interest rates, which will depend on the conditions of the markets and our financial condition at such time. In addition, we and our subsidiaries may be able to incur substantial additional indebtedness in the future. If new indebtedness is added to our current debt levels, the related risks that we and our subsidiaries now face could intensify.
38
Covenants in our debt agreements restrict our business in many ways, a default of which may result in acceleration of certain of our indebtedness.
We are subject to various covenants in the instruments governing our debt that limit our ability and/or our restricted subsidiaries’ ability to, among other things:
• | incur or assume liens or additional debt or provide guarantees in respect of obligations of other persons; |
• | issue redeemable stock and preferred stock; |
• | pay dividends or distributions or redeem or repurchase capital stock; |
• | prepay, redeem or repurchase debt; |
• | make loans, investments and capital expenditures; |
• | enter into agreements that restrict distributions from our subsidiaries; |
• | sell assets and capital stock of our subsidiaries; |
• | enter into certain transactions with affiliates; and |
• | consolidate or merge with or into, or sell substantially all of our assets to, another person. |
A breach of any of these covenants could result in a default under our indebtedness. If there were an event of default under any of the agreements relating to our outstanding indebtedness, the holders of the defaulted debt could cause all amounts outstanding with respect to that debt to be due and payable immediately, terminate all commitments to extend further credit, foreclose against all the assets comprising the collateral securing or otherwise supporting the debt and pursue other legal remedies. The instruments governing our debt contain cross-default or cross-acceleration provisions that may cause all of the debt issued under such instruments to become immediately due and payable as a result of a default under an unrelated debt instrument. An event of default or an acceleration under one debt agreement could cause a cross-default or cross-acceleration of other debt agreements. Our assets and cash flows may be insufficient to fully repay borrowings under our outstanding debt instruments if the obligations thereunder were accelerated upon an event of default. We may need to conduct asset sales or elect to pursue other alternatives, including proceedings under applicable insolvency laws relating to some or all of our business. Any or all of the above could have a material adverse effect on our business, financing activities, financial conditions and operations. For a description of our indebtedness, see Note 13. Debt in the Consolidated Financial Statements, included in Part IV, Item 15 of this report "Exhibits, Financial Statement Schedules".
U.S. federal income tax reform could adversely affect us.
On December 22, 2017, U.S. federal tax legislation, commonly referred to as the Tax Cuts and Jobs Act of 2017 (TCJA), was signed into law, significantly altering the U.S. Internal Revenue Code effective, in substantial part, January 1, 2018. The TCJA, among other things, includes:
• | changes to U.S. federal tax rates; |
• | expanded limitations on the deductibility of interest; |
• | immediate expensing of capital expenditures; |
• | the migration from a “worldwide” system of taxation to a territorial system; |
• | the creation of an anti-base erosion minimum tax system; and |
• | the modification or repeal of many business deductions and credits. |
Additionally, the TCJA eliminates the ability to carry back any future net operating losses and only allows for carryforwards, the utilization of which is limited to 80% of taxable income in a given carryforward year. This could affect the timing of our ability to utilize net operating losses in the future.
The aforementioned changes could, individually or in aggregate, increase our future effective tax rate and adversely impact our results of operations and cash flows from operations. Finally, prospective or retroactive regulatory and administrative guidance relating to the TCJA could adversely impact our businesses and our current and future projections of U.S. cash taxes.
Further future changes to tax laws could materially adversely affect us.
Under current law, we are expected to be treated as a non-U.S. corporation for U.S. federal income tax purposes. However, changes to the rules in Section 7874 of the Code or regulations promulgated thereunder or other guidance issued by the Treasury or the IRS could adversely affect our status as a non-U.S. corporation for U.S. federal income tax purposes, and any such changes could have prospective or retroactive application to us, Endo Health Solutions Inc. (EHSI) and/or their respective shareholders and affiliates. Consequently, there can be no assurance that there will not exist in the future a change in law that might cause us to be treated as a U.S. corporation for U.S. federal income tax purposes, including with retroactive effect.
In addition, recent Irish proposals could create a “controlled foreign corporation” tax regime and limit deductibility of certain interest and/or other payments made by our Irish subsidiaries from which we currently benefit. If such changes in law were enacted, it could have a material adverse effect on our financial statements and cash flow from operations.
39
In addition, Ireland’s Department of Finance, the Organization for Economic Co-operation and Development, the European Commission and other Government agencies in jurisdictions where we and our affiliates do business have had an extended focus on issues related to the taxation of multinational corporations and there are several current proposals that, if enacted, would substantially change the taxation of multinational corporations. One example is in the area of “base erosion and profit shifting,” where payments are made between affiliates from a jurisdiction with high tax rates to a jurisdiction with lower tax rates. As a result, the tax laws in the jurisdictions in which we operate could change on a prospective or retroactive basis, and any such changes could increase our effective tax rate, potentially materially adversely impacting our financial statements and cash flows from operations.
The IRS may not agree with the conclusion that we should be treated as a non-U.S. corporation for U.S. federal income tax purposes.
Although we are incorporated in Ireland, the U.S. Internal Revenue Service (IRS) may assert that we should be treated as a U.S. corporation (and, therefore, a U.S. tax resident) for U.S. federal income tax purposes pursuant to Section 7874 of the Internal Revenue Code (the Code). A corporation is generally considered a tax resident in the jurisdiction of its organization or incorporation for U.S. federal income tax purposes. Because we are an Irish incorporated entity, we would generally be classified as a non-U.S. corporation (and, therefore, a non-U.S. tax resident) under these rules. Section 7874 provides an exception pursuant to which a non-U.S. incorporated entity may, in certain circumstances, be treated as a U.S. corporation for U.S. federal income tax purposes.
Under Section 7874, we would be treated as a non-U.S. corporation for U.S. federal income tax purposes if the former shareholders of EHSI owned, immediately after the Paladin transaction (within the meaning of Section 7874), less than 80% (by both vote and value) of Endo shares by reason of holding shares in EHSI (the ownership test). The former EHSI shareholders owned less than 80% (by both vote and value) of the shares in Endo after the Paladin merger by reason of their ownership of shares in EHSI. As a result, under current law, we are expected to be treated as a non-U.S. corporation for U.S. federal income tax purposes. There is limited guidance regarding the application of Section 7874, including with respect to the provisions regarding the application of the ownership test. Our obligation to complete the Paladin transactions was conditional upon its receipt of a Section 7874 opinion from our counsel, Skadden, Arps, Slate, Meagher & Flom LLP (Skadden), dated as of the closing date of the Paladin transaction and subject to certain qualifications and limitations set forth therein, to the effect that Section 7874 and the regulations promulgated thereunder should not apply in such a manner so as to cause Endo to be treated as a U.S. corporation for U.S. federal income tax purposes from and after the closing date. However, an opinion of tax counsel is not binding on the IRS or a court. Therefore, there can be no assurance that the IRS will not take a position contrary to Skadden’s Section 7874 opinion or that a court will not agree with the IRS in the event of litigation.
The effective rate of taxation upon our results of operations is dependent on multi-national tax considerations.
We earn a portion of our income outside the U.S. That portion of our earnings is taxed at the more favorable rates applicable to the activities undertaken by our subsidiaries outside of the U.S. Our effective income tax rate in the future could be adversely affected by a number of factors, including changes in the mix of earnings in countries with differing statutory tax rates, changes in the valuation of deferred tax assets and liabilities, changes in tax laws, the outcome of income tax audits and the repatriation of earnings from our subsidiaries for which we have not provided for taxes. Cash repatriations are subject to restrictions in certain jurisdictions and may be subject to withholding and other taxes. We are subject to the examination of our tax returns and tax arrangements by the IRS and other tax and governmental authorities. For example, our transfer pricing is and has been the subject of tax authority audits, and may be the subject of future audits by tax authorities, and we may be subject to tax assessments or the reallocation of income among our subsidiaries. We regularly assess all of these matters to determine the adequacy of our tax provisions, which are subject to significant discretion. Although we believe our tax provisions are adequate, the final determination of tax audits and any related disputes could be materially different from our historical income tax provisions and accruals. The results of audits and disputes could have a material adverse effect on our financial statements for the period or periods for which the applicable final determinations are made.
We may not be able to successfully maintain our low tax rates or other tax positions, which could adversely affect our businesses and financial condition, results of operations and growth prospects.
We are incorporated in Ireland and also maintain subsidiaries in, amongst other jurisdictions, the United States, Canada, India, Bermuda, the United Kingdom and Luxembourg. The IRS and other taxing authorities may continue to challenge our intercompany arrangements. Responding to or defending such a challenge could be expensive, consume time and other resources and divert management’s attention. We cannot predict whether taxing authorities will conduct an audit challenging our tax positions, the cost involved in responding to and defending any such audit and resulting litigation, or the outcome. If we are unsuccessful, we may be required to pay taxes for prior periods, interest, fines or penalties, and may be obligated to pay increased taxes in the future or repay certain tax refunds, any of which could require us to reduce our operating expenses, decrease efforts in support of our products or seek to raise additional funds, all of which could have a material adverse effect on our business, financial statements, results of operations and growth prospects.
40
Our ability to use U.S. tax attributes to offset U.S. taxable income may be limited.
Existing and future tax laws and regulations may limit our ability to use U.S. tax attributes including, but not limited to, net operating losses, to offset U.S. taxable income. For a period of time following the 2014 Paladin transaction, Section 7874 of the Code precludes our U.S. affiliates from utilizing U.S. tax attributes to offset taxable income if we complete certain transactions with related non-U.S. subsidiaries. In addition, the U.S. Treasury Department has issued temporary and proposed regulations related to corporate inversions and earnings stripping. The limitations on the use of certain tax attributes and deductions in these regulations are in addition to existing rules that could impose more restrictive limitations in the event that cumulative changes in our stock ownership within a three-year period exceed certain thresholds. Such changes or the adoption of additional limitations could impact our overall utilization of deferred tax assets, potentially resulting in a material adverse impact to our financial statements and cash flows from operations.
Any attempts to take us over will be subject to Irish Takeover Rules and subject to review by the Irish Takeover Panel.
We are subject to Irish Takeover Rules, under which our board of directors (Board of Directors) will not be permitted to take any action which might frustrate an offer for our ordinary shares once it has received an approach which may lead to an offer or has reason to believe an offer is imminent.
If pharmaceutical companies are successful in limiting the use of generics through their legislative, regulatory and other efforts, our sales of generic products may suffer.
Many pharmaceutical companies increasingly have used state and federal legislative and regulatory means to delay generic competition. These efforts have included:
• | pursuing new patents for existing products which may be granted just before the expiration of earlier patents, which could extend patent protection for additional years; |
• | using the Citizen Petition process (e.g., under 21 C.F.R. s. 10.30) to request amendments to FDA standards; |
• | attempting to use the legislative and regulatory process to have drugs reclassified or rescheduled or to set definitions of abuse deterrent formulations to protect brand company patents and profits; and |
• | engaging in state-by-state initiatives to enact legislation that restricts the substitution of some generic drugs. |
If pharmaceutical companies or other third parties are successful in limiting the use of generic products through these or other means, our sales of generic products may decline. If we experience a material decline in generic product sales, our results of operations, financial condition and cash flows will suffer.
We have limited experience in manufacturing biologic products and may encounter difficulties in our manufacturing processes, which could materially adversely affect our results of operations or delay or disrupt manufacture of those of our products that are reliant upon our manufacturing operations.
The manufacture of biologic products requires significant expertise and capital investment. Although we manufacture CCH, the active ingredient in XIAFLEX®, in our Horsham, Pennsylvania facility, we have limited experience in manufacturing CCH or any other biologic products. Biologics such as CCH require processing steps that are highly complex and generally more difficult than those required for most chemical pharmaceuticals. In addition, TESTOPEL® is manufactured using a unique, proprietary process. If our manufacturing processes at the Horsham or Rye, New York facilities are disrupted, it may be difficult to find alternate manufacturing sites. We may encounter difficulties with the manufacture of the active ingredient of XIAFLEX® or TESTOPEL®, which could delay, disrupt or halt our manufacture of XIAFLEX® and TESTOPEL®, respectively, require write-offs which may affect our financial results, result in product recalls or product liability claims or otherwise materially affect our results of operations.
We are incorporated in Ireland, and Irish law differs from the laws in effect in the United States and may afford less protection to, or otherwise adversely affect, our shareholders.
Our shareholders may have more difficulty protecting their interests than would shareholders of a corporation incorporated in a jurisdiction of the United States. As an Irish company, we are governed by the Irish Companies Act 2014 (the Companies Act). The Companies Act and other relevant aspects of Irish law differ in some material respects from laws generally applicable to U.S. corporations and shareholders, including, among others, the provisions relating to interested director and officer transactions, acquisitions, takeovers, shareholder lawsuits and indemnification of directors. For example, under Irish law, the duties of directors and officers of a company are generally owed to the company only. As a result, shareholders of Irish companies generally do not have a personal right of action against the directors or officers of a company and may pursue a right of action on behalf of the company only in limited circumstances. In addition, depending on the circumstances, the acquisition, ownership and/or disposition of our ordinary shares may subject individuals to different or additional tax consequences under Irish law including, but not limited to, Irish stamp duty, dividend withholding tax and capital acquisitions tax.
41
We are an Irish company and it may be difficult to enforce judgments against us or certain of our officers and directors.
We are incorporated in Ireland and a substantial portion of our assets are located in jurisdictions outside the U.S. In addition, some of our officers and directors reside outside the U.S., and some or all of their respective assets are or may be located in jurisdictions outside of the U.S. Therefore, it may be difficult for investors to effect service of process against us or such officers or directors or to enforce against us or them judgments of U.S. courts predicated upon civil liability provisions of the U.S. federal securities laws.
There is no treaty between Ireland and the U.S. providing for the reciprocal enforcement of foreign judgments. The following requirements must be met before the foreign judgment will be deemed to be enforceable in Ireland:
• | the judgment must be for a definite sum; |
• | the judgment must be final and conclusive; and |
• | the judgment must be provided by a court of competent jurisdiction. |
An Irish court will also exercise its right to refuse judgment if the foreign judgment was obtained by fraud, if the judgment violated Irish public policy, if the judgment is in breach of natural justice or if it is irreconcilable with an earlier judgment. Further, an Irish court may stay proceedings if concurrent proceedings are being brought elsewhere. Judgments of U.S. courts of liabilities predicated upon U.S. federal securities laws may not be enforced by Irish courts if deemed to be contrary to public policy in Ireland.
Our failure to comply with various laws protecting the confidentiality of certain patient health information could result in penalties and reputational damage.
Certain countries in which we operate have, or are developing, laws protecting the confidentiality of certain patient health information. European Union (EU) member states and other jurisdictions have adopted data protection laws and regulations, which impose significant compliance obligations.
For example, the EU Data Protection Directive, as implemented into national laws by the EU member states, imposes strict obligations and restrictions on the ability to collect, analyze and transfer personal data, including health data from clinical trials and adverse event reporting. Data protection authorities from different EU member states may interpret the EU Data Protection Directive and national laws differently, which adds to the complexity of processing personal data in the EU, and guidance on implementation and compliance practices are often updated or otherwise revised. The EU Data Protection Directive prohibits the transfer of personal data to countries outside of the EU member states that are not considered by the European Commission to provide an adequate level of data protection, and transfers of personal data to such countries can only be made in certain circumstances, such as where the transfer is required by law or the individual to whom the personal data relates has given his or her consent to the transfer. We have policies and practices that we believe make us compliant with applicable privacy regulations. Nevertheless, any failure to comply with the rules arising from the EU Data Protection Directive and related national laws of EU member states, as well as privacy laws in other countries in which we operate, could lead to government enforcement actions and significant sanctions or penalties against us, adversely impact our results of operations and subject us to negative publicity.
The EU Data Protection Regulation, which will replace the current EU Data Protection Directive, was adopted in 2016 and will become enforceable on May 25, 2018. The EU Data Protection Regulation will introduce new data protection requirements in the EU and substantial fines for breaches of the data protection rules may increase our responsibility and liability in relation to personal data that we process, and we may be required to put in place additional mechanisms to ensure compliance with the new EU data protection rules. Such additional responsibility and/or liabilities may materially affect our operations.
Item 1B. Unresolved Staff Comments
None.
42
Item 2. Properties
Our significant properties at December 31, 2017 are as follows:
Location | Purpose | Approximate Square Footage | Ownership | Lease Term End Date | |||||
Corporate Properties: | |||||||||
Dublin, Ireland | Global Corporate Headquarters | 17,000 | Leased | August 2024 | |||||
Malvern, Pennsylvania | U.S. Corporate Headquarters | 300,000 | Leased (1) | December 2024 | |||||
Chesterbrook, Pennsylvania | Former Auxilium Headquarters | 75,000 | Leased (2) | December 2023 | |||||
U.S. Branded Pharmaceuticals Segment Properties: | |||||||||
Cranbury, New Jersey | Manufacturing | 33,000 | Leased | February 2023 | |||||
Rye, New York | Manufacturing | 20,000 | Leased/Owned (3) | March 2019 | |||||
Horsham, Pennsylvania | Administration/Research & Development | 40,000 | Leased | July 2028 | |||||
Horsham, Pennsylvania | Manufacturing | 50,000 | Leased | July 2028 | |||||
U.S. Generic Pharmaceuticals Segment Properties: | |||||||||
Chestnut Ridge, New York | Administration/Distribution | 135,000 | Owned | N/A | |||||
Chestnut Ridge, New York | Administration/Manufacturing | 92,000 | Owned | N/A | |||||
Chestnut Ridge, New York | Administration/Research & Development | 62,000 | Leased | December 2024 | |||||
Chestnut Ridge, New York | Administration/Quality Assurance | 40,000 | Owned | N/A | |||||
Huntsville, Alabama | Distribution/Manufacturing | 320,000 | Owned (4) | N/A | |||||
Huntsville, Alabama | Generic Pharmaceuticals Distribution | 280,000 | Owned (4) | N/A | |||||
Huntsville, Alabama | Distribution/Manufacturing | 180,000 | Owned (4) | N/A | |||||
Huntsville, Alabama | Distribution | 37,000 | Leased (4) | September 2019 | |||||
Irvine, California | Manufacturing/Distribution | 66,000 | Leased | December 2022 | |||||
Irvine, California | Administration/Manufacturing/Quality Assurance | 66,000 | Leased | December 2022 | |||||
Irvine, California | Research & Development | 27,000 | Leased | August 2018 | |||||
Montebello, New York | Distribution | 189,000 | Leased | January 2024 | |||||
Chennai, India | Administration/Manufacturing/Research & Development | 95,000 | Owned | N/A | |||||
Chennai, India | Research & Development | 24,000 | Leased | May 2021 | |||||
Chennai, India | Administration/Manufacturing/Research & Development | 130,000 | Owned | N/A | |||||
Chennai, India | Administration/Manufacturing/Research & Development | 190,000 | Owned | N/A | |||||
Mumbai, India | Research & Development | 20,000 | Leased | August 2022 | |||||
Rochester, Michigan | Administration/Manufacturing/Research & Development | 407,000 | Owned | N/A | |||||
International Pharmaceuticals Segment Properties: | |||||||||
Montreal, Canada | Paladin Headquarters | 26,000 | Leased | December 2023 | |||||
__________
(1) | Approximately 90,000 square feet of this property has been subleased. |
(2) | This property has been subleased. |
(3) | Approximately 11,000 square feet of this property is leased and 9,000 square feet is owned. |
(4) | As discussed in Note 4. Restructuring of the Consolidated Financial Statements of Part IV, Item 15 of this report "Exhibits, Financial Statement Schedules", as a result of the 2017 U.S. Generic Pharmaceuticals Restructuring Initiative, the Company is currently in the process of closing its Huntsville, Alabama facilities and expects to complete such closures by the end of the third quarter of 2018. |
Item 3. Legal Proceedings
The disclosures under Note 14. Commitments and Contingencies of the Consolidated Financial Statements, included in Part IV, Item 15 of this report "Exhibits, Financial Statement Schedules" are incorporated into this Part I, Item 3 by reference.
Item 4. Mine Safety Disclosures
Not applicable.
43
PART II
Item 5. Market for Registrant’s Common Equity, Related Stockholder Matters and Issuer Purchases of Equity Securities
Market Information. Our ordinary shares are traded on the NASDAQ under the ticker symbol “ENDP.” The following table sets forth the quarterly high and low share price information for the periods indicated. The prices shown represent quotations between dealers, without adjustment for retail markups, markdowns or commissions, and may not represent actual transactions.
Endo Ordinary Shares | |||||||
NASDAQ (US$) | |||||||
High | Low | ||||||
Year Ended December 31, 2017 | |||||||
1st Quarter | $ | 17.99 | $ | 9.70 | |||
2nd Quarter | $ | 14.15 | $ | 10.15 | |||
3rd Quarter | $ | 12.54 | $ | 7.41 | |||
4th Quarter | $ | 9.20 | $ | 5.77 | |||
Year Ended December 31, 2016 | |||||||
1st Quarter | $ | 61.14 | $ | 25.98 | |||
2nd Quarter | $ | 35.34 | $ | 12.56 | |||
3rd Quarter | $ | 24.93 | $ | 15.45 | |||
4th Quarter | $ | 21.87 | $ | 13.83 | |||
Holders. As of February 20, 2018, we estimate that there were approximately 77 holders of record of our ordinary shares.
Dividends. We have never declared or paid any cash dividends on our ordinary shares and we currently have no plans to declare a dividend. Subject to limitations imposed by Irish law and the various agreements and indentures governing our indebtedness, we are permitted to pay dividends.
44
Performance Graph. The following graph provides a comparison of the cumulative total shareholder return on the Company’s ordinary shares with that of the cumulative total shareholder return on the (i) NASDAQ Composite Index and (ii) the NASDAQ Pharmaceutical Index, commencing on December 31, 2012 and ending December 31, 2017. The graph assumes $100 invested on December 31, 2012 in the Company’s ordinary shares and in each of the comparative indices. Our historic share price performance is not necessarily indicative of future share price performance.
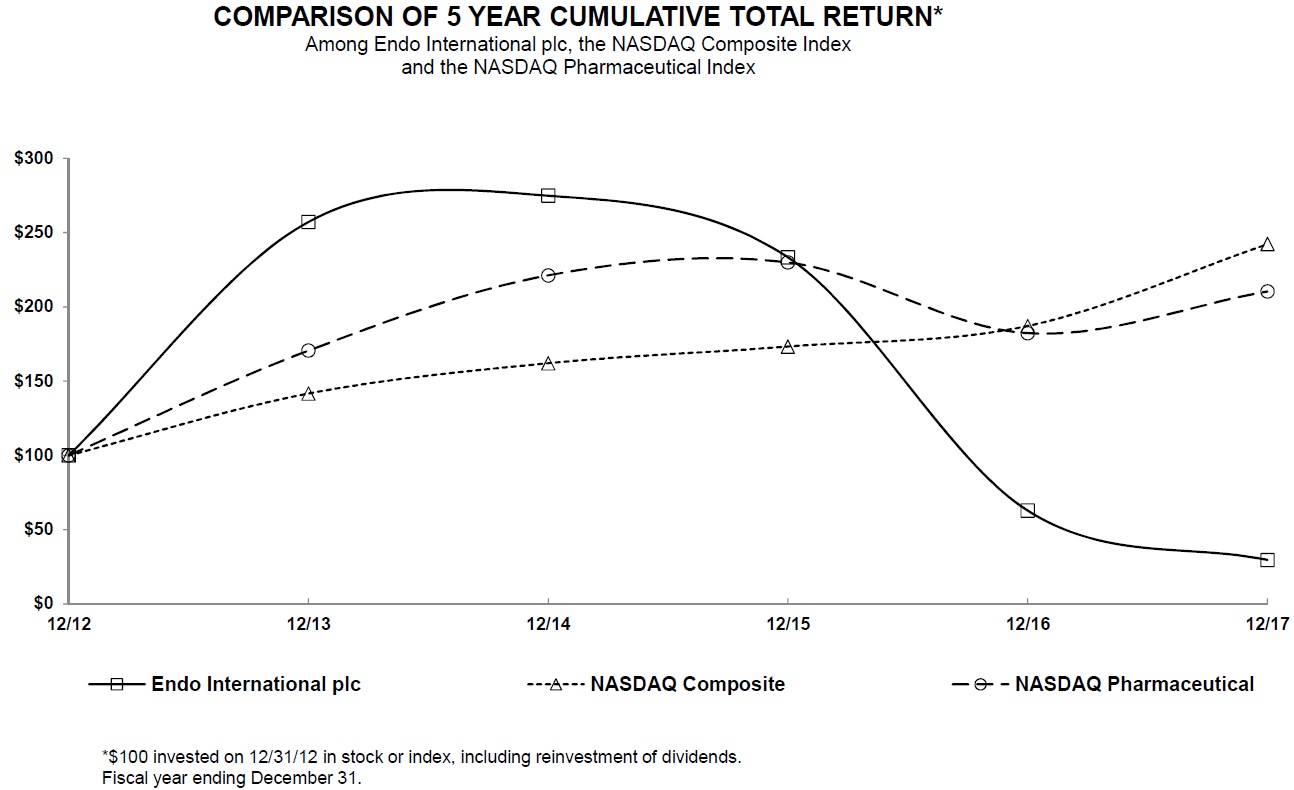
December 31, | |||||||||||||||||||||||
2012 | 2013 | 2014 | 2015 | 2016 | 2017 | ||||||||||||||||||
Endo International plc | $ | 100.00 | $ | 257.19 | $ | 274.95 | $ | 233.40 | $ | 62.79 | $ | 29.55 | |||||||||||
NASDAQ Composite Index | $ | 100.00 | $ | 141.63 | $ | 162.09 | $ | 173.33 | $ | 187.19 | $ | 242.29 | |||||||||||
NASDAQ Pharmaceutical Index | $ | 100.00 | $ | 170.57 | $ | 221.26 | $ | 229.97 | $ | 182.33 | $ | 210.44 | |||||||||||
Recent sales of unregistered securities; Use of proceeds from registered securities. There were no unregistered sales of equity securities by the Company during the three years ended December 31, 2017.
45
Purchase of Equity Securities by the issuer and affiliated purchasers. The following table reflects purchases of Endo International plc ordinary shares by the Company during the three months ended December 31, 2017:
Period | Total Number of Shares Purchased | Average Price Paid per Share | Total Number of Shares Purchased as Part of Publicly Announced Plan | Approximate Dollar Value of Shares that May Yet be Purchased Under the Plan (1) | |||||||||
October 1, 2017 to October 31, 2017 | — | — | — | $ | 2,250,000,000 | ||||||||
November 1, 2017 to November 30, 2017 | — | — | — | $ | 2,250,000,000 | ||||||||
December 1, 2017 to December 31, 2017 | — | — | — | $ | 2,250,000,000 | ||||||||
Three months ended December 31, 2017 | — | — | |||||||||||
__________
(1) | On April 28, 2015, our Board of Directors resolved to approve a share buyback program (the 2015 Share Buyback Program), authorizing the Company to redeem in the aggregate up to $2.5 billion of its outstanding ordinary shares. In accordance with Irish Law and the Company’s Articles of Association, all ordinary shares redeemed shall be cancelled upon redemption. Redemptions under this program may be made from time to time in open market or negotiated transactions or otherwise, as determined by the Board of Directors. This program does not obligate the Company to redeem any particular amount of ordinary shares. Future redemptions, if any, will depend on factors such as levels of cash generation from operations, cash requirements for investment in the Company's business, repayment of future debt, if any, the then current share price, market conditions, legal limitations and other factors. The 2015 Share Buyback Program may be suspended, modified or discontinued at any time. During November 2015, the Company redeemed and cancelled 4.4 million ordinary shares totaling $250.0 million, not including related fees. |
46
Item 6. Selected Financial Data
The consolidated financial information presented below has been derived from our financial statements. The selected historical consolidated financial data presented below should be read in conjunction with Part II, Item 7 of this report "Management’s Discussion and Analysis of Financial Condition and Results of Operations" and Part II, Item 8 of this report "Financial Statements and Supplementary Data". The selected data in this section is not intended to replace the Consolidated Financial Statements. The information presented below is not necessarily indicative of the results of our future operations. See Note 3. Discontinued Operations and Assets and Liabilities Held for Sale in the Consolidated Financial Statements, included in Part IV, Item 15 of this report "Exhibits, Financial Statement Schedules" and below for further discussion on reclassifications to conform to the current presentation.
Year Ended December 31, | |||||||||||||||||||
2017 | 2016 | 2015 | 2014 | 2013 | |||||||||||||||
(dollars in thousands, except per share data) | |||||||||||||||||||
Consolidated Statement of Operations Data: | |||||||||||||||||||
Total revenues | $ | 3,468,858 | $ | 4,010,274 | $ | 3,268,718 | $ | 2,380,683 | $ | 2,124,681 | |||||||||
Operating (loss) income from continuing operations | (960,065 | ) | (3,471,515 | ) | (933,475 | ) | 326,482 | 517,225 | |||||||||||
(Loss) income from continuing operations before income tax | (1,483,004 | ) | (3,923,856 | ) | (1,437,864 | ) | 99,875 | 385,366 | |||||||||||
(Loss) income from continuing operations | (1,232,711 | ) | (3,223,772 | ) | (300,399 | ) | 61,608 | 241,624 | |||||||||||
Discontinued operations, net of tax | (802,722 | ) | (123,278 | ) | (1,194,926 | ) | (779,792 | ) | (874,038 | ) | |||||||||
Consolidated net loss | (2,035,433 | ) | (3,347,050 | ) | (1,495,325 | ) | (718,184 | ) | (632,414 | ) | |||||||||
Less: Net income (loss) attributable to noncontrolling interests | — | 16 | (283 | ) | 3,135 | 52,925 | |||||||||||||
Net loss attributable to Endo International plc | $ | (2,035,433 | ) | $ | (3,347,066 | ) | $ | (1,495,042 | ) | $ | (721,319 | ) | $ | (685,339 | ) | ||||
Basic and Diluted net (loss) income per share attributable to Endo International plc: | |||||||||||||||||||
Continuing operations—basic | $ | (5.52 | ) | $ | (14.48 | ) | $ | (1.52 | ) | $ | 0.42 | $ | 2.13 | ||||||
Discontinued operations—basic | (3.60 | ) | (0.55 | ) | (6.07 | ) | (5.33 | ) | (8.18 | ) | |||||||||
Basic | $ | (9.12 | ) | $ | (15.03 | ) | $ | (7.59 | ) | $ | (4.91 | ) | $ | (6.05 | ) | ||||
Continuing operations—diluted | $ | (5.52 | ) | $ | (14.48 | ) | $ | (1.52 | ) | $ | 0.40 | $ | 2.02 | ||||||
Discontinued operations—diluted | (3.60 | ) | (0.55 | ) | (6.07 | ) | (5.00 | ) | (7.74 | ) | |||||||||
Diluted | $ | (9.12 | ) | $ | (15.03 | ) | $ | (7.59 | ) | $ | (4.60 | ) | $ | (5.72 | ) | ||||
Shares used to compute net loss per share attributable to Endo International plc—Basic | 223,198 | 222,651 | 197,100 | 146,896 | 113,295 | ||||||||||||||
Shares used to compute net loss per share attributable to Endo International plc—Diluted | 223,198 | 222,651 | 197,100 | 156,730 | 119,829 | ||||||||||||||
Cash dividends declared per share | $ | — | $ | — | $ | — | $ | — | $ | — | |||||||||
47
As of and for the Year Ended December 31, | |||||||||||||||||||
2017 | 2016 | 2015 | 2014 | 2013 | |||||||||||||||
(dollars in thousands) | |||||||||||||||||||
Consolidated Balance Sheet Data: | |||||||||||||||||||
Cash and cash equivalents | $ | 986,605 | $ | 517,250 | $ | 272,348 | $ | 405,696 | $ | 526,597 | |||||||||
Total assets | $ | 11,635,580 | $ | 14,275,109 | $ | 19,350,336 | $ | 10,824,169 | $ | 6,510,810 | |||||||||
Long-term debt, less current portion, net | $ | 8,242,032 | $ | 8,141,378 | $ | 8,251,657 | $ | 4,100,627 | $ | 3,262,798 | |||||||||
Other long-term obligations, including capitalized leases | $ | 687,759 | $ | 797,397 | $ | 1,656,391 | $ | 1,149,353 | $ | 910,552 | |||||||||
Total Endo International plc shareholders’ equity | $ | 484,880 | $ | 2,701,589 | $ | 5,968,030 | $ | 2,374,757 | $ | 526,018 | |||||||||
Noncontrolling interests | $ | — | $ | — | $ | (54 | ) | $ | 33,456 | $ | 59,198 | ||||||||
Total shareholders’ equity | $ | 484,880 | $ | 2,701,589 | $ | 5,967,976 | $ | 2,408,213 | $ | 585,216 | |||||||||
Other Financial Data: | |||||||||||||||||||
Net cash provided by operating activities | $ | 553,985 | $ | 528,143 | $ | 118,501 | $ | 372,964 | $ | 310,534 | |||||||||
Net cash provided by (used in) investing activities | $ | 104,583 | $ | (177,552 | ) | $ | (6,183,764 | ) | $ | (1,008,616 | ) | $ | (113,639 | ) | |||||
Net cash (used in) provided by financing activities | $ | (166,993 | ) | $ | (397,186 | ) | $ | 6,001,992 | $ | 267,669 | $ | 567,508 | |||||||
As further discussed in Note 2. Summary of Significant Accounting Policies of the Consolidated Financial Statements, included in Part IV, Item 15 of this report "Exhibits, Financial Statement Schedules", the Company has adopted certain accounting pronouncements in 2017. As a result, certain prior period amounts have been reclassified to conform to current period presentation.
The comparability of the forgoing information is impacted by various factors. The Company has recorded certain charges for asset impairments and litigation-related and other matters during each year presented, portions of which are reported as Discontinued operations, net of tax in the Consolidated Statements of Operations. The Company has completed a number of significant business combinations since 2013, certain of which resulted in significant financing activities. These business combinations had a significant impact on the Company’s financial statements in their respective years of acquisition and in subsequent years. These impacts result from the consideration transferred by the Company for the acquisitions, the initial and subsequent purchase accounting for the acquired entities’ assets and liabilities and the post-acquisition results of operations. The Company has also ceased operations and/or divested of certain businesses.
Through the dates of: (i) the sale of the HealthTronics, Inc. (HealthTronics) business in February 2014, (ii) the sale of the Men’s Health and Prostate Health businesses in August 2015 and (iii) the wind down of the Women’s Health business (referred to herein as Astora) in March 2016, the assets and liabilities of all of these aforementioned businesses are classified as held for sale in the Consolidated Balance Sheets for all periods presented, except in the case of certain assets and liabilities that were to remain with the Company after sale including, among others, the mesh-related product liability accrual, related Qualified Settlement Funds (QSFs) and certain intangible and fixed assets. Additionally, the assets and liabilities of Litha Healthcare Group Limited and related Sub-Sahara African business assets (Litha), which was sold on July 3, 2017, are classified as held for sale in the Consolidated Balance Sheet as of December 31, 2016. The operating results of the HealthTronics business and the entire American Medical Systems Holdings, Inc. (AMS) business, which includes Men’s Health, Prostate Health and Astora, are reported as Discontinued operations, net of tax in the Consolidated Statements of Operations for all periods presented. For additional information, see Note 3. Discontinued Operations and Assets and Liabilities Held for Sale in the Consolidated Financial Statements, included in Part IV, Item 15 of this report "Exhibits, Financial Statement Schedules".
For further information regarding the comparability of the financial data presented in the tables above and factors that may impact comparability of future results, see Item 7. Management’s Discussion and Analysis of Financial Condition and Results of Operations as well as the Consolidated Financial Statements and related notes included in this report and previously filed Annual Reports on Form 10-K.
48
Item 7. Management’s Discussion and Analysis of Financial Condition and Results of Operations
The following Management’s Discussion and Analysis of Financial Condition and Results of Operations describes the principal factors affecting the results of operations, liquidity and capital resources and critical accounting estimates of Endo International plc. This discussion should be read in conjunction with our audited Consolidated Financial Statements and related notes thereto. Except for the historical information contained in this Report, including the following discussion, this Report contains forward-looking statements that involve risks and uncertainties. See "Forward-Looking Statements" beginning on page i of this Report.
Unless otherwise indicated or required by the context, references throughout to “Endo,” the “Company,” “we,” “our” or “us” refer to financial information and transactions of Endo International plc and its subsidiaries.
The assets and liabilities of Litha, which was sold on July 3, 2017, are classified as held for sale in the Consolidated Balance Sheet as of December 31, 2016. The operating results of AMS are reported as Discontinued operations, net of tax in the Consolidated Statements of Operations for all periods presented. For additional information, see Note 3. Discontinued Operations and Assets and Liabilities Held for Sale in the Consolidated Financial Statements, included in Part IV, Item 15 of this report "Exhibits, Financial Statement Schedules".
EXECUTIVE SUMMARY
This executive summary provides highlights from the results of operations that follow:
• | Total revenues in 2017 decreased 14% from 2016 to $3,468.9 million as strong performance from our U.S. Generic Pharmaceuticals segment’s Sterile Injectables portfolio and our U.S. Branded Pharmaceuticals segment’s Specialty Products portfolio was more than offset by declines in our U.S. Generic Pharmaceuticals segment’s Base portfolio and our U.S. Branded Pharmaceuticals segment’s Established Products portfolio. |
• | Gross margin percentage in 2017 increased to 35.8% from 34.3% in 2016. This increase was primarily attributable to a shift in product mix to higher margin products, the favorable margin impact from our manufacturing network restructuring initiatives, including product rationalization efforts, and decreased amortization expense. |
• | Asset impairment charges in 2017 decreased to $1,154.4 million from $3,781.2 million in 2016. |
• | During the year ended December 31, 2017, we recognized an income tax benefit of $250.3 million on $1,483.0 million of loss from continuing operations before income tax, compared to a tax benefit of $700.1 million on $3,923.9 million of loss from continuing operations before income tax during 2016. This reduction was primarily attributable to a benefit arising from a 2016 legal entity restructuring as part of our continuing integration of our acquired businesses that did not reoccur in 2017. This 2016 restructuring resulted in the realization of a $636.1 million tax benefit arising from an outside basis difference that was reduced by a $394.6 million charge for the establishment of a valuation allowance on a portion of the Company’s U.S. deferred tax assets. |
• | Loss from continuing operations in 2017 was $1,232.7 million, compared to $3,223.8 million in 2016. |
• | In January 2017, we announced a restructuring initiative as part of our ongoing organizational review intended to further integrate, streamline and optimize our operations by aligning certain corporate and R&D functions with our recently restructured U.S. Generic Pharmaceuticals and U.S. Branded Pharmaceuticals business units in order to create efficiencies and cost savings (the January 2017 Restructuring Initiative). |
• | In March 2017, we announced that the Food and Drug Administration’s (FDA) Drug Safety and Risk Management and Anesthetic and Analgesic Drug Products Advisory Committees voted that the benefits of reformulated OPANA® ER (oxymorphone hydrochloride extended release) no longer outweigh its risks. In June 2017, we became aware of the FDA’s request that we voluntarily withdraw OPANA® ER from the market, and in July 2017, after careful consideration and consultation with the FDA, we decided to voluntarily remove OPANA® ER from the market. During the second quarter of 2017, we began to work with the FDA to coordinate an orderly withdrawal of the product from the market. By September 1, 2017, we ceased shipments of OPANA® ER to customers and we expect the New Drug Application will be withdrawn in the coming months. |
• | In April 2017, we issued $300.0 million in aggregate principal amount of 5.875% senior secured notes due 2024 and entered into a new senior secured credit agreement (the 2017 Credit Agreement) among the Company and certain of its subsidiaries, the lenders party thereto from time to time and JPMorgan Chase, Bank, N.A., as administrative agent, issuing bank and swingline lender, which provided for (i) a five-year senior secured revolving credit facility in a principal amount of $1,000.0 million (the 2017 Revolving Credit Facility) and (ii) a seven-year senior secured term loan facility in a principal amount of $3,415.0 million (the 2017 Term Loan Facility). We used the net proceeds from these instruments and cash on hand to repay all of our outstanding loans under our prior credit facilities and to pay related fees and expenses. Any proceeds from the 2017 Revolving Credit Facility are expected to be used for working capital, capital expenditures and general corporate purposes. |
49
• | Beginning in the second quarter of 2017, we aggressively pursued a settlement strategy in connection with mesh litigation. Consequently, we increased our mesh liability accrual by $775.5 million in the second quarter of 2017, which is expected to cover approximately 22,000 known U.S. mesh claims, subject to a claims validation process for all resolved claims, as well as all of the international mesh liability claims of which we were aware and other mesh-related matters. Although we believe we appropriately estimated the probable total amount of loss associated with mesh-related matters, it is reasonably possible that further claims may be filed or asserted or adjustments to our liability accrual may be required. This could have a material adverse effect on our business, financial condition, results of operations and cash flows. Charges related to mesh liability and associated legal fees and other expenses for all periods presented are reported in Discontinued operations, net of tax in our Consolidated Statements of Operations. See Note 14. Commitments and Contingencies in the Consolidated Financial Statements, included in Part IV, Item 15 of this report "Exhibits, Financial Statement Schedules" for further information. |
• | As part of previously announced initiatives, we divested both Litha, our South African business, and Somar, our Latin American business in July 2017 and October 2017, respectively. |
• | In July 2017, we announced that we will be ceasing operations and closing our manufacturing and distribution facilities in Huntsville, Alabama (the 2017 U.S. Generic Pharmaceuticals Restructuring Initiative). |
• | In January 2018, the Company initiated a restructuring initiative that included a reorganization of its U.S. Generic Pharmaceuticals segment’s research and development network, a further simplification of the Company’s manufacturing networks and a company-wide unification of certain corporate functions (the January 2018 Restructuring Initiative). |
CRITICAL ACCOUNTING ESTIMATES
The preparation of our Consolidated Financial Statements in conformity with accounting principles generally accepted in the U.S. (U.S. GAAP) requires us to make estimates and assumptions that affect the amounts and disclosures in our Consolidated Financial Statements, including the notes thereto, and elsewhere in this report. For example, we are required to make significant estimates and assumptions related to revenue recognition, including sales deductions, financial instruments, long-lived assets, goodwill, other intangibles, income taxes, contingencies and share-based compensation, among others. Some of these estimates can be subjective and complex. Although we believe that our estimates and assumptions are reasonable, there may be other reasonable estimates or assumptions that differ significantly from ours. Further, our estimates and assumptions are based upon information available at the time they were made. Actual results may differ significantly from our estimates.
Accordingly, in order to understand our Consolidated Financial Statements, it is important to understand our critical accounting estimates. We consider an accounting estimate to be critical if: (i) the accounting estimate requires us to make assumptions about matters that were highly uncertain at the time the accounting estimate was made and (ii) changes in the estimate that are reasonably likely to occur from period to period, or use of different estimates that we reasonably could have used in the current period, would have a material impact on our financial condition, results of operations or cash flows. Our most critical accounting estimates are described below:
Revenue recognition
Our revenue consists almost entirely of sales of our pharmaceutical products to customers, whereby we ship product to a customer pursuant to a purchase order, which typically corresponds and/or makes reference to a master agreement with that customer, and invoice the customer upon shipment. For sales such as these, we recognize revenue when title and risk of loss has passed to the customer, which is typically upon delivery to the customer, when estimated provisions for revenue reserves are reasonably determinable and when collectability is reasonably confirmed. The amount of revenue we recognize is equal to the selling price, adjusted for our estimates of a number of significant sales deductions, which are further described below.
Revenue from the launch of a new or significantly unique product may be deferred until such time that the product has achieved market acceptance. For these products, revenue is typically recognized based on dispensed prescription data and other information obtained prior to and during the period following launch.
We believe that speculative buying of product, particularly in anticipation of possible price increases, has been the historical practice of certain of our customers. The timing of purchasing decisions made by wholesaler and large retail chain customers can materially affect the level of our sales in any particular period. Accordingly, our sales may not correlate to the number of prescriptions written for our products based on external third-party data.
We have entered into distribution service agreements (DSAs) with certain of our significant wholesaler customers that obligate the wholesalers, in exchange for fees paid by us, to: (i) manage the variability of their purchases and inventory levels within specified limits based on product demand and (ii) provide us with specific services, including the provision of periodic retail demand information and current inventory levels for our pharmaceutical products held at their warehouse locations.
50
Sales deductions
When we recognize revenue from the sale of our products, we simultaneously record an adjustment to revenue for estimated chargebacks, rebates, sales incentives and allowances, DSA and other fees for services, returns and allowances. These sales deductions, as described in greater detail below, are estimated based on historical experience, estimated future trends, estimated customer inventory levels, current contract sales terms with our direct and indirect customers and other competitive factors. We subsequently review our provisions for our various sales deductions based on new or revised information that becomes available to us and make revisions to our estimates if and when appropriate.
Where available, we have relied on information received from our wholesaler customers about the quantities of inventory held, including the information received pursuant to DSAs, which we have not independently verified. For other customers, we have estimated inventory held based on buying patterns. In addition, we have evaluated market conditions for products primarily through the analysis of wholesaler and other third party sell-through, as well as internally-generated information, to assess factors that could impact expected product demand at December 31, 2017. We believe that the estimated level of inventory held by our customers is within a reasonable range as compared to both: (i) historical amounts and (ii) expected demand for each respective product at December 31, 2017.
If the assumptions we use to calculate our provisions for sales deductions do not appropriately reflect future activity, our financial position, results of operations and cash flows could be materially impacted. The following table presents the activity and ending balances, excluding Discontinued operations, for our product sales provisions for the years ended December 31, 2017, 2016 and 2015 (in thousands):
Returns and Allowances | Rebates | Chargebacks | Other Sales Deductions | Total | |||||||||||||||
Balance, January 1, 2015 | $ | 174,940 | $ | 497,362 | $ | 217,402 | $ | 25,380 | $ | 915,084 | |||||||||
Additions related to acquisitions | 129,281 | 184,290 | 117,236 | 27,970 | 458,777 | ||||||||||||||
Current year provision | 146,615 | 1,604,062 | 2,272,896 | 148,090 | 4,171,663 | ||||||||||||||
Prior year provision | 4,070 | (12,604 | ) | (7,011 | ) | — | (15,545 | ) | |||||||||||
Payments or credits | (97,974 | ) | (1,449,953 | ) | (2,221,307 | ) | (154,638 | ) | (3,923,872 | ) | |||||||||
Balance, December 31, 2015 | $ | 356,932 | $ | 823,157 | $ | 379,216 | $ | 46,802 | $ | 1,606,107 | |||||||||
Current year provision | 122,414 | 1,562,340 | 3,125,109 | 332,721 | 5,142,584 | ||||||||||||||
Prior year provision | (7,199 | ) | (18,705 | ) | 4,707 | 311 | (20,886 | ) | |||||||||||
Payments or credits | (139,396 | ) | (1,878,602 | ) | (3,162,423 | ) | (312,829 | ) | (5,493,250 | ) | |||||||||
Balance, December 31, 2016 | $ | 332,751 | $ | 488,190 | $ | 346,609 | $ | 67,005 | $ | 1,234,555 | |||||||||
Current year provision | 108,544 | 1,315,012 | 2,659,421 | 242,343 | 4,325,320 | ||||||||||||||
Prior year provision | (2,028 | ) | (21,442 | ) | 1,224 | (269 | ) | (22,515 | ) | ||||||||||
Payments or credits | (147,100 | ) | (1,427,073 | ) | (2,750,546 | ) | (268,731 | ) | (4,593,450 | ) | |||||||||
Decreases due to business dispositions | (1,133 | ) | — | — | — | (1,133 | ) | ||||||||||||
Balance, December 31, 2017 | $ | 291,034 | $ | 354,687 | $ | 256,708 | $ | 40,348 | $ | 942,777 | |||||||||
Returns and Allowances
Consistent with industry practice, we maintain a return policy that allows our customers to return product within a specified period of time both subsequent to and, in certain cases, prior to the product’s expiration date. Our return policy generally allows customers to receive credit for expired products within six months prior to expiration and within one year after expiration. Our provision for returns and allowances consists of our estimates for future product returns, pricing adjustments and delivery errors. The primary factors we consider in estimating our potential product returns include:
• | the shelf life or expiration date of each product; |
• | historical levels of expired product returns; |
• | external data with respect to inventory levels in the wholesale distribution channel; |
• | external data with respect to prescription demand for our products; and |
• | the estimated returns liability to be processed by year of sale based on analysis of lot information related to actual historical returns. |
51
In determining our estimates for returns and allowances, we are required to make certain assumptions regarding the timing of the introduction of new products and the potential of these products to capture market share. In addition, we make certain assumptions with respect to the extent and pattern of decline associated with generic competition. To make these assessments, we utilize market data for similar products as analogs for our estimations. We use our best judgment to formulate these assumptions based on past experience and information available to us at the time. We continually reassess and make the appropriate changes to our estimates and assumptions as new information becomes available to us.
Our estimate for returns and allowances may be impacted by a number of factors, but the principal factor relates to the level of inventory in the distribution channel. When we are aware of an increase in the level of inventory of our products in the distribution channel, we consider the reasons for the increase to determine whether we believe the increase is temporary or other-than-temporary. Increases in inventory levels assessed as temporary will not result in an adjustment to our provision for returns and allowances. Some of the factors that may be an indication that an increase in inventory levels will be temporary include:
• | recently implemented or announced price increases for our products; and |
• | new product launches or expanded indications for our existing products. |
Conversely, other-than-temporary increases in inventory levels may be an indication that future product returns could be higher than originally anticipated and, accordingly, we may need to adjust our provision for returns and allowances. Some of the factors that may be an indication that an increase in inventory levels will be other-than-temporary include:
• | declining sales trends based on prescription demand; |
• | recent regulatory approvals to shorten the shelf life of our products, which could result in a period of higher returns related to older product still in the distribution channel; |
• | introduction of new product or generic competition; |
• | increasing price competition from generic competitors; and |
• | changes to the National Drug Codes (NDCs) of our products, which could result in a period of higher returns related to product with the old NDC, as our customers generally permit only one NDC per product for identification and tracking within their inventory systems. |
Rebates
Our provision for rebates, sales incentives and other allowances can generally be categorized into the following four types:
• | direct rebates; |
• | indirect rebates; |
• | governmental rebates, including those for Medicaid, Medicare and TRICARE, among others; and |
• | managed-care rebates. |
We establish contracts with wholesalers, chain stores and indirect customers that provide for rebates, sales incentives, DSA fees and other allowances. Some customers receive rebates upon attaining established sales volumes. Direct rebates are generally rebates paid to direct purchasing customers based on a percentage applied to a direct customer’s purchases from us, including fees paid to wholesalers under our DSAs, as described above. Indirect rebates are rebates paid to indirect customers which have purchased our products from a wholesaler under a contract with us.
We are subject to rebates on sales made under governmental and managed-care pricing programs based on relevant statutes with respect to governmental pricing programs and contractual sales terms with respect to managed-care providers and group purchasing organizations. For example, we are required to provide a 50% discount on our brand-name drugs to patients who fall within the Medicare Part D coverage gap, also referred to as the donut hole.
We participate in various federal and state government-managed programs whereby discounts and rebates are provided to participating government entities. For example, Medicaid rebates are amounts owed based upon contractual agreements or legal requirements with public sector (Medicaid) benefit providers after the final dispensing of the product by a pharmacy to a benefit plan participant. Medicaid reserves are based on expected payments, which are driven by patient usage, contract performance and field inventory that will be subject to a Medicaid rebate. Medicaid rebates are typically billed up to 180 days after the product is shipped, but can be as much as 270 days after the quarter in which the product is dispensed to the Medicaid participant. In addition to the estimates mentioned above, our calculation also requires other estimates, such as estimates of sales mix, to determine which sales are subject to rebates and the amount of such rebates. Periodically, we adjust the Medicaid rebate provision based on actual claims paid. Due to the delay in billing, adjustments to actual claims paid may incorporate revisions of this provision for several periods. Because Medicaid pricing programs involve particularly difficult interpretations of complex statutes and regulatory guidance, our estimates could differ from actual experience.
52
In determining our estimates for rebates, we consider the terms of our contracts, relevant statutes, historical relationships of rebates to revenues, past payment experience, estimated inventory levels of our customers and estimated future trends. Our provisions for rebates include estimates for both unbilled claims for end-customer sales that have already occurred and future claims that will be made when inventory in the distribution channel is sold through to end-customer plan participants. Changes in the level of utilization of our products through private or public benefit plans and group purchasing organizations will affect the amount of rebates that we owe.
Chargebacks
We market and sell products to both: (i) direct customers including wholesalers, distributors, warehousing pharmacy chains and other direct purchasing groups and (ii) indirect customers including independent pharmacies, non-warehousing chains, managed-care organizations, group purchasing organizations and government entities. We enter into agreements with certain of our indirect customers to establish contract pricing for certain products. These indirect customers then independently select a wholesaler from which to purchase the products at these contracted prices. Alternatively, we may pre-authorize wholesalers to offer specified contract pricing to other indirect customers. Under either arrangement, we provide credit to the wholesaler for any difference between the contracted price with the indirect customer and the wholesaler’s invoice price. Such credit is called a chargeback.
Our provision for chargebacks consists of our estimates for the credits described above. The primary factors we consider in developing and evaluating our provision for chargebacks include:
• | the average historical chargeback credits; |
• | estimated future sales trends; and |
• | an estimate of the inventory held by our wholesalers, based on internal analysis of a wholesaler’s historical purchases and contract sales. |
Other sales deductions
We offer certain of our customers prompt pay cash discounts. Provisions for prompt pay discounts are estimated and recorded at the time of sale. We estimate provisions for cash discounts based on contractual sales terms with customers, an analysis of unpaid invoices and historical payment experience. Estimated cash discounts have historically been predictable and less subjective due to the limited number of assumptions involved, the consistency of historical experience and the fact that we generally settle these amounts within 30 to 60 days.
Shelf-stock adjustments are credits issued to our customers to reflect decreases in the selling prices of our products. These credits are customary in the industry and are intended to reduce a customer’s inventory cost to better reflect current market prices. The determination to grant a shelf-stock credit to a customer following a price decrease is at our discretion rather than contractually required. The primary factors we consider when deciding whether to record a reserve for a shelf-stock adjustment include:
• | the estimated number of competing products being launched as well as the expected launch date, which we determine based on market intelligence; |
• | the estimated decline in the market price of our product, which we determine based on historical experience and customer input; and |
• | the estimated levels of inventory held by our customers at the time of the anticipated decrease in market price, which we determine based upon historical experience and customer input. |
Valuation of long-lived assets
As of December 31, 2017, our combined long-lived assets balance, including property, plant and equipment and finite-lived intangible assets, is approximately $4.5 billion.
Long-lived assets are assessed for impairment whenever events or changes in circumstances indicate the carrying amounts of the assets may not be recoverable. Recoverability of an asset that will continue to be used in our operations is measured by comparing the carrying amount of the asset to the forecasted undiscounted future cash flows related to the asset. In the event the carrying amount of the asset exceeds its undiscounted future cash flows and the carrying amount is not considered recoverable, impairment may exist. An impairment loss, if any, is measured as the excess of the asset’s carrying amount over its fair value, generally based on a discounted future cash flow method, independent appraisals or preliminary offers from prospective buyers. An impairment loss would be recognized in the Consolidated Statements of Operations in the period that the impairment occurs. As a result of the significance of our long-lived assets, any recognized impairment loss could have a material adverse impact on our financial position and results of operations.
53
Our reviews of long-lived assets during the three years ended December 31, 2017 resulted in certain impairment charges. The majority of these charges related to finite-lived intangible assets, which are described in Note 10. Goodwill and Other Intangibles in the Consolidated Financial Statements, included in Part IV, Item 15 of this report "Exhibits, Financial Statement Schedules". These impairment charges were generally based on fair value estimates determined using either discounted cash flow models or preliminary offers from prospective buyers. The discounted cash flow models include assumptions related to product revenue, growth rates and operating margin. These assumptions are based on management’s annual and ongoing budgeting, forecasting and planning processes and represent our best estimate of future product cash flows. These estimates are subject to the economic environment in which our segments operate, demand for our products and competitor actions. The use of different assumptions would have increased or decreased our estimated discounted future cash flows and the resulting estimated fair values of these assets, causing increases and/or decreases in the resulting asset impairment charges. The discount rates applied to these estimated cash flows ranged from 9.0% to 9.5% with respect to the long-lived assets impaired in 2017.
Events giving rise to impairment are an inherent risk in the pharmaceutical industry and cannot be predicted. Factors that we consider in deciding when to perform an impairment review include significant under-performance of a product line in relation to expectations, significant negative industry or economic trends and significant changes or planned changes in our use of the assets.
Our long-lived intangible assets, which consist of license rights and developed technology, are initially recorded at fair value upon acquisition. To the extent they are deemed to have finite lives, they are then amortized over their estimated useful lives using either the straight-line method or, in the case of certain developed technology assets, the economic benefit model. The values of these various assets are subject to continuing scientific, medical and marketplace uncertainty. Factors giving rise to our initial estimate of useful lives are subject to change. Significant changes to any of these factors may result in a reduction in the useful life of the asset and an acceleration of related amortization expense, which could cause our operating income, net income and net income per share to decrease. Amortization expense is not recorded on assets held for sale. Each category of long-lived intangible assets is described further below.
License Rights. Our license rights have useful lives ranging from 3 to 15 years, with a weighted average useful life of approximately 12 years. We determine amortization periods for licenses based on our assessment of various factors including the expected launch date of the product, the strength of the intellectual property protection of the product, contractual terms and various other competitive, developmental and regulatory issues.
Developed Technology. Our developed technology assets have useful lives ranging from 1 to 20 years, with a weighted average useful life of approximately 11 years. We determine amortization periods and method of amortization for developed technology assets based on our assessment of various factors impacting estimated useful lives and timing and extent of estimated cash flows of the acquired assets including the strength of the intellectual property protection of the product, contractual terms and various other competitive and regulatory issues.
Goodwill and indefinite-lived intangible assets
As of December 31, 2017, our combined goodwill and indefinite-lived intangible assets balance is approximately $4.8 billion.
We test goodwill and indefinite-lived intangible assets for impairment at least annually, but also perform tests whenever events or changes in circumstances indicate that the asset might be impaired. Our annual assessment is performed as of October 1st.
As further described in Note 2. Summary of Significant Accounting Policies of the Consolidated Financial Statements of Part IV, Item 15 of this report “Exhibits, Financial Statement Schedules”, effective January 1, 2017, we early adopted Accounting Standards Update (ASU) No. 2017-04 “Intangibles - Goodwill and Other (Topic 350): Simplifying the Accounting for Goodwill Impairment” (ASU 2017-04). Subsequent to adoption, we perform our goodwill impairment tests by comparing the fair value and carrying amount of each of our reporting units. Any goodwill impairment charge we recognize for a reporting unit is equal to the lesser of (i) the total goodwill allocated to that reporting unit and (ii) the amount by which that reporting unit’s carrying amount exceeds its fair value.
Similarly, we perform our indefinite-lived intangible asset impairment tests by comparing the fair value of each intangible asset with its carrying amount. If the carrying amount of an indefinite-lived intangible asset exceeds its fair value, an impairment loss is recognized in an amount equal to that excess.
The fair values of our reporting units and of identified indefinite-lived intangible assets are determined using an income approach that utilizes a discounted cash flow model, or, where appropriate, a market approach, or a combination thereof. The discounted cash flow models are dependent upon our estimates of future cash flows and other factors. Our estimates of future cash flows involve assumptions concerning (i) future operating performance, including future sales, long-term growth rates, operating margins, variations in the amount and timing of cash flows and the probability of achieving the estimated cash flows and (ii) future economic conditions, all which may differ from actual future cash flows.
54
Assumptions related to future operating performance are based on management’s annual and ongoing budgeting, forecasting and planning processes and represent our best estimate of the future results of operations across the Company as of a point in time. These estimates are subject to many assumptions, such as the economic environment in which our segments operate, demand for our products and competitor actions. Estimated future cash flows are discounted to present value using a market participant, weighted average cost of capital. The financial and credit market volatility directly impacts certain inputs and assumptions used to develop the weighted average cost of capital such as the risk-free interest rate, industry beta, debt interest rate and our market capital structure. These assumptions are based on significant inputs not observable in the market and thus represent Level 3 measurements within the fair value hierarchy. The use of different inputs and assumptions could increase or decrease our estimated discounted future cash flows, the resulting estimated fair values and the amounts of our related impairments, if any.
In order to assess the reasonableness of the calculated fair values of our reporting units, we also compare the sum of the reporting units’ fair values to Endo’s market capitalization and calculate an implied control premium (the excess sum of the reporting units’ fair values over the market capitalization) or an implied control discount (the excess sum of total invested capital over the sum of the reporting units’ fair values). The Company evaluates the implied control premium or discount by comparing it to control premiums or discounts of recent comparable market transactions, as applicable. If the control premium or discount is not reasonable in light of comparable recent transactions, or recent movements in the Company’s share price, we reevaluate the fair value estimates of the reporting units by adjusting discount rates and/or other assumptions. This re-evaluation could correlate to different implied fair values for certain or all of the Company’s reporting units.
On January 1, 2017, the Company had five reporting units: (1) Branded, (2) Generics, (3) Paladin, (4) Litha, which was eliminated effective July 3, 2017 upon the sale of Litha, and (5) Somar, which was eliminated effective October 25, 2017 upon the sale of Somar. As further discussed below, Endo performed interim goodwill tests for various reporting units during 2017. The critical accounting estimates used in connection with these tests are discussed below and a description of goodwill impairment charges is included in Note 10. Goodwill and Other Intangibles in the Consolidated Financial Statements, included in Part IV, Item 15 of this report "Exhibits, Financial Statement Schedules".
During the first six months of 2017, we initiated various interim goodwill tests for our Branded, Generics, Paladin and Somar reporting units. These tests resulted in goodwill impairment charges of $180.4 million, $82.6 million and $25.7 million for the Branded, Paladin and Somar reporting units, respectively, for the six months ended June 30, 2017. The interim test for the Generics reporting unit did not result in an impairment charge. The fair values of the Branded, Generics and Paladin reporting units were determined using an income approach with discount rates ranging from 9.0% to 10.0%. The fair value of the Somar reporting unit was determined using a market approach. For the Branded reporting unit interim test, a 50 basis point increase in the assumed discount rate utilized would have increased our goodwill impairment charge by approximately $100 million. For the Generics reporting unit interim test, a 50 basis point increase in the assumed discount rate utilized would not have changed the results of our analysis. For the Paladin reporting unit interim test, a 50 basis point increase in the assumed discount rate utilized would have increased our goodwill impairment charge by approximately $20 million. The Somar goodwill impairment charge represented the remaining carrying amount of goodwill.
Subsequent to these interim tests, Endo performed its annual goodwill and indefinite-lived intangible assets impairment test as of October 1, 2017. For the purpose of the 2017 annual test, the Company had four reporting units: (1) Branded, (2) Generics, (3) Paladin and (4) Somar, which was eliminated effective October 25, 2017 upon the sale of Somar. We did not record any goodwill impairment charges as a result of the annual tests. The fair values of our Branded, Generics and Paladin reporting units and associated indefinite-lived intangible assets were determined using an income approach with discount rates ranging from 9.5% to 12.5%, depending on the overall risk associated with the particular assets and other market factors. The fair values of the Somar reporting unit and associated other intangible assets were determined using a market approach. We believe the discount rates and other inputs and assumptions are consistent with those that a market participant would use. An increase of 50 basis points to our assumed discount rates used in testing any of these reporting units would not have changed the results of our analyses.
Additionally, in connection with the first quarter 2018 changes to our operating segments discussed above, we realigned our previous U.S. Generic Pharmaceuticals segment into two segments: (i) a new U.S. Branded - Sterile Injectables segment and (ii) a new U.S. Generic Pharmaceuticals segment. Each of these new segments will represent a separate reporting unit for goodwill testing purposes. Under U.S. GAAP, we are required to test the goodwill of the impacted reporting units both immediately before and after the segment realignment. This analysis, which we expect to complete in connection with our first quarter 2018 financial reporting close, is expected to result in an impairment to the goodwill of the new U.S. Generic Pharmaceuticals reporting unit, the amount of which could be material.
55
Income taxes
Our income tax expense, deferred tax assets and liabilities, income tax payable and reserves for unrecognized tax benefits reflect our best assessment of estimated current and future taxes to be paid. We are subject to income taxes in the U.S. and numerous other foreign jurisdictions in which we operate. Significant judgments and estimates are required in determining the consolidated income tax expense or benefit for financial statement purposes. Deferred income taxes arise from temporary differences, which result in future taxable or deductible amounts, between the tax basis of assets and liabilities and the corresponding amounts reported in our Consolidated Financial Statements. In assessing the ability to realize deferred tax assets, we consider, when appropriate, future taxable income by tax jurisdiction and tax planning strategies. Where appropriate, we record a valuation allowance to reduce our deferred tax assets to equal an amount that is more likely than not to be realized. In projecting future taxable income, we begin with historical results adjusted for the results of discontinued operations and incorporate assumptions about the amount of future earnings within a specific jurisdiction’s pretax operating income adjusted for material changes including in business operations. The assumptions about future taxable income require significant judgment and, while these assumptions rely heavily on estimates, such estimates are consistent with the plans we are using to manage the underlying businesses.
Future changes in tax laws and rates could also affect recorded deferred tax assets and liabilities, including further administrative or regulatory guidance related to the TCJA. As further discussed in Note 19. Income Taxes in the Consolidated Financial Statements, included in Part IV, Item 15 of this report "Exhibits, Financial Statement Schedules", our estimate of the impact of the TCJA has been recorded on a provisional basis based on currently available information and interpretations of the TCJA. Any adjustments to this estimate will be recorded as an income tax expense or benefit in the period the adjustment is determined.
The calculation of our tax liabilities often involves dealing with uncertainties in the application of complex tax laws and regulations in a multitude of jurisdictions across our global operations. A benefit from an uncertain tax position may be recognized when it is more likely than not that the position will be sustained on the basis of the technical merits upon examination, including resolutions of any related appeals or litigation processes. We first record unrecognized tax benefits as liabilities and then adjust these liabilities when our judgment changes as a result of the evaluation of new information not previously available at the time of establishing the liability. Because of the complexity of some of these uncertainties, the ultimate resolution may result in a payment, potentially including interest and penalties, that is materially different from our current estimate of the unrecognized tax benefit liabilities. These differences will be reflected as increases or decreases to income tax expense in the period in which new information becomes available. We classify interest and penalties arising from uncertain tax positions as a component of tax expense.
We make an evaluation at the end of each reporting period as to whether or not some or all of the undistributed earnings of our subsidiaries are indefinitely reinvested. While we may have concluded in the past that some of such undistributed earnings are indefinitely reinvested, facts and circumstances may change in the future. Changes in facts and circumstances may include a change in the estimated capital needs of our subsidiaries, or a change in our corporate liquidity requirements. Such changes could result in our management determining that some or all of such undistributed earnings are no longer indefinitely reinvested. In that event, we would be required to adjust our income tax provision in the period we determined that the earnings will no longer be indefinitely reinvested outside the relevant tax jurisdiction.
Contingencies
The Company is subject to various patent challenges, product liability claims, government investigations and other legal proceedings in the ordinary course of business. Material legal proceedings are discussed in Note 14. Commitments and Contingencies in the Consolidated Financial Statements, included in Part IV, Item 15 of this report "Exhibits, Financial Statement Schedules". Contingent accruals and legal settlements are recorded in the Consolidated Statements of Operations as Litigation-related and other contingencies, net (or Discontinued operations, net in the case of vaginal mesh matters) when the Company determines that a loss is both probable and reasonably estimable. Legal fees and other expenses related to litigation are expensed as incurred and included in Selling, general and administrative expenses in the Consolidated Statements of Operations (or Discontinued operations, net in the case of vaginal mesh matters).
Due to the fact that legal proceedings and other contingencies are inherently unpredictable, our estimates of the probability and amount of any such liabilities involve significant judgment regarding future events. The factors we consider in developing our liabilities for legal proceedings include the merits and jurisdiction of the proceeding, the nature and the number of other similar current and past proceedings, the nature of the product and the current assessment of the science subject to the proceeding, if applicable, and the likelihood of the conditions of settlement being met.
56
In order to evaluate whether a claim is probable of loss, we may rely on certain information about the claim. Without access to and review of such information, we may not be in a position to determine whether a loss is probable. Further, the timing and extent to which we obtain any such information, and our evaluation thereof, is often impacted by items outside of our control including, without limitation, the normal cadence of the litigation process and the provision of claim information to us by plaintiff’s counsel. The amount of our liabilities for legal proceedings may change as we receive additional information and/or become aware of additional asserted or unasserted claims. Additionally, there is a possibility that we will suffer adverse decisions or verdicts of substantial amounts or that we will enter into additional monetary settlements, either of which could be in excess of amounts previously accrued for. Any changes to our liabilities for legal proceedings could have a material adverse effect on our business, financial condition, results of operations and cash flows.
As of December 31, 2017, our reserve for loss contingencies totaled $1,298.2 million, of which $1,087.2 million relates to our liability accrual for vaginal mesh cases and other mesh-related matters. Although we believe there is a reasonable possibility that a loss in excess of the amount recognized exists, we are unable to estimate the possible loss or range of loss in excess of the amount recognized at this time.
RESULTS OF OPERATIONS
Consolidated Results Review
The following table displays our revenue, gross margin, gross margin percentage and other pre-tax expense or income for the years ended December 31, 2017, 2016 and 2015 (dollars in thousands):
% Change | |||||||||||||||||
2017 | 2016 | 2015 | 2017 vs. 2016 | 2016 vs. 2015 | |||||||||||||
Total revenues | $ | 3,468,858 | $ | 4,010,274 | $ | 3,268,718 | (14 | )% | 23 | % | |||||||
Cost of revenues | 2,228,530 | 2,634,973 | 2,075,651 | (15 | )% | 27 | % | ||||||||||
Gross margin | $ | 1,240,328 | $ | 1,375,301 | $ | 1,193,067 | (10 | )% | 15 | % | |||||||
Gross margin percentage | 35.8 | % | 34.3 | % | 36.5 | % | |||||||||||
Selling, general and administrative | 629,874 | 770,728 | 741,304 | (18 | )% | 4 | % | ||||||||||
Research and development | 172,067 | 183,372 | 102,197 | (6 | )% | 79 | % | ||||||||||
Litigation-related and other contingencies, net | 185,990 | 23,950 | 37,082 | NM | (35 | )% | |||||||||||
Asset impairment charges | 1,154,376 | 3,781,165 | 1,140,709 | (69 | )% | NM | |||||||||||
Acquisition-related and integration items | 58,086 | 87,601 | 105,250 | (34 | )% | (17 | )% | ||||||||||
Interest expense, net | 488,228 | 452,679 | 373,214 | 8 | % | 21 | % | ||||||||||
Loss on extinguishment of debt | 51,734 | — | 67,484 | NM | (100 | )% | |||||||||||
Other (income) expense, net | (17,023 | ) | (338 | ) | 63,691 | NM | NM | ||||||||||
Loss from continuing operations before income tax | $ | (1,483,004 | ) | $ | (3,923,856 | ) | $ | (1,437,864 | ) | (62 | )% | NM | |||||
__________
NM indicates that the percentage change is not meaningful or is greater than 100%.
Total Revenues. In 2017, total revenues decreased primarily due to declines in our U.S. Generic Pharmaceuticals segment’s Base portfolio, driven by overall market trends and product rationalization, and our U.S. Branded Pharmaceuticals segment’s Established Products portfolio, driven by the impact of generic competition, the divestiture of STENDRA® in the third quarter of 2016 and actions taken with respect to OPANA® ER, which are further described below. Additionally, sales in our International Pharmaceuticals segment were negatively impacted by our July 3, 2017 divestiture of Litha and October 25, 2017 divestiture of Somar. These declines were partially offset by continued strong performance from our U.S. Generic Pharmaceuticals segment’s Sterile Injectables portfolio, including VASOSTRICT® and ADRENALIN®, and our U.S. Branded Pharmaceuticals segment’s Specialty Products portfolio, which includes XIAFLEX®.
In March 2017, we announced that the Food and Drug Administration’s (FDA) Drug Safety and Risk Management and Anesthetic and Analgesic Drug Products Advisory Committees voted that the benefits of reformulated OPANA® ER (oxymorphone hydrochloride extended release) no longer outweigh its risks. In June 2017, we became aware of the FDA’s request that we voluntarily withdraw OPANA® ER from the market, and in July 2017, after careful consideration and consultation with the FDA, we decided to voluntarily remove OPANA® ER from the market. During the second quarter of 2017, we began to work with the FDA to coordinate an orderly withdrawal of the product from the market. By September 1, 2017, we ceased shipments of OPANA® ER to customers and we expect the New Drug Application will be withdrawn in the coming months. These actions had an adverse effect on the revenues and results of operations of our U.S. Branded Pharmaceuticals segment in 2017.
57
In 2016, total revenues increased primarily due to a full year of revenues related to our September 2015 acquisition of Par. This increase was partially offset by decreased revenues for certain products in our U.S. Branded Pharmaceuticals segment, driven mainly by decreased VOLTAREN® Gel, LIDODERM®, OPANA® ER and FROVA® revenues related to generic competition. In addition, we experienced decreased revenues in our legacy U.S. Generic Pharmaceuticals business, which resulted from competitive pressure on commoditized generic products.
Our revenues are further described below under the heading “Business Segment Results Review”.
Cost of revenues and gross margin percentage. During the years ended December 31, 2017, 2016 and 2015, we incurred certain charges that impact the comparability of total Cost of revenues, including those related to acquisitions, separation benefits and restructurings initiatives, among others. The following table summarizes such amounts (in thousands):
2017 | 2016 | 2015 | |||||||||
Amortization of intangible assets | $ | 773,766 | $ | 876,451 | $ | 561,302 | |||||
Inventory step-up and certain manufacturing costs that will be eliminated pursuant to integration plans | 390 | $ | 124,349 | $ | 249,464 | ||||||
Separation benefits and other cost reduction initiatives (1) | 175,809 | $ | 53,133 | $ | 41,210 | ||||||
__________
(1) | Amounts primarily relate to certain employee separation costs, accelerated depreciation charges, product discontinuation charges, charges to increase excess inventory reserves related to restructurings and other cost reduction and restructuring charges. See Note 4. Restructuring of the Consolidated Financial Statements of Part IV, Item 15 of this report "Exhibits, Financial Statement Schedules" for discussion of our material restructuring initiatives. |
In 2017, Cost of revenues decreased primarily due to the previously described decrease in total revenues, decreases to inventory step-up expense based on the timing of prior acquisitions and decreases to amortization expense. These savings were partially offset by increased restructuring charges included in Cost of revenues related to the 2017 U.S. Generic Pharmaceuticals Restructuring Initiative as described more fully in Note 4. Restructuring of the Consolidated Financial Statements included in Part IV, Item 15 of this report "Exhibits, Financial Statement Schedules".
Gross margin percentage increased in 2017 primarily due to the gross margin effects of the Cost of revenues decreases described above, together with the favorable margin impact of product rationalization efforts. These increases were partially offset by the margin effects of continued competitive pressure on the commoditized generic products in our U.S. Generic Pharmaceuticals segment’s Base portfolio.
In 2016, Cost of revenues increased primarily due to a full year of costs associated with our September 2015 acquisition of Par, which resulted in increased Cost of revenues related to sales and increased intangible asset amortization, partially offset by decreases in charges related to inventory step-up and certain manufacturing costs that will be eliminated pursuant to integration plans based on the timing of our acquisitions of Par and Auxilium.
Gross margin percentage decreased in 2016 primarily due to the gross margin effects of the Cost of revenues increases described above and changes to the mix of revenue toward lower margin generic pharmaceutical product sales as compared to the higher margin branded sales.
Selling, general and administrative expenses. In 2017, Selling, general and administrative expenses decreased primarily as a result of cost reductions that were implemented during 2016 and in the first half of 2017, including the impact of those related to various restructuring initiatives. Additionally, there was a decrease in restructuring charges included in Selling, general and administrative expense in 2017.
In 2016, Selling, general and administrative expenses increased primarily due to a full year of employee, facility and other selling, general and administrative expenses related to our September 2015 acquisition of Par. In addition, we incurred charges related to restructuring initiatives during 2016, including the 2016 U.S. Generic Pharmaceuticals Restructuring Initiative and the 2016 U.S. Branded Pharmaceuticals Restructuring Initiative, as described more fully in Note 4. Restructuring of the Consolidated Financial Statements included in Part IV, Item 15 of this report "Exhibits, Financial Statement Schedules". These increases were partially offset by a $37.6 million charge recorded upon our January 2015 acquisition of Auxilium related to the acceleration of Auxilium employee equity awards as well as 2015 restructuring charges related Auxilium and Par.
Our material restructuring initiatives are described more fully in Note 4. Restructuring of the Consolidated Financial Statements included in Part IV, Item 15 of this report "Exhibits, Financial Statement Schedules".
58
Research and development expenses. The following table presents the composition of our total R&D expense for the years ended December 31, 2017, 2016 and 2015 (in thousands):
2017 | 2016 | 2015 | |||||||||
U.S. Generic Pharmaceuticals portfolio | $ | 127,415 | $ | 128,330 | $ | 58,418 | |||||
U.S. Branded Pharmaceuticals portfolio | 39,764 | 49,062 | 25,828 | ||||||||
International Pharmaceuticals portfolio | 4,257 | 3,348 | 9,624 | ||||||||
Enterprise-wide R&D costs | 631 | 2,632 | 8,327 | ||||||||
Total R&D expense | $ | 172,067 | $ | 183,372 | $ | 102,197 | |||||
Our R&D efforts are focused on the development of a balanced, diversified portfolio of innovative and clinically differentiated products. The acquisition of Auxilium added multiple, strategically-aligned programs to our branded pharmaceutical R&D pipeline with the addition of collagenase clostridium histolyticum (CCH). Through our U.S. Generics business, we seek out and develop high-barrier-to-entry generic products, including first-to-file or first-to-market opportunities. We periodically review our generic products pipeline in order to better direct investment toward those opportunities that we expect will deliver the greatest returns.
In 2017, R&D expense decreased due to a reduction in costs associated with post-marketing studies related to certain products in our U.S. Branded Pharmaceuticals segment and our Phase 2b cellulite trial, the results of which were announced in November 2016, cost savings resulting from the January 2017 Restructuring Initiative and lower development costs and filing fees related to new product launches in our U.S. Generic Pharmaceuticals segment. Partially offsetting the decrease were preliminary costs incurred in 2017 associated with the Phase 3 cellulite trials that began in early 2018. In 2018, we expect to continue to incur R&D costs related to the cellulite treatment development program. As a result of the January 2018 Restructuring Initiative and other cost reduction initiatives, we expect our U.S. Generic Pharmaceuticals R&D costs to begin to decline significantly in 2018. This expected decline primarily reflects decreases in costs associated with offshoring certain of our R&D activities to India and the prioritization of assets within our portfolio. However, there can be no assurance that we will achieve these results. Our material restructuring initiatives are described more fully in Note 4. Restructuring of the Consolidated Financial Statements included in Part IV, Item 15 of this report "Exhibits, Financial Statement Schedules".
In 2016, R&D expense increased primarily due to a full year of costs associated with our September 2015 acquisition of Par as well as additional investments in expanding our research and development capabilities. The increase in U.S. Branded Pharmaceuticals expenses in 2016 was primarily attributable to costs incurred related to the Phase 2 cellulite trial.
Litigation-related and other contingencies, net. Our legal proceedings and other contingent matters are described in more detail in Note 14. Commitments and Contingencies of the Consolidated Financial Statements of Part IV, Item 15 of this report "Exhibits, Financial Statement Schedules".
Asset impairment charges. The following table presents the components of our total Asset impairment charges for the years ended December 31, 2017, 2016 and 2015 (in thousands):
2017 | 2016 | 2015 | |||||||||
Goodwill impairment charges | $ | 288,745 | $ | 2,676,350 | $ | 759,280 | |||||
Other intangible asset impairment charges | 799,955 | 1,088,903 | 370,610 | ||||||||
Property, plant and equipment impairment charges | 65,676 | 15,912 | 10,819 | ||||||||
Total asset impairment charges | $ | 1,154,376 | $ | 3,781,165 | $ | 1,140,709 | |||||
A discussion of our impairment testing methodology and the critical accounting estimates made in connection with our various impairment tests is included above under the caption “CRITICAL ACCOUNTING ESTIMATES.” The factors leading to our material asset impairment tests, as well as the results of these tests, are further described in Note 9. Property, Plant and Equipment and Note 10. Goodwill and Other Intangibles of the Consolidated Financial Statements of Part IV, Item 15 of this report "Exhibits, Financial Statement Schedules".
Acquisition-related and integration items. In 2017, Acquisition-related and integration items, excluding amounts related to contingent consideration, decreased 87% to $8.1 million. In 2016, amounts decreased 63% to $63.8 million. The decreases in both periods related primarily to the timing of acquisition and integration costs directly associated with our January 2015 acquisition of Auxilium and our September 2015 acquisition of Par.
Net adjustments related to acquisition-related contingent consideration, which resulted from changes in market conditions impacting the commercial potential of the underlying products, were a charge of $49.9 million in 2017, a charge of $23.8 million in 2016 and a benefit of $65.6 million in 2015. See Note 7. Fair Value Measurements in the Consolidated Financial Statements, included in Part IV, Item 15 of this report "Exhibits, Financial Statement Schedules" for further discussion of our acquisition-related contingent consideration.
59
Interest expense, net. The components of Interest expense, net for the years ended December 31, 2017, 2016 and 2015 are as follows (in thousands):
2017 | 2016 | 2015 | |||||||||
Interest expense | $ | 494,694 | $ | 456,396 | $ | 378,901 | |||||
Interest income | (6,466 | ) | (3,717 | ) | (5,687 | ) | |||||
Interest expense, net | $ | 488,228 | $ | 452,679 | $ | 373,214 | |||||
In 2017, the increase in interest expense was primarily due to increased interest rates following the refinancing that occurred on April 27, 2017, which is further described in Note 13. Debt in the Consolidated Financial Statements, included in Part IV, Item 15 of this report "Exhibits, Financial Statement Schedules".
In 2016, the increase in interest expense was primarily due to an increase in our average total outstanding indebtedness during the year. At December 31, 2016, 2015 and 2014, our principal amounts of total debt were $8.4 billion, $8.7 billion and $4.3 billion, respectively. Period-over-period average total outstanding indebtedness increased primarily due to the financing of the Par acquisition.
Loss on extinguishment of debt. Loss on extinguishment of debt during the year ended December 31, 2017 related to certain previously unamortized debt issuance costs that were charged to expense in connection with the April 2017 refinancing. There were no comparable charges in 2016. In 2015, charges primarily related to the early redemption of certain of our former senior notes.
Other (income) expense, net. The components of Other (income) expense, net for the years ended December 31, 2017, 2016 and 2015 are as follows (in thousands):
2017 | 2016 | 2015 | |||||||||
Foreign currency (gain) loss, net | $ | (2,801 | ) | $ | 2,991 | $ | (23,058 | ) | |||
Equity loss (earnings) from investments accounted for under the equity method, net | 898 | (1,190 | ) | 3,217 | |||||||
Other-than-temporary impairment of equity investment | — | — | 18,869 | ||||||||
Legal settlement | — | — | (12,500 | ) | |||||||
Costs associated with unused financing commitments | — | — | 78,352 | ||||||||
Other miscellaneous, net | (15,120 | ) | (2,139 | ) | (1,189 | ) | |||||
Other (income) expense, net | $ | (17,023 | ) | $ | (338 | ) | $ | 63,691 | |||
Foreign currency (gain) loss, net results from the remeasurement of the Company’s foreign currency denominated assets and liabilities. In 2017, other miscellaneous, net includes a $10.1 million gain resulting from the sale of Litha, as further described in Note 3. Discontinued Operations and Assets and Liabilities Held for Sale in the Consolidated Financial Statements, included in Part IV, Item 15 of this report "Exhibits, Financial Statement Schedules". During 2015, the Company recognized an other-than-temporary impairment of its Litha joint venture investment, totaling $18.9 million, reflecting the excess carrying amount of this investment over its estimated fair value. In addition, the Company incurred $78.4 million during 2015 related to unused commitment fees primarily associated with financing for the Par acquisition.
Income tax benefit. The following table displays our Loss from continuing operations before income tax, Income tax benefit and effective tax rate for the years ended December 31, 2017, 2016 and 2015 (dollars in thousands):
2017 | 2016 | 2015 | |||||||||
Loss from continuing operations before income tax | $ | (1,483,004 | ) | $ | (3,923,856 | ) | $ | (1,437,864 | ) | ||
Income tax benefit | $ | (250,293 | ) | $ | (700,084 | ) | $ | (1,137,465 | ) | ||
Effective tax rate | 16.9 | % | 17.8 | % | 79.1 | % | |||||
Our tax rate is affected by recurring items, such as tax rates in non-U.S. jurisdictions as compared to the notional U.S. federal statutory tax rate, and the relative amount of income or loss in those various jurisdictions. It is also impacted by certain items that may occur in any given year, but are not consistent from year to year. The following items had the most significant impact on the difference between the notional U.S. statutory federal income tax rate and our effective tax rate:
2017:
• | $1,648.8 million of tax expense or a 111.2% rate charge from recording net valuation allowances relating to the Company’s operations. |
• | $1,350.8 million of net tax benefit or a 91.1% rate benefit associated with our geographical mix of earnings. As of December 31, 2017, no provision has been made for Irish taxes, as the majority of our undistributed earnings were considered to be permanently reinvested outside of Ireland. |
60
• | $56.1 million of net tax benefit or 3.8% rate benefit associated with the divestiture of certain International Pharmaceuticals segment businesses. |
• | $60.8 million of tax expense or a 4.1% rate charge resulting from the non-deductible portion of impaired goodwill. |
2016:
• | $926.9 million tax expense or a 23.6% rate charge resulting from the non-deductible portion of impaired goodwill. |
• | $762.6 million tax expense or a 19.4% rate charge from recording net valuation allowances relating to the Company’s operations. |
• | $636.1 million net tax benefit or a 16.2% rate benefit associated with the recognition of outside basis differences in certain subsidiaries. |
• | $301.7 million net tax benefit or a 7.7% rate benefit associated with our geographical mix of earnings. As of December 31, 2016, no provision has been made for Irish taxes, as the majority of our undistributed earnings were considered to be permanently reinvested outside of Ireland. |
2015:
• | $786.1 million net tax benefit or a 54.7% rate benefit associated with the recognition of outside basis differences in certain subsidiaries. |
• | $359.5 million net tax benefit or a 25.0% rate benefit associated with our geographical mix of earnings. As of December 31, 2015, no provision has been made for Irish taxes, as the majority of our undistributed earnings were considered to be permanently reinvested outside of Ireland. |
• | $278.3 million tax expense or 19.4% rate charge resulting from the non-deductible portion of impaired goodwill. |
Although the TCJA will reduce the notional U.S. federal statutory tax rate, because the Company has valuation allowances established against its U.S. deferred tax assets, as of December 31, 2017, we do not expect a significant reduction in our future tax expense. Moreover, we have valuation allowances established against our deferred tax assets in most other jurisdictions in which we operate, with the exception of Canada and India. Accordingly, it would be unlikely for future pre-tax losses to create a tax benefit that would be more likely than not to be realized.
For additional information on our income taxes, see Note 19. Income Taxes of the Consolidated Financial Statements of Part IV, Item 15 of this report "Exhibits, Financial Statement Schedules".
Discontinued operations, net of tax. As a result of the decision to sell our AMS business and wind down our Astora business, the operating results of these businesses are reported as Discontinued operations, net of tax in the Consolidated Statements of Operations for all periods presented. The results of our discontinued operations, net of tax, were losses of $802.7 million, $123.3 million and $1,194.9 million, during the years ended December 31, 2017, 2016 and 2015, respectively.
In 2017, the primary driver of the change was the after-tax impact of a $775.5 million second quarter 2017 charge related to mesh litigation that is further described in Note 14. Commitments and Contingencies of the Consolidated Financial Statements of Part IV, Item 15 of this report "Exhibits, Financial Statement Schedules". This compares to $20.1 million of litigation-related charges recorded during 2016. Also contributing to the period-over-period change was a decrease in revenue resulting from the wind-down of our Astora business following discontinuation of business operations on March 31, 2016. Partially offsetting these changes was an overall decrease in spending as well as a decrease in asset impairment charges of $21.3 million.
In 2016, the decrease in the loss was mainly due to decreases in both litigation-related charges of $1,087.6 million and asset impairment charges of $209.4 million, partially offset by a 2016 decrease in income from operations resulting from the sale of the Men’s Health and Prostate Health components in the third quarter of 2015, a $13.6 million gain on the sale recorded during the third quarter of 2015 that did not reoccur in 2016 and an income tax benefit of $157.4 million recognized in 2015 that did not reoccur in 2016 as a result of our recording of a full valuation allowance in 2016 on certain of our U.S. net deferred tax assets.
2018 Outlook. We estimate that our 2018 total revenues will be between $2.6 billion and $2.8 billion. This estimate reflects an anticipated decline in our future U.S. Generic Pharmaceuticals segment, which will exclude sterile injectable products, driven by the expiration of the marketing exclusivity periods for both ezetimibe tablets and quetiapine ER tablets in the second quarter of 2017, the impact of product rationalization actions resulting from the 2016 and 2017 U.S. Generic Pharmaceuticals segment restructuring initiatives and continued competitive pressure on commoditized generic products; a decline in our future U.S. Branded - Specialty & Established Pharmaceuticals segment resulting from the continued decline in the Established Products portfolio partly driven by the ceasing of shipments of OPANA® ER by September 1, 2017, partially offset by growth in the Specialty Products portfolio primarily driven by XIAFLEX®; a decline in the International Pharmaceuticals segment primarily due to the divestitures of Litha and Somar; partially offset by growth in the future U.S. Branded - Sterile Injectables segment. The Company anticipates continued margin improvement in 2018 driven by cost efficiencies associated with our U.S. Generic Pharmaceuticals segment restructuring initiatives, a continued shift in product mix to higher margin products and targeted cost reductions in selling, general and administrative expenses. We will continue to invest in XIAFLEX® and other core products to position the Company for long-term success. There can be no assurance that we will achieve these results.
61
Business Segment Results Review
As of December 31, 2017, the three reportable business segments in which we operate are: (1) U.S. Generic Pharmaceuticals, (2) U.S. Branded Pharmaceuticals and (3) International Pharmaceuticals. These segments reflect the level at which the chief operating decision maker regularly reviews financial information to assess performance and to make decisions about resources to be allocated. Each segment derives revenue from the sales or licensing of its respective products and is discussed in more detail below.
We evaluate segment performance based on each segment’s adjusted income from continuing operations before income tax, a financial measure not determined in accordance with U.S. GAAP, which we define as Loss from continuing operations before income tax and before certain upfront and milestone payments to partners; acquisition-related and integration items, including transaction costs, earn-out payments or adjustments, changes in the fair value of contingent consideration and bridge financing costs; cost reduction and integration-related initiatives such as separation benefits, retention payments, other exit costs and certain costs associated with integrating an acquired company’s operations; excess costs that will be eliminated pursuant to integration plans; asset impairment charges; amortization of intangible assets; inventory step-up recorded as part of our acquisitions; certain non-cash interest expense; litigation-related and other contingent matters; gains or losses from early termination of debt; foreign currency gains or losses on intercompany financing arrangements; and certain other items.
Certain of the corporate general and administrative expenses incurred by us are not attributable to any specific segment. Accordingly, these costs are not allocated to any of our segments and are included in the results below as “Corporate unallocated costs.” Interest income and expense are also considered corporate items and not allocated to any of our segments. Our consolidated adjusted income from continuing operations before income tax is equal to the combined results of each of our segments less these unallocated corporate items.
We refer to adjusted income from continuing operations before income tax in making operating decisions because we believe it provides meaningful supplemental information regarding our operational performance. For instance, we believe that this measure facilitates its internal comparisons to our historical operating results and comparisons to competitors’ results. We believe this measure is useful to investors in allowing for greater transparency related to supplemental information used in our financial and operational decision-making. In addition, we have historically reported similar financial measures to our investors and believe that the inclusion of comparative numbers provides consistency in our current financial reporting. Further, we believe that adjusted income from continuing operations before income tax may be useful to investors as we are aware that certain of our significant shareholders utilize adjusted income from continuing operations before income tax to evaluate our financial performance. Finally, adjusted income from continuing operations before income tax is utilized in the calculation of adjusted diluted income per share, which is used by the Compensation Committee of Endo’s Board of Directors in assessing the performance and compensation of substantially all of our employees, including our executive officers.
There are limitations to using financial measures such as adjusted income from continuing operations before income tax. Other companies in our industry may define adjusted income from continuing operations before income tax differently than we do. As a result, it may be difficult to use adjusted income from continuing operations before income tax or similarly named adjusted financial measures that other companies may use to compare the performance of those companies to our performance. Because of these limitations, adjusted income from continuing operations before income tax is not intended to represent cash flow from operations as defined by U.S. GAAP and should not be used as alternatives to net income as indicators of operating performance or to cash flows as measures of liquidity. We compensate for these limitations by providing reconciliations of our total segment adjusted income from continuing operations before income tax to our consolidated Loss from continuing operations before income tax, which is determined in accordance with U.S. GAAP and included in our Consolidated Statements of Operations.
Revenues. The following table displays our revenue by reportable segment for the years ended December 31, 2017, 2016 and 2015 (dollars in thousands):
% Change | |||||||||||||||||
2017 | 2016 | 2015 | 2017 vs. 2016 | 2016 vs. 2015 | |||||||||||||
U.S. Generic Pharmaceuticals | $ | 2,281,001 | $ | 2,564,613 | $ | 1,672,416 | (11 | )% | 53 | % | |||||||
U.S. Branded Pharmaceuticals | 957,525 | 1,166,294 | 1,284,607 | (18 | )% | (9 | )% | ||||||||||
International Pharmaceuticals (1) | 230,332 | 279,367 | 311,695 | (18 | )% | (10 | )% | ||||||||||
Total net revenues to external customers | $ | 3,468,858 | $ | 4,010,274 | $ | 3,268,718 | (14 | )% | 23 | % | |||||||
__________
(1) | Revenues generated by our International Pharmaceuticals segment are primarily attributable to external customers located in Canada and, prior to the sale of Litha on July 3, 2017 and Somar on October 25, 2017, South Africa and Latin America. |
62
U.S. Generic Pharmaceuticals. The following table displays the significant components of our U.S. Generic Pharmaceuticals revenues to external customers for the years ended December 31, 2017, 2016 and 2015 (dollars in thousands):
% Change | |||||||||||||||||
2017 | 2016 | 2015 | 2017 vs. 2016 | 2016 vs. 2015 | |||||||||||||
U.S. Generics Base (1) | $ | 829,729 | $ | 1,230,097 | $ | 1,083,809 | (33 | )% | 13 | % | |||||||
Sterile Injectables | 654,270 | 530,805 | 107,592 | 23 | % | NM | |||||||||||
New Launches and Alternative Dosages (2) | 797,002 | 803,711 | 481,015 | (1 | )% | 67 | % | ||||||||||
Total U.S. Generic Pharmaceuticals | $ | 2,281,001 | $ | 2,564,613 | $ | 1,672,416 | (11 | )% | 53 | % | |||||||
__________
NM indicates that the percentage change is not meaningful or is greater than 100%.
(1) | U.S. Generics Base includes solid oral-extended release, solid oral-immediate release and pain/controlled substances products. |
(2) | New Launches and Alternative Dosages includes liquids, semi-solids, patches, powders, ophthalmics, sprays and new product launches. Products are included in New Launches during the calendar year of launch and the subsequent calendar year such that the period of time any product will be considered a New Launch will range from thirteen to twenty-four months. Subsequent to this thirteen to twenty-four month period that revenues are considered New Launches, these product revenues will be reflected as either U.S. Generics Base or Sterile Injectables, or will remain as an Alternative Dosage. New Launches contributed revenues of $445.0 million, $474.5 million and $71.3 million in 2017, 2016 and 2015, respectively. |
U.S. Generics Base
Net sales of U.S. Generics Base decreased in 2017 due to continued competitive pressure on commoditized generic products and the impact of product rationalization actions resulting from the 2016 and 2017 U.S. Generic Pharmaceuticals segment restructuring initiatives. In 2016, net sales of U.S. Generics Base increased due to $629.4 million of revenue from Par, which we acquired in September 2015, partially offset by a decrease as a result of competitive pressure on commoditized generic products.
Sterile Injectables
Net sales of Sterile Injectables increased in 2017 primarily due to net sales of VASOSTRICT® and ADRENALIN®. VASOSTRICT® is currently the first and only vasopressin injection with an NDA approved by the FDA. Its sales were $399.9 million in 2017, up from $343.5 million in 2016, with the change driven by increases in both volume and price. Net sales of Sterile Injectables increased in 2016 primarily due to a full year of revenues from the acquisition of Par, which was acquired in September 2015.
New Launches and Alternative Dosages
The New Launches and Alternative Dosages category currently includes ezetimibe tablets (generic version of Zetia®) and quetiapine ER tablets (generic version of Seroquel® XR). Both of these were first-to-file products launched in the fourth quarter of 2016. The marketing exclusivity periods for both ezetimibe tablets and quetiapine ER tablets expired in the second quarter of 2017. As a result, combined revenues for these products began to decline significantly during the second quarter of 2017. Combined sales for these two products totaled approximately $250 million in 2017, which related almost entirely to the first half of 2017, compared to approximately $290 million in 2016. We do not expect to record significant revenues related to these products in future years.
In 2017, New Launches and Alternative Dosages decreased primarily due to lower combined revenues from ezetimibe tablets and quetiapine ER tablets, as described above, and lower prices as a result of competitive pressure on certain products within Alternative Dosages, partially offset by the launch of new injectables during the first half of 2017 and increases in Alternative Dosages, driven by favorable changes in the competitive market for certain products in this category.
Net sales of New Launches and Alternative Dosages in 2016 increased primarily due to launch products from the September 2015 Par acquisition, including ezetimibe tablets and quetiapine ER tablets, partially offset by increased competitive pressure on patches, ophthalmics and other alternative doses.
As of December 31, 2017, our U.S. Generic Pharmaceuticals segment has over 175 products in its pipeline, which included approximately 100 ANDAs pending with the FDA. Of the 100 ANDAs, approximately 40 represent first-to-file opportunities or first-to-market opportunities. We periodically review our generic products pipeline in order to better direct investment toward those opportunities that we expect will deliver the greatest returns. This process can lead to decisions to discontinue certain R&D projects that may reduce the number of products in our previously reported generic pipeline.
63
U.S. Branded Pharmaceuticals. The following table displays the significant components of our U.S. Branded Pharmaceuticals revenues to external customers for the years ended December 31, 2017, 2016 and 2015 (dollars in thousands):
% Change | |||||||||||||||||
2017 | 2016 | 2015 | 2017 vs. 2016 | 2016 vs. 2015 | |||||||||||||
Specialty Products: | |||||||||||||||||
XIAFLEX® | $ | 213,378 | $ | 189,689 | $ | 158,115 | 12 | % | 20 | % | |||||||
SUPPRELIN® LA | 86,211 | 78,648 | 70,099 | 10 | % | 12 | % | ||||||||||
Other Specialty (1) | 153,384 | 138,483 | 98,025 | 11 | % | 41 | % | ||||||||||
Total Specialty Products | $ | 452,973 | $ | 406,820 | $ | 326,239 | 11 | % | 25 | % | |||||||
Established Products: | |||||||||||||||||
OPANA® ER | $ | 83,826 | $ | 158,938 | $ | 175,772 | (47 | )% | (10 | )% | |||||||
PERCOCET® | 125,231 | 139,211 | 135,822 | (10 | )% | 2 | % | ||||||||||
VOLTAREN® Gel | 68,780 | 100,642 | 207,161 | (32 | )% | (51 | )% | ||||||||||
LIDODERM® | 51,629 | 87,577 | 125,269 | (41 | )% | (30 | )% | ||||||||||
Other Established (2) | 175,086 | 273,106 | 314,344 | (36 | )% | (13 | )% | ||||||||||
Total Established Products | $ | 504,552 | $ | 759,474 | $ | 958,368 | (34 | )% | (21 | )% | |||||||
Total U.S. Branded Pharmaceuticals (3) | $ | 957,525 | $ | 1,166,294 | $ | 1,284,607 | (18 | )% | (9 | )% | |||||||
__________
(1) | Products included within Other Specialty include TESTOPEL®, NASCOBAL® Nasal Spray and AVEED® |
(2) | Products included within Other Established include, but are not limited to, TESTIM® and FORTESTA® Gel, including authorized generics. |
(3) | Individual products presented above represent the top two performing products in each product category and/or any product having revenues in excess of $100.0 million during the years ended December 31, 2017, 2016 or 2015. |
Specialty Products
The increase in net sales of XIAFLEX® in 2017 was primarily attributable to demand growth driven by the continued investment and promotional efforts behind XIAFLEX®, as well as price. The increase in net sales of XIAFLEX® in 2016 was primarily attributable to volume increases in addition to a full twelve months of product revenues following our January 29, 2015 acquisition of Auxilium.
The increase in net sales of SUPPRELIN® LA in 2017 was primarily attributable to price increases. The increase in net sales of SUPPRELIN® LA in 2016 was primarily attributable to both volume and price increases.
Net sales of Other Specialty Products increased in 2017, driven by increased net sales of NASCOBAL® Nasal Spray, AVEED® and TESTOPEL®, which all benefited from increased prices. NASCOBAL® Nasal Spray and AVEED® also benefited from improved volume. The increase in net sales of Other Specialty Products in 2016 was primarily attributable to increased net sales of NASCOBAL® Nasal Spray.
Established Products
As further described above, net sales of OPANA® ER decreased in 2017 as a result of the decision to cease shipments of OPANA® ER to customers by September 1, 2017, which had an adverse effect on the revenues and the results of operations of our U.S. Branded Pharmaceuticals segment during 2017. Prior to this decision, net sales of OPANA® ER were declining as a result of competing generic versions of OPANA® ER and general market declines. Net sales of OPANA® ER decreased in 2016 as a result of competing generic versions of OPANA® ER, which launched beginning in early 2013.
The decrease in net sales of PERCOCET® in 2017 was primarily attributable to volume decreases, partially offset by price increases. The increase in net sales of PERCOCET® in 2016 was primarily attributable to price increases, partially offset by volume decreases.
The decreases in net sales of VOLATREN® Gel in both 2017 and 2016 were primarily attributable to the March 2016 launch of Amneal Pharmaceuticals LLC’s generic equivalent of VOLTAREN® Gel and our launch of the authorized generic of VOLTAREN® Gel in July 2016. Subject to FDA approval, it is possible one or more additional competing generic products could potentially enter the market, which could further impact future sales of VOLTAREN® Gel.
The decrease in net sales of LIDODERM® in 2017 was primarily attributable to volume decreases resulting from generic competition. The decrease in 2016 was attributable to volume decreases resulting from generic competition partially offset by an increase in price. Actavis plc (Actavis) (now Teva) launched a generic form of LIDODERM® in September 2013, our U.S. Generic Pharmaceuticals segment launched its authorized generic of LIDODERM® in May 2014, and Mylan, Inc. launched a generic form of LIDODERM® in August 2015. To the extent additional competitors are able to launch generic versions of LIDODERM®, our revenues could decline further.
64
The decrease in net sales of Other Established Products in 2017 was primarily attributable to volume decreases resulting from generic competition and certain other factors, as well as the divestiture of STENDRA® in the third quarter of 2016. The decrease in net sales of Other Established Products in 2016 was primarily attributable to decreased FROVA® revenues related to generic competition, partially offset by the acquisitions of Auxilium, which we acquired in January 2015, and Par, which we acquired in September 2015.
International Pharmaceuticals. The decrease in International Pharmaceuticals net sales in 2017 was primarily attributable to the divestitures of Litha in July 2017 and Somar in October 2017, partially offset by revenue increases in certain of the other international markets in which we operate in 2017. We expect this segment’s revenues to continue to decline in 2018 due to the second-half 2017 divestitures of Litha and Somar, which are described in more detail in Note 3. Discontinued Operations and Assets and Liabilities Held for Sale of the Consolidated Financial Statements of Part IV, Item 15 of this report "Exhibits, Financial Statement Schedules". The decrease during 2016 was primarily attributable to decreases in Litha revenues as a result of its divestiture of non-core assets during the first quarter of 2016 in addition to unfavorable fluctuations in foreign currency rates, partially offset by increased revenues from the acquisition of certain Aspen Holdings assets in the fourth quarter of 2015 (the Aspen Asset Acquisition).
Adjusted income from continuing operations before income tax. The following table displays our Adjusted income from continuing operations before income tax by reportable segment for the years ended December 31, 2017, 2016 and 2015 (dollars in thousands):
% Change | |||||||||||||||||
2017 | 2016 | 2015 | 2017 vs. 2016 | 2016 vs. 2015 | |||||||||||||
U.S. Generic Pharmaceuticals | $ | 1,064,352 | $ | 1,079,479 | $ | 741,767 | (1 | )% | 46 | % | |||||||
U.S. Branded Pharmaceuticals | 485,515 | 553,806 | 694,440 | (12 | )% | (20 | )% | ||||||||||
International Pharmaceuticals | 58,308 | 84,337 | 81,789 | (31 | )% | 3 | % | ||||||||||
Total segment adjusted income from continuing operations before income tax | $ | 1,608,175 | $ | 1,717,622 | $ | 1,517,996 | (6 | )% | 13 | % | |||||||
U.S. Generic Pharmaceuticals. The decrease in adjusted income from continuing operations before income tax for the U.S. Generic Pharmaceuticals segment for 2017 was primarily attributable to the impact of competitive pressure on commoditized generic products, partially offset by increases related to sales and gross margin resulting from strong performance of our Sterile Injectables portfolio. Additionally, product rationalization actions and other restructuring initiatives had the effect of improving gross margin and reducing overall operating expenses. In 2016, revenues and gross margins increased primarily due to the September 2015 Par acquisition. These increases were partially offset by the impact of competitive pressure on commoditized generic products and increased charges related to excess inventory reserves due to the underperformance of certain products.
U.S. Branded Pharmaceuticals. The decrease in adjusted income from continuing operations before income tax for the U.S. Branded Pharmaceuticals segment for 2017 was a result of decreased revenues related to generic competition impacting several products in this segment, actions taken with respect to OPANA® ER as discussed above and the divestiture of STENDRA® in the third quarter of 2016. These decreases were partially offset by targeted cost reductions in Selling, general and administrative expenses associated with our previously announced restructuring initiatives, as well as the reduction to Research and development costs described above. The decrease in 2016 was primarily attributable to decreased VOLTAREN® Gel, LIDODERM®, OPANA® ER and FROVA® revenues related to generic competition.
International Pharmaceuticals. The decrease in adjusted income from continuing operations before income tax for the International Pharmaceuticals segment for 2017 was primarily attributable to the July 3, 2017 divestiture of Litha and October 25, 2017 divestiture of Somar. The increase in 2016 was primarily attributable to an increase in gross margin resulting from the divestiture of certain lower margin products in the first quarter of 2016, increased revenues from the Aspen Asset Acquisition and decreased operating expenses, partially offset by unfavorable fluctuations in foreign currency rates.
65
The table below provides reconciliations of our consolidated Loss from continuing operations before income tax, which is determined in accordance with U.S. GAAP, to our total segment adjusted income from continuing operations before income tax for the years ended December 31, 2017, 2016 and 2015 (in thousands):
2017 | 2016 | 2015 | |||||||||
Total consolidated loss from continuing operations before income tax | $ | (1,483,004 | ) | $ | (3,923,856 | ) | $ | (1,437,864 | ) | ||
Interest expense, net | 488,228 | 452,679 | 373,214 | ||||||||
Corporate unallocated costs (1) | 165,298 | 189,043 | 171,242 | ||||||||
Amortization of intangible assets | 773,766 | 876,451 | 561,302 | ||||||||
Inventory step-up and certain manufacturing costs that will be eliminated pursuant to integration plans | 390 | 125,699 | 249,464 | ||||||||
Upfront and milestone payments to partners | 9,483 | 8,330 | 16,155 | ||||||||
Separation benefits and other cost reduction initiatives (2) | 212,448 | 107,491 | 125,407 | ||||||||
Impact of VOLTAREN® Gel generic competition | — | (7,750 | ) | — | |||||||
Acceleration of Auxilium employee equity awards at closing | — | — | 37,603 | ||||||||
Certain litigation-related and other contingencies, net (3) | 185,990 | 23,950 | 37,082 | ||||||||
Asset impairment charges (4) | 1,154,376 | 3,781,165 | 1,140,709 | ||||||||
Acquisition-related and integration items (5) | 58,086 | 87,601 | 105,250 | ||||||||
Loss on extinguishment of debt | 51,734 | — | 67,484 | ||||||||
Costs associated with unused financing commitments | — | — | 78,352 | ||||||||
Other-than-temporary impairment of equity investment | — | — | 18,869 | ||||||||
Foreign currency impact related to the remeasurement of intercompany debt instruments | (1,403 | ) | 366 | (25,121 | ) | ||||||
Other, net | (7,217 | ) | (3,547 | ) | (1,152 | ) | |||||
Total segment adjusted income from continuing operations before income tax | $ | 1,608,175 | $ | 1,717,622 | $ | 1,517,996 | |||||
__________
(1) | Amounts include certain corporate overhead costs, such as headcount and facility expenses and certain other income and expenses. |
(2) | Amounts primarily relate to employee separation costs of $53.0 million, $57.9 million and $60.2 million in 2017, 2016 and 2015, respectively. Other amounts in 2017 include accelerated depreciation of $123.7 million, charges to increase excess inventory reserves of $13.7 million and other charges of $22.0 million, each of which related primarily to the 2017 U.S. Generic Pharmaceuticals Restructuring Initiative. Other amounts in 2016 primarily consist of charges to increase excess inventory reserves of $24.5 million and other restructuring costs of $25.1 million, consisting primarily of contract termination fees and building costs. Other amounts in 2015 primarily consist of $41.2 million of inventory write-offs and $13.3 million of building costs, including a $7.9 million charge recorded upon the cease use date of our Auxilium subsidiary’s former corporate headquarters. See Note 4. Restructuring of the Consolidated Financial Statements of Part IV, Item 15 of this report "Exhibits, Financial Statement Schedules" for discussion of our material restructuring initiatives. |
(3) | Amounts include adjustments for Litigation-related and other contingencies, net as further described in Note 14. Commitments and Contingencies of the Consolidated Financial Statements of Part IV, Item 15 of this report "Exhibits, Financial Statement Schedules". |
(4) | Amounts primarily relate to charges to impair goodwill and intangible assets as further described in Note 10. Goodwill and Other Intangibles of the Consolidated Financial Statements of Part IV, Item 15 of this report "Exhibits, Financial Statement Schedules" as well as charges to write down certain property, plant and equipment as further described in Note 4. Restructuring, Note 7. Fair Value Measurements and Note 9. Property, Plant and Equipment of the Consolidated Financial Statements of Part IV, Item 15 of this report "Exhibits, Financial Statement Schedules". |
(5) | Amounts in 2017, 2016 and 2015 include costs directly associated with previous acquisitions of $8.1 million, $63.8 million and $170.9 million, respectively. In addition, in 2017 and 2016, there were charges due to changes in the fair value of contingent consideration of $49.9 million and $23.8 million, respectively. In 2015, there was a benefit due to changes in the fair value of contingent consideration of $65.6 million. |
LIQUIDITY AND CAPITAL RESOURCES
Our principal source of liquidity is cash generated from operations. Our principal liquidity requirements are primarily for working capital for operations, licenses, milestone payments, capital expenditures, contingent liabilities, vaginal mesh liability payments and debt service payments. The Company’s working capital was $50.2 million at December 31, 2017 compared to a working capital deficit of $45.3 million at December 31, 2016. The amounts at December 31, 2017 and December 31, 2016 include restricted cash and cash equivalents of $313.8 million and $276.0 million, respectively, held in Qualified Settlement Funds (QSFs) for mesh-related matters. Although these amounts in QSFs are included in working capital, they are required to be used for mesh product liability settlement agreements that are expected to be paid to qualified claimants within the next twelve months.
Cash and cash equivalents, which primarily consisted of bank deposits, time deposits and money market accounts, totaled $986.6 million at December 31, 2017 compared to $517.3 million at December 31, 2016.
66
We expect cash generated from operations together with our cash, cash equivalents, restricted cash and the revolving credit facilities to be sufficient to cover cash needs for working capital and general corporate purposes, contingent liabilities, payment of contractual obligations, principal and interest payments on our indebtedness, capital expenditures, ordinary share repurchases and any regulatory and/or sales milestones that may become due over the next year. However, on a longer term basis, we may not be able to accurately predict the effect of certain developments on the rate of sales growth, such as the degree of market acceptance, patent protection and exclusivity of our products, pricing pressures (including those due to the impact of competition), the effectiveness of our sales and marketing efforts and the outcome of our current efforts to develop, receive approval for and successfully launch our product candidates. We may also face unexpected expenses in connection with our business operations, including expenses related to our ongoing and future legal proceedings and governmental investigations and other contingent liabilities. Furthermore, we may not be successful in implementing, or may face unexpected changes or expenses in connection with our strategic direction, including the potential for opportunistic corporate development transactions. Any of the above could adversely affect our future cash flows.
We may need to obtain additional funding to repay our outstanding indebtedness, for our future operational needs or for future transactions. We have historically had broad access to financial markets that provide liquidity; however, we cannot be certain that funding will be available on terms acceptable to us, or at all. Any issuances of equity securities or convertible securities could have a dilutive effect on the ownership interest of our current shareholders and may adversely impact net income per share in future periods. An acquisition may be accretive or dilutive and, by its nature, involves numerous risks and uncertainties. As a result of acquisition efforts, if any, we are likely to experience significant charges to earnings for merger and related expenses (whether or not the acquisitions are consummated) that may include transaction costs, closure costs or costs of restructuring activities.
We consider the undistributed earnings from the majority of our subsidiaries as of December 31, 2017 to be indefinitely reinvested outside of Ireland and, accordingly, neither income tax nor withholding taxes have been provided thereon. As of December 31, 2017, indefinitely reinvested earnings were approximately $169.8 million. We have historically repatriated funds on a tax-free basis to our parent company for stock repurchases and to our Irish and Luxembourg financing companies to repay debt. Accordingly, we do not anticipate incurring tax in deploying funds to satisfy liquidity needs arising in the ordinary course of our business.
Borrowings. At December 31, 2017, under the 2017 Credit Agreement, the Company had outstanding borrowings in an aggregate principal amount of $3,397.9 million and additional availability of approximately $996.8 million under the 2017 Revolving Credit Facility.
The 2017 Credit Agreement contains affirmative and negative covenants that the Company believes to be usual and customary for a senior secured credit facility. The negative covenants include, among other things, limitations on asset sales, mergers and acquisitions, indebtedness, liens, dividends and other restrictive payments, investments and transactions with the Company’s affiliates. As of December 31, 2017, we were in compliance with all such covenants.
At December 31, 2017, the Company’s indebtedness also includes senior notes with aggregate principal amounts totaling $5.0 billion. These notes mature between 2022 and 2025, subject to earlier repurchase or redemption in accordance with the terms of the respective indentures. Interest rates on these notes range from 5.375% to 7.25%. Other than the 5.875% Senior Secured Notes due 2024, these notes are senior unsecured obligations of the Company’s subsidiaries party to the applicable indenture governing such notes. These notes are issued by certain of our subsidiaries and are guaranteed on a senior unsecured basis by the subsidiaries of Endo International plc that also guarantee our 2017 Credit Agreement, except for a de minimis amount of the 7.25% Senior Notes due 2022, which are issued by Endo Health Solutions Inc. and guaranteed on a senior unsecured basis by the guarantors named in the Fifth Supplemental Indenture relating to such notes. The 5.875% Senior Secured Notes due 2024 are senior secured obligations of Endo International plc and its subsidiaries that are party to the indenture governing such notes. These notes are issued by certain of our subsidiaries and are guaranteed on a senior secured basis by Endo International plc and its subsidiaries that also guarantee our 2017 Credit Agreement.
The indentures governing our various senior notes contain affirmative and negative covenants that the Company believes to be usual and customary for similar indentures. The negative covenants, among other things, restrict the Company’s ability, and the ability of its restricted subsidiaries, to incur certain additional indebtedness and issue preferred stock, make certain investments and restricted payments, sell certain assets, enter into sale and leaseback transactions, agree to payment restrictions on the ability of restricted subsidiaries to make certain payments to Endo International plc or any of its restricted subsidiaries, create certain liens, merge, consolidate or sell all or substantially all of the Company’s assets or enter into certain transactions with affiliates. As of December 31, 2017, we were in compliance with all covenants.
The obligations of the borrowers under the 2017 Credit Agreement are guaranteed by the Company and the subsidiaries of the Company (with certain customary exceptions) (the “Guarantors” and, together with the Borrowers, the “Loan Parties”). The obligations (i) under the 2017 Credit Agreement and related loan documents and (ii) the indenture governing the 5.875% Senior Secured Notes due 2024 and related documents are secured on a pari passu basis by a perfected first priority (subject to permitted liens) lien on substantially all of the assets of the Loan Parties (subject to customary exceptions).
Credit ratings. The Company’s corporate credit ratings assigned by Moody’s Investors Service and Standard & Poor’s are B2 with a negative outlook and B with a stable outlook, respectively.
67
Working capital. The components of our working capital and our liquidity at December 31, 2017 and December 31, 2016 are below (dollars in thousands):
December 31, 2017 | December 31, 2016 | ||||||
Total current assets | $ | 2,271,077 | $ | 2,589,459 | |||
Less: total current liabilities | (2,220,909 | ) | (2,634,745 | ) | |||
Working capital | $ | 50,168 | $ | (45,286 | ) | ||
Current ratio | 1.0:1 | -1.0:1 | |||||
Net working capital increased by $95.5 million from December 31, 2016 to December 31, 2017. This increase reflects the favorable impact to net current assets resulting from operations during the year ended December 31, 2017. In addition, the April 2017 refinancing reduced the principal amount of debt maturing in 2017 by $86.4 million, which had the effect of increasing working capital. We also sold Litha in the third quarter of 2017 and Somar in the fourth quarter of 2017, which resulted in increases to working capital of $39.5 million and $82.3 million, respectively. These increases during the year ended December 31, 2017 were partially offset by the unfavorable impact of mesh-related product liability charges, net of related reclassification adjustments from current to non-current liabilities, of $565.0 million, purchases of property, plant and equipment of $125.7 million, payments for deferred financing fees of $57.8 million and the elimination of a $24.1 million current deferred charge related to the adoption of ASU 2016-16, which was recorded as an adjustment to retained earnings.
The following table summarizes our Consolidated Statements of Cash Flows for the years ended December 31, 2017, 2016 and 2015 (in thousands):
2017 | 2016 | 2015 | |||||||||
Net cash flow provided by (used in): | |||||||||||
Operating activities | $ | 553,985 | $ | 528,143 | $ | 118,501 | |||||
Investing activities | 104,583 | (177,552 | ) | (6,183,764 | ) | ||||||
Financing activities | (166,993 | ) | (397,186 | ) | 6,001,992 | ||||||
Effect of foreign exchange rate | 2,515 | 436 | (11,269 | ) | |||||||
Movement in cash held for sale | 11,744 | (11,744 | ) | 997 | |||||||
Net increase (decrease) in cash, cash equivalents, restricted cash and restricted cash equivalents | $ | 505,834 | $ | (57,903 | ) | $ | (73,543 | ) | |||
Net cash provided by operating activities. Net cash provided by operating activities was $554.0 million in 2017 compared to $528.1 million in 2016 and $118.5 million in 2015.
Net cash provided by operating activities represents the cash receipts and cash disbursements from all of our activities other than investing activities and financing activities. Changes in cash from operating activities reflect, among other things, the timing of cash collections from customers, payments to suppliers, managed care organizations, government agencies, collaborative partners and employees, as well as tax payments and refunds in the ordinary course of business.
The $25.8 million increase in Net cash provided by operating activities in 2017 compared 2016 was primarily the result of increased cash receipts generated by net sales of ezetimibe tablets and quetiapine ER tablets, which launched in the fourth quarter of 2016 and contributed to the $474.7 million decrease in Accounts receivable from December 31, 2016 to December 31, 2017. Cash outlays for mesh settlements decreased $491.1 million during 2017 compared to 2016. In addition, as a result of continued generic competition on certain legacy branded products and the discontinuation of certain generic products resulting from the 2016 U.S. Generic Pharmaceuticals Restructuring Initiative, cash outlays for customer rebates and chargebacks decreased during 2017 compared to 2016. These increases were partially offset by $760.0 million in U.S. federal income tax refunds received during 2016, compared to $29.8 million received in 2017, increased payments to partners during 2017 resulting from sales of ezetimibe tablets, which launched during the fourth quarter of 2016 and contributed to the $128.3 million decrease in accrued royalties and other distribution partner payables from December 31, 2016 to December 31, 2017 and the timing of payments related to certain other current liabilities.
The $409.6 million increase in Net cash provided by operating activities in 2016 compared to 2015 was primarily the result of $760.0 million in U.S. federal income tax refunds received during 2016, offset partially by the timing of cash collections and cash payments related to our operations.
Net cash provided by (used in) investing activities. Net cash provided by investing activities was $104.6 million in 2017 compared to $177.6 million used in investing activities in 2016 and $6,183.8 million used in investing activities in 2015.
68
This $282.1 million change in cash provided by investing activities in 2017 compared to cash used in investing activities in 2016 relates primarily to an increase in net proceeds from the sales of businesses and other assets of $212.4 million, including the sales of Litha in July 2017 and Somar in October 2017, and a decrease in purchases of property, plant and equipment of $13.2 million. In addition, 2016 activity included acquisitions, net of cash acquired of $30.4 million and payments for patent acquisition costs and license fees of $19.2 million, neither of which had comparable activity during 2017.
The $6,006.2 million decrease in cash used in investing activities in 2016 compared to cash used in investing activities in 2015 relates primarily to a decrease in cash used for acquisitions in 2016 of $7,617.7 million and a decrease in patent acquisition costs and license fees in 2016 of $24.8 million, which related primarily to the 2015 acquisitions of Par, Auxilium and certain Aspen Holdings assets. This amount was partially offset by a decrease of $1,577.9 million in proceeds from sales of businesses and other assets, primarily relating to the sale of the Men’s Health and Prostate Health components of the AMS business during the third quarter of 2015, and an increase in purchases of property, plant and equipment of $57.1 million.
Net cash (used in) provided by financing activities. Net cash used in financing activities was $167.0 million in 2017 compared to $397.2 million used in financing activities in 2016 and $6,002.0 million provided by financing activities in 2015.
Items contributing to the $230.2 million decrease in cash used in financing activities in 2017 compared to cash used in financing activities in 2016 include an increase in proceeds from issuance of term loans of $3,415.0 million, an increase in proceeds from issuance of notes of $300.0 million and a decrease in payments of revolving debt of $605.0 million, partially offset by an increase in principal payments on term loans of $3,627.3 million, a decrease in amounts of revolving debt drawn of $380.0 million, an increase in payments for deferred financing fees of $57.3 million and an increase in payments for contingent consideration of $29.1 million.
Items contributing to the $6,399.2 million change in cash used in financing activities in 2016 compared to cash provided by financing activities in 2015 include a decrease in proceeds from the issuance of notes of $2,835.0 million, a decrease in proceeds from the issuance of term loans of $2,800.0 million, a decrease in proceeds from the issuance of ordinary shares of $2,300.0 million, a decrease in proceeds from draw of revolving debt of $145.0 million and an increase in repayments of revolving debt of $305.0 million, partially offset by a decrease in principal payments on notes of $899.9 million, a decrease in principal payments on term loans of $369.8 million, a decrease in amounts for the repurchase of ordinary shares of $250.1 million, a decrease due to the repurchase of convertible notes of $247.8 million, a decrease resulting from payments for deferred financing fees of $124.6 million and a decrease in payments related to the issuance of ordinary shares of $67.0 million.
Research and development. Over the past few years, we have incurred significant expenditures related to conducting clinical studies to develop new products and expand the value of our existing products beyond what is currently approved in their respective labels.
As part of the Auxilium acquisition, the Company acquired Auxilium’s licensed rights covering certain indications of CCH, the active ingredient in XIAFLEX®. As a result, the Company has incurred R&D expense for certain indications of CCH in various stages of development, including a Phase 2b cellulite trial, the results of which were announced in November 2016, and Phase 3 cellulite clinical trials, which began in early 2018.
We expect to incur R&D expenditures related to the development and advancement of our current generic and branded product pipeline and any additional product candidates we may add via license, acquisition or organically. There can be no assurance that the results of any ongoing or future nonclinical or clinical trials related to these projects will be successful, that additional trials will not be required, that any drug, product or indication under development will receive regulatory approval in a timely manner or at all or that such drug, product or indication could be successfully manufactured in accordance with local current good manufacturing practices or marketed successfully, or that we will have sufficient funds to develop or commercialize any of our products.
Manufacturing, supply and other service agreements. We contract with various third party manufacturers, suppliers and service providers to supply our products, or materials used in the manufacturing of our products, and to provide additional services such as packaging, processing, labeling, warehousing, distribution and customer service support. Any interruption to the goods or services provided for by these and similar contracts could have an adverse effect on our business, financial condition, results of operations and cash flows.
License and collaboration agreements. We could become obligated to make certain contingent payments pursuant to our license, collaboration and other agreements. Payments under these agreements generally become due and payable only upon the achievement of certain developmental, regulatory, commercial and/or other milestones. In addition, we may be required to make sales-based royalty payments under certain arrangements if certain products are approved for marketing. Due to the fact that it is uncertain if and when these milestones will be achieved, such contingencies have not been recorded in our Consolidated Balance Sheets.
69
Acquisitions. Going forward, our primary focus will be on organic growth. However, we may consider and, as appropriate, make acquisitions of other businesses, products, product rights or technologies. Our cash reserves and other liquid assets may be inadequate to consummate such acquisitions and it may be necessary for us to issue ordinary shares or raise substantial additional funds in the future to complete future transactions. In addition, as a result of any acquisition efforts, we are likely to experience significant charges to earnings for merger and related expenses (whether or not our efforts are successful) that may include transaction costs, closure costs, integration costs and/or costs of restructuring activities.
Legal proceedings. We are subject to various patent challenges, product liability claims, government investigations and other legal proceedings in the ordinary course of business. Contingent accruals are recorded when we determine that a loss is both probable and reasonably estimable. Due to the fact that legal proceedings and other contingencies are inherently unpredictable, our assessments involve significant judgments regarding future events. For additional discussion of legal proceedings, see Note 14. Commitments and Contingencies of the Consolidated Financial Statements of Part IV, Item 15 of this report “Exhibits, Financial Statement Schedules”.
Contractual Obligations. The following table lists our enforceable and legally binding noncancelable obligations as of December 31, 2017.
Payment Due by Period (in thousands) | ||||||||||||||||||||||||||||
Total | 2018 | 2019 | 2020 | 2021 | 2022 | Thereafter | ||||||||||||||||||||||
Long-term debt obligations (1) | $ | 8,382,980 | $ | 34,205 | $ | 34,150 | $ | 34,150 | $ | 34,150 | $ | 1,134,150 | $ | 7,112,175 | ||||||||||||||
Interest expense (2) | 3,170,418 | 520,446 | 513,425 | 517,651 | 517,276 | 480,210 | 621,410 | |||||||||||||||||||||
Capital lease obligations (3) | 47,548 | 6,713 | 6,633 | 6,564 | 6,681 | 6,831 | 14,126 | |||||||||||||||||||||
Operating lease obligations (4) | 88,186 | 13,888 | 14,120 | 13,505 | 11,758 | 11,212 | 23,703 | |||||||||||||||||||||
Purchase obligations (5) | 65,740 | 22,093 | 15,016 | 11,343 | 11,586 | 1,150 | 4,552 | |||||||||||||||||||||
Mesh-related product liability settlements (6) | 602,689 | 392,239 | 210,450 | — | — | — | — | |||||||||||||||||||||
Other obligations and commitments (7) | 8,343 | 4,843 | 500 | 500 | 500 | 500 | 1,500 | |||||||||||||||||||||
Total (8) | $ | 12,365,904 | $ | 994,427 | $ | 794,294 | $ | 583,713 | $ | 581,951 | $ | 1,634,053 | $ | 7,777,466 | ||||||||||||||
__________
(1) | Includes minimum cash payments related to principal associated with our indebtedness. A discussion of such indebtedness is included above under the caption “Borrowings”. Any outstanding amounts borrowed pursuant to the 2017 Credit Facility will immediately mature if certain of our senior notes (enumerated under the heading “April 2017 Refinancing” in Note 13. Debt of the Consolidated Financial Statements of Part IV, Item 15 of this report) (other than, in the case of the 2017 Revolving Credit Facility, the 5.375% Senior notes Due 2023 and the 6.00% Senior Notes due 2023) are not refinanced or repaid in full prior to the date that is 91 days prior to the respective stated maturity dates thereof. Accordingly, we may be required to repay or refinance senior notes with an aggregate principal amount of $1,100.0 million in 2021, despite such notes having stated maturities in 2022. Similarly, we may be required to repay or refinance senior notes with an aggregate principal amount of $750.0 million in 2022, despite such notes having stated maturities in 2023. The amounts in this table do not reflect any such early payment; rather, they reflect stated maturity dates. |
(2) | These amounts represent future cash interest payments related to our existing debt obligations based on fixed and variable interest rates specified in the associated debt agreements. Payments related to variable debt are based on applicable rates at December 31, 2017 plus the specified margin in the associated debt agreements for each period presented. |
(3) | Includes minimum cash payments related to certain fixed assets, primarily related to technology. In addition, includes minimum cash payments related to the direct financing arrangement for our U.S. headquarters in Malvern, Pennsylvania. We have entered into agreements to sublease certain properties. Most significantly, we sublease approximately 90,000 square feet of our Malvern, Pennsylvania headquarters and substantially all of our Chesterbrook, Pennsylvania facility. As of December 31, 2017, we expect to receive approximately $25.2 million in future minimum rental payments over the remaining terms of the Malvern and Chesterbrook subleases from 2018 until 2024. Amounts included in this table have not been reduced by the minimum sublease rentals. |
(4) | Includes minimum cash payments related to our leased automobiles, machinery and equipment, facilities and other property not included in capital lease obligations. Any proceeds for sublease income are excluded from the table above. |
(5) | Purchase obligations are enforceable and legally binding obligations for purchases of goods and services, including minimum inventory contracts. |
(6) | The amounts included above represent contractual payments for mesh-related product liability settlements and reflect the earliest date that a settlement payment could be due and the largest amount that could be due on that date. These matters are described in more detail in Note 14. Commitments and Contingencies of the Consolidated Financial Statements of Part IV, Item 15 of this report. |
(7) | Other obligations and commitments include agreements to purchase third-party assets, products and services and other minimum royalty obligations. |
(8) | Total does not include contractual obligations already included in current liabilities on our Consolidated Balance Sheets, except for current portion of long-term debt, accrued interest, short-term capital lease obligations, the mesh-related product liability and certain purchase obligations, which are discussed below. |
70
For purposes of the table above, obligations for the purchase of goods or services are included only for significant noncancelable purchase orders at least one year in length that are enforceable, legally binding and specify all significant terms, including fixed or minimum quantities to be purchased, fixed, minimum or variable price provisions and the timing of the obligation. In cases where our minimum obligations are variable based on future contingent events or circumstances, we estimate the minimum obligations based on information available to us at the time of disclosure. Our purchase orders are based on our current manufacturing needs and are typically fulfilled by our suppliers within a relatively short period. At December 31, 2017, we have open purchase orders that represent authorizations to purchase rather than binding agreements that are not included in the table above. In addition, we do not include collaboration agreements and potential payments under those agreements or potential payments related to contingent consideration.
As of December 31, 2017, our liability for unrecognized tax benefits amounted to $435.1 million (including interest and penalties). Due to the nature and timing of the ultimate outcome of these uncertain tax positions, we cannot make a reliable estimate of the amount and period of related future payments. Therefore, our liability has been excluded from the above contractual obligations table.
Fluctuations. Our quarterly results have fluctuated in the past and may continue to fluctuate. These fluctuations may be due to the timing of new product launches, purchasing patterns of our customers, market acceptance of our products, the impact of competitive products and pricing, certain actions taken by us which may impact the availability of our products, asset impairment charges, litigation-related charges, restructuring costs, including separation benefits, business combination transaction costs, upfront, milestone and certain other payments made or accrued pursuant to licensing agreements and changes in the fair value of financial instruments and contingent assets and liabilities recorded as part of business combinations. Further, a substantial portion of our total revenues are through three wholesale drug distributors who in turn supply our products to pharmacies, hospitals and physicians. Accordingly, we are potentially subject to a concentration of credit risk with respect to our trade receivables.
Growth opportunities. We continue to evaluate growth opportunities including investments, licensing arrangements, acquisitions of product rights or technologies, businesses and strategic alliances and promotional arrangements, any of which could require significant capital resources. We continue to focus our business development activities on further diversifying our revenue base through product licensing and company acquisitions, as well as other opportunities to enhance shareholder value. Through execution of our business strategy we focus on developing new products both internally and with contract and collaborative partners; expanding our product lines by acquiring new products and technologies, increasing revenues and earnings through sales and marketing programs for our innovative product offerings and effectively using our resources; and providing additional resources to support our businesses.
Non-U.S. operations. Fluctuations in foreign currency rates resulted in a net gain of $2.8 million in 2017. This compares to a net loss of $3.0 million in 2016 and a net gain of $23.1 million in 2015.
Inflation. We do not believe that inflation had a material adverse effect on our financial statements for the periods presented.
Off-balance sheet arrangements. We have no off-balance sheet arrangements as defined in Item 303(a)(4) of Regulation S-K.
Item 7A. Quantitative and Qualitative Disclosures About Market Risk
Market risk is the potential loss arising from adverse changes in the financial markets, including interest rates and foreign currency exchange rates.
Interest Rate Risk
Our exposure to interest rate risk relates primarily to our variable rate indebtedness associated with our term loan and revolving credit facilities. At December 31, 2017, our variable-rate debt borrowings related to our term loan facilities and had an aggregate principal amount of $3.4 billion. Borrowings under the 2017 Credit Agreement bear interest at a LIBOR-based variable rate as further described in Note 13. Debt in Part IV, Item 15 of this report "Exhibits, Financial Statement Schedules", in certain cases subject to a floor. A hypothetical 1% increase in the applicable rate over the floor would result in $34.0 million in incremental annual interest expense related to our variable-rate debt borrowings.
To the extent that we utilize amounts under the 2017 Revolving Credit Facility or take on additional variable rate indebtedness, we will be exposed to additional interest rate risk.
As of December 31, 2017 and 2016, we had no other assets or liabilities with significant interest rate sensitivity.
71
Foreign Currency Exchange Risk
We operate and transact business in various foreign countries and are therefore subject to risks associated with foreign currency exchange rate fluctuations. The Company manages this foreign currency risk, in part, through operational means including managing foreign currency revenues in relation to same currency costs as well as managing foreign currency assets in relation to same currency liabilities. The Company is also exposed to the potential earnings effects from intercompany foreign currency assets and liabilities that arise from normal trade receivables and payables and other intercompany loans. Additionally, certain of the Company’s subsidiaries maintain their books of record in currencies other than their respective functional currencies. These subsidiaries’ financial statements are remeasured into their respective functional currencies using current or historic exchange rates. Such remeasurement adjustments could have an adverse effect on the Company’s results of operations.
All assets and liabilities of our international subsidiaries, which maintain their financial statements in local currency, are translated to U.S. dollars at period-end exchange rates. Translation adjustments arising from the use of differing exchange rates are included in Accumulated other comprehensive loss in shareholders’ equity. Gains and losses on foreign currency transactions and short-term intercompany receivables from foreign subsidiaries are included in Other (income) expense, net.
Fluctuations in foreign currency rates resulted in a net gain of $2.8 million in 2017. This compares to a net loss of $3.0 million in 2016 and a net gain of $23.1 million in 2015.
Based on the Company’s significant foreign currency denominated intercompany loans existing at December 31, 2017, we estimate that a 10% change in the underlying currencies of our foreign currency denominated intercompany loans, relative to the U.S. Dollar, could result in approximately $10 million in incremental foreign currency losses.
Item 8. Financial Statements and Supplementary Data
The information required by this item is contained in the financial statements set forth in Item 15. under the caption “Consolidated Financial Statements” as part of this Annual Report on Form 10-K.
Item 9. Changes in and Disagreements with Accountants on Accounting and Financial Disclosure
Not applicable.
Item 9A. Controls and Procedures
(a) Evaluation of Disclosure Controls and Procedures
The Company’s management, with the participation of the Company’s Chief Executive Officer and Principal Financial Officer, has evaluated the effectiveness of the Company’s disclosure controls and procedures, as defined in Rules 13a-15(e) and 15d-15(e) of the Securities Exchange Act of 1934, as of December 31, 2017. Based on that evaluation, the Company’s Chief Executive Officer and Principal Financial Officer concluded that the Company’s disclosure controls and procedures were effective as of December 31, 2017.
(b) Management’s Report on Internal Control over Financial Reporting
The report of management of the Company regarding internal control over financial reporting is set forth in Item 15. of this Annual Report on Form 10-K under the caption “Management’s Report on Internal Control Over Financial Reporting” and incorporated herein by reference.
(c) Attestation Report of Independent Registered Public Accounting Firm
The attestation report of the Company’s independent registered public accounting firm regarding internal control over financial reporting is set forth in Item 15. of this Annual Report on Form 10-K under the caption “Report of Independent Registered Public Accounting Firm” and incorporated herein by reference.
(d) Changes in Internal Control over Financial Reporting
During the fiscal quarter ended December 31, 2017, the Company implemented a new global financial consolidations and planning system, which has led to a variety of changes to the Company’s internal controls, particularly within the Company’s finance function. Management believes it maintained and monitored appropriate internal controls during and subsequent to the implementation.
There have been no other changes in the Company’s internal control over financial reporting during the fiscal quarter ended December 31, 2017 that have materially affected, or are reasonably likely to materially affect, the Company’s internal control over financial reporting.
Item 9B. Other Information
None.
72
PART III
Item 10. Directors, Executive Officers and Corporate Governance
Directors
The information concerning our directors required under this Item is incorporated herein by reference from our proxy statement, which will be filed with the Securities and Exchange Commission, relating to our 2018 Annual General Meeting (2018 Proxy Statement).
Executive Officers
For information concerning Endo’s executive officers, see Part 1, Item 1 of this report "Business" under the caption “Executive Officers of the Registrant” and our 2018 Proxy Statement.
Code of Ethics
The information concerning our Code of Conduct is incorporated herein by reference from our 2018 Proxy Statement and can be viewed on our website, the internet address for which is www.endo.com.
Audit Committee
The information concerning our Audit Committee is incorporated herein by reference from our 2018 Proxy Statement.
Audit Committee Financial Experts
The information concerning our Audit Committee Financial Experts is incorporated herein by reference from our 2018 Proxy Statement.
Item 11. Executive Compensation
The information required under this Item is incorporated herein by reference from our 2018 Proxy Statement.
Item 12. Security Ownership of Certain Beneficial Owners and Management and Related Stockholder Matters
Equity Compensation Plan Information. The following table sets forth aggregate information for the fiscal year ended December 31, 2017 regarding the Company’s compensation plans, under which equity securities of Endo may be issued to employees and directors.
Column A | Column B | Column C | ||||||||
Plan Category | Number of securities to be issued upon exercise of outstanding options, warrants and rights (1) | Weighted-average exercise price of outstanding options, warrants and rights (2) | Number of securities remaining available for future issuance under equity compensation plans (excluding securities reflected in Column A) (1) | |||||||
Equity compensation plans approved by security holders | 13,426,446 | $ | 22.79 | 8,822,860 | ||||||
Equity compensation plans not approved by security holders | — | — | — | |||||||
Total | 13,426,446 | $ | 22.79 | 8,822,860 | ||||||
__________
(1) | The Company has issued approximately 1.0 million stock options and 0.1 million restricted stock units for which a grant date has not yet been established for accounting purposes. These options and restricted stock units were not considered to have been granted for purposes of this table. |
(2) | Excludes shares of restricted stock units and performance share units outstanding. |
The other information required under this Item is incorporated herein by reference from our 2018 Proxy Statement.
Item 13. Certain Relationships and Related Transactions, and Director Independence
The information required under this Item is incorporated herein by reference from our 2018 Proxy Statement.
Item 14. Principal Accounting Fees and Services
Information about the fees for 2017 and 2016 for professional services rendered by our independent registered public accounting firm is incorporated herein by reference from our 2018 Proxy Statement. Our Audit Committee’s policy on pre-approval of audit and permissible non-audit services of our independent registered public accounting firm is incorporated by reference from our 2018 Proxy Statement.
The information required under this Item is incorporated herein by reference from our 2018 Proxy Statement.
73
PART IV
Item 15. Exhibits, Financial Statement Schedules
(a) The following documents are filed as part of this report:
1. | The Consolidated Financial Statements: |
Management’s Report on Internal Control Over Financial Reporting
Report of Independent Registered Public Accounting Firm
Consolidated Balance Sheets as of December 31, 2017 and 2016
Consolidated Statements of Operations for the years ended December 31, 2017, 2016 and 2015
Consolidated Statements of Comprehensive Loss for the years ended December 31, 2017, 2016 and 2015
Consolidated Statements of Shareholders’ Equity for the years ended December 31, 2017, 2016 and 2015
Consolidated Statements of Cash Flows for the years ended December 31, 2017, 2016 and 2015
Notes to Consolidated Financial Statements
2. | Financial Statement Schedules |
SCHEDULE II—VALUATION AND QUALIFYING ACCOUNTS
(in thousands)
Balance at Beginning of Period | Additions, Costs and Expenses | Deductions, Write-offs | Other (1) | Balance at End of Period | |||||||||||||||
Valuation Allowance For Deferred Tax Assets: | |||||||||||||||||||
Year Ended December 31, 2015 | $ | 40,646 | $ | 386,087 | $ | (17,106 | ) | $ | 17,364 | $ | 426,991 | ||||||||
Year Ended December 31, 2016 | $ | 426,991 | $ | 4,416,478 | $ | (2,039 | ) | $ | (221 | ) | $ | 4,841,209 | |||||||
Year Ended December 31, 2017 | $ | 4,841,209 | $ | 3,811,982 | $ | — | $ | (590,216 | ) | $ | 8,062,975 | ||||||||
__________
(1) | Represents opening balances of businesses acquired in the period and, for the year ended December 31, 2017, changes in the statutory U.S. Federal corporate income tax rate. |
All other financial statement schedules have been omitted because they are not applicable or the required information is included in the Consolidated Financial Statements or notes thereto.
3. | Exhibits: |
Incorporated by Reference From: | ||||
Number | Description | File Number | Filing Type | Filing Date |
2.1 | 001-36326 | Quarterly Report on Form 10-Q | May 11, 2015 | |
2.2 | 001-36326 | Current Report on Form 8-K | May 21, 2015 | |
2.3 | 001-36326 | Quarterly Report on Form 10-Q | May 9, 2017 | |
2.4 | 001-36326 | Quarterly Report on Form 10-Q | August 8, 2017 | |
74
Incorporated by Reference From: | ||||
Number | Description | File Number | Filing Type | Filing Date |
3.1 | 001-36326 | Current Report on Form 8-K12B | February 28, 2014 | |
3.2 | 001-36326 | Quarterly Report on Form 10-Q | August 8, 2017 | |
4.1 | 333-194253 | Form S-8 | February 28, 2014 | |
4.2 | 001-15989 | Current Report on Form 8-K | June 9, 2011 | |
4.3 | 001-15989 | Annual Report on Form 10-K | March 3, 2014 | |
4.4 | 001-36326 | Current Report on Form 8-K | April 17, 2014 | |
4.5 | 001-15989 | Current Report on Form 8-K | December 19, 2013 | |
4.6 | 001-36326 | Current Report on Form 8-K12B | February 28, 2014 | |
4.7 | 001-36326 | Annual Report on Form 10-K | February 29, 2016 | |
4.8 | 001-36326 | Current Report on Form 8-K | May 7, 2014 | |
4.9 | 001-36326 | Annual Report on Form 10-K | February 29, 2016 | |
4.10 | 001-36326 | Current Report on Form 8-K | May 7, 2014 | |
75
Incorporated by Reference From: | ||||
Number | Description | File Number | Filing Type | Filing Date |
4.11 | 001-36326 | Current Report on Form 8-K | July 1, 2014 | |
4.12 | 001-36326 | Annual Report on Form 10-K | February 29, 2016 | |
4.13 | 001-36326 | Current Report on Form 8-K | July 1, 2014 | |
4.14 | 001-36326 | Current Report on Form 8-K | January 27, 2015 | |
4.15 | 001-36326 | Annual Report on Form 10-K | February 29, 2016 | |
4.16 | 001-36326 | Current Report on Form 8-K | January 27, 2015 | |
4.17 | 001-36326 | Current Report on Form 8-K | July 9, 2015 | |
4.18 | 001-36326 | Current Report on Form 8-K | April 28, 2017 | |
4.19 | 001-36326 | Current Report on Form 8-K | May 21, 2015 | |
4.19.1 | 001-36326 | Current Report on Form 8-K | May 5, 2016 | |
4.20 | 000-50855 | Current Report on Form 8-K | April 29, 2013 | |
4.21 | 001-36326 | Current Report on Form 8-K | May 21, 2015 | |
76
Incorporated by Reference From: | ||||
Number | Description | File Number | Filing Type | Filing Date |
10.1 | 001-15989 | Annual Report on Form 10-K | March 1, 2013 | |
10.2 | 001-15989 | Annual Report on Form 10-K | March 1, 2013 | |
10.3 | 001-15989 | Annual Report on Form 10-K | March 1, 2013 | |
10.4 | 333-194253 | Form S-8 | February 28, 2014 | |
10.5 | 001-36326 | Current Report on Form 8-K | April 28, 2017 | |
10.6* | 000-50855 | Current Report on Form 8-K | September 1, 2011 | |
10.6.1* | 001-36326 | Annual Report on Form 10-K | February 29, 2016 | |
10.7* | 000-50855 | Quarterly Report on Form 10-Q | August 8, 2008 | |
10.8 | 001-36326 | Current Report on Form 8-K | June 9, 2017 | |
10.9 | 001-36326 | Annual Report on Form 10-K | March 1, 2017 | |
10.10 | 001-36326 | Annual Report on Form 10-K | March 1, 2017 | |
10.11 | 001-36326 | Annual Report on Form 10-K | March 1, 2017 | |
10.12 | 001-36326 | Annual Report on Form 10-K | March 1, 2017 | |
10.13 | 001-36326 | Quarterly Report on Form 10-Q | August 10, 2015 | |
10.14 | 001-36326 | Annual Report on Form 10-K | February 29, 2016 | |
10.15 | 001-36326 | Current Report on Form 8-K | May 5, 2016 | |
10.16 | 001-36326 | Quarterly Report on Form 10-Q | May 6, 2016 | |
10.17* | 001-36326 | Quarterly Report on Form 10-Q | August 9, 2016 | |
10.18 | 001-36326 | Current Report on Form 8-K | September 29, 2016 | |
10.19 | 001-36326 | Current Report on Form 8-K/A | December 9, 2016 | |
10.20 | 001-36326 | Current Report on Form 8-K/A | December 22, 2016 | |
10.21 | 001-36326 | Current Report on Form 8-K | February 15, 2018 | |
14.1 | 001-36326 | Current Report on Form 8-K | August 2, 2017 | |
21.1 | Not applicable; filed herewith | |||
77
Incorporated by Reference From: | ||||
Number | Description | File Number | Filing Type | Filing Date |
23.1 | Not applicable; filed herewith | |||
24 | Not applicable; filed herewith | |||
31.1 | Not applicable; filed herewith | |||
31.2 | Not applicable; filed herewith | |||
32.1 | Not applicable; furnished herewith | |||
32.2 | Not applicable; furnished herewith | |||
101 | The following materials from Endo International plc’s Annual Report on Form 10-K for the year ended December 31, 2017, formatted in XBRL (eXtensible Business Reporting Language): (i) the Consolidated Balance Sheets, (ii) the Consolidated Statements of Operations, (iii) the Consolidated Statements of Comprehensive Loss, (iv) the Consolidated Statements of Shareholders’ Equity, (v) the Consolidated Statements of Cash Flows and (vi) the Notes to Consolidated Financial Statements | Not applicable; submitted herewith | ||
* | Confidential portions of this exhibit (indicated by asterisks) have been redacted and filed separately with the Securities and Exchange Commission pursuant to a confidential treatment request in accordance with Rule 24b-2 of the Securities Exchange Act of 1934, as amended | |||
Item 16. Form 10-K Summary
None.
78
SIGNATURES
Pursuant to the requirements of Section 13 or 15(d) of the Securities Exchange Act of 1934, the Registrant has duly caused this report to be signed on its behalf by the undersigned, thereunto duly authorized.
ENDO INTERNATIONAL PLC | |
(Registrant) | |
/s/ PAUL V. CAMPANELLI | |
Name: | Paul V. Campanelli |
Title: | President and Chief Executive Officer |
(Principal Executive Officer) | |
Date: February 27, 2018
79
Pursuant to the requirements of the Securities Exchange of 1934, this report has been signed below by the following persons on behalf of the Registrant and in the capacities and on the dates indicated.
Signature | Title | Date | |||
/S/ PAUL V. CAMPANELLI | Director, President and Chief Executive Officer (Principal Executive Officer) | February 27, 2018 | |||
Paul V. Campanelli | |||||
/S/ BLAISE COLEMAN | Executive Vice President, Chief Financial Officer (Principal Financial Officer) | February 27, 2018 | |||
Blaise Coleman | |||||
/S/ DANIEL A. RUDIO | Senior Vice President, Controller (Principal Accounting Officer) | February 27, 2018 | |||
Daniel A. Rudio | |||||
* | Chairman and Director | February 27, 2018 | |||
Roger H. Kimmel | |||||
* | Director | February 27, 2018 | |||
Shane M. Cooke | |||||
* | Director | February 27, 2018 | |||
Nancy J. Hutson, Ph.D. | |||||
* | Director | February 27, 2018 | |||
Michael Hyatt | |||||
* | Director | February 27, 2018 | |||
Sharad S. Mansukani, M.D. | |||||
* | Director | February 27, 2018 | |||
William P. Montague | |||||
* | Director | February 27, 2018 | |||
Todd B. Sisitsky | |||||
* | Director | February 27, 2018 | |||
Jill D. Smith | |||||
*By: | /S/ MATTHEW J. MALETTA | Attorney-in-fact pursuant to a Power of Attorney filed with this Report as Exhibit 24 | February 27, 2018 | ||
Matthew J. Maletta | |||||
80
INDEX TO FINANCIAL STATEMENTS
Page | |
F-1
MANAGEMENT’S REPORT ON INTERNAL CONTROL OVER FINANCIAL REPORTING
The management of Endo International plc is responsible for establishing and maintaining adequate internal control over financial reporting as defined in Rules 13a-15(f) and 15d-15(f) under the Securities Exchange Act of 1934, as amended. Endo International plc’s internal control over financial reporting was designed to provide reasonable assurance regarding the preparation of financial statements for external purposes in accordance with generally accepted accounting principles.
Because of its inherent limitations, internal control over financial reporting may not prevent or detect misstatements. Also, projections of any evaluation of effectiveness to future periods are subject to the risk that controls may become inadequate because of changes in conditions, or that the degree of compliance with the policies or procedures may deteriorate.
Endo International plc’s management assessed the effectiveness of the Company’s internal control over financial reporting as of December 31, 2017. In making this assessment, it used the criteria set forth by the Committee of Sponsoring Organizations of the Treadway Commission (COSO) in Internal Control-Integrated Framework (2013). Based on our assessment we determined that, as of December 31, 2017, the Company’s internal control over financial reporting is effective based on those criteria.
Endo International plc’s independent registered public accounting firm has issued its report on the effectiveness of the Company’s internal control over financial reporting as of December 31, 2017. This report appears on page F-3.
/S/ PAUL V. CAMPANELLI |
Paul V. Campanelli |
Director, President and Chief Executive Officer (Principal Executive Officer) |
/S/ BLAISE COLEMAN |
Blaise Coleman |
Executive Vice President, Chief Financial Officer (Principal Financial Officer) |
February 27, 2018
F-2
REPORT OF INDEPENDENT REGISTERED PUBLIC ACCOUNTING FIRM
To the Board of Directors and Shareholders of Endo International plc:
Opinions on the Financial Statements and Internal Control over Financial Reporting
We have audited the accompanying consolidated balance sheets of Endo International plc and its subsidiaries (the “Company”) as of December 31, 2017 and December 31, 2016, and the related consolidated statements of operations, comprehensive loss, shareholders’ equity and cash flows for each of the three years in the period ended December 31, 2017, including the related notes and schedule of valuation and qualifying accounts for each of the three years in the period ended December 31, 2017 appearing under Item 15(a)(2) (collectively referred to as the “consolidated financial statements”). We also have audited the Company's internal control over financial reporting as of December 31, 2017, based on criteria established in Internal Control - Integrated Framework (2013) issued by the Committee of Sponsoring Organizations of the Treadway Commission (COSO).
In our opinion, the consolidated financial statements referred to above present fairly, in all material respects, the financial position of the Company as of December 31, 2017 and 2016, and the results of their operations and their cash flows for each of the three years in the period ended December 31, 2017 in conformity with accounting principles generally accepted in the United States of America. Also in our opinion, the Company maintained, in all material respects, effective internal control over financial reporting as of December 31, 2017, based on criteria established in Internal Control - Integrated Framework (2013) issued by the COSO.
Change in Accounting Principles
As discussed within Note 2 to the consolidated financial statements, the Company changed the manner in which it accounts for the income tax effects of share based payment transactions, intra-entity transfers of assets other than inventory, the classification of debt prepayment and extinguishment costs within the statement of cash flows, and the changes to restricted cash and cash equivalents within its statements of cash flows in 2017.
Basis for Opinions
The Company's management is responsible for these consolidated financial statements, for maintaining effective internal control over financial reporting, and for its assessment of the effectiveness of internal control over financial reporting, included in the accompanying Management's Report on Internal Control over Financial Reporting. Our responsibility is to express opinions on the Company’s consolidated financial statements and on the Company's internal control over financial reporting based on our audits. We are a public accounting firm registered with the Public Company Accounting Oversight Board (United States) (“PCAOB”) and are required to be independent with respect to the Company in accordance with the U.S. federal securities laws and the applicable rules and regulations of the Securities and Exchange Commission and the PCAOB.
We conducted our audits in accordance with the standards of the PCAOB. Those standards require that we plan and perform the audits to obtain reasonable assurance about whether the consolidated financial statements are free of material misstatement, whether due to error or fraud, and whether effective internal control over financial reporting was maintained in all material respects.
Our audits of the consolidated financial statements included performing procedures to assess the risks of material misstatement of the consolidated financial statements, whether due to error or fraud, and performing procedures that respond to those risks. Such procedures included examining, on a test basis, evidence regarding the amounts and disclosures in the consolidated financial statements. Our audits also included evaluating the accounting principles used and significant estimates made by management, as well as evaluating the overall presentation of the consolidated financial statements. Our audit of internal control over financial reporting included obtaining an understanding of internal control over financial reporting, assessing the risk that a material weakness exists, and testing and evaluating the design and operating effectiveness of internal control based on the assessed risk. Our audits also included performing such other procedures as we considered necessary in the circumstances. We believe that our audits provide a reasonable basis for our opinions.
Definition and Limitations of Internal Control over Financial Reporting
A company’s internal control over financial reporting is a process designed to provide reasonable assurance regarding the reliability of financial reporting and the preparation of financial statements for external purposes in accordance with generally accepted accounting principles. A company’s internal control over financial reporting includes those policies and procedures that (i) pertain to the maintenance of records that, in reasonable detail, accurately and fairly reflect the transactions and dispositions of the assets of the company; (ii) provide reasonable assurance that transactions are recorded as necessary to permit preparation of financial statements in accordance with generally accepted accounting principles, and that receipts and expenditures of the company are being made only in accordance with authorizations of management and directors of the company; and (iii) provide reasonable assurance regarding prevention or timely detection of unauthorized acquisition, use, or disposition of the company’s assets that could have a material effect on the financial statements.
F-3
Because of its inherent limitations, internal control over financial reporting may not prevent or detect misstatements. Also, projections of any evaluation of effectiveness to future periods are subject to the risk that controls may become inadequate because of changes in conditions, or that the degree of compliance with the policies or procedures may deteriorate.
/s/ PricewaterhouseCoopers LLP |
Philadelphia, Pennsylvania |
February 27, 2018 |
We have served as the Company’s auditor since 2014. |
F-4
ENDO INTERNATIONAL PLC
CONSOLIDATED BALANCE SHEETS
DECEMBER 31, 2017 AND 2016
(In thousands, except share and per share data)
December 31, 2017 | December 31, 2016 | ||||||
ASSETS | |||||||
CURRENT ASSETS: | |||||||
Cash and cash equivalents | $ | 986,605 | $ | 517,250 | |||
Restricted cash and cash equivalents | 320,453 | 282,074 | |||||
Accounts receivable, net of allowance of $392 and $6,956 at December 31, 2017 and 2016, respectively | 517,436 | 992,153 | |||||
Inventories, net | 391,437 | 555,671 | |||||
Prepaid expenses and other current assets | 43,098 | 77,523 | |||||
Income taxes receivable | 12,048 | 47,803 | |||||
Assets held for sale | — | 116,985 | |||||
Total current assets | $ | 2,271,077 | $ | 2,589,459 | |||
MARKETABLE SECURITIES | 1,456 | 2,267 | |||||
PROPERTY, PLANT AND EQUIPMENT, NET | 523,971 | 669,596 | |||||
GOODWILL | 4,450,082 | 4,729,395 | |||||
OTHER INTANGIBLES, NET | 4,317,684 | 5,859,297 | |||||
DEFERRED INCOME TAXES | 11,582 | 7,817 | |||||
OTHER ASSETS | 59,728 | 417,278 | |||||
TOTAL ASSETS | $ | 11,635,580 | $ | 14,275,109 | |||
LIABILITIES AND SHAREHOLDERS’ EQUITY | |||||||
CURRENT LIABILITIES: | |||||||
Accounts payable and accrued expenses | $ | 1,096,825 | $ | 1,454,084 | |||
Current portion of legal settlement accrual | 1,087,793 | 1,015,932 | |||||
Current portion of long-term debt | 34,205 | 131,125 | |||||
Income taxes payable | 2,086 | 9,266 | |||||
Liabilities held for sale | — | 24,338 | |||||
Total current liabilities | $ | 2,220,909 | $ | 2,634,745 | |||
DEFERRED INCOME TAXES | 43,131 | 192,297 | |||||
LONG-TERM DEBT, LESS CURRENT PORTION, NET | 8,242,032 | 8,141,378 | |||||
LONG-TERM LEGAL SETTLEMENT ACCRUAL, LESS CURRENT PORTION | 210,450 | — | |||||
OTHER LIABILITIES | 434,178 | 605,100 | |||||
COMMITMENTS AND CONTINGENCIES (NOTE 14) | |||||||
SHAREHOLDERS’ EQUITY: | |||||||
Euro deferred shares, $0.01 par value; 4,000,000 shares authorized and issued at both December 31, 2017 and December 31, 2016 | 48 | 42 | |||||
Ordinary shares, $0.0001 par value; 1,000,000,000 shares authorized; 223,331,706 and 222,954,175 shares issued and outstanding at December 31, 2017 and December 31, 2016, respectively | 22 | 22 | |||||
Additional paid-in capital | 8,791,170 | 8,743,240 | |||||
Accumulated deficit | (8,096,539 | ) | (5,688,281 | ) | |||
Accumulated other comprehensive loss | (209,821 | ) | (353,434 | ) | |||
Total shareholders’ equity | $ | 484,880 | $ | 2,701,589 | |||
TOTAL LIABILITIES AND SHAREHOLDERS’ EQUITY | $ | 11,635,580 | $ | 14,275,109 | |||
See Notes to Consolidated Financial Statements.
F-5
ENDO INTERNATIONAL PLC
CONSOLIDATED STATEMENTS OF OPERATIONS
YEARS ENDED DECEMBER 31, 2017, 2016 AND 2015
(In thousands, except per share data)
2017 | 2016 | 2015 | |||||||||
TOTAL REVENUES | $ | 3,468,858 | $ | 4,010,274 | $ | 3,268,718 | |||||
COSTS AND EXPENSES: | |||||||||||
Cost of revenues | 2,228,530 | 2,634,973 | 2,075,651 | ||||||||
Selling, general and administrative | 629,874 | 770,728 | 741,304 | ||||||||
Research and development | 172,067 | 183,372 | 102,197 | ||||||||
Litigation-related and other contingencies, net | 185,990 | 23,950 | 37,082 | ||||||||
Asset impairment charges | 1,154,376 | 3,781,165 | 1,140,709 | ||||||||
Acquisition-related and integration items | 58,086 | 87,601 | 105,250 | ||||||||
OPERATING LOSS FROM CONTINUING OPERATIONS | $ | (960,065 | ) | $ | (3,471,515 | ) | $ | (933,475 | ) | ||
INTEREST EXPENSE, NET | 488,228 | 452,679 | 373,214 | ||||||||
LOSS ON EXTINGUISHMENT OF DEBT | 51,734 | — | 67,484 | ||||||||
OTHER (INCOME) EXPENSE, NET | (17,023 | ) | (338 | ) | 63,691 | ||||||
LOSS FROM CONTINUING OPERATIONS BEFORE INCOME TAX | $ | (1,483,004 | ) | $ | (3,923,856 | ) | $ | (1,437,864 | ) | ||
INCOME TAX BENEFIT | (250,293 | ) | (700,084 | ) | (1,137,465 | ) | |||||
LOSS FROM CONTINUING OPERATIONS | $ | (1,232,711 | ) | $ | (3,223,772 | ) | $ | (300,399 | ) | ||
DISCONTINUED OPERATIONS, NET OF TAX (NOTE 3) | (802,722 | ) | (123,278 | ) | (1,194,926 | ) | |||||
CONSOLIDATED NET LOSS | $ | (2,035,433 | ) | $ | (3,347,050 | ) | $ | (1,495,325 | ) | ||
Less: Net income (loss) attributable to noncontrolling interests | — | 16 | (283 | ) | |||||||
NET LOSS ATTRIBUTABLE TO ENDO INTERNATIONAL PLC | $ | (2,035,433 | ) | $ | (3,347,066 | ) | $ | (1,495,042 | ) | ||
NET LOSS PER SHARE ATTRIBUTABLE TO ENDO INTERNATIONAL PLC ORDINARY SHAREHOLDERS—BASIC: | |||||||||||
Continuing operations | $ | (5.52 | ) | $ | (14.48 | ) | $ | (1.52 | ) | ||
Discontinued operations | (3.60 | ) | (0.55 | ) | (6.07 | ) | |||||
Basic | $ | (9.12 | ) | $ | (15.03 | ) | $ | (7.59 | ) | ||
NET LOSS PER SHARE ATTRIBUTABLE TO ENDO INTERNATIONAL PLC ORDINARY SHAREHOLDERS—DILUTED: | |||||||||||
Continuing operations | $ | (5.52 | ) | $ | (14.48 | ) | $ | (1.52 | ) | ||
Discontinued operations | (3.60 | ) | (0.55 | ) | (6.07 | ) | |||||
Diluted | $ | (9.12 | ) | $ | (15.03 | ) | $ | (7.59 | ) | ||
WEIGHTED AVERAGE SHARES: | |||||||||||
Basic | 223,198 | 222,651 | 197,100 | ||||||||
Diluted | 223,198 | 222,651 | 197,100 | ||||||||
See Notes to Consolidated Financial Statements.
F-6
ENDO INTERNATIONAL PLC
CONSOLIDATED STATEMENTS OF COMPREHENSIVE LOSS
YEARS ENDED DECEMBER 31, 2017, 2016 AND 2015
(In thousands)
2017 | 2016 | 2015 | |||||||||||||||||||||
CONSOLIDATED NET LOSS | $ | (2,035,433 | ) | $ | (3,347,050 | ) | $ | (1,495,325 | ) | ||||||||||||||
OTHER COMPREHENSIVE INCOME (LOSS), NET OF TAX: | |||||||||||||||||||||||
Net unrealized (loss) gain on securities: | |||||||||||||||||||||||
Unrealized (loss) gain arising during the period | $ | (515 | ) | $ | (914 | ) | $ | 2,299 | |||||||||||||||
Less: reclassification adjustments for gain realized in net loss | — | (515 | ) | (6 | ) | (920 | ) | — | 2,299 | ||||||||||||||
Net unrealized gain (loss) on foreign currency: | |||||||||||||||||||||||
Foreign currency translation gain (loss) arising during the period | $ | 31,202 | $ | 31,729 | $ | (284,722 | ) | ||||||||||||||||
Less: reclassification adjustments for loss realized in net loss | 112,926 | 144,128 | — | 31,729 | 25,715 | (259,007 | ) | ||||||||||||||||
OTHER COMPREHENSIVE INCOME (LOSS) | $ | 143,613 | $ | 30,809 | $ | (256,708 | ) | ||||||||||||||||
CONSOLIDATED COMPREHENSIVE LOSS | $ | (1,891,820 | ) | $ | (3,316,241 | ) | $ | (1,752,033 | ) | ||||||||||||||
Less: Net income (loss) attributable to noncontrolling interests | — | 16 | (283 | ) | |||||||||||||||||||
Less: Other comprehensive income (loss) attributable to noncontrolling interests | — | 38 | (495 | ) | |||||||||||||||||||
COMPREHENSIVE LOSS ATTRIBUTABLE TO ENDO INTERNATIONAL PLC | $ | (1,891,820 | ) | $ | (3,316,295 | ) | $ | (1,751,255 | ) | ||||||||||||||
See Notes to Consolidated Financial Statements.
F-7
ENDO INTERNATIONAL PLC
CONSOLIDATED STATEMENTS OF SHAREHOLDERS' EQUITY
YEARS ENDED DECEMBER 31, 2017, 2016 AND 2015
(In thousands, except share data)
Endo International plc Shareholders | |||||||||||||||||||||||||||||||||||||
Ordinary Shares | Euro Deferred Shares | Additional Paid-in Capital | Accumulated Deficit | Accumulated Other Comprehensive Loss | Total Endo International plc Shareholders’ Equity | Noncontrolling Interests | Total Shareholders’ Equity | ||||||||||||||||||||||||||||||
Number of Shares | Amount | Number of Shares | Amount | ||||||||||||||||||||||||||||||||||
BALANCE, JANUARY 1, 2015 | 153,912,985 | $ | 15 | 4,000,000 | $ | 48 | $ | 3,093,867 | $ | (595,085 | ) | $ | (124,088 | ) | $ | 2,374,757 | $ | 33,456 | $ | 2,408,213 | |||||||||||||||||
Net loss | — | — | — | — | — | (1,495,042 | ) | — | (1,495,042 | ) | (283 | ) | (1,495,325 | ) | |||||||||||||||||||||||
Other comprehensive loss | — | — | — | — | — | — | (256,213 | ) | (256,213 | ) | (495 | ) | (256,708 | ) | |||||||||||||||||||||||
Compensation related to share-based awards | — | — | — | — | 61,185 | — | — | 61,185 | — | 61,185 | |||||||||||||||||||||||||||
Exercise of options | 880,885 | — | — | — | 27,217 | — | — | 27,217 | — | 27,217 | |||||||||||||||||||||||||||
Tax benefits of share awards, net | — | — | — | — | 20,051 | — | — | 20,051 | — | 20,051 | |||||||||||||||||||||||||||
Issuance of ordinary shares related to the employee stock purchase plan | 67,867 | — | — | — | 4,299 | — | — | 4,299 | — | 4,299 | |||||||||||||||||||||||||||
Ordinary shares issued | 27,982,302 | 3 | — | — | 2,299,997 | — | — | 2,300,000 | — | 2,300,000 | |||||||||||||||||||||||||||
Equity issuance fees | — | — | — | — | (66,956 | ) | — | — | (66,956 | ) | — | (66,956 | ) | ||||||||||||||||||||||||
Ordinary shares issued in connection with the Auxilium acquisition | 18,609,835 | 2 | — | — | 1,519,318 | — | — | 1,519,320 | — | 1,519,320 | |||||||||||||||||||||||||||
Ordinary shares issued in connection with the Par acquisition | 18,069,899 | 2 | — | — | 1,325,246 | — | — | 1,325,248 | — | 1,325,248 | |||||||||||||||||||||||||||
Tax withholding for restricted shares | — | — | — | — | (15,398 | ) | — | — | (15,398 | ) | — | (15,398 | ) | ||||||||||||||||||||||||
Share repurchases | (4,361,957 | ) | — | — | — | — | (251,088 | ) | — | (251,088 | ) | — | (251,088 | ) | |||||||||||||||||||||||
Buy-out of noncontrolling interests, net | — | — | — | — | (2,972 | ) | — | (3,904 | ) | (6,876 | ) | (32,732 | ) | (39,608 | ) | ||||||||||||||||||||||
Fair value of equity component of acquired Auxilium notes | — | — | — | — | 266,649 | — | — | 266,649 | — | 266,649 | |||||||||||||||||||||||||||
Conversion of Auxilium notes | 5,170,239 | — | — | — | 160,892 | — | — | 160,892 | — | 160,892 | |||||||||||||||||||||||||||
Settlement of common stock warrants | 1,792,379 | — | — | — | — | — | — | — | — | — | |||||||||||||||||||||||||||
Other | (152 | ) | — | — | (5 | ) | (10 | ) | — | — | (15 | ) | — | (15 | ) | ||||||||||||||||||||||
BALANCE, DECEMBER 31, 2015 | 222,124,282 | $ | 22 | 4,000,000 | $ | 43 | $ | 8,693,385 | $ | (2,341,215 | ) | $ | (384,205 | ) | $ | 5,968,030 | $ | (54 | ) | $ | 5,967,976 | ||||||||||||||||
F-8
Endo International plc Shareholders | |||||||||||||||||||||||||||||||||||||
Ordinary Shares | Euro Deferred Shares | Additional Paid-in Capital | Accumulated Deficit | Accumulated Other Comprehensive Loss | Total Endo International plc Shareholders’ Equity | Noncontrolling Interests | Total Shareholders’ Equity | ||||||||||||||||||||||||||||||
Number of Shares | Amount | Number of Shares | Amount | ||||||||||||||||||||||||||||||||||
Net (loss) income | — | — | — | — | — | (3,347,066 | ) | — | (3,347,066 | ) | 16 | (3,347,050 | ) | ||||||||||||||||||||||||
Other comprehensive income | — | — | — | — | — | — | 30,771 | 30,771 | 38 | 30,809 | |||||||||||||||||||||||||||
Compensation related to share-based awards | — | — | — | — | 59,769 | — | — | 59,769 | — | 59,769 | |||||||||||||||||||||||||||
Exercise of options | 62,589 | — | — | — | 1,952 | — | — | 1,952 | — | 1,952 | |||||||||||||||||||||||||||
Tax benefits of share awards, net | — | — | — | — | (5,449 | ) | — | — | (5,449 | ) | — | (5,449 | ) | ||||||||||||||||||||||||
Issuance of ordinary shares related to the employee stock purchase program | 306,918 | — | — | — | 5,119 | — | — | 5,119 | — | 5,119 | |||||||||||||||||||||||||||
Ordinary shares issued | 460,386 | — | — | — | — | — | — | — | — | — | |||||||||||||||||||||||||||
Tax withholding for restricted shares | — | — | — | — | (11,500 | ) | — | — | (11,500 | ) | — | (11,500 | ) | ||||||||||||||||||||||||
Other | — | — | — | (1 | ) | (36 | ) | — | — | (37 | ) | — | (37 | ) | |||||||||||||||||||||||
BALANCE, DECEMBER 31, 2016 prior to the adoption of ASU 2016-16 | 222,954,175 | $ | 22 | 4,000,000 | $ | 42 | $ | 8,743,240 | $ | (5,688,281 | ) | $ | (353,434 | ) | $ | 2,701,589 | $ | — | $ | 2,701,589 | |||||||||||||||||
Effect of adopting ASU 2016-16 (NOTE 2) | — | — | — | — | — | (372,825 | ) | — | (372,825 | ) | — | (372,825 | ) | ||||||||||||||||||||||||
BALANCE, JANUARY 1, 2017 | 222,954,175 | $ | 22 | 4,000,000 | $ | 42 | $ | 8,743,240 | $ | (6,061,106 | ) | $ | (353,434 | ) | $ | 2,328,764 | — | $ | 2,328,764 | ||||||||||||||||||
Net loss | — | — | — | — | — | (2,035,433 | ) | — | (2,035,433 | ) | — | (2,035,433 | ) | ||||||||||||||||||||||||
Other comprehensive income | — | — | — | — | — | — | 143,613 | 143,613 | — | 143,613 | |||||||||||||||||||||||||||
Compensation related to share-based awards | — | — | — | — | 50,149 | — | — | 50,149 | — | 50,149 | |||||||||||||||||||||||||||
Ordinary shares issued | 377,531 | — | — | — | — | — | — | — | — | — | |||||||||||||||||||||||||||
Tax withholding for restricted shares | — | — | — | — | (2,078 | ) | — | — | (2,078 | ) | — | (2,078 | ) | ||||||||||||||||||||||||
Other | — | — | — | 6 | (141 | ) | — | — | (135 | ) | — | (135 | ) | ||||||||||||||||||||||||
BALANCE, DECEMBER 31, 2017 | 223,331,706 | $ | 22 | 4,000,000 | $ | 48 | $ | 8,791,170 | $ | (8,096,539 | ) | $ | (209,821 | ) | $ | 484,880 | $ | — | $ | 484,880 | |||||||||||||||||
See Notes to Consolidated Financial Statements.
F-9
ENDO INTERNATIONAL PLC
CONSOLIDATED STATEMENTS OF CASH FLOWS
YEARS ENDED DECEMBER 31, 2017, 2016 AND 2015
(In thousands)
2017 | 2016 | 2015 | |||||||||
OPERATING ACTIVITIES: | |||||||||||
Consolidated net loss | $ | (2,035,433 | ) | $ | (3,347,050 | ) | $ | (1,495,325 | ) | ||
Adjustments to reconcile consolidated net loss to Net cash provided by operating activities: | |||||||||||
Depreciation and amortization | 983,765 | 983,309 | 632,756 | ||||||||
Inventory step-up | 390 | 108,768 | 232,461 | ||||||||
Share-based compensation | 50,149 | 59,769 | 61,185 | ||||||||
Amortization of debt issuance costs and discount | 22,694 | 28,514 | 23,604 | ||||||||
(Benefit) provision for bad debts | (1,649 | ) | 6,885 | 5,073 | |||||||
Deferred income taxes | (156,129 | ) | (745,341 | ) | (447,168 | ) | |||||
Change in fair value of contingent consideration | 49,949 | 23,823 | (65,640 | ) | |||||||
Loss on extinguishment of debt | 51,734 | — | 67,484 | ||||||||
Asset impairment charges | 1,154,376 | 3,802,493 | 1,390,281 | ||||||||
(Gain) loss on sale of business and other assets | (13,809 | ) | 3,192 | (10,294 | ) | ||||||
Changes in assets and liabilities which (used) provided cash: | |||||||||||
Accounts receivable | 486,359 | (7,387 | ) | (274,994 | ) | ||||||
Inventories | 147,189 | 66,876 | 29,130 | ||||||||
Prepaid and other assets | 5,345 | 69,273 | 21,283 | ||||||||
Accounts payable and accrued expenses | (69,608 | ) | (682,515 | ) | 443,398 | ||||||
Other liabilities | (18,336 | ) | (524,532 | ) | 69,926 | ||||||
Income taxes payable/receivable | (103,001 | ) | 682,066 | (564,659 | ) | ||||||
Net cash provided by operating activities | $ | 553,985 | $ | 528,143 | $ | 118,501 | |||||
INVESTING ACTIVITIES: | |||||||||||
Purchases of property, plant and equipment | (125,654 | ) | (138,856 | ) | (81,774 | ) | |||||
Acquisitions, net of cash and restricted cash acquired | — | (30,394 | ) | (7,648,048 | ) | ||||||
Proceeds from sale of marketable securities and investments | — | 34 | 1,230 | ||||||||
Decrease in notes receivable | 7,000 | — | 17 | ||||||||
Patent acquisition costs and license fees | — | (19,206 | ) | (43,968 | ) | ||||||
Proceeds from sale of business and other assets, net | 223,237 | 10,870 | 1,588,779 | ||||||||
Net cash provided by (used in) investing activities | $ | 104,583 | $ | (177,552 | ) | $ | (6,183,764 | ) | |||
F-10
2017 | 2016 | 2015 | |||||||||
FINANCING ACTIVITIES: | |||||||||||
Proceeds from issuance of notes | 300,000 | — | 2,835,000 | ||||||||
Proceeds from issuance of term loans | 3,415,000 | — | 2,800,000 | ||||||||
Principal payments on notes | — | — | (899,875 | ) | |||||||
Principal payments on term loans | (3,730,951 | ) | (103,625 | ) | (473,376 | ) | |||||
Proceeds from draw of revolving debt | — | 380,000 | 525,000 | ||||||||
Repayments of revolving debt | — | (605,000 | ) | (300,000 | ) | ||||||
Principal payments on other indebtedness | (6,154 | ) | (7,736 | ) | (10,070 | ) | |||||
Repurchase of convertible senior subordinated notes | — | — | (247,760 | ) | |||||||
Prepayment penalty on long-term debt | — | — | (31,496 | ) | |||||||
Sale of mandatorily redeemable preferred shares | — | — | 60,000 | ||||||||
Redemption of mandatorily redeemable preferred shares | — | — | (60,000 | ) | |||||||
Deferred financing fees | (57,773 | ) | (500 | ) | (125,111 | ) | |||||
Payments for contingent consideration | (85,037 | ) | (55,896 | ) | (29,786 | ) | |||||
Payments of tax withholding for restricted shares | (2,078 | ) | (11,500 | ) | (15,398 | ) | |||||
Exercise of options | — | 1,952 | 27,217 | ||||||||
Repurchase of ordinary shares | — | — | (250,088 | ) | |||||||
Issuance of ordinary shares related to the employee stock purchase plan | — | 5,119 | 4,299 | ||||||||
Issuance of ordinary shares | — | — | 2,300,000 | ||||||||
Payments related to the issuance of ordinary shares | — | — | (66,956 | ) | |||||||
Cash buy-out of noncontrolling interests | — | — | (39,608 | ) | |||||||
Net cash (used in) provided by financing activities | $ | (166,993 | ) | $ | (397,186 | ) | $ | 6,001,992 | |||
Effect of foreign exchange rate | 2,515 | 436 | (11,269 | ) | |||||||
Movement in cash held for sale | 11,744 | (11,744 | ) | 997 | |||||||
NET INCREASE (DECREASE) IN CASH, CASH EQUIVALENTS, RESTRICTED CASH AND RESTRICTED CASH EQUIVALENTS | $ | 505,834 | $ | (57,903 | ) | $ | (73,543 | ) | |||
CASH, CASH EQUIVALENTS, RESTRICTED CASH AND RESTRICTED CASH EQUIVALENTS, BEGINNING OF PERIOD | 805,180 | 863,083 | 936,626 | ||||||||
CASH, CASH EQUIVALENTS, RESTRICTED CASH AND RESTRICTED CASH EQUIVALENTS, END OF PERIOD | $ | 1,311,014 | $ | 805,180 | $ | 863,083 | |||||
SUPPLEMENTAL INFORMATION: | |||||||||||
Cash paid for interest | $ | 467,017 | $ | 429,172 | $ | 284,985 | |||||
Cash paid for income taxes | $ | 28,675 | $ | 63,983 | $ | 42,700 | |||||
Cash received from U.S. Federal tax refunds | $ | 29,825 | $ | 759,950 | $ | 162,821 | |||||
Cash paid into Qualified Settlement Funds for mesh legal settlements | $ | 668,306 | $ | 831,131 | $ | 743,132 | |||||
Cash paid out of Qualified Settlement Funds for mesh legal settlements | $ | 632,176 | $ | 1,134,734 | $ | 649,391 | |||||
Other cash distributions for mesh legal settlements | $ | 19,243 | $ | 7,830 | $ | 27,380 | |||||
SCHEDULE OF NON-CASH INVESTING AND FINANCING ACTIVITIES: | |||||||||||
Accrual for purchases of property, plant and equipment | $ | 5,723 | $ | 2,676 | $ | 4,476 | |||||
Acquisition financed by ordinary shares | $ | — | $ | — | $ | 2,844,568 | |||||
Repurchase of convertible senior subordinated notes financed by ordinary shares | $ | — | $ | — | $ | 625,483 | |||||
See Notes to Consolidated Financial Statements.
F-11
ENDO INTERNATIONAL PLC
NOTES TO CONSOLIDATED FINANCIAL STATEMENTS
FOR THE YEARS ENDED DECEMBER 31, 2017, 2016 AND 2015
NOTE 1. DESCRIPTION OF BUSINESS
Endo International plc is an Ireland-domiciled, global specialty pharmaceutical company focused on generic and branded pharmaceuticals. We aim to be the premier partner to healthcare professionals and payment providers, delivering an innovative suite of generic and branded drugs to meet patients’ needs. Unless otherwise indicated or required by the context, references throughout to “Endo,” the “Company,” “we,” “our” or “us” refer to financial information and transactions of Endo International plc and its subsidiaries. The accompanying Consolidated Financial Statements of Endo International plc and its subsidiaries have been prepared in accordance with United States (U.S.) generally accepted accounting principles (GAAP).
NOTE 2. SUMMARY OF SIGNIFICANT ACCOUNTING POLICIES
Consolidation and Basis of Presentation. The Consolidated Financial Statements include the accounts of wholly owned subsidiaries after the elimination of intercompany accounts and transactions.
Reclassifications. Certain prior period amounts have been reclassified to conform to the current period presentation. Additionally, as further discussed below under the heading “Recent Accounting Pronouncements Adopted or Otherwise Effective as of December 31, 2017,” the Company adopted Accounting Standards Update (ASU) No. 2016-09 “Compensation - Stock Compensation” (ASU 2016-09), ASU No. 2016-15 “Classification of Certain Cash Receipts and Cash Payments” (ASU 2016-15) and ASU No. 2016-18 “Statement of Cash Flows (Topic 230) - Restricted Cash” (ASU 2016-18) during 2017. The table below presents the effects of these ASUs on the Company’s Consolidated Statements of Cash Flows for each of the years ended December 31, 2016 and 2015 (in thousands):
Prior to Adoption | Impact of Adoption of: | Subsequent to Adoption | |||||||||||||||||
ASU 2016-09 | ASU 2016-15 | ASU 2016-18 | |||||||||||||||||
For the year ended December 31, 2016: | |||||||||||||||||||
Net cash provided by operating activities | $ | 524,439 | $ | 3,204 | $ | — | $ | 500 | $ | 528,143 | |||||||||
Net cash provided by (used in) investing activities | 125,861 | — | — | (303,413 | ) | (177,552 | ) | ||||||||||||
Net cash used in financing activities | (393,982 | ) | (3,204 | ) | — | — | (397,186 | ) | |||||||||||
Effect of foreign exchange rate | 328 | — | — | 108 | 436 | ||||||||||||||
Movement in cash held for sale | (11,744 | ) | — | — | — | (11,744 | ) | ||||||||||||
Net change (1) | $ | 244,902 | $ | — | $ | — | $ | (302,805 | ) | $ | (57,903 | ) | |||||||
Beginning-of-period balance (2) | 272,348 | — | — | 590,735 | 863,083 | ||||||||||||||
End-of-period balance (2) | $ | 517,250 | $ | — | $ | — | $ | 287,930 | $ | 805,180 | |||||||||
For the year ended December 31, 2015: | |||||||||||||||||||
Net cash provided by operating activities | $ | 62,026 | $ | 21,979 | $ | 31,496 | $ | 3,000 | $ | 118,501 | |||||||||
Net cash used in investing activities | (6,244,770 | ) | — | — | 61,006 | (6,183,764 | ) | ||||||||||||
Net cash provided by financing activities | 6,055,467 | (21,979 | ) | (31,496 | ) | — | 6,001,992 | ||||||||||||
Effect of foreign exchange rate | (7,068 | ) | — | — | (4,201 | ) | (11,269 | ) | |||||||||||
Movement in cash held for sale | 997 | — | — | — | 997 | ||||||||||||||
Net change (1) | $ | (133,348 | ) | $ | — | $ | — | $ | 59,805 | $ | (73,543 | ) | |||||||
Beginning-of-period balance (2) | 405,696 | — | — | 530,930 | 936,626 | ||||||||||||||
End-of-period balance (2) | $ | 272,348 | $ | — | $ | — | $ | 590,735 | $ | 863,083 | |||||||||
__________
(1) | This line refers to the “Net increase (decrease) in cash and cash equivalents” prior to the adoption of ASU 2016-18 and the “Net increase (decrease) in cash, cash equivalents, restricted cash and restricted cash equivalents” after the adoption. |
(2) | These lines refer to the beginning or end of period amounts of “Cash and cash equivalents” prior to the adoption of ASU 2016-18 and the beginning or end of periods amounts of “Cash, cash equivalents, restricted cash and restricted cash equivalents” after the adoption. |
The adoption of ASU 2016-09 and ASU 2016-15 did not affect the Company’s Consolidated Statement of Cash Flows for the year ended December 31, 2017. The primary impact of adopting ASU 2016-18 on the Company’s 2017 Consolidated Statement of Cash Flows was to exclude the cash flow effect of $36.2 million of net increases in restricted cash and cash equivalents from net cash provided by investing activities for the year ended December 31, 2017.
F-12
Use of Estimates. The preparation of our Consolidated Financial Statements in conformity with GAAP requires us to make estimates and assumptions that affect the amounts and disclosures in our Consolidated Financial Statements, including the notes thereto, and elsewhere in this report. For example, we are required to make significant estimates and assumptions related to revenue recognition, including sales deductions, financial instruments, long-lived assets, goodwill, other intangibles, income taxes, contingencies and share-based compensation, among others. Some of these estimates can be subjective and complex. Although we believe that our estimates and assumptions are reasonable, there may be other reasonable estimates or assumptions that differ significantly from ours. Further, our estimates and assumptions are based upon information available at the time they were made. Actual results may differ significantly from our estimates.
We regularly evaluate our estimates and assumptions using historical experience and other factors, including the economic environment. As future events and their effects cannot be determined with precision, our estimates and assumptions may prove to be incomplete or inaccurate, or unanticipated events and circumstances may occur that might cause us to change those estimates and assumptions. Market conditions, such as illiquid credit markets, volatile equity markets, dramatic fluctuations in foreign currency rates and economic downturn, can increase the uncertainty already inherent in our estimates and assumptions. We also are subject to other risks and uncertainties that may cause actual results to differ from estimated amounts, such as changes in the healthcare environment, competition, litigation, legislation and regulations. We adjust our estimates and assumptions when facts and circumstances indicate the need for change. Those changes generally will be reflected in our Consolidated Financial Statements on a prospective basis.
Customer, Product and Supplier Concentration. We primarily sell our generic and branded pharmaceuticals to wholesalers, retail drug store chains, supermarket chains, mass merchandisers, distributors, mail order accounts, hospitals and government agencies. Our wholesalers and distributors purchase products from us and, in turn, supply products to retail drug store chains, independent pharmacies and managed health care organizations. Customers in the managed health care market include health maintenance organizations, nursing homes, hospitals, clinics, pharmacy benefit management companies and mail order customers. Total revenues from direct customers that accounted for 10% or more of our total consolidated revenues during the years ended December 31, 2017, 2016 and 2015 are as follows:
2017 | 2016 | 2015 | ||||||
Cardinal Health, Inc. | 25 | % | 26 | % | 21 | % | ||
McKesson Corporation | 25 | % | 27 | % | 31 | % | ||
AmerisourceBergen Corporation | 25 | % | 25 | % | 23 | % | ||
Revenues from these customers are included within each of our segments.
VASOSTRICT® accounted for 12% of our 2017 total revenues. No other products accounted for 10% or more of our total revenues during the years ended December 31, 2017, 2016 or 2015.
We have agreements with certain third parties for the manufacture, supply and processing of certain of our existing pharmaceutical products. See Note 14. Commitments and Contingencies for information on material manufacturing, supply and other service agreements.
We are subject to risks and uncertainties associated with these concentrations that could have a material adverse effect on our financial position and results of operations in future periods, including in the near term.
Revenue Recognition. Our revenue consists almost entirely of sales of our pharmaceutical products to customers, whereby we ship product to a customer pursuant to a purchase order, which typically corresponds and/or makes reference to a master agreement with that customer, and invoice the customer upon shipment. For sales such as these, we recognize revenue when title and risk of loss has passed to the customer, which is typically upon delivery to the customer, when estimated provisions for revenue reserves are reasonably determinable and when collectability is reasonably confirmed. The amount of revenue we recognize is equal to the selling price, adjusted for our estimates of a number of significant sales deductions, which are further described below.
Revenue from the launch of a new or significantly unique product may be deferred until such time that the product has achieved market acceptance. For these products, revenue is typically recognized based on dispensed prescription data and other information obtained prior to and during the period following launch.
Sales Deductions. When we recognize revenue from the sale of our products, we simultaneously record an adjustment to revenue for estimated chargebacks, rebates, sales incentives and allowances, DSA and other fees for services, returns and allowances. These sales deductions are estimated based on historical experience, estimated future trends, estimated customer inventory levels, current contract sales terms with our direct and indirect customers and other competitive factors. We subsequently review our provisions for our various sales deductions based on new or revised information that becomes available to us and make revisions to our estimates if and when appropriate. If the assumptions we used to calculate our provisions for sales deductions do not appropriately reflect future activity, our financial position, results of operations and cash flows could be materially impacted.
F-13
Research and Development (R&D). Expenditures for research and development are expensed as incurred. Total R&D expenses include the costs of discovery research, preclinical development, early- and late-clinical development and drug formulation, clinical trials, medical support of marketed products, upfront, milestone and other payments under third-party collaborations and contracts and other costs. R&D spending also includes enterprise-wide costs which support our overall R&D infrastructure. Property, plant and equipment that are acquired or constructed for research and development activities and that have alternate future uses are capitalized and depreciated over their estimated useful lives on a straight-line basis. Contractual upfront and milestone payments made to third parties are generally: (i) expensed as incurred up to the point of regulatory approval and (ii) capitalized and amortized over the related product’s remaining useful life subsequent to regulatory approval. Amounts capitalized for such payments are included in Other intangibles, net in the Consolidated Balance Sheets.
Cash and Cash Equivalents. The Company considers all highly liquid money market instruments with an original maturity of three months or less when purchased to be cash equivalents. At December 31, 2017, cash equivalents were deposited in financial institutions and consisted of immediately available fund balances and time deposits. The Company maintains its cash deposits and cash equivalents with financial institutions it believes to be well-known and stable.
Restricted Cash and Cash Equivalents. Cash and cash equivalents that are restricted as to withdrawal or use under the terms of certain contractual agreements are excluded from Cash and cash equivalents in the Consolidated Balance Sheets. For additional information see Note 7. Fair Value Measurements.
Marketable Securities. The Company has equity securities, which consist of investments in the stock of publicly traded companies. For additional information see Note 7. Fair Value Measurements.
Accounts Receivable. Accounts receivable are stated at their net realizable value. The allowance for doubtful accounts against gross accounts receivable reflects the best estimate of probable losses inherent in the receivables portfolio determined on the basis of historical experience, specific allowances for known troubled accounts and other currently available information. In addition, accounts receivable is reduced by certain sales deduction reserves where we have the right of offset with the customer.
Concentrations of Credit Risk. Financial instruments that potentially subject the Company to significant concentrations of credit risk consist primarily of cash equivalents, restricted cash equivalents, marketable debt securities and accounts receivable. We invest our excess cash in high-quality, liquid money market instruments and time deposits maintained by major banks and financial institutions. We have not experienced any losses on our cash equivalents.
We perform ongoing credit evaluations of our customers and generally do not require collateral. We have no history of significant losses from uncollectible accounts. Approximately 89% and 84% of our gross trade accounts receivable balances represent amounts due from three customers (Cardinal Health, Inc., McKesson Corporation and AmerisourceBergen Corporation) at December 31, 2017 and 2016, respectively.
We do not expect our current or future exposures to credit risk to have a significant impact on our operations. However, there can be no assurance that any of these risks will not have an adverse effect on our business.
Inventories. Inventories consist of raw materials, work-in-process and finished goods. Inventory that is in excess of the amount expected to be sold within one year is classified as long-term inventory and is recorded in Other assets in the Consolidated Balance Sheets. The Company capitalizes inventory costs associated with certain generic products prior to regulatory approval and product launch when it is reasonably certain, based on management’s judgment of future commercial use and net realizable value, that the pre-launch inventories will be saleable. The determination to capitalize is made on a product-by-product basis once: (i) the Company (or its third party development partners) has filed an ANDA that has been acknowledged by the FDA as containing sufficient information to allow the FDA to conduct its review in an efficient and timely manner and (ii) management is reasonably certain that all regulatory and legal requirements will be cleared. The Company could be required to write down previously capitalized costs related to pre-launch inventories upon a change in such judgment, a denial or delay of approval by regulatory bodies, a delay in commercialization or other potential factors. Our inventories are stated at the lower of cost or net realizable value. Cost is determined by the first-in, first-out method and includes materials, direct labor and an allocation of overhead. Net realizable value is determined by the estimated selling prices in the ordinary course of business, less reasonably predictable costs of completion, disposal and transportation. When necessary, we write-down inventories to net realizable value based on forecasted demand and market and regulatory conditions, which may differ from actual results.
F-14
Property, Plant and Equipment. Property, plant and equipment is generally stated at cost less accumulated depreciation. Major improvements are capitalized, while routine maintenance and repairs are expensed as incurred. Costs incurred during the construction or development of property plant and equipment are capitalized as assets under construction. Once an asset has been put into service, depreciation expense is taken over the estimated useful life of the related assets or, in the case of leasehold improvements and capital lease assets, over the shorter of the estimated useful life or the lease term. Depreciation expense is recorded on a straight-line basis. Depreciation expense is not recorded on Assets held for sale. Gains and losses on disposals are included in Other (income) expense, net in the Consolidated Statements of Operations. Depreciation is based on the following estimated useful lives, as of December 31, 2017:
Range of Useful Lives (1), from: | |||
Buildings | 10 years | to | 30 years |
Machinery and equipment | 2 years | to | 15 years |
Leasehold improvements | 2 years | to | 10 years |
Computer equipment and software | 1 year | to | 7 years |
Assets under capital lease | Shorter of useful life or lease term | ||
Furniture and fixtures | 3 years | to | 10 years |
__________
(1) | The useful lives for certain fixed assets have been reduced in connection with our 2017 U.S. Generic Pharmaceuticals Restructuring Initiative, which is further described in Note 4. Restructuring. The ranges of useful lives above do not include such assets. |
Computer Software. The Company capitalizes certain costs incurred in connection with obtaining or developing internal-use software, including external direct costs of material and services, and payroll costs for employees directly involved with the software development. Capitalized software costs are included in Property, plant and equipment, net in the Consolidated Balance Sheets and depreciated beginning when the software project is substantially complete and the asset is ready for its intended use. Costs incurred during the preliminary project stage and post-implementation stage, as well as maintenance and training costs, are expensed as incurred.
Lease Accounting. The Company accounts for operating lease transactions by recording rent expense on a straight-line basis over the expected life of the lease, commencing on the date it gains possession of leased property. The Company includes tenant improvement allowances and rent holidays received from landlords and the effect of any rent escalation clauses as adjustments to straight-line rent expense over the expected life of the lease.
Capital lease transactions are reflected as a liability at the inception of the lease based on the present value of the minimum lease payments or, if lower, the fair value of the property. Assets under capital leases are recorded in Property, plant and equipment, net in the Consolidated Balance Sheets and depreciated in a manner similar to other Property, plant and equipment.
Certain construction projects may be accounted for as direct financing arrangements, whereby the Company records, over the construction period, the full cost of the asset in Property, plant and equipment, net in the Consolidated Balance Sheets. A corresponding liability is also recorded, net of leasehold improvements paid for by the Company, and is amortized over the expected lease term through monthly rental payments using an effective interest method. Assets recorded under direct financing arrangements are depreciated over the lease term.
Finite-Lived Intangible Assets. Our finite-lived intangible assets, which consist of license rights and developed technology, are initially recorded at fair value upon acquisition. There are several methods that can be used to determine fair value. For intangible assets, we typically use the income method. This method starts with our forecast of all of the expected future net cash flows. Revenues are estimated based on relevant market size and growth factors, expected industry trends, individual project life cycles and, if applicable, the life of any estimated period of marketing exclusivity, such as that granted by a patent. The pricing, margins and expense levels of similar products are considered if available. These cash flows are then adjusted to present value by applying an appropriate discount rate that reflects the risk factors associated with the cash flow streams.
To the extent an intangible asset is deemed to have a finite life, it is then amortized over its estimated useful life using either the straight-line method or, in the case of certain developed technology assets, the economic benefit model. The values of these various assets are subject to continuing scientific, medical and marketplace uncertainty. Factors giving rise to our initial estimate of useful lives are subject to change. Significant changes to any of these factors may result in a reduction in the useful life of the asset and an acceleration of related amortization expense, which could cause our operating income, net income and net income per share to decrease. Amortization expense is not recorded on assets held for sale.
License Rights. Our license rights have useful lives ranging from 3 years to 15 years, with a weighted average useful life of approximately 12 years. We determine amortization periods for licenses based on our assessment of various factors including the expected launch date of the product, the strength of the intellectual property protection of the product, contractual terms and various other competitive, developmental and regulatory issues.
F-15
Developed Technology. Our developed technology assets have useful lives ranging from 1 year to 20 years, with a weighted average useful life of approximately 11 years. We determine amortization periods and method of amortization for developed technology assets based on our assessment of various factors impacting estimated useful lives and timing and extent of estimated cash flows of the acquired assets including the strength of the intellectual property protection of the product, contractual terms and various other competitive and regulatory issues.
Long-Lived Asset Impairment Testing. Long-lived assets, including property, plant and equipment and finite-lived intangible assets, are assessed for impairment whenever events or changes in circumstances indicate the carrying amounts of the assets may not be recoverable. Recoverability of an asset that will continue to be used in our operations is measured by comparing the carrying amount of the asset to the forecasted undiscounted future cash flows related to the asset. In the event the carrying amount of the asset exceeds its undiscounted future cash flows and the carrying amount is not considered recoverable, impairment may exist. An impairment loss, if any, is measured as the excess of the asset’s carrying amount over its fair value, generally based on a discounted future cash flow method, independent appraisals or preliminary offers from prospective buyers. An impairment loss would be recognized in the Consolidated Statements of Operations in the period that the impairment occurs.
In-Process Research and Development Assets (IPR&D). IPR&D assets are considered indefinite-lived intangible assets. Similar to finite-lived intangible assets, IPR&D assets are initially recorded at fair value. While amortization expense is not initially recorded for IPR&D assets, these assets are subject to impairment reviews. Impairment tests for an IPR&D asset occur at least annually on October 1st of each year, but also whenever events or changes in circumstances indicate that the asset might be impaired. If the fair value of the intangible assets is less than its carrying amount, an impairment loss is recognized for the difference. For those assets that reach commercialization, the assets are reclassified as finite-lived intangible assets and amortized over the expected useful lives.
Goodwill. Acquisitions meeting the definition of business combinations are accounted for using the acquisition method of accounting, which requires that the purchase price be allocated to the net assets acquired at their respective fair values. Any excess of the purchase price over the estimated fair values of the net assets acquired is recorded as goodwill. While amortization expense is not recorded on goodwill, goodwill is subject to impairment reviews. Impairment tests for goodwill occur at least annually on October 1st of each year, but also whenever events or changes in circumstances indicate that the asset might be impaired.
As further described below under the heading “Recent Accounting Pronouncements Adopted or Otherwise Effective as of December 31, 2017,” effective January 1, 2017, we early adopted Accounting Standards Update (ASU) No. 2017-04 “Intangibles - Goodwill and Other (Topic 350): Simplifying the Accounting for Goodwill Impairment” (ASU 2017-04). Subsequent to adoption, we perform our goodwill impairment tests by comparing the fair value of each of our reporting units with the carrying amount. Any goodwill impairment charge we recognize for a reporting unit is equal to the lesser of (i) the total goodwill allocated to that reporting unit and (ii) the amount by which that reporting unit’s carrying amount exceeds its fair value.
Contingencies. The Company is subject to various patent challenges, product liability claims, government investigations and other legal proceedings in the ordinary course of business. Legal fees and other expenses related to litigation are expensed as incurred and included in Selling, general and administrative expenses or Discontinued operations, net of tax in the Consolidated Statements of Operations. Contingent accruals and legal settlements are recorded in the Consolidated Statements of Operations as Litigation-related and other contingencies, net (or Discontinued operations, net in the case of vaginal mesh matters) when the Company determines that a loss is both probable and reasonably estimable. Due to the fact that legal proceedings and other contingencies are inherently unpredictable, our estimates of the probability and amount of any such liabilities involve significant judgment regarding future events. The Company records a receivable from its product liability insurance carriers only when the resolution of any dispute has been reached and realization of the potential claim for recovery is considered probable.
Contingent Consideration. Certain of the Company’s business acquisitions involve the potential for future payment of consideration that is contingent upon the achievement of operational and commercial milestones and royalty payments on future product sales. The fair value of contingent consideration liabilities is determined at the acquisition date using unobservable inputs. These inputs include the estimated amount and timing of projected cash flows, the probability of success (achievement of the contingent event) and the risk-adjusted discount rate used to present value the probability-weighted cash flows. Subsequent to the acquisition date, at each reporting period, the Company remeasures its contingent consideration liability to its current fair value, with changes recorded in earnings. Changes to any of the inputs used in determining fair value may result in a significantly different fair value adjustment.
Share Repurchases. The Company accounts for the repurchase of ordinary shares at par value. Under applicable Irish law, ordinary shares repurchased are retired and not displayed separately as treasury stock. Upon retirement of the ordinary shares, the Company records the difference between the weighted average cost of such ordinary shares and the par value of the ordinary shares as an adjustment to Accumulated deficit in the Consolidated Balance Sheets.
Advertising Costs. Advertising costs are expensed as incurred and included in Selling, general and administrative expenses in the Consolidated Statements of Operations. Advertising costs amounted to $42.0 million, $47.9 million and $57.9 million for the years ended December 31, 2017, 2016 and 2015, respectively.
F-16
Cost of Revenues. Cost of revenues includes all costs directly related to bringing both purchased and manufactured products to their final selling destination. Amounts include purchasing and receiving costs, direct and indirect costs to manufacture products including direct materials, direct labor and direct overhead expenses necessary to acquire and convert purchased materials and supplies into finished goods, royalties paid or owed by Endo on certain in-licensed products, inspection costs, depreciation of certain property, plant and equipment, amortization of intangible assets, warehousing costs, freight charges, costs to operate our equipment and other shipping and handling costs, among others.
Share-Based Compensation. The Company grants share-based compensation awards to certain employees and non-employee directors. Generally, the grant-date fair value of each award is recognized as expense over the requisite service period. However, expense recognition differs in the case of certain performance share units where the ultimate payout is performance-based. For these awards, at each reporting period, the Company estimates the ultimate payout and adjusts the cumulative expense based on its estimate and the percent of the requisite service period that has elapsed. Share-based compensation expense is reduced for estimated future forfeitures. These estimates are revised in future periods if actual forfeitures differ from the estimates. Changes in forfeiture estimates impact compensation expense in the period in which the change in estimate occurs. New ordinary shares are generally issued upon the exercise of stock options or vesting of stock awards by employees and non-employee directors.
Foreign Currency. The Company operates in various jurisdictions both inside and outside of the U.S. While the Company’s reporting currency is the U.S. dollar (USD), the Company has concluded that certain of its distinct and separable operations have functional currencies other than the USD. Further, certain of the Company’s operations hold assets and liabilities and recognize income and expenses denominated in various local currencies, which may differ from their functional currencies.
Assets and liabilities are first remeasured from local currency to functional currency, generally using end-of-period exchange rates. Foreign currency income and expenses are generally remeasured using average exchange rates in effect during the year. In the case of nonmonetary assets and liabilities such as inventories, prepaid expenses, property, plant and equipment, goodwill and other intangible assets, and related income statement amounts, such as depreciation expense, historical exchange rates are used for remeasurement. The net effect of remeasurement is included in Other (income) expense, net in the Consolidated Statements of Operations.
As part of the Company’s consolidation process, assets and liabilities of entities with functional currencies other than the USD are translated into USD at end-of-period exchange rates. Income and expenses are translated using average exchange rates in effect during the year. The net effect of translation is included as foreign currency translation, a component of Other comprehensive income (loss). Upon the sale or liquidation of an investment in a foreign operation, the Company records a reclassification adjustment out of Other comprehensive income (loss) for the accumulated amount of currency translation.
Income Taxes. The Company accounts for income taxes under the asset and liability method, which requires the recognition of deferred tax assets and liabilities for the expected future tax consequences of events that have been included in the financial statements. Under this method, deferred tax assets and liabilities are determined based on the differences between the financial statements and tax basis of assets and liabilities using enacted tax rates in effect for the year in which the differences are expected to reverse. The effect of a change in tax rates on deferred tax assets and liabilities is recognized in income in the period that includes the enactment date. The Company records net deferred tax assets to the extent it believes these assets will more likely than not be realized. In making such a determination, the Company considers all available positive and negative evidence, including projected future taxable income, tax-planning strategies and results of recent operations. In the event that the Company were to determine that it would be able to realize its deferred tax assets in the future in excess of their net recorded amount, the Company would make an adjustment to the deferred tax asset valuation allowance, which would reduce the provision for income tax.
The Company records uncertain tax positions on the basis of a two-step process whereby the Company first determines whether it is more likely than not that the tax positions will be sustained based on the technical merits of the position and then measures those tax positions that meet the more-likely-than-not recognition threshold. The Company recognizes the largest amount of tax benefit that is greater than 50% likely to be realized upon ultimate settlement with the tax authority. The Company recognizes interest and penalties related to unrecognized tax benefits within the Income tax expense (benefit) line in the Consolidated Statements of Operations. Accrued interest and penalties are included within the related tax liability line in the Consolidated Balance Sheets.
Comprehensive Income. Comprehensive income or loss includes all changes in equity during a period except those that resulted from investments by or distributions to a company’s shareholders. Other comprehensive income or loss refers to revenues, expenses, gains and losses that are included in comprehensive income, but excluded from net income as these amounts are recorded directly as an adjustment to shareholders’ equity.
F-17
Recent Accounting Pronouncements
Recently Issued Accounting Pronouncements Not Yet Adopted at December 31, 2017
In May 2014, the Financial Accounting Standards Board (FASB) issued ASU No. 2014-09, “Revenue from Contracts with Customers” (ASU 2014-09). ASU 2014-09 represents a comprehensive new revenue recognition model that requires a company to recognize revenue to depict the transfer of promised goods or services to customers in an amount that reflects the consideration to which a company expects to be entitled to receive in exchange for those goods or services. This ASU sets forth a new five-step revenue recognition model which replaces the prior revenue recognition guidance in its entirety and is intended to eliminate numerous industry-specific pieces of revenue recognition guidance that have historically existed. In August 2015, the FASB issued ASU No. 2015-14, “Revenue from Contracts with Customers (Topic 606): Deferral of the Effective Date,” which defers the effective date of ASU 2014-09 by one year, but permits companies to adopt one year earlier if they choose (i.e., the original effective date). As such, ASU 2014-09 will be effective for annual and interim reporting periods beginning after December 15, 2017. In March and April 2016, the FASB issued ASU No. 2016-08 “Revenue from Contracts with Customers (Topic 606): Principal versus Agent Consideration (Reporting Revenue Gross versus Net)” and ASU No. 2016-10 “Revenue from Contracts with Customers (Topic 606): Identifying Performance Obligations and Licensing,” respectively, which clarifies the guidance on reporting revenue as a principal versus agent, identifying performance obligations and accounting for intellectual property licenses. In addition, in May 2016, the FASB issued ASU No. 2016-12 “Revenue from Contracts with Customers (Topic 606): Narrow-Scope Improvements and Practical Expedients,” which amends certain narrow aspects of Topic 606, and in December 2016, the FASB issued ASU No. 2016-20 “Technical Corrections and Improvements to Topic 606, Revenue from Contracts with Customers,” which amends certain narrow aspects of Topic 606.
The new revenue recognition standard is effective for the Company on January 1, 2018. The Company is currently finalizing its analysis of the impact of ASU 2014-09 on its consolidated results of operations and financial position. The Company established a cross-functional implementation team consisting of representatives from across its business segments, which has substantially completed a diagnostic assessment of the impact of the standard on its contract portfolio, including review of customer contracts, as well as the Company’s current accounting policies and practices to identify potential differences that would result from applying the requirements of the new standard to its revenue contracts. Based on this assessment, the Company does not expect the impact to be material to its consolidated financial statements. The Company is also finalizing its evaluation of the internal control implications associated with the adoption of the new standard, including the identification and implementation, if necessary, of changes to its business processes, systems and controls to support recognition and disclosure under the new standard.
The majority of the Company’s revenue is generated from product sales and the Company currently does not anticipate a significant impact to revenue related to these arrangements. In certain limited situations, under current GAAP, the Company has deferred revenue for certain product sales because the sales price was not deemed to be fixed or determinable. Under the new standard, the Company will be required to estimate the variable consideration associated with these transactions and record revenue at the point of sale.
The Company also generates revenue from certain less significant transactions, including certain licensing arrangements. The Company has substantially completed its preliminary evaluation of the impact of the new standard on these other transactions and does not anticipate a significant impact on revenue related to these arrangements; however, this analysis is preliminary and remains subject to change.
The two permitted transition methods under the new standard are the full retrospective method, in which case the standard would be applied to each prior reporting period presented and the cumulative effect of applying the standard would be recognized at the earliest period shown, or the modified retrospective method, in which case the cumulative effect of applying the standard would be recognized at the date of initial application. The Company will utilize the modified retrospective method of adoption.
In February 2016, the FASB issued ASU No. 2016-02, “Leases (Topic 842)” (ASU 2016-02). ASU 2016-02 establishes the principles to report transparent and economically neutral information about the assets and liabilities that arise from leases. This guidance requires lessees to recognize the lease assets and lease liabilities that arise from leases in the statement of financial position and to disclose qualitative and quantitative information about lease transactions, such as information about variable lease payments and options to renew and terminate leases. ASU 2016-02 is effective for fiscal years beginning after December 15, 2018, including interim periods within those fiscal years. The Company is currently evaluating the impact of ASU 2016-02 on the Company’s consolidated results of operations and financial position.
In May 2017, the FASB issued ASU No. 2017-09 “Compensation - Stock Compensation” (ASU 2017-09). ASU 2017-09 provides guidance about which changes to the terms or conditions of a share-based payment award require an entity to apply modification accounting. It is intended to reduce both (1) diversity in practice and (2) cost and complexity when accounting for changes to the terms or conditions of share-based payment awards. ASU 2017-09 is effective for annual periods, and interim periods within those annual periods, beginning after December 15, 2017. Early adoption is permitted. The Company adopted the new standard on January 1, 2018 and the amendments in this update will be applied prospectively to any award modified on or after the adoption date.
F-18
In February 2018, the FASB issued ASU No. 2018-02 “Reclassification of Certain Tax Effects from Accumulated Other Comprehensive Income” (ASU 2018-02). ASU 2018-02 allows for a reclassification from accumulated other comprehensive income or loss to retained earnings or accumulated deficit for stranded tax effects resulting from the Tax Cuts and Jobs Act of 2017 (TCJA). ASU 2018-02 also requires certain related disclosures. ASU 2018-02 is effective for annual periods, and interim periods within those annual periods, beginning after December 15, 2018 and should be applied either in the period of adoption or retrospectively to each period in which the effect of the change in the U.S. federal corporate income tax rate in the TCJA is recognized. Early adoption is permitted. The Company is currently evaluating the impact of ASU 2018-02.
Recent Accounting Pronouncements Adopted or Otherwise Effective as of December 31, 2017
In July 2015, the FASB issued ASU No. 2015-11, “Simplifying the Measurement of Inventory” (ASU 2015-11). ASU 2015-11 states that an entity should measure inventory at the lower of cost or net realizable value. Net realizable value is the estimated selling prices in the ordinary course of business, less reasonably predictable costs of completion, disposal and transportation. For public entities, ASU 2015-11 is effective for fiscal years beginning after December 15, 2016, including interim periods within those fiscal years. The Company adopted ASU 2015-11 on January 1, 2017 and the adoption did not impact the Company’s consolidated results of operations and financial position.
As discussed above under the heading “Reclassifications,” in March 2016, the FASB issued ASU 2016-09. ASU 2016-09 changes how companies account for certain aspects of share-based payments to employees including: (i) requiring all income tax effects of awards to be recognized in the income statement, rather than in additional paid in capital, when the awards vest or are settled, (ii) eliminating the requirement that excess tax benefits be realized before companies can recognize them, (iii) requiring companies to present excess tax benefits as an operating activity on the statement of cash flows rather than as a financing activity, (iv) increasing the amount an employer can withhold to cover income taxes on awards and still qualify for the exception to liability classification for shares used to satisfy the employer’s statutory income tax withholding obligation, (v) requiring an employer to classify the cash paid to a tax authority when shares are withheld to satisfy its statutory income tax withholding obligation as a financing activity on its statement of cash flows and (vi) electing whether to account for forfeitures of share-based payments by (a) recognizing forfeitures of awards as they occur or (b) estimating the number of awards expected to be forfeited and adjusting the estimate when it is likely to change, as is currently required. ASU 2016-09 is effective for fiscal years beginning after December 15, 2016, and interim periods within those fiscal years. The Company adopted the new guidance on January 1, 2017 on a prospective basis, except for the provision requiring companies to present excess tax benefits as an operating activity on the statement of cash flows rather than as a financing activity, which was adopted retrospectively. As a result of the adoption, during the year ended December 31, 2017, the Company did not recognize any tax expense in its Consolidated Statement of Operations that would have been recorded as additional paid-in capital prior to adoption. The table above under the heading “Reclassifications” presents the retrospective effects of the adoption of ASU 2016-09 on the Company’s Consolidated Statements of Cash Flows, which related to the reclassification of excess tax benefits. The adoption of ASU 2016-09 did not impact beginning retained earnings and the Company will continue to estimate forfeitures to determine the amount of compensation cost to be recognized in each period. None of the other provisions in this amended guidance had a significant impact on the Company’s consolidated financial statements.
As discussed above under the heading “Reclassifications,” in August 2016, the FASB issued ASU 2016-15. ASU 2016-15 addresses eight specific cash flow issues with the objective of reducing diversity in how certain cash receipts and cash payments are presented and classified in the statement of cash flows. One of the provisions of ASU 2016-15 is that cash outflows for debt prepayment or debt extinguishment costs should be classified as cash outflows for financing activities, rather than operating activities. ASU 2016-15 is effective for fiscal years beginning after December 15, 2017, and interim periods within those fiscal years. Early adoption is permitted in any interim or annual period, but all of ASU 2016-15 must be adopted in the same period. All updates should be applied using a retrospective transition method. The Company early adopted ASU 2016-15 on December 31, 2017. The table above under the heading “Reclassifications” presents the retrospective effects of the adoption of ASU 2016-15 on the Company’s Consolidated Statements of Cash Flows, which related to the reclassification of cash outflows for debt prepayment costs.
In October 2016, the FASB issued ASU No. 2016-16 “Intra-Entity Transfers of Assets Other Than Inventory” (ASU 2016-16). ASU 2016-16 states that an entity should recognize the income tax consequences when an intra-entity transfer of an asset other than inventory occurs. ASU 2016-16 is effective for fiscal years beginning after December 15, 2017 and interim periods within those fiscal years. Early adoption is permitted as long as it is adopted in the first interim period of a fiscal year beginning after December 15, 2016. The Company early adopted ASU 2016-16 on January 1, 2017, resulting in the elimination of previously recorded deferred charges that were established in 2016. Specifically, the Company eliminated a $24.1 million current deferred charge and a $348.8 million non-current deferred charge that were reflected in our Consolidated Balance Sheet at December 31, 2016 as Prepaid expenses and other current assets and Other assets, respectively. The eliminations of these deferred charges were recorded as adjustments to retained earnings as of January 1, 2017. On adoption, the Company also recorded net deferred tax assets, primarily related to certain intangible assets and tax deductible goodwill, of $479.7 million, fully offset by a corresponding valuation allowance.
F-19
As discussed above under the heading “Reclassifications,” in November 2016, the FASB issued ASU 2016-18. ASU 2016-18 states that a statement of cash flows should explain the change during the period in the total of cash, cash equivalents and amounts generally described as restricted cash or restricted cash equivalents. Therefore, amounts generally described as restricted cash and restricted cash equivalents should be included with cash and cash equivalents when reconciling the beginning-of-period and end-of-period total amounts shown on the statement of cash flows. ASU 2016-18 is effective for fiscal years beginning after December 15, 2017, and interim periods within those fiscal years. Early adoption is permitted, including adoption in an interim period, and all updates should be applied using a retrospective transition method. The Company early adopted ASU 2016-18 on December 31, 2017. The table above under the heading “Reclassifications” presents the retrospective effects of the adoption of ASU 2016-18 on the Company’s Consolidated Statements of Cash Flows.
In January 2017, the FASB issued ASU No. 2017-01 “Business Combinations (Topic 805) - Clarifying the Definition of a Business” (ASU 2017-01). ASU 2017-01 clarifies the definition of a business with the objective of adding guidance to assist entities with evaluating whether transactions should be accounted for as acquisitions (or disposals) of assets or businesses. The amendments in this update provide a screen to determine when an integrated set of assets and activities (collectively referred to as a “set”), is not a business. The screen requires that when substantially all of the fair value of the gross assets acquired (or disposed of) is concentrated in a single identifiable asset or a group of similar identifiable assets, the set is not a business. This screen reduces the number of transactions that need to be further evaluated. ASU 2017-01 is effective for annual periods beginning after December 15, 2017, including interim periods within those periods. The amendments in this update should be applied prospectively on or after the effective date. Early application of the amendments in this update is allowed. The Company early adopted this new standard on January 1, 2017.
In January 2017, the FASB issued ASU 2017-04. ASU 2017-04 simplifies the subsequent measurement of goodwill by eliminating Step 2 from the goodwill impairment test. In computing the implied fair value of goodwill under Step 2, an entity had to perform procedures to determine the fair value at the impairment testing date of its assets and liabilities (including unrecognized assets and liabilities) following the procedure that would be required in determining the fair value of assets acquired and liabilities assumed in a business combination. Instead, under ASU 2017-04, an entity should perform its annual or interim goodwill impairment test by comparing the fair value of a reporting unit with its carrying amount. An entity should recognize an impairment charge for the amount by which the carrying amount exceeds the reporting unit’s fair value; however, the loss recognized should not exceed the total amount of goodwill allocated to that reporting unit. Additionally, an entity should consider the income tax effects of any tax deductible goodwill on the carrying amount of the reporting unit when measuring the goodwill impairment loss, if applicable. ASU 2017-04 is effective for annual or any interim goodwill impairment tests in fiscal years beginning after December 15, 2019 and an entity should apply the amendments of ASU 2017-04 on a prospective basis. Early adoption is permitted for interim or annual goodwill impairment tests performed on testing dates after January 1, 2017. The Company early adopted this standard on January 1, 2017. Refer to Note 10. Goodwill and Other Intangibles for a description of goodwill impairment charges taken during the year ended December 31, 2017.
NOTE 3. DISCONTINUED OPERATIONS AND ASSETS AND LIABILITIES HELD FOR SALE
American Medical Systems
On February 24, 2015, the Company’s Board of Directors (Board of Directors) approved a plan to sell the Company’s American Medical Systems Holdings, Inc. (AMS) business. The AMS business included the Men’s Health and Prostate Health and Women’s Health (Astora) businesses. The Men’s Health and Prostate Health businesses were sold to Boston Scientific Corporation (Boston Scientific) on August 3, 2015 for $1.6 billion in cash. In addition, Boston Scientific paid $60.0 million in exchange for 60,000 shares of AMS Series B Non-Voting Preferred Stock (the Series B Senior Preferred Stock) sold by our subsidiary Endo Pharmaceuticals Inc. (EPI). On December 11, 2015, the Company repurchased the Series B Senior Preferred Stock from Boston Scientific Corporation for $61.6 million.
On February 24, 2016, the Company’s Board of Directors resolved to wind-down the remaining Astora business as it did not align with the Company’s strategic direction and to reduce Astora’s exposure to mesh-related product liability. Astora ceased business operations on March 31, 2016.
The operating results of AMS are reported as Discontinued operations, net of tax in the Consolidated Statements of Operations for all periods presented. The assets and liabilities of the AMS disposal groups were classified as held for sale until they were sold in the case of the Men’s Health and Prostate Health businesses, or until the Company determined it would wind-down the remaining business in the case of Astora.
F-20
In connection with classifying AMS as held for sale during 2015, the Company was required to compare the estimated fair values of the underlying disposal groups, less the costs to sell, to the respective carrying amounts. The Company performed this analysis for each unsold AMS disposal group during each reporting period in 2015. As a result of these analyses, the Company recorded combined asset impairment charges of $230.7 million in 2015, which were classified as Discontinued operations, net of tax in the Consolidated Statements of Operations. We estimated the fair value of the Men’s Health and Prostate Health businesses based on the agreed-upon purchase price with Boston Scientific. The fair value of Astora was estimated based on contemporaneous expressions of interest from third parties.
Subsequently, at the time of the sale of the Men’s Health and Prostate Health businesses in August 2015, the Company recorded a gain based on the difference between the net proceeds received and the net book value of the assets sold of approximately $13.6 million, which included an adjustment of $25.7 million relating to amounts transferred from foreign currency translation adjustments and included in the determination of net income for the period as a result of the sale, which decreased the gain. This amount is included in Discontinued operations, net of tax in the Consolidated Statements of Operations for the year ended December 31, 2015.
In addition, as a result of determining that the sale of the AMS disposal groups was probable as of December 31, 2015, the Company re-assessed its permanent reinvestment assertion for certain components of the AMS business and recognized a corresponding tax benefit of $161.8 million during the year ended December 31, 2015, which was recorded as Income tax benefit (a component of Loss from continuing operations) in the Consolidated Statements of Operations. In addition, due to the overall differences between the book and tax basis of the underlying assets sold during the third quarter of 2015, the Company recognized a tax benefit of $157.4 million during the year ended December 31, 2015 from Discontinued operations.
As a result of the Astora wind-down initiative announced in the first quarter of 2016, the Company incurred asset impairment charges of $21.3 million during the year ended December 31, 2016. See below for discussion of our material wind-down initiatives.
The following table provides the operating results of AMS Discontinued operations, net of tax for the years ended December 31, 2017, 2016 and 2015 (in thousands):
2017 | 2016 | 2015 | |||||||||
Revenue | $ | 338 | $ | 30,101 | $ | 305,256 | |||||
Litigation-related and other contingencies, net | $ | 775,474 | $ | 20,115 | $ | 1,107,752 | |||||
Asset impairment charges | $ | — | $ | 21,328 | $ | 230,703 | |||||
Gain on sale of business | $ | — | $ | — | $ | 13,550 | |||||
Loss from discontinued operations before income taxes | $ | (816,426 | ) | $ | (123,164 | ) | $ | (1,352,344 | ) | ||
Income tax benefit | $ | (13,704 | ) | $ | — | $ | (157,418 | ) | |||
Discontinued operations, net of tax | $ | (802,722 | ) | $ | (123,164 | ) | $ | (1,194,926 | ) | ||
Amounts reported in the table above as Litigation-related and other contingencies, net primarily relate to charges for vaginal-mesh-related matters, which are further described in Note 14. Commitments and Contingencies.
The cash flows from discontinued operating activities related to AMS included the impact of net losses of $802.7 million, $123.2 million and $1,194.9 million for the years ended December 31, 2017, 2016 and 2015, respectively, and the impact of cash activity related to vaginal mesh cases, which is further described in Note 14. Commitments and Contingencies. Net cash used in discontinued investing activities related to AMS consisted of purchases of property, plant and equipment of $0.1 million and $2.7 million for the years ended December 31, 2016 and 2015, with no comparable amount during the year ended December 31, 2017. There was no depreciation or amortization during the years ended December 31, 2017 or 2016 related to AMS. Depreciation and amortization during the year ended December 31, 2015 was $11.6 million.
Astora Restructuring Initiative
The Astora wind-down process included a restructuring initiative implemented during the three months ended March 31, 2016, which included a reduction of the Astora workforce consisting of approximately 250 employees (the Astora Restructuring Initiative).
F-21
The Company did not incur any pre-tax charges during the year ended December 31, 2017 as a result of the Astora Restructuring Initiative. A summary of expenses related to the Astora Restructuring Initiative is included below for the year ended December 31, 2016 (in thousands):
2016 | |||
Employee separation, retention and other benefit-related costs | $ | 20,476 | |
Asset impairment charges | 21,328 | ||
Contract termination-related items | 8,074 | ||
Other wind down costs | 10,972 | ||
Total | $ | 60,850 | |
The Company anticipates there will be no significant additional pre-tax restructuring expenses related to this initiative. The majority of these actions were completed as of September 30, 2016 and substantially all cash payments were made by June 30, 2017. These restructuring costs are included in Discontinued operations in the Consolidated Statements of Operations.
The liability related to the Astora Restructuring Initiative is included in Accounts payable and accrued expenses in the Consolidated Balance Sheets. Changes to this liability during the years ended December 31, 2017 and 2016 were as follows (in thousands):
Employee Separation and Other Benefit-Related Costs | Contract Termination Charges | Other Restructuring Costs | Total | ||||||||||||
Liability balance as of January 1, 2016 | $ | — | $ | — | $ | — | $ | — | |||||||
Expenses | 20,476 | 8,074 | 5,798 | 34,348 | |||||||||||
Cash distributions | (16,621 | ) | (6,413 | ) | (5,798 | ) | (28,832 | ) | |||||||
Liability balance as of January 1, 2017 | $ | 3,855 | $ | 1,661 | $ | — | $ | 5,516 | |||||||
Cash distributions | (3,855 | ) | (1,208 | ) | — | (5,063 | ) | ||||||||
Liability balance as of December 31, 2017 | $ | — | $ | 453 | $ | — | $ | 453 | |||||||
Litha
During the fourth quarter of 2016, the Company initiated a process to sell its Litha Healthcare Group Limited and related Sub-Sahara African business assets (Litha) and, on February 27, 2017, the Company entered into a definitive agreement to sell Litha to Acino Pharma AG (Acino). The sale closed on July 3, 2017 and the Company received net cash proceeds of approximately $94.2 million, after giving effect to cash and net working capital purchase price adjustments, as well as a short-term receivable of $4.4 million, which was subsequently collected in October 2017. No additional gain or loss was recognized upon sale. However, in December 2017, Acino became obligated to pay $10.1 million of additional consideration to the Company related to the settlement of certain contingencies set forth in the purchase agreement, which was subsequently paid to the Company in January 2018. In December 2017, the Company recorded a short-term receivable and a gain on the sale of Litha for this amount. The gain is included in Other (income) expense, net in the Consolidated Statements of Operations. The purchase agreement contains an additional contingency that could result in a decrease in the purchase price of up to $26 million as a result of additional payments to Acino, which would result in a loss on the sale. This contingency is expected to be resolved by June 30, 2018.
The assets and liabilities of Litha are classified as held for sale in the Consolidated Balance Sheets as of December 31, 2016. Litha was part of the Company’s International Pharmaceuticals segment.
The following table provides the components of Assets and Liabilities held for sale of Litha as of and December 31, 2016 (in thousands):
December 31, 2016 | |||
Current assets | $ | 50,167 | |
Property, plant and equipment | 3,527 | ||
Other intangibles, net | 29,950 | ||
Other assets | 11,343 | ||
Assets held for sale | $ | 94,987 | |
Current liabilities | 18,642 | ||
Other liabilities | 5,696 | ||
Liabilities held for sale | $ | 24,338 | |
F-22
Litha does not meet the requirements for treatment as a discontinued operation.
Somar
On June 30, 2017, the Company entered into a definitive agreement to sell Somar and all of the securities thereof, to AI Global Investments (Netherlands) PCC Limited acting for and on behalf of the Soar Cell (the Purchaser). The sale closed on October 25, 2017 and the Purchaser paid an aggregate purchase price of approximately $124 million in cash, after giving effect to estimated cash, debt and net working capital purchase price adjustments. The Company recognized a $1.3 million loss upon sale. Somar was part of the Company’s International Pharmaceuticals segment. Somar does not meet the requirements for treatment as a discontinued operation.
NOTE 4. RESTRUCTURING
Auxilium Restructuring Initiative
In connection with the acquisition of Auxilium Pharmaceuticals, Inc. (subsequently converted to Auxilium Pharmaceuticals LLC hereafter referred to as Auxilium) on January 29, 2015, the Company implemented cost-rationalization and integration initiatives to capture operating synergies and generate cost savings across the Company (the Auxilium Restructuring Initiative). These measures included realigning our sales, sales support, management activities and staffing, which included separation benefits to former Auxilium employees, in addition to the closing of duplicative facilities. The cost reduction initiatives included a reduction in headcount of approximately 40% of the former Auxilium workforce. For former Auxilium employees that agreed to continue employment with the Company for a merger transition period, the separation costs payable upon completion of their retention period were expensed over their respective retention period.
As a result of the Auxilium Restructuring Initiative, the Company incurred $1.1 million of restructuring expenses during the year ended December 31, 2017, primarily related to its Chesterbrook, Pennsylvania facility. There were no significant restructuring expenses related to this initiative during the year ended December 31, 2016. The Company incurred restructuring expenses of $41.9 million during the year ended December 31, 2015, primarily consisting of $26.7 million of employee severance and other benefit-related costs. Other restructuring expenses related primarily to our Auxilium subsidiary’s former corporate headquarters in Chesterbrook, Pennsylvania, including $7.0 million of asset impairment charges on certain related leasehold improvements and $7.9 million recorded upon the facility’s cease use date, representing the liability for our remaining obligations under the respective lease agreement, net of estimated sublease income. These restructuring costs were included in the U.S. Branded Pharmaceuticals segment, and were primarily included in Selling, general and administrative costs and expenses in the Consolidated Statements of Operations. The Company does not anticipate any additional pre-tax restructuring expenses.
The liability related to the Auxilium Restructuring Initiative is included in Accounts payable and accrued expenses and Other liabilities in the Consolidated Balance Sheets. Changes to this accrual during the years ended December 31, 2017 and 2016 were as follows (in thousands):
Employee Separation and Other Benefit-Related Costs | Other Restructuring Costs | Total | |||||||||
Liability balance as of January 1, 2016 | $ | 5,353 | $ | 6,910 | $ | 12,263 | |||||
Cash distributions | (5,353 | ) | (1,406 | ) | (6,759 | ) | |||||
Liability balance as of January 1, 2017 | $ | — | $ | 5,504 | $ | 5,504 | |||||
Expenses | — | 1,058 | 1,058 | ||||||||
Cash distributions | — | (1,937 | ) | (1,937 | ) | ||||||
Liability balance as of December 31, 2017 | $ | — | $ | 4,625 | $ | 4,625 | |||||
The remainder of the cash payments will be made over the remaining lease term of the Chesterbrook facility, which extends until December 2023.
2015 U.S. Generic Pharmaceuticals Restructuring Initiative
In connection with the acquisition of Par Pharmaceutical Holdings, Inc. and its subsidiaries (together herein Par) on September 25, 2015, we implemented cost-rationalization and integration initiatives to capture operating synergies and generate cost savings across the Company. These measures included realigning the Company’s U.S. Generic Pharmaceuticals segment sales, sales support, management activities and staffing, which resulted in separation benefits to certain U.S. Generic Pharmaceuticals employees. The cost reduction initiatives included a reduction in headcount of approximately 6% of the U.S. Generic Pharmaceuticals workforces. Under this restructuring initiative (the 2015 U.S. Generic Pharmaceuticals Restructuring Initiative), separation costs were expensed over the requisite service period, if any, while retention was expensed ratably over the respective retention period.
F-23
There were no significant restructuring expenses related to this initiative during the year ended December 31, 2017. The Company incurred restructuring expenses of $5.0 million and $23.6 million during the years ended December 31, 2016 and 2015, respectively, consisting of employee separation, retention and other benefit-related costs. These actions were completed by October 31, 2016. These restructuring costs were allocated to the U.S. Generic Pharmaceuticals segment, and were primarily included in Selling, general and administrative expenses in the Consolidated Statements of Operations.
The liability related to the 2015 U.S. Generic Pharmaceuticals Restructuring Initiative is included in Accounts payable and accrued expenses in the Consolidated Balance Sheets. Changes to this accrual during the years ended December 31, 2017 and 2016 were as follows (in thousands):
Total | |||
Liability balance as of January 1, 2016 | $ | 17,914 | |
Expenses | 5,010 | ||
Cash distributions | (19,655 | ) | |
Liability balance as of January 1, 2017 | $ | 3,269 | |
Expenses | 63 | ||
Cash distributions | (3,332 | ) | |
Liability balance as of December 31, 2017 | $ | — | |
2016 U.S. Generic Pharmaceuticals Restructuring Initiative
As part of the ongoing U.S. Generic Pharmaceuticals integration efforts initiated in connection with the acquisition of Par in September 2015, the Company announced a restructuring initiative in May 2016 to optimize its product portfolio and rationalize its manufacturing sites to expand product margins (the 2016 U.S. Generic Pharmaceuticals Restructuring Initiative). These measures included certain cost savings initiatives, including a reduction in headcount and the disposal of our Charlotte, North Carolina manufacturing facility (the Charlotte facility). On October 31, 2016, we entered into a definitive agreement to sell the Charlotte facility for cash proceeds of $14 million. The transaction closed in January 2017. The assets of the Charlotte facility were classified as held for sale in the accompanying Consolidated Balance Sheet as of December 31, 2016.
As a result of the 2016 U.S. Generic Pharmaceuticals Restructuring Initiative, the Company incurred pre-tax charges of $1.0 million and $173.9 million during the years ended December 31, 2017 and 2016, respectively. The 2017 charges related primarily to employee separation and other benefit-related costs.
The 2016 charges consisted of certain asset impairment charges of $107.2 million, charges to increase excess inventory reserves of $33.3 million, charges related to employee separation, retention and other benefit-related costs of $17.0 million, accelerated depreciation of $10.2 million and other charges of $6.2 million. These charges are included in the U.S. Generic Pharmaceuticals segment and are included in Asset impairment charges, Cost of revenues and Selling, general and administrative expenses in the Consolidated Statements of Operations. The Company does not expect to incur additional significant expenses related to this restructuring initiative. Substantially all related cash payments were made by the end of 2017. Under this restructuring initiative, separation costs were expensed ratably over the requisite service period, if any, while retention was expensed ratably over the respective retention period.
The liability related to the 2016 U.S. Generic Pharmaceuticals Restructuring Initiative is included in Accounts payable and accrued expenses in the Consolidated Balance Sheets and related entirely to employee separation and other benefit-related costs. Changes to this liability during the years ended December 31, 2017 and 2016 were as follows (in thousands):
Total | |||
Liability balance as of January 1, 2016 | $ | — | |
Expenses | 16,983 | ||
Cash distributions | (7,044 | ) | |
Liability balance as of January 1, 2017 | $ | 9,939 | |
Expenses | 984 | ||
Cash distributions | (10,672 | ) | |
Liability balance as of December 31, 2017 | $ | 251 | |
F-24
2016 U.S. Branded Pharmaceuticals Restructuring Initiative
In December 2016, the Company announced that it was terminating its worldwide license and development agreement with BioDelivery Sciences International, Inc. (BDSI) for BELBUCA™ and returning the product to BDSI. This termination was completed on January 6, 2017. As a result of this announcement and a comprehensive assessment of its product portfolio, the Company restructured its U.S. Branded Pharmaceuticals segment sales organization during the fourth quarter of 2016 (the 2016 U.S. Branded Pharmaceuticals Restructuring Initiative), which included the elimination of an approximate 375-member U.S. Branded Pharmaceuticals pain field sales force and the termination of certain contracts.
The Company did not incur any significant pre-tax charges during the year ended December 31, 2017 as a result of the 2016 U.S. Branded Pharmaceuticals Restructuring Initiative. The Company incurred total pre-tax charges of approximately $61.5 million during the fourth quarter of 2016. These charges consisted of a non-cash intangible asset impairment charge of approximately $36.8 million, employee separation and other benefit-related costs of $16.5 million, early contract termination fees of $5.2 million and $3.0 million of inventory write-offs. Actions related to this initiative were completed by December 31, 2016 and substantially all of the cash payments were made by the end of 2017. These charges are included in the U.S. Branded Pharmaceuticals segment and are included in Asset impairment charges, Cost of revenues, and Selling, general and administrative expenses in the Consolidated Statements of Operations. The Company does not expect to incur any additional material pre-tax restructuring expenses related to this initiative.
The liability related to the 2016 U.S. Branded Pharmaceuticals Restructuring Initiative is included in Accounts payable and accrued expenses in the Consolidated Balance Sheets. Changes to this liability during the years ended December 31, 2017 and 2016 were as follows (in thousands):
Employee Separation and Other Benefit-Related Costs | Contract Termination Charges | Total | |||||||||
Liability balance as of January 1, 2016 | $ | — | $ | — | $ | — | |||||
Expenses | 16,544 | 5,224 | 21,768 | ||||||||
Cash distributions | — | — | — | ||||||||
Liability balance as of January 1, 2017 | $ | 16,544 | $ | 5,224 | $ | 21,768 | |||||
Cash distributions | (16,544 | ) | (5,224 | ) | (21,768 | ) | |||||
Liability balance as of December 31, 2017 | $ | — | $ | — | $ | — | |||||
January 2017 Restructuring Initiative
On January 26, 2017, the Company announced a restructuring initiative implemented as part of its ongoing organizational review (the January 2017 Restructuring Initiative). This restructuring is intended to further integrate, streamline and optimize the Company’s operations by aligning certain corporate and R&D functions with its recently restructured U.S. Generic Pharmaceuticals and U.S. Branded Pharmaceuticals business units in order to create efficiencies and cost savings. As part of this restructuring, the Company undertook certain cost reduction initiatives, including a reduction of approximately 90 positions of its workforce, primarily related to corporate and U.S. Branded Pharmaceuticals R&D functions in Malvern, PA and Chestnut Ridge, NY, a streamlining of general and administrative expenses, an optimization of commercial spend and a refocusing of research and development efforts.
As a result of the January 2017 Restructuring Initiative, the Company incurred total pre-tax charges of approximately $15.1 million during the year ended December 31, 2017 related to employee separation and other benefit-related costs. Of the total charges incurred, $6.9 million are included in the U.S. Branded Pharmaceuticals segment, $4.9 million are included in Corporate unallocated costs and $3.3 million are included in the U.S. Generic Pharmaceuticals segment for the year ended December 31, 2017, respectively. These charges are included in Selling, general and administrative expenses in the Consolidated Statements of Operations. The Company does not expect to incur additional material pre-tax restructuring-related expenses. Substantially all cash payments were made by the end of 2017 and substantially all of the actions associated with this restructuring were completed by the end of April 2017.
The liability related to the January 2017 Restructuring Initiative is included in Accounts payable and accrued expenses in the Consolidated Balance Sheets and is entirely related to employee separation and other benefit-related costs. Changes to this liability during the year ended December 31, 2017 were as follows (in thousands):
2017 | |||
Liability balance as of January 1, 2017 | $ | — | |
Expenses | 15,072 | ||
Cash distributions | (12,391 | ) | |
Liability balance as of December 31, 2017 | $ | 2,681 | |
F-25
2017 U.S. Generic Pharmaceuticals Restructuring Initiative
On July 21, 2017, the Company announced that after completing a comprehensive review of its manufacturing network, the Company will be ceasing operations and closing its manufacturing and distribution facilities in Huntsville, Alabama (the 2017 U.S. Generic Pharmaceuticals Restructuring Initiative). The closure of the facilities is expected to occur by the end of 2018.
As a result of the 2017 U.S. Generic Pharmaceuticals Restructuring Initiative, the Company’s workforce is expected to be reduced by approximately 815 employees and the Company expects total pre-tax charges related to this initiative to be approximately $345 million, including total estimated cash outlays of approximately $70 million, substantially all of which will be paid by the end of 2018. The estimated restructuring charges consist of accelerated depreciation charges of approximately $155 million, asset impairment charges related to identifiable intangible assets and certain property, plant and equipment of approximately $105 million, charges to increase excess inventory reserves of approximately $10 million, employee separation, retention and other benefit-related costs of approximately $40 million and certain other charges of approximately $35 million. Employee separation, retention and certain other employee benefit-related costs are expensed ratably over the requisite service period. Other costs including, but not limited to, contract termination fees and product technology transfer costs, will be expensed as incurred.
As a result of the 2017 U.S. Generic Pharmaceuticals Restructuring Initiative, the Company incurred pre-tax charges of $286.7 million during the year ended December 31, 2017. These expenses consisted of charges relating to accelerated depreciation of $123.3 million, employee separation, retention and other benefit-related costs of $29.6 million, charges to increase excess inventory reserves of $12.1 million, certain intangible asset and property, plant and equipment impairment charges of $104.7 million and certain other charges of $17.0 million.
These charges are included in the U.S. Generic Pharmaceuticals segment. Intangible asset and property, plant and equipment impairment charges are included in Asset impairment charges. Charges to increase excess inventory reserves are included in Cost of revenues. Employee separation, retention and other benefit-related costs are included in Cost of revenues. Certain other charges are included in both Cost of revenues and Selling, general and administrative expenses in the Consolidated Statements of Operations.
The liability related to the 2017 U.S. Generic Pharmaceuticals Restructuring Initiative is included in Accounts payable and accrued expenses in the Consolidated Balance Sheets. Changes to this liability during the year ended December 31, 2017 were as follows (in thousands):
Employee Separation and Other Benefit-Related Costs | Other Restructuring Costs | Total | |||||||||
Liability balance as of January 1, 2017 | $ | — | $ | — | $ | — | |||||
Expenses | 29,553 | 13,724 | 43,277 | ||||||||
Cash distributions | (6,578 | ) | (12,114 | ) | (18,692 | ) | |||||
Liability balance as of December 31, 2017 | $ | 22,975 | $ | 1,610 | $ | 24,585 | |||||
January 2018 Restructuring Initiative
In January 2018, the Company initiated a restructuring initiative that included a reorganization of its U.S. Generic Pharmaceuticals segment’s research and development network, a further simplification of the Company’s manufacturing networks and a company-wide unification of certain corporate functions (the January 2018 Restructuring Initiative).
As a result of the January 2018 Restructuring Initiative, the Company expects total related pre-tax charges of approximately $30 million, including total estimated cash outlays of approximately $25 million, substantially all of which will be paid by March 31, 2019. The estimated restructuring charges consist of employee separation, retention and other benefit-related costs of approximately $25 million and certain other charges of approximately $5 million. Employee separation, retention and certain other employee benefit-related costs are expensed ratably over the requisite service period. Other costs will be expensed as incurred.
As a result of the January 2018 Restructuring Initiative, the Company incurred pre-tax charges of $2.6 million during the year ended December 31, 2017. These expenses consisted of certain property, plant and equipment impairment charges of $2.0 million and certain other charges of $0.6 million. These charges are included in the U.S. Generic Pharmaceuticals segment. Impairment charges are included in Asset impairment charges in the Consolidated Statements of Operations. Certain other charges are included in Selling, general and administrative expenses in the Consolidated Statements of Operations.
F-26
NOTE 5. ACQUISITIONS
For each of the acquisitions described below, the estimates of the fair values of the net assets acquired have been finalized and all measurement period adjustments are complete.
Auxilium Pharmaceuticals, Inc.
On January 29, 2015 (the Auxilium Acquisition Date), the Company acquired all of the outstanding shares of common stock of Auxilium, a fully integrated specialty biopharmaceutical company in the men’s healthcare sector with a strategically focused product portfolio and pipeline in orthopedics, dermatology and other therapeutic areas, in a cash and stock transaction valued at $2.6 billion. The consideration included 18,609,835 ordinary shares valued at $1.52 billion.
The operating results of Auxilium are included in the accompanying Consolidated Statements of Operations for the years ended December 31, 2017 and 2016 and the operating results from the acquisition date of January 29, 2015 are included in the accompanying Consolidated Statements of Operations for the year ended December 31, 2015. The Consolidated Balance Sheets as of December 31, 2017 and 2016 reflect the acquisition of Auxilium. Our measurement period adjustments for Auxilium were complete as of December 31, 2015.
The Company recognized no acquisition-related transaction costs associated with the Auxilium acquisition during the years ended December 31, 2017 and 2016. The Company recognized acquisition-related transaction costs associated with the Auxilium acquisition during the year ended December 31, 2015 totaling $23.1 million. These costs, which related primarily to bank fees, legal and accounting services and fees for other professional services, are included in Acquisition-related and integration items in the accompanying Consolidated Statements of Operations.
The amounts of Auxilium Revenue and Net loss included in the Company’s Consolidated Statements of Operations from and including January 29, 2015 to December 31, 2015 are as follows (in thousands, except per share data):
Revenue | $ | 341,520 | |
Net loss attributable to Endo International plc (1) | $ | (469,986 | ) |
Basic and diluted net loss per share | $ | (2.38 | ) |
__________
(1) | Net loss attributable to Endo International plc does not include any portion of the goodwill impairment charges recorded during 2015 since it is not possible to distinguish the amount of the charges directly attributable to Auxilium. |
The following supplemental unaudited pro forma information presents the financial results as if the acquisition of Auxilium had occurred on January 1, 2015 for the year ended December 31, 2015. This supplemental pro forma information has been prepared for comparative purposes and does not purport to be indicative of what would have occurred had the acquisition been made on January 1, 2015, nor is it indicative of any future results.
2015 | |||
Unaudited pro forma consolidated results (in thousands, except per share data): | |||
Revenue | $ | 3,292,293 | |
Net loss attributable to Endo International plc | $ | (1,513,625 | ) |
Basic and diluted net loss per share | $ | (7.68 | ) |
These amounts have been calculated after applying the Company’s accounting policies and adjusting the results of Auxilium to reflect factually supportable adjustments that give effect to events that are directly attributable to the Auxilium acquisition assuming the Auxilium acquisition had occurred on January 1, 2015. These adjustments mainly include adjustments to interest expense and additional intangible amortization. The adjustments to interest expense, net of tax, related to borrowings to finance the acquisition increased the expense by $1.1 million for the year ended December 31, 2015. In addition, the adjustments include additional intangible amortization, net of tax, which would have been charged assuming the Company’s estimated fair value of the intangible assets. The adjustment to the amortization expense for the year ended December 31, 2015 increased the expense by $6.2 million.
Acquisition of Par Pharmaceutical Holdings, Inc.
On September 25, 2015 (Par Acquisition Date), the Company acquired Par Pharmaceutical Holdings, Inc., a specialty pharmaceutical company that develops, licenses, manufactures, markets and distributes innovative and cost-effective pharmaceuticals with a focus on high-barrier-to-entry products and first-to-file or first-to-market opportunities, for total consideration of $8.14 billion, including the assumption of Par debt. The consideration included 18,069,899 of the Company’s ordinary shares valued at $1.33 billion.
F-27
The operating results of Par are included in the accompanying Consolidated Statements of Operations for the years ended December 31, 2017 and 2016 and the operating results from the acquisition date of September 25, 2015 are included in the accompanying Consolidated Statements of Operations for the year ended December 31, 2015. The Consolidated Balance Sheets as of December 31, 2017 and 2016 reflect the acquisition of Par. Our measurement period adjustments for Par were complete as of September 30, 2016.
The Company recognized acquisition-related transaction costs associated with the Par acquisition during the year ended December 31, 2015 totaling $46.3 million. These costs, which related primarily to bank fees, legal and accounting services and fees for other professional services, are included in Acquisition-related and integration items in the accompanying Consolidated Statements of Operations.
The amounts of Par revenue and Net loss attributable to Endo International plc included in the Company’s Consolidated Statements of Operations for the year ended December 31, 2015 from and including September 25, 2015 to December 31, 2015 are as follows (in thousands, except per share data):
Revenue | $ | 401,238 | |
Net loss attributable to Endo International plc | $ | (4,348 | ) |
Basic and diluted net loss per share | $ | (0.02 | ) |
The following supplemental unaudited pro forma information presents the financial results as if the acquisition of Par had occurred on January 1, 2015 for the year ended December 31, 2015. This supplemental pro forma information has been prepared for comparative purposes and does not purport to be indicative of what would have occurred had the acquisition been made on January 1, 2015, nor is it indicative of any future results.
2015 | |||
Unaudited pro forma consolidated results (in thousands, except per share data): | |||
Revenue | $ | 4,268,110 | |
Net loss attributable to Endo International plc | $ | (1,594,130 | ) |
Basic and diluted net loss per share | $ | (8.09 | ) |
These amounts have been calculated after applying the Company’s accounting policies and adjusting the results of Par to reflect factually supportable adjustments that give effect to events that are directly attributable to the Par acquisition assuming the Par acquisition had occurred on January 1, 2015. These adjustments mainly include adjustments to interest expense and additional intangible amortization. The adjustments to interest expense, net of tax, related to borrowings to finance the acquisition increased the expense by $11.7 million for the year ended December 31, 2015. In addition, the adjustments include additional intangible amortization, net of tax, which would have been charged assuming the Company’s estimated fair value of the intangible assets. The adjustment to the amortization expense for the year ended December 31, 2015 increased the expense by $129.2 million.
Aspen Holdings
On October 1, 2015, the Company acquired a broad portfolio of branded and generic injectable and established products focused on pain, anti-infectives, cardiovascular and other specialty therapeutic areas from a subsidiary of Aspen Pharmacare Holdings Ltd, a leading publicly-traded South African company that supplies branded and generic products in more than 150 countries, and from GlaxoSmithKline plc (GSK) for total consideration of approximately $135.6 million. The Company accounted for this transaction as a business combination in accordance with the relevant accounting literature. The transaction expanded the Company’s presence in South Africa. These products were incorporated into our Litha business, which was subsequently sold in July 2017.
Until sold, the operating results of the Aspen Asset Acquisition were included in the accompanying Consolidated Statements of Operations for the years ended December 31, 2017 and 2016 and the operating results from the acquisition date of October 1, 2015 are included in the accompanying Consolidated Statements of Operations for the year ended December 31, 2015. Our measurement period adjustments for the Aspen Asset Acquisition were complete as of September 30, 2016.
Pro forma results of operations have not been presented because the effect of the Aspen Asset Acquisition was not material.
F-28
VOLTAREN® Gel
The Company had exclusive U.S. marketing rights to VOLTAREN® Gel through June 30, 2016 pursuant to a License and Supply Agreement entered into in 2008 with and among Novartis AG and Novartis Consumer Health, Inc. (the 2008 VOLTAREN® Gel Agreement). On December 11, 2015, the Company, Novartis AG and Sandoz Inc. entered into a new License and Supply Agreement (the 2015 VOLTAREN® Gel Agreement) whereby the Company licensed exclusive U.S. marketing and license rights to commercialize VOLTAREN® Gel and to launch an authorized generic of VOLTAREN® Gel effective July 1, 2016. Pursuant to the 2015 VOLTAREN® Gel Agreement, the former 2008 VOLTAREN® Gel Agreement expired on June 30, 2016 in accordance with its terms.
The Company accounted for this transaction as a business combination as of the effective date in accordance with the relevant accounting literature. The Company acquired the product for consideration of approximately $162.7 million, consisting of an upfront payment of $16.2 million and contingent cash consideration with an acquisition-date fair value of approximately $146 million, including the impact of a measurement period adjustment recorded during the fourth quarter of 2016. See Note 7. Fair Value Measurements for further discussion of this contingent consideration.
The preliminary fair values of the net identifiable assets acquired totaled approximately $162.7 million, resulting in no goodwill. The amount of net identifiable assets acquired in connection with the VOLTAREN® Gel acquisition includes approximately $162.7 million of identifiable developed technology intangible assets to be amortized over an average life of approximately 7 years. Our measurement period adjustments for the acquisition of VOLTAREN® Gel were complete as of December 31, 2016.
The operating results of VOLTAREN® Gel under business combination accounting are included in the accompanying Consolidated Statements of Operations for the year ended December 31, 2017 and for the six months ended December 31, 2016. The results included in the accompanying Consolidated Statements of Operations for the year ended December 31, 2015 and for the six months ended June 30, 2016, were accounted for under the previous license and supply agreement, which was not treated as a business combination.
Pro forma results of operations have not been presented because the effect of the 2015 VOLTAREN® Gel Agreement was not material.
NOTE 6. SEGMENT RESULTS
As of December 31, 2017, the three reportable business segments in which the Company operates are: (1) U.S. Generic Pharmaceuticals, (2) U.S. Branded Pharmaceuticals and (3) International Pharmaceuticals. These segments reflect the level at which the chief operating decision maker regularly reviews financial information to assess performance and to make decisions about resources to be allocated. Each segment derives revenue from the sales or licensing of its respective products and is discussed in more detail below.
We evaluate segment performance based on each segment’s adjusted income from continuing operations before income tax, which we define as Loss from continuing operations before income tax and before certain upfront and milestone payments to partners; acquisition-related and integration items, including transaction costs, earn-out payments or adjustments, changes in the fair value of contingent consideration and bridge financing costs; cost reduction and integration-related initiatives such as separation benefits, retention payments, other exit costs and certain costs associated with integrating an acquired company’s operations; excess costs that will be eliminated pursuant to integration plans; asset impairment charges; amortization of intangible assets; inventory step-up recorded as part of our acquisitions; certain non-cash interest expense; litigation-related and other contingent matters; gains or losses from early termination of debt; foreign currency gains or losses on intercompany financing arrangements; and certain other items.
Certain of the corporate general and administrative expenses incurred by the Company are not attributable to any specific segment. Accordingly, these costs are not allocated to any of the Company’s segments and are included in the results below as “Corporate unallocated costs.” Interest income and expense are also considered corporate items and not allocated to any of the Company’s segments. The Company’s consolidated adjusted income from continuing operations before income tax is equal to the combined results of each of its segments less these unallocated corporate items.
U.S. Generic Pharmaceuticals
Our U.S. Generic Pharmaceuticals segment focuses on high-barrier-to-entry products, including first-to-file or first-to-market opportunities that are difficult to formulate or manufacture or face complex legal and regulatory challenges. The product offerings of this segment consist of a differentiated product portfolio including solid oral extended-release, solid oral immediate-release, abuse-deterrent products, liquids, semi-solids, patches, powders, ophthalmics, sprays and sterile injectables and include products in the pain management, urology, central nervous system disorders, immunosuppression, oncology, women’s health and cardiovascular disease markets, among others.
F-29
U.S. Branded Pharmaceuticals
Our U.S. Branded Pharmaceuticals segment includes a variety of branded prescription products to treat and manage conditions in urology, urologic oncology, endocrinology, pain and orthopedics. The products that are included in this segment include XIAFLEX®, SUPPRELIN® LA, TESTOPEL®, NASCOBAL® Nasal Spray, AVEED®, OPANA® ER, PERCOCET®, VOLTAREN® Gel, LIDODERM®, TESTIM® and FORTESTA® Gel, among others.
International Pharmaceuticals
Our International Pharmaceuticals segment includes a variety of specialty pharmaceutical products sold outside the U.S., primarily in Canada through our operating company Paladin Labs Inc. (Paladin). This segment’s key products serve growing therapeutic areas, including attention deficit hyperactivity disorder (ADHD), pain, women’s health and oncology. This segment also included: (i) our South African business, which was sold in July 2017 and consisted of Litha Healthcare Group Limited and certain assets acquired from Aspen Holdings in October 2015 and (ii) our Latin American business consisting of Grupo Farmacéutico Somar, S.A.P.I. de C.V. (Somar), which was sold in October 2017.
The following represents selected information for the Company’s reportable segments for the years ended December 31, 2017, 2016 and 2015 (in thousands):
2017 | 2016 | 2015 | |||||||||
Net revenues to external customers: | |||||||||||
U.S. Generic Pharmaceuticals | $ | 2,281,001 | $ | 2,564,613 | $ | 1,672,416 | |||||
U.S. Branded Pharmaceuticals | 957,525 | 1,166,294 | 1,284,607 | ||||||||
International Pharmaceuticals (1) | 230,332 | 279,367 | 311,695 | ||||||||
Total net revenues to external customers | $ | 3,468,858 | $ | 4,010,274 | $ | 3,268,718 | |||||
Adjusted income from continuing operations before income tax: | |||||||||||
U.S. Generic Pharmaceuticals | $ | 1,064,352 | $ | 1,079,479 | $ | 741,767 | |||||
U.S. Branded Pharmaceuticals | 485,515 | 553,806 | 694,440 | ||||||||
International Pharmaceuticals | 58,308 | 84,337 | 81,789 | ||||||||
Total segment adjusted income from continuing operations before income tax | $ | 1,608,175 | $ | 1,717,622 | $ | 1,517,996 | |||||
__________
(1) | Revenues generated by our International Pharmaceuticals segment are primarily attributable to external customers located in Canada and, prior to the sale of Litha on July 3, 2017 and Somar on October 25, 2017, South Africa and Latin America. |
There were no material revenues from external customers attributed to an individual country outside of the United States during the years ended December 31, 2017, 2016 and 2015. There were no material tangible long-lived assets in an individual country other than the United States as of December 31, 2017 or December 31, 2016.
F-30
The table below provides reconciliations of our consolidated Loss from continuing operations before income tax, which is determined in accordance with U.S. GAAP, to our total segment adjusted income from continuing operations before income tax for the years ended December 31, 2017, 2016 and 2015 (in thousands):
2017 | 2016 | 2015 | |||||||||
Total consolidated loss from continuing operations before income tax | $ | (1,483,004 | ) | $ | (3,923,856 | ) | $ | (1,437,864 | ) | ||
Interest expense, net | 488,228 | 452,679 | 373,214 | ||||||||
Corporate unallocated costs (1) | 165,298 | 189,043 | 171,242 | ||||||||
Amortization of intangible assets | 773,766 | 876,451 | 561,302 | ||||||||
Inventory step-up and certain manufacturing costs that will be eliminated pursuant to integration plans | 390 | 125,699 | 249,464 | ||||||||
Upfront and milestone payments to partners | 9,483 | 8,330 | 16,155 | ||||||||
Separation benefits and other cost reduction initiatives (2) | 212,448 | 107,491 | 125,407 | ||||||||
Impact of VOLTAREN® Gel generic competition | — | (7,750 | ) | — | |||||||
Acceleration of Auxilium employee equity awards at closing | — | — | 37,603 | ||||||||
Certain litigation-related and other contingencies, net (3) | 185,990 | 23,950 | 37,082 | ||||||||
Asset impairment charges (4) | 1,154,376 | 3,781,165 | 1,140,709 | ||||||||
Acquisition-related and integration items (5) | 58,086 | 87,601 | 105,250 | ||||||||
Loss on extinguishment of debt | 51,734 | — | 67,484 | ||||||||
Costs associated with unused financing commitments | — | — | 78,352 | ||||||||
Other-than-temporary impairment of equity investment | — | — | 18,869 | ||||||||
Foreign currency impact related to the remeasurement of intercompany debt instruments | (1,403 | ) | 366 | (25,121 | ) | ||||||
Other, net | (7,217 | ) | (3,547 | ) | (1,152 | ) | |||||
Total segment adjusted income from continuing operations before income tax | $ | 1,608,175 | $ | 1,717,622 | $ | 1,517,996 | |||||
__________
(1) | Amounts include certain corporate overhead costs, such as headcount and facility expenses and certain other income and expenses. |
(2) | Amounts primarily relate to employee separation costs of $53.0 million, $57.9 million and $60.2 million in 2017, 2016 and 2015, respectively. Other amounts in 2017 include accelerated depreciation of $123.7 million, charges to increase excess inventory reserves of $13.7 million and other charges of $22.0 million, each of which related primarily to the 2017 U.S. Generic Pharmaceuticals Restructuring Initiative. Other amounts in 2016 primarily consist of charges to increase excess inventory reserves of $24.5 million and other restructuring costs of $25.1 million, consisting primarily of contract termination fees and building costs. Other amounts in 2015 primarily consist of $41.2 million of inventory write-offs and $13.3 million of building costs, including a $7.9 million charge recorded upon the cease use date of our Auxilium subsidiary’s former corporate headquarters. See Note 4. Restructuring for discussion of our material restructuring initiatives. |
(3) | Amounts include adjustments for Litigation-related and other contingencies, net as further described in Note 14. Commitments and Contingencies. |
(4) | Amounts primarily relate to charges to impair goodwill and intangible assets as further described in Note 10. Goodwill and Other Intangibles as well as charges to write down certain property, plant and equipment as further described in Note 4. Restructuring, Note 7. Fair Value Measurements and Note 9. Property, Plant and Equipment. |
(5) | Amounts in 2017, 2016 and 2015 include costs directly associated with previous acquisitions of $8.1 million, $63.8 million and $170.9 million, respectively. In addition, in 2017 and 2016, there were charges due to changes in the fair value of contingent consideration of $49.9 million and $23.8 million, respectively. In 2015, there was a benefit due to changes in the fair value of contingent consideration of $65.6 million. |
The following represents additional selected financial information for our reportable segments for the years ended December 31, 2017, 2016 and 2015 (in thousands):
2017 | 2016 | 2015 | |||||||||
Depreciation expense: | |||||||||||
U.S. Generic Pharmaceuticals | $ | 183,063 | $ | 79,839 | $ | 29,193 | |||||
U.S. Branded Pharmaceuticals | 16,957 | 16,294 | 19,884 | ||||||||
International Pharmaceuticals | 3,332 | 2,557 | 3,147 | ||||||||
Corporate unallocated | 6,647 | 8,168 | 7,674 | ||||||||
Total depreciation expense | $ | 209,999 | $ | 106,858 | $ | 59,898 | |||||
F-31
2017 | 2016 | 2015 | |||||||||
Amortization expense: | |||||||||||
U.S. Generic Pharmaceuticals | $ | 505,152 | $ | 554,581 | $ | 223,367 | |||||
U.S. Branded Pharmaceuticals | 239,512 | 261,235 | 280,954 | ||||||||
International Pharmaceuticals | 29,102 | 60,635 | 56,981 | ||||||||
Total amortization expense | $ | 773,766 | $ | 876,451 | $ | 561,302 | |||||
Asset information is not reviewed or included within our internal management reporting. Therefore, the Company has not disclosed asset information for each reportable segment.
NOTE 7. FAIR VALUE MEASUREMENTS
Financial Instruments
The financial instruments recorded in our Consolidated Balance Sheets include cash and cash equivalents (including money market funds and time deposits), restricted cash and cash equivalents, accounts receivable, marketable securities, equity and cost method investments, accounts payable and accrued expenses, acquisition-related contingent consideration and debt obligations. Included in cash and cash equivalents and restricted cash and cash equivalents are money market funds representing a type of mutual fund required by law to invest in low-risk securities (for example, U.S. government bonds, U.S. Treasury Bills and commercial paper). Money market funds pay dividends that generally reflect short-term interest rates. Due to their short-term maturity, the carrying amounts of non-restricted and restricted cash and cash equivalents (including money market funds and time deposits), accounts receivable, accounts payable and accrued expenses approximate their fair values.
At December 31, 2017 and 2016, the Company had combined restricted cash and cash equivalents of $324.4 million and $287.9 million, respectively, of which $320.5 million and $282.1 million, respectively, are classified as current assets and reported in our Consolidated Balance Sheets as Restricted cash and cash equivalents. The remaining amounts, which are classified as non-current assets, are reported in our Consolidated Balance Sheets as Other assets. Approximately $313.8 million and $276.0 million of our restricted cash and cash equivalents are held in QSFs for mesh-related matters at December 31, 2017 and 2016, respectively. See Note 14. Commitments and Contingencies for further information relating to the vaginal mesh liability.
Fair value guidance establishes a three-tier fair value hierarchy, which prioritizes the inputs used in measuring fair value. These tiers include:
• | Level 1—Quoted prices in active markets for identical assets or liabilities. |
• | Level 2—Inputs other than Level 1 that are observable, either directly or indirectly, such as quoted prices for similar assets or liabilities; quoted prices in markets that are not active; or other inputs that are observable or can be corroborated by observable market data for substantially the full term of the assets or liabilities. |
• | Level 3—Unobservable inputs that are supported by little or no market activity and that are significant to the fair value of the assets or liabilities. |
Marketable Securities
Equity securities consist of investments in the stock of publicly traded companies, the values of which are based on quoted market prices and thus represent Level 1 measurements within the above-defined fair value hierarchy. These securities are not held to support current operations and are therefore classified as non-current assets. Equity securities are included in Marketable securities in our Consolidated Balance Sheets at December 31, 2017 and December 31, 2016.
At the time of purchase, we classify our marketable securities as either available-for-sale securities or trading securities, depending on our intent at that time. Available-for-sale and trading securities are carried at fair value with unrealized holding gains and losses recorded within other comprehensive income or net income, respectively. The Company reviews any unrealized losses associated with available-for-sale securities to determine the classification as a “temporary” or “other-than-temporary” impairment. A temporary impairment results in an unrealized loss being recorded in other comprehensive income. An impairment that is viewed as other-than-temporary is recognized in net income. The Company considers various factors in determining the classification, including the length of time and extent to which the fair value has been less than the Company’s cost basis, the financial condition and near-term prospects of the issuer or investee, and the Company’s ability to hold the investment for a period of time sufficient to allow for any anticipated recovery in market value.
F-32
Acquisition-Related Contingent Consideration
The fair value of contingent consideration liabilities is determined using unobservable inputs; hence these instruments represent Level 3 measurements within the above-defined fair value hierarchy. These inputs include the estimated amount and timing of projected cash flows, the probability of success (achievement of the contingent event) and the risk-adjusted discount rate used to present value the probability-weighted cash flows. Subsequent to the acquisition date, at each reporting period, the contingent consideration liability is remeasured at current fair value with changes recorded in earnings. Changes in any of the inputs may result in a significant adjustment to fair value. See Recurring Fair Value Measurements below for additional information on acquisition-related contingent consideration.
Recurring Fair Value Measurements
The Company’s financial assets and liabilities measured at fair value on a recurring basis at December 31, 2017 and December 31, 2016 were as follows (in thousands):
Fair Value Measurements at Reporting Date using: | |||||||||||||||
December 31, 2017 | Quoted Prices in Active Markets for Identical Assets (Level 1) | Significant Other Observable Inputs (Level 2) | Significant Unobservable Inputs (Level 3) | Total | |||||||||||
Assets: | |||||||||||||||
Money market funds | $ | 439,831 | $ | — | $ | — | $ | 439,831 | |||||||
Time deposits | — | 303,410 | — | 303,410 | |||||||||||
Equity securities | 1,456 | — | — | 1,456 | |||||||||||
Total | $ | 441,287 | $ | 303,410 | $ | — | $ | 744,697 | |||||||
Liabilities: | |||||||||||||||
Acquisition-related contingent consideration—short-term | $ | — | $ | — | $ | 70,543 | $ | 70,543 | |||||||
Acquisition-related contingent consideration—long-term | — | — | 119,899 | 119,899 | |||||||||||
Total | $ | — | $ | — | $ | 190,442 | $ | 190,442 | |||||||
Fair Value Measurements at Reporting Date using: | |||||||||||||||
December 31, 2016 | Quoted Prices in Active Markets for Identical Assets (Level 1) | Significant Other Observable Inputs (Level 2) | Significant Unobservable Inputs (Level 3) | Total | |||||||||||
Assets: | |||||||||||||||
Money market funds | $ | 26,210 | $ | — | $ | — | $ | 26,210 | |||||||
Time deposits | — | 100,000 | — | 100,000 | |||||||||||
Equity securities | 2,267 | — | — | 2,267 | |||||||||||
Total | $ | 28,477 | $ | 100,000 | $ | — | $ | 128,477 | |||||||
Liabilities: | |||||||||||||||
Acquisition-related contingent consideration—short-term | $ | — | $ | — | $ | 109,373 | $ | 109,373 | |||||||
Acquisition-related contingent consideration—long-term | — | — | 152,740 | 152,740 | |||||||||||
Total | $ | — | $ | — | $ | 262,113 | $ | 262,113 | |||||||
At December 31, 2017 and December 31, 2016, money market funds include $35.6 million and $26.2 million, respectively, in QSFs to be disbursed to mesh-related or other product liability claimants. Amounts in QSFs are considered restricted cash equivalents. See Note 14. Commitments and Contingencies for further discussion of our product liability cases. Our money market funds and equity securities are considered available-for-sale securities. The differences between the amortized cost and fair value of such securities were not material, individually or in the aggregate, at December 31, 2017 or December 31, 2016, nor were any of the related gross unrealized gains or losses.
F-33
Fair Value Measurements Using Significant Unobservable Inputs
The following table presents changes to the Company’s liability for acquisition-related contingent consideration, which was measured at fair value on a recurring basis using significant unobservable inputs (Level 3) for the years ended December 31, 2017 and 2016 (in thousands):
2017 | 2016 | ||||||
Beginning of period | $ | 262,113 | $ | 143,502 | |||
Amounts acquired | — | 146,866 | |||||
Amounts settled | (122,559 | ) | (55,896 | ) | |||
Measurement period adjustments | — | 3,700 | |||||
Changes in fair value recorded in earnings | 49,949 | 23,823 | |||||
Effect of currency translation | 939 | 118 | |||||
End of period | $ | 190,442 | $ | 262,113 | |||
At December 31, 2017, the fair value measurements of the contingent consideration obligations were determined using risk-adjusted discount rates ranging from 10% to 22%. Changes in fair value recorded in earnings related to acquisition-related contingent consideration are included in our Consolidated Statements of Operations as Acquisition-related and integration items, and amounts recorded for the short-term and long-term portions of acquisition-related contingent consideration are included in Accounts payable and accrued expenses and Other liabilities, respectively, in our Consolidated Balance Sheets.
The following table presents changes to the Company’s liability for acquisition-related contingent consideration during the year ended December 31, 2017 by acquisition (in thousands):
Balance as of December 31, 2016 | Acquisitions | Fair Value Adjustments and Accretion | Payments and Other | Balance as of December 31, 2017 | |||||||||||||||
Auxilium acquisition | $ | 21,097 | $ | — | $ | 467 | $ | (8,503 | ) | $ | 13,061 | ||||||||
Lehigh Valley Technologies, Inc. acquisitions | 96,000 | — | 40,016 | (73,015 | ) | 63,001 | |||||||||||||
VOLTAREN® Gel acquisition | 118,395 | — | 18,586 | (38,857 | ) | 98,124 | |||||||||||||
Other | 26,621 | — | (9,120 | ) | (1,245 | ) | 16,256 | ||||||||||||
Total | $ | 262,113 | $ | — | $ | 49,949 | $ | (121,620 | ) | $ | 190,442 | ||||||||
The following table presents changes to the Company’s liability for acquisition-related contingent consideration during the year ended December 31, 2016 by acquisition (in thousands):
Balance as of December 31, 2015 | Acquisitions | Fair Value Adjustments and Accretion | Payments and Other | Balance as of December 31, 2016 | |||||||||||||||
Qualitest acquisition | $ | 1,137 | $ | — | $ | (1,137 | ) | $ | — | $ | — | ||||||||
Sumavel acquisition | 631 | — | (631 | ) | — | — | |||||||||||||
Auxilium acquisition | 26,435 | — | 8,952 | (14,290 | ) | 21,097 | |||||||||||||
Lehigh Valley Technologies, Inc. acquisitions | 97,003 | — | 30,676 | (31,679 | ) | 96,000 | |||||||||||||
VOLTAREN® Gel acquisition | — | 146,055 | (18,807 | ) | (8,853 | ) | 118,395 | ||||||||||||
Other | 18,296 | 4,511 | 4,770 | (956 | ) | 26,621 | |||||||||||||
Total | $ | 143,502 | $ | 150,566 | $ | 23,823 | $ | (55,778 | ) | $ | 262,113 | ||||||||
F-34
Nonrecurring Fair Value Measurements
The Company’s financial assets and liabilities measured at fair value on a nonrecurring basis during the year ended December 31, 2017 were as follows (in thousands):
Fair Value Measurements at Reporting Date using: | Total Expense for the Year Ended December 31, 2017 | ||||||||||||||
Quoted Prices in Active Markets for Identical Assets (Level 1) | Significant Other Observable Inputs (Level 2) | Significant Unobservable Inputs (Level 3) | |||||||||||||
Assets: | |||||||||||||||
Certain U.S. Branded Pharmaceuticals intangible assets (Note 10) | $ | — | $ | — | $ | 34,326 | $ | (76,674 | ) | ||||||
Certain U.S. Generic Pharmaceuticals intangible assets (Note 10) | — | — | 367,160 | (577,923 | ) | ||||||||||
Certain International Pharmaceuticals intangible assets (Note 10) | — | — | 21,772 | (145,360 | ) | ||||||||||
Certain property, plant and equipment (1) | — | — | — | (65,676 | ) | ||||||||||
Total | $ | — | $ | — | $ | 423,258 | $ | (865,633 | ) | ||||||
__________
(1) | Amounts relate primarily to an aggregate charge of $47.2 million recorded in connection with the 2017 U.S. Generic Pharmaceuticals Restructuring Initiative, which is described further in Note 4. Restructuring, and $11.9 million recorded following the initiation of held-for-sale accounting resulting from the Company’s June 30, 2017 definitive agreement to sell Somar, which is described in Note 3. Discontinued Operations and Assets and Liabilities Held for Sale. |
Additionally, the Company recorded aggregate goodwill impairment charges during the year ended December 31, 2017 of $288.7 million. Refer to Note 10. Goodwill and Other Intangibles for further description of the impairment charges taken, including the valuation methodologies utilized.
The Company’s financial assets and liabilities measured at fair value on a nonrecurring basis during the year ended December 31, 2016 were as follows (in thousands):
Fair Value Measurements at Measurement Date using: | Total Expense for the Year Ended December 31, 2016 | ||||||||||||||
Quoted Prices in Active Markets for Identical Assets (Level 1) | Significant Other Observable Inputs (Level 2) | Significant Unobservable Inputs (Level 3) | |||||||||||||
Assets: | |||||||||||||||
Certain Astora property, plant and equipment (Note 3) | $ | — | $ | — | $ | — | $ | (5,041 | ) | ||||||
Certain U.S. Generic Pharmaceuticals property, plant and equipment | — | — | 11,360 | (13,679 | ) | ||||||||||
Certain U.S. Branded Pharmaceuticals intangible assets (Note 10) | — | — | 4,621 | (110,430 | ) | ||||||||||
Certain U.S. Generic Pharmaceuticals intangible assets (Note 10) | — | — | 872,474 | (676,776 | ) | ||||||||||
Certain International Pharmaceuticals intangible assets (Note 10) | — | — | 139,313 | (301,698 | ) | ||||||||||
Certain Astora intangible assets (Note 3) | — | — | — | (16,287 | ) | ||||||||||
Generics reporting unit goodwill (Note 10) | — | — | 3,531,301 | (2,342,549 | ) | ||||||||||
Paladin reporting unit goodwill (Note 10) | — | — | 170,572 | (272,578 | ) | ||||||||||
Somar reporting unit goodwill (Note 10) | — | — | 24,044 | (33,000 | ) | ||||||||||
Litha reporting unit goodwill (Note 10) | — | — | — | (26,343 | ) | ||||||||||
Other asset impairment charges | — | — | — | (4,112 | ) | ||||||||||
Total | $ | — | $ | — | $ | 4,753,685 | $ | (3,802,493 | ) | ||||||
NOTE 8. INVENTORIES
Inventories consist of the following at December 31, 2017 and December 31, 2016 (in thousands):
December 31, 2017 | December 31, 2016 | ||||||
Raw materials (1) | $ | 124,685 | $ | 175,240 | |||
Work-in-process (1) | 109,897 | 100,494 | |||||
Finished goods (1) | 156,855 | 279,937 | |||||
Total | $ | 391,437 | $ | 555,671 | |||
__________
(1) The components of inventory shown in the table above are net of allowance for obsolescence.
F-35
Inventory that is in excess of the amount expected to be sold within one year, which relates primarily to XIAFLEX® inventory, is classified as long-term inventory and is not included in the table above. At December 31, 2017 and December 31, 2016, $17.1 million and $22.9 million, respectively, of long-term inventory was included in Other assets in the Consolidated Balance Sheets. As of December 31, 2017 and December 31, 2016, the Company’s Consolidated Balance Sheets included approximately $5.9 million and $16.8 million, respectively, of capitalized pre-launch inventories related to generic products that were not yet available to be sold.
NOTE 9. PROPERTY, PLANT AND EQUIPMENT
Changes in the amount of Property, plant and equipment for the year ended December 31, 2017 are set forth in the table below (in thousands). This table excludes changes related to businesses classified as held for sale, to the extent such changes occurred after the business was classified as held for sale.
Cost: | Land and Buildings | Machinery and Equipment | Leasehold Improve- ments | Computer Equipment and Software | Assets under Capital Lease | Furniture and Fixtures | Assets under Construc- tion | Total | |||||||||||||||||||||||
At January 1, 2017 | $ | 322,537 | $ | 227,833 | $ | 50,359 | $ | 118,928 | $ | 9,155 | $ | 21,086 | $ | 129,102 | $ | 879,000 | |||||||||||||||
Additions | 19,871 | 49,088 | 11,067 | 21,626 | — | 684 | 26,043 | 128,379 | |||||||||||||||||||||||
Disposals, transfers, impairments and other | (12,333 | ) | (9,939 | ) | (1,271 | ) | (9,459 | ) | (4,259 | ) | (8,770 | ) | (36,186 | ) | (82,217 | ) | |||||||||||||||
Effect of currency translation | 1,391 | 836 | 309 | 356 | — | 124 | 76 | 3,092 | |||||||||||||||||||||||
At December 31, 2017 | $ | 331,466 | $ | 267,818 | $ | 60,464 | $ | 131,451 | $ | 4,896 | $ | 13,124 | $ | 119,035 | $ | 928,254 | |||||||||||||||
Accumulated Depreciation: | |||||||||||||||||||||||||||||||
At January 1, 2017 | $ | (50,770 | ) | $ | (64,319 | ) | $ | (21,263 | ) | $ | (62,836 | ) | $ | (5,773 | ) | $ | (4,443 | ) | $ | — | $ | (209,404 | ) | ||||||||
Additions | (93,633 | ) | (76,986 | ) | (6,607 | ) | (27,121 | ) | (2,645 | ) | (3,007 | ) | — | (209,999 | ) | ||||||||||||||||
Disposals, transfers and other | (4,656 | ) | 6,964 | 1,088 | 7,354 | 4,257 | 1,201 | — | 16,208 | ||||||||||||||||||||||
Effect of currency translation | (343 | ) | (400 | ) | (85 | ) | (189 | ) | — | (71 | ) | — | (1,088 | ) | |||||||||||||||||
At December 31, 2017 | $ | (149,402 | ) | $ | (134,741 | ) | $ | (26,867 | ) | $ | (82,792 | ) | $ | (4,161 | ) | $ | (6,320 | ) | $ | — | $ | (404,283 | ) | ||||||||
Net Book Amount: | |||||||||||||||||||||||||||||||
At December 31, 2017 | $ | 182,064 | $ | 133,077 | $ | 33,597 | $ | 48,659 | $ | 735 | $ | 6,804 | $ | 119,035 | $ | 523,971 | |||||||||||||||
At December 31, 2016 | $ | 271,767 | $ | 163,514 | $ | 29,096 | $ | 56,092 | $ | 3,382 | $ | 16,643 | $ | 129,102 | $ | 669,596 | |||||||||||||||
Depreciation expense, including expense related to assets under capital lease, was $210.0 million, $106.9 million and $59.9 million for the years ended December 31, 2017, 2016 and 2015, respectively.
During the years ended December 31, 2017, 2016 and 2015, the Company recorded impairment charges totaling $65.7 million, $15.9 million and $10.8 million, respectively, which amounts exclude $5.0 million in 2016 related to AMS, which was classified as a discontinued operation. Impairment charges in 2017 primarily relate to an aggregate charge of $47.2 million recorded in connection with the 2017 U.S. Generic Pharmaceuticals Restructuring Initiative, which is described further in Note 4. Restructuring, and $11.9 million recorded following the initiation of held-for-sale accounting resulting from the Company’s June 30, 2017 definitive agreement to sell Somar, which is described in Note 3. Discontinued Operations and Assets and Liabilities Held for Sale. In 2016 and 2015, impairment charges reflect the write off of certain property, plant and equipment amounts that were abandoned or sold as part of our ongoing efforts to improve our operating efficiency and consolidate certain locations, including our generics manufacturing and research and development operations. These charges are included in the Asset impairment charges line item in our Consolidated Statement of Operations.
F-36
NOTE 10. GOODWILL AND OTHER INTANGIBLES
Goodwill
Changes in the carrying amount of our goodwill for the years ended December 31, 2017 and 2016 were as follows (in thousands):
Carrying Amount | |||||||||||||||
U.S. Generic Pharmaceuticals | U.S. Branded Pharmaceuticals | International Pharmaceuticals | Total | ||||||||||||
Goodwill as of December 31, 2015 | $ | 5,789,934 | $ | 1,002,776 | $ | 506,644 | $ | 7,299,354 | |||||||
Measurement period adjustments | 83,916 | 8,352 | 1,366 | 93,634 | |||||||||||
Effect of currency translation on gross balance | — | — | 3,336 | 3,336 | |||||||||||
Effect of currency translation on accumulated impairment | — | — | 9,421 | 9,421 | |||||||||||
Goodwill impairment charges | (2,342,549 | ) | (1,880 | ) | (331,921 | ) | (2,676,350 | ) | |||||||
Goodwill as of December 31, 2016 | $ | 3,531,301 | $ | 1,009,248 | $ | 188,846 | $ | 4,729,395 | |||||||
Effect of currency translation on gross balance | — | — | 40,454 | 40,454 | |||||||||||
Effect of currency translation on accumulated impairment | — | — | (31,023 | ) | (31,023 | ) | |||||||||
Goodwill impairment charges | — | (180,430 | ) | (108,314 | ) | (288,744 | ) | ||||||||
Goodwill as of December 31, 2017 | $ | 3,531,301 | $ | 828,818 | $ | 89,963 | $ | 4,450,082 | |||||||
The carrying amounts of goodwill at December 31, 2017 and December 31, 2016 are net of the following accumulated impairments:
Accumulated Impairment | |||||||||||||||
U.S. Generic Pharmaceuticals | U.S. Branded Pharmaceuticals | International Pharmaceuticals | Total | ||||||||||||
Accumulated impairment losses as of December 31, 2016 | $ | 2,342,549 | $ | 675,380 | $ | 408,280 | $ | 3,426,209 | |||||||
Accumulated impairment losses as of December 31, 2017 (1) | $ | 2,342,549 | $ | 855,810 | $ | 463,545 | $ | 3,661,904 | |||||||
__________
(1) | During the year ended December 31, 2017, we sold our Litha and Somar businesses. Accordingly, we removed $84.1 million of accumulated impairments from the International Pharmaceuticals segment. |
F-37
Other Intangible Assets
Changes in the amount of other intangible assets for the year ended December 31, 2017 are set forth in the table below (in thousands). This table excludes changes related to businesses classified as held for sale, to the extent such changes occurred after the business was classified as held for sale. As such, this table excludes asset impairment charges of $9.6 million related to our Litha business, assets derecognized upon the divestitures of Litha, Somar and BELBUCA™ with a combined carrying amount of $26.4 million and net increases resulting from currency translation of $1.5 million related to our Litha and Somar businesses.
Cost basis: | Balance as of December 31, 2016 | Acquisitions | Impairments (1) | Other (1) (2) | Effect of Currency Translation (1) | Balance as of December 31, 2017 | |||||||||||||||||
Indefinite-lived intangibles: | |||||||||||||||||||||||
In-process research and development | $ | 1,123,581 | $ | — | $ | (334,490 | ) | $ | (442,100 | ) | $ | 209 | $ | 347,200 | |||||||||
Total indefinite-lived intangibles | $ | 1,123,581 | $ | — | $ | (334,490 | ) | $ | (442,100 | ) | $ | 209 | $ | 347,200 | |||||||||
Finite-lived intangibles: | |||||||||||||||||||||||
Licenses (weighted average life of 12 years) | $ | 465,720 | $ | — | $ | (8,178 | ) | $ | (140 | ) | $ | — | $ | 457,402 | |||||||||
Tradenames | 7,345 | — | (808 | ) | (262 | ) | 134 | 6,409 | |||||||||||||||
Developed technology (weighted average life of 11 years) | 6,223,004 | — | (446,835 | ) | 378,811 | 32,784 | 6,187,764 | ||||||||||||||||
Total finite-lived intangibles (weighted average life of 11 years) | $ | 6,696,069 | $ | — | $ | (455,821 | ) | $ | 378,409 | $ | 32,918 | $ | 6,651,575 | ||||||||||
Total other intangibles | $ | 7,819,650 | $ | — | $ | (790,311 | ) | $ | (63,691 | ) | $ | 33,127 | $ | 6,998,775 | |||||||||
Accumulated amortization: | Balance as of December 31, 2016 | Amortization | Impairments | Other (2) | Effect of Currency Translation | Balance as of December 31, 2017 | |||||||||||||||||
Finite-lived intangibles: | |||||||||||||||||||||||
Licenses | $ | (341,600 | ) | $ | (28,761 | ) | $ | — | $ | 140 | $ | — | $ | (370,221 | ) | ||||||||
Tradenames | (6,599 | ) | (42 | ) | — | 262 | (30 | ) | (6,409 | ) | |||||||||||||
Developed technology | (1,612,154 | ) | (744,963 | ) | — | 63,289 | (10,633 | ) | (2,304,461 | ) | |||||||||||||
Total other intangibles | $ | (1,960,353 | ) | $ | (773,766 | ) | $ | — | $ | 63,691 | $ | (10,663 | ) | $ | (2,681,091 | ) | |||||||
Net other intangibles | $ | 5,859,297 | $ | 4,317,684 | |||||||||||||||||||
__________
(1) | Additional information on the changes in the total gross carrying amount of our other intangible assets is presented below (in thousands): |
Gross Carrying Amount | |||
December 31, 2016 | $ | 7,819,650 | |
Impairment of certain U.S. Branded Pharmaceuticals intangible assets | (76,674 | ) | |
Impairment of certain U.S. Generic Pharmaceuticals intangible assets | (577,923 | ) | |
Impairment of certain International Pharmaceuticals intangible assets | (135,714 | ) | |
Transfer of intangible assets to Assets held for sale (NOTE 3) | (33,304 | ) | |
Removal of certain fully amortized intangible assets | (30,387 | ) | |
Effect of currency translation | 33,127 | ||
December 31, 2017 | $ | 6,998,775 | |
(2) | Includes reclassification adjustments of $442.1 million for certain developed technology intangible assets, previously classified as in-process research and development, that were placed in service during the year ended December 31, 2017, the removal of certain fully amortized intangible assets and the transfer of Somar intangible assets to Assets held for sale. |
F-38
Amortization expense for the years ended December 31, 2017, 2016 and 2015 totaled $773.8 million, $876.5 million, and $561.3 million respectively. Amortization expense is included in Cost of revenues in the Consolidated Statements of Operations. Estimated amortization of intangibles for the five fiscal years subsequent to December 31, 2017 is as follows (in thousands):
2018 | $ | 598,603 | |
2019 | $ | 506,857 | |
2020 | $ | 469,339 | |
2021 | $ | 450,854 | |
2022 | $ | 436,811 | |
Impairments
Endo tests goodwill and indefinite-lived intangible assets for impairment annually, or more frequently whenever events or changes in circumstances indicate that the asset might be impaired. Our annual assessment is performed as of October 1st.
As part of our goodwill and intangible asset impairment assessments, we estimate the fair values of our reporting units and our intangible assets using an income approach that utilizes a discounted cash flow model, or, where appropriate, a market approach. The discounted cash flow models are dependent upon our estimates of future cash flows and other factors. These estimates of future cash flows involve assumptions concerning (i) future operating performance, including future sales, long-term growth rates, operating margins, variations in the amount and timing of cash flows and the probability of achieving the estimated cash flows and (ii) future economic conditions. These assumptions are based on significant inputs not observable in the market and thus represent Level 3 measurements within the fair value hierarchy. The discount rates applied to the estimated cash flows for the Company’s October 1, 2017, 2016 and 2015 annual goodwill and indefinite-lived intangible assets impairment test ranged from 9.5% to 12.5%, 8.5% to 11.0% and from 9.0% to 16.0%, respectively, depending on the overall risk associated with the particular assets and other market factors. We believe the discount rates and other inputs and assumptions are consistent with those that a market participant would use. Any impairment charges resulting from annual or interim goodwill and intangible asset impairment assessments are recorded to Asset impairment charges in our Consolidated Statements of Operations.
A summary of significant goodwill and other intangible asset impairment charges by reportable segment for the years ended December 31, 2017, 2016 and 2015 is included below.
As a result of our annual test performed as of October 1, 2017, the Company determined that the estimated fair values of its Branded, Generics and International reporting units exceeded their carrying amounts; therefore, a goodwill impairment charge was not required for the three months ended December 31, 2017.
Certain of our 2016 impairment charges discussed below related to our 2016 annual goodwill impairment test. After performing this test, we concluded that the carrying amounts of our Generics, Paladin, Somar and Litha reporting units each exceeded their respective estimated fair values and recorded goodwill impairment charges of $2,342.5 million, $272.6 million, $33.0 million and $26.3 million, respectively. The impairments were a result of a combination of factors, including increased buying power from the continued consolidation of our generic business customer base, a significant change in the value derived from the level and frequency of anticipated future pricing opportunities and increased levels of competition, particularly in our Generics reporting unit, due to the entry of new low cost competitors and accelerated FDA ANDA approvals. These factors were exacerbated by an increase in the risk factor included in the discount rate used to calculate the Generics discounted cash flows from the date of our last interim test. The increase in the discount rate was due to the implied control premium resulting from recent trading values of our stock. On a combined basis, these factors reduced the estimated fair value of our reporting units.
Additionally, our 2015 Paladin goodwill impairment charge discussed below related to our 2015 annual goodwill impairment test. After performing this test, we concluded that the carrying amount of our Paladin reporting unit exceeded its estimated fair values and recorded goodwill impairment charges of $85.8 million. The impairment was primarily due to the loss of exclusivity on certain products sold in Canada.
U.S. Generic Pharmaceuticals Segment
During each quarter of 2017, the Company identified certain market conditions impacting the recoverability of certain indefinite and finite-lived intangible assets in its U.S. Generic Pharmaceuticals segment. Accordingly, the Company tested these assets for impairment and determined that their carrying amounts were no longer fully recoverable, resulting in pre-tax, non-cash asset impairment charges totaling $72.7 million, $268.2 million, $54.2 million and $125.3 million during the three months ended March 31, 2017, June 30, 2017, September 30, 2017 and December 31, 2017, respectively. In addition, as further described in Note 4. Restructuring, we announced the 2017 U.S. Generic Pharmaceuticals Restructuring Initiative in July 2017, which includes the discontinuation of certain commercial products. As a result, we assessed the recoverability of the impacted products, resulting in 2017 pre-tax, non-cash intangible asset impairment charges of approximately $57.5 million.
F-39
During the three months ended March 31, 2016 and June 30, 2016, the Company identified certain market and regulatory conditions impacting the commercial potential of certain indefinite and finite-lived intangible assets in our U.S. Generic Pharmaceuticals segment. Accordingly, we tested these assets for impairment and determined that the carrying amounts of certain of these assets were no longer fully recoverable, resulting in pre-tax, non-cash asset impairment charges of $29.3 million and $40.0 million during the first and second quarters of 2016, respectively. In addition, during the first quarter of 2016, the Company recognized pre-tax, non-cash asset impairment charges of $100.3 million related to the 2016 U.S. Generic Pharmaceuticals Restructuring Initiative, which resulted from the discontinuation of certain commercial products and the abandonment of certain IPR&D projects. See Note 4. Restructuring for discussion of our material restructuring initiatives. During the fourth quarter of 2016, the Company recognized pre-tax, non-cash intangible asset impairment charges of $507.2 million in its U.S. Generic Pharmaceuticals segment resulting from certain market conditions, including price erosion and increased competition, impacting the commercial potential of finite and indefinite-lived intangible assets, including higher than expected erosion rates in the U.S. Generic Pharmaceuticals base business. Also during the fourth quarter of 2016, we recognized a pre-tax, non-cash goodwill asset impairment charge of $2,342.5 million. The goodwill impairment charge related to our 2016 annual test, as described above.
During the year ended December 31, 2015, we identified certain market conditions impacting the commercial potential of certain indefinite and finite-lived intangible assets in our U.S. Generic Pharmaceuticals segment. Accordingly, we tested these assets for impairment and determined that the carrying amounts of certain of these assets were no longer fully recoverable, resulting in 2015 pre-tax, non-cash intangible asset impairment charges of $181.0 million.
U.S. Branded Pharmaceuticals Segment
In March 2017, we announced that the Food and Drug Administration’s (FDA) Drug Safety and Risk Management and Anesthetic and Analgesic Drug Products Advisory Committees voted that the benefits of reformulated OPANA® ER (oxymorphone hydrochloride extended release) no longer outweigh its risks. In June 2017, we became aware of the FDA’s request that we voluntarily withdraw OPANA® ER from the market, and in July 2017, after careful consideration and consultation with the FDA, we decided to voluntarily remove OPANA® ER from the market. As a result of our decision, we determined that the carrying amount of our OPANA® ER intangible asset was no longer recoverable, resulting in a pre-tax, non-cash impairment charge of $20.6 million in the second quarter of 2017, representing the remaining carrying amount. In addition, during the second, third and fourth quarters of 2017, we identified certain market conditions impacting the recoverability of certain other finite-lived intangible assets in our U.S. Branded Pharmaceuticals segment. Accordingly, we tested these assets for impairment and determined that their carrying amounts were no longer fully recoverable, resulting in pre-tax, non-cash asset impairment charges totaling $31.5 million, $24.1 million and $0.5 million during the three months ended June 30, 2017, September 30, 2017 and December 31, 2017, respectively.
In addition, as a result of the actions taken with respect to OPANA® ER and the continued erosion of our U.S. Branded Pharmaceuticals segment’s Established Products portfolio, we initiated an interim goodwill impairment analysis of our Branded reporting unit during the second quarter of 2017. Based on the provisions of ASU 2017-04, which we adopted as of January 1, 2017, we recorded a pre-tax, non-cash goodwill impairment charge of $180.4 million during the three months ended June 30, 2017 for the amount by which the carrying amount exceeded the reporting unit’s fair value. We estimated the fair value of the Branded reporting unit using an income approach that utilizes a discounted cash flow model. The discount rate applied to the estimated cash flows for our Branded goodwill impairment test was 9.5%.
As a result of unfavorable formulary changes and generic competition for sumatriptan, we experienced a downturn in the performance of our SUMAVEL® DOSEPRO® product, a needle-free delivery system for sumatriptan acquired from Zogenix, Inc. in 2014. As a result of this underperformance, we concluded during the third quarter of 2016 that an impairment assessment was required to evaluate the recoverability of SUMAVEL® DOSEPRO®. After performing this assessment, we recorded a pre-tax, non-cash impairment charge of $72.8 million during the third quarter of 2016, representing the remaining carrying amount. During the fourth quarter of 2016, we recognized pre-tax, non-cash goodwill and intangible asset impairment charges of $1.9 million and $37.6 million, respectively, resulting primarily from the termination of our BELBUCA™ product and the return of this product to BDSI.
In 2015, a sustained downturn in the short-acting testosterone replacement therapy (TRT) market caused underperformance across several of our TRT products, including TESTIM® and NATESTO™. In addition, we also experienced underperformance with respect to STENDRA®. As a result of this underperformance and a re-alignment of investment priorities towards higher growth and higher value assets such as XIAFLEX®, we concluded during the third quarter of 2015 that an impairment assessment was required to evaluate the recoverability of certain finite-lived intangible assets associated with these products. After performing this assessment, we recorded a pre-tax, non-cash impairment charge of approximately $152.0 million during the third quarter of 2015, representing a full impairment of our Natesto™ intangible asset and a partial impairment of our TESTIM® and STENDRA® intangible assets. As a result of providing written notice to VIVUS Inc. on December 30, 2015 that we were terminating the STENDRA® License Agreement effective June 30, 2016, we recorded an additional pre-tax, non-cash impairment charge of approximately $9.5 million, representing the remaining carrying amount of our STENDRA® intangible asset. Additionally, during the fourth quarter of 2015, we determined that the fair value of certain U.S. Branded Pharmaceuticals IPR&D assets were less than their respective carrying amounts, and we recorded a pre-tax, non-cash impairment charge of $5.5 million representing the full carrying amount of the assets.
F-40
Given the results of our intangible asset assessment during the third quarter of 2015 for STENDRA® and certain TRT products, we initiated an interim goodwill impairment analysis of our Urology, Endocrinology and Oncology (UEO) reporting unit as of September 30, 2015. As a result of this interim analysis, we determined that the net book value of our UEO reporting unit exceeded its estimated fair value. We prepared this analysis on a preliminary basis to estimate the amount of a provisional impairment charge as of September 30, 2015, and determined that an impairment was probable and reasonably estimable. We performed the preliminary fair value assessments taking into consideration a number of factors, based upon the latest available information, including the preliminary results of a hypothetical purchase price allocation. As a result of the preliminary analysis, during the three months ended September 30, 2015, we recorded a provisional pre-tax, non-cash goodwill impairment charge of $680.0 million, representing the difference between the estimated implied fair value of the UEO reporting unit’s goodwill and its respective carrying amount. We completed our UEO goodwill impairment analysis during the fourth quarter of 2015 and reduced the provisional pre-tax, non-cash goodwill impairment charge by $6.5 million, resulting in a net 2015 charge of $673.5 million.
International Pharmaceuticals Segment
Pursuant to an existing agreement with a wholly owned subsidiary of Novartis AG (Novartis), Paladin licensed the Canadian rights to commercialize serelaxin, an investigational drug for the treatment of acute heart failure (AHF). In March 2017, Novartis announced that a Phase 3 study of serelaxin in patients with AHF failed to meet its primary endpoints. As a result, we concluded that the full carrying amount of our serelaxin IPR&D intangible asset was impaired, resulting in a $45.5 million pre-tax non-cash impairment charge for the three months ended March 31, 2017.
In addition and as a result of the serelaxin impairment discussed above, we assessed the recoverability of our Paladin goodwill balance and determined that the estimated fair value of the Paladin reporting unit was below its carrying amount. We recorded a pre-tax, non-cash asset impairment charge of $82.6 million during the three months ended March 31, 2017 for the amount by which the carrying amount exceeded the reporting unit’s fair value. We estimated the fair value of the Paladin reporting unit using an income approach that utilizes a discounted cash flow model. The discount rate applied to the estimated cash flows for our Paladin goodwill impairment test was 10.0%.
As further discussed in Note 3. Discontinued Operations and Assets and Liabilities Held for Sale, we entered into a definitive agreement to sell Somar on June 30, 2017, which resulted in Somar’s assets and liabilities being classified as held for sale. The initiation of held-for-sale accounting, together with the agreed upon sale price, triggered an impairment review. Accordingly, we performed an impairment analysis using a market approach and determined that impairment charges were required. We recorded 2017 pre-tax, non-cash impairment charges of $25.7 million and $89.5 million related to Somar’s goodwill and other intangible assets, respectively. The goodwill and other intangible asset impairment charges each represented the remaining carrying amounts of the corresponding assets.
As described above, as part of the 2016 annual goodwill impairment test, we recorded pre-tax, non-cash goodwill impairment charges related to our Paladin, Somar and Litha reporting units of $272.6 million, $33.0 million and $26.3 million, respectively.
During the three months ended September 30, 2016, we determined that we would not pursue commercialization of a product in certain international markets. Accordingly, we tested the finite-lived intangible asset associated with this product for impairment and determined that the carrying amount was no longer fully recoverable, resulting in a pre-tax, non-cash intangible asset impairment charge of $16.2 million during the third quarter of 2016. During the fourth quarter of 2016, we recognized pre-tax, non-cash intangible asset impairment charges of $285.5 million in our International Pharmaceuticals segment resulting from certain market conditions impacting the commercial potential of finite and indefinite-lived intangible assets.
As described above, as part of the 2015 annual goodwill impairment test, we recorded a pre-tax, non-cash goodwill impairment charge of $85.8 million related to our Paladin reporting unit.
As part of our finite-lived intangible asset impairment review processes for 2015, we recorded pre-tax, non-cash intangible asset impairment charges of approximately $14.6 million in our International Pharmaceuticals segment, representing the difference between the carrying amount of certain intangible assets and their estimated fair value.
NOTE 11. LICENSE AND COLLABORATION AGREEMENTS
Our subsidiaries have entered into certain license, collaboration and discovery agreements with third parties for product development. These agreements require our subsidiaries to share in the development costs of such products and the third parties grant marketing rights to our subsidiaries for such products.
Generally, under these agreements: (i) we are required to make upfront payments and other payments upon successful completion of regulatory or sales milestones, (ii) we are required to pay royalties on sales of the products arising from these agreements and (iii) termination is permitted with no significant continuing obligation.
F-41
BioSpecifics Technologies Corp.
The Company, through an affiliate, is party to a development and license agreement, as amended (the BioSpecifics Agreement) with BioSpecifics Technologies Corp. (BioSpecifics). The BioSpecifics Agreement was originally entered into in June 2004 to obtain exclusive worldwide rights to develop, market and sell certain products containing BioSpecifics’ enzyme collagenase clostridium histolyticum (CCH), which we market for approved indications under the trademark XIAFLEX®. The Company’s licensed rights concern the development and commercialization of products, other than dermal formulations labeled for topical administration, and currently, the Company’s licensed rights cover the indications of Dupuytren’s contracture (DC), Dupuytren’s nodules, Peyronie’s disease (PD), adhesive capsulitis, cellulite, canine and human lipomas, plantar fibromatosis and lateral hip fat. The Company may further expand the BioSpecifics Agreement, at its option, to cover other indications as they are developed by the Company or BioSpecifics.
Under the BioSpecifics Agreement, we are responsible, at our own cost and expense, for developing the formulation and finished dosage form of products and arranging for the clinical supply of products. BioSpecifics is currently conducting exploratory clinical trials evaluating CCH as a treatment for a number of conditions, including uterine fibroids. The Company has the option to license development and marketing rights to these indications based on a full analysis of the data from the clinical trials, which would transfer responsibility for the future development costs to the Company and trigger opt-in payments and potential future milestone and royalty payments to BioSpecifics.
The BioSpecifics Agreement extends, on a country-by-country and product-by-product basis, for the longer of the patent life, the expiration of any regulatory exclusivity period or twelve years from the effective date. Either party may terminate the BioSpecifics Agreement as a result of the other party’s breach or bankruptcy. We may terminate the BioSpecifics Agreement with 90 days’ written notice.
We must pay BioSpecifics on a country-by-country and product-by-product basis a specified percentage within a range of 5% to 15% of net sales for products covered by the BioSpecifics Agreement. This royalty applies to net sales by the Company or its sublicensees, including Asahi Kasei Pharma Corporation (Asahi Kasei) and Swedish Orphan Biovitrum AB (Sobi). We are also obligated to pay a percentage of any future regulatory or commercial milestone payments received from such sublicensees. In addition, the Company and its affiliates pay BioSpecifics an amount equal to a specified mark-up on certain cost of goods related to supply of XIAFLEX® (which mark-up is capped at a specified percentage within the range of 5% to 15% of the cost of goods of XIAFLEX®) for products sold by the Company and its affiliates.
NOTE 12. ACCOUNTS PAYABLE AND ACCRUED EXPENSES
Accounts payable and accrued expenses include the following at December 31, 2017 and December 31, 2016 (in thousands):
December 31, 2017 | December 31, 2016 | ||||||
Trade accounts payable | $ | 85,348 | $ | 126,712 | |||
Returns and allowances | 291,034 | 332,455 | |||||
Rebates | 168,333 | 227,706 | |||||
Chargebacks | 14,604 | 33,092 | |||||
Accrued interest | 130,257 | 128,254 | |||||
Accrued payroll and related benefits | 113,908 | 115,224 | |||||
Accrued royalties and other distribution partner payables | 63,114 | 191,433 | |||||
Acquisition-related contingent consideration—short-term | 70,543 | 109,373 | |||||
Other | 159,684 | 189,835 | |||||
Total | $ | 1,096,825 | $ | 1,454,084 | |||
F-42
NOTE 13. DEBT
The following table presents information about the Company’s total indebtedness at December 31, 2017 and December 31, 2016 (in thousands):
December 31, 2017 | December 31, 2016 | ||||||||||||||||||||
Effective Interest Rate | Principal Amount | Carrying Amount | Effective Interest Rate | Principal Amount | Carrying Amount | ||||||||||||||||
7.25% Senior Notes due 2022 | 7.91 | % | $ | 400,000 | $ | 390,974 | 7.91 | % | $ | 400,000 | $ | 389,150 | |||||||||
5.75% Senior Notes due 2022 | 6.04 | % | 700,000 | 692,855 | 6.04 | % | 700,000 | 691,339 | |||||||||||||
5.375% Senior Notes due 2023 | 5.62 | % | 750,000 | 742,048 | 5.62 | % | 750,000 | 740,733 | |||||||||||||
6.00% Senior Notes due 2023 | 6.28 | % | 1,635,000 | 1,613,446 | 6.28 | % | 1,635,000 | 1,610,280 | |||||||||||||
5.875% Senior Secured Notes due 2024 | 6.14 | % | 300,000 | 295,513 | — | — | — | ||||||||||||||
6.00% Senior Notes due 2025 | 6.27 | % | 1,200,000 | 1,181,243 | 6.27 | % | 1,200,000 | 1,179,203 | |||||||||||||
Term Loan A Facility Due 2019 | — | — | — | 2.95 | % | 941,875 | 932,824 | ||||||||||||||
Term Loan B Facility Due 2022 | — | — | — | 4.06 | % | 2,772,000 | 2,728,919 | ||||||||||||||
Term Loan B Facility Due 2024 | 5.46 | % | 3,397,925 | 3,360,103 | — | — | — | ||||||||||||||
Other debt | 1.50 | % | 55 | 55 | 1.50 | % | 55 | 55 | |||||||||||||
Total long-term debt, net | $ | 8,382,980 | $ | 8,276,237 | $ | 8,398,930 | $ | 8,272,503 | |||||||||||||
Less current portion, net | 34,205 | 34,205 | 131,125 | 131,125 | |||||||||||||||||
Total long-term debt, less current portion, net | $ | 8,348,775 | $ | 8,242,032 | $ | 8,267,805 | $ | 8,141,378 | |||||||||||||
The senior unsecured notes are unsecured and effectively subordinated in right of priority to the 2017 Credit Agreement and our senior secured notes, in each case to the extent of the value of the collateral securing such instruments, which collateral represents substantially all of the assets of the issuers or borrowers and the guarantors party thereto.
The aggregate estimated fair value of the Company’s long-term debt, which was estimated using inputs based on quoted market prices for the same or similar debt issuances, was $7.5 billion and $7.8 billion at December 31, 2017 and December 31, 2016, respectively. Based on this valuation methodology, we determined these debt instruments represent Level 2 measurements within the fair value hierarchy.
Credit Facility
We have $996.8 million of remaining credit available through our Revolving Credit Facility as of December 31, 2017. As of December 31, 2017, we were in compliance with all covenants contained in our 2017 Credit Agreement. Our 2017 Credit Agreement is described below under the heading “April 2017 Refinancing.”
Senior Notes and Senior Secured Notes
Our various senior notes and our senior secured notes mature between 2022 and 2025. The indentures governing these notes generally allow for redemption prior to maturity, in whole or in part, subject to certain restrictions and limitations described therein. Generally, until a date specified in each indenture (which, as of December 31, 2017, has occurred only for the 7.25% Senior Notes due 2022, 5.75% Senior Notes due 2022 and 5.375% Senior Notes due 2023), the notes may either: (i) be redeemed, in part or in full, by paying the sum of: (a) 100% of the principal amount being redeemed, (b) an applicable make-whole premium as described in each indenture and (c) accrued and unpaid interest or (ii) be redeemed in part (up to 35% of the principal amount outstanding) with the net cash proceeds from specified equity offerings at redemption prices ranging from 105.875% to 106.000% (with respect to the notes for which the specified date described above has not yet occurred as of December 31, 2017) of the principal amount being redeemed, plus accrued and unpaid interest. After the specified date described above, the notes may generally be redeemed, in whole or in part, at redemption prices ranging from 100.000% to 104.500% of the principal amount being redeemed plus accrued and unpaid interest.
Other than the 5.875% Senior Secured Notes due 2024, these notes are senior unsecured obligations of the Company’s subsidiaries party to the applicable indenture governing such notes. These notes are issued by certain of our subsidiaries and are guaranteed on a senior unsecured basis by the subsidiaries of Endo International plc that also guarantee the 2017 Credit Agreement, except for a de minimis amount of the 7.25% Senior Notes due 2022, which are issued by Endo Health Solutions Inc. (EHSI). and guaranteed on a senior unsecured basis by the guarantors named in the Fifth Supplemental Indenture relating to such notes. The 5.875% Senior Secured Notes due 2024 are senior secured obligations of Endo International plc and its subsidiaries that are party to the indenture governing such notes. These notes are issued by certain of our subsidiaries and are guaranteed on a senior secured basis by Endo International plc and its subsidiaries that also guarantee our 2017 Credit Agreement.
F-43
The indentures governing our various senior notes contain affirmative and negative covenants that the Company believes to be usual and customary for similar indentures. The negative covenants, among other things, restrict the Company’s ability and the ability of its restricted subsidiaries to incur certain additional indebtedness and issue preferred stock, make certain investments and restricted payments, sell certain assets, enter into sale and leaseback transactions, agree to payment restrictions on the ability of restricted subsidiaries to make certain payments to Endo International plc or any of its restricted subsidiaries, create certain liens, merge, consolidate or sell all or substantially all of the Company’s assets or enter into certain transactions with affiliates. As of December 31, 2017, we were in compliance with all covenants. Additionally, pursuant to the terms of the indentures governing certain of our senior unsecured notes, the restricted subsidiaries of Endo International plc, whose assets comprise substantially all of the Company’s consolidated total assets after intercompany eliminations, are subject to various restrictions limiting their ability to transfer assets in excess of certain thresholds to Endo International plc.
April 2017 Refinancing
On April 27, 2017, Endo International plc entered into a new credit agreement (the 2017 Credit Agreement) as a guarantor, together with its subsidiaries Endo Luxembourg Finance Company I S.à r.l., and Endo LLC, as borrowers (the Borrowers), the other guarantors party thereto, the lenders party thereto and JPMorgan Chase Bank, N.A., as administrative agent, issuing bank and swingline lender. The 2017 Credit Agreement provides for (i) a five-year senior secured revolving credit facility in a principal amount of $1,000.0 million (the 2017 Revolving Credit Facility) (up to $50.0 million (which amount may be increased to up to $75.0 million with the consent of the administrative agent and certain issuing banks) of which is available for letters of credit and up to $50.0 million (which amount may be increased to up to $75.0 million with the consent of the administrative agent) of which is available for swing line loans) and (ii) a seven-year senior secured term loan facility in a principal amount of $3,415.0 million (the 2017 Term Loan Facility and, together with the 2017 Revolving Credit Facility, the 2017 Credit Facility). Any outstanding amounts borrowed pursuant to the 2017 Term Loan Facility will immediately mature if the 7.25% Senior Notes due 2022 are not refinanced or repaid in full prior to the date that is 91 days prior to the stated maturity date thereof. Any outstanding amounts borrowed pursuant to the 2017 Credit Facility will immediately mature if any of the following of our senior notes (other than, in the case of the 2017 Revolving Credit Facility, the 5.375% Senior notes due 2023 and the 6.00% Senior Notes due 2023) are not refinanced or repaid in full prior to the date that is 91 days prior to the stated maturity date thereof:
Instrument | Maturity Date | |
7.25% Senior Notes due 2022 | January 15, 2022 | |
5.75% Senior Notes due 2022 | January 15, 2022 | |
5.375% Senior Notes due 2023 | January 15, 2023 | |
6.00% Senior Notes due 2023 | July 15, 2023 | |
The proceeds of the 2017 Term Loan Facility were used, together with cash on hand, to repay our outstanding obligations under our prior credit facilities and to pay related fees and expenses. The proceeds of the 2017 Revolving Credit Facility will be used for working capital, capital expenditures and general corporate purposes. The obligations under the 2017 Credit Agreement are guaranteed by Endo International plc and its subsidiaries from time to time (with certain exceptions) (together with the Borrowers, the Loan Parties). The obligations under the 2017 Credit Agreement and the obligations under the indenture governing the 5.875% Senior Secured Notes due 2024 are secured on a pari passu basis by a first priority (subject to permitted liens) lien on substantially all the assets (with certain exceptions) of the Loan Parties. The 2017 Credit Agreement contains affirmative and negative covenants that the Company believes to be usual and customary for a senior secured credit facility of this type. The negative covenants include, among other things, limitations on asset sales, mergers and acquisitions, indebtedness, liens, dividends and other restricted payments, investments and transactions with the Company’s affiliates. In addition, on an annual basis commencing with the year ended December 31, 2018, the Company is required to perform a calculation of excess cash flow (as defined in the 2017 Credit Agreement) and a portion of the principal amount of the 2017 Term Loan Facility may be required to be prepaid in accordance with the terms of the 2017 Credit Agreement. No such payment is required at December 31, 2017.
The 2017 Credit Agreement provides that the Borrowers may incur incremental revolving commitments and/or incremental term loans in an aggregate principal amount of up to (i) up to $1.0 billion plus (ii) an unlimited amount if the pro forma first lien net leverage ratio at the time of incurrence of such incremental commitments or loans after giving effect thereto is less than or equal to 2.50 to 1.00 (assuming for purposes of such calculation that any incremental revolving commitments being incurred are fully drawn and without netting cash proceeds of any incremental facilities or incremental equivalent debt) or, in lieu of incremental facilities under the 2017 Credit Agreement, the incurrence of incremental equivalent debt consisting of pari passu notes or loans (subject to pro forma compliance with a first lien net leverage ratio of 2.50 to 1.00), junior secured notes or loans (subject to pro forma compliance with a secured net leverage ratio of 3.50 to 1.00) or unsecured notes or loans (subject to pro forma compliance with a total net leverage ratio of 6.50 to 1.00) from one or more of the existing lenders (or their affiliates) or other lenders (with the consent of the administrative agent) and, subject to compliance by the Borrowers with the documentation and other requirements under the 2017 Credit Agreement, without the need for consent from any of the existing lenders under the 2017 Credit Agreement.
F-44
Borrowings under the 2017 Revolving Credit Facility bear interest, at the borrower’s election, at a rate equal to (i) an applicable margin between 1.50% and 3.00% depending on the Company’s total net leverage ratio plus the London Interbank Offered Rate (LIBOR) or (ii) an applicable margin between 0.50% and 2.00% depending on the Company’s total net leverage ratio plus the Alternate Base Rate (as defined in the 2017 Credit Agreement). In addition, borrowings under our 2017 Term Loan Facility bear interest, at the borrower’s election, at a rate equal to (i) 4.25% plus LIBOR, subject to a LIBOR floor of 0.75%, or (ii) 3.75% plus the Alternate Base Rate, subject to an Alternate Base Rate floor of 1.75%.
Also on April 27, 2017, Endo Designated Activity Company (Endo DAC), Endo Finance LLC and Endo Finco Inc. (collectively, the Issuers) issued $300.0 million in aggregate principal amount of 5.875% Senior Secured Notes due 2024 (the 2024 Notes). The 2024 Notes were issued in a private offering for resale to “qualified institutional buyers” (as defined in Rule 144A under the Securities Act) and outside the United States to non-U.S. persons in compliance with Regulation S under the Securities Act. The 2024 Notes are senior secured obligations of the Issuers and are: (i) guaranteed by Endo International plc and its subsidiaries that also guarantee the 2017 Credit Agreement and certain other material indebtedness and (ii) secured by a lien on the same collateral that secures the 2017 Credit Agreement. Interest on the 2024 Notes is payable semiannually in arrears on April 15 and October 15 of each year, beginning on October 15, 2017. The 2024 Notes will mature on October 15, 2024, subject to earlier repurchase or redemption in accordance with the terms of the 2024 Notes indenture. On or after April 15, 2020, the Issuers may on any one or more occasions redeem all or a part of the 2024 Notes, at the redemption prices (expressed as percentages of principal amount) set forth below, plus accrued and unpaid interest and additional interest, if any, on the notes redeemed if such notes are redeemed during the twelve-month period beginning on April 15 of the years indicated below:
Year | Percentage | ||
2020 | 102.938 | % | |
2021 | 101.469 | % | |
2022 and thereafter | 100.000 | % | |
At any time prior to April 15, 2020, the Issuers may on any one or more occasions redeem all or a part of the 2024 Notes at a redemption price equal to 100% of the principal amount of the notes redeemed, plus the applicable make-whole premium as described in the 2024 Notes indenture, plus accrued and unpaid interest and additional interest, if any. In addition, prior to April 15, 2020, the Issuers may, subject to certain restrictions and limitations, redeem up to 35% of the aggregate principal amount of the 2024 Notes with the net cash proceeds from specified equity offerings at a redemption price equal to 105.875% of the aggregate principal amount of the 2024 Notes redeemed, plus accrued and unpaid interest and additional interest, if any. If the Company experiences certain change of control events, the Issuers must offer to repurchase the 2024 Notes at 101% of their principal amount, plus accrued and unpaid interest and additional interest, if any. The 2024 Notes indenture contains covenants that, among other things, restrict the Company’s ability and the ability of its restricted subsidiaries to incur certain additional indebtedness and issue preferred stock, make certain dividends, distributions, investments and restricted payments, sell certain assets, enter into sale and leaseback transactions, agree to payment restrictions on the ability of restricted subsidiaries to make certain payments to Endo International plc or any of its restricted subsidiaries, create certain liens, merge, consolidate or sell all or substantially all of the Company’s assets, enter into certain transactions with affiliates or designate subsidiaries as unrestricted subsidiaries. These covenants are subject to a number of exceptions and qualifications, including the fall away or revision of certain of these covenants and release of the collateral upon the 2024 Notes receiving investment grade credit ratings.
The Company used the net proceeds under the 2017 Term Loan Facility, together with the net proceeds of the 2024 Notes and cash on hand, to repay all of its outstanding loans under its prior credit facilities and to pay related fees and expenses. The Company intends to use the proceeds of the 2017 Revolving Credit Facility from time to time for working capital, capital expenditures and general corporate purposes.
In connection with the April 2017 Refinancing, we incurred new debt issuance costs of approximately $56.7 million, which were allocated among the new debt instruments as follows: (i) $41.3 million to the 2017 Term Loan Facility, (ii) $10.5 million to the 2017 Revolving Credit Facility and (iii) $4.9 million to the 2024 Notes. These costs, together with $10.1 million of the previously deferred debt issuance costs associated with our prior revolving credit facility, have been deferred and will be amortized as interest expense over the terms of the respective instruments. The remaining $51.7 million of deferred debt issuance costs associated with our prior revolving and term loan facilities were charged to expense in the second quarter of 2017. These expenses were included in the Consolidated Statements of Operations as Loss on extinguishment of debt.
F-45
Maturities
The following table presents, subsequent to the closing of the April 2017 Refinancing, the maturities on our long-term debt for each of the five fiscal years subsequent to December 31, 2017 (in thousands):
Maturities (1) | |||
2018 | $ | 34,205 | |
2019 | $ | 34,150 | |
2020 | $ | 34,150 | |
2021 | $ | 34,150 | |
2022 | $ | 1,134,150 | |
__________
(1) | Any outstanding amounts borrowed pursuant to the 2017 Credit Facility will immediately mature if certain of our senior notes (enumerated above under the heading “April 2017 Refinancing”) (other than, in the case of the 2017 Revolving Credit Facility, the 5.375% Senior Notes due 2023 and the 6.00% Senior Notes due 2023) are not refinanced or repaid in full prior to the date that is 91 days prior to the respective stated maturity dates thereof. Accordingly, we may be required to repay or refinance senior notes with an aggregate principal amount of $1,100.0 million in 2021, despite such notes having stated maturities in 2022. Similarly, we may be required to repay or refinance senior notes with an aggregate principal amount of $750.0 million in 2022, despite such notes having stated maturities in 2023. The amounts in this maturities table do not reflect any such early payment; rather, they reflect stated maturity dates. |
NOTE 14. COMMITMENTS AND CONTINGENCIES
Manufacturing, Supply and Other Service Agreements
Our subsidiaries contract with various third party manufacturers, suppliers and service providers to provide raw materials used in our subsidiaries’ products and semi-finished and finished goods, as well as certain packaging, labeling services, customer service support, warehouse and distribution services. If, for any reason, we are unable to obtain sufficient quantities of any of the finished goods or raw materials or components required for our products or services needed to conduct our business, it could have an adverse effect on our business, financial condition, results of operations and cash flows.
In addition to the manufacturing and supply agreements described above, we have agreements with various companies for clinical development services. Although we have no reason to believe that the parties to these agreements will not meet their obligations, failure by any of these third parties to honor their contractual obligations may have a material adverse effect on our business, financial condition, results of operations and cash flows.
Jubilant HollisterStier Laboratories LLC (JHS)
During the second quarter of 2016, we entered into a new agreement with JHS (JHS Agreement). Pursuant to the JHS Agreement, JHS fills and lyophilizes the XIAFLEX® bulk drug substance, which is manufactured by the Company, and produces sterile diluent. The initial term of the JHS agreement is three years, with automatic renewal provisions thereafter for subsequent one-year terms, unless or until either party provides notification prior to expiration of the then current term of the contract. The Company is required to purchase a specified percentage of its total forecasted volume of XIAFLEX® from JHS each year, unless JHS is unable to supply XIAFLEX® within the timeframe established under such forecasts. Amounts purchased pursuant to the JHS Agreement were $5.6 million and $6.3 million for the years ended December 31, 2017 and 2016. Amounts purchased in 2015 were not material.
Milestones and Royalties
See Note 11. License and Collaboration Agreements for a description of future milestone and royalty commitments pursuant to our material acquisitions, license and collaboration agreements.
Legal Proceedings and Investigations
We and certain of our subsidiaries are involved in various claims, legal proceedings, internal and governmental investigations (collectively, proceedings) that arise from time to time in the ordinary course of our business, including, among others, those relating to product liability, intellectual property, regulatory compliance, consumer protection and commercial matters. While we cannot predict the outcome of these proceedings and we intend to vigorously prosecute or defend our position as appropriate, there can be no assurance that we will be successful or obtain any requested relief and an adverse outcome in any of these proceedings could have a material adverse effect on our current and future financial position, results of operations and cash flows. Matters that are not being disclosed herein are, in the opinion of our management, immaterial both individually and in the aggregate with respect to our financial position, results of operations and cash flows. If and when such matters, in the opinion of our management, become material either individually or in the aggregate, we will disclose such matters.
F-46
We believe that certain settlements and judgments, as well as legal defense costs, relating to certain product liability or other matters are or may be covered in whole or in part under our insurance policies with a number of insurance carriers. In certain circumstances, insurance carriers reserve their rights to contest or deny coverage. We intend to contest vigorously any and all such disputes with our insurance carriers and to enforce our rights under the terms of our insurance policies. Accordingly, we will record receivables with respect to amounts due under these policies only when the resolution of any dispute has been reached and realization of the potential claim for recovery is considered probable. Amounts recovered under our insurance policies will likely be less than the stated coverage limits and may not be adequate to cover damages and/or costs relating to claims. In addition, there is no guarantee that insurers will pay claims or that coverage will otherwise be available.
As of December 31, 2017, our reserve for loss contingencies totaled $1,298.2 million, of which $1,087.2 million relates to our liability accrual for vaginal mesh cases and other mesh-related matters. During the fourth quarter of 2017, the Company recorded a total increase to its legal reserves of approximately $200 million related to testosterone-related product liability matters and LIDODERM®-related antitrust matters, which reflects the Company’s conclusion that a loss is probable with respect to these matters. The reserve for LIDODERM®-related matters includes an estimated loss for, among other matters, a settlement in principle of all remaining claims filed against EPI in multidistrict litigation (MDL) No. 2521, which is further discussed below under the heading “Other Antitrust Matters.” The testosterone-related reserve includes an estimated loss for, among other matters, all testosterone-related product liability cases filed in MDL No. 2545 and in other courts. These cases are further discussed below under the heading “Product Liability and Related Matters.” Although we believe there is a reasonable possibility that a loss in excess of the amount recognized exists, we are unable to estimate the possible loss or range of loss in excess of the amount recognized at this time.
Product Liability and Related Matters
We and certain of our subsidiaries have been named as defendants in numerous lawsuits in various U.S. federal and state courts, as well as in Canada and other countries, alleging personal injury resulting from the use of certain products of our subsidiaries. These and other related matters are described below in more detail.
Vaginal Mesh. In October 2008, the FDA issued a Public Health Notification (October 2008 Public Health Notification) regarding potential complications associated with transvaginal placement of surgical mesh to treat pelvic organ prolapse (POP) and stress urinary incontinence (SUI). The notification provided recommendations and encouraged physicians to seek specialized training in mesh procedures, to advise their patients about the risks associated with these procedures and to be diligent in diagnosing and reporting complications.
In July 2011, the FDA issued an update to the October 2008 Public Health Notification to further advise the public and the medical community of the potential complications associated with transvaginal placement of surgical mesh to treat POP and SUI. In the July 2011 update, the FDA stated that adverse events are not rare and questioned the relative effectiveness of transvaginal mesh as a treatment for POP as compared to non-mesh surgical repair. The July 2011 update continued to encourage physicians to seek specialized training in mesh procedures, to consider and to advise their patients about the risks associated with these procedures and to be diligent in diagnosing and reporting complications. In January 2016, the FDA issued a statement reclassifying surgical mesh for transvaginal POP repair from Class II to Class III. Surgical mesh for SUI repair remains a Class II device.
Since 2008, we and certain of our subsidiaries, including AMS and/or Astora, have been named as defendants in multiple lawsuits in the U.S. in various state and federal courts (including a federal MDL pending in the U.S. District Court for the Southern District of West Virginia (MDL No. 2325)), and in Canada and other countries, alleging personal injury resulting from the use of transvaginal surgical mesh products designed to treat POP and SUI. In January 2018, a representative proceeding (class action) was filed in the Federal Court of Australia against American Medical Systems, LLC. In the various class action and individual complaints, plaintiffs claim a variety of personal injuries, including chronic pain, incontinence, inability to control bowel function and permanent deformities, and seek compensatory and punitive damages, where available.
We and certain plaintiffs’ counsel representing mesh-related product liability claimants have entered into various Master Settlement Agreements (MSAs) and other agreements to resolve up to approximately 71,000 filed and unfiled mesh claims handled or controlled by the participating counsel. These MSAs and other agreements were entered into at various times between June 2013 and the present, were solely by way of compromise and settlement and were not in any way an admission of liability or fault by us or any of our subsidiaries.
All MSAs are subject to a process that includes guidelines and procedures for administering the settlements and the release of funds. In certain cases, the MSAs provide for the creation of qualified settlement funds (QSFs) into which funds may be deposited pursuant to certain schedules set forth in those agreements. All MSAs have participation requirements regarding the claims represented by each law firm party to the MSA. In addition, one agreement gives us a unilateral right of approval regarding which claims may be eligible to participate under that settlement. To the extent fewer claims than are authorized under an agreement participate, the total settlement payment under that agreement will be reduced by an agreed-upon amount for each such non-participating claim. Funds deposited in QSFs are included in restricted cash and cash equivalents in the Consolidated Balance Sheets.
F-47
Distribution of funds to any individual claimant is conditioned upon the receipt of documentation substantiating the validity of the claim, a full release and dismissal of the entire action or claim as to all AMS parties and affiliates. Prior to receiving funds, an individual claimant is required to represent and warrant that liens, assignment rights or other claims identified in the claims administration process have been or will be satisfied by the individual claimant. Confidentiality provisions apply to the amount of settlement awards to participating claimants, the claims evaluation process and procedures used in conjunction with award distributions, and the negotiations leading to the settlements.
In June 2017, the MDL court entered a case management order which, among other things, requires plaintiffs in newly-filed MDL cases to provide expert disclosures on specific causation within one hundred twenty (120) days of filing a claim (the Order). Under the Order, a plaintiff's failure to meet the foregoing deadline may be grounds for the entry of judgment against such plaintiff. In July 2017, a similar order was entered in Minnesota state court.
Beginning in the second quarter of 2017, the Company aggressively pursued a settlement strategy in connection with the mesh litigation. Consequently, the Company increased its mesh liability accrual by $775.5 million in the second quarter of 2017, which is expected to cover approximately 22,000 known U.S. mesh claims, subject to a claims validation process for all resolved claims, as well as all of the international mesh liability claims of which the Company is aware and other mesh-related matters. This increase reflected the Company’s conclusion that a loss was probable with respect to all unsettled mesh-related matters of which we were aware, and our current liability accrual applies to such matters. Although the Company believes it has appropriately estimated the probable total amount of loss associated with all matters as of the date of this report, it is reasonably possible that further claims may be filed or asserted and adjustments to our liability accrual may be required. This could have a material adverse effect on our business, financial condition, results of operations and cash flows.
The following table presents the changes in the QSFs and mesh liability accrual balance during the year ended December 31, 2017 (in thousands):
Qualified Settlement Funds | Mesh Liability Accrual | ||||||
Balance as of January 1, 2017 | $ | 275,987 | $ | 963,117 | |||
Additional charges | — | 775,474 | |||||
Cash contributions to Qualified Settlement Funds | 668,306 | — | |||||
Cash distributions to settle disputes from Qualified Settlement Funds | (632,176 | ) | (632,176 | ) | |||
Cash distributions to settle disputes | — | (19,243 | ) | ||||
Other | 1,697 | — | |||||
Balance as of December 31, 2017 | $ | 313,814 | $ | 1,087,172 | |||
As of December 31, 2017, $876.7 million of the mesh liability accrual amount shown above is classified in the Current portion of the legal settlement accrual in the Consolidated Balance Sheets, with the remainder classified as Long-term legal settlement accrual, less current portion. Charges related to vaginal mesh liability and associated legal fees and other expenses for all periods presented are reported in Discontinued operations, net of tax in our Consolidated Statements of Operations.
To date, the Company has made total mesh liability payments of approximately $2.9 billion, $313.8 million of which remains in the QSFs as of December 31, 2017. We expect to fund into the QSFs the remaining payments under all settlement agreements during 2018 and 2019. As the funds are disbursed out of the QSFs from time to time, the liability accrual will be reduced accordingly with a corresponding reduction to restricted cash and cash equivalents. In addition, we may pay cash distributions to settle disputes separate from the QSFs, which will also decrease the liability accrual and decrease cash and cash equivalents.
We were contacted in October 2012 regarding a civil investigation initiated by a number of state attorneys general into mesh products, including transvaginal surgical mesh products designed to treat POP and SUI. In November 2013, we received a subpoena relating to this investigation from the state of California, and we have subsequently received additional subpoenas from California and other states. We are currently cooperating with these investigations.
We will continue to vigorously defend any unresolved claims and to explore other options as appropriate in our best interests. Similar matters may be brought by others or the foregoing matters may be expanded. We are unable to predict the outcome of these matters or to estimate the possible range of any additional losses that could be incurred.
Testosterone. Various manufacturers of prescription medications containing testosterone, including our subsidiaries Endo Pharmaceuticals Inc. (EPI) and Auxilium Pharmaceuticals, Inc. (subsequently converted to Auxilium Pharmaceuticals, LLC and hereinafter referred to as Auxilium), have been named as defendants in multiple lawsuits alleging personal injury resulting from the use of such medications, including FORTESTA® Gel, DELATESTRYL®, TESTIM®, TESTOPEL®, AVEED® and STRIANT®. Plaintiffs in these suits generally allege various personal injuries, including pulmonary embolism, stroke or other vascular and/or cardiac injuries, and seek compensatory and/or punitive damages, where available.
F-48
As of February 20, 2018, we were aware of approximately 1,300 testosterone cases (some of which may have been filed on behalf of multiple plaintiffs) pending against one or more of our subsidiaries. Many of these cases have been coordinated in a federal MDL pending in the U.S. District Court for the Northern District of Illinois (MDL No. 2545). In addition, there are cases pending against EPI and/or Auxilium in the Philadelphia Court of Common Pleas (PCCP) and in certain other state courts.
In November 2015, the MDL court entered an order granting defendants’ motion to dismiss claims involving certain testosterone products that were approved pursuant to Abbreviated New Drug Applications (ANDAs), including TESTOPEL®. Plaintiffs filed a motion for reconsideration and clarification of this order. In March 2016, the MDL court granted plaintiffs’ motion in part and entered an order permitting certain claims to go forward to the extent they are based on allegations of fraudulent off-label marketing.
The first MDL trial against Auxilium involving TESTIM® took place in November 2017 and resulted in a defense verdict. The first PCCP trial against Auxilium involving TESTIM® was scheduled for January 2018 but resolved prior to trial. The next PCCP trial against Auxilium involving TESTIM® is set for July 2018, with approximately fourteen other PCCP trials involving one or more of our subsidiaries scheduled to follow by January 2019; in some of these cases, another pharmaceutical manufacturer is also named as a defendant.
In February 2018, counsel for plaintiffs and counsel for Auxilium and EPI signed a memorandum of understanding regarding a potential settlement, subject to certain contingencies and conditions. The MDL court subsequently entered a case management order directing that proceedings involving these parties be temporarily stayed so that the parties may devote their efforts to finalizing a master settlement agreement. A fourth quarter 2017 increase to the Company’s legal reserves includes, among other things, an estimated loss for all testosterone-related product liability claims filed in MDL No. 2545 and in other courts. Although the Company believes it has appropriately estimated the probable total amount of loss associated with testosterone-related product liability matters as of the date of this report, it is reasonably possible that further claims may be filed or asserted and adjustments to our liability accrual may be required. This could have a material adverse effect on our business, financial condition, results of operations and cash flows.
The MDL also includes a lawsuit filed in November 2014 in the U.S. District for the Northern District of Illinois against EPI, Auxilium and various other manufacturers of testosterone products on behalf of a proposed class of health insurance companies and other third party payers that claim to have paid for certain testosterone products. After a series of motions to dismiss, plaintiffs filed a third amended complaint in April 2016, asserting civil claims for alleged violations of the Racketeer Influenced and Corrupt Organizations Act (RICO) and for negligent misrepresentation based on defendants’ marketing of certain testosterone products. The court denied a motion to dismiss this complaint in August 2016 and the case is currently in discovery. In November 2017, plaintiff filed a motion to certify a nationwide class of third party payers. This lawsuit is not part of the potential settlement described above.
We will continue to vigorously defend any unresolved claims and to explore other options as appropriate in our best interests. Similar matters may be brought by others or the foregoing matters may be expanded. We are unable to predict the outcome of these matters or to estimate the possible range of any additional losses that could be incurred.
Unapproved Drug Litigation
In September 2013, the State of Louisiana filed a petition for damages against certain of our subsidiaries, including EPI, and more than 50 other pharmaceutical companies in Louisiana state court (19th Judicial District) alleging that the defendants or their subsidiaries marketed products that were not approved by the FDA and seeking damages, fines, penalties, attorneys’ fees and costs under various causes of action. In October 2015, the district court entered judgment for defendants on their exception for no right of action. The State appealed, and in October 2016 the Louisiana First Circuit Court of Appeals reversed the dismissal as to the State’s Medicaid Assistance Program Integrity Law (MAPIL) and Louisiana Unfair Trade Practices Act (LUTPA) claims but affirmed the dismissal as to the State’s other claims. The State’s petition for rehearing was denied in December 2016. Both sides applied to the Louisiana Supreme Court for a writ of certiorari to review the First Circuit’s decision. Those writs were denied in March 2017. In May 2017, defendants filed exceptions for no cause of action in the district court. In August 2017, the court sustained defendants’ exception as to the MAPIL claim but overruled defendants’ exception as to the LUTPA claim. The State then filed a motion seeking reconsideration with respect to the MAPIL claim, and defendants filed a motion for clarification with respect to the court’s ruling on the LUTPA claim. In October 2017, the court denied the State’s motion and entered final judgment against the State with respect to the MAPIL claim. The court also granted defendants’ motion for clarification and dismissed the State’s LUTPA claim insofar as it sought civil penalties for alleged violations occurring before June 2, 2006. In October 2017, defendants applied for a supervisory writ to the Louisiana First Circuit Court of Appeals on the district court’s August 2017 order overruling defendants’ exception on the State’s LUTPA claim.
F-49
In March 2017, the State of Mississippi filed a complaint against our subsidiary EPI in Mississippi state court (Hinds County Chancery Court) alleging that EPI marketed products that were not approved by the FDA and seeking damages, penalties, attorneys’ fees, costs and other relief under various causes of action. In April 2017, EPI removed the case to the U.S. District Court for the Southern District of Mississippi. In May 2017, the State moved to remand the case to state court, and that motion was granted in October 2017. In November 2017, EPI filed a motion to dismiss the State’s complaint on various grounds. In January 2018, the State filed a motion for leave to amend its complaint. In February 2018, following an unopposed motion by the State, the court consolidated the State’s case against EPI with five substantially similar cases brought by the State against other defendants. The consolidation is solely for purposes of coordinated pretrial proceedings and discovery, not for trial.
We will continue to vigorously defend the foregoing matters and to explore other options as appropriate in our best interests. Similar matters may be brought by others or the foregoing matters may be expanded. We are unable to predict the outcome of these matters or to estimate the possible range of any losses that could be incurred.
Opioid-Related Matters
Since 2014, multiple U.S. states, counties, other governmental persons or entities and private plaintiffs have filed suit against our subsidiaries EHSI and EPI, in some instances the Company and/or our subsidiary Par Pharmaceutical, Inc. (PPI), and/or various other manufacturers, distributors and/or others, asserting claims relating to defendants’ alleged sales, marketing and/or distribution practices with respect to prescription opioid medications, including certain of our products. As of February 20, 2018, the cases of which we were aware include, but are not limited to, cases filed by the states of Delaware, Kentucky, Mississippi, Missouri, New Mexico and Ohio; approximately 465 cases filed by counties, cities, Native American tribes and/or other government-related persons or entities in Alabama, Arizona, Arkansas, California, Colorado, Connecticut, Florida, Georgia, Illinois, Indiana, Iowa, Kansas, Kentucky, Louisiana, Maryland, Massachusetts, Michigan, Minnesota, Mississippi, Missouri, Montana, Nevada, New Hampshire, New Jersey, New Mexico, New York, North Carolina, North Dakota, Ohio, Oregon, Pennsylvania, South Carolina, South Dakota, Tennessee, Texas, Washington, West Virginia, Wisconsin and Puerto Rico; approximately 25 cases filed by hospitals, health systems, unions, health and welfare funds or other third-party payers; and approximately eight cases alleging personal injury and/or wrongful death. We will continue to vigorously defend the foregoing matters and to explore other options as appropriate in our best interests. Similar matters may be brought by others or the foregoing matters may be expanded. We are unable to predict the outcome of these matters or to estimate the possible range of any losses that could be incurred.
Many of these cases have been coordinated in a federal MDL pending in the U.S. District Court for the Northern District of Ohio (MDL No. 2804). Other cases remain pending in various state courts. Certain cases filed in Connecticut, Illinois and New York state courts have been transferred to a single court within their respective state court systems for coordinated pretrial proceedings. Defendants have filed motions seeking similar relief in Pennsylvania.
The complaints in the cases assert a variety of claims including, but not limited to, claims for alleged violations of public nuisance, consumer protection, unfair trade practices, racketeering, Medicaid fraud and/or drug dealer liability statutes and/or common law claims for public nuisance, fraud/misrepresentation, strict liability, negligence and/or unjust enrichment. The claims are generally based on alleged misrepresentations and/or omissions in connection with the sale and marketing of prescription opioid medications and/or an alleged failure to take adequate steps to prevent abuse and diversion. Plaintiffs generally seek declaratory and/or injunctive relief; compensatory, punitive and/or treble damages; restitution, disgorgement, civil penalties, abatement, attorneys’ fees, costs and/or other relief. Certain of the cases are brought as putative class actions.
Defendants, including the company’s subsidiaries, have filed motions to dismiss in certain cases. For the most part, these motions remain pending. In a case filed by the City of Chicago in June 2014, defendants have answered the city’s claims for consumer fraud (deceptive practices) and misrepresentation; defendants’ motion to dismiss other claims remains pending. The case is now part of MDL 2804. In a case filed in May 2014 in California state court (Orange County) in the name of the People of the State of California, acting by and through County Counsel for Santa Clara County and the Orange County District Attorney, following a hearing in January 2018, the court denied defendants’ motions to dismiss the fourth amended complaint but struck certain material from that complaint. In February 2018, plaintiffs filed a motion for leave to file a fifth amended complaint.
In March 2017, the Boone County Commission filed suit in the U.S. District Court for the Southern District of West Virginia against multiple defendants, including our subsidiary Generics Bidco I, LLC, for the alleged violation of federal and state safety laws designed to monitor, detect and prevent the diversion of controlled substances. The complaint generally seeks compensatory and punitive damages for the alleged creation of a public nuisance. In December 2017, the case was transferred to MDL 2804 for pretrial purposes.
In addition to the lawsuits described above, the Company and/or its subsidiaries have received certain subpoenas, civil investigative demands (CIDs) and informal requests for information concerning the sale, marketing and/or distribution of prescription opioid medications, including the following:
F-50
In September 2017, the Department of Justice for the State of Oregon and the Office of the Attorney General for the Commonwealth of Massachusetts issued CIDs to EHSI and EPI on behalf of a multistate group which we understand currently includes the District of Columbia and the following additional states: Alabama, Arizona, California, Colorado, Connecticut, Florida, Georgia, Hawaii, Idaho, Illinois, Iowa, Kansas, Louisiana, Maine, Maryland, Michigan, Minnesota, Nebraska, Nevada, New York, North Carolina, North Dakota, Pennsylvania, Rhode Island, South Dakota, Tennessee, Texas, Utah, Vermont, Virginia, West Virginia, Wisconsin and Wyoming. Our subsidiaries are currently cooperating with this investigation. We understand that these recent CIDs superseded prior subpoenas and/or CIDs issued by certain of the foregoing states.
Other states are conducting their own investigations outside of the multistate group. For example, in August 2015, our subsidiary EPI received a subpoena from the New Hampshire Attorney General’s office seeking documents and information regarding sales and marketing of opioids, including OPANA® ER. We were cooperating with the investigation until we learned that the Attorney General was being assisted by outside counsel hired on a contingency fee basis. The Attorney General initiated an action in New Hampshire Superior Court to enforce the subpoena despite this contingency fee arrangement, and we (along with other companies that had received similar subpoenas) responded by filing a motion for protective order to preclude the use of contingency fee counsel. In addition, we filed a separate motion seeking declaratory relief. In March 2016, the Superior Court granted the motion for protective order on the grounds that the contingency fee agreement was invalid as ultra vires and that the Attorney General’s office had acted outside of its statutory authority in entering into the agreement with the contingency fee counsel. In April 2016, both the Attorney General and the companies that had received subpoenas, including EPI, appealed, in part, the March 2016 Superior Court order to the New Hampshire Supreme Court. In June 2017, the New Hampshire Supreme Court reversed the Superior Court’s protective order ruling and remanded the case to the Superior Court. We resumed cooperation with the investigation and in December 2017, the Attorney General issued a second subpoena to EPI seeking additional documents and information regarding sales and marketing of opioids. In October 2017, we filed a petition for certiorari seeking U.S. Supreme Court review of the New Hampshire Supreme Court’s decision. Other states investigating outside of the multistate group include New Jersey (subpoena received by EPI in March 2017); Washington (CID received by the Company, EHSI and EPI in August 2017); Indiana (CID received by EHSI and EPI in November 2017); Montana (CID received by EHSI and EPI in January 2018); Alaska (CID received by EPI in February 2018); and South Carolina (CID received by EHSI and EPI in February 2018). We are cooperating with these investigations.
In January 2018, our subsidiary EPI received a federal grand jury subpoena from the U.S. District Court for the Southern District of Florida in connection with an investigation being conducted by the U.S. Attorney’s Office for the Southern District of Florida in conjunction with the U.S. Food and Drug Administration. The subpoena seeks information related to OPANA® ER and other oxymorphone products. EPI is cooperating with the investigation.
Similar investigations may be brought by others or the foregoing matters may be expanded or result in litigation. We are unable to predict the outcome of these matters or to estimate the possible range of any losses that could be incurred.
Generic Drug Pricing Matters
In December 2014, our subsidiary Par received a grand jury subpoena from the Antitrust Division of the DOJ issued by the U.S. District Court for the Eastern District of Pennsylvania. The subpoena requested documents and information focused primarily on product and pricing information relating to Par’s authorized generic version of Lanoxin (digoxin) oral tablets and Par’s generic doxycycline products, and on communications with competitors and others regarding those products. Par is cooperating with the investigation.
In December 2015, EPI received interrogatories and a subpoena from the Connecticut Attorney General’s Office requesting documents and information regarding pricing of certain of generic products, including doxycycline hyclate, amitriptyline hydrochloride, doxazosin mesylate, methotrexate sodium and oxybutynin chloride. EPI is cooperating with this investigation.
We are unable to predict the outcome of the foregoing investigations, which may involve additional requests for information or result in litigation. In addition, investigations or litigations similar to these matters described above may be brought by others or the foregoing matters may be expanded. We are also unable to predict the ultimate legal and financial liability, if any, and at this time cannot reasonably estimate the possible loss or range of loss, if any, for these matters but will explore all options as appropriate in our best interests.
Since April 2017, certain private plaintiff cases alleging price-fixing and other anticompetitive conduct with respect to at least 18 different generic pharmaceutical products have been consolidated and/or coordinated for pretrial proceedings in a federal MDL pending in the U.S. District Court for the Eastern District of Pennsylvania under the caption In re Generic Pharmaceuticals Pricing Antitrust Litigation (MDL No. 2724). The various cases included in the MDL involve different groups of defendants. Our subsidiary PPI is named as a defendant in proposed class actions relating to six of these products: digoxin, doxycycline hyclate, divalproex ER, propranolol, baclofen and amitriptyline hydrochloride. Among the private plaintiff lawsuits now consolidated and/or coordinated in the MDL, the earliest lawsuits naming the Company and/or its subsidiaries were filed in November 2016 and related to digoxin and doxycycline.
F-51
The private plaintiffs in the MDL include alleged direct purchasers, end-payers, and indirect purchaser resellers, and they purport to represent not only themselves but also all others similarly situated. At the MDL court’s direction, in August 2017, private plaintiffs filed separate consolidated amended class action complaints as to each product and each type of purchaser (direct purchasers, end-payers and indirect purchaser resellers), except the propranolol direct purchaser plaintiffs are attempting to proceed on a consolidated amended complaint filed in the U.S. District Court for the Southern District of New York prior to MDL transfer (the Southern District of New York had denied a motion to dismiss this complaint). The MDL court has divided the various cases into three separate tranches for certain administrative and scheduling purposes, including briefing on motions to dismiss. As to the six products in the first tranche (which include digoxin, doxycycline hyclate and divalproex ER), defendants filed motions to dismiss in October 2017; those motions remain pending. Defendants have also asserted that they are entitled to move the MDL court to dismiss the propranolol direct purchaser consolidated amended complaint; the MDL court has taken this issue under advisement. Defendants moved to stay discovery in all cases pending rulings on their motions to dismiss; in February 2018, the Court denied that motion with certain exceptions.
In December 2016, the Attorney General for the State of Connecticut, leading a coalition of 20 state attorneys general, filed a complaint in the U.S. District Court for the District of Connecticut alleging price-fixing and other anticompetitive conduct with respect to doxycycline hyclate delayed release and glyburide against certain manufacturers of those products. The Company and its subsidiaries were not named in that complaint, or in an amended complaint filed on behalf of 40 states in March 2017, or in a separate lawsuit filed by four more states and the District of Columbia in the same court in July 2017. In August 2017, the state cases were transferred to MDL No. 2724. In October 2017, the state plaintiffs filed a motion for leave to (1) consolidate their two cases, (2) add Alaska and the Commonwealth of Puerto Rico as plaintiffs, and (3) assert additional claims against existing and new defendants. The proposed amended complaint would add new allegations and claims against 14 new defendants, including our subsidiary Par Pharmaceutical Companies, Inc. (subsequently renamed Endo Generics Holding, Inc. but referred to as Par in this Commitments and Contingencies note), relating to 13 additional products. As to our subsidiary, the proposed amended complaint alleges anticompetitive conduct with respect to doxycycline monohydrate. The proposed amended complaint also alleges that the defendants engaged in an overarching conspiracy to restrain trade across the generic pharmaceutical industry and seeks to hold all defendants, including our subsidiary, jointly and severally liable for harm caused by the alleged anticompetitive activity concerning the 15 drugs at issue. The proposed amended complaint seeks declaratory and injunctive relief, disgorgement and other equitable relief, compensatory and treble damages, civil penalties, costs and attorneys’ fees. Defendants have opposed the states’ motion for leave to file their proposed consolidated amended complaint, and the court has not yet ruled on the issue.
In January 2018, The Kroger Co., Albertsons Companies, LLC, and H.E. Butt Grocery Company LP filed a lawsuit in the U.S. District Court for the Eastern District of Pennsylvania against PPI, as well as numerous other manufacturers of generic pharmaceuticals, alleging anticompetitive conduct relating to thirty separate generic pharmaceutical products, including seven products allegedly manufactured by PPI: digoxin, doxycycline hyclate, doxycycline monohydrate, divalproex ER, propranolol, baclofen and amitriptyline hydrochloride. The complaint alleges an overarching conspiracy among all named defendants to engage in price-fixing for all thirty products, as well as product-specific conspiracies relating to each individual product, in violation of federal antitrust law. The complaint seeks monetary damages, including treble damages, attorneys’ fees, and injunctive relief.
We will continue to vigorously defend the foregoing matters and to explore other options as appropriate in our best interests. Similar matters may be brought by others or the foregoing matters may be expanded. We are unable to predict the outcome of these matters or to estimate the possible range of any losses that could be incurred.
Other Pricing Matters
Beginning in December 2015, two complaints, including a class action complaint, were filed in the PCCP against us and certain of our subsidiaries, including Par, along with other manufacturers of generic pharmaceutical products, seeking compensatory and punitive or treble damages, as well as injunctive relief, and alleging that certain marketing and pricing practices by the defendant companies violated state law, including consumer protection law. The class action complaint was subsequently removed to the U.S. District Court for the Eastern District of Pennsylvania, and the plaintiff filed an amended complaint. In September 2017, the district court dismissed the amended complaint with prejudice. The case in the PCCP has been stayed pending final resolution of the class action. We will continue to vigorously defend this matter and to explore other options as appropriate in our best interests.
In March 2016, EPI received a CID from the U.S. Attorney’s Office for the Southern District of New York. The CID requested documents and information regarding contracts with pharmacy benefit managers regarding FROVA®. We are cooperating with this investigation.
Similar matters may be brought by others or the foregoing matters may be expanded. We are unable to predict the outcome of these matters or to estimate the possible range of any losses that could be incurred.
F-52
Other Antitrust Matters
Beginning in November 2013, multiple direct and indirect purchasers of LIDODERM® filed a number of cases against our subsidiary EPI and co-defendants Teikoku Seiyaku Co., Ltd. and Teikoku Pharma USA, Inc. (collectively, Teikoku), and Actavis plc and certain of its subsidiaries (collectively, Actavis), which was subsequently acquired by Teva Pharmaceuticals Industries Ltd and its subsidiaries from Allergan plc. Plaintiffs generally alleged that EPI, Teikoku and Actavis entered into an anticompetitive conspiracy to restrain trade through the settlement of patent infringement litigation concerning U.S. Patent No. 5,827,529 (the ‘529 patent) and other patents. Some complaints also alleged that Teikoku wrongfully listed the ‘529 patent in FDA’s Approved Drug Products with Therapeutic Equivalence Evaluations (Orange Book) as related to LIDODERM®, that EPI and Teikoku commenced sham patent litigation against Actavis and that EPI abused the FDA citizen petition process by filing a citizen petition and amendments solely to interfere with generic companies’ efforts to obtain FDA approval of their versions of LIDODERM®. The complaints asserted claims under Sections 1 and 2 of the Sherman Act (15 U.S.C. §§ 1, 2), and/or various state antitrust and consumer protection statutes, as well as common law claims, and generally sought damages, treble damages, disgorgement of profits, restitution, injunctive relief and attorneys’ fees. The cases were consolidated and/or coordinated in April 2014 in a federal MDL in the U.S. District Court for the Northern District of California (MDL No. 2521). The MDL court certified classes of direct and indirect purchasers in February 2017. In June 2017, defendants moved for summary judgment on all claims, and plaintiffs also moved for partial summary judgment on certain elements of their claims. In November 2017, the court granted defendants’ motion in part, ruling in defendants’ favor on the issues of infringement and derivation and also limiting the time period at issue. Defendants’ motions for summary judgment were denied in all other respects. The court also granted plaintiffs’ motions for summary judgment on the issues of agreement and relevant market. EPI settled with certain plaintiffs in October 2017 and reached an agreement in principle with all remaining plaintiffs in February 2018. Settlements with the direct and indirect purchaser classes will be subject to court approval.
Beginning in June 2014, multiple direct and indirect purchasers of OPANA® ER filed cases against our subsidiaries EHSI and EPI and other pharmaceutical companies, including Impax Laboratories Inc. (Impax) and Penwest Pharmaceuticals Co., which our subsidiary EPI had acquired. Some cases were filed on behalf of putative classes of direct and indirect purchasers, while others were filed on behalf of individual retailers or health care benefit plans. All cases have been consolidated and/or coordinated for pretrial proceedings in a federal MDL pending in the U.S. District Court for the Northern District of Illinois (MDL No. 2580). Plaintiffs generally allege that an agreement reached by EPI and Impax to settle patent infringement litigation concerning multiple patents pertaining to OPANA® ER and EPI’s introduction of the re-formulation of OPANA® ER violated antitrust laws. The complaints assert claims under Sections 1 and 2 of the Sherman Act, various state antitrust and consumer protection statutes and state common law. Plaintiffs generally seek damages, treble damages, disgorgement of profits, restitution, injunctive relief and attorneys’ fees. In February 2016, the MDL court issued orders (i) denying defendants’ motion to dismiss the claims of the direct purchasers, (ii) denying in part and granting in part defendants’ motion to dismiss the claims of the indirect purchasers, but giving them permission to file amended complaints and (iii) granting defendants’ motion to dismiss the complaints filed by certain retailers, but giving them permission to file amended complaints. In response to the MDL court’s orders, the indirect purchasers filed an amended complaint to which the defendants filed a renewed motion to dismiss certain claims, and certain retailers also filed amended complaints. The court has dismissed the indirect purchaser unjust enrichment claims arising under the laws of the states of California, Rhode Island and Illinois. The cases are currently in discovery. We will continue to vigorously defend these matters and to explore other options as appropriate in our best interests.
Beginning in February 2009, the FTC and certain private plaintiffs, including distributors and retailers, filed suit against our subsidiary, Par, and others alleging violations of antitrust law arising out of Par’s settlement of certain patent litigation concerning the generic version of AndroGel®. Generally, the complaints seek damages, treble damages, equitable relief, and attorneys’ fees and costs. The cases have been consolidated and/or coordinated for pretrial proceedings in a federal MDL pending in the U.S. District Court for the Northern District of Georgia (MDL No. 2084). In September 2012, the district court granted summary judgment to defendants on plaintiffs’ claims of sham litigation. In May 2016, plaintiffs representing a putative class of indirect purchasers voluntarily dismissed their case against Par with prejudice. In February 2017, the FTC voluntarily dismissed its claims against Par with prejudice. Claims by a putative class of direct purchasers and certain specific alleged direct purchasers or their assignees are still pending. In September 2017, Par moved for summary judgment on all remaining claims. We will continue to vigorously defend these matters and to explore other options as appropriate in our best interests.
In February 2018, an alleged indirect purchaser filed a proposed class action against our subsidiary PPI and others alleging a conspiracy to delay generic competition and monopolize the market for Zetia® (ezetimibe) and its generic equivalents. The complaint asserts claims under Sections 1 and 2 of the Sherman Act, various state antitrust and consumer protection statutes and state common law and seeks injunctive relief, damages, treble damages, attorneys’ fees and costs. We intend to vigorously defend this matter and to explore other options as appropriate in our best interests.
In November 2014, EPI received a CID from Florida’s Office of the Attorney General seeking documents and other information concerning EPI’s agreement with Actavis settling the LIDODERM® patent litigation, as well as information concerning marketing and sales of LIDODERM®. EPI received similar CIDs from South Carolina’s Office of the Attorney General in February 2016 and from Alaska’s Office of the Attorney General in February 2015. The Alaska CID was also directed to EHSI and included requests for documents and information concerning agreements with Actavis and Impax settling the OPANA® ER patent litigation.
F-53
In February 2015, Par and affiliates received a CID from the Office of the Attorney General for the State of Alaska seeking production of certain documents and information regarding Par’s settlement of the AndroGel® patent litigation as well as documents produced in the aforementioned litigation filed by the FTC.
We are cooperating with each of the foregoing investigations.
A fourth quarter 2017 increase to the Company’s legal reserves includes, among other things, an estimated loss for certain LIDODERM®-related claims. We will continue to vigorously defend any unresolved claims and to explore other options as appropriate in our best interests. Similar matters may be brought by others or the foregoing matters may be expanded. We are unable to predict the outcome of these matters or to estimate the possible range of any additional losses that could be incurred.
False Claims Act Litigation
Beginning in July 2006, the Attorneys General of Florida, Indiana and Virginia and the U.S. Office of Personnel Management (the USOPM) issued subpoenas, and the Attorneys General of Michigan, Tennessee, Texas and Utah issued CIDs, to our subsidiary Par, among other companies. The demands generally requested documents and information pertaining to allegations that certain of Par’s sales and marketing practices caused pharmacies to substitute ranitidine capsules for ranitidine tablets, fluoxetine tablets for fluoxetine capsules and two 7.5 mg buspirone tablets for one 15 mg buspirone tablet, under circumstances in which some state Medicaid programs at various times reimbursed the new dosage form at a higher rate than the dosage form being substituted. The aforementioned subpoenas and CIDs culminated in a qui tam action by Bernard Lisitza asserting claims under federal and state law on behalf of the U.S. and several states. The complaint was unsealed in August 2011. Lisitza’s corrected second amended complaint generally sought (i) a finding that defendants violated, and an order that they be enjoined from future violations of, the federal False Claims Act and state false claims acts; (ii) treble damages and maximum civil penalties for each violation of the federal False Claims Act and state false claims acts; (iii) an applicable percentage share of the proceeds; and (iv) expenses, fees and costs. The U.S. intervened in this action and filed a separate complaint in September 2011, alleging claims for violations of the federal False Claims Act and common law fraud. The U.S.’s second corrected complaint generally sought (i) treble damages and civil penalties for violations under the federal False Claims Act and (ii) compensatory and punitive damages for common law fraud. The states of Michigan and Indiana also intervened, asserting claims under their respective state false claim acts, as well as common law fraud and unjust enrichment claims. Michigan’s complaint generally sought treble damages, civil penalties and common law compensatory and punitive damages. Indiana’s amended complaint generally sought treble damages, costs and attorneys’ fees. In August 2017, the court granted summary judgment against Lisitza, precluding him from serving as the relator and entering judgment against all plaintiffs on whose behalf he had filed suit. The court also granted summary judgment as to the intervenors’ claims for violation of the federal False Claims Act and for common law fraud and declined to exercise supplemental jurisdiction over the remaining claims. Lisitza appealed the court’s summary judgment rulings in September 2017 but dismissed his appeal in October 2017. All remaining claims by Lisitza and the intervening states have since been resolved and the matter is now concluded.
Securities Litigation
In May 2016, a putative class action entitled Craig Friedman v. Endo International plc, Rajiv Kanishka Liyanaarchchie de Silva and Suketu P. Upadhyay was filed in the U.S. District Court for the Southern District of New York by an individual shareholder on behalf of himself and all similarly situated shareholders. In August 2016, the court appointed Steamfitters’ Industry Pension Fund and Steamfitters’ Industry Security Benefit Fund as lead plaintiffs in the action. In October 2016, plaintiffs filed a second amended complaint that, among other things, added Paul Campanelli as a defendant, and we filed a motion to dismiss. In response, and without resolving the motion, the Court permitted lead plaintiffs to file a third amended complaint. The amended complaint alleged violations of Sections 10(b) and 20(a) of the Exchange Act based on the Company’s revision of its 2016 earnings guidance and certain disclosures about its generics business, the integration of Par and its subsidiaries, certain other alleged business issues and the receipt of a CID from the U.S. Attorney’s Office for the Southern District of New York regarding contracts with pharmacy benefit managers concerning FROVA®. Lead plaintiffs sought class certification, damages in an unspecified amount and attorneys’ fees and costs. We filed a motion to dismiss the third amended complaint in December 2016. In January 2018, the Court granted our motion and dismissed the case with prejudice. In February 2018, lead plaintiffs filed a motion for relief from the judgment and leave to file a fourth amended complaint.
In February 2017, a putative class action entitled Public Employees’ Retirement System of Mississippi v. Endo International plc was filed in the Court of Common Pleas of Chester County, Pennsylvania by an institutional purchaser of shares in our June 2, 2015 public offering, on behalf of itself and all similarly situated purchasers. The lawsuit alleges violations of Sections 11, 12(a)(2) and 15 of the Securities Act of 1933 against Endo, certain of its current and former directors and officers, and the underwriters who participated in the offering, based on certain disclosures about Endo’s generics business. In March 2017, defendants removed the case to the U.S. District Court for the Eastern District of Pennsylvania. In August 2017, the court remanded the case back to the Chester County Court of Common Pleas. In October 2017, plaintiff filed an amended complaint, and defendants moved to partially stay the case pending the resolution of a pending U.S. Supreme Court case that could impact the state court’s jurisdiction. Defendants’ motion for a partial stay was granted in November 2017. In December 2017, defendants filed preliminary objections to the amended complaint.
F-54
In April 2017, a putative class action entitled Phaedra A. Makris v. Endo International plc, Rajiv Kanishka Liyanaarchchie de Silva and Suketu P. Upadhyay was filed in the Superior Court of Justice in Ontario, Canada by an individual shareholder on behalf of herself and similarly-situated Canadian-based investors who purchased Endo’s securities between January 11 and May 5, 2016. The statement of claim generally seeks class certification, declaratory relief, damages, interest and costs based on alleged violations of the Ontario Securities Act. The statement of claim alleges negligent misrepresentations concerning the Company’s revenues, profit margins and earnings per share; its receipt of a subpoena from the State of Connecticut regarding doxycycline hyclate, amitriptyline hydrochloride, doxazosin mesylate, methotrexate sodium and oxybutynin chloride; and the erosion of the Company’s U.S. generic pharmaceuticals business.
In August 2017, a putative class action entitled Bier v. Endo International plc, et al. was filed in the U.S. District Court for the Eastern District of Pennsylvania by an individual shareholder on behalf of himself and all similarly situated shareholders. The original complaint alleged violations of Section 10(b) and 20(a) of the Exchange Act against Endo and four current and former directors and officers, based on the Company’s decision to remove reformulated OPANA® ER from the market. In December 2017, SEB Investment Management AB was appointed lead plaintiff in the action. In February 2018, the lead plaintiff filed an amended complaint, which added claims alleging violations of Sections 11 and 15 of the Securities Act in connection with the June 2015 offering. The amended complaint named the Company, EHSI and twenty current and former directors, officers and employees of Endo as defendants. Defendants have not yet responded to the amended complaint.
In November 2017, a putative class action entitled Pelletier v. Endo International plc, Rajiv Kanishka Liyanaarchchie De Silva, Suketu P. Upadhyay, and Paul V. Campanelli was filed in the U.S. District Court for the Eastern District of Pennsylvania by an individual shareholder on behalf of himself and all similarly situated shareholders. The lawsuit alleges violations of Section 10(b) and 20(a) of the Exchange Act in connection with the allegations of anticompetitive conduct asserted in In re Generic Pharmaceuticals Pricing Antitrust Litigation, MDL No. 2724. In January 2018, the Chief Judge of the Eastern District of Pennsylvania designated Pelletier as related to Bier and reassigned Pelletier to the judge overseeing Bier. A lead plaintiff has not yet been selected.
We will continue to vigorously defend the foregoing matters and to explore other options as appropriate in our best interests. Similar matters may be brought by others or the foregoing matters may be expanded. We are unable to predict the outcome of these matters or to estimate the possible range of any losses that could be incurred.
VASOSTRICT® Related Matters
In July 2016, Fresenius Kabi USA, LLC (Fresenius) filed a complaint against Par and its affiliate Par Sterile Products, LLC in the U.S. District Court for the District of New Jersey alleging that Par and its affiliate engaged in an anticompetitive scheme to exclude competition from the market for vasopressin solution for intravenous injection in view of Par’s VASOSTRICT® (vasopressin) product. The complaint alleges violations of Sections 1 and 2 of the Sherman Antitrust Act, as well as state antitrust and common law, based on assertions that Par and its affiliate entered into exclusive supply agreements with one or more active pharmaceutical ingredient (API) manufacturers and that, as a result, Fresenius has been unable to obtain vasopressin API in order to file an ANDA to obtain FDA approval for its own vasopressin product. Fresenius seeks actual, treble and punitive damages, attorneys’ fees and costs, and injunctive relief. In September 2016, Par and its affiliate filed a motion to dismiss, which the district court denied in February 2017. The case is currently in discovery.
In August 2017, our subsidiaries PPI and Par Sterile Products, LLC filed a complaint for actual, exemplary and punitive damages, injunctive relief and other relief against QuVa Pharma, Inc. (QuVa), Stuart Hinchen, Peter Jenkins, and Mike Rutkowski in the U.S. District Court for the District of New Jersey. The complaint alleges misappropriation in violation of the federal Defend Trade Secrets Act, New Jersey’s Trade Secrets Act and New Jersey common law, as well as unfair competition, breach of contract, breach of fiduciary duty, breach of the duty of loyalty, tortious interference with contractual relations and breach of the duty of confidence in connection with VASOSTRICT®, a vasopressin-based cardiopulmonary drug. In October 2017, defendants answered the complaint and QuVa asserted counterclaims against PPI and Par Sterile Products, LLC alleging unfair competition under New Jersey common law and seeking declaratory judgment of non-infringement as to five U.S. Patents assigned to PPI that are listed in FDA’s Orange Book for VASOSTRICT®. The counterclaims seek actual, exemplary, and punitive damages, injunctive relief and other relief. We filed a motion to dismiss the unfair competition counterclaim in November 2017. Briefing on that motion has been completed but no ruling has been issued. Also in November 2017, we filed a motion for preliminary injunction seeking various forms of relief, including an order prohibiting defendants, and all persons working in concert with them, from selling or offering for sale any product that competes with a Par product and was developed and/or is manufactured using Par’s trade secrets. Briefing on that motion has been completed and a hearing on that motion was held in February 2018. In January 2018, we filed a first amended complaint adding five former employees of Par Sterile Products, LLC as defendants and numerous causes of action against some or all of those former employees, including misappropriation under the federal Defend Trade Secrets Act, New Jersey’s Trade Secrets Act and New Jersey common law, as well as breach of contract, breach of the duty of loyalty and breach of the duty of confidence.
F-55
In October 2017, Endo Par Innovation Company, LLC (EPIC) and Par Sterile Products, LLC (PSP) filed a complaint in the United States District Court for the District of Columbia challenging the legality of the FDA’s Interim Policy on Compounding Using Bulk Drug Substances Under Section 503B of the Federal Food, Drug, and Cosmetic Act (January 2017) with respecting to listing of vasopressin in Category 1 of the Interim Policy. The complaint contends that the Interim Policy is unlawful because it is inconsistent with the Federal, Food, Drug, and Cosmetic Act, including, but not limited to, Section 503B of that Act. The complaint seeks (i) a declaration that FDA’s Interim Policy and its listing of vasopressin in Category 1 of the Interim Policy are unlawful, and (ii) an order enjoining and vacating the Interim Policy and FDA’s listing of vasopressin in Category 1 of the Interim Policy. In January 2018, EPIC and PSP agreed to a temporary stay of the litigation in light of the FDA’s announcement that forthcoming guidance will address the concerns set forth in the Company’s complaint.
We will continue to vigorously defend or prosecute the foregoing matters as appropriate, to protect our intellectual property rights, to pursue all available legal and regulatory avenues and to explore other options as appropriate in our best interests. Similar matters may be brought by others or the foregoing matters may be expanded. We are unable to predict the outcome of these matters or to estimate the possible range of any losses that could be incurred.
Paragraph IV Certifications on OPANA® ER
In late 2012, two patents (U.S. Patent Nos. 8,309,122 and 8,329,216) were issued to EPI covering OPANA® ER (oxymorphone hydrochloride extended-release tablets CII). In December 2012, EPI filed a complaint against Actavis in U.S. District Court for the Southern District of New York for patent infringement based on its ANDA for a non-INTAC® technology version of OPANA® ER. In May 2013 and June 2013, EPI filed similar suits in the U.S. District Court for the Southern District of New York against the following applicants for non-INTAC® technology OPANA® ER: Roxane Laboratories, Inc. (Roxane) and Ranbaxy Laboratories Limited, which was acquired by Sun Pharmaceutical Industries Ltd. (Ranbaxy). Those suits allege infringement of U.S. Patent Nos. 7,851,482, 8,309,122 and 8,329,216. In July 2013, Actavis and Roxane were granted FDA approval to market all strengths of their respective non-INTAC® technology formulations of OPANA® ER. In September 2013, Actavis launched its generic version of non-crush-resistant OPANA® ER 5, 10, 20, 30 and 40 mg tablets. A trial in this case was held from March 2015 through April 2015 in the U.S. District Court for the Southern District of New York. In August 2015, the District Court ruled that all defendants infringed the claims of U.S. Patent Nos. 8,309,122 and 8,329,216. The District Court also ruled that the defendants failed to show that U.S. Patent Nos. 8,309,122 and 8,329,216 were invalid, enjoined the defendants from launching their generic products until the expiration of those patents and directed Actavis to withdraw its generic product within 60 days. In October 2015, the District Court tolled the 60-day period until it decided two pending post-trial motions. In April 2016, the District Court issued an order upholding its August 2015 ruling in EPI’s favor and confirming the prior injunction against the manufacture or sale of the generic version of the non-INTAC® technology OPANA® ER currently offered by Actavis and the additional approved but not yet marketed generic version of the product developed by Roxane. The defendants filed appeals to the Court of Appeals for the Federal Circuit. EPI continued its suit for damages for Actavis’s sales of its infringing generic version of OPANA® ER. In August 2017, EPI settled the damages portion of this suit with Actavis. As a result of that settlement, EPI received $25 million from Actavis in August 2017. We intend to continue vigorously asserting our intellectual property rights and to oppose any such appeal.
From September 21, 2012 through October 30, 2013, EPI and its partner Grünenthal received Paragraph IV Notices from each of Teva Pharmaceuticals USA, Inc., Amneal Pharmaceuticals, LLC (Amneal), ThoRx Laboratories, Inc. (ThoRx), Actavis, Impax and Ranbaxy (now Sun Pharmaceutical Industries Ltd.), advising of the filing by each such company of an ANDA for a generic version of the formulation of OPANA® ER with INTAC® technology. These Paragraph IV Notices refer to U.S. Patent Nos. 7,851,482, 8,075,872, 8,114,383, 8,192,722, 8,309,060, 8,309,122 and 8,329,216, which variously cover the formulation of OPANA® ER, a highly pure version of the active pharmaceutical ingredient and the release profile of OPANA® ER. EPI filed lawsuits against each of these filers in the U.S. District Court for the Southern District of New York. Each lawsuit was filed within the 45-day deadline to invoke a 30-month stay of FDA approval pursuant to the Hatch-Waxman legislative scheme. A trial in this case was held from March 2015 through April 2015 in the U.S. District Court for the Southern District of New York against the remaining filers. In August 2015, the District Court issued an Opinion holding that all defendants infringed the claims of U.S. Patent Nos. 8,309,060, 8,309,122 and 8,329,216. The Opinion also held that the defendants had shown that U.S. Patent No. 8,309,060 was invalid, but that the defendants had failed to show that U.S. Patent Nos. 8,309,122 and 8,329,216 were invalid. The District Court also issued an Order enjoining the defendants from launching their generic products until the expiration of U.S. Patent Nos. 8,309,122 and 8,329,216. The defendants filed appeals to the Court of Appeals for the Federal Circuit. An argument was held at the Federal Circuit on this appeal in December 2017. No opinion has yet been issued. We intend to continue to vigorously assert our intellectual property and oppose appeals by the defendants. However, there can be no assurance that we and/or Grünenthal will be successful. If we are unsuccessful and Teva, Amneal, ThoRx, Actavis or Impax is able to obtain FDA approval of its product, generic versions of OPANA® ER INTAC® technology may be launched prior to the applicable patents’ expirations in 2023. Additionally, we cannot predict or determine the timing or outcome of this defense but will explore all options as appropriate in our best interests.
F-56
In August 2014 and October 2014, the U.S. Patent Office issued U.S. Patent Nos. 8,808,737 and 8,871,779 respectively, which cover a method of using OPANA® ER and a highly pure version of the active pharmaceutical ingredient of OPANA® ER. In November 2014, EPI filed lawsuits against Teva, ThoRx, Actavis, Impax, Ranbaxy, Roxane, Amneal and Sandoz Inc. based on their ANDAs filed against both the INTAC® technology and non-INTAC® technology versions of OPANA® ER. Those lawsuits were filed in the U.S. District Court for the District of Delaware alleging infringement of these new patents, which expire in 2027 and 2029, respectively. On November 17, 2015, the District Court held the ‘737 patent invalid for claiming unpatentable subject matter. That patent has been dismissed from all suits and the suits administratively closed as to that patent, subject to appeal at the end of the case on the ‘779 patent. In July 2016, a three-day trial was held in the U.S. District Court for the District of Delaware against Teva and Amneal for infringement of the ‘779 patent. In October 2016, the District Court issued an Opinion holding that the defendants infringed the claims of U.S. Patent No. 8,871,779. The Opinion also held that the defendants had failed to show that U.S. Patent No. 8,871,779 was invalid. The District Court issued an Order enjoining the defendants from launching their generic products until the expiration of U.S. Patent No. 8,871,779 in November 2029. A trial for infringement of the ‘799 patent by Actavis was held in February 2017 in the same court (U.S. District Court for the District of Delaware) in front of the same judge. In August 2017, the District Court issued an Opinion holding that Actavis infringed the claims of U.S. Patent No. 8,871,779, and that Actavis had failed to show that U.S. Patent No. 8,871,779 was invalid. Teva, Amneal and Actavis have appealed these holdings. We have appealed the holding that the ‘737 patent is invalid.
We will continue to vigorously defend or prosecute the foregoing matters as appropriate, to protect our intellectual property rights, to pursue all available legal and regulatory avenues and to explore other options as appropriate in our best interests in defense of both the non-INTAC® technology formulation OPANA® ER and the INTAC® technology formulation OPANA® ER, including enforcement of the product’s intellectual property rights and approved labeling. We are unable to predict the outcome of these matters or to estimate the possible range of any losses that could be incurred.
Other Proceedings and Investigations
Proceedings similar to those described above may also be brought in the future. Additionally, we are involved in, or have been involved in, arbitrations or various other proceedings that arise from the normal course of our business. We cannot predict the timing or outcome of these other proceedings. Currently, neither we nor our subsidiaries are involved in any other proceedings that we expect to have a material effect on our business, financial condition, results of operations and cash flows.
Leases
We lease certain fixed assets under capital leases that expire through 2024. We lease automobiles, machinery and equipment and facilities under certain noncancelable operating leases that expire through 2028. These leases are renewable at our option.
On October 28, 2011, our subsidiary EPI entered into a lease agreement for a new Company headquarters in Malvern, Pennsylvania. The initial term of the lease was through 2024 and includes three renewal options, each for an additional 60-month period. This lease is accounted for as a direct financing arrangement whereby the Company recorded, over the construction period, the full cost of the asset in Property, plant and equipment, net. A corresponding liability was also recorded, net of leasehold improvements paid for by the Company, and is being amortized over the expected lease term through monthly rental payments using an effective interest method. At December 31, 2017, there was a liability of $38.4 million related to this arrangement, $4.6 million of which is included in Accounts payable and accrued expenses and $33.8 million of which is included in Other liabilities in the accompanying Consolidated Balance Sheet.
A summary of minimum future rental payments required under capital and operating leases as of December 31, 2017 are as follows (in thousands):
Capital Leases (1)(2) | Operating Leases | ||||||
2018 | $ | 6,713 | $ | 13,888 | |||
2019 | 6,633 | 14,120 | |||||
2020 | 6,564 | 13,505 | |||||
2021 | 6,681 | 11,758 | |||||
2022 | 6,831 | 11,212 | |||||
Thereafter | 14,126 | 23,703 | |||||
Total minimum lease payments | $ | 47,548 | $ | 88,186 | |||
Less: Amount representing interest | 4,168 | ||||||
Total present value of minimum payments | $ | 43,380 | |||||
Less: Current portion of such obligations | 6,713 | ||||||
Long-term capital lease obligations | $ | 36,667 | |||||
__________
(1) | The direct financing arrangement is included under Capital Leases. |
F-57
(2) | We have entered into agreements to sublease certain properties. Most significantly, we sublease approximately 90,000 square feet of our Malvern, Pennsylvania headquarters and substantially all of our Chesterbrook, Pennsylvania facility. As of December 31, 2017, we expect to receive approximately $25.2 million in future minimum rental payments over the remaining terms of the Malvern and Chesterbrook subleases from 2018 until 2024. Amounts included in this table have not been reduced by the minimum sublease rentals. |
Expenses incurred under operating leases were $18.7 million, $22.2 million and $20.1 million for the years ended December 31, 2017, 2016 and 2015, respectively.
NOTE 15. OTHER COMPREHENSIVE LOSS
The following table presents the tax effects allocated to each component of Other comprehensive income (loss) for the years ended December 31, 2017, 2016 and 2015 (in thousands):
2017 | 2016 | 2015 | |||||||||||||||||||||||||||||||||
Before-Tax Amount | Tax Benefit (Expense) | Net-of-Tax Amount | Before-Tax Amount | Tax Benefit (Expense) | Net-of-Tax Amount | Before-Tax Amount | Tax (Expense) Benefit | Net-of-Tax Amount | |||||||||||||||||||||||||||
Net unrealized (loss) gain on securities: | |||||||||||||||||||||||||||||||||||
Unrealized (loss) gain arising during the period | $ | (811 | ) | $ | 296 | $ | (515 | ) | $ | (1,588 | ) | $ | 674 | $ | (914 | ) | $ | 2,349 | $ | (50 | ) | $ | 2,299 | ||||||||||||
Less: reclassification adjustments for gain realized in net loss | — | — | — | (6 | ) | — | (6 | ) | — | — | — | ||||||||||||||||||||||||
Net unrealized (losses) gains | $ | (811 | ) | $ | 296 | $ | (515 | ) | $ | (1,594 | ) | $ | 674 | $ | (920 | ) | 2,349 | (50 | ) | 2,299 | |||||||||||||||
Net unrealized gain (loss) on foreign currency: | |||||||||||||||||||||||||||||||||||
Foreign currency translation gain (loss) arising during the period | 31,202 | — | 31,202 | 18,267 | 13,462 | 31,729 | (263,425 | ) | (21,297 | ) | (284,722 | ) | |||||||||||||||||||||||
Less: reclassification adjustments for loss realized in net loss | 112,926 | — | 112,926 | — | — | — | 25,557 | 158 | 25,715 | ||||||||||||||||||||||||||
Foreign currency translation gain (loss) | $ | 144,128 | $ | — | $ | 144,128 | $ | 18,267 | $ | 13,462 | $ | 31,729 | (237,868 | ) | (21,139 | ) | (259,007 | ) | |||||||||||||||||
Other comprehensive income (loss) | $ | 143,317 | $ | 296 | $ | 143,613 | $ | 16,673 | $ | 14,136 | $ | 30,809 | $ | (235,519 | ) | $ | (21,189 | ) | $ | (256,708 | ) | ||||||||||||||
Reclassification adjustments out of Other comprehensive income (loss) related to foreign currency translation were recorded upon the liquidation of Litha and Somar during 2017 and the AMS Men’s Health and Prostate Health businesses during 2015.
The following is a summary of the accumulated balances related to each component of Other comprehensive income (loss), net of taxes, at December 31, 2017 and December 31, 2016 (in thousands):
December 31, 2017 | December 31, 2016 | ||||||
Net unrealized gains | $ | 380 | $ | 895 | |||
Foreign currency translation loss | (210,201 | ) | (354,329 | ) | |||
Accumulated other comprehensive loss | $ | (209,821 | ) | $ | (353,434 | ) | |
NOTE 16. SHAREHOLDERS' EQUITY
On February 11, 2014, the Company issued 4,000,000 euro deferred shares of $0.01 each at par. The euro deferred shares are held by nominees in order to satisfy an Irish legislative requirement to maintain a minimum level of issued share capital denominated in euro and to have at least seven registered shareholders. The euro deferred shares carry no voting rights and are not entitled to receive any dividend or distribution.
On January 29, 2015, the Company acquired Auxilium for total consideration of $2.6 billion. The consideration included 18,609,835 ordinary shares valued at $1.52 billion. The acquisition is described in more detail in Note 5. Acquisitions.
F-58
On June 10, 2015, we completed the sale of 27,627,628 ordinary shares, including 3,603,603 ordinary shares sold upon the exercise in full by the underwriters of their option to purchase additional ordinary shares from us, at a price of $83.25 per share, for aggregate gross proceeds to us of $2.30 billion, before fees, in order to finance a portion of the Par acquisition, which is described in more detail in Note 5. Acquisitions. On September 25, 2015, the Company acquired Par for total consideration of $8.14 billion. The consideration included 18,069,899 ordinary shares valued at $1.33 billion.
During the year ended December 31, 2015, the Company completed a buy-out of the noncontrolling interest associated with its Litha subsidiary. The following table reflects the effect on the Company’s equity for the year ended December 31, 2015 (in thousands):
2015 | |||
Adjustment to Accumulated other comprehensive loss related to the reallocation (from noncontrolling to controlling interests) of foreign currency translation loss attributable to our noncontrolling interest in Litha | $ | (3,904 | ) |
Decrease in noncontrolling interests for buy-out of Litha | (32,732 | ) | |
Decrease in additional paid-in capital for buy-out of Litha | (2,972 | ) | |
Total cash consideration paid related to buy-out of Litha | $ | (39,608 | ) |
Share Repurchase Program
The Company has broad shareholder authority pursuant to Article 11 of the Company’s Articles of Association to conduct repurchase by way of redemptions of its ordinary shares.
Pursuant to the 2014 Share Buyback Authority, in April 2015, our Board of Directors approved a share buyback program (the 2015 Share Buyback Program). The 2015 Share Buyback Program authorized the Company to redeem in the aggregate $2.5 billion of its outstanding ordinary shares. As permitted by Irish Law and the Company’s Articles of Association, all ordinary shares redeemed under the 2015 Share Buyback Program shall be cancelled upon redemption.
In November 2015, the Company entered into a program to repurchase by way of redemption up to $250.0 million of its ordinary shares under the 2015 Share Buyback Program. The Company redeemed and cancelled approximately 4.4 million of its ordinary shares during November 2015 totaling $250.0 million, not including related fees.
NOTE 17. SHARE-BASED COMPENSATION
As discussed in Note 3. Discontinued Operations and Assets and Liabilities Held for Sale, the operating results of the Company’s AMS businesses are reported as Discontinued operations, net of tax in the Consolidated Statements of Operations for all periods presented. However, as share-based compensation is not material for these businesses, amounts in this Note 17. Share-based Compensation have not been adjusted to exclude the impact of these businesses.
Stock Incentive Plans
In June 2015, the Company’s shareholders approved the 2015 Stock Incentive Plan (the 2015 Plan). As of the effective date of the 2015 Plan, 10.0 million ordinary shares, including the transfer of 5.0 million ordinary shares available to be granted under the previous 2010 Stock Incentive Plan, were reserved for the granting of stock options (including incentive stock options), stock appreciation rights, restricted stock awards, performance awards and other share-based awards, which may be issued at the discretion of the Company’s board of directors from time to time. Upon the approval of the 2015 Plan, no additional ordinary shares were to be granted under the previously approved plans, including the Company’s 2000, 2004, 2007, 2010 and Assumed Stock Incentive Plans. All awards previously granted and outstanding under the prior plans remain subject to the terms of those prior plans.
During the second quarter of 2017, the Company’s shareholders approved an amendment to the 2015 Plan. The plan was amended and restated to increase the number of the Company’s ordinary shares that may be issued with respect to awards under the Plan by 10.0 million ordinary shares and to make certain other changes to the Plan’s terms. The shares were registered in August 2017.
During the third quarter of 2017, the Company issued approximately 1.0 million stock options and 0.1 million restricted stock units for which a grant date has not been established as the awards are subject to shareholder approval at the Company’s 2018 Annual General Meeting of Shareholders. If approved, the options will have an exercise price equal to the closing share price on their issuance date in August 2017. Additionally, at December 31, 2017, there are 0.3 million performance share units, representing target amounts, for which a grant date has not yet been established.
At December 31, 2017, approximately 8.8 million ordinary shares were reserved for future grants under the 2015 Plan. Options and awards which have been issued but for which a grant date has not yet been established are excluded from this amount.
As of December 31, 2017, stock options, restricted stock awards, performance stock units and restricted stock units have been granted under the stock incentive plans.
F-59
Generally, the grant-date fair value of each award is recognized as expense over the requisite service period. However, expense recognition differs in the case of certain performance share units where the ultimate payout is performance-based. For these awards, at each reporting period, the Company estimates the ultimate payout and adjusts the cumulative expense based on its estimate and the percent of the requisite service period that has elapsed.
The Company recognized share-based compensation expense of $50.1 million, $59.8 million and $98.8 million during the years ended December 31, 2017, 2016 and 2015, respectively. The share-based compensation expense recognized during the year ended December 31, 2015 includes a charge related to the acceleration of Auxilium employee equity awards at closing of $37.6 million and $11.4 million of expense related to certain AMS equity awards modified in conjunction with the anticipated sale of the business. The AMS amounts are recorded in Discontinued Operations, net of tax. As of December 31, 2017, the total remaining unrecognized compensation cost related to all non-vested share-based compensation awards for which a grant date has been established as of December 31, 2017 amounted to $58.2 million.
Presented below is the allocation of share-based compensation as recorded in our Consolidated Statements of Operations for the years ended December 31, 2017, 2016 and 2015 (in thousands).
2017 | 2016 | 2015 | |||||||||
Selling, general and administrative expenses | $ | 38,292 | $ | 54,176 | $ | 79,928 | |||||
Research and development expenses | 4,197 | 2,440 | 2,388 | ||||||||
Cost of revenues | 7,660 | 2,040 | 2,241 | ||||||||
Discontinued operations (Note 3) | — | 1,113 | 14,231 | ||||||||
Total share-based compensation expense | $ | 50,149 | $ | 59,769 | $ | 98,788 | |||||
Stock Options
During the years ended December 31, 2017, 2016 and 2015, the Company granted stock options to employees of the Company as part of their annual share compensation award and, in certain circumstances, on an ad hoc basis or upon their commencement of service with the Company. For options for which a grant date has not yet occurred, no fair value has been established and these options are not reflected in any of the amounts in this “Stock Options” section.
Employee stock options generally vest ratably, in equal amounts, over a three or four-year service period and expire ten years from the grant date. The fair value of option grants is estimated at the date of grant using the Black-Scholes option-pricing model. This model utilizes assumptions related to volatility, the risk-free interest rate, the dividend yield (which is assumed to be zero as the Company has not paid cash dividends to date and does not currently expect to pay cash dividends) and the expected term of the option. Expected volatilities utilized in the model are based mainly on the historical volatility of the Company’s share price over a period commensurate with the expected life of the share option as well as other factors. The risk-free interest rate is derived from the U.S. Treasury yield curve in effect at the time of grant. We estimate the expected term of options granted based on our historical experience with our employees’ exercise of stock options and other factors.
F-60
A summary of the activity for each of the years ended December 31, 2017, 2016 and 2015 is presented below:
Number of Shares | Weighted Average Exercise Price | Weighted Average Remaining Contractual Term | Aggregate Intrinsic Value (1) | |||||||||
Outstanding as of January 1, 2015 | 3,063,352 | $ | 40.15 | |||||||||
Granted | 794,757 | $ | 77.27 | |||||||||
Exercised | (880,885 | ) | $ | 30.93 | ||||||||
Forfeited | (201,397 | ) | $ | 72.24 | ||||||||
Expired | (7,260 | ) | $ | 45.20 | ||||||||
Outstanding as of December 31, 2015 | 2,768,567 | $ | 51.56 | |||||||||
Granted | 2,578,105 | $ | 35.45 | |||||||||
Exercised | (62,589 | ) | $ | 31.19 | ||||||||
Forfeited | (858,556 | ) | $ | 52.27 | ||||||||
Expired | (100,318 | ) | $ | 60.71 | ||||||||
Outstanding as of December 31, 2016 | 4,325,209 | $ | 41.70 | |||||||||
Granted | 5,288,675 | $ | 10.42 | |||||||||
Forfeited | (623,987 | ) | $ | 28.32 | ||||||||
Expired | (741,767 | ) | $ | 40.29 | ||||||||
Outstanding as of December 31, 2017 | 8,248,130 | $ | 22.79 | 7.87 | $ | 493,979 | ||||||
Vested and expected to vest as of December 31, 2017 | 7,633,410 | $ | 23.46 | 7.76 | $ | 435,456 | ||||||
Exercisable as of December 31, 2017 | 1,826,250 | $ | 42.39 | 3.99 | $ | — | ||||||
__________
(1) | The intrinsic value of a stock option is the excess, if any, of the closing price of the Company’s ordinary shares on the last trading day of the fiscal year over the exercise price. The aggregate intrinsic values presented in the table above represent sum of the intrinsic values of all corresponding stock options that are “in-the-money.” |
The range of exercise prices for the above stock options outstanding at December 31, 2017 is from $7.55 to $89.68.
No options were exercised during the year ended December 31, 2017. The total intrinsic value of options exercised during the years ended December 31, 2016 and 2015 was $1.3 million and $27.2 million, respectively. No tax benefits from stock option exercises were realized during the years ended December 31, 2017 and 2016. Tax benefits from stock option exercises during the year ended December 31, 2015 were $11.7 million. The weighted average grant date fair value of the stock options granted in the years ended December 31, 2017, 2016 and 2015 was $4.73, $11.46 and $21.09 per option, respectively, determined using the following average assumptions:
2017 | 2016 | 2015 | ||||||
Expected term (years) | 4.0 | 4.0 | 4.0 | |||||
Risk-free interest rate | 1.7 | % | 1.1 | % | 1.3 | % | ||
Dividend yield | — | — | — | |||||
Expected volatility | 58 | % | 43 | % | 32 | % | ||
As of December 31, 2017, the weighted average remaining requisite service period of the non-vested stock options was 2.5 years and the total remaining unrecognized compensation cost related to non-vested stock options amounted to $21.1 million.
Restricted Stock Units and Performance Share Units
During the years ended December 31, 2017, 2016 and 2015, the Company granted restricted stock units (RSUs) and performance share units (PSUs) to employees of the Company as part of their annual share compensation award and, in certain circumstances, on an ad hoc basis or upon their commencement of service with the Company. For RSUs and PSUs for which a grant date has not yet occurred, no fair value has been established and these awards are not reflected in any of the amounts in this “Restricted Stock Units and Performance Share Units” section.
RSUs vest ratably, in equal amounts, over a three or four-year service period. PSUs vest in full after a three-year service period and are conditional upon the achievement of performance or market conditions established by the compensation committee of the Board of Directors.
F-61
PSUs granted in 2017 were based upon two discrete measures: relative total shareholder return (TSR) and a free cash flow performance metric. The free cash flow performance metric, which accounts for 50% of the PSU award at grant, will be measured annually over a 3-year performance cycle. The remaining 50% of the PSU award is tied exclusively to relative TSR performance, which will be measured against the 3-year TSR of a custom index of companies. The actual number of shares awarded is adjusted to between zero and 200% of the target award amount based upon achievement of certain goals. In addition to meeting the conditions required by both the TSR and free cash flow portions of the awards, grant recipients are also subject to being employed by the Company following the completion of the 3-year period in order to receive the awards. TSR relative to peers is considered a market condition under applicable authoritative guidance, while the free cash flow measure is considered performance condition.
In 2016, PSU grants are tied to relative TSR performance, which will be measured against the 3-year TSR of a custom index of companies, with maximum payout levels also based on absolute compounded annual growth rate (CAGR) stock price objectives. Each award covered a 3-year performance cycle. The actual number of shares awarded is adjusted to between zero and 300% of the target award amount based upon achievement of pre-determined relative TSR and CAGR stock price goals. TSR relative to peers is considered a market condition under applicable authoritative guidance.
Starting in 2014 and continuing in 2015, PSU grants are tied to the attainment of absolute CAGR for the Company’s ordinary share price, which is considered a market condition under applicable authoritative guidance. Each award covers a 3-year performance cycle. The actual number of shares awarded is adjusted to between zero and 300% of the target award amount based upon achievement of pre-determined CAGR goals.
RSUs are valued based on the closing price of Endo’s ordinary shares on the date of grant. PSUs with TSR conditions are valued using a Monte-Carlo variant valuation model, while those with adjusted free cash flow conditions are valued taking into consideration the probability of achieving the specified performance goal. The Monte-Carlo variant valuation model considered a variety of potential future share prices for Endo as well as our peer companies in a selected market index.
A summary of our nonvested RSUs and PSUs for the years ended December 31, 2017, 2016 and 2015 is presented below:
Number of Shares | Aggregate Intrinsic Value (1) | |||||
Nonvested as of January 1, 2015 | 1,654,753 | |||||
Granted | 927,214 | |||||
Forfeited | (251,351 | ) | ||||
Vested | (523,763 | ) | ||||
Nonvested as of December 31, 2015 | 1,806,853 | |||||
Granted | 1,582,429 | |||||
Forfeited | (975,994 | ) | ||||
Vested | (728,228 | ) | ||||
Nonvested as of December 31, 2016 | 1,685,060 | |||||
Granted | 4,168,477 | |||||
Forfeited | (552,981 | ) | ||||
Vested | (575,883 | ) | ||||
Nonvested as of December 31, 2017 | 4,724,673 | $ | 36,616,216 | |||
Vested and expected to vest as of December 31, 2017 | 4,337,839 | $ | 33,618,256 | |||
__________
(1) | The aggregate intrinsic values of RSUs and PSUs presented in the table above are calculated by multiplying the closing price of the Company’s ordinary shares on the last trading day of the fiscal year by the corresponding number of RSUs and PSUs. |
As of December 31, 2017, the weighted average remaining requisite service period of these units was 2.1 years. The weighted average grant date fair value of the units granted during the years ended December 31, 2017, 2016 and 2015 was $11.42, $43.52 and $72.34 per unit, respectively. As of December 31, 2017, the total remaining unrecognized compensation cost related to non-vested RSUs and PSUs amounted to $30.8 million and $6.3 million, respectively.
F-62
NOTE 18. OTHER EXPENSE (INCOME), NET
The components of Other (income) expense, net for the for the years ended December 31, 2017, 2016 and 2015 are as follows (in thousands):
2017 | 2016 | 2015 | |||||||||
Foreign currency (gain) loss, net | $ | (2,801 | ) | $ | 2,991 | (23,058 | ) | ||||
Equity loss (earnings) from investments accounted for under the equity method, net | 898 | (1,190 | ) | 3,217 | |||||||
Other-than-temporary impairment of equity investment | — | — | 18,869 | ||||||||
Legal settlement | — | — | (12,500 | ) | |||||||
Costs associated with unused financing commitments | — | — | 78,352 | ||||||||
Other miscellaneous, net | (15,120 | ) | (2,139 | ) | (1,189 | ) | |||||
Other (income) expense, net | $ | (17,023 | ) | $ | (338 | ) | $ | 63,691 | |||
Foreign currency (gain) loss, net results from the remeasurement of the Company’s foreign currency denominated assets and liabilities. In 2017, other miscellaneous, net includes a $10.1 million gain resulting from the sale of Litha, as further described in Note 3. Discontinued Operations and Assets and Liabilities Held for Sale. During 2015, the Company recognized an other-than-temporary impairment of its Litha joint venture investment, totaling $18.9 million, reflecting the excess carrying amount of this investment over its estimated fair value. In addition, the Company incurred $78.4 million during 2015 related to unused commitment fees primarily associated with financing for the Par acquisition.
NOTE 19. INCOME TAXES
Tax Reform
The TCJA, which was signed into law on December 22, 2017, has resulted in significant changes to the U.S. corporate income tax system. In addition to the reduction of the U.S. statutory federal corporate income tax rate from 35% to 21% effective January 1, 2018, the TCJA contains a broad range of provisions, many of which differ significantly from those contained in previous U.S. tax law. Key provisions of the TCJA, which generally became effective January 1, 2018, include expanded limitations on the deductibility of interest, immediate expensing of capital expenditures, the creation of a new anti-base erosion minimum tax system that among other things limits the deductibility of certain payments made to related foreign entities, the introduction of a territorial tax system beginning in 2018, a one-time deemed repatriation of foreign earnings subject to a transition tax and the modification or repeal of many business deductions and credits. Although the rate of U.S. federal income tax will be reduced in the future, changes in tax rates and laws are accounted for in the period of enactment. Therefore, during the year ended December 31, 2017, we recorded a benefit of $36.2 million as our current estimate of the provisions of the TCJA. This benefit, which is primarily related to remeasurement of deferred tax liabilities related to tax deductible goodwill, has been recorded in our Consolidated Statements of Operations as Income tax benefit.
We have recorded the aforementioned net benefit based on currently available information and interpretations of the TCJA. In accordance with authoritative guidance issued by the SEC, the income tax effect for certain aspects of the TCJA may represent provisional amounts for which our accounting is incomplete but a reasonable estimate could be determined and recorded during the fourth quarter of 2017. We consider amounts related to the various transition rules and interpretations of the TCJA to be provisional. Accordingly, we will continue to evaluate the impacts of the TCJA, including administrative and regulatory guidance as it becomes available. The measurement and existence of current and non-current income tax payables and/or the remeasurement of deferred tax assets and liabilities may change upon finalization of our analysis, which is expected to occur no later than one year from the date of the TCJA’s enactment. Any adjustment to a provisional amount identified during the one-year measurement period will be recorded as an income tax expense or benefit in the period the adjustment is determined.
Income (Loss) Before Income Taxes
Our operations are conducted through our various subsidiaries in numerous jurisdictions throughout the world. We have provided for income taxes based upon the tax laws and rates in the countries in which our operations are conducted.
The components of our Loss from continuing operations before income tax by geography for the years ended December 31, 2017, 2016 and 2015 are as follows (in thousands):
2017 | 2016 | 2015 | |||||||||
United States | $ | (1,866,222 | ) | $ | (4,309,211 | ) | $ | (626,740 | ) | ||
International | 383,218 | 385,355 | (811,124 | ) | |||||||
Total (loss) income from continuing operations before income tax | $ | (1,483,004 | ) | $ | (3,923,856 | ) | $ | (1,437,864 | ) | ||
F-63
Income tax from continuing operations consists of the following for the years ended December 31, 2017, 2016 and 2015 (in thousands):
2017 | 2016 | 2015 | |||||||||
Current: | |||||||||||
U.S. Federal | $ | (86,478 | ) | $ | 18,369 | $ | (308,909 | ) | |||
U.S. State | (6,462 | ) | 9,501 | (5,600 | ) | ||||||
International | (1,224 | ) | 22,851 | 16,722 | |||||||
Total current income tax | $ | (94,164 | ) | $ | 50,721 | $ | (297,787 | ) | |||
Deferred: | |||||||||||
U.S. Federal | $ | (124,682 | ) | $ | (661,484 | ) | $ | (779,757 | ) | ||
U.S. State | (3,225 | ) | (239 | ) | (70,221 | ) | |||||
International | (28,222 | ) | (83,619 | ) | (9,376 | ) | |||||
Total deferred income tax | $ | (156,129 | ) | $ | (745,342 | ) | $ | (859,354 | ) | ||
Excess tax benefits of stock compensation exercised | $ | — | $ | (5,463 | ) | $ | 19,676 | ||||
Valuation allowance | — | — | — | ||||||||
Total income tax | $ | (250,293 | ) | $ | (700,084 | ) | $ | (1,137,465 | ) | ||
Tax Rate
A reconciliation of income tax from continuing operations at the U.S. federal statutory income tax rate to the total income tax provision from continuing operations for the years ended December 31, 2017, 2016 and 2015 is as follows (in thousands):
2017 | 2016 | 2015 | |||||||||
Notional U.S. federal income tax provision at the statutory rate | $ | (519,051 | ) | $ | (1,373,350 | ) | $ | (503,271 | ) | ||
State income tax, net of federal benefit | (11,473 | ) | 5,182 | (45,823 | ) | ||||||
U.S. tax reform impact | (36,216 | ) | — | — | |||||||
Uncertain tax positions | 58,120 | (18,111 | ) | 30,974 | |||||||
Residual tax on non-U.S. net earnings | (1,350,811 | ) | (301,666 | ) | (359,831 | ) | |||||
Effects of outside basis differences | — | (636,134 | ) | (786,130 | ) | ||||||
Non-deductible goodwill impairment | 60,808 | 926,881 | 248,403 | ||||||||
Change in valuation allowance | 1,648,836 | 762,604 | 278,339 | ||||||||
Intra-entity transfers of assets | (53,509 | ) | (92,859 | ) | — | ||||||
International Pharmaceuticals segment divestitures | (56,092 | ) | — | — | |||||||
Other | 9,095 | 27,369 | (126 | ) | |||||||
Income tax | $ | (250,293 | ) | $ | (700,084 | ) | $ | (1,137,465 | ) | ||
During the year ended December 31, 2017, the tax benefit primarily related to pre-tax losses incurred by certain U.S. subsidiaries. During the year ended December 31, 2016, the Company recorded a $636.1 million net tax benefit related to worthless stock deductions that are reflected as a component of benefits from outside basis differences. During the year ended December 31, 2015, the Company recorded a $674.2 million net tax benefit predominately related to a worthless stock deduction directly attributable to mesh product liability losses that is reflected as a component of benefits from outside basis differences. The Company claimed the worthless stock deduction on its 2015 U.S. Federal and State income tax returns.
F-64
Deferred Tax Assets and Liabilities
Deferred income taxes result from temporary differences between the amount of assets and liabilities recognized for financial reporting and tax purposes. Excluding assets and liabilities held for sale, the significant components of the net deferred income tax liability shown on the balance sheets as of December 31, 2017 and 2016 are as follows (in thousands):
2017 | 2016 | ||||||
Deferred tax assets: | |||||||
Accrued expenses and customer allowances | $ | 299,142 | $ | 232,101 | |||
Compensation related to stock options | 20,108 | 24,246 | |||||
Deferred interest expense | 46,230 | 57,440 | |||||
Fixed assets and intangible assets | 484,313 | 55,473 | |||||
Loss on capital assets | 49,585 | 9,904 | |||||
Net operating loss carryforward | 7,183,651 | 4,410,386 | |||||
Other | 32,356 | 30,262 | |||||
Research and development credit carryforward | 4,838 | 4,244 | |||||
Tax credit carryforwards | 1,516 | 4,520 | |||||
Uncertain tax positions | 4,364 | 10,562 | |||||
Total gross deferred income tax assets | $ | 8,126,103 | $ | 4,839,138 | |||
Deferred tax liabilities: | |||||||
Other | $ | (2,042 | ) | $ | — | ||
Outside basis difference | (92,635 | ) | (182,409 | ) | |||
Total gross deferred income tax liabilities | $ | (94,677 | ) | $ | (182,409 | ) | |
Valuation allowance | (8,062,975 | ) | (4,841,209 | ) | |||
Net deferred income tax liability | $ | (31,549 | ) | $ | (184,480 | ) | |
At December 31, 2017, the Company had the following significant deferred tax assets for net operating and capital loss carryforwards, net of unrecognized tax benefits (in thousands):
Jurisdiction | 2017 | Begin to Expire | ||||
Ireland | $ | 43,965 | indefinite | |||
Luxembourg | $ | 6,847,805 | 2034 | |||
United States: | ||||||
Federal-ordinary losses | $ | 115,518 | 2020 | |||
Federal-capital losses | $ | 27,114 | 2022 | |||
State-ordinary losses | $ | 172,439 | 2018 | |||
State-capital losses | $ | 20,920 | 2026 | |||
A valuation allowance is required when it is more likely than not that all or a portion of a deferred tax asset will not be realized. The Company assesses the available positive and negative evidence to estimate if sufficient future taxable income will be generated to use the existing deferred tax assets. The amount of the deferred tax asset considered realizable, however, could be adjusted if estimates of future taxable income during the carryforward period are reduced or increased, or if objective negative evidence, in the form of cumulative losses, is no longer present and additional weight may be given to subjective evidence, such as projections for growth.
The Company has recorded a valuation allowance against certain jurisdictional net operating loss carryforwards and other tax attributes. As of December 31, 2017 and 2016, the total valuation allowance, including amounts classified as held for sale, was $8,063.0 million and $4,841.2 million, respectively. During the years ended December 31, 2017 and 2016, the Company increased its valuation allowance in the amount of $3,221.8 million and $4,414.2 million, respectively. The net increase in the Company’s valuation allowance in 2017 was primarily driven by: (i) $3,310.8 million related to losses within jurisdictions unable to support recognition of a deferred tax asset, of which the largest jurisdiction was Luxembourg, where the Company recognized a significant loss on its investment in the equity of consolidated subsidiaries, (ii) the establishment of a $479.7 million valuation allowance offsetting net deferred tax assets created in connection with the adoption of ASU 2016-16 that primarily related to certain intangibles and tax deductible goodwill, which is further described in Note 2. Summary of Significant Accounting Policies and (iii) $21.5 million relating to state tax benefits. This increase was partially offset by a $590.2 million reduction related to remeasurement of certain deferred tax assets resulting from the TCJA.
F-65
The net increase in the Company’s valuation allowance in 2016 was primarily split into three main components: (i) $3,950.1 million related to losses within jurisdictions unable to support recognition of a deferred tax asset, the largest jurisdiction of which was Luxembourg, where the Company recognized a material loss on its investment in the equity of consolidated subsidiaries, (ii) $67.1 million relating to state tax benefits and (iii) $400.8 million related to recording a valuation allowance on U.S. deferred tax assets.
At December 31, 2017, the Company had the following significant valuation allowances (in thousands):
Jurisdiction | 2017 | |||
Canada | $ | 2,228 | ||
Ireland | $ | 99,194 | ||
Luxembourg | $ | 6,847,805 | ||
United States | $ | 1,110,172 | ||
We have provided income taxes for earnings that are currently distributed as well as the taxes associated with certain earnings that are expected to be distributed in the future. No additional provision has been made for Irish and non-Irish income taxes on the undistributed earnings of subsidiaries or for unrecognized deferred tax liabilities for temporary differences related to basis differences in investments in subsidiaries as such earnings are expected to be indefinitely reinvested, the investments are essentially permanent in duration. As of December 31, 2017, certain subsidiaries had approximately $169.8 million of cumulative undistributed earnings that have been permanently reinvested because our plans do not demonstrate a need to repatriate such earnings. A liability could arise if our intention to indefinitely reinvest such earnings were to change and amounts are distributed by such subsidiaries or if such subsidiaries are ultimately disposed. It is not practicable to estimate the additional income taxes related to indefinitely reinvested earnings or the basis differences related to investments in subsidiaries.
Uncertain Tax Positions
The Company and its subsidiaries are subject to income taxes in the U.S., various states and numerous foreign jurisdictions with varying statutes as to which tax years are subject to examination by the tax authorities. The Company has taken positions on its tax returns that may be challenged by various tax authorities for which reserves have been established for tax-related uncertainties. These accruals for tax-related uncertainties are based on the Company’s best estimate of the potential tax exposures. When particular matters arise, a number of years may elapse before such matters are audited and finally resolved. Favorable resolution of such matters could be recognized as a reduction of the Company’s effective tax rate in the year of resolution. Resolution of any particular issue could increase the effective tax rate and may require the use of cash in the year of resolution.
F-66
As of December 31, 2017, the Company had total unrecognized income tax benefits of $435.1 million. If recognized in future years, $289.9 million of these currently unrecognized income tax benefits would impact the income tax provision and effective tax rate. As of December 31, 2016, the Company had total unrecognized tax benefits of $443.6 million. If recognized in future years, $435.4 million of these unrecognized income tax benefits would have impacted the income tax provision and effective tax rate. The following table summarizes the activity related to unrecognized income tax benefits (in thousands):
Unrecognized Tax Benefit Federal, State, and Foreign Tax | |||
UTB Balance at January 1, 2015 | $ | 105,330 | |
Gross additions for current year positions | 65,439 | ||
Gross reductions for prior period positions | (234 | ) | |
Gross additions for prior period positions | 3,460 | ||
Decrease due to lapse of statute of limitations | (75 | ) | |
Additions related to acquisitions | 150,152 | ||
Currency translation adjustment | (7,825 | ) | |
UTB Balance at December 31, 2015 | $ | 316,247 | |
Gross additions for current year positions | 142,778 | ||
Gross reductions for prior period positions | (35,888 | ) | |
Gross additions for prior period positions | 2,111 | ||
Decrease due to lapse of statute of limitations | (3,085 | ) | |
Additions related to acquisitions | 2,350 | ||
Currency translation adjustment | 88 | ||
UTB Balance at December 31, 2016 | $ | 424,601 | |
Gross additions for current year positions | 44,293 | ||
Gross reductions for prior period positions | (64,887 | ) | |
Gross additions for prior period positions | 22,765 | ||
Decrease due to lapse of statute of limitations | (13,151 | ) | |
Additions related to acquisitions | — | ||
Currency translation adjustment | 2,330 | ||
UTB Balance at December 31, 2017 | $ | 415,951 | |
Accrued interest and penalties | 19,185 | ||
Total UTB balance including accrued interest and penalties | $ | 435,136 | |
Current portion | $ | 17,100 | |
Non-current portion | $ | 418,036 | |
The Company records accrued interest as well as penalties related to uncertain tax positions as part of the provision for income taxes. As of December 31, 2017, we had recorded $19.2 million of accrued interest and penalties related to uncertain tax positions on the Consolidated Balance Sheet, all of which was recorded in income taxes. As of December 31, 2016, the balance of accrued interest and penalties was $19.0 million, all of which was recorded in income taxes. During the years ended December 31, 2017, 2016, and 2015, we recognized expense of $1.4 million, $5.1 million and $1.6 million, respectively, related to interest and penalties. The current and non-current portions of our UTB balance are included in our Consolidated Balance Sheet as Accounts payable and accrued expenses, Other liabilities or, if appropriate, as a reduction to Deferred tax assets.
Our subsidiaries file income tax returns in the countries in which they have operations. Generally, these countries have statutes of limitations ranging from 3 to 10 years. Certain subsidiary tax returns are currently under examination by taxing authorities, including U.S. tax returns for the 2011 through 2015 tax years by the Internal Revenue Service.
It is expected that the amount of unrecognized tax benefits will change during the next twelve months; however, the Company does not anticipate any adjustments that would lead to a material impact on our results of operations or our financial position.
F-67
As of December 31, 2017, we may be subject to examination in the major tax jurisdictions:
Jurisdiction | Open Years | |
Canada | 2013 through 2017 | |
India | 2012 through 2017 | |
Ireland | 2014 through 2017 | |
Luxembourg | 2013 through 2017 | |
United States - federal, state and local | 2006 through 2017 | |
NOTE 20. NET LOSS PER SHARE
The following is a reconciliation of the numerator and denominator of basic and diluted net loss per share for the years ended December 31, 2017, 2016 and 2015 (in thousands):
2017 | 2016 | 2015 | |||||||||
Numerator: | |||||||||||
Loss from continuing operations | $ | (1,232,711 | ) | $ | (3,223,772 | ) | $ | (300,399 | ) | ||
Less: Net income (loss) from continuing operations attributable to noncontrolling interests | — | 16 | (283 | ) | |||||||
Loss from continuing operations attributable to Endo International plc ordinary shareholders | $ | (1,232,711 | ) | $ | (3,223,788 | ) | $ | (300,116 | ) | ||
Loss from discontinued operations attributable to Endo International plc ordinary shareholders, net of tax | (802,722 | ) | (123,278 | ) | (1,194,926 | ) | |||||
Net loss attributable to Endo International plc ordinary shareholders | $ | (2,035,433 | ) | $ | (3,347,066 | ) | $ | (1,495,042 | ) | ||
Denominator: | |||||||||||
For basic per share data—weighted average shares | 223,198 | 222,651 | 197,100 | ||||||||
Dilutive effect of ordinary share equivalents | — | — | — | ||||||||
Dilutive effect of various convertible notes and warrants | — | — | — | ||||||||
For diluted per share data—weighted average shares | 223,198 | 222,651 | 197,100 | ||||||||
Basic net loss per share data is computed based on the weighted average number of ordinary shares outstanding during the period. Diluted loss per share data is computed based on the weighted average number of ordinary shares outstanding and, if there is net income from continuing operations attributable to Endo ordinary shareholders during the period, the dilutive impact of ordinary share equivalents outstanding during the period.
The dilutive effect of ordinary share equivalents are measured under the treasury stock method. Due to the Company’s adoption of ASU 2016-09, effective January 1, 2017, the Company no longer considers excess tax benefits resulting from share-based compensation awards when applying the treasury stock method to calculate diluted weighted average shares outstanding. Therefore, the adoption of this ASU will have the effect of increasing dilution in periods where there is net income from continuing operations attributable to Endo ordinary shareholders and there are weighted average dilutive awards outstanding. Stock options and awards that have been issued but for which a grant date has not yet been established, such as those discussed in Note 17. Share-based Compensation, are not considered in the calculation of basic of diluted weighted average shares.
All potentially dilutive items were excluded from the diluted share calculation for the years ended December 31, 2017, 2016 and 2015 because their effect would have been anti-dilutive, as the Company was in a loss position.
NOTE 21. SAVINGS AND INVESTMENT PLAN AND DEFERRED COMPENSATION PLANS
Savings and Investment Plan
The Company maintains a defined contribution Savings and Investment Plan (the Endo 401(k) Plan) covering all U.S.-based eligible employees. The Company matches 100% of the first 3% of eligible cash compensation that a participant contributes to the Endo 401(k) Plan plus 50% of the next 2% for a total of up to 4%, subject to statutory limitations. Participants are immediately vested with respect to their own contributions and the Company’s matching contributions.
Costs incurred for contributions made by the Company to the Endo 401(k) Plan amounted to $9.4 million, $11.5 million and $8.6 million for the years ended December 31, 2017, 2016 and 2015, respectively.
F-68
Directors Stock Election Plan
The Company maintains a directors stock election plan. The purpose of this plan is to provide non-employee directors the opportunity to have their retainer fees, or a portion thereof, delivered in the form of Endo ordinary shares. The amount of shares will be determined by dividing the portion of cash fees elected to be received as shares by the closing price of the shares on the day the payment would have otherwise been paid in cash.
F-69
NOTE 22. QUARTERLY FINANCIAL DATA (UNAUDITED)
The following table presents select unaudited financial data for each of the three-month periods ending March 31, 2017, June 30, 2017, September 30, 2017 and December 31, 2017, as well as the comparable 2016 periods (in thousands, except per share data):
Quarter Ended | |||||||||||||||
March 31, | June 30, | September 30, | December 31, | ||||||||||||
2017 (1) | |||||||||||||||
Total revenues | $ | 1,037,600 | $ | 875,731 | $ | 786,887 | $ | 768,640 | |||||||
Gross profit | $ | 368,638 | $ | 336,330 | $ | 272,365 | $ | 262,995 | |||||||
Loss from continuing operations | $ | (165,423 | ) | $ | (696,020 | ) | $ | (99,687 | ) | $ | (271,581 | ) | |||
Discontinued operations, net of tax | $ | (8,405 | ) | $ | (700,498 | ) | $ | 3,017 | $ | (96,836 | ) | ||||
Net loss attributable to Endo International plc | $ | (173,828 | ) | $ | (1,396,518 | ) | $ | (96,670 | ) | $ | (368,417 | ) | |||
Net loss per share attributable to Endo International plc ordinary shareholders—Basic: | |||||||||||||||
Continuing operations | $ | (0.74 | ) | $ | (3.12 | ) | $ | (0.45 | ) | $ | (1.22 | ) | |||
Discontinued operations | (0.04 | ) | (3.14 | ) | 0.02 | (0.43 | ) | ||||||||
Basic | $ | (0.78 | ) | $ | (6.26 | ) | $ | (0.43 | ) | $ | (1.65 | ) | |||
Net loss per share attributable to Endo International plc ordinary shareholders—Diluted: | |||||||||||||||
Continuing operations | $ | (0.74 | ) | $ | (3.12 | ) | $ | (0.45 | ) | $ | (1.22 | ) | |||
Discontinued operations | (0.04 | ) | (3.14 | ) | 0.02 | (0.43 | ) | ||||||||
Diluted | $ | (0.78 | ) | $ | (6.26 | ) | $ | (0.43 | ) | $ | (1.65 | ) | |||
Weighted average shares—Basic | 223,014 | 223,158 | 223,299 | 223,322 | |||||||||||
Weighted average shares—Diluted | 223,014 | 223,158 | 223,299 | 223,322 | |||||||||||
2016 (2) | |||||||||||||||
Total revenues | $ | 963,539 | $ | 920,887 | $ | 884,335 | $ | 1,241,513 | |||||||
Gross profit | $ | 274,834 | $ | 288,669 | $ | 326,863 | $ | 484,935 | |||||||
(Loss) income from continuing operations | $ | (88,763 | ) | $ | 389,812 | $ | (191,496 | ) | $ | (3,333,325 | ) | ||||
Discontinued operations, net of tax | $ | (45,108 | ) | $ | (46,216 | ) | $ | (27,423 | ) | $ | (4,531 | ) | |||
Net (loss) income attributable to Endo International plc | $ | (133,869 | ) | $ | 343,578 | $ | (218,919 | ) | $ | (3,337,856 | ) | ||||
Net (loss) income per share attributable to Endo International plc ordinary shareholders—Basic: | |||||||||||||||
Continuing operations | $ | (0.40 | ) | $ | 1.75 | $ | (0.86 | ) | $ | (14.96 | ) | ||||
Discontinued operations | (0.20 | ) | (0.21 | ) | (0.12 | ) | (0.02 | ) | |||||||
Basic | $ | (0.60 | ) | $ | 1.54 | $ | (0.98 | ) | $ | (14.98 | ) | ||||
Net (loss) income per share attributable to Endo International plc ordinary shareholders—Diluted: | |||||||||||||||
Continuing operations | $ | (0.40 | ) | $ | 1.75 | $ | (0.86 | ) | $ | (14.96 | ) | ||||
Discontinued operations | (0.20 | ) | (0.21 | ) | (0.12 | ) | (0.02 | ) | |||||||
Diluted | $ | (0.60 | ) | $ | 1.54 | $ | (0.98 | ) | $ | (14.98 | ) | ||||
Weighted average shares—Basic | 222,302 | 222,667 | 222,767 | 222,870 | |||||||||||
Weighted average shares—Diluted | 222,302 | 222,863 | 222,767 | 222,870 | |||||||||||
__________
(1) | Loss from continuing operations for the year ended December 31, 2017 was impacted by (1) acquisition-related and integration items of $10.9 million, $4.2 million, $16.6 million and $26.4 million during the first, second, third and fourth quarters, respectively, including charges due to changes in the fair value of contingent consideration of $6.2 million, $2.0 million, $15.4 million and $26.4 million, respectively; (2) asset impairment charges of $204.0 million, $725.0 million, $94.9 million and $130.4 million during the first, second, third and fourth quarters, respectively; (3) certain cost reductions and separation benefits incurred in connection with continued efforts to enhance the Company’s operations and other miscellaneous costs of $22.7 million, $24.6 million, $80.7 million and $84.5 million during the first, second, third and fourth quarters, respectively; (4) charges/(benefits) related to litigation-related and other contingent matters totaling $0.9 million, $(2.6) million, $(12.4) million and $200.0 million during the first, second, third and fourth quarters, respectively, and (5) loss on extinguishment of debt of $51.7 million during the second quarter. As previously reported in our Quarterly Report on Form 10-Q for the quarter ended September 30, 2017, the third quarter numbers above reflect a $14.2 million correcting entry to increase asset impairment charges resulting from certain assets that should have been impaired during the second quarter. |
F-70
(2) | (Loss) income from continuing operations for the year ended December 31, 2016 was impacted by (1) acquisition-related and integration items of $12.6 million, $48.2 million, $19.5 million and $7.4 million during the first, second, third and fourth quarters, respectively, including charges/(benefits) of $(10.7) million, $23.9 million, $11.6 million and $(1.0) million during the first, second, third and fourth quarters, respectively; (2) asset impairment charges of $129.6 million, $40.0 million, $93.5 million and $3,518.1 million during the first, second, third and fourth quarters, respectively; (3) inventory step-up and certain manufacturing costs that will be eliminated pursuant to integration plans of $68.5 million, $29.1 million, $14.2 million and $13.9 million during the first, second, third and fourth quarters, respectively; (4) certain cost reductions and separation benefits incurred in connection with continued efforts to enhance the Company’s operations and other miscellaneous costs of $38.5 million, $22.2 million, $9.8 million and $37.1 million during the first, second, third and fourth quarters, respectively, and (5) charges/(benefits) related to litigation-related and other contingent matters totaling $5.2 million, $5.3 million, $18.3 million and $(4.8) million during the first, second, third and fourth quarters, respectively. |
Quarterly and year-to-date computations of per share amounts are made independently, therefore, the sum of the per share amounts for the quarters may not equal the per share amounts for the year.
As further described in Note 3. Discontinued Operations and Assets and Liabilities Held for Sale, we sold our Litha business on July 3, 2017 and our Somar business on October 25, 2017. Both of these businesses were part of our International Pharmaceuticals segment. Neither business met the requirements for presentation as discontinued operations. The operating results of the AMS business are reported as Discontinued operations, net of tax in the Consolidated Statements of Operations for all periods presented. For additional information, see Note 3. Discontinued Operations and Assets and Liabilities Held for Sale.
F-71