Attached files
| file | filename |
|---|---|
| EX-32.2 - EX-32.2 - TPG RE Finance Trust, Inc. | trtx-ex322_6.htm |
| EX-32.1 - EX-32.1 - TPG RE Finance Trust, Inc. | trtx-ex321_7.htm |
| EX-31.2 - EX-31.2 - TPG RE Finance Trust, Inc. | trtx-ex312_9.htm |
| EX-31.1 - EX-31.1 - TPG RE Finance Trust, Inc. | trtx-ex311_8.htm |
| EX-23.2 - EX-23.2 - TPG RE Finance Trust, Inc. | trtx-ex232_555.htm |
| EX-23.1 - EX-23.1 - TPG RE Finance Trust, Inc. | trtx-ex231_554.htm |
| EX-21.1 - EX-21.1 - TPG RE Finance Trust, Inc. | trtx-ex211_726.htm |
| EX-10.38 - EX-10.38 - TPG RE Finance Trust, Inc. | trtx-ex1038_556.htm |
| EX-10.37 - EX-10.37 - TPG RE Finance Trust, Inc. | trtx-ex1037_557.htm |
| EX-10.36 - EX-10.36 - TPG RE Finance Trust, Inc. | trtx-ex1036_558.htm |
UNITED STATES
SECURITIES AND EXCHANGE COMMISSION
Washington, D.C. 20549
FORM 10-K
|
☒ |
ANNUAL REPORT PURSUANT TO SECTION 13 OR 15(d) OF THE SECURITIES EXCHANGE ACT OF 1934 |
For the fiscal year ended December 31, 2017
OR
|
☐ |
TRANSITION REPORT PURSUANT TO SECTION 13 OR 15(d) OF THE SECURITIES EXCHANGE ACT OF 1934 |
FOR THE TRANSITION PERIOD FROM TO
Commission File Number 001-38156
TPG RE Finance Trust, Inc.
(Exact name of Registrant as specified in its Charter)
|
Maryland |
36-4796967 |
|
(State or other jurisdiction of incorporation or organization) |
(I.R.S. Employer Identification No.) |
|
888 Seventh Avenue, 35th Floor New York, New York |
10106 |
|
(Address of principal executive offices) |
(Zip Code) |
Registrant’s telephone number, including area code: (212) 601-4700
Securities registered pursuant to Section 12(b) of the Act:
|
Title of each class |
|
Name of each exchange on which registered |
|
Common Stock, par value $0.001 per share |
|
New York Stock Exchange |
Securities registered pursuant to Section 12(g) of the Act: None
Indicate by check mark if the Registrant is a well-known seasoned issuer, as defined in Rule 405 of the Securities Act. YES ☐ NO ☒
Indicate by check mark if the Registrant is not required to file reports pursuant to Section 13 or 15(d) of the Act. YES ☐ NO ☒
Indicate by check mark whether the Registrant: (1) has filed all reports required to be filed by Section 13 or 15(d) of the Securities Exchange Act of 1934 during the preceding 12 months (or for such shorter period that the Registrant was required to file such reports), and (2) has been subject to such filing requirements for the past 90 days. YES ☒ NO ☐
Indicate by check mark whether the Registrant has submitted electronically and posted on its corporate Web site, if any, every Interactive Data File required to be submitted and posted pursuant to Rule 405 of Regulation S-T (§232.405 of this chapter) during the preceding 12 months (or for such shorter period that the Registrant was required to submit and post such files). YES ☒ NO ☐
Indicate by check mark if disclosure of delinquent filers pursuant to Item 405 of Regulation S-K (§229.405) is not contained herein, and will not be contained, to the best of Registrant’s knowledge, in definitive proxy or information statements incorporated by reference in Part III of this Form 10-K or any amendment to this Form 10-K. ☒
Indicate by check mark whether the Registrant is a large accelerated filer, an accelerated filer, a non-accelerated filer, smaller reporting company, or an emerging growth company. See the definitions of “large accelerated filer,” “accelerated filer,” “smaller reporting company,” and “emerging growth company” in Rule 12b-2 of the Exchange Act.
|
Large accelerated filer |
☐ |
|
|
|
Accelerated filer |
|
☐ |
|
|
|
|
|
|
|||
|
Non-accelerated filer |
☒ |
|
(Do not check if a smaller reporting company) |
|
Smaller reporting company |
|
☐ |
|
|
|
|
|
|
|
|
|
|
|
|
|
|
|
Emerging growth company |
|
☐ |
If an emerging growth company, indicate by check mark if the Registrant has elected not to use the extended transition period for complying with any new or revised financial accounting standards provided pursuant to Section 13(a) of the Exchange Act. ☐
Indicate by check mark whether the Registrant is a shell company (as defined in Rule 12b-2 of the Exchange Act). YES ☐ NO ☒
As of June 30, 2017, the last business day of the Registrant’s most recently completed second fiscal quarter, the Registrant’s common stock was not listed on any exchange or over-the counter market. The Registrant’s common stock began trading on the New York Stock Exchange on July 20, 2017. On December 29, 2017, the last business day of the Registrant’s most recently completed fourth fiscal quarter, the aggregate market value of the Registrant’s common stock held by non-affiliates of the Registrant was $501.4 million based on the closing sales price of the Registrant’s common stock on such date as reported on the New York Stock Exchange. For purposes of this computation, all officers, directors and 10% beneficial owners of the Registrant’s common stock of which the Registrant is aware are deemed to be affiliates. Such determination should not be deemed to be an admission that such officers, directors or 10% beneficial owners are, in fact, affiliates of the Registrant.
As of February 23, 2018, there were 59,174,286 shares of the Registrant’s common stock, $0.001 par value per share, and 1,167,714 shares of the Registrant’s Class A common stock, $0.001 par value per share, outstanding.
DOCUMENTS INCORPORATED BY REFERENCE
Part III of this annual report on Form 10-K incorporates information by reference from the Registrant’s definitive proxy statement with respect to its 2018 annual meeting of stockholders to be filed with the Securities and Exchange Commission within 120 days after the end of the Registrant’s fiscal year.
|
|
|
Page |
|
PART I |
|
|
|
Item 1. |
2 |
|
|
Item 1A. |
12 |
|
|
Item 1B. |
58 |
|
|
Item 2. |
58 |
|
|
Item 3. |
58 |
|
|
Item 4. |
58 |
|
|
|
|
|
|
PART II |
|
|
|
Item 5. |
59 |
|
|
Item 6. |
63 |
|
|
Item 7. |
Management’s Discussion and Analysis of Financial Condition and Results of Operations |
64 |
|
Item 7A. |
89 |
|
|
Item 8. |
91 |
|
|
Item 9. |
Changes in and Disagreements With Accountants on Accounting and Financial Disclosure |
91 |
|
Item 9A. |
91 |
|
|
Item 9B. |
91 |
|
|
|
|
|
|
PART III |
|
|
|
Item 10. |
92 |
|
|
Item 11. |
92 |
|
|
Item 12. |
Security Ownership of Certain Beneficial Owners and Management and Related Stockholder Matters |
92 |
|
Item 13. |
Certain Relationships and Related Transactions, and Director Independence |
92 |
|
Item 14. |
92 |
|
|
|
|
|
|
PART IV |
|
|
|
Item 15. |
93 |
Certain Terms
Except where the context requires otherwise, the terms “Company,” “we,” “us,” and “our” refer to TPG RE Finance Trust, Inc., a Maryland corporation, and its subsidiaries; the term “Manager” refers to our external manager, TPG RE Finance Trust Management, L.P., a Delaware limited partnership; the term “TPG” refers to TPG Global, LLC, a Delaware limited liability company, and its affiliates; and the term “TPG Fund” refers to any partnership or other pooled investment vehicle, separate account, fund-of-one or any similar arrangement or investment program sponsored, advised or managed (including on a subadvisory basis) by TPG, whether currently in existence or subsequently established (in each case, including any related alternative investment vehicle, parallel or feeder investment vehicle, co-investment vehicle and any entity formed in connection therewith, including any entity formed for investments by TPG and its affiliates in any such vehicle, whether invested as a limited partner or through general partner investments).
i
CAUTIONARY NOTE REGARDING FORWARD-LOOKING STATEMENTS
This Form 10-K contains forward-looking statements within the meaning of Section 27A of the Securities Act of 1933, as amended (the “Securities Act”), and Section 21E of the Securities Exchange Act of 1934, as amended (“Exchange Act”), which reflect our current views with respect to, among other things, our operations and financial performance. You can identify these forward-looking statements by the use of words such as “outlook,” “believe,” “expect,” “potential,” “continue,” “may,” “should,” “seek,” “approximately,” “predict,” “intend,” “will,” “plan,” “estimate,” “anticipate,” the negative version of these words, other comparable words or other statements that do not relate strictly to historical or factual matters. By their nature, forward-looking statements speak only as of the date they are made, are not statements of historical fact or guarantees of future performance and are subject to risks, uncertainties, assumptions or changes in circumstances that are difficult to predict or quantify. Our expectations, beliefs and projections are expressed in good faith, and we believe there is a reasonable basis for them. However, there can be no assurance that management’s expectations, beliefs and projections will occur or be achieved, and actual results may vary materially from what is expressed in or indicated by the forward-looking statements.
There are a number of risks, uncertainties and other important factors that could cause our actual results to differ materially from the forward-looking statements contained in this Form 10-K. Such risks and uncertainties include, but are not limited to, the following:
|
|
• |
the general political, economic and competitive conditions in the markets in which we invest; |
|
|
• |
the level and volatility of prevailing interest rates and credit spreads; |
|
|
• |
adverse changes in the real estate and real estate capital markets; |
|
|
• |
general volatility of the securities markets in which we participate; |
|
|
• |
changes in our business, investment strategies or target assets; |
|
|
• |
difficulty in obtaining financing or raising capital; |
|
|
• |
reductions in the yield on our investments and increases in the cost of our financing; |
|
|
• |
adverse legislative or regulatory developments, including with respect to tax laws; |
|
|
• |
acts of God such as hurricanes, earthquakes, wildfires and other natural disasters, acts of war and/or terrorism and other events that may cause unanticipated and uninsured performance declines and/or losses to us or the owners and operators of the real estate securing our investments; |
|
|
• |
deterioration in the performance of properties securing our investments that may cause deterioration in the performance of our investments and potentially principal losses to us; |
|
|
• |
defaults by borrowers in paying debt service on outstanding indebtedness; |
|
|
• |
the adequacy of collateral securing our investments and declines in the fair value of our investments; |
|
|
• |
adverse developments in the availability of desirable investment opportunities; |
|
|
• |
difficulty in successfully managing our growth, including integrating new assets into our existing systems; |
|
|
• |
the cost of operating our platform, including, but not limited to, the cost of operating a real estate investment platform and the cost of operating as a publicly traded company; |
|
|
• |
the availability of qualified personnel and our relationship with our Manager; |
|
|
• |
conflicts with TPG and its affiliates, including our Manager, the personnel of TPG providing services to us, including our officers, and certain funds managed by TPG; |
|
|
• |
our qualification as a real estate investment trust (“REIT”) for U.S. federal income tax purposes and our exclusion from registration under the Investment Company Act of 1940, as amended (the “Investment Company Act”); and |
1
|
|
and Exchange Commission (the “SEC”), the Internal Revenue Service (the “IRS”), the New York Stock Exchange (the “NYSE) and other authorities that we are subject to, as well as their counterparts in any foreign jurisdictions where we might do business. |
There may be other factors that may cause our actual results to differ materially from the forward-looking statements contained in this Form 10-K, including factors disclosed in Item 1A – “Risk Factors” and in Item 7 – “Management’s Discussion and Analysis of Financial Condition and Results of Operations.” You should evaluate all forward-looking statements made in this Form 10-K in the context of these risks and uncertainties.
Although we believe that the expectations reflected in the forward-looking statements are reasonable, we cannot guarantee future results, levels of activity, performance, or achievements. We caution you that the risks, uncertainties and other factors referenced above may not contain all of the risks, uncertainties and other factors that are important to you. In addition, we cannot assure you that we will realize the results, benefits or developments that we expect or anticipate or, even if substantially realized, that they will result in the consequences or affect us or our business in the way expected. All forward-looking statements in this Form 10-K apply only as of the date made and are expressly qualified in their entirety by the cautionary statements included in this Form 10-K and in other filings we make with the SEC. We undertake no obligation to publicly update or revise any forward-looking statements to reflect subsequent events or circumstances, except as required by law.
Company and Organization
TPG RE Finance Trust, Inc. is a Maryland corporation that was incorporated on October 24, 2014 and which commenced operations on December 18, 2014. We are externally managed by TPG RE Finance Trust Management, L.P., an affiliate of TPG. Our principal executive offices are located at 888 Seventh Avenue, 35th Floor, New York, New York 10106. We are organized as a holding company and conduct our operations primarily through our various subsidiaries. As of December 31, 2017, the Company conducted substantially all of its operations through a Delaware limited liability company, TPG RE Finance Trust Holdco, LLC (“Holdco”), and the Company’s other wholly-owned subsidiaries.
We conduct our operations as a REIT for U.S. federal income tax purposes. We generally will not be subject to U.S. federal income taxes on our taxable income to the extent that we annually distribute all of our net taxable income to stockholders and maintain our qualification as a REIT. We also operate our business in a manner that permits us to maintain an exclusion from registration under the Investment Company Act. We operate our business as one segment, which directly originates and acquires a diversified portfolio of commercial real estate-related assets consisting primarily of first mortgage loans and senior participation interests in first mortgage loans secured by institutional-quality properties in primary and select secondary markets in the United States, and commercial mortgage-backed securities (“CMBS”).
Manager
We are externally managed and advised by our Manager, which is responsible for administering our business activities, day-to-day operations, and providing us the services of our executive management team, investment team, and appropriate support personnel. TPG Real Estate, TPG’s real estate platform, includes TPG Real Estate Partners, TPG’s real estate equity investment platform, and us, currently TPG’s dedicated real estate debt investment platform. Collectively, TPG Real Estate managed more than $6.7 billion in assets at September 30, 2017, which included commercial real estate holdings in the United States consisting of approximately 1,000 properties comprising approximately 85.4 million square feet. TPG Real Estate’s teams work across TPG’s New York, San Francisco and London offices, and have 17 and 27 employees, respectively, between TPG’s real estate debt investment platform and TPG’s real estate equity platform.
Our chief executive officer, chief financial officer, and other executive officers are senior TPG Real Estate professionals. None of our executive officers, our Manager, or other personnel supplied to us by our Manager is obligated to dedicate any specific amount of time to our business. Our Manager is subject to the supervision and oversight of our board of directors and has only such functions and authority as our board of directors delegates to it. Pursuant to a management agreement between our Manager and us (our “Management Agreement”), our Manager is entitled to receive a base management fee, an incentive fee, and certain expense reimbursements.
2
See Note 10 to our consolidated financial statements in this Form 10-K for more detail on the terms of the Management Agreement.
Investment Strategy
The loans we target for origination and investment typically have the following characteristics:
|
|
• |
Unpaid principal balance greater than $50 million; |
|
|
• |
Stabilized as-is loan-to value (“LTV”) of less than 70% with respect to individual properties; |
|
|
• |
Floating rate loans tied to the one-month U.S. dollar-denominated London Interbank Offered Rate (“LIBOR”) and spreads of 300 to 500 basis points over LIBOR; |
|
|
• |
Secured by properties that are: (1) primarily in the office, mixed use, multifamily, industrial, retail and hospitality real estate sectors; (2) expected to reach stabilization within 24 months of the origination or acquisition date; and (3) located in primary and select secondary markets in the U.S. with multiple demand drivers, such as employment growth, medical infrastructure, universities, convention centers and attractive cultural and lifestyle amenities; and, |
|
|
• |
Well-capitalized sponsors with substantial experience in particular real estate sectors and geographic markets. |
We believe that our current investment strategy provides significant opportunities to our stockholders for attractive risk-adjusted returns over time. However, to capitalize on the investment opportunities at different points in the economic and real estate investment cycle, we may modify or expand our investment strategy. We believe that the flexibility of our strategy supported by our Manager’s significant commercial real estate experience and the extensive resources of TPG and TPG Real Estate will allow us to take advantage of changing market conditions to maximize risk-adjusted returns to our stockholders.
We invest primarily in commercial mortgage loans and other commercial real estate-related debt instruments, focusing on loans secured by properties primarily in the office, mixed use, multifamily, industrial, retail and hospitality real estate sectors in primary and select secondary markets in the U.S., including, but not limited to, the following:
|
|
• |
Commercial Mortgage Loans. We intend to continue to focus on directly originating and selectively acquiring first mortgage loans. These loans are secured by a first mortgage lien on a commercial property, may vary in duration, predominantly bear interest at a floating rate, may provide for regularly scheduled principal amortization and typically require a balloon payment of principal at maturity. These investments may encompass a whole commercial mortgage loan or may include a pari passu participation within a commercial mortgage loan. |
|
|
• |
Other Commercial Real Estate-Related Debt Instruments. Although we expect that originating and selectively acquiring commercial first mortgage loans will be our primary area of focus, we also expect to opportunistically originate and selectively acquire other commercial real estate-related debt instruments, subject to maintaining our qualification as a REIT for U.S. federal income tax purposes and exclusion or exemption from regulation under the Investment Company Act, including, but not limited to, subordinate mortgage interests, mezzanine loans, secured real estate securities, note financing, preferred equity and miscellaneous debt instruments. |
As market conditions evolve over time, we expect to adapt as appropriate. We believe our current investment strategy will produce significant opportunities to make investments with attractive risk-return profiles. However, to capitalize on the investment opportunities that may be present at various other points of an economic cycle, we may expand or change our investment strategy by targeting assets with debt characteristics, such as subordinate mortgage loans, mezzanine loans, preferred equity, real estate securities and note financings. We may also target assets with equity characteristics, including triple net lease properties and other forms of direct equity ownership of commercial real estate properties, subject to any duties to offer to other funds managed by TPG.
We believe that the diversification of our investment portfolio, our ability to actively manage those investments, and the flexibility of our strategy positions us to generate attractive returns for our stockholders in a variety of market conditions over the long term.
3
As of December 31, 2017, our portfolio consisted of 54 first mortgage loans (or interests therein) with an aggregate unpaid principal balance of $3.1 billion and four mezzanine loans with an aggregate unpaid principal balance of $75.4 million, and collectively having a weighted average credit spread of 4.8%, a weighted average all-in yield of 6.5%, a weighted average term to extended maturity (assuming all extension options are exercised by borrowers) of 3.6 years, and a weighted average LTV of 58.7%. As of December 31, 2017, 99.9% of the loan commitments in our portfolio consisted of floating rate loans, and 98.0% of the loan commitments in our portfolio consisted of first mortgage loans (or interests therein). We also had $529.0 million of unfunded loan commitments as of December 31, 2017, our funding of which is subject to satisfaction of borrower milestones. In addition, as of December 31, 2017, we held five CMBS investments, with an aggregate face amount of $85.7 million and a weighted average yield to final maturity of 3.1%.
Loan Portfolio
The following table details overall statistics for our loan portfolio as of December 31, 2017 (dollars in thousands):
|
|
|
|
|
|
|
Total Loan Exposure(1) |
|
|||||||||
|
|
|
Balance Sheet Portfolio |
|
|
Total Loan Portfolio |
|
|
Floating Rate Loans |
|
|
Fixed Rate Loans |
|
||||
|
Number of loans |
|
|
57 |
|
|
|
60 |
|
|
|
59 |
|
|
|
1 |
|
|
% of portfolio (by unpaid principal balance) |
|
|
100.0 |
% |
|
|
100.0 |
% |
|
|
99.9 |
% |
|
|
0.1 |
% |
|
Total loan commitment |
|
$ |
3,727,156 |
|
|
$ |
3,862,656 |
|
|
$ |
3,860,016 |
|
|
$ |
2,640 |
|
|
Unpaid principal balance |
|
$ |
3,198,116 |
|
|
$ |
3,198,116 |
|
|
$ |
3,195,476 |
|
|
$ |
2,640 |
|
|
Unfunded loan commitments(2) |
|
$ |
529,040 |
|
|
$ |
529,040 |
|
|
$ |
529,040 |
|
|
$ |
— |
|
|
Carrying value |
|
$ |
3,175,672 |
|
|
$ |
3,175,672 |
|
|
$ |
3,173,236 |
|
|
$ |
2,436 |
|
|
Weighted average credit spread(3) |
|
|
4.8 |
% |
|
|
4.8 |
% |
|
|
4.8 |
% |
|
|
5.6 |
% |
|
Weighted average all-in yield(3) |
|
|
6.5 |
% |
|
|
6.5 |
% |
|
|
6.5 |
% |
|
|
7.9 |
% |
|
Weighted average term to extended maturity (in years)(4) |
|
|
3.6 |
|
|
|
3.6 |
|
|
|
3.6 |
|
|
|
2.7 |
|
|
Weighted average LTV(5) |
|
|
58.7 |
% |
|
|
58.7 |
% |
|
|
58.6 |
% |
|
|
84.2 |
% |
|
(1) |
In certain instances, we create structural leverage through the co-origination or non-recourse syndication of a senior loan interest to a third party. In either case, the senior mortgage loan (i.e., the non-consolidated senior interest) is not included on our balance sheet. When we create structural leverage through the co-origination or non-recourse syndication of a senior loan interest to a third party, we retain on our balance sheet a mezzanine loan. Total loan commitment encompasses the entire loan portfolio we originated, acquired and financed, including three non-consolidated senior interests totaling $135.5 million sold or co-originated and thus are not included in our balance sheet portfolio. See Item 7 - “Management’s Discussion and Analysis of Financial Condition and Results of Operations—Investment Portfolio Financing—Non-Consolidated Senior Interests” in this Form 10-K for additional information. |
|
(2) |
Unfunded loan commitments may be funded over the term of each loan, subject in certain cases to an expiration date or a force-funding date, primarily to finance development, property improvements or lease-related expenditures by our borrowers, and in some instances to finance operating deficits during renovation and lease-up. |
|
(3) |
As of December 31, 2017, our floating rate loans were indexed to LIBOR. In addition to credit spread, all-in yield includes the amortization of deferred origination fees, purchase price premium and discount, loan origination costs and accrual of both extension and exit fees. Credit spread and all-in yield for the total portfolio assumes the applicable floating benchmark rate as of December 31, 2017 for weighted average calculations. |
|
(4) |
Extended maturity assumes all extension options are exercised by the borrower; provided, however, that our loans may be repaid prior to such date. As of December 31, 2017, based on the unpaid principal balance of our total loan exposure, 67.2% of our loans were subject to yield maintenance or other prepayment restrictions and 32.8% were open to repayment by the borrower without penalty. |
4
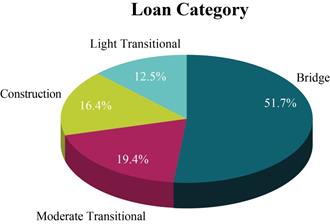
The following presents, by loan commitment, the geographic distribution and property types securing our loan portfolio as of December 31, 2017:
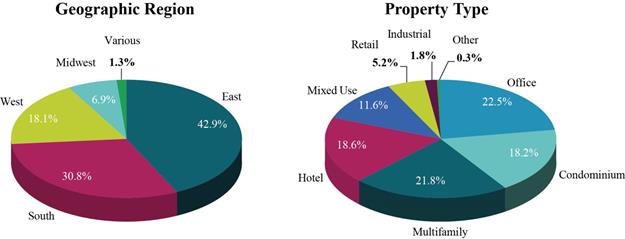
Our loan portfolio consists of Bridge, Construction, Moderate Transitional and Light Transitional mortgage loans. These mortgage loan categories are used by us to classify, define, and assess our loan investments. The following presents, by loan commitment, our loan portfolio by loan category as of December 31, 2017:
For the years ended December 31, 2017 and December 31, 2016, no loans were placed on non-accrual status, and we have sustained no losses or impairments to our loan portfolio.
5
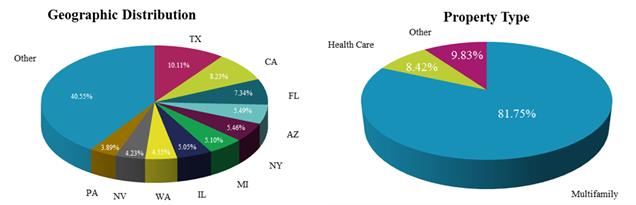
We may invest in CMBS, or CMBS-related, assets as part of our investment strategy, primarily as a short-term cash management tool. Our current CMBS portfolio consists of five fixed rate securities whose underlying collateral is United States treasury bonds or first mortgage loans secured by multifamily or healthcare-related properties. The underlying real estate collateral is located across the United States, primarily in Texas, California, and Florida with no state representing more than 11% of an investment’s par value. At December 31, 2017, there were no floating rate securities in our CMBS Portfolio. The following table details overall statistics for our CMBS portfolio as of December 31, 2017 (dollars in thousands):
|
|
|
CMBS Portfolio |
|
|
|
Number of securities |
|
|
5 |
|
|
Fixed rate securities |
|
|
5 |
|
|
% of portfolio |
|
|
100 |
% |
|
Par value |
|
$ |
86,314 |
|
|
Face amount(1) |
|
$ |
85,661 |
|
|
Weighted average coupon(2) |
|
|
3.7 |
% |
|
Weighted average yield to final maturity(2) |
|
|
3.1 |
% |
|
Weighted average life (in years) |
|
|
2.4 |
|
|
Weighted average principal repayment window (in years) |
|
|
4.6 |
|
|
Final maturity (in years) |
|
|
16.3 |
|
|
Ratings range(3) |
|
Unrated to AAA |
|
|
|
(1) |
Amounts disclosed are before giving effect to unamortized purchase price premium and discount and unrealized gains or losses. |
|
(2) |
Weighted by market value as of December 31, 2017. |
|
(3) |
Ratings range includes one structured finance investment that is unrated. This three year structured finance investment is 100% collateralized by multifamily mortgage loans underwritten by the Federal Home Loan Mortgage Corporation (“FHLMC”), which loans are slated for near term securitization by FHLMC. Upon the contractual maturity of the structured finance investment, FHLMC is required to purchase all of the performing mortgage loans at par. Currently, all of the underlying mortgage loans are performing. The four other CMBS investments are rated AA+ through AAA. |
The following presents, by outstanding principal balance, the geographic distribution and property types securing our CMBS investments as of December 31, 2017:
For additional information regarding our investment portfolio as of December 31, 2017, see Item 7 – “Management’s Discussion and Analysis of Financial Condition and Results of Operations” in this Form 10-K.
6
In addition to raising capital through public offerings of our equity and debt securities, our financing strategy includes a combination of secured revolving repurchase facilities, a secured credit facility and asset-specific financing structures. To create structural, matched term financing, we have and may in certain instances, originate mezzanine loans in connection with the contemporaneous issuance of a first mortgage loan to a third-party lender or the non-recourse transfer of a first mortgage loan originated by us. In either case, the senior mortgage loan is not included on our balance sheet, and we refer to such senior loan interest as a “non-consolidated senior interest.” When we create structural leverage through the co-origination or non-recourse syndication of a senior loan interest to a third party, we retain on our balance sheet a mezzanine loan. Additionally, we may use other forms of leverage, including secured and unsecured warehouse facilities, issuances of non-recourse collateralized loan obligations (“CLO”), structured financing, derivative instruments, and public and private secured and unsecured debt issuances by us or our subsidiaries. We generally seek to match-fund and match-index our investments by minimizing the differences between the durations and indices of our investments and those of our liabilities, respectively, including in certain instances through the use of derivatives; however, under certain circumstances, we may determine not to do so or we may otherwise be unable to do so.
On February 14, 2018, we closed a $932.4 million CLO, creating additional matched-term, matched index funding for approximately 29% of our loan portfolio based on unpaid principal balance at December 31, 2017. For more information on the CLO, see Note 17 to our consolidated financial statements in this Form 10-K.
During the year ended December 31, 2017, we entered into a new secured revolving repurchase facility, increased the maximum facility size of four of our existing secured revolving repurchase facilities, entered into a new senior secured credit facility, and added three new asset-specific financings providing an aggregate of $1.4 billion of additional credit capacity. The following table details the principal balance amounts outstanding for our financing arrangements as of December 31, 2017 (dollars in thousands):
|
|
|
Portfolio Financing Outstanding Principal Balance |
|
|
|
|
|
December 31, 2017 |
|
|
|
Secured revolving repurchase facilities |
|
$ |
1,835,801 |
|
|
Senior secured credit facility |
|
|
- |
|
|
Asset-specific financings |
|
|
289,487 |
|
|
Total indebtedness(1) |
|
$ |
2,125,288 |
|
|
(1) |
Excludes deferred financing costs of $10.3 million at December 31, 2017. |
The amount of leverage we employ for particular assets will depend upon our Manager’s assessment of the credit, liquidity, price volatility, and other risks of those assets and the financing counterparties, the availability of particular types of financing at the time, and the financial covenants under our credit facilities. Our decision to use leverage to finance our assets will be at the discretion of our Manager and will not be subject to the approval of our stockholders. We currently expect that our leverage, measured as the ratio of debt to equity, will generally range from 3.0 to 3.5:1, subject to compliance with our financial covenants under our secured revolving repurchase facilities and other contractual obligations. We will endeavor to match the terms and indices of our assets and liabilities.
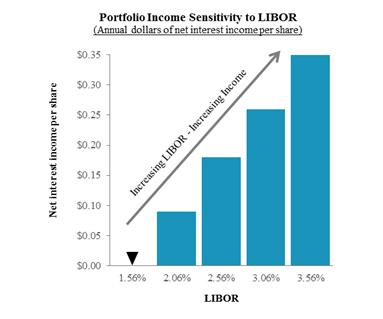
Floating Rate Portfolio
Our business model seeks to minimize our exposure to changing interest rates by match-indexing our assets using the same, or similar, benchmark indices, typically LIBOR, as well as durations. Accordingly, rising interest rates will generally increase our net interest income, while declining interest rates will generally decrease our net interest income. As of December 31, 2017, 99.9% of our loans by unpaid principal balance earned a floating rate of interest and were financed with liabilities that require interest payments based on floating rates, which resulted in approximately $1.1 billion of net floating rate exposure that is positively correlated to rising interest rates, subject to the impact of interest rate floors on certain of our floating rate loans. As of December 31, 2017, the remaining 0.1% of our loans by unpaid principal balance earned a fixed rate of interest, but were financed with liabilities that require interest payments based on floating rates, which results in a negative correlation to rising interest rates to the extent of our amount of fixed rate financing. Due to the short remaining term to maturity and the small percentage of our loan portfolio represented by fixed rate loans, we have elected not to employ interest rate derivatives (interest rate
7
swaps, caps, collars or swaptions) to limit our exposure to increases in interest rates on such liabilities, but we may do so in the future.
The following table shows how an increase in LIBOR would affect our net interest income per share per annum as of December 31, 2017:
Investment Guidelines
Our board of directors has approved the following investment guidelines:
|
|
• |
No investment will be made that would cause us to fail to maintain our qualification as a REIT under the Internal Revenue Code of 1986, as amended (the “Internal Revenue Code”); |
|
|
• |
No investment will be made that would cause us or any of our subsidiaries to be required to be registered as an investment company under the Investment Company Act; |
|
|
• |
Our Manager will seek to invest our capital in our target assets; |
|
|
• |
Prior to the deployment of our capital into our target assets, our Manager may cause our capital to be invested in any short-term investments in money market funds, bank accounts, overnight repurchase agreements with primary Federal Reserve Bank dealers collateralized by direct U.S. government obligations and other instruments or investments determined by our Manager to be of high quality; |
|
|
• |
Not more than 25% of our Equity (as defined in our Management Agreement) may be invested in any individual investment without the approval of a majority of our independent directors (it being understood, however, that for purposes of the foregoing concentration limit, in the case of any investment that is comprised (whether through a structured investment vehicle or other arrangement) of securities, instruments or assets of multiple portfolio issuers, such investment for purposes of the foregoing limitation will be deemed to be multiple investments in such underlying securities, instruments and assets and not the particular vehicle, product or other arrangement in which they are aggregated); and |
|
|
• |
Any investment in excess of $300 million requires the approval of a majority of our independent directors. |
These investment guidelines may be amended, supplemented or waived pursuant to the approval of our board of directors (which must include a majority of our independent directors) from time to time, but without the approval of our stockholders.
8
We are engaged in a competitive business environment. We operate in a competitive market for the origination and acquisition of attractive investment opportunities. We compete with a variety of institutional investors, including other REITs, debt funds, specialty finance companies, savings and loan associations, banks, mortgage bankers, insurance companies, mutual funds, institutional investors, investment banking firms, financial institutions, private equity and hedge funds, governmental bodies and other entities and may compete with other TPG Funds. Many of our competitors are substantially larger and have considerably greater financial, technical and marketing resources than we do. Several of our competitors, including other REITs, have recently raised, or are expected to raise, significant amounts of capital and may have investment objectives that overlap with our investment objectives, which may create additional competition for lending and other investment opportunities. Some of our competitors may have a lower cost of funds and access to funding sources that may not be available to us or are only available to us on substantially less attractive terms. Many of our competitors are not subject to the operating constraints associated with REIT tax compliance or maintenance of an exclusion or exemption from the Investment Company Act. In addition, some of our competitors may have higher risk tolerances or different risk assessments, which could allow them to consider a wider variety of investments and establish more lending relationships than we do. Competition may result in realizing fewer investments, higher prices, acceptance of greater risk, greater defaults, lower yields or a narrower spread of yields over our borrowing costs. In addition, competition for attractive investments could delay the investment of our capital.
In the face of this competition, we have access to our Manager’s professionals through TPG and TPG Real Estate, and their industry expertise, which may provide us with a competitive advantage in competing effectively for attractive investment opportunities and help us assess risks and determine appropriate pricing for certain potential investments. However, we may not be able to achieve our business goals or expectations due to the competitive risks that we face. For additional information concerning these competitive risks, see Item 1A - “Risk Factors—Risks Related to Our Lending and Investment Activities—We operate in a competitive market for the origination and acquisition of attractive investment opportunities and competition may limit our ability to originate or acquire attractive investments in our target assets, which could have a material adverse effect on us.”
Employees
We do not have any employees. We are externally managed and are advised by our Manager pursuant to our Management Agreement between our Manager and us. All of our executive officers and certain of our directors are employees of our Manager or its affiliates. We do not expect to have any employees.
Government Regulation
Our operations are subject, in certain instances, to supervision and regulation by U.S. and other governmental authorities, and may be subject to various laws and judicial and administrative decisions imposing various requirements and restrictions, which among other things: (i) regulate credit-granting activities; (ii) establish maximum interest rates, finance charges and other charges; (iii) require disclosures to customers; (iv) govern secured transactions; and (v) set collection, foreclosure, repossession and claims-handling procedures and other trade practices. We are also required to comply with certain provisions of the Equal Credit Opportunity Act that are applicable to commercial loans. We intend to conduct our business so that neither we nor any of our subsidiaries are required to register as an investment company under the Investment Company Act.
In our judgment, existing statutes and regulations have not had a material adverse effect on our business. In recent years, legislators in the United States and in other countries have said that greater regulation of financial services firms is needed, particularly in areas such as risk management, leverage, and disclosure. While we expect that additional new regulations in these areas may be adopted and existing ones may change in the future, it is not possible at this time to forecast the exact nature of any future legislation, regulations, judicial decisions, orders or interpretations, nor their impact upon our future business, financial condition, or results of operations or prospects.
Taxation
We made an election to be taxed as a REIT for U.S. federal income tax purposes, commencing with our initial taxable year ended December 31, 2014. We generally must distribute annually at least 90% of our net taxable income, subject to certain adjustments and excluding any net capital gain, in order for U.S. federal income tax not to apply to our earnings that we distribute. To the extent that we satisfy this distribution requirement, but distribute less
9
than 100% of our net taxable income, we will be subject to U.S. federal income tax on our undistributed taxable income. In addition, we will be subject to a 4% nondeductible excise tax if the actual amount that we pay out to our stockholders in a calendar year is less than a minimum amount specified under U.S. federal tax laws. Our qualification as a REIT also depends on our ability to meet various other requirements imposed by the Internal Revenue Code, which relate to organizational structure, diversity of stock ownership, and certain restrictions with regard to the nature of our assets and the sources of our income. Even if we qualify as a REIT, we are subject to certain U.S. federal excise taxes and state and local taxes on our income and assets. If we fail to qualify as a REIT in any taxable year, we will be subject to U.S. federal income taxes at regular corporate rates, including any applicable alternative minimum tax, and will not be able to qualify as a REIT for the subsequent four years.
Furthermore, we have one or more taxable REIT subsidiaries, or TRSs, which pay federal, state, and local income tax on their net taxable income. See Item 1A – “Risk Factors – Risks Related to our REIT Status and Certain Other Tax Items” for additional tax status information.
Available Information
We maintain a website at www.tpgrefinance.com. We are providing the address to our website solely for the information of investors. The information on our website is not a part of, nor is it incorporated by reference into this report. Through our website, we make available, free of charge, our annual proxy statement, annual reports on Form 10-K, quarterly reports on Form 10-Q, current reports on Form 8-K and amendments to those reports filed or furnished pursuant to Section 13(a) or 15(d) of the Exchange Act as soon as reasonably practicable after we electronically file such material with, or furnish them to, the SEC. The SEC maintains a website that contains these reports at www.sec.gov. You may also read and copy any filed document at the SEC’s public reference room in Washington, D.C. at 100 F Street, N.E., Washington, D.C. 20549. Please call the SEC at 1-800-SEC-0330 for further information about public reference rooms.
10
Risks Related to Our Lending and Investment Activities
Our success depends on the availability of attractive investment opportunities and our Manager’s ability to identify, structure, consummate, leverage, manage and realize returns on our investments.
Our operating results are dependent upon the availability of, as well as our Manager’s ability to identify, structure, consummate, leverage, manage and realize returns on, our loans and other investments. In general, the availability of attractive investment opportunities and, consequently, our operating results, will be affected by the level and volatility of interest rates, conditions in the financial markets, general economic conditions, the demand for investment opportunities in our target assets and the supply of capital for such investment opportunities. We cannot assure you that our Manager will be successful in identifying and consummating attractive investments or that such investments, once made, will perform as anticipated.
Our commercial mortgage loans and other commercial real estate-related debt instruments expose us to risks associated with real estate investments generally.
We seek to originate and selectively acquire commercial mortgage loans and other commercial real estate-related debt instruments. Any deterioration of real estate fundamentals generally, and in the United States in particular, could negatively impact our performance by making it more difficult for borrowers to satisfy their debt payment obligations, increasing the default risk applicable to borrowers and making it relatively more difficult for us to generate attractive risk-adjusted returns. Real estate investments will be subject to various risks, including:
|
|
• |
economic and market fluctuations; |
|
|
• |
political instability or changes, terrorism and acts of war; |
|
|
• |
changes in environmental, zoning and other laws; |
|
|
• |
casualty or condemnation losses; |
|
|
• |
regulatory limitations on rents; |
|
|
• |
decreases in property values; |
|
|
• |
changes in the appeal of properties to tenants; |
|
|
• |
changes in supply (resulting from the recent growth in commercial real estate debt funds or otherwise) and demand; |
|
|
• |
energy supply shortages; |
|
|
• |
various uninsured or uninsurable risks; |
|
|
• |
natural disasters; |
|
|
• |
changes in government regulations (such as rent control); |
|
|
• |
changes in the availability of debt financing and/or mortgage funds which may render the sale or refinancing of properties difficult or impracticable; |
|
|
• |
increased mortgage defaults; |
|
|
• |
increases in borrowing rates; and |
|
|
• |
negative developments in the economy and/or adverse changes in real estate values generally and other risk factors that are beyond our control. |
We cannot predict the degree to which economic conditions generally, and the conditions for commercial real estate debt investing in particular, will improve or decline. Any declines in the performance of the U.S. and global economies or in the real estate debt markets could have a material adverse effect on us.
11
Commercial real estate debt instruments that are secured or otherwise supported, directly or indirectly, by commercial property are subject to delinquency, foreclosure and loss, which could materially and adversely affect us.
Commercial real estate debt instruments, such as mortgage loans, that are secured or, in the case of certain assets (including participation interests, mezzanine loans and preferred equity), supported by commercial property are subject to risks of delinquency and foreclosure and risks of loss that are greater than similar risks associated with loans made on the security of single-family residential property. The ability of a borrower to pay the principal of and interest on a loan secured by an income-producing property typically is dependent primarily upon the successful operation of such property rather than upon the existence of independent income or assets of the borrower. If the net operating income of the property is reduced, the borrower’s ability to pay the principal of and interest on the loan in a timely manner, or at all, may be impaired and therefore could reduce our return from an affected property or investment, which could materially and adversely affect us. Net operating income of an income-producing property may be adversely affected by the risks particular to commercial real property described above, as well as, among other things:
|
|
• |
tenant mix and tenant bankruptcies; |
|
|
• |
success of tenant businesses; |
|
|
• |
property management decisions, including with respect to capital improvements, particularly in older building structures; |
|
|
• |
property location and condition, including, without limitation, any need to address environmental contamination at a property; |
|
|
• |
competition from comparable types of properties; |
|
|
• |
changes in global, national, regional or local economic conditions or changes in specific industry segments; |
|
|
• |
declines in regional or local real estate values or rental or occupancy rates; |
|
|
• |
increases in interest rates, real estate tax rates and other operating expenses; |
|
|
• |
changes to tax laws and rates to which real estate lenders and investors are subject; and |
|
|
• |
government regulations. |
In the event of any default under a mortgage loan held directly by us, we will bear a risk of loss to the extent of any deficiency between the value of the collateral and the principal of and accrued interest on the mortgage loan. In the event of the bankruptcy of a mortgage loan borrower, the mortgage loan to that borrower will be deemed to be secured only to the extent of the value of the underlying collateral at the time of bankruptcy (as determined by the bankruptcy court), and the lien securing the mortgage loan will be subject to the avoidance powers of the bankruptcy trustee or debtor-in-possession to the extent the lien is unenforceable under state law. Foreclosure of a mortgage loan can be an expensive and lengthy process that could have a substantial negative effect on any anticipated return on the foreclosed mortgage loan.
We originate and acquire transitional loans, which involves greater risk of loss than stabilized commercial mortgage loans.
We originate and acquire transitional loans secured by first lien mortgages on commercial real estate. These loans provide interim financing to borrowers seeking short-term capital for the acquisition or transition (for example, lease up and/or rehabilitation) of commercial real estate and generally have a maturity of three years or less. A borrower under a transitional loan has usually identified an asset that has been under-managed and/or is located in a recovering market. If the market in which the asset is located fails to recover according to the borrower’s projections, or if the borrower fails to improve the operating performance of the asset or the value of the asset, the borrower may not receive a sufficient return on the asset to satisfy the transitional loan, and we will bear the risk that we may not recover some or all of our investment.
In addition, borrowers usually use the proceeds of a conventional mortgage loan to repay a transitional loan. We may therefore be dependent on a borrower’s ability to obtain permanent financing to repay a transitional loan, which could depend on market conditions and other factors. In the event of any failure to repay under a transitional loan held by us, we will bear the risk of loss of principal and non-payment of interest and fees to the extent of any
12
deficiency between the value of the mortgage collateral and the principal amount and unpaid interest of the transitional loan.
There can be no assurances that the U.S. or global financial systems will remain stable, and the occurrence of another significant credit market disruption may negatively impact our ability to execute our investment strategy, which would materially and adversely affect us.
The U.S. and global financial markets experienced significant disruptions in the past, during which times global credit markets collapsed, borrowers defaulted on their loans at historically high levels, banks and other lending institutions suffered heavy losses and the value of real estate declined. During such periods, a significant number of borrowers became unable to pay principal and interest on outstanding loans as the value of their real estate declined. Although liquidity has returned to the market and property values have generally recovered to levels that exceed those observed prior to the global financial crisis, declining real estate values could in the future reduce the level of new mortgage and other real estate-related loan originations. Instability in the U.S. and global financial markets in the future could be caused by any number of factors beyond our control, including, without limitation, terrorist attacks or other acts of war and adverse changes in national or international economic, market and political conditions. Any future sustained period of increased payment delinquencies, foreclosures or losses could adversely affect both our net interest income from loans in our portfolio as well as our ability to originate and acquire loans, which would materially and adversely affect us.
The potential discontinuation of LIBOR may adversely affect the interest rate indices on our investments, the interest rate indices on the financing that we use to fund our investments, or both.
Our investments currently include loans primarily with floating interest rates. Our floating rate investments earn interest at rates that typically adjust from time to time based upon LIBOR. Additionally, the financing that we use to fund our investments typically bears interest at a rate equal to LIBOR plus a credit spread determined primarily by advance rate and property type.
LIBOR and other interest rates or other types of rates and indices which are deemed “benchmarks” are the subject of recent national, international and other regulatory guidance and proposals for reform. These reforms may cause these benchmarks to perform differently than in the past, to disappear entirely or to have other consequences which cannot be predicted. Any such consequences could have an adverse effect on the return on our investments, the cost of the financing that we use to fund our investments, or both.
Furthermore, Regulation (EU) 2016/1011 (the “Benchmark Regulation”) was published by the European Parliament and the Council of the European Union on June 8, 2016. If the methodology or other terms of LIBOR are changed in order to comply with the terms of the Benchmark Regulation, such changes could (among other things) have the effect of reducing or increasing the rate or level or affecting the volatility of the published rate or level of LIBOR. Any such changes could have an adverse impact on the return on our investments, the cost of the financing that we use to fund our investments, or both. In addition, the Benchmark Regulation stipulates that each administrator of a benchmark regulated thereunder must be licensed by the competent authority of the member state where such administrator is located. There is a risk that administrators of LIBOR will fail to obtain a necessary license, preventing them from continuing to provide LIBOR as a benchmark or causing them to cease to administer LIBOR altogether because of the additional costs of compliance with the Benchmark Regulation and other applicable regulations, and the risks associated therewith.
Central banks around the world, including the U.S. Federal Reserve, have commissioned working groups that include market participants (the “Alternative Rate Committees”) with the goal of finding suitable replacements for their currency’s LIBOR that are based on observable market transactions. The search for replacements accelerated after the Financial Stability Board reported that uncertainty surrounding the integrity of LIBOR represents a potentially serious systemic vulnerability and risk due to limited transactions in the underlying inter-bank lending market. In July 2017, the Chief Executive of the United Kingdom Financial Conduct Authority (the “FCA”), which regulates LIBOR, called for an orderly transition over a four to five year period from LIBOR to the reference rates selected by the Alternative Rate Committees. The FCA’s announcement stated that it expects that it would not be in a position to sustain LIBOR through its influence or legal compulsion powers after the end of 2021. The announcement indicates that the continuation of LIBOR on the current basis is not guaranteed. It is impossible to predict whether and to what extent banks will continue to provide LIBOR submissions to the administrator of LIBOR.
13
It is unclear at this time whether or not LIBOR will cease to exist or if new methods of calculating LIBOR will be established such that it continues to exist after 2021. If LIBOR ceases to exist, we may need to renegotiate the interest rate indices on our investments, the interest rate indices on the financing that we use to fund our investments, or both. Any such changes to the interest rate indices on our investments or the financing that we use to fund our investments could have an adverse effect on the return on our investments, the cost of the financing that we use to fund our investments, or both. Additionally, we may not be able to renegotiate the same indices on our investments and our financing that we used to fund our investments, which may result in a portfolio that is not match indexed.
Difficulty in redeploying the proceeds from repayments of our existing loans and other investments could materially and adversely affect us.
As of December 31, 2017, our portfolio, excluding CMBS investments, had a weighted average term to extended maturity (assuming all extension options have been exercised by borrowers) of 3.6 years. As our loans and other investments are repaid, we will attempt to redeploy the proceeds we receive into new loans and investments, and repay borrowings under our secured revolving repurchase facilities and other financing arrangements. It is possible that we will fail to identify reinvestment options that would provide a yield and/or a risk profile that is comparable to the asset that was repaid. If we fail to redeploy the proceeds we receive from repayment of a loan or other investment in equivalent or better alternatives, we could be materially and adversely affected.
If we are unable to successfully integrate new assets and manage our growth, our results of operations and financial condition may suffer.
We have in the past and may in the future significantly increase the size and/or change the mix of our portfolio of assets. We may be unable to successfully and efficiently integrate newly-acquired assets into our existing portfolio or otherwise effectively manage our assets or our growth effectively. In addition, increases in our portfolio of assets and/or changes in the mix of our assets may place significant demands on our Manager’s administrative, operational, asset management, financial and other resources. Any failure to manage increases in size effectively could adversely affect our results of operations and financial condition.
We operate in a competitive market for the origination and acquisition of attractive investment opportunities and competition may limit our ability to originate or acquire attractive investments in our target assets, which could have a material adverse effect on us.
We operate in a competitive market for the origination and acquisition of attractive investment opportunities. We compete with a variety of institutional investors, including other REITs, debt funds, specialty finance companies, savings and loan associations, banks, mortgage bankers, insurance companies, mutual funds, institutional investors, investment banking firms, financial institutions, private equity and hedge funds, governmental bodies and other entities and, may compete with TPG Funds. Many of our competitors are substantially larger and have considerably greater financial, technical and marketing resources than we do. Several of our competitors, including other REITs, have recently raised, or are expected to raise, significant amounts of capital, and may have investment objectives that overlap with our investment objectives, which may create additional competition for lending and other investment opportunities. Some of our competitors may have a lower cost of funds and access to funding sources that may not be available to us or are only available to us on substantially less attractive terms. Many of our competitors are not subject to the operating constraints associated with REIT tax compliance or maintenance of an exclusion or exemption from the Investment Company Act. In addition, some of our competitors may have higher risk tolerances or different risk assessments, which could allow them to consider a wider variety of investments and establish more lending relationships than we do. Competition may result in realizing fewer investments, higher prices, acceptance of greater risk, greater defaults, lower yields or a narrower spread of yields over our borrowing costs. In addition, competition for attractive investments could delay the investment of our capital. Furthermore, changes in the financial regulatory regime following the 2016 U.S. Presidential election could decrease the current restrictions on banks and other financial institutions and allow them to compete with us for investment opportunities that were previously not available to, or otherwise pursued by, them. See “—Risks Related to Our Company—Changes in laws or regulations governing our operations, changes in the interpretation thereof or newly enacted laws or regulations and any failure by us to comply with these laws or regulations could materially and adversely affect us.”
14
As a result, competition may limit our ability to originate or acquire attractive investments in our target assets and could result in reduced returns. We can provide no assurance that we will be able to identify and originate or acquire attractive investments that are consistent with our investment strategy.
Interest rate fluctuations could significantly decrease our ability to generate income on our investments, which could materially and adversely affect us.
Our primary interest rate exposure relates to the yield on our investments and the financing cost of our debt, as well as any interest rate swaps that we may utilize for hedging purposes. Changes in interest rates affect our net interest income, which is the difference between the interest income we earn on our interest-earning investments and the interest expense we incur in financing these investments. Interest rate fluctuations resulting in our interest expense exceeding our interest income would result in operating losses for us. Changes in the level of interest rates also may affect our ability to originate or acquire investments and may impair the value of our investments and our ability to realize gains from the disposition of assets. Changes in interest rates may also affect borrower default rates.
Our operating results depend, in part, on differences between the income earned on our investments, net of credit losses, and our financing costs. For any period during which our investments are not match-funded, the income earned on such investments may respond more slowly to interest rate fluctuations than the cost of our borrowings. Consequently, changes in interest rates, particularly short-term interest rates, could materially and adversely affect us.
Prepayment rates may adversely affect our financial performance and cash flows and the value of certain of our investments.
Our business is currently focused on originating floating rate mortgage loans secured by commercial real estate assets. Generally, our mortgage loan borrowers may repay their loans prior to their stated maturities. In periods of declining interest rates and/or credit spreads, prepayment rates on loans generally increase. If general interest rates or credit spreads decline at the same time, the proceeds of such prepayments received during such periods may not be reinvested for some period of time or may be reinvested by us in comparable assets yielding less than the yields on the assets that were prepaid.
Because our mortgage loans are generally not originated or acquired at a premium to par value, prepayment rates do not materially affect the value of such loan assets. However, the value of certain other assets may be affected by prepayment rates. For example, if we acquire fixed rate CMBS or other fixed rate mortgage-related securities, or a pool of such mortgage securities in the future, we would anticipate that the underlying mortgages would prepay at a projected rate generating an expected yield. If we were to purchase such assets at a premium to par value, if borrowers prepay their loans faster than expected, the corresponding prepayments on any such mortgage-related securities would likely reduce the expected yield. Conversely, if we were to purchase such assets at a discount to par value, when borrowers prepay their loans slower than expected, the decrease in corresponding prepayments on the mortgage-related securities would likely reduce the expected yield. In addition, if we were to purchase such assets at a discount to par value, when borrowers prepay their loans faster than expected, the increase in corresponding prepayments on the mortgage-related securities would likely increase the expected yield.
Prepayment rates on floating rate and fixed rate loans may differ in different interest rate environments, and may be affected by a number of factors, including, but not limited to, the availability of mortgage credit, the relative economic vitality of the area in which the related properties are located, the servicing of the loans, possible changes in tax laws, other opportunities for investment, and other economic, social, geographic, demographic and legal factors, all of which are beyond our control, and structural factors such as call protection. Consequently, such prepayment rates cannot be predicted with certainty and no strategy can completely insulate us from prepayment risk.
15
Our investments may be concentrated and could be subject to risk of default.
We are not required to observe specific diversification criteria. Therefore, our investments may be concentrated in certain property types that are subject to higher risk of foreclosure, or secured by properties concentrated in a limited number of geographic locations. Although we attempt to mitigate our risk through various credit and structural protections, we cannot assure you that these efforts will be successful. To the extent that our portfolio is concentrated in any one region or type of asset, downturns relating generally to such region or type of asset may result in defaults on a number of our investments within a short time period, which may reduce our net income and, depending upon whether such loans are matched-term funded, may pressure our liquidity position. Such outcomes may adversely affect the market price of our common stock and, accordingly, have a material adverse effect on us. For more information on the concentration of our loan portfolio by geographic region and asset type, see Note 15 to our consolidated financial statements in this Form 10-K.
The illiquidity of certain of our investments may materially and adversely affect us.
The illiquidity of certain of our investments may make it difficult for us to sell such loans and other investments if the need or desire arises. In addition, certain of our loans and other investments may become less liquid after we originate or acquire them as a result of periods of delinquencies or defaults or turbulent market conditions, which may make it more difficult for us to dispose of such loans and other investments at advantageous times or in a timely manner. Moreover, we expect that many of our investments will not be registered under the relevant securities laws, resulting in prohibitions against their transfer, sale, pledge or their disposition except in transactions that are exempt from registration requirements or are otherwise in accordance with such laws. As a result, many of our loans and other investments are or will be illiquid, and if we are required to liquidate all or a portion of our portfolio quickly, for example as a result of margin calls, we may realize significantly less than the value at which we have previously recorded our investments. Further, we may face other restrictions on our ability to liquidate a loan or other investment to the extent that we or our Manager (and/or its affiliates) has or could be attributed as having material, non-public information regarding such business entity. As a result, our ability to vary our portfolio in response to changes in economic and other conditions may be relatively limited, which could materially and adversely affect us.
Most of the commercial mortgage loans that we originate or acquire are nonrecourse loans and the assets securing these loans may not be sufficient to protect us from a partial or complete loss if the borrower defaults on the loan, which could materially and adversely affect us.
Except for customary nonrecourse carve-outs for certain actions and environmental liability, most commercial mortgage loans are nonrecourse obligations of the sponsor and borrower, meaning that there is no recourse against the assets of the borrower or sponsor other than the underlying collateral. In the event of any default under a commercial mortgage loan held directly by us, we will bear a risk of loss to the extent of any deficiency between the value of the collateral and the principal of and accrued interest on the mortgage loan, which could materially and adversely affect us. Even if a commercial mortgage loan is recourse to the borrower (or if a nonrecourse carve-out to the borrower applies), in most cases, the borrower’s assets are limited primarily to its interest in the related mortgaged property. Further, although a commercial mortgage loan may provide for limited recourse to a principal or affiliate of the related borrower, there is no assurance that any recovery from such principal or affiliate will be made or that such principal’s or affiliate’s assets would be sufficient to pay any otherwise recoverable claim. In the event of the bankruptcy of a borrower, the loan to such borrower will be deemed to be secured only to the extent of the value of the underlying collateral at the time of bankruptcy (as determined by the bankruptcy court), and the lien securing the loan will be subject to the avoidance powers of the bankruptcy trustee or debtor-in-possession to the extent the lien is unenforceable under state law.
We may not have control over certain of our investments.
Our ability to manage our portfolio may be limited by the form in which our investments are made. In certain situations, we may:
|
|
• |
acquire loans or investments subject to rights of senior classes, servicers or collateral managers under intercreditor or servicing agreements or securitization documents; |
|
|
• |
pledge our investments as collateral for financing arrangements; |
|
|
• |
acquire only a minority and/or a non-controlling participation in an underlying loan or investment; |
16
|
|
• |
co-invest with others through partnerships, joint ventures or other entities, thereby acquiring non-controlling interests; or |
|
|
• |
rely on independent third-party management or servicing with respect to the management of an asset. |
Therefore, we may not be able to exercise control over all aspects of our loans and investments. Such financial assets may involve risks not present in investments where senior creditors, junior creditors, servicers or third party controlling investors are not involved. Our rights to control the process following a borrower default may be subject to the rights of senior or junior creditors or servicers whose interests may not be aligned with ours. A partner or co-venturer may have financial difficulties resulting in a negative impact on such asset, may have economic or business interests or goals that are inconsistent with ours, or may be in a position to take action contrary to our investment objectives. In addition, we may, in certain circumstances, be liable for the actions of our partners or co-venturers.
Future joint venture investments could be adversely affected by our lack of sole decision-making authority, our reliance on joint venture partners’ financial condition and liquidity and disputes between us and our joint venture partners.
We may in the future make investments through joint ventures. Such joint venture investments may involve risks not otherwise present when we originate or acquire investments without partners, including the following:
|
|
• |
we may not have exclusive control over the investment or the joint venture, which may prevent us from taking actions that are in our best interest; |
|
|
• |
joint venture agreements often restrict the transfer of a partner’s interest or may otherwise restrict our ability to sell the interest when we desire and/or on advantageous terms; |
|
|
• |
any future joint venture agreements may contain buy-sell provisions pursuant to which one partner may initiate procedures requiring the other partner to choose between buying the other partner’s interest or selling its interest to that partner; |
|
|
• |
we may not be in a position to exercise sole decision-making authority regarding the investment or joint venture, which could create the potential risk of creating impasses on decisions, such as with respect to acquisitions or dispositions; |
|
|
• |
a partner may, at any time, have economic or business interests or goals that are, or that may become, inconsistent with our business interests or goals; |
|
|
• |
a partner may be in a position to take action contrary to our instructions, requests, policies or objectives, including our policy with respect to maintaining our qualification as a REIT and our exclusion or exemption from registration under the Investment Company Act; |
|
|
• |
a partner may fail to fund its share of required capital contributions or may become bankrupt, which may mean that we and any other remaining partners generally would remain liable for the joint venture’s liabilities; |
|
|
• |
our relationships with our partners are contractual in nature and may be terminated or dissolved under the terms of the applicable joint venture agreements and, in such event, we may not continue to own or operate the interests or investments underlying such relationship or may need to purchase such interests or investments at a premium to the market price to continue ownership; |
|
|
• |
disputes between us and a partner may result in litigation or arbitration that could increase our expenses and prevent our Manager and our officers and directors from focusing their time and efforts on our business and could result in subjecting the investments owned by the joint venture to additional risk; or |
|
|
• |
we may, in certain circumstances, be liable for the actions of a partner, and the activities of a partner could adversely affect our ability to maintain our qualification as a REIT or our exclusion or exemption from registration under the Investment Company Act, even though we do not control the joint venture. |
Any of the above may subject us to liabilities in excess of those contemplated and adversely affect the value of our future joint venture investments.
17
We are subject to additional risks associated with investments in the form of loan participation interests.
We have in the past invested, and may in the future invest, in loan participation interests in which another lender or lenders share with us the rights, obligations and benefits of a commercial mortgage loan made by an originating lender to a borrower. Accordingly, we will not be in privity of contract with a borrower because the other lender or participant is the record holder of the loan and, therefore, we will not have any direct right to any underlying collateral for the loan. These loan participations may be senior, pari passu or junior to the interests of the other lender or lenders in respect of distributions from the commercial mortgage loan. Furthermore, we may not be able to control the pursuit of any rights or remedies under the commercial mortgage loan, including enforcement proceedings in the event of default thereunder. In certain cases, the original lender or another participant may be able to take actions in respect of the commercial mortgage loan that are not in our best interests. In addition, in the event that (1) the owner of the loan participation interest does not have the benefit of a perfected security interest in the lender’s rights to payments from the borrower under the commercial mortgage loan or (2) there are substantial differences between the terms of the commercial mortgage loan and those of the applicable loan participation interest, such loan participation interest could be recharacterized as an unsecured loan to a lender that is the record holder of the loan in such lender’s bankruptcy, and the assets of such lender may not be sufficient to satisfy the terms of such loan participation interest. Accordingly, we may face greater risks from loan participation interests than if we had made first mortgage loans directly to the owners of real estate collateral.
Mezzanine loans, B-Notes and other investments that are subordinated or otherwise junior in an issuer’s capital structure, such as preferred equity, and that involve privately negotiated structures, will expose us to greater risk of loss.
We have in the past originated and acquired, and may in the future originate and acquire, mezzanine loans, B-Notes and other investments that are subordinated or otherwise junior in an issuer’s capital structure, such as preferred equity, and that involve privately negotiated structures. To the extent we invest in subordinated debt or preferred equity, such investments and our remedies with respect thereto, including the ability to foreclose on any collateral securing such investments, will be subject to the rights of holders of more senior tranches in the issuer’s capital structure and, to the extent applicable, contractual co-lender, intercreditor, and/or participation agreement provisions, which will expose us to greater risk of loss.
As the terms of such loans and investments are subject to contractual relationships among lenders, co-lending agents and others, they can vary significantly in their structural characteristics and other risks. For example, the rights of holders of B-Notes to control the process following a borrower default may vary from transaction to transaction. Further, B-Notes typically are secured by a single property and accordingly reflect the risks associated with significant concentration. Like B-Notes, mezzanine loans are by their nature structurally subordinated to more senior property-level financings. If a borrower defaults on our mezzanine loan or on debt senior to our loan, or if the borrower is in bankruptcy, our mezzanine loan will be satisfied only after the property-level debt and other senior debt is paid in full. As a result, a partial loss in the value of the underlying collateral can result in a total loss of the value of the mezzanine loan. In addition, even if we are able to foreclose on the underlying collateral following a default on a mezzanine loan, we would be substituted for the defaulting borrower and, to the extent income generated on the underlying property is insufficient to meet outstanding debt obligations on the property, we may need to commit substantial additional capital and/or deliver a replacement guarantee by a creditworthy entity, which could include us, to preserve the existing mortgage loan on the property, stabilize the property and prevent additional defaults to lenders with existing liens on the property. In addition, mezzanine loans may have higher LTVs than conventional mortgage loans, resulting in less equity in the underlying property and increasing the risk of default and loss of principal. Significant losses related to our B-Notes and mezzanine loans would result in operating losses for us and may limit our ability to make distributions to our stockholders.
18
Our origination or acquisition of construction loans exposes us to an increased risk of loss.
We have in the past originated or acquired construction loans and may do so in the future. If we fail to fund our entire commitment on a construction loan or if a borrower otherwise fails to complete the construction of a project, there could be adverse consequences associated with the loan, including, but not limited to: a loss of the value of the property securing the loan, especially if the borrower is unable to raise funds to complete construction from other sources; a borrower claim against us for failure to perform under the loan documents; increased costs to the borrower that the borrower is unable to pay; a bankruptcy filing by the borrower; and abandonment by the borrower of the collateral for the loan. As described below, the process of foreclosing on a property is time-consuming, and we may incur significant expense if we foreclose on a property securing a loan under these or other circumstances.
Risks of cost overruns and non-completion of the construction or renovation of the properties underlying loans we originate or acquire could materially and adversely affect us.
The renovation, refurbishment or expansion by a borrower of a mortgaged property involves risks of cost overruns and non-completion. Costs of construction or renovation to bring a property up to market standards for the intended use of that property may exceed original estimates, possibly making a project uneconomical. Other risks may include: environmental risks, permitting risks, other construction risks, and subsequent leasing of the property not being completed on schedule or at projected rental rates. If such construction or renovation is not completed in a timely manner, or if it costs more than expected, the borrower may experience a prolonged reduction of net operating income and may be unable to make payments of interest or principal to us, which could materially and adversely affect us.
Investments that we make in CMBS, CLOs, and other similar structured finance investments, as well as those that we structure, sponsor or arrange, pose additional risks.
We have in the past invested, and may in the future invest, in CMBS. In addition, we may invest in subordinate classes of CLOs and other similar structured finance investments in a structure of securities secured by a pool of mortgages or loans. Such investments are the first or among the first to bear loss upon a restructuring or liquidation of the underlying collateral, and the last to receive payment of interest and principal. Thus, there is generally only a nominal amount of equity or other debt securities junior to such positions, if any, issued in such structures. The estimated fair values of such subordinated interests tend to be much more sensitive to economic downturns and adverse underlying borrower developments than more senior securities. A projection of an economic downturn, for example, could cause a decline in the price of lower credit quality CMBS and CLOs because the ability of borrowers to make principal and interest payments on the mortgages or loans underlying such securities may be impaired.
Subordinate interests such as CLOs and similar structured finance investments generally are not actively traded and are relatively illiquid investments, and volatility in CLO trading markets may cause the value of these investments to decline. In addition, if the underlying mortgage portfolio has been overvalued by the originator, or if the values subsequently decline and, as a result, less collateral value is available to satisfy interest and principal payments and any other fees in connection with the trust or other conduit arrangement for such securities, we may incur significant losses.
With respect to the CMBS and CLOs in which we may invest, control over the related underlying loans will be exercised through a special servicer or collateral manager designated by a “directing certificate holder” or a “controlling class representative,” or otherwise pursuant to the related securitization documents. We may acquire classes of CMBS and CLOs for which we may not have the right to appoint the directing certificate holder or otherwise direct the special servicing or collateral management. With respect to the management and servicing of those loans, the related special servicer or collateral manager may take actions that could materially and adversely affect our interests.
We may finance first mortgage loans, which may present greater risks than if we had made first mortgages directly to owners of real estate collateral.
Our loan portfolio may include first mortgage loan-on-loan financings, which are loans made to holders of mortgage loans that are secured by commercial real estate. While we will have certain rights with respect to the real estate collateral underlying a first mortgage loan, the holder of the commercial real estate first mortgage loans may fail to exercise its rights with respect to a default or other adverse action relating to the underlying real estate collateral or fail to promptly notify us of such an event, which would adversely affect our ability to enforce our rights. In addition, in the event of the bankruptcy of the borrower under the first mortgage loan, we may not have
19
full recourse to the assets of the holder of the commercial real estate loan, or the assets of the holder of the commercial real estate loan may not be sufficient to satisfy our first mortgage loan financing. Accordingly, we may face greater risks from our first mortgage loan financings than if we had made first mortgage loans directly to owners of real estate collateral.
Investments in non-conforming and non-investment grade rated investments involve an increased risk of default and loss.
Many of our investments may not conform to conventional loan standards applied by traditional lenders and either will not be rated (as is often the case for private loans) or will be rated as non-investment grade by the rating agencies. As a result, these investments should be expected to have an increased risk of default and loss than investment-grade rated assets. Any loss we incur may be significant and may materially and adversely affect us. Our investment guidelines do not limit the percentage of unrated or non-investment grade rated assets we may hold in our portfolio.
Any credit ratings assigned to our investments will be subject to ongoing evaluations and revisions and we cannot assure you that those ratings will not be downgraded.
Some of our investments may be rated by rating agencies. Any credit ratings on our investments are subject to ongoing evaluation by credit rating agencies, and we cannot assure you that any such ratings will not be downgraded or withdrawn by a rating agency in the future if, in its judgment, circumstances warrant. If rating agencies assign a lower-than-expected rating or reduce or withdraw, or indicate that they may reduce or withdraw, their ratings of our investments in the future, the value and liquidity of our investments could significantly decline, which would adversely affect the value of our investment portfolio and could result in losses upon disposition or the failure of borrowers to satisfy their debt service obligations to us.
We may invest in derivative instruments, which would subject us to increased risk of loss.
Subject to maintaining our qualification as a REIT, we may invest in derivative instruments. Derivative instruments, especially when purchased in large amounts, may not be liquid in all circumstances, so that in volatile markets we may not be able to close out a position without incurring a loss. The prices of derivative instruments, including swaps, futures, forwards and options, are highly volatile and such instruments may subject us to significant losses. The value of such derivatives also depends upon the price of the underlying instrument or commodity. Such derivatives and other customized instruments also are subject to the risk of non-performance by the relevant counterparty. In addition, actual or implied daily limits on price fluctuations and speculative position limits on the exchanges or over-the-counter markets in which we may conduct our transactions in derivative instruments may prevent prompt liquidation of positions, subjecting us to the potential of greater losses. Derivative instruments that may be purchased or sold by us may include instruments not traded on an exchange. The risk of non-performance by the obligor on such an instrument may be greater and the ease with which we can dispose of or enter into closing transactions with respect to such an instrument may be less than in the case of an exchange-traded instrument. In addition, significant disparities may exist between “bid” and “asked” prices for derivative instruments that are traded over-the-counter and not on an exchange. Such over-the-counter derivatives are also typically not subject to the same type of investor protections or governmental regulation as exchange-traded instruments.
In addition, we may invest in derivative instruments that are neither presently contemplated nor currently available, but which may be developed in the future, to the extent such opportunities are both consistent with our investment objectives and legally permissible. Any such investments may expose us to unique and presently indeterminate risks, the impact of which may not be capable of determination until such instruments are developed and/or we determine to make such an investment.
We may originate or acquire commercial mortgage loans and other commercial real estate-related debt instruments secured or supported by assets located outside the United States and, as a result, we will be subject to additional risks.
While we currently intend to originate or acquire commercial mortgage loans and other commercial real estate-related debt instruments secured or, in the case of certain assets (including mezzanine loans and preferred equity), supported primarily by U.S. collateral, we may originate and acquire investments secured or supported by assets located outside the U.S. in the future, subject to market conditions. As a result, it is possible that we may own
20
non-U.S. real estate directly in the future upon a default of a commercial mortgage loan or other commercial real estate-related debt instrument. Non-U.S. real estate investments are subject to various additional risks, including:
|
|
• |
currency exchange matters, including fluctuations in currency exchange rates and costs associated with conversion of investment principal and income from one currency into another; |
|
|
• |
financing to purchase assets located outside the United States may be unavailable on favorable terms or at all, or may be subject to non-customary covenants that hinder our operations; |
|
|
• |
less developed, stable or efficient financial markets than in the United States, which may lead to potential price volatility and relative illiquidity; |
|
|
• |
the burdens of complying with international regulatory requirements and prohibitions that differ between jurisdictions; |
|
|
• |
the existence of tariffs and other trade barriers or restrictions; |
|
|
• |
changes in laws or clarifications to existing laws that could impact our tax treaty positions, which could adversely impact the returns on our investments; |
|
|
• |
the potential for a less developed legal or regulatory environment, differences in the legal and regulatory environment or enhanced legal and regulatory compliance; |
|
|
• |
political hostility to investments by foreign investors; |
|
|
• |
higher rates of inflation; |
|
|
• |
higher transaction costs; |
|
|
• |
difficulty enforcing contractual obligations; |
|
|
• |
fewer investor protections; |
|
|
• |
certain economic and political risks, including potential exchange control regulations and restrictions on our non-U.S. investments and repatriation of profits from investments or of capital invested, the risks of political, economic or social instability, the possibility of expropriation or confiscatory taxation and adverse economic and political developments; and |
|
|
• |
potentially adverse tax consequences. |
If any of the foregoing risks were to materialize, they could materially and adversely affect us.
Concerns regarding the stability of the sovereign debt of certain European countries and other geopolitical issues and market perceptions concerning the instability of the Euro, the potential re-introduction of individual currencies within the Eurozone, or the potential dissolution of the Euro entirely, could materially and adversely affect us.
We may originate and acquire investments secured or supported by assets located in Europe. Concerns persist with respect to the sovereign debt situation of several countries, including Greece, Ireland, Italy, Spain and Portugal, which together with the risk of contagion to other more financially stable countries, has also raised a number of uncertainties regarding the stability and overall standing of the European Monetary Union. Concern over such uncertainties has been exacerbated by other geopolitical issues that may affect the Eurozone, including the vote by the United Kingdom (U.K.) to exit the European Union (E.U.). Any further deterioration in the global or Eurozone economy could have a significant adverse effect on our activities and the value of any European collateral.
In addition, we may acquire assets that are denominated in British pounds sterling or in Euros. Further deterioration in the Eurozone economy could have a material adverse effect on the value of our investment in such assets and amplify the currency risks faced by us.
If any country were to leave the Eurozone, or if the Eurozone were to break up entirely, the treatment of debt obligations previously denominated in Euros is uncertain. A number of issues would be raised, such as whether obligations that are expressed to be payable in Euros would be re-denominated into a new currency. The answer to this and other questions is uncertain and would depend on: the way in which the break-up occurred and also on the nature of the transaction; the law governing it; which courts have jurisdiction in relation to it; the place of payment;
21
and the place of incorporation of the payor. If we were to hold any investments in Euros at the time of any Eurozone exits or break-up, this uncertainty and potential re-denomination could have a material adverse effect on us.
The vote by the U.K. to exit the E.U. could materially and adversely affect us.
On June 23, 2016, the U.K. held a referendum in which a majority of voters approved an exit from the E.U., commonly referred to as “Brexit.” In March 2017, the U.K. government initiated the exit process under Article 50 of the Treaty of the European Union, commencing a period of up to two years for the U.K. and the other E.U. member states to negotiate the terms of the withdrawal. Uncertainty over the terms of the U.K.’s withdrawal from the E.U. could cause political and economic uncertainty in the U.K. and the rest of Europe, which could harm our business and financial results. In particular, Brexit caused significant volatility in global stock markets and currency exchange fluctuations. Consequently, any loans or other investments that we may originate or acquire in the future that are denominated in British pounds sterling will be subject to increased risks related to these currency rate fluctuations and our net assets in U.S. dollar terms may decline. In addition, Brexit may also adversely affect commercial real estate fundamentals in the U.K. and E.U., including greater uncertainty for leasing prospects for properties with transitional loans, which could negatively impact the ability of U.K and E.U.-based borrowers to satisfy their debt payment obligations, increasing default risk and/or making it more difficult for us to generate attractive risk-adjusted returns for any operations we may have in the U.K. in the future.
The long-term effects of Brexit are expected to depend on, among other things, any agreements the U.K. makes to retain access to E.U. markets either during a transitional period or more permanently. Brexit could adversely affect European or worldwide economic or market conditions and could contribute to instability in global financial and real estate markets. In addition, Brexit could lead to legal uncertainty and potentially divergent national laws and regulations as the U.K. determines which E.U. laws to replace or replicate. Until the terms and timing of the U.K’s exit from the E.U. become clearer, it is not possible to determine the impact that the U.K.’s departure from the E.U. and/or any related matters may have on us; however, any of these effects of Brexit, and others we cannot anticipate, could materially and adversely affect us.
Any distressed loans or other investments we make, or investments that later become non-performing, may subject us to losses and other risks relating to bankruptcy proceedings, which could materially and adversely affect us.
While our loans and other investments focus primarily on performing real estate-related interests, they may also include distressed investments (for example, investments in defaulted, out-of-favor or distressed loans and debt securities) or certain of our investments may become non-performing following our acquisition thereof. Certain of our investments may include properties that typically are highly leveraged, with significant burdens on cash flow and, therefore, involve a high degree of financial risk. During an economic downturn or recession, loans or securities of financially or operationally troubled borrowers or issuers are more likely to go into default than loans or securities of other borrowers or issuers. Loans or securities of financially or operationally troubled issuers are less liquid and more volatile than loans or securities of borrowers or issuers not experiencing such difficulties. The market prices of such securities are subject to erratic and abrupt market movements and the spread between bid and ask prices may be greater than normally expected. Investment in the loans or securities of financially or operationally troubled borrowers or issuers involves a high degree of credit and market risk.
In certain limited cases (for example, in connection with a workout, restructuring or foreclosure proceeding involving one or more of our investments), the success of our investment strategy will depend, in part, on our ability to effectuate loan modifications and/or restructure and improve the operations of our borrowers. The activity of identifying and implementing successful restructuring programs and operating improvements entails a high degree of uncertainty. There can be no assurance that we will be able to identify and implement successful restructuring programs and improvements with respect to any distressed loans or other investments we may have from time to time.
These financial or operating difficulties may never be overcome and may cause borrowers to become subject to bankruptcy or other similar administrative proceedings. There is a possibility that we may incur substantial or total losses on our loans or other investments and, in certain circumstances, become subject to certain additional potential liabilities that may exceed the value of our original investment therein. For example, under certain circumstances, a lender that has inappropriately exercised control over the management and policies of a debtor may have its claims subordinated or disallowed or may be found liable for damages suffered by parties as a result of such actions. In any reorganization or liquidation proceeding relating to our loans or other investments, we may lose our
22
entire investment, may be required to accept cash or securities with a value less than our original investment and/or may be required to accept different terms, including payment over an extended period of time. In addition, under certain circumstances, payments to us may be reclaimed if any such payment or distribution is later determined to have been a fraudulent conveyance, preferential payment or similar transaction under applicable bankruptcy and insolvency laws. Furthermore, bankruptcy laws and similar laws applicable to administrative proceedings may delay our ability to realize value from collateral for loan positions held by us, may adversely affect the economic terms and priority of such loans through doctrines such as equitable subordination or may result in a restructuring of the debt through principles such as the “cramdown” provisions of the bankruptcy laws. Any of the foregoing results could materially and adversely affect us.
We may need to foreclose on certain of the loans we originate or acquire, which could result in losses that materially and adversely affect us.
We may find it necessary or desirable to foreclose on certain of the loans we originate or acquire, and the foreclosure process may be lengthy and expensive. Whether or not we have participated in the negotiation of the terms of any such loans, we cannot assure you as to the adequacy of the protection of the terms of the applicable loan, including the validity or enforceability of the loan and the maintenance of the anticipated priority and perfection of the applicable security interests. Furthermore, claims may be asserted by lenders or borrowers that might interfere with enforcement of our rights. Borrowers may resist foreclosure actions by asserting numerous claims, counterclaims and defenses against us, including, without limitation, lender liability claims and defenses, even when the assertions may have no basis in fact, in an effort to prolong the foreclosure action and seek to force the lender into a modification of the loan or a favorable buy-out of the borrower’s position in the loan. In some states, foreclosure actions can take several years or more to litigate. At any time prior to or during the foreclosure proceedings, the borrower may file for bankruptcy, which would have the effect of staying the foreclosure actions and further delaying the foreclosure process, and could potentially result in a reduction or discharge of a borrower’s debt. Foreclosure may create a negative public perception of the related property, resulting in a diminution of its value. Even if we are successful in foreclosing on a loan, the liquidation proceeds upon sale of the underlying real estate may not be sufficient to recover our cost basis in the loan, resulting in a loss to us. Furthermore, any costs or delays involved in the foreclosure of the loan or a liquidation of the underlying property will further reduce the net proceeds and, thus, increase the loss. The incurrence of any such losses could materially and adversely affect us.
Real estate valuation is inherently subjective and uncertain.
The valuation of the commercial real estate that secures or otherwise supports our investments is inherently subjective and uncertain due to, among other factors, the individual nature of each property, its location, the expected future rental revenues from that particular property and the valuation methodology adopted. In addition, where we invest in construction loans, initial valuations will assume completion of the project. As a result, the valuations of the commercial real estate that secures or otherwise supports investments are made on the basis of assumptions and methodologies that may not prove to be accurate, particularly in periods of volatility, low transaction flow or restricted debt availability in the commercial real estate markets.
Our reserves for loan losses may prove inadequate, which could have a material adverse effect on us.
We evaluate our loans and the adequacy of our loan loss reserves on a quarterly basis, and may maintain varying levels of loan loss reserves. Our determination of asset-specific loan loss reserves relies on material estimates regarding the fair value of any loan collateral. The estimation of ultimate loan losses, provision expenses and loss reserves is a complex and subjective process. As such, there can be no assurance that our judgment will prove to be correct and that reserves will be adequate over time to protect against losses inherent in our portfolio at any given time. Such losses could be caused by various factors, including, but not limited to, unanticipated adverse changes in the economy or events adversely affecting specific assets, borrowers, industries in which our borrowers operate or markets in which our borrowers or their properties are located. If our reserves for loan losses prove inadequate, we may suffer losses, which could have a material adverse effect on us.
In June 2016, the FASB issued Accounting Standards Update 2016-13, “Financial Instruments-Credit Losses, Measurement of Credit Losses on Financial Instruments (Topic 326),” which replaces the current “incurred loss” model for recognizing credit losses with an “expected loss” model referred to as the Current Expected Credit Loss model, or CECL. Under the CECL model, which will become effective for us for fiscal years beginning after December 15, 2019 and for interim periods within those fiscal years, we will be required to present certain financial assets carried at amortized cost, such as loans held for investment, at the net amount expected to be collected. The
23
measurement of expected credit losses is to be based on information about past events, including historical experience, current conditions, and reasonable and supportable forecasts that affect the collectability of the reported amount. This measurement will take place at the time the financial asset is first added to the balance sheet and updated quarterly thereafter. This differs significantly from the “incurred loss” model required under current GAAP, which delays recognition until it is probable a loss has been incurred. Accordingly, we expect that the adoption of the CECL model will materially affect how we determine our allowance for loan losses and could require us to significantly increase our allowance and recognize provisions for loan losses earlier in the lending cycle. Moreover, the CECL model may create more volatility in the level of our allowance for loan losses. If we are required to materially increase our level of allowance for loan losses for any reason, such increase could adversely affect our business, financial condition and results of operations.
We may experience a decline in the fair value of investments we may make in securities, which could materially and adversely affect us.
A decline in the fair value of investments we may make in securities, such as CMBS, may require us to recognize an other-than-temporary (“OTTI”) impairment against such assets under GAAP if we were to determine that, with respect to any assets in unrealized loss positions, we do not have the ability and intent to hold such assets to maturity or for a period of time sufficient to allow for recovery to the original acquisition cost of such assets. If such a determination were to be made, we would recognize unrealized losses through earnings and write down the amortized cost of such assets to a new cost basis, based on the fair value of such assets on the date they are considered to be other-than-temporarily impaired. Such impairment charges reflect non-cash losses at the time of recognition. The subsequent disposition or sale of such assets could further affect our future losses or gains, as they are based on the difference between the sale price received and adjusted amortized cost of such assets at the time of sale. If we experience a decline in the fair value of our investments, it could materially and adversely affect us.
Some of our investments may be recorded at fair value and, as a result, there will be uncertainty as to the value of these investments.
Our investments are not publicly-traded but some of our investments may be publicly-traded in the future. The fair value of securities and other investments that are not publicly-traded may not be readily determinable. We will value these investments quarterly at fair value, which may include unobservable inputs. Because such valuations are subjective, the fair value of certain of our investments may fluctuate over short periods of time and our determinations of fair value may differ materially from the values that would have been used if a ready market for these investments existed. The value of our common stock could be adversely affected if our determinations regarding the fair value of these investments were materially higher than the values that we ultimately realize upon their disposal.
Additionally, our results of operations for a given period could be adversely affected if our determinations regarding the fair value of investments treated as available-for-sale or trading assets were materially higher than the values that we ultimately realize upon their disposal.
In addition to other analytical tools, our Manager will utilize financial models to evaluate commercial mortgage loans and commercial real estate-related debt instruments, the accuracy and effectiveness of which cannot be guaranteed.
In addition to other analytical tools, our Manager utilizes financial models to evaluate commercial mortgage loans and commercial real estate-related debt instruments, the accuracy and effectiveness of which cannot be guaranteed. In all cases, financial models are only estimates of future results which are based upon assumptions made at the time that the projections are developed. There can be no assurance that our Manager’s projected results will be attained and actual results may vary significantly from the projections. General economic and industry-specific conditions, which are not predictable, can have an adverse impact on the reliability of projections.
Insurance proceeds on a property may not cover all losses, which could result in the corresponding non-performance of or loss on our investment related to such property.
There are certain types of losses, generally of a catastrophic nature, such as earthquakes, floods, hurricanes, terrorism or acts of war, which may be uninsurable or not economically insurable. Inflation, changes in building codes and ordinances, environmental considerations and other factors, including terrorism or acts of war, also might result in insurance proceeds that are insufficient to repair or replace a property if it is damaged or destroyed. Under
24
these circumstances, the insurance proceeds received with respect to a property relating to one of our investments might not be adequate to restore our economic position with respect to our investment. Any uninsured loss could result in the corresponding non-performance of or loss on our investment related to such property.
The impact of any future terrorist attacks and the availability of affordable terrorism insurance expose us to certain risks.
Terrorist attacks, the anticipation of any such attacks, the consequences of any military or other response by the U.S. and its allies, and other armed conflicts could cause consumer confidence and spending to decrease or result in increased volatility in the U.S. and worldwide financial markets and economy. The economic impact of these events could also adversely affect the credit quality of some of our investments and the properties underlying our interests.
We may suffer losses as a result of the adverse impact of any future attacks and these losses may adversely impact our performance and may cause the market price of our common stock to decline or be more volatile. A prolonged economic slowdown, a recession or declining real estate values could impair the performance of our investments, increase our funding costs, limit our access to the capital markets or result in a decision by lenders not to extend credit to us, any of which could materially and adversely affect us. Losses resulting from these types of events may not be fully insurable.
In addition, with the enactment of the Terrorism Risk Insurance Act of 2002 (“TRIA”) and the subsequent enactment of the Terrorism Risk Insurance Program Reauthorization Act of 2015, which extended TRIA through the end of 2020, insurers are required to make terrorism insurance available under their property and casualty insurance policies, but this legislation does not regulate the pricing of such insurance, and there is no assurance this legislation will be extended beyond 2020. The absence of affordable insurance coverage may adversely affect the general real estate finance market, lending volume and the market’s overall liquidity and may reduce the number of suitable investment opportunities available to us and the pace at which we are able to make investments. If the properties underlying our investments are unable to obtain affordable insurance coverage, the value of those investments could decline, and in the event of an uninsured loss, we could lose all or a portion of our investment.
Liability relating to environmental matters may impact the value of properties that we may acquire upon foreclosure of the properties underlying our loans.
To the extent we foreclose on properties underlying our loans, we may be subject to environmental liabilities arising from such foreclosed properties. Under various U.S. federal, state and local laws, an owner or operator of real property may become liable for the costs of removal of certain hazardous substances released on its property. These laws often impose liability without regard to whether the owner or operator knew of, or was responsible for, the release of such hazardous substances. If we foreclose on any properties underlying our loans, the presence of hazardous substances on a property may adversely affect our ability to sell the property and we may incur substantial remediation costs. As a result, the discovery of material environmental liabilities attached to such properties could materially and adversely affect us.
We may be subject to lender liability claims, and if we are held liable under such claims, we could be subject to losses.
In recent years, a number of judicial decisions have upheld the right of borrowers to sue lending institutions on the basis of various evolving legal theories, collectively termed “lender liability.” Generally, lender liability is founded on the premise that a lender has either violated a duty, whether implied or contractual, of good faith and fair dealing owed to the borrower or has assumed a degree of control over the borrower resulting in the creation of a fiduciary duty owed to the borrower or its other creditors or stockholders. We cannot assure prospective investors that such claims will not arise or that we will not be subject to significant liability and losses if a claim of this type were to arise.
If the loans that we originate or acquire do not comply with applicable laws, we may be subject to penalties, which could materially and adversely affect us.
Loans that we originate or acquire may be directly or indirectly subject to U.S. federal, state or local governmental laws. Real estate lenders and borrowers may be responsible for compliance with a wide range of laws intended to protect the public interest, including, without limitation, the Truth in Lending, Equal Credit Opportunity, Fair Housing and Americans with Disabilities Acts and local zoning laws (including, but not limited to, zoning laws
25
that allow permitted non-conforming uses). If we or any other person fails to comply with such laws in relation to a loan that we have originated or acquired, legal penalties may be imposed, which could materially and adversely affect us. Additionally, jurisdictions with “one action,” “security first” and/or “antideficiency rules” may limit our ability to foreclose on a real property or to realize on obligations secured by a real property. In the future, new laws may be enacted or imposed by U.S. federal, state or local governmental entities, and such laws could have a material adverse effect on us.
If we originate or acquire commercial mortgage loans or commercial real estate-related debt instruments secured by liens on facilities that are subject to a ground lease and such ground lease is terminated unexpectedly, our interests in such loans could be materially and adversely affected.
A ground lease is a lease of land, usually on a long-term basis, that does not include buildings or other improvements on the land. Normally, any real property improvements made by the lessee during the term of the lease will revert to the owner at the end of the lease term. We may originate or acquire commercial mortgage loans or commercial real estate-related debt instruments secured by liens on facilities that are subject to a ground lease, and, if the ground lease were to expire or terminate unexpectedly, due to the borrower’s default on such ground lease, our interests in such loans could be materially and adversely affected.
Risks Related to Our Financing and Hedging
We have a significant amount of debt, which subjects us to increased risk of loss, and our charter and bylaws contain no limitation on the amount of debt we may incur or have outstanding.
As of December 31, 2017, we had $2.1 billion of debt outstanding. In the future, subject to market conditions and availability, we may incur significant additional debt through secured revolving repurchase facilities, senior secured credit facilities, asset-specific financings, warehouse facilities, structured financing and derivative instruments, in addition to transaction or asset-specific funding arrangements. We may also rely on short-term financing that would especially expose us to changes in availability. We may also issue additional equity, equity-related and debt securities to fund our investment strategy. As of December 31, 2017, we were a party to secured revolving repurchase and senior secured credit facilities with each of Goldman Sachs Bank USA, JP Morgan Chase Bank, National Association, Morgan Stanley Bank, N.A., Wells Fargo Bank, National Association, Royal Bank of Canada, U.S. Bank National Association, and Bank of America N.A., with an aggregate maximum size of approximately $2.8 billion for loans and $3.0 billion for loans and CMBS combined.
Subject to compliance with the leverage covenants contained in our secured revolving repurchase facilities and other financing documents, we expect that the amount of leverage that we will incur in the future will take into account a variety of factors, which may include our Manager’s assessment of credit, liquidity, price volatility and other risks of our investments and the financing counterparties, the potential for losses and extension risk in our portfolio and availability of particular types of financing at the then-current rate. Given current market conditions, we expect that our overall leverage, measured as the ratio of debt to equity, will generally range from 3.0 to 3.5:1, subject to compliance with our financial covenants under our secured revolving repurchase facilities and other contractual obligations, although we may employ more or less leverage on individual loan investments after consideration of the impact on expected risk and return of the specific situation, and future changes in value of underlying properties. To the extent we believe market conditions are favorable, we may revise our leverage policy in the future. Incurring substantial debt could subject us to many risks that, if realized, would materially and adversely affect us, including the risk that:
|
|
• |
our cash flow from operations may be insufficient to make required payments of principal of and interest on our debt, which is likely to result in (a) acceleration of such debt (and any other debt containing a cross-default or cross-acceleration provision), which we then may be unable to repay from internal funds or to refinance on favorable terms, or at all, (b) our inability to borrow undrawn amounts under our financing arrangements, even if we are current in payments on borrowings under those arrangements, which would result in a decrease in our liquidity, and/or (c) the loss of some or all of our collateral assets to foreclosure or sale; |
|
|
• |
our debt may increase our vulnerability to adverse economic and industry conditions with no assurance that investment yields will increase in an amount sufficient to offset the higher financing costs; |
26
|
|
• |
we may not be able to refinance any debt that matures prior to the maturity (or realization) of an underlying investment it was used to finance on favorable terms or at all. |
There can be no assurance that our leverage strategy will be successful, and our leverage strategy may cause us to incur significant losses, which could materially and adversely affect us.
There can be no assurance that we will be able to obtain or utilize additional financing arrangements in the future on similar or more favorable terms, or at all.
Our ability to fund our investments and refinance our existing indebtedness will be impacted by our ability to secure additional financing through various arrangements, including secured revolving repurchase facilities, non-recourse CLO financing and asset-specific financing structures, on favorable terms. In certain instances, we create structural leverage through the co-origination or non-recourse syndication of a senior loan interest to a third party. In either case, the senior mortgage loan is not included on our balance sheet, and we refer to such senior loan interest as a “non-consolidated senior interest.” When we create structural leverage through the co-origination or non-recourse syndication of a senior loan interest to a third party, we retain on our balance sheet a mezzanine loan. Over time, in addition to these types of financings, we may use other forms of leverage, including secured and unsecured warehouse facilities, structured financing, derivative instruments and public and private secured and unsecured debt issuances by us or our subsidiaries. Our access to additional sources of financing will depend upon a number of factors, over which we have little or no control, including:
|
|
• |
general economic or market conditions; |
|
|
• |
the market’s view of the quality of our investments; |
|
|
• |
the market’s perception of our growth potential; |
|
|
• |
our current and potential future earnings and cash distributions; and |
|
|
• |
the market price of our common stock. |
We also expect to periodically access the capital markets to raise cash to fund new investments. Unfavorable economic or capital market conditions may increase our funding costs, limit our access to the capital markets or could result in a decision by our potential lenders not to extend credit. An inability to successfully access the capital markets could limit our ability to grow our business and fully execute our investment strategy and could decrease our earnings and liquidity. In addition, any dislocation or weakness in the capital and credit markets could adversely affect one or more lenders and could cause one or more of our lenders to be unwilling or unable to provide us with financing or to increase the costs of that financing. In addition, as regulatory capital requirements imposed on our lenders are increased, they may be required to limit, or increase the cost of, financing they provide to us. In general, this could potentially increase our financing costs and reduce our liquidity or require us to sell assets at an inopportune time or price. Accordingly, there can be no assurance that we will be able to obtain or utilize any financing arrangements in the future on similar or more favorable terms, or at all. In addition, even if we are able to access the capital markets, significant balances may be held in cash or cash equivalents pending future investment as we may be unable to invest proceeds on the timeline anticipated.
Certain of our current financing arrangements contain, and our future financing arrangements likely will contain, various financial and operational covenants, and a default of any such covenants could materially and adversely affect us.
Certain of our current financing arrangements contain, and our future financing arrangements likely will contain, various financial and operational covenants affecting our ability and, in certain cases, our subsidiaries’ ability, to incur additional debt, make certain investments, reduce liquidity below certain levels, make distributions to our stockholders and otherwise affect our operating policies. For a description of certain of the covenants, see Item 7- “Management’s Discussion and Analysis of Financial Condition and Results of Operations—Investment Portfolio Financing.” If we fail to meet or satisfy any of these covenants in our financing arrangements, we would be in default under these agreements, which could result in a cross-default or cross-acceleration under other financing arrangements, and our lenders could elect to declare outstanding amounts due and payable (or such amounts may
27
automatically become due and payable), terminate their commitments, require the posting of additional collateral and enforce their respective interests against existing collateral. A default also could limit significantly our financing alternatives, which could cause us to curtail our investment activities or dispose of assets when we otherwise would not choose to do so. Further, this could make it difficult for us to satisfy the requirements necessary to maintain our qualification as a REIT for U.S. federal income tax purposes. As a result, a default on any of our debt agreements, and in particular our secured revolving repurchase facilities (since a significant portion of our assets are or will be, as the case may be, financed thereunder), could materially and adversely affect us.
Our financing arrangements may require us to provide additional collateral or pay down debt.
Our current and future financing arrangements involve the risk that the market value of the assets pledged or sold by us to the provider of the financing may decline in value, in which case the lender or counterparty may require us to provide additional collateral or lead to margin calls that may require us to repay all or a portion of the funds advanced. We may not have the funds available to repay our debt at that time, which would likely result in defaults unless we are able to raise the funds from alternative sources, including by selling assets at a time when we might not otherwise choose to do so, which we may not be able to achieve on favorable terms or at all. See “—Our current financing arrangements contain, and our future financing arrangements likely will contain, various financial and operational covenants, and a default of any such covenants could materially and adversely affect us.” Posting additional margin would reduce our cash available to make other, higher yielding investments (thereby decreasing our return on equity). If we cannot meet these requirements, the lender or counterparty could accelerate our indebtedness, increase the interest rate on advanced funds and terminate our ability to borrow funds from it, which could materially and adversely affect us. In the case of repurchase transactions, if the value of the underlying security has declined as of the end of that term, or if we default on our obligations under the secured revolving repurchase facility, we will likely incur a loss on our repurchase transactions. In addition, if a lender or counterparty files for bankruptcy or becomes insolvent, our loans may become subject to bankruptcy or insolvency proceedings, thus depriving us, at least temporarily, of the benefit of these assets. Such an event could restrict our access to financing and increase our cost of capital.
Interest rate fluctuations could increase our financing costs, which could materially and adversely affect us.
Our primary interest rate exposures relate to the yield on our loans and the financing cost of our debt, as well as any interest rate swaps utilized for hedging purposes. Changes in interest rates affect our net interest income, which is the difference between the interest income we earn on our interest-earning assets and the interest expense we incur in financing these assets. In a period of rising interest rates, our interest expense on floating rate debt would increase, while any additional interest income we earn on floating rate assets may not compensate for such increase in interest expense and the interest income we earn on fixed rate assets would not change. Similarly, in a period of declining interest rates, our interest income on floating rate assets would decrease, while any decrease in the interest we are charged on our floating rate debt may not compensate for such decrease in interest income and the interest expense we incur on our fixed rate debt would not change. Consequently, changes in interest rates may significantly influence our net interest income. Interest rate fluctuations resulting in our interest expense exceeding interest income would result in operating losses, which could materially and adversely affect us. Changes in the level of interest rates also may affect our ability to originate or acquire loans or other investments, the value of our investments and our ability to realize gains from the disposition of assets. Moreover, changes in interest rates may affect borrower default rates.
Our investments may be subject to fluctuations in interest rates that may not be adequately protected, or protected at all, by our hedging strategies.
Our investments currently include loans primarily with floating interest rates and, in the future, may include loans with fixed interest rates. Floating rate investments earn interest at rates that adjust from time to time (typically, in our case, monthly) based upon an index (in our case, LIBOR). These floating rate loans are insulated from changes in value specifically due to changes in interest rates; however, the interest they earn fluctuates based upon interest rates (for example, LIBOR) and, in a declining and/or low interest rate environment, these loans will earn lower rates of interest and this will impact our operating performance. Fixed interest rate investments, however, do not have adjusting interest rates and the relative value of the fixed cash flows from these investments will decrease as prevailing interest rates rise or increase as prevailing interest rates fall, causing potentially significant changes in value. Our Manager may employ various hedging strategies on our behalf to limit the effects of changes in interest rates (and in some cases credit spreads), including engaging in interest rate swaps, caps, floors and other interest rate derivative products. We believe that no strategy can completely insulate us from the risks associated with interest
28
rate changes and there is a risk that they may provide no protection at all and potentially compound the impact of changes in interest rates. Hedging transactions involve certain additional risks such as counterparty risk, leverage risk, the legal enforceability of hedging contracts, the early repayment of hedged transactions and the risk that unanticipated and significant changes in interest rates may cause a significant loss of basis in the contract and a change in current period expense. We cannot make assurances that we will be able to enter into hedging transactions or that such hedging transactions will adequately protect us against the foregoing risks.
Our use of leverage may create a mismatch with the duration and index of the investments that we are financing.
We generally seek to structure our leverage such that we minimize the differences between the term of our investments and the leverage we use to finance such an investment. However, under certain circumstances, we may determine not to do so or we may otherwise be unable to do so. In addition, we finance each loan or other investment on an individual basis. Accordingly, the extended term of the financed loan or other investment may not correspond to the term to extended maturity of the financing for such loan or other investment. In the event that our leverage is for a shorter term than the financed loan or other investment, we may not be able to extend or find appropriate replacement leverage and that would have an adverse impact on our liquidity and our returns. In the event that our leverage is for a longer term than the financed loan or other investment, we may not be able to repay such leverage or replace the financed loan or other investment with an optimal substitute or at all, which would negatively impact our desired leveraged returns.
We generally attempt to structure our leverage such that we minimize the differences between the index of our investments and the index of our leverage (for example, financing floating rate investments with floating rate leverage and fixed rate investments with fixed rate leverage). If such a product is not available to us from our lenders on reasonable terms, we may use hedging instruments to effectively create such a match. For example, in the case of future fixed rate investments, we may finance such investments with floating rate leverage, but effectively convert all or a portion of the attendant leverage to fixed rate using hedging strategies.
Our attempts to mitigate such risk are subject to factors outside our control, such as the availability to us of favorable financing and hedging options, which is subject to a variety of factors, of which duration and term matching are only two. The risks of a duration mismatch are magnified by the potential for the extension of loans in order to maximize the likelihood and magnitude of their recovery value in the event the loans experience credit or performance challenges. Employment of this asset management practice would effectively extend the duration of our investments, while our liabilities have set maturity dates.
Warehouse facilities that we may obtain in the future may limit our ability to originate or acquire assets, and we may incur losses if the collateral is liquidated.
We may utilize, if available, warehouse facilities pursuant to which we would accumulate loans in anticipation of a securitization or other financing, which assets would be pledged as collateral for such facilities until the securitization or other transaction is consummated. In order to borrow funds to originate or acquire assets under any future warehouse facilities, we expect that our lenders thereunder would have the right to review the potential assets for which we seek financing. We may be unable to obtain the consent of a lender to originate or acquire assets that we believe would be beneficial to us and we may be unable to obtain alternate financing for such assets. In addition, no assurance can be given that a securitization or other financing would be consummated with respect to the assets being warehoused. If the securitization or other financing is not consummated, the lender could demand repayment of the facility, and in the event that we were unable to timely repay, could liquidate the warehoused collateral and we would then have to pay any amount by which the original purchase price of the collateral assets exceeds its sale price, subject to negotiated caps, if any, on our exposure. In addition, regardless of whether the securitization or other financing is consummated, if any of the warehoused collateral is sold before the completion, we would have to bear any resulting loss on the sale.
We have utilized and may in the future utilize securitizations to finance our investments, which may expose us to risks that could result in losses.
We have utilized and may in the future utilize securitizations of certain of our investments to generate cash for funding new investments and for other purposes. Such financing generally involves creating a special purpose vehicle, contributing a pool of our investments to the entity, and selling interests in the entity on a non-recourse basis to purchasers (whom we would expect to be willing to accept a lower interest rate to invest in investment-grade loan pools). We would expect to retain all or a portion of the equity and potentially other tranches in the securitized pool of portfolio investments. Prior to any such financings, we may use short-term facilities to finance
29
the acquisition of investments until a sufficient quantity of investments had been accumulated, at which time we would refinance these facilities through a securitization, such as a CMBS, or issuance of CLOs, or the private placement of loan participations or other long-term financing. When employing this strategy, we would be subject to the risk that we would not be able to acquire, during the period that our short-term facilities are available, a sufficient amount of eligible investments or loans to maximize the efficiency of a CMBS, CLO or private placement issuance. We also would be subject to the risk that we would not be able to obtain short-term credit facilities or would not be able to renew any short-term credit facilities after they expire should we find it necessary to extend our short-term credit facilities to allow more time to seek and acquire the necessary eligible investments for a long-term financing. The inability to consummate securitizations of our portfolio to finance our investments on a long-term basis could require us to seek other forms of potentially less attractive financing or to liquidate assets at an inopportune time or price, which could adversely affect our performance and our ability to grow our business.
Moreover, conditions in the capital markets, including volatility and disruption in the capital and credit markets, may not permit a securitization at any particular time or may make the issuance of any such securitization less attractive to us even when we do have sufficient eligible assets. We may also suffer losses if the value of the mortgage loans we acquire declines prior to securitization. Declines in the value of a mortgage loan can be due to, among other things, changes in interest rates and changes in the credit quality of the loan. In addition, we may suffer a loss due to the incurrence of transaction costs related to executing these transactions. To the extent that we incur a loss executing or participating in future securitizations for the reasons described above or for other reasons, it could materially and adversely impact our business and financial condition. The inability to securitize our portfolio may hurt our performance and our ability to grow our business.
On February 14, 2018, we closed a $932.4 million CLO, creating additional matched-term, matched index funding for approximately 29% of our loan portfolio by unpaid principal balance at December 31, 2017. For more information on the CLO, see Note 17 to our consolidated financial statements in this Form 10-K.
We may be subject to losses arising from guarantees of debt and contingent obligations of our subsidiaries or joint venture or co-investment partners.
We conduct substantially all of our operations and own substantially all of our assets through our holding company subsidiary, TPG RE Finance Trust Holdco, LLC (“Holdco”). Holdco has guaranteed repayment of 25% of the principal amount borrowed and other payment obligations under each of our secured revolving repurchase facilities secured by loans and 100% of the principal amount borrowed and other payment obligations under each of our secured revolving repurchase facilities secured by CMBS. In connection with certain of our asset-specific financings, Holdco has provided funding guarantees under which Holdco guarantees the funding obligations of the special purpose lending entity in limited circumstances. Our secured revolving repurchase facilities provide for significant aggregate borrowings. Holdco may in the future guarantee the performance of additional subsidiaries’ obligations. The guarantee agreements contain financial covenants covering liquid assets and net worth requirements. Holdco’s failure to satisfy these covenants and other requirements could result in defaults under each of our secured revolving repurchase facilities and acceleration of the amount borrowed thereunder. Such defaults could have a material adverse effect on us. We may also agree to guarantee indebtedness incurred by a joint venture or co-investment partner. Such a guarantee may be on a joint and several basis with such joint venture or co-investment partner, in which case we may be liable in the event such partner defaults on its guarantee obligation. The non-performance of such obligations may cause losses to us in excess of the capital we initially may have invested or committed under such obligations and there is no assurance that we will have sufficient capital to cover any such losses.
Hedging may adversely affect our earnings, which could materially and adversely affect us.
Subject to maintaining our qualification as a REIT, we may pursue various hedging strategies to seek to reduce our exposure to adverse changes in interest rates and fluctuations in currencies. Our hedging activity will vary in scope based on the level and volatility of interest rates, the type of assets held and other changing market conditions. Interest rate and currency hedging may fail to protect or could adversely affect our earnings because, among other things:
|
|
• |
interest, currency and/or credit hedging can be expensive and may result in us generating less net interest income; |
|
|
• |
available interest or currency rate hedges may not correspond directly with the interest rate or currency risk for which protection is sought; |
30
|
|
• |
due to a credit loss, prepayment or asset sale, the duration of the hedge may not match the duration of the related asset or liability; |
|
|
• |
the amount of income that a REIT may earn from hedging transactions (other than hedging transactions that satisfy certain requirements of the Internal Revenue Code or that are done through a taxable REIT subsidiary (“TRS”)) to offset interest rate losses is limited by U.S. federal income tax provisions governing REITs; |
|
|
• |
the credit quality of the hedging counterparty owing money on the hedge may be downgraded to such an extent that it impairs our ability to sell or assign our side of the hedging transaction; |
|
|
• |
the hedging counterparty owing money in the hedging transaction may default on its obligation to pay; |
|
|
• |
we may fail to recalculate, readjust and execute hedges in an efficient manner; and |
|
|
• |
legal, tax and regulatory changes could occur and may adversely affect our ability to pursue our hedging strategies and/or increase the costs of implementing such strategies. |
Accordingly, any hedging activity in which we engage may materially and adversely affect us. While we may enter into such transactions seeking to reduce risks, unanticipated changes in interest rates, credit spreads or currencies may result in poorer overall investment performance than if we had not engaged in any such hedging transactions. In addition, the degree of correlation between price movements of the instruments used in a hedging strategy and price movements in the portfolio positions or liabilities being hedged may vary materially. Moreover, for a variety of reasons, we may not seek to establish a perfect correlation between such hedging instruments and the portfolio positions or liabilities being hedged. Any such imperfect correlation may prevent us from achieving the intended hedge and expose us to risk of loss.
In addition, some hedging instruments involve risk because they often are not traded on regulated exchanges, guaranteed by an exchange or its clearing house, or regulated by any U.S. or foreign governmental authorities. Consequently, we cannot assure you that a liquid secondary market will exist for hedging instruments purchased or sold, and we may be required to maintain a position until exercise or expiration, which could result in significant losses. In addition, there are no requirements with respect to record keeping, financial responsibility or segregation of customer funds and positions, and the business failure of a hedging counterparty with whom we enter into a hedging transaction will most likely result in its default, which may result in the loss of unrealized profits and force us to cover our commitments, if any, at the then-current market price.
We may be subject to counterparty risk associated with hedging activities.
We may be subject to credit risk with respect to counterparties to derivative contracts (whether a clearing corporation in the case of exchange-traded instruments or another third party in the case of over-the-counter instruments). If a counterparty becomes bankrupt or otherwise fails to perform its obligations under a derivative contract due to financial difficulties, we may experience significant delays in obtaining any recovery under the derivative contract in a dissolution, assignment for the benefit of creditors, liquidation, winding-up, bankruptcy, or other analogous proceeding. In addition, in the event of the insolvency of a counterparty to a derivative transaction, the derivative transaction would typically be terminated at its fair market value. If we are owed this fair market value in the termination of the derivative transaction and its claim is unsecured, we will be treated as a general creditor of such counterparty, and will not have any claim with respect to the underlying security. We may obtain only a limited recovery or may obtain no recovery in such circumstances. Counterparty risk with respect to certain exchange-traded and over-the-counter derivatives may be further complicated by recently enacted U.S. financial reform legislation.
We may enter into hedging transactions that could expose us to contingent liabilities in the future.
Subject to maintaining our qualification as a REIT, part of our investment strategy may involve entering into hedging transactions that could require us to fund cash payments in certain circumstances (such as the early termination of the hedging instrument caused by an event of default or other early termination event, or the decision by a counterparty to request margin securities it is contractually owed under the terms of the hedging instrument). The amount due would be equal to the unrealized loss of the open swap positions with the respective counterparty and could also include other fees and charges. These economic losses will be reflected in our results of operations, and our ability to fund these obligations will depend on the liquidity of our assets and access to capital at the time, and the need to fund these obligations could materially and adversely affect us.
31
We may enter into certain hedging transactions or otherwise invest in certain derivative instruments coming within the regulatory jurisdiction of the Commodity Futures Trading Commission (“CFTC”). Maintaining relief from regulation as a commodity pool operator requires us to limit our exposure to such derivative instruments and may thus limit our ability to engage in certain transactions, even if doing so would otherwise be prudent and beneficial and if not doing so could have a material adverse effect on us.
Mortgage real estate investment trusts (“mortgage REITs”) that trade in commodity interest positions (including swaps) are considered commodity pools and the operators of such mortgage REITs, absent relief from the CFTC, would be required to register as commodity pool operators (“CPOs”) and to become members of the National Futures Association (the “NFA”). Registration with the CFTC and membership in the NFA require compliance with the NFA’s rules and renders such CPO subject to regulation by the CFTC, including with respect to disclosure, reporting, recordkeeping and business conduct.
The CFTC has provided relief from CPO registration to operators of mortgage REITS, subject to certain conditions. Among the conditions of the relief are that REITs claiming the relief limit the initial margin and premiums required to establish commodity interest positions to no more than five percent of the fair market value of their total assets and limit the net income derived annually from their commodity interest positions that are not qualifying hedging transactions to less than five percent of their gross income. We may from time to time, directly or indirectly, invest in commodity interests for hedging or investment purposes. We intend to comply with the conditions of the CFTC relief, even if breaching the five percent thresholds, in particular with respect to initial margin and premiums required to establish commodity interest positions, would otherwise be prudent and beneficial to us and even if not breaching such thresholds could have a material adverse effect on us. Additionally, because we are not required to register as a CPO, we are not required to comply with CFTC regulations related to disclosure, recordkeeping and reporting or with the NFA business conduct rules.
Risks Related to Our Relationship with Our Manager and its Affiliates
We depend on our Manager and the personnel of TPG provided to our Manager for our success. We may not find a suitable replacement for our Manager if our Management Agreement is terminated, or if key personnel cease to be employed by TPG or otherwise become unavailable to us, which would materially and adversely affect us.
We are externally managed and advised by our Manager, an affiliate of TPG. We currently have no employees and all of our executive officers are employees of TPG. We are completely reliant on our Manager, which has significant discretion as to the implementation of our investment and operating policies and strategies.
Our success depends entirely upon the ongoing efforts, experience, diligence, skill, and network of business contacts of our executive officers and the other key personnel of TPG provided to our Manager and its affiliates. These individuals evaluate, negotiate, execute and monitor our loans and other investments and advise us regarding maintenance of our REIT status and exclusion or exemption from regulation under the Investment Company Act.
In addition, we can offer no assurance that our Manager will remain our investment manager or that we will continue to have access to our executive officers and the other key personnel of TPG who provide services to us. If we terminate our Management Agreement other than upon the occurrence of a cause event or if our Manager terminates our Management Agreement upon our material breach, we would be required to pay a very substantial termination fee to our Manager. See “—Termination of our Management Agreement would be costly.” Furthermore, if our Management Agreement is terminated and no suitable replacement is found to manage us, we may not be able to execute our business plan, which would materially and adversely affect us.
Other than any dedicated or partially dedicated chief financial officer that our Manager may elect to provide to us, the TPG personnel provided to our Manager, as our external manager, are not required to dedicate a specific portion of their time to the management of our business.
Other than with respect to any dedicated or partially dedicated chief financial officer that our Manager may elect to provide to us, neither our Manager nor any other TPG affiliate is obligated to dedicate any specific personnel exclusively to us nor are they or their personnel obligated to dedicate any specific portion of their time to the management of our business. Although our Manager has informed us that Robert Foley will continue to serve as our chief financial and risk officer and that he will spend a substantial portion of his time on our affairs, key personnel, including Mr. Foley, provided to us by our Manager may become unavailable to us as a result of their departure from TPG or for any other reason. As a result, we cannot provide any assurances regarding the amount of time our Manager or its affiliates will dedicate to the management of our business and our Manager and its affiliates
32
may have conflicts in allocating their time, resources and services among our business and any TPG Funds they may manage, and such conflicts may not be resolved in our favor. Each of our executive officers is also an employee of TPG, who has now or may be expected to have significant responsibilities for TPG Funds managed by TPG now or in the future. Consequently, we may not receive the level of support and assistance that we otherwise might receive if we were internally managed. Our Manager and its affiliates are not restricted from entering into other investment advisory relationships or from engaging in other business activities.
Our Manager manages our portfolio pursuant to very broad investment guidelines and is not required to seek the approval of our board of directors for each investment, financing, asset allocation or hedging decision made by it, which may result in our making riskier loans and other investments and which could materially and adversely affect us.
Our Manager is authorized to follow very broad investment guidelines that provide it with substantial discretion regarding investment, financing, asset allocation and hedging decisions. Our board of directors will periodically review our investment guidelines and our portfolio but will not, and will not be required to, review and approve in advance all of our proposed loans and other investments or our Manager’s financing, asset allocation or hedging decisions. In addition, in conducting periodic reviews, our directors may rely primarily on information provided, or recommendations made, to them by our Manager or its affiliates. Subject to maintaining our REIT qualification and our exclusion or exemption from regulation under the Investment Company Act, our Manager has significant latitude within the broad investment guidelines in determining the types of loans and other investments it makes for us, and how such loans and other investments are financed or hedged, which could result in investment returns that are substantially below expectations or losses, which could materially and adversely affect us.
Our Manager’s fee structure may not create proper incentives or may induce our Manager and its affiliates to make certain loans or other investments, including speculative investments, which increase the risk of our portfolio.
We pay our Manager base management fees regardless of the performance of our portfolio. Our Manager’s entitlement to base management fees, which are not based solely upon performance metrics or goals, might reduce its incentive to devote its time and effort to seeking loans or other investments that provide attractive risk-adjusted returns for our stockholders. Because the base management fees are also based in part on our outstanding equity, our Manager may also be incentivized to advance strategies that increase our equity, and there may be circumstances where increasing our equity will not optimize the returns for our stockholders. Consequently, we are required to pay our Manager base management fees in a particular period despite experiencing a net loss or a decline in the value of our portfolio during that period.
In addition, our Manager has the ability to earn incentive compensation each quarter based on our Core Earnings, as calculated in accordance with our Management Agreement, which may create an incentive for our Manager to invest in assets with higher yield potential, which are generally riskier or more speculative, or sell an asset prematurely for a gain, in an effort to increase our short-term net income and thereby increase the incentive compensation to which it is entitled. This could result in increased risk to our investment portfolio. If our interests and those of our Manager are not aligned, the execution of our business plan could be adversely affected, which could materially and adversely affect us.
We may compete with existing and future TPG Funds, which may present various conflicts of interest that restrict our ability to pursue certain investment opportunities or take other actions that are beneficial to our business and result in decisions that are not in the best interests of our stockholders.
We are subject to conflicts of interest arising out of our relationship with TPG, including our Manager and its affiliates. As of December 31, 2017, three of our seven directors are employees of TPG. In addition, our chief financial and risk officer and our other executive officers are also employees of TPG, and we are managed by our Manager, a TPG affiliate. There is no guarantee that the policies and procedures adopted by us, the terms and conditions of our Management Agreement or the policies and procedures adopted by our Manager, TPG and their affiliates, as the case may be, will enable us to identify, adequately address or mitigate these conflicts of interest. Some examples of conflicts of interest that may arise by virtue of our relationship with our Manager and TPG include:
33
|
|
contractual restrictions may reduce the advantages across TPG’s various businesses that TPG expects to draw on for purposes of pursuing attractive investment opportunities. Because TPG has many different asset management, advisory and other businesses, it is subject to a number of actual and potential conflicts of interest, greater regulatory oversight and more legal and contractual restrictions than that to which it would otherwise be subject if it had just one line of business. In addressing these conflicts and regulatory, legal and contractual requirements across its various businesses, TPG has implemented certain policies and procedures (for example, information walls) that may reduce the benefits that TPG expects to utilize for our Manager for purposes of identifying and managing our investments. For example, TPG may come into possession of material non-public information with respect to companies that are TPG’s advisory clients in which our Manager may be considering making an investment on our behalf. As a consequence, that information, which could be of benefit to our Manager or us, might become restricted to those other businesses and otherwise be unavailable to our Manager, and could also restrict our Manager’s activities. Additionally, the terms of confidentiality or other agreements with or related to companies in which any TPG Fund has or has considered making an investment or which is otherwise an advisory client of TPG may restrict or otherwise limit the ability of TPG or our Manager to engage in businesses or activities competitive with such companies. |
|
|
• |
Allocation of Investment Opportunities. Certain inherent conflicts of interest arise from the fact that TPG and our Manager will provide investment management and other services both to us and to other persons or entities, whether or not the investment objectives or policies of any such other person or entity are similar to those of ours, including, without limitation, the sponsoring, closing and/or managing of any TPG Fund. However, for so long as our Management Agreement is in effect and TPG controls our Manager, neither our Manager nor TPG Real Estate Management, LLC, which is the manager of TPG Real Estate Partners, will directly or indirectly form any other public vehicle in the U.S. whose strategy is to primarily originate, acquire and manage performing commercial mortgage loans. The respective investment guidelines and policies of our business and the TPG Funds may or may not overlap, in whole or in part, and if there is any such overlap, investment opportunities will be allocated between us and the TPG Funds in a manner that may result in fewer investment opportunities being allocated to us than would have otherwise been the case in the absence of such TPG Funds. The methodology applied between us and one or more of the TPG Funds under TPG’s allocation policy may result in us not participating (and/or not participating to the same extent) in certain investment opportunities in which we would have otherwise participated had the related allocations been determined without regard to such allocation policy and/or based only on the circumstances of those particular investments. TPG and our Manager may also give advice to TPG Funds that may differ from advice given to us even though such TPG Funds’ investment objectives may be the same or similar to ours. |
There are currently two TPG Fund complexes that are making new investments that may include the origination, acquisition and management of mortgage-related loans and CMBS as a part of their primary investment strategy, which funds collectively had approximately $12.2 billion in aggregate capital commitments as of December 31, 2017.
As a result, we may invest in commercial mortgage loans or other commercial real estate-related debt instruments alongside certain TPG Funds focusing on commercial mortgage loans or other commercial real estate-related debt instruments. To the extent any TPG Funds otherwise have investment objectives or guidelines that overlap with ours, in whole or in part, then, pursuant to TPG’s allocation policy, investment opportunities that fall within such common objectives or guidelines will generally be allocated among our company and one or more of such TPG Funds on a basis that our Manager and applicable TPG affiliates determine to be fair and reasonable in their sole discretion, subject to the following considerations:
|
|
o |
our and the relevant TPG Funds’ investment focuses and objectives; |
|
|
o |
the TPG professionals who sourced the investment opportunity; |
|
|
o |
the TPG professionals who are expected to oversee and monitor the investment; |
|
|
o |
the expected amount of capital required to make the investment, as well as our and the relevant TPG Funds’ current and projected capacity for investing (including for any potential follow-on investments); |
34
|
|
o |
the stage of development of the prospective portfolio company or borrower; |
|
|
o |
our and the relevant TPG Funds’ respective existing portfolio of investments; |
|
|
o |
the investment opportunity’s risk profile; |
|
|
o |
our and the relevant TPG Funds’ respective expected life cycles; |
|
|
o |
any investment targets or restrictions (e.g., industry, size, etc.) that apply to us and the relevant TPG Funds; |
|
|
o |
our ability and the ability of the relevant TPG Funds to accommodate structural, timing and other aspects of the investment process; and |
|
|
o |
legal, tax, contractual, regulatory or other considerations that our Manager and applicable TPG affiliates deem relevant. |
There is no assurance that any such conflicts arising out of the foregoing will be resolved in our favor. Our Manager and TPG affiliates are entitled to amend their investment objectives or guidelines at any time without prior notice to us or our consent.
|
|
• |
Investments in Different Levels or Classes of an Issuer’s Securities. We and the TPG Funds may make investments at different levels of an issuer’s or borrower’s capital structure (for example, an investment by a TPG Fund in an equity or mezzanine interest with respect to the same portfolio entity in which we own a debt interest or vice versa) or in a different tranche of debt or equity with respect to an entity in which we have an interest. We may make investments that are senior or junior to, or have rights and interests different from or adverse to, the investments made by the TPG Funds. Such investments may conflict with the interests of such TPG Funds in related investments, and the potential for any such conflicts of interests may be heightened in the event of a default or restructuring of any such investments. Actions may be taken for the TPG Funds that are adverse to us, including with respect to the timing and manner of sale and actions taken in circumstances of financial distress. In addition, in connection with such investments, TPG will generally seek to implement certain procedures to mitigate conflicts of interest which typically involve maintaining a non-controlling interest in any such investment and a forbearance of rights, including certain non-economic rights, relating to the TPG Funds, such as where TPG may cause us to decline to exercise certain control- and/or foreclosure-related rights with respect to a portfolio entity (including following the vote of other third-party lenders generally or otherwise recusing itself with respect to decisions), including with respect to defaults, foreclosures, workouts, restructurings and/or exit opportunities, subject to certain limitations. Our Management Agreement requires our Manager to keep our board of directors reasonably informed on a periodic basis in connection with the foregoing, including with respect to transactions that involve investments at different levels of an issuer’s or borrower’s capital structure, as to which our Manager has agreed to provide our board of directors with quarterly updates. While TPG will seek to resolve any conflicts in a fair and equitable manner with respect to conflicts resolution among us and the TPG Funds generally, such transactions are not required to be presented to our board of directors for approval, and there can be no assurance that any such conflicts will be resolved in our favor. |
|
|
• |
Assignment and Sharing or Limitation of Rights. We may invest alongside TPG Funds and in connection therewith may, for legal, tax, regulatory or other reasons which may be unrelated to us, share with or assign to such TPG Funds certain of our rights, in whole or in part, or agree to limit our rights, including in certain instances certain control- and/or foreclosure-related rights with respect to such shared investments and/or otherwise agree to implement certain procedures to ameliorate conflicts of interest which may in certain circumstances involve a forbearance of our rights. Such sharing or assignment of rights could make it more difficult for us to protect our interests and could give rise to a conflict (which may be exacerbated in the case of financial distress) and could result in a TPG Fund exercising such rights in a way adverse to us. |
35
|
|
purchaser commits to or makes such investments. We may also make investments and provide debt financing with respect to portfolio entities in which TPG Funds and/or their affiliates hold or propose to acquire an interest. While the terms and conditions of any such debt commitments and related arrangements will generally be on market terms, the involvement of us and/or such TPG Funds or their affiliates in such transactions may affect the terms of such transactions or arrangements and/or may otherwise influence our Manager’s decisions with respect to the management of us and/or TPG’s management of such TPG Funds and/or the relevant portfolio entity, which will give rise to potential or actual conflicts of interests and which may adversely impact us. |
|
|
• |
Pursuit of Differing Strategies. TPG and our Manager may determine that an investment opportunity may not be appropriate for us, but may be appropriate for one or more of the TPG Funds, or may decide that our company and certain of the TPG Funds should take differing positions with respect to a particular investment. In these cases, TPG and our Manager may pursue separate transactions for us and one or more TPG Funds. This may affect the market price or the terms of the particular investment or the execution of the transaction, or both, to the detriment or benefit of us and one or more TPG Funds. For example, a TPG investment manager may determine that it would be in the interest of a TPG Fund to sell a security that we hold long, potentially resulting in a decrease in the market price of the security held by us. |
|
|
• |
Variation in Financial and Other Benefits. A conflict of interest arises where the financial or other benefits available to our Manager or its affiliates differ among us and the TPG Funds that it manages. If the amount or structure of the base management fees, incentive compensation and/or our Manager’s or its affiliates’ compensation differs among us and the TPG Funds (such as where certain TPG Funds pay higher base management fees, incentive compensation, performance-based management fees or other fees), our Manager or its affiliates might be motivated to help such TPG Funds over us. Similarly, the desire to maintain assets under management or to enhance our Manager’s or its affiliates’ performance records or to derive other rewards, financial or otherwise, could influence our Manager or its affiliates in affording preferential treatment to TPG Funds over us. Our Manager may, for example, have an incentive to allocate favorable or limited opportunity investments or structure the timing of investments to favor such TPG Funds. Additionally, our Manager might be motivated to favor TPG Funds in which it has an ownership interest or in which TPG has ownership interests. Conversely, if an investment professional at our Manager or its affiliates does not personally hold an investment in us but holds investments in TPG Funds, such investment professional’s conflicts of interest with respect to us may be more acute. |
|
|
• |
Underwriting, Advisory and Other Relationships. As part of its regular business, TPG provides a broad range of underwriting, investment banking, placement agent and other services. In connection with selling investments by way of a public offering, a TPG broker-dealer may act as the managing underwriter or a member of the underwriting syndicate on a firm commitment basis and purchase securities on that basis. TPG may retain any commissions, remuneration, or other profits and receive compensation from such underwriting activities, which have the potential to create conflicts of interest. TPG may also participate in underwriting syndicates from time to time with respect to us or portfolio companies of TPG Funds, or may otherwise be involved in the private placement of debt or equity securities issued by us or such portfolio companies, or otherwise in arranging financings with respect thereto. Subject to applicable law, TPG may receive underwriting fees, placement commissions or other compensation with respect to such activities, which will not be shared with us or our stockholders. Where TPG serves as underwriter with respect to a portfolio company’s securities, we or the applicable TPG Fund holding such securities may be subject to a “lock-up” period following the offering under applicable regulations during which time our ability to sell any securities that we continue to hold is restricted. This may prejudice our ability to dispose of such securities at an opportune time. |
TPG has long-term relationships with a significant number of corporations and their senior management. In determining whether to invest in a particular transaction on our behalf, our Manager may consider those relationships (subject to its obligations under our Management Agreement), which may result in certain transactions that our Manager would not otherwise undertake or refrain from undertaking on our behalf in view of such relationships.
36
|
|
may be sources of investment opportunities, co-investors or commercial counterparties or portfolio companies of TPG Funds. Such relationships may influence our Manager in deciding whether to select such service providers. In certain circumstances, service providers or their affiliates may charge different rates or have different arrangements for services provided to TPG or TPG Funds as compared to services provided to us, which in certain circumstances may result in more favorable rates or arrangements than those payable by, or made with, us. In addition, in instances where multiple TPG businesses may be exploring a potential individual investment, certain of these service providers may choose to be engaged by TPG rather than us. |
|
|
• |
Material, Non-Public Information. We, directly or through TPG, our Manager or certain of their respective affiliates, may come into possession of material non-public information with respect to an issuer or borrower in which we have invested or may invest. Should this occur, our Manager may be restricted from buying or selling securities, derivatives or loans of the issuer or borrower on our behalf until such time as the information becomes public or is no longer deemed material. Disclosure of such information to the personnel responsible for management of our business may be on a need-to-know basis only, and we may not be free to act upon any such information. Therefore, we and/or our Manager may not have access to material non-public information in the possession of TPG which might be relevant to an investment decision to be made by our Manager on our behalf, and our Manager may initiate a transaction or purchase or sell an investment which, if such information had been known to it, may not have been undertaken. Due to these restrictions, our Manager may not be able to initiate a transaction on our behalf that it otherwise might have initiated and may not be able to purchase or sell an investment that it otherwise might have purchased or sold, which could negatively affect us. |
|
|
• |
Possible Future Activities. Our Manager and its affiliates may expand the range of services that they provide over time. Except as and to the extent expressly provided in our Management Agreement, our Manager and its affiliates will not be restricted in the scope of their businesses or in the performance of any such services (whether now offered or undertaken in the future) even if such activities could give rise to conflicts of interest, and whether or not such conflicts are described herein. Our Manager, TPG and their affiliates continue to develop relationships with a significant number of companies, financial sponsors and their senior managers, including relationships with clients who may hold or may have held investments similar to those intended to be made by us. These clients may themselves represent appropriate investment opportunities for us or may compete with us for investment opportunities. |
|
|
• |
Transactions with TPG Funds. From time to time, we may enter into purchase and sale transactions with TPG Funds. Such transactions will be conducted in accordance with, and subject to, the terms and conditions of our Management Agreement (including the requirement that sales to, or acquisitions of investments or receipt of financing from, TPG, any TPG Fund or any of their affiliates be approved in advance by a majority of our independent directors) and our code of business conduct and ethics and applicable laws and regulations. |
|
|
• |
Loan Refinancings. We may from time to time seek to participate in investments relating to the refinancing of loans held by TPG Funds. While it is expected that our participation in connection with such refinancing transactions will be at arms’ length and on market/contract terms, such transactions may give rise to potential or actual conflicts of interest. |
TPG may enter into one or more strategic relationships in certain geographical regions or with respect to certain types of investments that, although intended to provide greater opportunities for us, may require us to share such opportunities or otherwise limit the amount of an opportunity we can otherwise take.
Further conflicts could arise once we and TPG have made our and their respective investments. For example, if a company goes into bankruptcy or reorganization, becomes insolvent or otherwise experiences financial distress or is unable to meet its payment obligations or comply with covenants relating to securities held by us or by TPG, TPG may have an interest that conflicts with our interests or TPG may have information regarding the company that we do not have access to. If additional financing is necessary as a result of financial or other difficulties, it may not be in our best interests to provide such additional financing. If TPG were to lose investments as a result of such difficulties, the ability of our Manager to recommend actions in our best interests might be impaired.
37
Termination of our Management Agreement would be costly.
Termination of our Management Agreement without cause would be difficult and costly. Our independent directors will review our Manager’s performance and the fees that may be payable to our Manager annually and, following the initial term of three years, our Management Agreement may be terminated each year upon the affirmative vote of at least two-thirds of our independent directors, based upon their determination that (1) our Manager’s performance is unsatisfactory and materially detrimental to us and our subsidiaries taken as a whole or (2) the base management fee and incentive compensation, taken as a whole, payable to our Manager is not fair, subject to our Manager’s right to prevent any termination due to unfair fees by accepting a reduction of fees agreed to by at least two-thirds of our independent directors. We are required to provide our Manager with 180 days’ prior written notice of any such termination. Additionally, upon such a termination unrelated to a cause event, or if we materially breach our Management Agreement and our Manager terminates our Management Agreement, our Management Agreement provides that we will pay our Manager a termination fee equal to three times the sum of (x) the average annual base management fee and (y) the average annual incentive compensation earned by our Manager, in each case during the 24-month period immediately preceding the most recently completed calendar quarter prior to the date of termination or, if such termination occurs prior to July 25, 2019, the base management fees and the incentive compensation will be annualized for the period from July 25, 2017 to July 25, 2019 based on such fees actually received by our Manager during such period. These provisions increase the cost to us of terminating our Management Agreement and adversely affect our ability to terminate our Manager in the absence of a cause event.
Our Manager maintains a contractual as opposed to a fiduciary relationship with us. Our Manager’s liability is limited under our Management Agreement, and we have agreed to indemnify our Manager against certain liabilities.
Pursuant to our Management Agreement, our Manager assumes no responsibility to us other than to render the services called for thereunder in good faith and will not be responsible for any action of our board of directors in following or declining to follow its advice or recommendations, including as set forth in our investment guidelines. Our Manager maintains a contractual as opposed to a fiduciary relationship with us. Under the terms of our Management Agreement, our Manager and its affiliates, and their respective directors, officers, employees, members, partners and stockholders, will not be liable to us, any subsidiary of ours, our board of directors, our stockholders or any of our subsidiaries’ stockholders, members or partners for acts or omissions performed in accordance with and pursuant to our Management Agreement, except by reason of acts or omissions constituting bad faith, willful misconduct, gross negligence or reckless disregard of their duties under our Management Agreement. We have agreed to indemnify our Manager, its affiliates and the directors, officers, employees, members, partners and stockholders of our Manager and its affiliates from any and all expenses, losses, damages, liabilities, demands, charges and claims of any nature whatsoever (including reasonable attorneys’ fees) in respect of or arising from any acts or omissions of such party performed in good faith under our Management Agreement and not constituting bad faith, willful misconduct, gross negligence or reckless disregard of duties of such party under our Management Agreement. As a result, we could experience poor performance or losses for which our Manager would not be liable.
We do not own the TPG name, but we may use it as part of our corporate name pursuant to a trademark license agreement with an affiliate of TPG. Use of the name by other parties or the termination of our trademark license agreement may harm our business.
We have entered into a trademark license agreement (the “trademark license agreement”) with an affiliate of TPG (the “licensor”), pursuant to which it has granted us a fully paid-up, royalty-free, non-exclusive, non-transferable, non-sublicensable license to use the name “TPG RE Finance Trust, Inc.” and the ticker symbol “TRTX.” Under this agreement, we have a right to use this name for so long as our Manager (or another TPG affiliate that serves as our manager) remains an affiliate of the licensor under the trademark license agreement. The trademark license agreement may be terminated by either party as a result of certain breaches or upon 90 days’ prior written notice; provided that upon notification of such termination by us, the licensor may elect to effect termination of the trademark license agreement immediately at any time after 30 days from the date of such notification. The licensor will retain the right to continue using the “TPG” name. The trademark license agreement does not permit us to preclude the licensor from licensing or transferring the ownership of the “TPG” name to third parties, some of whom may compete with us. Consequently, we may be unable to prevent any damage to goodwill that may occur as a result of the activities of the licensor, TPG or others. Furthermore, in the event that the trademark license agreement is terminated, we will be required to, among other things, change our name and NYSE ticker symbol. Any of these events could disrupt our recognition in the market place, damage any goodwill we may have generated and otherwise have a material adverse effect on us.
38
Our investment strategy and guidelines, asset allocation and financing strategy may be changed without stockholder consent.
Our Manager is authorized to follow broad investment guidelines that have been approved by our board of directors. Those investment guidelines, as well as our target assets, investment strategy, financing strategy and hedging policies with respect to investments, originations, acquisitions, growth, operations, indebtedness, capitalization and distributions, may be changed at any time without notice to, or the consent of, our stockholders. This could result in an investment portfolio with a different risk profile. A change in our investment strategy may increase our exposure to interest rate risk, default risk and real estate market fluctuations. Furthermore, a change in our asset allocation could result in our making investments in asset categories different from those described in this Form 10-K. These changes could materially and adversely affect us.
We may not be able to operate our business successfully or implement our operating policies and investment strategy.
We cannot assure you that our past experience will be sufficient to enable us to operate our business successfully or implement our operating policies and investment strategy as described in this Form 10-K. Furthermore, we may not be able to generate sufficient operating cash flows to pay our operating expenses or service our indebtedness. Our operating cash flows will depend on many factors, including the performance of our existing portfolio, the availability of attractive investment opportunities for the origination and selective acquisition of additional assets, the level and volatility of interest rates, readily accessible short-term and long-term financing, conditions in the financial markets, the real estate market and the economy, and our ability to successfully operate our business and execute our investment strategy. We will face substantial competition in originating and acquiring attractive loans and other investments, which could adversely impact the returns from new loans and other investments.
TPG and our Manager may not be able to hire and retain qualified loan originators or grow and maintain our relationships with key loan brokers, and if they are unable to do so, we could be materially and adversely affected.
We depend on TPG and our Manager to generate borrower clients by, among other things, developing relationships with property owners, developers, mortgage brokers and investors and others, which we believe leads to repeat and referral business. Accordingly, TPG and our Manager must be able to attract, motivate and retain skilled loan originators. The market for loan originators is highly competitive and may lead to increased costs to hire and retain them. We cannot guarantee that TPG and our Manager will be able to attract or retain qualified loan originators. If TPG and our Manager cannot attract, motivate or retain a sufficient number of skilled loan originators, or even if they can motivate or retain them but at higher costs, we could be materially and adversely affected. We also depend on TPG and our Manager for a network of loan brokers, which we anticipate may generate a significant portion of our loan originations. While TPG and our Manager will strive to continue to cultivate long-standing relationships that generate repeat business for us, brokers are free to transact business with other lenders and have done so in the past and will do so in the future. Our competitors also have relationships with some of our brokers and actively compete with us in bidding on loans marketed by these brokers, which could impair our loan origination volume and reduce our returns. There can be no assurance that TPG and our Manager will be able to maintain or develop new relationships with additional brokers.
Maintenance of our exemptions from registration as an investment company under the Investment Company Act imposes significant limits on our operations. Your investment return may be reduced if we are required to register as an investment company under the Investment Company Act.
We conduct, and intend to continue to conduct, our operations so that we are not required to register as an “investment company” as defined in Section 3(a)(1)(A) or Section 3(a)(1)(C) of the Investment Company Act. We believe we are not an investment company under Section 3(a)(1)(A) of the Investment Company Act because we do not engage primarily, or hold ourselves out as being engaged primarily, in the business of investing, reinvesting or trading in securities. Rather, through our wholly-owned or majority-owned subsidiaries, we are primarily engaged in non-investment company businesses related to real estate. In addition, we intend to conduct our operations so that we do not come within the definition of an investment company under Section 3(a)(1)(C) of the Investment Company Act because less than 40% of the value of our total assets (exclusive of U.S. government securities and cash items) on an unconsolidated basis will consist of “investment securities” (the “40% test”). Excluded from the
39
term “investment securities” (as that term is defined in the Investment Company Act) are securities issued by majority-owned subsidiaries that are themselves not investment companies and are not relying on the exclusions from the definition of investment company set forth in Section 3(c)(1) or Section 3(c)(7) of the Investment Company Act. Our interests in wholly-owned or majority-owned subsidiaries that qualify for the exclusion pursuant to Section 3(c)(5)(C), as described below, Rule 3a-7, as described below, or another exclusion or exception under the Investment Company Act (other than Section 3(c)(1) or Section 3(c)(7) thereof), do not constitute “investment securities.”
To maintain our status as a non-investment company, the securities issued to us by any wholly-owned or majority-owned subsidiaries that we may form in the future that are excluded from the definition of investment company under Section 3(c)(1) or Section 3(c)(7) of the Investment Company Act, together with any other investment securities we may own, may not have a value in excess of 40% of the value of our total assets on an unconsolidated basis. We will monitor our holdings to ensure ongoing compliance with this test, but there can be no assurance that we will be able to maintain an exclusion or exemption from registration. The 40% test limits the types of businesses in which we may engage through our subsidiaries. In addition, the assets we and our subsidiaries may originate or acquire are limited by the provisions of the Investment Company Act and the rules and regulations promulgated under the Investment Company Act, which may materially and adversely affect us.
We hold our assets primarily through direct or indirect wholly-owned or majority-owned subsidiaries, certain of which are excluded from the definition of investment company pursuant to Section 3(c)(5)(C) of the Investment Company Act. We will classify our assets for purposes of certain of our subsidiaries’ Section 3(c)(5)(C) exemption from the Investment Company Act based upon positions set forth by the SEC staff. Based on such positions, to qualify for the exclusion pursuant to Section 3(c)(5)(C), each such subsidiary generally is required to hold at least (i) 55% of its assets in “qualifying” real estate assets, which we refer to as “Qualifying Interests,” and (ii) at least 80% of its assets in Qualifying Interests and real estate-related assets. Qualifying Interests for this purpose include senior mortgage loans, certain B-Notes and certain mezzanine loans that satisfy various conditions as set forth in SEC staff no-action letters and other guidance, and other assets that the SEC staff in various no-action letters and other guidance has determined are Qualifying Interests for the purposes of the Investment Company Act. We treat as real estate-related assets B-Notes, CMBS and mezzanine loans that do not satisfy the conditions set forth in the relevant SEC staff no-action letters and other guidance, and debt and equity securities of companies primarily engaged in real estate businesses. The SEC has not published guidance with respect to the treatment of the pari passu participation interests in senior mortgage loans held by certain of our subsidiaries for purposes of the Section 3(c)(5)(C) exclusion. Unless the SEC or its staff issues guidance applicable to the participation interests, we intend to treat such participation interests as real estate-related assets. Because of the composition of the assets of our subsidiaries that own such participation interests, we currently treat such subsidiaries as excluded from the definition of investment company under Section 3(c)(1) or Section 3(c)(7) of the Investment Company Act, and treat the securities issued by them to us as “investment securities” for purposes of the 40% test.
Certain of our subsidiaries rely on Rule 3a-7 under the Investment Company Act. We refer to these subsidiaries as our “CLO subsidiaries.” Rule 3a-7 under the Investment Company Act is available to certain structured financing vehicles that are engaged in the business of holding financial assets that, by their terms, convert into cash within a finite time period and that issue fixed income securities entitling holders to receive payments that depend primarily on the cash flows from these assets, provided that, among other things, the structured finance vehicle does not engage in certain portfolio management practices resembling those employed by management investment companies (e.g., mutual funds). Accordingly, each of these CLO subsidiaries is subject to an indenture (or similar transaction documents) that contains specific guidelines and restrictions limiting the discretion of the CLO subsidiary and its collateral manager, if applicable. In particular, these guidelines and restrictions prohibit the CLO subsidiary from acquiring and disposing of assets primarily for the purpose of recognizing gains or decreasing losses resulting from market value changes. Thus, a CLO subsidiary cannot acquire or dispose of assets primarily to enhance returns to the owner of the equity in the CLO subsidiary; however, subject to this limitation, sales and purchases of assets may be made so long as doing so does not violate guidelines contained in the CLO subsidiary’s relevant transaction documents. A CLO subsidiary generally can, for example, sell an asset if the collateral manager believes that its credit characteristic qualifies it as an impaired asset, subject to fulfilling the requirements set forth in Rule 3a-7 under the Investment Company Act and the CLO subsidiary’s relevant transaction documents. As a result of these restrictions, our CLO subsidiaries may suffer losses on their assets and we may suffer losses on our investments in those CLO subsidiaries.
SEC no-action positions are based on specific factual situations that differ in some regards from the factual situations we and our subsidiaries may face, and as a result, we may have to apply SEC staff guidance that relates to
40
other factual situations by analogy. A number of these no-action positions were issued more than twenty years ago. There may be no guidance from the SEC staff that applies directly to our factual situations, and the SEC may disagree with our conclusion that the published guidance applies in the manner we have concluded. No assurance can be given that the SEC or its staff will concur with our classification of our assets. In addition, the SEC or its staff may, in the future, issue further guidance that may require us to re-classify our assets for purposes of the Investment Company Act, including for purposes of our subsidiaries’ compliance with the exclusions provided in Section 3(c)(5)(C) or Rule 3a-7 of the Investment Company Act. There is no guarantee that we will be able to adjust our assets in the manner required to maintain our exclusion or exemption from the Investment Company Act and any adjustment in our strategy or assets could have a material adverse effect on us.
To the extent that the SEC or its staff provides more specific guidance regarding any of the matters bearing upon the definition of investment company and the exemptions to that definition, we may be required to adjust our strategy accordingly. On August 31, 2011, the SEC issued a concept release and request for comments regarding the Section 3(c)(5)(C) exclusion (Release No. IC-29778) in which it contemplated the possibility of issuing new rules or providing new interpretations of the exemption that might, among other things, define the phrase “liens on and other interests in real estate” or consider sources of income in determining a company’s “primary business.” Any additional guidance from the SEC or its staff could further inhibit our ability to pursue the strategies we have chosen.
Because registration as an investment company would significantly affect our (or our subsidiaries’) ability to engage in certain transactions or be structured in the manner we currently are, we intend to conduct our business so that we and our wholly-owned subsidiaries and majority-owned subsidiaries will continue to satisfy the requirements to avoid regulation as an investment company. However, there can be no assurance that we or our subsidiaries will be able to satisfy these requirements and maintain our and their exclusion or exemption from such registration. If we or our wholly-owned subsidiaries or our majority-owned subsidiaries do not meet these requirements, we could be forced to alter our investment portfolio by selling or otherwise disposing of a substantial portion of the assets that do not satisfy the applicable requirements or by acquiring a significant position in assets that are Qualifying Interests. Such investments may not represent an optimum use of capital when compared to the available investments we and our subsidiaries target pursuant to our investment strategy. These investments may present additional risks to us, and these risks may be compounded by our inexperience with such investments. Altering our investment portfolio in this manner may materially and adverse affect us if we are forced to dispose of or acquire assets in an unfavorable market.
There can be no assurance that we and our subsidiaries will be able to successfully avoid operating as an unregistered investment company. If it were established that we were an unregistered investment company, there would be a risk that we would be subject to monetary penalties and injunctive relief in an action brought by the SEC, that we would be unable to enforce contracts with third parties, that third parties could seek to obtain rescission of transactions undertaken during the period for which it was established that we were an unregistered investment company, and that we would be subject to limitations on corporate leverage that would have an adverse impact on our investment returns.
If we were required to register as an investment company under the Investment Company Act, we would become subject to substantial regulation with respect to our capital structure (including our ability to use borrowings), management, operations, transactions with affiliated persons (as defined in the Investment Company Act) and portfolio composition, including disclosure requirements and restrictions with respect to diversification and industry concentration and other matters. Compliance with the Investment Company Act would, accordingly, limit our ability to make certain investments and require us to significantly restructure our business plan, which could materially and adversely affect our ability to pay distributions to our stockholders. Because affiliate transactions generally are prohibited under the Investment Company Act, we would not be able to enter into transactions with any of our affiliates if we fail to maintain our exclusion or exemption, and our Manager may terminate our Management Agreement if we become required to register as an investment company, with such termination deemed to occur immediately before such event. If our Management Agreement is terminated, it could constitute an event of default under our financing arrangements and financial institutions may then have the right to accelerate their outstanding loans to us and terminate their arrangements and their obligation to advance funds to us in the future. In addition, we may not be able to secure a replacement manager on favorable terms, if at all. Thus, compliance with the requirements of the Investment Company Act imposes significant limits on our operations, and our failure to comply with those requirements would likely have a material adverse effect on us.
41
Rapid changes in the market value or income potential of our assets may make it more difficult for us to maintain our qualification as a REIT or our exclusion or exemption from regulation under the Investment Company Act.
If the market value or income potential of our assets declines, we may need to acquire additional assets and/or liquidate certain types of assets in order to maintain our REIT qualification or our exclusion or exemption from the Investment Company Act. If the decline in the market value and/or income of our assets occurs quickly, this may be especially difficult to accomplish. This difficulty may be exacerbated by the illiquid nature of the assets that we may own. We may have to make investment decisions that we otherwise would not make absent the REIT qualification and Investment Company Act considerations, which could materially and adversely affect us.
The due diligence process undertaken by our Manager in regard to our investment opportunities may not reveal all facts relevant to an investment and, as a result, we may experience losses, which could materially and adversely affect us.
Before originating a loan to a borrower or making other investments for us, our Manager conducts due diligence that it deems reasonable and appropriate based on the facts and circumstances relevant to each potential investment. When conducting due diligence, our Manager may be required to evaluate important and complex business, financial, tax, accounting, environmental and legal issues. Outside consultants, legal advisors, accountants and investment banks may be involved in the due diligence process in varying degrees depending on the type of potential investment. Relying on the resources available to it, our Manager evaluates our potential investments based on criteria it deems appropriate for the relevant investment. Our Manager’s estimates may not prove accurate, as actual results may vary from estimates. If our Manager underestimates the asset-level losses relative to the price we pay for a particular investment, we may experience losses with respect to such investment. Additionally, during the mortgage loan underwriting process, appraisals will generally be obtained by our Manager on the collateral underlying each prospective mortgage. Inaccurate or inflated appraisals may result in an increase in the severity of losses on the mortgage loans. Any such losses could materially and adversely affect us.
Failure to obtain, maintain or renew required licenses and authorizations necessary to operate our mortgage-related activities may materially and adversely affect us.
We and our Manager are required to obtain, maintain or renew certain licenses and authorizations (including “doing business” authorizations and licenses to act as a commercial mortgage lender) from U.S. federal or state governmental authorities, government sponsored entities or similar bodies in connection with some or all of our mortgage-related activities. There is no assurance that we or our Manager will be able to obtain, maintain or renew any or all of the licenses and authorizations that we require or that we or our Manager will avoid experiencing significant delays in connection therewith. The failure of our company or our Manager to obtain, maintain or renew licenses will restrict our options and ability to engage in desired activities, and could subject us to fines, suspensions, terminations and various other adverse actions if it is determined that we or our Manager have engaged without the requisite licenses or authorizations in activities that required a license or authorization, which could have a material adverse effect on us.
Changes in laws or regulations governing our operations, changes in the interpretation thereof or newly enacted laws or regulations and any failure by us to comply with these laws or regulations could materially and adversely affect us.
The laws and regulations governing our operations, as well as their interpretation, may change from time to time, and new laws and regulations may be enacted. Accordingly, any change in these laws or regulations, changes in their interpretation or newly enacted laws or regulations and any failure by us to comply with these laws or regulations could require changes to certain of our business practices or impose additional costs on us, which could materially and adversely affect us. Furthermore, if regulatory capital requirements, whether under the Dodd-Frank Wall Street Reform and Consumer Protection Act (the “Dodd-Frank Act”), Basel III or other regulatory action, are imposed on private lenders that provide us with funds, or were to be imposed on us, they or we may be required to limit, or increase the cost of, financing they provide to us or that we provide to others. Among other things, this could potentially increase our financing costs, reduce our ability to originate or acquire loans and other investments and reduce our liquidity or require us to sell assets at an inopportune time or price.
In addition, various laws and regulations currently exist that restrict the investment activities of banks and certain other financial institutions but do not apply to us, which we believe creates opportunities for us to originate loans and participate in certain other investments that are not available to these more regulated institutions.
42
However, following the U.S. Presidential election in November 2016, there are several indications that the new administration will seek to deregulate the financial industry, including by altering the Dodd-Frank Act, which may decrease the restrictions on banks and other financial institutions and allow them to compete with us for investment opportunities that were previously not available to, or otherwise pursued by, them. See “—Risks Related to Our Lending and Investment Activities—We operate in a competitive market for the origination and acquisition of attractive investment opportunities and competition may limit our ability to originate or acquire attractive investments in our target assets, which could have a material adverse effect on us.”
Over the last several years, there also has been an increase in regulatory attention to the extension of credit outside the traditional banking sector, raising the possibility that some portion of the non-bank financial sector will be subject to new regulation. While it cannot be known at this time whether any regulation will be implemented or what form it will take, increased regulation of non-bank credit extension could materially and adversely affect us, impose additional costs on us, intensify the regulatory supervision of us or otherwise materially and adversely affect us.
In addition, the Iran Threat Reduction and Syria Human Rights Act of 2012 (the “ITRA”) expands the scope of U.S. sanctions against Iran and Syria. In particular, Section 219 of the ITRA amended the Exchange Act to require companies subject to SEC reporting obligations under Section 13 of the Exchange Act to disclose in their periodic reports specified dealings or transactions involving Iran or other individuals and entities targeted by certain sanctions promulgated by the Office of Foreign Assets Control of the U.S. Treasury Department engaged in by the reporting company or any of its affiliates during the period covered by the relevant periodic report. These companies are required to separately file with the SEC a notice that such activities have been disclosed in the relevant periodic reports, and the SEC is required to post this notice of disclosure on its website and send the report to the U.S. President and certain U.S. Congressional committees. The U.S. President thereafter is required to initiate an investigation and, within 180 days of initiating such an investigation with respect to certain disclosed activities, to determine whether sanctions should be imposed. Disclosure of such activity, even if such activity is not subject to sanctions under applicable law, and any sanctions actually imposed on us or our affiliates as a result of these activities, could harm our reputation and have a negative impact on our business.
Actions of the U.S. government, including the U.S. Congress, Federal Reserve Board, U.S. Treasury Department and other governmental and regulatory bodies, to stabilize or reform the financial markets, or market response to those actions, may not achieve the intended effect and could materially and adversely affect us.
In July 2010, the Dodd-Frank Act was signed into law, which imposes significant investment restrictions and capital requirements on banking entities and other organizations that are significant to U.S. financial stability. For instance, the so-called “Volcker Rule” provisions of the Dodd-Frank Act impose significant restrictions on the proprietary trading activities of banking entities (and certain affiliates thereof) and on their ability to sponsor or invest in private equity and hedge funds. It also subjects nonbank financial companies that have been designated as “systemically important” by the Financial Stability Oversight Council to increased capital requirements and quantitative limits for engaging in such activities, as well as consolidated supervision by the Federal Reserve Board. The Dodd-Frank Act also seeks to reform the asset-backed securitization market (including the mortgage-backed securities market) by requiring the retention of a portion of the credit risk inherent in the pool of securitized assets and by imposing additional registration and disclosure requirements. In October 2014, five U.S. federal banking and housing agencies and the SEC issued final credit risk retention rules, which generally require sponsors of asset-backed securities to retain at least 5% of the credit risk relating to the assets that underlie such asset-backed securities. These rules, which have become generally effective with respect to new securitization transactions backed by mortgage loans, could restrict credit availability and could negatively affect the terms and availability of credit to fund our investments. While the full impact of the Dodd-Frank Act cannot be fully assessed, the Dodd-Frank Act’s extensive requirements may have a significant effect on the financial markets and may affect the availability or terms of financing from our lender counterparties and the availability or terms of mortgage-backed securities, which may, in turn, have a material adverse effect on us.
On December 16, 2015, the CFTC published a final rule governing margin requirements for uncleared swaps entered into by registered swap dealers and major swap participants who are not supervised by the Federal Reserve Board, the Office of the Comptroller of the Currency, the Federal Deposit Insurance Corporation, the Farm Credit Administration and the Federal Housing Finance Agency (collectively, the “Prudential Regulators”), referred to as “covered swap entities”. The final rule generally requires covered swap entities, subject to certain thresholds and exemptions, to collect and post margin in respect of uncleared swap transactions with other covered swap entities and financial end-users. In particular, the final rule requires covered swap entities and financial end-users having
43
“material swaps exposure,” defined as an average aggregate daily notional amount of uncleared swaps exceeding a certain specified amount, to collect and/or post (as applicable) a minimum amount of “initial margin” in respect of each uncleared swap; the specified amounts for material swaps exposure differ subject to a phase-in schedule until September 1, 2020, when the average aggregate daily notional amount will thenceforth be $8 billion as calculated from June, July and August of the previous calendar year. In addition, the final rule requires covered swap entities entering into uncleared swaps with other covered swap entities or financial-end users, regardless of swaps exposure, to post and/or collect (as applicable) “variation margin” in reflection of changes in the mark-to-market value of an uncleared swap since the swap was executed or the last time such margin was exchanged. The CFTC final rule is broadly consistent with a similar rule requiring the exchange of initial and variation margin adopted by the Prudential Regulators in October 2015, which apply to registered swap dealers, major swap participants, security-based swap dealers and major security-based swap participants that are supervised by one or more of the Prudential Regulators. These newly adopted rules on margin requirements for uncleared swaps could adversely affect our business, including our ability to enter such swaps or our available liquidity.
The current regulatory environment may be impacted by future legislative developments, such as amendments to key provisions of the Dodd-Frank Act, including provisions setting forth capital and risk retention requirements. On February 3, 2017, President Trump signed an executive order calling for the administration to review U.S. financial laws and regulations in order to determine their consistency with a set of core principles identified in the order. The full scope of President Trump’s short-term legislative agenda is not yet fully known, but it may include certain deregulatory measures for the U.S. financial services industry, including changes to the Financial Stability Oversight Council, the Volcker Rule and credit risk retention requirements, among other areas. In particular, on June 8, 2017, one pending bill, called the Financial CHOICE Act (the “CHOICE Act”), was passed by the U.S. House of Representatives. If passed by the U.S. Senate and signed into law by President Trump, the CHOICE Act would, among other things, remove risk retention requirements for non-residential mortgage securitizations. In addition, on February 9, 2018, the U.S. Court of Appeals for the District of Columbia Circuit ruled that CLO managers need not comply with the credit risk retention rules discussed above. No assurances can be given as to the passage of any pending legislation or the ultimate resolution of any pending litigation or the impact that these actions could have on our results of operations or financial condition.
The obligations associated with being a public company require significant resources and attention from our Manager’s senior leadership team.
As a public company with listed equity securities, we are obligated to comply with certain laws, regulations and requirements, including the requirements of the Exchange Act, certain corporate governance provisions of the Sarbanes-Oxley Act of 2002 (the “Sarbanes-Oxley Act”), related regulations of the SEC and requirements of the NYSE, with which we were not required to comply as a private company. The Exchange Act requires that we file annual, quarterly and current reports with respect to our business, financial condition, cash flows and results of operations. The Sarbanes-Oxley Act requires, among other things, that we establish and maintain effective internal controls and procedures for financial reporting and that our management and independent registered public accounting firm report annually on the effectiveness of our internal control over financial reporting, beginning with the filing of our annual report on Form 10-K for the year ending December 31, 2018.
These reporting and other obligations place significant demands on our Manager’s senior leadership team, administrative, operational and accounting resources and cause us to incur significant expenses. We may need to upgrade our systems or create new systems, implement additional financial and other controls, reporting systems and procedures, and create or outsource an internal audit function. If we are unable to accomplish these objectives in a timely and effective fashion, our ability to comply with the financial reporting requirements and other rules that apply to reporting companies could be impaired.
If we fail to implement and maintain an effective system of internal control, we may be unable to accurately determine our financial results or prevent fraud. As a result, our stockholders could lose confidence in our financial results, which could materially and adversely affect us.
Effective internal controls are necessary for us to provide reliable financial reports and effectively prevent fraud. We may in the future discover areas of our internal controls that need improvement. We cannot be certain that we will be successful in maintaining an effective system of internal control over our financial reporting and financial processes. Furthermore, as we grow our business, our internal controls will become more complex, and we will require significantly more resources to ensure our internal controls remain effective. Additionally, the existence of any material weakness or significant deficiency would require our Manager to devote significant time and us to
44
incur significant expense to remediate any such material weaknesses or significant deficiencies and our Manager may not be able to remediate any such material weaknesses or significant deficiencies in a timely manner. The existence of any material weakness in our internal control over financial reporting could also result in errors in our financial statements that could require us to restate our financial statements, cause us to fail to meet our reporting obligations and cause stockholders to lose confidence in our financial results, which could materially and adversely affect us.
Operational risks may disrupt our businesses, result in losses or limit our growth.
We rely heavily on our and TPG’s financial, accounting, communications and other data processing systems. Such systems may fail to operate properly or become disabled as a result of tampering or a breach of the network security systems or otherwise. In addition, such systems are from time to time subject to cyberattacks, which may continue to increase in sophistication and frequency in the future. Breaches of our network security systems could involve attacks that are intended to obtain unauthorized access to our proprietary information, destroy data or disable, degrade or sabotage our systems, often through the introduction of computer viruses and other malicious code, cyberattacks and other means and could originate from a wide variety of sources, including unknown third parties outside the firm. Although TPG takes various measures to ensure the integrity of such systems, there can be no assurance that these measures will provide protection. If such systems are compromised, do not operate properly or are disabled, we could suffer financial loss, a disruption of our businesses, liability to investors, regulatory intervention or reputational damage.
In addition, we are highly dependent on information systems and technology. Our information systems and technology may not continue to be able to accommodate our growth, and the cost of maintaining such systems may increase from its current level. Such a failure to accommodate growth, or an increase in costs related to such information systems, could have a material adverse effect on us.
Furthermore, most of the personnel of TPG provided to our Manager are located in TPG’s New York City office, and we depend on continued access to this office for the continued operation of our business. A disaster or a disruption in the infrastructure that supports our business, including a disruption involving electronic communications or other services used by us or third parties with whom we conduct business, or directly affecting our headquarters, could have a material adverse impact on our ability to continue to operate our business without interruption. TPG’s disaster recovery program may not be sufficient to mitigate the harm that may result from such a disaster or disruption. In addition, insurance and other safeguards might only partially reimburse us for our losses, if at all.
Finally, we rely on third-party service providers for certain aspects of our business, including for certain information systems, technology and administration. Any interruption or deterioration in the performance of these third parties or failures of their information systems and technology could impair the quality of our operations and could affect our reputation and hence materially and adversely affect us.
We depend on Situs Asset Management, LLC (“Situs”) for asset management services. We may not find a suitable replacement for Situs if our agreement with Situs is terminated, or if key personnel cease to be employed by Situs or otherwise become unavailable to us.
We are party to an agreement with Situs pursuant to which Situs provides us with dedicated asset management employees for performing asset management services pursuant to our proprietary guidelines. Our ability to monitor the performance of our investments will depend to a significant extent upon the efforts, experience, diligence and skill of Situs and its employees.
In addition, we can offer no assurance that Situs will continue to be able to provide us with dedicated asset management employees for performing asset management services for us. Any interruption or deterioration in the performance of Situs or failures of Situs’s information systems and technology could impair the quality of our operations and could affect our reputation and hence materially and adversely affect us. If our agreement with Situs is terminated and no suitable replacement is found to manage our portfolio, we may not be able to monitor the performance of our investments. Furthermore, we may incur certain costs in connection with a termination of our agreement with Situs.
45
Accounting rules for certain of our transactions are highly complex and involve significant judgment and assumptions. Changes in accounting interpretations or assumptions could impact our ability to timely prepare consolidated historical financial statements, which could materially and adversely affect us.
Accounting rules for transfers of financial assets, consolidation of variable interest entities, loan loss reserves, valuation of assets and liabilities, and other aspects of our operations are highly complex and involve significant judgment and assumptions. These complexities could lead to a delay in preparation of financial information and the delivery of this information to our stockholders. Changes in accounting interpretations or assumptions could impact our consolidated historical financial statements and our ability to timely prepare our consolidated historical financial statements. Our inability to timely prepare our consolidated historical financial statements in the future could materially and adversely affect us.
Risks Related to our REIT Status and Certain Other Tax Items
If we fail to remain qualified as a REIT, we will be subject to tax as a regular corporation and could face a substantial tax liability, which would reduce the amount of cash available for distribution to our stockholders.
We currently intend to operate in a manner that will allow us to continue to qualify as a REIT for U.S. federal income tax purposes. We have not requested nor obtained a ruling from the IRS as to our REIT qualification. Our continued qualification as a REIT depends on our satisfaction of certain asset, income, organizational, distribution, stockholder ownership and other requirements on a continuing basis. Our ability to satisfy the asset tests depends upon our analysis of the characterization and fair values of our investments, some of which are not susceptible to a precise determination, and for which we will not obtain independent appraisals. Our compliance with the REIT income and quarterly asset requirements also depends upon our ability to successfully manage the composition of our income and assets on an ongoing basis. Moreover, the proper classification of an instrument as debt or equity for U.S. federal income tax purposes may be uncertain in some circumstances, which could affect the application of the REIT qualification requirements. Accordingly, there can be no assurance that the IRS will not contend that our interests in subsidiaries or in securities of other issuers will not cause a violation of the REIT requirements.
If we were to fail to qualify as a REIT in any taxable year, we would be subject to U.S. federal income tax and applicable state and local taxes on our taxable income at regular corporate rates, and distributions made to our stockholders would not be deductible by us in computing our taxable income. Any resulting corporate tax liability could be substantial and would reduce the amount of cash available for distribution to our stockholders, which in turn could materially and adversely affect us and the value of our common stock. Unless we were entitled to relief under certain Internal Revenue Code provisions, we also would be disqualified from taxation as a REIT for the four taxable years following the year in which we failed to qualify as a REIT.
Dividends payable by REITs do not qualify for the reduced tax rates available for some dividends.
The maximum tax rate applicable to income from “qualified dividends” payable to domestic stockholders that are taxed at individual rates is currently 20%, plus the 3.8% surtax on net investment income, if applicable. Dividends payable by REITs, however, are generally not eligible for the reduced rates on qualified individual income. Rather, under the recently-enacted Tax Cuts and Jobs Act (the “TCJA”), REIT dividends constitute “qualified business income” and thus a 20% deduction is available to individual taxpayers with respect to such dividends, resulting in a 29.6% maximum federal tax rate (plus the 3.8% surtax on net investment income, if applicable) for individual U.S. stockholders. Additionally, without further legislative action, the 20% deduction applicable to REIT dividends will expire on January 1, 2026. The more favorable rates applicable to regular corporate qualified dividends could cause investors who are taxed at individual rates to perceive investments in REITs to be relatively less attractive than investments in the stocks of non-REIT corporations that pay dividends, which could adversely affect the value of the shares of REITs, including our common stock. The preferential rates applicable to regular corporate qualified dividends could cause investors to perceive investments in REITs to be relatively less attractive than investments in the stocks of non-REIT corporations that pay dividends, which could adversely affect the value of the stock of REITs, including our common stock.
Compliance with the REIT requirements may hinder our ability to grow, which could materially and adversely affect us.
We generally must distribute annually at least 90% of our REIT taxable income, subject to certain adjustments and excluding any net capital gain, in order for U.S. federal corporate income tax not to apply to earnings that we distribute. To the extent that we satisfy this distribution requirement, but distribute less than 100% of our REIT taxable income, we will be subject to U.S. federal corporate income tax on our undistributed taxable income. In
46
addition, we will be subject to a 4% nondeductible excise tax if the actual amount that we pay out to our stockholders in a calendar year is less than a minimum amount specified under U.S. federal tax laws. We intend to continue to make distributions to our stockholders to comply with the REIT requirements of the Internal Revenue Code.
From time to time, we may generate taxable income greater than our income for financial reporting purposes prepared in accordance with GAAP, or differences in timing between the recognition of taxable income and the actual receipt of cash may occur. For example, we may be required to accrue income from mortgage loans, CMBS and other types of debt investments or interests in debt investments before we receive any payments of interest or principal on such assets. We may also acquire distressed debt investments that are subsequently modified by agreement with the borrower. If the amendments to the outstanding debt are “significant modifications” under the applicable U.S. Treasury Regulations, the modified debt may be considered to have been reissued to us at a gain in a debt-for-debt exchange with the borrower, with gain recognized by us to the extent that the principal amount of the modified debt exceeds our cost of purchasing it prior to modification. Moreover, under the TCJA, we generally will be required to take certain amounts into income no later than the time such amounts are reflected on certain financial statements. The application of this rule may require the accrual of income with respect to our debt instruments, such as original issue discount or market discount, earlier than would be the case under the general tax rules, although the precise application of this rule is unclear at this time. This rule generally will be effective for tax years beginning after December 31, 2017 or, for debt instruments issued with original issue discount, for tax years beginning after December 31, 2018. To the extent that this rule requires the accrual of income earlier than under the general tax rules, it could increase our “phantom income.”
We may also be required under the terms of indebtedness that we incur to use cash received from interest payments to make principal payments on that indebtedness, with the effect of recognizing income but not having a corresponding amount of cash available for distribution to our stockholders.
As a result, we may find it difficult or impossible to meet distribution requirements from our ordinary operations in certain circumstances. In particular, where we experience differences in timing between the recognition of taxable income and the actual receipt of cash, the requirement to distribute a substantial portion of our taxable income could cause us to do any of the following in order to comply with the REIT requirements: (i) sell assets in adverse market conditions, (ii) raise funds on unfavorable terms, (iii) distribute amounts that would otherwise be invested in future acquisitions, capital expenditures or repayment of debt or (iv) make a taxable distribution of shares of our common stock, as part of a distribution in which stockholders may elect to receive shares (subject to a limit measured as a percentage of the total distribution). These alternatives could increase our costs or reduce our equity. Thus, compliance with the REIT requirements may hinder our ability to grow, which could materially and adversely affect us.
We may choose to make distributions to our stockholders in our own common stock, in which case our stockholders could be required to pay income taxes in excess of the cash dividends they receive.
We may in the future distribute taxable dividends that are payable in cash and shares of our common stock at the election of each stockholder. Taxable stockholders receiving such distributions will be required to include the full amount of the distribution as ordinary income to the extent of our current and accumulated earnings and profits for U.S. federal income tax purposes. As a result, stockholders may be required to pay income taxes with respect to such dividends in excess of the cash dividends received. If a U.S. stockholder sells the stock that it receives as a dividend in order to pay this tax, the sale proceeds may be less than the amount included in income with respect to the dividend, depending on the market price of our common stock at the time of the sale. Furthermore, with respect to certain non-U.S. stockholders, we or the applicable withholding agent may be required to withhold U.S. tax with respect to such dividends, including in respect of all or a portion of such dividend that is payable in common stock. In addition, if a significant number of our stockholders determine to sell shares of our common stock in order to pay taxes owed on dividends, it may put downward pressure on the trading price of our common stock.
On August 11, 2017, the IRS issued Revenue Procedure 2017-45 authorizing elective cash/stock dividends to be made by publicly offered REITs (e.g., REITs that are required to file annual and periodic reports with the SEC under the Exchange Act). Pursuant to Revenue Procedure 2017-45, effective for distributions declared on or after August 11, 2017, the IRS will treat the distribution of stock pursuant to an elective cash/stock dividend as a distribution of property under Section 301 of the Internal Revenue Code (e.g., a dividend), as long as at least 20% of the total dividend is available in cash and certain other parameters detailed in the Revenue Procedure are satisfied. Although we have no current intention of paying dividends in our own common stock, if in the future we choose to
47
pay dividends in our own common stock, our stockholders may be required to pay tax in excess of the cash that they receive.
Even if we remain qualified as a REIT, we may face other tax liabilities that reduce our cash flow, which could materially and adversely affect us.
Even if we remain qualified for taxation as a REIT, we may be subject to certain U.S. federal, state and local taxes on our income and assets, including taxes on any undistributed income, tax on income from some activities conducted as a result of a foreclosure, and state or local income, property and transfer taxes, such as mortgage recording taxes. In addition, in order to continue to meet the REIT qualification requirements, prevent the recognition of certain types of non-cash income or to avert the imposition of a 100% tax that applies to certain gains derived by a REIT from dealer property or inventory, we may hold a significant amount of our investments through TRSs or other subsidiary corporations that will be subject to corporate-level income tax at regular rates. In addition, it a TRS borrows funds either from us or a third party, it may be unable to deduct all or a portion of the interest paid, resulting in a higher corporate-level tax liability. Specifically, recently enacted tax reform legislation imposes a disallowance of deductions for business interest expense (even if paid to third parties) in excess of the sum of a taxpayer’s business interest income and 30% of the adjusted taxable income of the business, which is its taxable income computed without regard to business interest income or expense, net operating losses or the pass-through income deduction (and for taxable years before 2022, excludes depreciation and amortization). The TRS rules also impose a 100% excise tax on certain transactions between a TRS and its parent REIT that are not conducted on an arm’s-length basis. Any of these taxes would reduce our cash flow, which could materially and adversely affect us.
Complying with REIT requirements may cause us to forego otherwise attractive investment opportunities.
To continue to qualify as a REIT for U.S. federal income tax purposes, we must satisfy ongoing tests concerning, among other things, the sources of our income, the nature and diversification of our assets, the amounts that we distribute to our stockholders and the ownership of our stock. We may be required to make distributions to stockholders at disadvantageous times or when we do not have funds readily available for distribution, and may be unable to pursue investments that would be otherwise advantageous to us in order to satisfy the source-of-income or asset-diversification requirements for qualifying as a REIT. In addition, in certain cases, the modification of a debt instrument could result in the conversion of the instrument from a qualifying real estate asset to a wholly or partially non-qualifying asset that must be contributed to a TRS or disposed of in order for us to maintain our REIT status. Compliance with the source-of-income requirements may also limit our ability to acquire debt instruments at a discount from their face amount. Thus, compliance with the REIT requirements may cause us to forego or, in certain cases, to maintain ownership of, otherwise attractive investment opportunities.
Complying with REIT requirements may force us to liquidate or restructure otherwise attractive investments.
To continue to qualify as a REIT, we must ensure that at the end of each calendar quarter, at least 75% of the value of our assets consists of cash, cash items, government securities and qualified REIT real estate assets, including certain mortgage loans and certain kinds of CMBS. The remainder of our investments in securities (other than government securities and qualified real estate assets) generally cannot include more than 10% of the outstanding voting securities of any one issuer or more than 10% of the total value of the outstanding securities of any one issuer. In addition, in general, no more than 5% of the value of our assets (other than government securities and qualified real estate assets) can consist of the securities of any one issuer, and no more than 20% (25% for 2017 and prior years) of the value of our total securities can be represented by securities of one or more TRSs. If we fail to comply with these requirements at the end of any calendar quarter, we must correct the failure within 30 days after the end of the calendar quarter or qualify for certain statutory relief provisions to avoid losing our REIT qualification and suffering adverse tax consequences. As a result, we may be required to liquidate or restructure otherwise attractive investments. These actions could have the effect of reducing our income and amounts available for distribution to our stockholders.
We may be required to report taxable income from certain investments in excess of the economic income we ultimately realize from them.
We may acquire debt instruments in the secondary market for less than their face amount. The discount at which such debt instruments are acquired may reflect doubts about their ultimate collectability rather than current market interest rates. The amount of such discount will nevertheless generally be treated as “market discount” for U.S. federal income tax purposes. Accrued market discount is generally reported as income when, and to the extent that, any payment of principal of the debt instrument is made. Payments on commercial mortgage loans are
48
ordinarily made monthly, and consequently accrued market discount may have to be included in income each month as if the debt instrument were assured of ultimately being collected in full. If we collect less on the debt instrument than our purchase price plus the market discount we had previously reported as income, we may not be able to benefit from any offsetting loss deductions. In addition, we may acquire distressed debt investments that are subsequently modified by agreement with the borrower. If the amendments to the outstanding debt are “significant modifications” under applicable U.S. Treasury Regulations, the modified debt may be considered to have been reissued to us at a gain in a debt-for-debt exchange with the borrower. In that event, we may be required to recognize taxable gain to the extent the principal amount of the modified debt exceeds our adjusted tax basis in the unmodified debt, even if the value of the debt or the payment expectations have not changed.
Moreover, some of the CMBS that we acquire may have been issued with original issue discount. We will be required to report such original issue discount based on a constant yield method and will be taxed based on the assumption that all future projected payments due on such CMBS will be made. If such CMBS turns out not to be fully collectible, an offsetting loss deduction will become available only in the later year that uncollectibility is provable.
Additionally, under the TCJA, we generally will be required to take certain amounts in income no later than the time such amounts are reflected on certain financial statements. The application of this rule may require the accrual of income with respect to our debt instruments, such as original issue discount or market discount, earlier than would be the case under the general tax rules, although the precise application of this rule is unclear at this time. This rule generally will be effective for tax years beginning after December 31, 2017 or, for debt instruments issued with original issue discount, for tax years beginning after December 31, 2018. To the extent that this rule requires the accrual of income earlier than under the general tax rules, it could increase our “phantom income.”
Finally, in the event that any debt instruments or CMBS acquired by us are delinquent as to mandatory principal and interest payments, or in the event payments with respect to a particular debt instrument are not made when due, we may nonetheless be required to continue to recognize the unpaid interest as taxable income as it accrues, despite doubt as to its ultimate collectability. In each case, while we would in general ultimately have an offsetting loss deduction available to us when such interest was determined to be uncollectible, the utility of that deduction could depend on our having taxable income in that later year or thereafter.
The “taxable mortgage pool” rules may increase the taxes that we or our stockholders may incur, and may limit the manner in which we effect future securitizations.
Securitizations could result in the creation of taxable mortgage pools (“TMPs”), for U.S. federal income tax purposes. As a REIT, so long as we own 100% of the equity interests in a TMP, we generally would not be adversely affected by the characterization of the securitization as a TMP. Certain categories of stockholders, however, such as foreign stockholders eligible for treaty or other benefits, stockholders with net operating losses, and certain tax-exempt stockholders that are subject to unrelated business income tax, could be subject to increased taxes on a portion of their dividend income from us that is attributable to the TMP. In addition, to the extent that our common stock is owned by tax-exempt “disqualified organizations,” such as certain government-related entities and charitable remainder trusts that are not subject to tax on unrelated business income, we may incur a corporate level tax on a portion of our income from the TMP. In that case, we may reduce the amount of our distributions to any disqualified organization whose stock ownership gave rise to the tax. Moreover, we would be precluded from selling equity interests in these securitizations to outside investors, or selling any debt securities issued in connection with these securitizations that might be considered to be equity interests for tax purposes. These limitations may prevent us from using certain techniques to maximize our returns from securitization transactions.
The tax on prohibited transactions limits our ability to engage in transactions, including certain methods of securitizing mortgage loans, which would be treated as sales for U.S. federal income tax purposes.
A REIT’s net income from prohibited transactions is subject to a 100% tax. In general, prohibited transactions are sales or other dispositions of property, other than foreclosure property, but including mortgage loans, held primarily for sale to customers in the ordinary course of business. We might be subject to this tax if we were to dispose of or securitize loans in a manner that was treated as a sale of the loans for U.S. federal income tax purposes. Therefore, in order to avoid the prohibited transactions tax, we may choose not to engage in certain sales of loans at the REIT level, and may limit the structures we utilize for our securitization transactions, even though the sales or structures might otherwise be beneficial to us.
49
Our investments in construction loans will require us to make estimates about the fair value of land improvements that may be challenged by the IRS.
We have invested and will continue to invest in construction loans, the interest from which will be qualifying income for purposes of the REIT income tests, provided that the loan value of the real property securing the construction loan is equal to or greater than the highest outstanding principal amount of the construction loan during any taxable year. For purposes of construction loans, the loan value of the real property is the fair value of the land plus the reasonably estimated cost of the improvements or developments (other than personal property) that will secure the loan and that are to be constructed from the proceeds of the loan. There can be no assurance that the IRS would not challenge our estimate of the loan value of the real property.
The failure of a mezzanine loan to qualify as a real estate asset could adversely affect our ability to continue to qualify as a REIT.
We have invested and will continue to invest in mezzanine loans, for which the IRS has provided a safe harbor but not rules of substantive law. Pursuant to the safe harbor, if a mezzanine loan meets certain requirements, it will be treated by the IRS as a real estate asset for purposes of the REIT asset tests, and interest derived from the mezzanine loan will be treated as qualifying mortgage interest for purposes of the REIT 75% income test. Certain of our mezzanine loans may not meet all of the requirements of this safe harbor. In the event we own a mezzanine loan that does not meet the safe harbor, the IRS could challenge such loan’s treatment as a real estate asset for purposes of the REIT asset and income tests and, if such a challenge were sustained, we could fail to qualify as a REIT.
The failure of assets subject to secured revolving repurchase facilities to qualify as real estate assets could adversely affect our ability to continue to qualify as a REIT.
We have entered into secured revolving repurchase facilities and may in the future enter into additional secured revolving repurchase facilities pursuant to which we would agree, from time to time, to nominally sell certain of our assets to a counterparty and repurchase these assets at a later date in exchange for a purchase price. Economically, repurchase transactions are financings which are secured by the assets sold pursuant thereto. We believe that we would be treated for REIT asset and income test purposes as the owner of the assets that are the subject of any such repurchase transaction notwithstanding that such agreement may transfer record ownership of the assets to the counterparty during the term of the agreement. It is possible, however, that the IRS could assert that we did not own the assets during the term of the repurchase transaction, in which case we could fail to continue to qualify as a REIT.
Liquidation of assets may jeopardize our REIT qualification or create additional tax liability for us.
To continue to qualify as a REIT, we must comply with requirements regarding our assets and our sources of income. If we are compelled to liquidate our investments to repay obligations to our lenders, we may be unable to comply with these requirements, ultimately jeopardizing our qualification as a REIT, or we may be subject to a 100% tax on any resultant gain if we sell assets that are treated as dealer property or inventory.
Complying with REIT requirements may limit our ability to hedge effectively and may cause us to incur tax liabilities.
The REIT provisions of the Internal Revenue Code substantially limit our ability to hedge our assets and liabilities. Any income from a properly identified hedging transaction we enter into either (i) to manage risk of interest rate changes with respect to borrowings made or to be made to acquire or carry real estate assets, (ii) to manage risk of currency fluctuations with respect to items of income that qualify for purposes of the REIT 75% or 95% gross income tests or assets that generate such income, or (iii) to hedge another instrument that hedges risks described in clause (i) or (ii) for a period following the extinguishment of the liability or the disposition of the asset that was previously hedged by the instrument, and, in each case, such instrument is properly identified under applicable U.S. Treasury Regulations, does not constitute “gross income” for purposes of the 75% or 95% gross income tests. To the extent that we enter into other types of hedging transactions, the income from those transactions is likely to be treated as non-qualifying income for purposes of both of the gross income tests. As a result of these rules, we intend to limit our use of advantageous hedging techniques or implement those hedges through a domestic TRS. This could increase the cost of our hedging activities because our TRS would be subject to tax on gains or expose us to greater risks associated with changes in interest rates than we would otherwise want to bear. In
50
addition, losses in a TRS will generally not provide any tax benefit, except for being carried forward against future taxable income in such TRS.
Qualifying as a REIT involves highly technical and complex provisions of the Internal Revenue Code.
Qualification as a REIT involves the application of highly technical and complex provisions of the Internal Revenue Code for which only limited judicial and administrative authorities exist. Even a technical or inadvertent violation could jeopardize our REIT qualification. Our continued qualification as a REIT will depend on our satisfaction of certain asset, income, organizational, distribution, stockholder ownership and other requirements on a continuing basis. In addition, our ability to satisfy the requirements to continue to qualify as a REIT depends in part on the actions of third parties over which we have no control or only limited influence, including in cases where we own an equity interest in an entity that is classified as a partnership for U.S. federal income tax purposes.
New legislation or administrative or judicial action, in each instance potentially with retroactive effect, could make it more difficult or impossible for us to remain qualified as a REIT or have other adverse effects on us.
The present U.S. federal income tax treatment of REITs may be modified, possibly with retroactive effect, by legislative, judicial or administrative action at any time, which could affect the U.S. federal income tax treatment of an investment in us. The U.S. federal income tax rules dealing with REITs are constantly under review by persons involved in the legislative process, the IRS and the U.S. Treasury Department, which results in statutory changes as well as frequent revisions to regulations and interpretations. Any such changes to the tax laws or interpretations thereof, with or without retroactive application, could materially and adversely affect our stockholders or us. We cannot predict how changes in the tax laws might affect our stockholders or us. The recently-enacted TCJA makes significant changes to the U.S. federal income tax rules for taxation of individuals and corporations. The top corporate income tax rate has been reduced to 21%. In the case of individuals, the tax brackets have been adjusted, the top federal income rate has been reduced to 37%, special rules reduce taxation of certain income earned through pass-through entities and reduce the top effective rate applicable to ordinary dividends from REITs to 29.6% (through a 20% deduction for ordinary REIT dividends received) and various deductions have been eliminated or limited. The TCJA generally requires us to take certain amounts in income no later than the time such amounts are reflected on certain financial statements. The application of this rule may require the accrual of income with respect to our debt instruments, such as original issue discount or market discount, earlier than would be the case under the general tax rules, although the precise application of this rule is unclear at this time. This rule generally will be effective for tax years beginning after December 31, 2017 or, for debt instruments issued with original issue discount, for tax years beginning after December 31, 2018. To the extent that this rule requires the accrual of income earlier than under the general tax rules, it could increase our “phantom income,” which may make it more likely that we could be required to borrow funds or take other action to satisfy the REIT distribution requirements for the taxable year in which this “phantom income” is recognized. Most of the TCJA changes applicable to individuals are temporary and apply only to taxable years beginning after December 31, 2017 and before January 1, 2026. There are only minor changes to the REIT rules (other than the 20% deduction applicable to individuals for ordinary REIT dividends received). The TCJA makes numerous other large and small changes to the tax rules that do not affect REITs directly but may affect our stockholders and may indirectly affect us.
Stockholders are urged to consult with their tax advisors with respect to the TCJA and any other regulatory or administrative developments and proposals and their potential effect on an investment in our common stock.
Risks Related to Our Common Stock
The market price for our common stock may fluctuate significantly.
Our common stock trades on the NYSE under the symbol “TRTX”. The capital and credit markets have on occasion experienced periods of extreme volatility and disruption. The market price and liquidity of the market for shares of our common stock may be significantly affected by numerous factors, some of which are beyond our control and may not be directly related to our operating performance. Accordingly, no assurance can be given as to the ability of our stockholders to sell their common stock or the price that our stockholders may obtain for their common stock. Some of the factors that could negatively affect the market price of our common stock include:
|
|
• |
our actual or projected operating results, financial condition, cash flows and liquidity, or changes in investment strategy or prospects; |
|
|
• |
changes in the value of our portfolio; |
51
|
|
• |
actual or perceived conflicts of interest with TPG, including our Manager, and the personnel of TPG provided to our Manager, including our executive officers, and TPG Funds; |
|
|
• |
equity issuances by us, or share resales by our stockholders, or the perception that such issuances or resales may occur; |
|
|
• |
loss of a major funding source or inability to obtain new favorable funding sources in the future; |
|
|
• |
our financing strategy and leverage; |
|
|
• |
actual or anticipated accounting problems; |
|
|
• |
publication of research reports about us or the commercial real estate industry; |
|
|
• |
adverse market reaction to additional indebtedness we incur or securities we may issue in the future; |
|
|
• |
additions to or departures of key personnel of TPG, including our Manager; |
|
|
• |
changes in market valuations or operating performance of companies comparable to us; |
|
|
• |
price and volume fluctuations in the overall stock market from time to time; |
|
|
• |
short-selling pressure with respect to shares of our common stock or REITs generally; |
|
|
• |
speculation in the press or investment community; |
|
|
• |
any shortfall in revenue or net income or any increase in losses from levels expected by investors or securities analysts; |
|
|
• |
increases in market interest rates, which may lead investors to demand a higher distribution yield for our common stock and would result in increased interest expense on our debt; |
|
|
• |
failure to maintain our REIT qualification or exclusion or exemption from Investment Company Act regulation or listing on the NYSE; |
|
|
• |
changes in law, regulatory policies or tax guidelines, or interpretations thereof, particularly with respect to REITs; |
|
|
• |
general market and economic conditions and trends, including inflationary concerns and the current state of the credit and capital markets; and |
|
|
• |
the other factors described in this Item 1A- “Risk Factors.” |
As noted above, market factors unrelated to our performance could also negatively impact the market price of our common stock. One of the factors that investors may consider in deciding whether to buy or sell our common stock is our distribution rate, if any, as a percentage of our stock price relative to market interest rates. If market interest rates increase, prospective investors may demand a higher distribution rate or seek alternative investments paying higher dividends or interest. As a result, interest rate fluctuations and conditions in the capital markets can affect the market price of our common stock.
Common stock eligible for future sale may have adverse effects on the market price of our common stock.
Prior to our initial public offering, we entered into a registration rights agreement with TPG Holdings III, L.P. and certain of our other stockholders. The registration rights agreement provides these stockholders with certain demand, shelf and piggyback registration rights. Pursuant to the registration rights agreement, each of the holders may make up to three requests that we register the resale of all or any part of such holder’s registrable securities under the Securities Act at any time. The registration rights agreement also provides the holders with certain shelf registration rights. Accordingly, a holder may request that we file a shelf registration statement pursuant to Rule 415 under the Securities Act relating to the resale of the registrable securities held by such holder from time to time in accordance with the methods of distribution elected by such holder. In any demand or shelf registration, subject to certain exceptions, the other holders will have the right to participate in the registration on a pro rata basis, subject to certain conditions. By exercising these rights, and selling a significant number of shares of our common stock, the market price of our common stock could decline significantly.
The registration rights agreement provides the holders with piggyback registration rights that require us to register the resale of shares of our common stock held by the holders in the event we register for sale, either for our own account or for the account of others, shares of our common stock in future offerings. The holders will be able to participate in such registration on a pro rata basis, subject to certain terms and conditions.
52
In addition, a substantial amount of our shares of common stock held by our stockholders prior to our initial public offering have become eligible for resale subject to the requirements of Rule 144 under the Securities Act.
We have also filed a registration statement on Form S-8 to register the issuance of an aggregate of 4,600,463 shares of our common stock that may be issued under the TPG RE Finance Trust, Inc. 2017 Equity Incentive Plan (the “Incentive Plan”). The issuance of these shares and their subsequent sale could cause the market price of our common stock to decline.
We cannot predict the effect, if any, of future issuances or sales of our stock, or the availability of shares for future issuances or sales, on the market price of our common stock. Issuances or sales of substantial amounts of stock or the perception that such issuances or sales could occur may adversely affect the prevailing market price for our common stock.
We may issue shares of restricted stock and other equity-based awards under our equity incentive plan. Also, we may issue additional shares of our stock in public offerings or private placements to make new investments or for other general corporate purposes. We are not required to offer any such shares to existing stockholders on a preemptive basis. Therefore, it may not be possible for existing stockholders to participate in such future stock issuances, which may dilute the then existing stockholders’ interests in us.
We have not established a minimum distribution payment level and we cannot assure you of our ability to pay distributions in the future.
We are generally required to distribute to our stockholders at least 90% of our REIT taxable income each year for us to qualify as a REIT under the Internal Revenue Code, which requirement we currently intend to satisfy through quarterly distributions of all or substantially all of our REIT taxable income in such year, subject to certain adjustments. We have not established a minimum distribution payment level and our ability to make distributions may be adversely affected by a number of factors, including the risk factors described in this Form 10-K. Distributions to our stockholders, if any, will be authorized by our board of directors in its sole discretion out of funds legally available therefor and will be dependent upon a number of factors, including our historical and projected results of operations, cash flows and financial condition, our financing covenants, maintenance of our REIT qualification, applicable provisions of the Maryland General Corporation Law (the “MGCL”) and such other factors as our board of directors deems relevant.
We believe that a change in any one of the following factors could adversely affect our results of operations and cash flows and impair our ability to make distributions to our stockholders:
|
|
• |
our ability to make attractive investments; |
|
|
• |
margin calls or other expenses that reduce our cash flows; |
|
|
• |
defaults or prepayments in our investment portfolio or decreases in the value of our investment portfolio; and |
|
|
• |
the fact that anticipated operating expense levels may not prove accurate, as actual results may vary from estimates. |
As a result, no assurance can be given that we will be able to make distributions to our stockholders at any time in the future or that the level of any distributions we do make to our stockholders will achieve a market yield or increase or even be maintained over time, any of which could materially and adversely affect us.
In addition, distributions that we make to our stockholders will generally be taxable to our stockholders as ordinary income. However, a portion of our distributions may be designated by us as long-term capital gains to the extent that they are attributable to capital gain income recognized by us or may constitute a return of capital to the extent that they exceed our earnings and profits as determined for U.S. federal income tax purposes. A return of capital is not taxable, but has the effect of reducing the basis of a stockholder’s investment in our common stock.
Future offerings of debt or equity securities, which would rank senior to our common stock, may adversely affect the market price of our common stock.
If we decide to issue debt or equity securities in the future, which would rank senior to our common stock, it is likely that they will be governed by an indenture or other instrument containing covenants restricting our operating
53
flexibility. Additionally, any convertible or exchangeable securities that we issue in the future may have rights, preferences and privileges more favorable than those of our common stock and may result in dilution to owners of our common stock. We and, indirectly, our stockholders, will bear the cost of issuing and servicing such securities. Because our decision to issue debt or equity securities in any future offering will depend on market conditions and other factors beyond our control, we cannot predict or estimate the amount, timing, nature or effect of our future offerings. Thus, holders of our common stock will bear the risk of our future offerings reducing the market price of our common stock and diluting the value of their stock holdings in us.
Purchases of our common stock by Goldman Sachs & Co. LLC for us under our 10b5-1 Purchase Plan may result in the market price of our common stock being higher than the price that otherwise might exist in the open market.
We have entered into an agreement (the “10b5-1 Purchase Plan”) with Goldman Sachs & Co. LLC. Pursuant to the 10b5-1 Purchase Plan, Goldman Sachs & Co. LLC, as our agent, will buy in the open market up to $35.0 million in shares of our common stock in the aggregate during the period beginning four full calendar weeks after the completion of our initial public offering on July 25, 2017 and ending 12 months thereafter or, if sooner, the date on which all the capital committed to the 10b5-1 Purchase Plan has been exhausted. Whether purchases will be made under the 10b5-1 Purchase Plan and how much will be purchased at any time is uncertain, dependent on prevailing market prices and trading volumes, all of which we cannot predict. These activities may have the effect of maintaining the market price of our common stock or retarding a decline in the market price of the common stock, and, as a result, the market price of our common stock may be higher than the price that otherwise might exist in the open market.
Certain provisions of Maryland law could inhibit changes in control.
Certain provisions of the MGCL may have the effect of deterring a third party from making a proposal to acquire us or of inhibiting a change in control under circumstances that otherwise could provide the holders of our common stock with the opportunity to realize a premium over the then-prevailing market price of our common stock. Under the MGCL, certain “business combinations” (including a merger, consolidation, share exchange or, in certain circumstances, an asset transfer or issuance or reclassification of equity securities) between a Maryland corporation and an interested stockholder (as defined in the statute) or an affiliate of such an interested stockholder are prohibited for five years after the most recent date on which the interested stockholder becomes an interested stockholder. Thereafter, any such business combination must be recommended by the board of directors of such corporation and approved by the affirmative vote of at least (1) 80% of the votes entitled to be cast by holders of outstanding shares of voting stock of the corporation and (2) two-thirds of the votes entitled to be cast by holders of shares of voting stock of the corporation other than shares held by the interested stockholder with whom (or with whose affiliate) the business combination is to be effected or held by an affiliate or associate of the interested stockholder, unless, among other conditions, the corporation’s common stockholders receive a minimum price (as defined in the MGCL) for their shares and the consideration is received in cash or in the same form as previously paid by the interested stockholder for its shares. These provisions of the MGCL do not apply, however, to business combinations that are approved or exempted by a board of directors prior to the time that the interested stockholder becomes an interested stockholder. Pursuant to the statute, our board of directors has by resolution exempted any business combination between us and any other person, provided that such business combination is first approved by our board of directors.
The MGCL provides that holders of “control shares” of our company (defined as shares of voting stock that, if aggregated with all other shares of capital stock owned or controlled by the acquirer, would entitle the acquirer to exercise one of three increasing ranges of voting power in electing directors) acquired in a “control share acquisition” (defined as the direct or indirect acquisition of issued and outstanding “control shares”) have no voting rights except to the extent approved at a special meeting of stockholders by the affirmative vote of at least two-thirds of all of the votes entitled to be cast on the matter, excluding all interested shares. Our bylaws currently contain a provision exempting any and all acquisitions by any person of shares of our stock from this statute.
The “unsolicited takeover” provisions of the MGCL permit our board of directors, without stockholder approval and regardless of what is currently provided in our charter or bylaws, to implement takeover defenses if we have a class of equity securities registered under the Exchange Act and at least three independent directors. These provisions may have the effect of inhibiting a third party from making an acquisition proposal for us or of delaying, deferring or preventing a change in control of our company under circumstances that otherwise could provide the holders of shares of our common stock with the opportunity to realize a premium over the then-current market price.
54
Our charter contains a provision whereby we have elected to be subject to the provisions of Title 3, Subtitle 8 of the MGCL relating to the filling of vacancies on our board of directors.
The authorized but unissued shares of our common stock and preferred stock may prevent a change in our control.
Our charter authorizes us to issue additional authorized but unissued shares of our common stock and preferred stock. In addition, a majority of our entire board of directors may, without stockholder approval, amend our charter to increase or decrease the aggregate number of shares of our capital stock or the number of shares of our capital stock of any class or series that we have authority to issue and classify or reclassify any unissued shares of our common stock or preferred stock and set the preferences, rights and other terms of the classified or reclassified shares. As a result, our board of directors may establish a class or series of common stock or preferred stock that could delay, defer or prevent a transaction or a change in control that might involve a premium price for shares of our common stock or otherwise be in the best interest of our stockholders.
Ownership limitations may delay, defer or prevent a transaction or a change in our control that might involve a premium price for our common stock or otherwise be in the best interest of our stockholders.
In order for us to maintain our qualification as a REIT under the Internal Revenue Code, not more than 50% of the value of the outstanding shares of our capital stock may be owned, directly or indirectly, by five or fewer individuals (as defined in the Internal Revenue Code to include certain entities) during the last half of a taxable year. Our charter, with certain exceptions, authorizes our board of directors to take the actions that are necessary or appropriate to preserve our qualification as a REIT. Unless exempted by our board of directors, no person may own more than 9.8% in value or in number of shares, whichever is more restrictive, of the outstanding shares of any class or series of our capital stock. Our board may grant an exemption prospectively or retroactively in its sole discretion, subject to such conditions, representations and undertakings as it may deem appropriate. These ownership limitations in our charter are standard in REIT charters and are intended to provide added assurance of compliance with the tax law requirements, and to reduce administrative burdens. However, these ownership limits might also delay, defer or prevent a transaction or a change in our control that might involve a premium price for our common stock or otherwise be in the best interest of our stockholders or result in the transfer of shares acquired in excess of the ownership limits to a trust for the benefit of a charitable beneficiary and, as a result, the forfeiture by the acquirer of the benefits of owning the additional shares.
Our charter contains provisions that make removal of our directors difficult, which makes it more difficult for our stockholders to effect changes to our management and may prevent a change in control of our company that is in the best interests of our stockholders.
Our charter provides that a director may be removed only for cause and only by the affirmative vote of at least two-thirds of all the votes of stockholders entitled to be cast generally in the election of directors. Vacancies on our board of directors may be filled only by a majority of the remaining directors, even if the remaining directors do not constitute a quorum, and any individual elected to fill such a vacancy will serve for the remainder of the full term of the directorship in which the vacancy occurred and until his or her successor is duly elected and qualifies. These requirements make it more difficult for our stockholders to effect changes to our management by removing and replacing directors and may prevent a change in control of our company that is otherwise in the best interests of our stockholders.
Our charter contains provisions that limit the responsibilities of our directors and officers with respect to certain business opportunities.
Our charter provides that, if any director or officer of our company who is also a partner, advisory board member, director, officer, manager, member or shareholder of TPG (any such director or officer, a “TPG Director/Officer”) acquires knowledge of a potential business opportunity, we renounce, on our behalf and on behalf of our subsidiaries, any potential interest or expectation in, or right to be offered or to participate in, such business opportunity to the maximum extent permitted from time to time by Maryland law. Accordingly, to the maximum extent permitted from time to time by Maryland law, (1) no TPG Director/Officer is required to present, communicate or offer any business opportunity to us or any of our subsidiaries and (2) the TPG Director/Officer, on his or her own behalf or on behalf of TPG, will have the right to hold and exploit any business opportunity, or to direct, recommend, offer, sell, assign or otherwise transfer such business opportunity to any person or entity other than us.
55
Accordingly, any TPG Director/Officer may hold and make use of any business opportunity or direct such opportunity to any person or entity other than us and, as a result, those business opportunities may not be available to us.
Our rights and the rights of our stockholders to take action against our directors and officers are limited, which could limit your recourse in the event of actions not in your best interests.
Our charter limits the liability of our directors and officers to us and our stockholders for money damages to the maximum extent permitted under Maryland law. Under current Maryland law, our present and former directors and officers will not have any liability to us or our stockholders for money damages except for liability resulting from:
|
|
• |
actual receipt of an improper personal benefit or profit in money, property or services; or |
|
|
• |
active and deliberate dishonesty by the director or executive officer that was established by a final judgment and was material to the cause of action adjudicated. |
Our charter and bylaws obligate us, to the maximum extent permitted by Maryland law in effect from time to time, to indemnify and, without requiring a preliminary determination of the ultimate entitlement to indemnification, pay or reimburse reasonable expenses in advance of final disposition of a proceeding to:
|
|
• |
any individual who is a present or former director or executive officer of our company and who is made, or threatened to be made, a party to, or witness in, the proceeding by reason of his or her service in that capacity; or |
|
|
• |
any individual who, while a director or officer of our company and at our request, serves or has served as a director, officer, trustee, member, manager or partner of another corporation, real estate investment trust, limited liability company, partnership, joint venture, trust, employee benefit plan or other enterprise and who is made, or threatened to be made, a party to, or witness in, the proceeding by reason of his or her service in that capacity. |
Our charter and bylaws also permit us to indemnify and advance expenses to any person who served a predecessor of ours in any of the capacities described above and to any employee or agent of our company or a predecessor of our company.
As a result, we and our stockholders may have more limited rights against our directors and officers than might otherwise exist absent the current provisions in our charter and bylaws or that might exist with other companies, which could limit your recourse in the event of actions not in your best interests.
We are a holding company with no direct operations and, as such, we rely on funds received from Holdco to pay liabilities and distributions to our stockholders, and the interests of our stockholders are structurally subordinated to all liabilities and any preferred equity of Holdco and its subsidiaries.
We are a holding company and conduct substantially all of our operations through Holdco. We do not have, apart from an interest in Holdco, any independent operations. As a result, we rely on distributions from Holdco to pay any dividends that we may declare on shares of our stock. We also rely on distributions from Holdco to meet any of our obligations, including any tax liability on taxable income allocated to us from Holdco. In addition, because we are a holding company, your claims as stockholders are structurally subordinated to all existing and future liabilities (whether or not for borrowed money) and any preferred equity of Holdco and its subsidiaries. Therefore, in the event of our bankruptcy, liquidation or reorganization, our assets and those of Holdco and its subsidiaries will be available to satisfy the claims of our stockholders only after all of Holdco’s and its subsidiaries’ liabilities and any preferred equity have been paid in full.
Investing in our common stock may involve a high degree of risk.
The investments that we make in accordance with our investment objectives may result in a high amount of risk when compared to alternative investment options and volatility or loss of principal. Our investments may be highly speculative and aggressive, and therefore an investment in our common stock may not be suitable for someone with lower risk tolerance.
56
Item 1B. Unresolved Staff Comments.
Not applicable.
Our principal executive office is located in leased space at 888 Seventh Avenue, 35th Floor, New York, New York 10106. Our principal administrative office is located in leased space at 301 Commerce Street, 33rd Floor, Fort Worth, Texas 76102. We do not own any real property. We consider these facilities to be suitable and adequate for the management and operations of our business.
From time to time, we may be involved in various claims and legal actions arising in the ordinary course of business. As of December 31, 2017, we were not involved in any material legal proceedings.
Item 4. Mine Safety Disclosures.
Not applicable.
57
Item 5. Market for Registrant’s Common Equity, Related Stockholder Matters and Issuer Purchases of Equity Securities.
Common Stock Performance
Our common stock was listed on the NYSE on July 20, 2017 in connection with our initial public offering, which closed on July 25, 2017, and is currently traded under the symbol “TRTX”. It has been our policy to declare quarterly dividends to common stockholders in compliance with applicable provisions of the Internal Revenue Code governing REITs. For the fiscal quarters indicated below, the reported high and low sales prices per share of our common stock on the NYSE and the cash dividends declared per share of common stock and Class A common stock are as follows:
|
|
|
High |
|
|
Low |
|
|
Dividends Declared Per Share(1) |
|
|||
|
2017 |
|
|
|
|
|
|
|
|
|
|
|
|
|
Fourth Quarter |
|
$ |
20.11 |
|
|
$ |
18.61 |
|
|
$ |
0.38 |
|
|
Third Quarter(2) |
|
|
20.70 |
|
|
|
18.71 |
|
|
|
0.33 |
|
|
(1) |
Dividend per share amounts reflect the impact of the common stock and Class A common stock dividend paid upon the completion of our initial public offering. |
|
(2) |
Beginning on July 20, 2017, the date our common stock was listed on the NYSE. |
The last reported sale price of our common stock on February 23, 2018 as reported on the NYSE composite transaction tape was $18.73. As of February 23, 2018, there were approximately 494 holders of record of our common stock and approximately 9 holders of record of our Class A common stock. This does not include the number of stockholders that hold shares in “street name” through banks or broker-dealers.
Dividends (Distributions)
We generally intend to distribute each year substantially all of our taxable income (which does not necessarily equal net income as calculated in accordance with GAAP) to our stockholders so as to comply with the REIT provisions of the Internal Revenue Code. In addition, our dividend policy remains subject to revision at the discretion of our board of directors. All distributions will be made at the discretion of our board of directors and will depend upon, among other things, our actual results of operations and liquidity. These results and our ability to pay distributions will be affected by various factors, including our taxable income, our financial condition, our maintenance of REIT status, applicable law, and other factors as our board of directors deems relevant. See Item 1A – “Risk Factors” and Item 7 – “Management’s Discussion and Analysis of Financial Condition and Results of Operations,” of this Form 10-K for information regarding the sources of funds used for distributions and for a discussion of factors, if any, which may adversely affect our ability to make distributions.
Cash distributions declared with respect to our common stock can be characterized for federal income tax purposes as taxable ordinary dividends, capital gain dividends, nondividend distributions or a combination thereof. The following is a characterization of our annual common stock distributions declared per share for the years indicated:
|
|
|
Year Ended December 31, |
|
|||||||||
|
|
|
2017 |
|
|
2016 |
|
|
2015 |
|
|||
|
Ordinary dividends |
|
$ |
1.52 |
|
|
$ |
1.62 |
|
|
$ |
1.91 |
|
|
Capital gain (loss) dividends |
|
|
0.04 |
|
|
|
— |
|
|
|
— |
|
|
Totals(1) |
|
$ |
1.56 |
|
|
$ |
1.62 |
|
|
$ |
1.91 |
|
|
(1) |
Dividend per share amounts reflect the impact of the common stock and Class A common stock dividend paid upon the completion of our initial public offering (discussed below). |
On July 3, 2017, we declared a stock dividend that resulted in the issuance of 9,224,268 shares of our common stock and 230,815 shares of our Class A common stock upon the completion of our initial public offering. The stock dividend was paid on July 25, 2017 to holders of record of our common stock and Class A common stock as of July 3, 2017.
58
Purchases of Equity Securities by the Issuer and Affiliated Purchases
The following table provides information about common stock purchases by or on behalf of the Company pursuant to the 10b5-1 Purchase Plan during the quarter ended December 31, 2017:
|
Fiscal Period |
|
Total Number of Shares Purchased |
|
|
Average Price Paid per Share |
|
|
Total Number of Shares Purchased as Part of Publicly Announced Plans or Programs |
|
|
Maximum Approximate Dollar Value of Shares that May Yet Be Purchased Under the Plans or Programs(1) |
|
||||
|
October 1, 2017 to October 31, 2017 |
|
|
152,253 |
|
|
$ |
19.62 |
|
|
|
152,253 |
|
|
$ |
25,457,021 |
|
|
November 1, 2017 to November 30, 2017 |
|
|
119,055 |
|
|
|
19.44 |
|
|
|
119,055 |
|
|
|
23,140,022 |
|
|
December 1, 2017 to December 31, 2017 |
|
|
114,730 |
|
|
|
19.42 |
|
|
|
114,730 |
|
|
|
20,908,468 |
|
|
Totals / Averages |
|
|
386,038 |
|
|
$ |
19.50 |
|
|
|
386,038 |
|
|
$ |
20,908,468 |
|
|
(1) |
In July 2017, the Company announced an agreement pursuant to which Goldman Sachs & Co. LLC, as our agent, will buy in the open market up to $35.0 million in shares of our common stock in the aggregate during the period beginning on or about August 21, 2017 and ending 12 months thereafter or, if sooner, the date on which all the capital committed has been exhausted. |
From inception of the 10b5-1 Purchase Plan through December 31, 2017, the Company repurchased 720,783 shares of common stock, at a weighted average price of $19.55 per share, for total consideration (including commissions and related fees) of $14.1 million. At December 31, 2017, the Company’s remaining commitment under the 10b5-1 Purchase Plan is $20.9 million.
59
The graph below compares the cumulative total stockholder return on our common stock, the S&P 500 Index and the Bloomberg REIT Mortgage Index, from July 20, 2017 (commencement of trading on the NYSE) to December 29, 2017 (the last trading day of the year ended December 31, 2017). Total cumulative stockholder return is based on a $100 investment in our common stock and in each of the indices on July 20, 2017 and assumes quarterly reinvestment of dividends before consideration of income taxes. Stockholder returns over the indicated periods should not be considered indicative of future stock prices or stockholder returns.
Total Stockholder Return
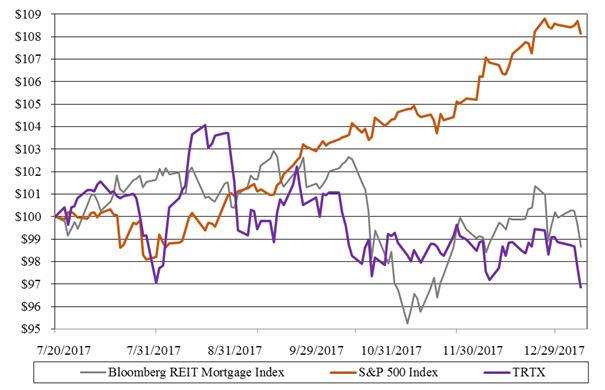
|
|
|
|
|
|
|
|
|
|
|
|
|
|
|
|
|
|
|
|
|
|
|
|
|
|
|
|
|
7/31/2017 |
|
|
8/31/2017 |
|
|
9/29/2017 |
|
|
10/31/2017 |
|
|
11/30/2017 |
|
|
12/29/2017 |
|
||||||
|
S&P 500 Index |
|
$ |
99.91 |
|
|
$ |
99.96 |
|
|
$ |
101.89 |
|
|
$ |
104.15 |
|
|
$ |
107.08 |
|
|
$ |
108.13 |
|
|
Bloomberg REIT Mortgage Index |
|
|
100.56 |
|
|
|
101.99 |
|
|
|
101.33 |
|
|
|
97.91 |
|
|
|
98.41 |
|
|
|
98.67 |
|
|
TPG RE Finance Trust, Inc. |
|
|
101.17 |
|
|
|
102.85 |
|
|
|
100.51 |
|
|
|
99.24 |
|
|
|
97.56 |
|
|
|
96.85 |
|
Initial Public Offering
On July 25, 2017, we completed our initial public offering in which we sold 11,000,000 shares of our common stock at an initial public offering price of $20.00 per share. The shares offered and sold in the initial public offering were registered under the Securities Act pursuant to our Registration Statement on Form S-11 (File No. 333-217446), which was declared effective by the SEC on July 19, 2017. The aggregate offering price for the shares registered and sold by us was approximately $220 million. The initial public offering generated $199.4 million in net proceeds, after deducting underwriting discounts of $13.2 million and offering expenses payable by us of approximately $7.4 million. On August 17, 2017, the underwriters of the Company’s initial public offering partially exercised their option to purchase up to an additional 1,650,000 shares of common stock. On August 22, 2017, we issued and sold, and the underwriters purchased, 650,000 shares of common stock for net proceeds of approximately $12.2 million, after deducting underwriting discounts of $0.8 million. The underwriters of the offering were Merrill Lynch, Pierce, Fenner & Smith Incorporated, Citigroup Global Markets Inc., Goldman Sachs & Co. LLC, Wells Fargo Securities, LLC, Deutsche Bank Securities Inc., J.P. Morgan Securities LLC, Morgan Stanley & Co. LLC, Barclays Capital Inc., TPG Capital BD, LLC and JMP Securities LLC. TPG Capital BD, LLC, an underwriter in the offering, is an affiliate and received underwriting discounts of approximately $0.6 million. No other offering
60
expenses were paid directly or indirectly to any of our directors or officers (or their associates), persons owning 10 percent or more of our common stock or any other affiliates.
We used the net proceeds from the offering to originate commercial mortgage loans consistent with our investment strategy and investment guidelines.
61
Item 6. Selected Financial Data.
The following selected consolidated historical financial data should be read in conjunction with the information set forth under Item 7 – “Management’s Discussion and Analysis of Financial Condition and Results of Operations” and the consolidated financial statements and the related notes thereto included in this Form 10-K.
|
|
|
Year Ended December 31, |
|
|
|
|
|
|||||||||
|
(Dollars in thousands, except for per share data) |
|
2017 |
|
|
2016 |
|
|
2015 |
|
|
Period from December 18, 2014 (inception) to December 31, 2014 |
|
||||
|
OPERATING DATA: |
|
|
|
|
|
|
|
|
|
|
|
|
|
|
|
|
|
INTEREST INCOME |
|
|
|
|
|
|
|
|
|
|
|
|
|
|
|
|
|
Interest Income |
|
$ |
198,903 |
|
|
$ |
153,631 |
|
|
$ |
128,647 |
|
|
$ |
1,847 |
|
|
Interest Expense |
|
|
(78,268 |
) |
|
|
(61,649 |
) |
|
|
(47,564 |
) |
|
|
(1,518 |
) |
|
Net Interest Income |
|
|
120,635 |
|
|
|
91,982 |
|
|
|
81,083 |
|
|
|
329 |
|
|
Other Income |
|
|
1,697 |
|
|
|
416 |
|
|
|
54 |
|
|
|
— |
|
|
OTHER EXPENSES |
|
|
|
|
|
|
|
|
|
|
|
|
|
|
|
|
|
Professional Fees |
|
|
3,132 |
|
|
|
3,260 |
|
|
|
5,224 |
|
|
|
7,719 |
|
|
General and Administrative |
|
|
2,975 |
|
|
|
2,199 |
|
|
|
784 |
|
|
|
764 |
|
|
Servicing Fees |
|
|
3,068 |
|
|
|
3,625 |
|
|
|
4,011 |
|
|
|
22 |
|
|
Management Fee |
|
|
14,096 |
|
|
|
8,816 |
|
|
|
6,902 |
|
|
|
61 |
|
|
Collateral Management Fee |
|
|
225 |
|
|
|
849 |
|
|
|
1,257 |
|
|
|
11 |
|
|
Incentive Management Fee |
|
|
4,338 |
|
|
|
3,687 |
|
|
|
1,992 |
|
|
|
— |
|
|
Total Other Expenses |
|
|
27,834 |
|
|
|
22,436 |
|
|
|
20,170 |
|
|
|
8,577 |
|
|
Net Income (Loss) Before Taxes |
|
$ |
94,498 |
|
|
$ |
69,962 |
|
|
$ |
60,967 |
|
|
$ |
(8,248 |
) |
|
Income Taxes |
|
|
(146 |
) |
|
|
5 |
|
|
|
(1,612 |
) |
|
|
— |
|
|
Net Income (Loss) |
|
$ |
94,352 |
|
|
$ |
69,967 |
|
|
$ |
59,355 |
|
|
$ |
(8,248 |
) |
|
Preferred Stock Dividends |
|
|
(16 |
) |
|
|
(16 |
) |
|
|
(15 |
) |
|
|
— |
|
|
Net Income (Loss) Attributable to Common Stockholders(1) |
|
$ |
94,336 |
|
|
$ |
69,951 |
|
|
$ |
59,340 |
|
|
$ |
(8,248 |
) |
|
Per Share Information: |
|
|
|
|
|
|
|
|
|
|
|
|
|
|
|
|
|
Basic and Diluted Earnings per Share(2) |
|
$ |
1.74 |
|
|
$ |
1.69 |
|
|
$ |
1.81 |
|
|
$ |
(0.28 |
) |
|
Dividends Declared Per Share(2) |
|
$ |
1.56 |
|
|
$ |
1.62 |
|
|
$ |
1.91 |
|
|
$ |
— |
|
|
Weighted Average Number of Shares Outstanding, Basic and Diluted: |
|
|
|
|
|
|
|
|
|
|
|
|
|
|
|
|
|
Common Stock(2) |
|
|
52,994,539 |
|
|
|
40,338,909 |
|
|
|
32,259,530 |
|
|
|
29,474,120 |
|
|
Class A Common Stock(2) |
|
|
1,200,057 |
|
|
|
1,067,117 |
|
|
|
608,439 |
|
|
|
— |
|
|
Total |
|
|
54,194,596 |
|
|
|
41,406,026 |
|
|
|
32,867,969 |
|
|
|
29,474,120 |
|
|
|
|
December 31, |
|
|||||||||||||
|
(Dollars in thousands, except for per share data) |
|
2017 |
|
|
2016 |
|
|
2015 |
|
|
2014 |
|
||||
|
BALANCE SHEET DATA (at period end): |
|
|
|
|
|
|
|
|
|
|
|
|
|
|
|
|
|
Total Assets |
|
$ |
3,355,385 |
|
|
$ |
2,665,583 |
|
|
$ |
2,119,753 |
|
|
$ |
1,952,147 |
|
|
Total Liabilities |
|
$ |
2,154,054 |
|
|
$ |
1,694,894 |
|
|
$ |
1,403,403 |
|
|
$ |
1,363,753 |
|
|
Total Equity |
|
$ |
1,201,331 |
|
|
$ |
970,689 |
|
|
$ |
716,350 |
|
|
$ |
588,394 |
|
|
Preferred Stock |
|
$ |
125 |
|
|
$ |
125 |
|
|
$ |
125 |
|
|
$ |
— |
|
|
Stockholders’ Equity, Net of Preferred Stock |
|
$ |
1,201,206 |
|
|
$ |
970,564 |
|
|
$ |
716,225 |
|
|
$ |
588,394 |
|
|
Number of Shares Outstanding at Period End(2) (3) |
|
|
60,618,730 |
|
|
|
48,446,028 |
|
|
|
35,929,782 |
|
|
|
29,474,120 |
|
|
Book Value per Common Share |
|
$ |
19.82 |
|
|
$ |
20.03 |
|
|
$ |
19.93 |
|
|
$ |
19.96 |
|
|
(1) |
Represents net income attributable to holders of our common stock and Class A common stock. |
|
(2) |
Share and per share data reflect the impact of the common stock and Class A common stock dividend which was paid upon completion of the Company’s initial public offering on July 25, 2017 to holders of record as of July 3, 2017. |
|
(3) |
Includes shares of common stock and Class A common stock. |
62
Item 7. Management’s Discussion and Analysis of Financial Condition and Results of Operations.
The following discussion should be read in conjunction with the consolidated financial statements and notes thereto appearing elsewhere in this Form 10-K. In addition to historical data, this discussion contains forward-looking statements about our business, operations and financial performance based on current expectations that involve risks, uncertainties and assumptions. Our actual results may differ materially from those in this discussion as a result of various factors, including but not limited to those discussed in Part, 1. Item 1A, “Risk Factors” in this Form 10-K.
Introduction
We are a commercial real estate finance company externally managed by TPG RE Finance Trust Management, L.P. and sponsored by TPG. We directly originate, acquire and manage commercial mortgage loans and other commercial real estate-related debt instruments in North America for our balance sheet. We operate our business as one segment.
We have made an election to be taxed as a REIT for U.S. federal income tax purposes, commencing with our initial taxable year ended December 31, 2014. We have been organized and have operated in conformity with the requirements for qualification and taxation as a REIT under the Internal Revenue Code and we believe that our organization and current and intended manner of operation will enable us to continue to meet the requirements for qualification and taxation as a REIT. As a REIT, we generally are not subject to U.S. federal income tax on our REIT taxable income that we distribute currently to our stockholders. We operate our business in a manner that permits us to maintain an exclusion or exemption from registration under the Investment Company Act.
2017 Highlights
Operating Results:
|
|
• |
Generated GAAP net income and Core Earnings of $94.4 million, an increase of $24.4 million, or 34.9%, as compared to the year ended December 31, 2016. |
|
|
• |
Declared dividends of $85.0 million, or $1.56 per share, representing a dividend yield of 7.9% on a Book Value per Common Share of $19.82 as of December 31, 2017. |
Investment Portfolio Activity:
|
|
• |
Originated 22 loans with a total commitment of $1.95 billion, an initial unpaid principal balance of $1.61 billion, unfunded commitments upon closing of $331.2 million, and a weighted average interest rate of LIBOR plus 4.4%. |
|
|
• |
Funded $313.2 million in connection with existing loans having future funding obligations. |
|
|
• |
Received cash proceeds of $1.2 billion, including $1.1 billion from principal repayments and $65.2 million from loan sales. |
Liquidity and Portfolio Financing:
|
|
• |
At December 31, 2017, we had unrestricted cash available for investment of $75.0 million. |
|
|
• |
At December 31, 2017, we had undrawn capacity (liquidity available to us without the need to pledge more collateral to our lenders) of $304.3 million under secured revolving repurchase and senior secured credit facilities with seven lenders, and asset-specific financings: |
|
|
• |
$194.6 million of undrawn capacity on account of our secured revolving repurchase facilities and senior secured credit facility, with a maximum facility commitment of $3.0 billion and a weighted average interest rate of LIBOR plus 2.2% as of December 31, 2017, providing stable financing, with mark-to-market provisions limited to asset and market specific events and a weighted average term to extended maturity (assuming we have exercised all extension options and term out provisions) of 2.6 years. |
|
|
• |
$109.7 million of undrawn capacity on account of asset-specific financings with a maximum commitment amount of $399.2 million at a weighted average interest rate of LIBOR plus 3.8% and a weighted average term to extended maturity (assuming we have exercised all extension options and term out provisions) of 2.4 years. |
63
|
|
• |
$984.3 million of financing capacity is available under our secured revolving repurchase facilities and senior secured credit facility for loan originations and acquisitions, with a maximum facility commitment of $2.8 billion and credit spreads based upon the LTV and other risk characteristics of collateral pledged, which together provide stable financing with mark-to-market provisions generally limited to asset and market specific events, and a weighted average term to extended maturity (assuming we have exercised all extension options and term out provisions) of 2.6 years. These facilities are 25% recourse to the Company’s wholly-owned subsidiary, TPG RE Finance Trust Holdco, LLC (“Holdco”). |
|
|
• |
$156.8 million of financing capacity is available for CMBS investments, with a maximum facility commitment of $200 million, credit spreads based upon the haircut and other risk characteristics of the collateral pledged, and a weighted average term to extended maturity (assuming we have exercised all extension options and term out provisions and have obtained the consent of our lenders) of 0.2 years. These facilities are 100% recourse to Holdco. |
Key Financial Measures and Indicators
As a commercial real estate finance company, we believe the key financial measures and indicators for our business are earnings per share, dividends declared per share, Core Earnings, and book value per share. For the three months ended December 31, 2017, we recorded earnings per share of $0.41, declared a dividend of $0.38 per share, and reported $0.41 per share of Core Earnings. For the year ended December 31, 2017, we recorded earnings per share of $1.74, declared dividends of $1.56 per share, and reported $1.74 per share of Core Earnings. In addition, our book value per common share as of December 31, 2017 was $19.82. As further described below, Core Earnings is a measure that is not prepared in accordance with GAAP. We use Core Earnings to evaluate our performance excluding the effects of certain transactions and GAAP adjustments that we believe are not necessarily indicative of our current loan activity and operations.
Earnings Per Common Share and Dividends Declared Per Common Share
The following table sets forth the calculation of basic and diluted net income per share and dividends declared per share (in thousands, except share and per share data):
|
|
|
Three Months Ended |
|
|
Year Ended December 31, |
|
||||||
|
|
|
December 31, 2017 |
|
|
2017 |
|
|
2016 |
|
|||
|
Net Income Attributable to Common Stockholders(1) |
|
$ |
24,754 |
|
|
$ |
94,336 |
|
|
$ |
69,951 |
|
|
Weighted Average Number of Common Shares Outstanding, Basic and Diluted(2)(3) |
|
|
60,796,636 |
|
|
|
54,194,596 |
|
|
|
41,406,026 |
|
|
Basic and Diluted Earnings per Common Share(3) |
|
$ |
0.41 |
|
|
$ |
1.74 |
|
|
$ |
1.69 |
|
|
Dividends Declared per Common Share(3) |
|
$ |
0.38 |
|
|
$ |
1.56 |
|
|
$ |
1.62 |
|
|
(1) |
Represents net income attributable to holders of our common stock and Class A common stock. |
|
(2) |
Weighted average number of shares outstanding includes common stock and Class A common stock. |
|
(3) |
Share and per share data reflect the impact of the common stock and Class A common stock dividend which was paid upon completion of the Company’s initial public offering on July 25, 2017 to holders of record as of July 3, 2017. See Note 12 to the Consolidated Financial Statements included in this Form 10-K for details. |
Core Earnings
We use Core Earnings to evaluate our performance excluding the effects of certain transactions and GAAP adjustments we believe are not necessarily indicative of our current loan activity and operations. Core Earnings is a non-GAAP measure, which we define as GAAP net income (loss) attributable to our stockholders, including realized gains and losses not otherwise included in GAAP net income (loss), and excluding (i) non-cash equity compensation expense, (ii) depreciation and amortization, (iii) unrealized gains (losses), and (iv) certain non-cash items. Core Earnings may also be adjusted from time to time to exclude one-time events pursuant to changes in
64
GAAP and certain other non-cash charges as determined by our Manager, subject to approval by a majority of our independent directors. The exclusion of depreciation and amortization from the calculation of Core Earnings only applies to debt investments related to real estate to the extent we foreclose upon the property or properties underlying such debt investments.
We believe that Core Earnings provides meaningful information to consider in addition to our net income and cash flow from operating activities determined in accordance with GAAP. Although pursuant to the Management Agreement we calculate the incentive and base management fees due to our Manager using Core Earnings before incentive fee expense, we report Core Earnings after incentive fee expense, because we believe this is a more meaningful presentation of the economic performance of our common and Class A common stock.
Core Earnings does not represent net income or cash generated from operating activities and should not be considered as an alternative to GAAP net income, or an indication of our GAAP cash flows from operations, a measure of our liquidity, or an indication of funds available for our cash needs. In addition, our methodology for calculating Core Earnings may differ from the methodologies employed by other companies to calculate the same or similar supplemental performance measures, and accordingly, our reported Core Earnings may not be comparable to the Core Earnings reported by other companies.
For additional information on the fees we pay our Manager, see Note 10 to our Consolidated Financial Statements included in this Form 10-K.
The following tables provide a reconciliation of GAAP net income attributable to common stockholders to Core Earnings (in thousands, except share and per share data):
|
|
|
Three Months Ended |
|
|
Year Ended December 31, |
|
||||||
|
|
|
December 31, 2017 |
|
|
2017 |
|
|
2016 |
|
|||
|
Net Income Attributable to Common Stockholders(1) |
|
$ |
24,754 |
|
|
$ |
94,336 |
|
|
$ |
69,951 |
|
|
Non-Cash Compensation Expense |
|
|
33 |
|
|
|
33 |
|
|
|
— |
|
|
Depreciation and Amortization Expense |
|
|
— |
|
|
|
— |
|
|
|
— |
|
|
Unrealized Gains (Losses) |
|
|
— |
|
|
|
— |
|
|
|
— |
|
|
Other Items |
|
|
— |
|
|
|
— |
|
|
|
— |
|
|
Core Earnings |
|
$ |
24,787 |
|
|
$ |
94,369 |
|
|
$ |
69,951 |
|
|
Weighted-Average Common Shares Outstanding, Basic and Diluted(2) |
|
|
60,796,636 |
|
|
|
54,194,596 |
|
|
|
41,406,026 |
|
|
Core Earnings per Common Share, Basic and Diluted(2) |
|
$ |
0.41 |
|
|
$ |
1.74 |
|
|
$ |
1.69 |
|
|
(1) |
Represents GAAP net income attributable to our common and Class A common stockholders. |
|
(2) |
Share and per share data reflect the impact of the common stock and Class A common stock dividend which was paid upon completion of the Company’s initial public offering on July 25, 2017 to holders of record as of July 3, 2017. See Note 12 to the Consolidated Financial Statements included in this Form 10-K for details. |
Book Value Per Common Share
The following table sets forth the calculation of our book value per share (in thousands, except share and per share data):
|
|
|
December 31, 2017 |
|
|
December 31, 2016 |
|
||
|
Total Stockholders’ Equity |
|
$ |
1,201,331 |
|
|
$ |
970,689 |
|
|
Preferred Stock |
|
|
125 |
|
|
|
125 |
|
|
Stockholders’ Equity, Net of Preferred Stock |
|
$ |
1,201,206 |
|
|
$ |
970,564 |
|
|
Number of Common Shares Outstanding at Period End(1)(2) |
|
|
60,618,730 |
|
|
|
48,446,028 |
|
|
Book Value per Common Share(2) |
|
$ |
19.82 |
|
|
$ |
20.03 |
|
|
(1) |
Includes shares of common and Class A common stock. |
65
Investment Portfolio Overview
Loan Portfolio
During the three months ended December 31, 2017, we originated seven loans with a total loan commitment amount of approximately $494.58 million, of which $451.77 million was funded at origination. Other loan fundings included $86.97 million of deferred fundings related to previously originated loan commitments. Proceeds from loan repayments during the three months ended December 31, 2017 totaled $182.66 million. We generated interest income of $52.5 million, incurred interest expense of $21.7 million, and generated net interest income of $30.8 million.
For the year ended December 31, 2017, we originated 22 loans with a total loan commitment amount of approximately $1.95 billion, of which $1.61 billion was funded at origination. Other loan fundings included $313.16 million of deferred fundings related to previously originated loan commitments. Proceeds from loan repayments and sales during the year ended December 31, 2017 were $1.13 billion and $65.21 million, respectively, totaling $1.2 billion. We generated interest income of $198.9 million, incurred interest expense of $78.3 million, and generated net interest income of $120.6 million.
The following table details our loan activity by unpaid principal balance (dollars in thousands):
|
|
|
Three Months Ended |
|
|
Year Ended |
|
||
|
|
|
December 31, 2017 |
|
|
December 31, 2017 |
|
||
|
Loan originations— initial funding |
|
$ |
451,765 |
|
|
$ |
1,614,406 |
|
|
Other loan fundings(1) |
|
|
86,973 |
|
|
|
313,160 |
|
|
Loan repayments |
|
|
(182,659 |
) |
|
|
(1,129,805 |
) |
|
Loan sales(2) |
|
|
— |
|
|
|
(65,206 |
) |
|
Total net fundings (repayments) |
|
$ |
356,079 |
|
|
$ |
732,555 |
|
|
(1) |
Additional fundings made under existing loan commitments. |
|
(2) |
In certain instances, we create structural leverage through the co-origination or non-recourse syndication of a senior loan interest to a third party. In either case, the senior mortgage loan (i.e., the non-consolidated senior interest) is not included on our balance sheet. When we create structural leverage through the co-origination or non-recourse syndication of a senior loan interest to a third party, we retain on our balance sheet a mezzanine loan. For the year ended December 31, 2017, such amounts include $53.0 million from two non-consolidated senior interests. See “—Investment Portfolio Financing—Non-Consolidated Senior Interests” for additional information. Additionally, loan sales for the year ended December 31, 2017 include $12.2 million from the sale of two loan participation interests by our subsidiary, TPG RE Finance Trust CLO Issuer, L.P. (the “CLO Issuer”). |
66
The following table details overall statistics for our loan portfolio as of December 31, 2017 (dollars in thousands):
|
|
|
|
|
|
|
Total Loan Exposure(1) |
|
|||||||||
|
|
|
Balance Sheet Portfolio |
|
|
Total Loan Portfolio |
|
|
Floating Rate Loans |
|
|
Fixed Rate Loans |
|
||||
|
Number of loans |
|
|
57 |
|
|
|
60 |
|
|
|
59 |
|
|
|
1 |
|
|
% of portfolio (by unpaid principal balance) |
|
|
100.0 |
% |
|
|
100.0 |
% |
|
|
99.9 |
% |
|
|
0.1 |
% |
|
Total loan commitment |
|
$ |
3,727,156 |
|
|
$ |
3,862,656 |
|
|
$ |
3,860,016 |
|
|
$ |
2,640 |
|
|
Unpaid principal balance |
|
$ |
3,198,116 |
|
|
$ |
3,198,116 |
|
|
$ |
3,195,476 |
|
|
$ |
2,640 |
|
|
Unfunded loan commitments(2) |
|
$ |
529,040 |
|
|
$ |
529,040 |
|
|
$ |
529,040 |
|
|
$ |
— |
|
|
Carrying value |
|
$ |
3,175,672 |
|
|
$ |
3,175,672 |
|
|
$ |
3,173,236 |
|
|
$ |
2,436 |
|
|
Weighted average credit spread(3) |
|
|
4.8 |
% |
|
|
4.8 |
% |
|
|
4.8 |
% |
|
|
5.6 |
% |
|
Weighted average all-in yield(3) |
|
|
6.5 |
% |
|
|
6.5 |
% |
|
|
6.5 |
% |
|
|
7.9 |
% |
|
Weighted average term to extended maturity (in years)(4) |
|
|
3.6 |
|
|
|
3.6 |
|
|
|
3.6 |
|
|
|
2.7 |
|
|
Weighted average LTV(5) |
|
|
58.7 |
% |
|
|
58.7 |
% |
|
|
58.6 |
% |
|
|
84.2 |
% |
|
(1) |
In certain instances, we create structural leverage through the co-origination or non-recourse syndication of a senior loan interest to a third party. In either case, the senior mortgage loan (i.e., the non-consolidated senior interest) is not included on our balance sheet. When we create structural leverage through the co-origination or non-recourse syndication of a senior loan interest to a third party, we retain on our balance sheet a mezzanine loan. Total loan commitment encompasses the entire loan portfolio we originated, acquired and financed, including $135.5 million of such non-consolidated senior interests sold or co-originated in three loans that are not included in our balance sheet portfolio. See “—Investment Portfolio Financing—Non-Consolidated Senior Interests” for additional information. |
|
(2) |
Unfunded loan commitments may be funded over the term of each loan, subject in certain cases to an expiration date or a force-funding date, primarily to finance development, property improvements or lease-related expenditures by our borrowers, and in some instances to finance operating deficits during renovation and lease-up. |
|
(3) |
As of December 31, 2017, our floating rate loans were indexed to LIBOR. In addition to credit spread, all-in yield includes the amortization of deferred origination fees, purchase price premium and discount, loan origination costs and accrual of both extension and exit fees. Credit spread and all-in yield for the total portfolio assumes the applicable floating benchmark rate as of December 31, 2017 for weighted average calculations. |
|
(4) |
Extended maturity assumes all extension options are exercised by the borrower; provided, however, that our loans may be repaid prior to such date. As of December 31, 2017, based on the unpaid principal balance of our total loan exposure, 67.2% of our loans were subject to yield maintenance or other prepayment restrictions and 32.8% were open to repayment by the borrower without penalty. |
|
(5) |
LTV is calculated as the total outstanding principal balance of the loan or participation interest in a loan plus any financing that is pari passu with or senior to such loan or participation interest as of December 31, 2017, divided by the applicable as-is real estate value at the time of origination or acquisition of such loan or participation interest in a loan. The as-is real estate value reflects our Manager’s estimates, at the time of origination or acquisition of a loan or participation interest in a loan, of the real estate value underlying such loan or participation interest, determined in accordance with our Manager’s underwriting standards and consistent with third-party appraisals obtained by our Manager. |
See Note 17 to the Consolidated Financial Statements included in this Form 10-K for details about our mortgage loan originations subsequent to December 31, 2017.
67
We may invest in CMBS, or CMBS-related, assets as part of our investment strategy, primarily as a short-term cash management tool. Our current CMBS Portfolio consists of five fixed rate securities whose underlying collateral is United States treasury bonds or first mortgage loans secured by multifamily or healthcare related properties. The underlying real estate collateral is located across the United States, primarily in Texas, California, and Florida with no state representing more than 11% of an investment’s par value. At December 31, 2017, there were no floating rate securities in our CMBS Portfolio. The following table details overall statistics for our CMBS portfolio as of December 31, 2017 (dollars in thousands):
|
|
|
CMBS Portfolio |
|
|
|
Number of securities |
|
|
5 |
|
|
Fixed rate securities |
|
|
5 |
|
|
% of portfolio |
|
|
100 |
% |
|
Par value |
|
$ |
86,314 |
|
|
Face amount(1) |
|
$ |
85,661 |
|
|
Weighted average coupon(2) |
|
|
3.7 |
% |
|
Weighted average yield to final maturity(2) |
|
|
3.1 |
% |
|
Weighted average life (in years) |
|
|
2.4 |
|
|
Weighted average principal repayment window (in years) |
|
|
4.6 |
|
|
Final maturity (in years) |
|
|
16.3 |
|
|
Ratings range(3) |
|
Unrated to AAA |
|
|
|
(1) |
Amounts disclosed are before giving effect to unamortized purchase price premium and discount and unrealized gains or losses. |
|
(2) |
Weighted by market value as of December 31, 2017. |
|
(3) |
Ratings range includes one structured finance investment that is unrated. This three year structured finance investment is 100% collateralized by multifamily mortgage loans underwritten by the Federal Home Loan Mortgage Corporation (“FHLMC”), which loans are slated for near term securitization by FHLMC. Upon the contractual maturity of the structured finance investment, FHLMC is required to purchase all of the performing mortgage loans at par. Currently, all of the underlying mortgage loans are performing. The four other CMBS investments are rated AA+ through AAA. |
Asset Management
We proactively manage the assets in our portfolio from closing to final repayment. We are party to an agreement with Situs Asset Management, LLC (“Situs”), one of the largest commercial mortgage loan servicers, pursuant to which Situs provides us with dedicated asset management employees for performing asset management services pursuant to our proprietary guidelines. Following the closing of an investment, this dedicated asset management team rigorously monitors the investment under our Manager’s oversight, with an emphasis on ongoing financial, legal and quantitative analyses. Through the final repayment of an investment, the asset management team maintains regular contact with borrowers, servicers and local market experts monitoring performance of the collateral, anticipating borrower, property and market issues, and enforcing our rights and remedies when appropriate.
Our Manager reviews our entire loan portfolio quarterly, undertakes an assessment of the performance of each loan, and assigns it a risk rating between “1” and “5,” from least risk to greatest risk, respectively. See Notes 2 and 3 to our Consolidated Financial Statements included in this Form 10-K for a discussion regarding the risk rating system that we use in connection with our portfolio. The following table allocates the carrying value of our loan portfolio as of December 31, 2017 and 2016 based on our internal risk ratings (dollars in thousands):
|
|
|
December 31, 2017 |
|
|
December 31, 2016 |
|
||||||||||
|
Risk Rating |
|
Carrying Value |
|
|
Number of Loans |
|
|
Carrying Value |
|
|
Number of Loans |
|
||||
|
1 |
|
|
— |
|
|
|
— |
|
|
|
261,261 |
|
|
|
3 |
|
|
2 |
|
|
1,318,816 |
|
|
|
22 |
|
|
|
745,340 |
|
|
|
17 |
|
|
3 |
|
|
1,680,913 |
|
|
|
29 |
|
|
|
1,205,994 |
|
|
|
33 |
|
|
4 |
|
|
175,943 |
|
|
|
6 |
|
|
|
237,395 |
|
|
|
4 |
|
|
5 |
|
|
— |
|
|
|
— |
|
|
|
— |
|
|
|
— |
|
|
|
|
$ |
3,175,672 |
|
|
|
57 |
|
|
$ |
2,449,990 |
|
|
|
57 |
|
68
The weighted average risk rating of our total loan exposure based on unpaid principal balance was 2.6 as of both December 31, 2017 and December 31, 2016.
Investment Portfolio Financing
Our portfolio financing arrangements during the year ended December 31, 2017 and December 31, 2016 included secured revolving repurchase facilities, a senior secured credit facility, a private, bi-lateral portfolio financing with a single investor structured as a collateralized loan obligation (“CLO”), asset-specific financings and non-consolidated senior interests.
The following table details our portfolio financing outstanding principal balances (dollars in thousands):
|
|
|
Portfolio Financing Outstanding Principal Balance |
|
|||||
|
|
|
December 31, 2017 |
|
|
December 31, 2016 |
|
||
|
Secured revolving repurchase facilities |
|
$ |
1,835,801 |
|
|
$ |
1,021,529 |
|
|
Senior secured credit facility |
|
|
— |
|
|
|
— |
|
|
CLO financing |
|
|
— |
|
|
|
543,320 |
|
|
Asset-specific financings |
|
|
289,487 |
|
|
|
111,382 |
|
|
Total indebtedness(1) |
|
$ |
2,125,288 |
|
|
$ |
1,676,231 |
|
|
(1) |
Excludes deferred financing costs of $10.3 million and $13.6 million as of December 31, 2017 and December 31, 2016, respectively. |
Secured Revolving Repurchase Facilities
As of December 31, 2017, aggregate borrowings outstanding under our secured revolving repurchase facilities totaled $1.8 billion, with a weighted average interest rate of LIBOR plus 2.2% per annum, a weighted average all-in cost of credit, including associated fees and expenses, of LIBOR plus 2.6% per annum, and a weighted average advance rate of 74.1%. As of December 31, 2017, outstanding borrowings under these facilities had a weighted average term to extended maturity (assuming we have exercised all extension options and term out provisions) of 2.6 years. The Morgan Stanley secured revolving repurchase facility has an initial maturity date of May 4, 2019 and can be extended for additional successive one year periods, subject to approval by the lender. The number of extension options is not limited by the terms of this facility.
At December 31, 2017 and December 31, 2016, the Company had two secured revolving repurchase facilities to finance its CMBS investing activities. Credit spreads vary depending upon the CMBS and advance rate. Assets pledged at December 31, 2017 and December 31, 2016 consisted of three and three mortgage-backed securities, respectively. These facilities are 100% recourse to Holdco. The agreements include various covenants covering net worth, liquidity, recourse limitations, and debt coverage, as further discussed below. The Company believes it is in compliance with all covenants as of December 31, 2017 and December 31, 2016.
The following tables detail our secured revolving repurchase facilities as of December 31, 2017 (dollars in thousands):
|
Lender |
|
Facility Commitment(1) |
|
|
Collateral UPB |
|
|
Advance Rate |
|
|
Approved Borrowings |
|
|
Outstanding Balance |
|
|
Undrawn Capacity(3) |
|
|
Available Capacity(2) |
|
|
Interest Rate |
|
Extended Maturity(4) |
|
|||||||
|
Goldman Sachs |
|
$ |
750,000 |
|
|
$ |
890,736 |
|
|
|
71.8 |
% |
|
$ |
636,639 |
|
|
$ |
566,747 |
|
|
$ |
69,892 |
|
|
$ |
113,361 |
|
|
L+2.2% |
|
8/19/2019 |
|
|
Wells Fargo |
|
|
750,000 |
|
|
|
814,886 |
|
|
|
75.1 |
|
|
|
606,386 |
|
|
|
517,538 |
|
|
|
88,848 |
|
|
|
143,614 |
|
|
L+2.1% |
|
5/25/2021 |
|
|
JP Morgan |
|
|
376,942 |
|
|
|
382,135 |
|
|
|
71.3 |
|
|
|
269,627 |
|
|
|
256,928 |
|
|
|
12,699 |
|
|
|
107,315 |
|
|
L+2.5% |
|
8/20/2020 |
|
|
Morgan Stanley |
|
|
500,000 |
|
|
|
533,707 |
|
|
|
75.7 |
|
|
|
403,155 |
|
|
|
379,998 |
|
|
|
23,157 |
|
|
|
96,845 |
|
|
L+2.4% |
|
N/A |
|
|
US Bank |
|
|
150,000 |
|
|
|
93,000 |
|
|
|
77.1 |
|
|
|
71,400 |
|
|
|
71,400 |
|
|
|
— |
|
|
|
78,600 |
|
|
L+2.0% |
|
12/9/2022 |
|
|
Subtotal/Weighted Average—Loans |
|
$ |
2,526,942 |
|
|
$ |
2,714,464 |
|
|
|
73.7 |
% |
|
$ |
1,987,207 |
|
|
$ |
1,792,611 |
|
|
$ |
194,596 |
|
|
$ |
539,735 |
|
|
L+2.2% |
|
|
|
|
Royal Bank of Canada |
|
|
100,000 |
|
|
|
8,418 |
|
|
|
90.0 |
|
|
|
7,805 |
|
|
|
7,805 |
|
|
|
— |
|
|
|
92,195 |
|
|
L+1.0% |
|
3/20/2018 |
(5) |
|
Goldman Sachs |
|
|
100,000 |
|
|
|
39,332 |
|
|
|
90.0 |
|
|
|
35,385 |
|
|
|
35,385 |
|
|
|
— |
|
|
|
64,615 |
|
|
L+0.1% |
|
3/2/2018 |
(5) |
|
Subtotal/Weighted Average—CMBS |
|
$ |
200,000 |
|
|
$ |
47,750 |
|
|
|
90.0 |
% |
|
$ |
43,190 |
|
|
$ |
43,190 |
|
|
$ |
— |
|
|
$ |
156,810 |
|
|
L+0.3% |
|
|
|
|
Total/Weighted Average |
|
$ |
2,726,942 |
|
|
$ |
2,762,214 |
|
|
|
74.1 |
% |
|
$ |
2,030,397 |
|
|
$ |
1,835,801 |
|
|
$ |
194,596 |
|
|
$ |
696,545 |
|
|
L+2.2% |
|
|
|
|
(1) |
Facility commitment represents the largest amount of borrowings available under a given facility once sufficient collateral assets have been approved by the lender and pledged by us. |
69
|
(2) |
Represents the facility commitment less the approved borrowings which amount is available to be borrowed provided we pledge and the lender approves additional collateral assets. |
|
(3) |
Undrawn capacity represents the positive difference between the borrowing amount approved by the lender against collateral assets pledged by us and the amount actually drawn against those collateral assets. In the case of asset-specific financings, our ability to draw the undrawn capacity is conditioned upon satisfaction by our borrower of conditions precedent to a funding on the underlying loan pledged as collateral, and by our pro rata funding with equity of the remaining future funding obligation. Amounts designated as undrawn capacity under our asset specific financings may only be used to satisfy our future funding obligations on the respective underlying pledged loan. |
|
(4) |
Our ability to extend our secured revolving repurchase facilities to the dates shown above is subject to satisfaction of certain conditions. Even if extended, our lenders retain sole discretion to determine whether to accept pledged collateral, and the advance rate and credit spread applicable to each borrowing thereunder. |
|
(5) |
Extended Maturity represents the sooner of the next maturity date of the CMBS repurchase agreement, or roll over date for the applicable underlying trade confirmation, subsequent to December 31, 2017. |
The following table details our secured revolving repurchase facilities as of December 31, 2016 (dollars in thousands):
|
Lender |
|
Facility Commitment(1) |
|
|
Collateral UPB |
|
|
Advance Rate |
|
|
Approved Borrowings |
|
|
Outstanding Balance |
|
|
Undrawn Capacity(3) |
|
|
Available Capacity(2) |
|
|
Interest Rate |
|
Extended Maturity(4) |
|
|||||||
|
Goldman Sachs |
|
$ |
500,000 |
|
|
$ |
363,146 |
|
|
|
69.5 |
% |
|
$ |
250,890 |
|
|
$ |
250,890 |
|
|
|
— |
|
|
$ |
249,110 |
|
|
L+2.2% |
|
8/19/2019 |
|
|
Wells Fargo |
|
|
500,000 |
|
|
|
461,618 |
|
|
|
71.4 |
|
|
|
320,271 |
|
|
|
320,271 |
|
|
|
— |
|
|
|
179,729 |
|
|
L+2.2% |
|
5/25/2021 |
|
|
JP Morgan |
|
|
313,750 |
|
|
|
414,269 |
|
|
|
69.9 |
|
|
|
289,188 |
|
|
|
288,749 |
|
|
|
439 |
|
|
|
24,562 |
|
|
L+2.7% |
|
8/20/2020 |
|
|
Morgan Stanley |
|
|
250,000 |
|
|
|
175,884 |
|
|
|
72.1 |
|
|
|
126,569 |
|
|
|
125,964 |
|
|
|
605 |
|
|
|
123,431 |
|
|
L+2.5% |
|
N/A |
|
|
Subtotal/Weighted Average—Loans |
|
$ |
1,563,750 |
|
|
$ |
1,414,917 |
|
|
|
70.6 |
% |
|
$ |
986,918 |
|
|
$ |
985,874 |
|
|
$ |
1,044 |
|
|
$ |
576,832 |
|
|
L+2.4% |
|
|
|
|
Royal Bank of Canada |
|
|
100,000 |
|
|
|
9,347 |
|
|
|
90.0 |
|
|
|
8,850 |
|
|
|
8,850 |
|
|
|
— |
|
|
|
91,150 |
|
|
L+1.0% |
|
2/15/2021 |
|
|
Goldman Sachs |
|
|
100,000 |
|
|
|
43,500 |
|
|
|
90.0 |
|
|
|
26,805 |
|
|
|
26,805 |
|
|
|
— |
|
|
|
73,195 |
|
|
L+2.0% |
|
2/10/2021 |
|
|
Subtotal/Weighted Average—CMBS |
|
$ |
200,000 |
|
|
$ |
52,847 |
|
|
|
90.0 |
% |
|
$ |
35,655 |
|
|
$ |
35,655 |
|
|
$ |
— |
|
|
$ |
164,345 |
|
|
L+1.7% |
|
|
|
|
Total/Weighted Average |
|
$ |
1,763,750 |
|
|
$ |
1,467,764 |
|
|
|
71.3 |
% |
|
$ |
1,022,573 |
|
|
$ |
1,021,529 |
|
|
$ |
1,044 |
|
|
$ |
741,177 |
|
|
L+2.4% |
|
|
|
|
(1) |
Facility commitment represents the largest amount of borrowings available under a given facility once sufficient collateral assets have been approved by the lender and pledged by us. |
|
(2) |
Represents the facility commitment less the approved borrowings which amount is available to be borrowed provided we pledge and the lender approves additional collateral assets. |
|
(3) |
Undrawn capacity represents the positive difference between the borrowing amount approved by the lender against collateral assets pledged by us and the amount actually drawn against those collateral assets. In the case of asset-specific financings, our ability to draw the undrawn capacity is conditioned upon satisfaction by our borrower of conditions precedent to a funding on the underlying loan pledged as collateral, and by our pro rata funding with equity of the remaining future funding obligation. Amounts designated as undrawn capacity under our asset specific financings may only be used to satisfy our future funding obligations on the respective underlying pledged loan. |
|
(4) |
Our ability to extend our secured revolving repurchase facilities to the dates shown above is subject to satisfaction of certain conditions. Even if extended, our lenders retain sole discretion to determine whether to accept pledged collateral, and the advance rate and credit spread applicable to each borrowing thereunder. |
During the year ended December 31, 2017 and December 31, 2016, the Company entered into one and two additional secured revolving repurchase facilities, respectively, to finance its lending activities. Credit spreads vary depending on property type and advance rate. Assets pledged are mortgage loans collateralized by commercial properties.
On August 18, 2017, and in connection with the repayment of the Class A Note and the termination of the collateralized loan obligation (as discussed below under “- Private Collateralized Loan Obligation”), the Company closed an amendment to its existing secured revolving repurchase facility with JPMorgan Chase Bank, N.A. to increase the maximum facility amount by $103.5 million, to $417.3 million, and to include as pledged collateral under the facility the seven first mortgage loan participation interests purchased from the CLO Issuer by one of our wholly-owned subsidiaries on August 18, 2017. With respect only to the upsize amount, amounts borrowed may not be repaid and reborrowed. All other material terms of the credit facility remain unchanged.
On July 21, 2017, the Company closed an amendment to its existing secured revolving repurchase facility with Morgan Stanley Bank, N.A. to increase the maximum facility amount to $400 million from $250 million. Additionally, the Company has the right to further upsize the facility to $500 million from $400 million upon at least five days’ notice, subject to customary conditions. The facility was also amended to provide for an extended maturity in May 2020 and can be extended by the Company for additional successive one year periods, subject to approval by the lender. As was the case prior to the amendment, the number of extension options is not limited by the terms of this facility. On December 27, 2017 the Company exercised its right to upsize the facility.
70
On June 12, 2017, the Company closed an amendment to its existing secured revolving repurchase facility with Goldman Sachs Bank USA, to increase the maximum facility amount to $750 million from $500 million. The current extended maturity of this facility is August 2019.
On June 8, 2017, the Company closed an amendment to its existing secured revolving repurchase facility with Wells Fargo Bank, National Association to increase the maximum facility amount to $750 million from $500 million. The current extended maturity of this facility is May 2021.
Borrowings under our secured revolving repurchase facilities are subject to the initial approval of eligible collateral loans (or CMBS, depending on the facility) by the lender. The maximum advance rate and pricing rate of individual advances are determined with reference to the attributes of the respective collateral.
The maximum and average month end balances for our secured revolving repurchase facilities during the year ended December 31, 2017 are as follows (dollars in thousands):
|
|
|
Year Ended December 31, 2017 |
|
|||||||||
|
|
|
Carrying Value |
|
|
Maximum Month End Balance |
|
|
Average Month End Balance |
|
|||
|
JP Morgan |
|
$ |
256,928 |
|
|
$ |
288,750 |
|
|
$ |
233,365 |
|
|
Goldman Sachs |
|
|
566,747 |
|
|
|
566,747 |
|
|
|
403,344 |
|
|
Wells Fargo |
|
|
517,538 |
|
|
|
547,735 |
|
|
|
371,335 |
|
|
Morgan Stanley |
|
|
379,998 |
|
|
|
379,998 |
|
|
|
237,574 |
|
|
US Bank |
|
|
71,400 |
|
|
|
71,400 |
|
|
|
25,900 |
|
|
Subtotal / Averages - Loans(1) |
|
$ |
1,792,611 |
|
|
$ |
1,792,611 |
|
|
$ |
1,271,518 |
|
|
Royal Bank of Canada |
|
|
7,805 |
|
|
|
57,832 |
|
|
|
17,484 |
|
|
Goldman Sachs |
|
|
35,385 |
|
|
|
63,103 |
|
|
|
38,906 |
|
|
Subtotal / Averages - CMBS(1) |
|
$ |
43,190 |
|
|
$ |
102,509 |
|
|
$ |
56,390 |
|
|
Total / Averages - Loans and CMBS(1) |
|
$ |
1,835,801 |
|
|
$ |
1,835,801 |
|
|
$ |
1,327,908 |
|
|
(1) |
The maximum month end balance subtotal and total represents the maximum outstanding borrowings on all secured revolving repurchase facilities at a month end during the year ended December 31, 2017. |
In connection with each facility, Holdco executed a guarantee agreement in favor of the counterparty pursuant to which Holdco guarantees the obligations of our subsidiary that is the borrower under the facility for customary “bad-boy events.” Also in connection with each facility, Holdco executed an indemnity in favor of the counterparty pursuant to which Holdco indemnifies the counterparty against actual losses incurred as a result of “bad boy events” on the part of our subsidiary that is the borrower.
We conduct substantially all of our operations and own substantially all of our assets through our holding company subsidiary, Holdco. Holdco has guaranteed repayment of 25% of the principal amount borrowed and other payment obligations under each of our secured revolving repurchase facilities secured by loans and 100% of the principal amount borrowed and other payment obligations under each of our secured revolving repurchase facilities secured by CMBS.
We use secured revolving repurchase facilities to finance certain of our originations or acquisitions of our target assets, which may be accepted by a respective secured revolving repurchase facility lender as collateral. Once we identify an asset and the asset is approved by the secured revolving repurchase facility lender to serve as collateral (which lender’s approval is in its sole discretion), we and the lender may enter into a transaction whereby the lender advances to us a percentage of the value of the asset, which is referred to as the “advance rate,” as the purchase price for such transaction with an obligation of ours to repurchase the asset from the lender for an amount equal to the purchase price for the transaction plus a price differential, which is calculated based on an interest rate. For each transaction, we and the lender agree to a trade confirmation which sets forth, among other things, the purchase price, the maximum advance rate, the interest rate, the market value of the loan asset and any future funding obligations which are contemplated with respect to the specific transaction and/or the underlying loan asset. For loan assets which involve future funding obligations of ours, the repurchase transaction may provide for the repurchase lender to fund portions (for example, pro rata per the maximum advance rate of the related repurchase transaction) of such future funding obligations. Generally, our secured revolving repurchase facilities allow for revolving balances, which allow us to voluntarily repay balances and draw again on existing available credit. The primary obligor on each secured revolving repurchase facility is a separate special purpose subsidiary of ours which
71
is restricted from conducting activity other than activity related to the utilization of its secured revolving repurchase facility. As additional credit support, our holding company subsidiary, Holdco, provides certain guarantees of the obligations of its subsidiaries. The liability of Holdco under the guarantees related to our secured revolving repurchase facilities secured by CMBS is in an amount equal to 100% of the outstanding obligations of the special purpose subsidiary which is the primary obligor under the related facility. The liability of Holdco under the guarantees related to our secured revolving repurchase facilities secured by loans is generally capped at 25% of the outstanding obligations of the special purpose subsidiary which is the primary obligor under the related facility. However, such liability cap under the guarantees related to our secured revolving repurchase facilities secured by loans does not apply in the event of certain “bad boy” defaults which can trigger recourse to Holdco for losses or the entire outstanding obligations of the borrower depending on the nature of the “bad boy” default in question. Examples of such “bad boy” defaults include, without limitation, fraud, intentional misrepresentation, willful misconduct, incurrence of additional debt in violation of financing documents, and the filing of a voluntary or collusive involuntary bankruptcy or insolvency proceeding of the special purpose entity subsidiary or the guarantor entity.
Each of the secured revolving repurchase facilities involves “margin maintenance” provisions, which are designed to allow the repurchase lender to maintain a certain margin of credit enhancement against the loan assets which serve as collateral. The lender’s margin amount is typically based on a percentage of the market value of the loan asset and/or mortgaged property collateral; however, certain secured revolving repurchase facilities may also involve margin maintenance based on maintenance of a minimum debt yield with respect to the cash flow from the underlying real estate collateral. Market value determinations and redeterminations may be made by the repurchase lender in its sole discretion subject to any specified parameters regarding the repurchase lender’s determination, which may involve the limitation or enumeration of factors which the repurchase lender may consider when determining market value.
At December 31, 2017, the weighted average haircut (which is equal to one minus the advance rate percentage against collateral for our secured revolving repurchase facilities taken as a whole) was 25.9%, as compared to 28.7% at December 31, 2016.
Generally, when the repurchase lender’s margin amount has fallen below the outstanding purchase price for a transaction, a margin deficit exists and the repurchase lender may require that we prepay outstanding amounts on the secured revolving repurchase facility to eliminate such margin deficit. In certain secured revolving repurchase facilities, the repurchase lender’s ability to make a margin call is further limited by certain prerequisites, such as the existence of enumerated “credit events” or that the margin deficit exceed a specified minimum threshold.
The secured revolving repurchase facilities also include cash management features which generally require that income from collateral loan assets be deposited in a lender-controlled account and be disbursed in accordance with a specified waterfall of payments designed to keep facility-related obligations current before such income is disbursed for our own account. The cash management features generally require the trapping of cash in such controlled account if an uncured default remains outstanding. Furthermore, some secured revolving repurchase facilities may require an accelerated principal amortization schedule if the secured revolving repurchase facility is in its final extended term.
Notwithstanding that a loan asset may be subject to a financing arrangement and serve as collateral under a secured revolving repurchase facility, we are generally granted the right to administer and service the loan and interact directly with the underlying obligors and sponsors of our loan assets so long as there is no default under the secured revolving repurchase facility and so long as we do not engage in certain material modifications (including amendments, waivers, exercises of remedies, or releases of obligors and collateral, among other things) of the loan assets without the repurchase lender’s prior consent.
72
The secured revolving repurchase facilities include customary affirmative and negative covenants for similar secured revolving repurchase facilities, including, but not limited to, reporting requirements, collateral diversity requirements and/or concentration limits, and certain operational restrictions. In addition, each secured revolving repurchase facility requires that the guarantor (Holdco) maintain compliance with financial covenants, including the following:
|
|
• |
maintenance of minimum cash liquidity (which includes available borrowing capacity) of no less than $50 million; |
|
|
• |
maintenance of minimum unrestricted cash of no less than the greater of $12 million and 5.0% of the guarantor’s recourse indebtedness; |
|
|
• |
maintenance of minimum tangible net worth of at least 75% of the net cash proceeds of all prior equity issuances plus 75% of the net cash proceeds of all subsequent equity issuances; |
|
|
• |
maintenance of a debt to equity ratio not to exceed 3.0x to 1.0x; and |
|
|
• |
maintenance of a minimum interest coverage ratio (EBITDA to interest expense) of no less than 1.5x to 1.0x. |
From time to time, the financial covenants in each of our secured revolving repurchase facilities may be amended.
Senior Secured Credit Facility
On September 29, 2017, we entered into a senior secured credit facility agreement with Bank of America N.A. that has a maximum facility amount of $250 million, which may increase from time to time, up to $500 million, at our request and agreement by the lender. We have not drawn on the facility. The current extended maturity of this facility is September 2022.
Asset-Specific Financings
At December 31, 2017 and December 31, 2016, we had outstanding seven and four loan investments financed with three and two separate counterparties, respectively, as asset-specific financings. In instances where we have multiple asset-specific financings with the same lender, the financings are not cross-collateralized.
The following table details statistics for our asset-specific financings at December 31, 2017 (dollars in thousands):
|
Lender |
|
Count |
|
Commitments |
|
|
Principal Balance |
|
|
Undrawn Capacity(1) |
|
|
Carrying Value |
|
|
Weighted Average Interest Rate(2) |
|
Extended Maturity(3) |
||||
|
Deutsche Bank |
|
|
|
|
|
|
|
|
|
|
|
|
|
|
|
|
|
|
|
|
|
|
|
Collateral assets |
|
3 |
|
$ |
245,115 |
|
|
$ |
190,587 |
|
|
N/A |
|
|
$ |
189,994 |
|
|
L+6.57% |
|
11/23/19 |
|
|
Financing provided |
|
3 |
|
|
156,965 |
|
|
|
122,847 |
|
|
|
34,119 |
|
|
|
122,433 |
|
|
L+3.49% |
|
11/23/19 |
|
Bank of the Ozarks |
|
|
|
|
|
|
|
|
|
|
|
|
|
|
|
|
|
|
|
|
|
|
|
Collateral assets |
|
3 |
|
|
305,000 |
|
|
|
195,065 |
|
|
N/A |
|
|
|
194,147 |
|
|
L+7.15% |
|
04/18/20 |
|
|
Financing provided |
|
3 |
|
|
209,750 |
|
|
|
134,140 |
|
|
|
75,610 |
|
|
|
133,224 |
|
|
L+4.36% |
|
04/18/20 |
|
BMO Harris |
|
|
|
|
|
|
|
|
|
|
|
|
|
|
|
|
|
|
|
|
|
|
|
Collateral asset |
|
1 |
|
|
45,000 |
|
|
|
45,000 |
|
|
N/A |
|
|
|
44,665 |
|
|
L+5.25% |
|
04/09/22 |
|
|
Financing provided |
|
1 |
|
|
32,500 |
|
|
|
32,500 |
|
|
|
— |
|
|
|
32,266 |
|
|
L+2.65% |
|
04/09/22 |
|
Totals |
|
|
|
|
|
|
|
|
|
|
|
|
|
|
|
|
|
|
|
|
|
|
|
Collateral Assets |
|
7 |
|
$ |
595,115 |
|
|
$ |
430,652 |
|
|
N/A |
|
|
$ |
428,806 |
|
|
L+6.69% |
|
|
|
|
Financing Provided |
|
7 |
|
$ |
399,215 |
|
|
$ |
289,487 |
|
|
$ |
109,729 |
|
|
$ |
287,923 |
|
|
L+3.80% |
|
|
|
(1) |
Undrawn capacity represents the positive difference between the borrowing amount approved by the lender against collateral assets pledged by us and the amount actually drawn against those collateral assets. In the case of asset-specific financings, our ability to draw the undrawn capacity is conditioned upon satisfaction by our borrower of conditions precedent to a funding on the underlying loan pledged as collateral, and by our pro rata funding with equity of the remaining future funding obligation. Amounts designated as undrawn capacity under our asset specific financings may only be used to satisfy our future funding obligations on the respective underlying pledged loan. |
73
|
(3) |
For each of the Collateral Assets, extended maturity is determined based on the maximum maturity of each of the corresponding loans, assuming all extension options are exercised by the borrower; provided, however, that our loans may be repaid prior to such date. |
The following table details our asset-specific financings at December 31, 2016 (dollars in thousands):
|
Lender |
|
Count |
|
Commitments |
|
|
Principal Balance |
|
|
Undrawn Capacity(1) |
|
|
Carrying Value |
|
|
Weighted Average Interest Rate(2) |
|
Extended Maturity(3) |
||||
|
Deutsche Bank |
|
|
|
|
|
|
|
|
|
|
|
|
|
|
|
|
|
|
|
|
|
|
|
Collateral Assets |
|
3 |
|
$ |
245,115 |
|
|
$ |
141,232 |
|
|
|
N/A |
|
|
$ |
139,912 |
|
|
L+6.52% |
|
12/17/2019 |
|
Financing Provided |
|
3 |
|
|
156,966 |
|
|
|
91,526 |
|
|
|
65,440 |
|
|
|
90,488 |
|
|
L+3.50% |
|
12/17/2019 |
|
Bank of the Ozarks |
|
|
|
|
|
|
|
|
|
|
|
|
|
|
|
|
|
|
|
|
|
|
|
Collateral Asset |
|
1 |
|
|
132,000 |
|
|
|
28,366 |
|
|
|
N/A |
|
|
|
27,203 |
|
|
L+7.50% |
|
8/23/2021 |
|
Financing Provided |
|
1 |
|
|
92,400 |
|
|
|
19,856 |
|
|
|
72,544 |
|
|
|
18,812 |
|
|
L+4.50% |
|
8/23/2021 |
|
Totals |
|
|
|
|
|
|
|
|
|
|
|
|
|
|
|
|
|
|
|
|
|
|
|
Collateral Assets |
|
4 |
|
$ |
377,115 |
|
|
$ |
169,598 |
|
|
|
N/A |
|
|
$ |
167,115 |
|
|
L+6.68% |
|
|
|
Financing Provided |
|
4 |
|
$ |
249,366 |
|
|
$ |
111,382 |
|
|
$ |
137,984 |
|
|
$ |
109,300 |
|
|
L+3.68% |
|
|
|
(1) |
Undrawn capacity represents the positive difference between the borrowing amount approved by the lender against collateral assets pledged by us and the amount actually drawn against those collateral assets. In the case of asset-specific financings, our ability to draw the undrawn capacity is conditioned upon satisfaction by our borrower of conditions precedent to a funding on the underlying loan pledged as collateral, and by our pro rata funding with equity of the remaining future funding obligation. Amounts designated as undrawn capacity under our asset specific financings may only be used to satisfy our future funding obligations on the respective underlying pledged loan. |
|
(2) |
All of these floating rate loans and related liabilities are indexed to LIBOR. |
|
(3) |
For each of the Collateral Assets, extended maturity is determined based on the maximum maturity of each of the corresponding loans, assuming all extension options are exercised by the borrower; provided, however, that our loans may be repaid prior to such date. |
In connection with the Deutsche Bank and Bank of the Ozarks asset-specific financings, Holdco has provided funding guarantees under which Holdco guarantees in limited circumstances the funding obligations of the special purpose lending entity. In addition, under the Deutsche Bank and Bank of the Ozarks asset-specific financings, Holdco has delivered limited non-recourse carve-out guarantees in favor of the lenders as additional credit support for the financings. These guarantees trigger recourse to Holdco as a result of certain “bad boy” defaults for actual losses incurred by such party, or the entire outstanding obligations of the financing borrower, depending on the nature of the “bad boy” default.
In connection with the BMO Harris asset-specific financing, Holdco has delivered a payment guarantee in favor of the lender as additional credit support for the financing. The liability of Holdco under this guarantee is generally capped at 25% of the outstanding obligations of the special purpose subsidiary which is the primary obligor under the financing. In addition, Holdco has delivered a non-recourse carveout guarantee, which can trigger recourse to Holdco as a result of certain “bad boy” defaults for losses incurred by BMO Harris or the entire outstanding obligations of the financing borrower, depending on the nature of the “bad boy” default.
Examples of “bad boy” defaults under the Deutsche Bank, Bank of the Ozarks and BMO Harris asset-specific financings include, without limitation: fraud; intentional misrepresentation; willful misconduct; incurrence of additional debt in violation of financing documents; and the filing of a voluntary or collusive involuntary bankruptcy or insolvency proceeding of the special purpose entity subsidiary or the guarantor entity. The guarantee agreements for each of the asset-specific financings also contain financial covenants covering liquid assets and net worth requirements.
Private Collateralized Loan Obligation
In December 2014, we acquired a controlling interest in a portfolio of 55 commercial real estate loans representing $1.9 billion of unpaid principal balance from German American Capital Corporation (“GACC”), and financed it with a note issued by the CLO Issuer. The financing was structured as a non-recourse CLO. CLO Issuer
74
issued a Class A note with an original principal balance of $1.4 billion due September 10, 2023 to Deutsche Bank A.G., New York branch, which is an affiliate of GACC. Our Manager served as the collateral manager for the CLO and was entitled to receive collateral management fees for such services.
On August 16, 2017, the outstanding principal balance of the Class A Note issued by the CLO Issuer was approximately $118.0 million. On August 16, 2017, the CLO Issuer sold to GACC two first mortgage loan participation interests with an aggregate unpaid principal balance of $12.8 million that collateralized in part the Class A Note issued by the CLO Issuer and recognized a $0.2 million loss on sale in Other Income, net. The sales price of the two first mortgage loans was approximately par value. These loans were sold because they were determined by our management to no longer be consistent with the Company’s current investment strategy.
On August 18, 2017, one of the Company’s wholly-owned subsidiaries purchased from the CLO Issuer seven first mortgage loan participation interests with an aggregate unpaid principal balance of $138.5 million that collateralized the remainder of the Class A Note issued by the CLO Issuer. The first mortgage loan participation interests were sold by the CLO Issuer for approximately par value. On August 23, 2017, proceeds from both transactions were used in combination with approximately $3.0 million of Company cash to retire all amounts outstanding under the Class A Note issued by the CLO Issuer, which totaled $118.0 million. The collateralized loan obligation was subsequently terminated.
Non-Consolidated Senior Interests
In certain instances, we create structural leverage through the co-origination or non-recourse syndication of a senior loan interest to a third party. In either case, the senior mortgage loan (i.e., the non-consolidated senior interest) is not included on our balance sheet. When we create structural leverage through the co-origination or non-recourse syndication of a senior loan interest to a third party, we retain on our balance sheet a mezzanine loan.
The following table details the subordinate interests retained on our balance sheet based on the total loan we financed through the use of non-consolidated senior interests sold or co-originated as of December 31, 2017 (dollars in thousands):
|
Non-Consolidated Senior Interests |
|
Count |
|
|
Principal Balance |
|
|
Carrying Value |
|
|
Interest Rate(1) |
|
Guarantee |
|
|
Weighted Average Term to Extended Maturity(2) |
||||
|
Senior loans sold or co-originated |
|
|
3 |
|
|
$ |
96,443 |
|
|
N/A |
|
|
L+2.6% |
|
|
N/A |
|
|
11/7/2020 |
|
|
Retained mezzanine loans |
|
|
3 |
|
|
$ |
53,000 |
|
|
$ |
52,760 |
|
|
L+11.8% |
|
|
N/A |
|
|
3/14/2021 |
|
Total loans |
|
|
3 |
|
|
$ |
149,443 |
|
|
N/A |
|
|
L+5.9% |
|
|
N/A |
|
|
12/22/2020 |
|
|
(1) |
Our loan and the non-consolidated senior interest sold or co-originated are indexed to LIBOR. |
|
(2) |
Weighted average term to extended maturity assumes all extension options are exercised by the borrowers; provided, however, that our loans may be repaid prior to such date. |
Debt-to-Equity Ratio and Total Leverage Ratio
The following table presents our debt-to-equity ratio and total leverage ratio:
|
|
|
December 31, 2017 |
|
|
December 31, 2016 |
|
||
|
Debt-to-equity ratio(1) |
|
|
1.71 |
x |
|
|
1.62 |
x |
|
Total leverage ratio(2) |
|
|
1.82 |
x |
|
|
1.67 |
x |
|
(1) |
Represents (i) total outstanding borrowings under secured debt agreements (collateralized loan obligation, net), secured financing/repurchase agreements (net) and notes payable (net), less cash, to (ii) total stockholders’ equity, at period end. |
|
(2) |
Represents (i) total outstanding borrowings under secured debt agreements (collateralized loan obligation, net), secured financing/repurchase agreements (net) and notes payable (net) plus non-consolidated senior interests sold or co-originated (if any), less cash, to (ii) total stockholders’ equity, at period end. |
75
Our business model seeks to minimize our exposure to changing interest rates by match-indexing our assets using the same, or similar, benchmark indices, typically LIBOR, as well as durations. Accordingly, rising interest rates will generally increase our net interest income, while declining interest rates will generally decrease our net interest income. As of December 31, 2017, 99.9% of our loans by unpaid principal balance earned a floating rate of interest and were financed with liabilities that require interest payments based on floating rates, which resulted in approximately $1.1 billion of net floating rate exposure that is positively correlated to rising interest rates, subject to the impact of interest rate floors on certain of our floating rate loans. As of December 31, 2017, the remaining 0.1% of our loans by unpaid principal balance earned a fixed rate of interest, but were financed with liabilities that require interest payments based on floating rates, which results in a negative correlation to rising interest rates to the extent of our amount of fixed rate financing. Due to the short remaining term to maturity and the small percentage of our loan portfolio represented by fixed rate loans, we have elected not to employ interest rate derivatives (interest rate swaps, caps, collars or swaptions) to limit our exposure to increases in interest rates on such liabilities, but we may do so in the future.
Our liabilities are generally index-matched to each collateral asset, resulting in a net exposure to movements in benchmark rates that vary based on the relative proportion of floating rate assets and liabilities. The following table details our portfolio’s net floating rate exposure as of December 31, 2017 and December 31, 2016 (dollars in thousands):
|
|
|
Year Ended December 31, |
|
|||||
|
|
|
2017 |
|
|
2016 |
|
||
|
Floating rate assets(1) |
|
$ |
3,195,476 |
|
|
$ |
2,390,238 |
|
|
Floating rate debt(1)(2) |
|
|
(2,125,288 |
) |
|
|
(1,676,231 |
) |
|
Net floating rate exposure |
|
$ |
1,070,188 |
|
|
$ |
714,007 |
|
|
(1) |
Our floating rate loans and related liabilities are indexed to LIBOR. Therefore, the net exposure to the benchmark rate is in direct proportion to our assets also indexed to that rate. |
|
(2) |
Includes borrowings under secured revolving repurchase facilities and asset-specific financings. |
76
Interest-Earning Assets and Interest-Bearing Liabilities
The following table presents the average balance of interest-earning assets and related interest-bearing liabilities, associated interest income and expense, and financing costs and the corresponding weighted average yields for the years ended December 31, 2017 and December 31, 2016 (dollars in thousands):
|
|
|
Year Ended December 31, |
|
|||||||||||||||||||||
|
|
|
2017 |
|
|
2016 |
|
||||||||||||||||||
|
|
|
Average Carrying Value(1) |
|
|
Interest Income/ Expense |
|
|
Wtd. Avg. Yield/ Financing Cost(2) |
|
|
Average Carrying Value(1) |
|
|
Interest Income/ Expense |
|
|
Wtd. Avg. Yield/ Financing Cost(2) |
|
||||||
|
Core Interest-earning assets: |
|
|
|
|
|
|
|
|
|
|
|
|
|
|
|
|
|
|
|
|
|
|
|
|
|
First mortgage loans |
|
$ |
2,586,862 |
|
|
$ |
184,203 |
|
|
|
7.1 |
% |
|
$ |
2,281,489 |
|
|
$ |
147,990 |
|
|
|
6.5 |
% |
|
Retained mezzanine loans |
|
|
63,454 |
|
|
|
7,440 |
|
|
|
11.7 |
% |
|
|
33,820 |
|
|
|
3,093 |
|
|
|
9.1 |
% |
|
CMBS |
|
|
104,689 |
|
|
|
7,260 |
|
|
|
6.9 |
% |
|
|
44,248 |
|
|
|
2,548 |
|
|
|
5.8 |
% |
|
Core interest-earning assets |
|
$ |
2,755,005 |
|
|
$ |
198,903 |
|
|
|
7.2 |
% |
|
$ |
2,359,557 |
|
|
$ |
153,631 |
|
|
|
6.5 |
% |
|
|
|
|
|
|
|
|
|
|
|
|
|
|
|
|
|
|
|
|
|
|
|
|
|
|
|
Interest-bearing liabilities: |
|
|
|
|
|
|
|
|
|
|
|
|
|
|
|
|
|
|
|
|
|
|
|
|
|
Asset-specific financing |
|
$ |
225,620 |
|
|
$ |
13,005 |
|
|
|
5.8 |
% |
|
$ |
76,881 |
|
|
$ |
4,633 |
|
|
|
6.0 |
% |
|
Secured revolving repurchase agreements |
|
|
1,327,919 |
|
|
|
51,799 |
|
|
|
3.9 |
% |
|
|
695,995 |
|
|
|
22,698 |
|
|
|
3.3 |
% |
|
CLO |
|
|
235,143 |
|
|
|
11,993 |
|
|
|
5.1 |
% |
|
|
820,007 |
|
|
|
32,102 |
|
|
|
3.9 |
% |
|
Subscription secured facility(3) |
|
|
13,750 |
|
|
|
1,360 |
|
|
|
9.9 |
% |
|
|
46,017 |
|
|
|
2,216 |
|
|
|
4.8 |
% |
|
Senior secured credit facility |
|
|
— |
|
|
|
111 |
|
|
|
— |
|
|
|
— |
|
|
|
— |
|
|
|
— |
|
|
Total interest-bearing liabilities |
|
$ |
1,802,432 |
|
|
$ |
78,268 |
|
|
|
4.3 |
% |
|
$ |
1,638,900 |
|
|
$ |
61,649 |
|
|
|
3.8 |
% |
|
Net interest income(4) |
|
|
|
|
|
$ |
120,635 |
|
|
|
|
|
|
|
|
|
|
$ |
91,982 |
|
|
|
|
|
|
|
|
|
|
|
|
|
|
|
|
|
|
|
|
|
|
|
|
|
|
|
|
|
|
|
|
Other Interest-earning assets: |
|
|
|
|
|
|
|
|
|
|
|
|
|
|
|
|
|
|
|
|
|
|
|
|
|
Cash equivalents |
|
$ |
113,027 |
|
|
$ |
749 |
|
|
|
0.7 |
% |
|
$ |
58,900 |
|
|
$ |
22 |
|
|
|
— |
|
|
Accounts receivable from servicer/trustee |
|
|
34,617 |
|
|
|
12 |
|
|
|
— |
|
|
|
35,794 |
|
|
|
14 |
|
|
|
— |
|
|
Total interest-earning assets |
|
$ |
2,902,649 |
|
|
$ |
199,664 |
|
|
|
6.9 |
% |
|
$ |
2,454,251 |
|
|
$ |
153,667 |
|
|
|
6.3 |
% |
|
(1) |
Based on carrying value for loans, amortized cost for securities and carrying value for debt. Calculated as the average of month-end balances. |
|
(2) |
Weighted average yield or financing cost calculated based on annualized interest income or expense divided by average carrying value. |
|
(3) |
Weighted average yield for the period ended December 31, 2017 reflects significant borrowings that were repaid prior to March 31, 2017. |
|
(4) |
Represents interest income on core interest-earning assets less interest expense on total interest-bearing liabilities. |
77
Operating Results
The following table sets forth information regarding our consolidated results of operations (dollars in thousands, except per share data):
|
|
|
Year Ended December 31, |
|
|
Variance |
|
|
Year Ended December 31, |
|
|
Variance |
|
||||||||||||
|
|
|
2017 |
|
|
2016 |
|
|
2017 vs 2016 |
|
|
2016 |
|
|
2015 |
|
|
2016 vs 2015 |
|
||||||
|
INTEREST INCOME |
|
|
|
|
|
|
|
|
|
|
|
|
|
|
|
|
|
|
|
|
|
|
|
|
|
Interest Income |
|
$ |
198,903 |
|
|
$ |
153,631 |
|
|
$ |
45,272 |
|
|
$ |
153,631 |
|
|
$ |
128,647 |
|
|
$ |
24,984 |
|
|
Interest Expense |
|
|
(78,268 |
) |
|
|
(61,649 |
) |
|
|
(16,619 |
) |
|
|
(61,649 |
) |
|
|
(47,564 |
) |
|
|
(14,085 |
) |
|
Net Interest Income |
|
|
120,635 |
|
|
|
91,982 |
|
|
|
28,653 |
|
|
|
91,982 |
|
|
|
81,083 |
|
|
|
10,899 |
|
|
OTHER REVENUE |
|
|
|
|
|
|
|
|
|
|
|
|
|
|
|
|
|
|
|
|
|
|
|
|
|
Other Income, net |
|
|
1,697 |
|
|
|
416 |
|
|
|
1,281 |
|
|
|
416 |
|
|
|
54 |
|
|
|
362 |
|
|
Total Other Revenue |
|
|
1,697 |
|
|
|
416 |
|
|
|
1,281 |
|
|
|
416 |
|
|
|
54 |
|
|
|
362 |
|
|
OTHER EXPENSES |
|
|
|
|
|
|
|
|
|
|
|
|
|
|
|
|
|
|
|
|
|
|
|
|
|
Professional Fees |
|
|
3,132 |
|
|
|
3,260 |
|
|
|
(128 |
) |
|
|
3,260 |
|
|
|
5,224 |
|
|
|
(1,964 |
) |
|
General and Administrative |
|
|
2,975 |
|
|
|
2,199 |
|
|
|
776 |
|
|
|
2,199 |
|
|
|
784 |
|
|
|
1,415 |
|
|
Servicing and Asset Management Fees |
|
|
3,068 |
|
|
|
3,625 |
|
|
|
(557 |
) |
|
|
3,625 |
|
|
|
4,011 |
|
|
|
(386 |
) |
|
Management Fees |
|
|
14,096 |
|
|
|
8,816 |
|
|
|
5,280 |
|
|
|
8,816 |
|
|
|
6,902 |
|
|
|
1,914 |
|
|
Collateral Management Fee |
|
|
225 |
|
|
|
849 |
|
|
|
(624 |
) |
|
|
849 |
|
|
|
1,257 |
|
|
|
(408 |
) |
|
Incentive Management Fee |
|
|
4,338 |
|
|
|
3,687 |
|
|
|
651 |
|
|
|
3,687 |
|
|
|
1,992 |
|
|
|
1,695 |
|
|
Total Other Expenses |
|
|
27,834 |
|
|
|
22,436 |
|
|
|
5,398 |
|
|
|
22,436 |
|
|
|
20,170 |
|
|
|
2,266 |
|
|
Income Before Income Taxes |
|
$ |
94,498 |
|
|
$ |
69,962 |
|
|
$ |
24,536 |
|
|
$ |
69,962 |
|
|
$ |
60,967 |
|
|
$ |
8,995 |
|
|
Income Taxes |
|
|
(146 |
) |
|
|
5 |
|
|
|
(151 |
) |
|
|
5 |
|
|
|
(1,612 |
) |
|
|
1,617 |
|
|
Net Income |
|
$ |
94,352 |
|
|
$ |
69,967 |
|
|
$ |
24,385 |
|
|
$ |
69,967 |
|
|
$ |
59,355 |
|
|
$ |
10,612 |
|
|
Preferred Stock Dividends |
|
|
(16 |
) |
|
|
(16 |
) |
|
|
— |
|
|
|
(16 |
) |
|
|
(15 |
) |
|
|
(1 |
) |
|
Net Income Attributable to Common Stockholders(1) |
|
|
94,336 |
|
|
$ |
69,951 |
|
|
$ |
24,385 |
|
|
$ |
69,951 |
|
|
$ |
59,340 |
|
|
$ |
10,611 |
|
|
Basic and Diluted Earnings per Common Share(2) |
|
$ |
1.74 |
|
|
$ |
1.69 |
|
|
$ |
0.05 |
|
|
$ |
1.69 |
|
|
$ |
1.81 |
|
|
$ |
(0.12 |
) |
|
Dividends Declared per Common Share(2) |
|
$ |
1.56 |
|
|
$ |
1.62 |
|
|
$ |
(0.06 |
) |
|
$ |
1.62 |
|
|
$ |
1.91 |
|
|
$ |
(0.29 |
) |
|
OTHER COMPREHENSIVE INCOME |
|
|
|
|
|
|
|
|
|
|
|
|
|
|
|
|
|
|
|
|
|
|
|
|
|
Unrealized (Loss) Gain on Commercial Mortgage-Backed Securities |
|
$ |
(1,284 |
) |
|
$ |
1,250 |
|
|
$ |
(2,534 |
) |
|
$ |
1,250 |
|
|
$ |
— |
|
|
$ |
1,250 |
|
|
Comprehensive Income |
|
$ |
93,068 |
|
|
$ |
71,217 |
|
|
$ |
21,851 |
|
|
$ |
71,217 |
|
|
$ |
59,355 |
|
|
$ |
11,862 |
|
|
(1) |
Represents net income attributable to holders of our common stock and Class A common stock. |
|
(2) |
Share and per share data reflect the impact of the common stock and Class A common stock dividend which was paid upon completion of the Company’s initial public offering on July 25, 2017 to holders of record as of July 3, 2017. See Note 12 to the Consolidated Financial Statements included in this Form 10-K for details. |
78
Comparison of the Years Ended December 31, 2017 and 2016
Net Interest Income
Net interest income increased $28.7 million, to $120.6 million, during the year ended December 31, 2017 compared to the year ended December 31, 2016. The increase was due primarily to loan portfolio growth of $727.0 million and a higher average LIBOR on the underlying loans. The increase in interest income was partially offset by an increase in interest expense due to increased borrowings of $992.5 million to fund loan portfolio growth and a higher average borrowing rate, due to an increase in LIBOR, during the year ended December 31, 2017 as compared to the year ended December 31, 2016.
Other Revenue
Other revenue is comprised of net gain/loss on the sale of certain loans and CMBS investments, interest income earned on certain cash collection accounts, and miscellaneous fee income. Other revenue increased by $1.3 million during the year ended December 31, 2017 compared to the year ended December 31, 2016. The change in other revenue was partially due to higher cash balances during the year ended December 31, 2017. Additionally, we recognized a gain on sale related to our CMBS investments of $0.3 million and a $0.1 million increase in miscellaneous fee income as compared to the year ended December 31, 2016.
Other Expenses
Other expenses are comprised of professional fees, general and administrative expenses, servicing and asset management fees, management fees payable to our Manager, and collateral management fees. Due primarily to increased operating costs as a public company and increased fees payable to our Manager as a result of our initial public offering and the calculation of such fees in our new Management Agreement, we expect these expenses to continue to increase following the completion of our initial public offering. Our general and administrative expenses are higher as a public company than when private due to investor relations and SEC reporting costs, increased accounting fees, NYSE costs, regulatory compliance, and other items required of a public company.
Other expenses increased by $4.7 million for the year ended December 31, 2017 compared to the year ended December 31, 2016. The increase in other expenses for the year ended December 31, 2017 was primarily due to: (i) an increase in management fees payable to our Manager of $5.3 million due to growth in the Company’s quarterly common stockholder’s equity base of $211.6 million due to our IPO and growth in Core Earnings and (ii) a net increase of general and administrative expenses and professional fees of $0.6 million as a result of our continued growth in size and the complexities of being a public company. These increases were partially offset by a decrease in servicing and asset management fees and collateral management fees of $1.2 million primarily as a result of terminating our CLO during the year ended December 31, 2017.
See Note 10 to our Consolidated Financial Statements included in this Form 10-K for details regarding our Management Agreement and the revisions made in connection with the initial public offering.
Incentive Compensation
The incentive compensation earned by our Manager increased by $0.7 million for the year ended December 31, 2017 compared to the year ended December 31, 2016. The change in incentive compensation to our Manager was primarily a result of the Management Agreement revisions in connection with the completion of our IPO, growth in the Company’s quarterly common stockholder’s equity base of $211.6 million due to our IPO and growth in Core Earnings during the year ended December 31, 2017.
See Note 10 to our Consolidated Financial Statements included in this Form 10-K for details regarding our Management Agreement and the revisions made in connection with the IPO.
Dividends Declared Per Share
During the year ended December 31, 2017, we declared dividends of $1.56 per share, or $85.0 million. During the year ended December 31, 2016, we declared dividends of $1.62 per share, or $66.9 million. The per share
79
decrease was primarily due to an increase of shares outstanding of our common stock and Class A common stock of 21.1 million shares resulting from our IPO and stock dividend completed during the year ended December 31, 2017.
Unrealized (Loss) Gain on CMBS
Other comprehensive (loss) income decreased $2.5 million during the year ended December 31, 2017 compared to the year ended December 31, 2016. The decrease is primarily related to the sale of a CMBS investment in the year ended December 31, 2017 and fair value fluctuations related to our remaining CMBS investments from 2016.
Comparison of the Years Ended December 31, 2016 and 2015
Net Interest Income
Net interest income increased $10.9 million during the year ended December 31, 2016 compared to the year ended December 31, 2015. The increase was due primarily to interest income arising from the growth in our loan portfolio of $542.8 million, net. The weighted average credit spread of our loan portfolio declined year-over-year to 5.1% from 5.9% due to the repayment of older vintage loans. The interest income increase was partially offset by additional interest expense incurred on our secured debt agreements due primarily to an increase of $296.6 million in borrowings at year-end, offset by a year-over-year decline in the weighted average credit spread of our borrowings to 2.6% from 2.7%.
Other Revenue
Other revenue is comprised of net gain/loss on the sale of certain loans and interest income earned on certain cash collection accounts. Other revenue increased by $0.4 million during the year ended December 31, 2016 compared to the year ended December 31, 2015.
Other Expenses
Other expenses increased by $2.3 million during the year ended December 31, 2016 compared to the year ended December 31, 2015 primarily due to: (i) an increase of $1.9 million in management fees payable to our Manager, reflecting an increased equity basis on which management fees are calculated due to the issuance of $250 million of stock during the year ended December 31, 2016; and (ii) an increase of $1.4 million of general and administrative expenses due to growth in our size and operations. These increases were partially offset by: (i) a decrease of $2.0 million in professional fees; (ii) a decrease of $0.4 million in loan servicing and asset management fees due to cost savings in a new contract with our dedicated servicing and asset management provider; and (iii) a decrease of $0.4 million in collateral management fees due to a $600.6 million decline in the CLO’s asset base as a result of underlying loan repayments. The incentive compensation earned by our Manager increased by $1.7 million during the year ended December 31, 2016 compared to the year ended December 31, 2015, primarily as a result of an increase in the amount by which Core Earnings exceeded the performance hurdle.
See Note 10 to our Consolidated Financial Statements included in this Form 10-K for details regarding our Management Agreement and the revisions made in connection with the initial public offering.
Dividends Declared Per Share
During the year ended December 31, 2016, we declared dividends of $1.62 per share, or $66.9 million. During the year ended December 31, 2015, we declared dividends of $1.91 per share, or $64.2 million. The per share decrease was due to the dilution resulting from the issuance of 4,061,738 shares in April 2016 as a result of $100 million in capital called, and 6,072,874 shares in October 2016 as a result of $150 million in capital called.
Unrealized (Loss) Gain on CMBS
During the year ended December 31, 2016, we recognized $1.3 million of net gains on our holdings of CMBS due to favorable changes in interest rates and credit spreads that occurred since the investments were acquired. No such gains or losses were recognized during the year ended December 31, 2015 as one CMBS investment was acquired at the end of 2015.
80
Liquidity and Capital Resources
Capitalization
We have capitalized our business to date through, among other things, the issuance and sale of shares of our common stock, borrowings under notes payable, secured revolving repurchase agreements, the sale of non-consolidated senior interests, a private collateralized loan obligation, and a subscription secured credit facility. As of December 31, 2017, we had outstanding 60.6 million shares of our common stock and Class A common stock representing $1.2 billion of stockholders’ equity, and $2.1 billion of outstanding borrowings used to finance our operations.
See Notes 5 and 6 to our Consolidated Financial Statements included in this Form 10-K for additional details regarding our borrowings under notes payable, secured revolving repurchase agreements, a private collateralized loan obligation, and a subscription secured credit facility.
Sources of Liquidity
Our primary sources of liquidity include cash and cash equivalents, accounts receivable from our servicers from loan repayments of our net loans held for investment, available borrowings under notes payable, secured revolving repurchase facilities, a senior secured credit facility, the sale of non-consolidated senior interests, a private collateralized loan obligation, and a subscription secured facility, which are set forth in the following table (dollars in thousands):
|
|
|
December 31, 2017 |
|
|
December 31, 2016 |
|
||
|
Cash and cash equivalents |
|
$ |
75,037 |
|
|
$ |
103,126 |
|
|
Secured revolving repurchase facilities (undrawn capacity) |
|
|
194,596 |
|
|
|
1,044 |
|
|
Senior secured credit facility |
|
|
— |
|
|
|
— |
|
|
Collateralized loan obligation financing |
|
|
— |
|
|
|
39,193 |
|
|
Asset-specific financing |
|
|
109,728 |
|
|
|
137,984 |
|
|
Revolving credit facility-capital commitments |
|
|
— |
|
|
|
109,142 |
|
|
Total |
|
$ |
379,361 |
|
|
$ |
390,489 |
|
Our existing loan portfolio also provides us with liquidity as loans are repaid or sold, in whole or in part, and the proceeds from such repayments become available for us to reinvest.
Liquidity Needs
In addition to our ongoing loan activity, our primary liquidity needs include interest and principal payments under our $2.1 billion of outstanding borrowings under notes payable and secured revolving repurchase facilities, $529.0 million of unfunded loan commitments, dividend distributions to our stockholders, and operating expenses.
Contractual Obligations and Commitments
Our contractual obligations and commitments as of December 31, 2017 were as follows (dollars in thousands):
|
|
|
|
|
|
|
Payment Timing |
|
|||||||||||||
|
|
|
Total Obligation |
|
|
Less than 1 Year |
|
|
1 to 3 Years |
|
|
3 to 5 Years |
|
|
More than 5 Years |
|
|||||
|
Unfunded loan commitments(1) |
|
$ |
529,040 |
|
|
$ |
88,374 |
|
|
$ |
413,856 |
|
|
$ |
26,810 |
|
|
$ |
— |
|
|
Secured debt agreements—principal(2) |
|
|
2,125,288 |
|
|
|
1,167,466 |
|
|
|
957,822 |
|
|
|
— |
|
|
|
— |
|
|
Secured debt agreements—interest(2) |
|
|
80,973 |
|
|
|
65,741 |
|
|
|
15,232 |
|
|
|
— |
|
|
|
— |
|
|
Total(3) |
|
$ |
2,735,301 |
|
|
$ |
1,321,581 |
|
|
$ |
1,386,910 |
|
|
$ |
26,810 |
|
|
$ |
— |
|
|
(1) |
The allocation of our loan commitments is based on the earlier of the commitment expiration date and the loan maturity date. |
81
|
amounts borrowed and rates will vary over time. Our floating rate loans and related liabilities are indexed to LIBOR. |
|
(3) |
Total excludes the $135.5 million of non-consolidated senior interests sold or co-originated, as the satisfaction of these interests is not expected to require a cash outlay from us. |
With respect to our debt obligations that are contractually obligated to be paid in the next several years, we plan to employ several strategies to meet these obligations, including: (i) applying repayments from underlying loans to satisfy the debt obligations which they secure; (ii) negotiating extensions of terms with our providers of credit; (iii) periodically accessing the capital markets to raise cash to fund new investments; (iv) the issuance of a structured finance vehicle, such as a CLO, as a method of financing; and/or (v) selling loan assets to generate cash to repay our debt obligations.
We are required to pay our Manager a base management fee, an incentive fee, and reimbursements for certain expenses pursuant to our Management Agreement. The table above does not include the amounts payable to our Manager under our Management Agreement as they are not fixed and determinable. See Note 10 to our consolidated financial statements included in this Form 10-K for additional terms and details of the fees payable under our Management Agreement.
As a REIT, we generally must distribute substantially all of our net taxable income to stockholders in the form of dividends to comply with the REIT provisions of the Internal Revenue Code. Our REIT taxable income does not necessarily equal our net income as calculated in accordance with GAAP or our Core Earnings as described above.
Off-Balance Sheet Arrangements
We have no off-balance sheet arrangements.
Cash Flows
The following table provides a breakdown of the net change in our cash, cash equivalents, and restricted cash (dollars in thousands):
|
|
|
For the years ended December 31, |
|
|||||||||
|
|
|
2017 |
|
|
2016 |
|
|
2015 |
|
|||
|
Cash flows provided by operating activities |
|
$ |
91,173 |
|
|
$ |
85,734 |
|
|
$ |
98,609 |
|
|
Cash flows used in investing activities |
|
|
(702,582 |
) |
|
|
(544,891 |
) |
|
|
(114,773 |
) |
|
Cash flows provided by financing activities |
|
|
583,171 |
|
|
|
457,181 |
|
|
|
110,451 |
|
|
Net increase (decrease) in cash, cash equivalents, and restricted cash |
|
$ |
(28,238 |
) |
|
$ |
(1,976 |
) |
|
$ |
94,287 |
|
We experienced a net decrease in cash, cash equivalents, and restricted cash of $28.2 million for the year ended December 31, 2017, compared to a net decrease of $2.0 million for the year ended December 31, 2016. During the year ended December 31, 2017, cash flows provided by operating activities totaled $91.2 million related primarily to net interest income. During the year ended December 31, 2017, cash flows used in investing activities totaled $702.6 million due primarily to loan originations. During the year ended December 31, 2017, cash flows provided by financing activities totaled $583.2 million due primarily to proceeds from secured financing agreements, the sale of $53.0 million of non-consolidated senior interests, and the completion of our initial public offering. We used the proceeds from our investing and financing activities, including cash provided by principal repayments and sales of loans and debt investments, to originate new loans and acquire CMBS investments of $2.0 billion during the year ended December 31, 2017.
We experienced a net decrease in cash, cash equivalents, and restricted cash of $2.0 million for the year ended December 31, 2016, compared to a net increase of $94.3 million for the year ended December 31, 2015. During 2016, cash flows provided by operating activities totaled $85.7 million related to net earnings of $70.0 million attributable largely to net interest margin and $13.4 million in collections of capitalized accrued interest. During 2016, cash flows used in investing activities totaled $544.9 million, including cash received of $637.3 million from loan principal repayments, $143.8 million from loan sales, and $1.2 million of proceeds from principal repayments from CMBS investments. During 2016, cash flows provided by financing activities totaled $457.2 million, including net borrowings under secured debt agreements of $287.7 million and $250.0 million of net proceeds from issuances of shares of our stock. We used the combined proceeds of our net financing proceeds, equity raised, and cash
82
provided by repayment and sales of debt investments to directly originate $609.0 million, and acquire $339.1 million, of new loans and acquire $59.5 million in principal amount of CMBS.
Corporate Activities
Income Taxes
We made an election to be taxed as a REIT for U.S. federal income tax purposes, commencing with our initial taxable year ended December 31, 2014. We generally must distribute annually at least 90% of our REIT taxable income, subject to certain adjustments and excluding any net capital gain, in order for U.S. federal income tax not to apply to our earnings that we distribute. To the extent that we satisfy this distribution requirement, but distribute less than 100% of our REIT taxable income, we will be subject to U.S. federal income tax on our undistributed REIT taxable income. In addition, we will be subject to a 4% nondeductible excise tax if the actual amount that we pay out to our stockholders in a calendar year is less than a minimum amount specified under U.S. federal tax laws.
Our qualification as a REIT also depends on our ability to meet various other requirements imposed by the Internal Revenue Code, which relate to organizational structure, diversity of stock ownership, and certain restrictions with regard to the nature of our assets and the sources of our income. Even if we qualify as a REIT, we may be subject to certain U.S. federal income and excise taxes and state and local taxes on our income and assets. If we fail to maintain our qualification as a REIT for any taxable year, we may be subject to material penalties as well as federal, state and local income tax on our taxable income at regular corporate rates and we would not be able to qualify as a REIT for the subsequent four full taxable years. We believe we have complied with all REIT requirements since our initial taxable year.
Dividends
On December 19, 2017, we declared a dividend for the fourth quarter of 2017, to holders of record of our common stock and Class A common stock as of December 29, 2017, in the amount of $0.38 per share of common stock and Class A common stock, or $23.1 million in the aggregate, which dividend was paid on January 25, 2018.
Initial Public Offering
On July 25, 2017, we completed our initial public offering in which we sold 11,000,000 shares of our common stock at an initial public offering price of $20.00 per share. The shares offered and sold in the initial public offering were registered under the Securities Act pursuant to our Registration Statement on Form S-11 (File No. 333-217446), which was declared effective by the SEC on July 19, 2017. The aggregate offering price for the shares registered and sold by us was approximately $220 million. The underwriters of the offering were Merrill Lynch, Pierce, Fenner & Smith Incorporated, Citigroup Global Markets Inc., Goldman Sachs & Co. LLC, Wells Fargo Securities, LLC, Deutsche Bank Securities Inc., J.P. Morgan Securities LLC, Morgan Stanley & Co. LLC, Barclays Capital Inc., TPG Capital BD, LLC and JMP Securities LLC.
The initial public offering generated $199.4 million in net proceeds, after deducting underwriting discounts of $13.2 million and offering expenses payable by us of approximately $7.4 million. On August 17, 2017, the underwriters of the Company’s initial public offering partially exercised their option to purchase up to an additional 1,650,000 shares of common stock. On August 22, 2017, the Company issued and sold, and the underwriters purchased, 650,000 shares of common stock for net proceeds of $12.2 million, after deducting underwriting discounts of $0.8 million. TPG Capital BD, LLC, an underwriter in the offering, is an affiliate and received underwriting discounts of approximately $0.6 million. No other offering expenses were paid directly or indirectly to any of our directors or officers (or their associates), persons owning 10 percent or more of our common stock or any other affiliates.
We used the net proceeds from the offering to originate commercial mortgage loans consistent with our investment strategy and investment guidelines.
Articles of Amendment and Restatement
On July 19, 2017, we filed Articles of Amendment and Restatement with the State Department of Assessments and Taxation of Maryland. The Articles of Amendment and Restatement increased our authorized common stock to 300,000,000 shares of common stock and 2,500,000 shares of Class A common stock with $0.001
83
par value per share. Additionally, the Articles of Amendment and Restatement increased our authorized preferred stock to 100,000,000 shares of preferred stock with a $0.001 par value per share.
Stock Dividend
On July 3, 2017, we declared a stock dividend that resulted in the issuance of 9,224,268 shares of our common stock and 230,815 shares of our Class A common stock upon the completion of our initial public offering. The stock dividend was paid on July 25, 2017 to holders of record of our common stock and Class A common stock as of July 3, 2017.
Termination of Pre-IPO Capital Commitments
In connection with the completion of our initial public offering, all of the obligations of certain of our pre-IPO stockholders to purchase additional shares of our common stock and Class A common stock using the undrawn portion of their capital commitments was terminated.
Termination of Stockholders Agreement
Upon the completion of our initial public offering, the stockholders agreement between us and certain of our pre-IPO stockholders terminated in accordance with its terms.
Critical Accounting Policies
Our discussion and analysis of our financial condition and results of operations is based upon our consolidated financial statements, which have been prepared in accordance with GAAP. The preparation of these financial statements requires our Manager to make estimates and assumptions that affect the reported amounts of assets, liabilities, revenue and expenses, and related disclosure of contingent assets and liabilities. Actual results could differ from these estimates. During 2017, our Manager reviewed and evaluated our critical accounting policies and believes them to be appropriate. The following is a summary of our significant accounting policies that we believe are the most affected by our Manager’s judgments, estimates, and assumptions:
Revenue Recognition
Interest income on loans is accrued using the interest method based on the contractual terms of the loan, adjusted for credit impairment, if any. The objective of the interest method is to arrive at periodic interest income including recognition of fees and costs at a constant effective yield. Premiums, discounts, origination fees and exit fees are amortized or accreted into interest income over the lives of the loans using the interest method, or on a straight line basis when it approximates the interest method. Extension fees are amortized into income on a straight line basis, when it approximates the interest method, or the extension period to which they relate if they can be waived by the Company, or a co-lender, in connection with a loan refinancing. Prepayment penalties from borrowers are recognized as interest income when received. Certain of the Company’s investments may provide for additional interest based on the borrower’s operating cash flow or appreciation of the underlying collateral. Such amounts are considered contingent interest and are reflected as interest income only upon certainty of collection.
The Company considers a loan to be non-performing and places loans on non-accrual status at such time as: (1) management determines the borrower is incapable of, or has ceased efforts toward, curing the cause of a default; (2) the loan becomes 90 days delinquent; or (3) the loan has a maturity default. While on non-accrual status, based on the Company’s judgment as to collectability of principal, loans are either accounted for on a cash basis, where interest income is recognized only upon receipt of cash for principal and interest payments, or on a cost-recovery basis, where all cash receipts reduce a loan’s carrying value, and interest income is only recorded when such carrying value has been fully recovered. For the years ended December 31, 2017 and December 31, 2016, no loans were placed on non-accrual status, and we have sustained no losses or impairments to our loan portfolio.
Loans Held for Investment
Loans that the Company has the intent and ability to hold for the foreseeable future, or until maturity or payoff, are reported at their outstanding principal balances net of any premiums, discounts, loan origination fees and an allowance for loan losses. Loan origination fees and direct loan origination costs are deferred and recognized in
84
interest income over the estimated life of the loans using the interest method, or on a straight line basis when it approximates the interest method, adjusted for actual prepayments.
The Company evaluates each loan classified as a loan held for investment for impairment on a quarterly basis. Impairment occurs when it is deemed probable that the Company will be unable to collect all amounts due according to the contractual terms of the loan. If the loan is considered to be impaired, an allowance is recorded to reduce the carrying value of the loan to the present value of the expected future cash flows discounted at the loan’s contractual effective rate, or the fair value of the collateral, less estimated costs to sell, if recovery of the Company’s investment is expected solely from the sale of the collateral. As part of the quarterly impairment review, we evaluate the risk of each loan and assign a risk rating based on a variety of factors, grouped as follows to include (without limitation): (i) loan and credit structure, including the LTV and structural features; (ii) quality and stability of real estate value and operating cash flow, including debt yield, property type, dynamics of the geographic, property-type and local market, physical condition, stability of cash flow, leasing velocity and quality and diversity of tenancy; (iii) performance against underwritten business plan; and (iv) quality, experience and financial condition of sponsor, borrower and guarantor(s). Based on a 5-point scale, our loans are rated “1” through “5,” from least risk to greatest risk, respectively, which ratings are defined as follows:
|
|
1- |
Outperform—Exceeds performance metrics (for example, technical milestones, occupancy, rents, net operating income) included in original or current credit underwriting and business plan; |
|
|
2- |
Meets or Exceeds Expectations—Collateral performance meets or exceeds substantially all performance metrics included in original or current underwriting / business plan; |
|
|
3- |
Satisfactory—Collateral performance meets or is on track to meet underwriting; business plan is met or can reasonably be achieved; |
|
|
4- |
Underperformance—Collateral performance falls short of original underwriting, and material differences exist from business plan; technical milestones have been missed; defaults may exist, or may soon occur absent material improvement; and |
|
|
5- |
Risk of Impairment/Default—Collateral performance is significantly worse than underwriting; major variance from business plan; loan covenants or technical milestones have been breached; timely exit from loan via sale or refinancing is questionable. |
Since inception, the Company has not recorded asset-specific loan loss reserves, nor has it recognized any impairments on its loan portfolio. Our determination of asset-specific loan loss reserves, should any such reserves be necessary, relies on material estimates regarding the fair value of loan collateral. Such losses could be caused by various factors, including, but not limited to, unanticipated adverse changes in the economy or events adversely affecting specific assets, borrowers, industries in which our borrowers operate or markets in which our borrowers or their properties are located. Significant judgment is required when evaluating loans for impairment.
The Company’s loans are typically collateralized by real estate, or a partnership or similar equity interest in an entity that owns real estate. As a result, the Company regularly evaluates on a loan-by-loan basis the extent and impact of any credit deterioration associated with the performance and/or value of the underlying collateral property as well as the financial and operating capability of the borrower/sponsor. The Company also evaluates the financial strength of loan guarantors, if any, and the borrower’s competency in managing and operating the property or properties. In addition, the Company considers the overall economic environment, real estate sector, and geographic sub-market in which the borrower operates. Such impairment analyses are completed and reviewed by asset management personnel and evaluated by senior management, who utilize various data sources, including (i) periodic financial data such as property occupancy, tenant profile, rental rates, operating expenses, the borrower’s exit plan, and capitalization and discount rates, (ii) site inspections, (iii) sales and financing comparables, (iv) current credit spreads for refinancing and (v) other market data.
Portfolio Financing Arrangements
The Company finances certain loan and CMBS investments using secured revolving repurchase agreements, asset-specific financing arrangements (notes payable on the consolidated balance sheets), a senior secured credit facility, the sale of non-consolidated senior interests, and, prior to August 23, 2017, its private collateralized loan obligation (“CLO”). The related borrowings are recorded as separate liabilities on the Company’s consolidated balance sheets. Interest income earned on the investments and interest expense incurred on the related borrowings are reported separately on the Company’s consolidated statements of income and comprehensive income.
85
In certain instances, the Company creates structural leverage through the co-origination or non-recourse syndication of a senior loan interest to a third party. For all such syndications the Company has completed through December 31, 2017, the Company has transferred 100% of the senior mortgage loan that the Company originated on a non-recourse basis to a third-party lender and has retained as a loan investment a separate mezzanine loan investment secured by a pledge of the equity in the mortgage borrower. With respect to the senior mortgage loan transferred, the Company retains: no control over the mortgage loan; no economic interest in the mortgage loan; and no recourse to the purchaser or the borrower. Consequently, based on these circumstances and because the Company does not have any continuing involvement with the transferred senior mortgage loan, these syndications are accounted for as sales under GAAP and are removed from the Company’s consolidated financial statements at the time of transfer. The Company’s consolidated balance sheets only include the separate mezzanine loan remaining after the transfer and not the non-consolidated senior loan interest sold or co-originated that the Company transferred.
See Note 2 to our consolidated financial statements for a listing and description of our significant accounting policies.
86
The following table provides details with respect to our portfolio, excluding our investments in CMBS, on a loan-by-loan basis as of December 31, 2017 (dollars in millions, except loan per square foot/unit):
|
Loan # |
|
Form of Investment |
|
Origination / Acquisition Date(2) |
|
Total Loan |
|
|
Principal Balance |
|
|
Carrying Value(3) |
|
|
Interest Rate(4) |
|
All-in Yield(5) |
|
|
Fixed / Floating |
|
Extended Maturity(6) |
|
City, State |
|
Property Type |
|
Loan Type |
|
Loan Per Sq.Ft. / Unit |
|
LTV(7) |
|
|
|
Risk Rating(8) |
|
||||||
|
First Mortgage Loans(1) |
|
|
|
|
|
|
|
|
|
|
|
|
|
|
|
|
|
|
|
|
|
|
|
|
|
|
|
|
|
|
|
|
|
|
|
|
|
|
|
|
|
|
|
|
1 |
|
Senior Loan |
|
04/28/17 |
|
$ |
188.0 |
|
|
$ |
142.0 |
|
|
$ |
140.6 |
|
|
L +4.1% |
|
L +4.4% |
|
|
Floating |
|
10/09/21 |
|
Nashville, TN |
|
Mixed Use |
|
Bridge |
|
$292 Sq ft |
|
|
60.7 |
% |
(10) |
|
|
3 |
|
|
|
2 |
|
Senior Loan |
|
10/12/17 |
|
|
180.0 |
|
|
|
165.5 |
|
|
|
163.9 |
|
|
L +3.8% |
|
L +4.0% |
|
|
Floating |
|
11/09/22 |
|
Charlotte, NC |
|
Hotel |
|
Bridge |
|
$257,143 Unit |
|
|
65.5 |
% |
|
|
|
2 |
|
|
|
3 |
|
Senior Loan |
|
09/29/17 |
|
|
173.3 |
|
|
|
147.4 |
|
|
|
145.9 |
|
|
L +4.3% |
|
L +4.6% |
|
|
Floating |
|
10/09/22 |
|
Philadelphia, PA |
|
Office |
|
Moderate Transitional |
|
$213 Sq ft |
|
|
72.2 |
% |
|
|
|
3 |
|
|
|
4 |
|
Senior Loan |
|
12/16/16 |
|
|
164.0 |
|
|
|
122.5 |
|
|
|
121.4 |
|
|
L +4.5% |
|
L +4.7% |
|
|
Floating |
|
01/09/22 |
|
Atlanta, GA |
|
Retail |
|
Bridge |
|
$461 Sq ft |
|
|
47.7 |
% |
|
|
|
4 |
|
|
|
5 |
|
Senior Loan |
|
08/23/16 |
|
|
132.0 |
|
|
|
69.2 |
|
|
|
68.4 |
|
|
L +7.5% |
|
L +7.9% |
|
|
Floating |
|
08/23/21 |
|
Fort Lauderdale, FL |
|
Condominium |
|
Construction |
|
$281 Sq ft |
|
|
19.8 |
% |
|
|
|
2 |
|
|
|
6 |
|
Senior Loan |
|
08/10/17 |
|
|
125.9 |
|
|
|
107.2 |
|
|
|
106.3 |
|
|
L +4.8% |
|
L +5.0% |
|
|
Floating |
|
09/09/22 |
|
Cliffside, NJ |
|
Multifamily |
|
Bridge |
|
$400,828 Unit |
|
|
56.8 |
% |
|
|
|
3 |
|
|
|
7 |
|
Senior Loan |
|
08/22/17 |
|
|
121.6 |
|
|
|
99.1 |
|
|
|
98.4 |
|
|
L +4.4% |
|
L +4.7% |
|
|
Floating |
|
07/26/22 |
|
Houston, TX |
|
Multifamily |
|
Bridge |
|
$425,245 Unit |
|
|
62.5 |
% |
|
|
|
3 |
|
|
|
8 |
|
Senior Loan |
|
09/25/15 |
|
|
108.0 |
|
|
|
81.5 |
|
|
|
81.0 |
|
|
L +7.0% |
|
L +7.3% |
|
|
Floating |
|
09/25/19 |
|
Miami, FL |
|
Condominium |
|
Construction |
|
$253 Sq ft |
|
|
84.7 |
% |
|
|
|
2 |
|
|
|
9 |
|
Senior Loan |
|
07/21/17 |
|
|
106.6 |
|
|
|
90.0 |
|
|
|
89.1 |
|
|
L +4.5% |
|
L +4.8% |
|
|
Floating |
|
08/09/24 |
|
Pittsburgh, PA |
|
Multifamily |
|
Bridge |
|
$296,042 Unit |
|
|
59.4 |
% |
|
|
|
3 |
|
|
|
10 |
|
Senior Loan |
|
08/31/15 |
|
|
98.0 |
|
|
|
77.8 |
|
|
|
77.6 |
|
|
L +6.0% |
|
L +6.2% |
|
|
Floating |
|
08/31/19 |
|
Dallas, TX |
|
Condominium |
|
Construction |
|
$301 Sq ft |
|
|
5.4 |
% |
|
|
|
2 |
|
|
|
11 |
|
Senior Loan |
|
10/16/15 |
|
|
96.4 |
|
|
|
90.5 |
|
|
|
90.2 |
|
|
L +4.8% |
|
L +5.0% |
|
|
Floating |
|
10/16/20 |
|
San Diego, CA |
|
Office |
|
Moderate Transitional |
|
$310 Sq ft |
|
|
73.1 |
% |
|
|
|
3 |
|
|
|
12 |
|
Senior Loan |
|
07/24/17 |
|
|
93.5 |
|
|
|
85.2 |
|
|
|
84.5 |
|
|
L +3.3% |
|
L +3.5% |
|
|
Floating |
|
08/09/22 |
|
Phoenix, AZ |
|
Mixed Use |
|
Bridge |
|
$148 Sq ft |
|
|
64.0 |
% |
|
|
|
2 |
|
|
|
13 |
|
Senior Loan |
|
02/13/17 |
|
|
90.5 |
|
|
|
68.7 |
|
|
|
68.1 |
|
|
L +4.8% |
|
L +5.0% |
|
|
Floating |
|
02/13/22 |
|
Torrance, CA |
|
Office |
|
Moderate Transitional |
|
$247 Sq ft |
|
|
64.4 |
% |
|
|
|
3 |
|
|
|
14 |
|
Senior Loan |
|
10/14/15 |
|
|
90.0 |
|
|
|
87.1 |
|
|
|
86.8 |
|
|
L +3.9% |
|
L +4.2% |
|
|
Floating |
|
10/14/20 |
|
Brooklyn, NY |
|
Mixed Use |
|
Light Transitional |
|
$359 Sq ft |
|
|
58.2 |
% |
|
|
|
2 |
|
|
|
15 |
|
Senior Loan |
|
09/29/17 |
|
|
89.5 |
|
|
|
67.0 |
|
|
|
66.2 |
|
|
L +3.9% |
|
L +4.2% |
|
|
Floating |
|
10/09/22 |
|
Dallas, TX |
|
Office |
|
Moderate Transitional |
|
$106 Sq ft |
|
|
50.7 |
% |
|
|
|
2 |
|
|
|
16 |
|
Senior Loan |
|
02/01/17 |
|
|
85.0 |
|
|
|
76.3 |
|
|
|
75.7 |
|
|
L +4.7% |
|
L +5.0% |
|
|
Floating |
|
02/09/22 |
|
St. Pete Beach, FL |
|
Hotel |
|
Light Transitional |
|
$222,382 Unit |
|
|
60.7 |
% |
|
|
|
3 |
|
|
|
17 |
|
Senior Loan |
|
06/13/17 |
|
|
84.4 |
|
|
|
81.7 |
|
|
|
81.2 |
|
|
L +3.8% |
|
L +4.0% |
|
|
Floating |
|
07/09/22 |
|
Jersey City, NJ |
|
Multifamily |
|
Bridge |
|
$148,330 Unit |
|
|
81.0 |
% |
|
|
|
3 |
|
|
|
18 |
|
Senior Loan |
|
03/16/16 |
|
|
84.2 |
|
|
|
61.4 |
|
|
|
61.0 |
|
|
L +4.8% |
|
L +5.0% |
|
|
Floating |
|
03/16/21 |
|
Herndon, VA |
|
Office |
|
Light Transitional |
|
$138 Sq ft |
|
|
61.1 |
% |
|
|
|
3 |
|
|
|
19 |
|
Senior Loan |
|
12/15/17 |
|
|
79.0 |
|
|
|
79.0 |
|
|
|
78.2 |
|
|
L +5.3% |
|
L +5.6% |
|
|
Floating |
|
01/09/23 |
|
Rochester & Buffalo, NY |
|
Multifamily |
|
Bridge |
|
$57,205 Unit |
|
|
59.6 |
% |
|
|
|
2 |
|
|
|
20 |
|
Senior Loan |
|
06/29/15 |
|
|
76.4 |
|
|
|
48.3 |
|
|
|
48.2 |
|
|
L +6.8% |
|
L +7.3% |
|
|
Floating |
|
06/29/19 |
|
Miami, FL |
|
Condominium |
|
Construction |
|
$257 Sq ft |
|
|
34.7 |
% |
|
|
|
2 |
|
|
|
21 |
|
Senior Loan |
|
05/22/15 |
|
|
75.0 |
|
|
|
48.1 |
|
|
|
48.1 |
|
|
L +8.5% |
|
L +8.8% |
|
|
Floating |
|
05/22/19 |
|
Aspen, CO |
|
Condominium |
|
Construction |
|
$1,090 Sq ft |
|
|
8.1 |
% |
|
|
|
2 |
|
|
|
22 |
|
Senior Loan |
|
12/20/17 |
|
|
67.6 |
|
|
|
40.8 |
|
|
|
40.1 |
|
|
L +4.0% |
|
L +4.3% |
|
|
Floating |
|
01/09/23 |
|
Arlington, VA |
|
Office |
|
Moderate Transitional |
|
$194 Sq ft |
|
|
51.7 |
% |
|
|
|
3 |
|
|
|
23 |
|
Senior Loan |
|
05/25/16 |
|
|
67.0 |
|
|
|
67.0 |
|
|
|
66.5 |
|
|
L +3.7% |
|
L +4.4% |
|
|
Floating |
|
09/09/20 |
|
Manhattan, NY |
|
Hotel |
|
Bridge |
|
$167,920 Unit |
|
|
55.8 |
% |
|
|
|
3 |
|
|
|
24 |
|
Senior Loan |
|
05/25/16 |
|
|
65.0 |
|
|
|
65.0 |
|
|
|
64.2 |
|
|
L +2.3% |
|
L +3.7% |
|
|
Floating |
|
08/09/19 |
|
Sacramento, CA |
|
Office |
|
Bridge |
|
$170 Sq ft |
|
|
55.7 |
% |
|
|
|
2 |
|
|
|
25 |
|
Senior Loan |
|
09/20/17 |
|
|
64.9 |
|
|
|
52.9 |
|
|
|
52.4 |
|
|
L +4.3% |
|
L +4.6% |
|
|
Floating |
|
10/09/22 |
|
Glenview, IL |
|
Multifamily |
|
Light Transitional |
|
$153,428 Unit |
|
|
70.5 |
% |
|
|
|
3 |
|
|
|
26 |
|
Senior Loan |
|
03/01/16 |
|
|
64.2 |
|
|
|
51.5 |
|
|
|
51.3 |
|
|
L +4.9% |
|
L +5.1% |
|
|
Floating |
|
03/01/21 |
|
Long Island City, NY |
|
Office |
|
Moderate Transitional |
|
$289 Sq ft |
|
|
54.1 |
% |
|
|
|
2 |
|
|
|
27 |
|
Senior Loan |
|
11/16/17 |
|
|
63.0 |
|
|
|
63.0 |
|
|
|
62.4 |
|
|
L +3.4% |
|
L +3.6% |
|
|
Floating |
|
12/09/22 |
|
Brooklyn, NY |
|
Multifamily |
|
Bridge |
|
$440,559 Unit |
|
|
69.3 |
% |
|
|
|
3 |
|
|
|
28 |
|
Senior Loan |
|
03/01/16 |
|
|
61.2 |
|
|
|
44.2 |
|
|
|
44.0 |
|
|
L +5.1% |
|
L +5.3% |
|
|
Floating |
|
03/01/21 |
|
Long Island City, NY |
|
Office |
|
Moderate Transitional |
|
$474 Sq ft |
|
|
67.9 |
% |
|
|
|
3 |
|
|
|
29 |
|
Senior Loan |
|
02/19/15 |
|
|
60.8 |
|
|
|
60.8 |
|
|
|
60.8 |
|
|
L +5.9% |
|
L +6.1% |
|
|
Floating |
|
06/09/20 |
|
Pacific Palisades, CA |
|
Condominium |
|
Construction |
|
$456 Sq ft |
|
|
60.5 |
% |
|
|
|
3 |
|
|
|
30 |
|
Senior Loan |
|
06/14/17 |
|
|
60.0 |
|
|
|
60.0 |
|
|
|
59.6 |
|
|
L +3.9% |
|
L +4.3% |
|
|
Floating |
|
07/09/20 |
|
Newark, NJ |
|
Mixed Use |
|
Bridge |
|
$255 Sq ft |
|
|
62.2 |
% |
|
|
|
2 |
|
|
|
31 |
|
Senior Loan |
|
04/20/16 |
|
|
54.5 |
|
|
|
52.4 |
|
|
|
52.2 |
|
|
L +2.8% |
|
L +3.0% |
|
|
Floating |
|
04/20/21 |
|
Minneapolis, MN |
|
Multifamily |
|
Bridge |
|
$153,881 Unit |
|
|
42.6 |
% |
|
|
|
2 |
|
|
|
32 |
|
Senior Loan |
|
12/20/17 |
|
|
51.0 |
|
|
|
51.0 |
|
|
|
50.5 |
|
|
L +4.0% |
|
L +4.3% |
|
|
Floating |
|
01/09/23 |
|
New Orleans, LA |
|
Hotel |
|
Bridge |
|
$217,949 Unit |
|
|
59.9 |
% |
|
|
|
3 |
|
|
|
33 |
|
Senior Loan |
|
05/11/15 |
|
|
49.1 |
|
|
|
46.7 |
|
|
|
46.7 |
|
|
L +5.3% |
|
L +5.4% |
|
|
Floating |
|
12/03/20 |
|
San Francisco, CA |
|
Hotel |
|
Light Transitional |
|
$192,112 Unit |
|
|
76.8 |
% |
|
|
|
3 |
|
|
|
34 |
|
Senior Loan |
|
05/25/16 |
|
|
49.0 |
|
|
|
49.0 |
|
|
|
48.9 |
|
|
L +2.8% |
|
L +3.4% |
|
|
Floating |
|
02/09/20 |
|
Various, Multiple |
|
Hotel |
|
Light Transitional |
|
$64,644 Unit |
|
|
61.4 |
% |
|
|
|
2 |
|
|
|
35 |
|
Senior Loan |
|
09/13/16 |
|
|
48.5 |
|
|
|
46.0 |
|
|
|
45.7 |
|
|
L +4.3% |
|
L +4.5% |
|
|
Floating |
|
09/13/21 |
|
Calistoga, CA |
|
Hotel |
|
Bridge |
|
$544,944 Unit |
|
|
51.4 |
% |
|
|
|
2 |
|
|
|
36 |
|
Senior Loan |
|
03/21/17 |
|
|
45.0 |
|
|
|
45.0 |
|
|
|
44.7 |
|
|
L +5.3% |
|
L +5.5% |
|
|
Floating |
|
04/09/22 |
|
Chicago, IL |
|
Hotel |
|
Bridge |
|
$172,414 Unit |
|
|
60.2 |
% |
|
|
|
3 |
|
|
|
37 |
|
Senior Loan |
|
01/22/16 |
|
|
45.0 |
|
|
|
39.8 |
|
|
|
39.7 |
|
|
L +4.3% |
|
L +4.5% |
|
|
Floating |
|
01/22/21 |
|
New York, NY |
|
Office |
|
Light Transitional |
|
$334 Sq ft |
|
|
71.0 |
% |
|
|
|
3 |
|
|
|
38 |
|
Senior Loan |
|
12/29/14 |
|
|
42.9 |
|
|
|
41.0 |
|
|
|
41.0 |
|
|
L +6.3% |
|
L +5.0% |
|
|
Floating |
|
03/14/19 |
|
Manhattan, NY |
|
Condominium |
|
Construction |
|
$1,271 Sq ft |
|
|
19.9 |
% |
|
|
|
3 |
|
|
|
39 |
|
Senior Loan |
|
09/01/15 |
|
|
37.0 |
|
|
|
37.0 |
|
|
|
36.9 |
|
|
L +4.6% |
|
L +4.9% |
|
|
Floating |
|
09/01/20 |
|
Santa Barbara, CA |
|
Hotel |
|
Bridge |
|
$234,177 Unit |
|
|
67.3 |
% |
|
|
|
3 |
|
|
|
40 |
|
Senior Loan |
|
02/18/16 |
|
|
36.5 |
|
|
|
36.5 |
|
|
|
36.4 |
|
|
L +4.0% |
|
L +4.3% |
|
|
Floating |
|
02/18/21 |
|
Long Island City, NY |
|
Industrial |
|
Bridge |
|
$133 Sq ft |
|
|
75.6 |
% |
|
|
|
2 |
|
|
87
|
Loan # |
|
Form of Investment |
|
Origination / Acquisition Date(2) |
|
Total Loan |
|
|
Principal Balance |
|
|
Carrying Value(3) |
|
|
Interest Rate(4) |
|
All-in Yield(5) |
|
|
Fixed / Floating |
|
Extended Maturity(6) |
|
City, State |
|
Property Type |
|
Loan Type |
|
Loan Per Sq.Ft. / Unit |
|
LTV(7) |
|
|
|
Risk Rating(8) |
|
||||||
|
|
Senior Loan |
|
08/20/15 |
|
|
34.7 |
|
|
|
34.7 |
|
|
|
34.5 |
|
|
L +4.7% |
|
L +4.9% |
|
|
Floating |
|
08/20/20 |
|
Manhattan, NY |
|
Condominium |
|
Bridge |
|
$427 Sq ft |
|
|
70.1 |
% |
|
|
|
2 |
|
||
|
42 |
|
Senior Loan |
|
12/29/14 |
|
|
33.5 |
|
|
|
33.5 |
|
|
|
33.5 |
|
|
L +6.3% |
|
L +6.1% |
|
|
Floating |
|
06/06/18 |
|
Chicago, IL |
|
Hotel |
|
Bridge |
|
$127,060 Unit |
|
|
68.4 |
% |
(11) |
|
|
3 |
|
|
|
43 |
|
Senior Loan |
|
10/11/16 |
|
|
32.0 |
|
|
|
32.0 |
|
|
|
31.8 |
|
|
L +5.9% |
|
L +6.3% |
|
|
Floating |
|
10/11/21 |
|
Chicago, IL |
|
Hotel |
|
Bridge |
|
$148,837 Unit |
|
|
59.8 |
% |
|
|
|
3 |
|
|
|
44 |
|
Senior Loan |
|
10/06/16 |
|
|
30.0 |
|
|
|
30.0 |
|
|
|
29.8 |
|
|
L +5.0% |
|
L +5.3% |
|
|
Floating |
|
10/06/21 |
|
Los Angeles, CA |
|
Industrial |
|
Bridge |
|
$115 Sq ft |
|
|
73.3 |
% |
|
|
|
2 |
|
|
|
45 |
|
Senior Loan |
|
06/08/16 |
|
|
28.4 |
|
|
|
28.4 |
|
|
|
28.2 |
|
|
L +4.6% |
|
L +4.9% |
|
|
Floating |
|
06/08/21 |
|
Woodland Hills, CA |
|
Retail |
|
Moderate Transitional |
|
$401 Sq ft |
|
|
61.7 |
% |
|
|
|
3 |
|
|
|
46 |
|
Senior Loan |
|
11/17/17 |
|
|
28.0 |
|
|
|
28.0 |
|
|
|
27.7 |
|
|
L +5.3% |
|
L +5.6% |
|
|
Floating |
|
12/09/22 |
|
Victor, NY |
|
Multifamily |
|
Bridge |
|
$152,174 Unit |
|
|
71.7 |
% |
|
|
|
2 |
|
|
|
47 |
|
Senior Loan |
|
11/17/17 |
|
|
26.0 |
|
|
|
26.0 |
|
|
|
25.8 |
|
|
L +5.3% |
|
L +5.6% |
|
|
Floating |
|
12/09/22 |
|
Rochester, NY |
|
Multifamily |
|
Bridge |
|
$154,762 Unit |
|
|
69.1 |
% |
|
|
|
2 |
|
|
|
48 |
|
Senior Loan |
|
11/16/16 |
|
|
19.1 |
|
|
|
19.1 |
|
|
|
19.1 |
|
|
L +4.8% |
|
L +5.2% |
|
|
Floating |
|
11/09/19 |
|
Manhattan, NY |
|
Condominium |
|
Moderate Transitional |
|
$901 Sq ft |
|
|
49.8 |
% |
|
|
|
4 |
|
|
|
49 |
|
Senior Loan |
|
11/16/16 |
|
|
14.4 |
|
|
|
14.4 |
|
|
|
14.4 |
|
|
L +4.8% |
|
L +5.2% |
|
|
Floating |
|
11/09/19 |
|
Manhattan, NY |
|
Condominium |
|
Moderate Transitional |
|
$956 Sq ft |
|
|
43.3 |
% |
|
|
|
4 |
|
|
|
50 |
|
Senior Loan |
|
11/16/16 |
|
|
9.8 |
|
|
|
9.9 |
|
|
|
9.9 |
|
|
L +4.8% |
|
L +5.2% |
|
|
Floating |
|
11/09/19 |
|
Manhattan, NY |
|
Condominium |
|
Moderate Transitional |
|
$1,071 Sq ft |
|
|
46.6 |
% |
|
|
|
4 |
|
|
|
51 |
|
Senior Loan |
|
11/16/16 |
|
|
8.6 |
|
|
|
8.8 |
|
|
|
8.6 |
|
|
L +4.8% |
|
L +5.2% |
|
|
Floating |
|
11/09/19 |
|
Manhattan, NY |
|
Condominium |
|
Moderate Transitional |
|
$887 Sq ft |
|
|
40.7 |
% |
|
|
|
4 |
|
|
|
52 |
|
Senior Loan |
|
12/29/14 |
|
|
7.8 |
|
|
|
7.8 |
|
|
|
7.6 |
|
|
L +4.3% |
|
L +10.9% |
|
|
Floating |
|
05/01/18 |
|
Raleigh, NC |
|
Land |
|
Bridge |
|
$6 Sq ft |
|
|
56.3 |
% |
|
|
|
3 |
|
|
|
53 |
|
Senior Loan |
|
12/29/14 |
|
|
2.6 |
|
|
|
2.6 |
|
|
|
2.4 |
|
|
5.6% |
|
7.9% |
|
|
Fixed |
|
09/10/20 |
|
Shelby Township, MI |
|
Retail |
|
Bridge |
|
$25 Sq ft |
|
|
84.2 |
% |
|
|
|
4 |
|
|
|
54 |
|
Senior Loan |
|
12/29/14 |
|
|
2.4 |
|
|
|
2.4 |
|
|
|
2.4 |
|
|
L +4.3% |
|
L +7.8% |
|
|
Floating |
|
05/01/18 |
|
Cary, NC |
|
Land |
|
Bridge |
|
$1 Sq ft |
|
|
53.3 |
% |
|
|
|
3 |
|
|
|
Subtotal / Weighted Average |
|
|
|
|
|
|
3,650.8 |
|
|
|
3,122.7 |
|
|
|
3,100.5 |
|
|
L +4.6% |
(9) |
|
6.4 |
% |
|
|
|
3.6 yrs |
|
|
|
|
|
|
|
|
|
|
58.7 |
% |
|
|
|
2.6 |
|
|
Mezzanine Loans: |
|
|
|
|
|
|
|
|
|
|
|
|
|
|
|
|
|
|
|
|
|
|
|
|
|
|
|
|
|
|
|
|
|
|
|
|
|
|
|
|
|
|
|
|
55 |
|
Mezzanine Loan |
|
04/20/16 |
|
|
23.3 |
|
|
|
22.4 |
|
|
|
22.4 |
|
|
L +7.8% |
|
L +8.0% |
|
|
Floating |
|
04/20/21 |
|
Minneapolis, MN |
|
Multifamily |
|
Bridge |
|
$219,830 Unit |
|
|
60.8 |
% |
|
|
|
2 |
|
|
|
56 |
|
Mezzanine Loan |
|
07/20/15 |
|
|
19.0 |
|
|
|
19.0 |
|
|
|
19.0 |
|
|
L +8.5% |
|
L +8.7% |
|
|
Floating |
|
07/20/20 |
|
Manhattan, NY |
|
Multifamily |
|
Bridge |
|
$777,778 Unit |
|
|
87.9 |
% |
|
|
|
3 |
|
|
|
57 |
|
Mezzanine Loan |
|
02/02/17 |
|
|
17.6 |
|
|
|
17.5 |
|
|
|
17.4 |
|
|
L +13.4% |
|
L +13.6% |
|
|
Floating |
|
02/09/21 |
|
Orlando, FL |
|
Multifamily |
|
Bridge |
|
$215,015 Unit |
|
|
81.8 |
% |
|
|
|
2 |
|
|
|
58 |
|
Mezzanine Loan |
|
01/19/17 |
|
|
16.5 |
|
|
|
16.5 |
|
|
|
16.4 |
|
|
L +14.0% |
|
L +14.4% |
|
|
Floating |
|
01/19/22 |
|
Savannah, GA |
|
Hotel |
|
Construction |
|
$321,429 Unit |
|
|
0.0 |
% |
|
|
|
3 |
|
|
|
Subtotal / Weighted Average |
|
|
|
|
|
$ |
76.4 |
|
|
$ |
75.4 |
|
|
$ |
75.2 |
|
|
L +10.6% |
|
L +10.9% |
|
|
|
|
3.2 yrs |
|
|
|
|
|
|
|
|
|
|
59.2 |
% |
|
|
|
2.5 |
|
|
|
Total / Weighted Average |
|
|
|
|
|
$ |
3,727.2 |
|
|
$ |
3,198.1 |
|
|
$ |
3,175.7 |
|
|
L +4.8% |
|
|
6.5 |
% |
|
|
|
3.6 yrs |
|
|
|
|
|
|
|
|
|
|
58.7 |
% |
|
|
|
2.6 |
|
|
(1) |
First mortgage loans are whole mortgage loans unless otherwise noted. Loans numbered 42, 52, 53 and 54 represent 75% pari passu participation interests in whole mortgage loans. Loans numbered 8, 20, 29, and 33 represent 65% pari passu participation interests in whole mortgage loans. Loan number 38 represents a 50% pari passu participation interest in the whole mortgage loan. Loans numbered 48, 49, 50, and 51 represent 24% pari passu participation interests in whole mortgage loans. |
|
(2) |
Date loan was originated or acquired by us, which date has not been updated for subsequent loan modifications. |
|
(3) |
Represents unpaid principal balance net of unamortized costs. |
|
(4) |
Represents the formula pursuant to which our right to receive a cash coupon on a loan is determined. |
|
(5) |
In addition to credit spread, all-in yield includes the amortization of deferred origination fees, purchase price premium and discount, loan origination costs and accrual of extension and exit fees. All-in yield for the total portfolio assumes the applicable floating benchmark rate as of December 31, 2017 for weighted average calculations. |
|
(6) |
Extended maturity assumes all extension options are exercised by the borrower; provided, however, that our loans may be repaid prior to such date. As of December 31, 2017, based on unpaid principal balance, 67.2% of our loans were subject to yield maintenance or other prepayment restrictions and 32.8% were open to repayment by the borrower without penalty. |
|
(7) |
LTV is calculated as the total outstanding principal balance of the loan or participation interest in a loan plus any financing that is pari passu with or senior to such loan or participation interest at the time of origination or acquisition divided by the applicable as-is real estate value at the time of origination or acquisition of such loan or participation interest in a loan. The as-is real estate value reflects our Manager’s estimates, at the time of origination or acquisition of a loan or participation interest in a loan, of the real estate value underlying such loan or participation interest, determined in accordance with our Manager’s underwriting standards and consistent with third-party appraisals obtained by our Manager. |
|
(8) |
For a discussion of risk ratings, please see Notes 2 and 3 to our Consolidated Financial Statements included in this Form 10-K. |
|
(9) |
Represents the weighted average of the LIBOR interest rate plus credit spread as of December 31, 2017 for the floating rate loans and the coupon for the fixed rate loans. |
|
(10) |
LTV is calculated using an as-complete real estate value at the time of origination. The as-complete real estate value reflects our Manager’s estimate, at the time of origination of the underlying real estate value, determined in accordance with our Manager’s underwriting standards and consistent with third-party appraisals obtained by our Manager. |
|
(11) |
LTV is calculated using an as-is real estate value updated subsequent to the loan origination or acquisition date prepared pursuant to a third party appraisal obtained by our Manager. This as-is real estate value reflects our Manager’s estimate, as of the appraisal date of the underlying real estate value, pursuant to the third-party appraisal obtained by our Manager and is consistent with our Manager’s underwriting standards. |
88
Item 7A. Quantitative and Qualitative Disclosures About Market Risk.
Interest Rate Risk
Our business model is such that rising interest rates will generally increase our net interest income, while declining interest rates will generally decrease our net interest income. As of December 31, 2017, 99.9% of our loans by unpaid principal balance earned a floating rate of interest and were financed with liabilities that require interest payments based on floating rates, which resulted in an amount of net equity that is positively correlated to rising interest rates. As of December 31, 2017, the remaining 0.1% of our loans by unpaid principal balance earned a fixed rate of interest, but were financed with liabilities that require interest payments based on floating rates, which resulted in a negative correlation to rising interest rates to the extent of our amount of fixed rate financing.
The following table illustrates the impact, assuming our existing investment portfolio and liabilities, on our interest income and interest expense for the twelve-month period following December 31, 2017, assuming an immediate increase or decrease of both 25 and 50 basis points in the applicable interest rate benchmark (dollars in thousands):
|
Assets (Liabilities) Subject to Interest Rate Sensitivity(1) |
|
|
|
|
|
|
|
25 Basis Point Increase |
|
|
25 Basis Point Decrease |
|
|
50 Basis Point Increase |
|
|
50 Basis Point Decrease |
|
|||||
|
$ |
3,195,476 |
|
|
|
|
|
Interest income |
|
$ |
7,989 |
|
|
$ |
(7,785 |
) |
|
$ |
15,977 |
|
|
$ |
(14,251 |
) |
|
|
(2,125,288 |
) |
|
(2 |
) |
|
Interest expense |
|
|
(5,313 |
) |
|
|
5,313 |
|
|
|
(10,626 |
) |
|
|
10,626 |
|
|
$ |
1,070,188 |
|
|
|
|
|
Total change in net interest income |
|
$ |
2,676 |
|
|
$ |
(2,472 |
) |
|
$ |
5,351 |
|
|
$ |
(3,625 |
) |
|
(1) |
Our floating rate loans and related liabilities are indexed to LIBOR. |
|
(2) |
Borrowings include secured revolving repurchase facilities, asset-specific financings, and non-consolidated senior interests sold or co-originated. |
Credit Risk
Our loans and other investments are also subject to credit risk. The performance and value of our loans and other investments depend upon the sponsors’ ability to operate the properties that serve as our collateral so that they produce cash flows adequate to pay interest and principal due to us. To monitor this risk, the asset management team reviews our portfolio and maintains regular contact with borrowers, co-lenders and local market experts to monitor the performance of the underlying collateral, anticipate borrower, property and market issues and, to the extent necessary or appropriate, enforce our rights as the lender.
In addition, we are exposed to the risks generally associated with the commercial real estate market, including variances in occupancy rates, capitalization rates, absorption rates and other macroeconomic factors beyond our control. We seek to manage these risks through our underwriting and asset management processes.
Prepayment Risk
Prepayment risk is the risk that principal will be repaid at a different rate than anticipated, causing the return on certain investments to be less than expected. As we receive prepayments of principal on our assets, any premiums paid on such assets are amortized against interest income. In general, an increase in prepayment rates accelerates the amortization of purchase premiums, thereby reducing the interest income earned on the assets. Conversely, discounts on such assets are accreted into interest income. In general, an increase in prepayment rates accelerates the accretion of purchase discounts, thereby increasing the interest income earned on the assets.
Extension Risk
Our Manager computes the projected weighted average life of our assets based on assumptions regarding the rate at which the borrowers will prepay the mortgages or extend. If prepayment rates decrease in a rising interest rate environment or extension options are exercised, the life of the fixed rate assets could extend beyond the term of the secured debt agreements. This could have a negative impact on our results of operations. In some situations, we may be forced to sell assets to maintain adequate liquidity, which could cause us to incur losses.
89
We are exposed to risks related to the equity capital markets and our related ability to raise capital through the issuance of our stock or other equity instruments. We are also exposed to risks related to the debt capital markets and our related ability to finance our business through borrowings under secured revolving repurchase facilities or other debt instruments or facilities. As a REIT, we are required to distribute a significant portion of our taxable income annually, which constrains our ability to accumulate operating cash flow and therefore requires us to utilize debt or equity capital to finance our business. We seek to mitigate these risks by monitoring the debt and equity capital markets to inform our decisions on the amount, timing and terms of capital we raise.
Counterparty Risk
The nature of our business requires us to hold our cash and cash equivalents and obtain financing from various financial institutions. This exposes us to the risk that these financial institutions may not fulfill their obligations to us under these various contractual arrangements. We mitigate this exposure by depositing our cash and cash equivalents and entering into financing agreements with high credit-quality institutions.
The nature of our loans and other investments also exposes us to the risk that our counterparties do not make required interest and principal payments on scheduled due dates. We seek to manage this risk through a comprehensive credit analysis prior to making an investment and rigorous monitoring of the underlying collateral.
Non-Performance Risk
In addition to the risks related to fluctuations in cash flows and asset values associated with movements in interest rates, there is also the risk of non-performance on floating rate assets. In the case of a significant increase in interest rates, the additional debt service payments due from our borrowers may strain the operating cash flows of the collateral real estate assets and, potentially, contribute to non-performance or, in severe cases, default. This risk is partially mitigated by various facts we consider during our underwriting process, which in certain cases include a requirement for our borrower to purchase an interest rate cap contract.
Currency Risk
We may in the future hold assets denominated in foreign currencies, which would expose us to foreign currency risk. As a result, a change in foreign currency exchange rates may have an adverse impact on the valuation of our assets, as well as our income and distributions. Any such changes in foreign currency exchange rates may impact the measurement of such assets or income for the purposes of our REIT tests and may affect the amounts available for payment of dividends on our common stock.
We intend to hedge any currency exposures in a prudent manner. However, our currency hedging strategies may not eliminate all of our currency risk due to, among other things, uncertainties in the timing and/or amount of payments received on the related investments and/or unequal, inaccurate or unavailability of hedges to perfectly offset changes in future exchange rates. Additionally, we may be required under certain circumstances to collateralize our currency hedges for the benefit of the hedge counterparty, which could adversely affect our liquidity.
We may hedge foreign currency exposure on certain investments in the future by entering into a series of forwards to fix the U.S. dollar amount of foreign currency denominated cash flows (interest income, rental income and principal payments) we expect to receive from any foreign currency denominated investments. Accordingly, the notional values and expiration dates of our foreign currency hedges would approximate the amounts and timing of future payments we expect to receive on the related investments.
Loan Portfolio Value
As of December 31, 2017, 0.1% of our loans by unpaid principal balance earned a fixed rate of interest and as such, the value is sensitive to changes in interest rates. We generally hold all of our loans to maturity and do not expect to realize gains or losses on any fixed rate loan as a result of movements in market interest rates.
90
The market values of commercial mortgage assets are subject to volatility and may be adversely affected by a number of factors, including, but not limited to, national, regional and local economic conditions (which may be adversely affected by industry slowdowns and other factors); local real estate conditions; changes or continued weakness in specific industry segments; construction quality, age and design; demographic factors; and retroactive changes to building or similar codes. In addition, decreases in property values reduce the value of the collateral and the potential proceeds available to a borrower to repay the underlying loans, which could also cause us to suffer losses.
Item 8. Financial Statements and Supplementary Data.
The financial statements required by this item and the reports of the independent accountants thereon appear on pages F-2 to F-35. See the accompanying Index to Consolidated Financial Statements and Schedule on page F-1. The supplementary financial data required by Item 302 of Regulation S-K appears in Note 16 to the consolidated financial statements.
Item 9. Changes in and Disagreements With Accountants on Accounting and Financial Disclosure.
None.
Item 9A. Controls and Procedures.
Disclosure Controls and Procedures. We maintain disclosure controls and procedures that are designed to ensure that information required to be disclosed in our reports under the Exchange Act is recorded, processed, summarized and reported within the time periods specified in the SEC’s rules and forms and that such information is accumulated and communicated to our management, including our Chief Executive Officer (Principal Executive Officer) and Chief Financial Officer (Principal Financial Officer), to allow for timely decisions regarding required disclosure. In designing and evaluating the disclosure controls and procedures, management recognizes that any controls and procedures, no matter how well designed and operated, can provide only reasonable assurance of achieving the desired control objectives, and management is required to apply its judgment in evaluating the cost-benefit relationship of possible controls and procedures.
As required by Rules 13a-15(b) and 15d-15(b) under the Exchange Act, we carried out an evaluation, under the supervision and with the participation of our management, including our Chief Executive Officer (Principal Executive Officer) and Chief Financial Officer (Principal Financial Officer), of the effectiveness of the design and operation of our disclosure controls and procedures as of December 31, 2017. Based upon that evaluation, our Chief Executive Officer (Principal Executive Officer) and Chief Financial Officer (Principal Financial Officer) concluded that our disclosure controls and procedures were effective at the reasonable assurance level as of December 31, 2017.
Changes in Internal Control Over Financial Reporting. There were no changes in our internal control over financial reporting (as such term as defined in Rules 13a-15(f) and 15d-15(f) under the Exchange Act) during the most recently completed fiscal quarter that have materially affected, or are reasonably likely to materially affect, our internal control over financial reporting.
This annual report does not include a report of management’s assessment regarding internal control over financial reporting or an attestation report of the Company’s registered public accounting firm due to a transition period established by rules of the SEC for newly public companies.
None.
91
Item 10. Directors, Executive Officers and Corporate Governance.
The information required by this item is incorporated by reference to the Company’s definitive proxy statement to be filed not later than April 30, 2018 with the SEC pursuant to Regulation 14A under the Exchange Act.
Item 11. Executive Compensation.
The information required by this item is incorporated by reference to the Company’s definitive proxy statement to be filed not later than April 30, 2018 with the SEC pursuant to Regulation 14A under the Exchange Act.
Item 12. Security Ownership of Certain Beneficial Owners and Management and Related Stockholder Matters.
The information required by this item is incorporated by reference to the Company’s definitive proxy statement to be filed not later than April 30, 2018 with the SEC pursuant to Regulation 14A under the Exchange Act.
Item 13. Certain Relationships and Related Transactions, and Director Independence.
The information required by this item is incorporated by reference to the Company’s definitive proxy statement to be filed not later than April 30, 2018 with the SEC pursuant to Regulation 14A under the Exchange Act.
Item 14. Principal Accountant Fees and Services.
The information required by this item is incorporated by reference to the Company’s definitive proxy statement to be filed not later than April 30, 2018 with the SEC pursuant to Regulation 14A under the Exchange Act.
92
Item 15. Exhibits and Financial Statement Schedules.
|
(a) (1) |
|
Financial Statements |
|
|
|
|
|
|
|
See the accompanying Index to Consolidated Financial Statements and Schedule on page F-1. |
|
|
|
|
|
(a) (2) |
|
Consolidated Financial Statement Schedules |
|
|
|
|
|
|
|
See the accompanying Index to Consolidated Financial Statements and Schedule on page F-1. |
|
|
|
|
|
(a) (3) |
|
Exhibits |
93
|
Exhibit Number |
|
Description |
|
3.1 |
|
|
|
|
|
|
|
3.2 |
|
|
|
|
|
|
|
4.1 |
|
|
|
|
|
|
|
4.2 |
|
|
|
|
|
|
|
10.1 |
|
|
|
|
|
|
|
10.2 |
|
|
|
|
|
|
|
10.3 |
|
|
|
|
|
|
|
10.4 |
|
|
|
|
|
|
|
10.5 |
|
|
|
|
|
|
|
10.6 |
|
|
|
|
|
|
|
10.7 |
|
|
|
|
|
|
|
10.8 |
|
|
|
|
|
|
|
10.9 |
|
94
|
Exhibit Number |
|
Description |
|
|
|
|
|
10.10 |
|
|
|
|
|
|
|
10.11 |
|
|
|
|
|
|
|
10.12 |
|
|
|
|
|
|
|
10.13 |
|
|
|
|
|
|
|
10.14 |
|
|
|
|
|
|
|
10.15 |
|
|
|
|
|
|
|
10.16 |
|
|
|
|
|
|
|
10.17 |
|
|
|
|
|
|
|
10.18 |
|
|
|
|
|
|
|
10.19 |
|
|
|
|
|
|
|
10.20 |
|
95
|
Exhibit Number |
|
Description |
|
|
|
|
|
10.21 |
|
|
|
|
|
|
|
10.22 |
|
|
|
|
|
|
|
10.23 |
|
|
|
|
|
|
|
10.24 |
|
|
|
|
|
|
|
10.25 |
|
|
|
|
|
|
|
10.26 |
|
|
|
|
|
|
|
10.27 |
|
|
|
|
|
|
|
10.28 |
|
|
|
|
|
|
|
10.29 |
|
|
|
|
|
|
|
10.30 |
|
|
|
|
|
|
|
10.31 |
|
|
|
|
|
|
|
10.32 |
|
96
|
Exhibit Number |
|
Description |
|
|
|
|
|
10.33 |
|
|
|
|
|
|
|
10.34 |
|
|
|
|
|
|
|
10.35 |
|
|
|
|
|
|
|
10.36 |
|
|
|
|
|
|
|
10.37 |
|
|
|
|
|
|
|
10.38 |
|
|
|
|
|
|
|
21.1 |
|
|
|
|
|
|
|
23.1 |
|
|
|
|
|
|
|
23.2 |
|
|
|
|
|
|
|
31.1 |
|
|
|
|
|
|
|
31.2 |
|
|
|
|
|
|
|
32.1 |
|
|
|
|
|
|
|
32.2 |
|
|
|
|
|
|
|
101.INS |
|
XBRL Instance Document |
|
101.SCH |
|
XBRL Taxonomy Extension Schema Document |
|
101.CAL |
|
XBRL Taxonomy Extension Calculation Linkbase Document |
|
101.DEF |
|
XBRL Taxonomy Extension Definition Linkbase Document |
|
101.LAB |
|
XBRL Taxonomy Extension Label Linkbase Document |
|
101.PRE |
|
XBRL Taxonomy Extension Presentation Linkbase Document |
|
|
|
|
|
† |
|
This document has been identified as a management contract or compensatory plan or arrangement. |
97
Pursuant to the requirements of Section 13 or 15(d) of the Securities Exchange Act of 1934, as amended, the Registrant has duly caused this Report to be signed on its behalf by the undersigned, thereunto duly authorized.
|
Date: February 26, 2018 |
|
TPG RE Finance Trust, Inc. |
|
|
|
|
|
|
|
|
|
|
|
|
|
|
By: |
/s/ GRETA GUGGENHEIM |
|
|
|
|
Greta Guggenheim |
|
|
|
|
Chief Executive Officer and President |
|
|
|
|
(Principal Executive Officer) |
Pursuant to the requirements of the Securities Exchange Act of 1934, as amended, this Report has been signed below by the following persons on behalf of the Registrant in the capacities and on the dates indicated.
|
Name |
|
Title |
|
Date |
|
|
|
|
|
|
|
/s/ AVI BANYASZ |
|
Chairman of the Board of Directors |
|
February 26, 2018 |
|
Avi Banyasz |
|
|
|
|
|
|
|
|
|
|
|
/s/ GRETA GUGGENHEIM |
|
Chief Executive Officer, President, and Director (Principal Executive Officer) |
|
February 26, 2018 |
|
Greta Guggenheim |
|
|
|
|
|
|
|
|
|
|
|
/s/ ROBERT FOLEY |
|
Chief Financial and Risk Officer (Principal Financial Officer and Accounting Officer) |
|
February 26, 2018 |
|
Robert Foley |
|
|
|
|
|
|
|
|
|
|
|
/s/ KELVIN DAVIS |
|
Director |
|
February 26, 2018 |
|
Kelvin Davis |
|
|
|
|
|
|
|
|
|
|
|
/s/ MICHAEL GILLMORE |
|
Director |
|
February 26, 2018 |
|
Michael Gillmore |
|
|
|
|
|
|
|
|
|
|
|
/s/ WENDY SILVERSTEIN |
|
Director |
|
February 26, 2018 |
|
Wendy Silverstein |
|
|
|
|
|
|
|
|
|
|
|
/s/ BRADLEY SMITH |
|
Director |
|
February 26, 2018 |
|
Bradley Smith |
|
|
|
|
|
|
|
|
|
|
|
/s/ GREGORY WHITE |
|
Director |
|
February 26, 2018 |
|
Gregory White |
|
|
|
|
98
INDEX TO CONSOLIDATED FINANCIAL STATEMENTS AND SCHEDULE
F-1
Report of Independent Registered Public Accounting Firm
To the Shareholders and the Board of Directors of TPG RE Finance Trust, Inc.
Opinion on the Financial Statements
We have audited the accompanying consolidated balance sheets of TPG RE Finance Trust, Inc. and subsidiaries (the "Company") as of December 31, 2017 and 2016, the related consolidated statements of income and comprehensive income, changes in equity and cash flows, for the years ended December 31, 2017 and 2016, and the related notes (collectively referred to as the “financial statements”). In our opinion, the financial statements present fairly, in all material respects, the financial position of the Company as of December 31, 2017 and 2016, and the results of its operations and its cash flows for the years ended December 31, 2017 and 2016, in accordance with accounting principles generally accepted in the United States of America.
Basis for Opinion
These financial statements are the responsibility of the Company's management. Our responsibility is to express an opinion on the Company's financial statements based on our audits. We are a public accounting firm registered with the Public Company Accounting Oversight Board (United States) (PCAOB) and are required to be independent with respect to the Company in accordance with the U.S. federal securities laws and the applicable rules and regulations of the Securities and Exchange Commission and the PCAOB.
We conducted our audit in accordance with the standards of the PCAOB. Those standards require that we plan and perform the audit to obtain reasonable assurance about whether the financial statements are free of material misstatement, whether due to error or fraud. The Company is not required to have, nor were we engaged to perform, an audit of its internal control over financial reporting. As part of our audits, we are required to obtain an understanding of internal control over financial reporting but not for the purpose of expressing an opinion on the effectiveness of the Company’s internal control over financial reporting. Accordingly, we express no such opinion.
Our audits included performing procedures to assess the risks of material misstatement of the financial statements, whether due to error or fraud, and performing procedures that respond to those risks. Such procedures included examining, on a test basis, evidence supporting the amounts and disclosures in the financial statements. Our audits also included evaluating the accounting principles used and significant estimates made by management, as well as evaluating the overall presentation of the financial statements. We believe that our audits provide a reasonable basis for our opinion.
/s/ Deloitte & Touche LLP
Dallas, Texas
February 26, 2018
We have served as the Company’s auditors since 2016.
F-2
REPORT OF INDEPENDENT REGISTERED PUBLIC ACCOUNTING FIRM
To the Shareholders of
TPG RE Finance Trust, Inc.
In our opinion, the consolidated statements of income and comprehensive income, of changes in equity, and of cash flows for the year ended December 31, 2015, present fairly, in all material respects, the results of operations and cash flows of TPG RE Finance Trust, Inc. for the year ended December 31, 2015, in conformity with accounting principles generally accepted in the United States of America. In addition, in our opinion, the financial statement schedule for the year ended December 31, 2015 presents fairly, in all material respects, the information set forth therein when read in conjunction with the related consolidated financial statements. These financial statements and financial statement schedule are the responsibility of the Company’s management. Our responsibility is to express an opinion on these financial statements and financial statement schedule based on our audit. We conducted our audit of these financial statements in accordance with the standards of the Public Company Accounting Oversight Board (United States). Those standards require that we plan and perform the audit to obtain reasonable assurance about whether the financial statements are free of material misstatement. An audit includes examining, on a test basis, evidence supporting the amounts and disclosures in the financial statements, assessing the accounting principles used and significant estimates made by management, and evaluating the overall financial statement presentation. We believe that our audits provide a reasonable basis for our opinion.
/s/ PricewaterhouseCoopers LLP
New York, New York
March 23, 2016
F-3
(in thousands, except share and per share data)
|
|
|
December 31, 2017 |
|
|
December 31, 2016 |
|
||
|
ASSETS(1) |
|
|
|
|
|
|
|
|
|
Cash and Cash Equivalents |
|
$ |
75,037 |
|
|
$ |
103,126 |
|
|
Restricted Cash |
|
|
700 |
|
|
|
849 |
|
|
Accounts Receivable |
|
|
141 |
|
|
|
644 |
|
|
Accounts Receivable from Servicer/Trustee |
|
|
220 |
|
|
|
34,743 |
|
|
Accrued Interest Receivable |
|
|
16,861 |
|
|
|
14,023 |
|
|
Loans Held for Investment (includes $2,694,106 and $1,397,610 pledged as collateral under secured revolving repurchase agreements) |
|
|
3,175,672 |
|
|
|
2,449,990 |
|
|
Investment in Commercial Mortgage-Backed Securities, Available-for-Sale (includes $47,762 and $51,305 pledged as collateral under secured revolving repurchase agreements) |
|
|
85,895 |
|
|
|
61,504 |
|
|
Other Assets, Net |
|
|
859 |
|
|
|
704 |
|
|
Total Assets |
|
$ |
3,355,385 |
|
|
$ |
2,665,583 |
|
|
LIABILITIES AND STOCKHOLDERS’ EQUITY(1) |
|
|
|
|
|
|
|
|
|
Liabilities |
|
|
|
|
|
|
|
|
|
Accrued Interest Payable |
|
$ |
5,385 |
|
|
$ |
2,907 |
|
|
Accrued Expenses |
|
|
5,067 |
|
|
|
6,555 |
|
|
Collateralized Loan Obligation (net of deferred financing costs of $0 and $2,541) |
|
|
— |
|
|
|
540,780 |
|
|
Secured Revolving Repurchase and Senior Secured Agreements (net of deferred financing costs of $8,697 and $8,159) |
|
|
1,827,104 |
|
|
|
1,013,370 |
|
|
Notes Payable (net of deferred financing costs of $1,601 and $2,883) |
|
|
287,886 |
|
|
|
108,499 |
|
|
Payable to Affiliates |
|
|
5,227 |
|
|
|
3,955 |
|
|
Deferred Revenue |
|
|
317 |
|
|
|
482 |
|
|
Dividends Payable |
|
|
23,068 |
|
|
|
18,346 |
|
|
Total Liabilities |
|
|
2,154,054 |
|
|
|
1,694,894 |
|
|
Commitments and Contingencies—See Note 14 |
|
|
|
|
|
|
|
|
|
Stockholders’ Equity: |
|
|
|
|
|
|
|
|
|
Preferred Stock ($0.001 par value; 100,000,000 and 125 shares authorized; 125 and 125 shares issued and outstanding, respectively) |
|
|
— |
|
|
|
— |
|
|
Common Stock ($0.001 par value; 300,000,000 and 95,500,000 shares authorized; 59,440,112 and 47,251,165 shares issued and outstanding, respectively) |
|
|
60 |
|
|
|
39 |
|
|
Class A Common Stock ($0.001 par value; 2,500,000 and 2,500,000 shares authorized; 1,178,618 and 1,194,863 shares issued and outstanding, respectively) |
|
|
1 |
|
|
|
1 |
|
|
Additional Paid-in-Capital |
|
|
1,216,112 |
|
|
|
979,467 |
|
|
Accumulated Deficit |
|
|
(14,808 |
) |
|
|
(10,068 |
) |
|
Accumulated Other Comprehensive (Loss) Income |
|
|
(34 |
) |
|
|
1,250 |
|
|
Total Stockholders' Equity(2) |
|
|
1,201,331 |
|
|
|
970,689 |
|
|
Total Liabilities and Stockholders' Equity |
|
$ |
3,355,385 |
|
|
$ |
2,665,583 |
|
|
(1) |
At December 31, 2017, there were no VIE assets or liabilities recorded in the Company’s Total Assets and Total Liabilities. The Company’s consolidated Total Assets and Total Liabilities at December 31, 2016 include VIE assets and liabilities of $743.5 million and $542.8 million, respectively. These assets were available only to satisfy obligations of the VIE, and creditors of the VIE had recourse only to those assets, and not to TPG RE Finance Trust, Inc. See Note 5 to the Consolidated Financial Statements for details. |
|
(2) |
Shares issued and shares outstanding reflect the impact of the common stock and Class A common stock dividend which was paid upon completion of the Company’s initial public offering on July 25, 2017 to holders of record as of July 3, 2017. See Note 12 to the Consolidated Financial Statements for details. |
See accompanying notes to the Consolidated Financial Statements
F-4
Consolidated Statements of Income
and Comprehensive Income
(in thousands, except share and per share data)
|
|
|
Year Ended December 31, |
|
|||||||||
|
|
|
2017 |
|
|
2016 |
|
|
2015 |
|
|||
|
INTEREST INCOME |
|
|
|
|
|
|
|
|
|
|
|
|
|
Interest Income |
|
$ |
198,903 |
|
|
$ |
153,631 |
|
|
$ |
128,647 |
|
|
Interest Expense |
|
|
(78,268 |
) |
|
|
(61,649 |
) |
|
|
(47,564 |
) |
|
Net Interest Income |
|
|
120,635 |
|
|
|
91,982 |
|
|
|
81,083 |
|
|
OTHER REVENUE |
|
|
|
|
|
|
|
|
|
|
|
|
|
Other Income, net |
|
|
1,697 |
|
|
|
416 |
|
|
|
54 |
|
|
Total Other Revenue |
|
|
1,697 |
|
|
|
416 |
|
|
|
54 |
|
|
OTHER EXPENSES |
|
|
|
|
|
|
|
|
|
|
|
|
|
Professional Fees |
|
|
3,132 |
|
|
|
3,260 |
|
|
|
5,224 |
|
|
General and Administrative |
|
|
2,975 |
|
|
|
2,199 |
|
|
|
784 |
|
|
Servicing and Asset Management Fees |
|
|
3,068 |
|
|
|
3,625 |
|
|
|
4,011 |
|
|
Management Fee |
|
|
14,096 |
|
|
|
8,816 |
|
|
|
6,902 |
|
|
Collateral Management Fee |
|
|
225 |
|
|
|
849 |
|
|
|
1,257 |
|
|
Incentive Management Fee |
|
|
4,338 |
|
|
|
3,687 |
|
|
|
1,992 |
|
|
Total Other Expenses |
|
|
27,834 |
|
|
|
22,436 |
|
|
|
20,170 |
|
|
Income Before Income Taxes |
|
|
94,498 |
|
|
|
69,962 |
|
|
|
60,967 |
|
|
Income Taxes |
|
|
(146 |
) |
|
|
5 |
|
|
|
(1,612 |
) |
|
Net Income |
|
$ |
94,352 |
|
|
$ |
69,967 |
|
|
$ |
59,355 |
|
|
Preferred Stock Dividends |
|
|
(16 |
) |
|
|
(16 |
) |
|
|
(15 |
) |
|
Net Income Attributable to Common Stockholders |
|
$ |
94,336 |
|
|
$ |
69,951 |
|
|
$ |
59,340 |
|
|
Basic Earnings per Common Share(1) |
|
$ |
1.74 |
|
|
$ |
1.69 |
|
|
$ |
1.81 |
|
|
Diluted Earnings per Common Share(1) |
|
$ |
1.74 |
|
|
$ |
1.69 |
|
|
$ |
1.81 |
|
|
Weighted Average Number of Common Shares Outstanding(1) |
|
|
|
|
|
|
|
|
|
|
|
|
|
Basic: |
|
|
54,194,596 |
|
|
|
41,406,026 |
|
|
|
32,867,969 |
|
|
Diluted: |
|
|
54,194,596 |
|
|
|
41,406,026 |
|
|
|
32,867,969 |
|
|
OTHER COMPREHENSIVE INCOME |
|
|
|
|
|
|
|
|
|
|
|
|
|
Net Income |
|
$ |
94,352 |
|
|
$ |
69,967 |
|
|
$ |
59,355 |
|
|
Unrealized (Loss) Gain on Commercial Mortgage-Backed Securities |
|
|
(1,284 |
) |
|
|
1,250 |
|
|
|
— |
|
|
Comprehensive Net Income |
|
$ |
93,068 |
|
|
$ |
71,217 |
|
|
$ |
59,355 |
|
|
(1) |
Share and per share data reflect the impact of the common stock and Class A common stock dividend which was paid upon completion of the Company’s initial public offering on July 25, 2017 to holders of record as of July 3, 2017. See Note 12 to the Consolidated Financial Statements for details. |
See accompanying notes to the Consolidated Financial Statements
F-5
Consolidated Statements of
(In thousands, except share data)
|
|
|
Preferred Stock |
|
|
Common Stock |
|
|
Class A Common Stock |
|
|
Additional |
|
|
|
|
|
|
Accumulated Other |
|
|
|
|
|
|||||||||||||||||
|
|
|
Shares |
|
|
Par Value |
|
|
Shares |
|
|
Par Value |
|
|
Shares |
|
|
Par Value |
|
|
Paid- in-Capital |
|
|
Accumulated Deficit |
|
|
Comprehensive (Loss) Income |
|
|
Total Equity |
|
||||||||||
|
Balance at December 31, 2014 |
|
|
— |
|
|
$ |
— |
|
|
|
23,865,684 |
|
|
$ |
24 |
|
|
|
— |
|
|
$ |
— |
|
|
$ |
596,618 |
|
|
$ |
(8,248 |
) |
|
$ |
— |
|
|
$ |
588,394 |
|
|
Issuance of Preferred Stock |
|
|
125 |
|
|
|
— |
|
|
|
— |
|
|
|
— |
|
|
|
— |
|
|
|
— |
|
|
|
125 |
|
|
|
— |
|
|
|
— |
|
|
|
125 |
|
|
Issuance of Class A Common Stock |
|
|
— |
|
|
|
— |
|
|
|
— |
|
|
|
— |
|
|
|
783,158 |
|
|
|
1 |
|
|
|
19,382 |
|
|
|
— |
|
|
|
— |
|
|
|
19,383 |
|
|
Issuance of Common Stock |
|
|
— |
|
|
|
— |
|
|
|
6,666,788 |
|
|
|
7 |
|
|
|
— |
|
|
|
— |
|
|
|
168,924 |
|
|
|
— |
|
|
|
— |
|
|
|
168,931 |
|
|
Redemption of Common Stock |
|
|
— |
|
|
|
— |
|
|
|
(2,222,689 |
) |
|
|
(2 |
) |
|
|
— |
|
|
|
— |
|
|
|
(55,572 |
) |
|
|
— |
|
|
|
— |
|
|
|
(55,574 |
) |
|
Net Income |
|
|
— |
|
|
|
— |
|
|
|
— |
|
|
|
— |
|
|
|
— |
|
|
|
— |
|
|
|
— |
|
|
|
59,355 |
|
|
|
— |
|
|
|
59,355 |
|
|
Dividends on Preferred Stock |
|
|
— |
|
|
|
— |
|
|
|
— |
|
|
|
— |
|
|
|
— |
|
|
|
— |
|
|
|
— |
|
|
|
(15 |
) |
|
|
— |
|
|
|
(15 |
) |
|
Dividends on Common Stock (Dividends Declared per Share of $1.91) |
|
|
— |
|
|
|
— |
|
|
|
— |
|
|
|
— |
|
|
|
— |
|
|
|
— |
|
|
|
— |
|
|
|
(63,003 |
) |
|
|
— |
|
|
|
(63,003 |
) |
|
Dividends on Class A Common Stock (Dividends Declared per Share of $1.91) |
|
|
— |
|
|
|
— |
|
|
|
— |
|
|
|
— |
|
|
|
— |
|
|
|
— |
|
|
|
— |
|
|
|
(1,246 |
) |
|
|
— |
|
|
|
(1,246 |
) |
|
Balance at December 31, 2015 |
|
|
125 |
|
|
|
— |
|
|
|
28,309,783 |
|
|
$ |
29 |
|
|
|
783,158 |
|
|
$ |
1 |
|
|
$ |
729,477 |
|
|
$ |
(13,157 |
) |
|
$ |
— |
|
|
$ |
716,350 |
|
|
Issuance of Class A Common Stock |
|
|
— |
|
|
|
— |
|
|
|
— |
|
|
|
— |
|
|
|
184,342 |
|
|
|
— |
|
|
|
4,547 |
|
|
|
— |
|
|
|
— |
|
|
|
4,547 |
|
|
Issuance of Common Stock |
|
|
— |
|
|
|
— |
|
|
|
9,950,270 |
|
|
|
10 |
|
|
|
— |
|
|
|
— |
|
|
|
245,443 |
|
|
|
— |
|
|
|
— |
|
|
|
245,453 |
|
|
Net Income |
|
|
— |
|
|
|
— |
|
|
|
— |
|
|
|
— |
|
|
|
— |
|
|
|
— |
|
|
|
— |
|
|
|
69,967 |
|
|
|
— |
|
|
|
69,967 |
|
|
Other Comprehensive Income |
|
|
— |
|
|
|
— |
|
|
|
— |
|
|
|
— |
|
|
|
|
|
|
|
|
|
|
|
— |
|
|
|
— |
|
|
|
1,250 |
|
|
|
1,250 |
|
|
Dividends on Preferred Stock |
|
|
— |
|
|
|
— |
|
|
|
— |
|
|
|
— |
|
|
|
— |
|
|
|
— |
|
|
|
— |
|
|
|
(16 |
) |
|
|
— |
|
|
|
(16 |
) |
|
Dividends on Common Stock (Dividends Declared per Share of $1.62) |
|
|
— |
|
|
|
— |
|
|
|
— |
|
|
|
— |
|
|
|
— |
|
|
|
— |
|
|
|
— |
|
|
|
(65,200 |
) |
|
|
— |
|
|
|
(65,200 |
) |
|
Dividends on Class A Common Stock (Dividends Declared per Share of $1.62) |
|
|
— |
|
|
|
— |
|
|
|
— |
|
|
|
— |
|
|
|
— |
|
|
|
— |
|
|
|
— |
|
|
|
(1,662 |
) |
|
|
— |
|
|
|
(1,662 |
) |
|
Balance at December 31, 2016 |
|
|
125 |
|
|
|
— |
|
|
|
38,260,053 |
|
|
$ |
39 |
|
|
|
967,500 |
|
|
$ |
1 |
|
|
$ |
979,467 |
|
|
$ |
(10,068 |
) |
|
$ |
1,250 |
|
|
$ |
970,689 |
|
|
Issuance of Class A Common Stock |
|
|
— |
|
|
|
— |
|
|
|
— |
|
|
|
— |
|
|
|
14,711 |
|
|
|
— |
|
|
|
365 |
|
|
|
— |
|
|
|
— |
|
|
|
365 |
|
|
Issuance of Common Stock |
|
|
— |
|
|
|
— |
|
|
|
12,642,166 |
|
|
|
12 |
|
|
|
— |
|
|
|
— |
|
|
|
257,622 |
|
|
|
— |
|
|
|
— |
|
|
|
257,634 |
|
|
Common Stock and Class A Common Stock Dividend |
|
|
— |
|
|
|
— |
|
|
|
9,224,268 |
|
|
|
9 |
|
|
|
230,815 |
|
|
|
— |
|
|
|
(9 |
) |
|
|
— |
|
|
|
— |
|
|
|
— |
|
|
Conversion of Class A Shares to Common Shares |
|
|
— |
|
|
|
— |
|
|
|
34,408 |
|
|
|
— |
|
|
|
(34,408 |
) |
|
|
— |
|
|
|
— |
|
|
|
— |
|
|
|
— |
|
|
|
— |
|
|
Retired Common Stock |
|
|
— |
|
|
|
— |
|
|
|
(720,783 |
) |
|
|
— |
|
|
|
— |
|
|
|
— |
|
|
|
(14 |
) |
|
|
(14,076 |
) |
|
|
— |
|
|
|
(14,090 |
) |
|
Initial Public Offering Transaction Costs |
|
|
— |
|
|
|
— |
|
|
|
— |
|
|
|
— |
|
|
|
— |
|
|
|
— |
|
|
|
(21,352 |
) |
|
|
|
|
|
|
— |
|
|
|
(21,352 |
) |
|
Amortization of Share Based Compensation |
|
|
— |
|
|
|
— |
|
|
|
— |
|
|
|
— |
|
|
|
— |
|
|
|
— |
|
|
|
33 |
|
|
|
— |
|
|
|
— |
|
|
|
33 |
|
|
Net Income |
|
|
— |
|
|
|
— |
|
|
|
— |
|
|
|
— |
|
|
|
— |
|
|
|
— |
|
|
|
— |
|
|
|
94,352 |
|
|
|
— |
|
|
|
94,352 |
|
|
Other Comprehensive (Loss) |
|
|
— |
|
|
|
— |
|
|
|
— |
|
|
|
— |
|
|
|
— |
|
|
|
— |
|
|
|
— |
|
|
|
— |
|
|
|
(1,284 |
) |
|
|
(1,284 |
) |
|
Dividends on Preferred Stock |
|
|
— |
|
|
|
— |
|
|
|
— |
|
|
|
— |
|
|
|
— |
|
|
|
— |
|
|
|
— |
|
|
|
(16 |
) |
|
|
— |
|
|
|
(16 |
) |
|
Dividends on Common Stock (Dividends Declared per Share of $1.56) |
|
|
— |
|
|
|
— |
|
|
|
— |
|
|
|
— |
|
|
|
— |
|
|
|
— |
|
|
|
— |
|
|
|
(83,187 |
) |
|
|
— |
|
|
|
(83,187 |
) |
|
Dividends on Class A Common Stock (Dividends Declared per Share of $1.56) |
|
|
— |
|
|
|
— |
|
|
|
— |
|
|
|
— |
|
|
|
— |
|
|
|
— |
|
|
|
— |
|
|
|
(1,813 |
) |
|
|
— |
|
|
|
(1,813 |
) |
|
Balance at December 31, 2017 |
|
|
125 |
|
|
$ |
— |
|
|
|
59,440,112 |
|
|
$ |
60 |
|
|
|
1,178,618 |
|
|
$ |
1 |
|
|
$ |
1,216,112 |
|
|
$ |
(14,808 |
) |
|
$ |
(34 |
) |
|
$ |
1,201,331 |
|
See accompanying notes to the Consolidated Financial Statements
F-6
Consolidated Statements of Cash Flows
(In thousands)
|
|
|
Year Ended December 31, |
|
|||||||||
|
|
|
2017 |
|
|
2016 |
|
|
2015 |
|
|||
|
Cash Flows from Operating Activities: |
|
|
|
|
|
|
|
|
|
|
|
|
|
Net Income |
|
$ |
94,352 |
|
|
$ |
69,967 |
|
|
$ |
59,355 |
|
|
Adjustment to Reconcile Net Income to Net Cash Provided by Operating Activities: |
|
|
|
|
|
|
|
|
|
|
|
|
|
Amortization and Accretion of Premiums, Discounts and Loan Origination Fees, Net |
|
|
(19,477 |
) |
|
|
(8,439 |
) |
|
|
14,042 |
|
|
Amortization of Deferred Financing Costs |
|
|
11,788 |
|
|
|
9,425 |
|
|
|
6,500 |
|
|
Capitalized Accrued Interest |
|
|
5,517 |
|
|
|
13,434 |
|
|
|
(22,373 |
) |
|
Gain on Sales of Loans Held for Investment and Commercial Mortgage-Backed Securities, net |
|
|
(185 |
) |
|
|
— |
|
|
|
— |
|
|
Stock Compensation Expense |
|
|
33 |
|
|
|
— |
|
|
|
— |
|
|
Cash Flows Due to Changes in Operating Assets and Liabilities: |
|
|
|
|
|
|
|
|
|
|
|
|
|
Accounts Receivable |
|
|
503 |
|
|
|
4,213 |
|
|
|
9,432 |
|
|
Accrued Interest Receivable |
|
|
(3,056 |
) |
|
|
(1,813 |
) |
|
|
27,155 |
|
|
Accrued Expenses |
|
|
(1,843 |
) |
|
|
(182 |
) |
|
|
(2,128 |
) |
|
Accrued Interest Payable |
|
|
2,478 |
|
|
|
984 |
|
|
|
500 |
|
|
Payable to Affiliates |
|
|
1,272 |
|
|
|
(2,243 |
) |
|
|
6,126 |
|
|
Deferred Fee Income |
|
|
(165 |
) |
|
|
482 |
|
|
|
— |
|
|
Other Assets |
|
|
(44 |
) |
|
|
(94 |
) |
|
|
— |
|
|
Net Cash Provided by Operating Activities |
|
|
91,173 |
|
|
|
85,734 |
|
|
|
98,609 |
|
|
Cash Flows from Investing Activities: |
|
|
|
|
|
|
|
|
|
|
|
|
|
Origination of Loans Held for Investment |
|
|
(1,596,531 |
) |
|
|
(535,185 |
) |
|
|
(535,357 |
) |
|
Purchased Accrued Interest |
|
|
— |
|
|
|
— |
|
|
|
10,815 |
|
|
Purchase of Loans Held for Investment |
|
|
— |
|
|
|
(412,921 |
) |
|
|
— |
|
|
Advances on Loans Held for Investment |
|
|
(313,160 |
) |
|
|
(318,998 |
) |
|
|
(303,584 |
) |
|
Principal Advances Held by Servicer/Trustee |
|
|
496 |
|
|
|
— |
|
|
|
(3,458 |
) |
|
Principal Repayments of Loans Held for Investment |
|
|
1,164,052 |
|
|
|
781,049 |
|
|
|
718,111 |
|
|
Proceeds from Sales of Loans Held for Investment |
|
|
65,054 |
|
|
|
— |
|
|
|
— |
|
|
Purchase of Commercial Mortgage-Backed Securities |
|
|
(96,294 |
) |
|
|
(59,509 |
) |
|
|
(1,300 |
) |
|
Principal Repayments of Mortgage-Backed Securities |
|
|
73,912 |
|
|
|
1,173 |
|
|
|
— |
|
|
Purchases of Fixed Assets |
|
|
(111 |
) |
|
|
(500 |
) |
|
|
— |
|
|
Net Cash (Used in) Investing Activities |
|
|
(702,582 |
) |
|
|
(544,891 |
) |
|
|
(114,773 |
) |
|
Cash Flows from Financing Activities: |
|
|
|
|
|
|
|
|
|
|
|
|
|
Payments on Collateralized Loan Obligation |
|
|
(559,574 |
) |
|
|
(539,542 |
) |
|
|
(508,746 |
) |
|
Proceeds from Collateralized Loan Obligation |
|
|
16,254 |
|
|
|
80,083 |
|
|
|
155,946 |
|
|
Payments on Secured Financing Agreements |
|
|
(797,018 |
) |
|
|
(369,870 |
) |
|
|
— |
|
|
Proceeds from Secured Financing Agreements |
|
|
1,789,394 |
|
|
|
1,117,069 |
|
|
|
376,857 |
|
|
Payment of Deferred Financing Costs |
|
|
(8,699 |
) |
|
|
(7,426 |
) |
|
|
(6,808 |
) |
|
Payment to Retire Common Stock |
|
|
(13,851 |
) |
|
|
— |
|
|
|
(55,574 |
) |
|
Proceeds from Issuance of Preferred Stock |
|
|
— |
|
|
|
— |
|
|
|
125 |
|
|
Proceeds from Issuance of Common Stock |
|
|
243,654 |
|
|
|
245,453 |
|
|
|
168,932 |
|
|
Proceeds from Issuance of Class A Common Stock |
|
|
365 |
|
|
|
4,547 |
|
|
|
19,382 |
|
|
Payment of Initial Public Offering Transaction Costs |
|
|
(7,060 |
) |
|
|
— |
|
|
|
— |
|
|
Dividends Paid on Common Stock |
|
|
(78,475 |
) |
|
|
(71,238 |
) |
|
|
(38,966 |
) |
|
Dividends Paid on Class A Common Stock |
|
|
(1,803 |
) |
|
|
(1,875 |
) |
|
|
(682 |
) |
|
Dividends Paid on Preferred Stock |
|
|
(16 |
) |
|
|
(20 |
) |
|
|
(15 |
) |
|
Net Cash Provided by Financing Activities |
|
|
583,171 |
|
|
|
457,181 |
|
|
|
110,451 |
|
|
Net Change in Cash, Cash Equivalents, and Restricted Cash |
|
|
(28,238 |
) |
|
|
(1,976 |
) |
|
|
94,287 |
|
|
Cash, Cash Equivalents and Restricted Cash at Beginning of Year |
|
|
103,975 |
|
|
|
105,951 |
|
|
|
11,664 |
|
|
Cash, Cash Equivalents and Restricted Cash at End of Year |
|
$ |
75,737 |
|
|
$ |
103,975 |
|
|
$ |
105,951 |
|
|
Supplemental Disclosure of Cash Flow Information: |
|
|
|
|
|
|
|
|
|
|
|
|
|
Interest Paid |
|
$ |
64,003 |
|
|
$ |
51,269 |
|
|
$ |
38,966 |
|
|
Taxes Paid (Refund) |
|
|
142 |
|
|
|
(5 |
) |
|
|
3,199 |
|
|
Supplemental Disclosure of Non-Cash Investing and Financing Activities: |
|
|
|
|
|
|
|
|
|
|
|
|
|
Principal Repayments of Loans Held for Investment by Servicer/Trustee, Net |
|
|
220 |
|
|
|
25,887 |
|
|
|
58,556 |
|
|
Dividends Declared, not paid |
|
|
23,068 |
|
|
|
18,346 |
|
|
|
24,601 |
|
|
Accrued Initial Public Offering Transaction Costs |
|
|
312 |
|
|
|
— |
|
|
|
— |
|
|
Accrued Deferred Financing Costs |
|
|
1,054 |
|
|
|
2,953 |
|
|
|
— |
|
|
Unrealized Gain on Commercial Mortgage-Backed Securities, Available-for-Sale |
|
|
1,284 |
|
|
|
1,250 |
|
|
|
— |
|
|
Proceeds from Secured Financing Agreements Held by Trustee |
|
|
— |
|
|
|
8,856 |
|
|
|
— |
|
|
Accrued Other Assets Costs |
|
|
— |
|
|
|
110 |
|
|
|
— |
|
|
Accrued Common Stock Retirement Costs |
|
|
239 |
|
|
|
— |
|
|
|
— |
|
See accompanying notes to the Consolidated Financial Statements
F-7
Notes to the Consolidated Financial Statements
(1) Business and Organization
TPG RE Finance Trust, Inc., together with its consolidated subsidiaries (“we”, “us”, “our”, or the “Company”), is a Maryland corporation that was incorporated on October 24, 2014 and commenced operations on December 18, 2014 (“Inception”). We are organized as a holding company and conduct our operations primarily through our various subsidiaries. We conduct our operations as a real estate investment trust (“REIT”) for U.S. federal income tax purposes. We generally will not be subject to U.S. federal income taxes on our REIT taxable income to the extent that we annually distribute all of our REIT taxable income to stockholders and maintain our qualification as a REIT. We also operate our business in a manner that permits us to maintain an exclusion from registration under the Investment Company Act of 1940, as amended.
The Company’s principal business activity is to directly originate and acquire a diversified portfolio of commercial real estate related assets, primarily consisting of first mortgage loans and senior participation interests in first mortgage loans secured by institutional-quality properties in primary and select secondary markets in the United States, and commercial mortgage-backed securities (“CMBS”). As of December 31, 2017 and December 31, 2016, the Company conducted substantially all of its operations through a Delaware limited liability company, TPG RE Finance Trust Holdco, LLC (“Holdco”), and the Company’s other wholly-owned subsidiaries.
(2) Summary of Significant Accounting Policies
Basis of Presentation
The consolidated financial statements of the Company have been prepared in accordance with accounting principles generally accepted in the United States of America (“GAAP”). The consolidated financial statements include the Company’s accounts, a consolidated variable interest entity for which the Company was the primary beneficiary through August 23, 2017, and its wholly-owned subsidiaries (see Note 5 for details). All intercompany transactions and balances have been eliminated.
Certain reclassifications have been made to prior periods to conform to the current period presentation.
Use of Estimates
The preparation of the consolidated financial statements in conformity with GAAP requires estimates of assets, liabilities, revenues, expenses and disclosure of contingent assets and liabilities at the date of the consolidated financial statements. Actual results could differ from management’s estimates, and such differences could be material. Significant estimates made in the consolidated financial statements include, but are not limited to: impairment; adequacy of provisions for loan losses; and valuation of financial instruments.
Principles of Consolidation
Financial Accounting Standards Board (“FASB”) Accounting Standards Codification (“ASC”) Topic 810—Consolidation (“ASC 810”) provides guidance on the identification of a VIE (a variable interest entity for which control is achieved through means other than voting rights) and the determination of which business enterprise, if any, should consolidate the VIE. An entity is considered a VIE if any of the following applies: (1) the equity investors (if any) lack one or more of the essential characteristics of a controlling financial interest; (2) the equity investment at risk is insufficient to finance that entity’s activities without additional subordinated financial support; or (3) the equity investors have voting rights that are not proportionate to their economic interests and the activities of the entity involve or are conducted on behalf of an investor with a disproportionately small voting interest. The Company consolidates VIEs in which it is considered to be the primary beneficiary. The primary beneficiary is defined as the entity having both of the following characteristics: (1) the power to direct the activities that, when taken together, most significantly impact the VIE’s performance; and (2) the obligation to absorb losses and right to receive the returns from the VIE that would be significant to the VIE.
F-8
At each reporting date, the Company reconsiders its primary beneficiary conclusion to determine if its obligation to absorb losses of, or its rights to receive benefits from, the VIE could potentially be more than insignificant, and will consolidate or not consolidate accordingly.
Revenue Recognition
Interest income on loans is accrued using the interest method based on the contractual terms of the loan, adjusted for credit impairment, if any. The objective of the interest method is to arrive at periodic interest income including recognition of fees and costs at a constant effective yield. Premiums, discounts, origination fees and exit fees are amortized or accreted into interest income over the lives of the loans using the interest method, or on a straight line basis when it approximates the interest method. Extension fees are amortized into income on a straight line basis, when it approximates the interest method, or the extension period to which they relate if they can be waived by the Company, or a co-lender, in connection with a loan refinancing. Prepayment penalties from borrowers are recognized as interest income when received. Certain of the Company’s investments may provide for additional interest based on the borrower’s operating cash flow or appreciation of the underlying collateral. Such amounts are considered contingent interest and are reflected as interest income only upon certainty of collection.
The Company considers a loan to be non-performing and places loans on non-accrual status at such time as: (1) management determines the borrower is incapable of, or has ceased efforts toward, curing the cause of a default; (2) the loan becomes 90 days delinquent; or (3) the loan has a maturity default. While on non-accrual status, based on the Company’s judgment as to collectability of principal, loans are either accounted for on a cash basis, where interest income is recognized only upon receipt of cash for principal and interest payments, or on a cost-recovery basis, where all cash receipts reduce a loan’s carrying value, and interest income is only recorded when such carrying value has been fully recovered. For the years ended December 31, 2017 and December 31, 2016, no loans were placed on non-accrual status, and we have sustained no losses or impairments to our loan portfolio.
Loans Held for Investment
Loans that the Company has the intent and ability to hold for the foreseeable future, or until maturity or payoff, are reported at their outstanding principal balances net of any premiums, discounts, loan origination fees and an allowance for loan losses. Loan origination fees and direct loan origination costs are deferred and recognized in interest income over the estimated life of the loans using the interest method, or on a straight line basis when it approximates the interest method, adjusted for actual prepayments.
The Company evaluates each loan classified as a loan held for investment for impairment on a quarterly basis. Impairment occurs when it is deemed probable that the Company will be unable to collect all amounts due according to the contractual terms of the loan. If the loan is considered to be impaired, an allowance is recorded to reduce the carrying value of the loan to the present value of the expected future cash flows discounted at the loan’s contractual effective rate, or the fair value of the collateral, less estimated costs to sell, if recovery of the Company’s investment is expected solely from the sale of the collateral. As part of the quarterly impairment review, we evaluate the risk of each loan and assign a risk rating based on a variety of factors, grouped as follows to include (without limitation): (i) loan and credit structure, including the as-is loan-to-value (“LTV”) and structural features; (ii) quality and stability of real estate value and operating cash flow, including debt yield, property type, dynamics of the geographic, property-type and local market, physical condition, stability of cash flow, leasing velocity and quality and diversity of tenancy; (iii) performance against underwritten business plan; and (iv) quality, experience and financial condition of sponsor, borrower and guarantor(s). Based on a 5-point scale, our loans are rated “1” through “5,” from least risk to greatest risk, respectively, which ratings are defined as follows:
|
|
1- |
Outperform—Exceeds performance metrics (for example, technical milestones, occupancy, rents, net operating income) included in original or current credit underwriting and business plan; |
|
|
2- |
Meets or Exceeds Expectations—Collateral performance meets or exceeds substantially all performance metrics included in original or current underwriting / business plan; |
|
|
3- |
Satisfactory—Collateral performance meets or is on track to meet underwriting; business plan is met or can reasonably be achieved; |
F-9
|
|
5- |
Risk of Impairment/Default—Collateral performance is significantly worse than underwriting; major variance from business plan; loan covenants or technical milestones have been breached; timely exit from loan via sale or refinancing is questionable. |
Since inception, the Company has not recorded asset-specific loan loss reserves, nor has it recognized any impairments on its loan portfolio. Our determination of asset-specific loan loss reserves, should any such reserves be necessary, relies on material estimates regarding the fair value of loan collateral. Such losses could be caused by various factors, including, but not limited to, unanticipated adverse changes in the economy or events adversely affecting specific assets, borrowers, industries in which our borrowers operate or markets in which our borrowers or their properties are located. Significant judgment is required when evaluating loans for impairment.
The Company’s loans are typically collateralized by real estate, or a partnership or similar equity interest in an entity that owns real estate. As a result, the Company regularly evaluates on a loan-by-loan basis the extent and impact of any credit deterioration associated with the performance and/or value of the underlying collateral property as well as the financial and operating capability of the borrower/sponsor. The Company also evaluates the financial strength of loan guarantors, if any, and the borrower’s competency in managing and operating the property or properties. In addition, the Company considers the overall economic environment, real estate sector, and geographic sub-market in which the borrower operates. Such impairment analyses are completed and reviewed by asset management personnel and evaluated by senior management, who utilize various data sources, including (i) periodic financial data such as property occupancy, tenant profile, rental rates, operating expenses, the borrower’s exit plan, and capitalization and discount rates, (ii) site inspections, (iii) sales and financing comparables, (iv) current credit spreads for refinancing and (v) other market data.
Commercial Mortgage-Backed Securities
The Company acquires CMBS investments for cash management and investment purposes. The Company designates CMBS investments as available-for-sale on the date of acquisition of the investment. CMBS that are not classified as held-to-maturity and which the Company does not hold for the purpose of selling in the near-term, but may dispose of prior to maturity, are also designated as available-for-sale and are carried at fair value. The Company’s recognition of interest income from its CMBS, including its amortization of premium and discount, follows the Company’s revenue recognition policy. The Company uses a specific identification method when determining the cost of security sold and the amount reclassified out of accumulated other comprehensive income into earnings. Unrealized losses on securities that, in the judgment of management, are other than temporary are charged against earnings as a loss in the consolidated statements of income. Significant valuation inputs are Level II in the fair value hierarchy as described under “Fair Value Measurements”.
Portfolio Financing Arrangements
The Company finances certain loan and CMBS investments using secured revolving repurchase agreements, asset-specific financing arrangements (notes payable on the consolidated balance sheets), a senior secured credit facility, and, prior to August 23, 2017, its private collateralized loan obligation (“CLO”). The related borrowings are recorded as separate liabilities on the Company’s consolidated balance sheets. Interest income earned on the investments and interest expense incurred on the related borrowings are reported separately on the Company’s consolidated statements of income and comprehensive income.
In certain instances, the Company creates structural leverage through the co-origination or non-recourse syndication of a senior loan interest to a third party. For all such syndications the Company has completed through December 31, 2017, the Company has transferred 100% of the senior mortgage loan that the Company originated on a non-recourse basis to a third-party lender and has retained as a loan investment a separate mezzanine loan investment secured by a pledge of the equity in the mortgage borrower. With respect to the senior mortgage loan transferred, the Company retains: no control over the mortgage loan; no economic interest in the mortgage loan; and no recourse to the purchaser or the borrower. Consequently, based on these circumstances and because the Company
F-10
does not have any continuing involvement with the transferred senior mortgage loan, these syndications are accounted for as sales under GAAP and are removed from the Company’s consolidated financial statements at the time of transfer. The Company’s consolidated balance sheets only include the separate mezzanine loan remaining after the transfer and not the non-consolidated senior loan interest sold or co-originated that the Company transferred.
Fair Value Measurements
The Company follows ASC 820-10, Fair Value Measurements and Disclosures (“ASC 820-10”), for its holdings of financial instruments. ASC 820-10 defines fair value, establishes a framework for measuring fair value in accordance with GAAP and expands disclosure of fair value measurements. ASC 820-10 determines fair value to be the price that would be received for a financial instrument in a current sale, which assumes an orderly transaction between market participants on the measurement date. The Company determines the estimated fair value of financial assets and liabilities using the three-tier fair value hierarchy established by GAAP, which prioritizes the inputs used in measuring fair value. GAAP establishes market-based or observable inputs as the preferred source of values followed by valuation models using management assumptions in the absence of market inputs. The financial instruments recorded at fair value on a recurring basis in the Company’s consolidated financial statements are cash and cash equivalents, restricted cash and available-for-sale CMBS investments. The three levels of inputs that may be used to measure fair value are as follows:
Level I—Valuations based on quoted prices in active markets for identical assets or liabilities that the Company has the ability to access.
Level II—Valuations based on quoted prices in markets that are not active or for which all significant inputs are observable, either directly or indirectly.
Level III—Valuations based on inputs that are unobservable and significant to the overall fair value measurement.
For certain financial instruments, the various inputs that management uses to measure fair value may fall into different levels of the fair value hierarchy. In such cases, the determination of which category within the fair value hierarchy is appropriate for such financial instrument is based on the lowest level of input that is significant to the fair value measurement. The assessment of the significance of a particular input to the fair value measurement in its entirety requires judgment and considers factors specific to the financial instrument. The Company may use valuation techniques consistent with the market and income approaches to measure the fair value of its assets and liabilities. The market approach uses third-party valuations and information obtained from market transactions involving identical or similar assets or liabilities. The income approach uses projections of the future economic benefits of an instrument to determine its fair value, such as in the discounted cash flow methodology. The inputs or methodology used for valuing financial instruments are not necessarily an indication of the risk associated with investing in these financial instruments. Transfers between levels of the fair value hierarchy are assumed to occur at the end of the reporting period.
Income Taxes
The Company qualifies and has elected to be taxed as a REIT for U.S. federal income tax purposes under the Internal Revenue Code of 1986, as amended, commencing with its initial taxable year ended December 31, 2014. To the extent that it annually distributes at least 90% of its REIT taxable income to stockholders and complies with various other requirements as a REIT, the Company generally will not be subject to U.S. federal income taxes on its distributed REIT taxable income. If the Company fails to continue to qualify as a REIT in any taxable year and does not qualify for certain statutory relief provisions, the Company will be subject to U.S. federal and state income taxes at regular corporate rates beginning with the year in which it fails to qualify and may be precluded from being able to elect to be treated as a REIT for the Company’s four subsequent taxable years. Even though the Company currently qualifies for taxation as a REIT, the Company may be subject to certain U.S. federal, state, local and foreign taxes on the Company’s income and property and to U.S. federal income and excise taxes on the Company’s undistributed REIT taxable income.
F-11
Deferred tax assets and liabilities are recognized for future tax consequences attributable to temporary differences between the financial statement carrying amounts of existing assets and liabilities and their respective tax bases. Deferred tax assets and liabilities are measured using enacted tax rates expected to apply to taxable income in the periods in which those temporary differences are expected to be recovered or settled. The effect on deferred tax assets and liabilities of a change in tax rates is recognized in the period in which the enactment date occurs. Under ASC Topic 740, Income Taxes (“ASC 740”), a valuation allowance is established when management believes it is more likely than not that a deferred tax asset will not be realized. The Company intends to continue to operate in a manner consistent with, and to continue to meet the requirements to be treated as, a REIT for tax purposes and to distribute all of its REIT taxable income. Accordingly, the Company does not expect to pay corporate level taxes.
Earnings per Common Share
The Company utilizes the two-class method when assessing participating securities to calculate earnings per common share. Basic and diluted earnings per common share is computed by dividing net income attributable to common stockholders (i.e., holders of common stock and Class A common stock), by the weighted-average number of common shares (both common stock and Class A common stock) outstanding during the period. The preferences, rights, voting powers, restrictions, limitations as to dividends and other distributions, qualifications and terms and conditions of redemption of the Class A common stock are identical to the common stock, except (1) the Class A common stock is not a “margin security” as defined in Regulation U of the Board of Governors of the U.S. Federal Reserve System (and rulings and interpretations thereunder) and may not be listed on a national securities exchange or a national market system and (2) each share of Class A common stock is convertible at any time or from time to time, at the option of the holder, for one fully paid and non-assessable share of common stock. The Class A common stock votes together with the common stock as a single class. Shares of Class A common stock have been issued to, and are owned by, certain individuals or entities affiliated with the Company’s external manager, TPG RE Finance Trust Management, L.P., a Delaware limited partnership (the “Manager”), and the sale or conversion to common stock by investors of such shares of Class A common stock is subject to certain restrictions.
Diluted earnings per common share is calculated by including the effect of dilutive securities. The Company accounts for unvested share-based payment awards that contain non-forfeitable dividend rights or dividend equivalents (whether paid or unpaid) as participating securities, which are included in the computation of earnings per share pursuant to the two-class method.
Share-Based Compensation
Share-based compensation consists of awards issued by the Company to certain employees of affiliates of our Manager that vest over the life of the awards as well as certain members of our Board of Directors. Compensation expense is recognized in net income on a variable basis over the applicable award vesting period based on the value of our common stock. Forfeitures of share-based awards are recognized as they occur.
Deferred Financing Costs
Deferred financing costs are reflected net of the CLO and secured financing agreements on the Company’s consolidated balance sheets. These costs are amortized in interest expense using the interest method or on a straight line basis when it approximates the interest method over the life of the related obligations.
Cash and Cash Equivalents
Cash and cash equivalents include cash held in banks or invested in money market funds with original maturities of less than 90 days. The Company deposits its cash and cash equivalents with high credit quality institutions to minimize credit risk exposure. The Company maintains cash accounts at several financial institutions, which are insured up to a maximum of $250,000 per account as of December 31, 2017 and December 31, 2016. The balances in these accounts may exceed the insured limits.
F-12
Restricted cash primarily represents deposit proceeds from potential borrowers which may be returned to borrowers, after deducting transaction costs paid by the Company for the benefit of the borrowers, upon the closing of a loan transaction.
The following table provides a reconciliation of cash, cash equivalents, and restricted cash on the consolidated balance sheets to the total amount shown on the consolidated statements of cash flows (dollars in thousands):
|
|
|
December 31, 2017 |
|
|
December 31, 2016 |
|
||
|
Cash and Cash Equivalents |
|
$ |
75,037 |
|
|
$ |
103,126 |
|
|
Restricted Cash |
|
|
700 |
|
|
|
849 |
|
|
Total cash, cash equivalents, and restricted cash shown on the consolidated statements of cash flows |
|
$ |
75,737 |
|
|
$ |
103,975 |
|
Recently Issued & Adopted Accounting Pronouncements
In May 2017, the FASB issued Accounting Standards Update (“ASU”) 2017-09, Compensation – Stock Compensation (Topic 718): Scope of Modification Accounting (“ASU 2017-09”). ASU 2017-09 provides guidance about which changes to the terms or conditions of a share-based payment award require an entity to apply modification accounting in Topic 718. The current disclosure requirements in Topic 718 apply regardless of whether an entity is required to apply modification accounting under the amendments of ASU 2017-09. This guidance is effective for fiscal years, and interim periods within those fiscal years, beginning after December 15, 2017. Early adoption is permitted, including adoption in an interim period. The Company early adopted this update during the quarter ended December 31, 2017, and its adoption did not have a material impact on our consolidated financial statements.
In March 2017, the FASB issued ASU 2017-08, Receivables (Topic 310): Receivables – Nonrefundable Fees and Other Costs (“ASU 2017-08”). ASU 2017-08 shortens the amortization period for certain callable debt securities held at a premium. Specifically, the amendments require the premium to be amortized to the earliest call date. The amendments do not require an accounting change for securities held at a discount; discounts continue to be amortized through maturity. This guidance is effective for fiscal years, and interim periods within those fiscal years, beginning after December 15, 2018. Early adoption is permitted, including adoption in an interim period. The Company early adopted this update during the quarter ended March 31, 2017. There was no effect on our consolidated financial statements as a result of the adoption of ASU 2017-08.
In November 2016, the FASB issued ASU 2016-18, Statement of Cash Flows (Topic 230): Restricted Cash (a consensus of the FASB Emerging Issues Task Force) (“ASU 2016-18”). The amendments in ASU 2016-18 require an entity to reconcile and explain the period-over-period change in total cash, cash equivalents and restricted cash within its statements of cash flows. ASU 2016-18 is effective for fiscal years, and interim periods within those fiscal years, beginning after December 15, 2017. Early adoption is permitted. A reporting entity must apply the amendments in ASU 2016-18 using a full retrospective approach. The Company adopted ASU 2016-18 in the fourth quarter of 2017 and applied the guidance retrospectively to our prior period consolidated statement of cash flows.
In August 2016, the FASB issued ASU 2016-15, Statement of Cash Flows (Topic 230): Classification of Certain Cash Receipts and Cash Payments (“ASU 2016-15”). ASU 2016-15 is intended to reduce diversity in practice in how certain transactions are classified in the statement of cash flows. The new guidance addresses the classification of various transactions including debt prepayment or debt extinguishment costs, settlement of zero-coupon debt instruments, contingent consideration payments made after a business combination, distributions received from equity method investees, beneficial interests in securitization transactions, and others. The Company adopted ASU 2016-15 during the quarter ended September 30, 2016, and its adoption did not have a material impact on our consolidated financial statements.
In March 2016, the FASB issued ASU 2016-09, Improvements to Employee Share-Based Payment Accounting (“ASU 2016-09”). ASU 2016-09 is intended to simplify accounting for share-based payment
F-13
transactions. The areas for simplification in this update involve several aspects of accounting for share-based payment transactions, including income tax consequences, award classification as equity or liabilities, policy election to account for employee forfeitures as they occur, and classification on the statements of cash flows. ASU 2016-09 is effective for fiscal years, and interim periods within those fiscal years, beginning after December 15, 2016. Early adoption is permitted. The transition method required by ASU 2016-09 varies based on the specific amendment being adopted. The Company adopted this update on December 13, 2017 upon the approval of its initial stock awards under its 2017 Equity Incentive Plan. The adoption of ASU 2016-09 did not have a material impact on our consolidated financial statements. The Company has formally disclosed its policy regarding the treatment of forfeitures of stock compensation awards (see Share-Based Compensation above).
In April 2015, the FASB issued ASU 2015-03, Interest—Imputation of Interest (Subtopic 835-30): Simplifying the Presentation of Debt Issuance Costs (“ASU 2015-03”), which requires that debt issuance costs related to a recognized debt liability be presented in the balance sheet as a direct deduction from the carrying amount of that debt liability, consistent with debt discounts. The Company did not elect to early adopt ASU 2015-03. This new guidance is framed around how to account for costs related to term debt, and it does not address how to present fees paid to lenders or other costs to secure revolving lines of credit, which are, at the outset, not associated with an outstanding borrowing. In August 2015, FASB issued ASU 2015-15, Presentation and Subsequent Measurement of Debt Issuance Costs Associated with Line-of-Credit Arrangements (“ASU 2015-15”), which amends ASC 835-30, Interest—Imputation of Interest. This update clarifies the presentation and subsequent measurement of debt issuance costs associated with lines of credit. These costs may be deferred and presented as an asset and subsequently amortized ratably over the term of the revolving debt arrangement. The Company adopted this update during the quarter ended March 31, 2016. The effect of the adoption of ASU 2015-03 and ASU 2015-15 was to reclassify debt issuance costs of approximately $13.6 million as of December 31, 2016 from “Deferred Financing Costs” to a contra account as a deduction from the related debt liabilities. There was no effect on the Company’s consolidated statements of income and comprehensive income as a result of the adoption of ASU 2015-03 and ASU 2015-15.
In February 2015, FASB issued ASU 2015-02, Consolidation (Topic 810): Amendments to the Consolidation Analysis (“ASU 2015-02”). ASU 2015-02 requires an entity to evaluate whether it should consolidate certain legal entities. All legal entities are subject to reevaluation under the revised consolidation model. Specifically, the amendments: (1) modify the evaluation of whether limited partnerships and similar legal entities are variable interest entities (VIEs) or voting interest entities; (2) eliminate the presumption that a general partner should consolidate a limited partnership; and (3) affect the consolidation analysis of reporting entities that are involved with VIEs, particularly those that have fee arrangements and related party relationships. This guidance is effective for fiscal years beginning after December 15, 2015. The Company adopted this update during the quarter ended March 31, 2016. There was no effect on our consolidated financial statements as a result of the adoption of ASU 2015-02.
In August 2014, FASB issued ASU 2014-13, Consolidation (Topic 810): Measuring the Financial Assets and the Financial Liabilities of a Consolidated Collateralized Financing Entity (“ASU 2014-13”). For entities that consolidate a collateralized financing entity within the scope of this update, an option to elect to measure the financial assets and the financial liabilities of that collateralized financing entity using either the measurement alternative included in ASU 2014-13 or ASC 820 on fair value measurement is provided. The guidance is effective for fiscal years beginning after December 15, 2015. The Company adopted this update during the quarter ended March 31, 2016, and the adoption did not have a material effect on the Company’s consolidated financial statements, as the fair value option was not elected.
In August 2014, FASB issued ASU 2014-15, Presentation of Financial Statements—Going Concern (Subtopic 205-40): Disclosure of Uncertainties About an Entity’s Ability to Continue as a Going Concern (“ASU 2014-15”). The guidance in ASU 2014-15 sets forth management’s responsibility to evaluate whether there is substantial doubt about an entity’s ability to continue as a going concern as well as required disclosures. ASU 2014-15 indicates that, when preparing interim and annual financial statements, management should evaluate whether conditions or events, in the aggregate, raise substantial doubt about the entity’s ability to continue as a going concern for one year from the date the financial statements are issued or are available to be issued. This evaluation should include consideration of conditions and events that are either known or are reasonably knowable at the date the financial statements are issued or are available to be issued, and, if applicable, whether it is probable that management’s plans to address the substantial doubt will be implemented and, if so, whether it is probable that the plans will alleviate the
F-14
substantial doubt. ASU 2014-15 is effective for annual periods ending after December 15, 2016, and interim periods and annual periods thereafter. The adoption of this guidance did not have an impact on our disclosures.
Recently Issued Accounting Pronouncements
In June 2016, the FASB issued ASU 2016-13, Financial Instruments—Credit Losses (Topic 326): Measurement of Credit Losses on Financial Instruments (“ASU 2016-13”). ASU 2016-13 significantly changes how entities will measure credit losses for most financial assets and certain other instruments that are not measured at fair value through net income. ASU 2016-13 will replace the “incurred loss” model under existing guidance with an “expected loss” model for instruments measured at amortized cost, and require entities to record allowances for available-for-sale debt securities rather than reduce the carrying amount, as they do today under the other-than-temporary impairment model. Upon adoption, and resulting from this change, the Company expects that it will have to record a loan loss reserve at origination or acquisition of an individual loan or a loan portfolio. ASU 2016-13 also simplifies the accounting model for purchased credit-impaired debt securities and loans. ASU 2016-13 is effective for fiscal years beginning after December 15, 2019 and is to be adopted through a cumulative-effect adjustment to retained earnings as of the beginning of the first reporting period in which the guidance is effective. The Company is currently evaluating the impact ASU 2016-13 will have on its consolidated financial statements.
In May 2014, FASB issued ASU 2014-09, Revenue from Contracts with Customers (Topic 606) (“ASU 2014-09”). ASU 2014-09 is a comprehensive new revenue recognition model requiring a company to recognize revenue to depict the transfer of goods or services to a customer at an amount reflecting the consideration it expects to receive in exchange for those goods or services. In August 2015, the FASB issued an update (“ASU 2015-14”) to Topic 606, Deferral of the Effective Date, which defers the adoption of ASU 2014-09 to interim and annual reporting periods in fiscal years that begin after December 15, 2017. In March 2016, the FASB issued an update (“ASU 2016-08”) to Topic 606, Principal versus Agent Considerations (Reporting Revenue Gross versus Net), which clarifies the implementation guidance on principal versus agent considerations in the new revenue recognition standard pursuant to ASU 2014-09. In April 2016, the FASB issued an update (“ASU 2016-10”) to Topic 606, Identifying Performance Obligations and Licensing, which clarifies guidance related to identifying performance obligations and licensing implementation guidance contained in ASU 2014-09. In May 2016, the FASB issued an update (“ASU 2016-12”) to Topic 606, Narrow-Scope Improvements and Practical Expedients, which amends certain aspects of the new revenue recognition standard pursuant to ASU 2014-09. In adopting ASU 2014-09, companies may use either a full retrospective or a modified retrospective approach. Additionally, this guidance requires improved disclosures regarding the nature, amount, timing and uncertainty of revenue and cash flows arising from contracts with customers. Early adoption is not permitted, except that we may adopt under the original provisions of ASU 2014-09 prior to the issuance of ASU 2015-14. The Company adopted the revenue recognition standard updates on January 1, 2018. The Company anticipates that these updates may impact the fiscal period in which its miscellaneous fee revenue is recognized, but not preclude its recognition. For the fiscal years ended December 31, 2017, 2016, and 2015, the Company’s miscellaneous fee revenue subject to this change did not exceed $0.5 million during any period. Miscellaneous fee revenue is recorded to Other Income, net in the Company’s consolidated statements of income. As a result, the Company’s adoption of the revenue recognition standard updates on January 1, 2018 is not expected to have a material impact on the Company’s consolidated financial statements.
(3) Loans Held for Investment
The Company currently originates and acquires first mortgage and mezzanine loans secured by commercial properties. These loans can potentially subject the Company to concentrations of credit risk as measured by various metrics, including the property type collateralizing the loan, loan size, loans to a single sponsor and loans in a single geographic area, among others. The Company’s loans held for investment are accounted for at amortized cost.
During the year ended December 31, 2017, the Company’s subsidiaries originated or acquired 22 loans with a total commitment of approximately $1.95 billion, an initial unpaid principal balance of $1.61 billion, and unfunded commitments upon closing of $331.2 million. To fund these originations, the Company employed financing methods that included secured revolving repurchase agreements and other secured financings, notes payable, and the syndication of non-consolidated senior interests which are non-recourse to the Company and are recognized as sales. Total commitments related to the syndication of non-consolidated senior interests for the year ended December 31, 2017 were $91.50 million.
F-15
The following tables present an overview of the loan investment portfolio as of December 31, 2017 and December 31, 2016 (dollars in thousands):
|
|
|
December 31, 2017 |
|
|||||||||
|
Loans Receivable |
|
Outstanding Principal |
|
|
Unamortized Premium (Discount), Loan Origination Fees, net |
|
|
Carrying Amount |
|
|||
|
Senior loans |
|
$ |
3,122,670 |
|
|
$ |
(22,143 |
) |
|
$ |
3,100,527 |
|
|
Subordinated and mezzanine loans |
|
|
75,446 |
|
|
|
(301 |
) |
|
|
75,145 |
|
|
Subtotal before allowance |
|
|
3,198,116 |
|
|
|
(22,444 |
) |
|
|
3,175,672 |
|
|
Allowance for loan losses |
|
|
— |
|
|
|
— |
|
|
|
— |
|
|
Total |
|
$ |
3,198,116 |
|
|
$ |
(22,444 |
) |
|
$ |
3,175,672 |
|
|
|
|
December 31, 2016 |
|
|||||||||
|
Loans Receivable |
|
Outstanding Principal |
|
|
Unamortized Premium (Discount), Loan Origination Fees, net |
|
|
Carrying Amount |
|
|||
|
Senior loans |
|
$ |
2,429,632 |
|
|
$ |
(20,931 |
) |
|
$ |
2,408,701 |
|
|
Subordinated and mezzanine loans |
|
|
41,446 |
|
|
|
(157 |
) |
|
|
41,289 |
|
|
Subtotal before allowance |
|
|
2,471,078 |
|
|
|
(21,088 |
) |
|
|
2,449,990 |
|
|
Allowance for loan losses |
|
|
— |
|
|
|
— |
|
|
|
— |
|
|
Total |
|
$ |
2,471,078 |
|
|
$ |
(21,088 |
) |
|
$ |
2,449,990 |
|
For the year ended December 31, 2017, loan portfolio activity was as follows (dollars in thousands):
|
Balance at December 31, 2016 |
|
$ |
2,449,990 |
|
|
Loans originated |
|
|
1,596,531 |
|
|
Additional fundings |
|
|
315,409 |
|
|
Amortization of discount and origination fees |
|
|
19,381 |
|
|
Deductions during the period: |
|
|
|
|
|
Collection of principal |
|
|
(1,202,776 |
) |
|
Amortization of premium |
|
|
(2,863 |
) |
|
Balance at December 31, 2017 |
|
$ |
3,175,672 |
|
At December 31, 2017 and December 31, 2016, there was $0.0 million and $2.9 million, respectively, of unamortized premium and $2.0 million and $12.5 million, respectively, of unamortized discount included in loans held for investment at amortized cost on the consolidated balance sheets.
The table below summarizes the carrying values and results of the Company’s internal risk rating review performed as of December 31, 2017 and December 31, 2016 (dollars in thousands):
|
|
|
Carrying Value |
|
|||||
|
Rating |
|
December 31, 2017 |
|
|
December 31, 2016 |
|
||
|
1 |
|
$ |
— |
|
|
$ |
261,261 |
|
|
2 |
|
|
1,318,816 |
|
|
|
745,340 |
|
|
3 |
|
|
1,680,913 |
|
|
|
1,205,994 |
|
|
4 |
|
|
175,943 |
|
|
|
237,395 |
|
|
5 |
|
|
— |
|
|
|
— |
|
|
Totals |
|
$ |
3,175,672 |
|
|
$ |
2,449,990 |
|
|
Weighted Average Risk Rating(1) |
|
|
2.6 |
|
|
|
2.6 |
|
|
(1) |
Weighted Average Risk Rating calculated based on unpaid principal balance at year end. |
F-16
During the year ended December 31, 2017, two loans were moved from the Company’s category four risk rating, one into its category two risk rating and the other into its category three risk rating, as a result of improved operating performance of the underlying loan collateral. Furthermore, the Company moved six loans that were classified in its category three risk rating to category four, resulting from a decline in collateral performance. Additionally, during the year ended December 31, 2017, two loans classified in its category four risk rating, one loan classified in its category three risk rating, three loans in its category two risk rating, and three loans classified in its category one risk rating as of December 31, 2016 were repaid during the ordinary course of business. The weighted average risk rating at both December 31, 2017 and December 31, 2016 was 2.6.
At December 31, 2017 and December 31, 2016, there were no loans on non-accrual status or that were impaired; thus, the Company did not record a reserve for loan loss.
See Note 17 for details about the Company’s mortgage loan originations subsequent to December 31, 2017.
(4) Commercial Mortgage-Backed Securities
At December 31, 2017 and December 31, 2016, the Company had five CMBS designated as available-for-sale. During the year ended December 31, 2017, the Company sold a CMBS investment for net proceeds of $43.8 million, recognizing in Other income, net a gain on sale of $0.3 million. Detailed information regarding the Company’s available-for-sale CMBS is as follows (dollars in thousands):
|
|
|
December 31, 2017 |
|
|||||||||||||
|
|
|
Face Amount |
|
|
Unamortized Premium (Discount) |
|
|
Gross Unrealized (Loss) |
|
|
Estimated Fair Value |
|
||||
|
Investments, at Fair Value |
|
|
|
|
|
|
|
|
|
|
|
|
|
|
|
|
|
Commercial mortgage-backed securities |
|
$ |
85,661 |
|
|
$ |
268 |
|
|
$ |
(34 |
) |
|
$ |
85,895 |
|
|
|
|
December 31, 2016 |
|
|||||||||||||
|
|
|
Face Amount |
|
|
Unamortized Premium (Discount) |
|
|
Gross Unrealized Gain |
|
|
Estimated Fair Value |
|
||||
|
Investments, at Fair Value |
|
|
|
|
|
|
|
|
|
|
|
|
|
|
|
|
|
Commercial mortgage-backed securities |
|
$ |
62,927 |
|
|
$ |
(2,673 |
) |
|
$ |
1,250 |
|
|
$ |
61,504 |
|
The CMBS fair values are considered Level II fair value measurements within the fair value hierarchy of ASC 820-10. The CMBS fair values are based upon market, broker, and counterparty or pricing services quotations, which provide valuation estimates, based upon reasonable market order indications. These fair value quotations are subject to significant variability based on market conditions, such as interest rates, credit spreads and market liquidity, and are reviewed by the Company for reasonableness and consistency.
The amortized cost and estimated fair value of the Company’s available-for-sale CMBS by contractual maturity are shown in the following table (dollars in thousands):
|
|
|
December 31, 2017 |
|
|||||
|
|
|
Amortized Cost |
|
|
Estimated Fair Value |
|
||
|
Expected Maturity Date |
|
|
|
|
|
|
|
|
|
After one, within five years |
|
$ |
36,700 |
|
|
$ |
36,872 |
|
|
After five, within ten years |
|
|
49,229 |
|
|
|
49,023 |
|
|
Total investment in commercial mortgage- backed securities, at fair value |
|
$ |
85,929 |
|
|
$ |
85,895 |
|
F-17
|
|
December 31, 2016 |
|
||||||
|
|
|
Amortized Cost |
|
|
Estimated Fair Value |
|
||
|
Expected Maturity Date |
|
|
|
|
|
|
|
|
|
After one, within five years |
|
$ |
58,962 |
|
|
$ |
60,242 |
|
|
After five, within ten years |
|
|
1,292 |
|
|
|
1,262 |
|
|
Total investment in commercial mortgage- backed securities, at fair value |
|
$ |
60,254 |
|
|
$ |
61,504 |
|
No other-than-temporary impairments were recognized through income for the years ended December 31, 2017 or year ended December 31, 2016.
(5) Variable Interest Entities and Collateralized Loan Obligation
On December 18, 2014, the Company entered into a collateralized loan obligation through TPG RE Finance Trust CLO Issuer, L.P., a wholly-owned subsidiary of the Company (“CLO Issuer”) and on December 29, 2014, the Company acquired from German American Capital Corporation (“GACC”) a portfolio of 75% participation interests in certain loans secured primarily by first mortgages on commercial properties, with a face value of approximately $2.4 billion. To partially fund the investment, on December 18, 2014, the CLO Issuer issued a Class A Note secured by the Company’s 75% participation interests in the portfolio of loans acquired. The Company evaluated in accordance with ASC 810 the key attributes of the CLO Issuer to determine if it was a VIE and, if so, whether the Company was the primary beneficiary of the CLO Issuer’s operating activities. This analysis resulted in the Company concluding that the CLO Issuer was a VIE, that the Company was the primary beneficiary, and that it would consolidate the entity.
The CLO Issuer invested in real estate-related loans which were substantially financed by the issuance of debt securities. The Manager was named collateral manager (“CLO Collateral Manager”) for all of the CLO Issuer’s collateral assets. The CLO Collateral Manager was responsible for the activities that most significantly impacted the performance of the underlying assets, including but not limited to monitoring, managing and disposing of collateral assets and managing the CLO Issuer’s compliance with provisions of the CLO indenture. The Company’s involvement with the CLO Issuer primarily affected its financial performance and operating cash flows through amounts recorded to interest income, interest expense and provision for loan losses.
The Company consolidated the CLO Issuer because ultimately it had the ability to control the activities that most significantly impacted the economic performance of the entity through its contractual rights with the affiliated CLO Collateral Manager. The CLO Collateral Manager had a contractual duty to the CLO Issuer, which in turn benefited the Company as the owner of 100% of the equity in the CLO Issuer. Additionally, the Company had exposure to the CLO Issuer’s losses to the extent of its equity interests and also had rights to waterfall payments in excess of required payments to the CLO Issuer’s Class A Note holder which would both be significant to the CLO Issuer. At each reporting date, the Company reconsidered its primary beneficiary conclusion to determine if its obligation to absorb losses of, or its rights to receive benefits from, the CLO Issuer could potentially be more than insignificant and if it should consolidate the CLO Issuer.
On August 16, 2017, the outstanding principal balance of the Class A Note issued by the CLO Issuer was approximately $118.0 million. On August 16, 2017, the CLO Issuer sold to GACC two first mortgage loan participation interests with an aggregate unpaid principal balance of $12.8 million that collateralized the Class A Note in part and recognized in Other income, net a $0.2 million loss on sale. The sales price of the two first mortgage loans was approximately par value. These loans were sold because they were determined to no longer be consistent with the Company’s current investment strategy.
On August 18, 2017, one of the Company’s wholly-owned subsidiaries purchased from the CLO Issuer seven first mortgage loan participation interests with an aggregate unpaid principal balance of $138.5 million that collateralized the remainder of the Class A Note issued by the CLO Issuer. The first mortgage loan participation interests were sold by the CLO Issuer for approximately par value. On August 23, 2017, proceeds from both transactions were used in combination with approximately $3.0 million of Company cash to retire all amounts outstanding under the Class A Note issued by the CLO Issuer, which totaled $118.0 million. The collateralized loan obligation was subsequently terminated.
F-18
The Company’s total assets and total liabilities at December 31, 2016 included the following VIE assets and liabilities (dollars in thousands):
|
|
|
December 31, 2016 |
|
|
|
ASSETS |
|
|
|
|
|
Cash and Cash Equivalents |
|
$ |
2,133 |
|
|
Accounts Receivable |
|
|
479 |
|
|
Accounts Receivable from Servicer/Trustee |
|
|
23,009 |
|
|
Accrued Interest Receivable |
|
|
5,714 |
|
|
Loans Held for Investment |
|
|
712,158 |
|
|
Total Assets |
|
$ |
743,493 |
|
|
LIABILITIES |
|
|
|
|
|
Accrued Interest Payable |
|
$ |
885 |
|
|
Accrued Expenses |
|
|
32 |
|
|
Collateralized Loan Obligation |
|
|
540,780 |
|
|
Payable to Affiliates |
|
|
933 |
|
|
Deferred Revenue |
|
|
198 |
|
|
Total Liabilities |
|
$ |
542,828 |
|
Assets held by the CLO Issuer were restricted and could only be used to settle obligations of the entity. The liabilities of the CLO Issuer were non-recourse to the Company and could only be satisfied from the CLO Issuer’s asset pool. From inception of the CLO through its dissolution, the Company did not provide, and was not required to provide, financial support to the CLO Issuer through a liquidity arrangement or otherwise.
The following table outlines borrowings and the corresponding collateral under the Company’s consolidated CLO Issuer as of December 31, 2016 (dollars in thousands):
|
As of December 31, 2016 |
|
|||||||||||||
|
Debt |
|
|
Collateral (loans) |
|
||||||||||
|
Face Value |
|
|
Carrying Value |
|
|
Outstanding Principal |
|
|
Carrying Value |
|
||||
|
$ |
543,320 |
|
|
$ |
540,780 |
|
|
$ |
712,420 |
|
|
$ |
712,158 |
|
The Company incurred approximately $13.2 million of issuance costs which were amortized on an effective yield basis over the shorter of the remaining life of the loans that collateralized the Class A Note, or the Class A Note. As a result of retiring all amounts outstanding under the Class A Note, the Company recognized an additional $0.9 million of issuance costs recorded to Interest Expense. As of December 31, 2017 and December 31, 2016, the Company’s unamortized issuance costs were $0.0 million and $2.5 million, respectively.
Interest on the Class A Note was payable monthly, beginning on December 18, 2014, and for the years ended December 31, 2017, December 31, 2016, and December 31, 2015 interest expense (excluding amortization of deferred financing costs) of $9.3 million, $21.8 million, and $35.5 million, respectively, is included in the Company’s consolidated statements of income as interest expense.
(6) Secured Revolving Repurchase Agreements, Senior Secured Credit Facility, Notes Payable and Subscription Secured Facility
At December 31, 2017 and December 31, 2016, the Company had notes payable and secured revolving repurchase agreements for certain of the Company’s originated loans. In addition, at December 31, 2016, the Company had a subscription secured credit facility outstanding, which facility was terminated in July 2017. On September 29, 2017, the Company entered into a new senior secured credit facility agreement with Bank of America. These financing agreements bear interest at a rate equal to LIBOR plus a credit spread determined primarily by advance rate and property type, or in the case of the subscription secured facility before it was terminated, the creditworthiness of the irrevocable investor commitments that secured the facility. The agreements contain covenants that include certain financial requirements, including maintenance of minimum liquidity, minimum tangible net worth, maximum debt to net worth ratio, current ratio and limitations on capital expenditures,
F-19
indebtedness, distributions, transactions with affiliates and maintenance of positive net income as defined in the agreements.
The following table presents certain information regarding the Company’s notes payable, secured revolving repurchase agreements, senior secured credit facility, and subscription secured facility as of December 31, 2017 and December 31, 2016, respectively. Except as otherwise noted, all agreements are on a non-recourse basis. Amounts included are shown in thousands:
|
As of December 31, 2017 |
|
|||||||||||||||||||||||||||
|
Notes Payable |
|
Maturity Date |
|
Index Rate |
|
Weighted Average Spread |
|
|
Interest Rate |
|
|
Commitment Amount |
|
|
Maximum Current Availability |
|
|
Balance Outstanding |
|
|
Principal Balance of Collateral |
|
||||||
|
Bank of the Ozarks |
|
08/23/19 |
|
1 Month Libor |
|
|
4.5 |
% |
|
|
5.9 |
% |
|
$ |
92,400 |
|
|
$ |
43,979 |
|
|
$ |
48,421 |
|
|
$ |
69,172 |
|
|
Bank of the Ozarks |
|
08/31/18 |
|
1 Month Libor |
|
|
4.0 |
|
|
|
5.4 |
|
|
|
68,600 |
|
|
|
14,151 |
|
|
|
54,449 |
|
|
|
77,784 |
|
|
Deutsche Bank |
|
09/25/19 |
|
1 Month Libor |
|
|
3.5 |
|
|
|
4.9 |
|
|
|
64,779 |
|
|
|
15,895 |
|
|
|
48,884 |
|
|
|
81,473 |
|
|
Deutsche Bank |
|
06/29/18 |
|
1 Month Libor |
|
|
3.3 |
|
|
|
4.6 |
|
|
|
49,644 |
|
|
|
18,224 |
|
|
|
31,420 |
|
|
|
48,339 |
|
|
Bank of the Ozarks |
|
05/22/18 |
|
1 Month Libor |
|
|
4.8 |
|
|
|
6.1 |
|
|
|
48,750 |
|
|
|
17,479 |
|
|
|
31,271 |
|
|
|
48,109 |
|
|
Deutsche Bank |
|
12/09/18 |
|
1 Month Libor |
|
|
3.7 |
|
|
|
5.0 |
|
|
|
42,543 |
|
|
|
1 |
|
|
|
42,542 |
|
|
|
60,775 |
|
|
BMO Harris Bank(1) |
|
04/09/20 |
|
1 Month Libor |
|
|
2.7 |
|
|
|
4.0 |
|
|
|
32,500 |
|
|
|
— |
|
|
|
32,500 |
|
|
|
45,000 |
|
|
Subtotal |
|
|
|
|
|
|
|
|
|
|
|
|
|
$ |
399,216 |
|
|
$ |
109,729 |
|
|
$ |
289,487 |
|
|
$ |
430,652 |
|
|
Repurchase Agreements |
|
Maturity Date |
|
Index Rate |
|
Weighted Average Spread |
|
|
Interest Rate |
|
|
Commitment Amount |
|
|
Maximum Current Availability |
|
|
Balance Outstanding |
|
|
Principal Balance of Collateral |
|
||||||
|
Goldman Sachs(1) |
|
08/19/18 |
|
1 Month Libor |
|
|
2.2 |
% |
|
|
3.6 |
% |
|
$ |
750,000 |
|
|
$ |
183,253 |
|
|
$ |
566,747 |
|
|
$ |
890,736 |
|
|
Wells Fargo(1) |
|
05/25/19 |
|
1 Month Libor |
|
|
2.1 |
|
|
|
3.6 |
|
|
|
750,000 |
|
|
|
232,462 |
|
|
|
517,538 |
|
|
|
814,886 |
|
|
JP Morgan(1) |
|
08/20/18 |
|
1 Month Libor |
|
|
2.5 |
|
|
|
4.0 |
|
|
|
376,942 |
|
|
|
120,014 |
|
|
|
256,928 |
|
|
|
382,135 |
|
|
Morgan Stanley(1) |
|
05/04/19 |
|
1 Month Libor |
|
|
2.4 |
|
|
|
3.9 |
|
|
|
500,000 |
|
|
|
120,002 |
|
|
|
379,998 |
|
|
|
533,707 |
|
|
US Bank(1) |
|
12/09/19 |
|
1 Month Libor |
|
|
2.0 |
|
|
|
3.6 |
|
|
|
150,000 |
|
|
|
78,600 |
|
|
|
71,400 |
|
|
|
93,000 |
|
|
Goldman Sachs (CMBS)(2) |
|
03/02/18 |
|
3 Month Libor |
|
|
0.1 |
|
|
|
1.6 |
|
|
|
100,000 |
|
|
|
64,615 |
|
|
|
35,385 |
|
|
|
39,332 |
|
|
Royal Bank of Canada (CMBS)(2) |
|
03/20/18 |
|
3 Month Libor |
|
|
1.0 |
|
|
|
2.6 |
|
|
|
100,000 |
|
|
|
92,195 |
|
|
|
7,805 |
|
|
|
8,418 |
|
|
Subtotal |
|
|
|
|
|
|
|
|
|
|
|
|
|
$ |
2,726,942 |
|
|
$ |
891,141 |
|
|
$ |
1,835,801 |
|
|
$ |
2,762,214 |
|
|
Senior Secured Credit Facility |
|
Maturity Date |
|
Index Rate |
|
Weighted Average Spread |
|
|
Interest Rate |
|
|
Commitment Amount |
|
|
Maximum Current Availability |
|
|
Balance Outstanding |
|
|
Principal Balance of Collateral |
|
||||||
|
Bank of America(1) |
|
09/29/20 |
|
1 Month Libor |
|
|
— |
|
|
|
— |
|
|
$ |
250,000 |
|
|
$ |
250,000 |
|
|
|
— |
|
|
|
— |
|
|
Total |
|
|
|
|
|
|
|
|
|
|
|
|
|
$ |
3,376,158 |
|
|
$ |
1,250,870 |
|
|
$ |
2,125,288 |
|
|
$ |
3,192,866 |
|
|
(1) |
Borrowings under secured revolving repurchase agreements, senior secured credit facility, and one note payable with a guarantee for 25% recourse. |
|
(2) |
Borrowings under secured revolving repurchase agreements with a guarantee for 100% recourse. Maturity Date represents the sooner of the next maturity date of the CMBS secured revolving repurchase agreement, or roll over date for the applicable underlying trade confirmation, subsequent to December 31, 2017. |
|
As of December 31, 2016 |
|
|||||||||||||||||||||||||||
|
Notes Payable |
|
Maturity Date |
|
Index Rate |
|
Weighted Average Spread |
|
|
Interest Rate |
|
|
Commitment Amount |
|
|
Maximum Current Availability |
|
|
Balance Outstanding |
|
|
Principal Balance of Collateral |
|
||||||
|
Bank of the Ozarks |
|
8/23/2019 |
|
1 Month Libor |
|
|
4.5 |
% |
|
|
5.1 |
% |
|
$ |
92,400 |
|
|
$ |
72,544 |
|
|
$ |
19,856 |
|
|
$ |
28,366 |
|
|
Deutsche Bank |
|
9/25/2019 |
|
1 Month Libor |
|
|
3.5 |
|
|
|
4.1 |
|
|
|
64,779 |
|
|
|
30,207 |
|
|
|
34,572 |
|
|
|
57,620 |
|
|
Deutsche Bank |
|
12/9/2018 |
|
1 Month Libor |
|
|
3.3 |
|
|
|
3.9 |
|
|
|
49,644 |
|
|
|
29,293 |
|
|
|
20,351 |
|
|
|
31,309 |
|
|
Deutsche Bank |
|
9/29/2018 |
|
1 Month Libor |
|
|
3.7 |
|
|
|
4.3 |
|
|
|
42,543 |
|
|
|
5,940 |
|
|
|
36,603 |
|
|
|
52,303 |
|
|
Subtotal |
|
|
|
|
|
|
|
|
|
|
|
|
|
$ |
249,366 |
|
|
$ |
137,984 |
|
|
$ |
111,382 |
|
|
$ |
169,598 |
|
F-20
|
Repurchase Agreements |
|
Maturity Date |
|
Index Rate |
|
Weighted Average Spread |
|
|
Interest Rate |
|
|
Commitment Amount |
|
|
Maximum Current Availability |
|
|
Balance Outstanding |
|
|
Principal Balance of Collateral |
|
||||||
|
Goldman Sachs(1) |
|
8/19/2017 |
|
1 Month Libor |
|
|
2.2 |
% |
|
|
2.9 |
% |
|
$ |
500,000 |
|
|
$ |
249,110 |
|
|
$ |
250,890 |
|
|
$ |
363,146 |
|
|
Wells Fargo(1) |
|
5/25/2019 |
|
1 Month Libor |
|
|
2.2 |
|
|
|
3.0 |
|
|
|
500,000 |
|
|
|
179,729 |
|
|
|
320,271 |
|
|
|
461,618 |
|
|
JP Morgan(1) |
|
8/20/2018 |
|
1 Month Libor |
|
|
2.7 |
|
|
|
3.4 |
|
|
|
313,750 |
|
|
|
25,001 |
|
|
|
288,749 |
|
|
|
414,269 |
|
|
Morgan Stanley(1) |
|
5/3/2019 |
|
1 Month Libor |
|
|
2.5 |
|
|
|
3.2 |
|
|
|
250,000 |
|
|
|
124,036 |
|
|
|
125,964 |
|
|
|
175,884 |
|
|
Goldman Sachs (CMBS)(2) |
|
8/19/2017 |
|
3 Month Libor |
|
|
2.0 |
|
|
|
2.6 |
|
|
|
100,000 |
|
|
|
73,195 |
|
|
|
26,805 |
|
|
|
43,500 |
|
|
Royal Bank of Canada (CMBS)(2) |
|
2/9/2021 |
|
3 Month Libor |
|
|
1.0 |
|
|
|
1.6 |
|
|
|
100,000 |
|
|
|
91,150 |
|
|
|
8,850 |
|
|
|
9,347 |
|
|
Subtotal |
|
|
|
|
|
|
|
|
|
|
|
|
|
$ |
1,763,750 |
|
|
$ |
742,221 |
|
|
$ |
1,021,529 |
|
|
$ |
1,467,764 |
|
|
Subscription Secured Facility |
|
Maturity Date |
|
Index Rate |
|
Weighted Average Spread |
|
|
Interest Rate |
|
|
Commitment Amount |
|
|
Maximum Current Availability |
|
|
Balance Outstanding |
|
|
Principal Balance of Collateral |
|
||||||
|
Lloyds Bank |
|
1/6/2018 |
|
1 Month Libor |
|
|
1.8 |
% |
|
|
2.5 |
% |
|
$ |
250,000 |
|
|
$ |
109,142 |
|
|
|
— |
|
|
|
— |
|
|
Total |
|
|
|
|
|
|
|
|
|
|
|
|
|
$ |
2,263,116 |
|
|
$ |
989,347 |
|
|
$ |
1,132,911 |
|
|
$ |
1,637,362 |
|
|
(1) |
Borrowings under secured revolving repurchase agreements with a guarantee for 25% recourse. |
|
(2) |
Borrowings under secured revolving repurchase agreements with a guarantee for 100% recourse. |
Notes Payable
As of December 31, 2017 and December 31, 2016, the Company had seven and four note-on-note financing agreements, respectively, to finance certain of its lending activities. These loans allow for additional advances up to a specified cap and are secured by seven and four loans held for investment, respectively. The Company’s note-on-note agreements have the following guarantees:
|
|
(1) |
Deutsche Bank and Bank of the Ozarks: Holdco has provided funding guarantees under which Holdco guarantees the funding obligations of the special purpose lending entity in limited circumstances. In addition, under the Deutsche Bank and Bank of the Ozarks asset-specific financings, Holdco has delivered limited non-recourse carve-out guarantees in favor of the lenders as additional credit support for the financings. These guarantees trigger recourse to Holdco as a result of certain “bad boy” defaults for actual losses incurred by such party, or the entire outstanding obligations of the financing borrower, depending on the nature of the “bad boy” default in question; and |
|
|
(2) |
BMO Harris: Holdco has delivered a payment guarantee in favor of the lender as additional credit support for the financing. The liability of Holdco under this guarantee is generally capped at 25% of the outstanding obligations of the special purpose subsidiary which is the primary obligor under the financing. In addition, Holdco has delivered a non-recourse carveout guarantee, which can trigger recourse to Holdco as a result of certain “bad boy” defaults for losses incurred by BMO Harris or the entire outstanding obligations of the financing borrower, depending on the nature of the “bad boy” default in question. |
All loans at December 31, 2017 are guaranteed by Holdco, and the agreements include guarantor covenants regarding liquid assets and net worth requirements. The Company believes it is in compliance with all covenants as of December 31, 2017 and December 31, 2016. One of these loans at December 31, 2017 is 25% recourse to Holdco.
F-21
Secured Revolving Repurchase Agreements
The Company frequently utilizes secured revolving repurchase agreements to finance the direct origination or acquisition of commercial real estate mortgage loans and CMBS. Under these secured revolving repurchase agreements, the Company transfers all of its rights, title and interest in the loans or CMBS to the repurchase counterparty in exchange for cash, and simultaneously agrees to reacquire the asset at a future date for an amount equal to the cash exchanged plus an interest factor. The repurchase counterparty collects all principal and interest on related loans or CMBS and remits to the Company only the net after collecting its interest and other fees.
During the years ended December 31, 2017 and December 31, 2016, the Company entered into one and two additional secured revolving repurchase agreements, respectively, to finance its lending activities. Credit spreads vary depending on property type and advance rate. Assets pledged are mortgage loans collateralized by commercial properties. These facilities are 25% recourse to Holdco.
On July 21, 2017, the Company closed an amendment to its existing secured revolving repurchase facility with Morgan Stanley Bank, N.A. to increase the maximum facility amount to $400 million from $250 million. Additionally, the Company has the right to further upsize the facility to $500 million from $400 million upon at least five days’ notice, subject to customary conditions. The facility was also amended to provide for an extended maturity in May 2020 and can be extended by the Company for additional successive one year periods, subject to approval by the lender. As was the case prior to the amendment, the number of extension options is not limited by the terms of this facility. On December 27, 2017 the Company exercised its right to upsize the facility to $500 million.
On August 18, 2017, and in connection with the repayment of the Class A Note and the termination of the collateralized loan obligation, the Company closed an amendment to its existing secured revolving repurchase facility with JPMorgan Chase Bank, N.A. to increase the maximum facility amount by $103.5 million, to $417.3 million, and to include as pledged collateral under the facility the seven first mortgage loan participation interests purchased from the CLO Issuer by one of our wholly-owned subsidiaries on August 18, 2017. With respect only to the upsize amount, amounts borrowed may not be repaid and reborrowed. All other material terms of the credit facility remain unchanged.
On June 12, 2017, the Company closed an amendment to its existing secured revolving repurchase facility with Goldman Sachs Bank USA, to increase the maximum facility amount to $750 million from $500 million. The current extended maturity of this facility is August 2019.
On June 8, 2017, the Company closed an amendment to its existing secured revolving repurchase facility with Wells Fargo Bank, National Association to increase the maximum facility amount to $750 million from $500 million. The current extended maturity of this facility is May 2021.
At December 31, 2017 and December 31, 2016, the Company had two secured revolving repurchase agreements to finance its CMBS investing activities. Credit spreads vary depending upon the CMBS and advance rate. Assets pledged at December 31, 2017 and December 31, 2016 consisted of three and three mortgage-backed securities, respectively. These facilities are 100% recourse to Holdco. The agreements include various covenants covering net worth, liquidity, recourse limitations, and debt coverage. The Company believes it is in compliance with all covenants as of December 31, 2017 and December 31, 2016.
F-22
The following table summarizes certain characteristics of the Company’s secured revolving repurchase agreements secured by commercial mortgage loans, all of which are considered long-term borrowings, and comprise counterparty concentration risks, at December 31, 2017 (dollars in thousands):
|
|
|
December 31, 2017 |
|
|||||||||||||||||||||||||
|
|
|
Commitment Amount |
|
|
UPB of Collateral |
|
|
Carrying Value of Collateral(1) |
|
|
Amounts Payable under Repurchase Agreements(2) |
|
|
Net Counterparty Exposure(3) |
|
|
Percent of Stockholders' Equity |
|
|
Days to Extended Maturity |
|
|||||||
|
Goldman Sachs Bank |
|
$ |
750,000 |
|
|
$ |
890,736 |
|
|
$ |
887,667 |
|
|
$ |
568,012 |
|
|
$ |
319,655 |
|
|
|
26.6 |
% |
|
|
596 |
|
|
Wells Fargo Bank |
|
|
750,000 |
|
|
|
814,886 |
|
|
|
811,257 |
|
|
|
518,353 |
|
|
|
292,904 |
|
|
|
24.4 |
|
|
|
1,241 |
|
|
Morgan Stanley Bank(4) |
|
|
500,000 |
|
|
|
533,707 |
|
|
|
531,747 |
|
|
|
380,592 |
|
|
|
151,155 |
|
|
|
12.6 |
|
|
N/A |
|
|
|
JP Morgan Chase Bank |
|
|
376,942 |
|
|
|
382,135 |
|
|
|
382,542 |
|
|
|
257,484 |
|
|
|
125,058 |
|
|
|
10.4 |
|
|
|
963 |
|
|
US Bank |
|
|
150,000 |
|
|
|
93,000 |
|
|
|
92,448 |
|
|
|
71,573 |
|
|
|
20,875 |
|
|
|
1.7 |
|
|
|
1,804 |
|
|
Subtotal / Weighted Average |
|
$ |
2,526,942 |
|
|
$ |
2,714,464 |
|
|
$ |
2,705,661 |
|
|
$ |
1,796,014 |
|
|
$ |
909,647 |
|
|
|
|
|
|
|
960 |
|
|
(1) |
Amounts shown in the table include interest receivable of $11.6 million and are net of premium, discount and origination fees of $20.4 million. |
|
(2) |
Amounts shown in the table include interest payable of $3.4 million and do not reflect unamortized deferred financing fees of $8.7 million. |
|
(3) |
Represents the net carrying value of the commercial real estate assets sold under agreements to repurchase, including accrued interest plus any cash or assets on deposit to secure the repurchase obligation, less the amount of the repurchase liability, including accrued interest. |
|
(4) |
The Morgan Stanley Bank credit facility is excluded from the Days to Extended Maturity calculation because it does not have a contractual maturity date. |
The following table summarizes certain characteristics of the Company’s secured revolving repurchase agreements secured by CMBS, all of which are considered short-term borrowings, and comprise counterparty concentration risks, at December 31, 2017 (dollars in thousands):
|
|
|
December 31, 2017 |
|
|||||||||||||||||||||||||
|
|
|
Commitment Amount |
|
|
UPB of Collateral |
|
|
Carrying Value of Collateral(1) |
|
|
Amounts Payable under Repurchase Agreements(2) |
|
|
Net Counterparty Exposure(3) |
|
|
Percent of Stockholders' Equity |
|
|
Days to Extended Maturity(4) |
|
|||||||
|
Goldman Sachs Bank |
|
$ |
100,000 |
|
|
$ |
39,332 |
|
|
$ |
39,213 |
|
|
$ |
35,426 |
|
|
$ |
3,787 |
|
|
|
0.3 |
% |
|
$ |
61 |
|
|
Royal Bank of Canada |
|
|
100,000 |
|
|
|
8,418 |
|
|
|
8,675 |
|
|
|
7,879 |
|
|
|
796 |
|
|
|
0.1 |
|
|
|
79 |
|
|
Subtotal / Weighted Average |
|
$ |
200,000 |
|
|
$ |
47,750 |
|
|
$ |
47,888 |
|
|
$ |
43,305 |
|
|
$ |
4,583 |
|
|
|
|
|
|
|
64 |
|
|
Total / Weighted Average - Loans and CMBS |
|
$ |
2,726,942 |
|
|
$ |
2,762,214 |
|
|
$ |
2,753,549 |
|
|
$ |
1,839,319 |
|
|
$ |
914,230 |
|
|
|
|
|
|
|
933 |
|
|
(1) |
Amounts shown in the table include interest receivable of $0.1 million and are net of premium, discount, and unrealized gains of $0.0 million. |
|
(2) |
Amounts shown in the table include interest payable of $0.1 million and do not reflect unamortized deferred financing fees of $0.0 million. |
|
(3) |
Represents the net carrying value of available-for-sale securities sold under agreements to repurchase, including accrued interest plus any cash or assets on deposit to secure the repurchase obligation, less the amount of the repurchase liability, including accrued interest. |
|
(4) |
Represents the sooner of the next maturity date of the CMBS secured revolving repurchase agreement, or roll over date for the applicable underlying trade confirmation, subsequent to December 31, 2017. |
F-23
The following table summarizes certain characteristics of the Company’s secured revolving repurchase agreements secured by commercial mortgage loans, all of which are considered long-term borrowings, and comprise counterparty concentration risks, at December 31, 2016 (dollars in thousands):
|
|
|
December 31, 2016 |
|
|||||||||||||||||||||||||
|
|
|
Commitment Amount |
|
|
UPB of Collateral |
|
|
Carrying Value of Collateral(1) |
|
|
Amounts Payable under Repurchase Agreements(2) |
|
|
Net Counterparty Exposure(3) |
|
|
Percent of Stockholders' Equity |
|
|
Days to Extended Maturity |
|
|||||||
|
Wells Fargo Bank |
|
$ |
500,000 |
|
|
$ |
461,618 |
|
|
$ |
450,338 |
|
|
$ |
320,175 |
|
|
$ |
130,163 |
|
|
|
13.4 |
% |
|
|
1,606 |
|
|
Goldman Sachs Bank |
|
|
500,000 |
|
|
|
363,146 |
|
|
|
361,964 |
|
|
|
251,366 |
|
|
|
110,598 |
|
|
|
11.4 |
|
|
|
961 |
|
|
JP Morgan Chase Bank |
|
|
313,750 |
|
|
|
414,269 |
|
|
|
414,461 |
|
|
|
289,206 |
|
|
|
125,255 |
|
|
|
12.9 |
|
|
|
1,328 |
|
|
Morgan Stanley Bank(4) |
|
|
250,000 |
|
|
|
175,884 |
|
|
|
175,178 |
|
|
|
126,152 |
|
|
|
49,026 |
|
|
|
5.1 |
|
|
N/A |
|
|
|
Subtotal |
|
$ |
1,563,750 |
|
|
$ |
1,414,917 |
|
|
$ |
1,401,941 |
|
|
$ |
986,899 |
|
|
$ |
415,042 |
|
|
|
|
|
|
|
3,895 |
|
|
(1) |
Amounts shown in the table include interest receivable of $0.004 million and are net of premium, discount and origination fees of $0.02 million. |
|
(2) |
Amounts shown in the table include interest payable of $0.001 million and do not reflect unamortized deferred financing fees of $0.01 million. |
|
(3) |
Represents the net carrying value of the commercial real estate assets sold under agreements to repurchase, including accrued interest plus any cash or assets on deposit to secure the repurchase obligation, less the amount of the repurchase liability, including accrued interest. |
|
(4) |
The Morgan Stanley Bank credit facility is excluded from the Days to Extended Maturity calculation because it does not have a contractual maturity date. |
The following table summarizes certain characteristics of the Company’s secured revolving repurchase agreements secured by CMBS, all of which are considered short-term borrowings, and comprise counterparty concentration risks, at December 31, 2016 (dollars in thousands):
|
|
|
December 31, 2016 |
|
|||||||||||||||||||||||||
|
|
|
Commitment Amount |
|
|
UPB of Collateral |
|
|
Carrying Value of Collateral(1) |
|
|
Amounts Payable under Repurchase Agreements(2) |
|
|
Net Counterparty Exposure(3) |
|
|
Percent of Stockholders' Equity |
|
|
Days to Extended Maturity |
|
|||||||
|
Goldman Sachs Bank |
|
$ |
100,000 |
|
|
$ |
43,500 |
|
|
$ |
41,403 |
|
|
$ |
26,832 |
|
|
$ |
14,571 |
|
|
|
1.5 |
% |
|
|
1,502 |
|
|
Royal Bank of Canada |
|
|
100,000 |
|
|
|
9,347 |
|
|
|
9,932 |
|
|
|
8,856 |
|
|
|
1,076 |
|
|
|
0.1 |
|
|
|
1,507 |
|
|
Subtotal |
|
$ |
200,000 |
|
|
$ |
52,847 |
|
|
$ |
51,335 |
|
|
$ |
35,688 |
|
|
$ |
15,647 |
|
|
|
|
|
|
|
3,009 |
|
|
Total / Weighted Average - Loans and CMBS |
|
$ |
1,763,750 |
|
|
$ |
1,467,764 |
|
|
$ |
1,453,276 |
|
|
$ |
1,022,587 |
|
|
$ |
430,689 |
|
|
|
|
|
|
|
1,331 |
|
|
(1) |
Amounts shown in the table include interest receivable of $0.03 million and are net of premium, discount, and unrealized gains of $2.7 million. |
|
(2) |
Amounts shown in the table include interest payable of $0.03 million and do not reflect unamortized deferred financing fees of $0.01 million. |
|
(3) |
Represents the net carrying value of available-for-sale securities sold under agreements to repurchase, including accrued interest plus any cash or assets on deposit to secure the repurchase obligation, less the amount of the repurchase liability, including accrued interest. |
Senior Secured Credit Facility
On September 29, 2017, the Company entered into a senior secured credit facility agreement with Bank of America that has a maximum facility amount of $250 million, which may increase from time to time, up to $500 million, at the request of the Company and agreement by the lender. The current extended maturity of this facility is September 2022.
F-24
On January 6, 2016, the Company entered into a subscription secured revolving credit facility with a commitment of $250 million. Borrowing ability was limited to the lesser of $250 million and 66.67% of unfunded commitments from included investors as defined in the agreement. The credit facility term was two years with a one year extension option at a rate of LIBOR plus 1.75%. Upon the completion of the Company’s initial public offering in July 2017, the Company cancelled the unfunded commitments and terminated this facility.
(7) Schedule of Maturities
The future principal payments for the five years subsequent to December 31, 2017 and thereafter are as follows (in thousands):
|
|
|
Senior Secured Credit Facility |
|
|
Repurchase Agreements |
|
|
Notes Payable |
|
|||
|
2018 |
|
$ |
— |
|
|
$ |
959,362 |
|
|
$ |
208,103 |
|
|
2019 |
|
|
— |
|
|
|
876,439 |
|
|
|
48,884 |
|
|
2020 |
|
|
— |
|
|
|
— |
|
|
|
32,500 |
|
|
2021 |
|
|
— |
|
|
|
— |
|
|
|
— |
|
|
2022 |
|
|
— |
|
|
|
— |
|
|
|
— |
|
|
Thereafter |
|
|
— |
|
|
|
— |
|
|
|
— |
|
|
Total |
|
$ |
— |
|
|
$ |
1,835,801 |
|
|
$ |
289,487 |
|
(8) Fair Value Measurements
The Company’s consolidated balance sheet includes Level I fair value measurements related to cash equivalents, restricted cash, accounts receivable, and accounts payable and accrued liabilities. At December 31, 2017, the Company had $37.5 million invested in money market funds with original maturities of less than 90 days. The carrying values of these financial assets and liabilities are reasonable estimates of fair value because of the short-term maturities of these instruments. The consolidated balance sheet also includes Loans Held for Investment, a collateralized loan obligation (as of December 31, 2016), and secured financing arrangements that are considered Level III fair value measurements that are not measured at fair value on a recurring basis, but are subject to fair value adjustments utilizing the fair value of the underlying collateral when there is evidence of impairment. The Company did not have any nonrecurring fair value items as of December 31, 2017 and December 31, 2016.
The following tables provide information about financial assets and liabilities not carried at fair value on a recurring basis in our consolidated balance sheet (dollars in thousands):
|
|
|
December 31, 2017 |
|
|||||||||||||
|
|
|
|
|
|
|
Fair Value |
|
|||||||||
|
|
|
Carrying Value |
|
|
Level I |
|
|
Level II |
|
|
Level III |
|
||||
|
Financial Assets |
|
|
|
|
|
|
|
|
|
|
|
|
|
|
|
|
|
Loans Held for Investment |
|
$ |
3,175,672 |
|
|
|
— |
|
|
|
— |
|
|
$ |
3,202,150 |
|
|
Financial Liabilities |
|
|
|
|
|
|
|
|
|
|
|
|
|
|
|
|
|
Secured Financing Arrangements |
|
|
2,114,990 |
|
|
|
— |
|
|
|
— |
|
|
|
2,114,990 |
|
|
|
|
December 31, 2016 |
|
|||||||||||||
|
|
|
|
|
|
|
Fair Value |
|
|||||||||
|
|
|
Carrying Value |
|
|
Level I |
|
|
Level II |
|
|
Level III |
|
||||
|
Financial Assets |
|
|
|
|
|
|
|
|
|
|
|
|
|
|
|
|
|
Loans Held for Investment |
|
$ |
2,449,990 |
|
|
|
— |
|
|
|
— |
|
|
$ |
2,469,717 |
|
|
Financial Liabilities |
|
|
|
|
|
|
|
|
|
|
|
|
|
|
|
|
|
Collateralized Loan Obligation |
|
|
540,780 |
|
|
|
— |
|
|
|
— |
|
|
|
540,780 |
|
|
Secured Financing Arrangements |
|
|
1,121,869 |
|
|
|
— |
|
|
|
— |
|
|
|
1,121,869 |
|
F-25
Level III fair values were determined based on standardized valuation models and significant unobservable market inputs, including holding period, discount rates based on loan to value, property type and loan pricing expectations developed by the Manager that were corroborated with other institutional lenders to determine a market spread that was added to the one-month LIBOR forward curve. There were no transfers of financial assets or liabilities within the fair value hierarchy during the year ended December 31, 2017.
At December 31, 2017 and December 31, 2016, the estimated fair value of loans held for investment was $3.2 billion and $2.5 billion, respectively. The average gross spread at December 31, 2017 and December 31, 2016 was 4.8% and 5.10%, respectively. The weighted average years to maturity at December 31, 2017 and December 31, 2016 was 3.6 years and 3.0 years, respectively, assuming full extension of all loans.
At December 31, 2017 and December 31, 2016, the carrying value of the secured financing agreements approximates fair value as current borrowing spreads reflect market terms. At December 31, 2016, the carrying value of the collateralized loan obligation approximates fair value as current borrowing spreads reflect market terms.
(9) Income Taxes
During the years ended December 31, 2017 and 2016, the Company indirectly owned 100% of the equity of TPG RE Finance Trust CLO TRS Corp. (“CLO TRS”), TPG RE Finance Trust CLO TRS 1 Corp. (“TRS 1”) and TPG RE Finance Trust CLO TRS 2 Corp. (“TRS 2”), each of which is a taxable REIT subsidiary (collectively, “TRS”). TRS is subject to applicable U.S. federal, state, local and foreign income tax on its taxable income. In addition, as a REIT, the Company also may be subject to a 100% excise tax on certain transactions between it and its TRS that are not conducted on an arm’s-length basis. The Company files income tax returns in the United States federal jurisdiction as well as various state and local jurisdictions. The filings are subject to normal reviews by regulatory agencies until the related statute of limitations expires, with open tax years for all years since the Company’s initial capitalization in 2014. The years open to examination range from 2014 to present.
The Company’s TRS had no operations as of December 31, 2017 and December 31, 2016, and accordingly no deferred tax assets or liabilities exist relating to the TRS’s operations. On December 31, 2017, TRS was dissolved as a result of the transactions that lead to the Company’s termination of its collateralized loan obligation discussed in Note 5.
ASC 740 also prescribes a recognition threshold and measurement attribute for the financial statement recognition and measurement of a tax position taken or expected to be taken in a tax return. ASC 740 also provides guidance on derecognition, classification, interest and penalties, accounting in interim periods, disclosure and transition. The Company has analyzed its various federal and state filing positions and believes that its income tax filing positions and deductions are well documented and supported. As of December 31, 2017 and December 31, 2016, based on the Company’s evaluation, there is no reserve for any uncertain income tax positions.
The Company’s policy is to classify interest and penalties associated with underpayment of U.S. federal and state income taxes, if any, as a component of general and administrative expense on its consolidated statements of income. For the years ended December 31, 2017 and 2016, the Company did not have interest or penalties associated with the underpayment of any income taxes.
The following table details the income tax treatment for the Company’s common and Class A common stock dividends declared as follows (dollars in thousands):
|
|
|
Year Ended December 31, |
|
|||||||||
|
|
|
2017 |
|
|
2016 |
|
|
2015 |
|
|||
|
Ordinary dividends |
|
$ |
1.52 |
|
|
$ |
1.62 |
|
|
$ |
1.91 |
|
|
Capital gain (loss) dividends |
|
|
0.04 |
|
|
|
— |
|
|
|
— |
|
|
Totals(1) |
|
$ |
1.56 |
|
|
$ |
1.62 |
|
|
$ |
1.91 |
|
F-26
|
(1) |
Dividend per share amounts reflect the impact of the common stock and Class A common stock dividend paid upon the completion of our initial public offering. |
For the years ended December 31, 2017, December 31, 2016, and December 31, 2015, the Company incurred $0.1 million, $0.0 million, and $1.6 million respectively of federal, state and local tax expense relating to its TRS. At December 31, 2017, December 31, 2016, and December 31, 2015, the Company’s effective tax rate was 0.2%, 0.0%, and 2.73%, respectively.
At December 31, 2017, December 31, 2016, and December 31, 2015, the Company had no deferred tax assets or liabilities.
(10) Related Party Transactions
Management Agreements
Pre-IPO Management Agreement
The Company is externally managed and advised by the Manager and, through July 24, 2017, paid the Manager a management fee in accordance with the management agreement which was executed on December 15, 2014 (the “pre-IPO Management Agreement”). For the year ended December 31, 2017, the management fee and incentive management fee calculated under the pre-IPO Management Agreement was from January 1, 2017 through July 24, 2017, or 204 days. The management fee under the pre-IPO Management Agreement was equal to 1.25% of the Company’s stockholders’ equity per annum, which was calculated and payable quarterly in arrears. For purposes of calculating the management fee under the pre-IPO Management Agreement, stockholders’ equity meant: (i) the sum of (A) the net proceeds received by the Company from all issuances of the Company’s common stock, plus (B) the Company’s cumulative Core Earnings from and after the date of the pre-IPO Management Agreement to the end of the most recently completed calendar quarter, (ii) less (A) any distributions to the Company’s stockholders from and after the date of the pre-IPO Management Agreement, (B) any amount that the Company or any of its subsidiaries had paid to repurchase the Company’s common stock since the date of the pre-IPO Management Agreement, and (C) any incentive management fee paid from and after the date of the pre-IPO Management Agreement. With respect to that portion of the period from and after the date of the pre-IPO Management Agreement that was used in any calculation of the incentive management fee or the management fee under the pre-IPO Management Agreement, all items in the foregoing sentence (other than clause (i) (B)) were calculated on a daily weighted average basis.
In addition, the Manager was entitled to an incentive management fee each calendar quarter in arrears in an amount, not less than zero, equal to the product of (i) 16% and (ii) the positive sum, if any, remaining after (A) Core Earnings of the Company for such calendar quarter were reduced by (B) the product of (1) the Company’s stockholders’ equity as of the end of such calendar quarter, and (2) 7% per annum; provided, however, that no incentive management fee was payable with respect to any calendar quarter unless Core Earnings for the 12 most recently completed calendar quarters was greater than zero. The Manager also acted as Collateral Manager for the CLO. The collateral management fee was equal to 0.075% per annum of the aggregate par amount of the loans in the CLO, and was calculated and payable monthly in arrears in cash. Pursuant to an arrangement that the Company had with the Manager prior to the Company’s initial public offering, the Company was entitled to reduce the base management fee payable to the Manager under the pre-IPO Management Agreement by an amount equal to the collateral management fee the Manager was entitled to receive for acting as the collateral manager for the CLO. After the completion of the initial public offering and prior to the termination of the CLO, the Manager was entitled to earn a collateral management fee for acting as the collateral manager for the CLO without any reduction or offset right to the base management fee payable to the Manager under the Management Agreement (as defined below). As of December 31, 2017 and December 31, 2016, the aggregate par amount of the loans in the CLO was $0.0 million and $712.4 million, respectively.
Post-IPO Management Agreement
Upon the completion of the Company’s initial public offering on July 25, 2017, the pre-IPO Management Agreement terminated, without payment of any termination fee to the Manager, and the Company entered into a new
F-27
management agreement with the Manager (the “Management Agreement”). For the year ended December 31, 2017, the management fee and incentive management fee calculated under the Management Agreement was from July 25, 2017 through December 31, 2017, or 161 days.
Pursuant to the Management Agreement, the Company pays the Manager a base management fee equal to the greater of $250,000 per annum ($62,500 per quarter) and 1.50% per annum (0.375% per quarter) of the Company’s “Equity.” The base management fee is payable in cash, quarterly in arrears. “Equity” means: (1) the sum of (a) the net proceeds received by the Company from all issuances of the Company’s common stock and Class A common stock (for purposes of calculating this amount, the net proceeds received by the Company from all issuances of the Company’s outstanding common stock and Class A common stock prior to the completion of the Company’s initial public offering equals approximately $1.0 billion), plus (b) the Company’s cumulative Core Earnings for the period commencing on the completion of the Company’s initial public offering to the end of the most recently completed calendar quarter, and (2) less (a) any distributions to the Company’s stockholders following the completion of the Company’s initial public offering, (b) any amount that the Company or any of its subsidiaries have paid to repurchase for cash the Company’s common stock or Class A common stock following the completion of the Company’s initial public offering and (c) any incentive compensation earned by the Manager following the completion of the Company’s initial public offering. With respect to that portion of the period from and after the completion of the Company’s initial public offering that is used in the calculation of incentive compensation, which is described below, or the base management fee, all items in the foregoing sentence (other than the Company’s cumulative Core Earnings) will be calculated on a daily weighted average basis.
The Manager is entitled to incentive compensation which is calculated and payable in cash with respect to each calendar quarter following the completion of the Company’s initial public offering (or part thereof that the Management Agreement is in effect) in arrears in an amount, not less than zero, equal to the difference between: (1) the product of (a) 20% and (b) the difference between (i) the Company’s Core Earnings for the most recent 12-month period (or such lesser number of completed calendar quarters, if applicable), including the calendar quarter (or part thereof) for which the calculation of incentive compensation is being made (the “applicable period”), and (ii) the product of (A) the Company’s Equity in the most recent 12-month period (or such lesser number of completed calendar quarters, if applicable), including the applicable period, and (B) 7% per annum; and (2) the sum of any incentive compensation paid to the Manager with respect to the first three calendar quarters of the most recent 12-month period (or such lesser number of completed calendar quarters preceding the applicable period, if applicable). No incentive compensation is payable to the Manager with respect to any calendar quarter unless Core Earnings for the 12 most recently completed calendar quarters (or such lesser number of completed calendar quarters following the completion of the Company’s initial public offering) is greater than zero.
The Company is required to reimburse the Manager or its affiliates for documented costs and expenses incurred by it and its affiliates on the Company’s behalf except those specifically required to be borne by the Manager or its affiliates under the Management Agreement. The Company’s reimbursement obligation is not subject to any dollar limitation. The Manager or its affiliates is responsible for, and the Company will not reimburse the Manager or its affiliates for, the expenses related to the personnel of the Manager and its affiliates who provide services to the Company. However, the Company will reimburse the Manager for the Company’s allocable share of the compensation (including, without limitation, annual base salary, bonus, any related withholding taxes and employee benefits) paid to (1) the Manager’s personnel serving as the Company’s chief financial officer based on the percentage of his or her time spent managing the Company’s affairs and (2) other corporate finance, tax, accounting, internal audit, legal risk management, operations, compliance and other non-investment personnel of the Manager or its affiliates who spend all or a portion of their time managing the Company’s affairs, based on the percentage of time devoted by such personnel to the Company’s and the Company’s subsidiaries’ affairs.
Management Fees Incurred and Paid for the years ended December 31, 2017, 2016 and 2015
For the years ended December 31, 2017, December 31, 2016, and December 31, 2015, the Company incurred an aggregate of $10.0 million, $13.4 million, and $10.2 million, respectively, to the Manager for management fees and incentive management fees under the pre-IPO Management Agreement and collateral management fees under the collateral management agreement for the CLO. Additionally, for the year ended December 31, 2017 the Company incurred an aggregate of $8.6 million to the Manager for management fees and incentive management fees under the post-IPO Management Agreement. For the year ended December 31, 2017, under the pre-IPO and post-
F-28
IPO Management Agreements, the Company paid an aggregate of $16.4 million to the Manager for management fees and incentive management fees and collateral management fees under the collateral management agreement for the CLO. Management fees, incentive management fees, and collateral management fees included in payable to affiliates on the consolidated balance sheets at December 31, 2017, December 31, 2016, and December 31, 2015 is approximately $5.2 million, $2.9 million, and $3.4 million, respectively.
The Company is responsible for reimbursing the Manager for certain expenses paid by the Manager on behalf of the Company or for certain services provided by the Manager to the Company. Expenses incurred by the Manager and reimbursed by the Company are reflected in the respective consolidated statements of income expense category or the consolidated balance sheets based on the nature of the item. For the years ended December 31, 2017, December 31, 2016, and December 31, 2015, $1.0 million, $0.3 million, and $0.0 million were incurred by the Manager and reimbursable by the Company, respectively.
Termination Fee
A termination fee will be payable to the Manager upon termination of the Management Agreement by the Company absent a cause event. The termination fee would also be payable to the Manager upon termination of the Management Agreement by the Manager if the Company materially breaches the Management Agreement. The termination fee is equal to three times the sum of (x) the average annual base management fee and (y) the average annual incentive compensation earned by the Manager, in each case during the 24-month period immediately preceding the most recently completed calendar quarter prior to the date of termination or, if such termination occurs prior to July 25, 2019, and such termination fee is payable, the base management fees and the incentive compensation will be annualized for the period from July 25, 2017 to July 25, 2019 based on such fees actually received by the Manager during such period.
(11) Earnings per Share
The Company calculates its basic and diluted earnings per share using the two-class method for all periods presented, as the unvested shares of its common stock qualify as participating securities. These restricted shares have the same rights as the Company’s other shares of common stock and Class A common stock, including participating in any dividends, and therefore have been included in the Company’s basic and diluted earnings per share calculation. For the year ended December 31, 2017, $0.03 million and $0.01 million of common stock dividends declared and undistributed net income attributable to common stockholders, respectively were allocated to unvested shares of our common stock.
At December 31, 2017, all share and per share data reflect the impact of the common stock and Class A common stock dividend which was paid upon completion of the Company’s initial public offering on July 25, 2017 to holders of record as of July 3, 2017. The following table sets forth the calculation of basic and diluted earnings per common share (common stock and Class A common stock) based on the weighted-average number of shares of common stock and Class A common stock outstanding (in thousands, except share and per share data):
|
|
|
Three Months Ended December 31, (unaudited) |
|
|
Year Ended December 31, |
|
||||||||||||||
|
|
|
2017 |
|
|
2016 |
|
|
2017 |
|
|
2016 |
|
|
2015 |
|
|||||
|
Net Income Attributable to Common Stockholders |
|
$ |
24,754 |
|
|
$ |
19,155 |
|
|
$ |
94,336 |
|
|
$ |
69,951 |
|
|
$ |
59,340 |
|
|
Weighted-Average Common Shares Outstanding, Basic and Diluted |
|
|
60,796,636 |
|
|
|
48,282,984 |
|
|
|
54,194,596 |
|
|
|
41,406,026 |
|
|
|
32,867,969 |
|
|
Per Common Share Amount, Basic and Diluted |
|
$ |
0.41 |
|
|
$ |
0.40 |
|
|
$ |
1.74 |
|
|
$ |
1.69 |
|
|
$ |
1.81 |
|
F-29
Initial Public Offering
On July 25, 2017, the Company completed an initial public offering of 11 million shares of common stock at a price of $20.00 per share for net proceeds of $199.4 million, after deducting underwriting discounts of $13.2 million and offering expenses payable by us of approximately $7.4 million. On August 17, 2017, the underwriters of the Company’s initial public offering partially exercised their option to purchase up to an additional 1,650,000 shares of common stock. On August 22, 2017, the Company issued and sold, and the underwriters purchased, 650,000 shares of common stock for net proceeds of $12.2 million, after deducting underwriting discounts of $0.8 million. The Company used the net proceeds from the offering to originate commercial mortgage loans consistent with its investment strategy and investment guidelines.
On July 28, 2017, the Company paid GACC $2.0 million related to its contractual deferred purchase price obligation due in the event the Company consummated an initial public offering on or before December 29, 2017.
Stock Dividend
On July 3, 2017, we declared a stock dividend that resulted in the issuance of 9,224,268 shares of our common stock and 230,815 shares of our Class A common stock upon the completion of our initial public offering. The stock dividend was paid on July 25, 2017 to holders of record of our common stock and Class A common stock as of July 3, 2017. All prior periods have been restated to give effect to the impact of these transactions on our common and Class A common stock issued, shares outstanding, per share calculations, and basic and diluted weighted average number of common shares outstanding.
10b5-1 Purchase Plan
The Company entered into an agreement (the “10b5-1 Purchase Plan”) with Goldman Sachs & Co. LLC, pursuant to which Goldman Sachs & Co. LLC, as our agent, will buy in the open market up to $35.0 million in shares of our common stock in the aggregate during the period beginning on or about August 21, 2017 and ending 12 months thereafter or, if sooner, the date on which all the capital committed to the 10b5-1 Purchase Plan has been exhausted. The 10b5-1 Purchase Plan requires Goldman Sachs & Co. LLC to purchase for us shares of our common stock when the market price per share is below the threshold price specified in the 10b5-1 Purchase Plan which is based on our book value per common share. During the three months ended December 31, 2017, the Company repurchased 386,038 shares of common stock, at a weighted average price of $19.51 per share, for total consideration (including commissions and related fees) of $7.5 million.
Through December 31, 2017, the Company has repurchased 720,783 shares of common stock, at a weighted average price of $19.55 per share, for total consideration (including commissions and related fees) of $14.1 million. At December 31, 2017, the Company’s remaining commitment under the 10b5-1 Purchase Plan is $20.9 million.
Subscriptions
Prior to the completion of the Company’s initial public offering on July 25, 2017, certain of the Company’s pre-IPO investors entered into subscription agreements for specified capital commitments. Unfunded capital commitments as of December 31, 2016 were $181.0 million. In connection with the completion of the Company’s initial public offering, the stockholders agreement between the Company and certain of the Company’s pre-IPO stockholders and all of the obligations of certain of the Company’s pre-IPO stockholders to purchase additional shares of the Company’s common stock and Class A common stock using the undrawn portion of their capital commitments were terminated.
Articles of Amendment and Restatement
On July 19, 2017, the Company filed Articles of Amendment and Restatement with the State Department of Assessments and Taxation of Maryland. The Articles of Amendment and Restatement increased the Company’s authorized common stock to 300,000,000 shares of common stock and 2,500,000 shares of Class A common stock with $0.001 par value per share. Additionally, the Articles of Amendment and Restatement increased our authorized preferred stock to 100,000,000 shares of preferred stock with a $0.001 par value per share. Class A common stock
F-30
has been issued to, and is owned by, certain individuals or entities affiliated with the Manager, and the sale or conversion to common stock by holders of such Class A common stock is subject to certain restrictions.
As of December 31, 2017, the Company’s authorized common stock consisted of 300,000,000 shares of common stock and 2,500,000 shares of Class A common stock with $0.001 par value per share. As of December 31, 2017 and December 31, 2016, the Company had total common stock and Class A common stock shares of 60,618,730 and 48,446,028 issued and outstanding, respectively.
Dividends
Prior to the completion of the Company’s initial public offering, dividends were accrued at the time of approval by the Special Actions Committee (the “Committee”), a standing committee comprised of directors who are employed by TPG Global, LLC or an affiliate thereof. Subsequent to the completion of the Company’s initial public offering, dividends are accrued at the time of approval by the Company’s Board of Directors. Upon the approval of the Committee, or the Company’s Board of Directors, as applicable, dividends are paid first to the holders of the Company’s Series A preferred stock at the rate of 12.5% of the total $0.001 million liquidation preference per annum plus all accumulated and unpaid dividends thereon, and second to the holders of the Company’s common stock and Class A common stock. The Company intends to distribute each year substantially all of its taxable income to its stockholders to comply with the REIT provisions of the Internal Revenue Code of 1986, as amended.
On December 19, 2017, the Company’s Board of Directors declared a dividend for the fourth quarter of 2017 in the amount of $0.38 per share of common stock and Class A common stock, or $23.1 million in the aggregate, which dividend was paid on January 25, 2018 to holders of record of our common stock and Class A common stock as of December 29, 2017. On December 23, 2016, we declared dividends associated with the fourth quarter of 2016 in the aggregate amount of $0.4677 per share of common stock and Class A common stock, or $18.3 million, which were paid in two installments on January 25, 2017 and February 1, 2017.
For the years ended December 31, 2017 and December 31, 2016, common and Class A common stock dividends in the amount of $85.0 million and $66.9 million, respectively, were approved. As of December 31, 2017 and December 31, 2016, $23.1 million and $18.3 million, respectively, remain unpaid and are reflected in dividends payable on the Company’s consolidated balance sheets.
Liquidation
Upon liquidation of the Company, subsequent to the redemption of preferred stock, the net assets attributable to all classes of common stock shall be distributed pro rata among the common shareholders in proportion to the number of shares of common stock, regardless of class, held by each such holder.
Other Comprehensive (Loss) Income
For the years ended December 31, 2017 and December 31, 2016, other comprehensive (loss) income was $(1.3) million and $1.3 million, respectively. Other comprehensive (loss) income is a result of unrealized (losses) gains on available-for-sale CMBS investments.
(13) Share-based Incentive Plan
The Company does not have any employees as we are externally managed by our Manager. However, as of December 31, 2017, certain individuals employed by an affiliate of our Manager and certain members of our Board of Directors were compensated, in part, through the issuance of share-based instruments.
The Company’s Board of Directors has adopted, and the Company’s stockholders have approved, the TPG RE Finance Trust, Inc. 2017 Equity Incentive Plan (the “Incentive Plan”). The Incentive Plan provides for the grant of equity-based awards to the Company’s, and its affiliates’, directors, officers, employees (if any) and consultants, and the members, officers, directors, employees and consultants of our Manager or its affiliates, as well as to our Manager and other entities that provide services to us and our affiliates and the employees of such entities. The total number of shares of common stock or long term incentive plan (“LTIP”) units that may be awarded under the
F-31
Incentive Plan is 4,600,463, or 7.5% of the issued and outstanding shares of our common stock after completion of our common and Class A common stock dividend, initial public offering and the issuance of shares in connection with the partial exercise of the option to purchase additional shares related to the initial public offering. The Incentive Plan will automatically expire on the tenth anniversary of its effective date, unless terminated earlier by the Company’s Board of Directors. No equity grants were awarded in conjunction with the Company’s initial public offering.
The following table details the outstanding shares of common stock and the weighted-average grant date fair value per share:
|
|
|
Common Stock |
|
|
Weighted-Average Grant Date Fair Value Per Share |
|
||
|
Balance as of December 31, 2015 |
|
|
— |
|
|
$ |
— |
|
|
Granted |
|
|
— |
|
|
|
— |
|
|
Vested |
|
|
— |
|
|
|
— |
|
|
Forfeited |
|
|
— |
|
|
|
— |
|
|
Balance as of December 31, 2016 |
|
|
— |
|
|
|
— |
|
|
Granted |
|
|
75,360 |
|
|
$ |
19.44 |
|
|
Vested |
|
|
— |
|
|
|
— |
|
|
Forfeited |
|
|
— |
|
|
|
— |
|
|
Balance as of December 31, 2017 |
|
|
75,360 |
|
|
$ |
19.44 |
|
The shares generally vest in installments over a three-year period, pursuant to the terms of the award and the Incentive Plan. The 75,360 shares of common stock outstanding at December 31, 2017 will vest as follows: 18,837 shares in 2018; 18,839 shares in 2019; 18,842 shares in 2020; and 18,842 shares in 2021. As of December 31, 2017, total unrecognized compensation cost relating to unvested share-based compensation arrangements was $1.4 million based on the December 29, 2017 closing price of our common stock on the New York Stock Exchange of $19.05. This cost is expected to be recognized over a weighted average period of 3.5 years from December 31, 2017.
(14) Commitments and Contingencies
Unfunded Commitments
As of December 31, 2017 and December 31, 2016, the Company had $529.0 million and $574.6 million, respectively, of unfunded commitments related to loans held for investment. These commitments are not reflected on the consolidated balance sheets.
Litigation
From time to time, the Company may be involved in various claims and legal actions arising in the ordinary course of business. The Company establishes an accrued liability for loss contingencies when a settlement arising from a legal proceeding is both probable and reasonably estimable. If a legal matter is not probable and reasonably estimable, no such liability is recorded. Examples of this include (i) early stages of a legal proceeding, (ii) damages that are unspecified or cannot be determined, (iii) discovery has not started or is incomplete or (iv) there is uncertainty as to the outcome of pending appeals or motions. If these items exist, an estimated range of potential loss cannot be determined and as such the Company does not record an accrued liability.
As of December 31, 2017 and December 31, 2016, the Company was not involved in any material legal proceedings and has not recorded an accrued liability for loss contingencies.
F-32
(15) Concentration of Credit Risk
Property Type
A summary of the loan portfolio by property type as of December 31, 2017 and December 31, 2016 based on current unpaid principal balance (“UPB”) and full loan commitment is as follows (dollars in thousands):
|
|
|
As of December 31, 2017 |
|
|||||||||||||||||
|
Property Type |
|
Loan Commitment |
|
|
Unfunded Commitment |
|
|
% of Portfolio |
|
|
Loan UPB |
|
|
% of Portfolio |
|
|||||
|
Office |
|
$ |
836,826 |
|
|
$ |
160,450 |
|
|
|
22.5 |
% |
|
$ |
676,376 |
|
|
|
21.1 |
% |
|
Multifamily |
|
|
813,775 |
|
|
|
75,509 |
|
|
|
21.8 |
|
|
|
738,266 |
|
|
|
23.1 |
|
|
Hotel |
|
|
693,569 |
|
|
|
27,980 |
|
|
|
18.6 |
|
|
|
665,589 |
|
|
|
20.8 |
|
|
Condominium |
|
|
679,779 |
|
|
|
166,358 |
|
|
|
18.2 |
|
|
|
513,421 |
|
|
|
16.1 |
|
|
Mixed Use |
|
|
431,500 |
|
|
|
57,243 |
|
|
|
11.6 |
|
|
|
374,257 |
|
|
|
11.7 |
|
|
Retail |
|
|
195,012 |
|
|
|
41,500 |
|
|
|
5.2 |
|
|
|
153,512 |
|
|
|
4.8 |
|
|
Industrial |
|
|
66,500 |
|
|
|
— |
|
|
|
1.8 |
|
|
|
66,500 |
|
|
|
2.1 |
|
|
Other |
|
|
10,195 |
|
|
|
— |
|
|
|
0.3 |
|
|
|
10,195 |
|
|
|
0.3 |
|
|
Total |
|
$ |
3,727,156 |
|
|
$ |
529,040 |
|
|
|
100.0 |
% |
|
$ |
3,198,116 |
|
|
|
100.0 |
% |
|
(1) |
During the year ended December 31, 2017, the Company refined its property type classification related to assets within its Mixed Use, Office, Retail, and Other categories. No other categories were impacted as a result of this refinement during the year ended December 31, 2017. |
|
|
|
As of December 31, 2016 |
|
|||||||||||||||||
|
Property Type |
|
Loan Commitment |
|
|
Unfunded Commitment |
|
|
% of Portfolio |
|
|
Loan UPB |
|
|
% of Portfolio |
|
|||||
|
Condominium |
|
$ |
821,411 |
|
|
$ |
338,222 |
|
|
|
27.0 |
% |
|
$ |
486,647 |
|
|
|
19.7 |
% |
|
Hotel |
|
|
644,459 |
|
|
|
31,282 |
|
|
|
21.2 |
|
|
|
615,238 |
|
|
|
24.9 |
|
|
Office |
|
|
538,736 |
|
|
|
99,953 |
|
|
|
17.7 |
|
|
|
438,783 |
|
|
|
17.8 |
|
|
Mixed Use |
|
|
527,548 |
|
|
|
74,100 |
|
|
|
17.4 |
|
|
|
453,448 |
|
|
|
18.4 |
|
|
Multifamily |
|
|
327,578 |
|
|
|
11,217 |
|
|
|
10.8 |
|
|
|
316,360 |
|
|
|
12.8 |
|
|
Industrial |
|
|
131,987 |
|
|
|
11,468 |
|
|
|
4.3 |
|
|
|
120,519 |
|
|
|
4.9 |
|
|
Other |
|
|
48,483 |
|
|
|
8,400 |
|
|
|
1.6 |
|
|
|
40,083 |
|
|
|
1.6 |
|
|
Total |
|
$ |
3,040,202 |
|
|
$ |
574,642 |
|
|
|
100.0 |
% |
|
$ |
2,471,078 |
|
|
|
100.0 |
% |
Geography
All of the Company’s loans held for investment are secured by properties within the United States. The geographic composition of loans held for investment based on current UPB and full loan commitment is as follows (dollars in thousands):
|
|
|
December 31, 2017 |
|
|||||||||||||||||
|
Geographic Region |
|
Loan Commitment |
|
|
Unfunded Commitment |
|
|
% Loan Commitment |
|
|
Loan UPB |
|
|
% Loan UPB |
|
|||||
|
East |
|
$ |
1,600,619 |
|
|
$ |
167,447 |
|
|
|
42.9 |
% |
|
$ |
1,433,172 |
|
|
|
44.8 |
% |
|
South |
|
|
1,147,510 |
|
|
|
278,890 |
|
|
|
30.8 |
|
|
|
868,620 |
|
|
|
27.2 |
|
|
West |
|
|
674,123 |
|
|
|
67,746 |
|
|
|
18.1 |
|
|
|
606,377 |
|
|
|
19.0 |
|
|
Midwest |
|
|
255,904 |
|
|
|
14,957 |
|
|
|
6.9 |
|
|
|
240,947 |
|
|
|
7.5 |
|
|
Various |
|
|
49,000 |
|
|
|
— |
|
|
|
1.3 |
|
|
|
49,000 |
|
|
|
1.5 |
|
|
Total |
|
$ |
3,727,156 |
|
|
$ |
529,040 |
|
|
|
100.0 |
% |
|
$ |
3,198,116 |
|
|
|
100.0 |
% |
F-33
|
|
December 31, 2016 |
|
||||||||||||||||||
|
Geographic Region |
|
Loan Commitment |
|
|
Unfunded Commitment |
|
|
% Loan Commitment |
|
|
Loan UPB |
|
|
% Loan UPB |
|
|||||
|
East |
|
$ |
1,330,003 |
|
|
$ |
132,951 |
|
|
|
43.7 |
% |
|
$ |
1,197,052 |
|
|
|
48.4 |
% |
|
West |
|
|
867,494 |
|
|
|
116,057 |
|
|
|
28.5 |
|
|
|
751,437 |
|
|
|
30.4 |
|
|
South |
|
|
578,340 |
|
|
|
311,166 |
|
|
|
19.0 |
|
|
|
272,692 |
|
|
|
11.0 |
|
|
Midwest |
|
|
179,589 |
|
|
|
3,000 |
|
|
|
5.9 |
|
|
|
176,589 |
|
|
|
7.1 |
|
|
Various |
|
|
84,776 |
|
|
|
11,468 |
|
|
|
2.8 |
|
|
|
73,308 |
|
|
|
3.0 |
|
|
Total |
|
$ |
3,040,202 |
|
|
$ |
574,642 |
|
|
|
100.0 |
% |
|
$ |
2,471,078 |
|
|
|
100.0 |
% |
Category
A summary of the loan portfolio by category as of December 31, 2017 and December 31, 2016 based on current UPB and full loan commitment is as follows (dollars in thousands):
|
|
|
December 31, 2017 |
|
|||||||||||||||||
|
Loan Category |
|
Loan Commitment |
|
|
Unfunded Commitment |
|
|
% Loan Commitment |
|
|
Loan UPB |
|
|
% Loan UPB |
|
|||||
|
Bridge |
|
$ |
1,927,488 |
|
|
$ |
176,316 |
|
|
|
51.7 |
% |
|
$ |
1,751,172 |
|
|
|
54.7 |
% |
|
Moderate Transitional |
|
|
723,075 |
|
|
|
132,483 |
|
|
|
19.4 |
|
|
|
590,592 |
|
|
|
18.5 |
|
|
Construction |
|
|
609,468 |
|
|
|
166,358 |
|
|
|
16.4 |
|
|
|
443,110 |
|
|
|
13.9 |
|
|
Light Transitional |
|
|
467,125 |
|
|
|
53,883 |
|
|
|
12.5 |
|
|
|
413,242 |
|
|
|
12.9 |
|
|
Total |
|
$ |
3,727,156 |
|
|
$ |
529,040 |
|
|
|
100.0 |
% |
|
$ |
3,198,116 |
|
|
|
100.0 |
% |
|
|
|
December 31, 2016 |
|
|||||||||||||||||
|
Loan Category |
|
Loan Commitment |
|
|
Unfunded Commitment |
|
|
% Loan Commitment |
|
|
Loan UPB |
|
|
% Loan UPB |
|
|||||
|
Bridge |
|
$ |
1,265,715 |
|
|
$ |
52,475 |
|
|
|
41.6 |
% |
|
$ |
1,213,240 |
|
|
|
49.0 |
% |
|
Construction |
|
|
853,618 |
|
|
|
355,878 |
|
|
|
28.1 |
|
|
|
503,258 |
|
|
|
20.4 |
|
|
Moderate Transitional |
|
|
567,818 |
|
|
|
104,098 |
|
|
|
18.7 |
|
|
|
463,720 |
|
|
|
18.8 |
|
|
Light Transitional |
|
|
353,051 |
|
|
|
62,191 |
|
|
|
11.6 |
|
|
|
290,860 |
|
|
|
11.8 |
|
|
Total |
|
$ |
3,040,202 |
|
|
$ |
574,642 |
|
|
|
100.0 |
% |
|
$ |
2,471,078 |
|
|
|
100.0 |
% |
Loan commitments represent principal commitments made by the Company, and do not include capitalized interest of $0.0 million and $5.5 million at December 31, 2017 and December 31, 2016, respectively.
(16) Summary of Quarterly Results of Operations (unaudited)
The following is a summary of the unaudited quarterly results of operations for the years ended December 31, 2017 and December 31, 2016 (dollars in thousands except per share data):
|
|
|
March 31 |
|
|
June 30 |
|
|
September 30 |
|
|
December 31 |
|
||||
|
2017 |
|
|
|
|
|
|
|
|
|
|
|
|
|
|
|
|
|
Net interest income and total other revenue |
|
$ |
30,263 |
|
|
$ |
32,346 |
|
|
$ |
28,253 |
|
|
$ |
31,470 |
|
|
Net income attributable to common stockholders |
|
$ |
23,475 |
|
|
$ |
25,320 |
|
|
$ |
20,787 |
|
|
$ |
24,754 |
|
|
Net income per share of common and Class A common stock: |
|
|
|
|
|
|
|
|
|
|
|
|
|
|
|
|
|
Basic and diluted |
|
$ |
0.48 |
|
|
$ |
0.52 |
|
|
$ |
0.35 |
|
|
$ |
0.41 |
|
|
2016 |
|
|
|
|
|
|
|
|
|
|
|
|
|
|
|
|
|
Net interest income and total other revenue |
|
$ |
20,817 |
|
|
$ |
23,620 |
|
|
$ |
23,497 |
|
|
$ |
24,464 |
|
|
Net income attributable to common stockholders |
|
$ |
16,249 |
|
|
$ |
17,108 |
|
|
$ |
17,439 |
|
|
$ |
19,155 |
|
|
Net income per share of common and Class A common stock: |
|
|
|
|
|
|
|
|
|
|
|
|
|
|
|
|
|
Basic and diluted |
|
$ |
0.45 |
|
|
$ |
0.42 |
|
|
$ |
0.43 |
|
|
$ |
0.40 |
|
F-34
Basic and diluted earnings per share are computed independently based on the weighted-average shares of Class A common stock and common stock outstanding for each period. Accordingly, the sum of the quarterly earnings per share amounts may not agree to the total for the year.
(17) Subsequent Events
The following events occurred subsequent to December 31, 2017:
Cash Dividend
On January 25, 2018, the Company paid a cash dividend on its common stock and Class A common stock, to stockholders of record as of December 29, 2017, of $0.38 per share, or $23.1 million.
Collateralized Loan Obligation
On February 14, 2018 (the “Closing Date”), the Company entered into a collateralized loan obligation through its wholly-owned subsidiaries TPG Real Estate Finance 2018-FL1 Issuer, Ltd., an exempted company incorporated in the Cayman Islands with limited liability, as issuer (the “Issuer”), and TPG RE Finance Trust 2018-FL1 Co-Issuer, LLC, a Delaware limited liability company, as co-issuer (the “Co-Issuer” and together with the Issuer, the “Issuers”). On the Closing Date, the Issuer issued $820.5 million principal amount of notes (the “Notes”). The Co-Issuer co-issued $745.9 million principal amount of investment grade-rated notes. Concurrently with the issuance of the Notes, the Issuer also issued preferred shares, par value $0.001 per share and with an aggregate liquidation preference and notional amount equal to $1,000 per share (the “Preferred Shares” and, together with the Notes, the “Securities”), to TPG RE Finance Trust 2018-FL1 Retention Holder, LLC, a Delaware limited liability company and wholly-owned subsidiary of the Company (“Retention Holder”).
Proceeds from the issuance of the Securities were used to purchase one commercial real estate whole loan (the “Whole Loan) and 25 fully-funded pari passu participations (the “Pari Passu Participations,” and, together with the Whole Loan, the “Mortgage Assets”) in certain commercial real estate mortgage loans. The Mortgage Assets were purchased by the Issuer from TPG RE Finance Trust CLO Loan Seller, LLC, a Delaware limited liability company, wholly-owned subsidiary of the Company and an affiliate of the Issuers. The Mortgage Assets represented approximately 29% of the aggregate unpaid principal balance of the Company’s loan investment portfolio as of December 31, 2017 and had an aggregate principal balance of approximately $932.4 million as of the monthly payment date with respect to each Mortgage Asset in February 2018. Proceeds from the issuance of the Securities were also used to repay an aggregate of $670.2 million of borrowings under the Company’s secured revolving repurchase facilities with Goldman Sachs Bank USA, Morgan Stanley Bank, N.A. and Wells Fargo Bank, National Association, thus creating additional borrowing capacity for new loan originations.
10b5-1 Purchase Plan
From January 1, 2018 through February 23, 2018, the Company repurchased 276,730 shares of common stock under the 10b5-1 Purchase Plan, at a weighted average price of $18.79 per share for total consideration (including commissions and related fees) of $5.2 million.
Senior Mortgage Loan Originations
From January 1, 2018 through February 26, 2018, the Company originated four first mortgage loans, totaling $367.20 million of loan commitments which have closed, and has pending two first mortgage loans totaling $206.0 million for which borrowers have executed non-binding term sheets with the Company, entered into a period of exclusivity with the Company, and paid expense deposits to cover underwriting costs of the Company. These loans were funded, or will be funded upon closing, with a combination of cash-on-hand and borrowings.
The Company has evaluated subsequent events through February 26, 2018.
F-35
Schedule IV - Mortgage Loans on Real Estate
As of December 31, 2017
(Dollars in Thousands)
|
Type of Loan/Borrower Senior Mortgage Loans (1) |
|
Description /Location |
|
Interest Payment Rates |
|
Extended Maturity Date (2) |
|
Periodic Payment Terms (3) |
|
Prior Liens (4) |
|
|
Unpaid Principal Balance |
|
|
Carrying Amount of Loans (5) |
|
|||
|
Senior Loans in excess of 3% of the carrying amount of total loans |
|
|||||||||||||||||||
|
Borrower A |
|
Hotel / NC |
|
L+3.75% |
|
2022 |
|
I/O |
|
$ |
— |
|
|
$ |
165,535 |
|
|
$ |
163,925 |
|
|
Borrower B |
|
Office / PA |
|
L+4.25% |
|
2022 |
|
I/O |
|
|
— |
|
|
|
147,441 |
|
|
|
145,854 |
|
|
Borrower C |
|
Mixed Use / TN |
|
L+4.10% |
|
2021 |
|
I/O |
|
|
— |
|
|
|
142,000 |
|
|
|
140,639 |
|
|
Borrower D |
|
Retail / GA |
|
L+4.50% |
|
2022 |
|
I/O |
|
|
— |
|
|
|
122,500 |
|
|
|
121,430 |
|
|
Borrower E |
|
Multifamily / NJ |
|
L+4.75% |
|
2022 |
|
I/O |
|
|
— |
|
|
|
107,220 |
|
|
|
106,320 |
|
|
Borrower F |
|
Multifamily / TX |
|
L+4.40% |
|
2022 |
|
I/O |
|
|
— |
|
|
|
99,102 |
|
|
|
98,352 |
|
|
Senior Loans less than 3% of the carrying amount of total loans |
|
|||||||||||||||||||
|
Senior Loan |
|
Hotel / Diversified |
|
Floating: L+2.8% - 6.3% |
|
2018 - 2023 |
|
IO |
|
|
— |
|
|
$ |
483,554 |
|
|
$ |
480,992 |
|
|
Senior Loan |
|
Condominium /Diversified |
|
Floating: L+4.7% - 8.5% |
|
2019 - 2021 |
|
IO |
|
|
— |
|
|
|
513,422 |
|
|
|
511,650 |
|
|
Senior Loan |
|
Office / Diversified |
|
Floating: L+2.3% - 5.1% |
|
2019 - 2023 |
|
IO |
|
|
— |
|
|
|
528,934 |
|
|
|
524,803 |
|
|
Senior Loan |
|
Industrial / Diversified |
|
Floating: L+4.0% - 5.0% |
|
2021 - 2021 |
|
IO |
|
|
— |
|
|
|
66,500 |
|
|
|
66,185 |
|
|
Senior Loan |
|
Multifamily / Diversified |
|
Floating: L+2.8% - 5.3% |
|
2021 - 2024 |
|
IO |
|
|
— |
|
|
|
472,998 |
|
|
|
468,932 |
|
|
Senior Loan |
|
Mixed-Use / Diversified |
|
Floating: L+3.3% - 3.9% |
|
2020 - 2022 |
|
IO |
|
|
— |
|
|
|
232,257 |
|
|
|
230,853 |
|
|
Senior Loan |
|
Retail / Diversified |
|
Floating: L+4.6% - 4.6% Fixed: 5.6% - 5.6% |
|
2020 - 2021 |
|
IO & P&I |
|
|
— |
|
|
|
31,012 |
|
|
|
30,673 |
|
|
Senior Loan |
|
Land / NC |
|
Floating: L+4.3% - 4.3% |
|
2018 - 2018 |
|
IO |
|
|
— |
|
|
|
10,195 |
|
|
|
9,919 |
|
|
Total senior loans |
|
|
|
|
|
|
|
|
|
$ |
— |
|
|
$ |
3,122,670 |
|
|
$ |
3,100,527 |
|
|
Subordinate loans (6) |
|
|||||||||||||||||||
|
Subordinate loans less than 3% of the carrying amount of total loans |
|
|||||||||||||||||||
|
Subordinate Loan |
|
Multifamily / Diversified |
|
Floating: L+7.8% - 13.4% |
|
2020 - 2021 |
|
IO |
|
|
98,000 |
|
|
|
58,946 |
|
|
|
58,771 |
|
|
Subordinate Loan |
|
Hotel / GA |
|
Floating: L+14.0% - 14.0% |
|
2022 - 2022 |
|
IO |
|
|
37,500 |
|
|
|
16,500 |
|
|
|
16,374 |
|
|
Total subordinate loans |
|
Multifamily / Diversified / Hotel |
|
Floating: L+7.8% -14.0% |
|
2020 -2022 |
|
IO |
|
$ |
135,500 |
|
|
$ |
75,446 |
|
|
$ |
75,145 |
|
|
Total Loans |
|
|
|
|
|
|
|
|
|
$ |
135,500 |
|
|
$ |
3,198,116 |
|
|
$ |
3,175,672 |
|
|
(1) |
Includes senior mortgage loans, related contiguous subordinate loans, and pari passu participations in senior mortgage loans. |
|
(2) |
Maximum maturity date assumes all extension options are exercised. |
|
(3) |
I/O = interest only, P/I = principal and interest. |
|
(4) |
Represents only third party liens. |
|
(5) |
The aggregate tax basis of the loans is $3.2 billion as of December 31, 2017. |
|
(6) |
Includes subordinate interests in mortgages and mezzanine loans. |
S-1
1. Reconciliation of Mortgage Loans on Real Estate:
The following table reconciles activity regarding mortgage loans on real estate for the years ended:
|
|
|
2017 |
|
|
2016 |
|
|
2015 |
|
|||
|
Balance at January 1, |
|
$ |
2,449,990 |
|
|
$ |
1,933,398 |
|
|
$ |
1,741,933 |
|
|
Additions during period: |
|
|
|
|
|
|
|
|
|
|
|
|
|
Loans originated |
|
|
1,596,531 |
|
|
|
948,106 |
|
|
|
535,339 |
|
|
Additional fundings |
|
|
315,409 |
|
|
|
328,356 |
|
|
|
360,538 |
|
|
Amortization of deferred fees and expenses |
|
|
19,381 |
|
|
|
14,227 |
|
|
|
6,898 |
|
|
Deductions during period: |
|
|
|
|
|
|
|
|
|
|
|
|
|
Collection of principal |
|
|
(1,202,776 |
) |
|
|
(767,713 |
) |
|
|
(690,366 |
) |
|
Amortization of premium |
|
|
(2,863 |
) |
|
|
(6,384 |
) |
|
|
(20,944 |
) |
|
Balance at December 31, |
|
$ |
3,175,672 |
|
|
$ |
2,449,990 |
|
|
$ |
1,933,398 |
|
S-2