Attached files
| file | filename |
|---|---|
| EX-23 - EXHIBIT 23 - DEAN FOODS CO | df-20171231x10kxexx23.htm |
| EX-32.2 - EXHIBIT 32.2 - DEAN FOODS CO | df-20171231x10kxex322.htm |
| EX-32.1 - EXHIBIT 32.1 - DEAN FOODS CO | df-20171231x10kxexx321.htm |
| EX-31.2 - EXHIBIT 31.2 - DEAN FOODS CO | df-20171231x10kxexx312.htm |
| EX-31.1 - EXHIBIT 31.1 - DEAN FOODS CO | df-20171231x10kxexx311.htm |
| EX-21 - EXHIBIT 21 - DEAN FOODS CO | df-20171231x10kxexx21.htm |
| EX-12 - EXHIBIT 12 - DEAN FOODS CO | df-20171213x10kxexx12.htm |
| EX-10.36 - EXHIBIT 10.36 - DEAN FOODS CO | df-20171231x10kxexx1036.htm |
| EX-10.35 - EXHIBIT 10.35 - DEAN FOODS CO | df-20171231x10kxexx1035.htm |
| EX-10.34 - EXHIBIT 10.34 - DEAN FOODS CO | df-20171231x10kxexx1034.htm |
| EX-10.33 - EXHIBIT 10.33 - DEAN FOODS CO | df-20171231x10kxexx1033.htm |
UNITED STATES
SECURITIES AND EXCHANGE COMMISSION
Washington, D.C. 20549
Form 10-K
(Mark One)
þ | ANNUAL REPORT PURSUANT TO SECTION 13 OR 15(d) OF THE SECURITIES EXCHANGE ACT OF 1934 |
For The Fiscal Year Ended December 31, 2017
OR
¨ | TRANSITION REPORT PURSUANT TO SECTION 13 OR 15(d) OF THE SECURITIES EXCHANGE ACT OF 1934 |
For the Transition Period from to
Commission File Number 001-12755
Dean Foods Company
(Exact name of Registrant as specified in its charter)

Delaware | 75-2559681 | |
(State or other jurisdiction of incorporation or organization) | (I.R.S. Employer Identification No.) | |
2711 North Haskell Avenue Suite 3400
Dallas, Texas 75204
(214) 303-3400
(Address, including zip code, and telephone number, including
area code, of Registrant’s principal executive offices)
Securities Registered Pursuant to Section 12(b) of the Act:
Title of Each Class | Name of Each Exchange on Which Registered | |
Common Stock, $.01 par value | New York Stock Exchange | |
Securities Registered Pursuant to Section 12(g) of the Act: None
Indicate by check mark if the registrant is a well-known seasoned issuer, as defined in Rule 405 of the Securities Act. Yes þ No ¨
Indicate by check mark if the registrant is not required to file reports pursuant to Section 13 or Section 15(d) of the Act. Yes ¨ No þ
Indicate by check mark whether the registrant (1) has filed all reports required to be filed by Section 13 or 15(d) of the Securities Exchange Act of 1934 during the preceding 12 months (or for such shorter period that the registrant was required to file such reports), and (2) has been subject to such filing requirements for the past 90 days. Yes þ No ¨
Indicate by check mark whether the registrant has submitted electronically and posted on its corporate Web site, if any, every Interactive Data File required to be submitted and posted pursuant to Rule 405 of Regulation S-T (§232.405 of this chapter) during the preceding 12 months (or for such shorter period that the registrant was required to submit and post such files). Yes þ No ¨
Indicate by check mark if disclosure of delinquent filers pursuant to Item 405 of Regulation S-K (§229.405 of this chapter) is not contained herein, and will not be contained, to the best of registrant’s knowledge, in definitive proxy or information statements incorporated by reference in Part III of this Form 10-K or any amendment to this Form 10-K þ
Indicate by check mark whether the registrant is a large accelerated filer, an accelerated filer, a non-accelerated filer, a smaller reporting company, or emerging growth company. See the definitions of “large accelerated filer,” “accelerated filer,” “smaller reporting company,” and "emerging growth company" in Rule 12b-2 of the Exchange Act. (Check one):
Large accelerated filer þ | Accelerated filer ¨ | Non-accelerated filer ¨ | Smaller reporting company ¨ | Emerging growth company ¨ | ||||
(Do not check if a smaller reporting company) | ||||||||
If an emerging growth company, indicate by check mark if the registrant has elected not to use the extended transition period for complying with any new or revised financial accounting standards provided pursuant to Section 13(a) of the Exchange Act. ¨
Indicate by check mark whether the registrant is a shell company (as defined in Rule 12b-2 of the Exchange Act). Yes ¨ No þ
The aggregate market value of the registrant’s voting and non-voting common stock held by non-affiliates of the registrant at June 30, 2017, based on the closing price for the registrant’s common stock on the New York Stock Exchange on June 30, 2017, was approximately $1.53 billion.
The number of shares of the registrant’s common stock outstanding as of February 21, 2018 was 91,166,009.
DOCUMENTS INCORPORATED BY REFERENCE
Portions of the registrant’s definitive Proxy Statement for its Annual Meeting of Stockholders to be held on or about May 9, 2018, which will be filed within 120 days of the registrant’s fiscal year end, are incorporated by reference into Part III of this Annual Report on Form 10-K.
TABLE OF CONTENTS
Item | Page | |
PART I | ||
1 | ||
1A | ||
1B | ||
2 | ||
3 | ||
4 | ||
PART II | ||
5 | ||
6 | ||
7 | ||
7A | ||
8 | ||
9 | ||
9A | ||
PART III | ||
10 | ||
11 | ||
12 | ||
13 | ||
14 | ||
PART IV | ||
15 | ||
16 | ||
Forward-Looking Statements
This Annual Report on Form 10-K (this “Form 10-K”) contains forward-looking statements within the meaning of the Private Securities Litigation Reform Act of 1995, which are subject to risks, uncertainties and assumptions that are difficult to predict. Forward-looking statements are predictions based on expectations and projections about future events, and are not statements of historical fact. Forward-looking statements include statements concerning business strategy, among other things, including anticipated trends and developments in and management plans for our business and the markets in which we operate. In some cases, you can identify these statements by forward-looking words, such as “estimate,” “expect,” “anticipate,” “project,” “plan,” “intend,” “believe,” “forecast,” “foresee,” “likely,” “may,” “should,” “goal,” “target,” “might,” “will,” "would," "can," “could,” “predict,” and “continue,” the negative or plural of these words and other comparable terminology. All forward-looking statements included in this Form 10-K are based upon information available to us as of the filing date of this Form 10-K, and we undertake no obligation to update any of these forward-looking statements for any reason. You should not place undue reliance on forward-looking statements. The forward-looking statements involve known and unknown risks, uncertainties and other factors that may cause our actual results, levels of activity, performance, or achievements to differ materially from those expressed or implied by these statements. These factors include the matters discussed in the section entitled “Part I — Item 1A — Risk Factors” in this Form 10-K, and elsewhere in this Form 10-K. You should carefully consider the risks and uncertainties described in this Form 10-K.
PART I
Item 1. | Business |
We are a leading food and beverage company and the largest processor and direct-to-store distributor of fresh fluid milk and other dairy and dairy case products in the United States, with a vision to be the most admired and trusted provider of wholesome, great-tasting dairy products at every occasion.
We manufacture, market and distribute a wide variety of branded and private label dairy and dairy case products, including fluid milk, ice cream, cultured dairy products, creamers, ice cream mix and other dairy products to retailers, distributors, foodservice outlets, educational institutions and governmental entities across the United States. Our portfolio includes DairyPure®, the country's first and largest fresh, white milk national brand, and TruMoo®, the leading national flavored milk brand, along with well-known regional dairy brands such as Alta Dena ®, Berkeley Farms ®, Country Fresh ®, Dean’s ®, Friendly's ®, Garelick Farms ®, LAND O LAKES ® milk and cultured products (licensed brand), Lehigh Valley Dairy Farms ®, Mayfield ®, McArthur ®, Meadow Gold®, Oak Farms ®, PET ® (licensed brand), T.G. Lee ®, Tuscan ® and more. In all, we have more than 50 national, regional and local dairy brands, as well as private labels. With our acquisition of Uncle Matt's Organic, Inc., which was completed on June 22, 2017, we now sell and distribute organic juice, probiotic-infused juices, and fruit-infused waters under the Uncle Matt's Organic® brand. Additionally, we are party to the Organic Valley Fresh joint venture which distributes organic milk under the Organic Valley ® brand to retailers. Dean Foods also makes and distributes ice cream, cultured products, juices, teas and bottled water. Due to the perishable nature of our products, we deliver the majority of our products directly to our customers’ locations in refrigerated trucks or trailers that we own or lease. We believe that we have one of the most extensive refrigerated direct-to-store delivery ("DSD") systems in the United States. We sell our products primarily on a local or regional basis through our local and regional sales forces, and in some instances, with the assistance of national brokers. Some national customer relationships are coordinated by our centralized corporate sales department or national brokers.
Unless stated otherwise, any reference to income statement items in this Form 10-K refers to results from continuing operations. Each of the terms "we," "us," "our," "the Company," and "Dean Foods" refers collectively to Dean Foods Company and its wholly-owned subsidiaries unless the context indicates otherwise.
Our principal executive offices are located at 2711 North Haskell Avenue, Suite 3400, Dallas, Texas 75204. Our telephone number is (214) 303-3400. We maintain a web site at www.deanfoods.com. We were incorporated in Delaware in 1994.
1
Developments Since January 1, 2017
Management Changes — Effective January 1, 2017, Ralph Scozzafava, formerly Executive Vice President and Chief Operating Officer, was promoted to Chief Executive Officer and appointed to the Company’s Board of Directors. Gregg A. Tanner stepped down as Chief Executive Officer of the Company and resigned from his position as a member of the Company’s Board of Directors, effective January 1, 2017. Mr. Tanner continued to serve in an advisory capacity as an employee of the Company through the Annual Stockholders Meeting in May 2017.
Chris Bellairs, our former Executive Vice President and Chief Financial Officer, departed the Company effective September 1, 2017. Kimberly Warmbier, our former Executive Vice President, Human Resources, departed the Company effective December 1, 2017. Jose Motta, the Company's former Vice President of Total Rewards, was promoted to Senior Vice President, Human Resources following Ms. Warmbier's departure. Effective February 27, 2018, Jody L. Macedonio will join the Company as our Executive Vice President and Chief Financial Officer.
Organic Valley Fresh Joint Venture — In the third quarter of 2017, we commenced the operations of our previously announced 50/50 strategic joint venture with Cooperative Regions of Organic Producer Pools (“CROPP”), an independent farmer cooperative that distributes organic milk and other organic dairy products under the Organic Valley ® brand. The joint venture, called Organic Valley Fresh, combines our processing plants and refrigerated DSD system with CROPP's portfolio of recognized brands and products, marketing expertise, and access to an organic milk supply from America's largest cooperative of organic dairy farmers to bring the Organic Valley ® brand to retailers. See Note 3 to our Consolidated Financial Statements for additional information regarding our Organic Valley Fresh Joint Venture.
Uncle Matt's Organic Acquisition — On June 22, 2017, we completed the acquisition of Uncle Matt's Organic, Inc. ("Uncle Matt's") for an aggregate purchase price of $22.0 million. Uncle Matt's is a leading organic juice company offering a wide range of organic juices, including probiotic-infused juices and fruit-infused waters. See Note 2 to our Consolidated Financial Statements for additional information regarding the Uncle Matt's acquisition.
Investment in Good Karma — On May 4, 2017, we acquired a non-controlling interest in, and entered into a distribution agreement with, Good Karma Foods, Inc. (“Good Karma”), the leading producer of flax-based milk and yogurt products. This investment allows us to diversify our portfolio to include plant-based dairy alternatives and provides Good Karma the ability to more rapidly expand distribution across the U.S., as well as increase investments in brand building and product innovation. See Note 3 to our Consolidated Financial Statements for additional information regarding our investment in Good Karma.
Amendment to Senior Secured Revolving Credit Facility — On January 4, 2017, we amended the credit agreement (the "Credit Agreement") governing our senior secured revolving credit facility (the "Credit Facility") to, among other things, extend the maturity date of the Credit Facility to January 4, 2022, modify certain financial covenants and modify certain other terms. Please see "Part II — Item 7. Management's Discussion and Analysis of Financial Condition and Results of Operations — Liquidity and Capital Resources" for additional information regarding the amendment.
Amendment to Receivables Securitization Facility — On January 4, 2017, we amended the credit agreement governing our receivables securitization facility to, among other things, extend the liquidity termination date to January 4, 2020, reduce the maximum size of the receivables securitization facility to $450 million, modify certain financial covenants to be consistent with the amended leverage ratio covenant under the Credit Agreement described above, and to modify certain other terms. Please see "Part II — Item 7. Management's Discussion and Analysis of Financial Condition and Results of Operations — Liquidity and Capital Resources" for additional information regarding the amendment.
2
Overview
We manufacture, market and distribute a wide variety of branded and private label dairy and dairy case products, including fluid milk, ice cream, cultured dairy products, creamers, ice cream mix and other dairy products to retailers, distributors, foodservice outlets, educational institutions and governmental entities across the United States. Our consolidated net sales totaled $7.8 billion in 2017. The following charts depict our 2017 net sales by product and product sales mix between company branded versus private label.
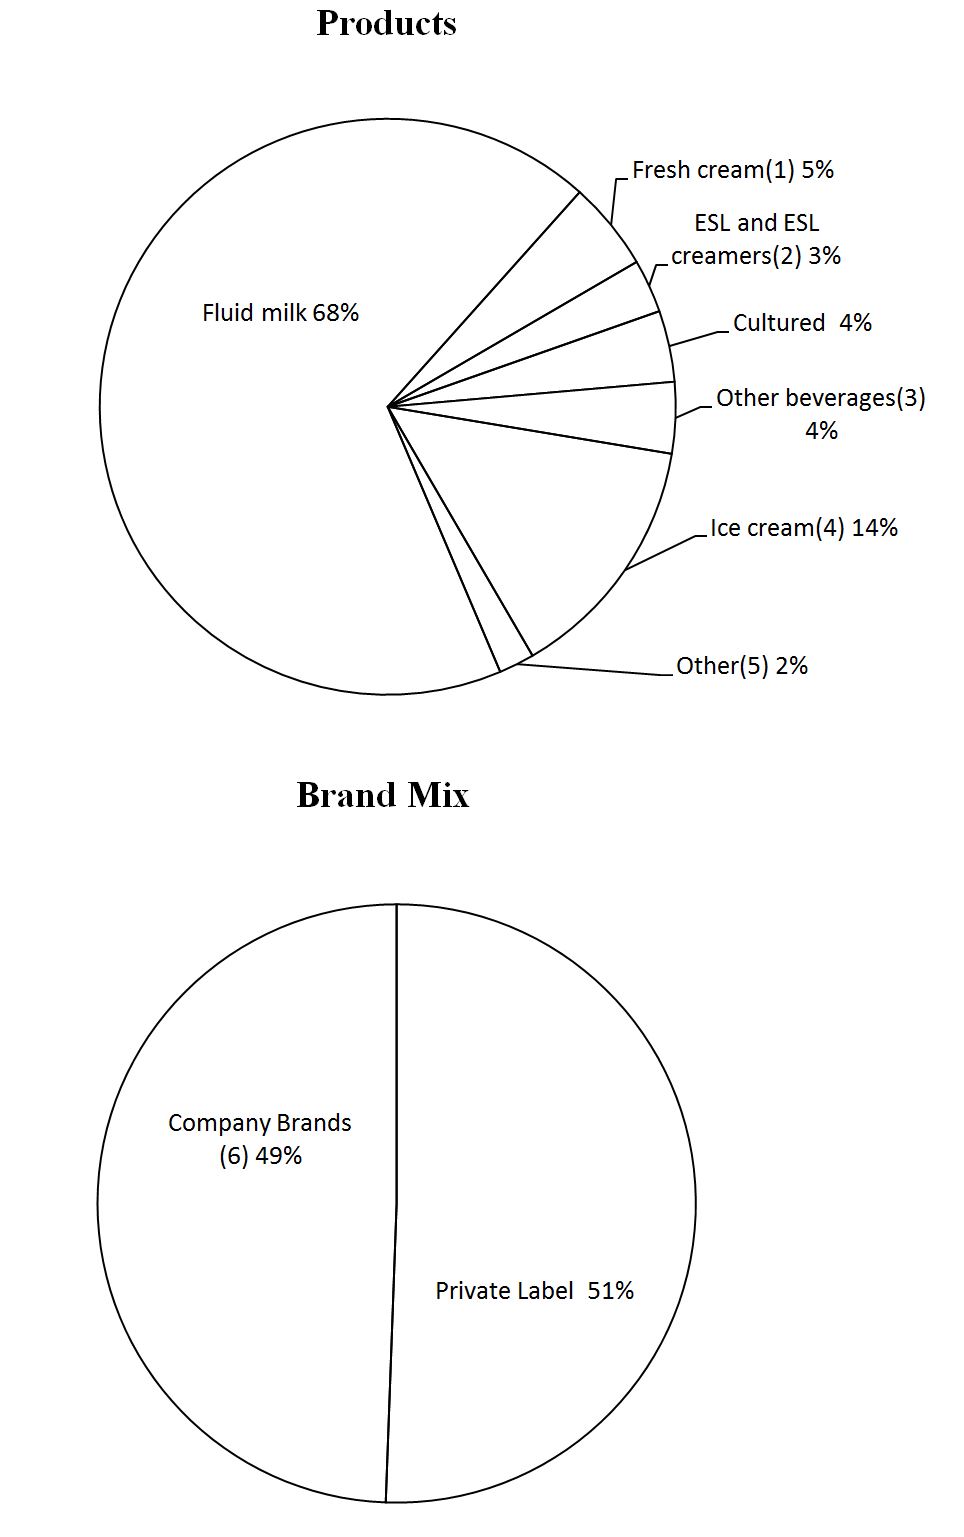
(1) | Includes half-and-half and whipping cream. |
(2) | Includes creamers and other extended shelf-life fluids. |
(3) | Includes fruit juice, fruit flavored drinks, iced tea and water. |
(4) | Includes ice cream, ice cream mix and ice cream novelties. |
(5) | Includes items for resale such as cream, butter, cheese, eggs and milkshakes. |
(6) | Includes all national, regional and local brands. |
3
We sell our products under national, regional and local proprietary or licensed brands. Products not sold under these brands are sold under a variety of private labels. We sell our products primarily on a local or regional basis through our local and regional sales forces, although some national customer relationships are coordinated by a centralized corporate sales department. Our largest customer is Walmart Inc., including its subsidiaries such as Sam’s Club, which accounted for approximately 17.5% of our net sales for the year ended December 31, 2017.
Our brands include DairyPure®, the country's first and largest fresh, white milk national brand, and TruMoo®, the leading national flavored milk brand. As of December 31, 2017, our national, local and regional proprietary and licensed brands included the following:
Alta Dena® | Hygeia® | Over the Moon® |
Arctic Splash® | Jilbert™ | PET® (licensed brand) |
Barbers Dairy® | Knudsen® (licensed brand) | Pog® (licensed brand) |
Barbe’s® | LAND O LAKES® (licensed brand) | Price’s™ |
Berkeley Farms® | Land-O-Sun & design® | Purity™ |
Broughton™ | Lehigh Valley Dairy Farms® | ReadyLeaf® |
Brown Cow® | Louis Trauth Dairy Inc.® | Reiter™ |
Brown’s Dairy® | Mayfield® | Robinson™ |
Caribou® (licensed brand) | McArthur® | Schepps® |
Chug® | Meadow Brook® | Sonora™ |
Country Fresh™ | Meadow Gold® | Steve's® |
Country Love® | Mile High Ice Cream™ | Stroh’s® |
Creamland™ | Model Dairy® | Swiss Dairy™ |
DairyPure® | Morning Glory® | Swiss Premium™ |
Dean’s® | Nature’s Pride® | TruMoo® |
Fieldcrest® | Nurture® | T.G. Lee® |
Friendly's® | Nutty Buddy® | Turtle Tracks® |
Fruit Rush® | Oak Farms® | Tuscan® |
Gandy’s™ | Orchard Pure® | Uncle Matt's Organic® |
Garelick Farms® | Organic Valley® (licensed by joint venture) | Viva® |
We currently operate 65 manufacturing facilities in 31 states located largely based on customer needs and other market factors, with distribution capabilities across all 50 states. For more information about our facilities, see “Item 2. Properties.” Due to the perishable nature of our products, we deliver the majority of our products directly to our customers’ locations in refrigerated trucks or trailers that we own or lease. This form of delivery is called a “direct-to-store delivery” or “DSD” system. We believe that we have one of the most extensive refrigerated DSD systems in the United States.
The primary raw material used in our products is conventional raw milk (which contains both raw skim milk and butterfat) that we purchase primarily from farmers’ cooperatives, as well as from independent farmers. The federal government and certain state governments set minimum prices for raw skim milk and butterfat on a monthly basis. Another significant raw material we use is resin, which is a fossil fuel-based product used to make plastic bottles. The price of resin fluctuates based on changes in crude oil and natural gas prices. Other raw materials and commodities used by us include diesel fuel, used to operate our extensive DSD system, and juice concentrates and sweeteners used in our products. We generally increase or decrease the prices of our private label fluid dairy products on a monthly basis in correlation with fluctuations in the costs of raw materials, packaging supplies and delivery costs. We manage the pricing of our branded fluid milk products on a longer-term basis, balancing consumer demand with net price realization but, in some cases, we are subject to the terms of sales agreements with respect to the means and/or timing of price increases.
We have several competitors in each of our major product and geographic markets. Competition between dairy processors for shelf-space with retailers is based primarily on price, service, quality and the expected or historical sales performance of the product compared to its competitors’ products. In some cases we pay fees to customers for shelf-space. Competition for consumer sales is based on a variety of factors such as price, taste preference, quality and brand recognition. Dairy products also compete with many other beverages and nutritional products for consumer sales. Additionally, we face competitive pressures from vertically integrated retailers, discount supermarket chains, dairy cooperatives and other processors, and online and delivery grocery retailers.
4
The fluid milk category enjoys a number of attractive attributes. This category’s size and pervasiveness, plus the limited shelf life of the product, make it an important category for retailers and consumers, as well as a large long-term opportunity for the best positioned dairy processors. However, the dairy industry is not without some well documented challenges. It is a mature industry that has traditionally been characterized as highly competitive and subject to commodity volatility, with low profit margins. Additionally, according to the U.S. Department of Agriculture ("USDA"), consumption of fluid milk continues to decline.
For more information on factors that could impact our business, see “— Government Regulation — Milk Industry Regulation” and “Part II — Item 7. Management’s Discussion and Analysis of Financial Condition and Results of Operations — Known Trends and Uncertainties — Conventional Raw Milk and Other Inputs.” See Note 19 to our Consolidated Financial Statements for segment, geographic and customer information.
Current Business Strategy
Dean Foods has evolved over the past 20 years through periods of rapid acquisition, consolidation, integration and the separation of our operations including the spin-off of The WhiteWave Foods Company ("WhiteWave") and sale of Morningstar Foods ("Morningstar") in 2013. Today, we are a leading food and beverage company and the largest processor and direct-to-store distributor of fresh fluid milk and other dairy and dairy case products in the United States.
Our vision is to be the most admired and trusted provider of wholesome, great-tasting dairy products at every occasion. Our strategy is to invest and grow our portfolio of brands while strengthening our operations and capabilities to achieve a more profitable core business. Our strategy is anchored by the following five pillars and is underscored by our commitments to safety, quality and service, and delivering sustainable profit growth and total shareholder return:
Build and Buy Strong Brands:
• | Build our existing brands with consumer-led innovation, marketing, and logistical excellence. |
• | Evaluate and consider strategic opportunities. |
• | Diversify our portfolio in adjacent categories. |
Win in Private Label:
• | Enhance our profitability by lowering our internal costs, partnering with our customers and driving standard practices across our business. |
• | Enhance our profitability by strategically targeting key customers and channels. |
Deliver Operational Excellence:
• | Reset our cost structure through the execution of our enterprise-wide cost productivity plan, including rescaling our supply chain, optimizing spend management and integrating our operating model. |
• | Consolidate our manufacturing and distribution network to better align with our current and projected volumes. |
Transform Go To Market:
• | Expand our reach and ability to meet evolving consumer needs. |
• | More profitably serve customers through new delivery and production capabilities. |
• | Drive efficiency through standardized business principles and customer collaboration. |
Enhance Future Capabilities:
• | Foster an engaged and aligned organization that has a consumer mindset. |
• | Improve processes, technology and infrastructure to enable cross-functional decision-making that creates opportunities to build our business. |
Corporate Responsibility
Within our business strategies, corporate responsibility remains an integral part of our efforts. As we work to strengthen our business, we are committed to do it in a way that is right for our employees, shareholders, consumers, customers, suppliers and the environment. We intend to realize savings by reducing waste and duplication while we continue to support programs that improve our local communities. We believe that our customers, consumers and suppliers value our efforts to operate in an ethical, environmentally sustainable, and socially responsible manner.
5
Seasonality
Our business is affected by seasonal changes in the demand for dairy products. Sales volumes are typically higher in the fourth quarter due to increased dairy consumption during seasonal holidays. Fluid milk volumes tend to decrease in the second and third quarters of the year primarily due to the reduction in dairy consumption associated with our school customers, partially offset by the increase in ice cream and ice cream mix consumption during the summer months. Because certain of our operating expenses are fixed, fluctuations in volumes and revenue from quarter to quarter may have a material effect on operating income for the respective quarters.
Intellectual Property
We are continually developing new technology and enhancing existing proprietary technology related to our dairy operations. Seven U.S. and eight international patents have been issued to us and five U.S. and two international patent applications are pending. Our U.S. patents are expected to expire at various dates between February 2019 and December 2035. If the pending U.S. patent applications are granted, those patents would be expected to expire at various dates between June 2035 and October 2037. Our international patents are expected to expire at various dates between February 2028 and March 2030. If the pending international patent applications are granted, those patents would be expected to expire in September 2037.
We primarily rely on a combination of trademarks, copyrights, trade secrets, confidentiality procedures and contractual provisions to protect our technology and other intellectual property rights. Despite these protections, it may be possible for unauthorized parties to copy, obtain or use certain portions of our proprietary technology or trademarks.
Research and Development
Our total research and development ("R&D") expense was $3.5 million, $3.0 million and $2.3 million for 2017, 2016 and 2015, respectively. Our R&D activities primarily consist of generating and testing new product concepts, new flavors of products and packaging.
Employees
As of December 31, 2017, we had approximately 16,000 employees. Approximately 37% of our employees participate in a multitude of collective bargaining agreements of varying duration and terms.
Government Regulation
Food-Related Regulations
As a manufacturer and distributor of food products, we are subject to a number of food-related regulations, including the Federal Food, Drug and Cosmetic Act and regulations promulgated thereunder by the U.S. Food and Drug Administration (“FDA”). This comprehensive regulatory framework governs the manufacture (including composition and ingredients), labeling, packaging and safety of food in the United States. The FDA:
• | regulates manufacturing practices for foods through its current good manufacturing practices regulations; |
• | specifies the standards of identity for certain foods, including many of the products we sell; and |
• | prescribes the format and content of certain information required to appear on food product labels. |
We are also subject to the Food Safety Modernization Act of 2011, which, among other things, mandates the FDA to adopt preventative controls to be implemented by food facilities in order to minimize or prevent hazards to food safety. In addition, the FDA enforces the Public Health Service Act and regulations issued thereunder, which authorizes regulatory activity necessary to prevent the introduction, transmission or spread of communicable diseases. These regulations require, for example, pasteurization of milk and milk products. We are subject to numerous other federal, state and local regulations involving such matters as the licensing and registration of manufacturing facilities, enforcement by government health agencies of standards for our products, inspection of our facilities and regulation of our trade practices in connection with the sale of food products.
We use quality control laboratories in our manufacturing facilities to test raw ingredients. In addition, all of our facilities have achieved Safety Quality Food ("SQF") Level 3 under the Global Food Safety Initiative. Product quality and freshness are essential to the successful distribution of our products. To monitor product quality at our facilities, we maintain quality control programs to test products during various processing stages. We believe our facilities and manufacturing practices are in material compliance with all government regulations applicable to our business.
6
Employee Safety Regulations
We are subject to certain safety regulations, including regulations issued pursuant to the U.S. Occupational Safety and Health Act. These regulations require us to comply with certain manufacturing safety standards to protect our employees from accidents. We believe that we are in material compliance with all employee safety regulations applicable to our business.
Environmental Regulations
We are subject to various state and federal environmental laws, regulations and directives, including the Food Quality Protection Act of 1996, the Clean Air Act, the Clean Water Act, the Resource Conservation and Recovery Act, the Federal Insecticide, Fungicide and Rodenticide Act and the Comprehensive Environmental Response Compensation and Liability Act of 1980, as amended. Our plants use a number of chemicals that are considered to be “extremely” hazardous substances pursuant to applicable environmental laws due to their toxicity, including ammonia, which is used extensively in our operations as a refrigerant. Such chemicals must be handled in accordance with such environmental laws. Also, on occasion, certain of our facilities discharge biodegradable wastewater into municipal waste treatment facilities in excess of levels allowed under local regulations. As a result, certain of our facilities are required to pay wastewater surcharges or to construct wastewater pretreatment facilities. To date, such wastewater surcharges and construction costs have not had a material effect on our financial condition or results of operations.
We maintain above-ground and under-ground petroleum storage tanks at many of our facilities. We periodically inspect these tanks to determine whether they are in compliance with applicable regulations and, as a result of such inspections, we are required to make expenditures from time to time to ensure that these tanks remain in compliance. In addition, upon removal of the tanks, we are sometimes required to make expenditures to restore the site in accordance with applicable environmental laws. To date, such expenditures have not had a material effect on our financial condition or results of operations.
We believe that we are in material compliance with the environmental regulations applicable to our business. We do not expect the cost of our continued compliance to have a material impact on our capital expenditures, earnings, cash flows or competitive position in the foreseeable future. In addition, any asset retirement obligations are not material.
Milk Industry Regulation
The federal government establishes minimum prices that we must pay to producers in federally regulated areas for raw milk. Raw milk primarily contains raw skim milk in addition to a small percentage of butterfat. Raw milk delivered to our facilities is tested to determine the percentage of butterfat and other milk components, and we pay our suppliers for the raw milk based on the results of these tests.
The federal government’s minimum prices for Class I milk vary depending on the processor’s geographic location or sales area and the type of product manufactured. Federal minimum prices change monthly. Class I butterfat and raw skim milk prices (which are the minimum prices we are required to pay for raw milk that is processed into Class I products such as fluid milk) and Class II raw skim milk prices (which are the minimum prices we are required to pay for raw milk that is processed into Class II products such as cottage cheese, creams, creamers, ice cream and sour cream) for each month are announced by the federal government the immediately preceding month. Class II butterfat prices are announced either at the end of the month or the first week of the following month in which the price is effective. Some states have established their own rules for determining minimum prices for raw milk. In addition to the federal or state minimum prices, we also may pay producer premiums, procurement costs and other related charges that vary by location and supplier.
Labeling Regulations
We are subject to various labeling requirements with respect to our products at the federal, state and local levels. At the federal level, the FDA has authority to review product labeling, and the U.S. Federal Trade Commission (“FTC”) may review labeling and advertising materials, including online and television advertisements, to determine if advertising materials are misleading. Similarly, many states review dairy product labels to determine whether they comply with applicable state laws. We believe we are in material compliance with all labeling laws and regulations applicable to our business.
We are also subject to various state and local consumer protection laws.
7
Where You Can Get More Information
Our fiscal year ends on December 31. We file annual, quarterly and current reports, proxy statements and other information with the Securities and Exchange Commission.
You may read and copy any reports, statements or other information that we file with the Securities and Exchange Commission at the Securities and Exchange Commission’s Public Reference Room at 100 F Street, N.E., Washington D.C. 20549. You can request copies of these documents, upon payment of a duplicating fee, by writing to the Securities and Exchange Commission. Please call the Securities and Exchange Commission at 1-800-SEC-0330 for further information on the operation of the Public Reference Room.
We file our reports with the Securities and Exchange Commission electronically through the Securities and Exchange Commission’s Electronic Data Gathering, Analysis and Retrieval (“EDGAR”) system. The Securities and Exchange Commission maintains an Internet site that contains reports, proxy and information statements and other information regarding companies that file electronically with the Securities and Exchange Commission through EDGAR. The address of this Internet site is http://www.sec.gov.
We also make available free of charge through our website at www.deanfoods.com our Annual Report on Form 10-K, Quarterly Reports on Form 10-Q, Current Reports on Form 8-K, and amendments to those reports filed or furnished pursuant to Section 13(a) or 15(d) of the Securities Exchange Act of 1934, as amended, as soon as reasonably practicable after we electronically file such material with, or furnish it to, the Securities and Exchange Commission. We are not, however, including the information contained on our website, or information that may be accessed through links on our website, as part of, or incorporating such information by reference into, this Form 10-K.
Our Code of Ethics is applicable to all of our employees and directors. Our Code of Ethics is available on our corporate website at www.deanfoods.com, together with the Corporate Governance Principles of our Board of Directors and the charters of the Audit, Compensation and Nominating/Corporate Governance Committees of our Board of Directors. Any waivers that we may grant to our executive officers or directors under the Code of Ethics, and any amendments to our Code of Ethics, will be posted on our corporate website. If you would like hard copies of any of these documents, or of any of our filings with the Securities and Exchange Commission, write or call us at:
Dean Foods Company
2711 North Haskell Avenue, Suite 3400
Dallas, Texas 75204
(214) 303-3400
Attention: Investor Relations
Item 1A. Risk Factors
Business, Competitive and Strategic Risks
The continuing shift from branded to private label products could continue to negatively impact our profit margin.
We are experiencing a continuing shift from branded to private label products. Retailers continue to aggressively price their private label milk to drive foot traffic, which has been increasing the price gap between branded and private label milk. We believe this negatively affects our branded product sales as customers trade down to private label products. This trend could be accelerated by the continued expansion of deep discount supermarket retailers, such as Aldi and Lidl, in the U.S. market. These factors have negatively impacted and could continue to impact our mix and margins, which could materially adversely affect our profitability.
Volume softness in the dairy category, combined with our volume losses, has had a negative impact on our sales and profits.
Industry-wide volume softness across dairy product categories, particularly within fluid milk, continued in 2017. Decreasing dairy category volume has increased the impact of declining margins on our business. Periods of declining volumes limit the cost and price increases that we can seek to recapture. We expect volume softness to continue in the future. In addition, in recent years, we have experienced volume losses and declines in historical volumes from some of our largest customers, which has negatively impacted our sales and profitability and which will continue to have a negative impact in the future if we are not able to reduce costs quickly enough to offset the lost volume and attract and retain a profitable customer and product mix.
8
Our results of operations and financial condition depend heavily on commodity prices and the availability of raw materials and other inputs. Our failure or inability to respond to high or fluctuating input prices could adversely affect our profitability.
Our results of operations and financial condition depend heavily on the cost and supply of raw materials and other inputs including conventional raw milk, butterfat, cream and other dairy commodities, many of which are determined by constantly changing market forces of supply and demand over which we have limited or no control. Cost increases in raw materials and other inputs could cause our profitability to decrease significantly compared to prior periods, as we may be unwilling or unable to increase our prices or unable to achieve cost savings to offset the increased cost of these raw materials and other inputs.
Although we generally pass through the cost of dairy commodities to our customers over time, we believe demand destruction can occur at certain price levels, and we may be unwilling or unable to pass through the cost of dairy commodities, which could materially and adversely affect our profitability. Dairy commodity prices can be affected by adverse weather conditions (including the impact of climate change) and natural disasters, such as floods, droughts, frost, fires, earthquakes and pestilence, which can lower crop and dairy yields and reduce supplies of these ingredients or increase their prices.
Our profitability also depends on the cost and supply of non-dairy raw materials and other inputs, such as sweeteners, petroleum-based products, diesel fuel, resin and other non-dairy food ingredients.
Our dairy and non-dairy raw materials are generally sourced from third parties, and we are not assured of continued supply, pricing or sufficient access to raw materials from any of these suppliers. Damage to our suppliers' manufacturing, transportation or distribution capabilities could impair our ability to make, transport, distribute or sell our products. Other events that adversely affect our suppliers and that are out of our control could also impair our ability to obtain the raw materials and other inputs that we need in the quantities and at the prices that we desire. Such events include adverse weather conditions (including climate change) or natural disasters, government action, or problems with our suppliers’ businesses, finances, labor relations, costs, production, insurance, reputation and international demand and supply characteristics.
If we are unable to obtain raw materials and other inputs for our products or offset any increased costs for such raw materials and inputs, our business could be negatively affected. While we may enter into forward purchase contracts and other purchase arrangements with suppliers and may purchase over-the-counter contracts with our qualified banking partners or exchange-traded commodity futures contracts for raw materials, these arrangements do not eliminate the risk of negative impacts on our business, financial condition and results of operations from commodity price changes.
We may not realize anticipated benefits from our enterprise-wide cost productivity plan, and we may not complete this plan within our projected time frames, either of which could materially adversely impact our business, financial condition, results of operations and cash flows.
We are executing an aggressive enterprise-wide cost productivity plan to significantly overhaul and reset our cost structure. We believe these cost savings measures are necessary to offset our volume deleverage and position our business for future success and growth. Our future success and earnings depend upon our ability to realize the benefit of our cost reduction activities and rationalization plans, particularly in an environment of increased competitive activity, volume pressures, and reduced profitability. Inflation, declining volumes and competitive pricing pressures have negated, and may continue to negate, some of the impact of our cost saving efforts. In addition, several factors could cause our cost productivity plan to adversely affect our business, financial condition, results of operations and cash flows. These include potential disruption of our operations and other aspects of our business and significant investments required to execute the plan. Employee morale and productivity could also suffer and result in unintended employee attrition. Our cost productivity plan will require substantial management time and attention and may divert management from other important work. In addition, certain of our cost reduction activities have led to increased costs in other aspects of our business such as increased conversion or distribution costs. For example, in connection with our plant closures, our cost of distribution on a per gallon basis has increased as we have changed distribution routes and transported product into areas previously serviced by now closed plants. If we fail to properly anticipate and mitigate the ancillary cost increases related to our plant closures or other cost savings, we may not realize the benefits of our cost productivity plan.
In addition, we must execute our plans within our projected timelines in order to meet our financial projections and to remain competitive in the marketplace. We could encounter delays in executing our plans, which could cause further disruption and additional unanticipated expense. If we are unable to realize the anticipated benefits from our cost productivity plan or complete them within the targeted time frame, we may be unable to meet our financial projections, or realize the necessary cost savings to offset the anticipated impact from our volume deleverage and cost inflation. In addition, we could be cost disadvantaged in the marketplace, and our competitiveness and our profitability could decrease. Depending on the extent of the decline in our financial results and our financial and cash flow projections, we may also incur tangible or intangible asset impairment charges in future periods.
9
Our volume, sales and profits have been, and may continue to be, negatively impacted by the outcome of competitive bidding.
Many of our retail customers have become increasingly price sensitive and investing in private label, which has intensified the competitive environment in which we operate. As a result, we have been subject to a number of competitive bidding situations, both formal and informal, which have materially reduced our sales volumes and profitability on sales to several customers. We expect this trend of competitive bidding to continue. In oder to win business in such a competitive environment, we may have to replace existing or lost volume with lower margin business, which could also negatively impact our profitability. Additionally, this competitive environment may result in us serving an increasing number of small format customers, which may raise the costs of production and distribution, and negatively impact the profitability of our business. If we are unable to structure our business to appropriately respond to the pricing demands of our customers, we may lose customers to other processors that are willing to sell product at a lower cost, which could negatively impact our volume, sales and profits.
Price concessions to retailers have negatively impacted, and could continue to negatively impact, our operating margins and profitability.
In the past, retailers have at times required price concessions that have negatively impacted our margins, and continued pressures to make such price concessions could negatively impact our profitability in the future. If we are not able to lower our cost structure adequately in response to customer pricing demands, and if we are not able to attract and retain a profitable customer mix and a profitable product mix, our profitability could continue to be adversely affected.
We may be adversely impacted by a changing customer and consumer landscape.
Many of our customers, such as supermarkets, warehouse clubs and food distributors, have consolidated. This consolidation may continue. These consolidations have produced large, more sophisticated customers with increased buying power and negotiating strength, who may seek lower prices or more favorable terms, and they have increased our dependence on key large-format retailers and discount supermarket retailers. In addition, some of these customers are vertically integrated and have re-dedicated key shelf-space that was formerly occupied by our branded products for their private label products. We are also facing downward pricing pressure from retailers, such as discount supermarket retailers, who sell their own private label products and proprietary brands. In addition to the competitive pressures from retail customers, we are facing increased competition from dairy cooperatives and other processors.
The highly competitive retail fluid milk and broader grocery industries are facing additional future uncertainties as a result of the rise of discount supermarket chains, online and delivery grocery offerings, meal kit services, and other mechanisms of food delivery. These developments may trigger significant changes in pricing competition, and the grocery industry, as well as consumer buying patterns, the effects and timing of which are currently unknown.
Higher levels of price competition and higher resistance to price increases have had a significant impact on our business. If we are unable to respond to these customer dynamics and potential future changes in the customer landscape, our business or financial results could be materially adversely affected.
Our ability to generate positive cash flow and profits will depend partly on our successful execution of our business strategy.
Our ability to generate positive cash flow and profits will depend partly on our successful execution of our business strategy. Our business strategy may require significant capital investment and management attention, which may result in the diversion of these resources from other business issues and opportunities. Additionally, the successful implementation of our current business strategy is subject to our ability to manage costs and expenses and implement our enterprise-wide cost productivity plan, our ability to develop new and innovative products, the success of continuing improvement initiatives, our ability to leverage processing and logistical efficiencies, our consumers’ demand for our brands and products, the effectiveness of our advertising and targeting of consumers and channels, the availability of favorable acquisition opportunities and our ability to attract and retain qualified management and other personnel. There can be no assurance that we will be able to successfully implement our business strategy. If we cannot successfully execute our business strategy, our business, financial condition and results of operations may be adversely impacted.
10
The success of our business strategy depends upon our ability to build our brands.
Building strong brands is a key component of our business strategy in order to expand sales and volumes and to respond to the changing customer landscape. With the launch of our national brands, DairyPure® and TruMoo®, we have expanded from a regional branding strategy to a national branding strategy. We have incurred, and may continue to incur in the future, significant expenditures for advertising and marketing campaigns in an effort to build brand awareness and preference over other private label products. We may not be successful in our efforts to expand our regional brand presence to a national brand presence, and we cannot guarantee that our advertising and marketing campaigns will result in customer or consumer acceptance of our brands. Further, the success of our national branding strategy requires us to drive operational changes in order to have a national brand footprint. If these efforts are unsuccessful or we incur substantial costs in connection with these efforts, our business, operating results and financial condition could be adversely affected.
The loss of, or a material reduction or change in the mix of sales volumes purchased by, any of our largest customers could negatively impact our sales and profits.
Walmart Inc. and its subsidiaries, including Sam’s Club, accounted for approximately 17.5% and 16.7% of our consolidated net sales in 2017 and 2016, respectively, and our top five customers, including Walmart, collectively accounted for approximately 32% and 31% of our consolidated net sales in 2017 and 2016, respectively. In connection with Walmart Inc.’s dairy processing plant in Indiana, we expect to lose approximately 60 million gallons of private label fluid milk volume beginning in the second half of 2018, which equates to approximately 100 to 110 million gallons annually. In addition, we expect marketplace volume and mix challenges to continue in 2018, including those associated with our largest customer.
We are also indirectly exposed to the financial and business risks of our largest customers because, if their business declines, they may correspondingly decrease the volumes purchased from us. The loss of, or further declines or changes in the mix of sales volumes purchased by, any of our largest customers could negatively impact our sales and profits, particularly due to our significant fixed costs and assets, which are difficult to rapidly reduce in response to significant volume declines.
The failure to successfully identify, consummate and integrate acquisitions into our existing operations could adversely affect our financial results.
We regularly evaluate acquisitions and other strategic opportunities as part of our business strategy. We face significant competition from numerous other bidders, many of which may have greater financial resources to allocate for acquisition opportunities. Accordingly, attractive acquisition opportunities may not be available to us or may be available only at higher cost or valuations. If we are unable to identify suitable acquisition candidates or successfully consummate the acquisitions and integrate the businesses we acquire, our business strategy may not succeed.
Additionally, the acquisitions that we complete may involve potential risks, including:
•diversion of management’s attention from other business concerns;
•inability to achieve anticipated benefits from these acquisitions in the timeframe we anticipate, or at all;
• | inherent risks in entering geographic locations, markets or lines of business in which we have limited prior experience; |
• | inability to integrate the new operations, technologies and products of the acquired companies successfully with our existing businesses; |
• | increased leverage and higher interest expense associated with borrowings that may be required to fund these acquisitions; |
• | potential disruption of our ongoing business; |
•potential loss of key employees and customers of the acquired companies;
•possible assumption of unknown liabilities; and
•potential disputes with the sellers.
Moreover, merger and acquisition activities are subject to antitrust and competition laws, which have impacted, and may continue to impact, our ability to pursue strategic transactions.
Any or all of these risks could materially adversely impact our business and financial results.
If we fail to anticipate and respond to changes in consumer preferences, demand for our products could decline.
Consumer tastes, preferences and consumption habits evolve over time and are difficult to predict. Demand for our products depends on our ability to identify and offer products that appeal to these shifting preferences. Factors that may affect consumer tastes and preferences include:
11
• | dietary trends and increased attention to nutritional values, such as the sugar, fat, protein or calorie content of different foods and beverages; |
• | concerns regarding the health effects of specific ingredients and nutrients, such as dairy, sugar and other sweeteners, vitamins and minerals; |
• | concerns regarding the public health consequences associated with obesity, particularly among young people; and |
• | increasing awareness of the environmental and social effects of product production. |
If we fail to anticipate and respond to these changes and trends, we may experience reduced consumer demand for our products, which in turn could adversely affect our sales volumes and our business could be negatively affected.
Our business operations could be disrupted and the liquidity and market price of our securities could decline if our information technology systems fail to perform adequately or experience a security breach.
We maintain a large database of confidential information and sensitive data in our information technology systems, including confidential employee, supplier and customer information, and accounting, financial and other data on which we rely for internal and external financial reporting and other purposes. In addition, the efficient operation of our business depends on our information technology systems. We rely on our information technology systems, including those of third parties, to effectively manage our business data, communications, supply chain, logistics, accounting and other business processes. If we do not allocate and effectively manage the resources necessary to build and sustain an appropriate technology environment, our business or financial results could be negatively impacted. In addition, our information technology systems and those of third parties are vulnerable to damage or interruption from circumstances beyond our control, including systems failures, viruses, security breaches or cyber incidents such as ransomware, intentional cyber attacks aimed at theft of sensitive data or inadvertent cyber-security compromises. A security breach of such information or failure of our information technology systems or those of third parties that we rely on could result in damage to our reputation, negatively impact our relations with our customers or employees, and expose us to liability and litigation. Moreover, a security breach or failure of our information systems could also result in the alteration, corruption or loss of the accounting, financial or other data on which we rely for internal and external financial reporting and other purposes and, depending on the severity of the security breach or systems failure, could prevent the audit of our financial statements or our internal control over financial reporting from being completed on a timely basis or at all, or could negatively impact the resulting audit opinions. Any such damage or interruption, or alteration, corruption or loss, could have a material adverse effect on our business or could cause our securities to become less liquid and the market price of our securities to decline.
We may incur liabilities or harm to our reputation, or be forced to recall products, as a result of real or perceived product quality or other product-related issues.
We sell products for human consumption, which involves a number of risks. Product contamination, spoilage, other adulteration, misbranding, mislabeling, or product tampering could require us to recall products. We also may be subject to liability if our products or operations violate applicable laws or regulations, including environmental, health and safety requirements, or in the event our products cause injury, illness or death. In addition, our product advertising could make us the target of claims relating to false or deceptive advertising under U.S. federal and state laws, including the consumer protection statutes of some states, or laws of other jurisdictions in which we operate. A significant product liability, consumer fraud or other legal judgment against us or a widespread product recall may negatively impact our sales, brands, reputation and profitability. Moreover, claims or liabilities of this sort might not be covered by insurance or by any rights of indemnity or contribution that we may have against others. Even if a product liability, consumer fraud or other claim is found to be without merit or is otherwise unsuccessful, the negative publicity surrounding such assertions regarding our products or processes could materially and adversely affect our reputation and brand image, particularly in categories that consumers believe as having strong health and wellness credentials. Further, the risks to our reputation and brand image are more susceptible on a national scale as a result of our expansion from a regional branded platform to a national branded platform. In addition, consumer preferences related to genetically modified foods, animal proteins, or the use of certain sweeteners could result in negative publicity and adversely affect our reputation. Any loss of consumer confidence in our product ingredients or in the safety and quality of our products would be difficult and costly to overcome and could have a material adverse effect on our business.
12
Disruption of our supply or distribution chains or transportation systems could adversely affect our business.
Our ability to make, move and sell our products is critical to our success. Damage or disruption to our manufacturing or distribution capabilities due to weather (including the impact of climate change), natural disaster, fire, environmental incident, terrorism (including eco-terrorism and bio-terrorism), pandemic, strikes, the financial or operational instability of key suppliers, distributors, warehousing and transportation providers, or other reasons could impair our ability to manufacture or distribute our products. If we are unable, or it is not financially feasible, to mitigate the likelihood or potential impact of such events, our business and results of operations could be negatively affected and additional resources could be required to restore our supply chain. In addition, we are subject to federal motor carrier regulations, such as the Federal Motor Carrier Safety Act, with which our extensive DSD system must comply. Failure to comply with such regulations could result in our inability to deliver product to our customers in a timely manner, which could adversely affect our reputation and our results.
Failure to maintain sufficient internal production capacity or to enter into co-packing agreements on terms that are beneficial for us may result in our inability to meet customer demand and/or increase our operating costs.
The success of our business depends, in part, on maintaining a strong production platform and we rely on internal production resources and third-party co-packers to fulfill our manufacturing needs. As part of our ongoing cost reduction efforts, we have closed or announced the closure of a number of our plants since late 2012. It is possible that we may need to increase our reliance on third parties to provide manufacturing and supply services, commonly referred to as “co-packing” agreements, for a number of our products. In particular, there is increasing consumer preference for certain sized extended shelf life (“ESL”) products in certain categories and, as a result of the Morningstar divestiture, we are contractually limited in our ability to manufacture ESL products. In such case, we must rely on our co-packers. A failure by our co-packers to comply with food safety, environmental, or other laws and regulations may disrupt our supply of products and cause damage to the reputation of our brand. If we need to enter into additional co-packing agreements in the future, we can provide no assurance that we would be able to find acceptable third-party providers or enter into agreements on satisfactory terms. Our inability to establish satisfactory co-packing arrangements could limit our ability to operate our business and could negatively affect our sales volumes and results of operations. If we cannot maintain sufficient production capacity, either internally or through third-party agreements, we may be unable to meet customer demand and/or our manufacturing costs may increase, which could negatively affect our business.
If we are unable to hire, retain and develop our leadership bench, or fail to develop and implement an adequate succession plan for current leadership positions, it could have a negative impact on our business.
Our continued and future success depends partly upon our ability to hire, retain and develop our leadership bench. Effective succession planning is also a key factor in our long-term success. Any unplanned turnover or failure to develop or implement an adequate succession plan to backfill key leadership positions could deplete our institutional knowledge base and erode our competitive advantage. Our failure to enable the effective transfer of knowledge or to facilitate smooth transitions with regard to key leadership positions, including the upcoming onboarding of Jody Macedonio as CFO, could adversely affect our long-term strategic planning and execution and negatively affect our business, financial condition and results of operations.
Our existing debt and other financial obligations may restrict our business operations and we may incur even more debt.
We have substantial debt and other financial obligations and significant unused borrowing capacity. We may incur additional debt in the future. In addition to our other financial obligations, on December 31, 2017, we had $918.9 million of long-term debt obligations, excluding unamortized discounts and debt issuance costs of $5.7 million. On February 21, 2018, we had the ability to borrow up to a combined additional $576.6 million of combined future borrowing capacity under our Credit Facility and receivables securitization facility, subject to compliance with certain conditions.
We have pledged substantially all of our assets, other than real property, to secure our Credit Facility. Our debt and related debt service obligations could:
• | require us to dedicate significant cash flow to the payment of principal and interest on our debt, which reduces the funds we have available for other purposes, including for funding working capital, capital expenditures, and acquisitions and for other general corporate purposes; |
• | limit our flexibility in planning for or reacting to changes in our business and market conditions; |
• | impose on us additional financial and operational restrictions, including restrictions on our ability to, among other things, incur additional indebtedness, create liens, guarantee obligations, undertake acquisitions or sales of assets, declare dividends and make other specified restricted payments, and make investments; and |
• | place us at a competitive disadvantage compared to businesses in our industry that have less debt or that are debt-free. |
13
To the extent that we incur additional indebtedness in the future, these limitations would likely have a greater impact on our business. Failure to make required payments on our debt or comply with the financial covenants or any other non-financial or restrictive covenants set forth in the agreements governing our debt could create a default and cause a downgrade to our credit rating. Upon a default, our lenders could accelerate the indebtedness, foreclose against their collateral or seek other remedies, which would jeopardize our ability to continue our current operations. In those circumstances, we may be required to amend the agreements governing our debt, refinance all or part of our existing debt, sell assets, incur additional indebtedness or raise equity. Our ability to make scheduled payments on our debt and other financial obligations and comply with financial covenants depends on our financial and operating performance, which in turn, is subject to various factors such as prevailing economic conditions and to financial, business and other factors, some of which are beyond our control. See “Part II - Item 7. Management’s Discussion and Analysis of Financial Condition and Results of Operations - Liquidity and Capital Resources - Current Debt Obligations” for more information.
The Tax Cuts and Jobs Act signed into law on December 22, 2017 could have a negative effect on our financial condition and results of operations.
Legislative or other actions relating to taxes could have a negative effect on the Company. The rules dealing with U.S. federal income taxation are constantly under review by persons involved in the legislative process and by the Internal Revenue Service ("IRS") and the U.S. Treasury Department. The Tax Cuts and Jobs Act (the “Tax Act”), which was signed into law in December 2017, made comprehensive changes to the U.S. tax code affecting tax years 2017 and thereafter. Among other things, the Tax Act reduces the U.S. federal corporate income tax rate from 35% to 21%, imposes a mandatory one-time transition tax on unrepatriated foreign earnings, enhances the acceleration of depreciation deductions on qualified property, changes the U.S. taxation of foreign earnings and eliminates certain business deductions. The legislation is unclear in certain respects and will require interpretations and implementing regulations by the IRS, as well as state tax authorities, and the legislation could be subject to potential amendments and technical corrections, any of which could lessen or increase certain adverse impacts of the legislation. It is also uncertain how credit rating agencies will treat the impacts of this legislation on their credit ratings and metrics. While there are benefits, there is substantial uncertainty regarding the details of the Tax Act. The intended and unintended consequences of the Tax Act on our business and on holders of our common stock is uncertain and could be adverse. For example, the tax reform legislation enacted a new provision that in general allows farmers a 20% deduction on all payments received on sales to cooperatives. This new deduction could increase our cost of raw milk purchased directly from farmers or make it more difficult to find direct farm sources of supply and could also indirectly impact our other commodity costs.
We cannot predict with certainty how the Tax Act or any other changes in the tax laws might affect the Company or its stockholders. The new legislation and any U.S. Treasury regulations, administrative interpretations or court decisions interpreting such legislation could significantly and negatively affect U.S. federal income tax consequences to the Company and its stockholders.
We may need additional financing in the future, and we may not be able to obtain that financing.
From time to time, we may need additional financing to support our business and pursue our growth strategy, including strategic acquisitions. Our ability to obtain additional financing, if and when required, will depend on investor demand, our operating performance, the condition of the capital markets, and other factors. We cannot assure you that additional financing will be available to us on favorable terms when required, or at all. If we are unable to obtain additional financing in the future, our business, financial condition, and operations could be materially adversely affected.
Risks Related to Our Common Stock
Our Board of Directors could change our dividend policy at any time.
In November 2013, our Board of Directors adopted a dividend policy under which we intend to pay quarterly cash dividends on our common stock. Under this policy, holders of our common stock will receive dividends when and as declared by our Board of Directors. Pursuant to this policy, we paid quarterly dividends of $0.09 per share ($0.36 per share annually) during 2017. However, we are not required to pay dividends and our stockholders do not have contractual or other legal rights to receive them. Any determination to pay cash dividends on our common stock in the future may be affected by business conditions, our views on potential future capital requirements, the terms of our debt instruments, legal risks, changes in federal income tax law and challenges to our business model. Furthermore, our Board of Directors may decide at any time, in its discretion, not to pay a dividend, to decrease the amount of dividends or to change or revoke the dividend policy entirely. If we do not pay dividends, for whatever reason, shares of our common stock could become less liquid and the market price of our common stock could decline.
14
Our stock price is volatile and may decline regardless of our operating performance, and you could lose a significant part of your investment.
The market price of our common stock has historically been volatile and in the future may be influenced by many factors, some of which are beyond our control, including those described in this section and the following:
• | changes in financial estimates by analysts or our inability to meet those financial estimates; |
• | strategic actions by us or our competitors, such as acquisitions, restructurings, significant contracts, acquisitions, joint marketing relationships, joint ventures or capital commitments; |
• | variations in our quarterly results of operations and those of our competitors; |
• | general economic and stock market conditions; |
• | changes in conditions or trends in our industry, geographies or customers; |
• | terrorist acts; |
• | activism by any large stockholder or group of stockholders; |
• | perceptions of the investment opportunity associated with our common stock relative to other investment alternatives; |
• | actual or anticipated growth rates relative to our competitors; and |
• | speculation by the investment community regarding our business. |
In addition, the stock markets, including the New York Stock Exchange, have experienced price and volume fluctuations that have affected and continue to affect the market prices of equity securities issued by many companies, including companies in our industry. In the past, some companies that have had volatile market prices for their securities have been subject to class action or derivative lawsuits or shareholder activism. The filing of a lawsuit against us or shareholder activism targeted toward us, regardless of the outcome, could have a negative effect on our business, financial condition and results of operations, as it could result in substantial legal costs and a diversion of management’s attention and resources.
These market and industry factors may materially reduce the market price of our common stock, regardless of our operating performance. This volatility may increase the risk that our stockholders will suffer a loss on their investment or be unable to sell or otherwise liquidate their holdings of our common stock.
Capital Markets and General Economic Risks
Future funding requirements, withdrawal liabilities and related charges associated with multiemployer plans in which we participate could have a material negative impact on our business.
In addition to our company-sponsored pension plans, we participate in certain multiemployer defined benefit pension plans that are administered jointly by labor unions representing certain of our employees and multiple employers like us that have employees participating in the plan. We make periodic contributions to these multiemployer pension plans in accordance with the provisions of negotiated collective bargaining agreements. Our required contributions to these plans could increase due to a number of factors, including the funded status of the plans and the level of our ongoing participation in these plans. Underfunding is not a direct obligation or liability of ours or any employer, but is likely to have important consequences. Our risk of such increased payments may be greater if any of the participating employers in these underfunded plans withdraws from the plan due to insolvency and is not able to contribute an amount sufficient to fund the unfunded liabilities associated with its participants in the plan. In the event that we decide to withdraw from participation in one of these multiemployer plans, we could be required to make additional lump-sum contributions to the relevant plan. These withdrawal liabilities may be significant and could materially adversely affect our business and our financial results.
Some of the plans in which we participate are reported to have significant underfunded liabilities, which could increase the amount of any potential withdrawal liability. This requires us to potentially make substantial withdrawal liability payments when we close a facility covered by one of these plans, which could hinder our ability to make otherwise appropriate management decisions to operate as efficiently as possible. In addition, under the Pension Protection Act of 2006 and the Multi-Employer Pension Reform Act of 2014, special funding rules apply to multiemployer pension plans that are classified as “endangered,” “seriously endangered,” “critical,” or "critical and declining" status. Some of the plans in which we participate are in critical or critical and declining status, and we have been required to make additional contributions and may be subject to additional contributions in the future. We are subject to substantial withdrawal liability with respect to a number of multiemployer pension plans in which we participate. Our greatest potential withdrawal liability is related to the Central States, Southeast and Southwest Areas Pension Fund, which is in “critical and declining” status and has been for a number of years based on that plan's annual
15
Form 5500 filings, meaning it was less than 65% funded. The plan is currently projected to become insolvent in 2025. It is unclear what will happen to this plan in the future, and the effects and consequences of the plan’s insolvency are currently unknown. Future funding requirements and related charges associated with multiemployer plans in which we participate could have a material negative impact on our results of operations, financial condition and cash flows.
The costs of providing employee benefits have escalated, and liabilities under certain plans may be triggered due to our actions or the actions of others, which may adversely affect our profitability and liquidity.
We sponsor various defined benefit and defined contribution retirement plans, as well as contribute to various multiemployer pension plans on behalf of our employees. Changes in interest rates or in the market value of plan assets could affect the funded status of our pension plans. This could cause volatility in our benefits costs and increase future funding requirements of our plans. Pension and post-retirement costs also may be significantly affected by changes in key actuarial assumptions including anticipated rates of return on plan assets and the discount rates used in determining the projected benefit obligation and annual periodic pension costs. Recent changes in federal laws require plan sponsors to eliminate, over defined time periods, the underfunded status of plans that are subject to the Employee Retirement Income Security Act rules and regulations. Certain of our defined benefit retirement plans are less than fully funded. Facility closings may trigger cash payments or previously unrecognized obligations under our defined benefit retirement plans, and the costs of such liabilities may be significant or may compromise our ability to close facilities or otherwise conduct cost reduction initiatives on time and within budget. A significant increase in future funding requirements could have a negative impact on our results of operations, financial condition and cash flows. In addition to potential changes in funding requirements, the costs of maintaining our pension plans are impacted by various factors including increases in healthcare costs and legislative changes.
Changes in our credit ratings may have a negative impact on our future financing costs or the availability of capital.
Some of our debt is rated by Standard & Poor’s, Moody’s Investors Service and Fitch Ratings, and there are a number of factors beyond our control with respect to these ratings. Our credit ratings are currently considered to be below “investment grade.” Although the interest rate on our existing credit facilities is not affected by changes in our credit ratings, such ratings or any further rating downgrades may impair our ability to raise additional capital in the future on terms that are acceptable to us, if at all, may cause the value of our securities to decline and may have other negative implications with respect to our business. Ratings reflect only the views of the ratings agency issuing the rating, are not recommendations to buy, sell or hold our securities and may be subject to revision or withdrawal at any time by the ratings agency issuing the rating. Each rating should be evaluated independently of any other rating.
Unfavorable economic conditions may adversely impact our business, financial condition and results of operations.
The dairy industry is sensitive to changes in international, national and local general economic conditions. Future economic decline or increased income disparity could have an adverse effect on consumer spending patterns. Increased levels of unemployment, increased consumer debt levels and other unfavorable economic factors could further adversely affect consumer demand for products we sell or distribute, which in turn could adversely affect our results of operations. Consumers may not return to historical spending patterns following any future reduction in consumer spending.
Legal and Regulatory Risks
Litigation could expose us to significant liabilities and may have a material adverse impact on our reputation and business.
Scrutiny of the dairy industry has resulted, and may continue to result, in litigation against us. Such lawsuits are expensive to defend, divert management’s attention and may result in significant judgments or settlements. In some cases, these awards would be trebled by statute and successful plaintiffs are entitled to an award of attorneys’ fees. Depending on its size, such a judgment or settlement could materially and adversely affect our results of operations, cash flows and financial condition and impair our ability to continue operations. We may not be able to pay such judgment or to post a bond for an appeal, given our financial condition and our available cash resources. In addition, depending on its size, failure to pay such a judgment or failure to post an appeal bond could cause us to breach certain provisions of our credit facilities. In either of these or other circumstances, we may seek a waiver of or amendment to the terms of our credit facilities, but we may not be able to obtain such a waiver or amendment. Failure to obtain such a waiver or amendment would materially and adversely affect our results of operations, cash flows and financial condition and could impair our ability to continue operations. Moreover, such litigation could expose us to negative publicity, which could adversely affect our brands, reputation and/or customer preference for our products.
We were previously a party to a private antitrust lawsuit brought by two plaintiffs that was scheduled for trial beginning March 28, 2017. Prior to trial, the plaintiffs agreed with us to settle the lawsuit. We agreed to pay settlements to the plaintiffs and the parties resolved all outstanding claims in the litigation and agreed to voluntarily dismiss the litigation. The litigation was
16
dismissed on March 21, 2017 with respect to one plaintiff, and on March 26, 2017 with respect to the other plaintiff. The two plaintiffs initiated the case in 2007 as a putative class action. Although the court refused to certify the case as a class action, the court’s denial of class certification did not act as an adjudication on the merits for the class of purchasers the named plaintiffs proposed to represent. Therefore, we may be subject to subsequent litigation by such purchasers.
Our results of operations could be adversely affected if actual losses from legal claims against us exceed our reserves.
We are party to various litigation claims and legal proceedings. We evaluate these litigation claims and legal proceedings to assess the likelihood of unfavorable outcomes and to estimate, if possible, the amount of potential losses. Based on these assessments and estimates, we establish reserves and/or disclose the relevant litigation claims or legal proceedings, as appropriate. These assessments and estimates are based on the information available to management at the time and involve a significant amount of management judgment. Actual outcomes or losses may differ materially from our current assessments and estimates. If the amounts we are required to pay as a result of claims against us substantially exceed the sums anticipated by our reserves, if established, the need to pay those amounts could have a material adverse effect on our results of operations.
Labor disputes could adversely affect us.
As of December 31, 2017, approximately 37% of our employees were covered under collective bargaining agreements. Our collective bargaining agreements generally run in duration from 3 to 5 years. At any given time, we may face a number of union organizing drives. When we negotiate collective bargaining agreements or terms, we and the union may disagree on important issues which, in turn, could possibly lead to a strike, work slowdown or other job actions at one or more of our locations. In the event of a strike, work slowdown or other labor unrest, or if we are unable to negotiate labor contracts on reasonable terms, our ability to supply our products to customers could be impaired, which could result in reduced revenue and customer claims, and may distract our management from focusing on our business and strategic priorities. In addition, our ability to make short-term adjustments to control compensation and benefits costs or otherwise to adapt to changing business requirements may be limited by the terms of our collective bargaining agreements.
Our business is subject to various environmental and health and safety laws and regulations, which may increase our compliance costs or subject us to liabilities.
Our business operations are subject to numerous requirements in the United States relating to the protection of the environment and health and safety matters, including the Clean Air Act, the Clean Water Act, the Comprehensive Environmental Response and the Compensation and Liability Act of 1980, as amended, as well as similar state and local statutes and regulations in the United States. These laws and regulations govern, among other things, air emissions and the discharge of wastewater and other pollutants, the use of refrigerants, the handling and disposal of hazardous materials, and the cleanup of contamination in the environment. The costs of complying with these laws and regulations may be significant, particularly relating to wastewater and ammonia treatment which are capital intensive. Additionally, we could incur significant costs, including fines, penalties and other sanctions, cleanup costs and third-party claims for property damage or personal injury as a result of the failure to comply with, or liabilities under, environmental, health and safety requirements. New legislation, as well as current federal and other state regulatory initiatives relating to these environmental matters, could require us to replace equipment, install additional pollution controls, purchase various emission allowances or curtail operations. These costs could negatively affect our results of operations and financial condition.
Changes in laws, regulations and accounting standards could have an adverse effect on our financial results.
We are subject to federal, state and local governmental laws and regulations, including those promulgated by the FDA, the USDA, U.S. Department of the Treasury, IRS, Environmental Protection Agency ("EPA"), FTC, Department of Transportation, Department of Labor, the Sarbanes-Oxley Act of 2002, the Dodd-Frank Wall Street Reform and Consumer Protection Act of 2010 and numerous related regulations promulgated by the Securities and Exchange Commission and the Financial Accounting Standards Board. Changes in federal, state or local laws, or the interpretations of such laws and regulations, may negatively impact our financial results or our ability to market our products. Any or all of these risks could adversely impact our financial results.
Violations of laws or regulations related to the food industry, as well as new laws or regulations or changes to existing laws or regulations related to the food industry, could adversely affect our business.
The food production and marketing industry is subject to a variety of federal, state and local laws and regulations, including food safety requirements related to the ingredients, manufacture, processing, packaging, storage, marketing, advertising, labeling quality and distribution of our products, as well as those related to worker health and workplace safety. Our activities are subject to extensive regulation. We are regulated by, among other federal and state authorities, the FDA, the EPA, the FTC, and the U.S. Departments of Agriculture, Commerce, Labor and Transportation. Federal legislation passed in 2016 directs the USDA to adopt rules requiring the labeling of products containing or derived from genetically engineered organisms. New rules adopted by the
17
FDA redesigned the Nutrition Facts label and requires all packaged goods to use the new label by July 2018 (although the FDA has taken formal steps to extend that deadline, which is currently expected to be January 2020). Change and implementation of new labels on our products to comply with these rules may result in significant costs to our business. In addition, a growing number of local ordinances across the country have imposed a tax on sweetened beverages, which may have a negative impact on our sales, results of operations and our business. In addition, a number of states are considering similar laws. Governmental regulations also affect taxes and levies, healthcare costs, energy usage, immigration and other labor issues, all of which may have a direct or indirect effect on our business or those of our customers or suppliers.
In addition, our volumes may be impacted by the level of government spending that supports grocery purchases because such amounts may impact the level of consumer spending on fluid dairy products. As a meaningful portion of Supplemental Nutrition Assistance Program (“SNAP”) benefits are spent in the dairy category, we are cautious about the impact that any change or reduction in these benefits could have on consumer spending in the dairy category. Any reduction or change in SNAP benefits or the suspension, curtailment, or expiration of other government spending programs, such as the Special Supplemental Nutrition Program for Women, Infants, and Children, could have an adverse impact upon our volumes and our results of operations.
In addition, the marketing and advertising of our products could make us the target of claims relating to alleged false or deceptive advertising under federal and state laws and regulations, and we may be subject to initiatives that limit or prohibit the marketing and advertising of our products to children. Changes in these laws or regulations or the introduction of new laws or regulations could increase our compliance costs, increase other costs of doing business for us, our customers or our suppliers, or restrict our actions, which could adversely affect our results of operations. In some cases, increased regulatory scrutiny could interrupt distribution of our products or force changes in our production processes or procedures (or force us to implement new processes or procedures). For example, the FDA has finalized new regulations pursuant to the Food Safety Modernization Act of 2011 which requires, among other things, that food facilities conduct contamination hazard analysis, implement risk-based preventive controls and develop track-and-trace capabilities, and there could be unforeseen issues, requirements and costs that arise as we come into compliance with these new rules by the various required compliance dates, with the last new rule to become effective in 2019. Further, if we are found to be in violation of applicable laws and regulations in these areas, we could be subject to civil remedies, including fines, injunctions or recalls, as well as potential criminal sanctions, any of which could have a material adverse effect on our business.
Item 1B. | Unresolved Staff Comments |
None.
18
Item 2. | Properties |
Our corporate headquarters are located in leased premises at 2711 North Haskell Avenue, Suite 3400, Dallas, Texas 75204. In addition, we operate 65 manufacturing facilities. We believe that our facilities are well maintained and are generally suitable and of sufficient capacity to support our current business operations and that the loss of any single facility would not have a material adverse effect on our operations or financial results.
We currently conduct our manufacturing operations within the following facilities, most of which are owned:
Homewood, Alabama(2) | Hammond, Louisiana | Springfield, Ohio |
City of Industry, California(2) | Franklin, Massachusetts | Toledo, Ohio |
Hayward, California | Lynn, Massachusetts | Erie, Pennsylvania |
Englewood, Colorado | Wilbraham, Massachusetts | Lansdale, Pennsylvania |
Greeley, Colorado | Grand Rapids, Michigan | Lebanon, Pennsylvania |
Deland, Florida | Livonia, Michigan | Schuylkill Haven, Pennsylvania |
Miami, Florida | Marquette, Michigan | Sharpsville, Pennsylvania |
Orlando, Florida | Thief River Falls, Minnesota | Spartanburg, South Carolina |
Braselton, Georgia | Woodbury, Minnesota | Sioux Falls, South Dakota |
Hilo, Hawaii | Billings, Montana | Athens, Tennessee |
Honolulu, Hawaii | Great Falls, Montana | Nashville, Tennessee(2) |
Boise, Idaho | North Las Vegas, Nevada | Dallas, Texas |
Belvidere, Illinois | Reno, Nevada | El Paso, Texas |
Harvard, Illinois | Florence, New Jersey | Houston, Texas |
Huntley, Illinois | Albuquerque, New Mexico | Lubbock, Texas |
O’Fallon, Illinois | Rensselaer, New York | McKinney, Texas |
Rockford, Illinois | High Point, North Carolina | San Antonio, Texas |
Decatur, Indiana | Winston-Salem, North Carolina | Salt Lake City, Utah |
Huntington, Indiana | Bismarck, North Dakota | St. George, Utah |
LeMars, Iowa | Tulsa, Oklahoma | Ashwaubenon, Wisconsin |
Louisville, Kentucky | Marietta, Ohio | |
The majority of our manufacturing facilities also serve as distribution facilities. In addition, we have numerous distribution branches located across the country, some of which are owned but most of which are leased.
Item 3. Legal Proceedings
We are party from time to time to certain pending or threatened legal proceedings in the ordinary course of our business. Potential liabilities associated with these matters are not expected to have a material adverse impact on our financial position, results of operations, or cash flows.
Item 4. | Mine Safety Disclosures |
Not applicable.
19
PART II
Item 5. | Market for Registrant’s Common Equity, Related Stockholder Matters and Issuer Purchases of Equity Securities |
Our common stock trades on the New York Stock Exchange under the symbol “DF.” The following table sets forth the high and low sales prices of our common stock as quoted on the New York Stock Exchange for the last two fiscal years.
At February 21, 2018, there were 1,999 record holders of our common stock.
High | Low | ||||||
2016: | |||||||
First Quarter | $ | 21.17 | $ | 16.48 | |||
Second Quarter | 18.97 | 16.33 | |||||
Third Quarter | 19.67 | 15.69 | |||||
Fourth Quarter | 22.14 | 16.10 | |||||
2017: | |||||||
First Quarter | 22.31 | 17.78 | |||||
Second Quarter | 20.10 | 17.00 | |||||
Third Quarter | 17.33 | 10.30 | |||||
Fourth Quarter | 12.09 | 9.01 | |||||
Dividends — In accordance with our cash dividend policy, holders of our common stock will receive dividends when and as declared by our Board of Directors. Beginning in 2015, all awards of restricted stock units, performance stock units and phantom stock awards provide for cash dividend equivalent units, which vest in cash at the same time as the underlying award. Quarterly dividends of $0.09 per share were paid in March, June, September and December of 2017 and 2016, totaling approximately $32.7 million and $32.8 million for the years ended December 31, 2017 and 2016, respectively.
See “Item 7. Management’s Discussion and Analysis of Financial Condition and Results of Operations —Liquidity and Capital Resources — Current Debt Obligations” and Note 9 to our Consolidated Financial Statements for further information regarding the terms of our senior secured credit facility, including terms restricting the payment of dividends.
20
Item 6. | Selected Financial Data |
The following selected financial data as of and for each of the years ended December 31, 2013 to 2017 has been derived from our audited Consolidated Financial Statements. The operating results of WhiteWave and Morningstar and certain other directly attributable expenses, including interest expense, related to the sale of Morningstar, which occurred on January 3, 2013, and the spin-off of WhiteWave, which was completed on May 23, 2013, are reflected as discontinued operations in the table below for all periods presented. The selected financial data does not purport to indicate results of operations as of any future date or for any future period. The selected financial data should be read in conjunction with our Consolidated Financial Statements and the related Notes thereto.
Year Ended December 31 | |||||||||||||||||||
2017 | 2016 | 2015 | 2014 | 2013 | |||||||||||||||
(Dollars in thousands, except share data) | |||||||||||||||||||
Operating data: | |||||||||||||||||||
Net sales | $ | 7,795,025 | $ | 7,710,226 | $ | 8,121,661 | $ | 9,503,196 | $ | 9,016,321 | |||||||||
Cost of sales | 5,977,348 | 5,722,710 | 6,147,252 | 7,829,733 | 7,161,734 | ||||||||||||||
Gross profit(1) | 1,817,677 | 1,987,516 | 1,974,409 | 1,673,463 | 1,854,587 | ||||||||||||||
Operating costs and expenses: | |||||||||||||||||||
Selling and distribution | 1,346,948 | 1,348,349 | 1,379,317 | 1,355,053 | 1,337,745 | ||||||||||||||
General and administrative | 311,176 | 346,028 | 350,324 | 288,744 | 310,453 | ||||||||||||||
Amortization of intangibles(2) | 20,710 | 20,752 | 21,653 | 2,889 | 3,669 | ||||||||||||||
Facility closing and reorganization costs, net | 24,913 | 8,719 | 19,844 | 4,460 | 27,008 | ||||||||||||||
Litigation settlements(3) | — | — | — | (2,521 | ) | (1,019 | ) | ||||||||||||
Impairment of intangible and long-lived assets(4) | 30,668 | — | 109,910 | 20,820 | 43,441 | ||||||||||||||
Other operating (income) loss(5) | — | — | (4,535 | ) | 2,494 | ||||||||||||||
Total operating costs and expenses | 1,734,415 | 1,723,848 | 1,881,048 | 1,664,910 | 1,723,791 | ||||||||||||||
Operating income | 83,262 | 263,668 | 93,361 | 8,553 | 130,796 | ||||||||||||||
Other (income) expense: | |||||||||||||||||||
Interest expense(6) | 64,961 | 66,795 | 66,813 | 61,019 | 200,558 | ||||||||||||||
Loss on early retirement of debt(7) | — | — | 43,609 | 1,437 | 63,387 | ||||||||||||||
Gain on disposition of WhiteWave common stock(8) | — | — | — | — | (415,783 | ) | |||||||||||||
Other income, net | (2,942 | ) | (5,778 | ) | (3,751 | ) | (1,620 | ) | (400 | ) | |||||||||
Total other (income) expense | 62,019 | 61,017 | 106,671 | 60,836 | (152,238 | ) | |||||||||||||
Income (loss) from continuing operations before income taxes | 21,243 | 202,651 | (13,310 | ) | (52,283 | ) | 283,034 | ||||||||||||
Income tax expense (benefit)(9) | (26,179 | ) | 82,034 | (5,229 | ) | (32,096 | ) | (42,325 | ) | ||||||||||
Income (loss) from continuing operations | 47,422 | 120,617 | (8,081 | ) | (20,187 | ) | 325,359 | ||||||||||||
Income (loss) from discontinued operations, net of tax(10) | 11,291 | (312 | ) | (1,095 | ) | (652 | ) | 2,803 | |||||||||||
Gain (loss) on sale of discontinued operations, net of tax(11) | 2,875 | (376 | ) | 668 | 543 | 491,195 | |||||||||||||
Net income (loss) | 61,588 | 119,929 | (8,508 | ) | (20,296 | ) | 819,357 | ||||||||||||
Net loss attributable to non-controlling interest in discontinued operations | — | — | — | — | (6,179 | ) | |||||||||||||
Net income (loss) attributable to Dean Foods Company | $ | 61,588 | $ | 119,929 | $ | (8,508 | ) | $ | (20,296 | ) | $ | 813,178 | |||||||
Basic earnings (loss) per common share: | |||||||||||||||||||
Income (loss) from continuing operations attributable to Dean Foods Company | 0.52 | 1.33 | (0.09 | ) | (0.22 | ) | 3.47 | ||||||||||||
Income (loss) from discontinued operations attributable to Dean Foods Company | 0.16 | (0.01 | ) | — | — | 5.20 | |||||||||||||
Net income (loss) attributable to Dean Foods Company | $ | 0.68 | $ | 1.32 | $ | (0.09 | ) | $ | (0.22 | ) | $ | 8.67 | |||||||
Diluted earnings (loss) per common share: | |||||||||||||||||||
Income (loss) from continuing operations attributable to Dean Foods Company | 0.52 | 1.32 | (0.09 | ) | (0.22 | ) | 3.43 | ||||||||||||
Income (loss) from discontinued operations attributable to Dean Foods Company | 0.15 | (0.01 | ) | — | — | 5.15 | |||||||||||||
Net income (loss) attributable to Dean Foods Company | $ | 0.67 | $ | 1.31 | $ | (0.09 | ) | $ | (0.22 | ) | $ | 8.58 | |||||||
Cash dividend declared per common share | $ | 0.36 | $ | 0.36 | $ | 0.28 | $ | 0.28 | $ | — | |||||||||
Average common shares: | |||||||||||||||||||
Basic | 90,899,284 | 90,933,886 | 93,298,467 | 93,916,656 | 93,785,611 | ||||||||||||||
Diluted | 91,273,994 | 91,510,483 | 93,298,467 | 93,916,656 | 94,796,236 | ||||||||||||||
Other data: | |||||||||||||||||||
Ratio of earnings to fixed charges(12) | 1.19x | 2.84x | 0.87x | 0.48x | 2.17x | ||||||||||||||
Balance sheet data (at end of period): | |||||||||||||||||||
Total assets(13) | $ | 2,503,829 | $ | 2,606,227 | $ | 2,520,163 | $ | 2,768,714 | $ | 2,800,134 | |||||||||
Long-term debt(13)(14) | 913,199 | 886,051 | 834,573 | 916,257 | 895,351 | ||||||||||||||
Other long-term liabilities | 203,595 | 276,630 | 272,864 | 276,318 | 273,314 | ||||||||||||||
Dean Foods Company stockholders’ equity | 655,947 | 610,556 | 545,504 | 627,318 | 714,315 | ||||||||||||||
21
(1) | As disclosed in Note 1 to our Consolidated Financial Statements, we include certain shipping and handling costs within selling and distribution expense. As a result, our gross profit may not be comparable to other entities that present all shipping and handling costs as a component of cost of sales. |
(2) | Prior to 2015, certain of our trademarks were not amortized as our intent was to continue to use these intangible assets indefinitely. During the first quarter of 2015, we approved the launch of DairyPure®, our national white milk brand. In connection with the approval of the launch of DairyPure®, we re-evaluated our indefinite-lived trademarks and determined them to be finite-lived, with remaining useful lives of 5 years. In the first quarter of 2016, we further evaluated the remaining useful life of our finite-lived trademarks in conjunction with our newly approved strategy around our ice cream brands. Based on our evaluation, we extended the useful lives of certain of our finite-lived trademarks. See Note 6 to our Consolidated Financial Statements. |
(3) | Results for 2014 and 2013 include reductions in a litigation settlement liability due to plaintiff class "opt outs." |
(4) | Results for 2017 include non-cash impairment charges of $30.7 million related to property, plant and equipment at certain of our production facilities, and certain assets that are not expected to generate a future economic benefit. During the first quarter of 2015, we approved the launch of DairyPure®, our national white milk brand. In connection with the approval of the launch of DairyPure®, we changed our indefinite lived trademarks to finite lived, resulting in a triggering event for impairment testing purposes. Based upon our analysis, we recorded a non-cash impairment charge of $109.9 million. Results for 2014 include non-cash impairment charges of $20.8 million related to property, plant, and equipment at certain of our production facilities. Results for 2013 include non-cash impairment charges of $35.5 million related to property, plant and equipment at certain of our production facilities and $7.9 million related to certain finite and indefinite-lived intangible assets. See Notes 6 and 16 to our Consolidated Financial Statements. |
(5) | Results for 2014 and 2013 include the final settlement of certain liabilities associated with the prior disposition of a manufacturing facility and the final disposal of assets associated with the closure of one of our manufacturing facilities. |
(6) | Results for 2017 include a charge of $1.1 million related to the write-off of deferred financing costs in connection with the amendments to our senior secured revolving credit facility and receivables securitization facility. Results for 2013 include a charge of $6.8 million related to the write-off of deferred financing costs as a result of the termination of our prior senior secured credit facility and the repayment of all related indebtedness. |
(7) | In March 2015, we redeemed the remaining $476.2 million principal amount of our outstanding senior notes due 2016 at a total redemption price of approximately $521.8 million. As a result, we recorded a $38.3 million pre-tax loss on early retirement of long-term debt in the first quarter of 2015. In December 2014, we completed the redemption of our remaining $24 million outstanding principal amount of our senior notes due 2018 at a redemption price equal to 104.875% of their principal amount, plus accrued and unpaid interest, or approximately $26.1 million in total. As a result, we recorded a $1.4 million pre-tax loss on early retirement of debt in 2014. During the fourth quarter of 2013, we successfully completed a cash tender offer for $400 million aggregate principal amount of our senior notes due 2018 and our senior notes due 2016. We purchased $376.2 million of the senior notes due 2018, for their aggregate principal amount plus a call premium of approximately $54 million and $23.8 million of the senior notes due 2016 for their aggregate principal amount plus a call premium of approximately $3 million. As a result, we recorded a $63.4 million pre-tax loss on early retirement of debt. See Note 9 to our Consolidated Financial Statements. |
(8) | In July 2013, we disposed of our remaining investment in WhiteWave common stock through a debt-for-equity exchange. As a result of the disposition, we recorded a tax-free gain in continuing operations of $415.8 million in the third quarter of 2013. |
(9) | Results for 2017 include a one-time net income tax benefit of $43.7 million associated with the December 22, 2017 enactment of the Tax Act. See Note 8 to our Consolidated Financial Statements. Results for 2013 include the effects of the tax-free gain on the disposition of our remaining investment in WhiteWave common stock in 2013. |
(10) | Income (loss) from discontinued operations for each of the five years shown in the table above includes the operating results and certain other directly attributable expenses, including interest expense, related to the disposition of Morningstar and the spin-off of WhiteWave. See Note 2 to our Consolidated Financial Statements. |
(11) | Amounts for each of the five years relate to the disposition of Morningstar and the spin-off of WhiteWave in 2013. |
(12) | For purposes of calculating the ratio of earnings to fixed charges, “earnings” represents income (loss) before income taxes plus fixed charges and “fixed charges” consist of interest on all debt, amortization of deferred financing costs and the portion of rental expense that we believe is representative of the interest component of rent expense. |
(13) | Beginning in the first quarter of 2016, unamortized debt issuance costs, not related to revolving credit agreements, of $6.8 million, $7.9 million, $0.9 million and $1.9 million as of December 31, 2016, 2015, 2014 and 2013, respectively, were reclassified from other assets and netted against the outstanding debt balance due to the retrospective effect of ASU No. 2015-03, Imputation of Interest - Simplifying the Presentation of Debt Issuance Costs. |
(14) | Includes the current portion of long-term debt. |
22
Item 7. | Management’s Discussion and Analysis of Financial Condition and Results of Operations |
Business Overview
We are a leading food and beverage company and the largest processor and direct-to-store distributor of fresh fluid milk and other dairy and dairy case products in the United States, with a vision to be the most admired and trusted provider of wholesome, great-tasting dairy products at every occasion. We manufacture, market and distribute a wide variety of branded and private label dairy and dairy case products, including fluid milk, ice cream, cultured dairy products, creamers, ice cream mix and other dairy products to retailers, distributors, foodservice outlets, educational institutions and governmental entities across the United States. Our consolidated net sales totaled $7.8 billion in 2017. Due to the perishable nature of our products, we deliver the majority of our products directly to our customers' locations in refrigerated trucks or trailers that we own or lease. We believe that we have one of the most extensive refrigerated DSD systems in the United States. We sell our products primarily on a local or regional basis through our local and regional sales forces, and in some instances, with the assistance of national brokers. Some national customer relationships are coordinated by our centralized corporate sales department or national brokers.
Our Reportable Segment
We have aligned our leadership team, operating strategy, and sales, logistics and supply chain initiatives into a single operating and reportable segment. Unless stated otherwise, any reference to income statement items in our financial statements refers to results from continuing operations.
Recent Developments
See “Part I — Item 1. Business — Developments Since January 1, 2017” for further information regarding recent developments that have impacted our financial condition and results of operations.
Results of Operations
Our key performance indicators are brand mix, achieving low cost and volume performance, which are reflected in gross profit, operating income and net sales, respectively. We evaluate our financial performance based on sales and operating profit or loss before gains and losses on the sale of businesses, facility closing and reorganization costs, asset impairment charges, litigation settlements and other nonrecurring gains and losses. The following table presents certain information concerning our financial results, including information presented as a percentage of net sales:
Year Ended December 31 | ||||||||||||||||||||
2017 | 2016 | 2015 | ||||||||||||||||||
Dollars | Percent | Dollars | Percent | Dollars | Percent | |||||||||||||||
(Dollars in millions) | ||||||||||||||||||||
Net sales | $ | 7,795.0 | 100.0 | % | $ | 7,710.2 | 100.0 | % | $ | 8,121.7 | 100.0 | % | ||||||||
Cost of sales | 5,977.3 | 76.7 | 5,722.7 | 74.2 | 6,147.3 | 75.7 | ||||||||||||||
Gross profit(1) | 1,817.7 | 23.3 | 1,987.5 | 25.8 | 1,974.4 | 24.3 | ||||||||||||||
Operating costs and expenses: | ||||||||||||||||||||
Selling and distribution | 1,346.9 | 17.3 | 1,348.3 | 17.5 | 1,379.3 | 17.0 | ||||||||||||||
General and administrative | 311.2 | 4.0 | 346.0 | 4.5 | 350.3 | 4.3 | ||||||||||||||
Amortization of intangibles | 20.7 | 0.3 | 20.8 | 0.3 | 21.7 | 0.3 | ||||||||||||||
Facility closing and reorganization costs, net | 24.9 | 0.3 | 8.7 | 0.1 | 19.8 | 0.2 | ||||||||||||||
Impairment of intangible and long-lived assets | 30.7 | 0.4 | — | — | 109.9 | 1.3 | ||||||||||||||
Total operating costs and expenses | 1,734.4 | 22.3 | 1,723.8 | 22.4 | 1,881.0 | 23.1 | ||||||||||||||
Operating income | $ | 83.3 | 1.0 | % | $ | 263.7 | 3.4 | % | $ | 93.4 | 1.2 | % | ||||||||
(1) | As disclosed in Note 1 to our Consolidated Financial Statements, we include certain shipping and handling costs within selling and distribution expense. As a result, our gross profit may not be comparable to other entities that present all shipping and handling costs as a component of cost of sales. |
23
Year Ended December 31, 2017 Compared to Year Ended December 31, 2016
Net Sales — The change in net sales was due to the following:
Year Ended December 31, 2017 vs. 2016 | |||
(In millions) | |||
Volume | $ | (357.9 | ) |
Pricing and product mix changes | 360.4 | ||
Acquisitions | 82.3 | ||
Total increase | $ | 84.8 | |
Net sales increased $84.8 million, or 1.1%, during the year ended December 31, 2017 as compared to the year ended December 31, 2016, primarily due to increased pricing, as a result of increases in dairy commodity costs from year-ago levels. On average, during the year ended December 31, 2017, the Class I price was 11.1% above prior-year levels. Additionally, volumes associated with the Friendly's and Uncle Matt's acquisitions contributed $178.3 million to net sales in 2017 as compared to $96.0 million associated with the Friendly's acquisition in 2016. The Friendly's acquisition closed on June 20, 2016 and net sales during the year ended December 31, 2016 reflect 195 days of Friendly's operations. Net sales increases were partially offset by fluid milk volume declines from year-ago levels, driven predominantly by overall category softness and private label fluid milk volume losses during 2017 due to competitive pressures, as well as reduced branded fluid milk volumes due to increased retailer investment in private label products.
We generally increase or decrease the prices of our private label fluid dairy products on a monthly basis in correlation with fluctuations in the costs of raw materials, packaging supplies and delivery costs. We manage the pricing of our branded fluid milk products on a longer-term basis, balancing consumer demand with net price realization, but in some cases, we are subject to the terms of our sales agreements with respect to the means and/or timing of price increases, which can negatively impact our profitability. The following table sets forth the average monthly Class I “mover” and its components, as well as the average monthly Class II minimum prices for raw skim milk and butterfat for 2017 compared to 2016:
Year Ended December 31* | ||||||||||
2017 | 2016 | % Change | ||||||||
Class I mover(1) | $ | 16.45 | $ | 14.80 | 11.1 | % | ||||
Class I raw skim milk mover(1)(2) | 7.60 | 6.75 | 12.6 | % | ||||||
Class I butterfat mover(2)(3) | 2.61 | 2.37 | 10.1 | % | ||||||
Class II raw skim milk minimum(1)(4) | 7.12 | 6.47 | 10.0 | % | ||||||
Class II butterfat minimum(3)(4) | 2.62 | 2.32 | 12.9 | % | ||||||
* | The prices noted in this table are not the prices that we actually pay. The federal order minimum prices applicable at any given location for Class I raw skim milk or Class I butterfat are based on the Class I mover prices plus producer premiums and a location differential. Class II prices noted in the table are federal minimum prices, applicable at all locations. Our actual cost also includes procurement costs and other related charges that vary by location and supplier. Please see “Part I — Item 1. Business — Government Regulation — Milk Industry Regulation” and “— Known Trends and Uncertainties — Conventional Raw Milk and Other Inputs” below for a more complete description of raw milk pricing. |
(1) | Prices are per hundredweight. |
(2) | We process Class I raw skim milk and butterfat into fluid milk products. |
(3) | Prices are per pound. |
(4) | We process Class II raw skim milk and butterfat into products such as cottage cheese, creams and creamers, ice cream and sour cream. |
Cost of Sales — All expenses incurred to bring a product to completion are included in cost of sales, such as raw material, ingredient and packaging costs; labor costs; and plant and equipment costs. Cost of sales increased 4.4% during the year ended December 31, 2017 in comparison to the year ended December 31, 2016, primarily due to increased dairy commodity costs. The Class I price was 11.1% above prior-year levels. This increase was partly offset by the volume declines described above.
24
Gross Profit — Gross profit percentage decreased to 23.3% in 2017 compared to 25.8% in 2016. This decrease was primarily due to higher input costs and the overall volume declines discussed above, in addition to a higher mix of private label products in 2017, which carry lower margins than our branded products.
Operating Costs and Expenses — Our operating expenses increased $10.6 million, or 0.6%, during the year ended December 31, 2017 in comparison to the year ended December 31, 2016. Significant changes to operating costs and expenses in the year ended December 31, 2017 as compared to the year ended December 31, 2016 include the following:
• | Selling and distribution costs decreased by $1.4 million, primarily due to decreases in advertising costs of $20.6 million and incentive compensation of $8.2 million, partially offset by increases in freight costs of $23.5 million and insurance costs of $4.4 million. |
• | General and administrative costs decreased by $34.9 million during the year ended December 31, 2017 in comparison to the prior period. General and administrative costs of $346.0 million in 2016 included severance charges of $11.6 million related to the announcement of our CEO succession plan and acquisition-related expenses of $4.6 million related to the June 2016 acquisition of Friendly's. General and administrative costs of $311.2 million in 2017 were impacted by significantly lower incentive compensation in comparison to the prior year. These decreases were partially offset by litigation settlements reached in the first quarter of 2017 and the related legal expenses, totaling $17.0 million. |
• | Facility closing and reorganization costs increased by $16.2 million primarily due to costs associated with the implementation of our organizational structure change and asset write-downs and other charges associated with facilities closures. See Note 16 to our Consolidated Financial Statements. |
• | We recorded impairment charges to our long-lived assets of $30.7 million during the year ended December 31, 2017. There were no impairment charges during the year ended December 31, 2016. See Note 16 to our Consolidated Financial Statements. |
Other (Income) Expense — Other expense increased by $1.0 million during the year ended December 31, 2017 as compared to the year ended December 31, 2016. This increase was primarily due to lower foreign currency exchange gains in 2017 as compared to 2016, partially offset by lower interest expense in 2017 as compared to 2016, primarily due to the refinancing of our senior secured revolving credit facility and receivables securitization facility in January 2017.
Income Taxes — Income tax benefit was recorded at an effective rate of (123.2)% for 2017 compared to a 40.5% effective tax rate in 2016. Generally, our effective tax rate varies primarily based on our profitability level and the relative earnings of our business units. In 2017, our effective tax rate was significantly impacted by the enactment of the Tax Act on December 22, 2017. The Tax Act makes comprehensive changes to the U.S. tax code affecting tax years 2017 and thereafter. Among other things, the Tax Act reduces the U.S. federal corporate income tax rate from 35% to 21%, imposes a mandatory one-time transition tax on unrepatriated foreign earnings, enhances the acceleration of depreciation deductions on qualified property, changes the U.S. taxation of foreign earnings and eliminates certain business deductions. The reduction in the U.S. federal corporate income tax rate triggered an immediate revaluation of our deferred tax assets and liabilities, which resulted in a $45.8 million one-time income tax benefit. This benefit was partly offset by the recognition of a $2.1 million income tax expense associated with the mandatory deemed repatriation of our foreign earnings. See Note 8 to our Consolidated Financial Statements for further information regarding the tax impacts of the Tax Act.
In addition to the Tax Act impacts, our effective tax rate was impacted by the adoption of Accounting Standards Update ASU 2016-09, which requires excess tax benefits and tax deficiencies related to share-based payments to be recorded in the provision for income taxes, and an increase in our valuation allowance related to state net operating losses. Excluding the one-time net tax benefit of $43.7 million related to the Tax Act, the $3.0 million tax expense related to excess tax deficiencies, and the $5.9 million tax expense related to our valuation allowance, our effective tax rate in 2017 would have been 41.0%. In 2016, our effective tax rate was also impacted by the establishment of an uncertain tax position. Excluding the $3.0 million of tax expense related to this uncertain tax position, our effective tax rate in 2016 would have been 39.0%.
25
Year Ended December 31, 2016 Compared to Year Ended December 31, 2015
Net Sales — The change in net sales was due to the following:
Year Ended December 31, 2016 vs. 2015 | |||
(In millions) | |||
Volume | $ | (216.0 | ) |
Pricing and product mix changes | (291.4 | ) | |
Acquisitions | 96.0 | ||
Total decrease | $ | (411.4 | ) |
Net sales decreased $411.4 million, or 5.1%, during the year ended December 31, 2016 as compared to the year ended December 31, 2015, primarily due to decreased pricing, as a result of declines in dairy commodity costs from year-ago levels. On average, during the year ended December 31, 2016, the Class I price was 9.4% below prior-year levels.
Net sales were further impacted by a 2.1% total sales volume decline across all products from year-ago levels. Volume declines across our fluid milk business, which accounted for 77% of our total sales volume in 2016, were primarily the result of large format private label volume we chose to exit, as this volume was not consistent with our more disciplined pricing architecture. Our total branded white milk volumes decreased 1.8% year-over-year, and we experienced a 2.4% increase in our flavored milk volumes. Net sales declines were partially offset by a $96.0 million increase in net sales attributable to volumes associated with the Friendly's acquisition.
The following table sets forth the average monthly Class I “mover” and its components, as well as the average monthly Class II minimum prices for raw skim milk and butterfat for 2016 compared to 2015:
Year Ended December 31* | ||||||||||
2016 | 2015 | % Change | ||||||||
Class I mover(1) | $ | 14.80 | $ | 16.34 | (9.4 | )% | ||||
Class I raw skim milk mover(1)(2) | 6.75 | 8.91 | (24.2 | )% | ||||||
Class I butterfat mover(2)(3) | 2.37 | 2.21 | 7.2 | % | ||||||
Class II raw skim milk minimum(1)(4) | 6.47 | 7.69 | (15.9 | )% | ||||||
Class II butterfat minimum(3)(4) | 2.32 | 2.30 | 0.9 | % | ||||||
* | The prices noted in this table are not the prices that we actually pay. The federal order minimum prices applicable at any given location for Class I raw skim milk or Class I butterfat are based on the Class I mover prices plus producer premiums and a location differential. Class II prices noted in the table are federal minimum prices, applicable at all locations. Our actual cost also includes procurement costs and other related charges that vary by location and supplier. Please see “Part I — Item 1. Business — Government Regulation — Milk Industry Regulation” and “— Known Trends and Uncertainties — Conventional Raw Milk and Other Inputs” below for a more complete description of raw milk pricing. |
(1) | Prices are per hundredweight. |
(2) | We process Class I raw skim milk and butterfat into fluid milk products. |
(3) | Prices are per pound. |
(4) | We process Class II raw skim milk and butterfat into products such as cottage cheese, creams and creamers, ice cream and sour cream. |
Cost of Sales — Cost of sales decreased 6.9% during the year ended December 31, 2016 in comparison to the year ended December 31, 2015, primarily due to decreased dairy commodity costs. The Class I price was 9.4% below prior-year levels. In addition, this decrease was due to our ongoing cost and efficiency initiatives and lower sales volumes.
Gross Profit — Gross profit percentage increased to 25.8% in 2016 compared to 24.3% in 2015. This increase was primarily due to the execution of our branded pricing strategy and the associated increased margin pool for our branded products, as well as declining input costs and the impact of our ongoing productivity initiatives. Increases to gross profit were partially offset by overall volume declines discussed above.
26
Operating Costs and Expenses — Our operating expenses decreased $157.2 million, or 8.4%, during the year ended December 31, 2016 in comparison to the year ended December 31, 2015. Significant changes to operating costs and expenses in the year ended December 31, 2016 as compared to the year ended December 31, 2015 include the following:
• | Selling and distribution costs decreased by $31.0 million primarily due to lower fuel costs and net logistics cost reductions during the year ended December 31, 2016 in comparison to the year ended December 31, 2015, partially offset by increased advertising costs. |
• | General and administrative costs decreased by $4.3 million primarily due to lower incentive-based compensation paid in 2016 as compared to 2015, partially offset by a separation charge of $10.1 million recorded during 2016 in connection with the announcement of our CEO succession plan. Additionally, in 2016 we recorded $4.6 million of acquisition costs paid in conjunction with the Friendly's acquisition. See Note 2 to our Consolidated Financial Statements. |
• | Facility closing and reorganization costs decreased by $11.1 million. See Note 16 to our Consolidated Financial Statements. |
• | We recorded no impairment charges to our intangible assets during the year ended December 31, 2016, compared to $109.9 million of impairment charges during the year ended December 31, 2015. See Note 6 to our Consolidated Financial Statements. |
Other (Income) Expense — Other expense decreased by $45.7 million during the year ended December 31, 2016 as compared to the year ended December 31, 2015. This decrease in expense was primarily due to the loss on early retirement of long-term debt of $43.6 million recorded on the early retirement of our 2016 senior notes and extinguishment of our prior credit facility, which occurred during the first quarter of 2015. Net expense also decreased due to income from royalties of $3.2 million in 2016 compared to $1.7 million in 2015.
Income Taxes — Income tax expense was recorded at an effective rate of 40.5% for 2016 compared to a 39.3% effective tax benefit rate in 2015. Generally, our effective tax rate varies primarily based on our profitability level and the relative earnings of our business units. In 2016, our effective tax rate was also impacted by the establishment of an uncertain tax position. Excluding the $3.0 million of tax expense related to this uncertain tax position, our effective tax rate would have been 39.0%.
Liquidity and Capital Resources
Overview
We believe that our cash on hand coupled with future cash flows from operations and other available sources of liquidity, including our $450 million senior secured revolving credit facility and our $450 million receivables securitization facility, together will provide sufficient liquidity to allow us to meet our cash requirements for at least the next twelve months. Our anticipated uses of cash in 2018 include costs to execute our enterprise-wide cost productivity plan and other strategic initiatives; capital expenditures; working capital; financial obligations, including tax payments; dividend payments; additional investments in unconsolidated affiliates; and other costs that may be necessary to invest to grow our business. We are also authorized to repurchase shares of our common stock pursuant to a stock repurchase program authorized by our Board of Directors. Additionally, on an ongoing basis, we evaluate and consider strategic acquisitions, divestitures, joint ventures, or other transactions to create shareholder value and enhance financial performance. However, we may, from time to time, raise additional funds through borrowings or public or private sales of debt or equity securities. The amount, nature and timing of any borrowings or sales of debt or equity securities will depend on our operating performance and other circumstances; our then-current commitments and obligations; the amount, nature and timing of our capital requirements; any limitations imposed by our current credit arrangements; and overall market conditions.
As of December 31, 2017, we had total cash on hand of $16.5 million, of which $11.8 million was attributable to our foreign operations. Historically, the cash held by our foreign subsidiary was reinvested indefinitely and was generally subject to U.S. income tax only upon repatriation to the U.S. However, the Tax Act requires us to pay a one-time transition tax on cumulative undistributed foreign earnings for which we have not previously provided U.S. taxes. We have analyzed our foreign working capital and cash requirements and the potential tax liabilities that would be attributable to a repatriation and currently expect that we will repatriate approximately $10 million of cash that was previously deemed to be permanently reinvested.
At December 31, 2017, we had $918.9 million of long-term debt obligations, excluding unamortized discounts and debt issuance costs of $5.7 million. As of December 31, 2017, we had $575.1 million ($576.6 million as of February 21, 2018) of combined available future borrowing capacity under our senior secured revolving credit facility and receivables securitization facility, subject to compliance with the covenants in our credit agreements. Based on our current expectations, we believe our liquidity and capital resources will be sufficient to operate our business.
27
Strategic Activities Impacting Liquidity
Amendment to Senior Secured Revolving Credit Facility — On January 4, 2017, we amended our credit agreement to, among other things: (i) extend the maturity date of the senior secured revolving credit facility to January 4, 2022; (ii) modify the leverage ratio covenant to add a requirement that we comply with a maximum total net leverage ratio (which, for purposes of calculating indebtedness, excludes borrowings under our receivables securitization facility) not to exceed 4.25 to 1.00 and to eliminate the maximum senior secured net leverage ratio requirement; (iii) modify the definition of “Consolidated EBITDA” to permit certain pro forma cost savings add-backs in connection with permitted acquisitions and dispositions; (iv) modify the definition of “Applicable Rate” to reduce the interest rate margins such that loans outstanding under the revolving credit facility will bear interest, at our option, at either (x) the LIBO Rate (as defined in the Credit Agreement) plus a margin of between 1.75% and 2.50% (initially 2.00%) based on our total net leverage ratio, or (y) the Alternate Base Rate (as defined in the Credit Agreement) plus a margin of between 0.75% and 1.50% (initially 1.00%) based on our total net leverage ratio; (v) modify certain negative covenants to provide additional flexibility for the incurrence of debt, the payment of dividends and the making of certain permitted acquisitions and other investments; (vi) eliminate and release all real property as collateral for loans under the revolving credit facility; and (vii) provide the Company the ability to request that increases in the aggregate commitments under the revolving credit facility be made available as either revolving loans or term loans.
Amendment to Receivables Securitization Facility — On January 4, 2017, we amended the purchase agreement governing our receivables securitization facility to, among other things: (i) extend the liquidity termination date to January 4, 2020; (ii) reduce the maximum size of the receivables securitization facility to $450 million; (iii) replace the senior secured net leverage ratio with a total net leverage ratio to be consistent with the amended leverage ratio covenant under the Credit Agreement described above; and (iv) modify certain pricing terms such that advances outstanding under the receivables securitization facility will bear interest between 0.90% and 1.05%, and the Company will pay an unused fee between 0.40% and 0.55% on undrawn amounts, in each case based on the Company's total net leverage ratio.
Cash Dividends — In accordance with our cash dividend policy, holders of our common stock will receive dividends when and as declared by our Board of Directors. Beginning in 2015, all awards of restricted stock units, performance stock units and phantom shares provide for cash dividend equivalent units, which vest in cash at the same time as the underlying award. Quarterly dividends of $0.09 per share were paid in March, June, September and December of 2017 and 2016, totaling approximately $32.7 million and $32.8 million for each of the years ended December 31, 2017 and 2016, respectively. We expect to pay quarterly dividends of $0.09 per share ($0.36 per share annually) in 2018. Our cash dividend policy is subject to modification, suspension or cancellation in any manner and at any time. Dividends are presented as a reduction to retained earnings in our Consolidated Statement of Stockholders' Equity unless we have an accumulated deficit as of the end of the period, in which case they are reflected as a reduction to additional paid-in capital. See Note 11 to our Consolidated Financial Statements.
Stock Repurchase Program — Since 1998, our Board of Directors has from time to time authorized the repurchase of our common stock up to an aggregate of $2.38 billion, excluding fees and commissions. We made no share repurchases during the year ended December 31, 2017, and we repurchased 1,371,185 shares for $25.0 million during the year ended December 31, 2016. As of December 31, 2017, $197.1 million remained available for repurchases under this program (excluding fees and commissions). Our management is authorized to purchase shares from time to time through open market transactions at prevailing prices or in privately-negotiated transactions, subject to market conditions and other factors. Shares, when repurchased, are retired.
28
Historical Cash Flow
The following table summarizes our cash flows from operating, investing and financing activities for the year ended December 31, 2017 compared to the year ended December 31, 2016:
Year Ended December 31 | |||||||||||
2017 | 2016 | Change | |||||||||
(In thousands) | |||||||||||
Net cash flows from continuing operations: | |||||||||||
Operating activities | $ | 144,799 | $ | 257,413 | $ | (112,614 | ) | ||||
Investing activities | (134,986 | ) | (288,140 | ) | 153,154 | ||||||
Financing activities | (11,281 | ) | (9,934 | ) | (1,347 | ) | |||||
Effect of exchange rate changes on cash and cash equivalents | — | (2,093 | ) | 2,093 | |||||||
Net increase (decrease) in cash and cash equivalents | $ | (1,468 | ) | $ | (42,754 | ) | $ | 41,286 | |||
Operating Activities
Net cash provided by operating activities decreased by $112.6 million in the year ended December 31, 2017 compared to the year ended December 31, 2016. The decrease was primarily attributable to lower operating income and a discretionary pension contribution of $38.5 million to our company-sponsored pension plans in 2017.
Investing Activities
Net cash used in investing activities decreased by $153.2 million in the year ended December 31, 2017 compared to the year ended December 31, 2016. The decrease was primarily attributable to the purchase price, net of cash acquired, of $158.2 million paid for the Friendly's acquisition, which closed in the second quarter of 2016, as compared to the purchase price, net of cash acquired, of $21.6 million paid for the Uncle Matt's acquisition, which closed in the second quarter of 2017. Additionally, capital expenditures decreased by $37.9 million in 2017 compared to 2016. These decreases were partially offset by other investments of $11.0 million and $10.4 million of lower proceeds from the sale of fixed assets in 2017 as compared to 2016.
Financing Activities
Net cash used in financing activities increased by $1.3 million in the year ended December 31, 2017 compared to the year ended December 31, 2016. The increase was primarily attributable to the repayment of the $142 million senior notes in 2017, partially offset by net debt proceeds from borrowings of $167.1 million in 2017 as compared to $49.1 million in 2016. Additionally, there were no share repurchases made in 2017 in comparison to $25.0 million of share repurchases made in 2016.
The following table summarizes our cash flows from operating, investing and financing activities for the year ended December 31, 2016 compared to the year ended December 31, 2015:
Year Ended December 31 | |||||||||||
2016 | 2015 | Change | |||||||||
(In thousands) | |||||||||||
Net cash flows from continuing operations: | |||||||||||
Operating activities | $ | 257,413 | $ | 408,153 | $ | (150,740 | ) | ||||
Investing activities | (288,140 | ) | (146,247 | ) | (141,893 | ) | |||||
Financing activities | (9,934 | ) | (215,896 | ) | 205,962 | ||||||
Effect of exchange rate changes on cash and cash equivalents | (2,093 | ) | (1,638 | ) | (455 | ) | |||||
Net increase (decrease) in cash and cash equivalents | $ | (42,754 | ) | $ | 44,372 | $ | (87,126 | ) | |||
Operating Activities
Net cash provided by operating activities was $257.4 million for the year ended December 31, 2016 compared to net cash provided by operating activities of $408.2 million for the year ended December 31, 2015. Operating cash flows in 2015 benefited from a reduced working capital investment as collections of receivables in early 2015 were reflective of the higher Class I raw milk prices exiting 2014. Conversely, the value of receivables collected in 2016 was lower due to decreased Class I raw milk
29
prices exiting 2015. Further contributing to the decrease in operating cash flows in 2016 compared to 2015 was a higher incentive-based compensation payout in the first quarter of 2016 compared to 2015. Additionally, the decrease was attributable to the receipt of our 2014 federal income tax refund of $56 million during 2015.
Investing Activities
Net cash used in investing activities increased by $141.9 million in the year ended December 31, 2016 compared to the year ended December 31, 2015. This increase is primarily attributable to the $158.2 million purchase price for the Friendly's acquisition, which closed in the second quarter of 2016.
Financing Activities
Net cash used in financing activities was $9.9 million for the year ended December 31, 2016 compared to net cash used in financing activities of $215.9 million for the year ended December 31, 2015. This change was driven by net debt proceeds under our credit facilities of $49.1 million in 2016, as compared to net repayments of debt under our credit facilities of $305.3 million in 2015. Additionally, in 2015 we paid $16.8 million of financing costs in connection with our debt activities. Further contributing to the decrease in net cash used in financing activities was a decrease in share repurchases under our stock repurchase program to $25.0 million during 2016 from $53.0 million in the prior year period. Offsetting these uses of cash were net proceeds from the issuance of debt of $186.5 million in 2015, which reflects proceeds of $700.0 million from the issuance of the 2023 Notes, net of repayments on the early retirement of long-term debt of $513.5 million. Additionally, cash used for dividend payments increased to $32.8 million in 2016 in comparison to $26.2 million in 2015.
Current Debt Obligations
Our debt obligations consist of outstanding borrowings and letters of credit issued under our senior secured credit facility and receivables securitization facility and our Dean Foods Company Senior Notes Due 2023, each of which are described more fully below.
Senior Secured Revolving Credit Facility — We have a credit agreement (as amended, the "Credit Agreement") pursuant to which the lenders have provided us with a senior secured revolving credit facility in the amount of up to $450 million (the "Credit Facility") with a maturity date of January 4, 2022. Under the Credit Agreement, we have the right to request an increase of the aggregate commitments under the Credit Facility by up to $200 million, which we may request to be made available as either term loans or revolving loans, without the consent of any lenders not participating in such increase, subject to specified conditions. The Credit Facility is available for the issuance of up to $75 million of letters of credit and up to $100 million of swing line loans.
Loans outstanding under the Credit Facility bear interest, at our option, at either: (i) the LIBO Rate (as defined in the Credit Agreement) plus a margin of between 1.75% and 2.50% (2.00% as of February 21, 2018) based on our total net leverage ratio (as defined in the Credit Agreement); or (ii) the Alternate Base Rate (as defined in the Credit Agreement) plus a margin of between 0.75% and 1.50% (1.00% as of February 21, 2018) based on our total net leverage ratio.
We may make optional prepayments of the loans, in whole or in part, without premium or penalty (other than applicable breakage costs). Subject to certain exceptions and conditions described in the Credit Agreement, we will be obligated to prepay the Credit Facility, but without a corresponding commitment reduction, with the net cash proceeds of certain asset sales and with casualty insurance proceeds. The Credit Facility is guaranteed by our existing and future domestic material restricted subsidiaries (as defined in the Credit Agreement), which are substantially all of our wholly-owned U.S. subsidiaries other than the receivables securitization facility subsidiaries (the “Guarantors”).
The Credit Facility is secured by a first priority perfected security interest in substantially all of our assets and the assets of the Guarantors, whether consisting of personal, tangible or intangible property, including a pledge of, and a perfected security interest in: (i) all of the shares of capital stock of the Guarantors; and (ii) 65% of the shares of capital stock of our and the Guarantors' first-tier foreign subsidiaries that are material restricted subsidiaries, in each case subject to certain exceptions as set forth in the Credit Agreement. The collateral does not include, among other things: (a) any of our real property; (b) the capital stock and any assets of any unrestricted subsidiary; (c) any capital stock of any direct or indirect subsidiary of Dean Holding Company ("Legacy Dean"), a wholly owned subsidiary of the Company, which owns any real property; or (d) receivables sold pursuant to the receivables securitization facility.
The Credit Agreement contains customary representations, warranties and covenants, including, but not limited to specified restrictions on indebtedness, liens, guarantee obligations, mergers, acquisitions, consolidations, liquidations and dissolutions, sales of assets, leases, payment of dividends and other restricted payments during a default or non-compliance with the financial covenants, investments, loans and advances, transactions with affiliates and sale and leaseback transactions. The Credit Agreement also contains customary events of default and related cure provisions. We are required to comply with: (i) a
30
maximum total net leverage ratio of 4.25x (which, for purposes of calculating indebtedness, excludes borrowings under our receivables securitization facility); and (ii) a minimum consolidated interest coverage ratio of 2.25x. In addition, the Credit Agreement imposes certain restrictions on our ability to pay dividends and make other restricted payments if our total net leverage ratio (including borrowings under our receivables securitization facility) is in excess of 3.50x.
At February 21, 2018, we had no outstanding borrowings under the Credit Facility. There were no letters of credit issued under the Credit Facility as of February 21, 2018. Our average daily balance under the Credit Facility during the year ended December 31, 2017 was $2.2 million.
Dean Foods Receivables Securitization Facility — We have an amended and restated receivables purchase agreement (as amended), which provides us with a $450 million receivables securitization facility pursuant to which certain of our subsidiaries sell their accounts receivable to two wholly-owned entities intended to be bankruptcy-remote. The entities then transfer the receivables to third-party asset-backed commercial paper conduits sponsored by major financial institutions. The assets and liabilities of these two entities are fully reflected in our Consolidated Balance Sheets, and the securitization is treated as a borrowing for accounting purposes.
The receivables securitization facility has a liquidity termination date of January 4, 2020 and bears interest at a variable rate based upon commercial paper and one-month LIBO rates plus an applicable margin based on our net leverage ratio. The receivables purchase agreement contains covenants consistent with those contained in the Credit Agreement. Advances outstanding under the receivables securitization facility will bear interest between 0.90% and 1.05%, and the Company will pay an unused fee between 0.40% and 0.55% on undrawn amounts, in each case based on the Company's total net leverage ratio.
Based on the monthly borrowing base formula, we had the ability to borrow up to the full $450.0 million commitment amount under the receivables securitization facility as of December 31, 2017. The total amount of receivables sold to these entities as of December 31, 2017 was $638.3 million. During the year ended December 31, 2017, we borrowed $2.5 billion and repaid $2.4 billion under the facility with a remaining balance of $205.0 million as of December 31, 2017. In addition to letters of credit in the aggregate amount of $108.7 million that were issued but undrawn, the remaining available borrowing capacity was $136.3 million at December 31, 2017. Our average daily balance under this facility during the year ended December 31, 2017 was $81.6 million.
There were outstanding borrowings of $210.0 million under the receivables securitization facility as of February 21, 2018. In addition to letters of credit in the aggregate amount of $108.7 million that were issued but undrawn, the remaining available borrowing capacity was $126.6 million at February 21, 2018.
Covenant Compliance — As of December 31, 2017, we were in compliance with all covenants under our credit agreements. The following describes our financial covenants pursuant to our current credit agreements.
The Credit Agreement and the purchase agreement governing our receivables securitization facility require us to maintain a total net leverage ratio less than 4.25x as of the end of each fiscal quarter. In addition, the Credit Agreement imposes certain restrictions on our ability to pay dividends and make other restricted payments if our total net leverage ratio (including borrowings under our receivables securitization facility) exceeds 3.50x. As described in more detail in our Credit Agreement and the purchase agreement governing our receivables securitization facility, the total net leverage ratio is calculated as the ratio of consolidated funded indebtedness, less cash up to $50 million to the extent held by us and our restricted subsidiaries, to consolidated EBITDA for the period of four consecutive fiscal quarters ended on the measurement date. Consolidated funded indebtedness excludes borrowings under our receivables securitization facility and is calculated on a pro forma basis to give effect to permitted acquisitions, divestitures or refinancing of indebtedness.
Consolidated EBITDA is comprised of net income for us and our restricted subsidiaries plus interest expense, taxes, depreciation and amortization expense and other non-cash expenses, certain pro forma cost savings add-backs in connection with permitted acquisitions and dispositions, and certain other add-backs for non-recurring charges and other adjustments permitted in calculating covenant compliance under the Credit Agreement, and is calculated on a pro forma basis.
The Credit Agreement and the purchase agreement governing our receivables securitization facility require us to maintain an interest coverage ratio of at least 2.25x as of the end of each fiscal quarter. As described in more detail in the Credit Agreement and the purchase agreement governing our receivables securitization facility, our interest coverage ratio is calculated as the ratio of consolidated EBITDA to consolidated interest expense for the period of four consecutive fiscal quarters ended on the measurement date. Consolidated EBITDA is calculated as described above in the discussion of our leverage ratio. Consolidated interest expense is comprised of consolidated interest expense paid or payable in cash by us and our restricted subsidiaries, as calculated in accordance with generally accepted accounting principles, but excluding write-offs or amortization of deferred financing fees and amounts paid on early termination of swap agreements, calculated on a pro forma basis.
31
Dean Foods Company Senior Notes due 2023 — On February 25, 2015, we issued $700 million in aggregate principal amount of 6.50% senior notes due 2023 (the "2023 Notes") at an issue price of 100% of the principal amount of the 2023 Notes in a private placement for resale to “qualified institutional buyers” as defined in Rule 144A under the Securities Act of 1933, as amended (the "Securities Act"), and in offshore transactions pursuant to Regulation S under the Securities Act.
The 2023 Notes are our senior unsecured obligations. Accordingly, the 2023 Notes rank equally in right of payment with all of our existing and future senior obligations and are effectively subordinated in right of payment to all of our existing and future secured obligations, including obligations under our Credit Facility and receivables securitization facility, to the extent of the value of the collateral securing such obligations. The 2023 Notes are fully and unconditionally guaranteed on a senior unsecured basis, jointly and severally, by our subsidiaries that guarantee obligations under the Credit Facility.
The 2023 Notes will mature on March 15, 2023 and bear interest at an annual rate of 6.50%. Interest on the 2023 Notes is payable semi-annually in arrears in March and September of each year.
We may, at our option, redeem all or a portion of the 2023 Notes at any time on or after March 15, 2018 at the applicable redemption prices specified in the indenture governing the 2023 Notes (the "Indenture"), plus any accrued and unpaid interest to, but excluding, the applicable redemption date. We are also entitled to redeem up to 40% of the aggregate principal amount of the 2023 Notes before March 15, 2018 with the net cash proceeds that we receive from certain equity offerings at a redemption price equal to 106.5% of the principal amount of the 2023 Notes, plus accrued and unpaid interest, if any, to, but excluding, the applicable redemption date. In addition, prior to March 15, 2018, we may redeem all or a portion of the 2023 Notes, at a redemption price equal to 100% of the principal amount thereof, plus a “make-whole” premium and accrued and unpaid interest, if any, to, but excluding, the applicable redemption date.
If we undergo certain kinds of changes of control, holders of the 2023 Notes have the right to require us to repurchase all or any portion of such holder’s 2023 Notes at 101% of the principal amount of the notes being repurchased, plus any accrued and unpaid interest to, but excluding, the date of repurchase.
The Indenture contains covenants that, among other things, limit our ability to: (i) create certain liens; (ii) enter into sale and lease-back transactions; (iii) assume, incur or guarantee indebtedness for borrowed money that is secured by a lien on certain principal properties (or on any shares of capital stock of our subsidiaries that own such principal properties) without securing the 2023 Notes on a pari passu basis; and (iv) consolidate with or merge with or into, or sell, transfer, convey or lease all or substantially all of our properties and assets, taken as a whole, to another person.
The carrying value under the 2023 Notes at December 31, 2017 was $694.3 million, net of unamortized debt issuance costs of $5.7 million.
Subsidiary Senior Notes due 2017 — Legacy Dean had $142 million aggregate principal amount of senior notes, which matured on October 15, 2017. On October 16, 2017 we repaid in full the $142 million outstanding aggregate principal amount of the senior notes, plus remaining accrued and unpaid interest of $4.9 million, with borrowings from our receivables securitization facility.
32
Contractual Obligations and Other Long-Term Liabilities
In the normal course of business, we enter into contracts and commitments that obligate us to make payments in the future. The table below summarizes our obligations for indebtedness, purchase, lease and certain other contractual obligations at December 31, 2017.
Payments Due by Period | |||||||||||||||||||||||||||
Total | 2018 | 2019 | 2020 | 2021 | 2022 | Thereafter | |||||||||||||||||||||
(in millions) | |||||||||||||||||||||||||||
Receivables securitization facility(1) | $ | 205.0 | $ | — | $ | — | $ | 205.0 | $ | — | $ | — | $ | — | |||||||||||||
Credit Facility(1) | 11.2 | — | — | — | — | 11.2 | — | ||||||||||||||||||||
Dean Foods Company senior notes due 2023(2) | 700.0 | — | — | — | — | — | 700.0 | ||||||||||||||||||||
Purchase obligations(3) | 815.3 | 565.9 | 105.8 | 23.9 | 24.0 | 23.9 | 71.8 | ||||||||||||||||||||
Operating leases(4) | 444.1 | 104.3 | 90.3 | 70.5 | 52.8 | 39.1 | 87.1 | ||||||||||||||||||||
Capital leases(5) | 2.8 | 1.2 | 1.2 | 0.4 | — | — | — | ||||||||||||||||||||
Interest payments(6) | 273.2 | 54.7 | 54.7 | 47.8 | 47.7 | 45.5 | 22.8 | ||||||||||||||||||||
Benefit payments(7) | 381.7 | 20.5 | 20.9 | 21.5 | 22.2 | 22.8 | 273.8 | ||||||||||||||||||||
Total(8) | $ | 2,833.3 | $ | 746.6 | $ | 272.9 | $ | 369.1 | $ | 146.7 | $ | 142.5 | $ | 1,155.5 | |||||||||||||
(1) | Represents amounts outstanding under our receivables securitization facility and Credit Facility at December 31, 2017. |
(2) | Represents face amount. |
(3) | Primarily represents commitments to purchase minimum quantities of raw materials used in our production processes, including raw milk, diesel fuel, sugar and cocoa powder. We enter into these contracts from time to time to ensure a sufficient supply of raw ingredients. |
(4) | Represents future minimum lease payments under non-cancelable operating leases related to our distribution fleet, corporate offices and certain of our manufacturing and distribution facilities. See Note 18 to our Consolidated Financial Statements for more detail about our lease obligations. |
(5) | Represents future payments, including interest, under capital leases related to information technology equipment. See Note 18 to our Consolidated Financial Statements for more detail about our lease obligations. |
(6) | Includes fixed rate interest obligations and interest on variable rate debt based on the outstanding balances and interest rates in effect at December 31, 2017. Interest that may be due in the future on variable rate borrowings under the Credit Facility and receivables securitization facility will vary based on the interest rate in effect at the time and the borrowings outstanding at the time. |
(7) | Represents expected future benefit obligations of $349.8 million and $31.9 million related to our company-sponsored pension plans and postretirement healthcare plans, respectively. In addition to our company-sponsored plans, we participate in certain multiemployer defined benefit plans. The cost of these plans is equal to the annual required contributions determined in accordance with the provisions of negotiated collective bargaining arrangements. These costs were approximately $29.2 million, $30.1 million and $29.9 million during the years ended December 31, 2017, 2016 and 2015, respectively; however, the future cost of the multiemployer plans is dependent upon a number of factors, including the funded status of the plans, the ability of other participating companies to meet ongoing funding obligations, and the level of our ongoing participation in these plans. Because the amount of future contributions we would be contractually obligated to make pursuant to these plans cannot be reasonably estimated, such amounts have been excluded from the table above. See Note 14 to our Consolidated Financial Statements. |
(8) | The table above excludes our liability for uncertain tax positions of $15.1 million because the timing of any related cash payments cannot be reasonably estimated. |
33
Pension and Other Postretirement Benefit Obligations
We offer pension benefits through various defined benefit pension plans and also offer certain health care and life insurance benefits to eligible employees and their eligible dependents upon the retirement of such employees. Reported costs of providing non-contributory defined pension benefits and other postretirement benefits are dependent upon numerous factors, assumptions and estimates. For example, these costs are impacted by actual employee demographics (including age, compensation levels and employment periods), the level of contributions made to the plan and earnings on plan assets. Pension and postretirement costs also may be significantly affected by changes in key actuarial assumptions, including anticipated rates of return on plan assets and the discount rates used in determining the projected benefit obligation and annual periodic pension costs. In 2017 and 2016, we made contributions of $39.4 million and $5.5 million, respectively, to our defined benefit pension plans.
Our pension plan assets are primarily comprised of equity and fixed income investments. Changes made to the provisions of the plan may impact current and future pension costs. Fluctuations in actual equity market returns, as well as changes in general interest rates may result in increased or decreased pension costs in future periods. In accordance with Accounting Standards related to “Employers’ Accounting for Pensions,” changes in obligations associated with these factors may not be immediately recognized as pension costs on the income statement, but generally are recognized in future years over the remaining average service period of plan participants. As such, significant portions of pension costs recorded in any period may not reflect the actual level of cash benefits provided to plan participants. In 2017 and 2016, we recorded non-cash pension expense of $6.7 million and $6.8 million, respectively, substantially all of which was attributable to periodic expense.
Almost 90% of our defined benefit plan obligations are frozen as to future participation or increases in projected benefit obligation. Many of these obligations were acquired in prior strategic transactions. As an alternative to defined benefit plans, we offer defined contribution plans for eligible employees.
The weighted average discount rate reflects the rate at which our defined benefit plan obligations could be effectively settled. The rate, which is updated annually with the assistance of an independent actuary, uses a model that reflects a bond yield curve. The weighted average discount rate for our pension plan obligations was decreased from 4.29% at December 31, 2016 to 3.69% at December 31, 2017. We expect that our net periodic benefit cost in 2018 will be slightly lower than in 2017. We do not currently expect to make any contributions to the pension plans in 2018.
Substantially all of our qualified pension plans are consolidated into one master trust. Our investment objectives are to minimize the volatility of the value of our pension assets relative to our pension liabilities and to ensure assets are sufficient to pay plan benefits. In 2014, we adopted a broad pension de-risking strategy intended to align the characteristics of our assets relative to our liabilities. The strategy targets investments depending on the funded status of the obligation. We anticipate this strategy will continue in future years and will be dependent upon market conditions and plan characteristics.
At December 31, 2017, our master trust was invested as follows: investments in equity securities were at 30%; investments in fixed income were at 70%; and cash equivalents were less than 1%. We believe the allocation of our master trust investments as of December 31, 2017 is generally consistent with the targets set forth by our Investment Committee.
See Notes 14 and 15 to our Consolidated Financial Statements for additional information regarding retirement plans and other postretirement benefits.
Other Commitments and Contingencies
In 2001, in connection with our acquisition of Legacy Dean, we purchased Dairy Farmers of America’s (“DFA”) 33.8% interest in our operations. In connection with that transaction, we issued a contingent, subordinated promissory note to DFA in the original principal amount of $40 million. The promissory note has a 20-year term and bears interest based on the consumer price index. Interest will not be paid in cash but will be added to the principal amount of the note annually, up to a maximum principal amount of $96 million. We may prepay the note in whole or in part at any time, without penalty. The note will only become payable if we materially breach or terminate one of our related milk supply agreements with DFA without renewal or replacement. Otherwise, the note will expire in 2021, without any obligation to pay any portion of the principal or interest. Payments made under the note, if any, would be expensed as incurred. We have not terminated, and we have not materially breached, any of our milk supply agreements with DFA related to the promissory note. We have previously terminated unrelated supply agreements with respect to several plants that were supplied by DFA. In connection with our goals of cost control and supply chain efficiency, we continue to evaluate our sources of raw milk supply.
We also have the following commitments and contingent liabilities, in addition to contingent liabilities related to ordinary course litigation, investigations and audits:
• | certain indemnification obligations related to businesses that we have divested; |
34
• | certain lease obligations, which require us to guarantee the minimum value of the leased asset at the end of the lease; |
• | selected levels of property and casualty risks, primarily related to employee health care, workers’ compensation claims and other casualty losses; and |
• | certain litigation-related contingencies. |
See Note 18 to our Consolidated Financial Statements for more information about our commitments and contingent obligations.
Future Capital Requirements
During 2018, we intend to invest a total of approximately $135 million to $160 million in capital expenditures, primarily in support of our enterprise-wide cost productivity plan and other strategic initiatives and for our existing manufacturing facilities. For 2018, we expect cash interest to be approximately $57 million based upon current debt levels and projected forward interest rates under our Credit Facility and receivables securitization facility. Cash interest excludes amortization of deferred financing fees of approximately $3 million.
On an ongoing basis, we evaluate and consider acquisitions, divestitures, joint ventures, or other transactions to create shareholder value and enhance financial performance. We have also instituted a cash divided policy and may repurchase shares of our common stock.
At December 31, 2017, $136.3 million was available under the receivables securitization facility, with $438.8 million also available under the Credit Facility, subject to compliance with the covenants in our credit agreements. Availability under the receivables securitization facility is calculated using the current receivables balance for the seller entities, less adjustments for vendor concentration limits, reserve requirements and other adjustments as described in our amended and restated receivables purchase agreement, not to exceed the total commitment amount less current borrowings and outstanding letters of credit. Availability under the Credit Facility is calculated using the total commitment amount less current borrowings and outstanding letters of credit. At February 21, 2018, approximately $576.6 million, subject to compliance with the covenants in our credit agreements, was available to finance working capital and for other general corporate purposes under our credit facilities.
Known Trends and Uncertainties
Competitive Environment, Volume Performance and Enterprise-Wide Cost Productivity Plan
The fluid milk industry remains highly competitive, and we are currently navigating a number of challenging dynamics across our cost structure, volumes, customers, and product mix. In 2017, we navigated a rapidly-changing industry landscape and a dynamic retail environment. Within private label fluid milk, competition for volume increased significantly in 2017, and we are losing volume at higher levels than anticipated. As a result, we are experiencing increased levels of volume deleverage that have negatively impacted our operating income. In addition, retailers continue to aggressively price their private label products, which we believe negatively impacts our branded product sales, resulting in compressed margins.
During the year ended December 31, 2017, we experienced fluid milk volume declines from year-ago levels, driven predominantly by overall category softness and private label fluid milk volume losses during 2017 due to competitive pressures, as well as reduced branded fluid milk volumes due to increased retailer investment in private label products.
We expect marketplace volume and mix challenges to continue in 2018, including those associated with our largest customer. These challenges make the execution of our commercial initiatives and our recently launched enterprise-wide cost productivity plan a critical path to navigating our volume and competitive pressures.
We have historically targeted annual cost productivity savings mainly to offset cost inflation and volume deleverage and in 2018 we are challenging ourselves to generate additional savings. In addition, we have recently designed, and in some cases are implementing, an aggressive enterprise-wide cost productivity plan to significantly reset our cost structure with targeted cost savings incremental to our annual productivity savings. We currently have legacy processes and systems that are fragmented and decentralized in many areas, which has created a cost structure that is disproportionately sensitive to small percentage declines in volume. We have organized our enterprise-wide cost productivity plan into three targeted work streams: rescaling our supply chain, optimizing spend management and integrating our operating model.We believe this plan is necessary to support our business strategy and deliver more consistent earnings and cash flow over the long term. The plan will be phased over several years and will require significant one-time investments in 2018, including investments in people, infrastructure, technology and systems, which will negatively impact our profitability and cash flows in 2018.
Due to the phased implementation and timing of our initiatives and investments, we will not generate enough cost savings in 2018 to offset the planned investments, cost inflation and volume pressures in 2018. In addition, inflation, declining volumes
35
and competitive pricing pressures have negated, and may continue to negate, some of the impact of our cost saving efforts. We also must execute our plans within our projected time frames in order to meet our financial projections and to remain competitive in the marketplace. For further discussion of the risks relating to our cost productivity plan, see “Part I - Item 1A. Risk Factors - Business, Competitive and Strategic Risks - We may not realize anticipated benefits from our enterprise-wide cost productivity plan, and we may not complete this plan within our projected time frames, either of which could materially adversely impact our business, financial condition, results of operations and cash flows."
Conventional Raw Milk and Other Inputs
Conventional Raw Milk and Butterfat — The primary raw materials used in the products we manufacture, distribute and sell are conventional raw milk (which contains both raw skim milk and butterfat) and bulk cream. On a monthly basis, the federal government and certain state governments set minimum prices for raw milk. The regulated minimum prices differ based on how the raw milk is utilized. Raw milk processed into fluid milk is priced at the Class I price and raw milk processed into products such as cottage cheese, creams and creamers, ice cream and sour cream is priced at the Class II price. Generally, we pay the federal minimum prices for raw milk, plus certain producer premiums (or “over-order” premiums) and location differentials. We also incur other raw milk procurement costs in some locations (such as hauling and field personnel). A change in the federal minimum price does not necessarily mean an identical change in our total raw milk costs as over-order premiums may increase or decrease. This relationship is different in every region of the country and can sometimes differ within a region based on supplier arrangements. However, in general, the overall change in our raw milk costs can be linked to the change in federal minimum prices. Because our Class II products typically have a higher fat content than that contained in raw milk, we also purchase bulk cream for use in some of our Class II products. Bulk cream is typically purchased based on a multiple of the Grade AA butter price on the Chicago Mercantile Exchange.
Prices for conventional raw milk during the year ended December 31, 2017 were approximately 11% higher than year-ago levels. In the fourth quarter of 2017, Class I raw milk costs were approximately 1% lower than the third quarter of 2017, but were approximately 3% higher than the fourth quarter of 2016. We are currently projecting Class I raw milk cost deflation in the first quarter of 2018 of approximately 15% in comparison to the first quarter of 2017 and cost deflation of approximately 5% to 10% for the year ending December 31, 2018 versus the year ended December 31, 2017. Commodity price changes primarily impact our branded business as the changes in raw milk costs are essentially a pass-through cost on our private label products. Given the multitude of factors that influence the dairy commodity environment, we acknowledge the potential for future volatility.
Fuel, Freight and Resin Costs — We purchase diesel fuel to operate our extensive DSD system, and we incur fuel surcharge expense related to the products we deliver through third-party carriers. Although we may utilize forward purchase contracts and other instruments to mitigate the risks related to commodity price fluctuations, such strategies do not fully mitigate commodity price risk. Adverse movements in commodity prices over the terms of the contracts or instruments could decrease the economic benefits we derive from these strategies. Another significant raw material we use is resin, which is a fossil fuel-based product used to make plastic bottles. The prices of diesel and resin are subject to fluctuations based on changes in crude oil and natural gas prices. We expect to experience inflation in external freight and resin costs in 2018.
Tax Rate
Income tax benefit was recorded at an effective rate of (123.2)% for 2017 compared to a 40.5% effective tax rate in 2016. Generally, our effective tax rate varies primarily based on our profitability level and the relative earnings of our business units. In 2017, our effective tax rate was significantly impacted by the enactment of the Tax Act on December 22, 2017 which resulted in a net tax benefit of $43.7 million substantially due to the revaluation of our deferred tax assets and liabilities. Our effective tax rate was also impacted by the adoption of Accounting Standards Update ASU 2016-09 and an increase in our valuation allowance related to state net operating losses. Excluding the one-time net tax benefit of $43.7 million related to the Tax Act, the $3.0 million tax expense related to excess tax deficiencies, and the $5.9 million tax expense related to our valuation allowance, our effective tax rate in 2017 would have been 41.0%. In 2016, our effective tax rate was also impacted by the establishment of an uncertain tax position. Excluding the $3.0 million of tax expense related to this uncertain tax position, our effective tax rate would have been 39.0%.
We currently expect our 2018 annual effective tax rate to be 26% to 28%, largely due to the reduction in the U.S. federal corporate income tax rate from 35% to 21%. Our estimated annual effective tax rate for 2018 and beyond could vary based upon our profitability level and the relative earnings of our business units and is also subject to change as interpretations of the Tax Act are issued or applied.
36
Critical Accounting Policies and Use of Estimates
In certain circumstances, the preparation of our Consolidated Financial Statements in conformity with generally accepted accounting principles requires us to use our judgment to make certain estimates and assumptions. These estimates affect the reported amounts of assets and liabilities and disclosures of contingent assets and liabilities at the date of the Consolidated Financial Statements and the reported amounts of net sales and expenses during the reporting period. Our senior management has discussed the development and selection of these critical accounting policies, as well as our significant accounting policies (see Note 1 to our Consolidated Financial Statements), with the Audit Committee of our Board of Directors. The following accounting policies are the most critical to aid in fully understanding and evaluating our reported financial results, and the estimates they involve require our most difficult, subjective or complex judgments.
Estimate Description | Judgment and/or Uncertainty | Potential Impact if Results Differ |
Goodwill and Intangible Assets Our goodwill and intangible assets have resulted from acquisitions and primarily include trademarks with finite lives and indefinite lives and customer-related intangible assets. Goodwill and indefinite-lived trademarks are evaluated for impairment annually and on an interim basis when circumstances arise that indicate a possible impairment to ensure that the carrying value is recoverable. An indefinite-lived trademark is impaired if its book value exceeds its estimated fair value. Goodwill is evaluated for impairment if we determine that it is more likely than not that the book value of a reporting unit exceeds its estimated fair value. Finite-lived intangible assets are evaluated for impairment upon a significant change in the operating environment or whenever circumstances indicate that the carrying value may not be recoverable. If an evaluation of the undiscounted cash flows indicates impairment, the asset is written down to its estimated fair value, which is generally based on discounted future cash flows. Our goodwill and intangible assets totaled $328.0 million as of December 31, 2017. | Considerable management judgment is necessary to initially value intangible assets upon acquisition and to evaluate those assets and goodwill for impairment going forward. We determine fair value using widely acceptable valuation techniques including discounted cash flows, market multiples analyses and relief from royalty analyses. Assumptions used in our valuations, such as forecasted growth rates and our cost of capital, are consistent with our internal projections and operating plans. We believe that a trademark has an indefinite life if it has a history of strong sales and cash flow performance that we expect to continue for the foreseeable future. If these indefinite-lived trademark criteria are not met, the trademarks are amortized over their expected useful lives. Determining the expected life of a trademark requires considerable management judgment and is based on an evaluation of a number of factors including the competitive environment, trademark history and anticipated future trademark support. | We believe that the assumptions used in valuing our intangible assets and in our impairment analysis are reasonable, but variations in any of the assumptions may result in different calculations of fair values that could result in a material impairment charge. In 2016 and 2015, a qualitative assessment of goodwill was performed for our reporting unit. We assessed economic conditions and industry and market considerations, in addition to the overall financial performance of the reporting unit. Based on the results of our assessment, we determined that it was not necessary to perform a quantitative assessment. We performed a step one valuation of goodwill in 2017. Results of our valuation indicated the fair value of our reporting unit exceeded the carrying value by approximately $559 million or 36.1%. Results of the annual impairment testing of our indefinite-lived trademarks completed during the fourth quarter of 2017 indicated no impairment. During the first quarter of 2015, we approved the launch of DairyPure®, our national white milk brand. In connection with the approval of the launch of DairyPure®, we reclassified our previously identified indefinite lived trademarks to finite lived, resulting in a triggering event for impairment testing purposes. Based upon our analysis, we recorded a non-cash impairment charge of $109.9 million and related income tax benefit of $41.2 million in the first quarter of 2015. The remaining balance for these trademarks is currently being amortized on a straight-line basis over their remaining useful lives, which range from approximately 3 to 8 years. We can provide no assurance that we will not have additional impairment charges in future periods as a result of changes in our operating results or our assumptions. |
37
Estimate Description | Judgment and/or Uncertainty | Potential Impact if Results Differ |
Property, Plant and Equipment We perform impairment tests when circumstances indicate that the carrying value may not be recoverable. Indicators of impairment could include significant changes in business environment or planned closure of a facility. The results of our 2017 impairment analysis indicated an impairment of our property, plant, and equipment at three of our production facilities, totaling $27.8 million. The impairments were the result of declines in operating cash flows at these production facilities on both a historical and forecasted basis. In addition, we recorded a write-down of certain corporate assets in connection with our enterprise-wide cost productivity plan totaling $2.9 million. These charges were recorded during the year ended December 31, 2017. Additionally, within facility closing and reorganization costs, we recognized $5.6 million of impairment charges during the year ended December 31, 2017 related to the write-down of plant, property and equipment at facilities approved for closure. Our property, plant and equipment, net of accumulated depreciation, totaled $1.1 billion as of December 31, 2017. | Considerable management judgment is necessary to evaluate the impact of operating changes and to estimate future cash flows for purposes of determining whether an asset group needs to be tested for recoverability. The testing of an asset group for recoverability involves assumptions regarding the future cash flows of the asset group (which often includes consideration of a probability weighting of estimated future cash flows), the growth rate of those cash flows, and the remaining useful life over which the asset group is expected to generate cash flows. In the event we determine an asset group is not recoverable, the measurement of an estimated impairment loss involves a number of management judgments, including the selection of an appropriate discount rate, and estimates regarding the cash flows that would ultimately be realized upon liquidation of the asset group. | If actual results are not consistent with our estimates and assumptions used to calculate estimated future cash flows or the proceeds expected to be realized upon liquidation, we may be exposed to impairment losses that could be material. Additionally, we can provide no assurance that we will not have additional impairment charges in future periods as a result of changes in our operating results or our assumptions. |
Insurance Accruals We retain selected levels of employee health care, property and casualty risks, primarily related to employee health care, workers’ compensation claims and other casualty losses. Many of these potential losses are covered under conventional insurance programs with third-party insurers with high deductibles. In other areas, we are self-insured. At December 31, 2017, we recorded accrued liabilities related to these retained risks of $152.6 million, including both current and long-term liabilities. | Accrued liabilities related to these retained risks are calculated based upon loss development factors, which contemplate a number of variables including claims history and expected trends. These loss development factors are developed in consultation with third-party actuaries. | If actual results differ from our assumptions, we could be exposed to material gains or losses. A 10% change in our insurance liabilities could affect net earnings by approximately $9.5 million. |
38
Estimate Description | Judgment and/or Uncertainty | Potential Impact if Results Differ |
Income Taxes A liability for uncertain tax positions is recorded to the extent a tax position taken or expected to be taken in a tax return does not meet certain recognition or measurement criteria. A valuation allowance is recorded against a deferred tax asset if it is not more likely than not that the asset will be realized. At December 31, 2017, our liability for uncertain tax positions, including accrued interest, was $15.1 million, and our valuation allowance was $21.8 million. | Considerable management judgment is necessary to assess the inherent uncertainties related to the interpretations of complex tax laws, regulations and taxing authority rulings, as well as to the expiration of statutes of limitations in the jurisdictions in which we operate. Additionally, several factors are considered in evaluating the realizability of our deferred tax assets, including the remaining years available for carry forward, the tax laws for the applicable jurisdictions, the future profitability of the specific business units, and tax planning strategies. | Our judgments and estimates concerning uncertain tax positions may change as a result of evaluation of new information, such as the outcome of tax audits or changes to or further interpretations of tax laws and regulations. Our judgments and estimates concerning realizability of deferred tax assets could change if any of the evaluation factors change. If such changes take place, there is a risk that our effective tax rate could increase or decrease in any period, impacting our net earnings. |
Employee Benefit Plans We provide a range of benefits including pension and postretirement benefits to our eligible employees and retirees. | We record annual amounts relating to these plans, which include various actuarial assumptions, such as discount rates, assumed investment rates of return, compensation increases, employee turnover rates and health care cost trend rates. We review our actuarial assumptions on an annual basis and make modifications to the assumptions based on current rates and trends when it is deemed appropriate. The effect of the modifications is generally recorded and amortized over future periods. | Different assumptions could result in the recognition of different amounts of expense over different periods of time. A 0.25% reduction in the assumed rate of return on plan assets or a 0.25% reduction in the discount rate would result in an increase in our annual pension expense of $0.8 million and $0.5 million, respectively. A 1% increase in assumed healthcare costs trends would increase the aggregate postretirement medical obligation by approximately $2.0 million. |
39
Recent Accounting Pronouncements
See Note 1 to our Consolidated Financial Statements.
Item 7A. | Quantitative and Qualitative Disclosures About Market Risk |
We are exposed to commodity price fluctuations, including raw milk, butterfat, sweeteners and other commodity costs used in the manufacturing, packaging and distribution of our products, including utilities, natural gas, resin and diesel fuel. To secure adequate supplies of materials and bring greater stability to the cost of ingredients and their related manufacturing, packaging and distribution, we routinely enter into forward purchase contracts and other purchase arrangements with suppliers. Under the forward purchase contracts, we commit to purchasing agreed-upon quantities of ingredients and commodities at agreed-upon prices at specified future dates. The outstanding purchase commitment for these commodities at any point in time typically ranges from one month’s to one year’s anticipated requirements, depending on the ingredient or commodity. These contracts are considered normal purchases. In addition to entering into forward purchase contracts, from time to time we may purchase over-the-counter contracts with our qualified banking partners or exchange-traded commodity futures contracts for raw materials that are ingredients of our products or components of such ingredients. Our open commodity derivatives recorded at fair value on our balance sheet were at a net liability position of $0.4 million as of December 31, 2017.
Although we may utilize forward purchase contracts and other instruments to mitigate the risks related to commodity price fluctuation, such strategies do not fully mitigate commodity price risk. Adverse movements in commodity prices over the terms of the contracts or instruments could decrease the economic benefits we expect to derive from these strategies. See Note 10 to our Consolidated Financial Statements.
40
Item 8. | Financial Statements and Supplementary Data |
Our Consolidated Financial Statements for 2017 are included in this report on the following pages.
Page | |
41
DEAN FOODS COMPANY
CONSOLIDATED BALANCE SHEETS
December 31 | |||||||
2017 | 2016 | ||||||
(Dollars in thousands, except share data) | |||||||
ASSETS | |||||||
Current assets: | |||||||
Cash and cash equivalents | $ | 16,512 | $ | 17,980 | |||
Receivables, net of allowances of $5,583 and $5,118 | 675,826 | 669,200 | |||||
Income tax receivable | 2,140 | 5,578 | |||||
Inventories | 278,063 | 284,484 | |||||
Deferred income taxes | — | 37,504 | |||||
Prepaid expenses and other current assets | 47,338 | 43,884 | |||||
Total current assets | 1,019,879 | 1,058,630 | |||||
Property, plant and equipment, net | 1,094,064 | 1,163,851 | |||||
Goodwill | 167,535 | 154,112 | |||||
Identifiable intangible and other assets, net | 211,620 | 207,897 | |||||
Deferred income taxes | 10,731 | 21,737 | |||||
Total | $ | 2,503,829 | $ | 2,606,227 | |||
LIABILITIES AND STOCKHOLDERS’ EQUITY | |||||||
Current liabilities: | |||||||
Accounts payable and accrued expenses | $ | 671,070 | $ | 706,981 | |||
Current portion of debt | 1,125 | 140,806 | |||||
Total current liabilities | 672,195 | 847,787 | |||||
Long-term debt, net | 912,074 | 745,245 | |||||
Deferred income taxes | 60,018 | 126,009 | |||||
Other long-term liabilities | 203,595 | 276,630 | |||||
Commitments and contingencies (Note 18) | |||||||
Stockholders’ equity: | |||||||
Preferred stock, none issued | — | — | |||||
Common stock, 91,123,759 and 90,586,741 shares issued and outstanding, with a par value of $0.01 per share | 911 | 906 | |||||
Additional paid-in capital | 659,227 | 653,629 | |||||
Retained earnings | 74,219 | 45,654 | |||||
Accumulated other comprehensive loss | (78,410 | ) | (89,633 | ) | |||
Total stockholders’ equity | 655,947 | 610,556 | |||||
Total | $ | 2,503,829 | $ | 2,606,227 | |||
See Notes to Consolidated Financial Statements.
F-1
DEAN FOODS COMPANY
CONSOLIDATED STATEMENTS OF OPERATIONS
Year Ended December 31 | |||||||||||
2017 | 2016 | 2015 | |||||||||
(Dollars in thousands, except share data) | |||||||||||
Net sales | $ | 7,795,025 | $ | 7,710,226 | $ | 8,121,661 | |||||
Cost of sales | 5,977,348 | 5,722,710 | 6,147,252 | ||||||||
Gross profit | 1,817,677 | 1,987,516 | 1,974,409 | ||||||||
Operating costs and expenses: | |||||||||||
Selling and distribution | 1,346,948 | 1,348,349 | 1,379,317 | ||||||||
General and administrative | 311,176 | 346,028 | 350,324 | ||||||||
Amortization of intangibles | 20,710 | 20,752 | 21,653 | ||||||||
Facility closing and reorganization costs, net | 24,913 | 8,719 | 19,844 | ||||||||
Impairment of intangible and long-lived assets | 30,668 | — | 109,910 | ||||||||
Total operating costs and expenses | 1,734,415 | 1,723,848 | 1,881,048 | ||||||||
Operating income | 83,262 | 263,668 | 93,361 | ||||||||
Other (income) expense: | |||||||||||
Interest expense | 64,961 | 66,795 | 66,813 | ||||||||
Loss on early retirement of long-term debt | — | — | 43,609 | ||||||||
Other income, net | (2,942 | ) | (5,778 | ) | (3,751 | ) | |||||
Total other expense | 62,019 | 61,017 | 106,671 | ||||||||
Income (loss) from continuing operations before income taxes | 21,243 | 202,651 | (13,310 | ) | |||||||
Income tax expense (benefit) | (26,179 | ) | 82,034 | (5,229 | ) | ||||||
Income (loss) from continuing operations | 47,422 | 120,617 | (8,081 | ) | |||||||
Income (loss) from discontinued operations, net of tax | 11,291 | (312 | ) | (1,095 | ) | ||||||
Gain (loss) on sale of discontinued operations, net of tax | 2,875 | (376 | ) | 668 | |||||||
Net income (loss) | $ | 61,588 | $ | 119,929 | $ | (8,508 | ) | ||||
Average common shares: | |||||||||||
Basic | 90,899,284 | 90,933,886 | 93,298,467 | ||||||||
Diluted | 91,273,994 | 91,510,483 | 93,298,467 | ||||||||
Basic income (loss) per common share: | |||||||||||
Income (loss) from continuing operations | $ | 0.52 | $ | 1.33 | $ | (0.09 | ) | ||||
Income (loss) from discontinued operations | 0.16 | (0.01 | ) | — | |||||||
Net income (loss) | $ | 0.68 | $ | 1.32 | $ | (0.09 | ) | ||||
Diluted income (loss) per common share: | |||||||||||
Income (loss) from continuing operations | $ | 0.52 | $ | 1.32 | $ | (0.09 | ) | ||||
Income (loss) from discontinued operations | 0.15 | (0.01 | ) | — | |||||||
Net income (loss) | $ | 0.67 | $ | 1.31 | $ | (0.09 | ) | ||||
See Notes to Consolidated Financial Statements.
F-2
DEAN FOODS COMPANY
CONSOLIDATED STATEMENTS OF COMPREHENSIVE INCOME (LOSS)
Year Ended December 31 | |||||||||||
2017 | 2016 | 2015 | |||||||||
(in thousands) | |||||||||||
Net income (loss) | $ | 61,588 | $ | 119,929 | $ | (8,508 | ) | ||||
Other comprehensive income (loss): | |||||||||||
Cumulative translation adjustment | — | (2,257 | ) | (1,333 | ) | ||||||
Unrealized loss on derivative instruments, net of tax: | |||||||||||
Change in fair value of derivative instruments | — | — | (87 | ) | |||||||
Defined benefit pension and other postretirement benefit plans, net of tax: | |||||||||||
Prior service costs arising during the period | (819 | ) | — | (43 | ) | ||||||
Net gain (loss) arising during the period | 4,958 | (8,452 | ) | (5,036 | ) | ||||||
Less: amortization of prior service cost included in net periodic benefit cost | 7,084 | 6,879 | 5,679 | ||||||||
Other comprehensive income (loss) | 11,223 | (3,830 | ) | (820 | ) | ||||||
Comprehensive income (loss) | $ | 72,811 | $ | 116,099 | $ | (9,328 | ) | ||||
See Notes to Consolidated Financial Statements.
F-3
DEAN FOODS COMPANY
CONSOLIDATED STATEMENTS OF STOCKHOLDERS’ EQUITY
Dean Foods Company Stockholders | Total Stockholders’ Equity | |||||||||||||||||||||
Common Stock | Additional Paid-In Capital | Retained Earnings (Accumulated Deficit) | Accumulated Other Comprehensive Loss | |||||||||||||||||||
Shares | Amount | |||||||||||||||||||||
(Dollars in thousands, except share data) | ||||||||||||||||||||||
Balance, January 1, 2015 | 94,080,840 | $ | 941 | $ | 752,375 | $ | (41,015 | ) | $ | (84,983 | ) | $ | 627,318 | |||||||||
Issuance of common stock, net of tax impact of share-based compensation | 513,016 | 5 | (1,673 | ) | — | — | (1,668 | ) | ||||||||||||||
Share-based compensation expense | — | — | 8,488 | — | — | 8,488 | ||||||||||||||||
Share repurchases | (3,165,582 | ) | (32 | ) | (52,978 | ) | — | — | (53,010 | ) | ||||||||||||
Net loss | — | — | — | (8,508 | ) | — | (8,508 | ) | ||||||||||||||
Dividends(1) | — | — | (26,296 | ) | — | — | (26,296 | ) | ||||||||||||||
Other comprehensive income (loss) (Note 13): | ||||||||||||||||||||||
Change in fair value of derivative instruments, net of tax benefit of $54 | — | — | — | — | (87 | ) | (87 | ) | ||||||||||||||
Cumulative translation adjustment | — | — | — | — | (1,333 | ) | (1,333 | ) | ||||||||||||||
Pension and other postretirement benefit liability adjustment, net of tax of $394 | — | — | — | — | 600 | 600 | ||||||||||||||||
Balance, December 31, 2015 | 91,428,274 | $ | 914 | $ | 679,916 | $ | (49,523 | ) | $ | (85,803 | ) | $ | 545,504 | |||||||||
Issuance of common stock, net of tax impact of share-based compensation | 529,652 | 6 | (1,754 | ) | — | — | (1,748 | ) | ||||||||||||||
Share-based compensation expense | — | — | 8,843 | — | — | 8,843 | ||||||||||||||||
Share repurchases | (1,371,185 | ) | (14 | ) | (24,986 | ) | — | — | (25,000 | ) | ||||||||||||
Net income | — | — | — | 119,929 | — | 119,929 | ||||||||||||||||
Dividends(1) | — | — | (8,390 | ) | (24,752 | ) | — | (33,142 | ) | |||||||||||||
Other comprehensive loss (Note 13): | ||||||||||||||||||||||
Cumulative translation adjustment | — | — | — | — | (2,257 | ) | (2,257 | ) | ||||||||||||||
Pension and other postretirement benefit liability adjustment, net of tax benefit of $678 | — | — | — | — | (1,573 | ) | (1,573 | ) | ||||||||||||||
Balance, December 31, 2016 | 90,586,741 | $ | 906 | $ | 653,629 | $ | 45,654 | $ | (89,633 | ) | $ | 610,556 | ||||||||||
Issuance of common stock | 537,018 | 5 | 181 | — | — | 186 | ||||||||||||||||
Share-based compensation expense | — | — | 5,417 | — | — | 5,417 | ||||||||||||||||
Net income | — | — | — | 61,588 | — | 61,588 | ||||||||||||||||
Dividends(1) | — | — | — | (33,023 | ) | — | (33,023 | ) | ||||||||||||||
Other comprehensive income (Note 13): | ||||||||||||||||||||||
Pension and other postretirement benefit liability adjustment, net of tax of $5,676 | — | — | — | — | 11,223 | 11,223 | ||||||||||||||||
Balance, December 31, 2017 | 91,123,759 | $ | 911 | $ | 659,227 | $ | 74,219 | $ | (78,410 | ) | $ | 655,947 | ||||||||||
(1) | Cash dividends declared per common share were $0.36, $0.36 and $0.28 in the years ended December 31, 2017, 2016 and 2015, respectively. |
See Notes to Consolidated Financial Statements.
F-4
DEAN FOODS COMPANY
CONSOLIDATED STATEMENTS OF CASH FLOWS
Year Ended December 31 | |||||||||||
2017 | 2016 | 2015 | |||||||||
(In thousands) | |||||||||||
Cash flows from operating activities: | |||||||||||
Net income (loss) | $ | 61,588 | $ | 119,929 | $ | (8,508 | ) | ||||
(Income) loss from discontinued operations, net of tax | (11,291 | ) | 312 | 1,095 | |||||||
(Gain) loss on sale of discontinued operations, net of tax | (2,875 | ) | 376 | (668 | ) | ||||||
Adjustments to reconcile net income (loss) to net cash provided by operating activities: | |||||||||||
Depreciation and amortization | 170,640 | 178,385 | 176,884 | ||||||||
Share-based compensation expense | 11,021 | 29,830 | 16,377 | ||||||||
Loss on divestitures and other, net | 4,031 | 1,265 | 2,736 | ||||||||
Impairment of intangible and long-lived assets | 30,668 | — | 109,910 | ||||||||
Write-off of financing costs | 1,080 | — | — | ||||||||
Loss on early retirement of debt | — | — | 43,609 | ||||||||
Deferred income taxes | (25,431 | ) | 26,376 | (34,359 | ) | ||||||
Other, net | 8,467 | (4,861 | ) | 9,225 | |||||||
Changes in operating assets and liabilities, net of acquisitions: | |||||||||||
Receivables, net | (5,606 | ) | (462 | ) | 94,279 | ||||||
Inventories | 12,714 | (19,434 | ) | (1,495 | ) | ||||||
Prepaid expenses and other assets | (11,625 | ) | 7,474 | 8,148 | |||||||
Accounts payable and accrued expenses | (63,520 | ) | (65,165 | ) | (46,524 | ) | |||||
Income taxes receivable/payable | 3,438 | 2,241 | 56,297 | ||||||||
Litigation settlement | — | (18,853 | ) | (18,853 | ) | ||||||
Contributions to company sponsored pension plans | (38,500 | ) | — | — | |||||||
Net cash provided by operating activities | 144,799 | 257,413 | 408,153 | ||||||||
Cash flows from investing activities: | |||||||||||
Payments for property, plant and equipment | (106,726 | ) | (144,642 | ) | (162,542 | ) | |||||
Payments for acquisitions, net of cash acquired | (21,596 | ) | (158,203 | ) | — | ||||||
Proceeds from sale of fixed assets | 4,336 | 14,705 | 18,495 | ||||||||
Other investments | (11,000 | ) | — | (2,200 | ) | ||||||
Net cash used in investing activities | (134,986 | ) | (288,140 | ) | (146,247 | ) | |||||
Cash flows from financing activities: | |||||||||||
Repayments of debt | (143,323 | ) | (1,232 | ) | (1,416 | ) | |||||
Early retirement of debt | — | — | (476,188 | ) | |||||||
Premiums paid on early retirement of debt | — | — | (37,309 | ) | |||||||
Payments of financing costs | (1,786 | ) | — | (16,816 | ) | ||||||
Proceeds from senior secured revolver | 326,900 | 254,300 | 360,670 | ||||||||
Payments for senior secured revolver | (324,800 | ) | (245,200 | ) | (430,971 | ) | |||||
Proceeds from receivables securitization facility | 2,525,000 | 945,000 | 685,000 | ||||||||
Payments for receivables securitization facility | (2,360,000 | ) | (905,000 | ) | (920,000 | ) | |||||
Proceeds from issuance of 2023 notes | — | — | 700,000 | ||||||||
Common stock repurchases | — | (25,000 | ) | (53,010 | ) | ||||||
Cash dividends paid | (32,737 | ) | (32,828 | ) | (26,182 | ) | |||||
Issuance of common stock, net of share repurchases for withholding taxes | (535 | ) | (720 | ) | (16 | ) | |||||
Tax savings on share-based compensation | — | 746 | 342 | ||||||||
Net cash used in financing activities | (11,281 | ) | (9,934 | ) | (215,896 | ) | |||||
Effect of exchange rate changes on cash and cash equivalents | — | (2,093 | ) | (1,638 | ) | ||||||
Change in cash and cash equivalents | (1,468 | ) | (42,754 | ) | 44,372 | ||||||
Cash and cash equivalents, beginning of period | 17,980 | 60,734 | 16,362 | ||||||||
Cash and cash equivalents, end of period | $ | 16,512 | $ | 17,980 | $ | 60,734 | |||||
See Notes to Consolidated Financial Statements.
F-5
NOTES TO CONSOLIDATED FINANCIAL STATEMENTS
Years Ended December 31, 2017, 2016 and 2015
1. SUMMARY OF SIGNIFICANT ACCOUNTING POLICIES
Nature of Our Business — We are a leading food and beverage company and the largest processor and direct-to-store distributor of fresh fluid milk and other dairy and dairy case products in the United States. We process and distribute fluid milk and other dairy products, including ice cream, ice cream mix and cultured products, which are marketed under more than 50 national, regional and local dairy brands and a wide array of private labels. We also produce and distribute DairyPure®, our national white milk brand, and TruMoo®, our national flavored milk brand, as well as juices, teas, bottled water and other products.
Basis of Presentation and Consolidation — Our Consolidated Financial Statements are prepared in accordance with U.S. generally accepted accounting principles (“GAAP”) and include the accounts of our wholly-owned subsidiaries.
We have aligned our leadership team, operating strategy, and sales, logistics and supply chain initiatives into a single operating and reportable segment. Unless stated otherwise, any reference to income statement items in these financial statements refers to results from continuing operations.
Unless otherwise indicated, references in this report to “we,” “us”, “our” or "the Company" refer to Dean Foods Company and its subsidiaries, taken as a whole.
Use of Estimates — The preparation of our Consolidated Financial Statements in conformity with GAAP requires us to use our judgment to make estimates and assumptions that affect the reported amounts of assets and liabilities and disclosures of contingent assets and liabilities at the date of the Consolidated Financial Statements and the reported amounts of net sales and expenses during the reporting period. Actual results could differ from these estimates under different assumptions or conditions.
Cash Equivalents — We consider temporary investments with an original maturity of three months or less to be cash equivalents.
Inventories — Inventories are stated at the lower of cost or market. Our products are valued using the first-in, first-out method. The costs of finished goods inventories include raw materials, direct labor and indirect production and overhead costs. Reserves for obsolete or excess inventory are not material.
Property, Plant and Equipment — Property, plant and equipment are stated at acquisition cost, plus capitalized interest on borrowings during the actual construction period of major capital projects. Also included in property, plant and equipment are certain direct costs related to the implementation of computer software for internal use. Depreciation is calculated using the straight-line method typically over the following range of estimated useful lives of the assets:
Asset | Useful Life | |
Buildings | 15 to 40 years | |
Machinery and equipment | 3 to 20 years | |
Leasehold improvements | Over the shorter of their estimated useful lives or the terms of the applicable lease agreements | |
We test property, plant and equipment for impairment when circumstances indicate that the carrying value may not be recoverable. Indicators of impairment could include, among other factors, significant changes in the business environment, the planned closure of a facility, or deteriorations in operating cash flows. Considerable management judgment is necessary to evaluate the impact of operating changes and to estimate future cash flows. See Note 16. Expenditures for repairs and maintenance which do not improve or extend the life of the assets are expensed as incurred.
F-6
Goodwill and Intangible Assets — Identifiable intangible assets, other than indefinite-lived trademarks, are typically amortized over the following range of estimated useful lives:
Asset | Useful Life | |
Customer relationships | 5 to 15 years | |
Finite-lived trademarks | 5 to 10 years | |
Customer supply contracts | Over the shorter of the estimated useful lives or the terms of the agreements | |
Noncompetition agreements | Over the shorter of the estimated useful lives or the terms of the agreements | |
Deferred financing costs(1) | Over the terms of the related debt | |
(1) | Deferred financing costs associated with our receivables securitization facility and senior secured credit facility are recorded as assets in the identifiable intangible and other assets, net line of our Consolidated Balance Sheets. Beginning on January 1, 2016, we adopted ASU No. 2015-03, Imputation of Interest - Simplifying the Presentation of Debt Issuance Costs. Upon our adoption of ASU No. 2015-03, deferred financing costs associated with our senior notes due 2023 were reclassified from other assets to a reduction to the carrying amount of the liability on our Consolidated Balance Sheets and retroactively applied to prior periods. All of our deferred financing costs are amortized to interest expense over the terms of the related debt. |
In accordance with Accounting Standards related to “Goodwill and Other Intangible Assets”, we do not amortize goodwill and other intangible assets determined to have indefinite useful lives. Instead, we assess our goodwill and indefinite-lived trademarks for impairment annually and when circumstances indicate that the carrying value may not be recoverable. See Note 6.
Assets Held for Sale — We classify assets as held for sale when management approves and commits to a formal plan of sale and our expectation is that the sale will be completed within one year. The net assets of the business held for sale are then recorded at the lower of their current carrying value or the fair market value, less costs to sell. As of December 31, 2017 and 2016, there were no assets classified as held for sale.
Share-Based Compensation — Share-based compensation expense is recognized for equity awards over the vesting period based on their grant date fair value. The fair value of restricted stock unit awards and performance stock unit awards is equal to the closing price of our stock on the date of grant. The fair value of our phantom shares is remeasured at each reporting period based on the closing price of our common stock on the last day of the respective reporting period. Compensation expense is recognized only for equity awards expected to vest. We estimate forfeitures at the date of grant based on our historical experience and future expectations. Share-based compensation expense is included within general and administrative expenses in our Consolidated Statements of Operations. See Note 11.
Revenue Recognition, Sales Incentives and Accounts Receivable — Sales are recognized when persuasive evidence of an arrangement exists, the price is fixed or determinable, the product has been delivered to the customer and there is a reasonable assurance of collection of the sales proceeds. Sales are recorded net of allowances for returns, trade promotions and prompt pay and other discounts. We routinely offer sales incentives and discounts through various regional and national programs to our customers and consumers. These programs include rebates, shelf-price reductions, in-store display incentives, coupons and other trade promotional activities. These programs, as well as amounts paid to customers for shelf-space in retail stores, are considered reductions in the price of our products and thus are recorded as reductions to gross sales. Some of these incentives are recorded by estimating incentive costs based on our historical experience and expected levels of performance of the trade promotion. We maintain liabilities at the end of each period for the estimated incentive costs incurred but unpaid for these programs. Differences between estimated and actual incentive costs are normally insignificant and are recognized in earnings in the period such differences are determined.
As a result of the purchase of raw milk, we obtain more butterfat than is needed in our production process. Excess butterfat is sold, primarily in the form of bulk cream, to third parties. We currently present the sales of these excess raw materials as a reduction of cost of sales within our Consolidated Statements of Operations as it enables us to report our true cost of the raw materials utilized in our operations. Sales of excess raw materials included as a reduction to cost of sales were $606.9 million, $551.5 million and $577.4 million for the years ended December 31, 2017, 2016, and 2015, respectively.
We provide credit terms to customers generally ranging up to 30 days, perform ongoing credit evaluations of our customers and maintain allowances for potential credit losses based on our historical experience. Our reserve for product returns has not historically been material.
F-7
See "Recently Issued Accounting Pronouncements" below for information regarding expected future impacts to revenue recognition upon adoption of Accounting Standards Update ("ASU") No. 2014-09, Revenue from Contracts with Customers.
Income Taxes — All of our consolidated U.S. operating subsidiaries are included in our U.S. federal consolidated income tax return. Our foreign subsidiary is required to file a local jurisdiction income tax return with respect to its operations. Prior to the enactment of the Tax Cuts and Jobs Act (the "Tax Act") on December 22, 2017, we considered these accumulated foreign earnings to be indefinitely reinvested and therefore no provision had been made for U.S. income taxes on such amounts. The Tax Act made significant changes to the taxation of undistributed foreign earnings, requiring that all previously untaxed earnings and profits of our foreign subsidiary be subjected to a one-time mandatory transition tax. Accordingly, as of December 31, 2017, we have recorded a provision of $2.1 million for U.S. income taxes on these accumulated foreign earnings.
Deferred income taxes arise from temporary differences between amounts recorded in the Consolidated Financial Statements and tax bases of assets and liabilities using enacted tax rates in effect for the years in which the differences are expected to reverse. Deferred tax assets, including the benefit of net operating loss and tax credit carryforwards, are evaluated based on the guidelines for realization and are reduced by a valuation allowance if deemed necessary.
We recognize the income tax benefit from an uncertain tax position when it is more likely than not that, based on technical merits, the position will be sustained upon examination, including resolutions of any related appeals or litigation processes. We recognize accrued interest related to uncertain tax positions as a component of income tax expense, and penalties, if incurred, are recognized as a component of operating income.
Advertising Expense — We market our products through advertising and other promotional activities, including media, agency, coupons, trade shows and other promotional activities. Advertising expense is charged to income during the period incurred, except for expenses related to the development of a major commercial or media campaign which are charged to income during the period in which the advertisement or campaign is first presented by the media. Advertising expense totaled $39.1 million in 2017, $59.6 million in 2016 and $44.8 million in 2015. Prepaid advertising expense totaled $0.5 million in 2017, $1.9 million in 2016 and $0.7 million in 2015.
Shipping and Handling Fees — Our shipping and handling costs are included in both cost of sales and selling and distribution expense, depending on the nature of such costs. Shipping and handling costs included in cost of sales reflect inventory warehouse costs and product loading and handling costs. Shipping and handling costs included in selling and distribution expense consist primarily of those costs associated with moving finished products from production facilities through our distribution network, including costs associated with its distribution centers, route delivery costs and the cost of shipping products to customers through third party carriers. Shipping and handling costs that were recorded as a component of selling and distribution expense were $1.2 billion in 2017, $1.1 billion in 2016 and $1.2 billion in 2015.
Insurance Accruals — We retain selected levels of property and casualty risks, primarily related to employee health care, workers’ compensation claims and other casualty losses. Many of these potential losses are covered under conventional insurance programs with third party insurers with high deductibles. In other areas, we are self-insured. Accrued liabilities related to these retained risks are calculated based upon loss development factors that contemplate a number of factors including claims history and expected trends.
Research and Development — Our research and development activities primarily consist of generating and testing new product concepts, new flavors of products and packaging. Our total research and development expense was $3.5 million, $3.0 million and $2.3 million for 2017, 2016 and 2015, respectively. Research and development costs are primarily included in general and administrative expenses in our Consolidated Statements of Operations.
Recently Adopted Accounting Pronouncements
ASU No. 2016-09 — In March 2016, the Financial Accounting Standards Board ("FASB") issued ASU 2016-09, Compensation — Stock Compensation — Improvements to Employee Share-Based Payment Accounting. ASU 2016-09 simplifies several aspects of the accounting for share-based payment transactions, including the income tax consequences, the accounting for forfeitures, the classification of awards as either equity or liabilities, and the classification of certain share-based payment transactions on the statement of cash flows. We adopted this ASU effective January 1, 2017, and it has been applied in accordance with the transition methods specified in the guidance. As permitted by the standard, we have not changed our accounting policy for forfeitures of share-based awards and will continue estimating forfeitures when determining compensation cost to be recognized over the vesting period. The presentation of excess tax benefits of share-based awards on the Consolidated Statement of Cash Flows has been applied prospectively; therefore, cash flows related to excess tax benefits will no longer be separately classified as a financing activity apart from other income tax cash flows. In addition, we are now recording on a prospective basis excess tax benefits and tax deficiencies related to share-based payments within the provision for income taxes on the Consolidated Statement of Operations rather than on the Consolidated Balance Sheet within additional paid-in capital.
F-8
ASU No. 2015-17 — In November 2015, the FASB issued ASU 2015-17, Income Taxes — Balance Sheet Classification of Deferred Taxes. ASU 2015-17 simplifies the presentation of deferred income taxes and requires that deferred tax liabilities and assets be classified as noncurrent in a classified statement of financial position. The amendments eliminate the guidance in Accounting Standards Codification ("ASC") Topic 740 that requires an entity to separate deferred tax liabilities and assets into a current amount and a noncurrent amount in a classified statement of financial position. We adopted this ASU on a prospective basis effective January 1, 2017.
Recently Issued Accounting Pronouncements
Effective in 2018
ASU No. 2017-09 — In May 2017, the FASB issued ASU 2017-09, Compensation — Stock Compensation (Topic 718): Scope of Modification Accounting. The new guidance is intended to provide clarity and reduce both diversity in practice and cost and complexity when applying the guidance in Topic 718, Compensation—Stock Compensation, to a change to the terms or conditions of a share-based payment award. The amendments provide guidance about which changes to the terms or conditions of a share-based payment award require an entity to apply modification accounting in Topic 718. An entity should account for the effects of a modification unless all the following are met: 1) The fair value (or calculated value or intrinsic value) of the modified award is the same as the fair value (or calculated value or intrinsic value) of the original award immediately before the original award is modified. If the modification does not affect any of the inputs to the valuation technique that the entity uses to value the award, the entity is not required to estimate the value immediately before and after the modification; 2) The vesting conditions of the modified award are the same as the vesting conditions of the original award immediately before the original award is modified; and 3) The classification of the modified award as an equity instrument or a liability instrument is the same as the classification of the original award immediately before the original award is modified. This guidance is effective for all entities for annual periods, and interim periods within those annual periods, beginning after December 15, 2017. Early adoption is permitted, including adoption in any interim period, for reporting periods for which financial statements have not yet been issued. The amendments should be applied prospectively to an award modified on or after the adoption date. We did not early adopt this ASU. We do not expect the adoption of ASU 2017-09 to have a material impact on our financial statements.
ASU No. 2017-07 — In March 2017, the FASB issued ASU 2017-07, Compensation — Retirement Benefits (Topic 715): Improving the Presentation of Net Periodic Pension Cost and Net Periodic Postretirement Benefit Cost. The new guidance is intended to improve the presentation of net periodic pension cost and net periodic postretirement benefit cost. The amendments require that an employer report the service cost component in the same line item or items as other compensation costs arising from services rendered by the pertinent employees during the period. The other components of net periodic benefit costs (which include interest costs, expected return on plan assets, amortization of prior service cost or credits and actuarial gains and losses) are to be reported separately and outside a subtotal of operating income, if one is presented. Currently, we record all components of net periodic benefit cost on the same line item as the employees' respective compensation expense. Upon adoption of this standard we will be required to present net periodic cost for pension and postretirement benefits in accordance with the new guidance described above. See Note 14 for further information on our pension and postretirement plans. For public companies, this guidance is effective for interim and annual reporting periods beginning after December 15, 2017. The amendment should be applied on a retrospective basis. Early adoption is permitted as of the beginning of an annual period for which financial statements (interim or annual) have not been issued or made available for issuance. We did not early adopt this ASU. We do not expect the adoption of ASU 2017-07 to have a material impact on our financial statements.
ASU No. 2017-03 — In January 2017, the FASB issued ASU 2017-03, Accounting Changes and Error Corrections and Investments — Equity Method and Joint Ventures: Amendments to SEC Paragraphs Pursuant to Staff Announcements at the September 22, 2016 and November 17, 2016 Emerging Issues Task Force ("EITF") Meetings. The new guidance is intended to provide clarity in relation to the disclosure of the impact that ASU 2014-09 and ASU 2016-02, which are described below, will have on our financial statements when adopted. The effective dates for this guidance are the same as the respective effective dates for ASU 2014-09 and ASU 2016-02. We do not expect the adoption of ASU 2017-03 to have a material impact on our financial statements.
ASU No. 2017-01 — In January 2017, the FASB issued ASU 2017-01, Business Combinations: Clarifying the Definition of a Business. The new guidance clarifies the definition of a business with the objective of adding guidance to assist entities with evaluating whether transactions should be accounted for as acquisitions (or disposals) of assets or businesses. For public companies, this standard is effective for annual periods beginning after December 15, 2017, including interim periods within those periods. The amendments should be applied prospectively on or after the effective date. Early application of the amendments is allowed with certain restrictions. We do not expect the adoption of ASU 2017-01 to have a material impact on our financial statements and will prospectively apply the guidance to applicable transactions.
F-9
ASU No. 2016-16 — In October 2016, the FASB issued ASU 2016-16, Income Taxes: Intra-Entity Transfers of Assets Other Than Inventory. ASU 2016-16 reduces complexity by allowing the recognition of current and deferred income taxes for an intra-entity asset transfer (other than inventory) when the transfer occurs. The new guidance is intended to reduce the complexity of GAAP and diversity in practice related to the tax consequences of certain types of intra-entity asset transfers, particularly those involving intellectual property. For public companies, this standard is effective for annual reporting periods beginning after December 15, 2017, including interim reporting periods within those annual reporting periods. Early adoption is permitted as of the beginning of an annual reporting period for which financial statements (interim or annual) have not been issued or made available for issuance. We did not early adopt this ASU. The amendments should be applied on a modified retrospective basis through a cumulative-effect adjustment directly to retained earnings as of the beginning of the period of adoption. We do not expect the adoption of ASU 2016-16 to have a material impact on our financial statements.
ASU No. 2016-15 — In August 2016, the FASB issued ASU 2016-15, Statement of Cash Flows: Classification of Certain Cash Receipts and Cash Payments. The new guidance is intended to eliminate diversity in practice in how certain cash receipts and cash payments are presented and classified in the statement of cash flows. The new standard is effective for financial statements issued for fiscal years beginning after December 15, 2017, and interim periods within those fiscal years. Early adoption is permitted for all entities, provided that all of the amendments are adopted in the same period. We did not early adopt this ASU. The guidance requires application using a retrospective transition method. We do not expect the adoption of ASU 2016-15 to have a material impact on our financial statements.
ASU No. 2016-01 — In January 2016, the FASB issued ASU 2016-01, Recognition and Measurement of Financial Assets and Liabilities. ASU 2016-01 supersedes existing guidance to classify equity securities with readily determinable fair values into different categories and requires equity securities to be measured at fair value with changes in the fair value recognized through net income. An entity’s equity investments that are accounted for under the equity method of accounting or result in consolidation of an investee are not included within the scope of this amended guidance. The amendments allow equity investments that do not have readily determinable fair values to be remeasured at fair value either upon the occurrence of an observable price change or upon identification of impairment. The amended guidance is effective for fiscal years beginning after December 15, 2017, including interim periods within those fiscal years. The amendments in this ASU should be applied by means of a cumulative-effect adjustment to the balance sheet as of the beginning of the fiscal year of adoption. The amendments related to equity securities without readily determinable fair values (including disclosure requirements) should be applied prospectively to equity investments that exist as of the date of adoption of the ASU. Early application of certain amendments in this standard to financial statements of fiscal years and interim periods that have not yet been issued is permitted as of the beginning of the fiscal year of adoption. Except for the early application of certain amendments discussed above, early adoption of the standard is not permitted. We do not expect the adoption of ASU 2016-01 to have a material impact on our financial statements.
ASU No. 2014-09 — In May 2014, the FASB issued ASU 2014-09, Revenue from Contracts with Customers. The comprehensive new standard supersedes existing revenue recognition guidance and requires revenue to be recognized when promised goods or services are transferred to customers in amounts that reflect the consideration to which the company expects to be entitled in exchange for those goods or services. Adoption of the new rules could affect the timing of revenue recognition for certain transactions. Additionally, the new standard requires enhanced disclosures, including information regarding the nature, amount, timing and uncertainty of revenue and cash flows arising from customer contracts. The standard allows for either “full retrospective” adoption, meaning the standard is applied to all of the periods presented, or “modified retrospective” adoption, meaning the standard is applied only to the most current period presented in the financial statements. The new standard was originally effective for reporting periods beginning after December 15, 2016 and early adoption was not permitted. On August 12, 2015, the FASB approved a one year delay of the effective date to reporting periods beginning after December 15, 2017, while permitting companies to voluntarily adopt the new standard as of the original effective date. In December 2016, the FASB issued ASU 2016-20, Technical Corrections and Improvements to Topic 606, Revenue from Contracts with Customers, which clarifies narrow aspects of ASC 606 or corrects unintended application of the guidance. The effective date and transition requirements for ASU 2016-20 are the same as the effective date and transition requirements for ASU 2014-09.
To assess the potential impacts of the new revenue recognition standard on our consolidated financial statements and current accounting practices, we formed a steering committee comprised of subject matter experts within the Company to assist in the identification and evaluation of our significant revenue streams and other key activities impacting revenue recognition. In particular, we evaluated the impact of the new guidance on our classification of sales of excess raw materials, which primarily consist of bulk cream sales. Historically, we have presented the sale of excess raw materials as a reduction of cost of sales within our Consolidated Statements of Operations as it allowed us to report our true cost of the raw materials utilized in our operations; however, upon further evaluation of these sales in connection with our implementation of the new revenue guidance, we have determined that it is appropriate to present these sales as revenue. Sales of excess raw materials included as a reduction to cost of sales were $606.9 million, $551.5 million and $577.4 million for the years ended December 31, 2017, 2016, and 2015 respectively. On a prospective basis, effective January 1, 2018, these sales will be reported within the net sales line of our Consolidated Statements of Operations.
F-10
Additionally, we evaluated the impact of the new standard on certain common practices currently employed by us and by other manufacturers of consumer products, such as scan-based trading, product rebates and other pricing allowances, product returns, trade promotions, sales broker commissions and slotting fees. Based on the results of our assessment, our current accounting practices for these activities is consistent with the requirements under the new revenue guidance and therefore there will not be any material changes to the nature, timing or amount of revenue recognition for these activities upon adoption. We are substantially complete with our implementation of the new standard and are on schedule to finalize it by March 2018. While we have reached conclusions on our assessment, we continue to finalize our documentation, evaluate and revise our internal controls, and finish implementing changes to our internal systems to support the new standard. Due to the nature of our business, we anticipate minimal changes will be made to our accounting and revenue policies, except with respect to the treatment of our sales of excess raw materials described above.
We adopted the new revenue standard on January 1, 2018 using the modified retrospective transition method, which results in an adjustment to retained earnings for the cumulative effect of applying the standard to contracts in process as of the adoption date. Under this method we will be providing additional disclosures of the amount by which each financial statement line item is affected in the current reporting period during 2018, as compared to the prior guidance. These additional disclosures will provide a disaggregation of our revenue and will also include certain qualitative information related to our revenue streams. Based on the results of our assessment as described above, we have determined that the adoption of ASU 2014-09 will not materially impact our results of operations or financial position, except with respect to the change in classification of sales of excess raw materials disclosed above. An adjustment to retained earnings will not be required as the change in classification of sales of excess raw materials does not result in a change to the earnings reported in prior periods.
Effective in 2019
ASU No. 2018-02 — In February 2018, the FASB issued ASU 2018-02, Income Statement-Reporting Comprehensive Income (Topic 220): Reclassification of Certain Tax Effects from Accumulated Other Comprehensive Income. The amendments in the new guidance allow a reclassification from accumulated other comprehensive income to retained earnings for stranded tax effects resulting from the Tax Act. Consequently, the amendments eliminate the stranded tax effects resulting from the Tax Act and will improve the usefulness of information reported to financial statement users. However, because the amendments only relate to the reclassification of the income tax effects of the Tax Act, the underlying guidance that requires that the effect of a change in tax laws or rates be included in income from continuing operations is not affected. The amendments in this Update also require certain disclosures about stranded tax effects. The amendments in this Update are effective for all entities for fiscal years beginning after December 15, 2018, and interim periods within those fiscal years. Early adoption of the amendments in this Update is permitted, including adoption in any interim period, for public business entities for reporting periods for which financial statements have not yet been issued. The amendments in this Update should be applied either in the period of adoption or retrospectively to each period (or periods) in which the effect of the change in the U.S. federal corporate income tax rate in the Tax Act is recognized. We currently expect to early adopt this ASU in the first quarter of 2018. We do not expect the adoption of ASU 2018-02 to have a material impact on our financial statements.
ASU No. 2017-12 — In August 2017, the FASB issued ASU 2017-12, Targeted Improvements to Accounting for Hedging Activities. The new guidance improves the financial reporting of hedging relationships to better portray the economic results of an entity’s risk management activities in its financial statements. The amendments in this guidance are effective for fiscal years beginning after December 15, 2018, and interim periods within those fiscal years. Early application is permitted in any interim period after issuance of this guidance. We do not intend to early adopt this ASU. We do not currently expect the adoption of ASU 2017-12 to have a material impact on our financial statements as our derivative instruments are not designated as cash flow or fair value hedges under Topic 815. See Note 10 for further information on our derivative instruments.
F-11
ASU No. 2016-02 — In February 2016, the FASB issued ASU 2016-02, Leases. ASU 2016-02 requires lessees to recognize lease assets and lease liabilities in the balance sheet and disclose key information about leasing arrangements, such as information about variable lease payments and options to renew and terminate leases. The amended guidance will require both operating and finance leases to be recognized in the balance sheet. Additionally, the amended guidance aligns lessor accounting to comparable guidance in ASC Topic 606, Revenue from Contracts with Customers. The amended guidance is effective for fiscal years beginning after December 15, 2018, including interim periods within those fiscal years. Early adoption is permitted. The amendments in this ASU should be adopted using a modified retrospective transition approach, which requires application of the new guidance at the beginning of the earliest comparative period presented in the year of adoption. We do not intend to early adopt this ASU. To assess the impacts of the new lease standard on our consolidated financial statements and current accounting practices, we will be forming a steering committee comprised of subject matter experts within the Company to assist with the assessment of contractual arrangements that may qualify as a lease under the new standard, gather lease data, assist with evaluating and implementing lease management technology solutions, and other key activities. We anticipate the impact of this standard to be significant to our Consolidated Balance Sheet due to the amount of our lease commitments. See Note 18 for further information regarding these commitments. We are currently evaluating the other impacts that ASU 2016-02 will have on our consolidated financial statements.
Effective in 2020
ASU No. 2017-04 — In January 2017, the FASB issued ASU 2017-04, Intangibles — Goodwill and Other: Simplifying the Test for Goodwill Impairment. The new guidance simplifies the subsequent measurement of goodwill by removing the second step of the two-step impairment test. The amendment requires an entity to perform its annual or interim goodwill impairment test by comparing the fair value of a reporting unit with its carrying amount. An entity should recognize an impairment charge for the amount by which the carrying amount exceeds a reporting unit’s fair value. An entity still has the option to perform the qualitative assessment for a reporting unit to determine if the quantitative impairment test is necessary. For public companies, this guidance is effective for annual periods or any interim goodwill impairment tests in fiscal years beginning after December 15, 2019 and should be applied on a prospective basis. Early adoption is permitted for interim or annual goodwill impairment tests performed on testing dates after January 1, 2017. We do not intend to early adopt this ASU. We do not expect the adoption of ASU 2017-04 to have a material impact on our financial statements.
2. ACQUISITIONS AND DISCONTINUED OPERATIONS
Acquisitions
Uncle Matt's Organic — On June 22, 2017, we completed the acquisition of Uncle Matt's Organic, Inc. ("Uncle Matt's"). Uncle Matt's is a leading organic juice company offering a wide range of organic juices, including probiotic-infused juices and fruit-infused waters. The total purchase price was $22.0 million. Assets acquired and liabilities assumed in connection with the acquisition have been recorded at their fair values and include identifiable intangible assets of $8.4 million, of which $6.6 million relates to an indefinite-lived trademark and $1.8 million relates to customer relationships that are subject to amortization over a period of 10 years.
We recorded goodwill of $13.4 million in connection with the acquisition, which consists of the excess of the net purchase price over the fair value of the net assets acquired. This goodwill represents the expected value attributable to our expansion into the organic juice category. The goodwill is not deductible for tax purposes.
The acquisition was funded through a combination of cash on hand and borrowings under our receivables securitization facility. The pro forma impact of the acquisition on consolidated net earnings would not have materially changed reported net earnings. Uncle Matt's results of operations have been included in our Consolidated Statements of Operations from the date of acquisition.
Friendly's — On June 20, 2016, we completed the acquisition of Friendly’s Ice Cream Holdings Corp. (“Friendly’s Holdings”), including its wholly-owned subsidiary, Friendly’s Manufacturing and Retail, LLC (“Friendly’s Manufacturing,” and together with Friendly’s Holdings, “Friendly’s”), the Friendly’s® trademark and all intellectual property associated with the ice cream business. Friendly’s develops, produces, manufactures, markets, distributes and sells ice cream and other frozen dessert-related products, as well as toppings. The total purchase price was $158.2 million. Assets acquired and liabilities assumed in connection with the acquisition have been recorded at their fair values and include identifiable intangible assets of $81.7 million, of which $29.7 million relates to customer relationships that are subject to amortization over a period of 15 years. Additionally, we assumed an unfavorable lease contract with a fair value of $5.4 million, which will be amortized as a reduction of rent expense over the term of the lease agreement.
We recorded goodwill of $67.3 million in connection with the acquisition, which consists of the excess of the net purchase price over the fair value of the net assets acquired. This goodwill represents the expected value attributable to an anticipated
F-12
increased competitive position in the ice cream market in the Northeastern United States. The goodwill is not deductible for tax purposes.
The acquisition was funded through a combination of cash on hand and borrowings under our senior secured revolving credit facility and receivables securitization facility. Friendly's results of operations have been included in our Consolidated Statements of Operations from the date of acquisition. The purchase accounting and the final fair value assessments are complete.
During the years ended December 31, 2017, 2016 and 2015, we incurred an immaterial amount of expense related to other transactional activities, which is recorded in general and administrative expenses in our Consolidated Statements of Operations.
Discontinued Operations
During the year ended December 31, 2017, we recognized net gains from discontinued operations of $11.3 million due to the lapse of a statute of limitation related to an unrecognized tax benefit previously established as a direct result of the spin-off of The WhiteWave Foods Company, which was completed on May 23, 2013. During the year ended December 31, 2017, we recognized net gains from the sale of discontinued operations of $2.9 million primarily related to the lapse of the statute of limitations related to unrecognized tax benefits previously established related to the sale of Morningstar Foods, LLC, which was completed on January 3, 2013.
During the year ended December 31, 2016, we recognized net losses from discontinued operations of $0.3 million and net losses on the sale of discontinued operations, net of tax, of $0.4 million, primarily related to interest expense on uncertain tax positions that we retained in connection with our spin-off of The WhiteWave Foods Company in 2013 and our sale of Morningstar Foods in 2013.
During the year ended December 31, 2015, we recognized net losses from discontinued operations of $1.1 million from the finalization of certain pre-separation tax items related to our spin-off of The WhiteWave Foods Company in 2013 and net gains on the sale of discontinued operations, net of tax, of $0.7 million, primarily from favorable taxing authority settlements related to our sale of Morningstar Foods in 2013.
3. INVESTMENTS IN UNCONSOLIDATED AFFILIATES
Organic Valley Fresh Joint Venture — In the third quarter of 2017, we commenced the operations of our previously announced 50/50 strategic joint venture with Cooperative Regions of Organic Producer Pools (“CROPP”), an independent farmer cooperative that distributes organic milk and other organic dairy products under the Organic Valley ® brand. The joint venture, called Organic Valley Fresh, combines our processing plants and refrigerated DSD system with CROPP's portfolio of recognized brands and products, marketing expertise, and access to an organic milk supply from America's largest cooperative of organic dairy farmers to bring the Organic Valley ® brand to retailers. We and CROPP each made a capital contribution of $2.0 million to the joint venture during the third quarter of 2017.
We have concluded that the Company is not the primary beneficiary of the Organic Valley Fresh joint venture; therefore, the financial results of the joint venture have not been consolidated in our consolidated financial statements. We are accounting for this investment under the equity method of accounting. The earnings of the joint venture for the year ended December 31, 2017 were not material to our consolidated financial statements.
Good Karma — On May 4, 2017, we acquired a non-controlling interest in, and entered into a distribution agreement with, Good Karma Foods, Inc. (“Good Karma”), the leading producer of flax-based milk and yogurt products. This investment allows us to diversify our portfolio to include plant-based dairy alternatives and provides Good Karma the ability to more rapidly expand distribution across the U.S., as well as increase investments in brand building and product innovation. We are accounting for this investment under the equity method of accounting based upon our ability to exercise significant influence over the investee through our ownership interest and representation on Good Karma's board of directors. We expect to increase our ownership interest in Good Karma in 2018, subject to the achievement of specified performance criteria. Our equity in the earnings of this investment were not material to our consolidated financial statements for the year ended December 31, 2017.
F-13
4. INVENTORIES
Inventories at December 31, 2017 and 2016 consisted of the following:
December 31 | |||||||
2017 | 2016 | ||||||
(In thousands) | |||||||
Raw materials and supplies | $ | 106,814 | $ | 110,095 | |||
Finished goods | 171,249 | 174,389 | |||||
Total | $ | 278,063 | $ | 284,484 | |||
5. PROPERTY, PLANT AND EQUIPMENT
Property, plant and equipment as of December 31, 2017 and 2016 consisted of the following:
December 31 | |||||||
2017 | 2016 | ||||||
(In thousands) | |||||||
Land | $ | 175,243 | $ | 174,323 | |||
Buildings | 677,827 | 673,687 | |||||
Leasehold improvements | 83,366 | 82,284 | |||||
Machinery and equipment | 1,867,168 | 1,921,436 | |||||
Construction in progress | 29,952 | 24,362 | |||||
2,833,556 | 2,876,092 | ||||||
Less accumulated depreciation | (1,739,492 | ) | (1,712,241 | ) | |||
Total | $ | 1,094,064 | $ | 1,163,851 | |||
Depreciation expense amounted to $145.1 million, $151.9 million and $149.7 million during the years ended December 31, 2017, 2016 and 2015, respectively.
There was no material interest capitalized during the years ended December 31, 2017 and 2016.
See Note 16 for information regarding property, plant and equipment write-downs incurred in conjunction with our restructuring plans and certain other events.
6. GOODWILL AND INTANGIBLE ASSETS
Our goodwill and intangible assets have resulted from acquisitions. Upon acquisition, the purchase price is first allocated to identifiable assets and liabilities, including trademarks and customer-related intangible assets, with any remaining purchase price recorded as goodwill. Goodwill and intangible assets with indefinite lives are not amortized. Finite-lived intangible assets are amortized over their expected useful lives. Determining the expected life of an intangible asset is based on a number of factors including the competitive environment, history and anticipated future support.
We conduct impairment tests of goodwill and indefinite-lived intangible assets annually in the fourth quarter and on an interim basis when circumstances arise that indicate a possible impairment. We evaluate goodwill at the reporting unit level.
In evaluating goodwill and indefinite-lived intangibles for impairment, we may elect to utilize a qualitative assessment to evaluate whether it is more likely than not (that is, a likelihood of more than 50 percent) that the fair value of a reporting unit is less than its carrying amount. If our qualitative assessment indicates that goodwill impairment is more likely than not, we perform a quantitative assessment to determine whether goodwill is impaired and to measure the amount of goodwill impairment to be recognized, if any. Under the accounting guidance, we also have an option at any time to bypass the qualitative assessment and immediately perform a quantitative step one assessment to estimate the fair value of our reporting unit and identify any potential impairment of goodwill. As our last step one analysis was performed in the fourth quarter of 2014, we completed a step one goodwill impairment analysis for our single reporting unit during the fourth quarter of 2017.
Considerable management judgment is necessary to evaluate goodwill and indefinite-lived intangible assets for impairment. We estimate fair value using widely acceptable valuation techniques including discounted cash flows and market
F-14
multiples analysis with respect to our goodwill reporting unit, and the relief-from-royalty method with respect to our indefinite-lived trademarks. These valuation approaches are dependent upon a number of factors, including estimates of future growth and trends, royalty rates in the category of intellectual property, discount rates and other variables. Assumptions used in our valuations were consistent with our internal projections and operating plans, as well as other factors and assumptions, and utilized unobservable inputs (Level 3, as defined in Note 10) and significant management judgment. Additionally, under the market approach analysis, we used significant other observable inputs (Level 2, as defined in Note 10) including various guideline company comparisons. We base our fair value estimates on assumptions we believe to be reasonable, but which are unpredictable and inherently uncertain. Changes in these estimates or assumptions could materially affect the determination of fair value and the conclusions of the step one analysis for our reporting unit.
For purposes of the step one goodwill impairment analysis, we estimated the fair value of our reporting unit using an equal weighting of the income approach that analyzed projected discounted cash flows and a market approach that considered other comparable companies. Both approaches resulted in a fair value estimate for our reporting unit that significantly exceeded its carrying amount. Accordingly, we were not required to perform step two of the impairment analysis, and we did not recognize any impairment charges related to goodwill during 2017.
Additionally, based on the results of our annual impairment testing of our indefinite-lived trademarks completed during the fourth quarter of 2017, we did not record any impairment charges.
As of December 31, 2017, the gross carrying value of goodwill was $2.24 billion and accumulated goodwill impairment was $2.08 billion. We recorded a goodwill impairment charge of $2.08 billion in 2011 with no goodwill impairment charges in subsequent years.
The changes in the net carrying amount of goodwill for the year ended December 31, 2017 were as follows (in thousands):
Balance at December 31, 2015 | $ | 86,841 | |
Acquisitions (Note 2) | 67,271 | ||
Balance at December 31, 2016 | $ | 154,112 | |
Acquisitions (Note 2) | 13,423 | ||
Balance at December 31, 2017 | $ | 167,535 | |
We evaluate our finite-lived intangible assets for impairment upon a significant change in the operating environment or whenever circumstances indicate that the carrying value may not be recoverable. If an evaluation of the undiscounted cash flows indicates impairment, the asset is written down to its estimated fair value, which is generally based on discounted future cash flows.
Prior to 2015, certain of our trademarks were not amortized as our intent was to continue to use these intangible assets indefinitely. During the first quarter of 2015, we approved the launch of DairyPure®, our national white milk brand. In connection with the approval of the launch of DairyPure®, we re-evaluated our indefinite-lived trademarks and determined them to be finite-lived, with remaining useful lives of 5 years. The launch of DairyPure® resulted in a triggering event for impairment testing purposes. Based upon our testing, we recorded a non-cash impairment charge of $109.9 million and related income tax benefit of $41.2 million in the first quarter of 2015. The impairment charge is reported in the impairment of intangible and long-lived assets line in our Consolidated Statements of Operations.
In the first quarter of 2016, we further evaluated the remaining useful life of our finite-lived trademarks in conjunction with our newly approved strategy around our ice cream brands. Based on our evaluation, we extended the useful lives of certain of our finite-lived trademarks. Our finite-lived trademarks will be amortized on a straight-line basis over their remaining useful lives, which range from approximately 3 to 8 years, with a weighted-average remaining useful life of approximately 5 years.
F-15
The net carrying amounts of our intangible assets other than goodwill as of December 31, 2017 and 2016 were as follows:
December 31, 2017 | December 31, 2016 | ||||||||||||||||||||||||||||||
Acquisition Costs(1) | Impairment | Accumulated Amortization | Net Carrying Amount | Acquisition Costs | Impairment | Accumulated Amortization | Net Carrying Amount | ||||||||||||||||||||||||
(In thousands) | |||||||||||||||||||||||||||||||
Intangible assets with indefinite lives: | |||||||||||||||||||||||||||||||
Trademarks | $ | 58,600 | $ | — | $ | — | $ | 58,600 | $ | 52,000 | $ | — | $ | — | $ | 52,000 | |||||||||||||||
Intangible assets with finite lives: | |||||||||||||||||||||||||||||||
Customer-related and other | $ | 80,685 | $ | — | $ | (41,398 | ) | $ | 39,287 | $ | 78,925 | $ | — | $ | (37,050 | ) | $ | 41,875 | |||||||||||||
Trademarks | 230,709 | (109,910 | ) | (58,189 | ) | 62,610 | 229,777 | (109,910 | ) | (41,824 | ) | 78,043 | |||||||||||||||||||
Total | $ | 369,994 | $ | (109,910 | ) | $ | (99,587 | ) | $ | 160,497 | $ | 360,702 | $ | (109,910 | ) | $ | (78,874 | ) | $ | 171,918 | |||||||||||
(1) | The increase in the gross amount of intangible assets from December 31, 2016 to December 31, 2017 is related in part to an indefinite-lived trademark of $6.6 million and a finite-lived customer-related intangible of $1.8 million we recorded as a part of the Uncle Matt's acquisition. See Note 2. Additionally, we acquired a finite-lived trademark of a regional artisan ice cream brand for $0.9 million during the period. |
Amortization expense on intangible assets for the years ended December 31, 2017, 2016 and 2015 was $20.7 million, $20.8 million and $21.7 million, respectively. The amortization of intangible assets is reported on a separate line item in our Consolidated Statements of Operations. Estimated aggregate intangible asset amortization expense for the next five years is as follows (in millions):
2018 | $ | 20.3 | |
2019 | 20.3 | ||
2020 | 12.2 | ||
2021 | 10.5 | ||
2022 | 7.8 | ||
7. ACCOUNTS PAYABLE AND ACCRUED EXPENSES
Accounts payable and accrued expenses as of December 31, 2017 and 2016 consisted of the following:
December 31 | |||||||
2017 | 2016 | ||||||
(In thousands) | |||||||
Accounts payable | $ | 424,140 | $ | 416,847 | |||
Payroll and benefits, including incentive compensation | 62,551 | 101,315 | |||||
Health insurance, workers’ compensation and other insurance costs | 60,068 | 60,357 | |||||
Customer rebates | 38,571 | 41,919 | |||||
Other accrued liabilities | 85,740 | 86,543 | |||||
Total | $ | 671,070 | $ | 706,981 | |||
8. INCOME TAXES
On December 22, 2017, the Tax Act was signed into law, making comprehensive changes to the U.S. tax code affecting tax years 2017 and thereafter. Among other things, the Tax Act reduces the U.S. federal corporate income tax rate from 35% to 21%, imposes a mandatory one-time transition tax on unrepatriated foreign earnings, enhances the acceleration of depreciation deductions on qualified property, changes the U.S. taxation of foreign earnings and eliminates certain business deductions.
In response to the enactment of the Tax Act, the SEC staff issued Staff Accounting Bulletin No. 118 (“SAB 118”), which provides guidance on accounting for the tax effects of the new law. SAB 118 provides a measurement period that should
F-16
not extend beyond one year from the Tax Act enactment date for companies to complete the accounting under ASC 740, Income Taxes. For the year ended December 31, 2017, we were able to make reasonable estimates of the impact of the Tax Act and have recorded provisional amounts related to the revaluation of our deferred taxes and the one-time mandatory transition tax based on information available as of December 31, 2017. Accordingly, we have recorded a $45.8 million income tax benefit related to the revaluation of our deferred tax assets and liabilities and a $2.1 million income tax expense associated with the transition tax on our accumulated foreign earnings.
Prior to the enactment of the Tax Act, we considered the earnings of our foreign subsidiary to be permanently reinvested and, therefore, no deferred income taxes have been recorded. We have analyzed our foreign working capital and cash requirements and the potential tax liabilities that would be attributable to a repatriation and currently expect that we will repatriate approximately $10 million of cash that was previously deemed to be permanently reinvested. Additionally, we will not consider the future earnings of our foreign subsidiary to be permanently reinvested and have determined that any tax effects resulting from this change would be immaterial.
Although we do not expect a material change in the provisional estimates recorded, the ultimate impact may differ from the amounts recorded as of December 31, 2017. These estimates may be impacted by additional clarification and guidance on how the Internal Revenue Service (“IRS”) will implement tax reform, further clarification and guidance on how state taxing authorities will implement tax reform and the potential for additional guidance from the SEC or the FASB related to tax reform.
The following table presents the 2017, 2016 and 2015 income tax expense (benefit):
Year Ended December 31 | |||||||||||
2017(1) | 2016(2) | 2015(3) | |||||||||
(In thousands) | |||||||||||
Current income taxes: | |||||||||||
Federal | $ | (1,315 | ) | $ | 49,529 | $ | 26,939 | ||||
State | 1,317 | 5,728 | 1,987 | ||||||||
Foreign | 844 | 879 | 513 | ||||||||
Total current income tax expense | 846 | 56,136 | 29,439 | ||||||||
Deferred income taxes: | |||||||||||
Federal | (38,100 | ) | 15,164 | (34,620 | ) | ||||||
State | 11,075 | 10,734 | (48 | ) | |||||||
Total deferred income tax expense (benefit) | (27,025 | ) | 25,898 | (34,668 | ) | ||||||
Total income tax expense (benefit) | $ | (26,179 | ) | $ | 82,034 | $ | (5,229 | ) | |||
(1) | Excludes $14.2 million of income tax benefit related to discontinued operations. |
(2) | Excludes $0.5 million of income tax expense related to discontinued operations. |
(3) | Excludes $0.5 million of income tax expense related to discontinued operations. |
F-17
The following is a reconciliation of income tax expense (benefit) computed at the U.S. federal statutory tax rate to income tax expense (benefit) reported in our Consolidated Statements of Operations:
Year Ended December 31 | ||||||||||||||||||||
2017 | 2016 | 2015 | ||||||||||||||||||
Amount | Percentage | Amount | Percentage | Amount | Percentage | |||||||||||||||
(In thousands, except percentages) | ||||||||||||||||||||
Tax expense (benefit) at statutory rate | $ | 7,435 | 35.0 | % | $ | 70,928 | 35.0 | % | $ | (4,658 | ) | 35.0 | % | |||||||
State income taxes | 1,844 | 8.7 | 9,620 | 4.8 | 3,469 | (26.1 | ) | |||||||||||||
Corporate owned life insurance | (933 | ) | (4.4 | ) | — | — | (947 | ) | 7.1 | |||||||||||
Nondeductible executive compensation | 371 | 1.8 | 1,130 | 0.6 | 851 | (6.4 | ) | |||||||||||||
Change in valuation allowances | 5,851 | 27.5 | 1,080 | 0.5 | (2,209 | ) | 16.6 | |||||||||||||
Share-based compensation(1) | 2,995 | 14.1 | — | — | — | — | ||||||||||||||
Domestic production activities deduction | (244 | ) | (1.2 | ) | (4,393 | ) | (2.2 | ) | (2,456 | ) | 18.5 | |||||||||
Transition tax on unrepatriated foreign earnings | 2,106 | 9.9 | — | — | — | — | ||||||||||||||
Tax reform revaluation of deferred taxes | (45,840 | ) | (215.8 | ) | — | — | — | — | ||||||||||||
Other | 236 | 1.2 | 3,669 | 1.8 | 721 | (5.4 | ) | |||||||||||||
Total | $ | (26,179 | ) | (123.2 | )% | $ | 82,034 | 40.5 | % | $ | (5,229 | ) | 39.3 | % | ||||||
(1) | Includes excess tax benefits and deficiencies related to share-based payments recorded in the provision of income taxes because of the adoption of Accounting Standards Update ASU 2016-09 in 2017. See Note 1. |
The tax effects of temporary differences giving rise to deferred income tax assets (liabilities) were:
December 31 | |||||||
2017(1) | 2016(2) | ||||||
(In thousands) | |||||||
Deferred income tax assets: | |||||||
Accrued liabilities | $ | 54,971 | $ | 93,491 | |||
Retirement plans and postretirement benefits | 10,379 | 34,777 | |||||
Share-based compensation | 3,886 | 13,322 | |||||
Receivables and inventories | 6,651 | 8,187 | |||||
Derivative financial instruments | 99 | — | |||||
Net operating loss carryforwards | 38,023 | 34,478 | |||||
Tax credit carryforwards | 9,965 | 8,890 | |||||
Valuation allowances | (21,755 | ) | (12,048 | ) | |||
102,219 | 181,097 | ||||||
Deferred income tax liabilities: | |||||||
Property, plant and equipment | (124,185 | ) | (208,559 | ) | |||
Intangible assets | (22,213 | ) | (29,356 | ) | |||
Derivative financial instruments | — | (916 | ) | ||||
Cancellation of debt | (1,708 | ) | (5,576 | ) | |||
Other | (3,400 | ) | (3,458 | ) | |||
(151,506 | ) | (247,865 | ) | ||||
Net deferred income tax asset (liability) | $ | (49,287 | ) | $ | (66,768 | ) | |
(1) | Includes $7.0 million of deferred tax assets related to uncertain tax positions. |
(2) | Includes $8.8 million of deferred tax assets related to uncertain tax positions. |
F-18
These net deferred income tax assets (liabilities) are classified in our Consolidated Balance Sheets as follows:
December 31 | |||||||
2017 | 2016 | ||||||
(In thousands) | |||||||
Current assets | $ | — | $ | 37,504 | |||
Noncurrent assets | 10,731 | 21,737 | |||||
Noncurrent liabilities | (60,018 | ) | (126,009 | ) | |||
Total | $ | (49,287 | ) | $ | (66,768 | ) | |
At December 31, 2017, we had $38.0 million of tax-effected federal and state net operating losses and $10.0 million of federal and state tax credits available for carryover to future years. These items are subject to certain limitations and begin to expire in 2018. A valuation allowance of $21.8 million has been established because we do not believe it is more likely than not that all of the deferred tax assets related to these items will be realized prior to expiration. Our valuation allowance increased $9.7 million in 2017, which included a $3.9 million effect related to the revaluation of deferred taxes as a result of the Tax Act, due to certain state net operating loss carryforwards that we no longer expect to utilize prior to their expiration.
The following is a reconciliation of gross unrecognized tax benefits, including interest, recorded in our Consolidated Balance Sheets:
December 31 | |||||||||||
2017 | 2016 | 2015 | |||||||||
(In thousands) | |||||||||||
Balance at beginning of year | $ | 30,410 | $ | 27,829 | $ | 26,463 | |||||
Increases in tax positions for current year | 251 | 125 | 39 | ||||||||
Increases in tax positions for prior years | 904 | 4,542 | 1,327 | ||||||||
Decreases in tax positions for prior years | (53 | ) | (199 | ) | — | ||||||
Settlement of tax matters | — | (1,887 | ) | — | |||||||
Lapse of applicable statutes of limitations | (16,458 | ) | — | — | |||||||
Balance at end of year | $ | 15,054 | $ | 30,410 | $ | 27,829 | |||||
Of the total unrecognized tax benefit balance at December 31, 2017, $5.1 million would impact our effective tax rate and $2.9 million would be recorded in discontinued operations, if recognized. The remaining $7.0 million represents tax positions for which the ultimate deductibility is highly certain but for which there is uncertainty about the timing of such deductibility. Due to the impact of deferred income tax accounting, the disallowance of the shorter deductibility period would not affect our effective tax rate but would accelerate payment of cash to the applicable taxing authority. Due to the anticipated resolution of several uncertain tax positions, we expect our gross liability for uncertain tax positions to decrease by approximately $5 million to $6 million during the next 12 months.
We recognize accrued interest related to uncertain tax positions as a component of income tax expense. Penalties, if incurred, are recorded in general and administrative expenses in our Consolidated Statements of Operations. Interest expense recorded in income tax expense for 2017, 2016 and 2015 was immaterial. Our liability for uncertain tax positions included accrued interest of $2.0 million and $2.7 million at December 31, 2017 and 2016, respectively.
As of December 31, 2017, our 2014 through 2016 U.S. consolidated income tax returns remain open for examination by the IRS. State income tax returns are generally subject to examination for a period of three to five years after filing. We have various state income tax returns in the process of examination, appeals or settlement.
F-19
9. DEBT
Our long-term debt as of December 31, 2017 and December 31, 2016 consisted of the following:
December 31, 2017 | December 31, 2016 | ||||||||||||||
Amount | Interest Rate | Amount | Interest Rate | ||||||||||||
(In thousands, except percentages) | |||||||||||||||
Dean Foods Company debt obligations: | |||||||||||||||
Senior secured revolving credit facility | $ | 11,200 | 3.33 | % | * | $ | 9,100 | 2.94 | % | * | |||||
Senior notes due 2023 | 700,000 | 6.50 | 700,000 | 6.50 | |||||||||||
711,200 | 709,100 | ||||||||||||||
Subsidiary debt obligations: | |||||||||||||||
Senior notes due 2017 | — | — | 142,000 | 6.90 | |||||||||||
Receivables securitization facility | 205,000 | 2.48 | * | 40,000 | 1.87 | * | |||||||||
Capital lease and other | 2,671 | — | 3,980 | — | |||||||||||
207,671 | 185,980 | ||||||||||||||
Subtotal | 918,871 | 895,080 | |||||||||||||
Unamortized debt issuance costs | (5,672 | ) | (9,029 | ) | |||||||||||
Total debt | 913,199 | 886,051 | |||||||||||||
Less current portion | (1,125 | ) | (140,806 | ) | |||||||||||
Total long-term portion | $ | 912,074 | $ | 745,245 | |||||||||||
* | Represents a weighted average rate, including applicable interest rate margins. |
The scheduled debt maturities at December 31, 2017 were as follows (in thousands):
2018 | $ | 1,125 | |
2019 | 1,154 | ||
2020 | 205,392 | ||
2021 | — | ||
2022 | 11,200 | ||
Thereafter | 700,000 | ||
Subtotal | 918,871 | ||
Less unamortized debt issuance costs | (5,672 | ) | |
Total debt | $ | 913,199 | |
Senior Secured Revolving Credit Facility — In March 2015, we terminated our prior credit facility, replacing it with the new credit facility described below. As a result of the termination, we recorded a write-off of unamortized debt issue costs of $5.3 million during the three months ended March 31, 2015. The write-off was recorded in the loss on early retirement of long-term debt line in our Consolidated Statements of Operations.
In March 2015, we entered into a credit agreement, as amended on January 4, 2017 and as described below (as amended, the "Credit Agreement"), pursuant to which the lenders provided us with a senior secured revolving credit facility in the amount of up to $450 million (the "Credit Facility"). Under the Credit Agreement, we have the right to request an increase of the aggregate commitments under the Credit Facility by up to $200 million, which we may request to be made available as either term loans or revolving loans, without the consent of any lenders not participating in such increase, subject to specified conditions. The Credit Facility is available for the issuance of up to $75 million of letters of credit and up to $100 million of swing line loans.
In connection with the execution of the Credit Agreement, we paid certain arrangement fees of approximately $4.8 million to lenders and other fees of approximately $2.5 million, which were capitalized and will be amortized to interest expense over the remaining term of the facility.
F-20
On January 4, 2017, we amended the Credit Agreement to, among other things, (i) extend the maturity date of the Credit Facility to January 4, 2022; (ii) modify the leverage ratio covenant to add a requirement that we comply with a maximum total net leverage ratio (which, for purposes of calculating indebtedness, excludes borrowings under our receivables securitization facility) not to exceed 4.25 to 1.00 and to eliminate the maximum senior secured net leverage ratio requirement; (iii) modify the definition of “Consolidated EBITDA” to permit certain pro forma cost savings add-backs in connection with permitted acquisitions and dispositions; (iv) modify the definition of “Applicable Rate” to reduce the interest rate margins such that loans outstanding under the Credit Facility will bear interest, at our option, at either (x) the LIBO Rate (as defined in the Credit Agreement) plus a margin of between 1.75% and 2.50% (2.00% as of December 31, 2017) based on our total net leverage ratio (as defined in the Credit Agreement), or (y) the Alternate Base Rate (as defined in the Credit Agreement) plus a margin of between 0.75% and 1.50% (1.00% as of December 31, 2017) based on our total net leverage ratio; (v) modify certain negative covenants to provide additional flexibility for the incurrence of debt, the payment of dividends and the making of certain permitted acquisitions and other investments; (vi) eliminate and release all real property as collateral for loans under the Credit Facility; and (vii) provide the Company the ability to request that increases in the aggregate commitments under the Credit Facility be made available as either revolving loans or term loans.
In connection with the execution of the amendment to the Credit Agreement, we paid certain arrangement fees of approximately $0.7 million to lenders and other fees of approximately $0.3 million, which were capitalized and will be amortized to interest expense over the remaining term of the facility. Additionally, we wrote off $0.9 million of unamortized deferred financing costs in connection with this amendment.
We may make optional prepayments of the loans under the Credit Facility, in whole or in part, without premium or penalty (other than applicable breakage costs). Subject to certain exceptions and conditions described in the Credit Agreement, we will be obligated to prepay the Credit Facility, but without a corresponding commitment reduction, with the net cash proceeds of certain asset sales and with casualty insurance proceeds. The Credit Facility is guaranteed by our existing and future domestic material restricted subsidiaries (as defined in the Credit Agreement), which are substantially all of our wholly-owned U.S. subsidiaries other than the receivables securitization facility subsidiaries (the "Guarantors").
The Credit Facility is secured by a first priority perfected security interest in substantially all of our assets and the assets of the Guarantors, whether consisting of personal, tangible or intangible property, including a pledge of, and a perfected security interest in, (i) all of the shares of capital stock of the Guarantors and (ii) 65% of the shares of capital stock of our and the Guarantors' first-tier foreign subsidiaries that are material restricted subsidiaries, in each case subject to certain exceptions as set forth in the Credit Agreement. The collateral does not include, among other things, (a) any of our real property, (b) the capital stock and any assets of any unrestricted subsidiary, (c) any capital stock of any direct or indirect subsidiary of Dean Holding Company ("Legacy Dean"), a wholly owned subsidiary of the Company, which owns any real property, or (d) receivables sold pursuant to the receivables securitization facility.
The Credit Agreement contains customary representations, warranties and covenants, including, but not limited to specified restrictions on indebtedness, liens, guarantee obligations, mergers, acquisitions, consolidations, liquidations and dissolutions, sales of assets, leases, payment of dividends and other restricted payments during a default or non-compliance with the financial covenants, investments, loans and advances, transactions with affiliates and sale and leaseback transactions. The Credit Agreement also contains customary events of default and related cure provisions. We are required to comply with (a) a maximum total net leverage ratio of 4.25x (which, for purposes of calculating indebtedness, excludes borrowings under our receivables securitization facility); and (b) a minimum consolidated interest coverage ratio of 2.25x. In addition, the Credit Agreement imposes certain restrictions on our ability to pay dividends and make other restricted payments if our total net leverage ratio (including borrowings under our receivables securitization facility) is in excess of 3.50x.
At December 31, 2017, we had outstanding borrowings of $11.2 million under the Credit Facility. Our average daily balance under the Credit Facility during the year ended December 31, 2017 was $2.2 million. There were no letters of credit issued under the Credit Facility as of December 31, 2017.
Dean Foods Receivables Securitization Facility — We have a $450 million receivables securitization facility pursuant to which certain of our subsidiaries sell their accounts receivable to two wholly-owned entities intended to be bankruptcy-remote. The entities then transfer the receivables to third-party asset-backed commercial paper conduits sponsored by major financial institutions. The assets and liabilities of these two entities are fully reflected in our Consolidated Balance Sheets, and the securitization is treated as a borrowing for accounting purposes. In June 2014, the receivables securitization facility was modified to, among other things, increase the amount available for the issuance of letters of credit from $300 million to $350 million and to extend the liquidity termination date from March 2015 to June 2017. The receivables securitization facility was further amended in August 2014 to be consistent with the amended financial covenants under the credit agreement governing our previous credit facility.
F-21
In March 2015, the receivables securitization facility was further modified to, among other things, extend the liquidity termination date from June 2017 to March 2018 and modify the covenants to be consistent with those contained in the Credit Agreement described above.
In connection with the modification of the receivables securitization facility, we paid certain arrangement fees of approximately $0.7 million to lenders, which were capitalized and will be amortized to interest expense over the remaining term of the facility.
On January 4, 2017, we amended the purchase agreement governing the receivables securitization facility to, among other things, (i) extend the liquidity termination date to January 4, 2020, (ii) reduce the maximum size of the receivables securitization facility to $450 million, (iii) replace the senior secured net leverage ratio with a total net leverage ratio to be consistent with the amended leverage ratio covenant under the amended Credit Agreement described above, and (iv) modify certain pricing terms such that advances outstanding under the receivables securitization facility will bear interest between 0.90% and 1.05%, and the Company will pay an unused fee between 0.40% and 0.55% on undrawn amounts, in each case based on the Company's total net leverage ratio.
In connection with the amendment to the receivables purchase agreement, we paid certain arrangement fees of approximately $0.6 million to lenders and other fees of approximately $0.1 million, which were capitalized and will be amortized to interest expense over the remaining term of the facility. Additionally, we wrote off $0.2 million of unamortized deferred financing costs in connection with the amendment.
The receivables purchase agreement contains covenants consistent with those contained in the Credit Agreement.
Based on the monthly borrowing base formula, we had the ability to borrow up to the full $450.0 million commitment amount under the receivables securitization facility as of December 31, 2017. The total amount of receivables sold to these entities as of December 31, 2017 was $638.3 million. During the year ended December 31, 2017, we borrowed $2.5 billion and repaid $2.4 billion under the facility with a remaining balance of $205.0 million as of December 31, 2017. In addition to letters of credit in the aggregate amount of $108.7 million that were issued but undrawn, the remaining available borrowing capacity was $136.3 million at December 31, 2017. Our average daily balance under this facility during the year ended December 31, 2017 was $81.6 million. The receivables securitization facility bears interest at a variable rate based upon commercial paper and one-month LIBO rates plus an applicable margin based on our total net leverage ratio.
Dean Foods Company Senior Notes due 2023 — On February 25, 2015, we issued $700 million in aggregate principal amount of 6.50% senior notes due 2023 (the "2023 Notes") at an issue price of 100% of the principal amount of the 2023 Notes in a private placement for resale to “qualified institutional buyers” as defined in Rule 144A under the Securities Act of 1933, as amended (the "Securities Act"), and in offshore transactions pursuant to Regulation S under the Securities Act.
In connection with the issuance of the 2023 Notes, we paid certain arrangement fees of approximately $7.0 million to initial purchasers and other fees of approximately $1.8 million, which were deferred and netted against the outstanding debt balance, and will be amortized to interest expense over the remaining term of the 2023 Notes.
The 2023 Notes are our senior unsecured obligations. Accordingly, the 2023 Notes rank equally in right of payment with all of our existing and future senior obligations and are effectively subordinated in right of payment to all of our existing and future secured obligations, including obligations under our Credit Facility and receivables securitization facility, to the extent of the value of the collateral securing such obligations. The 2023 Notes are fully and unconditionally guaranteed on a senior unsecured basis, jointly and severally, by our subsidiaries that guarantee obligations under the Credit Facility.
The 2023 Notes will mature on March 15, 2023 and bear interest at an annual rate of 6.50%. Interest on the 2023 Notes is payable semi-annually in arrears in March and September of each year.
We may, at our option, redeem all or a portion of the 2023 Notes at any time on or after March 15, 2018 at the applicable redemption prices specified in the indenture governing the 2023 Notes (the "Indenture"), plus any accrued and unpaid interest to, but excluding, the applicable redemption date. We are also entitled to redeem up to 40% of the aggregate principal amount of the 2023 Notes before March 15, 2018 with the net cash proceeds that we receive from certain equity offerings at a redemption price equal to 106.5% of the principal amount of the 2023 Notes, plus accrued and unpaid interest, if any, to, but excluding, the applicable redemption date. In addition, prior to March 15, 2018, we may redeem all or a portion of the 2023 Notes, at a redemption price equal to 100% of the principal amount thereof, plus a “make-whole” premium and accrued and unpaid interest, if any, to, but excluding, the applicable redemption date.
F-22
If we undergo certain kinds of changes of control, holders of the 2023 Notes have the right to require us to repurchase all or any portion of such holder’s 2023 Notes at 101% of the principal amount of the notes being repurchased, plus any accrued and unpaid interest to, but excluding, the date of repurchase.
The Indenture contains covenants that, among other things, limit our ability to: (i) create certain liens; (ii) enter into sale and lease-back transactions; (iii) assume, incur or guarantee indebtedness for borrowed money that is secured by a lien on certain principal properties (or on any shares of capital stock of our subsidiaries that own such principal properties) without securing the 2023 Notes on a pari passu basis; and (iv) consolidate with or merge with or into, or sell, transfer, convey or lease all or substantially all of our properties and assets, taken as a whole, to another person.
We used the net proceeds from the 2023 Notes to redeem all of our outstanding senior unsecured notes due 2016, as described below, and to repay a portion of the outstanding borrowings under our previous senior secured credit facility and receivables securitization facility. The carrying value under the 2023 Notes at December 31, 2017 was $694.3 million, net of unamortized debt issuance costs of $5.7 million.
Standby Letter of Credit — In February 2012, in connection with a litigation settlement agreement we entered into with the plaintiffs in the Tennessee dairy farmer litigation, we issued a standby letter of credit in the amount of $80 million, representing the approximate amount of subsequent payments due under the terms of the settlement agreement. The total amount of the letter of credit decreased proportionately as we made each of the four installment payments. We made installment payments in June of 2013, 2014, 2015, and 2016. As of December 31, 2017, the letter of credit has been reduced to zero as a result of the final annual installment payment of $18.9 million, which we made in June 2016.
Dean Foods Company Senior Notes due 2016 — In March 2015, we redeemed the remaining principal amount of $476.2 million of our outstanding senior notes due 2016 for a total redemption price of approximately $521.8 million. As a result, we recorded a $38.3 million pre-tax loss on early retirement of long-term debt in the first quarter of 2015, which consisted of debt redemption premiums and unpaid interest of $37.3 million, a write-off of unamortized long-term debt issue costs of $0.8 million and a write-off of the remaining bond discount and interest rate swaps of approximately $0.2 million. The loss was recorded in the loss on early retirement of long-term debt line in our Consolidated Statements of Operations. The redemption was financed with proceeds from the issuance of the 2023 Notes.
Subsidiary Senior Notes due 2017 — Legacy Dean had certain senior notes outstanding at the time of its acquisition, of which one series ($142 million aggregate principal amount) matured on October 15, 2017. The indenture governing the Legacy Dean senior notes does not contain financial covenants but does contain certain restrictions, including a prohibition against Legacy Dean and its subsidiaries granting liens on certain of their real property interests and a prohibition against Legacy Dean granting liens on the stock of its subsidiaries. The Legacy Dean senior notes are not guaranteed by Dean Foods Company or Legacy Dean’s wholly-owned subsidiaries.
On October 16, 2017 we repaid in full the $142 million outstanding aggregate principal amount of the senior notes, plus remaining accrued and unpaid interest of $4.9 million, with borrowings from our receivables securitization facility.
See Note 10 for information regarding the fair value of the 2023 Notes and the subsidiary senior notes due 2017 as of December 31, 2017 and 2016.
Capital Lease Obligations and Other — Capital lease obligations of $2.7 million and $4.0 million as of December 31, 2017 and 2016, respectively, were primarily comprised of our leases for information technology equipment. See Note 18.
10. DERIVATIVE FINANCIAL INSTRUMENTS AND FAIR VALUE MEASUREMENTS
Derivative Financial Instruments
Commodities — We are exposed to commodity price fluctuations, including in the prices of raw milk, butterfat, sweeteners and other commodity costs used in the manufacturing, packaging and distribution of our products, such as natural gas, resin and diesel fuel. To secure adequate supplies of materials and bring greater stability to the cost of ingredients and their related manufacturing, packaging and distribution, we routinely enter into forward purchase contracts and other purchase arrangements with suppliers. Under the forward purchase contracts, we commit to purchasing agreed-upon quantities of ingredients and commodities at agreed-upon prices at specified future dates. The outstanding purchase commitment for these commodities at any point in time typically ranges from one month’s to one year’s anticipated requirements, depending on the ingredient or commodity. These contracts are considered normal purchases.
In addition to entering into forward purchase contracts, from time to time we may purchase over-the-counter contracts from our qualified financial institutions or enter into exchange-traded commodity futures contracts for raw materials that are
F-23
ingredients of our products or components of such ingredients. All commodities contracts are marked to market in our income statement at each reporting period and a derivative asset or liability is recorded on our Consolidated Balance Sheet.
Although we may utilize forward purchase contracts and other instruments to mitigate the risks related to commodity price fluctuation, such strategies do not fully mitigate commodity price risk. Adverse movements in commodity prices over the terms of the contracts or instruments could decrease the economic benefits we derive from these strategies. As of December 31, 2017 and 2016, our derivatives recorded at fair value in our Consolidated Balance Sheets were:
Derivative Assets | Derivative Liabilities | ||||||||||||||
December 31, 2017 | December 31, 2016 | December 31, 2017 | December 31, 2016 | ||||||||||||
(In thousands) | |||||||||||||||
Derivatives not designated as Hedging Instruments | |||||||||||||||
Commodities contracts — current(1) | $ | 1,431 | $ | 2,416 | $ | 1,829 | $ | 12 | |||||||
Commodities contracts — non-current(2) | — | — | 15 | — | |||||||||||
Total derivatives | $ | 1,431 | $ | 2,416 | $ | 1,844 | $ | 12 | |||||||
(1) | Derivative assets and liabilities that have settlement dates equal to or less than 12 months from the respective balance sheet date were included in prepaid expenses and other current assets and accounts payable and accrued expenses, respectively, in our Consolidated Balance Sheets. |
(2) | Derivative assets and liabilities that have settlement dates greater than 12 months from the respective balance sheet date were included in identifiable intangible and other assets, net, and other long-term liabilities, respectively, in our Consolidated Balance Sheets. |
Fair Value Measurements
Fair value is an exit price, representing the amount that would be received to sell an asset or paid to transfer a liability in an orderly transaction between market participants. As such, fair value is a market-based measurement that should be determined based on assumptions that market participants would use in pricing an asset or liability. As a basis for considering assumptions, we follow a three-tier fair value hierarchy, which prioritizes the inputs used in measuring fair value as follows:
• | Level 1 — Quoted prices for identical instruments in active markets. |
• | Level 2 — Quoted prices for similar instruments in active markets, quoted prices for identical or similar instruments in markets that are not active and model-derived valuations, in which all significant inputs are observable in active markets. |
• | Level 3 — Unobservable inputs in which there is little or no market data, which require the reporting entity to develop its own assumptions. |
A summary of our derivative assets and liabilities measured at fair value on a recurring basis as of December 31, 2017 is as follows (in thousands):
Fair Value as of December 31, 2017 | Level 1 | Level 2 | Level 3 | ||||||||||||
Assets — Commodities contracts | $ | 1,431 | $ | — | $ | 1,431 | $ | — | |||||||
Liabilities — Commodities contracts | 1,844 | — | 1,844 | — | |||||||||||
F-24
A summary of our derivative assets and liabilities measured at fair value on a recurring basis as of December 31, 2016 is as follows (in thousands):
Fair Value as of December 31, 2016 | Level 1 | Level 2 | Level 3 | ||||||||||||
Assets — Commodities contracts | $ | 2,416 | $ | — | $ | 2,416 | $ | — | |||||||
Liabilities — Commodities contracts | 12 | — | 12 | — | |||||||||||
Due to their near-term maturities, the carrying amounts of accounts receivable and accounts payable are considered equivalent to fair value. In addition, because the interest rates on our Credit Facility, receivables securitization facility, and certain other debt are variable, their fair values approximate their carrying values.
The fair values of our Dean Foods Company senior notes and subsidiary senior notes were determined based on quoted market prices obtained through an external pricing source which derives its price valuations from daily marketplace transactions, with adjustments to reflect the spreads of benchmark bonds, credit risk and certain other variables. We have determined these fair values to be Level 2 measurements as all significant inputs into the quotes provided by our pricing source are observable in active markets. The following table presents the outstanding principal amounts and fair values of the 2023 Notes and subsidiary senior notes at December 31:
2017 | 2016 | ||||||||||||||
Amount Outstanding | Fair Value | Amount Outstanding | Fair Value | ||||||||||||
(In thousands) | |||||||||||||||
Dean Foods Company senior notes due 2023 | $ | 700,000 | $ | 698,250 | $ | 700,000 | $ | 736,750 | |||||||
Subsidiary senior notes due 2017 | — | — | 142,000 | 146,615 | |||||||||||
Additionally, we maintain a Supplemental Executive Retirement Plan (“SERP”), which is a nonqualified deferred compensation arrangement for our executive officers and other employees earning compensation in excess of the maximum compensation that can be taken into account with respect to our 401(k) plan. The SERP is designed to provide these employees with retirement benefits from us that are equivalent, as a percentage of total compensation, to the benefits provided to other employees. The assets related to this plan are primarily invested in money market and mutual funds and are held at fair value. We classify these assets as Level 2 as fair value can be corroborated based on quoted market prices for identical or similar instruments in markets that are not active. The following table presents a summary of the SERP assets measured at fair value on a recurring basis as of December 31, 2017 (in thousands):
Total | Level 1 | Level 2 | Level 3 | ||||||||||||
Money market | $ | 22 | $ | — | $ | 22 | $ | — | |||||||
Mutual funds | 1,785 | — | 1,785 | — | |||||||||||
The following table presents a summary of the SERP assets measured at fair value on a recurring basis as of December 31, 2016 (in thousands):
Total | Level 1 | Level 2 | Level 3 | ||||||||||||
Money market | $ | 27 | $ | — | $ | 27 | $ | — | |||||||
Mutual funds | 1,673 | — | 1,673 | — | |||||||||||
11. COMMON STOCK AND SHARE-BASED COMPENSATION
Our authorized shares of capital stock include one million shares of preferred stock and 250 million shares of common stock with a par value of $0.01 per share.
F-25
Cash Dividends — In accordance with our cash dividend policy, holders of our common stock will receive dividends when and as declared by our Board of Directors. Beginning in 2015, all awards of restricted stock units, performance stock units and phantom shares provide for cash dividend equivalent units, which vest in cash at the same time as the underlying award. Quarterly dividends of $0.09 per share were paid in March, June, September and December of 2017 and 2016, totaling approximately $32.7 million and $32.8 million for each of the years ended December 31, 2017 and 2016, respectively. Quarterly dividends of $0.07 per share were paid in March, June, September and December of 2015, totaling approximately $26.2 million for the year ended December 31, 2015. Our cash dividend policy is subject to modification, suspension or cancellation in any manner and at any time. Dividends are presented as a reduction to retained earnings in our Consolidated Statement of Stockholders’ Equity unless we have an accumulated deficit as of the end of the period, in which case they are reflected as a reduction to additional paid-in capital.
Stock Repurchase Program — Since 1998, our Board of Directors has from time to time authorized the repurchase of our common stock up to an aggregate of $2.38 billion, excluding fees and commissions. We repurchased 1,371,185 shares for $25.0 million during the year ended December 31, 2016.
The following table summarizes the share repurchase activity for the year ended December 31, 2016 (in thousands, except per share data):
Number of shares repurchased | 1,371 | ||
Weighted average purchase price per share | $18.21 | ||
Amount of share repurchases | $ | 25,000 | |
We made no share repurchases during the year ended December 31, 2017. As of December 31, 2017, $197.1 million remained available for repurchases under this program (excluding fees and commissions). Our management is authorized to purchase shares from time to time through open market transactions at prevailing prices or in privately-negotiated transactions, subject to market conditions and other factors. Shares, when repurchased, are retired.
Stock Award Plans — The Dean Foods Company 2016 Stock Incentive Plan (the “2016 Plan”), approved on May 11, 2016, allows grant awards of various types of equity-based compensation, including stock options, stock appreciation rights (‘‘SARs’’), restricted stock and restricted stock units, performance shares and performance units and other types of stock-based awards as compensation to employees, consultants and directors. The maximum number of shares that are available to be awarded under the 2016 Plan is 11,750,000 shares of common stock of the Company and is inclusive of the shares remaining available for issuance under the 2007 Stock Incentive Plan (the "2007 Plan"), which expired upon the 2016 Plan approval.
Any shares subject to any award granted under the 2016 Plan or the 2007 Plan which for any reason expires after the effective date of the 2016 Plan without having been exercised, or is canceled, terminated or otherwise settled without the issuance of stock will again be available for grant under the 2016 Plan. However, to the extent that any options or SARs are exercised by delivering the net value of such award in shares (a so-called ‘‘net exercise’’), the total number of shares for which the option or SAR is exercised, and not just the net number of shares delivered upon such exercise, will be counted as though issued under the 2016 Plan. Additionally, any shares that are canceled or surrendered to satisfy a participant’s applicable tax withholding obligations in respect of any award granted under the 2016 Plan or the 2007 Plan will not again become available for issuance. If any full-value award granted under the 2016 Plan or granted under the 2007 Plan expires without having been exercised, or is canceled, terminated or otherwise settled without the issuance of stock, that number of shares equal to (x) the number of shares subject to such award multiplied by (y) the multiplier applicable under the applicable plan (that is, two shares for each share subject to each such full-value award granted under the 2016 Plan and 1.67 for each full-value award granted under the 2007 Plan) will become available for issuance under the 2016 Plan. If any stock option award granted under the 2016 Plan or the 2007 Plan expires without having been exercised, or is canceled, terminated or otherwise settled without the issuance of stock, there will become available for issuance under the 2016 Plan one share of our common stock for each share of our common stock subject to such stock option award.
As of December 31, 2017, we had approximately 11.7 million shares, in the aggregate, available for grant under the 2016 Plan.
Restricted Stock Units — We issue restricted stock units ("RSUs") to certain senior employees and non-employee directors as part of our long-term incentive program. An RSU represents the right to receive one share of common stock in the future. RSUs have no exercise price. RSUs granted to employees generally vest ratably over three years, subject to certain accelerated vesting provisions based primarily on a change of control, or in certain cases upon death or qualified disability. RSUs granted to non-employee directors vest ratably over three years.
F-26
The following table summarizes RSU activity during the year ended December 31, 2017:
Employees | Directors | Total | |||||||||
RSUs outstanding at January 1, 2017 | 872,785 | 80,207 | 952,992 | ||||||||
RSUs granted | 444,741 | 45,528 | 490,269 | ||||||||
Shares issued upon vesting | (286,365 | ) | (37,794 | ) | (324,159 | ) | |||||
RSUs canceled or forfeited(1) | (485,756 | ) | (2,112 | ) | (487,868 | ) | |||||
RSUs outstanding at December 31, 2017 | 545,405 | 85,829 | 631,234 | ||||||||
Weighted-average per share grant date fair value | $ | 17.90 | $ | 18.46 | $ | 17.98 | |||||
(1) | Pursuant to the terms of our stock unit plans, employees have the option of forfeiting stock units to cover their minimum statutory tax withholding when shares are issued. Any stock units surrendered or canceled in satisfaction of participants’ tax withholding obligations are not available for future grants under the plans. |
The following table summarizes information about our RSU grants and RSU expense during the years ended December 31, 2017, 2016 and 2015 (in thousands, except per share amounts):
Year Ended December 31 | |||||||||||
2017 | 2016 | 2015 | |||||||||
Total intrinsic value of RSUs vested/distributed during the period | $ | 7,960 | $ | 8,920 | $ | 7,958 | |||||
Weighted-average grant date fair value of RSUs granted | 17.91 | 19.13 | 16.41 | ||||||||
Tax benefit related to RSU expense | 2,071 | 1,694 | 2,303 | ||||||||
At December 31, 2017, there was $7.4 million of total unrecognized RSU expense, all of which is related to unvested awards. This compensation expense is expected to be recognized over the weighted-average remaining vesting period of 0.99 years.
Performance Stock Units — In 2016, we began granting performance stock units ("PSUs") as part of our long-term incentive compensation program. PSUs cliff vest and settle in shares of our common stock at the end of a three-year performance period contingent upon the achievement of specific performance goals established for each calendar year during the performance period. The PSUs are deemed granted in three separate one year tranches on the dates in which our Compensation Committee establishes the applicable annual performance goals. The number of shares that may be earned at the end of the vesting period may range from zero to 200 percent of the target award amount based on the achievement of the performance goals. The fair value of PSUs is estimated using the market price of our common stock on the date of grant, and we recognize compensation expense ratably over the vesting period for the portion of the award that is expected to vest. The fair value of the PSUs is remeasured at each reporting period. The following table summarizes PSU activity during year ended December 31, 2017:
PSUs | Weighted Average Grant Date Fair Value | |||||
Outstanding at January 1, 2017 | 90,583 | $ | 19.13 | |||
Granted | 159,102 | 18.82 | ||||
Vested | — | — | ||||
Forfeited | (127,878 | ) | 19.23 | |||
Outstanding at December 31, 2017 | 121,807 | $ | 18.62 | |||
F-27
Phantom Shares — We grant phantom shares as part of our long-term incentive compensation program, which are similar to RSUs in that they are based on the price of our stock and vest ratably over a three-year period, but are cash-settled based upon the value of our stock at each vesting period. The fair value of the awards is remeasured at each reporting period. Compensation expense, which is variable, is recognized over the vesting period with a corresponding liability, which is recorded in accounts payable and accrued expenses in our Consolidated Balance Sheets. The following table summarizes the phantom share activity during the year ended December 31, 2017:
Shares | Weighted- Average Grant Date Fair Value | |||||
Outstanding at January 1, 2017 | 1,361,062 | $ | 17.78 | |||
Granted | 823,683 | 18.14 | ||||
Converted/paid | (637,751 | ) | 17.05 | |||
Forfeited | (224,414 | ) | 18.33 | |||
Outstanding at December 31, 2017 | 1,322,580 | $ | 18.26 | |||
Restricted Stock — We offer our non-employee directors the option to receive certain compensation for services rendered in either cash or shares of restricted stock equal to 150% of the fee amount. Shares of restricted stock vest one-third on grant, one-third on the first anniversary of grant and one-third on the second anniversary of grant. The following table summarizes restricted stock activity during the year ended December 31, 2017:
Shares | Weighted- Average Grant Date Fair Value | |||||
Unvested at January 1, 2017 | 41,750 | $ | 17.61 | |||
Restricted shares granted | 57,571 | 13.89 | ||||
Restricted shares vested | (46,552 | ) | 15.99 | |||
Unvested at December 31, 2017 | 52,769 | $ | 14.97 | |||
Stock Options — We did not grant any stock options during 2015, 2016 or 2017, nor do we plan to in 2018. At December 31, 2017, there was no remaining unrecognized stock option expense related to unvested awards.
Under the terms of our stock option plans, employees and non-employee directors may be granted options to purchase our stock at a price equal to the market price on the date the option is granted.
Prior to 2014, we did not historically declare or pay a regular cash dividend on our common stock. Stock option awards are not impacted by our decision in 2013 to begin paying dividends in 2014.
The following table summarizes stock option activity during the year ended December 31, 2017:
Options | Weighted Average Exercise Price | Weighted Average Contractual Life | Aggregate Intrinsic Value | |||||||||
Options outstanding and exercisable at January 1, 2017 | 2,038,829 | $ | 19.78 | |||||||||
Forfeited and canceled(1) | (1,088,846 | ) | 23.47 | |||||||||
Exercised | (249,516 | ) | 10.91 | |||||||||
Options outstanding and exercisable at December 31, 2017(2) | 700,467 | 17.21 | 1.21 | $ | 158,016 | |||||||
(1) | Pursuant to the terms of our stock option plans, options that are forfeited or canceled may be available for future grants. Effective May 15, 2013, any stock options surrendered or canceled in satisfaction of participants' exercise proceeds or tax withholding obligation will no longer become available for future grants under the plans. |
(2) | As of December 31, 2017, there were no remaining unvested stock options. |
F-28
The following table summarizes information about options outstanding and exercisable at December 31, 2017:
Options Outstanding and Exercisable | ||||||||
Range of Exercise Prices | Number Outstanding | Weighted- Average Remaining Contractual Life (in years) | Weighted- Average Exercise Price | |||||
$8.96 to 10.44 | 88,451 | 3.69 | $ | 9.77 | ||||
12.60 | 69,423 | 2.06 | 12.60 | |||||
13.30 to 16.98 | 74,044 | 1.51 | 15.09 | |||||
17.36 | 222,184 | 1.08 | 17.36 | |||||
17.48 to 21.14 | 23,563 | 0.61 | 18.82 | |||||
21.96 | 221,936 | 0.04 | 21.96 | |||||
24.60 | 866 | 0.09 | 24.60 | |||||
The following table summarizes additional information regarding our stock option activity (in thousands):
Year Ended December 31 | |||||||||||
2017 | 2016 | 2015 | |||||||||
Intrinsic value of options exercised | $ | 427 | $ | 1,372 | $ | 336 | |||||
Fair value of shares vested | — | — | 453 | ||||||||
Tax benefit related to stock option expense | — | — | 34 | ||||||||
During the year ended December 31, 2017, net cash received from stock option exercises was $2.7 million and the total cash benefit for tax deductions to be realized for these option exercises was $0.2 million.
Share-Based Compensation Expense — The following table summarizes the share-based compensation expense related to equity-based awards recognized during the years ended December 31, 2017, 2016 and 2015 (in thousands):
Year Ended December 31 | |||||||||||
2017 | 2016 | 2015 | |||||||||
Stock options | $ | — | $ | — | $ | 88 | |||||
RSUs | 5,969 | 11,053 | 8,407 | ||||||||
PSUs | (2,395 | ) | (1) | 3,601 | — | ||||||
Phantom shares | 7,447 | 15,176 | 7,882 | ||||||||
Total | $ | 11,021 | $ | 29,830 | $ | 16,377 | |||||
(1) | The net credit to PSU expense for the year ended December 31, 2017 is primarily the result of lower expected performance (relative to the established performance metric) associated with the 2017 tranche of these awards and reflects the impact of a mark-to-market adjustment with respect to PSUs granted to certain former executives which will be cash settled following the completion of the performance period based on our stock price. |
F-29
12. EARNINGS (LOSS) PER SHARE
Basic earnings (loss) per share is based on the weighted average number of common shares issued and outstanding during each period. Diluted earnings (loss) per share is based on the weighted average number of common shares issued and outstanding and the effect of all dilutive common stock equivalents outstanding during each period. Stock option conversions and stock units were not included in the computation of diluted loss per share for the year ended December 31, 2015 as we incurred a loss for this period and any effect on loss per share would have been anti-dilutive. The following table reconciles the numerators and denominators used in the computations of both basic and diluted earnings (loss) per share:
Year Ended December 31 | |||||||||||
2017 | 2016 | 2015 | |||||||||
(In thousands, except share data) | |||||||||||
Basic earnings (loss) per share computation: | |||||||||||
Numerator: | |||||||||||
Income (loss) from continuing operations | $ | 47,422 | $ | 120,617 | $ | (8,081 | ) | ||||
Denominator: | |||||||||||
Average common shares | 90,899,284 | 90,933,886 | 93,298,467 | ||||||||
Basic earnings (loss) per share from continuing operations | $ | 0.52 | $ | 1.33 | $ | (0.09 | ) | ||||
Diluted earnings (loss) per share computation: | |||||||||||
Numerator: | |||||||||||
Income (loss) from continuing operations | $ | 47,422 | $ | 120,617 | $ | (8,081 | ) | ||||
Denominator: | |||||||||||
Average common shares — basic | 90,899,284 | 90,933,886 | 93,298,467 | ||||||||
Stock option conversion(1) | 119,284 | 246,116 | — | ||||||||
RSUs and PSUs(2) | 255,426 | 330,481 | — | ||||||||
Average common shares — diluted | 91,273,994 | 91,510,483 | 93,298,467 | ||||||||
Diluted earnings (loss) per share from continuing operations | $ | 0.52 | $ | 1.32 | $ | (0.09 | ) | ||||
(1) Anti-dilutive common shares excluded | 880,541 | 1,262,158 | 2,933,770 | ||||||||
(2) Anti-dilutive stock units excluded | 442,047 | — | 340,398 | ||||||||
13. ACCUMULATED OTHER COMPREHENSIVE LOSS
The changes in accumulated other comprehensive loss by component, net of tax, during the year ended December 31, 2017 were as follows (in thousands):
Pension and Other Postretirement Benefits Items | Foreign Currency Items | Total | |||||||||
Balance, December 31, 2016 | $ | (84,852 | ) | $ | (4,781 | ) | $ | (89,633 | ) | ||
Other comprehensive income before reclassifications | 17,740 | — | 17,740 | ||||||||
Amounts reclassified from accumulated other comprehensive loss | (6,517 | ) | (1) | — | (6,517 | ) | |||||
Net current-period other comprehensive income | 11,223 | — | 11,223 | ||||||||
Balance, December 31, 2017 | $ | (73,629 | ) | $ | (4,781 | ) | $ | (78,410 | ) | ||
(1) | The accumulated other comprehensive loss reclassification components are related to amortization of unrecognized actuarial losses and prior service costs, both of which are included in the computation of net periodic pension cost. See Notes 14 and 15. |
F-30
The changes in accumulated other comprehensive income (loss) by component, net of tax, during the year ended December 31, 2016 were as follows (in thousands):
Pension and Other Postretirement Benefits Items | Foreign Currency Items | Total | |||||||||
Balance, December 31, 2015 | $ | (83,279 | ) | $ | (2,524 | ) | $ | (85,803 | ) | ||
Other comprehensive income (loss) before reclassifications | 4,284 | (2,257 | ) | 2,027 | |||||||
Amounts reclassified from accumulated other comprehensive loss | (5,857 | ) | (1) | — | (5,857 | ) | |||||
Net current-period other comprehensive loss | (1,573 | ) | (2,257 | ) | (3,830 | ) | |||||
Balance, December 31, 2016 | $ | (84,852 | ) | $ | (4,781 | ) | $ | (89,633 | ) | ||
(1) | The accumulated other comprehensive loss reclassification components are related to amortization of unrecognized actuarial losses and prior service costs, both of which are included in the computation of net periodic pension cost. See Notes 14 and 15. |
14. EMPLOYEE RETIREMENT AND PROFIT SHARING PLANS
We sponsor various defined benefit and defined contribution retirement plans, including various employee savings and profit sharing plans, and contribute to various multiemployer pension plans on behalf of our employees. Substantially all full-time union and non-union employees who have completed one or more years of service and have met other requirements pursuant to the plans are eligible to participate in one or more of these plans. During 2017, 2016 and 2015, our retirement and profit sharing plan expenses were as follows:
Year Ended December 31 | |||||||||||
2017 | 2016 | 2015 | |||||||||
(In thousands) | |||||||||||
Defined benefit plans | $ | 6,717 | $ | 6,805 | $ | 6,594 | |||||
Defined contribution plans | 19,562 | 19,078 | 16,498 | ||||||||
Multiemployer pension and certain union plans | 29,231 | 30,073 | 29,930 | ||||||||
Total | $ | 55,510 | $ | 55,956 | $ | 53,022 | |||||
Defined Benefit Plans — The benefits under our defined benefit plans are based on years of service and employee compensation. Our funding policy is to contribute annually the minimum amount required under Employee Retirement Income Security Act regulations plus additional amounts as we deem appropriate.
Included in accumulated other comprehensive loss at December 31, 2017 and 2016 are the following amounts that have not yet been recognized in net periodic pension cost: unrecognized prior service costs of $2.6 million ($1.6 million net of tax) and $2.1 million ($1.3 million net of tax), respectively, and unrecognized actuarial losses of $122.1 million ($74.4 million net of tax) and $141.5 million ($87.4 million net of tax), respectively. Prior service costs and actuarial losses included in accumulated other comprehensive income (loss) and expected to be recognized in net periodic pension cost during the year ending December 31, 2018 are $0.4 million ($0.3 million net of tax) and $8.5 million ($6.3 million net of tax), respectively.
F-31
The reconciliation of the beginning and ending balances of the projected benefit obligation and the fair value of plan assets for the years ended December 31, 2017 and 2016, and the funded status of the plans at December 31, 2017 and 2016 are as follows:
December 31 | |||||||
2017 | 2016 | ||||||
(In thousands) | |||||||
Change in benefit obligation: | |||||||
Benefit obligation at beginning of year | $ | 338,733 | $ | 333,975 | |||
Service cost | 3,007 | 3,173 | |||||
Interest cost | 11,709 | 12,171 | |||||
Plan amendments | 1,233 | — | |||||
Actuarial (gain) loss | 19,921 | 11,578 | |||||
Benefits paid | (24,819 | ) | (21,407 | ) | |||
Plan settlements | — | (757 | ) | ||||
Benefit obligation at end of year | 349,784 | 338,733 | |||||
Change in plan assets: | |||||||
Fair value of plan assets at beginning of year | 282,183 | 282,753 | |||||
Actual return on plan assets | 48,038 | 16,105 | |||||
Employer contributions | 39,358 | 5,489 | |||||
Benefits paid | (24,819 | ) | (21,407 | ) | |||
Plan settlements | — | (757 | ) | ||||
Fair value of plan assets at end of year | 344,760 | 282,183 | |||||
Funded status at end of year | $ | (5,024 | ) | $ | (56,550 | ) | |
The underfunded status of the plans of $5.0 million at December 31, 2017 is recognized in our Consolidated Balance Sheet and includes $5.1 million classified as a noncurrent pension asset, $9.2 million classified as a noncurrent pension liability, and $0.9 million classified as a current accrued pension liability. We do not expect any plan assets to be returned to us during the year ending December 31, 2018. We do not currently expect to make any contributions to the pension plans in 2018.
A summary of our key actuarial assumptions used to determine benefit obligations as of December 31, 2017 and 2016 follows:
December 31 | |||||
2017 | 2016 | ||||
Weighted average discount rate | 3.69 | % | 4.29 | % | |
Rate of compensation increase | 3.70 | % | 3.70 | % | |
F-32
A summary of our key actuarial assumptions used to determine net periodic benefit cost for 2017, 2016 and 2015 follows:
Year Ended December 31 | ||||||||
2017 | 2016 | 2015 | ||||||
Effective discount rate for benefit obligations | 4.29 | % | 4.53 | % | 4.08 | % | ||
Effective rate for interest on benefit obligations | 3.56 | % | 3.76 | % | 4.08 | % | ||
Effective discount rate for service cost | 4.51 | % | 4.67 | % | 4.08 | % | ||
Effective rate for interest on service cost | 3.91 | % | 4.14 | % | 4.08 | % | ||
Expected return on assets | 6.25 | % | 6.75 | % | 7.00 | % | ||
Rate of compensation increase | 3.70 | % | 4.00 | % | 4.00 | % | ||
Year Ended December 31 | |||||||||||
2017 | 2016 | 2015 | |||||||||
(In thousands) | |||||||||||
Components of net periodic benefit cost: | |||||||||||
Service cost | $ | 3,007 | $ | 3,173 | $ | 3,631 | |||||
Interest cost | 11,709 | 12,171 | 13,736 | ||||||||
Expected return on plan assets | (19,030 | ) | (18,531 | ) | (20,026 | ) | |||||
Amortizations: | |||||||||||
Prior service cost | 706 | 857 | 856 | ||||||||
Unrecognized net loss | 10,325 | 8,822 | 8,544 | ||||||||
Effect of settlement | — | 313 | — | ||||||||
Other | — | — | (147 | ) | |||||||
Net periodic benefit cost | $ | 6,717 | $ | 6,805 | $ | 6,594 | |||||
The overall expected long-term rate of return on plan assets is a weighted-average expectation based on the targeted and expected portfolio composition. We consider historical performance and current benchmarks to arrive at expected long-term rates of return in each asset category.
The amortization of unrecognized net loss represents the amortization of investment losses incurred. The effect of settlement costs in 2017, 2016 and 2015 represents the recognition of net periodic benefit cost related to pension settlements reached as a result of plant closures.
Pension plans with an accumulated benefit obligation in excess of plan assets follows:
December 31 | |||||||
2017 | 2016 | ||||||
(In millions) | |||||||
Projected benefit obligation | $ | 349.8 | $ | 338.7 | |||
Accumulated benefit obligation | 346.0 | 336.3 | |||||
Fair value of plan assets | 344.8 | 282.2 | |||||
The accumulated benefit obligation for all defined benefit plans was $346.0 million and $336.3 million at December 31, 2017 and 2016, respectively.
Almost 90% of our defined benefit plan obligations are frozen as to future participation or increases in projected benefit obligation. Many of these obligations were acquired in prior strategic transactions. As an alternative to defined benefit plans, we offer defined contribution plans for eligible employees.
At the end of 2015, we changed our approach used to measure service and interest costs for pension and other postretirement benefits. In 2015, we measured service and interest costs utilizing a single weighted-average discount rate derived from the yield curve used to measure the plan obligations. In 2016, we elected to measure service and interest costs by applying the specific spot rates along that yield curve to the plans’ liability cash flows. We believe the new approach provides a more precise measurement of service and interest costs by aligning the timing of the plans’ liability cash flows to the corresponding spot rates on the yield curve. This change does not affect the measurement of our plan obligations but generally results in lower pension expense in
F-33
periods when the yield curve is upward sloping. We have accounted for this change as a change in accounting estimate and, accordingly, have accounted for it on a prospective basis starting in 2016.
Substantially all of our qualified pension plans are consolidated into one master trust. Our investment objectives are to minimize the volatility of the value of our pension assets relative to our pension liabilities and to ensure assets are sufficient to pay plan benefits. In 2014, we adopted a broad pension de-risking strategy intended to align the characteristics of our assets relative to our liabilities. The strategy targets investments depending on the funded status of the obligation. We anticipate this strategy will continue in future years and will be dependent upon market conditions and plan characteristics.
At December 31, 2017, our master trust was invested as follows: investments in equity securities were at 30%; investments in fixed income were at 70%; and cash equivalents were less than 1%. We believe the allocation of our master trust investments as of December 31, 2017 is generally consistent with the targets set forth by our Investment Committee.
Estimated pension plan benefit payments to participants for the next ten years are as follows:
2018 | $ | 18.3 | million |
2019 | 18.6 | million | |
2020 | 19.1 | million | |
2021 | 19.9 | million | |
2022 | 20.4 | million | |
Next five years | 104.8 | million | |
Fair value is an exit price, representing the amount that would be received to sell an asset or paid to transfer a liability in an orderly transaction between market participants. As such, fair value is a market-based measurement that should be determined based on assumptions that market participants would use in pricing an asset or liability. As a basis for considering assumptions, we follow a three-tier fair value hierarchy, which prioritizes the inputs used in measuring fair value of our defined benefit plans’ consolidated assets as follows:
• | Level 1 — Quoted prices for identical instruments in active markets. |
• | Level 2 — Quoted prices for similar instruments in active markets, quoted prices for identical or similar instruments in markets that are not active and model-derived valuations, in which all significant inputs are observable in active markets. |
• | Level 3 — Unobservable inputs in which there is little or no market data, which require the reporting entity to develop its own assumptions. |
F-34
The fair values by category of inputs as of December 31, 2017 were as follows (in thousands):
Fair Value as of December 31, 2017 | Level 1 | Level 2 | Level 3 | ||||||||||||
Equity Securities: | |||||||||||||||
Common Stock | $ | 364 | $ | 364 | $ | — | $ | — | |||||||
Index Funds: | |||||||||||||||
U.S. Equities(a) | 98,759 | — | 98,759 | — | |||||||||||
Equity Funds(b) | 7,675 | — | 7,675 | — | |||||||||||
Total Equity Securities | 106,798 | 364 | 106,434 | — | |||||||||||
Fixed Income: | |||||||||||||||
Bond Funds(c) | 233,628 | — | 233,628 | — | |||||||||||
Diversified Funds(d) | 2,700 | — | — | 2,700 | |||||||||||
Total Fixed Income | 236,328 | — | 233,628 | 2,700 | |||||||||||
Cash Equivalents: | |||||||||||||||
Short-term Investment Funds(e) | 1,634 | — | 1,634 | — | |||||||||||
Total Cash Equivalents | 1,634 | — | 1,634 | — | |||||||||||
Total | $ | 344,760 | $ | 364 | $ | 341,696 | $ | 2,700 | |||||||
(a) | Represents a pooled/separate account that tracks the Dow Jones U.S. Total Stock Market Index. |
(b) | Represents a pooled/separate account comprised of approximately 90% U.S. large-cap stocks and 10% international stocks. |
(c) | Represents investments primarily in U.S. dollar-denominated, investment grade bonds, including government securities, corporate bonds, and mortgage- and asset-backed securities. |
(d) | Represents a pooled/separate account investment in the General Investment Account of an investment manager. The account primarily invests in fixed income debt securities, such as high grade corporate bonds, government bonds and asset-backed securities. |
(e) | Investment is comprised of high grade money market instruments with short-term maturities and high liquidity. |
F-35
The fair values by category of inputs as of December 31, 2016 were as follows (in thousands):
Fair Value as of December 31, 2016 | Level 1 | Level 2 | Level 3 | ||||||||||||
Equity Securities: | |||||||||||||||
Common Stock | $ | 275 | $ | 275 | $ | — | $ | — | |||||||
Index Funds: | |||||||||||||||
U.S. Equities(a) | 112,329 | — | 112,329 | — | |||||||||||
Equity Funds(b) | 6,204 | — | 6,204 | — | |||||||||||
Total Equity Securities | 118,808 | 275 | 118,533 | — | |||||||||||
Fixed Income: | |||||||||||||||
Bond Funds(c) | 157,361 | — | 157,361 | — | |||||||||||
Diversified Funds(d) | 3,930 | — | — | 3,930 | |||||||||||
Total Fixed Income | 161,291 | — | 157,361 | 3,930 | |||||||||||
Cash Equivalents: | |||||||||||||||
Short-term Investment Funds(e) | 1,921 | — | 1,921 | — | |||||||||||
Total Cash Equivalents | 1,921 | — | 1,921 | — | |||||||||||
Other Investments: | |||||||||||||||
Partnerships/Joint Ventures(f) | 163 | — | — | 163 | |||||||||||
Total Other Investments | 163 | — | — | 163 | |||||||||||
Total | $ | 282,183 | $ | 275 | $ | 277,815 | $ | 4,093 | |||||||
(a) | Represents a pooled/separate account that tracks the Dow Jones U.S. Total Stock Market Index. |
(b) | Represents a pooled/separate account comprised of approximately 90% U.S. large-cap stocks and 10% international stocks. |
(c) | Represents investments primarily in U.S. dollar-denominated, investment grade bonds, including government securities, corporate bonds, and mortgage- and asset-backed securities. |
(d) | Represents a pooled/separate account investment in the General Investment Account of an investment manager. The account primarily invests in fixed income debt securities, such as high grade corporate bonds, government bonds and asset-backed securities. |
(e) | Investment is comprised of high grade money market instruments with short-term maturities and high liquidity. |
(f) | The majority of the total partnership balance is a partnership comprised of a portfolio of two limited partnership funds that invest in public and private equity. |
Inputs and valuation techniques used to measure the fair value of plan assets vary according to the type of security being valued. The common stock investments held directly by the plans are actively traded and fair values are determined based on quoted prices in active markets and are therefore classified as Level 1 inputs in the fair value hierarchy.
Fair values of equity securities held through units of pooled or index funds are based on net asset value of the units of the funds as determined by the fund manager. These funds are similar in nature to retail mutual funds, but are typically more efficient for institutional investors than retail mutual funds. The fair value of pooled funds is determined by the value of the underlying assets held by the fund and the units outstanding. The values of the pooled funds are not directly observable, but are based on observable inputs and, accordingly, have been classified as Level 2 in the fair value hierarchy.
Fair values of fixed income bond funds are typically determined by reference to the values of similar securities traded in the marketplace and current interest rate levels. Multiple pricing services are typically employed to assist in determining these valuations. These investments are classified as Level 2 in the fair value hierarchy as all significant inputs into the valuation are readily observable in the marketplace. Investments in diversified funds and investments in partnerships/joint ventures are classified as Level 3 in the fair value hierarchy as their fair value is dependent on inputs and assumptions which are not readily observable in the marketplace.
F-36
A reconciliation of the change in the fair value measurement of the defined benefit plans’ consolidated assets using significant unobservable inputs (Level 3) during the years ended December 31, 2017 and 2016 is as follows (in thousands):
Diversified Funds | Partnerships/ Joint Ventures | Total | |||||||||
Balance at December 31, 2015 | $ | 3,929 | $ | 273 | $ | 4,202 | |||||
Actual return on plan assets: | |||||||||||
Relating to instruments still held at reporting date | 115 | (18 | ) | 97 | |||||||
Purchases, sales and settlements (net) | (114 | ) | (92 | ) | (206 | ) | |||||
Balance at December 31, 2016 | $ | 3,930 | $ | 163 | $ | 4,093 | |||||
Actual return on plan assets: | |||||||||||
Relating to instruments still held at reporting date | 97 | — | 97 | ||||||||
Relating to instruments sold during the period | — | (1 | ) | (1 | ) | ||||||
Purchases, sales and settlements (net) | (1,849 | ) | — | (1,849 | ) | ||||||
Transfers in and/or out of Level 3 | 522 | (162 | ) | 360 | |||||||
Balance at December 31, 2017 | $ | 2,700 | $ | — | $ | 2,700 | |||||
Defined Contribution Plans — Certain of our non-union personnel may elect to participate in savings and profit sharing plans sponsored by us. These plans generally provide for salary reduction contributions to the plans on behalf of the participants of between 1% and 50% of a participant’s annual compensation and provide for employer matching and profit sharing contributions as determined by our Board of Directors. In addition, certain union hourly employees are participants in company-sponsored defined contribution plans, which provide for salary reduction contributions according to several schedules, including as a percentage of salary, various cents per hour and flat dollar amounts. Additionally, employer contributions are sometimes, although not always, provided according to various schedules ranging from flat dollar contributions to matching contributions as a percent of salary based on the employees deferral election.
Multiemployer Pension Plans — Certain of our subsidiaries contribute to various multiemployer pension and other postretirement benefit plans which cover a majority of our full-time union employees and certain of our part-time union employees. Such plans are usually administered by a board of trustees composed of labor representatives and the management of the participating companies. The risks of participating in these multiemployer plans are different from single-employer plans in the following aspects:
• | Assets contributed to a multiemployer plan by one employer may be used to provide benefits to employees of other participating employers; |
• | If a participating employer stops contributing to the plan, the unfunded obligations of the plan may be borne by the remaining participating employers; and |
• | If we choose to stop participating in one or more of our multiemployer plans, we may be required to pay those plans an amount based on the underfunded status of the plan, referred to as a withdrawal liability. |
F-37
Our participation in these multiemployer plans for the year ended December 31, 2017 is outlined in the table below. Unless otherwise noted, the most recent Pension Protection Act (“PPA”) Zone Status available in 2017 and 2016 is for the plans’ year-end at December 31, 2016 and December 31, 2015, respectively. The zone status is based on information that we obtained from each plan’s Form 5500, which is available in the public domain and is certified by the plan’s actuary. Among other factors, plans in the red zone are in "critical" or "critical and declining" status and generally less than 65% funded, plans in the yellow zone are in "endangered" status and less than 80% funded, and plans in the green zone are in "healthy" status and at least 80% funded. The “FIP/RP Status Pending/Implemented” column indicates plans for which a funding improvement plan (“FIP”) or a rehabilitation plan (“RP”) is either pending or has been implemented. Federal law requires that plans classified in the yellow zone or red zone adopt a funding improvement plan or rehabilitation plan, respectively, in order to improve the financial health of the plan. The “Extended Amortization Provisions” column indicates plans which have elected to utilize the special 30-year amortization rules provided by the Pension Relief Act of 2010 to amortize its losses from 2008 as a result of turmoil in the financial markets. The last column in the table lists the expiration date(s) of the collective-bargaining agreement(s) to which the plans are subject.
Pension Fund | Employer Identification Number | Pension Plan Number | PPA Zone Status | FIP / RP Status Pending/ Implemented | Extended Amortization Provisions | Expiration Date of Associated Collective- Bargaining Agreement(s) | |||||||
2017 | 2016 | ||||||||||||
Western Conference of Teamsters Pension Plan(1) | 91-6145047 | 001 | Green | Green | N/A | No | January 1, 2018 - August 31, 2020 | ||||||
Central States, Southeast and Southwest Areas Pension Plan(2) | 36-6044243 | 001 | Red | Red | Implemented | No | February 18, 2018 - August 31, 2020 | ||||||
Retail, Wholesale & Department Store International Union and Industry Pension Fund(3) | 63-0708442 | 001 | Green | Green | N/A | Yes | June 7, 2018 - October 3, 2020 | ||||||
Dairy Industry – Union Pension Plan for Philadelphia Vicinity(4) | 23-6283288 | 001 | Yellow | Green | (5) | N/A | Yes | March 31, 2018 - October 31, 2020 | |||||
(1) | We are party to approximately thirteen collective bargaining agreements that require contributions to this plan. These agreements cover a large number of employee participants and expire on various dates between 2018 and 2020. The agreement expiring in March 2019 is the most significant as 32% of our employee participants in this plan are covered by that agreement. |
(2) | There are approximately 20 collective bargaining agreements that govern our participation in this plan. The agreements expire on various dates between 2018 and 2020. Approximately 47%, 29%, and 24% of our employee participants in this plan are covered by the agreements expiring in 2018, 2019, and 2020 respectively. |
(3) | We are subject to approximately eight collective bargaining agreements with respect to this plan. Approximately 54%, 2%, and 44% of our employee participants in this plan are covered by the agreements expiring in 2018, 2019, and 2020 respectively. |
(4) | We are party to four collective bargaining agreements with respect to this plan. The agreement expiring in September 2020 is the most significant as 63% of our employee participants in this plan are covered by that agreement. |
(5) The most recent PPA Zone Status available in 2016 was for the plan's year-end at December 31, 2015. As of December 31, 2015, the estimated funding ratio of the plan was 80.8%. As of January 1, 2016, the actuary reported that the estimated funding ratio of the plan was 79.56%, and that the plan was certified to be in endangered status. A notice of endangered status was provided to the plan’s participants and beneficiaries, bargaining parties, the Pension Benefit Guaranty Corporation, and the Department of Labor. At the date of filing for the Annual Report on Form 10-K for the year ended December 31, 2016, Forms 5500 were not available for the plan year ended in 2016.
F-38
Information regarding our contributions to our multiemployer pension plans is shown in the table below. There are no changes that materially affected the comparability of our contributions to each of these plans during the years ended December 31, 2017, 2016 and 2015.
Pension Fund | Employer Identification Number | Pension Plan Number | Dean Foods Company Contributions (in millions) | ||||||||||||||
2017 | 2016 | 2015 | Surcharge Imposed(3) | ||||||||||||||
Western Conference of Teamsters Pension Plan | 91-6145047 | 001 | $ | 13.2 | $ | 13.8 | $ | 12.8 | No | ||||||||
Central States, Southeast and Southwest Areas Pension Plan | 36-6044243 | 001 | 9.5 | 8.6 | 9.3 | No | |||||||||||
Retail, Wholesale & Department Store International Union and Industry Pension Fund(1) | 63-0708442 | 001 | 1.3 | 1.8 | 1.3 | No | |||||||||||
Dairy Industry – Union Pension Plan for Philadelphia Vicinity(1) | 23-6283288 | 001 | 2.1 | 1.9 | 2.1 | No | |||||||||||
Other Funds(2) | 3.1 | 4.0 | 4.4 | ||||||||||||||
Total Contributions | $ | 29.2 | $ | 30.1 | $ | 29.9 | |||||||||||
(1) | During the 2016 and 2015 plan years, our contributions to these plans exceeded 5% of total plan contributions. At the date of filing of this Annual Report on Form 10-K, Forms 5500 were not available for the plan years ending in 2017. |
(2) | Amounts shown represent our contributions to all other multiemployer pension and other postretirement benefit plans, which are immaterial both individually and in the aggregate to our Consolidated Financial Statements. |
(3) | Federal law requires that contributing employers to a plan in Critical status pay to the plan a surcharge to help correct the plan’s financial situation. The amount of the surcharge is equal to a percentage of the amount we would otherwise be required to contribute to the plan and ceases once our related collective bargaining agreements are amended to comply with the provisions of the rehabilitation plan. |
15. POSTRETIREMENT BENEFITS OTHER THAN PENSIONS
Certain of our subsidiaries provide health care benefits to certain retirees who are covered under specific group contracts. As defined by the specific group contract, qualified covered associates may be eligible to receive major medical insurance with deductible and co-insurance provisions subject to certain lifetime maximums.
Included in accumulated other comprehensive loss at December 31, 2017 and 2016 are the following amounts that have not yet been recognized in net periodic benefit cost: unrecognized prior service costs of $0.4 million ($0.3 million net of tax) and $0.5 million ($0.3 million net of tax), respectively, and unrecognized actuarial losses of $4.6 million ($3.4 million net of tax) and $6.7 million ($4.1 million net of tax), respectively. The prior service cost and actuarial loss included in accumulated other comprehensive income (loss) and expected to be recognized in net periodic benefit cost during the year ending December 31, 2018 is $0.1 million ($0.1 million net of tax) and $0.5 million ($0.3 million net of tax), respectively.
F-39
The following table sets forth the funded status of these plans:
December 31 | |||||||
2017 | 2016 | ||||||
(In thousands) | |||||||
Change in benefit obligation: | |||||||
Benefit obligation at beginning of year | $ | 30,122 | $ | 32,132 | |||
Service cost | 586 | 640 | |||||
Interest cost | 960 | 1,085 | |||||
Employee contributions | 256 | 338 | |||||
Actuarial (gain) loss | 1,622 | (1,916 | ) | ||||
Benefits paid | (1,680 | ) | (2,157 | ) | |||
Benefit obligation at end of year | 31,866 | 30,122 | |||||
Fair value of plan assets at end of year | — | — | |||||
Funded status | $ | (31,866 | ) | $ | (30,122 | ) | |
The unfunded portion of the liability of $31.9 million at December 31, 2017 is recognized in our Consolidated Balance Sheet and includes $2.2 million classified as a current accrued postretirement liability.
A summary of our key actuarial assumptions used to determine the benefit obligation as of December 31, 2017 and 2016 follows:
December 31 | |||||
2017 | 2016 | ||||
Healthcare inflation: | |||||
Healthcare cost trend rate assumed for next year | 6.72 | % | 7.00 | % | |
Rate to which the cost trend rate is assumed to decline (ultimate trend rate) | 4.50 | % | 4.50 | % | |
Year of ultimate rate achievement | 2038 | 2038 | |||
Weighted average discount rate | 3.53 | % | 3.97 | % | |
A summary of our key actuarial assumptions used to determine net periodic benefit cost follows:
Year Ended December 31 | ||||||||
2017 | 2016 | 2015 | ||||||
Healthcare inflation: | ||||||||
Healthcare cost trend rate assumed for next year | 7.00 | % | 7.27 | % | 7.70 | % | ||
Rate to which the cost trend rate is assumed to decline (ultimate trend rate) | 4.50 | % | 4.50 | % | 4.50 | % | ||
Year of ultimate rate achievement | 2038 | 2038 | 2029 | |||||
Effective discount rate for benefit obligations | 3.97 | % | 4.27 | % | 3.85 | % | ||
Effective rate for interest on benefit obligations | 3.32 | % | 3.52 | % | 3.85 | % | ||
Effective discount rate for service cost | 4.44 | % | 4.68 | % | 3.85 | % | ||
Effective rate for interest on service cost | 4.08 | % | 4.37 | % | 3.85 | % | ||
At the end of 2015, we changed our approach used to measure service and interest costs for pension and other postretirement benefits. In 2015, we measured service and interest costs utilizing a single weighted-average discount rate derived from the yield curve used to measure the plan obligations. In 2016, we elected to measure service and interest costs by applying the specific spot rates along that yield curve to the plans’ liability cash flows. We believe the new approach provides a more precise measurement of service and interest costs by aligning the timing of the plans’ liability cash flows to the corresponding spot rates on the yield curve. This change does not affect the measurement of our plan obligations but generally results in lower pension expense in periods when the yield curve is upward sloping. We have accounted for this change as a change in accounting estimate and, accordingly, have accounted for it on a prospective basis starting in 2016.
F-40
Year Ended December 31 | |||||||||||
2017 | 2016 | 2015 | |||||||||
(In thousands) | |||||||||||
Components of net periodic benefit cost: | |||||||||||
Service and interest cost | $ | 1,545 | $ | 1,725 | $ | 2,276 | |||||
Amortizations: | |||||||||||
Prior service cost | 92 | 92 | 92 | ||||||||
Unrecognized net (gain) loss | (457 | ) | (245 | ) | 63 | ||||||
Net periodic benefit cost | $ | 1,180 | $ | 1,572 | $ | 2,431 | |||||
Assumed health care cost trend rates have a significant effect on the amounts reported for the health care plans. A one percent change in assumed health care cost trend rates would have the following effects:
1-Percentage- Point Increase | 1-Percentage- Point Decrease | ||||||
(In thousands) | |||||||
Effect on total of service and interest cost components | $ | 214 | $ | (177 | ) | ||
Effect on postretirement obligation | 1,982 | (3,489 | ) | ||||
We expect to contribute $2.2 million to the postretirement health care plans in 2018. Estimated postretirement health care plan benefit payments for the next ten years are as follows:
2018 | $ | 2.2 | million |
2019 | 2.3 | million | |
2020 | 2.4 | million | |
2021 | 2.3 | million | |
2022 | 2.4 | million | |
Next five years | 11.3 | million | |
16. ASSET IMPAIRMENT CHARGES AND FACILITY CLOSING AND REORGANIZATION COSTS
Asset Impairment Charges
We evaluate our finite-lived intangible and long-lived assets for impairment when circumstances indicate that the carrying value may not be recoverable. Indicators of impairment could include, among other factors, significant changes in the business environment, the planned closure of a facility, or deteriorations in operating cash flows. Considerable management judgment is necessary to evaluate the impact of operating changes and to estimate future cash flows.
Testing the assets for recoverability involves developing estimates of future cash flows directly associated with, and that are expected to arise as a direct result of, the use and eventual disposition of the assets. Other inputs are based on assessment of an individual asset’s alternative use within other production facilities, evaluation of recent market data and historical liquidation sales values for similar assets. As the inputs for testing recoverability are largely based on management’s judgments and are not generally observable in active markets, we consider such measurements to be Level 3 measurements in the fair value hierarchy. See Note 10.
The results of our 2017 impairment analysis indicated an impairment of our property, plant, and equipment at three of our production facilities, totaling $27.8 million. The impairments were the result of declines in operating cash flows at these production facilities on both a historical and forecasted basis. In addition, we recorded a write-down of certain corporate assets in connection with our enterprise-wide cost productivity plan totaling $2.9 million. These impairment charges were recorded during the year ended December 31, 2017.
For the year ended December 31, 2016, the results of our analysis indicated no impairment of our property, plant and equipment, outside of facility closing and reorganization costs.
We can provide no assurance that we will not have impairment charges in future periods as a result of changes in our business environment, operating results or the assumptions and estimates utilized in our impairment tests.
F-41
Facility Closing and Reorganization Costs
Costs associated with approved plans within our ongoing network optimization strategies are summarized as follows:
Year Ended December 31 | |||||||||||
2017 | 2016 | 2015 | |||||||||
(In thousands) | |||||||||||
Closure of facilities, net(1) | $ | 12,703 | $ | 8,719 | $ | 19,844 | |||||
Organizational Effectiveness(2) | 12,210 | — | — | ||||||||
Facility closing and reorganization costs, net | $ | 24,913 | $ | 8,719 | $ | 19,844 | |||||
(1) | Reflects charges, net of gains on the sales of assets, associated with closed facilities that were incurred in 2017, 2016 and 2015. These charges are primarily related to facility closures in Richmond, Virginia; Orem, Utah; New Orleans, Louisiana; Rochester, Indiana; Riverside, California; Delta, Colorado; Denver, Colorado; Springfield, Virginia; Buena Park, California; and Sheboygan, Wisconsin, as well as other approved closures. We have incurred net charges to date of $62.3 million related to these facility closures through December 31, 2017. We expect to incur additional charges related to these facility closures of approximately $9.4 million related to shutdown, contract termination and other costs. As we continue the evaluation of our supply chain and distribution network, it is likely that we will close additional facilities in the future. |
(2) | During 2017, we initiated a company-wide, multi-phase organizational effectiveness assessment to better align each key function of the Company with our strategic plan. This initiative has resulted in headcount reductions due to changes to our organizational structure, and the charges shown in the table above are primarily comprised of severance benefits and other employee-related costs associated with these organizational changes. We do not expect to incur any material additional costs associated with this initiative. |
Activity for 2017 and 2016 with respect to facility closing and reorganization costs is summarized below and includes items expensed as incurred:
Accrued Charges at December 31, 2015 | Charges and Adjustments | Payments | Accrued Charges at December 31, 2016 | Charges and Adjustments | Payments | Accrued Charges at December 31, 2017 | |||||||||||||||||||||
(In thousands) | |||||||||||||||||||||||||||
Cash charges: | |||||||||||||||||||||||||||
Workforce reduction costs | $ | 5,476 | $ | 409 | $ | (2,275 | ) | $ | 3,610 | $ | 14,033 | $ | (11,780 | ) | $ | 5,863 | |||||||||||
Shutdown costs | — | 3,043 | (3,043 | ) | — | 3,792 | (3,792 | ) | — | ||||||||||||||||||
Lease obligations after shutdown | 5,286 | 350 | (1,704 | ) | 3,932 | 1,021 | (2,347 | ) | 2,606 | ||||||||||||||||||
Other | — | 882 | (882 | ) | — | 318 | (318 | ) | — | ||||||||||||||||||
Subtotal | $ | 10,762 | 4,684 | $ | (7,904 | ) | $ | 7,542 | 19,164 | $ | (18,237 | ) | $ | 8,469 | |||||||||||||
Other charges (gains): | |||||||||||||||||||||||||||
Write-down of assets(1) | 7,979 | 5,602 | |||||||||||||||||||||||||
(Gain) loss on sale of related assets | (3,963 | ) | 138 | ||||||||||||||||||||||||
Other, net | 19 | 9 | |||||||||||||||||||||||||
Subtotal | 4,035 | 5,749 | |||||||||||||||||||||||||
Total | $ | 8,719 | $ | 24,913 | |||||||||||||||||||||||
(1) | The write-down of assets relates primarily to owned buildings, land and equipment of those facilities identified for closure. The assets were tested for recoverability at the time the decision to close the facilities was more likely than not to occur. Over time, refinements to our estimates used in testing for recoverability may result in additional asset write-downs. The write-down of assets can include accelerated depreciation recorded for those facilities identified for closure. Our methodology for testing the recoverability of the assets is consistent with the methodology described in the “Asset Impairment Charges” section above. |
F-42
17. SUPPLEMENTAL CASH FLOW INFORMATION
Year Ended December 31 | |||||||||||
2017 | 2016 | 2015 | |||||||||
(In thousands) | |||||||||||
Cash paid for interest and financing charges, net of capitalized interest | $ | 60,403 | $ | 60,580 | $ | 49,593 | |||||
Net cash paid (received) for taxes | (3,063 | ) | 50,630 | (29,157 | ) | ||||||
Non-cash additions to property, plant and equipment, including capital leases | 8,879 | 4,748 | 10,129 | ||||||||
18. COMMITMENTS AND CONTINGENCIES
Contingent Obligations Related to Divested Operations — We have divested certain businesses in recent years. In each case, we have retained certain known contingent obligations related to those businesses and/or assumed an obligation to indemnify the purchasers of the businesses for certain unknown contingent liabilities, including environmental liabilities. We believe that we have established adequate reserves, which are immaterial to the financial statements, for potential liabilities and indemnifications related to our divested businesses. Moreover, we do not expect any liability that we may have for these retained liabilities, or any indemnification liability, to materially exceed amounts accrued.
Contingent Obligations Related to Milk Supply Arrangements — On December 21, 2001, in connection with our acquisition of Legacy Dean, we purchased Dairy Farmers of America’s (“DFA”) 33.8% interest in our operations. In connection with that transaction, we issued a contingent, subordinated promissory note to DFA in the original principal amount of $40 million. The promissory note has a 20-year term that bears interest based on the consumer price index. Interest will not be paid in cash but will be added to the principal amount of the note annually, up to a maximum principal amount of $96 million. We may prepay the note in whole or in part at any time, without penalty. The note will only become payable if we materially breach or terminate one of our related milk supply agreements with DFA without renewal or replacement. Otherwise, the note will expire in 2021, without any obligation to pay any portion of the principal or interest. Payments made under the note, if any, would be expensed as incurred. We have not terminated, and we have not materially breached, any of our milk supply agreements with DFA related to the promissory note. We have previously terminated unrelated supply agreements with respect to several plants that were supplied by DFA. In connection with our continued focus on cost control and increased supply chain efficiency, we continue to evaluate our sources of raw milk supply.
Insurance — We use a combination of insurance and self-insurance for a number of risks, including property, workers’ compensation, general liability, automobile liability, product liability and employee health care utilizing high deductibles. Deductibles vary due to insurance market conditions and risk. Liabilities associated with these risks are estimated considering historical claims experience and other actuarial assumptions. Based on current information, we believe that we have established adequate reserves to cover these claims. At December 31, 2017 and 2016, we recorded accrued liabilities related to these retained risks of $152.6 million and $154.3 million, respectively, including both current and long-term liabilities.
Lease and Purchase Obligations — We lease certain property, plant and equipment used in our operations under both capital and operating lease agreements. Such leases, which are primarily for machinery, equipment and vehicles, including our distribution fleet, have lease terms ranging from one to 20 years. Certain of the operating lease agreements require the payment of additional rentals for maintenance, along with additional rentals based on miles driven or units produced. Certain leases require us to guarantee a minimum value of the leased asset at the end of the lease. Our maximum exposure under those guarantees is not a material amount. Rent expense was $135.4 million, $127.3 million and $125.5 million for 2017, 2016 and 2015, respectively.
F-43
The net book value of assets under capital leases, which are included in property, plant and equipment in our Consolidated Balance Sheets, are as follows:
Year Ended December 31 | |||||||
2017 | 2016 | ||||||
(In thousands) | |||||||
Machinery and equipment | $ | 5,619 | $ | 5,832 | |||
Less accumulated depreciation | (2,948 | ) | (1,852 | ) | |||
Net book value of assets under capital leases | $ | 2,671 | $ | 3,980 | |||
Future minimum payments at December 31, 2017 under non-cancelable capital leases and operating leases with terms in excess of one year are summarized below:
Capital Leases | Operating Leases | ||||||
(In thousands) | |||||||
2018 | $ | 1,199 | $ | 104,321 | |||
2019 | 1,219 | 90,274 | |||||
2020 | 398 | 70,538 | |||||
2021 | — | 52,766 | |||||
2022 | — | 39,066 | |||||
Thereafter | — | 87,116 | |||||
Total minimum lease payments | 2,816 | $ | 444,081 | ||||
Less amount representing interest | (145 | ) | |||||
Present value of capital lease obligations | $ | 2,671 | |||||
We have entered into various contracts, in the normal course of business, obligating us to purchase minimum quantities of raw materials used in our production and distribution processes, including conventional raw milk, diesel fuel, sugar and other ingredients that are inputs into our finished products. We enter into these contracts from time to time to ensure a sufficient supply of raw ingredients. In addition, we have contractual obligations to purchase various services that are part of our production process.
Litigation, Investigations and Audits — On August 9, 2007, two plaintiffs filed a putative class action antitrust complaint against Dean Foods and other milk processors in the United States District Court for the Eastern District of Tennessee. Plaintiffs alleged generally that we, either acting alone or in conjunction with others in the milk industry, lessened competition in the Southeastern United States for the sale of processed fluid Grade A milk to retail outlets and other customers. Plaintiffs further alleged that the defendants’ conduct artificially inflated wholesale prices paid by direct milk purchasers. On January 25, 2016, the district court denied plaintiffs’ motion for class certification. On February 8, 2016, plaintiffs filed a petition for permission to appeal the district court’s order denying class certification. That petition was denied by the Sixth Circuit on June 14, 2016. Although the courts refused to certify the case as a class action, the two original plaintiffs decided to pursue their individual claims for damages. The case was scheduled for trial on March 28, 2017. Prior to trial, the plaintiffs agreed with us to settle the lawsuit. We agreed to pay settlements to the plaintiffs and the parties resolved all outstanding claims in the litigation and agreed to voluntarily dismiss the litigation. The litigation was dismissed on March 21, 2017 with respect to one plaintiff, and on March 26, 2017 with respect to the other plaintiff. We recorded a charge and a corresponding liability in connection with the settlements in the first quarter of 2017.
In addition to the legal proceeding described above, we are party from time to time to certain claims, litigations, audits and investigations. Potential liabilities associated with these other matters are not expected to have a material adverse impact on our financial position, results of operations, or cash flows.
F-44
19. SEGMENT, GEOGRAPHIC AND CUSTOMER INFORMATION
We operate as a single reportable segment in manufacturing, marketing, selling and distributing a wide variety of branded and private label dairy and dairy case products. We operate 65 manufacturing facilities which are geographically located largely based on local and regional customer needs and other market factors. We manufacture, market and distribute a wide variety of branded and private label dairy case products, including fluid milk, ice cream, cultured dairy products, creamers, ice cream mix and other dairy products to retailers, distributors, foodservice outlets, educational institutions and governmental entities across the United States. Our products are primarily delivered through what we believe to be one of the most extensive refrigerated direct-to-store delivery systems in the United States.
Approximate net revenue from external customers for each group of similar products for fiscal 2017, 2016, and 2015 consisted of the following:
Year Ended December 31, | |||||||||||
2017 | 2016 | 2015 | |||||||||
(in millions) | |||||||||||
Fluid milk | $ | 5,316 | $ | 5,339 | $ | 5,728 | |||||
Ice cream(1) | 1,108 | 1,041 | 965 | ||||||||
Fresh cream(2) | 389 | 359 | 358 | ||||||||
Extended shelf life and other dairy products(3) | 196 | 231 | 250 | ||||||||
Cultured | 282 | 299 | 319 | ||||||||
Other beverages(4) | 291 | 308 | 343 | ||||||||
Other(5) | 213 | 133 | 159 | ||||||||
Total | $ | 7,795 | $ | 7,710 | $ | 8,122 | |||||
(1) | Includes ice cream, ice cream mix and ice cream novelties. |
(2) | Includes half-and-half and whipping creams. |
(3) | Includes creamers and other extended shelf life fluids. |
(4) | Includes fruit juice, fruit flavored drinks, iced tea and water. |
(5) | Includes items for resale such as butter, cheese, eggs and milkshakes. |
Our Chief Executive Officer evaluates the performance of our business based on sales and operating income or loss before gains and losses on the sale of businesses, facility closing and reorganization costs, litigation settlements, impairments of long-lived assets and other non-recurring gains and losses.
F-45
All results herein have been recast to present results on a comparable basis. These changes had no impact on consolidated net sales and operating income. The amounts in the following tables include our operating results and are obtained from reports used by our executive management team and do not include any allocated income taxes or management fees. There are no significant non-cash items reported in segment profit or loss other than depreciation and amortization.
Year Ended December 31, | |||||||||||
2017 | 2016 | 2015 | |||||||||
(in thousands) | |||||||||||
Operating income: | |||||||||||
Dean Foods | $ | 138,843 | $ | 272,387 | $ | 223,115 | |||||
Facility closing and reorganization costs, net | (24,913 | ) | (8,719 | ) | (19,844 | ) | |||||
Impairment of intangible and long-lived assets | (30,668 | ) | — | (109,910 | ) | ||||||
Total | 83,262 | 263,668 | 93,361 | ||||||||
Other (income) expense: | |||||||||||
Interest expense | 64,961 | 66,795 | 66,813 | ||||||||
Loss on early retirement of debt | — | — | 43,609 | ||||||||
Other income, net | (2,942 | ) | (5,778 | ) | (3,751 | ) | |||||
Consolidated income (loss) from continuing operations before income taxes | $ | 21,243 | $ | 202,651 | $ | (13,310 | ) | ||||
Geographic Information — Net sales related to our foreign operations comprised less than 1% of our consolidated net sales during the years ended December 31, 2017, 2016 and 2015. None of our long-lived assets are associated with our foreign operations.
Significant Customers — Our largest customer accounted for approximately 17.5%, 16.7%, and 16.4% of our consolidated net sales in 2017, 2016 and 2015, respectively.
20. QUARTERLY RESULTS OF OPERATIONS (unaudited)
The following is a summary of our unaudited quarterly results of operations for 2017 and 2016:
Quarter | |||||||||||||||
First | Second | Third | Fourth | ||||||||||||
(In thousands, except share and per share data) | |||||||||||||||
2017 | |||||||||||||||
Net sales | $ | 1,995,686 | $ | 1,926,722 | $ | 1,937,620 | $ | 1,934,997 | |||||||
Gross profit | 462,125 | 467,380 | 441,740 | 446,432 | |||||||||||
Income (loss) from continuing operations(1) | (9,759 | ) | 17,647 | (9,973 | ) | 49,507 | |||||||||
Net income (loss)(2) | (9,759 | ) | 17,647 | 1,382 | 52,318 | ||||||||||
Earnings (loss) per common share from continuing operations(3): | |||||||||||||||
Basic | (0.11 | ) | 0.19 | (0.11 | ) | 0.54 | |||||||||
Diluted | (0.11 | ) | 0.19 | (0.11 | ) | 0.54 | |||||||||
F-46
Quarter | |||||||||||||||
First | Second | Third | Fourth | ||||||||||||
(In thousands, except share and per share data) | |||||||||||||||
2016 | |||||||||||||||
Net sales | $ | 1,878,828 | $ | 1,848,788 | $ | 1,964,601 | $ | 2,018,009 | |||||||
Gross profit | 504,068 | 493,253 | 488,775 | 501,420 | |||||||||||
Income from continuing operations | 39,201 | 33,371 | 14,526 | 33,519 | |||||||||||
Net income(4) | 39,201 | 33,371 | 14,526 | 32,831 | |||||||||||
Earnings per common share from continuing operations (3): | |||||||||||||||
Basic | 0.43 | 0.37 | 0.16 | 0.37 | |||||||||||
Diluted | 0.43 | 0.36 | 0.16 | 0.37 | |||||||||||
(1) | Income from continuing operations for the first, second, third and fourth quarters of 2017 includes facility closing and reorganization costs, net of tax and gains on sales of assets, of $5.7 million, $3.6 million, $4.8 million and $1.2 million, respectively. See Note 16. Additionally, results for the first quarter of 2017 include a charge due to litigation settlements and the related legal expenses. See Note 18. The results for the third and fourth quarters of 2017 include impairments of our property, plant and equipment totaling $25.0 million and $5.7 million, respectively. See Note 16. The results for the fourth quarter of 2017 include a one-time income tax benefit of $43.7 million associated with the December 22, 2017 enactment of the Tax Cuts and Jobs Act. See Note 8. |
(2) | Net income for the third quarter of 2017 include net gains from discontinued operations of $11.4 million. See Note 2. |
(3) | Earnings (loss) per common share calculations for each of the quarters were based on the basic and diluted weighted average number of shares outstanding for each quarter. The sum of the quarters may not necessarily be equal to the full year earnings (loss) per common share amount. |
(4) | The results for the first, second, third and fourth quarters of 2016 include facility closing and reorganization costs, net of tax and gains on sales of assets, of $0.7 million, $(0.9) million, $5.7 million and $(0.2) million, respectively. See Note 16. The results for the third quarter of 2016 include a separation charge of $10.1 million in connection with the Company's CEO succession plan. See “Part I — Item 1. Business — Developments Since January 1, 2017.” |
F-47
REPORT OF INDEPENDENT REGISTERED PUBLIC ACCOUNTING FIRM
To the stockholders and the Board of Directors of Dean Foods Company
Opinion on the Financial Statements
We have audited the accompanying consolidated balance sheets of Dean Foods Company and subsidiaries (the "Company") as of December 31, 2017 and 2016, the related consolidated statements of operations, comprehensive income (loss), stockholders' equity, and cash flows for each of the three years in the period ended December 31, 2017, and the related notes and the schedule listed in the Index at Item 15 (collectively referred to as the “financial statements”). In our opinion, the financial statements present fairly, in all material respects, the financial position of the Company as of December 31, 2017 and 2016, and the results of its operations and its cash flows for each of the three years in the period ended December 31, 2017, in conformity with accounting principles generally accepted in the United States of America.
We have also audited, in accordance with the standards of the Public Company Accounting Oversight Board (PCAOB) (United States), the Company's internal control over financial reporting as of December 31, 2017, based on the criteria established in Internal Control - Integrated Framework (2013) issued by the Committee of Sponsoring Organizations of the Treadway Commission and our report dated February 26, 2018 expressed an unqualified opinion on the Company's internal control over financial reporting.
Basis of Opinion
These financial statements are the responsibility of the Company's management. Our responsibility is to express an opinion on the Company’s financial statements based on our audits. We are a public accounting firm registered with the PCAOB and are required to be independent with respect to the Company in accordance with the U.S. federal securities laws and the applicable rules and regulations of the Securities and Exchange Commission and the PCAOB.
We conducted our audits in accordance with the standards of the PCAOB. Those standards require that we plan and perform the audit to obtain reasonable assurance about whether the financial statements are free of material misstatement, whether due to error or fraud. Our audits included performing procedures to assess the risks of material misstatement of the financial statements, whether due to error or fraud, and performing procedures that respond to those risks. Such procedures included examining, on a test basis, evidence regarding the amounts and disclosures in the financial statements. Our audits also include evaluating the accounting principles used and significant estimates made by management, as well as evaluating the overall presentation of the financial statements. We believe that our audits provide a reasonable basis for our opinion.
/s/ DELOITTE & TOUCHE LLP
Dallas, Texas
February 26, 2018
We have served as the Company’s auditor since 1988.
F-48
Item 9. | Changes in and Disagreements with Accountants on Accounting and Financial Disclosure |
None.
Item 9A. | Controls and Procedures |
Evaluation of Disclosure Controls and Procedures
We conducted an evaluation of the effectiveness of the design and operation of our disclosure controls and procedures (as defined in Rules 13a-15(e) and 15d-15(e) of the Exchange Act, referred to herein as “Disclosure Controls”) as of the end of the period covered by this Annual Report on Form 10-K. The controls evaluation was done under the supervision and with the participation of management, including our Chief Executive Officer (CEO) and Interim Chief Financial Officer (CFO). Based upon our most recent controls evaluation, our CEO and Interim CFO have concluded that our Disclosure Controls were effective as of December 31, 2017.
Changes in Internal Control over Financial Reporting
There have been no changes in our internal control over financial reporting (as defined in Rules 13a-15(f) and 15d-15(f) under the Exchange Act) in the quarter ended December 31, 2017 that have materially affected, or are reasonably likely to materially affect, our internal control over financial reporting.
MANAGEMENT REPORT ON INTERNAL CONTROL OVER FINANCIAL REPORTING
Our management is responsible for establishing and maintaining adequate internal control over financial reporting. Our internal control system was designed to provide reasonable assurance to our management and Board of Directors regarding the preparation and fair presentation of published financial statements.
All internal control systems, no matter how well designed, have inherent limitations. Therefore, even those systems determined to be effective can provide only reasonable assurance with respect to financial statement preparation and presentation.
We have assessed the effectiveness of our internal control over financial reporting as of December 31, 2017. In making this assessment, we used the criteria established in Internal Control — Integrated Framework (2013) issued by the Committee of Sponsoring Organizations of the Treadway Commission (COSO). Based on our assessment, management believes that, as of December 31, 2017, our internal control over financial reporting is effective based on those criteria.
Our independent auditors, Deloitte & Touche LLP, a registered public accounting firm, are appointed by the Audit Committee of our Board of Directors. Deloitte & Touche LLP has audited and reported on the consolidated financial statements of Dean Foods Company and subsidiaries and our internal control over financial reporting. The reports of our independent auditors are contained in this Annual Report on Form 10-K.
Our independent registered public accounting firm has issued an audit report on our internal control over financial reporting. This report appears on page 44.
February 26, 2018
43
REPORT OF INDEPENDENT REGISTERED PUBLIC ACCOUNTING FIRM
To the stockholders and the Board of Directors of Dean Foods Company
Opinion on Internal Controls over Financial Reporting
We have audited the internal control over financial reporting of Dean Foods Company and subsidiaries (the "Company") as of December 31, 2017, based on criteria established in Internal Control - Integrated Framework (2013) issued by the Committee of Sponsoring Organizations of the Treadway Commission (COSO). In our opinion, the Company maintained, in all material respects, effective internal control over financial reporting as of December 31, 2017, based on criteria established in Internal Control - Integrated Framework (2013) issued by COSO.
We have also audited, in accordance with the standards of the Public Company Accounting Oversight Board (United States) (PCAOB), the consolidated financial statements as of and for the year ended December 31, 2017, of the Company and our report dated February 26, 2018, expressed an unqualified opinion on those financial statements.
Basis for Opinion
The Company's management is responsible for maintaining effective internal control over financial reporting and for its assessment of the effectiveness of internal control over financial reporting, included in the accompanying Management Report on Internal Control over Financial Reporting. Our responsibility is to express an opinion on the Company's internal control over financial reporting based on our audit. We are a public accounting firm registered with the PCAOB and are required to be independent with respect to the Company in accordance with the U.S. federal securities laws and the applicable rules and regulations of the Securities Exchange Commission and the PCAOB.
We conducted our audit in accordance with the standards of the PCAOB. Those standards require that we plan and perform the audit to obtain reasonable assurance about whether effective internal control over financial reporting was maintained in all material respects. Our audit included obtaining an understanding of internal control over financial reporting, assessing the risk that a material weakness exists, testing and evaluating the design and operating effectiveness of internal control based on the assessed risk, and performing such other procedures as we considered necessary in the circumstances. We believe that our audit provides a reasonable basis for our opinion.
Definition and Limitations of Internal Control over Financial Reporting
A company's internal control over financial reporting is a process designed to provide reasonable assurance regarding the reliability of financial reporting and the preparation of financial statements for external purposes in accordance with generally accepted accounting principles. A company's internal control over financial reporting includes those policies and procedures that (1) pertain to the maintenance of records that, in reasonable detail, accurately and fairly reflect the transactions and dispositions of the assets of the company; (2) provide reasonable assurance that transactions are recorded as necessary to permit preparation of financial statements in accordance with generally accepted accounting principles, and that receipts and expenditures of the company are being made only in accordance with authorizations of management and directors of the company; and (3) provide reasonable assurance regarding prevention or timely detection of unauthorized acquisition, use, or disposition of the company's assets that could have a material effect on the financial statements.
Because of its inherent limitations, internal control over financial reporting may not prevent of detect misstatements. Also, projections of any evaluation of effectiveness to future periods are subject to the risk that the controls may become inadequate because of changes in conditions, or that the degree of compliance with the policies or procedures may deteriorate.
/s/ DELOITTE & TOUCHE LLP
Dallas, Texas
February 26, 2018
44
PART III
Item 10. | Directors, Executive Officers and Corporate Governance |
Incorporated herein by reference to our proxy statement (to be filed) for our 2018 Annual Meeting of Stockholders not later than 120 days after the end of the fiscal year covered by this report.
Item 11. | Executive Compensation |
Incorporated herein by reference to our proxy statement (to be filed) for our 2018 Annual Meeting of Stockholders not later than 120 days after the end of the fiscal year covered by this report.
Item 12. | Security Ownership of Certain Beneficial Owners and Management and Related Stockholder Matters |
Incorporated herein by reference to our proxy statement (to be filed) for our 2018 Annual Meeting of Stockholders not later than 120 days after the end of the fiscal year covered by this report.
Item 13. | Certain Relationships and Related Transactions, and Director Independence |
Incorporated herein by reference to our proxy statement (to be filed) for our 2018 Annual Meeting of Stockholders not later than 120 days after the end of the fiscal year covered by this report.
Item 14. | Principal Accountant Fees and Services |
Incorporated herein by reference to our proxy statement (to be filed) for our 2018 Annual Meeting of Stockholders not later than 120 days after the end of the fiscal year covered by this report.
45
PART IV
Item 15. | Exhibits and Financial Statement Schedules |
Financial Statements
The following Consolidated Financial Statements are filed as part of this Form 10-K or are incorporated herein as indicated:
Page | |
Financial Statement Schedule | |
Exhibits | |
See Index to Exhibits | |
46
Item 16. | Form 10-K Summary |
Not applicable.
47
INDEX TO EXHIBITS
Exhibit No. | Description | Previously Filed as an Exhibit to and Incorporated by Reference From | Date Filed | |||
Quarterly Report on Form 10-Q for the quarter ended September 30, 2013 | November 12, 2013 | |||||
Quarterly Report on Form 10-Q for the quarter ended June 30, 2012 | August 7, 2012 | |||||
Quarterly Report on Form 10-Q for the quarter ended September 30, 2013 | November 12, 2013 | |||||
Current Report on Form 8-K | May 20, 2014 | |||||
Quarterly Report on Form 10-Q for the quarter ended September 30, 2017 | November 8, 2017 | |||||
Current Report on Form 8-K | August 15, 2013 | |||||
Current Report on Form 8-K | March 3, 2015 | |||||
Current Report on Form 8-K | March 3, 2015 | |||||
Annual Report on Form 10-K for the year ended December 31, 2006 | March 1, 2007 | |||||
Annual Report on Form 10-K for the year ended December 31, 2006 | March 1, 2007 | |||||
Annual Report on Form 10-K for the year ended December 31, 2006 | March 1, 2007 | |||||
Annual Report on Form 10-K for the year ended December 31, 2006 | March 1, 2007 | |||||
Annual Report on Form 10-K for the year ended December 31, 2006 | March 1, 2007 | |||||
Annual Report on Form 10-K for the year ended December 31, 2016 | February 22, 2017 | |||||
Quarterly Report on Form 10-Q for the quarter ended September 30, 2017 | November 8, 2017 | |||||
Quarterly Report on Form 10-Q for the quarter ended September 30, 2013 | November 12, 2013 | |||||
48
Exhibit No. | Description | Previously Filed as an Exhibit to and Incorporated by Reference From | Date Filed | |||
Quarterly Report on Form 10-Q for the quarter ended September 30, 2008 (pages 1 through 10 of Exhibit 10.3) | November 5, 2008 | |||||
Quarterly Report on Form 10-Q for the quarter ended March 31, 2012 | May 9, 2012 | |||||
Current Report on Form 8-K | May 20, 2013 | |||||
Current Report on Form 8-K | November 18, 2014 | |||||
Annual Report on Form 10-K for the year ended December 31, 2010 | March 1, 2011 | |||||
Annual Report on Form 10-K for the year ended December 31, 2010 | March 1, 2011 | |||||
Annual Report on Form 10-K for the year ended December 31, 2010 | March 1, 2011 | |||||
Annual Report on Form 10-K for the year ended December 31, 2010 | March 1, 2011 | |||||
Annual Report on Form 10-K for the year ended December 31, 2010 | March 1, 2011 | |||||
Annual Report on Form 10-K for the year ended December 31, 2010 | March 1, 2011 | |||||
Annual Report on Form 10-K for the year ended December 31, 2010 | March 1, 2011 | |||||
Annual Report on Form 10-K for the year ended December 31, 2012 | February 27, 2013 | |||||
Annual Report on Form 10-K for the year ended December 31, 2012 | February 27, 2013 | |||||
Annual Report on Form 10-K for the year ended December 31, 2012 | February 27, 2013 | |||||
Annual Report on Form 10-K for the year ended December 31, 2012 | February 27, 2013 | |||||
Exhibit No. | Description | Previously Filed as an Exhibit to and Incorporated by Reference From | Date Filed | |||
Quarterly Report on Form 10-Q for the quarter ended June 30, 2008 | August 8, 2008 | |||||
Annual Report on Form 10-K for the year ended December 31, 2012 | February 27, 2013 | |||||
Quarterly Report on Form 10-Q for the quarter ended June 30, 2016 | August 8, 2016 | |||||
Quarterly Report on Form 10-Q for the quarter ended September 30, 2016 | November 7, 2016 | |||||
Quarterly Report on Form 10-Q for the quarter ended September 30, 2016 | November 7, 2016 | |||||
Annual Report on Form 10-K for the year ended December 31, 2012 | February 27, 2013 | |||||
Quarterly Report on Form 10-Q for the quarter ended September 30, 2017 | November 8, 2017 | |||||
Current Report on Form 8-K | January 10, 2018 | |||||
Current Report on Form 8-K | January 10, 2018 | |||||
Filed herewith | ||||||
Filed herewith | ||||||
Filed herewith | ||||||
Filed herewith | ||||||
Current Report on Form 8-K | March 27, 2015 | |||||
Exhibit No. | Description | Previously Filed as an Exhibit to and Incorporated by Reference From | Date Filed | |||
Current Report on Form 8-K | January 6, 2017 | |||||
Current Report on Form 8-K | March 27, 2015 | |||||
Annual Report on Form 10-K for the year ended December 31, 2015 | February 22, 2016 | |||||
Current Report on Form 8-K | January 6, 2017 | |||||
Annual Report on Form 10-K for the year ended December 31, 2012 | February 27, 2013 | |||||
Quarterly Report on Form 10-Q for the quarter ended March 31, 2013 | May 9, 2013 | |||||
Current Report on Form 8-K | March 10, 2017 | |||||
Current Report on Form 8-K | May 13, 2016 | |||||
Current Report on Form 8-K | May 13, 2016 | |||||
Exhibit No. | Description | Previously Filed as an Exhibit to and Incorporated by Reference From | Date Filed | |||
Current Report on Form 8-K | May 13, 2016 | |||||
Current Report on Form 8-K | May 13, 2016 | |||||
Current Report on Form 8-K | May 13, 2016 | |||||
Current Report on Form 8-K | March 4, 2016 | |||||
Filed herewith | ||||||
Filed herewith | ||||||
Filed herewith | ||||||
Filed herewith | ||||||
Filed herewith | ||||||
Furnished herewith | ||||||
Furnished herewith | ||||||
101.INS | XBRL Instance Document(1) | |||||
101.SCH | XBRL Taxonomy Extension Schema Document(1) | |||||
101.CAL | XBRL Taxonomy Calculation Linkbase Document(1) | |||||
101.DEF | XBRL Taxonomy Extension Definition Linkbase Document(1) | |||||
101.LAB | XBRL Taxonomy Label Linkbase Document(1) | |||||
101.PRE | XBRL Taxonomy Presentation Linkbase Document(1) | |||||
(1) | Filed electronically herewith |
* | This exhibit is a management or compensatory contract. |
Attached as Exhibit 101 to this report are the following materials from Dean Foods Company’s Annual Report on Form 10-K for the fiscal year ended December 31, 2017, formatted in XBRL (eXtensible Business Reporting Language): (i) the Consolidated Statements of Operations for the years ended December 31, 2017, 2016 and 2015; (ii) the Consolidated Balance Sheets as of December 31, 2017 and 2016; (iii) the Consolidated Statements of Comprehensive Income (Loss) for the years ended December 31, 2017, 2016 and 2015; (iv) the Consolidated Statements of Stockholders’ Equity for the years ended December 31, 2017, 2016 and 2015; (v) the Consolidated Statements of Cash Flows for the years ended December 31, 2017, 2016 and 2015; and (vi) Notes to Consolidated Financial Statements.
SIGNATURES
Pursuant to the requirements of Section 13 or 15(d) of the Securities Exchange Act of 1934, the registrant has duly caused this report to be signed on its behalf by the undersigned, thereunto duly authorized.
DEAN FOODS COMPANY | |
By: | /S/ SCOTT K. VOPNI |
Scott K. Vopni | |
Senior Vice President - Finance, Chief Accounting Officer and Interim Chief Financial Officer | |
Dated February 26, 2018
Pursuant to the requirements of the Securities Exchange Act of 1934, this Report has been signed below by the following persons on behalf of the registrant and in the capacity and on the dates indicated.
Name | Title | Date | ||
/S/ JIM L. TURNER | Chairman of the Board | February 26, 2018 | ||
Jim L. Turner | ||||
/S/ RALPH SCOZZAFAVA | Chief Executive Officer and Director | February 26, 2018 | ||
Ralph Scozzafava | (Principal Executive Officer) | |||
/S/ SCOTT K. VOPNI | Senior Vice President, Finance, | February 26, 2018 | ||
Scott K. Vopni | Chief Accounting Officer and | |||
Interim Chief Financial Officer | ||||
(Principal Financial and | ||||
Accounting Officer) | ||||
/S/ JANET HILL | Director | February 26, 2018 | ||
Janet Hill | ||||
/S/ WAYNE MAILLOUX | Director | February 26, 2018 | ||
Wayne Mailloux | ||||
/S/ HELEN E. MCCLUSKEY | Director | February 26, 2018 | ||
Helen E. McCluskey | ||||
/S/ JOHN R. MUSE | Director | February 26, 2018 | ||
John R. Muse | ||||
/S/ B. CRAIG OWENS | Director | February 26, 2018 | ||
B. Craig Owens | ||||
/S/ ROBERT TENNANT WISEMAN | Director | February 26, 2018 | ||
Robert Tennant Wiseman | ||||
S-1
SCHEDULE II
DEAN FOODS COMPANY AND SUBSIDIARIES
VALUATION AND QUALIFYING ACCOUNTS
Years Ended December 31, 2017, 2016 and 2015
Description | Balance at Beginning of Period | Charged to (Reduction in) Costs and Expenses | Other | Deductions | Balance at End of Period | ||||||||||||||
(In thousands) | |||||||||||||||||||
Year ended December 31, 2017 | |||||||||||||||||||
Allowance for doubtful accounts | $ | 5,118 | $ | 3,610 | $ | 1,099 | $ | (4,244 | ) | $ | 5,583 | ||||||||
Deferred tax asset valuation allowances | 12,048 | 9,707 | — | — | 21,755 | ||||||||||||||
Year ended December 31, 2016 | |||||||||||||||||||
Allowance for doubtful accounts | $ | 13,960 | $ | (1,515 | ) | $ | 386 | $ | (7,713 | ) | $ | 5,118 | |||||||
Deferred tax asset valuation allowances | 10,968 | 1,080 | — | — | 12,048 | ||||||||||||||
Year ended December 31, 2015 | |||||||||||||||||||
Allowance for doubtful accounts | $ | 14,850 | $ | 3,987 | $ | (2,155 | ) | $ | (2,722 | ) | $ | 13,960 | |||||||
Deferred tax asset valuation allowances | 13,177 | (2,209 | ) | — | — | 10,968 | |||||||||||||