Attached files
| file | filename |
|---|---|
| EX-99.3 - EXHIBIT 99.3 - Centennial Resource Development, Inc. | exhibit993-12312017.htm |
| EX-32.2 - EXHIBIT 32.2 - Centennial Resource Development, Inc. | exhibit322-12312017.htm |
| EX-32.1 - EXHIBIT 32.1 - Centennial Resource Development, Inc. | exhibit321-12312017.htm |
| EX-31.2 - EXHIBIT 31.2 - Centennial Resource Development, Inc. | exhibit312-12312017.htm |
| EX-31.1 - EXHIBIT 31.1 - Centennial Resource Development, Inc. | exhibit311-12312017.htm |
| EX-23.2 - EXHIBIT 23.2 - Centennial Resource Development, Inc. | nsaicentennial10kconsent.htm |
| EX-23.1 - EXHIBIT 23.1 - Centennial Resource Development, Inc. | exhibit231-12312017.htm |
| EX-10.16 - EXHIBIT 10.16 - Centennial Resource Development, Inc. | exhibit1016-2016longtermin.htm |
UNITED STATES
SECURITIES AND EXCHANGE COMMISSION
Washington, D.C. 20549
FORM 10-K
þ Annual Report Pursuant to Section 13 or 15(d) of the Securities Exchange Act of 1934
For the fiscal year ended December 31, 2017
or
o Transition Report Pursuant to Section 13 or 15(d) of the Securities Exchange Act of 1934
Commission file number 001-37697
CENTENNIAL RESOURCE DEVELOPMENT, INC.
(Exact name of registrant as specified in its charter)
Delaware | 47-5381253 | |
(State of Incorporation) | (I.R.S. Employer Identification No.) | |
1001 Seventeenth Street, Suite 1800, Denver, Colorado 80202 | ||
(Address of principal executive offices including zip code) | ||
(Registrant’s telephone number, including area code): (720) 499-1400
Securities registered pursuant to Section 12(b) of the Act:
Title of each class | Name of each exchange on which registered | |
Class A Common Stock, par value $0.0001 per share | The NASDAQ Capital Market LLC | |
Securities registered pursuant to Section 12(g) of the Act: None
Indicate by check mark if the registrant is a well-known seasoned issuer, as defined in Rule 405 of the Securities Act. Yes o No ý
Indicate by check mark if the registrant is not required to file reports pursuant to Section 13 or Section 15(d) of the Act. Yes o No ý
Indicate by check mark whether the registrant (1) has filed all reports required to be filed by Section 13 or 15(d) of the Securities Exchange Act of 1934 during the preceding 12 months (or for such shorter period that the registrant was required to file such reports), and (2) has been subject to the filing requirements for the past 90 days. Yes ý No o
Indicate by check mark whether the Registrant has submitted electronically and posted on its corporate website, if any, every Interactive Data File required to be submitted and posted pursuant to Rule 405 of Regulation S-T (§232.405 of this chapter) during the preceding 12 months (or for such shorter period that the registrant was required to submit and post such files). Yes ý No o
Indicate by check mark if disclosure of delinquent filers pursuant to Item 405 of Regulation S-K is not contained herein, and will not be contained, to the best of registrant’s knowledge, in definitive proxy or information statements incorporated by reference in Part III of this Form 10-K or any amendment to this Form 10-K. o
Indicate by check mark whether the registrant is a large accelerated filer, an accelerated filer, a non-accelerated filer, a smaller reporting company or an emerging growth company. (See definitions of “large accelerated filer,” “accelerated filer,” “smaller reporting company” and “emerging growth company” in Rule 12b-2 of the Exchange Act).
Large accelerated filer ý | Accelerated filer o | |
Non-accelerated filer o (Do not check if a smaller reporting company) | Smaller reporting company o | |
Emerging growth company o | ||
If an emerging growth company, indicate by check mark if the registrant has elected not to use the extended transition period for complying with any new or revised financial accounting standards provided pursuant to Section 13(a) of the Exchange Act. o
Indicate by check mark whether the registrant is a shell company (as defined in Rule 12b-2 of the Exchange Act). Yes o No ý
The aggregate market value of the voting and non-voting common stock held by non-affiliates of the registrant as of June 30, 2017, the last business day of the registrant’s most recently completed second fiscal quarter, was approximately $2,479,264,380 based on the closing price of the shares of common stock on that date.
As of February 20, 2018, there were 260,368,235 shares of Class A Common Stock, par value $0.0001 per share, and 15,661,338 shares of Class C Common Stock, par value $0.0001 per share, outstanding.
TABLE OF CONTENTS
Page | ||||
GLOSSARY OF OIL AND NATURAL GAS TERMS
The following are abbreviations and definitions of certain terms used in this Annual Report on Form 10-K, which are commonly used in the oil and natural gas industry:
Bbl. One stock tank barrel of 42 U.S. gallons liquid volume used herein in reference to crude oil, condensate or NGLs.
Bbl/d. One Bbl per day.
Boe. One barrel of oil equivalent, calculated by converting natural gas to oil equivalent barrels at a ratio of six Mcf of natural gas to one Bbl of oil. This is an energy content correlation and does not reflect a value or price relationship between the commodities.
Boe/d. One Boe per day.
Btu. One British thermal unit, which is the quantity of heat required to raise the temperature of a one-pound mass of water by one-degree Fahrenheit.
Completion. The process of preparing an oil and gas wellbore for production through the installation of permanent production equipment, as well as perforation and fracture stimulation to optimize production.
Development project. The means by which petroleum resources are brought to the status of economically producible. As examples, the development of a single reservoir or field, an incremental development in a producing field or the integrated development of a group of several fields and associated facilities with a common ownership may constitute a development project.
Development well. A well drilled within the proved area of an oil or natural gas reservoir to the depth of a stratigraphic horizon known to be productive.
Differential. An adjustment to the price of oil or natural gas from an established spot market price to reflect differences in the quality and location of oil or natural gas.
Exploratory well. A well drilled to find a new field or to find a new reservoir in a field previously found to be productive of oil or natural gas in another reservoir.
Field. An area consisting of a single reservoir or multiple reservoirs all grouped on, or related to, the same individual geological structural feature or stratigraphic condition. The field name refers to the surface area, although it may refer to both the surface and the underground productive formations.
Flush production. First yield from a flowing well during its most productive period after it is first completed and put on-line.
Formation. A layer of rock which has distinct characteristics that differs from nearby rock.
Horizontal drilling. A drilling technique used in certain formations where a well is drilled vertically to a certain depth and then drilled at a right angle within a specified interval.
MBbl. One thousand barrels of crude oil, condensate or NGLs.
MBoe. One thousand Boe.
Mcf. One thousand cubic feet of natural gas.
Mcf/d. One Mcf per day.
MMBtu. One million British thermal units.
MMcf. One million cubic feet of natural gas.
NGL. Natural gas liquids. These are naturally occurring substances found in natural gas, including ethane, butane, isobutane, propane and natural gasoline, that can be collectively removed from produced natural gas, separated in these substances and sold.
NYMEX. The New York Mercantile Exchange.
Operator. The individual or company responsible for the development and/or production of an oil or natural gas well or lease.
Proved developed reserves. Reserves that can be expected to be recovered through existing wells with existing equipment and operating methods or in which the cost of the required equipment is relatively minor compared with the cost of a new well.
Proved reserves. The estimated quantities of oil, NGLs and natural gas that geological and engineering data demonstrate with reasonable certainty to be commercially recoverable in future years from known reservoirs under existing economic and operating conditions.
3
Proved undeveloped reserves or PUD. Proved reserves that are expected to be recovered from new wells on undrilled acreage, or from existing wells where a relatively major expenditure is required for completion or recompletion.
Realized price. The cash market price less differentials.
Recompletion. The completion for production of an existing wellbore in another formation from that which the well has been previously completed
Reserves. Estimated remaining quantities of oil and natural gas and related substances anticipated to be economically producible, as of a given date, by application of development projects to known accumulations. In addition, there must exist, or there must be a reasonable expectation that there will exist, the legal right to produce or a revenue interest in the production, installed means of delivering oil and natural gas or related substances to market and all permits and financing required to implement the project.
Reservoir. A porous and permeable underground formation containing a natural accumulation of producible oil and/or natural gas that is confined by impermeable rock or water barriers and is individual and separate from other reservoirs.
Royalty interest. An interest in an oil or gas property entitling the owner to shares of the production free of costs of exploration, development and production operations.
Spot market price. The cash market price without reduction for expected quality, location, transportation and adjustments.
Wellbore. The hole drilled by a drill bit that is equipped for oil and natural gas production once the well has been completed. Also called well or borehole.
Working interest. The interest in an oil and gas property (typically a leasehold interest) that gives the owner the right to drill, produce and conduct operations on the property and to a share of production, subject to all royalties and other burdens and to all costs of exploration, development and operations and all risks in connection therewith.
Workover. Operations on a producing well to restore or increase production.
WTI. West Texas Intermediate.
4
GLOSSARY OF CERTAIN OTHER TERMS
The following are definitions of certain other terms that are used in this Annual Report on Form 10-K:
Business Combination. The acquisition of approximately 89% of the outstanding membership interests in CRP from the Centennial Contributors, which closed on October 11, 2016, and the other transactions contemplated by the Contribution Agreement.
Business Combination Private Placements. The issuance and sale in private placements of (i) 81,005,000 shares of Class A Common Stock to Riverstone Centennial Holdings, L.P. and (ii) 20,000,000 shares of Class A Common Stock to certain other investors, which closed simultaneously with the consummation of the Business Combination.
Celero. Celero Energy Company, LP, a Delaware limited partnership.
Centennial Contributors. CRD, NGP Follow-On and Celero, collectively.
The Company, We, Our or Us. (i) Centennial Resource Development, Inc. and its consolidated subsidiaries including CRP, following the closing of the Business Combination and (ii) Silver Run Acquisition Corporation prior to the closing of the Business Combination.
Class A Common Stock. Our Class A Common Stock, par value $0.0001 per share.
Class B Common Stock. Our Class B Common Stock, par value $0.0001 per share.
Class C Common Stock. Our Class C Common Stock, par value $0.0001 per share, which was issued to the Centennial Contributors in connection with the Business Combination.
Contribution Agreement. The Contribution Agreement, dated as of July 6, 2016, among the Centennial Contributors, CRP and NewCo, as amended by Amendment No. 1 thereto, dated as of July 29, 2016, and the Joinder Agreement, dated as of October 7, 2016, by the Company.
CRD. Centennial Resource Development, LLC, a Delaware limited liability company.
CRP. Centennial Resource Production, LLC, a Delaware limited liability company.
CRP Common Units. The units representing common membership interests in CRP.
Founder Shares. Shares of our Class B Common Stock purchased by Riverstone in a private placement prior to our IPO, which were converted into shares of Class A Common Stock on a one-for-one basis in connection with the closing of the Business Combination.
GMT Acquisition. The acquisition of certain undeveloped acreage and producing oil and natural gas properties of GMT Exploration Company LLC, which closed on June 8, 2017.
Initial Stockholders. Holders of our founder shares prior to our IPO, including Riverstone and our independent directors prior to the Business Combination.
IPO. Silver Run Acquisition Corporation initial public offering of units, which closed on February 29, 2016.
NewCo. New Centennial, LLC, a Delaware limited liability company controlled by affiliates of Riverstone.
NGP Follow-On. NGP Centennial Follow-On LLC, a Delaware limited liability company.
Private Placement Warrants. Our 8,000,000 outstanding warrants, which were purchased by Riverstone in a private placement simultaneously with the closing of our IPO.
Public Warrants. Warrants for the purchase of shares of Class A Common Stock sold as part of the Units in our IPO, all of which have been exercised or redeemed and are no longer outstanding.
Riverstone. Riverstone Investment Group LLC and its affiliates, including Silver Run Sponsor, LLC, a Delaware limited liability company, collectively.
Riverstone Purchasers. Riverstone VI Centennial QB Holdings, L.P., Riverstone Non-ECI USRPI AIV, L.P. and REL US Centennial Holdings, LLC, which are affiliates of Riverstone.
Series B Preferred Stock. Our Series B Preferred Stock, par value $0.0001 per share, all outstanding shares of which were converted into 26,100,000 shares of Class A Common Stock on May 25, 2017.
Series B Preferred Units. Series B Preferred Units of CRP which, by their terms, convert to CRP Common Units upon the conversion of the Series B Preferred Stock.
5
Silverback. Silverback Exploration, LLC and Silverback Operating, LLC, collectively.
Silverback Acquisition. Our acquisition of leasehold interests and related upstream assets in Reeves County, Texas from Silverback, which closed on December 28, 2016.
Silverback Acquisition Private Placements. The issuance and sale in private placements of (i) 3,473,590 shares of Class A Common Stock and 104,400 shares of Series B Preferred Stock to the Riverstone Purchasers and (ii) 33,012,380 shares of our Class A Common Stock to certain other investors, which closed simultaneously with the consummation of the Silverback Acquisition.
Units. Our units sold in our IPO, each of which consisted of one share of Class A Common Stock and one-third of one Public Warrant.
Voting common stock. Our Class A Common Stock and Class C Common Stock.
6
CAUTIONARY STATEMENT CONCERNING FORWARD-LOOKING STATEMENTS
Throughout this Annual Report on Form 10-K, we make statements that may be deemed “forward-looking” statements within the meaning of Section 27A of the Securities Act of 1933, as amended (the “Securities Act”), and Section 21E of the Securities Exchange Act of 1934, as amended (the “Exchange Act”). All statements, other than statements of historical fact included in this Annual Report on Form 10-K, regarding our strategy, future operations, financial position, estimated revenues and losses, projected costs, prospects, plans and objectives of management are forward-looking statements. When used in this Annual Report on Form 10-K, the words “could,” “believe,” “anticipate,” “intend,” “estimate,” “expect,” “project” and similar expressions are intended to identify forward-looking statements, although not all forward-looking statements contain such identifying words. These forward-looking statements are based on management’s current expectations and assumptions about future events and are based on currently available information as to the outcome and timing of future events. When considering forward-looking statements, you should keep in mind the risk factors and other cautionary statements described under Part I, Item 1A. Risk Factors in this Annual Report on Form 10-K.
Forward-looking statements may include statements about:
• | our business strategy and future drilling plans; |
• | our reserves and our ability to replace the reserves we produce through drilling and property acquisitions; |
• | our drilling prospects, inventories, projects and programs; |
• | our financial strategy, liquidity and capital required for our development program; |
• | our realized oil, natural gas and NGL prices; |
• | the timing and amount of our future production of oil, natural gas and NGLs; |
• | our hedging strategy and results; |
• | our competition and government regulations; |
• | our ability to obtain permits and governmental approvals; |
• | our pending legal or environmental matters; |
• | our marketing of oil, natural gas and NGLs; |
• | our leasehold or business acquisitions; |
• | general economic conditions; |
• | credit markets; |
• | uncertainty regarding our future operating results; and |
• | our plans, objectives, expectations and intentions contained in this Annual Report on Form 10-K that are not historical. |
We caution you that these forward-looking statements are subject to all of the risks and uncertainties, most of which are difficult to predict and many of which are beyond our control, incident to the development, production, gathering and sale of oil and natural gas. These risks include, but are not limited to, commodity price volatility, inflation, lack of availability of drilling and production equipment and services, environmental risks, drilling and other operating risks, regulatory changes, the uncertainty inherent in estimating reserves and in projecting future rates of production, cash flow and access to capital, the timing of development expenditures and the other risks described under Part I, Item 1A. Risk Factors.
Reserve engineering is a process of estimating underground accumulations of oil and natural gas that cannot be measured in an exact way. The accuracy of any reserve estimate depends on the quality of available data, the interpretation of such data and price and cost assumptions made by reserve engineers. In addition, the results of drilling, testing and production activities may justify revisions of estimates that were made previously. If significant, such revisions would change the schedule of any further production and development drilling. Accordingly, reserve estimates may differ significantly from the quantities of oil and natural gas that are ultimately recovered.
Should one or more of the risks or uncertainties described in this Annual Report on Form 10-K occur, or should underlying assumptions prove incorrect, our actual results and plans could differ materially from those expressed in any forward-looking statements.
All forward-looking statements, expressed or implied, included in this Annual Report on Form 10-K are expressly qualified in their entirety by this cautionary statement. This cautionary statement should also be considered in connection with any subsequent written or oral forward-looking statements that we or persons acting on our behalf may issue.
7
Except as otherwise required by applicable law, we disclaim any duty to update any forward-looking statements, all of which are expressly qualified by the statements in this section, to reflect events or circumstances after the date of this Annual Report on Form 10-K.
8
PART I
ITEMS 1 AND 2. BUSINESS AND PROPERTIES
Overview
Centennial Resource Development, Inc. (the “Company,” “Centennial,” “we,” “us,” or “our”) is an independent oil and natural gas company focused on the development of unconventional oil and associated liquids-rich natural gas reserves in the Permian Basin. Our assets are concentrated in the Delaware Basin, a sub-basin of the Permian Basin, and our properties consist of large, contiguous acreage blocks primarily in Reeves County in West Texas and Lea County in New Mexico.
Our principal business objective is to increase shareholder value by building a premier development company focused on horizontal drilling in the Delaware Basin. We intend to grow our production and oil and natural gas reserves by developing our acreage with an increased focus on optimizing completions, improving drilling results and drilling extended laterals. We also intend to grow production and reserves through selective acquisitions that meet our strategic and financial objectives.
Presentation of Financial and Operating Data
On October 11, 2016, the Company consummated the acquisition of approximately 89% of the outstanding membership interests in Centennial Resource Production, LLC, a Delaware limited liability company (“CRP” and such acquisition, the “Business Combination”). The Company currently owns an approximate 94% membership interest in CRP due to various equity transactions. The financial statement presentation distinguishes CRP as an accounting “Predecessor” for periods prior to the Business Combination. Centennial is the “Successor” for periods after the Business Combination, which includes consolidation of CRP subsequent to the Business Combination. Except as the context otherwise requires, references in the following discussion to the “Company,” “Centennial,” “we,” “us,” or “our” with respect to periods prior to the closing of the Business Combination are to CRP and its operations before the Business Combination.
Organizational Structure
The following diagram illustrates the current ownership structure of the company:
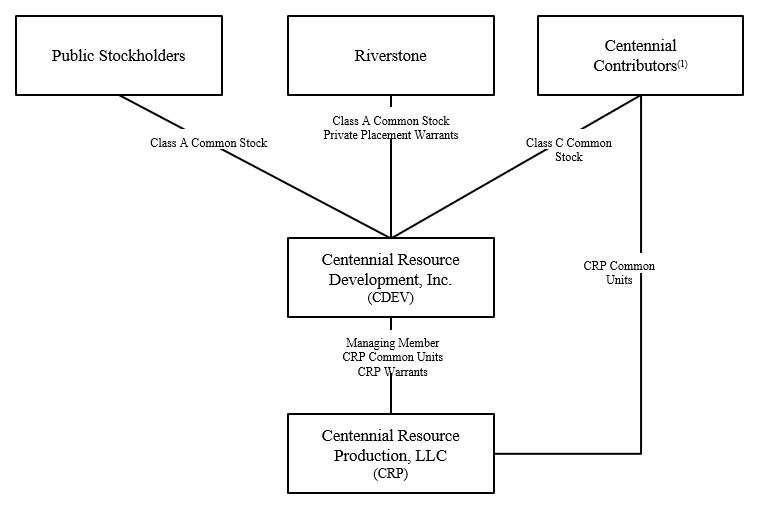
(1) | CRD, one of the Centennial Contributors, also owns one share of Series A Preferred Stock, par value $0.0001 per share (the “Series A Preferred Stock”) that provides CRD with the right to nominate and elect one director to the Company’s board of directors. The Series A Preferred Stock does not have any other voting rights or rights with respect to dividends except distributions in liquidation in the amount of $0.0001 per share. |
Description of Our Properties
As of December 31, 2017, we operated 181 producing horizontal wells. We have established commercial production on our acreage from eight distinct zones: the Avalon Shale, 1st Bone Spring, 2nd Bone Spring, 3rd Bone Spring, Upper Wolfcamp A, Lower Wolfcamp A, Wolfcamp B and Wolfcamp C. As a result, we are able to efficiently develop our drilling inventory and focus
9
on maximizing returns to our stakeholders. As of December 31, 2017, we had six operated rigs running on our acreage, five of which are in Reeves County and one of which is in Lea County.
As of December 31, 2017, we have leased or acquired approximately 84,718 net acres, approximately 91% of which we operate. In addition, we own 1,521 net mineral acres in the Delaware Basin. Approximately 85% of our total acreage as of December 31, 2017 was located in Texas, primarily Reeves County, in the southern portion of the Delaware Basin and approximately 15% is located in New Mexico, primarily in Lea County, in the northern portion of the Delaware Basin. As of December 31, 2017, over 64% of our net acreage is held by production. The relatively high proportion of our operated acreage that is held by production gives us significant operational control and capital spending flexibility. This allows us to execute our development program with significant control over the timing and allocation of capital expenditures and application of the optimal drilling and completion techniques to efficiently develop our resource base. Our development drilling plan is comprised exclusively of horizontal drilling with an ongoing focus on optimizing completions, improving drilling results and managing costs.
Proved Oil and Gas Reserves
Reserve estimates are inherently imprecise and estimates for new discoveries and undeveloped locations are more imprecise than reserve estimates for producing oil and gas properties. Accordingly, these estimates are expected to change as new information becomes available. The pre-tax PV 10% amounts shown in the following table are not intended to represent the current market value of our estimated proved reserves. The actual quantities and present value of our estimated proved reserves may be more or less than we have estimated. The following table should be read along with Part I, Item 1A. Risk Factors in this Annual Report on Form 10-K.
The following table summarizes estimated proved reserves, pre-tax 10%, and standardized measure of discounted future cash flows as of December 31, 2017 (Successor), December 31, 2016 (Successor), and December 31, 2015 (Predecessor):
Successor | Predecessor | |||||||||||
December 31, 2017 | December 31, 2016 | December 31, 2015 | ||||||||||
Proved developed reserves: | ||||||||||||
Oil (MBbls) | 41,786 | 14,551 | 9,347 | |||||||||
Natural gas (MMcf) | 126,065 | 42,190 | 12,711 | |||||||||
NGL (MBbls) | 12,133 | 3,618 | 1,603 | |||||||||
Total proved developed reserves (MBoe) | 74,929 | 25,200 | 13,068 | |||||||||
Proved undeveloped reserves: | ||||||||||||
Oil (MBbls) | 59,147 | 31,914 | 13,852 | |||||||||
Natural gas (MMcf) | 201,147 | 106,154 | 19,731 | |||||||||
NGL (MBbls) | 18,853 | 8,152 | 2,248 | |||||||||
Total proved undeveloped reserves (MBoe) | 111,525 | 57,759 | 19,389 | |||||||||
Total proved reserves: | ||||||||||||
Oil (MBbls) | 100,933 | 46,466 | 23,199 | |||||||||
Natural gas (MMcf) | 327,212 | 148,344 | 32,442 | |||||||||
NGL (MBbls) | 30,986 | 11,770 | 3,851 | |||||||||
Total proved reserves (MBoe) | 186,454 | 82,959 | 32,457 | |||||||||
Proved developed reserves % | 40 | % | 30 | % | 40 | % | ||||||
Proved undeveloped reserves % | 60 | % | 70 | % | 60 | % | ||||||
Reserve values (in millions): | ||||||||||||
Standard measure of discounted future net cash flows | $ | 1,503.3 | $ | 375.1 | $ | 135.1 | ||||||
Discounted future income tax expense | 244.8 | 52.4 | 10.4 | |||||||||
Total proved pre-tax PV 10% (1) | $ | 1,748.1 | $ | 427.5 | $ | 145.5 | ||||||
10
(1) | Pre-tax PV 10% may be considered a non-GAAP financial measure as defined by the SEC and is derived from the standardized measure of discounted future net cash flows (the ‘‘Standardized Measure’’), which is the most directly comparable GAAP financial measure. Pre-tax PV 10% is computed on the same basis as the Standardized Measure but without deducting future income taxes. We believe pre-tax PV 10% is a useful measure for investors when evaluating the relative monetary significance of our oil and natural gas properties. We further believe investors may utilize our pre-tax PV 10% as a basis for comparison of the relative size and value of our proved reserves to other companies because many factors that are unique to each individual company impact the amount of future income taxes to be paid. Our management uses this measure when assessing the potential return on investment related to our oil and gas properties and acquisitions. However, pre-tax PV 10% is not a substitute for the Standardized Measure. Our pre-tax PV 10% and Standardized Measure do not purport to present the fair value of our proved oil, NGL and natural gas reserves. |
Proved Undeveloped Reserves. Significant changes to our proved undeveloped (“PUD”) reserves that occurred during 2017 are summarized in the table below:
2017 | ||||
(Mboe) | ||||
Proved undeveloped reserves at January 1, | 57,759 | |||
Transferred to proved developed reserves | (18,141 | ) | ||
Revisions to previous estimates | 5,277 | |||
Extensions and discoveries | 66,630 | |||
Proved undeveloped reserves at December 31, | 111,525 | |||
During 2017, we spent $168.5 million in capital expenditures to convert 18.1 MMBoe of PUD reserves to proved developed reserves. Revisions of previous estimates of 5.3 MMBoe are composed of positive revisions of 15.1 MMBoe relating to adjustments to PUD well locations scheduled to be drilled at longer lateral lengths and upward performance revisions partially offset by 9.8 MMBoe of negative revisions associated with PUD reclassification to unproven reserves as they are no longer expected to be developed within the five years of their initial recording in accordance with SEC rules. In addition, we added 66.6 MMBoe of PUD reserves from extensions and discoveries during the year primarily due to successful drilling from our 2017 six-rig development drilling program, the majority of which were in the Upper Wolfcamp A zone. All of our PUD drilling locations are scheduled to be drilled within five years of their initial booking. The Company’s PUD to proved developed reserves conversion rate was 36% in 2017.
Preparation of Reserve Estimates
Estimation of Proved Reserves. Under SEC rules, proved reserves are those quantities of oil, natural gas and NGLs, which, by analysis of geoscience and engineering data, can be estimated with reasonable certainty to be economically producible—from a given date forward, from known reservoirs and under existing economic conditions, operating methods and government regulations—prior to the time at which contracts providing the right to operate expire, unless evidence indicates that renewal is reasonably certain, regardless of whether deterministic or probabilistic methods are used for the estimation. If deterministic methods are used, the Securities and Exchange Commission (the “SEC”) has defined reasonable certainty for proved reserves as a “high degree of confidence that the quantities will be recovered.” All of our proved reserves as of December 31, 2017, 2016 and 2015 were estimated using a deterministic method. The estimation of reserves involves two distinct determinations. The first determination results in the estimation of the quantities of recoverable oil, natural gas and NGLs and the second determination results in the estimation of the uncertainty associated with those estimated quantities in accordance with the definitions established under SEC rules. The process of estimating the quantities of recoverable reserves relies on the use of certain generally accepted analytical procedures. These analytical procedures fall into four broad categories or methods: (1) production performance-based methods; (2) material balance-based methods; (3) volumetric-based methods; and (4) analogy. These methods may be used singularly or in combination by the reserve evaluator in the process of estimating the quantities of reserves. Reserves for proved developed producing wells were estimated using production performance methods for the vast majority of properties. Certain new producing properties with very little production history were forecast using a combination of production performance and analogy to similar production, both of which are considered to provide a relatively high degree of accuracy. Non-producing reserve estimates, for developed and undeveloped properties, were forecast using either volumetric or analogy methods, or a combination of both. These methods provide a relatively high degree of accuracy for predicting proved developed non-producing and proved undeveloped reserves for our properties, due to the mature nature of the properties targeted for development and an abundance of subsurface control data.
Evaluation and Review of Proved Reserves. Our historical proved reserve estimates as of December 31, 2017, 2016 and 2015 were prepared based on reports by Netherland, Sewell & Associates, Inc. (“NSAI”). NSAI is a worldwide leader of petroleum property analysis for industry and financial organizations and government agencies. NSAI was founded in 1961 and performs consulting petroleum engineering services under Texas Board of Professional Engineers Registration No. F-2699. NSAI does not own an interest in any of our properties, nor is it employed by us on a contingent basis. Within NSAI, the technical persons
11
primarily responsible for preparing the estimates set forth in the NSAI reserves report incorporated herein are Mr. Neil H. Little and Mr. Mike K. Norton. Mr. Little, a Licensed Professional Engineer in the State of Texas (No. 117966), has been practicing consulting petroleum engineering at NSAI since 2011 and has over 9 years of prior industry experience. He graduated from Rice University in 2002 with a Bachelor of Science Degree in Chemical Engineering and from University of Houston in 2007 with a Master of Business Administration Degree. Mr. Norton, a Licensed Professional Geoscientist in the State of Texas, Geology (No. 441), has been practicing consulting petroleum geoscience at NSAI since 1989 and has over 10 years of prior industry experience. He graduated from Texas A&M University in 1978 with a Bachelor of Science Degree in Geology. Both technical principals meet or exceed the education, training, and experience requirements set forth in the Standards Pertaining to the Estimating and Auditing of Oil and Gas Reserves Information promulgated by the Society of Petroleum Engineers; both are proficient in judiciously applying industry standard practices to engineering and geoscience evaluations as well as applying SEC and other industry reserves definitions and guidelines.
We maintain an internal staff of petroleum engineers and geoscience professionals who worked closely with our independent reserve engineers to ensure the integrity, accuracy and timeliness of the data used to calculate our proved reserves relating to our assets. Our internal technical team members meet with our independent reserve engineers periodically during the period covered by the proved reserve report to discuss the assumptions and methods used in the proved reserve estimation process. We provide historical information to the independent reserve engineers for our properties, such as ownership interest, oil and natural gas production, well test data, commodity prices and operating and development costs. Jeff Thompson has served as our Vice President of Reservoir Engineering since July 2017. Prior to that, Mr. Thompson served as General Manager at QEP Resources leading the reservoir engineering, geoscience, and regulatory teams focused on the Williston Basin from 2016 to 2017. Mr. Thompson also served as the General Manager of the Greater Green River Basin Team from 2015 to 2016 and worked as the Reservoir Engineering Manager of QEP’s Williston Basin assets from 2012 to 2015. Mr. Thompson originally joined QEP Resources (formerly Questar E&P) in 2005 as a member of the Mid-Continent asset team functioning in various engineering roles before managing the Mid-Continent Reservoir Engineering Team in 2012. Mr. Thompson earned his B.S. in Petroleum Engineering from the University of Oklahoma. He is a Registered Professional Engineer in Oklahoma and member of the Society of Petroleum Engineers.
Production
The following table sets forth information regarding net production of oil, natural gas and NGLs, and certain price and cost information for each of the periods indicated:
Successor | Predecessor | |||||||||||||||
Year Ended December 31, 2017 | October 11, 2016 through December 31, 2016 | January 1, 2016 through October 10, 2016 | Year Ended December 31, 2015 | |||||||||||||
Production data: | ||||||||||||||||
Oil (MBbls) | 6,994 | 523 | 1,584 | 1,830 | ||||||||||||
Natural gas (MMcf) | 17,754 | 1,113 | 2,660 | 3,058 | ||||||||||||
NGLs (MBbls) | 1,678 | 96 | 253 | 331 | ||||||||||||
Total (MBoe) | 11,630 | 805 | 2,280 | 2,671 | ||||||||||||
Average realized prices (excluding effect of hedges): | ||||||||||||||||
Oil (per Bbl) | $ | 48.17 | $ | 46.49 | $ | 37.74 | $ | 42.43 | ||||||||
Natural gas (per Mcf) | 2.75 | 3.10 | 2.27 | 2.60 | ||||||||||||
NGL (per Bbl) | 26.28 | 20.36 | 12.98 | 14.66 | ||||||||||||
Per BOE | $ | 36.96 | $ | 36.92 | $ | 30.31 | $ | 33.87 | ||||||||
Production costs per Boe: | ||||||||||||||||
Lease operating expenses | $ | 3.55 | $ | 4.40 | $ | 4.84 | $ | 7.93 | ||||||||
Severance and ad valorem taxes | 1.99 | 2.03 | 1.62 | 1.88 | ||||||||||||
Transportation, processing, gathering and other operating expenses | 2.95 | 2.72 | 2.01 | 2.15 | ||||||||||||
Contract termination and rig stacking | — | — | — | 0.89 | ||||||||||||
Productive Wells
As of December 31, 2017, we owned an approximate 64% average working interest in 315 gross (203 net) productive wells. Our wells are primarily oil wells (299 gross/188 net productive oil wells) that produce associated liquids-rich natural gas. Productive wells consist of producing wells, wells capable of production and wells awaiting connection to production facilities.
12
Gross wells are the total number of producing wells in which we have an interest, operated and non-operated, and net wells are the sum of our fractional working interests owned in gross wells.
Acreage
The following table sets forth information as of December 31, 2017 relating to our gross and net developed and undeveloped leasehold acreage. Developed acreage consists of acres spaced or assigned to productive wells and does not include undrilled acreage held by production under the terms of the lease. Undeveloped acreage is defined as acres on which wells have not been drilled or completed to a point that would permit the production of commercial quantities of oil or natural gas, regardless of whether such acreage contains proved reserves.
Developed Acreage | Undeveloped Acreage | Total Acreage(3) | ||||||||||||||
Gross(1) | Net(2) | Gross(1) | Net(2) | Gross(1) | Net(2) | |||||||||||
22,880 | 21,407 | 104,564 | 63,311 | 127,444 | 84,718 | |||||||||||
(1) | A gross acre is an acre in which a working interest is owned. The number of gross acres is the total number of acres in which a working interest is owned. |
(2) | A net acre is deemed to exist when the sum of the fractional ownership working interests in gross acres equals one. The number of net acres is the sum of the fractional working interests owned in gross acres expressed as whole numbers and fractions thereof. |
(3) | Does not include our 1,521 net mineral acres. |
The following table sets forth the gross and net undeveloped acreage, as of December 31, 2017, that will expire over the next five years unless production is established within the spacing units covering the acreage, the lease is renewed or extended under continuous drilling provisions prior to the primary term expiration dates, or pursuant to other terms of the lease agreements.
2018 | 2019 | 2020 | 2021 | 2022 | ||||||||||||||||||||||||
Gross | Net | Gross | Net | Gross | Net | Gross | Net | Gross | Net | |||||||||||||||||||
17,898 | 10,724 | 23,902 | 14,270 | 11,910 | 1,752 | 480 | 480 | 236 | 189 | |||||||||||||||||||
Drilling Results
The following table sets forth the results of our drilling activity, as defined by wells placed on production, for the periods indicated. Productive wells are those that produce, or are capable of producing, commercial quantities of hydrocarbons, regardless of whether they produce a reasonable rate of return. Dry wells are those that prove to be incapable of producing hydrocarbons in sufficient quantities to justify completion.
Successor | Predecessor | |||||||||||||||||||||||
Year ended December 31, 2017 | October 11, 2016 through December 31, 2016 | January 1, 2016 through October 10, 2016 | Year Ended December 31, 2015 | |||||||||||||||||||||
Gross | Net | Gross | Net | Gross | Net | Gross | Net | |||||||||||||||||
Development Wells: | ||||||||||||||||||||||||
Productive(1) | 69 | 65.2 | 5 | 2.5 | 10 | 7.0 | 16 | 12.4 | ||||||||||||||||
Dry | 1 | 1.0 | — | — | — | — | — | — | ||||||||||||||||
70 | 66.2 | 5 | 2.5 | 10 | 7.0 | 16 | 12.4 | |||||||||||||||||
Exploratory Wells: | ||||||||||||||||||||||||
Productive(1) | 1 | 1.0 | — | — | — | — | — | — | ||||||||||||||||
Dry | 1 | 1.0 | — | — | — | — | — | — | ||||||||||||||||
2 | 2.0 | — | — | — | — | — | — | |||||||||||||||||
Total | 72 | 68.2 | 5 | 2.5 | 10 | 7.0 | 16 | 12.4 | ||||||||||||||||
(1) | Although a well may be classified as productive upon completion, future changes in oil and natural gas prices, operating costs and production may result in the well becoming uneconomical, particularly exploratory wells where there is no production history. |
13
Title to Properties
We believe that we have satisfactory title to substantially all of our producing properties in accordance with generally accepted industry standards. Individual properties may be subject to burdens such as royalty, overriding royalty, working and other outstanding interests customary in the industry. In most cases, we investigate title and obtain title opinions from counsel only when we acquire producing properties or before commencement of drilling operations.
Marketing and Customers
We market the majority of our production from properties we operate for both our account and the account of the other working interest owners in these properties. We sell our oil, natural gas and NGL production to purchasers at market prices. We sell all of our NGLs under contracts with terms of greater than twelve months and the majority of our natural gas and all of our oil under contracts with terms of less than twelve months.
We normally sell production to a relatively small number of customers, as is customary in our business. The tables below present percentages by purchaser that accounted for 10% or more of our total oil, NGL, and natural gas sales for the years ended December 31, 2017, 2016, and 2015.
Year Ended December 31, 2017 | ||
Shell Trading (US) Company | 33 | % |
BP America | 16 | % |
Eagleclaw Midstream Ventures, LLC | 14 | % |
Year Ended December 31, 2016 | ||
Plains Marketing, LP | 48 | % |
Shell Trading (US) Company | 22 | % |
Permian Transport and Trading | 11 | % |
Year Ended December 31, 2015 | ||
Plains Marketing, LP | 64 | % |
During these periods, no other purchaser accounted for 10% or more of our revenue. The loss of any of our major purchasers could materially and adversely affect our revenues in the short-term. However, based on the current demand for oil and natural gas and the availability of other purchasers, we believe that the loss of any major purchaser would not have a material adverse effect on our financial condition and results of operations because crude oil and natural gas are fungible products with well-established markets and numerous purchasers.
Competition
The oil and natural gas industry is a highly competitive environment, and we compete with both major integrated and other independent oil and natural gas companies in all aspects of our business to explore, develop and operate our properties and market our production. Competitive conditions may be affected by future legislation and regulations as the United States develops new energy and climate-related policies. In addition, some of our competitors may have a competitive advantage when responding to factors that affect demand for oil and natural gas production, such as changing prices, domestic and foreign political conditions, weather conditions, the proximity and capacity of natural gas pipelines and other transportation facilities and overall economic conditions. We also face indirect competition from alternative energy sources, including wind, solar and electric power. Our ability to acquire additional prospects and to find and develop reserves in the future will depend on our ability to evaluate and select suitable properties and to consummate transactions in a highly competitive environment.
Transportation
During the initial development of our fields, we consider all gathering and delivery infrastructure options in the areas of our production. Our oil is transported from the wellhead to our tank batteries by our gathering systems. The purchaser then transports the oil by truck or pipeline to a tank farm, another pipeline or a refinery. Our natural gas is generally transported by our gathering lines from the wellhead to a Central Delivery Point (“CDP”) and then is gathered by third-party lines from these CDPs to a gas processing facility. At a small number of our wells, we own natural gas pipeline facilities that connect our wells to third-party natural gas gathering systems located in the vicinity of those wells.
14
Regulation of the Oil and Natural Gas Industry
Our operations are subject to extensive federal, state and local laws and regulations. All of the jurisdictions in which we own or operate producing properties have statutory provisions regulating the development and production of oil and natural gas, including provisions related to permits for the drilling of wells, bonding requirements to drill or operate wells, the location of wells, the method of drilling and casing wells, the surface use and restoration of properties upon which wells are drilled, sourcing and disposal of water used in the drilling and completion process, and the abandonment of wells. Our operations are also subject to various conservation laws and regulations. These include the regulation of the size of drilling and spacing units or proration units, the number of wells which may be drilled in an area, and the unitization or pooling of crude oil or natural gas wells, as well as regulations that generally prohibit the venting or flaring of natural gas and impose certain requirements regarding the ratability or fair apportionment of production from fields and individual wells.
Failure to comply with applicable laws and regulations can result in substantial penalties. The regulatory burden on the industry increases the cost of doing business and affects profitability. Although we believe we are in substantial compliance with all applicable laws and regulations, such laws and regulations are frequently amended or reinterpreted. Therefore, we are unable to predict the future costs or impact of compliance. Additional proposals and proceedings that affect the oil and natural gas industry are regularly considered by Congress, the states, Federal Energy Regulatory Commission (“FERC”) and the courts. We cannot predict when or whether any such proposals may become effective.
We believe we are in substantial compliance with currently applicable laws and regulations and that continued substantial compliance with existing requirements will not have a material adverse effect on our financial position, cash flows or results of operations. However, current regulatory requirements may change, currently unforeseen environmental incidents may occur or past non-compliance with environmental laws or regulations may be discovered.
Regulation of Production of Oil and Natural Gas
The production of oil, natural gas and NGLs is subject to regulation under a wide range of local, state and federal statutes, rules, orders and regulations. Federal, state and local statutes and regulations require permits for drilling operations, drilling bonds and reports concerning operations. We own interests in properties located in New Mexico and Texas, which regulate drilling and operating activities by, among other things, requiring permits for the drilling of wells, maintaining bonding requirements in order to drill or operate wells, and regulating the location of wells, the method of drilling and casing wells, the surface use and restoration of properties upon which wells are drilled and the plugging and abandonment of wells. The laws of New Mexico and Texas also govern a number of conservation matters, including provisions for the unitization or pooling of oil and natural gas properties, the establishment of maximum allowable rates of production from oil and natural gas wells, the regulation of well spacing or density, and plugging and abandonment of wells. The effect of these regulations is to limit the amount of oil, natural gas and NGLs that we can produce from our wells and to limit the number of wells or the locations at which we can drill, although we can apply for exceptions to such regulations or to have reductions in well spacing or density. Moreover, New Mexico and Texas impose a production or severance tax with respect to the production and sale of oil, natural gas and NGLs within their jurisdiction.
The failure to comply with these rules and regulations can result in substantial penalties. Our competitors in the oil and natural gas industry are subject to the same regulatory requirements and restrictions that affect our operations.
Regulation of Sales and Transportation of Oil
Sales of oil, condensate and NGLs from our producing wells are not currently regulated and are made at negotiated prices. Nevertheless, Congress could enact price controls in the future.
Sales of oil are affected by the availability, terms and conditions and cost of transportation services. The transportation of oil in common carrier pipelines is also subject to rate and access regulation. FERC regulates the transportation in interstate commerce of crude oil, petroleum products, NGLs and other forms of liquid fuel under the Interstate Commerce Act.
Intrastate oil pipeline transportation rates are subject to regulation by state regulatory commissions. The basis for intrastate oil pipeline regulation, and the degree of regulatory oversight and scrutiny given to intrastate oil pipeline rates, varies from state to state. We rely on third-party pipelines systems to transport the majority of crude oil produced by ours wells. Insofar as effective interstate and intrastate rates and regulations regarding access are equally applicable to all comparable shippers, we believe that the regulation of oil transportation will not affect our operations in any way that is of material difference from those of our competitors who are similarly situated.
Changes in law, FERC or state policies and regulations may adversely affect the availability and reliability of firm and/or interruptible transportation service on interstate and intrastate pipelines, and we cannot predict what future action FERC or state regulatory bodies will take. We do not believe, however, that any regulatory changes will affect us in a way that materially differs from the way they will affect other oil producers and marketers with which we compete.
15
Regulation of Transportation and Sales of Natural Gas
Historically, the transportation and sale for resale of natural gas in interstate commerce have been regulated by agencies of the U.S. federal government, primarily FERC. In the past, the federal government regulated the prices at which natural gas could be sold. While sales by producers of natural gas can currently be made at uncontrolled market prices, Congress could reenact price controls in the future. Deregulation of wellhead natural gas sales began with the enactment of the Natural Gas Policy Act of 1978 (“NGPA”) and culminated in adoption of the Natural Gas Wellhead Decontrol Act which removed controls affecting wellhead sales of natural gas effective January 1, 1993. The transportation and sale for resale of natural gas in interstate commerce is regulated primarily under the Natural Gas Act of 1938 (“NGA”), and by regulations and orders promulgated under the NGA by FERC. In certain limited circumstances, intrastate transportation and wholesale sales of natural gas may also be affected directly or indirectly by laws enacted by Congress and by FERC regulations.
The federal Energy Policy Act of 2005 (“EP Act of 2005”) is a comprehensive compilation of tax incentives, authorized appropriations for grants and guaranteed loans, and significant changes to the statutory policy that affects all segments of the energy industry. Among other matters, the EP Act of 2005 amends the NGA to add an anti-market manipulation provision which makes it unlawful for any entity to engage in prohibited behavior to be prescribed by FERC, and furthermore provides FERC with additional civil penalty authority. The EP Act of 2005 provided FERC with the power to assess civil penalties of up to $1,000,000 per day for violations of the NGA and increased FERC’s civil penalty authority under the NGPA from $5,000 per violation per day to $1,000,000 per violation per day. In January 2018, FERC increased the maximum civil penalty amounts under the NGA and NGPA to adjust for inflation. FERC may now assess civil penalties under the NGA and NGPA of $1,238,271 per violation per day. The civil penalty provisions are applicable to entities that engage in the sale of natural gas for resale in interstate commerce. On January 19, 2006, FERC issued Order No. 670, a rule implementing the anti-market manipulation provision of the EP Act of 2005, and subsequently denied rehearing. The rules make it unlawful to: (i) in connection with the purchase or sale of natural gas subject to the jurisdiction of FERC, or the purchase or sale of transportation services subject to the jurisdiction of FERC, for any entity, directly or indirectly, use or employ any device, scheme or artifice to defraud; (ii) make any untrue statement of material fact or omit to make any such statement necessary to make the statements made not misleading; or (iii) engage in any act or practice that operates as a fraud or deceit upon any person. The new anti-market manipulation rule does not apply to activities that relate only to intrastate or other non-jurisdictional sales or gathering, but does apply to activities of gas pipelines and storage companies that provide interstate services, as well as otherwise non-jurisdictional entities to the extent the activities are conducted “in connection with” gas sales, purchases or transportation subject to FERC jurisdiction, which now includes the annual reporting requirements under Order 704, described below. The anti-market manipulation rule and enhanced civil penalty authority reflect an expansion of FERC’s NGA enforcement authority.
We are required to observe such anti-market manipulation laws and related regulations enforced by FERC under the EP Act of 2005 and under the Commodity Exchange Act (“CEA”), and regulations promulgated thereunder by the Commodity Futures Trading Commission (“CFTC”). The CEA prohibits any person from manipulating or attempting to manipulate the price of any commodity in interstate commerce or futures on such commodity. The CEA also prohibits knowingly delivering or causing to be delivered false or misleading or knowingly inaccurate reports concerning market information or conditions that affect or tend to affect the price of a commodity. Should we violate the anti-market manipulation laws and regulations, it could also be subject to related third-party damage claims by, among others, sellers, royalty owners and taxing authorities.
Natural gas gathering service, which occurs upstream of jurisdictional transmission services, is regulated by the states. Section 1(b) of the NGA exempts companies that provide natural gas gathering services from regulation by FERC as a “natural gas company” under the NGA. Although FERC has set forth a general test for determining whether facilities perform a non-jurisdictional gathering function or a jurisdictional transmission function, FERC’s determinations as to the classification of facilities are done on a case-by-case basis. To the extent that FERC issues an order that reclassifies certain jurisdictional transmission facilities as non-jurisdictional gathering facilities, or vice versa, and depending on the scope of that decision, our costs of getting gas to point-of-sale locations may increase. We believe that the natural gas pipelines in our gathering systems meet the traditional tests FERC has used to establish a pipeline’s status as a gatherer not subject to regulation as a natural gas company. However, the distinction between FERC-regulated transmission services and federally unregulated gathering services is the subject of ongoing litigation, so the classification and regulation of our gathering facilities are subject to change based on future determinations by FERC, the courts or Congress. State regulation of natural gas gathering facilities generally includes various occupational safety, environmental and, in some circumstances, nondiscriminatory-take requirements. Although such regulation has not generally been affirmatively applied by state agencies, natural gas gathering may receive greater regulatory scrutiny in the future.
Intrastate natural gas transportation is also subject to regulation by state regulatory agencies. The basis for intrastate regulation of natural gas transportation and the degree of regulatory oversight and scrutiny given to intrastate natural gas pipeline rates and services varies from state to state. Insofar as such regulation within a particular state will generally affect all intrastate natural gas shippers within the state on a comparable basis, we believe that the regulation of similarly situated intrastate natural gas transportation in any states in which we operate and ship natural gas on an intrastate basis will not affect our operations in any
16
way that is of material difference from those of our competitors. Like the regulation of interstate transportation rates, the regulation of intrastate transportation rates affects the marketing of natural gas that we produce, as well as the revenues we receive for sales of our natural gas.
Changes in law, FERC or state policies and regulations may adversely affect the availability and reliability of firm and/or interruptible transportation service on interstate and intrastate pipelines, and we cannot predict what future action FERC or state regulatory bodies will take. We do not believe, however, that any regulatory changes will affect us in a way that materially differs from the way they will affect other natural gas producers and marketers with which we compete.
Regulation of Environmental and Occupational Safety and Health Matters
Our operations are subject to stringent federal, state and local laws and regulations governing the occupational safety and health aspects of our operations, the discharge of materials into the environment, and protection of the environment and natural resources (including threatened and endangered species and their habitats). Numerous governmental entities, including the U.S. Environmental Protection Agency (“EPA”) and analogous state agencies, have the power to enforce compliance with these laws and regulations and the permits issued under them, often requiring difficult and costly actions. These laws and regulations may, among other things, (i) require the acquisition of permits to conduct drilling and other regulated activities; (ii) restrict the types, quantities and concentrations of various substances that can be released into the environment or injected into formations in connection with drilling and production activities; (iii) limit or prohibit drilling activities on certain lands lying within wilderness, wetlands, and other protected areas; (iv) require remedial measures to prevent or mitigate pollution from former and ongoing operations, such as requirements to close pits and plug abandoned wells; (v) apply specific health and safety criteria addressing worker protection; and (vi) impose substantial liabilities for pollution resulting from drilling and production operations. Any failure to comply with these laws and regulations may result in the assessment of administrative, civil and criminal penalties, the imposition of corrective or remedial obligations, the occurrence of delays or restrictions in permitting or performance of projects, and the issuance of orders enjoining performance of some or all of our operations.
The following is a summary of the more significant existing and proposed environmental and occupational safety and health laws, as amended from time to time, to which our business operations are or may be subject, and for which compliance may have a material adverse impact on our capital expenditures, results of operations or financial position.
Hazardous Substances and Handling Wastes
The Resource Conservation and Recovery Act (“RCRA”) and comparable state laws, regulate the generation, transportation, treatment, storage, disposal and cleanup of hazardous and nonhazardous solid wastes. Pursuant to rules issued by the EPA, the individual states administer some or all of the provisions of RCRA, sometimes in conjunction with their own, more stringent requirements. Drilling fluids, produced waters and other wastes associated with the exploration, development and production of oil, natural gas and NGLs, if properly handled, are currently exempt from regulation as hazardous waste under RCRA and, instead, are regulated under RCRA’s less stringent nonhazardous solid waste provisions, state laws or other federal laws. However, it is possible that certain oil and natural gas drilling and production wastes now classified as nonhazardous solid wastes could be classified as hazardous wastes in the future. For example, in December 2016, the EPA and environmental groups entered into a consent decree to address EPA’s alleged failure to timely assess its RCRA Subtitle D criteria regulations exempting certain exploration and production related oil and natural gas wastes from regulation as hazardous wastes under RCRA. The consent decree requires EPA to propose a rulemaking no later than March 15, 2019 for revision of certain Subtitle D criteria regulations pertaining to oil and natural gas wastes, or to sign a determination that revision of the regulations is not necessary. Were the EPA to propose a rulemaking, the consent decree requires that the EPA take final action by no later than July 15, 2021. Any such change could result in an increase in our, as well as the oil, natural gas and NGL exploration and production industry’s, costs to manage and dispose of wastes, which could have a material adverse effect on our results of operations and financial position. In addition, in the course of our operations, we may generate some amounts of ordinary industrial wastes, such as paint wastes, waste solvents, laboratory wastes and waste compressor oils that may be regulated as hazardous wastes if such wastes have hazardous characteristics. Although the costs of managing hazardous waste may be significant, we do not believe that our costs in this regard are materially more burdensome than those for similarly situated companies.
The Comprehensive Environmental Response, Compensation, and Liability Act (“CERCLA”), also known as the Superfund law, and comparable state laws impose joint and several liability, without regard to fault or the legality of conduct, on classes of persons who are considered to be responsible for the release of a hazardous substance into the environment. These persons include the current and former owners or operators of the site where the release occurred and anyone who disposed or arranged for the disposal of a hazardous substance released at the site. Under CERCLA, such persons may be subject to joint and several liability for the costs of cleaning up the hazardous substances that have been released into the environment, for damages to natural resources, and for the costs of certain health studies. CERCLA also authorizes the EPA and, in some instances, third parties to act in response to threats to the public health or the environment, and to seek to recover from the responsible classes of persons the costs they incur. In addition, it is not uncommon for neighboring landowners and other third parties to file claims for personal
17
injury and property damage allegedly caused by the hazardous substances released into the environment. generate materials in the course of our operations that may be regulated as hazardous substances.
We currently own, lease or operate numerous properties that have been used for oil, natural gas and NGL exploration, production and processing for many years. Although we believe that we have utilized operating and waste disposal practices that were standard in the industry at the time, hazardous substances, wastes, or petroleum hydrocarbons may have been released on, under or from the properties owned or leased by us, or on, under or from other locations, including off-site locations, where such substances have been taken for treatment or disposal. In addition, some of our properties have been operated by third parties or by previous owners or operators whose treatment and disposal of hazardous substances, wastes or petroleum hydrocarbons was not under our control. These properties and the substances disposed or released on, under or from them may be subject to CERCLA, RCRA and analogous state laws. Under such laws, we could be required to undertake response or corrective measures, which could include removal of previously disposed substances and wastes, cleanup of contaminated property or performance of remedial plugging or pit closure operations to prevent future contamination, the costs of which could be substantial.
Water Discharges
The Clean Water Act (“CWA”) and comparable state laws impose restrictions and strict controls with respect to the discharge of pollutants, including spills and leaks of hazardous substances, into state waters and waters of the United States. The discharge of pollutants into regulated waters is prohibited, except in accordance with the terms of a permit issued by the EPA or an analogous state agency. Spill prevention, control and countermeasure plan requirements imposed under the CWA require appropriate containment berms and similar structures to help prevent the contamination of navigable waters in the event of a petroleum hydrocarbon tank spill, rupture or leak. In addition, the CWA and analogous state laws require individual permits or coverage under general permits for discharges of storm water runoff from certain types of facilities. Federal and state regulatory agencies can impose administrative, civil and criminal penalties for noncompliance with discharge permits or other CWA requirements and analogous state laws and regulations.
The CWA also prohibits the discharge of dredge and fill material into regulated waters, including wetlands, unless authorized by permit. The EPA and the U.S. Army Corps of Engineers issued final rules attempting to clarify the federal jurisdictional reach over waters of the United States (the “WOTUS”), but this rule has been stayed nationwide by the U.S. Court of Appeals for the Sixth Circuit while the appellate court and numerous federal district courts ponder lawsuits opposing implementation of the rule. The U.S. Supreme Court considered the issue of which court has jurisdiction to hear challenges to the WOTUS rule, and in January 2018 concluded that jurisdiction rests with the federal district courts. In addition, in 2017, President Trump issued an executive order directing the EPA and the U.S. Army Corps of Engineers to review the WOTUS rule and, if the agencies’ reviews find that the rule does not meet the executive order’s goal of promoting economic growth while reducing regulatory uncertainty, to initiate a new rulemaking to repeal or revise the rule. Pursuant to the executive order, in June 2017, the EPA and U.S. Army Corps of Engineers formally proposed to rescind the WOTUS rule. In January 2018, the EPA and the U.S. Army Corps of Engineers finalized a rule that would delay applicability of the WOTUS rule for two years. Repeal of or revisions to the WOTUS rule will require the EPA and the U.S. Army Corps of Engineers to initiate a rulemaking that is subject to public notice and comment, as well as judicial challenges. Substantial uncertainty exists with respect to future implementation of the WOTUS rule.
The primary federal law related specifically to oil spill liability is the Oil Pollution Act of 1990 (the “OPA”), which amends and augments the oil spill provisions of the CWA and imposes certain duties and liabilities on certain “responsible parties” related to the prevention of oil spills and damages resulting from such spills in or threatening waters of the United States or adjoining shorelines. For example, operators of certain oil and natural gas facilities must develop, implement and maintain facility response plans, conduct annual spill training for certain employees and provide varying degrees of financial assurance. Owners or operators of a facility, vessel or pipeline that is a source of an oil discharge or that poses the substantial threat of discharge is one type of “responsible party” who is liable. The OPA applies joint and several liability, without regard to fault, to each liable party for oil removal costs and a variety of public and private damages. Although defenses exist, they are limited. As such, a violation of the OPA has the potential to adversely affect our operations.
Subsurface Injections
In the course of our operations, we produce water in addition to natural gas, crude oil and NGLs. Water that is not recycled may be disposed of in disposal wells, which inject the produced water into non-producing subsurface formations. Underground injection operations are regulated pursuant to the Underground Injection Control (the “UIC”) program established under the federal Safe Drinking Water Act (the “SDWA”) and analogous state laws. The UIC program requires permits from the EPA or an analogous state agency for the construction and operation of disposal wells, establishes minimum standards for disposal well operations, and restricts the types and quantities of fluids that may be disposed. A change in UIC disposal well regulations or the inability to obtain permits for new disposal wells in the future may affect our ability to dispose of produced water and ultimately increase the cost of our operations. For example, in response to recent seismic events near below-ground disposal wells used for the injection of natural gas- and oil-related wastewaters, federal and some state agencies have begun investigating whether such wells have caused increased seismic activity, and some states have shut down or imposed moratoria on the use of such disposal
18
wells. In response to these concerns, regulators in some states have adopted, and other states are considering adopting, additional requirements related to seismic safety. These seismic events have also led to an increase in tort lawsuits filed against exploration and production companies, as well as the owners of underground injection wells. Increased costs associated with the transportation and disposal of produced water, including the cost of complying with regulations concerning produced water disposal, may reduce our profitability; however, these costs are commonly incurred by all oil, natural gas and NGL producers, and we do not believe that the costs associated with the disposal of produced water will have a material adverse effect on our operations.
Air Emissions
The federal Clean Air Act (“CAA”) and comparable state laws restrict the emission of air pollutants from many sources, such as tank batteries, through air emissions standards, construction and operating permitting programs and the imposition of other compliance standards. These laws and regulations may require us to obtain pre-approval for the construction or modification of certain projects or facilities expected to produce or significantly increase air emissions, obtain and strictly comply with stringent air permit requirements or utilize specific equipment or technologies to control emissions of certain pollutants. The need to obtain permits has the potential to delay the development of our projects. Recently, there has been increased regulation with respect to air emissions result from the oil and natural gas sector. For example, the EPA promulgated rules in 2012 under the CAA that subject oil and natural gas production, processing, transmission and storage operations to regulation under the New Source Performance Standards (“NSPS”), and a separate set of requirements to address certain hazardous air pollutants frequently associated with oil and natural gas production and processing activities pursuant to the National Emissions Standards for Hazardous Air Pollutants (“NESHAP”) program.
In June 2016, the EPA published final rules establishing new air emission controls for methane emissions from certain new, modified or reconstructed equipment and processes in the oil and natural gas source category, including production, processing, transmission and storage activities. The EPA’s final rules include NSPS to limit methane emissions from equipment and processes across the oil and natural gas source category. The rules also extend limitations on volatile organic compound (“VOC”) emissions to sources that were unregulated under the previous NSPS at Subpart OOOO. Affected methane and VOC sources include hydraulically fractured (or re-fractured) oil and natural gas well completions, fugitive emissions from well sites and compressors, and pneumatic pumps. Several states and industry groups have filed suit before the U.S. Court of Appeals for the D.C. Circuit (the “D.C. Circuit”) challenging the EPA’s implementation of the methane rule and the EPA’s legal authority to issue the methane rules. However, in April 2017, the EPA announced that it will review its methane rule for new, modified and reconstructed sources and to initiate reconsideration proceedings to potentially revise or rescind portions of the rule. In addition, the EPA issued a stay of the June 3, 2017 compliance date applicable to fugitive emissions monitoring requirements for 90 days. In July 2017, the D.C. Circuit found that the EPA decision to issue the stay was not permissible under the CAA and vacated the stay, but subsequently issued a revised opinion allowing the agency to stay implementation of the rule for two weeks. However, in June 2017 the EPA issued a proposed rulemaking to stay the requirements of Subpart OOOOa for a period of two years and to revisit implementation of Subpart OOOOa in its entirety. The EPA has not yet published a final rule, but, as a result of these developments, future implementation of the 2016 standards is uncertain at this time.
The Bureau of Land Management (the “BLM”) also finalized rules in November 2016 that seek to limit methane emissions from exploration and production activities on federal lands by imposing limitations on venting and flaring of natural gas, as well as requirements for the implementation of leak detection and repair programs for certain processes and equipment. However, President Trump issued an executive order directing the BLM to review and potentially repeal or revise the rule. In June 2017 and October 2017, the BLM announced its intention to delay compliance with the requirements of the BLM methane rule until the agency can issue a revised rule. Also in October 2017, a federal magistrate judge found that the BLM did not have the authority to cease enforcing the rule. In December 2017, the BLM petitioned the U.S. Court of Appeals for the Ninth Circuit to review and overturn the magistrate judge’s decision. Also in December 2017, the BLM issued a final rule postponing compliance dates for portions of the rule until January 17, 2019. As a result of these developments, substantial uncertainty exists with respect to its implementation.
The EPA also finalized separate rules under the CAA in June 2016 regarding criteria for aggregating multiple sites into a single source for air-quality permitting purposes applicable to the oil and natural gas industry. This rule could cause small facilities (such as tank batteries), on an aggregate basis, to be deemed a major source, thereby triggering more stringent air permitting requirements, which in turn could result in operational delays or require us to install costly pollution control equipment. In addition, in October 2015, the EPA issued a final rule under the CAA lowering the National Ambient Air Quality Standards (“NAAQS”) for ground-level ozone from the current standard of 75 parts per billion (“ppb”) for the current 8-hour primary and secondary ozone standards to 70 ppb for both standards. The final rule became effective on December 28, 2015. The EPA issued its anticipated area designations in November 2017 and December 2017. States are expected to implement more stringent permitting and pollution control requirements as a result of this new final rule, which could apply to our operations.
19
Compliance with one or more of these and other air pollution control and permitting requirements has the potential to delay the development of natural gas, oil and NGL projects and increase our costs of development and production, which costs could be significant.
Regulation of GHG Emissions
In response to findings that emissions of carbon dioxide, methane and other greenhouse gases (“GHGs”) endanger public health and the environment, the EPA has adopted regulations under existing provisions of the CAA that, among other things, establish Prevention of Significant Deterioration (“PSD”) preconstruction and Title V operating permit reviews for certain large stationary sources that are already potential major sources of certain principal, or criteria, pollutant emissions. Facilities required to obtain PSD permits for their GHG emissions will also be required to meet “best available control technology” standards that will typically be established by state agencies. In addition, the EPA has adopted rules requiring the monitoring and annual reporting of GHG emissions from large GHG emission sources in the United States, including certain onshore and offshore natural gas, oil and NGL production sources, which include certain of our operations. As discussed above, federal regulatory action regarding GHG emissions from the oil and gas sector has focused on methane emissions; however, federal implementation of the finalized 2016 methane rule is uncertain at this time (as also discussed above).
While Congress has, from time to time, considered legislation to reduce emissions of GHGs, no significant legislation has been adopted at the federal level. In the absence of such federal climate legislation, a number of state and regional cap-and-trade programs have emerged that typically require major sources of GHG emissions to acquire and surrender emission allowances in return for emitting those GHGs. In addition, the United States is one of almost 200 nations that, in December 2015, agreed to the Paris Agreement, an international climate change agreement in Paris, France that calls for countries to set their own GHG emissions targets and be transparent about the measures each country will take to achieve its GHG emissions targets. The Paris Agreement entered into force on November 4, 2016 upon achieving its threshold for ratification by signatory countries. A long-term goal of the Paris Agreement is to limit global warming to below two degrees Celsius by 2100 from temperatures in the pre-industrial era. However, the Paris Agreement does not impose any binding obligations on its participants. In June 2017, President Trump stated that the United States intends to withdraw from the Paris Agreement, but may enter into a future international agreement related to GHGs. In August 2017, the U.S. State Department officially informed the United Nations of its intent to withdraw from the Paris Agreement unless it is renegotiated. The Paris Agreement provides for a four-year exit process beginning when it took effect in November 2016, which would result in an effective exit date of November 2020. The United States adherence to the exit process is uncertain and the terms on which the United States may reenter the Paris Agreement or a separately negotiated agreement are unclear at this time.
Although it is not possible at this time to predict how new laws or regulations that may be adopted or issued to address GHG emissions would impact our business, any such future laws, regulations or legal requirements imposing reporting or permitting obligations on, or limiting emissions of GHGs from, our equipment and operations could require us to incur costs to reduce emissions of GHGs associated with our operations, as well as delay or restrict our ability to permit GHG emissions from new or modified sources. In addition, substantial limitations on GHG emissions could adversely affect demand for the natural gas, oil and NGLs we produce and lower the value of our reserves. Finally, it should be noted that increasing concentrations of GHGs in the Earth’s atmosphere may produce climate changes that have significant physical effects, such as increased frequency and severity of storms, floods, droughts and other extreme climatic events; if any such effects were to occur, they could have an adverse effect on our exploration and production operations.
Hydraulic Fracturing Activities
Hydraulic fracturing is an important and common practice that is used to stimulate production of oil, natural gas and NGLs from dense subsurface rock formations. We regularly use hydraulic fracturing as part of our operations. Hydraulic fracturing is typically regulated by state oil and natural gas commissions. However, several federal agencies have asserted regulatory authority over certain aspects of the process. For example, the EPA published final CAA regulations in 2012 and, more recently, in June 2016, establishing performance standards, including standards for the capture of air emissions released during oil and natural gas hydraulic fracturing, leak detection, and permitting; published in June 2016 an effluent limitation guideline final rule prohibiting the discharge of wastewater from onshore unconventional oil and natural gas extraction facilities to publicly owned wastewater treatment plants; and issued in 2014 a prepublication version of its Advance Notice of Proposed Rulemaking regarding Toxic Substances Control Act (“TSCA”) reporting of the chemical substances and mixtures used in hydraulic fracturing. Also, in March 2015, the BLM adopted rules establishing stringent standards relating to hydraulic fracturing on federal and American Indian lands. In June 2016, a federal district court judge in Wyoming struck down this final rule, finding that the BLM lacked authority to promulgate the rule. That ruling was appealed, but in September 2017 the U.S. Court of Appeals for the Tenth Circuit dismissed the appeal and remanded with directions to vacate the lower court’s opinion, leaving the final rule in place. However, following the issuance of an executive order by President Trump to review rules related to the energy industry, the BLM initiated a rulemaking to rescind the final rule in December 2017. Also, in December 2016, the EPA released its final report on the potential
20
impacts of hydraulic fracturing on drinking water resources. The final report concluded that “water cycle” activities associated with hydraulic fracturing may impact drinking water resources “under certain limited circumstances.”
From time to time, legislation has been introduced, but not enacted, in Congress to provide for federal regulation of hydraulic fracturing and to require disclosure of the chemicals used in the fracturing process. Meanwhile, the regulation of hydraulic fracturing has continued at the state level. For example, Wyoming has promulgated rules related to the public disclosure of substances used in hydraulic fluid, testing requirements for water wells near drilling sites and leak detection and repair requirements for fugitive emissions from oil and gas production facilities.
In the event that a new, federal level of legal restrictions relating to the hydraulic fracturing process is adopted in areas where we operate, we may incur additional costs to comply with such federal requirements that may be significant in nature, and also could become subject to additional permitting requirements and experience added delays or curtailment in the pursuit of exploration, development, or production activities.
Activities on Federal Lands
Oil and natural gas exploration, development and production activities on federal lands, including American Indian lands and lands administered by the BLM, are frequently subject to permitting delays. Operations on these lands are also subject to the National Environmental Policy Act (“NEPA”). NEPA requires federal agencies, including the BLM, to evaluate major actions having the potential to significantly impact the environment. In the course of such evaluations, an agency will prepare an Environmental Assessment that assesses the potential direct, indirect and cumulative impacts of a proposed project and, if necessary, will prepare a more detailed Environmental Impact Statement that may be made available for public review and comment. We currently have exploration, development and production activities on federal lands. Our proposed exploration, development and production activities are expected to include leasing of federal mineral interests, which will require the acquisition of governmental permits or authorizations that are subject to the requirements of NEPA. This process has the potential to delay or limit, or increase the cost of, the development of natural gas, oil and NGL projects. Authorizations under NEPA are also subject to protest, appeal or litigation, any or all of which may delay or halt projects. Moreover, depending on the mitigation strategies recommended in the Environmental Assessments or Environmental Impact Statements, we could incur added costs, which may be substantial.
ESA and Migratory Birds
The federal Endangered Species Act (“ESA”) and comparable state laws were established to protect endangered and threatened species. Pursuant to the ESA, if a species is listed as threatened or endangered, restrictions may be imposed on activities adversely affecting that species’ habitat. Similar protections are offered to migratory birds under the Migratory Bird Treaty Act. We may conduct operations on oil and natural gas leases in areas where certain species that are listed as threatened or endangered are known to exist and where other species that potentially could be listed as threatened or endangered under the ESA may exist. Moreover, as a result of a 2011 settlement agreement, the U.S. Fish and Wildlife Service (“FWS”) was required to make a determination on listing of numerous species as endangered or threatened under the ESA by no later than completion of the agency’s 2017 fiscal year. The FWS did not meet that deadline. If we were to have a portion of our leases designated as critical or suitable habitat, it could adversely impact the value of our leases. In addition, the federal government recently has issued indictments under the Migratory Bird Treaty Act to several oil and natural gas companies after migratory birds were found dead near reserve pits associated with drilling activities. The identification or designation of previously unprotected species as threatened or endangered in areas where underlying property operations are conducted could cause us to incur increased costs arising from species protection measures, time delays or limitations on our exploration and production activities, which could have an adverse impact on our ability to develop and produce reserves. If we were to have a portion of our leases designated as critical or suitable habitat, it could adversely impact the value of our leases.
OSHA
We are subject to the requirements of the Occupational Safety and Health Act (“OSHA”) and comparable state statutes whose purpose is to protect the health and safety of workers. In addition, the OSHA hazard communication standard, the Emergency Planning and Community Right-to-Know Act and comparable state statutes and any implementing regulations require that we organize and/or disclose information about hazardous materials used or produced in our operations and that this information be provided to employees, state and local governmental authorities and citizens.
Related Permits and Authorizations
Many environmental laws require us to obtain permits or other authorizations from state and/or federal agencies before initiating certain drilling, construction, production, operation or other activities and to maintain these permits and compliance with their requirements for ongoing operations. These permits are generally subject to protest, appeal or litigation, which can in certain cases delay or halt projects and cease production or operation of wells, pipelines and other operations.
21
Related Insurance
We maintain insurance against some risks associated with above or underground contamination that may occur as a result of our development activities. However, this insurance is limited to activities at the well site and there can be no assurance that this insurance will continue to be commercially available or that this insurance will be available at premium levels that justify its purchase by us. The occurrence of a significant event that is not fully insured or indemnified against could have a materially adverse effect on our financial condition and operations. Further, we have no coverage for gradual, long-term pollution events.
Employees
As of December 31, 2017, we had 119 full-time employees. We hire independent contractors on an as needed basis and have no collective bargaining agreements with our employees. We believe that our employee relationships are satisfactory.
Offices
Our principal executive offices are located at 1001 Seventeenth Street, Suite 1800, Denver, Colorado 80202, and our telephone number is (720) 499-1400. We also have office space in Jal, New Mexico, Midland, Texas, Sugar Land, Texas and Pecos, Texas.
Available Information
Our internet website address is www.cdevinc.com. We routinely post important information for investors on our website. Within our website’s investor relations section, we make available free of charge our annual report on Form 10-K, quarterly reports on Form 10-Q, current reports on Form 8-K, and amendments to those reports filed with or furnished to the SEC under applicable securities laws. These materials are made available as soon as reasonably practical after we electronically file such materials with or furnish such materials to the SEC. Information on our website is not incorporated by reference into this Annual Report on Form 10-K and should not be considered part of this document.
The public may also read and copy materials we file with the SEC at the SEC’s Public Reference Room, which is located at 100 F Street, NE, Room 1580, Washington, DC 20549. You can obtain information on the operation of the Public Reference Room by calling the SEC at 1-800-SEC-0330. The SEC also maintains a website that contains reports, proxy and information statements and other information regarding issuers that file electronically with the SEC at www.sec.gov.
22
ITEM 1A. RISK FACTORS
The nature of our business activities subjects us to certain hazards and risks. The following risks and uncertainties, together with other information set forth in this Annual Report on Form 10-K, should be carefully considered by current and future investors in our securities. These risks and uncertainties are not the only ones we face. Additional risks and uncertainties presently unknown to us or currently deemed immaterial also may impair our business operations. The occurrence of one or more of these risks or uncertainties could materially and adversely affect our business, our financial condition, and the results of our operations, which in turn could negatively impact the value of our securities.
Risks Related to the Oil and Natural Gas Industry and Our Business
Oil, natural gas and NGL prices are volatile. A sustained decline in oil, natural gas and NGL prices could adversely affect our business, financial condition and results of operations and our ability to meet our capital expenditure obligations and financial commitments.
The prices we receive for our oil, natural gas and NGLs production heavily influence our revenue, profitability, access to capital, future rate of growth and carrying value of our properties. Oil, natural gas and NGLs are commodities, and their prices may fluctuate widely in response to relatively minor changes in the supply of and demand for oil, natural gas and NGLs and market uncertainty. Historically, oil, natural gas and NGL prices have been volatile. For example, during the period from January 1, 2014 through December 31, 2017, the WTI spot price for oil has declined from a high of $107.95 per Bbl on June 20, 2014 to $26.19 per Bbl on February 11, 2016, and the Henry Hub spot price for natural gas has declined from a high of $8.15 per MMBtu on February 10, 2014 to a low of $1.49 per MMBtu on March 4, 2016. Likewise, NGLs, which are made up of ethane, propane, isobutene, normal butane and natural gasoline, all of which have different uses and different pricing characteristics, have suffered significant recent declines in realized prices. The prices we receive for our production and the levels of our production depend on numerous factors beyond our control, which include the following:
• | worldwide and regional economic conditions impacting the global supply and demand for oil, natural gas and NGLs; |
• | the price and quantity of foreign imports of oil, natural gas and NGLs; |
• | political and economic conditions in or affecting other producing regions or countries, including the Middle East, Africa, South America and Russia; |
• | actions of the Organization of the Petroleum Exporting Countries (“OPEC”), its members and other state-controlled oil companies relating to oil price and production controls; |
• | the level of global exploration, development and production; |
• | the level of global inventories; |
• | prevailing prices on local price indexes in the area in which we operate; |
• | the proximity, capacity, cost and availability of gathering and transportation facilities; |
• | localized and global supply and demand fundamentals and transportation availability; |
• | the cost of exploring for, developing, producing and transporting reserves; |
• | weather conditions and other natural disasters; |
• | technological advances affecting energy consumption; |
• | the price and availability of alternative fuels; |
• | expectations about future commodity prices; and |
• | U.S. federal, state and local and non-U.S. governmental regulation and taxes. |
These factors and the volatility of the energy markets make it extremely difficult to predict future oil and natural gas price movements with any certainty. Compared to 2015, our realized oil price for 2016 fell 6% to $39.91 per barrel and increased in 2017 to $48.17 per barrel. Similarly, our realized natural gas price for 2016 dropped 3% to $2.52 per Mcf and increased to $2.75 per Mcf in 2017, and our realized price for NGLs increased 2% to $15.01 per barrel and to $26.28 per barrel in 2017. If the prices of oil and natural gas continue at current levels or decline further, our operations, financial condition and level of expenditures for the development of our oil and natural gas reserves may be materially and adversely affected.
In addition, lower commodity prices may reduce our cash flows and borrowing ability. If we are unable to obtain needed capital or financing on satisfactory terms, our ability to develop future reserves could be adversely affected. Also, using lower prices in estimating proved reserves may result in a reduction in proved reserve volumes due to economic limits. In addition, sustained periods with oil and natural gas prices at levels lower than current WTI or Henry Hub strip prices and the resultant
23
effect such prices may have on our drilling economics and our ability to raise capital may require us to re-evaluate and postpone or eliminate our development drilling, which could result in the reduction of some of our proved undeveloped reserves and related standardized measure. If we are required to curtail our drilling program, we may be unable to continue to hold leases that are scheduled to expire, which may further reduce our reserves. As a result, a substantial or extended decline in commodity prices may materially and adversely affect our future business, financial condition, results of operations, liquidity and ability to finance planned capital expenditures.
Our development and acquisition projects require substantial capital expenditures. We may be unable to obtain required capital or financing on satisfactory terms, which could lead to a decline in our ability to access or grow production and reserves.
The oil and natural gas industry is capital-intensive. We make and expect to continue to make substantial capital expenditures related to development and acquisition projects. We have funded, and we expect that we will continue to fund, our capital expenditures with cash generated by operations and borrowings under CRP’s revolving credit facility; however, our financing needs may require us to alter or increase our capitalization substantially through the issuance of debt or equity securities or the sale of assets. The issuance of additional indebtedness would require that a portion of our cash flow from operations be used for the payment of interest and principal on our indebtedness, thereby reducing our ability to use cash flow from operations to fund working capital, capital expenditures and acquisitions. The actual amount and timing of our future capital expenditures may differ materially from our estimates as a result of, among other things, oil, natural gas and NGL prices; actual drilling results; the availability of drilling rigs and other services and equipment; and regulatory, technological and competitive developments. A reduction in commodity prices from current levels may result in a decrease in our actual capital expenditures, which would negatively impact our ability to grow production.
Our cash flow from operations and access to capital are subject to a number of variables, including:
• | the prices at which our production is sold; |
• | our proved reserves; |
• | the level of hydrocarbons we are able to produce from existing wells; |
• | our ability to acquire, locate and produce new reserves; |
• | the levels of our operating expenses; and |
• | CRP’s ability to borrow under its revolving credit facility and the ability to access the capital markets. |
If our revenues or the borrowing base under CRP’s revolving credit facility decrease as a result of lower oil, natural gas and NGL prices, operating difficulties, declines in reserves or for any other reason, we may have limited ability to obtain the capital necessary to sustain our operations at current levels. If additional capital is needed, we may not be able to obtain debt or equity financing on terms acceptable to us, if at all. If cash flow generated by our operations or available borrowings under CRP’s revolving credit facility are not sufficient to meet our capital requirements, the failure to obtain additional financing could result in a curtailment of our operations relating to development of our properties. This, in turn, could lead to a decline in our reserves and production, and could materially and adversely affect our business, financial condition and results of operations.
Part of our strategy involves using some of the latest available horizontal drilling and completion techniques, which involve risks and uncertainties in their application.
Our operations involve utilizing some of the latest drilling and completion techniques as developed by us and our service providers. Risks that we face while drilling horizontal wells include the following:
• | landing a wellbore in the desired drilling zone; |
• | staying in the desired drilling zone while drilling horizontally through the formation; |
• | running our casing the entire length of the wellbore; and |
• | being able to run tools and other equipment consistently through the horizontal wellbore. |
Risks that we face while completing wells include the following:
• | the ability to fracture stimulate the planned number of stages; |
• | the ability to run tools the entire length of the wellbore during completion operations; and |
• | the ability to successfully clean out the wellbore after completion of the final fracture stimulation stage. |
In addition, certain of the new techniques we are adopting may cause irregularities or interruptions in production due to offset wells being shut in and the time required to drill and complete multiple wells before any such wells begin producing.
24
Furthermore, the results of our drilling in new or emerging formations are more uncertain initially than drilling results in areas that are more developed and have a longer history of established production. Newer or emerging formations and areas have limited or no production history and, consequently, we are more limited in assessing future drilling results in these areas. If our drilling results are less than anticipated, the return on our investment for a particular project may not be as attractive as anticipated, and we could incur material write-downs of unevaluated properties and the value of our undeveloped acreage could decline in the future.
Drilling for and producing oil and natural gas are high risk activities with many uncertainties that could adversely affect our business, financial condition or results of operations.
Our future financial condition and results of operations will depend on the success of our development, acquisition and production activities, which are subject to numerous risks beyond our control, including the risk that drilling will not result in commercially viable oil and natural gas production.
Our decisions to develop or purchase prospects or properties will depend in part on the evaluation of data obtained through geophysical and geological analyses, production data and engineering studies, the results of which are often inconclusive or subject to varying interpretations. For a discussion of the uncertainty involved in these processes, see “—Reserve estimates depend on many assumptions that may turn out to be inaccurate. Any material inaccuracies in reserve estimates or underlying assumptions will materially affect the quantities and present value of our reserves.” In addition, our cost of drilling, completing and operating wells is often uncertain.
Further, many factors may curtail, delay or cancel our scheduled drilling projects, including the following:
• | delays imposed by or resulting from compliance with regulatory requirements, including limitations resulting from wastewater disposal, emission of GHGs and limitations on hydraulic fracturing; |
• | pressure or irregularities in geological formations; |
• | shortages of or delays in obtaining equipment and qualified personnel or in obtaining water and sand for hydraulic fracturing activities; |
• | equipment failures, accidents or other unexpected operational events; |
• | lack of available gathering facilities or delays in construction of gathering facilities; |
• | lack of available capacity on interconnecting transmission pipelines; |
• | adverse weather conditions; |
• | issues related to compliance with environmental regulations; |
• | environmental hazards, such as oil and natural gas leaks, oil spills, pipeline and tank ruptures and unauthorized discharges of brine, well stimulation and completion fluids, toxic gases or other pollutants into the surface and subsurface environment; |
• | declines in oil and natural gas prices; |
• | limited availability of financing at acceptable terms; |
• | title problems; and |
• | limitations in the market for oil and natural gas. |
Our derivative activities could result in financial losses or could reduce our earnings.
We enter into derivative instrument contracts for a portion of our oil and natural gas production from time to time. As of December 31, 2017, we had entered into basis swaps through December 2018 covering a total of 2,730 MBbls of our projected oil production at a weighted average differential of $0.06 per bbl. In addition, as of December 31, 2017, we had entered into basis swaps covering a total of 1.8 million MMBtu of our projected natural gas production through December 2018 and 1.8 million MMBtu through December 2019, both at a weighted average differential of $0.43 per MMBtu. Accordingly, our earnings may fluctuate significantly as a result of changes in fair value of our derivative instruments.
Derivative instruments also expose us to the risk of financial loss in some circumstances, including when:
• | production is less than the volume covered by the derivative instruments; |
• | the counterparty to the derivative instrument defaults on its contractual obligations; |
• | there is an increase in the differential between the underlying price in the derivative instrument and actual prices received; or |
25
• | there are issues with regard to legal enforceability of such instruments. |
The use of derivatives may, in some cases, require the posting of cash collateral with counterparties. If we enter into derivative instruments that require cash collateral and commodity prices or interest rates change in a manner adverse to us, our cash otherwise available for use in our operations would be reduced, which could limit our ability to make future capital expenditures and make payments on our indebtedness, and which could also limit the size of CRP’s borrowing base. Future collateral requirements will depend on arrangements with our counterparties, highly volatile oil and natural gas prices and interest rates. In addition, derivative arrangements could limit the benefit we would receive from increases in the prices for oil and natural gas, which could also have a material adverse effect on our financial condition.
Our commodity derivative contracts expose us to risk of financial loss if a counterparty fails to perform under a contract. Disruptions in the financial markets could lead to sudden decreases in a counterparty’s liquidity, which could make the counterparty unable to perform under the terms of the contract, and we may not be able to realize the benefit of the contract. We are unable to predict sudden changes in a counterparty’s creditworthiness or ability to perform. Even if we accurately predict sudden changes, our ability to negate the risk may be limited depending upon market conditions.
During periods of declining commodity prices, our derivative contract receivable positions generally increase, which increases our counterparty credit exposure. If the creditworthiness of our counterparties deteriorates and results in their nonperformance, we could incur a significant loss with respect to our commodity derivative contracts.
Reserve estimates depend on many assumptions that may turn out to be inaccurate. Any material inaccuracies in reserve estimates or underlying assumptions will materially affect the quantities and present value of our reserves.
The process of estimating oil and natural gas reserves is complex. It requires interpretations of available technical data and many assumptions, including assumptions relating to current and future economic conditions and commodity prices. Any significant inaccuracies in these interpretations or assumptions could materially affect the estimated quantities and present value of our reserves. In order to prepare reserve estimates, we must project production rates and timing of development expenditures. We must also analyze available geological, geophysical, production and engineering data. The extent, quality and reliability of this data can vary. The process also requires economic assumptions about matters such as oil and natural gas prices, drilling and operating expenses, capital expenditures, taxes and availability of funds.
Actual future production, oil and natural gas prices, revenues, taxes, development expenditures, operating expenses and quantities of recoverable oil and natural gas reserves may vary from our estimates. For instance, initial production rates reported by us or other operators may not be indicative of future or long-term production rates, our recovery efficiencies may be worse than expected, and production declines may be greater than our estimates and may be more rapid and irregular when compared to initial production rates. In addition, we may adjust reserve estimates to reflect additional production history, results of development activities, current commodity prices and other existing factors. Any significant variance could materially affect the estimated quantities and present value of our reserves.
You should not assume that the present value of future net revenues from our reserves is the current market value of our estimated reserves. We generally base the estimated discounted future net cash flows from reserves on prices and costs on the date of the estimate. Actual future prices and costs may differ materially from those used in the present value estimate. For example, our estimated proved reserves as of December 31, 2017, and related standardized measure were calculated under rules of the SEC using twelve-month trailing average benchmark prices of $47.79 per barrel of oil (WTI Posted) and $2.98 per MMBtu (Henry Hub spot), which may be substantially higher or lower than the available spot prices in 2018. If spot prices are below such calculated amounts, using more recent prices in estimating proved reserves may result in a reduction in proved reserve volumes due to economic limits.
We will not be the operator on all of our acreage or drilling locations, and, therefore, we will not be able to control the timing of exploration or development efforts, associated costs, or the rate of production of any non-operated assets.
As of December 31, 2017, we have leased or acquired approximately 84,718 net acres, approximately 91% of which we operate. As of December 31, 2017, we operated 181 producing horizontal wells. We will have limited ability to exercise influence over the operations of the drilling locations operated by our partners, and there is the risk that our partners may at any time have economic, business or legal interests or goals that are inconsistent with ours. Furthermore, the success and timing of development activities operated by our partners will depend on a number of factors that will be largely outside of our control, including:
• | the timing and amount of capital expenditures; |
• | the operator’s expertise and financial resources; |
• | the approval of other participants in drilling wells; |
• | the selection of technology; and |
26
• | the rate of production of reserves, if any. |
This limited ability to exercise control over the operations and associated costs of some of our drilling locations could prevent the realization of targeted returns on capital in drilling or acquisition activities.
Our identified drilling locations are scheduled out over many years, making them susceptible to uncertainties that could materially alter the occurrence or timing of their drilling. In addition, we may not be able to raise the amount of capital that would be necessary to drill such locations.
We have specifically identified and scheduled certain drilling locations as an estimation of our future multi-year drilling activities on our existing acreage. These drilling locations represent a significant part of our growth strategy. Our ability to drill and develop these locations depends on a number of uncertainties, including oil and natural gas prices, the availability and cost of capital, drilling and production costs, availability of drilling services and equipment, drilling results, lease expirations, gathering system and pipeline transportation constraints, access to and availability of water sourcing and distribution systems, regulatory approvals and other factors. Because of these uncertain factors, we do not know if the numerous identified drilling locations will ever be drilled or if we will be able to produce natural gas or oil from these or any other drilling locations. In addition, unless production is established within the spacing units covering the undeveloped acres on which some of the drilling locations are obtained, the leases for such acreage will expire. As such, our actual drilling activities may materially differ from those presently identified.
As a result of the limitations described above, we may be unable to drill many of our identified locations. In addition, we will require significant additional capital over a prolonged period in order to pursue the development of these locations, and we may not be able to raise or generate the capital required to do so. See “—Our development and acquisition projects require substantial capital expenditures. We may be unable to obtain required capital or financing on satisfactory terms, which could lead to a decline in our ability to access or grow production and reserves.” Any drilling activities we are able to conduct on these locations may not be successful or enable us to add additional proved reserves to our overall proved reserves or may result in a downward revision of our estimated proved reserves, which could have a material adverse effect on our future business and results of operations. Additionally, if we curtail our drilling program, we may lose a portion of our acreage through lease expirations.
Certain of our undeveloped leasehold acreage is subject to leases that will expire over the next several years unless production is established on units containing the acreage, the primary term is extended through continuous drilling provisions or the leases are renewed.
As of December 31, 2017, over 64% of our total net acreage was held by production. The leases for our net acreage not held by production will expire at the end of their primary term unless production is established in paying quantities under the units containing these leases, the leases are held beyond their primary terms under continuous drilling provisions or the leases are renewed. If our leases expire and we are unable to renew the leases, we will lose the right to develop the related properties. Our ability to drill and develop these locations depends on a number of uncertainties, including oil and natural gas prices, the availability and cost of capital, drilling and production costs, availability of drilling services and equipment, drilling results, lease expirations, gathering system and pipeline transportation constraints, access to and availability of water sourcing and distribution systems, regulatory approvals and other factors.
Adverse weather conditions may negatively affect our operating results and our ability to conduct drilling activities.
Adverse weather conditions may cause, among other things, increases in the costs of, and delays in, drilling or completing new wells, power failures, temporary shut-in of production and difficulties in the transportation of our oil, natural gas and NGLs. Any decreases in production due to poor weather conditions will have an adverse effect on our revenues, which will in turn negatively affect our cash flow from operations.
Our operations are substantially dependent on the availability of water. Restrictions on our ability to obtain water may have an adverse effect on our financial condition, results of operations and cash flows.
Water is an essential component of deep shale oil and natural gas production during both the drilling and hydraulic fracturing processes. Drought conditions have persisted in Texas in past years. These drought conditions have led governmental authorities to restrict the use of water subject to their jurisdiction for hydraulic fracturing to protect local water supplies. If we are unable to obtain water to use in our operations, we may be unable to economically produce oil and natural gas, which could have a material and adverse effect on our financial condition, results of operations and cash flows.
Our producing properties are located in the Delaware Basin, a sub-basin of the Permian Basin making us vulnerable to risks associated with operating in a single geographic area.
All of our producing properties are geographically concentrated in the Delaware Basin, a sub-basin of the Permian Basin, primarily in West Texas. At December 31, 2017, all of our total estimated proved reserves were attributable to properties located in this area. As a result of this concentration, we may be disproportionately exposed to the impact of regional supply and demand
27
factors, delays or interruptions of production from wells in this area caused by governmental regulation, processing or transportation capacity constraints, market limitations, availability of equipment and personnel, water shortages or other drought related conditions or interruption of the processing or transportation of oil, natural gas or NGLs.
The marketability of our production is dependent upon transportation and other facilities, certain of which we do not control. If these facilities are unavailable, our operations could be interrupted and our revenues reduced.
The marketability of our oil and natural gas production depends in part upon the availability, proximity and capacity of transportation facilities owned by third parties. Our oil production is transported from the wellhead to our tank batteries by our gathering systems. The oil is then transported by the purchaser by truck to a transportation facility. Our natural gas production is generally transported by third-party gathering lines from the wellhead to a gas processing facility. We do not control these trucks and other third-party transportation facilities and our access to them may be limited or denied. Insufficient production from our wells to support the construction of pipeline facilities by our purchasers or a significant disruption in the availability of our or third-party transportation facilities or other production facilities could adversely impact our ability to deliver to market or produce our oil and natural gas and thereby cause a significant interruption in our operations. If, in the future, we are unable, for any sustained period, to implement acceptable delivery or transportation arrangements or encounter production related difficulties, we may be required to shut in or curtail production. Any such shut-in or curtailment, or an inability to obtain favorable terms for delivery of the oil and natural gas produced from our fields, would materially and adversely affect our financial condition and results of operations.
We may incur losses as a result of title defects in the properties in which we invest.
The existence of a material title deficiency can render a lease worthless and can adversely affect our results of operations and financial condition. While we typically obtain title opinions prior to commencing drilling operations on a lease or in a unit, the failure of title may not be discovered until after a well is drilled, in which case we may lose the lease and the right to produce all or a portion of the minerals under the property.
The development of our estimated PUDs may take longer and may require higher levels of capital expenditures than we currently anticipate. Therefore, our estimated PUDs may not be ultimately developed or produced.
As of December 31, 2017, 60% of our total estimated proved reserves were classified as proved undeveloped. Development of these proved undeveloped reserves may take longer and require higher levels of capital expenditures than we currently anticipate. Delays in the development of our reserves, increases in costs to drill and develop such reserves or decreases in commodity prices will reduce the value of our estimated PUDs and future net revenues estimated for such reserves and may result in some projects becoming uneconomic. In addition, delays in the development of reserves could cause us to have to reclassify our PUDs as unproved reserves. Further, we may be required to write-down our PUDs if we do not drill those wells within five years after their respective dates of booking.
If commodity prices decrease to a level such that our future undiscounted cash flows from our properties are less than their carrying value, we may be required to take write-downs of the carrying values of our properties.
Accounting rules that we periodically review the carrying value of our properties for possible impairment. Based on prevailing commodity prices and specific market factors and circumstances at the time of prospective impairment reviews, and the continuing evaluation of development plans, production data, economics and other factors, we may be required to write-down the carrying value of our properties. A write-down constitutes a non-cash charge to earnings. Recently, commodity prices have declined significantly. Lower commodity prices in the future could result in impairments of our properties, which could have a material adverse effect on our results of operations for the periods in which such charges are taken.
Unless we replace our reserves with new reserves and develop those reserves, our reserves and production will decline, which would adversely affect our future cash flows and results of operations.
Producing oil and natural gas reservoirs generally are characterized by declining production rates that vary depending upon reservoir characteristics and other factors. Unless we conduct successful ongoing exploration and development activities or continually acquire properties containing proved reserves, our proved reserves will decline as those reserves are produced. Our future reserves and production, and therefore our future cash flow and results of operations, are highly dependent on our success in efficiently developing our current reserves and economically finding or acquiring additional recoverable reserves. We may not be able to develop, find or acquire sufficient additional reserves to replace our current and future production. If we are unable to replace our current and future production, the value of our reserves will decrease, and our business, financial condition and results of operations would be materially and adversely affected.
Conservation measures and technological advances could reduce demand for oil and natural gas.
Fuel conservation measures, alternative fuel requirements, increasing consumer demand for alternatives to oil and natural gas, technological advances in fuel economy and energy generation devices could reduce demand for oil and natural gas. The
28
impact of the changing demand for oil and natural gas may have a material adverse effect on our business, financial condition, results of operations and cash flows.
We depend upon a small number of significant purchasers for the sale of most of our oil, natural gas and NGL production.
We normally sell production to a relatively small number of customers, as is customary in our business. For the year ended December 31, 2017, sales to Shell Trading (US) Company (“Shell”), BP America and Eagleclaw Midstream Ventures, LLC accounted for 33%, 16% and 14%, respectively, of total revenue. For the year ended December 31, 2016, sales to Plains Marketing, LP (“Plains”), Shell and Permian Transport and Trading accounted for 48%, 22%, and 11%, respectively, of total revenue. For the year ended December 31, 2015, we only had one major customer, Plains, which accounted for 64% of total revenue. The loss of any of our major purchasers could materially and adversely affect our revenues in the short-term. However, based on the current demand for oil and natural gas and the availability of other purchasers, we believe that the loss of any major purchaser would not have a material adverse effect on our financial condition and results of operations because crude oil and natural gas are fungible products with well-established markets and numerous purchasers.
Our operations may be exposed to significant delays, costs and liabilities as a result of environmental and occupational health and safety requirements applicable to our business activities.
Our operations are subject to stringent and complex federal, state and local laws and regulations governing the discharge of materials into the environment, health and safety aspects of our operations or otherwise relating to environmental protection. These laws and regulations may impose numerous obligations applicable to our operations, including the acquisition of a permit or other approval before conducting regulated activities; the restriction of types, quantities and concentration of materials that can be released into the environment; the limitation or prohibition of drilling activities on certain lands lying within wilderness, wetlands and other protected areas; the application of specific health and safety criteria addressing worker protection; and the imposition of substantial liabilities for pollution resulting from our operations. Numerous governmental authorities, such as the EPA and analogous state agencies, have the power to enforce compliance with these laws and regulations and the permits issued under them. Such enforcement actions often involve taking difficult and costly compliance measures or corrective actions. Failure to comply with these laws and regulations may result in the assessment of sanctions, including administrative, civil or criminal penalties, natural resource damages, the imposition of investigatory or remedial obligations, and the issuance of orders limiting or prohibiting some or all of our operations. In addition, we may experience delays in obtaining, or be unable to obtain, required permits, which may delay or interrupt our operations and limit our growth and revenue.
Certain environmental laws impose strict joint and several liability for costs required to remediate and restore sites where hazardous substances, hydrocarbons or solid wastes have been stored or released. We may be required to remediate contaminated properties currently or formerly operated by us or facilities of third parties that received waste generated by our operations regardless of whether such contamination resulted from the conduct of others or from consequences of our own actions that were in compliance with all applicable laws at the time those actions were taken. In connection with certain acquisitions, we could acquire, or be required to provide indemnification against, environmental liabilities that could expose us to material losses. In addition, claims for damages to persons or property, including natural resources, may result from the environmental, health and safety impacts of our operations. Our insurance may not cover all environmental risks and costs or may not provide sufficient coverage if an environmental claim is made against us. Moreover, public interest in the protection of the environment has increased dramatically in recent years. The trend of more expansive and stringent environmental legislation and regulations applied to the crude oil and natural gas industry could continue, resulting in increased costs of doing business and consequently affecting profitability. To the extent laws are enacted or other governmental action is taken that restricts drilling or imposes more stringent and costly operating, waste handling, disposal and cleanup requirements, our business, prospects, financial condition or results of operations could be materially adversely affected.
We may incur substantial losses and be subject to substantial liability claims as a result of our operations. Additionally, we may not be insured for, or our insurance may be inadequate to protect us against, these risks.
We are not insured against all risks. Losses and liabilities arising from uninsured and underinsured events could materially and adversely affect our business, financial condition or results of operations.
29
Our development activities are subject to all of the operating risks associated with drilling for and producing oil and natural gas, including the possibility of:
• | environmental hazards, such as uncontrollable releases of oil, natural gas, brine, well fluids, toxic gas or other pollution into the environment, including groundwater, air and shoreline contamination; |
• | abnormally pressured formations; |
• | mechanical difficulties, such as stuck oilfield drilling and service tools and casing collapse; fire, explosions and ruptures of pipelines; |
• | personal injuries and death; |
• | natural disasters; and |
• | terrorist attacks targeting oil and natural gas related facilities and infrastructure. |
Any of these risks could adversely affect our ability to conduct operations or result in substantial loss to us as a result of claims for:
• | injury or loss of life; |
• | damage to and destruction of property, natural resources and equipment; |
• | pollution and other environmental damage; |
• | regulatory investigations and penalties; and |
• | repair and remediation costs. |
We may elect not to obtain insurance for any or all of these risks if we believe that the cost of available insurance is excessive relative to the risks presented. In addition, pollution and environmental risks generally are not fully insurable. The occurrence of an event that is not fully covered by insurance could have a material adverse effect on our business, financial condition and results of operations.
Properties that we decide to drill may not yield oil or natural gas in commercially viable quantities.
Properties that we decide to drill that do not yield oil or natural gas in commercially viable quantities will adversely affect our results of operations and financial condition. There is no way to predict in advance of drilling and testing whether any particular prospect will yield oil or natural gas in sufficient quantities to recover drilling or completion costs or to be economically viable. The use of micro-seismic data and other technologies and the study of producing fields in the same area will not enable us to know conclusively prior to drilling whether oil or natural gas will be present or, if present, whether oil or natural gas will be present in commercial quantities. We cannot assure you that the analogies we draw from available data from other wells, more fully explored prospects or producing fields will be applicable to our drilling prospects. Further, our drilling operations may be curtailed, delayed or canceled as a result of numerous factors, including:
• | unexpected drilling conditions; |
• | title problems; |
• | pressure or lost circulation in formations; |
• | equipment failure or accidents; |
• | adverse weather conditions; |
• | compliance with environmental and other governmental or contractual requirements; and |
• | increases in the cost of, shortages or delays in the availability of, electricity, supplies, materials, drilling or workover rigs, equipment and services. |
We may be unable to make attractive acquisitions or successfully integrate acquired businesses, and any inability to do so may disrupt our business and hinder our ability to grow.
In the future we may make acquisitions of assets or businesses that complement or expand our current business. However, there is no guarantee we will be able to identify attractive acquisition opportunities. In the event we are able to identify attractive acquisition opportunities, we may not be able to complete the acquisition or do so on commercially acceptable terms. Competition for acquisitions may also increase the cost of, or cause us to refrain from, completing acquisitions.
The success of any completed acquisition will depend on our ability to integrate effectively the acquired business into our existing operations. The process of integrating acquired businesses may involve unforeseen difficulties and may require a
30
disproportionate amount of our managerial and financial resources. In addition, possible future acquisitions may be larger and purchase prices higher than those paid for earlier acquisitions. No assurance can be given that we will be able to identify additional suitable acquisition opportunities, negotiate acceptable terms, obtain financing for acquisitions on acceptable terms or successfully acquire identified targets. Our failure to achieve consolidation savings, to integrate the acquired businesses and assets into our existing operations successfully or to minimize any unforeseen operational difficulties could have a material adverse effect on our financial condition and results of operations. In addition, debt agreements impose certain limitations on our ability to enter into mergers or combination transactions and our ability to incur certain indebtedness, which could indirectly limit our ability to engage in acquisitions of businesses.
Certain of our properties are subject to land use restrictions, which could limit the manner in which we conduct our business.
Certain of our properties are subject to land use restrictions, including city ordinances, which could limit the manner in which we conduct our business. Although none of our drilling locations associated with proved undeveloped reserves as of December 31, 2017 are on properties currently subject to such land use restrictions, such restrictions could affect, among other things, our access to and the permissible uses of our facilities as well as the manner in which we produce oil and natural gas and may restrict or prohibit drilling in general. The costs we incur to comply with such restrictions may be significant in nature, and we may experience delays or curtailment in the pursuit of development activities and perhaps even be precluded from the drilling of wells.
The unavailability or high cost of additional drilling rigs, equipment, supplies, personnel and oilfield services could adversely affect our ability to execute our development plans within our budget and on a timely basis.
The demand for drilling rigs, pipe and other equipment and supplies, as well as for qualified and experienced field personnel to drill wells and conduct field operations, geologists, geophysicists, engineers and other professionals in the oil and natural gas industry, can fluctuate significantly, often in correlation with oil and natural gas prices, causing periodic shortages. Our operations are concentrated in areas in which activity has increased rapidly, and as a result, demand for such drilling rigs, equipment and personnel, as well as access to transportation, processing and refining facilities in these areas, has increased, as have the costs for those items. To the extent that commodity prices continue to improve in the future, any delay or inability to secure the personnel, equipment, power, services, resources and facilities access necessary for us to resume or increase our development activities could result in production volumes being below our forecasted volumes. In addition, any such negative effect on production volumes, or significant increases in costs, could have a material adverse effect on our cash flow and profitability. Furthermore, if we are unable to secure a sufficient number of drilling rigs at reasonable costs, we may not be able to drill all of our acreage before our leases expire.
We could experience periods of higher costs if commodity prices rise. These increases could reduce our profitability, cash flow and ability to complete development activities as planned.
Historically, our capital and operating costs have risen during periods of increasing oil, natural gas and NGL prices. These cost increases result from a variety of factors beyond our control, such as increases in the cost of electricity, steel and other raw materials that we and our vendors rely upon; increased demand for labor, services and materials as drilling activity increases; and increased taxes. Such costs may rise faster than increases in our revenue as commodity prices rise, thereby negatively impacting our profitability, cash flow and ability to complete development activities as scheduled and on budget. This impact may be magnified to the extent that our ability to participate in the commodity price increases is limited by our derivative activities.
Should we fail to comply with all applicable FERC administered statutes, rules, regulations and orders, we could be subject to substantial penalties and fines.
Under the EP Act of 2005, FERC has civil penalty authority under the NGA and the NGPA to impose penalties for current violations of up to $1,238,271 million per day for each violation and disgorgement of profits associated with any violation. While our operations have not been regulated by FERC as a natural gas company under the NGA, FERC has adopted regulations that may subject certain of our otherwise non-FERC jurisdictional operations to FERC annual reporting and posting requirements. We also must comply with the anti-market manipulation rules enforced by FERC. Additional rules and legislation pertaining to those and other matters may be considered or adopted by FERC from time to time. Failure to comply with those regulations in the future could subject us to civil penalty liability.
Climate change laws and regulations restricting emissions of GHGs could result in increased operating costs and reduced demand for the oil and natural gas that we produce, while potential physical effects of climate change could disrupt our production and cause us to incur significant costs in preparing for or responding to those effects.
In response to findings that emissions of carbon dioxide, methane and other GHGs present an endangerment to public health and the environment, the EPA has adopted regulations pursuant to the CAA that, among other things, require PSD preconstruction and Title V operating permits for certain large stationary sources. Facilities required to obtain PSD permits for their GHG emissions are also required to meet “best available control technology” standards that are being established by the states or, in
31
some cases, by the EPA on a case-by-case basis. These regulatory requirements could adversely affect our operations and restrict or delay our ability to obtain air permits for new or modified sources. In addition, the EPA has adopted rules requiring the monitoring and reporting of GHG emissions from specified onshore and offshore oil and natural gas production sources in the United States, which include certain of our operations. Furthermore, in June 2016, the EPA finalized rules that establish new controls for emissions of methane from new, modified or reconstructed sources in the oil and natural gas source category, including production, processing, transmission and storage activities. The rule includes first-time standards to address emissions of methane from equipment and processes across the source category, including hydraulically fractured oil and natural gas well completions. However, the EPA has recently indicated that it intends to reconsider certain aspects of this rule, and in June 2017 issued a proposed rulemaking that would stay the requirements of the methane rule for a period of two years. The EPA has also announced that it intends to impose methane emission standards for existing sources as well but, to date, has not yet issued a proposal. Compliance with these rules will require enhanced record-keeping practices, the purchase of new equipment, such as optical gas imaging instruments to detect leaks, and increased frequency of maintenance and repair activities to address emissions leakage. The rules will also likely require additional personnel time to support these activities or the engagement of third party contractors to assist with and verify compliance. These new and proposed rules could result in increased compliance costs on our operations.
While Congress has from time to time considered legislation to reduce emissions of GHGs, there has not been significant activity in the form of adopted legislation to reduce GHG emissions at the federal level in recent years. In the absence of such federal climate legislation, a number of state and regional efforts have emerged that are aimed at tracking and/or reducing GHG emissions by means of cap-and-trade programs. These programs typically require major sources of GHG emissions to acquire and surrender emission allowances in return for emitting those GHGs. In addition, efforts have been made and continue to be made in the international community toward the adoption of international treaties or protocols that would address global climate change issues. Most recently, the United States became one of almost 200 nations that, in December 2015, agreed to the Paris Agreement, which requires member countries to review and “represent a progression” in their intended nationally determined contributions, which set GHG emission reduction goals, every five years beginning in 2020. The Paris Agreement entered into force in November 2016. In June 2017, President Trump announced that the United States plans to withdraw from the Paris Agreement and to seek negotiations either to reenter the Paris Agreement on different terms or establish a new framework. In August 2017, the U.S. Department of State officially informed the United Nations of the United States’ intent to withdraw from the Paris Agreement unless it is renegotiated. Although it is not possible at this time to predict how legislation or new regulations that may be adopted to address GHG emissions would impact our business, any such future laws and regulations imposing reporting obligations on, or limiting emissions of GHGs from, our equipment and operations could require us to incur costs to reduce emissions of GHGs associated with our operations. Substantial limitations on GHG emissions could adversely affect demand for the oil and natural gas we produce. Finally, some scientists have concluded that increasing concentrations of GHGs in the Earth’s atmosphere may produce climate changes that have significant physical effects, such as increased frequency and severity of storms, floods and other climatic events; if any such effects were to occur, they could have a material adverse effect on our operations.
Federal, state and local legislative and regulatory initiatives relating to hydraulic fracturing as well as governmental reviews of such activities could result in increased costs and additional operating restrictions or delays in the completion of oil and natural gas wells and adversely affect our production.
Hydraulic fracturing is an important and common practice that is used to stimulate production of oil and/or natural gas from dense subsurface rock formations. The hydraulic fracturing process involves the injection of water, proppants and chemicals under pressure into targeted subsurface formations to fracture the surrounding rock and stimulate production. We regularly use hydraulic fracturing as part of our operations. Hydraulic fracturing is typically regulated by state oil and natural gas commissions, but the EPA has asserted federal regulatory authority pursuant to the SDWA over certain hydraulic fracturing activities involving the use of diesel fuels and published permitting guidance in February 2014 addressing the performance of such activities using diesel fuels. The EPA has also issued final regulations under the CAA establishing performance standards, including standards for the capture of air emissions released during hydraulic fracturing (although the Trump Administration has indicated an intent to review this rule), and advanced notice of proposed rulemaking under the Toxic Substances Control Act to require companies to disclose information regarding the chemicals used in hydraulic fracturing, and also finalized rules in 2016 that prohibit the discharge of wastewater from hydraulic fracturing operations to publicly owned wastewater treatment plants. In addition, the BLM finalized rules in March 2015 that impose new or more stringent standards for performing hydraulic fracturing on federal and American Indian lands (which was challenged in a U.S. federal trial court, resulting in a decision in June 2016 against the rule, an appeal of that decision, and a U.S. federal appeals court ruling in September 2017 dismissing the appeals and vacating the trial court decision); the rule is currently the subject of a December 2017 final rulemaking by the BLM to rescind it. In addition, Congress has from time to time considered legislation to provide for federal regulation of hydraulic fracturing under the SDWA and to require disclosure of the chemicals used in the hydraulic fracturing process. It is unclear how any additional federal regulation of hydraulic fracturing activities may affect our operations.
32
Certain governmental reviews are either underway or being proposed that focus on environmental aspects of hydraulic fracturing practices. The White House Council on Environmental Quality is coordinating an administration-wide review of hydraulic fracturing practices. Additionally, in December 2016, the EPA released its final report on the potential impacts of hydraulic fracturing on drinking water resources. The EPA report concluded that hydraulic fracturing activities have not led to widespread, systemic impacts on drinking water resources in the United States, although there are above-and-below ground mechanisms by which hydraulic fracturing activities have the potential to impact drinking water resources. Other governmental agencies, including the United States Department of Energy and the United States Department of the Interior, are evaluating various other aspects of hydraulic fracturing. These ongoing or proposed studies could spur initiatives to further regulate hydraulic fracturing under the federal SDWA or other regulatory mechanisms.
At the state level, several states have adopted or are considering legal requirements that could impose more stringent permitting, disclosure and well construction requirements on hydraulic fracturing activities. For example, in May 2013, the Railroad Commission of Texas issued a “well integrity rule,” which updates the requirements for drilling, putting pipe down and cementing wells. The rule also includes new testing and reporting requirements, such as (i) the requirement to submit cementing reports after well completion or after cessation of drilling, whichever is later, and (ii) the imposition of additional testing on wells less than 1,000 feet below usable groundwater. The well integrity rule took effect in January 2014. Local governments also may seek to adopt ordinances within their jurisdictions regulating the time, place and manner of drilling activities in general or hydraulic fracturing activities in particular. We believe that we follow applicable standard industry practices and legal requirements for groundwater protection in our hydraulic fracturing activities. Nonetheless, if new or more stringent federal, state or local legal restrictions relating to the hydraulic fracturing process are adopted in areas where we operate, we could incur potentially significant added costs to comply with such requirements, experience delays or curtailment in the pursuit of development activities, and perhaps even be precluded from drilling wells.
Legislation or regulatory initiatives intended to address seismic activity could restrict our drilling and production activities, as well as our ability to dispose of saltwater gathered from such activities, which could have a material adverse effect on our business.
State and federal regulatory agencies recently have focused on a possible connection between the hydraulic fracturing related activities and the increased occurrence of seismic activity, and regulatory agencies at all levels are continuing to study the possible linkage between oil and gas activity and induced seismicity. For example, in 2015, the United States Geological Study identified eight states, including Texas, with areas of increased rates of induced seismicity that could be attributed to fluid injection or oil and gas extraction. In addition, a number of lawsuits have been filed in other states, most recently in Oklahoma, alleging that disposal well operations have caused damage to neighboring properties or otherwise violated state and federal rules regulating waste disposal. In response to these concerns, regulators in some states are seeking to impose additional requirements, including requirements in the permitting of saltwater disposal wells or otherwise to assess any relationship between seismicity and the use of such wells. For example, in October 2014, the Railroad Commission of Texas published a new rule governing permitting or re-permitting of disposal wells that would require, among other things, the submission of information on seismic events occurring within a specified radius of the disposal well location, as well as logs, geologic cross sections and structure maps relating to the disposal area in question. If the permittee or an applicant of a disposal well permit fails to demonstrate that the saltwater or other fluids are confined to the disposal zone or if scientific data indicates such a disposal well is likely to be or determined to be contributing to seismic activity, then the agency may deny, modify, suspend or terminate the permit application or existing operating permit for that well.
We dispose of large volumes of saltwater gathered from our drilling and production operations pursuant to permits issued to us by governmental authorities overseeing such disposal activities. While these permits are issued pursuant to existing laws and regulations, these legal requirements are subject to change, which could result in the imposition of more stringent operating constraints or new monitoring and reporting requirements, owing to, among other things, concerns of the public or governmental authorities regarding such gathering or disposal activities. The adoption and implementation of any new laws or regulations that restrict our ability to use hydraulic fracturing or dispose of saltwater gathered from our drilling and production activities by limiting volumes, disposal rates, disposal well locations or otherwise, or requiring us to shut down disposal wells, could have a material adverse effect on our business, financial condition and results of operations.
Competition in the oil and natural gas industry is intense, making it more difficult for us to acquire properties, market oil or natural gas and secure trained personnel.
Our ability to acquire additional prospects and to find and develop reserves in the future will depend on our ability to evaluate and select suitable properties and to consummate transactions in a highly competitive environment for acquiring properties, marketing oil and natural gas and securing trained personnel. Also, there is substantial competition for capital available for investment in the oil and natural gas industry. Many of our competitors possess and employ financial, technical and personnel resources substantially greater than ours. Those companies may be able to pay more for productive properties and exploratory prospects and to evaluate, bid for and purchase a greater number of properties and prospects than our financial or personnel
33
resources permit. In addition, other companies may be able to offer better compensation packages to attract and retain qualified personnel than we are able to offer. The cost to attract and retain qualified personnel has increased over the past three years due to competition and may increase substantially in the future. We may not be able to compete successfully in the future in acquiring prospective reserves, developing reserves, marketing hydrocarbons, attracting and retaining quality personnel and raising additional capital, which could have a material adverse effect on our business.
The loss of senior management or technical personnel could adversely affect operations.
We depend on the services of our senior management and technical personnel. We do not maintain, nor do we plan to obtain, any insurance against the loss of any of these individuals. The loss of the services of our senior management or technical personnel could have a material adverse effect on our business, financial condition and results of operations.
Increases in interest rates could adversely affect our business.
Our business and operating results can be harmed by factors such as the availability, terms of and cost of capital, increases in interest rates or a reduction in credit rating. These changes could cause our cost of doing business to increase, limit our ability to pursue acquisition opportunities, reduce cash flow used for drilling and place us at a competitive disadvantage. At December 31, 2017, we had no borrowings outstanding under its credit facility. Interest is calculated under the terms of CRP’s credit agreement based on a LIBOR spread. Recent and continuing disruptions and volatility in the global financial markets may lead to a contraction in credit availability impacting our ability to finance operations. We require continued access to capital. A significant reduction in cash flows from operations or the availability of credit could materially and adversely affect our ability to achieve our planned growth and operating results.
We may be subject to risks in connection with acquisitions of properties.
The successful acquisition of producing properties requires an assessment of several factors, including:
• | recoverable reserves; |
• | future oil and natural gas prices and their applicable differentials; |
• | operating costs; and |
• | potential environmental and other liabilities. |
The accuracy of these assessments is inherently uncertain. In connection with these assessments, we perform a review of the subject properties that we believe to be generally consistent with industry practices. Our review will not reveal all existing or potential problems, nor will it permit us to become sufficiently familiar with the properties to fully assess their deficiencies and capabilities. Inspections may not always be performed on every well, and environmental problems, such as groundwater contamination, are not necessarily observable even when an inspection is undertaken. Even when problems are identified, the seller may be unwilling or unable to provide effective contractual protection against all or part of the problems. We often are not entitled to contractual indemnification for environmental liabilities and acquire properties on an “as is” basis.
Our use of seismic data is subject to interpretation and may not accurately identify the presence of oil and natural gas, which could adversely affect the results of our drilling operations.
Even when properly used and interpreted, seismic data and visualization techniques are only tools used to assist geoscientists in identifying subsurface structures and hydrocarbon indicators and do not enable the interpreter to know whether hydrocarbons are, in fact, present in those structures. As a result, our drilling activities may not be successful or economical. In addition, the use of advanced technologies, such as 3-D seismic data, requires greater pre-drilling expenditures than traditional drilling strategies, and we could incur losses as a result of such expenditures.
Restrictions on drilling activities intended to protect certain species of wildlife may adversely affect our ability to conduct drilling activities in areas where we operate.
Oil and natural gas operations in our operating areas may be adversely affected by seasonal or permanent restrictions on drilling activities designed to protect various wildlife. Seasonal restrictions may limit our ability to operate in protected areas and can intensify competition for drilling rigs, oilfield equipment, services, supplies and qualified personnel, which may lead to periodic shortages when drilling is allowed. These constraints and the resulting shortages or high costs could delay our operations or materially increase our operating and capital costs. Permanent restrictions imposed to protect endangered species could prohibit drilling in certain areas or require the implementation of expensive mitigation measures. The designation of previously unprotected species in areas where we operate as threatened or endangered could cause us to incur increased costs arising from species protection measures or could result in limitations on our activities that could have a material and adverse impact on our ability to develop and produce our reserves.
34
The enactment of derivatives legislation could have an adverse effect on our ability to use derivative instruments to reduce the effect of commodity price, interest rate and other risks associated with our business.
The Dodd-Frank Act, enacted on July 21, 2010, established federal oversight and regulation of the over-the-counter derivatives market and entities, such as us, that participate in that market. The Dodd-Frank Act requires the CFTC and the SEC to promulgate rules and regulations implementing the Dodd-Frank Act. In October 2011, the CFTC issued regulations to set position limits for certain futures and option contracts in the major energy markets and for swaps that are their economic equivalents. The initial position limits rule was vacated by the United States District Court for the District of Columbia in September 2012. However, in November 2013, the CFTC proposed new rules that would place limits on positions in certain core futures and equivalent swaps contracts for or linked to certain physical commodities, subject to exceptions for certain bona fide hedging transactions. As these new position limit rules are not yet final, the impact of those provisions on us is uncertain at this time.
The CFTC has designated certain interest rate swaps and credit default swaps for mandatory clearing. The CFTC has not yet proposed rules designating any other classes of swaps, including physical commodity swaps, for mandatory clearing. In addition, certain banking regulators and the CFTC have recently adopted final rules establishing minimum margin requirements for uncleared swaps. Although we expect to qualify for the end-user exception from such margin requirements for swaps entered into to hedge our commercial risks, the application of such requirements to other market participants, such as swap dealers, may change the cost and availability of the swaps that we use for hedging. If any of our swaps do not qualify for the commercial end-user exception, posting of collateral could impact liquidity and reduce cash available to us for capital expenditures, therefore reducing our ability to execute hedges to reduce risk and protect cash flow.
The full impact of the Dodd-Frank Act and related regulatory requirements upon our business will not be known until the regulations are implemented and the market for derivatives contracts has adjusted. The Dodd-Frank Act and any new regulations could significantly increase the cost of derivative contracts, materially alter the terms of derivative contracts, reduce the availability of derivatives to protect against risks we encounter, and reduce our ability to monetize or restructure our existing derivative contracts. If we reduce our use of derivatives as a result of the Dodd-Frank Act and regulations, our results of operations may become more volatile and our cash flows may be less predictable, which could adversely affect our ability to plan for and fund capital expenditures. Finally, the Dodd-Frank Act was intended, in part, to reduce the volatility of oil and natural gas prices, which some legislators attributed to speculative trading in derivatives and commodity instruments related to oil and natural gas. Our revenues could therefore be adversely affected if a consequence of the Dodd-Frank Act and implementing regulations is to lower commodity prices. Any of these consequences could have a material and adverse effect on us and our financial condition.
In addition, the European Union and other non-U.S. jurisdictions are implementing regulations with respect to the derivatives market. To the extent we transact with counterparties in foreign jurisdictions, we may become subject to such regulations, the impact of which is not clear at this time.
The standardized measure of our estimated reserves is not an accurate estimate of the current fair value of our estimated oil and natural gas reserves.
Standardized measure is a reporting convention that provides a common basis for comparing oil and natural gas companies subject to the rules and regulations of the SEC. Standardized measure requires the use of specific pricing as required by the SEC as well as operating and development costs prevailing as of the date of computation. Consequently, it may not reflect the prices ordinarily received or that will be received for oil and natural gas production because of varying market conditions, nor may it reflect the actual costs that will be required to produce or develop the oil and natural gas properties. As a result, estimates included herein of future net cash flow may be materially different from the future net cash flows that are ultimately received, and the standardized measure of our estimated reserves included in this Annual Report on Form 10-K should not be construed as accurate estimates of the current fair value of our proved reserves.
We may not be able to keep pace with technological developments in our industry.
The oil and natural gas industry is characterized by rapid and significant technological advancements and introductions of new products and services using new technologies. As others use or develop new technologies, we may be placed at a competitive disadvantage or may be forced by competitive pressures to implement those new technologies at substantial costs. In addition, other oil and natural gas companies may have greater financial, technical and personnel resources that allow them to enjoy technological advantages and that may in the future allow them to implement new technologies before we can. We may not be able to respond to these competitive pressures or implement new technologies on a timely basis or at an acceptable cost. If one or more of the technologies we use now or in the future were to become obsolete, our business, financial condition or results of operations could be materially and adversely affected.
35
A security interruption or failure with respect to our information technology systems could harm our ability to effectively operate our business.
Our ability to effectively manage and operate our business depends significantly on information technology systems. The failure of these systems to operate effectively and support our operations, challenges in transitioning to upgraded or replacement systems, difficulty in integrating new or updated systems, or a breach in security of these systems could adversely impact the operations of our business.
Any breach of our network may result in the loss of valuable business data, misappropriation of our customers’ or employees’ personal information, or a disruption of our business, which could harm our customer relationships and reputation, and result in lost revenues, fines or lawsuits.
Moreover, we must comply with increasingly complex and rigorous regulatory standards enacted to protect business and personal data. Any failure to comply with these regulatory standards could subject us to legal and reputational risks. Misuse of or failure to secure personal information could also result in violation of data privacy laws and regulations, proceedings against us by governmental entities or others, damage to our reputation and credibility, and could have a negative impact on revenues and profits.
Changes in laws or regulations, or a failure to comply with any laws and regulations, may adversely affect our business, investments and results of operations.
We are subject to laws, regulations and rules enacted by national, regional and local governments and NASDAQ. In particular, we are required to comply with certain SEC, NASDAQ and other legal or regulatory requirements. Compliance with, and monitoring of, applicable laws, regulations and rules may be difficult, time consuming and costly. Those laws, regulations and rules and their interpretation and application may also change from time to time and those changes could have a material adverse effect on our business, investments and results of operations. In addition, a failure to comply with applicable laws, regulations and rules, as interpreted and applied, could have a material adverse effect on our business and results of operations.
Unanticipated changes in effective tax rates or adverse outcomes resulting from examination of our income or other tax returns could adversely affect our financial condition and results of operations.
We are subject to income taxes in the United States, and our domestic tax liabilities are subject to the allocation of expenses in differing jurisdictions. Our future effective tax rates could be subject to volatility or adversely affected by a number of factors, including:
• | changes in the valuation of our deferred tax assets and liabilities; |
• | expected timing and amount of the release of any tax valuation allowances; |
• | tax effects of stock-based compensation; |
• | costs related to intercompany restructurings; |
• | changes in tax laws, regulations or interpretations thereof; or |
• | lower than anticipated future earnings in jurisdictions where we have lower statutory tax rates and higher than anticipated future earnings in jurisdictions where we have higher statutory tax rates. |
In addition, we may be subject to audits of our income, sales and other transaction taxes by U.S. federal and state authorities. Outcomes from these audits could have an adverse effect on our financial condition and results of operations.
The recently passed comprehensive tax reform bill could adversely affect our business and financial condition.
On December 22, 2017, President Trump signed into law H.R. 1 (commonly referred to as the “Jobs Act”), a comprehensive tax reform bill that significantly reforms the Internal Revenue Code of 1986, as amended. The Jobs Act, among other things, contains significant changes to corporate taxation, including a permanent reduction of the corporate income tax rate, a partial limitation on the deductibility of business interest expense, limitation of the deduction for certain net operating losses to 80% of current year taxable income, an indefinite net operating loss carryforward, immediate deductions for certain new investments instead of deductions for depreciation expense over time and the modification or repeal of many business deductions and credits. We continue to examine the impact of this tax reform legislation, and as its overall impact is uncertain, we note that the Jobs Act could adversely affect our business and financial condition. The impact of this tax reform legislation on holders of our common stock is also uncertain and could be adverse.
36
Risks Related to Our Indebtedness
Our leverage and debt service obligations may adversely affect our financial condition, results of operations, business prospects and our ability to make payments on our outstanding debt.
As of December 31, 2017, we had approximately $390.8 million of total long-term debt and additional borrowing capacity of $474.1 million under CRP’s revolving credit facility (after giving effect to $0.9 million of outstanding letters of credit). Our level of indebtedness could affect our operations in several ways, including the following:
• | require us to dedicate a substantial portion of our cash flow from operations to service our existing debt, thereby reducing the cash available to finance our operations and other business activities; |
• | limit management’s discretion in operating our business and our flexibility in planning for, or reacting to, changes in our business and the industry in which we operate; |
• | increase our vulnerability to downturns and adverse developments in our business and the economy generally; |
• | limit our ability to access the capital markets to raise capital on favorable terms or to obtain additional financing for working capital, capital expenditures, acquisitions, general corporate or other expenses or to refinance existing indebtedness; |
• | place restrictions on our ability to obtain additional financing, make investments, lease equipment, sell assets and engage in business combinations; |
• | make it more likely that a reduction in CRP’s borrowing base following a periodic redetermination could require CRP to repay a portion of its then-outstanding bank borrowings; |
• | make us vulnerable to increases in interest rates as the indebtedness under CRP’s revolving credit facility may vary with prevailing interest rates; |
• | place us at a competitive disadvantage relative to our competitors with lower levels of indebtedness in relation to their overall size or less restrictive terms governing their indebtedness; and |
• | make it more difficult for CRP to satisfy its obligations under its debt and increase the risk that we may default on its debt obligations. |
CRP may incur substantial additional indebtedness, which could further exacerbate the risks that we may face.
Subject to the restrictions in the instruments governing CRP’s outstanding indebtedness (including CRP’s revolving credit facility and senior notes), CRP and its subsidiaries may incur substantial additional indebtedness (including secured indebtedness) in the future. Although the instruments governing CRP’s outstanding indebtedness do contain restrictions on the incurrence of additional indebtedness, these restrictions will be subject to waiver and a number of significant qualifications and exceptions, and indebtedness incurred in compliance with these restrictions could be substantial. As of December 31, 2017, CRP had additional borrowing capacity of $474.1 million under its revolving credit facility (after giving effect to $0.9 million of outstanding letters of credit), all of which would be secured if borrowed.
Any increase in CRP’s level of indebtedness will have several important effects on our future operations, including, without limitation:
• | we will have additional cash requirements in order to support the payment of interest on CRP’s outstanding indebtedness; |
• | increases in CRP’s outstanding indebtedness and leverage will increase our vulnerability to adverse changes in general economic and industry conditions, as well as to competitive pressure; and |
• | depending on the levels of CRP’s outstanding indebtedness, our ability to obtain additional financing for working capital, capital expenditures, general corporate and other purposes may be limited. |
We may not be able to generate sufficient cash to service all of CRP’s indebtedness and may be forced to take other actions to satisfy CRP’s obligations under applicable debt instruments, which may not be successful.
CRP’s ability to make scheduled payments on or to refinance its indebtedness depends on our financial condition and operating performance, which are subject to prevailing economic and competitive conditions and certain financial, business and other factors beyond our control. We may not be able to maintain a level of cash flows from operating activities sufficient to permit CRP to pay the principal, premium, if any, and interest on CRP’s indebtedness.
37
If our cash flows and capital resources are insufficient to fund debt service obligations, we may be forced to reduce or delay investments and capital expenditures, sell assets, seek additional capital or restructure or refinance indebtedness. Our ability to restructure or refinance CRP’s indebtedness will depend on the condition of the capital markets and our financial condition at such time. Any refinancing of indebtedness could be at higher interest rates and may require CRP to comply with more onerous covenants, which could further restrict business operations. The terms of existing or future debt instruments may restrict us from adopting some of these alternatives. In addition, any failure to make payments of interest and principal on outstanding indebtedness on a timely basis would likely result in a reduction of our credit rating, which could harm CRP’s ability to incur additional indebtedness. In the absence of sufficient cash flows and capital resources, we could face substantial liquidity problems and might be required to dispose of material assets or operations to meet debt service and other obligations. The agreements governing CRP’s indebtedness restrict CRP’s ability to dispose of assets and CRP’s use of the proceeds from such disposition. CRP may not be able to consummate those dispositions, and the proceeds of any such disposition may not be adequate to meet any debt service obligations then due. These alternative measures may not be successful and may not permit CRP to meet scheduled debt service obligations.
Restrictions in CRP’s existing and future debt agreements could limit our growth and ability to engage in certain activities.
CRP’s credit agreement and the indenture governing its senior notes contain a number of significant covenants, including restrictive covenants that may limit CRP’s ability to, among other things:
• | incur additional indebtedness; |
• | make loans to others; |
• | make investments; |
• | merge or consolidate with another entity; |
• | make certain payments; |
• | hedge future production or interest rates; |
• | incur liens; |
• | sell assets; and |
• | engage in certain other transactions without the prior consent of the lenders. |
In addition, CRP’s credit agreement requires us to maintain certain financial ratios or to reduce our indebtedness if we are unable to comply with such ratios. As of December 31, 2017, we were in full compliance with such financial ratios and covenants.
The restrictions in CRP’s debt agreements may also limit our ability to obtain future financings to withstand a future downturn in our business or the economy in general, or to otherwise conduct necessary corporate activities. We may also be prevented from taking advantage of business opportunities that arise because of the limitations that the restrictive imposed on CRP.
A breach of any covenant in CRP’s debt agreements would result in a default under the applicable agreement after any applicable grace periods. A default, if not waived, could result in acceleration of the indebtedness outstanding under CRP’s credit agreement and in a default with respect to, and an acceleration of, the indebtedness outstanding under other debt agreements. The accelerated indebtedness would become immediately due and payable. If that occurs, we may not be able to make all of the required payments or borrow sufficient funds to refinance such indebtedness. Even if new financing were available at that time, it may not be on terms that are acceptable to us.
If CRP is unable to comply with the restrictions and covenants in the agreements governing its indebtedness, there could be a default under the terms of these agreements, which could result in an acceleration of payment of funds that CRP has borrowed.
Any default under the agreements governing CRP’s indebtedness that is not cured or waived by the required lenders, and the remedies sought by the holders of any such indebtedness, could make CRP unable to pay principal, premium, if any, and interest on such indebtedness. If we are unable to generate sufficient cash flow and are otherwise unable to obtain funds necessary to meet required payments of principal, premium, if any, and interest on CRP’s indebtedness, or if CRP otherwise fails to comply with the various covenants, including financial and operating covenants, in the agreements governing CRP’s indebtedness, CRP could be in default under the terms of the agreements governing such indebtedness. In the event of such default:
• | the holders of such indebtedness could elect to declare all the funds borrowed thereunder to be due and payable, together with accrued and unpaid interest; |
38
• | the lenders under CRP’s revolving credit facility could elect to terminate their commitments thereunder, cease making further loans and institute foreclosure proceedings against our assets; and |
• | we could be forced into bankruptcy or liquidation. |
If our operating performance declines, we may in the future need to obtain waivers under CRP’s revolving credit facility to avoid CRP being in default. If CRP breaches the covenants under its revolving credit facility and seeks a waiver, CRP may not be able to obtain a waiver from the required lenders. If this occurs, CRP would be in default under the revolving credit facility, the lenders could exercise their rights, as described above, and we could be forced into bankruptcy or liquidation.
Any significant reduction in the borrowing base under CRP’s revolving credit facility as a result of the periodic borrowing base redeterminations or otherwise may negatively impact our ability to fund our operations.
CRP’s revolving credit facility limits the amounts CRP can borrow up to a borrowing base amount, which the lenders, in their sole discretion, determine semiannually on April 1 and October 1. The borrowing base depends on, among other things, projected revenues from, and asset values of, the oil and natural gas properties securing the loan. The borrowing base will automatically be decreased by an amount equal to 25% of the aggregate notional amount of issued permitted senior unsecured notes. The lenders can unilaterally adjust the borrowing base and the borrowings permitted to be outstanding under CRP’s revolving credit facility. Any increase in the borrowing base requires the consent of the lenders holding 100% of the commitments. The borrowing base under the revolving credit facility is $575 million; however, on December 1, 2017, CRP entered into an amendment to the credit agreement to, among other things, reflect CRP’s election to voluntarily reduce the commitments and borrowing base under the credit agreement to $475.0 million.
In the future, we may not be able to access adequate funding under CRP’s revolving credit facility (or a replacement facility) as a result of a decrease in the borrowing base due to the issuance of new indebtedness, the outcome of a subsequent borrowing base redetermination or an unwillingness or inability on the part of lending counterparties to meet their funding obligations and the inability of other lenders to provide additional funding to cover the defaulting lender’s portion. Declines in commodity prices could result in a determination to lower the borrowing base in the future and, in such a case, CRP could be required to repay any indebtedness in excess of the redetermined borrowing base. As a result, we may be unable to implement our respective drilling and development plan, make acquisitions or otherwise carry out business plans, which would have a material adverse effect on our financial condition and results of operations and impair our ability to service CRP’s indebtedness.
If we experience liquidity concerns, we could face a downgrade in our debt ratings which could restrict our access to, and negatively impact the terms of, current or future financings or trade credit.
Our ability to obtain financings and trade credit and the terms of any financings or trade credit is, in part, dependent on the credit ratings assigned to our debt by independent credit rating agencies. We cannot provide assurance that any of our current ratings will remain in effect for any given period of time or that a rating will not be lowered or withdrawn entirely by a rating agency if, in its judgment, circumstances so warrant. Factors that may impact our credit ratings include debt levels, planned asset purchases or sales and near-term and long-term production growth opportunities, liquidity, asset quality, cost structure, product mix and commodity pricing levels. A ratings downgrade could adversely impact our ability to access financings or trade credit and increase our borrowing costs.
Risks Related to Our Class A Common Stock and Capital Structure
Our only significant asset is our current ownership of an approximate 94% membership interest in CRP. Distributions from CRP may not be sufficient to allow us to pay any dividends on our Class A Common Stock or satisfy our other financial obligations.
We have no direct operations and no significant assets other than our current ownership of an approximate 94% membership interest in CRP. We will depend on CRP for distributions, loans and other payments to generate the funds necessary to meet our financial obligations or to pay any dividends with respect to our Class A Common Stock. Subject to certain restrictions, CRP generally will be required to (i) make pro rata distributions to its members, including us, in an amount at least sufficient to allow us to pay our taxes and (ii) reimburse us for certain corporate and other overhead expenses. However, legal and contractual restrictions in agreements governing future indebtedness of CRP, as well as the financial condition and operating requirements of CRP may limit our ability to obtain cash from CRP. The earnings from, or other available assets of, CRP may not be sufficient to pay dividends or make distributions or loans to enable us to pay any dividends on our Class A Common Stock or satisfy our other financial obligations.
39
We are subject to certain requirements of Section 404 of the Sarbanes-Oxley Act. If we fail to comply with the requirements of Section 404 or if we or our auditors identify and report material weaknesses in internal control over financial reporting, our investors may lose confidence in our reported information and our stock price may be negatively affected.
We are required to comply with certain provisions of Section 404 of the Sarbanes-Oxley Act of 2002 (“Sarbanes-Oxley Act”). Section 404 requires that we document and test our internal control over financial reporting and issue management’s assessment of our internal control over financial reporting. This section also requires that our independent registered public accounting firm opine on those internal controls. If we fail to comply with the requirements of Section 404 of the Sarbanes-Oxley Act, or if we or our auditors identify and report material weaknesses in internal control over financial reporting, the accuracy and timeliness of the filing of our annual and quarterly reports may be materially adversely affected and could cause investors to lose confidence in our reported financial information, which could have a negative effect on the trading price of our Class A Common Stock. In addition, a material weakness in the effectiveness of our internal control over financial reporting could result in an increased chance of fraud and the loss of customers, reduce our ability to obtain financing and require additional expenditures to comply with these requirements, each of which could have a material adverse effect on our business, results of operations and financial condition.
We incur increased costs as a result of being a public company, which may significantly affect our financial condition.
We completed our initial public offering in February 2016. As a public company, we incur significant legal, accounting and other expenses that we would not incur as a private company. We also incur costs associated with our public company reporting requirements and with corporate governance requirements, including requirements under the Sarbanes-Oxley Act, as well as rules implemented by the SEC and the Financial Industry Regulatory Authority. These rules and regulations increase our legal and financial compliance costs and make some activities more time-consuming and costly. These rules and regulations make it more difficult and more expensive for us to obtain director and officer liability insurance and we may be required to accept reduced policy limits and coverage or incur substantially higher costs to obtain the same or similar coverage. As a result, it may be more difficult for us to attract and retain qualified individuals to serve on our board of directors or as executive officers.
If the price of our Class A Common Stock fluctuates significantly, your investment could lose value.
Although our Class A Common Stock is listed on The NASDAQ Capital Market, we cannot assure you that an active public market will continue for our Class A Common Stock. If an active public market for our Class A Common Stock does not continue, the trading price and liquidity of our Class A Common Stock will be materially and adversely affected. If there is a thin trading market or “float” for our Class A Common Stock, the market price for our Class A Common Stock may fluctuate significantly more than the stock market as a whole. Without a large float, our Class A Common Stock would be less liquid than the stock of companies with broader public ownership and, as a result, the trading prices of our Class A Common Stock may be more volatile. In addition, in the absence of an active public trading market, investors may be unable to liquidate their investment in us. Furthermore, the stock market is subject to significant price and volume fluctuations, and the price of our Class A Common Stock could fluctuate widely in response to several factors, including:
Factors affecting the trading price of our Class A Common Stock may include:
• | actual or anticipated fluctuations in our quarterly financial results or the quarterly financial results of companies perceived to be similar to us; |
• | changes in the market’s expectations about our operating results; |
• | success of competitors; |
• | our operating results failing to meet the expectation of securities analysts or investors in a particular period; |
• | changes in financial estimates and recommendations by securities analysts concerning us or its markets in general; |
• | operating and stock price performance of other companies that investors deem comparable to us; |
• | our ability to market new and enhanced products on a timely basis; |
• | changes in laws and regulations affecting our business; |
• | commencement of, or involvement in, litigation involving us; |
• | changes in our capital structure, such as future issuances of securities or the incurrence of additional debt; |
• | the volume of securities available for public sale; |
• | additions or departures of key personnel; |
• | sales of substantial amounts of our Class A Common Stock by our directors, executive officers or significant stockholders or the perception that such sales could occur; and |
40
• | general economic and political conditions such as recession; interest rate, fuel price, and international currency fluctuations; and acts of war or terrorism. |
The stock market has experienced extreme price and volume fluctuations in recent years that have significantly affected the quoted prices of the securities of many companies, including companies in our industry. The changes often appear to occur without regard to specific operating performance. The price of our Class A Common Stock could fluctuate based upon factors that have little or nothing to do with our company and these fluctuations could materially reduce our stock price.
If securities or industry analysts do not publish or cease publishing research or reports about us, our business, or our market, or if they change their recommendations regarding our securities adversely, the price and trading volume of our securities could decline.
The trading market for our securities will be influenced by the research and reports that industry or securities analysts may publish about us, our business, our market, or our competitors. Securities and industry analysts do not currently, and may never, publish research on us. If no securities or industry analysts commence coverage of us, our stock price and trading volume would likely be negatively impacted. If any of the analysts who may cover us change their recommendation regarding our securities adversely, or provide more favorable relative recommendations about our competitors, the price of our securities would likely decline. If any analyst who may cover us were to cease coverage of us or fail to regularly publish reports on it, we could lose visibility in the financial markets, which could cause our stock price or trading volume to decline.
Riverstone and its affiliates own a significant percentage of our outstanding voting common stock.
Riverstone and its affiliates beneficially own approximately 36% of our voting common stock. As long as Riverstone and its affiliates own or control a significant percentage of outstanding voting power, they will have the ability to strongly influence all corporate actions requiring stockholder approval, including the election and removal of directors and the size of our board of directors, any amendment of our second amended and restated certificate of incorporation (the “Charter”) or amended and restated bylaws (the “Bylaws”), or the approval of any merger or other significant corporate transaction, including a sale of substantially all of our assets.
The interests of Riverstone and its affiliates may not align with the interests of our other stockholders. Riverstone is in the business of making investments in companies and may acquire and hold interests in businesses that compete directly or indirectly with us. Riverstone and its affiliates may also pursue acquisition opportunities that may be complementary to our business, and, as a result, those acquisition opportunities may not be available to us. In addition, our Charter provides that we renounce any interest or expectancy in the business opportunities of our officers and directors and their respective affiliates and each such party shall not have any obligation to offer us those opportunities unless presented to one of our directors or officers in his or her capacity as a director or officer.
Anti-takeover provisions contained in our Charter and Bylaws, as well as provisions of Delaware law, could impair a takeover attempt.
Our Charter and Bylaws contain provisions that could have the effect of delaying or preventing changes in control or changes in our management without the consent of our board of directors. These provisions include:
• | no cumulative voting in the election of directors, which limits the ability of minority stockholders to elect director candidates; |
• | the exclusive right of our board of directors to elect a director to fill a vacancy created by the expansion of the board of directors or the resignation, death, or removal of a director, which prevents stockholders from being able to fill vacancies on our board of directors; |
• | the ability of our board of directors to determine whether to issue shares of our preferred stock and to determine the price and other terms of those shares, including preferences and voting rights, without stockholder approval, which could be used to significantly dilute the ownership of a hostile acquirer; |
• | a prohibition on stockholder action by written consent, which forces stockholder action to be taken at an annual or special meeting of our stockholders; |
• | the requirement that an annual meeting of stockholders may be called only by the chairman of the board of directors, the chief executive officer, or the board of directors, which may delay the ability of our stockholders to force consideration of a proposal or to take action, including the removal of directors; |
• | limiting the liability of, and providing indemnification to, our directors and officers; |
• | controlling the procedures for the conduct and scheduling of stockholder meetings; |
• | providing that directors may be removed prior to the expiration of their terms by stockholders only for cause; and |
41
• | advance notice procedures that stockholders must comply with in order to nominate candidates to our board of directors or to propose matters to be acted upon at a stockholders’ meeting, which may discourage or deter a potential acquirer from conducting a solicitation of proxies to elect the acquirer’s own slate of directors or otherwise attempting to obtain control of the Company. |
These provisions, alone or together, could delay hostile takeovers and changes in control of the Company or changes in our board of directors and management.
As a Delaware corporation, we are also subject to provisions of Delaware law, including Section 203 of the Delaware General Corporation Law (the “DGCL”), which prevents some stockholders holding more than 15% of our outstanding voting common stock from engaging in certain business combinations without approval of the holders of substantially all of our outstanding voting common stock. Any provision of our Charter or Bylaws or Delaware law that has the effect of delaying or deterring a change in control could limit the opportunity for our stockholders to receive a premium for their securities and could also affect the price that some investors are willing to pay for our securities.
Non-U.S. holders may be subject to U.S. income tax with respect to gain on disposition of their Class A Common Stock.
We believe that we are a United States real property holding corporation (a “USRPHC”). As a result, Non-U.S. holders (defined below in the section entitled “Material U.S. Federal Income Tax Considerations”) that own (or are treated as owning under constructive ownership rules) more than a specified amount of our Class A Common Stock during a specified time period may be subject to U.S. federal income tax on a sale, exchange, or other disposition of such Class A Common Stock and may be required to file a U.S. federal income tax return. If you are a Non-U.S. holder, we urge you to consult your tax advisors regarding the tax consequences of such treatment.
ITEM 1B. UNRESOLVED STAFF COMMENTS
None.
ITEM 3. LEGAL PROCEEDINGS
From time to time, we are a party to ongoing legal proceedings in the ordinary course of business, including workers’ compensation claims and employment-related disputes. While the outcome of these proceedings cannot be predicted with certainty, we do not believe the results of these proceedings, individually or in the aggregate, will have a material adverse effect on our business, financial condition, results of operations, or liquidity.
ITEM 4. MINE SAFETY DISCLOSURE
Not applicable.
42
PART II
ITEM 5. MARKET FOR REGISTRANT’S COMMON EQUITY, RELATED STOCKHOLDER MATTERS AND ISSUER PURCHASES OF EQUITY SECURITIES
Price Range of Class A Common Stock
Our Class A Common Stock is currently quoted on NASDAQ under the symbol “CDEV.” Through October 11, 2016, our Class A Common Stock was quoted under the symbol “SRAQ.” The following table sets forth, for the calendar quarter indicated, the high and low sales price per share of Class A Common Stock as reported on NASDAQ for the periods presented:
Class A Common Stock (CDEV) | |||||||
High | Low | ||||||
2017: | |||||||
Fourth Quarter | $ | 22.11 | $ | 17.48 | |||
Third Quarter | 19.32 | 14.21 | |||||
Second Quarter | 20.44 | 14.10 | |||||
First Quarter | 20.08 | 16.59 | |||||
2016: | |||||||
Fourth Quarter | $ | 20.97 | $ | 13.31 | |||
Third Quarter | 16.10 | 9.65 | |||||
Second Quarter(1) | 10.70 | 9.65 | |||||
First Quarter(2) | N/A | N/A | |||||
(1) | Beginning on April 15, 2016. |
(2) | Since the Class A Common Stock commenced separate trading on April 15, 2016, there is no information presented for the Class A Common Stock for the first quarter of 2016. |
As of February 20, 2018, there were 191 holders of record of our Class A Common Stock.
Dividend Policy
We have not paid any cash dividends on our Class A Common Stock or Class C Common Stock to date. Our board of directors may from time to time consider whether or not to institute a dividend policy. It is our present intention to retain any earnings for use in our business operations and, accordingly, we do not anticipate the board of directors declaring any dividends in the foreseeable future.
43
ITEM 6. SELECTED FINANCIAL DATA
The following data should be read in conjunction with Part II, Item 7. Management’s Discussion and Analysis of Financial Condition and Results of Operations, which includes a discussion of factors materially affecting the comparability of the information presented, and in conjunction with our consolidated financial statements included in this Annual Report on Form 10-K. The Company’s historical results are not necessarily indicative of future operating results.
On October 11, 2016, the Company consummated the acquisition of approximately 89% of the outstanding membership interests in Centennial Resource Production, LLC, a Delaware limited liability company (“CRP” and such acquisition, the “Business Combination”). The Company currently owns an approximate 94% membership interest in CRP due to various equity transactions. The financial statement presentation distinguishes CRP as an accounting “Predecessor” for periods prior to the Business Combination. Centennial is the “Successor” for periods after the Business Combination, which includes consolidation of CRP subsequent to the Business Combination. Except as the context otherwise requires, references in the following discussion to the “Company” or “Centennial” with respect to periods prior to the closing of the Business Combination are to CRP and its operations before the Business Combination.
The following table shows selected historical financial information of CRP for the periods and as of the dates indicated below. For all periods ending on or prior to and all dates as of or prior to October 15, 2014, the date on which Celero conveyed all of its oil and natural gas properties to CRP, the following table reflects the combined results of CRP and Celero, and for all periods and dates subsequent to October 15, 2014, reflects the results of CRP.
Successor | Predecessor | |||||||||||||||||||||||
Year Ended December 31, 2017 (1)(3) | October 11, 2016 through December 31, 2016(2)(3) | January 1, 2016 through October 10, 2016(5) | Year Ended December 31, | |||||||||||||||||||||
(in thousands, except per share, production and per BOE data) | 2015(4) | 2014(4)(5) | 2013(4)(5) | |||||||||||||||||||||
Statements of Operations Data: | ||||||||||||||||||||||||
Total revenues | $ | 429,902 | $ | 29,717 | $ | 69,116 | $ | 90,460 | $ | 131,825 | $ | 71,974 | ||||||||||||
Net income (loss) attributable to common shareholders | 75,568 | (8,081 | ) | (218,724 | ) | (38,325 | ) | 17,790 | 3,618 | |||||||||||||||
Income (loss) per share: | ||||||||||||||||||||||||
Basic | $ | 0.32 | $ | (0.05 | ) | |||||||||||||||||||
Diluted | $ | 0.32 | $ | (0.05 | ) | |||||||||||||||||||
Cash Flows Data: | ||||||||||||||||||||||||
Net cash provided by operating activities | $ | 259,918 | $ | 9,410 | $ | 51,740 | $ | 68,882 | $ | 97,248 | $ | 13,416 | ||||||||||||
Net cash used by investing activities | (992,306 | ) | (1,749,733 | ) | (101,434 | ) | (198,635 | ) | (163,380 | ) | (136,517 | ) | ||||||||||||
Net cash provided by financing activities | 724,220 | 1,874,268 | 47,926 | 118,504 | 36,966 | 118,742 | ||||||||||||||||||
Successor | Predecessor | |||||||||||||||||||
(in thousands) | December 31, 2017(1)(3) | December 31, 2016(2)(3) | December 31, 2015(4) | December 31, 2014(4)(5) | December 31, 2013(4)(5) | |||||||||||||||
Balance Sheet Data: | ||||||||||||||||||||
Total assets | $ | 3,616,569 | $ | 2,651,642 | $ | 616,295 | $ | 615,769 | $ | 472,085 | ||||||||||
Long-term debt | 390,764 | — | 138,649 | 129,568 | 29,000 | |||||||||||||||
Total equity | 3,003,972 | 2,552,935 | 450,864 | 377,932 | 390,547 | |||||||||||||||
Dividends per share | — | — | — | — | — | |||||||||||||||
(1) | The results are impacted by the GMT Acquisition, which occurred in June 2017. See Note 3—Property Acquisitions, in Item 8 of Part II of this Annual Report on Form 10-K for detailed information on the GMT Acquisition. |
(2) The results are impacted by the Business Combination which occurred in October 2016. See Note 2—Business Combination, in Item 8 of Part II of this Annual Report on Form 10-K for detailed information on the Business Combination.
(3) The results are impacted by the Silverback Acquisition, which occurred in December 2016. See Note 3—Property Acquisitions, in Item 8 of Part II of this Annual Report on Form 10-K for detailed information on the Silverback Acquisition.
(4) The selected historical consolidated and combined financial information of CRP as of and for the years ended December 31, 2015, 2014 and 2013 was derived from the audited historical consolidated and combined financial statements of CRP.
(5) For all periods ending on or prior to and all dates as of or prior to October 15, 2014, the date on which Celero conveyed all of its oil and natural gas properties to CRP reflects the combined results of CRP and Celero, and for all periods and dates subsequent to October 15, 2014, reflects the results of CRP.
44
ITEM 7. MANAGEMENT’S DISCUSSION AND ANALYSIS OF FINANCIAL CONDITION AND RESULTS OF OPERATIONS
The following discussion and analysis of our financial condition and results of operations should be read in conjunction with our consolidated financial statements and related notes in “Part II, Item 8. Financial Statements and Supplementary Data.” The following discussion and analysis contains forward-looking statements that reflect our future plans, estimates, beliefs and expected performance. The forward-looking statements are dependent upon events, risks and uncertainties that may be outside our control. Our actual results could differ materially from those discussed in these forward-looking statements. Factors that could cause or contribute to such differences include, but are not limited to, market prices for oil, natural gas and NGLs, production volumes, estimates of proved reserves, capital expenditures, economic and competitive conditions, regulatory changes and other uncertainties, as well as those factors discussed in “Cautionary Statement Concerning Forward-Looking Statements” and “Part I, Item 1A. Risk Factors” in this Annual Report on Form 10-K, all of which are difficult to predict. In light of these risks, uncertainties and assumptions, the forward-looking events discussed may not occur. We do not undertake any obligation to publicly update any forward-looking statements except as otherwise required by applicable law.
Overview
We are an independent oil and natural gas company focused on the development of unconventional oil and associated liquids-rich natural gas reserves in the Permian Basin. Our assets are concentrated in the Delaware Basin, a sub-basin of the Permian Basin. Our capital programs are specifically focused on projects that we believe provide the greatest potential for repeatable success and return on capital.
Market Conditions
The oil and natural gas industry is cyclical and commodity prices can be volatile. In the second half of 2014, oil prices began a rapid and significant decline as global and domestic supply began to outpace demand. During 2015 and through 2016, global and domestic oil supply continued to outpace demand resulting in further deterioration in realized oil prices. In 2017, commodity prices continued to be volatile, and it is likely that commodity prices will continue to fluctuate due to global supply and demand, inventory supply levels, weather conditions, geopolitical and other factors.
The following table highlights the quarterly average NYMEX price trends for crude oil and natural gas since the first quarter of 2015:
2015 | 2016 | 2017 | |||||||||||||||||||||||||||||||||||||||||||||
Q1 | Q2 | Q3 | Q4 | Q1 | Q2 | Q3 | Q4 | Q1 | Q2 | Q3 | Q4 | ||||||||||||||||||||||||||||||||||||
Crude Oil (per Bbl) | $ | 48.62 | $ | 57.84 | $ | 46.60 | $ | 42.16 | $ | 33.49 | $ | 45.70 | $ | 45.00 | $ | 49.27 | $ | 51.82 | $ | 48.32 | $ | 48.17 | $ | 55.31 | |||||||||||||||||||||||
Natural Gas (per MMBtu) | $ | 2.81 | $ | 2.74 | $ | 2.73 | $ | 2.24 | $ | 1.98 | $ | 2.25 | $ | 2.80 | $ | 3.17 | $ | 3.06 | $ | 3.14 | $ | 2.95 | $ | 2.91 | |||||||||||||||||||||||
Although oil and natural gas prices have begun to recover from the lows experienced during the first quarter of 2016, forecast prices for both oil and natural gas have not rebounded to 2014 levels. A sustained drop in oil, natural gas and NGL prices may not only decrease our revenues on a per unit basis but may also reduce the amount of oil, natural gas and NGLs that we can produce economically and therefore potentially lower our oil, natural gas and NGL reserve quantities.
Lower commodity prices in the future could result in impairments of our proved oil and natural gas properties or undeveloped acreage and may materially and adversely affect our future business, financial condition, results of operations, operating cash flows, liquidity or ability to finance planned capital expenditures. Lower commodity prices may also reduce the borrowing base under CRP’s credit agreement, which is determined at the discretion of the lenders and is based on the collateral value of our proved reserves that have been mortgaged to the lenders. Upon a redetermination, if any borrowings in excess of the revised borrowing capacity were outstanding, we could be forced to immediately repay a portion of the debt outstanding under the credit agreement.
2017 Highlights and Future Considerations
Operational Highlights
For the year ended December 31, 2017, we operated, on average, a six-rig drilling program and completed 70 gross operated productive wells. This total number of completed wells had an average effective lateral length of approximately 5,700 feet.
Acquisition and Divestiture Highlights
On June 8, 2017, we completed the GMT Acquisition, which consisted of interests in 36 gross producing horizontal wells plus approximately 11,850 undeveloped net acres in the core of the Northern Delaware Basin in Lea County, New Mexico for an unadjusted purchase price of $350.0 million.
45
On February 8, 2018, we completed the acquisition of approximately 4,000 undeveloped net acres, as well as certain producing properties, also in the core of the Northern Delaware Basin in Lea County, New Mexico for an unadjusted purchase price of $94.7 million. The operated acreage position contains an average 95% working interest and is largely contiguous to Centennial’s existing position.
On January 5, 2018, we entered into a purchase and sale agreement to sell approximately 8,600 undeveloped net acres and 12 gross producing wells located in Reeves County, Texas for a total sale price of $140.7 million, which is subject to certain post-closing adjustments. The transaction is expected to close on March 1, 2018. The divested acreage represents a largely non-operated position (average 32% WI) on the western portion of Centennial’s position in Reeves County. The properties to be divested consist of 1,987 MBoe of proved reserves as of December 31, 2017, representing approximately 1% of our proved reserves as of that date, and generated 235 Boe/d (less than 1%) of our 2017 average daily net production.
Financing Highlights
In connection with the GMT Acquisition in June 2017, we issued and sold in a private placement 23,500,000 shares of our Class A Common Stock to certain institutional investors, which resulted in gross proceeds of approximately $340.8 million, and such proceeds were used to fund the majority of the acquisition purchase price.
In November 2017, CRP issued at par $400.0 million of 5.375% senior notes due 2026 (the “Senior Notes”) in an 144A private placement that resulted in net proceeds to CRP of $391 million, after deducting $9 million in debt issuance costs. The net proceeds from this offering were used to repay all outstanding borrowings under the revolving credit facility and for general corporate purposes.
In connection with the October 2017 semi-annual redetermination on November 2, 2017, the Company entered into the fifth amendment to the restated credit agreement to increase the borrowing base from $350.0 million to $575.0 million. However, simultaneous with the issuance of the Senior Notes discussed above, we paid down all borrowings outstanding under our credit facility and entered into the sixth amendment to the credit agreement on December 1, 2017, which enabled us to voluntarily reduce the commitments and borrowing base under the credit agreement to $475.0 million.
Tax Reform
New tax legislation (commonly referred to as the “Jobs Act”) was enacted on December 22, 2017. Financial Accounting Standards Board (“FASB”) Accounting Standards Codification (“ASC”) 740, Accounting for Income Taxes requires companies to recognize the effect of tax law changes in the period of enactment even though the effective date for most provisions is for tax years beginning after December 31, 2017. Adjustments to our tax provision that were recorded in the three months ended December 31, 2017 principally relate to the reduction in the U.S. corporate income tax rate to 21%, which resulted in the Company recognizing an income tax benefit of $4.4 million to measure deferred taxes liabilities that will reverse at the new 21% rate. Other significant provisions of the Jobs Act that are not yet effective but may impact income taxes in future years include: (i) the limitation on the current deductibility of net interest expense in excess of 30% of adjusted taxable income, (ii) a limitation of net operating losses generated after fiscal 2018 to 80% of taxable income and the unlimited carryforward of such losses, (iii) temporary 100% expensing of certain business assets, (iv) additional limitations on certain general and administrative expenses and (v) changes in determining the excessive compensation limitation. Currently, we do not anticipate paying cash federal income taxes in the near term due to any of the legislative changes, primarily due to our ability to expense intangible drilling costs and the utilization of our net operating loss carryforwards.
46
Results of Operations
On October 11, 2016, the Company consummated the acquisition of approximately 89% of the outstanding membership interests in CRP (the “Business Combination”). The Company currently owns an approximate 94% membership interest in CRP due to various equity transactions. The financial statement presentation distinguishes CRP as an accounting “Predecessor” for periods prior to the Business Combination. Centennial is the “Successor” for periods after the Business Combination, which includes consolidation of CRP subsequent to the Business Combination. Except as the context otherwise requires, references in the following discussion to the “Company” or “Centennial” with respect to periods prior to the closing of the Business Combination are to CRP and its operations before the Business Combination.
For the Year Ended December 31, 2017 (Successor) Compared to Periods From October 11, 2016 Through December 31, 2016 (Successor) and January 1, 2016 Through October 10, 2016 (Predecessor) Combined
Oil, Natural Gas and NGL Sales Revenues. The following table provides the components of net revenues and net production (net of all royalties, overriding royalties and production due to others) for the periods indicated, as well as each period’s respective average prices and production volumes:
Successor | Predecessor | Combined | 2017 Successor vs. 2016 Combined | ||||||||||||||||||||
Year Ended December 31, 2017 | October 11, 2016 through December 31, 2016 | January 1, 2016 through October 10, 2016 | Year Ended December 31, 2016 | ||||||||||||||||||||
$ | % | ||||||||||||||||||||||
Net revenues (in thousands): | |||||||||||||||||||||||
Oil sales | $ | 336,931 | $ | 24,313 | $ | 59,787 | $ | 84,100 | $ | 252,831 | 301 | % | |||||||||||
Natural gas sales | 48,868 | 3,449 | 6,045 | 9,494 | 39,374 | 415 | % | ||||||||||||||||
NGL sales | 44,103 | 1,955 | 3,284 | 5,239 | 38,864 | 742 | % | ||||||||||||||||
Total net revenues | $ | 429,902 | $ | 29,717 | $ | 69,116 | $ | 98,833 | $ | 331,069 | 335 | % | |||||||||||
Average sales price: | |||||||||||||||||||||||
Oil (per Bbl) | $ | 48.17 | $ | 46.49 | $ | 37.74 | $ | 39.91 | $ | 8.26 | 21 | % | |||||||||||
Effect of derivative settlements on average price (per Bbl) | (0.06 | ) | 2.02 | 10.49 | 8.39 | (8.45 | ) | (101 | )% | ||||||||||||||
Oil net of hedging (per Bbl) | $ | 48.11 | $ | 48.51 | $ | 48.23 | $ | 48.30 | $ | (0.19 | ) | — | % | ||||||||||
Average NYMEX price for oil (per Bbl) | $ | 50.88 | $ | 49.21 | $ | 41.75 | $ | 43.43 | $ | 7.45 | 17 | % | |||||||||||
Natural gas (per Mcf) | $ | 2.75 | $ | 3.10 | $ | 2.27 | $ | 2.52 | $ | 0.23 | 9 | % | |||||||||||
Effect of derivative settlements on average price (per Mcf) | — | — | — | — | |||||||||||||||||||
Natural gas net of hedging (per Mcf) | $ | 2.75 | $ | 3.10 | $ | 2.27 | $ | 2.52 | $ | 0.23 | 9 | % | |||||||||||
Average NYMEX price for natural gas (per Mcf) | $ | 3.02 | $ | 3.18 | $ | 2.37 | $ | 2.55 | $ | 0.47 | 18 | % | |||||||||||
NGL (per Bbl) | $ | 26.28 | $ | 20.36 | $ | 12.98 | $ | 15.01 | $ | 11.27 | 75 | % | |||||||||||
Net production: | |||||||||||||||||||||||
Oil (MBbls) | 6,994 | 523 | 1,584 | 2,107 | 4,887 | 232 | % | ||||||||||||||||
Natural gas (MMcf) | 17,754 | 1,113 | 2,660 | 3,773 | 13,981 | 371 | % | ||||||||||||||||
NGLs (MBbls) | 1,678 | 96 | 253 | 349 | 1,329 | 381 | % | ||||||||||||||||
Total (MBoe) | 11,630 | 805 | 2,280 | 3,085 | 8,545 | 277 | % | ||||||||||||||||
Average daily net production volume: | |||||||||||||||||||||||
Oil (Bbls/d) | 19,161 | 6,378 | 5,577 | 5,757 | 13,404 | 233 | % | ||||||||||||||||
Natural gas (Mcf/d) | 48,640 | 13,573 | 9,366 | 10,309 | 38,331 | 372 | % | ||||||||||||||||
NGLs (Bbls/d) | 4,596 | 1,171 | 891 | 954 | 3,642 | 382 | % | ||||||||||||||||
Total (Boe/d) | 31,864 | 9,811 | 8,029 | 8,429 | 23,435 | 278 | % | ||||||||||||||||
47
Oil, Natural Gas and NGL Sales Revenues. Total net revenues for the year ended December 31, 2017 (Successor) were $331.1 million (or 335%) higher than total net revenues for the combined year ended December 31, 2016. Revenues are a function of oil, natural gas and NGL volumes sold and average commodity sales prices realized.
Net production volumes for oil, natural gas, and NGLs increased 232%, 371% and 381%, respectively, between periods. The oil volume increase between periods resulted primarily from drilling success in the Delaware Basin, as well as producing properties acquired in the Silverback and GMT Acquisitions, which collectively added 801 MBbls of net oil production in 2017. During the year ended December 31, 2017, 70 gross operated wells were placed on production in the Delaware Basin, which added 4,346 MBbls of net oil production. The increase in the Company’s operated well count is attributable to the ramp up of its drilling program starting in the fourth quarter of 2016. These oil volume increases were partially offset by normal production declines across existing wells. Natural gas and NGLs are produced concurrently with crude oil volumes, resulting in a high correlation between fluctuations in oil quantities sold and natural gas and NGL quantities sold. Natural gas and NGL volumes were additionally impacted by the acreage acquired from Silverback, which has a higher gas/oil ratio. During the year ended December 31, 2017, production mix consisted of 40% natural gas and NGL volumes as compared to 32% in 2016.
In addition to production-related increases in net revenue between periods, there were also significant increases in average realized sales prices for oil, natural gas and NGLs when comparing the year ended December 31, 2017 to 2016. The average realized price for oil before the effects of hedging increased 21%, the average realized price for natural gas before the effects of hedging increased 9%, and the average realized price for NGLs increased 75% between periods. Of the 21% increase in the average realized oil price, 17% of such increase was related to higher average NYMEX crude prices between periods, and the remaining 4% was attributable to narrower oil differentials in 2017. The 9% increase in the average realized natural gas price was similarly related to higher NYMEX prices between periods (NYMEX natural gas prices being up 18% between periods) which was partially offset by wider gas differentials experienced during the year ended December 31, 2017. Of the overall 75% increase in average realized NGL prices between periods, the majority of such increase was related to higher average Mont Belvieu spot prices for plant products during the year ended December 31, 2017. Additionally, NGL prices increased beginning in August 2016 as a result of lower transportation costs incurred by the Company’s gas processor due to the use of pipeline versus prior trucking alternatives.
Operating Expenses. The following table sets forth selected operating expense data for the periods indicated:
Successor | Predecessor | Combined | 2017 Successor vs. 2016 Combined | ||||||||||||||||||||
Year Ended December 31, 2017 | October 11, 2016 through December 31, 2016 | January 1, 2016 through October 10, 2016 | Year Ended December 31, 2016 | ||||||||||||||||||||
$ | % | ||||||||||||||||||||||
Operating Expenses (in thousands): | |||||||||||||||||||||||
Lease operating expenses | $ | 41,336 | $ | 3,541 | $ | 11,036 | $ | 14,577 | $ | 26,759 | 184 | % | |||||||||||
Severance and ad valorem taxes | 23,173 | 1,636 | 3,696 | 5,332 | 17,841 | 335 | % | ||||||||||||||||
Gathering, processing, and transportation expense | 34,259 | 2,187 | 4,583 | 6,770 | 27,489 | 406 | % | ||||||||||||||||
Production costs per Boe: | |||||||||||||||||||||||
Lease operating expenses | $ | 3.55 | $ | 4.40 | $ | 4.84 | $ | 4.73 | $ | (1.18 | ) | (25 | )% | ||||||||||
Severance and ad valorem taxes | 1.99 | 2.03 | 1.62 | 1.73 | 0.26 | 15 | % | ||||||||||||||||
Gathering, processing, and transportation expense | 2.95 | 2.72 | 2.01 | 2.19 | 0.76 | 35 | % | ||||||||||||||||
Lease Operating Expenses. LOE for the year ended December 31, 2017 (Successor) increased $26.8 million compared to the combined 2016 comparable period. Higher LOE for 2017 was primarily related to a $21.3 million increase associated with higher well count. The Company added 70 gross operated wells through successful drilling and 57 gross operated wells from the Silverback and GMT Acquisitions. In addition, workover activity increased $5.5 million between periods also as a result of higher well count. The Company had 106 gross operated horizontal wells, which includes those added from the Silverback Acquisition, as of December 31, 2016 as compared to 181 gross operated horizontal wells as of December 31, 2017.
LOE on a per Boe basis, on the other hand, decreased when comparing the year ended December 31, 2017 to the combined 2016 period. LOE per Boe was $3.55 for the year ended December 31, 2017, which represents a decrease of $1.18 per Boe (or 25%) from the combined year ended December 31, 2016. This decrease in rate was mainly due to flush production from new wells drilled and completed over the past 12 months, which has the effect of reducing fixed and semi-variable costs on a per Boe basis.
Severance and Ad Valorem Taxes. Severance taxes are primarily based on the market value of production at the wellhead, and ad valorem taxes are generally based on the valuation of oil and natural gas properties and vary across the different counties in which the Company operates. Severance and ad valorem taxes for the year ended December 31, 2017 (Successor) increased $17.8
48
million (or 335%) compared to the 2016 combined period due to higher oil, natural gas and NGL revenues between years. Severance and ad valorem taxes as a percentage of total net revenues remained consistent for the year ended December 31, 2017 and 2016 at 5.4%.
Gathering, Processing and Transportation Expenses. Gathering, processing and transportation costs (“GP&T”) for the year ended December 31, 2017 (Successor) increased $27.5 million compared to the combined 2016 period due to higher natural gas and NGL volumes sold between periods, which in turn resulted in a higher amount of plant processing fees and per unit transportation and gathering costs being incurred between 2017 and 2016.
On a per Boe basis, GP&T increased 35% from $2.19 for the combined year ended December 31, 2016 to $2.95 per Boe for the comparable 2017 period. This increase in rate was mainly attributable to the change in gas/oil ratio whereby a higher percentage of total production was made up of natural gas and NGL volumes during the year ended December 31, 2017, and thus a higher proportion of production during 2017 was subject to gas gathering and transportation charges as well as gas processing fees. On a natural gas and NGL volumes basis (i.e. excluding crude oil barrels) the Boe rate increased only 7% between periods from $6.92 to $7.39 for the years ended December 31, 2016 and 2017, respectively. This increase was primarily the result of a new firm transportation agreement entered into in June 2017, which provides guaranteed pipeline capacity for the Company’s natural gas production (refer to Note 13—Commitments and Contingencies in Item 8 of Part II of this Annual Report on Form 10-K for additional information on such agreement).
Depreciation, Depletion, and Amortization. The following table summarizes DD&A for the periods indicated:
Successor | Predecessor | |||||||||||
Year Ended December 31, 2017 | October 11, 2016 through December 31, 2016 | January 1, 2016 through October 10, 2016 | ||||||||||
(in thousands) | ||||||||||||
Depreciation, depletion and amortization | $ | 161,628 | $ | 14,877 | $ | 62,964 | ||||||
Depreciation, depletion and amortization per Boe | $ | 13.90 | $ | 18.48 | $ | 27.62 | ||||||
DD&A rate can fluctuate as a result of development costs, acquisitions, impairments, as well as changes in proved reserves or proved developed reserves. For the year ended December 31, 2017 (Successor), DD&A expense amounted to $161.6 million, compared to $14.9 million for the period from October 11, 2016 through December 31, 2016 (Successor) and $63.0 million for the period from January 1, 2016 through October 10, 2016 (Predecessor). The main factor contributing to higher DD&A expense in 2017 was the increase in overall production volumes from 2016 to 2017, which was partially offset by the significantly lower DD&A rate between periods.
DD&A per Boe was $13.90 for the year ended December 31, 2017 compared to $18.48 for the period from October 11, 2016 through December 31, 2016. The primary factor contributing to this lower DD&A rate was substantial additions to proved reserves and proved developed reserves over the past 12 months, relative to reduced drilling and completion costs over that time period. The higher rate of $27.62 for the Predecessor period from January 1, 2016 through October 10, 2016 was due to the Company’s assets and liabilities being recorded at their respective fair values as a result as the Business Combination on October 2016.
Exploration Expense. The following table summarizes exploration expenses for the periods indicated:
Successor | Predecessor | |||||||||||
Year Ended December 31, 2017 | October 11, 2016 through December 31, 2016 | January 1, 2016 through October 10, 2016 | ||||||||||
(in thousands) | ||||||||||||
Stock-based compensation expense | $ | 1,609 | $ | — | $ | — | ||||||
Dry exploratory well costs | 5,658 | — | — | |||||||||
Geological and geophysical costs | 7,106 | 1,468 | 920 | |||||||||
Exploration expense | $ | 14,373 | $ | 1,468 | $ | 920 | ||||||
Exploration expense was $14.4 million for the year ended December 31, 2017 (Successor) compared to $1.5 million for the period from October 11, 2016 through December 31, 2016 (Successor) and $0.9 million for the period from January 1, 2016 through October 10, 2016 (Predecessor). Exploration expense mainly consists of costs of topographical studies, G&G projects, and salaries and expenses of G&G personnel. The increase in exploration expense in 2017 is due to (i) increased G&G projects and seismic studies (ii) $5.7 million in exploratory dry hole costs in 2017 with no dry hole costs in 2016, (iii) seven geologist positions added since 2016, and (iv) equity-based compensation awards that were granted to G&G personnel in 2017.
49
General and Administrative Expenses. The following table summarizes G&A expenses for the periods indicated:
Successor | Predecessor | |||||||||||
Year Ended December 31, 2017 | October 11, 2016 through December 31, 2016 | January 1, 2016 through October 10, 2016 | ||||||||||
(in thousands) | ||||||||||||
Stock-based compensation expense | $ | 12,150 | $ | 1,333 | $ | — | ||||||
Cash general and administrative expenses | 37,732 | 11,758 | 24,661 | |||||||||
General and administrative expenses | $ | 49,882 | $ | 13,091 | $ | 24,661 | ||||||
G&A expenses for the year ended December 31, 2017 (Successor) were $49.9 million compared to $13.1 million for the period from October 11, 2016 through December 31, 2016 (Successor) and $24.7 million for the period from January 1, 2016 through October 10, 2016 (Predecessor). The higher G&A expenses incurred in 2017 were primarily due to $15.1 million in increased employee salaries and related payroll burdens, $10.8 million in higher stock-based compensation, and $3.5 million in increased professional fees. Employee-related costs were substantially higher in 2017 due to the number of administrative employees (i.e. non-billable to joint interest partners) increasing from 57 at December 31, 2016 to 119 as of December 31, 2017, and professional fees were also higher due to costs associated with being a public company that were incurred during the 2017 period. These increases were partially offset by $4.1 million and $15.8 million of transactional expenses incurred during the Successor and Predecessor 2016 periods, respectively, primarily attributable to the consummation of the Business Combination.
Other Income and Expenses.
Gain on Sale of Oil and Natural Gas Properties. During the year ended December 31, 2017 (Successor), a gain of $7.2 million was recorded on the sale of oil and gas properties in Pecos County, Texas as well as an additional gain of $1.6 million on other sales of non-core properties in 2017.
Interest Expense. The following table summarizes interest expenses for the periods indicated:
Successor | Predecessor | |||||||||||
Year Ended December 31, 2017 | October 11, 2016 through December 31, 2016 | January 1, 2016 through October 10, 2016 | ||||||||||
(in thousands) | ||||||||||||
Credit Facility | $ | 4,882 | $ | 263 | $ | 2,541 | ||||||
Senior Notes | 2,007 | — | — | |||||||||
Term Loan | — | 115 | 3,024 | |||||||||
Financing obligation | — | — | 61 | |||||||||
Interest capitalized | (1,160 | ) | — | — | ||||||||
Total | $ | 5,729 | $ | 378 | $ | 5,626 | ||||||
For the year ended December 31, 2017 (Successor), interest expense incurred was $5.7 million, which consisted of $4.9 million related to CRP’s credit facility and $2.0 million related to the Senior Notes partially offset by $1.2 million in capitalized interest. For the period from October 11, 2016 through December 31, 2016 (Successor) interest expense incurred was $0.4 million, which mainly consisted of the commitment fee paid for unused amounts on CRP’s credit facility. For the period from January 1, 2016 through October 10, 2016 (Predecessor), interest expense incurred was $2.5 million on borrowings under the revolving credit facility and interest of $3.0 million on the term loan, which was extinguished upon closing of the Business Combination.
Net Gain (Loss) on Derivative Instruments. Net gains and losses are a function of i) fluctuations in mark-to-market derivative fair values associated with corresponding changes in underlying commodity prices and ii) monthly cash settlements of hedged derivative positions. For the year ended December 31, 2017 (Successor), non-cash mark-to-market derivative gains of $5.8 million and cash derivatives settlements losses of $0.7 million were recognized. For the periods from October 11, 2016 through December 31, 2016 (Successor) and January 1, 2016 through October 10, 2016 (Predecessor), non-cash mark-to-market derivatives losses of $2.6 million and $23.5 million, respectively, and $1.1 million and $16.6 million, respectively, of cash derivatives settlements gains were recognized.
Income Tax Expense. During the year ended December 31, 2017 (Successor) the Company recognized $29.9 million in income tax expense. The Company's provision for income taxes for the year ended December 31, 2017 differed from the amount that would be provided by applying the statutory U.S. federal tax rate of 35% to pre-tax income primarily because of (i) the $5.1 million benefit associated with the release of the valuation allowance that was previously recorded against our NOL carryforwards, (ii) the $4.4 million benefit upon the enactment of the Jobs Act in December of 2017 which reduced the future corporate tax rate to 21%, and (iii) permanent items of $3.0 million. These benefits were partially offset by higher effective state
50
income tax rates (refer to Note 6—Income Taxes in Item 8 of Part II of this Annual Report on Form 10-K for additional information on income taxes).
For the Periods From October 11, 2016 Through December 31, 2016 (Successor) and January 1, 2016 Through October 10, 2016 (Predecessor) Combined Compared to Year Ended December 31, 2015 (Predecessor)
Oil, Natural Gas and NGL Sales Revenues. The following table provides the components of net revenues and net production (net of all royalties, overriding royalties and production due to others) for the periods indicated, as well as each period’s respective average prices and production volumes:
Successor | Predecessor | Combined | Predecessor | 2016 Combined vs 2015 Predecessor | |||||||||||||||||||
October 11, 2016 through December 31, 2016 | January 1, 2016 through October 10, 2016 | Year Ended December 31, 2016 | Year Ended December 31, 2015 | ||||||||||||||||||||
$ | % | ||||||||||||||||||||||
Net revenues (in thousands): | |||||||||||||||||||||||
Oil sales | $ | 24,313 | $ | 59,787 | $ | 84,100 | $ | 77,643 | $ | 6,457 | 8 | % | |||||||||||
Natural gas sales | 3,449 | 6,045 | 9,494 | 7,965 | 1,529 | 19 | % | ||||||||||||||||
NGL sales | 1,955 | 3,284 | 5,239 | 4,852 | 387 | 8 | % | ||||||||||||||||
Total net revenues | $ | 29,717 | $ | 69,116 | $ | 98,833 | $ | 90,460 | $ | 8,373 | 9 | % | |||||||||||
Average sales price: | |||||||||||||||||||||||
Oil (per Bbl) | $ | 46.49 | $ | 37.74 | $ | 39.91 | $ | 42.43 | $ | (2.52 | ) | (6 | )% | ||||||||||
Effect of derivative settlements on average price (per Bbl) | 2.02 | 10.49 | 8.39 | 19.18 | (10.79 | ) | (56 | )% | |||||||||||||||
Oil net of hedging (per Bbl) | $ | 48.51 | $ | 48.23 | $ | 48.30 | $ | 61.61 | $ | (13.31 | ) | (22 | )% | ||||||||||
Average NYMEX price for oil (per Bbl) | $ | 49.21 | $ | 41.75 | $ | 43.43 | $ | 48.76 | $ | (5.33 | ) | (11 | )% | ||||||||||
Natural gas (per Mcf) | $ | 3.10 | $ | 2.27 | $ | 2.52 | $ | 2.60 | $ | (0.08 | ) | (3 | )% | ||||||||||
Effect of derivative settlements on average price (per Mcf) | — | — | — | 0.43 | (0.43 | ) | (100 | )% | |||||||||||||||
Natural gas net of hedging (per Mcf) | $ | 3.10 | $ | 2.27 | $ | 2.52 | $ | 3.03 | $ | (0.51 | ) | (17 | )% | ||||||||||
Average NYMEX price for natural gas (per Mcf) | $ | 3.18 | $ | 2.37 | $ | 2.55 | $ | 2.63 | $ | (0.08 | ) | (3 | )% | ||||||||||
NGL (per Bbl) | $ | 20.36 | $ | 12.98 | $ | 15.01 | $ | 14.66 | $ | 0.35 | 2 | % | |||||||||||
Net production: | |||||||||||||||||||||||
Oil (MBbls) | $ | 523 | $ | 1,584 | $ | 2,107 | $ | 1,830 | $ | 277 | 15 | % | |||||||||||
Natural gas (MMcf) | 1,113 | 2,660 | 3,773 | 3,058 | 715 | 23 | % | ||||||||||||||||
NGLs (MBbls) | 96 | 253 | 349 | 331 | 18 | 5 | % | ||||||||||||||||
Total (MBoe) | $ | 805 | $ | 2,280 | $ | 3,085 | $ | 2,671 | $ | 414 | 15 | % | |||||||||||
Average daily net production volume: | |||||||||||||||||||||||
Oil (Bbls/d) | $ | 6,378 | $ | 5,577 | $ | 5,757 | $ | 5,014 | $ | 743 | 15 | % | |||||||||||
Natural gas (Mcf/d) | 13,573 | 9,366 | 10,309 | 8,378 | 1,931 | 23 | % | ||||||||||||||||
NGLs (Bbls/d) | 1,171 | 891 | 954 | 907 | 47 | 5 | % | ||||||||||||||||
Total (Boe/d) | $ | 9,811 | $ | 8,029 | $ | 8,429 | $ | 7,317 | $ | 1,112 | 15 | % | |||||||||||
The combined revenues for 2016 were 9%, or $8.4 million, higher than total revenues for 2015. The increase was primarily due to a 15% increase in production sold in 2016, which was partially offset by a 6% and 3% decrease in average sales price for oil and natural gas, respectively, compared to the prior year.
51
Combined oil sales increased 8%, or $6.5 million, for 2016 compared to the prior year period primarily due to a 15% increase in oil volumes sold, partially offset by an 6% decrease in the average sales price for oil. Combined natural gas sales increased 19%, or $1.5 million, for 2016 compared to the prior year period primarily due to a 23% increase in natural gas volumes sold, partially offset by a 3% decrease in the average sales price for natural gas. Combined NGL sales increased 8%, or $0.4 million, for 2016 compared to the prior year period primarily due to a 5% increase in the NGL volumes sold.
Operating Expenses.
The following table sets forth selected operating data for the periods indicated:
Successor | Predecessor | Combined | Predecessor | 2016 Combined vs 2015 Predecessor | |||||||||||||||||||
October 11, 2016 through December 31, 2016 | January 1, 2016 through October 10, 2016 | Year Ended December 31, 2016 | Year Ended December 31, 2015 | ||||||||||||||||||||
$ | % | ||||||||||||||||||||||
Operating Expenses (in thousands): | |||||||||||||||||||||||
Lease operating expenses | $ | 3,541 | $ | 11,036 | $ | 14,577 | $ | 21,173 | $ | (6,596 | ) | (31 | )% | ||||||||||
Severance and ad valorem taxes | 1,636 | 3,696 | 5,332 | 5,021 | 311 | 6 | % | ||||||||||||||||
Gathering, processing, and transportation expense | 2,187 | 4,583 | 6,770 | 5,732 | 1,038 | 18 | % | ||||||||||||||||
Production costs per Boe: | |||||||||||||||||||||||
Lease operating expenses | $ | 4.40 | $ | 4.84 | $ | 4.73 | $ | 7.93 | $ | (3.20 | ) | (40 | )% | ||||||||||
Severance and ad valorem taxes | 2.03 | 1.62 | 1.73 | 1.88 | (0.15 | ) | (8 | )% | |||||||||||||||
Gathering, processing, and transportation expense | 2.72 | 2.01 | 2.19 | 2.15 | 0.04 | 2 | % | ||||||||||||||||
Lease Operating Expenses. Combined LOE decreased 31%, or $6.6 million, in 2016 compared to 2015, due in part to service providers lowering costs in light of the weak commodity price environment. Additionally, the number of wells placed on production in 2016 decreased 29% compared to 2015. Workover expense decreased $2.0 million, and the Company converted several rental units to permanent pumping units decreasing the amounts of rental expense by approximately $1.6 million in 2016 compared to the prior year period. Lastly, the use of contract labor and expenses related to repairs and maintenance decreased by $1.2 million and $1.9 million, respectively, in 2016 compared to 2015.
Severance and Ad Valorem Taxes. Severance taxes are primarily based on the market value of production at the wellhead and ad valorem taxes are generally based on the valuation of oil and natural gas properties and vary across the different counties in which the Company operates. Combined severance and ad valorem taxes increased 6%, or $0.3 million, in 2016 compared to 2015, primarily due to higher sales volumes, partially offset by lower realized commodity prices. Combined severance and ad valorem taxes as a percentage of revenue were 5.4% for 2017 compared to 5.6% for the prior year period.
Gathering, Processing and Transportation Expenses. Combined transportation, processing, gathering and other operating expenses in 2016 increased 18%, or $1.0 million, compared to 2015, primarily due to an increase in natural gas production of 23% year over year, partially offset by lower realized commodity prices
Depreciation, Depletion, and Amortization. The following table summarizes DD&A for the periods indicated:
Successor | Predecessor | |||||||||||
October 11, 2016 through December 31, 2016 | January 1, 2016 through October 10, 2016 | Year Ended December 31, 2015 | ||||||||||
(in thousands) | ||||||||||||
Depreciation, depletion and amortization | $ | 14,877 | $ | 62,964 | $ | 90,084 | ||||||
Depreciation, depletion and amortization per Boe | 18.48 | 27.62 | 33.73 | |||||||||
DD&A rate can fluctuate as a result of impairments, dispositions, finding and development costs and proved reserve volumes. For the period from October 11, 2016 through December 31, 2016 (Successor), DD&A expense for the period was $14.9 million or $18.48 per Boe.
For the period from January 1, 2016 through October 10, 2016 (Predecessor), DD&A expense was $63.0 million or $27.62 per Boe. In 2015, DD&A expense was $90.1 million or $33.73 per Boe. The decrease in DD&A rate is primarily due to lower development costs and reserve additions.
52
Abandonment Expense and Impairment of Unproved Properties. The following table summarizes abandonment expense and impairment of unproved properties for the periods indicated:
Successor | Predecessor | |||||||||||
October 11, 2016 through December 31, 2016 | January 1, 2016 through October 10, 2016 | Year Ended December 31, 2015 | ||||||||||
(in thousands) | ||||||||||||
Abandonment expense and impairment of unproved properties | $ | — | $ | 2,545 | $ | 7,619 | ||||||
For the period from October 11, 2016 through December 31, 2016 (Successor), there were no abandonment expense or impairment of unproved property. For the period from January 1, 2016 through October 10, 2016 (Predecessor) and in 2015, impairment of unproved properties was $2.5 million and $7.6 million, respectively, related to leases that expired during the period or are expected to expire in the future.
Exploration. The following table summarizes exploration expense for the periods indicated:
Successor | Predecessor | |||||||||||
October 11, 2016 through December 31, 2016 | January 1, 2016 through October 10, 2016 | Year Ended December 31, 2015 | ||||||||||
(in thousands) | ||||||||||||
Exploration | $ | 1,468 | $ | 920 | $ | 84 | ||||||
For the period from October 11, 2016 through December 31, 2016 (Successor), exploration expense was $1.5 million related to seismic data and salaries and expenses of G&G personnel and consultants. For the period from January 1, 2016 through October 10, 2016 (Predecessor), exploration expense was $0.9 million related to salaries and expenses of G&G personnel and consultants. For 2015, explorations expense was $0.1 million related to logging analyses.
Contract Termination and Rig Stacking. The following table summarizes contract termination and rig stacking expenses for the periods indicated:
Successor | Predecessor | |||||||||||
October 11, 2016 through December 31, 2016 | January 1, 2016 through October 10, 2016 | Year Ended December 31, 2015 | ||||||||||
(in thousands) | ||||||||||||
Contract termination and rig stacking | $ | — | $ | — | $ | 2,387 | ||||||
For the periods from October 11, 2016 through December 31, 2016 (Successor) and January 1, 2016 through October 10, 2016 (Predecessor), there were no drilling and rig termination fees incurred as compared to $2.4 million in 2015. In light of the low commodity price environment, drilling activity was curtailed beginning in the first quarter of 2015, and as a result, drilling and rig termination fees were incurred of $2.4 million in 2015.
General and Administrative Expenses. The following table summarizes G&A expenses for the periods indicated:
Successor | Predecessor | |||||||||||
October 11, 2016 through December 31, 2016 | January 1, 2016 through October 10, 2016 | Year Ended December 31, 2015 | ||||||||||
(in thousands) | ||||||||||||
General and administrative expenses | $ | 13,091 | $ | 24,661 | $ | 14,206 | ||||||
For the period from October 11, 2016 through December 31, 2016 (Successor), G&A expenses were $13.1 million. G&A expenses for the Successor period included $4.1 million of transactional expenses primarily attributable to the consummation of the Business Combination. Additionally, G&A expenses for the Successor period included $1.0 million of non-cash charges resulting from the issuance of restricted stock and stock option awards.
For the period from January 1, 2016 through October 10, 2016 (Predecessor), G&A expenses were $24.7 million. In 2015, G&A expenses were $14.2 million. G&A expenses increased 74%, or $10.5 million, between these two periods primarily due to $15.8 million of transaction expenses incurred in connection with the Business Combination during the period from January 1, 2016 through October 10, 2016.
53
Incentive Compensation. The following table summarize incentive compensation for the period indicated:
Successor | Predecessor | |||||||||||
October 11, 2016 through December 31, 2016 | January 1, 2016 through October 10, 2016 | Year Ended December 31, 2015 | ||||||||||
(in thousands) | ||||||||||||
Incentive unit compensation | $ | — | $ | 165,394 | $ | — | ||||||
For the period from January 1, 2016 through October 10, 2016 (Predecessor), non-cash incentive compensation was $165.4 million related to the consummation of the Business Combination. Refer to Note 8—Stock-Based Compensation in Item 8 of Part II of this Annual Report on Form 10-K for additional information regarding the inventive units.
Other Income and Expenses. The following table summarizes other income and expenses for the periods indicated:
Successor | Predecessor | |||||||||||
October 11, 2016 through December 31, 2016 | January 1, 2016 through October 10, 2016 | Year Ended December 31, 2015 | ||||||||||
(in thousands) | ||||||||||||
Other (expense) income: | ||||||||||||
Gain (loss) on sale of oil and natural gas properties | $ | 24 | $ | 11 | $ | 2,439 | ||||||
Interest expense | (378 | ) | (5,626 | ) | (6,266 | ) | ||||||
Net gain (loss) on derivative instruments | (1,548 | ) | (6,838 | ) | 20,756 | |||||||
Other income | — | 6 | 20 | |||||||||
Total Other income (expense) | $ | (1,902 | ) | $ | (12,447 | ) | $ | 16,949 | ||||
Income tax benefit | $ | — | $ | 406 | $ | 572 | ||||||
Gain on Sale of Oil and Natural Gas Properties. For the periods from October 11, 2016 through December 31, 2016 (Successor) and January 1, 2016 through October 10, 2016 (Predecessor) net gains on the sale of oil and natural gas properties were immaterial. In 2015 (Predecessor), net gains on the sale of oil and natural gas properties was $2.4 million, which was primarily attributable to a gain associated with the sale of non-core unproved property to an unrelated third party.
Interest Expense. For the period from October 11, 2016 through December 31, 2016 (Successor) interest expense was $0.4 million primarily related to the commitment fee paid for unused amounts on the revolving credit facility. For the period from January 1, 2016 through October 10, 2016 (Predecessor), interest expense was $5.6 million related to borrowings under the revolving credit facility and interest on the term loan. In 2015 (Predecessor), interest expense was $6.3 million related to borrowings under the revolving credit facility and interest on the term loan.
Net Gain (Loss) on Derivative Instruments. For the periods from October 11, 2016 through December 31, 2016 (Successor) and January 1, 2016 through October 10, 2016 (Predecessor), derivatives losses of $1.5 million and $6.8 million, respectively, were incurred. In 2015 (Predecessor), a derivative gain of $20.8 million was recognized. Net losses and gains on derivatives are a function of fluctuations in the underlying commodity prices and the monthly settlement of the instruments.
Liquidity and Capital Resources
Overview
Our development and acquisition activities require us to make significant operating and capital expenditures. Historically, our primary sources of liquidity have been borrowings under CRP’s revolving credit facility, cash flows from operations and offerings of debt and equity securities and, prior to the Business Combination, capital contributions from CRP’s Sponsors. To date, our primary use of capital has been for development and the acquisition of oil and natural gas properties.
The following table summarizes our capital expenditures incurred during the year:
(in millions) | Year Ended December 31, 2017 | ||
Drilling and completion capital expenditures | $ | 624.1 | |
Land and other | 55.1 | ||
Facilities, seismic and other | 17.2 | ||
Total capital expenditures | $ | 696.4 | |
54
We continually evaluate our capital needs and compare them to our capital resources. Our estimated capital expenditure budget for 2018 is $885 million to $1,050 million, of which $710 million to $820 million is related to drilling and completion (“D&C”) activity. We expect to fund the capital expenditure budget with cash flows from operations and borrowings. The D&C portion of our 2018 capital budget represents an increase over the $624.1 million of D&C expenditures incurred during 2017. This increased 2018 capital budget is driven by an increase in rig activity from six to seven rigs, the concomitant increase in anticipated wells drilled and completed compared to 2017, and the increase in the number of extended lateral wells drilled which require more capital than shorter laterals.
Because we are the operator of a high percentage of our acreage, the amount and timing of these capital expenditures are largely discretionary. We could choose to defer a portion of these planned capital expenditures depending on a variety of factors, including, but not limited to, the success of our drilling activities, prevailing and anticipated prices for oil and natural gas, the availability of necessary equipment, infrastructure and capital, the receipt and timing of required regulatory permits and approvals, seasonal conditions, drilling and acquisition costs and the level of participation by other working interest owners.
Based upon current oil and natural gas price expectations in the year 2018, we believe that our cash flow from operations and borrowings will provide us with sufficient liquidity to execute our current capital program. However, future cash flows are subject to a number of variables, including the level of oil and natural gas production and prices, and significant additional capital expenditures will be required to more fully develop our properties. We cannot ensure that cash flows from operations and other needed capital will be available on acceptable terms or at all. In the event we make additional acquisitions and the amount of capital required is greater than the amount we have available for acquisitions at that time, we could be required to reduce the expected level of capital expenditures and/or seek additional sources for funding capital investments. As we pursue our future development program, we continually assess the correct mix of reserve base borrowings and debt offerings. If we require additional capital to fund acquisitions, we may also seek such capital through traditional reserve base borrowings, offerings of debt and equity securities, asset sales or other means. If we are unable to obtain funds when needed or on acceptable terms, we may be required to curtail our current drilling program, which could result in a loss of acreage through lease expirations. In addition, we may not be able to complete acquisitions that may be favorable to us or finance the capital expenditures necessary to maintain our production or replace our reserves.
Analysis of Cash Flow Changes
The following table summarizes our cash flows for the periods indicated:
Successor | Predecessor | |||||||||||||||
Year Ended December 31, 2017 | October 11, 2016 through December 31, 2016 | January 1, 2016 through October 10, 2016 | Year Ended December 31, 2015 | |||||||||||||
(in thousands) | ||||||||||||||||
Net cash provided by operating activities | $ | 259,918 | $ | 9,410 | $ | 51,740 | $ | 68,882 | ||||||||
Net cash used in investing activities | (992,306 | ) | (1,749,733 | ) | (101,434 | ) | (198,635 | ) | ||||||||
Net cash provided by financing activities | 724,220 | 1,874,268 | 47,926 | 118,504 | ||||||||||||
Total cash, cash equivalents and restricted cash were $125.9 million as of December 31, 2017, which includes $8.6 million of restricted cash. We generated $259.9 million of cash from operating activities, which was the results of continued higher production activities and realized prices partially offset by increased operating expenses. Cash from operating activities was used with cash on hand and $390.8 million net proceeds from the Senior Notes offering to finance $566.4 million for drilling and development capital expenditures and repay borrowings under our credit facility. Net proceeds of $333.5 million from the issuance of Class A Common Stock together with cash on hand, $35.0 million in net borrowings under the credit facility and proceeds from the sale of oil and gas properties were used to finance $435.5 million in oil and gas property acquisitions including the GMT Acquisition and the remainder of the Silverback Acquisition.
Total cash and cash equivalents were $134.1 million as of December 31, 2016. Cash flows from October 11, 2016 through December 31, 2016 were significantly impacted by the acquisition of CRP for $1,375.7 million, $822.7 million for the Silverback Acquisition, $26.9 million in acquisitions of oil and natural gas properties and $24.1 million for drilling and development capital expenditures which were financed by cash on hand, cash flows from operating activities, $1,540.6 million net proceeds from the issuance of Class A Common Shares and $379.5 million net proceeds from the issuance of Preferred Series B Shares.
Cash flows from January 1, 2016 through October 11, 2016 primarily relate to $55.6 million in acquisitions of oil and natural gas properties and $45.6 million for drilling and development capital expenditures, which were financed by cash on hand, $51.7 million cash flows generated from operating activities and $50.0 million in net borrowings under our credit facility.
Total cash and cash equivalents were $1.8 million as of December 31, 2015. The major use of our funds included $43.2 million in acquisitions of oil and natural gas properties and $156.0 million for drilling and development capital expenditures,
55
which were financed by $68.9 million cash flows from operating activities, cash on hand, borrowings from our credit facility and $111.4 million capital contributions.
Credit Agreement
CRP, the Company’s consolidated subsidiary, has a credit agreement with a syndicate of banks that as of December 31, 2017, had a borrowing base of $475.0 million, which has been committed by lenders and is available for borrowing. A portion of the revolving credit facility in an aggregate amount not to exceed $15.0 million may be used to issue letters of credit for the account of CRP or other designated subsidiaries of the Company. As of December 31, 2017, the Company had no borrowings outstanding and $474.1 million in available borrowing capacity, which was net of $0.9 million in letters of credit outstanding. The revolving credit facility is scheduled to mature in October 2019 and the Company expects to enter into a new credit agreement in the spring of 2018.
The amount available to be borrowed under CRP's revolving credit facility is subject to a borrowing base that is redetermined semi-annually each April 1 and October 1 by the lenders in their sole discretion. CRP's credit agreement also allows for two optional borrowing base redeterminations on January 1 and July 1. The borrowing base depends on, among other things, the volumes of CRP’s proved oil and natural gas reserves, estimated cash flows from these reserves and its commodity hedge positions. The borrowing base will automatically be decreased by an amount equal to 25% of the aggregate notional amount of permitted issued senior unsecured notes unless such decrease is waived by the lenders. Upon a redetermination of the borrowing base, if borrowings in excess of the revised borrowing capacity are outstanding, CRP could be required to immediately repay a portion of its debt outstanding under the credit agreement. Borrowings under CRP’s revolving credit facility are guaranteed by certain of its subsidiaries. In connection with the October 2017 semi-annual redetermination, on November 2, 2017, the credit agreement’s borrowing base was increased from $350.0 million to $575.0 million; however, on December 1, 2017 simultaneous with the issuance of the Senior Notes, CRP entered into an amendment to the credit agreement to, among other things, reflect CRP’s election to voluntarily reduce the commitments and borrowing base under the credit agreement to $475.0 million.
Borrowings under the revolving credit facility may be base rate loans or LIBOR loans. Interest is payable quarterly for base rate loans and at the end of the applicable interest period for LIBOR loans. LIBOR loans bear interest at LIBOR (adjusted for statutory reserve requirements) plus an applicable margin ranging from 225 to 325 basis points, depending on the percentage of the borrowing base utilized. Base rate loans bear interest at a rate per annum equal to the greatest of: (i) the agent bank's prime rate; (ii) the federal funds effective rate plus 50 basis points; and (iii) the adjusted LIBOR rate for a one-month interest period plus 100 basis points, plus an applicable margin ranging from 125 to 225 basis points, depending on the percentage of the borrowing base utilized. CRP also pays a commitment fee on unused amounts of its revolving credit facility of 50 basis points. CRP may repay any amounts borrowed prior to the maturity date without any premium or penalty other than customary LIBOR breakage costs. CRP also pays a commitment fee on unused amounts of its revolving credit facility of 50 basis points. CRP may repay any amounts borrowed prior to the maturity date without any premium or penalty other than customary LIBOR breakage costs.
CRP’s credit agreement contains restrictive covenants that limit its ability to, among other things: incur additional indebtedness; make investments and loans; enter into mergers; make or declare dividends; enter into commodity hedges exceeding a specified percentage of its expected production; enter into interest rate hedges exceeding a specified percentage of its outstanding indebtedness; incur liens; sell assets; and engage in transactions with affiliates.
CRP’s credit agreement also requires it to maintain compliance with the following financial ratios: (i) a current ratio, which is the ratio of CRP’s consolidated current assets (including unused commitments under its revolving credit facility and excluding non-cash assets under FASB’s ASC Topic 815, Derivatives and Hedging (“ASC 815”), and certain restricted cash) to its consolidated current liabilities (excluding the current portion of long-term debt under the credit agreement and non-cash liabilities under ASC 815), of not less than 1.0 to 1.0; and (ii) a leverage ratio, which is the ratio of Total Funded Debt (as defined in CRP’s credit agreement) to consolidated EBITDAX (as defined in CRP’s credit agreement) for the rolling four fiscal quarter period ending on such day, of not greater than 4.0 to 1.0.
CRP was in compliance with the covenants and the financial ratios described above as of December 31, 2017 and through the filing of this report.
5.375% Senior Unsecured Notes due 2026
On November 30, 2017, CRP issued at par $400.0 million of 5.375% senior notes due 2026 (the “Senior Notes”) in an 144A private placement that resulted in net proceeds to CRP of $391 million, after deducting $9 million in debt issuance costs. Interest is payable on the Senior Notes semi-annually in arrears on each January 15 and July 15, commencing July 15, 2018. The Senior Notes are fully and unconditionally guaranteed on a senior unsecured basis by each of CRP’s current subsidiaries that guarantee CRP’s revolving credit facility. The Senior Notes are not guaranteed by the Company nor is the Company subject to the terms of the indenture governing the Senior Notes.
56
At any time prior to January 15, 2021, CRP may, on any one or more occasions, redeem up to 35% of the aggregate principal amount of the Senior Notes with an amount of cash not greater than the net cash proceeds of certain equity offerings at a redemption price equal to 105.375% of the principal amount of the Senior Notes redeemed, plus accrued and unpaid interest, if any, to the date of redemption; provided that at least 65% of the aggregate principal amount issued under the indenture governing the Senior Notes remains outstanding immediately after such redemption and the redemption occurs within 180 days of the closing date of such equity offering.
At any time prior to January 15, 2021, CRP may, on any one or more occasions, redeem all or a part of the Senior Notes at a redemption price equal to 100% of the principal amount of the Senior Notes redeemed, plus a “make-whole” premium as of, and accrued and unpaid interest, if any, to, the date of redemption. On and after January 15, 2021, CRP may redeem the Senior Notes, in whole or in part, at redemption prices (expressed as percentages of principal amount) equal to 102.688% for the 12-month period beginning on January 15, 2021, 101.344% for the 12-month period beginning on January 15, 2022 and 100% beginning on January 15, 2023, plus accrued and unpaid interest to the redemption date.
If CRP experiences certain defined changes of control, each holder of the Senior Notes may require CRP to repurchase all or a portion of its Senior Notes for cash at a price equal to 101% of the aggregate principal amount of such Senior Notes, plus any accrued but unpaid interest to the date of repurchase.
The indenture governing the Senior Notes contains covenants that, among other things and subject to certain exceptions and qualifications, limit CRP’s ability and the ability of CRP’s restricted subsidiaries to: (i) incur or guarantee additional indebtedness or issue certain types of preferred stock; (ii) pay dividends on capital stock or redeem, repurchase or retire capital stock or subordinated indebtedness; (iii) transfer or sell assets; (iv) make investments; (v) create certain liens; (vi) enter into agreements that restrict dividends or other payments from their subsidiaries to them; (vii) consolidate, merge or transfer all or substantially all of their assets; (viii) engage in transactions with affiliates; and (ix) create unrestricted subsidiaries. CRP was in compliance with the covenants as of December 31, 2017 and through the filing of this report.
Upon an Event of Default (as defined in the indenture governing the Senior Notes), the trustee or the holders of at least 25% of the aggregate principal amount of then outstanding Senior Notes may declare the Senior Notes immediately due and payable, except that a default resulting from certain events of bankruptcy or insolvency with respect to CRP, any restricted subsidiary of CRP that is a significant subsidiary or any group of restricted subsidiaries that, taken together, would constitute a significant subsidiary, will automatically cause all outstanding Senior Notes to become due and payable.
Off-Balance Sheet Arrangements
We may enter into off-balance sheet arrangements and transactions that can give rise to material off-balance sheet obligations. As of December 31, 2017, we had no off-balance sheet arrangements.
57
Contractual Obligations
The Company routinely enters or extends operating agreements, office and equipment leases, drilling and completion rig contracts, among others, in the ordinary course of business. The following table summarizes our obligations and commitments as of December 31, 2017 to make future payments under certain contracts for the time periods specified below.
(in thousands) | 2018 | 2019 | 2020 | 2021 | 2022 | Thereafter | Total | |||||||||||||||||||||
Drilling rig commitments (1) | $ | 19,714 | $ | 1,620 | $ | — | $ | — | $ | — | $ | — | $ | 21,334 | ||||||||||||||
Office leases (2) | 2,360 | 2,322 | 2,163 | 2,073 | 274 | — | 9,192 | |||||||||||||||||||||
Water disposal agreement (3) | 1,825 | 1,825 | 1,825 | 1,825 | — | — | 7,300 | |||||||||||||||||||||
Purchase obligations (4) | 4,400 | 13,200 | 8,800 | — | — | — | 26,400 | |||||||||||||||||||||
Asset retirement obligations (5) | — | — | 1,072 | — | — | 11,089 | 12,161 | |||||||||||||||||||||
Long term debt obligations (6) | — | — | — | — | — | 400,000 | 400,000 | |||||||||||||||||||||
Cash interest expense on long-term debt obligations (7) | 23,871 | 23,574 | 21,500 | 21,500 | 21,500 | 66,292 | 178,237 | |||||||||||||||||||||
Transportation and gathering (8) | 2,044 | 2,044 | — | — | — | — | 4,088 | |||||||||||||||||||||
Total | $ | 54,214 | $ | 44,585 | $ | 35,360 | $ | 25,398 | $ | 21,774 | $ | 477,381 | $ | 658,712 | ||||||||||||||
(1) | The Company has six drilling rigs under long-term contract as of December 31, 2017. Early termination of these contracts would require termination penalties of $14.7 million to be paid as of December 31, 2017, which would be paid in lieu of paying the remaining drilling commitments under these contracts. |
(2) | The Company leases office space in Colorado, Texas and New Mexico. |
(3) | The Company entered into a water disposal agreement in which we have contracted for transportation and disposal of the produced water from our operated wells. Under the terms of the agreement, Centennial is obligated to provide a minimum volume of produced water or else pay for any deficiencies at the price stipulated in the contract. The obligations reported above represent our minimum financial commitments pursuant to the terms of this contract as of December 31, 2017. Actual expenditures under this contract may exceed the minimum commitments presented above. |
(4) | The Company entered into a supply agreement to purchase frac and sand product for a term of three years. Under the terms of the agreement, Centennial is obligated to purchase a minimum volume of frac and sand product at a fixed sales price. A prepayment of $13.2 million was made during 2017 and will be used as a partial credit against monthly purchases. The obligations reported above represent our minimum financial commitments pursuant to the terms of this contract as of December 31, 2017. Actual expenditures under this contract may exceed the minimum commitments presented above. |
(5) | Asset retirement obligations reflect the present value of the estimated future costs associated with the plugging and abandonment of oil and natural gas wells and related restoration in accordance with applicable laws and regulations. Refer to Note 11—Asset Retirement Obligations in Item 8 of Part II of this Annual Report on Form 10-K for additional information. |
(6) | Long-term debt consists of the principal amounts of the Senior Notes due 2026. As of December 31, 2017, there was no outstanding borrowings under the credit facility. |
(7) | Cash interest expense on the Senior Notes is estimated assuming no principal repayment until the maturity of the instrument. Cash interest expense on the credit facility assumes no borrowing outstanding and includes the unused commitment fees. |
(8) | In June 2017, the Company entered into a transportation service agreement through December 31, 2019 whereby it is required to deliver 40,000 MMBtu per day or pay for any deficiencies at the price stipulated in the contract. This delivery commitment is tied to the Company’s natural gas production in Reeves and Ward counties, Texas. |
Recently Issued Accounting Standards
Please refer to Note 1—Basis of Presentation and Summary of Significant Accounting Policies, in Part II, Item 8. Financial Statements and Supplementary Data in this Annual Report on Form 10-K for a discussion of recently issued accounting standards and their anticipated effect on our business.
Critical Accounting Policies and Estimates
The discussion and analysis of our financial condition and results of operations are based upon our consolidated financial statements, which have been prepared in accordance with GAAP. The preparation of these statements requires us to make certain assumptions and estimates that affect the reported amounts of assets, liabilities, revenues and expenses as well as the disclosure of contingent assets and liabilities at the date of our financial statements. We base our assumptions and estimates on historical experience and other sources that we believe to be reasonable at the time. Actual results may vary from our estimates due to
58
changes in circumstances, weather, politics, global economics, mechanical problems, general business conditions and other factors. A summary of our significant accounting policies is detailed in Note 1—Basis of Presentation and Summary of Significant Accounting Policies, in Part II, Item 8. Financial Statements and Supplementary Data in this Annual Report on Form 10-K.
We have outlined below certain of these policies as being of particular importance to the portrayal of our financial position and results of operations and which require the application of significant judgment by our management.
Oil and Natural Gas Reserve Quantities
We use the successful efforts method of accounting for our oil and gas producing activities. The successful efforts method inherently relies on estimation of proved crude oil, natural gas and NGLs reserves. The amount of estimated proved reserve affects whether certain costs are capitalized or expensed, the amount and timing of costs depreciated, depleted or amortized into net income and presentation of supplemental information on oil and gas producing activities. In addition, the expected future cash flows to be generated by producing properties are used for evaluating proved properties for impairment and the expected future taxable income available to realize deferred income tax assets, also in part, rely on estimates of quantities of net reserves. Proved oil and gas reserves are those quantities of oil and gas which, by analysis of geoscience and engineering data, can be estimated with reasonable certainty to be economically producible from a given date forward, from known reservoirs and under existing economic conditions, operating methods, and government regulations prior to the time at which contracts providing the right to operate expire, unless evidence indicates that renewal is reasonably certain, regardless of whether deterministic or probabilistic methods are used for the estimation. Key features of the Company’s reserve estimation process are covered in Preparation of Reserve Estimates in Item 2.
We engage Netherland, Sewell & Associates, Inc., our independent petroleum engineer, to prepare our total calculated proved reserve. Estimates prepared by petroleum engineers may be higher or lower than our estimates. Because these estimates depend on many assumptions, all of which may differ substantially from actual results, reserve estimates may be different from the quantities of oil and gas that are ultimately recovered. For example, if the crude oil and natural gas prices used in our year-end reserve estimates increased or decreased by 10%, our proved reserve quantities at December 31, 2017 would have increased by 1.2 MMBoe (0.63%) or decreased by 1.8 million MMBoe (0.98%), respectively, and the pre-tax PV10% of our proved reserves would have increased by $325.2 million (18.6%) or decreased by $327.3 million (18.72%), respectively. We continually make revisions to reserve estimates throughout the year as additional information becomes available. We make changes to depletion rates and impairment calculations (when impairment indicators arise) in the same period that changes to reserve estimates are made.
Impairment of Oil and Natural Gas Properties
We assess our proved properties for impairment when events or changes in circumstances indicate that the carrying value of assets may not be recoverable. For purposes of an impairment evaluation, our proved oil and natural gas properties must be grouped at the lowest level for which independent cash flows can be identified. If the sum of the undiscounted estimated cash flows from the use of the asset group and its eventual disposition is less than the carrying value of an asset group, the carrying value is written down to the estimated fair value. Fair value calculated for the purpose of testing impairment is estimated using the present value of expected future cash flows method and comparative market prices when appropriate. Fair value estimates are based on projected financial information which we believe to be reasonably likely to occur. An estimate of the sensitivity to changes in assumptions in our undiscounted cash flow calculations is not practicable, given the numerous assumptions that can materially affect our estimates. Unfavorable adjustments to our assumptions would likely be offset by favorable adjustments in other assumptions. For example, the impact of sustained reduced commodity prices on future undiscounted cash flows would likely be partially offset by lower costs.
Unproved properties costs consist of costs to acquire undeveloped leases as well as costs to acquire unproved reserves. We evaluate significant unproved properties for impairment based on remaining lease term, drilling results, reservoir performance, seismic interpretation or future plans to develop acreage.
Business and Asset Acquisitions
For business and asset acquisitions, we generally recognize the identifiable assets acquired, the liabilities assumed and any noncontrolling interest in the acquiree at their estimated fair values on the acquisition date. Determining fair value requires management’s judgment and involves the use of significant estimates and assumptions with respect to projections of future production volumes, pricing and cash flows, benchmark analysis of comparable public companies, discount rates, expectations regarding customer contracts and relationships, and other management estimates. The judgments made in the determination of the estimated fair value assigned to the assets acquired, liabilities assumed and any noncontrolling interest in the investee, as well as the estimated useful life of each asset and the duration of each liability, can materially impact the financial statements in periods after acquisition. See Note 2—Business Combination and Note 3—Property Acquisitions in Item 8 of Part II of this Annual Report on Form 10-K.
59
ITEM 7A. QUANTITATIVE AND QUALITATIVE DISCLOSURES ABOUT MARKET RISK
We are exposed to market risk, including the effects of adverse changes in commodity prices and interest rates as described below. The primary objective of the following information is to provide quantitative and qualitative information about our potential exposure to market risks. The term “market risk” refers to the risk of loss arising from adverse changes in oil and natural gas prices and interest rates. The disclosures are not meant to be precise indicators of expected future losses, but rather indicators of reasonably possible losses. All of our market risk sensitive instruments were entered into for purposes other than speculative trading.
Commodity Price Risk
Our major market risk exposure is in the pricing that we receive for our oil, natural gas and NGLs production. Pricing for oil, natural gas and NGLs has been volatile and unpredictable for several years, and we expect this volatility to continue in the future.
Due to this volatility, we have historically used, and we expect to continue to selectively use, commodity derivative instruments, such as collars, swaps and basis swaps, to mitigate price risk associated with a portion of our anticipated production. Our derivative instruments allow us to reduce, but not eliminate, the potential effects of the variability in cash flow from operations due to fluctuations in oil and natural gas prices and provide increased certainty of cash flows for our drilling program and debt service requirements. These instruments provide only partial price protection against declines in oil and natural gas prices and may partially limit our potential gains from future increases in prices. Our credit agreement limits our ability to enter into commodity hedges covering greater than 80% of our reasonably anticipated projected production volume.
The following table summarizes the approximate volumes and average contract prices of swap contracts the Company had in place as of December 31, 2017:
Description & Production Period | Volume (Bbl) | Weighted Average Differential ($/Bbl) (1) | ||||
Crude Oil Basis Swaps: | ||||||
January 2018 - June 2018 | 181,000 | $ | 0.10 | |||
January 2018 - June 2018 | 181,000 | 0.20 | ||||
January 2018 - June 2018 | 181,000 | 0.20 | ||||
January 2018 - June 2018 | 181,000 | 0.22 | ||||
January 2018 - June 2018 | 181,000 | 0.17 | ||||
January 2018 - December 2018 | 182,500 | 0.00 | ||||
January 2018 - December 2018 | 182,500 | 0.00 | ||||
January 2018 - December 2018 | 730,000 | 0.00 | ||||
January 2018 - December 2018 | 365,000 | 0.00 | ||||
January 2018 - December 2018 | 365,000 | 0.00 | ||||
(1) | The oil basis swap transactions are settled based on the difference between the arithmetic average of the ARGUS MIDLAND WTI and ARGUS WTI CUSHING settlements, during the relevant calculation period. |
Description & Production Period | Volume (MMBtu) | Weighted Average Differential ($/MMBtu) (1) | ||||
Natural Gas Basis Swaps: | ||||||
January 2018 - December 2018 | 1,825,000 | $ | (0.43 | ) | ||
January 2019 - December 2019 | 1,825,000 | $ | (0.43 | ) | ||
(1) | The natural gas basis swap contracts are settled based on the difference between Inside FERC’s West Texas WAHA price of natural gas and the NYMEX price of Natural Gas during the relevant calculation period. |
The fair value of these commodity derivative instruments at December 31, 2017 was a net asset of $0.9 million. A hypothetical upward or downward shift of 10% per Bbl in the NYMEX forward curve for crude oil as of December 31, 2017 would cause less than a $0.1 million increase or decrease in this fair value liability, and a hypothetical upward or downward shift of 10% per Mcf in the NYMEX forward curve for natural gas as of December 31, 2017 would cause a $0.2 million increase or decrease, respectively, in this fair value liability.
60
Interest Rate Risk
The Company’s ability to borrow and the rates offered by lenders can be adversely affected by credit market and the Company’s credit rating. CRP’s credit facility interest rate is based on a LIBOR spread, which expose the Company to interest rate risk if we have borrowings outstanding. At December 31, 2017, the Company had no borrowings outstanding under its credit facility. We do not currently have or intend to enter into any derivative arrangements to protect against fluctuations in interest rates applicable to our outstanding indebtedness.
The remaining $391 million of the Company’s long-term debt is a senior note with a fixed interest rate; therefore, it is not affected by interest rate movements. For additional information regarding the Company’s debt instruments, see Note 5—Long-Term Debt, in Item 8 of Part II of this Annual Report on Form 10-K.
61
ITEM 8. FINANCIAL STATEMENTS AND SUPPLEMENTARY DATA
CENTENNIAL RESOURCE DEVELOPMENT, INC.
INDEX TO FINANCIAL STATEMENTS AND SUPPLEMENTARY DATA
Page | |
Supplemental Information to Consolidated Financial Statements | |
62
Report of Independent Registered Public Accounting Firm
To the Stockholders and Board of Directors
Centennial Resource Development, Inc.:
Opinion on the Consolidated Financial Statements
We have audited the accompanying consolidated balance sheets of Centennial Resource Development, Inc. and subsidiaries (the Company) as of December 31, 2017 and 2016, the related consolidated statements of operations, shareholders’ (owners’) equity and cash flows for the year ended December 31, 2017 and the period October 11, 2016 through December 31, 2016 (Successor Company operations), and the period from January 1, 2016 to October 10, 2016 and for the year ended December 31, 2015 (Predecessor Company operations), and the related notes (collectively, the consolidated financial statements). In our opinion, the consolidated financial statements present fairly, in all material respects, the financial position of the Company as of December 31, 2017 and 2016, the results of its operations and its cash flows for the year ended December 31, 2017 and the period October 11, 2016 through December 31, 2016 (Successor Company operations) and for the period from January 1, 2016 to October 10, 2016 and the year ended December 31, 2015 (Predecessor Company operations), in conformity with U.S. generally accepted accounting principles.
We also have audited, in accordance with the standards of the Public Company Accounting Oversight Board (United States) (PCAOB), the Company’s internal control over financial reporting as of December 31, 2017, based on criteria established in Internal Control - Integrated Framework (2013) issued by the Committee of Sponsoring Organizations of the Treadway Commission, and our report dated February 26, 2018 expressed an unqualified opinion on the effectiveness of the Company’s internal control over financial reporting.
Basis for Opinion
These consolidated financial statements are the responsibility of the Company’s management. Our responsibility is to express an opinion on these consolidated financial statements based on our audits. We are a public accounting firm registered with the PCAOB and are required to be independent with respect to the Company in accordance with the U.S. federal securities laws and the applicable rules and regulations of the Securities and Exchange Commission and the PCAOB.
We conducted our audits in accordance with the standards of the PCAOB. Those standards require that we plan and perform the audit to obtain reasonable assurance about whether the consolidated financial statements are free of material misstatement, whether due to error or fraud. Our audits included performing procedures to assess the risks of material misstatement of the consolidated financial statements, whether due to error or fraud, and performing procedures that respond to those risks. Such procedures included examining, on a test basis, evidence regarding the amounts and disclosures in the consolidated financial statements. Our audits also included evaluating the accounting principles used and significant estimates made by management, as well as evaluating the overall presentation of the consolidated financial statements. We believe that our audits provide a reasonable basis for our opinion.
/s/ KPMG LLP
We have served as the Company’s auditor since 2014.
Denver, Colorado
February 26, 2018
63
Report of Independent Registered Public Accounting Firm
To the Stockholders and Board of Directors
Centennial Resource Development, Inc.:
Opinion on Internal Control Over Financial Reporting
We have audited Centennial Resource Development, Inc. and subsidiaries’ (the Company) internal control over financial reporting as of December 31, 2017, based on criteria established in Internal Control - Integrated Framework (2013) issued by the Committee of Sponsoring Organizations of the Treadway Commission. In our opinion, the Company maintained, in all material respects, effective internal control over financial reporting as of December 31, 2017, based on criteria established in Internal Control - Integrated Framework (2013) issued by the Committee of Sponsoring Organizations of the Treadway Commission.
We also have audited, in accordance with the standards of the Public Company Accounting Oversight Board (United States) (PCAOB), the consolidated balance sheets of Centennial Resource Development, Inc. and subsidiaries (the Company) as of December 31, 2017 and 2016, the related consolidated statements of operations, shareholders’ (owners’) equity and cash flows for the year ended December 31, 2017 and the period October 11, 2016 through December 31, 2016 (Successor Company operations), and the period from January 1, 2016 to October 10, 2016 and for the year ended December 31, 2015 (Predecessor Company operations), and the related notes (collectively, the consolidated financial statements), and our report dated February 26, 2018 expressed an unqualified opinion on those consolidated financial statements.
Basis for Opinion
The Company’s management is responsible for maintaining effective internal control over financial reporting and for its assessment of the effectiveness of internal control over financial reporting, included in the accompanying Management’s Annual Report on Internal Control Over Financial Reporting. Our responsibility is to express an opinion on the Company’s internal control over financial reporting based on our audit. We are a public accounting firm registered with the PCAOB and are required to be independent with respect to the Company in accordance with the U.S. federal securities laws and the applicable rules and regulations of the Securities and Exchange Commission and the PCAOB.
We conducted our audit in accordance with the standards of the PCAOB. Those standards require that we plan and perform the audit to obtain reasonable assurance about whether effective internal control over financial reporting was maintained in all material respects. Our audit of internal control over financial reporting included obtaining an understanding of internal control over financial reporting, assessing the risk that a material weakness exists, and testing and evaluating the design and operating effectiveness of internal control based on the assessed risk. Our audit also included performing such other procedures as we considered necessary in the circumstances. We believe that our audit provides a reasonable basis for our opinion.
Definition and Limitations of Internal Control Over Financial Reporting
A company’s internal control over financial reporting is a process designed to provide reasonable assurance regarding the reliability of financial reporting and the preparation of financial statements for external purposes in accordance with generally accepted accounting principles. A company’s internal control over financial reporting includes those policies and procedures that (1) pertain to the maintenance of records that, in reasonable detail, accurately and fairly reflect the transactions and dispositions of the assets of the company; (2) provide reasonable assurance that transactions are recorded as necessary to permit preparation of financial statements in accordance with generally accepted accounting principles, and that receipts and expenditures of the company are being made only in accordance with authorizations of management and directors of the company; and (3) provide reasonable assurance regarding prevention or timely detection of unauthorized acquisition, use, or disposition of the company’s assets that could have a material effect on the financial statements.
Because of its inherent limitations, internal control over financial reporting may not prevent or detect misstatements. Also, projections of any evaluation of effectiveness to future periods are subject to the risk that controls may become inadequate because of changes in conditions, or that the degree of compliance with the policies or procedures may deteriorate.
/s/ KPMG LLP
Denver, Colorado
February 26, 2018
64
CENTENNIAL RESOURCE DEVELOPMENT, INC.
CONSOLIDATED BALANCE SHEETS
(in thousands, except share amounts)
December 31, 2017 | December 31, 2016 | ||||||
ASSETS | |||||||
Current assets | |||||||
Cash and cash equivalents | $ | 117,315 | $ | 134,083 | |||
Accounts receivable, net | 78,786 | 14,734 | |||||
Derivative instruments, net | 433 | 431 | |||||
Prepaid and other current assets | 6,051 | 2,078 | |||||
Total current assets | 202,585 | 151,326 | |||||
Oil and natural gas properties, successful efforts method | |||||||
Unproved properties | 1,952,680 | 1,905,661 | |||||
Proved properties | 1,602,002 | 604,022 | |||||
Accumulated depreciation, depletion and amortization | (173,906 | ) | (14,436 | ) | |||
Total oil and natural gas properties, net | 3,380,776 | 2,495,247 | |||||
Other property and equipment, net | 5,465 | 2,193 | |||||
Total property and equipment, net | 3,386,241 | 2,497,440 | |||||
Noncurrent assets | |||||||
Derivative instruments, net | 662 | — | |||||
Other noncurrent assets | 27,081 | 2,876 | |||||
Total assets | $ | 3,616,569 | $ | 2,651,642 | |||
LIABILITIES AND SHAREHOLDERS' EQUITY | |||||||
Current liabilities | |||||||
Accounts payable and accrued expenses | $ | 199,533 | $ | 86,100 | |||
Derivative instruments, net | 240 | 5,361 | |||||
Total current liabilities | 199,773 | 91,461 | |||||
Noncurrent liabilities | |||||||
Long-term debt, net | 390,764 | — | |||||
Asset retirement obligations | 12,161 | 7,226 | |||||
Deferred tax liability, net | 9,899 | — | |||||
Derivative instruments, net | — | 20 | |||||
Total liabilities | 612,597 | 98,707 | |||||
Commitments and contingencies (Note 13) | |||||||
Shareholders’ Equity | |||||||
Preferred stock, $.0001 par value, 1,000,000 shares authorized: | |||||||
Series A: 1 share issued and outstanding | — | — | |||||
Series B: no shares issued and outstanding at December 31, 2017 and 104,400 shares issued and outstanding at December 31, 2016 | — | — | |||||
Common stock, $0.0001 par value, 620,000,000 shares authorized: | |||||||
Class A: 261,337,636 shares issued and 260,327,920 shares outstanding at December 31, 2017 and 201,091,646 shares issued and 200,835,049 shares outstanding at December 31, 2016 | 26 | 20 | |||||
Class C (Convertible): 15,661,338 shares issued and outstanding at December 31, 2017 and 19,155,921 shares issued and outstanding at December 31, 2016 | 2 | 2 | |||||
Additional paid-in capital | 2,767,558 | 2,364,049 | |||||
Retained earnings (accumulated deficit) | 66,639 | (8,929 | ) | ||||
Total shareholders’ equity | 2,834,225 | 2,355,142 | |||||
Noncontrolling interest | 169,747 | 197,793 | |||||
Total equity | 3,003,972 | 2,552,935 | |||||
Total liabilities and shareholders’ equity | $ | 3,616,569 | $ | 2,651,642 | |||
The accompanying notes are an integral part of these consolidated financial statements.
65
CENTENNIAL RESOURCE DEVELOPMENT, INC.
CONSOLIDATED STATEMENTS OF OPERATIONS
(in thousands, except per share data)
Successor | Predecessor | |||||||||||||||
Year Ended December 31, 2017 | October 11, 2016 through December 31, 2016 | January 1, 2016 through October 10, 2016 | Year Ended December 31, 2015 | |||||||||||||
Net revenues | ||||||||||||||||
Oil sales | $ | 336,931 | $ | 24,313 | $ | 59,787 | $ | 77,643 | ||||||||
Natural gas sales | 48,868 | 3,449 | 6,045 | 7,965 | ||||||||||||
NGL sales | 44,103 | 1,955 | 3,284 | 4,852 | ||||||||||||
Total net revenues | 429,902 | 29,717 | 69,116 | 90,460 | ||||||||||||
Operating expenses | ||||||||||||||||
Lease operating expenses | 41,336 | 3,541 | 11,036 | 21,173 | ||||||||||||
Severance and ad valorem taxes | 23,173 | 1,636 | 3,696 | 5,021 | ||||||||||||
Gathering, processing and transportation expenses | 34,259 | 2,187 | 4,583 | 5,732 | ||||||||||||
Depreciation, depletion and amortization | 161,628 | 14,877 | 62,964 | 90,084 | ||||||||||||
Impairment and abandonment expenses | (29 | ) | — | 2,545 | 7,619 | |||||||||||
Exploration expense | 14,373 | 1,468 | 920 | 84 | ||||||||||||
Contract termination and rig stacking | — | — | — | 2,387 | ||||||||||||
General and administrative expenses | 49,882 | 13,091 | 24,661 | 14,206 | ||||||||||||
Incentive unit compensation | — | — | 165,394 | — | ||||||||||||
Total operating expenses | 324,622 | 36,800 | 275,799 | 146,306 | ||||||||||||
Total operating income (loss) | 105,280 | (7,083 | ) | (206,683 | ) | (55,846 | ) | |||||||||
Other income (expense) | ||||||||||||||||
Gain (loss) on sale of oil and natural gas properties | 8,796 | 24 | 11 | 2,439 | ||||||||||||
Interest expense | (5,729 | ) | (378 | ) | (5,626 | ) | (6,266 | ) | ||||||||
Net gain (loss) on derivative instruments | 5,138 | (1,548 | ) | (6,838 | ) | 20,756 | ||||||||||
Other income | — | — | 6 | 20 | ||||||||||||
Other income (expense) | 8,205 | (1,902 | ) | (12,447 | ) | 16,949 | ||||||||||
Income (loss) before income taxes | 113,485 | (8,985 | ) | (219,130 | ) | (38,897 | ) | |||||||||
Income tax (expense) benefit | (29,930 | ) | — | 406 | 572 | |||||||||||
Net income (loss) | 83,555 | (8,985 | ) | (218,724 | ) | (38,325 | ) | |||||||||
Less: Net income (loss) attributable to noncontrolling interest | 7,987 | (904 | ) | — | — | |||||||||||
Net income (loss) attributable to common shareholders | $ | 75,568 | $ | (8,081 | ) | $ | (218,724 | ) | $ | (38,325 | ) | |||||
Income (loss) per share: | ||||||||||||||||
Basic | $ | 0.32 | $ | (0.05 | ) | |||||||||||
Diluted | $ | 0.32 | $ | (0.05 | ) | |||||||||||
The accompanying notes are an integral part of these consolidated financial statements.
66
CENTENNIAL RESOURCE DEVELOPMENT, INC.
CONSOLIDATED STATEMENTS OF CASH FLOWS
(in thousands)
Successor | Predecessor | |||||||||||||||
Year Ended December 31, 2017 | October 11, 2016 through December 31, 2016 | January 1, 2016 through October 10, 2016 | Year ended December 31, 2015 | |||||||||||||
Cash flows from operating activities: | ||||||||||||||||
Net income (loss) | $ | 83,555 | $ | (8,985 | ) | $ | (218,724 | ) | $ | (38,325 | ) | |||||
Adjustments to reconcile net income (loss) to net cash provided by operating activities: | ||||||||||||||||
Depreciation, depletion and amortization | 161,628 | 14,877 | 62,964 | 90,084 | ||||||||||||
Incentive unit compensation | — | — | 165,394 | — | ||||||||||||
Stock-based compensation expense | 13,759 | 1,333 | — | — | ||||||||||||
Noncash transaction cost | — | — | 14,049 | — | ||||||||||||
Impairment and abandonment expenses | (29 | ) | — | 2,545 | 7,619 | |||||||||||
Exploratory dry hole costs | 5,658 | — | — | — | ||||||||||||
Write-off of deferred S-1 related expense | — | — | — | 1,585 | ||||||||||||
Deferred tax expense (benefit) | 29,930 | — | (406 | ) | (572 | ) | ||||||||||
(Gain) loss on sale of oil and natural gas properties | (8,796 | ) | (24 | ) | (11 | ) | (2,439 | ) | ||||||||
Non-cash portion of derivative (gain) loss | (5,805 | ) | 2,602 | 23,461 | 14,737 | |||||||||||
Amortization of debt issuance costs | 887 | 70 | 376 | 482 | ||||||||||||
Changes in operating assets and liabilities: | ||||||||||||||||
(Increase) decrease in accounts receivable | (43,553 | ) | (983 | ) | 969 | 5,244 | ||||||||||
Increase in prepaid and other assets | (4,088 | ) | (1,092 | ) | (170 | ) | (864 | ) | ||||||||
Increase (decrease) in accounts payable and other liabilities | 26,772 | 1,612 | 1,293 | (8,669 | ) | |||||||||||
Net cash provided by operating activities | 259,918 | 9,410 | 51,740 | 68,882 | ||||||||||||
Cash flows from investing activities | ||||||||||||||||
Proceeds withdrawn from trust account | — | 500,561 | — | — | ||||||||||||
Acquisition of Centennial Resource Production, LLC | — | (1,375,744 | ) | — | — | |||||||||||
Acquisition of oil and natural gas properties | (435,547 | ) | (849,642 | ) | (55,564 | ) | (43,223 | ) | ||||||||
Drilling and development capital expenditures | (566,427 | ) | (24,107 | ) | (45,605 | ) | (156,006 | ) | ||||||||
Purchases of other property and equipment | (4,921 | ) | (801 | ) | (265 | ) | (2,097 | ) | ||||||||
Other assets | (7,907 | ) | — | — | — | |||||||||||
Proceeds from sales of oil and natural gas properties | 22,496 | — | — | 2,691 | ||||||||||||
Net cash used by investing activities | (992,306 | ) | (1,749,733 | ) | (101,434 | ) | (198,635 | ) | ||||||||
Cash flows from financing activities | ||||||||||||||||
Issuance of Class A common shares | 340,750 | 1,540,556 | — | — | ||||||||||||
Issuance of Preferred Series B Shares | — | 379,494 | — | — | ||||||||||||
Underwriting discount and offering costs | (7,291 | ) | (27,104 | ) | — | — | ||||||||||
Payment of deferred underwriting compensation | — | (17,500 | ) | — | — | |||||||||||
Proceeds from revolving credit facility | 275,000 | — | 55,000 | 92,000 | ||||||||||||
Repayment of revolving credit facility | (275,000 | ) | — | (5,000 | ) | (83,000 | ) | |||||||||
Proceeds from senior notes | 400,000 | — | — | — | ||||||||||||
Proceeds from stock options exercised | 877 | — | — | — | ||||||||||||
Restricted stock used for tax withholdings | (644 | ) | — | — | — | |||||||||||
Capital contributions | — | — | — | 111,396 | ||||||||||||
Debt issuance costs | (9,472 | ) | (1,115 | ) | — | (259 | ) | |||||||||
Financing obligation | — | (63 | ) | (2,074 | ) | (1,633 | ) | |||||||||
Net cash provided by financing activities | 724,220 | 1,874,268 | 47,926 | 118,504 | ||||||||||||
Net increase (decrease) in cash, cash equivalents and restricted cash | (8,168 | ) | 133,945 | (1,768 | ) | (11,249 | ) | |||||||||
Cash, cash equivalents and restricted cash, beginning of period | 134,083 | 138 | 1,768 | 13,017 | ||||||||||||
Cash, cash equivalents and restricted cash, end of period | $ | 125,915 | $ | 134,083 | $ | — | $ | 1,768 | ||||||||
The accompanying notes are an integral part of these consolidated financial statements.
67
CENTENNIAL RESOURCE DEVELOPMENT, INC.
CONSOLIDATED STATEMENTS OF CASH FLOWS (Continued)
(in thousands)
Supplemental cash flow information and noncash activity:
Successor | Predecessor | |||||||||||||||
Year Ended December 31, 2017 | October 11, 2016 through December 31, 2016 | January 1, 2016 through October 10, 2016 | Year ended December 31, 2015 | |||||||||||||
Supplemental cash flow information | ||||||||||||||||
Cash paid for interest | $ | 4,280 | $ | 234 | $ | 5,092 | $ | 5,782 | ||||||||
Supplemental noncash activity | ||||||||||||||||
Accrued capital expenditures included in accounts payable and accrued expenses | $ | 126,480 | $ | 65,217 | $ | 21,025 | $ | 13,124 | ||||||||
Asset retirement obligations incurred, including changes in estimate | 4,044 | 186 | 206 | 146 | ||||||||||||
Financing obligation | — | — | — | 3,770 | ||||||||||||
Reconciliation of cash, cash equivalents and restricted cash presented on the Consolidated Statements of Cash Flows:
(Successor) | (Predecessor) | |||||||||||||
Year Ended December 31, 2017 | October 11, 2016 through December 31, 2016 | January 1, 2016 through October 10, 2016 | Year ended December 31, 2015 | |||||||||||
Cash and cash equivalents | $ | 117,315 | $ | 134,083 | — | 1,768 | ||||||||
Restricted cash (1) | 8,600 | — | — | — | ||||||||||
Total cash, cash and cash equivalents and restricted cash | $ | 125,915 | $ | 134,083 | — | 1,768 | ||||||||
(1) | Included in Other Noncurrent Assets line item on the Consolidated Balance Sheets |
The accompanying notes are an integral part of these consolidated financial statements.
68
CENTENNIAL RESOURCE DEVELOPMENT, INC.
CONSOLIDATED STATEMENTS OF SHAREHOLDERS’ EQUITY (Successor)
(in thousands)
Common Stock | Preferred Stock | ||||||||||||||||||||||||||||||||||||||||||||||||||||||
Class A | Class B | Class C | Series A | Series B | Additional Paid-In Capital | Retained Earnings (Accumulated Deficit) | Total Shareholder's Equity | Non-controlling Interest | Total Equity | ||||||||||||||||||||||||||||||||||||||||||||||
Shares | Amount | Shares | Amount | Shares | Amount | Shares | Amount | Shares | Amount | ||||||||||||||||||||||||||||||||||||||||||||||
Balance at October 10, 2016 | 2,175 | $ | — | 12,500 | $ | 1 | — | $ | — | — | $ | — | — | $ | — | $ | 5,460 | $ | (461 | ) | $ | 5,000 | $ | — | $ | 5,000 | |||||||||||||||||||||||||||||
Conversion of common shares from Class B to Class A at transaction | 12,500 | 1 | (12,500 | ) | (1 | ) | — | — | — | — | — | — | — | — | — | — | — | ||||||||||||||||||||||||||||||||||||||
Class A common shares released from possible redemption | 47,825 | 5 | — | — | — | — | — | — | — | — | 478,243 | — | 478,248 | — | 478,248 | ||||||||||||||||||||||||||||||||||||||||
Class C common shares issued | — | — | — | — | 20,000 | 2 | — | — | — | — | (2 | ) | — | — | — | — | |||||||||||||||||||||||||||||||||||||||
Conversion of common shares from Class C to Class A | 844 | — | — | — | (844 | ) | — | — | — | — | — | 7,798 | — | 7,798 | (7,798 | ) | — | ||||||||||||||||||||||||||||||||||||||
Sale of unregistered Class A common shares | 101,005 | 10 | — | — | — | — | — | — | — | — | 1,010,040 | — | 1,010,050 | — | 1,010,050 | ||||||||||||||||||||||||||||||||||||||||
Underwriters’ discount and offering expense | — | — | — | — | — | — | — | — | — | — | (6,713 | ) | — | (6,713 | ) | — | (6,713 | ) | |||||||||||||||||||||||||||||||||||||
Net loss | — | — | — | — | — | — | — | — | — | — | — | (387 | ) | (387 | ) | — | (387 | ) | |||||||||||||||||||||||||||||||||||||
Noncontrolling interest in Centennial Resource Production, LLC | — | — | — | — | — | — | — | — | — | — | — | — | — | 184,779 | 184,779 | ||||||||||||||||||||||||||||||||||||||||
Balance at October 11, 2016 | 164,349 | $ | 16 | — | $ | — | 19,156 | $ | 2 | — | $ | — | — | $ | — | $ | 1,494,826 | $ | (848 | ) | $ | 1,493,996 | $ | 176,981 | $ | 1,670,977 | |||||||||||||||||||||||||||||
Restricted stock issued | 257 | — | — | — | — | — | — | — | — | — | — | — | — | — | — | ||||||||||||||||||||||||||||||||||||||||
Sale of unregistered Class A common shares | 36,486 | 4 | — | — | — | — | — | — | — | — | 530,503 | — | 530,507 | — | 530,507 | ||||||||||||||||||||||||||||||||||||||||
Sale of unregistered Class B preferred shares | — | — | — | — | — | — | — | — | 104 | — | 379,494 | — | 379,494 | — | 379,494 | ||||||||||||||||||||||||||||||||||||||||
Underwriters’ discount and offering expense | — | — | — | — | — | — | — | — | — | — | (20,391 | ) | — | (20,391 | ) | — | (20,391 | ) | |||||||||||||||||||||||||||||||||||||
Change in equity due to issuance of shares by Centennial Resource Production, LLC | — | — | — | — | — | — | — | — | — | — | (21,716 | ) | — | (21,716 | ) | 21,716 | — | ||||||||||||||||||||||||||||||||||||||
Stock-based compensation | — | — | — | — | — | — | — | — | — | — | 1,333 | — | 1,333 | — | 1,333 | ||||||||||||||||||||||||||||||||||||||||
Net loss | — | — | — | — | — | — | — | — | — | — | — | (8,081 | ) | (8,081 | ) | (904 | ) | (8,985 | ) | ||||||||||||||||||||||||||||||||||||
Balance at December 31, 2016 | 201,092 | $ | 20 | — | $ | — | 19,156 | $ | 2 | — | $ | — | 104 | $ | — | $ | 2,364,049 | $ | (8,929 | ) | $ | 2,355,142 | $ | 197,793 | $ | 2,552,935 | |||||||||||||||||||||||||||||
Warrants exercised | 6,236 | 1 | — | — | — | — | — | — | — | — | (1 | ) | — | — | — | — | |||||||||||||||||||||||||||||||||||||||
Restricted stock issued | 902 | — | — | — | — | — | — | — | — | — | — | — | — | — | — | ||||||||||||||||||||||||||||||||||||||||
Restricted stock forfeited | (12 | ) | — | — | — | — | — | — | — | — | — | — | — | — | — | — | |||||||||||||||||||||||||||||||||||||||
Restricted stock used for tax withholding | (33 | ) | — | — | — | — | — | — | — | — | — | (644 | ) | — | (644 | ) | — | (644 | ) | ||||||||||||||||||||||||||||||||||||
Option Exercises | 58 | — | — | — | — | — | — | — | — | — | 877 | — | 877 | — | 877 | ||||||||||||||||||||||||||||||||||||||||
Conversion of Series B preferred shares to Class A common shares | 26,100 | 3 | — | — | — | — | — | — | (104 | ) | — | (3 | ) | — | — | — | — | ||||||||||||||||||||||||||||||||||||||
Sale of unregistered Class A common shares | 23,500 | 2 | — | — | — | — | — | — | — | — | 340,748 | 340,750 | — | 340,750 | |||||||||||||||||||||||||||||||||||||||||
Underwriters' discount and offering expense | — | — | — | — | — | — | — | — | — | — | (7,291 | ) | — | (7,291 | ) | — | (7,291 | ) | |||||||||||||||||||||||||||||||||||||
Stock-based compensation | — | — | — | — | — | — | — | — | — | — | 13,759 | 13,759 | 13,759 | ||||||||||||||||||||||||||||||||||||||||||
Change in equity due to issuance of shares by Centennial Resource Production, LLC | — | — | — | — | — | — | — | — | — | — | (2,682 | ) | — | (2,682 | ) | 2,682 | — | ||||||||||||||||||||||||||||||||||||||
Conversion of common shares from Class C to Class A, net of tax | 3,495 | — | — | — | (3,495 | ) | — | — | — | — | — | — | 58,746 | — | 58,746 | (38,715 | ) | 20,031 | |||||||||||||||||||||||||||||||||||||
Net income | — | — | — | — | — | — | — | — | — | — | — | 75,568 | 75,568 | 7,987 | 83,555 | ||||||||||||||||||||||||||||||||||||||||
Balance at December 31, 2017 | 261,338 | $ | 26 | — | $ | — | 15,661 | $ | 2 | — | $ | — | — | $ | — | $ | 2,767,558 | $ | 66,639 | $ | 2,834,225 | $ | 169,747 | $ | 3,003,972 | ||||||||||||||||||||||||||||||
The accompanying notes are an integral part of these consolidated financial statements.
69
CENTENNIAL RESOURCE DEVELOPMENT, INC.
CONSOLIDATED STATEMENTS OF OWNERS’ EQUITY (Predecessor)
(in thousands)
Total equity | |||
Balance at December 31, 2014 | 377,932 | ||
Contributions | 111,396 | ||
Deemed distribution from sale of assets | (139 | ) | |
Net loss | (38,325 | ) | |
Balance at December 31, 2015 | 450,864 | ||
Contributions | 179,442 | ||
Net loss | (218,724 | ) | |
Balance at October 10, 2016 | $ | 411,582 | |
The accompanying notes are an integral part of these consolidated financial statements.
70
Note 1—Basis of Presentation and Summary of Significant Accounting Policies
Description of Business
Centennial Resource Development, Inc. (the “Company” or “Centennial”) is an independent oil and natural gas company focused on the development of unconventional oil and associated liquids-rich natural gas reserves in the Permian Basin. The Company’s assets are concentrated in the Delaware Basin, a sub-basin of the Permian Basin, and its properties consist of large, contiguous acreage blocks primarily in Reeves County in West Texas and Lea County in New Mexico.
Centennial was originally incorporated in Delaware on November 4, 2015 as a special purpose acquisition company under the name Silver Run Acquisition Corporation (“Silver Run”) for the purpose of effecting a merger, capital stock exchange, asset acquisition, stock purchase, reorganization or similar business combination involving the Company and one or more businesses.
On February 29, 2016, the Company consummated its initial public offering of Units each consisting of one share of Class A Common Stock and one-third of one Public Warrant. On October 11, 2016, the Company consummated the acquisition of approximately 89% of the outstanding membership interests in Centennial Resource Production, LLC, a Delaware limited liability company (“CRP” and such acquisition, the “Business Combination”). In connection with the closing of the Business Combination, the Company changed its name from “Silver Run Acquisition Corporation” to “Centennial Resource Development, Inc.” Refer to Note 2—Business Combination for further information related to the Business Combination.
CRP was formed in August 2012 by an affiliate of NGP Energy Capital Management, a family of energy-focused private equity investment funds, in connection with the acquisition of all of the oil and natural gas properties and certain other assets of Celero, which was formed in 2006 to focus on the development and acquisition of oil and natural gas properties located primarily in the Permian Basin of West Texas. Until the closing of the Business Combination, CRP operated as a privately-held independent oil and natural gas company.
Principles of Consolidation and Basis of Presentation
The consolidated financial statements include the accounts of the Company and its majority owned subsidiary CRP, and CRP’s wholly-owned subsidiaries and have been prepared in accordance with accounting principles generally accepted in the United States of America (“GAAP”) and the rules and regulations of the Securities and Exchange Commission (“SEC”). All intercompany balances and transactions have been eliminated in consolidation.
Noncontrolling interests represent third-party ownership in the Company’s consolidated subsidiary and is presented as a component of equity. See Note 7—Shareholders' Equity and Noncontrolling Interest for further discussion of noncontrolling interest.
Certain prior period amounts have been reclassified to conform to the current presentation on the accompanying consolidated financial statements. Such reclassifications had no impact on net income, cash flows or shareholders’ equity previously reported.
As a result of the Business Combination, the Company is the acquirer for accounting purposes, and CRP is the acquiree and accounting Predecessor. The Company’s financial statement presentation distinguishes CRP as an accounting “Predecessor” for periods prior to the Business Combination. The Company is the “Successor” for periods after the Business Combination, which includes consolidation of CRP subsequent to the Business Combination on October 11, 2016. The Business Combination was accounted for as a business combination using the acquisition method of accounting, and the Successor financial statements reflect a new basis of accounting that is based on the fair value of CRP’s net assets acquired. Refer to Note 2—Business Combination for further information related to the Business Combination. As a result of the application of the acquisition method of accounting as of the Business Combination, the financial statements for the Predecessor periods and for the Successor periods are presented on a different basis of accounting.
Use of Estimates
The preparation of the Company’s consolidated financial statements requires the Company’s management to make various assumptions, judgments and estimates to determine the reported amounts of assets, liabilities, revenues and expenses, and in the disclosures of commitments and contingencies. Changes in these assumptions, judgments, and estimates will occur as a result of the passage of time and the occurrence of future events and, accordingly, actual results could differ from amounts previously established.
The more significant areas requiring the use of assumptions, judgments and estimates include: (i) oil and natural gas reserves; (ii) cash flow estimates used in impairment tests of long-lived assets; (iii) depreciation, depletion and amortization; (iv) asset retirement obligations; (v) determining fair value and allocating purchase price in connection with business combinations and asset acquisitions; (vi) accrued revenue and related receivables; and (vii) accrued liabilities.
71
CENTENNIAL RESOURCE DEVELOPMENT, INC.
NOTES TO CONSOLIDATED AND COMBINED FINANCIAL STATEMENTS (Continued)
Risks and Uncertainties
The prices received for oil, natural gas and NGLs production heavily influences the Company’s revenue, profitability, access to capital, future rate of growth and carrying value of our properties. Oil, natural gas and NGLs are commodities, and their prices can be volatile in response to changes in global and domestic supply and demand and market uncertainty. The Company generally funds its operations and capital expenditures with cash flow from its operations, borrowings under CRP’s revolving credit facility and offerings of debt and equity securities. The Company expects to be able to fund its operations, planned capital expenditures and working capital requirements during the next 12 months and the foreseeable future. However, continued volatility of oil and gas prices could have an adverse effect on the Company’s future business, financial condition, results of operations, operating cash flows, liquidity and quantities of oil and gas reserves that may be economically produced, which could impact the Company’s ability to comply with the financial covenants under CRP’s credit facility and limit further borrowings to fund capital expenditures and potential acquisitions. Additionally, if forward prices decline, the Company could incur additional impairment of its oil and gas assets.
Cash and Cash Equivalents and Restricted Cash
The Company considers all highly liquid instruments with an original maturity of three months or less at the time of issuance to be cash equivalents. The carrying value of cash and cash equivalents approximates fair value because of the short-term maturity of these investments. From time to time, the Company is required to maintain cash in separate accounts, the use of which, is restricted by the terms of contracted arrangements. Such amounts are included in Other Noncurrent Assets on the Consolidated Balance Sheets.
Accounts Receivable
Accounts receivable consists mainly of receivables from oil and natural gas purchasers and from joint interest owners on properties the Company operates. For receivables from joint interest owners, the Company typically has the ability to withhold future revenue disbursements to recover non-payment of joint interest billings. Accordingly, oil and natural gas receivables are collected, and the Company has minimal bad debts.
Although diversified among many companies, collectability is dependent upon the financial wherewithal of each individual company and is influenced by the general economic conditions of the industry. Receivables are not collateralized. The Company establishes an allowance for doubtful accounts equal to the estimable portions of accounts receivable for which failure to collect is probable. The Company had no allowance for doubtful accounts as of December 31, 2017 and December 31, 2016.
Credit Risk and Other Concentrations
The Company normally sells production to a relatively small number of customers, as is customary in its business. The table below presents percentages by purchaser that accounted for 10% or more of our total oil, natural gas and NGL sales for each year as presented:
Year Ended December 31, 2017 | ||
Shell Trading (US) Company | 33 | % |
BP America | 16 | % |
Eagleclaw Midstream Ventures, LLC | 14 | % |
Year Ended December 31, 2016 | ||
Plains Marketing, LP | 48 | % |
Shell Trading (US) Company | 22 | % |
Permian Transport and Trading | 11 | % |
Year Ended December 31, 2015 | ||
Plains Marketing, LP | 64 | % |
During these periods, no other purchaser accounted for 10% or more of our revenue. The loss of any of the Company’s major purchasers could materially and adversely affect its revenues in the short-term. However, based on the current demand for oil and natural gas and the availability of other purchasers, the Company believes that the loss of any major purchaser would not have a material adverse effect on its financial condition and results of operations because crude oil and natural gas are fungible products with well-established markets and numerous purchasers.
72
CENTENNIAL RESOURCE DEVELOPMENT, INC.
NOTES TO CONSOLIDATED AND COMBINED FINANCIAL STATEMENTS (Continued)
By using derivative instruments to economically hedge exposures to changes in commodity prices, the Company exposes itself to credit risk and market risk. Credit risk is the failure of the counterparty to perform under the terms of the derivative contract. When the fair value of a derivative contract is positive, the counterparty owes the Company, which creates credit risk. The Company minimizes the credit risk in derivative instruments by: (i) limiting its exposure to any single counterparty; and (ii) monitoring the creditworthiness of the Company’s counterparties on an ongoing basis.
Oil and Natural Gas Properties
The Company’s oil and natural gas producing activities are accounted for using the successful efforts method of accounting. Under the successful efforts method, the costs incurred to acquire, drill, and complete productive development wells are capitalized. Oil and gas lease acquisition costs are also capitalized. Exploration costs, including personnel and other internal costs, geological and geophysical expenses, delay rentals for gas and oil leases, and costs associated with unsuccessful lease acquisitions are charged to expense as incurred. Costs of drilling exploratory wells are initially capitalized but are charged to expense if the well is determined to be unsuccessful. Costs to operate and maintain wells and field equipment are expensed as incurred.
The Company capitalizes interest on expenditures made in connection with exploration and development projects that are not subject to current amortization. Interest is capitalized only for the period that activities are in process to bring the projects to their intended use. Capitalized interest cannot exceed interest expense for the period capitalized. The Company capitalized interest of $1.2 million during the year ended December 31, 2017. The Company did not have any capitalized interest for the periods October 11, 2016 through December 31, 2016 (Successor) and January 1, 2016 through October 10, 2016 (Predecessor) and for the year ended December 31, 2015 (Predecessor).
Proved Oil and Natural Gas Properties. Costs incurred to obtain access to proved reserves and to provide facilities for extracting, treating, gathering and storing oil, natural gas and NGLs are capitalized. All costs incurred to drill and equip successful exploratory wells, development wells, development-type stratigraphic test wells and service wells, including unsuccessful development wells, are capitalized. Capitalized costs are depleted on a unit-of production method based on proved oil and gas reserves.
Net carrying values of retired, sold or abandoned properties that constitute less than a complete unit of depreciable property are charged or credited, net of proceeds, to accumulated depreciation, depletion and amortization unless doing so significantly affects the unit-of-production amortization rate, in which case a gain or loss is recognized. Gains or losses from the disposal of complete units of depreciable property are recognized to income.
The Company reviews it proved oil and natural gas properties for impairment when events and circumstances indicate a possible decline in the recoverability of the carrying amount of such property. The Company estimates the expected future cash flows of its oil and natural gas properties and compares these undiscounted cash flows to the carrying amount of the oil and natural gas properties to determine if the carrying amount is recoverable. If the carrying amount exceeds the estimated undiscounted future cash flows, the Company will write down the carrying amount of the oil and natural gas properties to fair value. The factors used to determine fair value include, but are not limited to, estimates of reserves, future commodity prices, future production estimates, estimated future capital expenditures and discount rates commensurate with the risk associated with realizing the projected cash flows. There were no impairments of proved oil and natural gas properties for the year ended December 31, 2017 (Successor), for the periods October 11, 2016 through December 31, 2016 (Successor) and January 1, 2016 through October 10, 2016 (Predecessor) and for the year ended December 31, 2015 (Predecessor).
Unproved Properties. Unproved properties consist of costs to acquire undeveloped leases as well as costs to acquire unproved reserves. Acquisition costs associated with the acquisition of non-producing leaseholds are recorded as unproved leasehold costs and capitalized as incurred. These consist of costs incurred in obtaining a mineral interest or right in a property, such as a lease in addition to options to lease, broker fees, recording fees and other similar costs related to acquiring properties. Leasehold costs are classified as unproved until proved reserves are discovered, at which time related costs are transferred to proved oil and natural gas properties. Unproved properties and the related costs are transferred to proved properties when reserves are discovered on or otherwise attributed to the property.
The Company evaluates significant unproved properties for impairment based on remaining lease term, drilling results, reservoir performance, seismic interpretation or future plans to develop acreage. There was no unproved property impairment expense for the year ended December 31, 2017 (Successor) or for the period from October 11, 2016 through December 31, 2016 (Successor). For the period from January 1, 2016, through October 10, 2016 (Predecessor), the Predecessor recorded unproved property impairment expense of $2.5 million for leases which have expired, or were expected to expire. For the year ended December 31, 2015 (Predecessor), the Predecessor recorded unproved property impairment expense of $7.6 million for leases which have expired, or were expected to expire.
73
CENTENNIAL RESOURCE DEVELOPMENT, INC.
NOTES TO CONSOLIDATED AND COMBINED FINANCIAL STATEMENTS (Continued)
Other Property and Equipment
Other property and equipment such as office furniture and equipment, buildings, vehicles, and computer hardware and software is recorded at cost. Depreciation is calculated using the straight-line method over the estimated useful lives of the assets ranging from three to twenty years. Major renewals and improvements are capitalized while expenditures for maintenance and repairs are expensed as incurred. When other property and equipment is sold or retired, the capitalized costs and related accumulated depreciation are removed from the accounts.
Deferred Loan Costs
Deferred loan costs related to the Company’s revolving credit facility are included in the line item Other Noncurrent Assets on the Consolidated Balance Sheets and are stated at cost, net of amortization. These costs are amortized to interest expense on a straight-line basis over the borrowing term. Costs incurred in connection with the 5.375% Senior Notes Offering are also deferred and charged to interest expense over the term of the agreement; however, these amounts are reflected as a reduction of the related obligation in the line item Long-term Debt on the Consolidated Balance Sheets.
Derivative Financial Instruments
In order to manage its exposure to oil and natural gas price volatility, the Company opportunistically utilizes derivative transactions from time to time, including commodity swap, basis swap, collar, and other similar agreements. To the extent legal right of offset exists with a counterparty, the Company reports derivative assets and liabilities on a net basis. The Company has exposure to credit risk to the extent the counterparty is unable to satisfy its settlement obligation. The Company actively monitors the creditworthiness of counterparties and assesses the impact, if any, on its derivative position.
The Company records derivative instruments on the Consolidated Balance Sheets as either an asset or liability measured at fair value and records changes in the fair value of derivatives in current earnings as they occur. The Company’s derivatives have not been designated as hedges for accounting purposes. For additional discussion on derivatives, please refer to Note 9—Derivative Instruments.
Asset Retirement Obligations
The Company recognizes an estimated liability for future costs associated with abandonment of its oil and natural gas properties. A liability for the fair value of an asset retirement obligation and corresponding increase to the carrying value of the related long-lived asset are recorded at the time a well is drilled or acquired. The fair value of the liability recognized is based on the present value of the estimated future cash outflows associated with its plug and abandonment obligations. The Company depletes the amount added to proved oil and natural gas property costs and recognizes expense in connection with the accretion of the discounted liability over the remaining estimated economic lives of the respective oil and natural gas properties. Revisions typically occur due to changes in estimated abandonment costs or well economic lives, or if federal or state regulators enact new requirements regarding the abandonment of wells. For additional discussion, please refer to Note 11—Asset Retirement Obligations.
Revenue Recognition
The Company derives revenue primarily from the sale of produced oil, natural gas, and NGLs. Revenue is recognized when the Company’s production is delivered to the purchaser, but payment is generally received between 30 and 90 days after the date of production. No revenue is recognized unless it is determined that title to the product has transferred to the purchaser. At the end of each month, the Company estimates the amount of production delivered to the purchaser and the price the Company will receive. The Company follows the sales method of accounting for its oil and natural gas revenue, whereby revenue is recorded based on the Company’s share of volume sold, regardless of whether the Company has taken its proportional share of volume produced. A receivable or liability is recognized only to the extent that the Company has an imbalance on a specific property greater than the expected remaining proved reserves. The Company had no significant imbalances as of December 31, 2017 or 2016.
Income Taxes
Income taxes and uncertain tax positions are accounted for in accordance with Financial Accounting Standards Board (“FASB”) Accounting Standards Codification (“ASC”) 740, Accounting for Income Taxes (“ASC 740”). Deferred income taxes are provided for the differences between the bases of assets and liabilities for financial reporting and income tax purposes. Tax positions meeting the more-likely-than-not recognition threshold are measured pursuant to the guidance set forth in ASC 740. We routinely assess the realizability of deferred income tax assets based on several factors and a valuation allowance is established if it’s more likely that not that some portion or all of deferred income tax assets will not be realized.
74
CENTENNIAL RESOURCE DEVELOPMENT, INC.
NOTES TO CONSOLIDATED AND COMBINED FINANCIAL STATEMENTS (Continued)
Stock-Based Compensation (Successor)
The Company grants various types of stock-based awards including stock options, restricted stock awards and performance stock units. The Company recognizes compensation related to all stock-based awards in the financial statements based on their estimated grant-date fair value and is recognized ratably over the applicable vesting period. The fair value of stock option awards is determined using the Black-Scholes option pricing model. Stock options typically expire ten years from the grant date and have service-based vesting schedules of three years. Service-based restricted stock awards are valued using the market price of the Company’s common stock on the grant date and generally vest ratably over a three-year service period. Performance stock units are subject to market-based vesting criteria as well as a three-year service period and the grant-date fair value is estimated using a Monte Carlo valuation model. See Note 8—Stock-Based Compensation for additional information regarding the Company’s stock-based compensation.
Incentive Unit Compensation (Predecessor)
Pursuant to the LLC Agreement of CRP (prior to the Business Combination), certain incentive units were available to be issued to the Company’s management and employees, consisting of Tier I, Tier I A, Tier II, Tier III and Tier IV units. The incentive units were intended to be compensation for services rendered to CRP. Tier Incentive units are accounted for as liability awards under FASB ASC Topic 718, Compensation: Stock Compensation (“ASC 718”), with compensation expense based on period-end fair value. Refer to Note 8—Stock-Based Compensation for additional information regarding the CRP’s incentive unit compensation (Predecessor).
Earnings (Loss) Per Share
The two-class method of computing earnings per share is required for entities that have participating securities. The two-class method is an earnings allocation formula that determines earnings per share for participating securities according to dividends declared (or accumulated) and participation rights in undistributed earnings.
Basic earnings per share (“EPS”) is calculated by dividing net income available to common shareholders by the weighted average shares outstanding during each period. Dilutive EPS is calculated by dividing adjusted net income available to common shareholders by the weighted average number of diluted common shares outstanding, which includes the effect of potentially dilutive securities. Potentially dilutive securities for the diluted EPS calculation consists of (i) unvested restricted stock and performance stock units, outstanding stock options and warrants using the treasury stock method, and (ii) the Company’s Class C common stock using the “if-converted” method, which is net of tax.
75
CENTENNIAL RESOURCE DEVELOPMENT, INC.
NOTES TO CONSOLIDATED AND COMBINED FINANCIAL STATEMENTS (Continued)
Shares of the Company’s unvested restricted stock and performance stock units are eligible to receive dividends; however, dividend rights will be forfeited if the award does not vest. Accordingly, these shares are not considered participating securities. Shares of the Company’s Class C Common Stock and warrants do not share in earnings or losses and are therefore not participating securities as well. In addition, the Company’s shares of Series B Preferred Stock were converted into shares of Class A Common Stock on May 25, 2017 as a result of shareholder vote. As such, the Company no longer has any participating securities as of December 31, 2017.
The following table reflects the allocation of net income to common stockholders and EPS computations for the periods indicated based on a weighted average number of common stock outstanding for the period:
Successor | |||||||
Year Ended December 31, 2017 | October 11, 2016 through December 31, 2016 | ||||||
(in thousands, except per share data) | |||||||
Net income (loss) attributable to common shareholders | $ | 75,568 | $ | (8,081 | ) | ||
Add: Income from conversion of Class C Common Stock | — | — | |||||
Less: Loss allocable to participating securities | — | (46 | ) | ||||
Adjusted net income (loss) attributable to common shareholders | $ | 75,568 | $ | (8,035 | ) | ||
Basic net earnings (loss) per share | $ | 0.32 | $ | (0.05 | ) | ||
Diluted net earnings (loss) per share | $ | 0.32 | $ | (0.05 | ) | ||
Basic weighted average share outstanding | 235,447 | 165,684 | |||||
Add: Dilutive effect of potential common shares | 4,307 | — | |||||
Diluted weighted average shares outstanding | 239,754 | 165,684 | |||||
For the year ended December 31, 2017, the diluted earnings per share calculation excludes 0.8 million stock options that were out-of-the-money and 18.6 million weighted average Class C Common Stock as their effect was anti-dilutive. For the period from October 11, 2016, through December 31, 2016, the diluted earnings per share calculation excludes all outstanding restricted stock and options as the Company recognized a net loss and their effect would have been anti-dilutive.
Segment Reporting
The Company operates in only one industry segment which is the exploration and production of oil and natural gas. All of its operations are conducted in one geographic area of the United States. All revenues are derived from customers located in the United States.
Recently Issued Accounting Standards
In January 2017, the FASB issued Accounting Standards Update (“ASU”) 2017-01, Business Combinations (Topic 805): Clarifying the Definition of a Business. This update affects all reporting entities and the objective of the guidance is to assist with evaluation of whether transactions should be accounted for as acquisitions (or disposals) of assets or businesses. The mandatory effective date for this update is for financial statements issued for fiscal years beginning after December 15, 2017, including interim periods within those fiscal years. The amendments should be applied prospectively on or after the effective date and disclosures are not required at transition. Early adoption is permitted for transactions for which the acquisition date occurs before the issuance date or effective date of the amendments, only when the transaction has not been reported in financial statements that have been issued or made available for issuance. The Company early adopted ASU 2017-01 in the second quarter of 2017. Refer to Note 3—Property Acquisitions for details of the GMT Acquisition.
In November 2016, the FASB issued ASU 2016-18, Statement of Cash Flows: Restricted Cash. This update applies to all entities that are required to present a statement of cash flows. This update expands the statement of cash flows to explain changes in restricted cash as well cash and cash equivalents. This update will be effective for financial statements issued for fiscal years beginning after December 15, 2017, including interim periods within those fiscal years with early adoption permitted. This update should be applied using the retrospective transition method. The Company early adopted ASU 2016-18 in the fourth quarter of 2017 and the only impact was related to presentation. Refer to the Consolidated Statements of Cash Flows for presentation.
In August 2016, the FASB issued ASU 2016-15, Statement of Cash Flows: Classification of Certain Cash Receipts and Cash Payments. This update applies to all entities that are required to present a statement of cash flows. This update provides guidance on eight specific cash flow issues: debt prepayment or debt extinguishment costs, settlement of zero-coupon debt instruments or
76
CENTENNIAL RESOURCE DEVELOPMENT, INC.
NOTES TO CONSOLIDATED AND COMBINED FINANCIAL STATEMENTS (Continued)
other debt instruments with coupon interest rates that are insignificant in relation to the effective interest rate of the borrowing, contingent consideration payments made after a business combination, proceeds from the settlement of insurance claims, proceeds from the settlement of corporate-owned life insurance policies, including bank-owned life insurance policies, distributions received from equity method investees, beneficial interests in securitization transactions and separately identifiable cash flows and application of the predominance principle. This update will be effective for financial statements issued for fiscal years beginning after December 31, 2017, including interim periods within those fiscal years with early adoption permitted. This update should be applied using the retrospective transition method. Adoption of this standard will only affect the presentation of the Company’s statements of cash flows and will not have a material impact on its consolidated financial statements.
In March 2016, the FASB issued ASU 2016-09, Compensation-Stock Compensation. This update applies to all entities that issue equity-based payment awards to their employees. Under this update, there were several areas that were simplified including the income tax consequences, classification of awards as either equity or liabilities and classification on the statement of cash flows. This update will be effective for financial statements issued for fiscal years beginning after December 15, 2016, including interim periods within those fiscal years with early adoption permitted. The Company elected to early adopt this guidance in October 2016 in conjunction with the issuance of its equity awards.
In February 2016, the FASB issued ASU 2016-02, Leases, which created Topic ASC 842, Leases (“Topic ASC 842”), superseding current lease requirements under Topic ASC 840. Subsequently, in January 2018, the FASB issued ASU 2018-01, which provides a practical expedient to the evaluation of existing land easement agreements under ASU 2016-02. ASU 2016-02 and its amendments applies to any entity that enters into a lease, with some specified scope exemptions. Under Topic ASC 842, a lessee should recognize in the statement of financial position a liability to make lease payments (the lease liability) and a right-of-use asset representing its right to use the underlying asset for the lease term. While there were no major changes to the lessor accounting, changes were made to align key aspects with the revenue recognition guidance. Topic ASC 842 will be effective for public entities for fiscal years beginning after December 15, 2018, including interim periods within those fiscal years, with early adoption permitted. Entities will be required to recognize and measure leases at the beginning of the earliest period presented using a modified retrospective approach. Although the Company is still in the process of evaluating the effect of adopting ASU 2016-02 and related amendments, the adoption is expected to result in the recognition of assets and liabilities on its Consolidated Balance Sheet for current operating leases. The Company is evaluating existing arrangements to determine if they qualify for lease accounting under Topic ASC 842.
In May 2014, the FASB issued ASU No. 2014-09, Revenue from Contracts with Customers, which supersedes the revenue recognition requirements in ASC Topic 605, Revenue Recognition, and most industry-specific guidance. The FASB subsequently issued various ASUs which deferred the effective date of ASU 2014-09 and provided additional implementation guidance. ASU 2014-09 and its amendments provides companies with a single model for use in accounting for revenue arising from contracts with customers and supersedes current revenue recognition guidance, including industry-specific revenue guidance. The core principle of the model is to recognize revenue when control of the goods or services transfers to the customer, as opposed to recognizing revenue when the risks and rewards transfer to the customer under the existing revenue guidance. In addition, new qualitative and quantitative disclosure requirements aim to enable financial statement users to understand the nature, amount, timing and uncertainty of revenue and cash flows arising from contracts with customers. ASU 2014-09 and its amendments are effective for fiscal years, and interim periods within those years, beginning after December 15, 2017. The standards permit retrospective application using either of the following methodologies: (i) restatement of each prior reporting period presented or (ii) recognition of a cumulative-effect adjustment as of the date of initial application.
The Company has selected the modified retrospective method and has adopted this guidance as of January 1, 2018, the effective date. The Company has substantially completed its review of the impact of the new standard on its significant contracts. However, the Company will finalize the adoption of ASU No. 2014-09 during the first quarter of 2018, but at this time, management does not believe there will be a material impact to net income or cash flows upon adoption of the new standard. Where the Company delivers raw gas to midstream processing companies and retains control of its natural gas and plant products until tailgate of the plant, the cost of such processing will continue to be reflected in the Company’s gathering, processing and transportation expenses as has been our practice historically. The Company has evaluated the expected disclosure requirements, changes to relevant business practices, accounting policies and control activities as a result of the adoption of the ASU and does not expect a material quantitative impact to the Company's consolidated financial statements, other than additional disclosures. Additionally, the Company will account for any gas imbalances based on the entitlement method rather than the sales method. This change will not have impact on the Company’s results of operations or financial position in 2018.
Note 2—Business Combination
On October 11, 2016 (the “Closing Date”), the Company consummated the acquisition of approximately 89% of the outstanding membership interests in Centennial Resource Production, LLC, a Delaware limited liability company (“CRP”),
77
CENTENNIAL RESOURCE DEVELOPMENT, INC.
NOTES TO CONSOLIDATED AND COMBINED FINANCIAL STATEMENTS (Continued)
pursuant to (i) that certain Contribution Agreement, dated as of July 6, 2016 (as amended by Amendment No. 1 thereto, dated as of July 29, 2016, the “Contribution Agreement”), among Centennial Resource Development, LLC, a Delaware limited liability company (“CRP”), NGP Centennial Follow-On LLC, a Delaware limited liability company (“NGP Follow-On”), Celero Energy Company, LP, a Delaware limited partnership (together with CRD and NGP Follow-On, the “Centennial Contributors”), CRP and New Centennial, LLC, a Delaware limited liability company (“NewCo”), (ii) that certain Assignment Agreement, dated as of October 7, 2016, between NewCo and the Company and (iii) that certain Joinder Agreement, dated as of October 7, 2016, by the Company (such acquisition, together with the other transactions contemplated by the Contribution Agreement, the “Business Combination”).
At the closing of the Business Combination (the “Closing”), Silver Run contributed approximately $1.49 billion in cash to CRP of which approximately $1.19 billion was then distributed to the Centennial Contributors for partial redemption of their membership interests in CRP. At the Closing, Silver Run and the Centennial Contributors effected a recapitalization of CRP pursuant to which (i) all of the remaining outstanding membership interests in CRP of the Centennial Contributors were converted into 20,000,000 units representing common membership interests in CRP (the “CRP Common Units”) and (ii) the Company was admitted as a member of CRP and issued 163,505,000 CRP Common Units, representing an approximate 89% interest in CRP.
The Business Combination was recorded using the acquisition method of accounting for business combinations. The allocation of the purchase price has been finalized and was based upon management’s estimates and assumptions related to the fair value of assets acquired and liabilities assumed on the Closing Date using currently available information.
The purchase price consideration for the Business Combination was as follows:
(in thousands) | October 11, 2016 | ||
Purchase price consideration: | |||
Cash | $ | 1,186,744 | |
Repayment of CRP long-term debt(1) | 189,000 | ||
Total purchase price consideration | 1,375,744 | ||
Fair value of non-controlling interest(2) | 184,779 | ||
Total purchase price consideration and fair value of non-controlling interest | $ | 1,560,523 | |
(1) | Represents the additional contribution made by Silver Run to CRP in exchange for CRP Common Units to repay CRP’s outstanding indebtedness at the Closing Date. |
(2) | Represents the fair value of the non-controlling interest (“NCI”) attributable to the Centennial Contributors. NCI is the portion of equity (net assets) in a subsidiary not attributable, directly or indirectly, to Silver Run. In a business combination the NCI is recognized at its acquisition date fair value. The fair value of the NCI at the Closing represented an 11% membership interest in CRP. |
The following table summarizes the allocation of the purchase price to the assets acquired and liabilities assumed:
(in thousands) | October 11, 2016 | ||
Fair value of assets acquired: | |||
Other current assets | $ | 13,341 | |
Derivative instruments | 1,052 | ||
Oil and natural gas properties: | |||
Proved properties | 444,551 | ||
Unproved properties | 1,138,423 | ||
Other property and equipment | 1,764 | ||
Goodwill | — | ||
Total fair value of assets acquired | 1,599,131 | ||
Fair value of liabilities assumed: | |||
Accounts payable and accrued expenses | 30,156 | ||
Other current liabilities | 63 | ||
Derivative instruments | 3,400 | ||
Asset retirement obligation | 4,989 | ||
Fair value of net assets acquired | $ | 1,560,523 | |
78
CENTENNIAL RESOURCE DEVELOPMENT, INC.
NOTES TO CONSOLIDATED AND COMBINED FINANCIAL STATEMENTS (Continued)
Unaudited Pro Forma Operating Results
The following unaudited pro forma combined financial information has been prepared as if the Business Combination and other related transactions had taken place on January 1, 2015. The unaudited pro forma consolidated financial information has been prepared using the acquisition method of accounting in accordance with GAAP.
The information reflects pro forma adjustments based on available information and certain assumptions that the Company believes are reasonable, including depletion of CRP’s fair-valued proved oil and gas properties, and the estimated tax impacts of the pro forma adjustments. Additionally, pro forma earnings for the year ended December 31, 2016, were adjusted to exclude $18.7 million of transaction-related costs and $165.4 million of incentive unit compensation incurred by CRP.
The pro forma condensed combined financial information has been included for comparative purposes and is not necessarily indicative of the results that might have actually occurred had the Business Combination taken place on January 1, 2015; furthermore, the financial information is not intended to be a projection of future results.
(Unaudited Pro Forma) | |||||||
Year Ended December 31, | |||||||
(in thousands) | 2016 | 2015 | |||||
Total net revenues | $ | 98,833 | $ | 90,460 | |||
Total operating expenses | 86,490 | 123,702 | |||||
Net income (loss) attributable to common shareholders | 1,666 | (6,397 | ) | ||||
Basic and diluted net income (loss) per share | $ | 0.01 | $ | (0.04 | ) | ||
Note 3—Property Acquisitions
2017 Acquisitions
On June 8, 2017, the Company completed the GMT Acquisition and acquired interests in 36 gross producing horizontal wells plus undeveloped acreage on approximately 11,850 net acres (14,770 gross acres) in Lea County, New Mexico for an unadjusted purchase price of $350.0 million. The Company operates approximately 79% of, and has an approximate 85% average working interest in, this acreage. The acquired acres are located in the Northern Delaware Basin with drilling locations in the Avalon Shale, 2nd Bone Spring Sand, 3rd Bone Spring Sand and Wolfcamp A formations.
The GMT Acquisition was recorded as an asset acquisition under ASU 2017-01. Accordingly, the GMT purchase consideration has been allocated to the GMT oil and natural gas properties based on their relative fair values measured as of the acquisition date. After settlement statement adjustments of $0.1 million, the Company paid a net purchase price of $350.1 million. On a relative fair value basis, $296.9 million was allocated to unproved properties and $53.2 million to proved properties with the remaining purchase price allocated amongst other assets and liabilities. Transaction costs as they relate to the GMT Acquisition mainly consist of advisory, legal and accounting fees and are capitalized as incurred, and the Company has incurred $0.5 million in transaction costs related to this acquisition as of December 31, 2017.
2016 Acquisitions
On December 28, 2016, the Company acquired interests in 31 producing horizontal wells plus undeveloped acreage on approximately 35,500 net acres (43,500 gross acres) located in Reeves County, Texas from Silverback Exploration, LLC, for an unadjusted purchase price of $855.0 million, which consisted of cash consideration paid by the Company and a $32.3 million payable at December 31, 2016 that was settled in 2017 when title issues relating to the purchased acreage were satisfied. The Company operates approximately 90% of, and has an approximate 90% working interest in, this acreage. The Wolfcamp A and Wolfcamp B are producing horizons on this acreage, and the Company believes that this acreage may be prospective for the Wolfcamp C, Avalon and Bone Spring shale formations.
The Silverback Acquisition was recorded using the acquisition method of accounting for business combinations. The allocation of the purchase price has been finalized and is based upon management’s estimates and assumptions related to the fair value of assets acquired and liabilities assumed on the acquisition date using currently available information. Transaction costs relating to this purchase were expensed as incurred. Since the acquisition date, the Company has recorded adjustments to provisional amounts totaling $0.3 million. These adjustments did not have a material impact on the Company’s previously reported consolidated financial statements, and therefore the Company has not retrospectively adjusted those financial statements.
79
CENTENNIAL RESOURCE DEVELOPMENT, INC.
NOTES TO CONSOLIDATED AND COMBINED FINANCIAL STATEMENTS (Continued)
The table below summarizes the allocation of the $867.8 million adjusted purchase price, based on the acquisition date fair value of the assets acquired and the liabilities assumed as of December 31, 2017:
(in thousands) | Silverback Acquisition | ||
Purchase price | $ | 867,772 | |
Allocation of purchase price: | |||
Unproved properties | 753,763 | ||
Proved properties | 116,700 | ||
Other property and equipment | 56 | ||
Liabilities | (2,747 | ) | |
Total | $ | 867,772 | |
In June 2016, the Company acquired undeveloped acreage and oil and gas producing properties located in Reeves County, Texas. Total cash consideration paid by the Company was $33.0 million, including usual and customary post-closing adjustments. Approximately $15.4 million was recorded as proved oil and natural gas properties. The assets include four operated producing horizontal wells and approximately 1,580 net acres that directly offset the Company’s existing acreage in Reeves County, Texas.
Predecessor | |||
(in thousands) | June 3, 2016 | ||
Cash consideration | $ | 32,979 | |
Fair value of assets and liabilities acquired: | |||
Proved oil and natural gas properties | 15,374 | ||
Unproved oil and natural gas properties | 18,071 | ||
Total fair value of oil and natural gas properties acquired | 33,445 | ||
Revenue Suspense | (400 | ) | |
Asset retirement obligation | (66 | ) | |
Total fair value of net assets acquired | $ | 32,979 | |
Note 4—Accounts Receivable, Accounts Payable and Accrued Expenses
Accounts receivable are comprised of the following:
(in thousands) | December 31, 2017 | December 31, 2016 | |||||
Oil and natural gas | $ | 52,891 | $ | 11,596 | |||
Joint interest billings | 25,256 | 2,942 | |||||
Other | 639 | 196 | |||||
Accounts receivable, net | $ | 78,786 | $ | 14,734 | |||
Accounts payable and accrued expenses are comprised of the following:
(in thousands) | December 31, 2017 | December 31, 2016 | |||||
Accounts payable | $ | 64,004 | $ | 11,210 | |||
Accrued capital expenditures | 90,511 | 24,038 | |||||
Revenues payable | 23,390 | 3,815 | |||||
Accrued employee compensation and benefits | 8,350 | 4,221 | |||||
Accrued interest | 1,936 | 230 | |||||
Payable to Silverback | — | 32,293 | |||||
Accrued underwriting fees | — | 7,719 | |||||
Other | 11,342 | 2,574 | |||||
Accounts payable and accrued expenses | $ | 199,533 | $ | 86,100 | |||
80
CENTENNIAL RESOURCE DEVELOPMENT, INC.
NOTES TO CONSOLIDATED AND COMBINED FINANCIAL STATEMENTS (Continued)
Note 5—Long-Term Debt
Credit Agreement
CRP, the Company’s consolidated subsidiary, has a credit agreement with a syndicate of banks that as of December 31, 2017, had a borrowing base of $475.0 million, which has been committed by lenders and is available for borrowing. A portion of the revolving credit facility in an aggregate amount not to exceed $15.0 million may be used to issue letters of credit for the account of CRP or other designated subsidiaries of the Company. As of December 31, 2017, the Company had no borrowings outstanding and $474.1 million in available borrowing capacity, which was net of $0.9 million in letters of credit outstanding.
The amount available to be borrowed under CRP's revolving credit facility is subject to a borrowing base that is redetermined semi-annually each April 1 and October 1 by the lenders in their sole discretion. CRP's credit agreement also allows for two optional borrowing base redeterminations on January 1 and July 1. The borrowing base depends on, among other things, the volumes of CRP’s proved oil and natural gas reserves, estimated cash flows from these reserves and its commodity hedge positions. The borrowing base will automatically be decreased by an amount equal to 25% of the aggregate notional amount of permitted issued senior unsecured notes unless such decrease is waived by the lenders. Upon a redetermination of the borrowing base, if borrowings in excess of the revised borrowing capacity are outstanding, CRP could be required to immediately repay a portion of its debt outstanding under the credit agreement. Borrowings under CRP’s revolving credit facility are guaranteed by certain of its subsidiaries. In connection with the October 2017 semi-annual redetermination, on November 2, 2017, the credit agreement’s borrowing base was increased from $350.0 million to $575.0 million; however, on December 1, 2017 simultaneous with the issuance of the Senior Notes, CRP entered into an amendment to the credit agreement to, among other things, reflect CRP’s election to voluntarily reduce the commitments and borrowing base under the credit agreement to $475.0 million.
Interest and commitment fees are accrued based on a borrowing base utilization grid set forth in the credit agreement and are discussed in “Item 7. Management’s Discussion and Analysis of Financial Condition and Results of Operations - Liquidity and Capital Resources” in this report. Commitment fees are accrued on the unused portion of the aggregate lender commitment amount and are included in interest expense in the Consolidated Statements of Operations. The credit facility provides for interest only payments until October 15, 2019, when the credit agreement expires, and all outstanding borrowings are due.
CRP’s credit agreement contains restrictive covenants that limit its ability to, among other things: incur additional indebtedness; make investments and loans; enter into mergers; make or declare dividends; enter into commodity hedges exceeding a specified percentage of its expected production; enter into interest rate hedges exceeding a specified percentage of its outstanding indebtedness; incur liens; sell assets; and engage in transactions with affiliates.
CRP’s credit agreement also requires it to maintain compliance with the following financial ratios: (i) a current ratio, which is the ratio of CRP’s consolidated current assets (including unused commitments under its revolving credit facility and excluding non-cash assets under FASB’s ASC Topic 815, Derivatives and Hedging (“ASC 815”), and certain restricted cash) to its consolidated current liabilities (excluding the current portion of long-term debt under the credit agreement and non-cash liabilities under ASC 815), of not less than 1.0 to 1.0; and (ii) a leverage ratio, which is the ratio of Total Funded Debt (as defined in CRP’s credit agreement) to consolidated EBITDAX (as defined in CRP’s credit agreement) for the rolling four fiscal quarter period ending on such day, of not greater than 4.0 to 1.0.
CRP was in compliance with the covenants and the financial ratios described above as of December 31, 2017 and through the filing of this report.
5.375% Senior Unsecured Notes due 2026
On November 30, 2017, CRP issued at par $400.0 million of 5.375% senior notes due 2026 (the “Senior Notes”) in an 144A private placement that resulted in net proceeds to CRP of $391 million, after deducting $9 million in debt issuance costs. Interest is payable on the Senior Notes semi-annually in arrears on each January 15 and July 15, commencing July 15, 2018. The Senior Notes are fully and unconditionally guaranteed on a senior unsecured basis by each of CRP’s current subsidiaries that guarantee CRP’s revolving credit facility. The Senior Notes are not guaranteed by the Company nor is the Company subject to the terms of the indenture governing the Senior Notes.
At any time prior to January 15, 2021, CRP may, on any one or more occasions, redeem up to 35% of the aggregate principal amount of the Senior Notes with an amount of cash not greater than the net cash proceeds of certain equity offerings at a redemption price equal to 105.375% of the principal amount of the Senior Notes redeemed, plus accrued and unpaid interest, if any, to the date of redemption; provided that at least 65% of the aggregate principal amount issued under the indenture governing the Senior Notes remains outstanding immediately after such redemption and the redemption occurs within 180 days of the closing date of such equity offering.
81
CENTENNIAL RESOURCE DEVELOPMENT, INC.
NOTES TO CONSOLIDATED AND COMBINED FINANCIAL STATEMENTS (Continued)
At any time prior to January 15, 2021, CRP may, on any one or more occasions, redeem all or a part of the Senior Notes at a redemption price equal to 100% of the principal amount of the Senior Notes redeemed, plus a “make-whole” premium as of, and accrued and unpaid interest, if any, to, the date of redemption. On and after January 15, 2021, CRP may redeem the Senior Notes, in whole or in part, at redemption prices (expressed as percentages of principal amount) equal to 102.688% for the 12-month period beginning on January 15, 2021, 101.344% for the 12-month period beginning January 15, 2022, and 100% beginning on January 15, 2023, plus accrued and unpaid interest to the redemption date.
If CRP experiences certain defined changes of control, each holder of the Senior Notes may require CRP to repurchase all or a portion of its Senior Notes for cash at a price equal to 101% of the aggregate principal amount of such Senior Notes, plus any accrued but unpaid interest to the date of repurchase.
The indenture governing the Senior Notes contains covenants that, among other things and subject to certain exceptions and qualifications, limit CRP’s ability and the ability of CRP’s restricted subsidiaries to: (i) incur or guarantee additional indebtedness or issue certain types of preferred stock; (ii) pay dividends on capital stock or redeem, repurchase or retire capital stock or subordinated indebtedness; (iii) transfer or sell assets; (iv) make investments; (v) create certain liens; (vi) enter into agreements that restrict dividends or other payments from their subsidiaries to them; (vii) consolidate, merge or transfer all or substantially all of their assets; (viii) engage in transactions with affiliates; and (ix) create unrestricted subsidiaries. CRP was in compliance with the covenants as of December 31, 2017 and through the filing of this report.
Upon an Event of Default (as defined in the indenture governing the Senior Notes), the trustee or the holders of at least 25% of the aggregate principal amount of then outstanding Senior Notes may declare the Senior Notes immediately due and payable, except that a default resulting from certain events of bankruptcy or insolvency with respect to CRP, any restricted subsidiary of CRP that is a significant subsidiary or any group of restricted subsidiaries that, taken together, would constitute a significant subsidiary, will automatically cause all outstanding Senior Notes to become due and payable.
Note 6—Income Taxes
In 2016, the Company became the sole managing member of CRP, and as a result, began consolidating the financial results of CRP. CRP is treated as a partnership for U.S. federal and most applicable state and local income tax purposes. As a partnership, CRP is not subject to U.S. federal and certain state and local income taxes. Any taxable income or loss generated by CRP is passed through to and included in the taxable income or loss of its members, including the Company, on a pro rata basis. The Company is subject to U.S. federal income taxes, in addition to state and local income taxes with respect to its allocable share of any taxable income or loss of CRP, as well as any stand-alone income or loss generated by the Company.
Income tax expenses and benefits included in the consolidated statements of operations are detailed below:
Successor | Predecessor | |||||||||||||||
Year Ended December 31, 2017 | October 11, 2016 through December 31, 2016 | January 1, 2016 through October 10, 2016 | Year Ended December 31, 2015 | |||||||||||||
(in thousands) | ||||||||||||||||
Current taxes | ||||||||||||||||
Federal | $ | — | $ | — | $ | — | $ | — | ||||||||
State | — | — | — | — | ||||||||||||
— | — | — | — | |||||||||||||
Deferred taxes | ||||||||||||||||
Federal | (26,713 | ) | — | — | — | |||||||||||
State | (3,217 | ) | — | 406 | 572 | |||||||||||
(29,930 | ) | — | 406 | 572 | ||||||||||||
Income tax benefit (expense) | $ | (29,930 | ) | $ | — | $ | 406 | $ | 572 | |||||||
82
CENTENNIAL RESOURCE DEVELOPMENT, INC.
NOTES TO CONSOLIDATED AND COMBINED FINANCIAL STATEMENTS (Continued)
A reconciliation of the statutory federal income tax expense to the income tax expense or benefit from continuing operations provided at December 31, 2017, is as follows:
Successor | Predecessor | |||||||||||||||
Year Ended December 31, 2017 | October 11, 2016 through December 31, 2016 | January 1, 2016 through October 10, 2016 | Year Ended December 31, 2015 | |||||||||||||
(in thousands) | ||||||||||||||||
Income tax (expense) benefit at the federal statutory rate | $ | (39,720 | ) | $ | 3,145 | $ | — | $ | — | |||||||
State income tax (expense) benefit - net of federal income tax benefits | (2,788 | ) | — | 406 | 572 | |||||||||||
Change in Federal tax rate (net of state benefit and VA) | 4,425 | — | — | — | ||||||||||||
Excess depletion | — | — | — | — | ||||||||||||
Noncontrolling interest in partnership | 2,795 | (273 | ) | — | — | |||||||||||
Equity based compensation | 241 | — | — | — | ||||||||||||
Nondeductible expenses | (31 | ) | (4 | ) | — | — | ||||||||||
Change in valuation allowance | 5,148 | (2,868 | ) | — | — | |||||||||||
Other | — | — | — | — | ||||||||||||
Income tax benefit (expense) | $ | (29,930 | ) | $ | — | $ | 406 | $ | 572 | |||||||
The change in the Federal tax rate was due to the passage of Public Law No. 115-97, commonly referred to as the Jobs Act. The passage of this legislation resulted in the Company generating a deferred tax benefit primarily due to the reduction in the U.S. statutory rate from 35% to 21%. Based on the Company's current interpretation and subject to the release of the related regulations and any future interpretive guidance, the Company believes the effects of the change in tax law incorporated herein are substantially complete.
The tax effects of temporary differences that give rise to significant positions of the deferred income tax assets and liabilities are presented below:
(in thousands) | December 31, 2017 | December 31, 2016 | |||||
Deferred tax assets: | |||||||
Net operating loss carryforwards | $ | 88,968 | $ | 2,590 | |||
Capitalized intangible drilling cost | 5,137 | 10,314 | |||||
Equity-based compensation | 2,631 | 467 | |||||
Other assets | 288 | 291 | |||||
Total deferred tax assets | 97,024 | 13,662 | |||||
Deferred tax liabilities: | |||||||
Investment in Centennial Resource Production, LLC | (106,923 | ) | (8,514 | ) | |||
Other liabilities | — | — | |||||
Total deferred tax liabilities | (106,923 | ) | (8,514 | ) | |||
Valuation allowance | — | (5,148 | ) | ||||
Net deferred tax asset (liabilities) | $ | (9,899 | ) | $ | — | ||
During 2017 in connection with the conversion of shares from a noncontrolling interest owner, a tax benefit was recorded in equity of $20.0 million. For the period from October 11, 2016 through December 31, 2016 (Successor), equity was debited $5.6 million in connection with the issuance of shares from a noncontrolling interest owner. No tax benefit was recorded in equity as a $2.0 million valuation allowance fully offset the attendant tax benefit.
As of December 31, 2017, the Company had approximately $415.9 million and $82.0 million of U.S. federal and state net operating loss carryovers, respectively, which expire variously from 2035 to 2037.
The Company periodically assesses whether it is more likely than not that it will generate sufficient taxable income to realize its deferred income tax assets, including net operating loss carry forwards. In making this determination, the Company considers
83
CENTENNIAL RESOURCE DEVELOPMENT, INC.
NOTES TO CONSOLIDATED AND COMBINED FINANCIAL STATEMENTS (Continued)
all available positive and negative evidence and makes certain assumptions. The Company considers, among other things, its deferred tax liabilities, the overall business environment, its historical earnings and losses, current industry trends, and its outlook for future years. As of December 31, 2017, in part because the Company achieved cumulative pre-tax income, management determined that sufficient positive evidence exists as of December 31, 2017, to conclude that it is more likely than not deferred tax assets will be realized prior to their expiration.
The calculation of the Company’s tax liabilities involves uncertainties in the application of complex tax laws and regulations. The Company gives financial statement recognition to those tax positions that it believes are more-likely-than-not to be sustained upon the examination by the Internal Revenue Service or other governmental agency. As of December 31, 2017, the Company did not have any accrued liability for uncertain tax positions and does not anticipate recognition of any significant liabilities for uncertain tax positions during the next 12 months. Interest and penalties related to uncertain tax positions are reported in income tax expense.
The Company is subject to the following material taxing jurisdictions: U.S., Colorado, New Mexico, and Texas. As of December 31, 2017, the Company has no current tax years under audit. The Company remains subject to examination for federal income taxes and state income taxes for tax years 2015 through 2017.
Note 7—Shareholders' Equity and Noncontrolling Interest
On November 9, 2017, Silver Run Sponsor, LLC (“Silver Run Sponsor”), the Riverstone Purchasers and Celero completed an underwritten public offering of 25,000,000 shares of Class A Common Stock. No cash proceeds were received by the Company in connection with this offering and 3,494,583 shares of Class C Common Stock were converted to shares of Class A Common Stock on a one-to-one basis. In addition, a tax benefit of $20.0 million was recorded in equity as a result of the conversion of shares from a noncontrolling interest owner.
On May 25, 2017, the Company’s stockholders approved at a special meeting the issuance of 26,100,000 shares of Class A Common Stock upon the conversion of 104,400 shares of Series B Preferred Stock that were held by affiliates of Riverstone Investment Group LLC in a private placement. There were no cash proceeds received by the Company in connection with this issuance.
On May 4, 2017, the Company entered into subscription agreements with certain investors pursuant to which such investors agreed to purchase, in the aggregate, 23,500,000 shares of Class A Common Stock at a purchase price of $14.50 per share, for gross proceeds of approximately $340.8 million. The closing under the subscription agreements occurred concurrently with the closing of the GMT Acquisition on June 8, 2017, and the proceeds were used to fund a majority of the purchase price of that acquisition.
On December 28, 2016, in connection with the Silverback Acquisition, the Company issued and sold in private placements (i) 3,473,590 shares of Class A Common Stock and 104,400 shares of Series B Preferred Stock to affiliates of Riverstone Investment Group LLC and (ii) 33,012,380 shares of Class A Common Stock to certain other investors, resulting in net cash proceeds of approximately $889.6 million. The Company used the proceeds from the private placements to fund the cash consideration for the Silverback Acquisition and the remaining proceeds for general corporate purposes. The shares of Series B Preferred Stock were subsequently converted into shares of the Company’s Class A Common Stock on a 250-to-one basis in 2017 as discussed above.
On October 11, 2016, in connection with Business combination, the Company issued and sold in private placements (i) 81,005,000 shares of Class A Common Stock to Riverstone Centennial Holdings, L.P. and (ii) 20,000,000 shares of Class A Common Stock to certain other accredited investors, resulting in net cash proceeds of approximately $1.0 billion. The outstanding shares of Class B Common Stock converted into shares of Class A Common Stock on a one-for-one basis in connection with the Business Combination. Additionally, the Company issued 20,000,000 shares of Class C Common Stock to the Centennial Contributors and one share of Series A Preferred Stock to CRD in connection with the Business Combination.
Class A Common Stock
Holders of the Company's Class A Common Stock are entitled to one vote for each share held on all matters to be voted on by the Company's stockholders. Holders of the Class A Common Stock and holders of the Class C Common Stock vote together as a single class on all matters submitted to a vote of the Company's stockholders, except as required by law.
Unless specified in the Charter (including any certificate of designation of preferred stock) or Bylaws, or as required by applicable provisions of the Delaware General Corporation Law or applicable stock exchange rules, the affirmative vote of a majority of the Company’s shares of common stock that are voted is required to approve any such matter voted on by the Company’s stockholders. There is no cumulative voting with respect to the election of directors, with the result that the holders of more than 50% of the shares voted for the election of directors can elect all of the directors (subject to the right of the holder of the Company’s Series A Preferred Stock to nominate and elect one director). Subject to the rights of the holders of any
84
CENTENNIAL RESOURCE DEVELOPMENT, INC.
NOTES TO CONSOLIDATED AND COMBINED FINANCIAL STATEMENTS (Continued)
outstanding series of preferred stock, the Company’s stockholders are entitled to receive ratable dividends when, as and if declared by the board of directors out of funds legally available therefor.
In the event of a liquidation, dissolution or winding up of the Company, the holders of the Class A Common Stock are entitled to share ratably in all assets remaining available for distribution to them after payment of liabilities and after provision is made for each class of stock, if any, having preference over the Class A Common Stock. The Company’s stockholders have no preemptive or other subscription rights. There are no sinking fund provisions applicable to the Class A Common Stock.
Class C Common Stock
The Company had 15,661,338 shares of Class C Common Stock outstanding as of December 31, 2017, which represent the remaining portion of the 20,000,000 shares of Class C Common Stock issued to the Centennial Contributors in connection with the Business Combination that had not been redeemed or exchanged as of such date.
Holders of Class C Common Stock have the right to vote on all matters properly submitted to a vote of the stockholders and vote together as a single class with the holders of Class A Common Stock. In addition, the holders of Class C Common Stock, voting as a separate class, are entitled to approve any amendment, alteration or repeal of any provision of the Company’s Charter that would alter or change the powers, preferences or relative, participating, optional, other or special rights of the Class C Common Stock. Holders of Class C Common Stock are not entitled to any dividends from the Company and are not entitled to receive any of its assets in the event of any voluntary or involuntary liquidation, dissolution or winding up of its affairs.
Shares of Class C Common Stock may be issued only to the Centennial Contributors, their respective successors and assigns, as well as any permitted transferees of the Centennial Contributors. A holder of Class C Common Stock may transfer shares of Class C Common Stock to any transferee (other than the Company) only if such holder also simultaneously transfers an equal number of such holder’s CRP Common Units to such transferee in compliance with the A&R LLC Agreement (as defined below). Holders of Class C Common Stock generally have the right to cause CRP to redeem all or a portion of their CRP Common Units in exchange for shares of the Company’s Class A Common Stock or, at CRP’s option, an equivalent amount of cash. The Company may, however, at its option, effect a direct exchange of cash or Class A Common Stock for such CRP Common Units in lieu of such a redemption by CRP. Upon the future redemption or exchange of CRP Common Units held by a Centennial Contributor, a corresponding number of shares of Class C Common Stock will be canceled.
Preferred Stock
As of December 31, 2017 and 2016, the Company had one share of Series A Preferred Stock outstanding which was issued to CRD in connection with the Business Combination. CRD, as the holder of the Series A Preferred Stock, is not entitled to any dividends from the Company, but is entitled to preferred distributions in liquidation in the amount of $0.0001 per share of Series A Preferred Stock and has a limited voting right as described below. The Series A Preferred Stock is redeemable by the Company (i) at such time as CRD and its affiliates cease to own, in the aggregate, at least 5,000,000 CRP Common Units and/or shares of Class A Common Stock (as adjusted for stock splits, stock dividends, reorganizations, recapitalizations and other similar transactions), (ii) at any time at CRD’s option or (iii) upon a breach by CRD of the transfer restrictions relating to the Series A Preferred Stock. In addition, for so long as the Series A Preferred Stock remains outstanding, CRD will be entitled to nominate one director for election to the Company’s board of directors in connection with any vote of the Company’s stockholders for the election of directors, and the vote of CRD will be the only vote required to elect such nominee to the Company’s board of directors.
Warrants
The Company’s Public Warrants were originally issued in connection with the IPO of Silver Run Acquisition Corporation. On March 1, 2017, the Company delivered a notice of redemption to all holders of its Public Warrants announcing its intention to redeem any Public Warrants that remained unexercised and outstanding after March 31, 2017 for $0.01 per Public Warrant. As of December 31, 2017, all of the Company’s Public Warrants have been either exercised for shares of Class A Common Stock or redeemed for $0.01 per Public Warrant. As a result of all such Warrants exercised, the Company issued in aggregate 6,235,790 shares of Class A common stock to holders of Public Warrants.
As of December 31, 2017, 8,000,000 Private Placement Warrants remained outstanding. Private Placement Warrants are non-redeemable so long as they are held by Riverstone or its permitted transferees. Each whole Private Placement Warrant is exercisable for one whole share of Class A Common Stock at a price of $11.50 per share. The warrants became exercisable on March 1, 2017 and will expire five years after the completion of the Business Combination or earlier upon redemption or liquidation.
85
CENTENNIAL RESOURCE DEVELOPMENT, INC.
NOTES TO CONSOLIDATED AND COMBINED FINANCIAL STATEMENTS (Continued)
Noncontrolling Interest
The noncontrolling interest relates to CRP Common Units that were originally issued to the Centennial Contributors in connection with the Business Combination and continue to be held by holders other than the Company. At the date of the Business Combination, the noncontrolling interest held 10.9% of the ownership in CRP. The noncontrolling interest percentage is affected by various equity transactions such as, Class C Common Stock conversions and Class A Common Stock activities.
As a result of the exchange of the CRP Common Units (and corresponding shares of Class C Common Stock) for Class A Common Stock on October 11, 2016 and the issuance of shares of Class A Common Stock and Series B Preferred stock on December 28, 2016 (as discussed in the preceding section above), the noncontrolling interest ownership of CRP decreased to 7.8% as of December 31, 2016.
As of December 31, 2017, the noncontrolling interest ownership of CRP decreased to 5.7%. The decrease was the result of Class A Common Stock issuance in May and the exchange of CRP Common Units (and corresponding shares of Class C Common Stock) for Class A Common Stock in November as discussed in preceding sections above.
The Company has consolidated the financial position, results of operations and cash flows of CRP and reflected that portion retained by other holders of CRP Common Units as a noncontrolling interest. Refer to the Consolidated Statements of Shareholders’ Equity for a summary of the activity attributable to the noncontrolling interest during the period.
Owners’ Equity (Predecessor)
At October 10, 2016 (prior to the Business Combination), members included Centennial HoldCo, Celero and Follow-On, owning an approximate 61.2%, 21.2% and 17.6% membership interest in Centennial OpCo, respectively. CRP had two classes of membership interests outstanding: Class A, which consisted of membership interests held by CRD and Follow-On; and Class B, which consisted of membership interests held by Celero. On October 10, 2016 CRP recorded a deemed contribution attributable to the consummation of the Business Combination, which resulted in the achievement of the payout conditions with respect to the incentive units and CRP recorded $165.4 million of compensation expense. Refer to Note 7—Shareholders' Equity and Noncontrolling Interest. Additionally, CRP recorded a deemed contribution of $14.0 million attributable to certain transaction costs related to the Business Combination paid by the Centennial Contributors. Refer to Note 2—Business Combination.
As of December 31, 2015, CRD had contributed $289.4 million and had a remaining capital commitment of $32.5 million, Follow-On had contributed $84.2 million and had a remaining capital commitment of $100.3 million, and Celero had contributed $125.4 million and has no remaining capital commitment.
In 2015 Follow-On contributed $84.2 million to Centennial OpCo in exchange for membership interests in Centennial CRP. In addition, CRD contributed approximately $27.2 million to CRP in exchange for additional membership interests in CRP.
Note 8—Stock-Based Compensation
Long Term Incentive Plan
On October 7, 2016, the stockholders of the Company approved the Centennial Resource Development, Inc. 2016 Long Term Incentive Plan (the “LTIP”). An aggregate of 16,500,000 shares of Class A Common Stock were authorized for issuance under the LTIP, and as of December 31, 2017, the Company had 10,851,807 shares of Class A Common Stock available for future grants. The LTIP provides for grant of stock options (including incentive stock options and nonqualified stock options), stock appreciation rights, restricted stock, dividend equivalents, restricted stock units and other stock or cash-based awards.
Stock-based compensation expense is recognized within General and administrative expenses and Exploration expense on the Consolidated Statements of Operations as shown below. Historical amounts may not be representative of future amounts as the value of future awards may vary from historical amounts. Upon adoption of ASU 2016-09 in October 2016, the Company elected to account for forfeitures of awards granted under the LTIP as they occur in determining compensation expense.
Year Ended December 31, 2017 | October 11, 2016 through December 31, 2016 | ||||||
(in thousands) | |||||||
Restricted stock awards | $ | 5,008 | $ | 405 | |||
Stock option awards | 8,160 | 928 | |||||
Performance Stock Units | 591 | — | |||||
Total stock-based compensation expense | $ | 13,759 | $ | 1,333 | |||
86
CENTENNIAL RESOURCE DEVELOPMENT, INC.
NOTES TO CONSOLIDATED AND COMBINED FINANCIAL STATEMENTS (Continued)
Restricted Stock
The following table provides information about restricted stock awards outstanding during the year ended December 31, 2017:
Awards | Weighted Average Grant-Date Fair Value | |||||
Unvested balance as of December 31, 2016 | 256,597 | $ | 20.03 | |||
Granted | 902,111 | $ | 17.33 | |||
Vested | (137,177 | ) | $ | 19.98 | ||
Forfeited | (11,815 | ) | $ | 18.29 | ||
Unvested balance as of December 31, 2017 | 1,009,716 | $ | 17.64 | |||
The Company grants service-based restricted stock awards to executive officers and employees, which generally vest ratably over a three-year service period, and to directors, which generally vest over a one-year service period. Compensation cost for the service-based restricted stock awards is based upon the grant-date market value of the award and such costs are recognized ratably over the applicable vesting period. Weighted average grant-date fair value for restricted stock award granted was $17.33 per share and $20.03 per share for the years ended December 31, 2017 and 2016, respectively. Total fair value of restricted stock awards that vested during the year ended December 31, 2017 was $2.7 million. Unrecognized compensation cost related to unvested restricted shares at December 31, 2017 was $15.1 million, which the Company expects to recognize over a weighted average period of 2.3 years.
Stock Options
Stock options that have been granted under the LTIP expire ten years from the grant date and have service-based vesting schedules of three years. The exercise price for an option under the LTIP is the closing price of the Company’s Class A Common Stock as reported by NASDAQ on the date of grant.
Compensation cost related to stock options is based on the grant-date fair value of the award, recognized ratably over the applicable vesting period. The Company estimates the fair value using the Black-Scholes option-pricing model. Expected volatilities are based on the re-levered asset volatility implied by a set of comparable companies. Expected term is based on the simplified method and is estimated as the average of the weighted average vesting term and the time to expiration as of the grant date. The Company uses U.S. Treasury bond rates in effect at the grant date for its risk-free interest rates.
The following table summarizes the assumptions and related information used to determine the grant-date fair value of stock options awarded during the year ended December 31, 2017:
Year Ended December 31, 2017 | October 11, 2016 through December 31, 2016 | ||||||
Weighted average grant-date fair value per share | $ | 7.15 | $ | 5.93 | |||
Expected term (in years) | 6 | 6 | |||||
Expected stock volatility | 38 | % | 40 | % | |||
Dividend yield | — | % | — | % | |||
Risk-free interest rate | 2.0 | % | 1.5 | % | |||
The following table provides information about stock option awards outstanding during the year ended December 31, 2017:
Options | Weighted Average Exercise Price | Weighted Average Remaining Term (in years) | Aggregate Intrinsic Value (in thousands) | |||||||||
Outstanding as of December 31, 2016 | 2,735,500 | $ | 14.67 | |||||||||
Granted | 1,884,500 | $ | 18.02 | |||||||||
Exercised | (58,499 | ) | $ | 15.02 | ||||||||
Forfeited | (279,000 | ) | $ | 14.54 | ||||||||
Outstanding as of December 31, 2017 | 4,282,501 | $ | 16.15 | 9.0 | $ | 15,633 | ||||||
Exercisable as of December 31, 2017 | 760,997 | $ | 14.67 | 8.8 | $ | 3,907 | ||||||
87
CENTENNIAL RESOURCE DEVELOPMENT, INC.
NOTES TO CONSOLIDATED AND COMBINED FINANCIAL STATEMENTS (Continued)
As of December 31, 2017, there was $18.9 million of unrecognized compensation cost related to non-vested stock options, which the Company expects to recognize on a pro rata basis over a weighted average period of 2.0 years.
Performance Stock Units
The Company grants to executive officers performance stock units that are subject to market-based vesting criteria as well as a three-year service period. Vesting at the end of the three-year service period is subject to the condition that the Company’s stock price increases by a greater percentage, or decreases by a lesser percentage, than the average percentage increase or decrease, respectively, of the stock prices of a peer group of companies. The market-based conditions must be met in order for the stock awards to vest, and it is, therefore, possible that no shares could vest. However, the Company recognizes compensation expense for the performance stock units subject to market conditions regardless of whether it becomes probable that these conditions will be achieved or not and compensation expense is not reversed if vesting does not actually occur.
The grant-date fair value was estimated using a Monte Carlo valuation model. The Monte Carlo valuation model is based on random projections of stock price paths and must be repeated numerous times to achieve a probabilistic assessment. Expected volatility was calculated based on the historical volatility of the common stock, and the risk-free interest rate is based on U.S. Treasury yield curve rates with maturities consistent with the three-year vesting period. The following table summarizes the key assumptions and related information used to determine the grant-date fair value of performance stock units awarded during the year ended December 31, 2017:
Year Ended December 31, 2017 | ||
Number of simulations | 1,000,000 | |
Expected stock volatility | 41.6 | % |
Dividend yield | — | % |
Risk-free interest rate | 1.5 | % |
The following table provides information about performance stock units outstanding during the year ended December 31, 2017:
Awards | Weighted Average Grant-Date Fair Value | |||||
Unvested balance as of December 31, 2016 | — | $ | — | |||
Granted | 193,391 | $ | 21.53 | |||
Vested | — | $ | — | |||
Forfeited | — | $ | — | |||
Unvested balance as of December 31, 2017 | 193,391 | $ | 21.53 | |||
As of December 31, 2017, there was $3.6 million of unrecognized compensation cost related to unvested performance stock units, which the Company expects to recognize on a pro rata basis over a weighted average period of 2.5 years
Incentive Unit Compensation (Predecessor)
Certain employees of Centennial Resource Management, LLC, a wholly owned subsidiary of CRD at the time of grant, received awards of CRD and NGP Follow-On incentive units, or profits interests. The incentive units were issued to employees in return for services provided and cash payout was based, in part, on the value of Centennial’s equity. The incentive units were accounted for as liability awards under ASC 718, with compensation expense based on period-end fair value and recognized at such time that the payout terms were probable of being met. The consummation of the Business Combination resulted in the achievement of the payout conditions with respect to the incentive units and CRP recorded $165.4 million of compensation expense. No incentive compensation expense was recorded at December 31, 2015, because it was not probable that the performance criterion would be met.
88
CENTENNIAL RESOURCE DEVELOPMENT, INC.
NOTES TO CONSOLIDATED AND COMBINED FINANCIAL STATEMENTS (Continued)
Note 9—Derivative Instruments
The Company is exposed to certain risks relating to its ongoing business operations and uses derivative instruments to manage its exposure to commodity price risk from time to time.
Commodity Derivative Contracts
Historically, prices received for crude oil and natural gas production have been volatile because of supply and demand factors, worldwide political factors, general economic conditions and seasonal weather patterns. The Company periodically uses derivative instruments, such as swaps, costless collars and basis swaps, to mitigate its exposure to declines in commodity prices and to the corresponding negative impacts such declines can have on its cash flow from operations, returns on capital and other financial results. While the use of these instruments limits the downside risk of adverse price changes, their use may also limit future revenues from favorable price changes. The Company does not enter into derivative contracts for speculative or trading purposes.
Commodity Swap Contracts. The Company opportunistically uses commodity derivative instruments known as fixed price swaps to realize a known price for a specific volume of production. All transactions are settled in cash with one party paying the other for the net difference in the agreed upon published third-party index price (“index price”) and the swap fixed price, multiplied by the contract volume. The Company also utilizes basis swaps contracts to hedge the difference between the index price and a local index price.
The following table summarizes the approximate volumes and average contract prices of swap contracts the Company had in place as of December 31, 2017:
Period | Volume (Bbl) | Weighted Average Differential ($/Bbl) (1) | |||||
Crude oil basis swaps | January 2018 - June 2018 | 905,000 | $ | 0.18 | |||
January 2018 - December 2018 | 1,825,000 | $ | 0.00 | ||||
(1) | The oil basis swap transactions are settled based on the difference between the arithmetic average of the ARGUS MIDLAND WTI and ARGUS WTI CUSHING settlements, during the relevant calculation period. |
Period | Volume (MMBtu) | Weighted Average Differential ($/MMBtu) (1) | |||||
Natural gas basis swaps | January 2018 - December 2018 | 1,825,000 | $ | (0.43 | ) | ||
January 2019 - December 2019 | 1,825,000 | $ | (0.43 | ) | |||
(1) | The natural gas basis swap contracts are settled based on the difference between Inside FERC’s West Texas WAHA price of natural gas and the NYMEX price of Natural Gas during the relevant calculation period. |
Derivative Instrument Reporting. The Company’s oil and natural gas derivative instruments have not been designated as hedges for accounting purposes; therefore, all gains and losses are recognized in the Company’s Consolidated Statements of Operations. All derivative instruments are recorded at fair value on the Consolidated Balance Sheets, other than derivative instruments that meet the “normal purchase normal sale” exclusion, and any gains and losses are recognized in current period earnings.
The following table presents gains and losses for derivative instruments not designated as hedges for accounting purposes for the periods presented:
Successor | Predecessor | |||||||||||
Year Ended December 31, 2017 | October 11, 2016 through December 31, 2016 | January 1, 2016 through October 10, 2016 | Year Ended December 31, 2015 | |||||||||
(in thousands) | ||||||||||||
Net gain (loss) on derivative instruments | 5,138 | (1,548 | ) | (6,838 | ) | 20,756 | ||||||
89
CENTENNIAL RESOURCE DEVELOPMENT, INC.
NOTES TO CONSOLIDATED AND COMBINED FINANCIAL STATEMENTS (Continued)
Offsetting of Derivative Assets and Liabilities. The Company’s commodity derivatives are measured at fair value and are included in the accompanying Consolidated Balance Sheets as derivative assets and liabilities. The Company nets its financial derivative instrument fair value amounts executed with the same counterparty pursuant to ISDA master netting agreements, which provide for net settlement over the term of the contract and in the event of default or termination of the contract. The following tables summarize the location and fair value amounts of all the Company’s derivative instruments in the Consolidated Balance Sheets, as well as the gross recognized derivative assets, liabilities and amounts offset in the Consolidated Balance Sheets:
December 31, 2017 | |||||||||||||
Balance Sheet Classification | Gross Fair Value Asset/Liability Amounts | Gross Amounts Offset (1) | Net Recognized Fair Value Assets/Liabilities | ||||||||||
Derivative Assets | |||||||||||||
Derivative instruments | Current assets | $ | 720 | $ | (287 | ) | $ | 433 | |||||
Derivative instruments | Noncurrent assets | 662 | — | 662 | |||||||||
Total derivative assets | $ | 1,382 | $ | (287 | ) | $ | 1,095 | ||||||
Derivative Liabilities | |||||||||||||
Derivative instruments | Current liabilities | $ | 527 | $ | (287 | ) | $ | 240 | |||||
(1) | The Company has agreements in place with all of its counterparties that allow for the financial right of offset for derivative assets and derivative liabilities at settlement or in the event of a default under the agreements or contract termination. |
December 31, 2016 | |||||||||||||
Balance Sheet Classification | Gross Fair Value Asset/Liability Amounts | Gross Amounts Offset (1) | Net Recognized Fair Value Assets/Liabilities | ||||||||||
Derivative Assets | |||||||||||||
Derivative instruments | Current assets | $ | 739 | $ | (308 | ) | $ | 431 | |||||
Derivative Liabilities | |||||||||||||
Derivative instruments | Current liabilities | 5,669 | (308 | ) | 5,361 | ||||||||
Derivative instruments | Noncurrent Liabilities | 20 | — | 20 | |||||||||
Total derivative liabilities | $ | 5,689 | $ | (308 | ) | $ | 5,381 | ||||||
(1) | The Company has agreements in place with all of its counterparties that allow for the financial right of offset for derivative assets and derivative liabilities at settlement or in the event of a default under the agreements or contract termination. |
Contingent Features in Financial Derivative Instruments. None of the Company’s derivative instruments contain credit-risk-related contingent features. Counterparties to the Company’s financial derivative contracts are high credit-quality financial institutions that are lenders under CRP’s credit agreement. The Company uses only credit agreement participants to hedge with, since these institutions are secured equally with the holders of any CRP bank debt, which eliminates the potential need to post collateral when Centennial is in a derivative liability position. As a result, the Company is not required to post letters of credit or corporate guarantees for its derivative counterparties in order to secure contract performance obligations.
In addition, the Company is exposed to credit risk associated with its derivative contracts from non-performance by its counterparties. The Company mitigates its exposure to any single counterparty by contracting with a number of financial institutions, each of which has a high credit rating and is a member of CRP’s credit facility as referenced above.
90
CENTENNIAL RESOURCE DEVELOPMENT, INC.
NOTES TO CONSOLIDATED AND COMBINED FINANCIAL STATEMENTS (Continued)
Note 10—Fair Value Measurements
Recurring Fair Value Measurements
The Company follows FASB ASC Topic 820, Fair Value Measurement and Disclosure, which establishes a three-level valuation hierarchy for disclosure of fair value measurements. The valuation hierarchy categorizes assets and liabilities measured at fair value into one of three different levels depending on the observability of the inputs employed in the measurement. The three levels are defined as follows:
• | Level 1: Quoted Prices in Active Markets for Identical Assets – inputs to the valuation methodology are quoted prices (unadjusted) for identical assets or liabilities in active markets. |
• | Level 2: Significant Other Observable Inputs – inputs to the valuation methodology include quoted prices for similar assets and liabilities in active markets, and inputs that are observable for the asset or liability, either directly or indirectly, for substantially the full term of the financial instrument. |
• | Level 3: Significant Unobservable Inputs – inputs to the valuation methodology are unobservable and significant to the fair value measurement. |
The following table is a listing of the Company’s assets and liabilities that are measured at fair value and where they were classified within the fair value hierarchy as of December 31, 2017 and December 31, 2016 (in thousands):
(in thousands) | Level 1 | Level 2 | Level 3 | ||||||||
Commodity derivative asset (liability), net | |||||||||||
December 31, 2017 | $ | — | $ | 855 | $ | — | |||||
December 31, 2016 | $ | — | $ | (4,950 | ) | $ | — | ||||
Both financial and non-financial assets and liabilities are categorized within the above fair value hierarchy based on the lowest level of input that is significant to the fair value measurement. The Company’s assessment of the significance of a particular input to the fair value measurement in its entirety requires judgement and considers factors specific to the asset or liability. The following is a description of the valuation methodologies used by the Company as well as the general classification of such instruments pursuant to the above fair value hierarchy. There were no transfers between any of the fair value levels during any period presented.
Derivatives
The Company uses Level 2 inputs to measure the fair value of oil and natural gas commodity derivatives. The Company uses industry-standard models that consider various assumptions including current market and contractual prices for the underlying instruments, implied market volatility, time value, nonperformance risk, as well as other relevant economic measures. Substantially all of these inputs are observable in the marketplace throughout the full term of the instrument and can be supported by observable data. The Company utilizes its counterparties’ valuations to assess the reasonableness of its own valuations.
Nonrecurring Fair Value Measurements
The fair value measurements of assets acquired and liabilities assumed are measured on a nonrecurring basis on the acquisition date using an income valuation technique based on inputs that are not observable in the market and therefore represent Level 3 inputs. Significant inputs to the valuation of acquired oil and gas properties include estimates of: (i) reserves; (ii) production rates; (iii) future operating and development costs; (iv) future commodity prices, including price differentials; (v) future cash flows; and (vi) a market participant-based weighted average cost of capital rate. These inputs require significant judgments and estimates by the Company’s management at the time of the valuation. Refer to Note 2—Business Combination and Note 3—Property Acquisitions for additional information on the fair value of assets acquired during 2017 and 2016.
The initial measurement of ARO at fair value is calculated using discounted cash flow techniques and is based on internal estimates of future retirement costs associated with property, plant and equipment. Significant Level 3 inputs used in the calculation of ARO include plugging costs and reserve lives. Refer to Note 11—Asset Retirement Obligations for additional information on the Company’s ARO.
91
CENTENNIAL RESOURCE DEVELOPMENT, INC.
NOTES TO CONSOLIDATED AND COMBINED FINANCIAL STATEMENTS (Continued)
Other Financial Instruments
The carrying amounts of the Company’s cash, cash equivalents, accounts receivable, accounts payable, and accrued liabilities approximate fair value because of the short-term maturities and/or liquid nature of these assets and liabilities. The carrying values of the amounts outstanding under CRP’s credit agreement approximate fair value because its variable interest rates are tied to current market rates and the applicable credit spreads represent current market rates for the credit risk profile of the Company. As of December 31, 2017, the fair value of the Senior Notes was $407.5 million, which was determined using the quoted market price, a Level 1 classification in the fair value hierarchy.
Note 11—Asset Retirement Obligations
The following table summarizes the changes in the Company’s asset retirement obligations for the periods presented:
Successor | Predecessor | |||||||||||
Year Ended December 31, 2017 | October 11, 2016 through December 31, 2016 | January 1, 2016 through October 10, 2016 | ||||||||||
(in thousands) | ||||||||||||
Asset retirement obligations, beginning of period | 7,226 | 4,989 | 2,288 | |||||||||
Additional liabilities incurred | 2,219 | 2,189 | 240 | |||||||||
Liabilities disposed | (336 | ) | — | — | ||||||||
Liabilities settled | (65 | ) | (1 | ) | (42 | ) | ||||||
Accretion expense | 516 | 49 | 134 | |||||||||
Revision to estimated cash flows | 2,601 | — | 32 | |||||||||
Asset retirement obligations, end of period | $ | 12,161 | $ | 7,226 | $ | 2,652 | ||||||
ARO reflect the present value of the estimated future costs associated with the plugging and abandonment of oil and natural gas wells, removal of equipment and facilities from leased acreage and land restoration in accordance with applicable local, state and federal laws. Inherent in the fair value calculation of ARO are numerous assumptions and judgments including the ultimate settlement amounts, inflation factors, credit adjusted discount rates and timing of settlement. To the extent future revisions to these assumptions impact the value of the existing ARO liability, a corresponding offsetting adjustment is made to the oil and natural gas property balance.
Note 12—Transactions with Related Parties
Founder Shares
On November 6, 2015, Riverstone purchased 11,500,000 shares of Class B Common Stock (the “founder shares”) from the Company, for an aggregate purchase price of $25,000, or approximately $0.002 per share. In February 2016, Riverstone transferred 40,000 founder shares to each of the Company’s then independent directors (together with Riverstone, the “initial stockholders”) at their original purchase price. On February 24, 2016, the Company effected a stock dividend of approximately 0.125 shares for each outstanding share of Class B Common Stock, resulting in the initial stockholders holding an aggregate of 12,937,000 founder shares. On April 8, 2016, following the expiration of the underwriters’ remaining over-allotment option in connection with the Company’s IPO, Riverstone forfeited 437,500 founder shares, so that the remaining 12,500,000 founder shares held by the initial stockholders would represent 20% of the Company’s then issued and outstanding shares of common stock. On October 11, 2016, all of the outstanding founder shares were automatically converted into shares of Class A Common Stock on a one-for-one basis in connection with the closing of the Business Combination.
Private Placement Warrants
On February 29, 2016, Riverstone purchased 8,000,000 Private Placement Warrants from the Company at a price of $1.50 per whole warrant ($12.0 million in the aggregate) in a private placement that occurred simultaneously with the closing of the Company’s IPO. Each whole Private Placement Warrant is exercisable for one whole share of Class A Common Stock at a price of $11.50 per share. A portion of the purchase price of the Private Placement Warrants was placed in the Company’s trust account along with the proceeds from its IPO. The Private Placement Warrants will expire at 5:00 p.m., New York City time, on October 11, 2021, or earlier upon redemption or our liquidation. Additionally, the Private Placement Warrants are non-redeemable and exercisable on a cashless basis so long as they are held by Riverstone or its permitted transferees. If such Private Placement Warrants are not held by Riverstone or its permitted transferees, we may call the Private Placement Warrants for redemption, in whole and not in part, at a price of $0.01 per Private Placement Warrant, upon not less than 30 days’ prior written notice of such
92
CENTENNIAL RESOURCE DEVELOPMENT, INC.
NOTES TO CONSOLIDATED AND COMBINED FINANCIAL STATEMENTS (Continued)
redemption to each holder if the reported last sale price of our Class A Common Stock equals or exceeds $18.00 per share for any 20 trading days within a 30-day trading period ending three business days before we send the notice of redemption.
Amended and Restated Limited Liability Company Agreement of CRP
In connection with the closing of the Business Combination, on October 11, 2016, the Company and the Centennial Contributors entered into CRP’s fifth amended and restated limited liability company agreement (as amended to date, the “A&R LLC Agreement”) to, among other things, set forth our rights and obligations as holders of common membership interests in CRP (the “CRP Common Units”). Under the A&R LLC Agreement, the Centennial Contributors generally have the right to cause CRP to redeem all or a portion of their CRP Common Units in exchange for shares of our Class A Common Stock or, at CRP’s option, an equivalent amount of cash; provided that we may, at our option, effect a direct exchange of cash or Class A Common Stock for such CRP Common Units in lieu of such a redemption by CRP. Upon the future redemption or exchange of CRP Common Units held by a Centennial Contributor, a corresponding number of shares of Class C Common Stock held by such Centennial Contribution will be cancelled. The A&R LLC Agreement also includes provisions intended to ensure that we at all times maintain a one-to-one ratio between (a) the number of outstanding shares of Class A Common Stock and the number of CRP Common Units owned by us (subject to certain exceptions) and (b) the number of outstanding shares of our Class C Common Stock and the number of CRP Common Units owned by the Centennial Contributors. This construct is intended to result in the Centennial Contributors having a voting interest in the Company that is identical to the Centennial Contributors’ economic interest in CRP.
Exchange Right
On October 11, 2016, following the closing of the Business Combination, the Company issued 844,079 shares of its Class A Common Stock to an accredited investor at the direction of certain Centennial Contributors affiliated with such investor, in exchange for 844,079 CRP Common Units held by such Centennial Contributors. The exchange was affected in accordance with the A&R LLC Agreement. Upon the exchange of the CRP Common Units, the Company canceled 844,079 shares of its Class C Common Stock held by the Centennial Contributors.
Amended and Restated Registration Rights Agreement
In connection with the closing of the Business Combination, on October 11, 2016, the Company entered into an amended and restated registration rights agreement (the “Registration Rights Agreement”) with certain Riverstone entities, certain of its former and current directors and the Centennial Contributors, pursuant to which such parties are entitled to certain registration rights relating to the resale of certain securities held by them. In connection with the Registration Rights Agreement, the Company filed a Registration Statement on Form S-3 that was declared effective on April 17, 2017.
Subscription Agreements
In connection with the Business Combination, on July 21, 2016, the Company entered into a subscription agreement with Riverstone, pursuant to which Riverstone purchased 81,005,000 shares of Class A Common Stock at the closing of the Business Combination for an aggregate purchase price of approximately $810.0 million.
In connection with the Silverback Acquisition, on November 27, 2016, the Company entered into a subscription agreement with Riverstone, pursuant to which Riverstone agreed to purchase an aggregate of 3,473,590 shares of Class A Common Stock and 104,400 shares of Series B Preferred Stock at the closing for an aggregate purchase price of approximately $430.0 million. Pursuant to the terms thereof, the Series B Preferred Stock converted into 26,100,000 shares of Class A Common Stock on May 25, 2017.
Customer and Supplier Relationships
NGP Affiliated Companies
Beginning December 28, 2016, NGP and entities affiliated with NGP were no longer considered related parties of the Company, and any expenses incurred on or after December 28, 2016 with NGP or its affiliates are no longer classified as related party expenses. However, expenses incurred before December 28, 2016 with NGP or its affiliates were classified as related party expenses as NGP beneficially owned more than 10% of equity interest in the Company. Such transactions are detailed below.
In May 2016, the Company acquired acreage in close proximity to its operating area in Reeves County, Texas and wellbore only rights in an uncompleted horizontal wellbore for approximately $9.8 million from Caird DB, LLC, an affiliate of NGP. In addition, the Company paid approximately $3.3 million during the year ended December 31, 2016, to RockPile Energy Services, LLC (“Rockpile”). On July 3, 2017, Rockpile was acquired by an unrelated third party and is no longer an affiliate of NGP.
93
CENTENNIAL RESOURCE DEVELOPMENT, INC.
NOTES TO CONSOLIDATED AND COMBINED FINANCIAL STATEMENTS (Continued)
Riverstone Affiliated Companies
Riverstone and its affiliates beneficially own more than 10% of equity interest in the Company and are therefore considered related parties. From time to time, the Company obtains services related to its drilling and completion activities from affiliates of Riverstone. In particular, the Company has paid the following amounts to the following affiliates of Riverstone for such services: (i) approximately $72.6 million and $8.2 million during the years ended December 31, 2017 and December 31, 2016, respectively, to Liberty Oilfield Services, LLC (“Liberty”); and (ii) approximately $6.4 million and $1.4 million during the years ended December 31, 2017 and December 31, 2016, respectively, to Permian Tank and Manufacturing, Inc. (“Permian”). Included in Accounts payable and accrued expenses was $0.3 million and $0.4 million due to Permian as of December 31, 2017 and December 31, 2016, respectively, and $3.1 million due to Liberty as of December 31, 2016.
Other Affiliated Companies
Mark G. Papa, President, Chief Executive Officer and Chairman of the Board, serves as a director and Chairman of the Board of Oil States International, Inc., an energy services company publicly traded on the New York Stock Exchange (“Oil States”). From time to time, the Company obtains services related to drilling and completion activities from Oil States. In particular, the Company paid approximately $10.5 million and $1.2 million during the years ended December 31, 2017 and December 31, 2016, respectively, to Oil States. Included in Accounts payable and accrued expenses was $1.5 million and $0.2 million due to Oil States as of December 31, 2017 and December 31, 2016, respectively.
Note 13—Commitments and Contingencies
Operating Leases and Other Commitments
The following is a schedule of the Company’s future minimum lease payments with commitments that have initial or remaining non-cancelable lease terms in excess of one year as of December 31, 2017:
(in thousands) | 2018 | 2019 | 2020 | 2021 | 2022 | Thereafter | Total | |||||||||||||||||||||
Drilling rig commitments | $ | 19,714 | $ | 1,620 | $ | — | $ | — | $ | — | $ | — | $ | 21,334 | ||||||||||||||
Office leases | 2,360 | 2,322 | 2,163 | 2,073 | 274 | — | 9,192 | |||||||||||||||||||||
Water disposal agreement | 1,825 | 1,825 | 1,825 | 1,825 | — | — | 7,300 | |||||||||||||||||||||
Purchase obligations | 4,400 | 13,200 | 8,800 | — | — | — | 26,400 | |||||||||||||||||||||
Transportation and gathering | 2,044 | 2,044 | — | — | — | — | 4,088 | |||||||||||||||||||||
Total | $ | 30,343 | $ | 21,011 | $ | 12,788 | $ | 3,898 | $ | 274 | $ | — | $ | 68,314 | ||||||||||||||
Drilling Rig Contracts
As of December 31, 2017, the Company had six drilling rigs under contract and its obligations under these agreements are included in the above schedule. Early termination of these contracts would require termination penalties of $14.7 million to be paid as of December 31, 2017, which would be paid in lieu of paying the remaining drilling commitments under these contracts. The Company recognized $38.0 million, $1.0 million and $2.0 million for the year ended December 31, 2017, the periods from October 11, 2016, through December 31, 2016, and January 1, 2016, through October 10, 2016, respectively, under these long-term contracts, which are initially capitalized as a component of oil and gas properties and either depleted in future periods or written off as exploration expense.
Office Leases
The Company leases office space in Colorado, Texas, and New Mexico. The Company recognized rent expense of $1.1 million, $0.1 million, $0.4 million, and $0.4 million for the year ended December 31, 2017, the periods from October 11, 2016, through December 31, 2016, and January 1, 2016, through October 10, 2016, and for the year ended December 31, 2015, respectively.
Water Disposal Agreement
In January 2017, the Company entered into a water disposal agreement for transportation and disposal of produced water from its operated wells. Under the terms of the agreement, Centennial is obligated to provide a minimum volume of produced water or else pay for any deficiencies at the price stipulated in the contract. The obligations reported above represent the minimum financial commitments pursuant to the terms of this contract as of December 31, 2017. Actual expenditures under this contract may exceed the minimum commitments presented above. The Company recognized water disposal costs of $2.4 million for the year ended December 31, 2017 related to this contract.
94
CENTENNIAL RESOURCE DEVELOPMENT, INC.
NOTES TO CONSOLIDATED AND COMBINED FINANCIAL STATEMENTS (Continued)
Purchase Obligations
In July 2017, the Company entered into a supply agreement to purchase frac and sand product for a term of three years. Under the terms of the agreement, Centennial is obligated to purchase a minimum volume of frac and sand product at a fixed sales price. A prepayment of $13.2 million was made during 2017 and will be used as a partial credit against monthly purchases. The obligations reported above represent our minimum financial commitments pursuant to the terms of this contract as of December 31, 2017. Actual expenditures under this contract may exceed the minimum commitments presented above. The Company paid $13.2 million for the year ended December 31, 2017 under this contract for advance purchases of frac and sand product of which $1.6 million was capitalized as incurred during the year.
Transportation and Gathering Agreement
In June 2017, the Company entered into a transportation service agreement through December 31, 2019 whereby it is required to deliver 40,000 MMBtu per day or pay for any deficiencies at the price stipulated in the contract. This delivery commitment is tied to the Company’s natural gas production in Reeves and Ward counties, Texas. The obligations reported above represent the minimum financial commitments pursuant to the terms of this contract as of December 31, 2017. Actual expenditures under this contract may exceed the minimum commitments presented above. The Company recognized transportation and gathering expenses of $1.2 million for the year ended December 31, 2017 related to this contract.
In December 2015, the Company entered into a transportation and gathering services agreement by which a transporter agreed to construct a crude oil gathering and transportation system capable of transporting crude oil from certain Company wells in Pecos, Reeves and Ward Counties, Texas to destination points in Crane and Midland, Texas (the “Transportation System”), and the Company agreed to dedicate and ship on the Transportation System all crude oil owned or controlled by the Company from oil and gas leases covering approximately 62,913 gross acres located within a designated area of mutual interest in Pecos, Reeves and Ward Counties. The agreement has a primary term of 12 years from October 1, 2016, the date the Transportation System was first put into service and may be extended at the Company’s option for two successive two-year terms and, thereafter, is automatically extended for successive one-year terms unless terminated by the Company or the transporter upon 60 days’ prior notice.
Contingencies
The Company may at times be subject to various commercial or regulatory claims, litigation or other legal proceedings that arise in the ordinary course of business. While the outcome of these lawsuits and claims cannot be predicted with certainty, management believes it is remote that the impact of such matters that are reasonably possible to occur will have a material adverse effect on the Company’s financial position, results of operations or cash flows. Management is unaware of any pending litigation brought against the Company requiring the reserve of a contingent liability as of the date of these consolidated financial statements.
Note 14—Subsequent events
On January 5, 2018, the Company entered into a purchase and sale agreement to sell approximately 8,600 undeveloped net acres and 12 gross producing wells located in Reeves County, Texas for a total sale price of $140.7 million, subject to certain post-closing adjustments. The divested acreage represents a largely non-operated position (average 32% WI) on the western portion of Centennial’s position in Reeves County. The net book value of the properties being sold approximates the sales price as of December 31, 2017, which primarily consists of oil and gas properties and property, plant and equipment included in the Consolidated Balance Sheet. The transaction is expected to close on March 1, 2018.
On February 8, 2018, the Company completed the acquisition of approximately 4,000 undeveloped net acres, as well as certain producing properties, in the Northern Delaware Basin in Lea County, New Mexico for an unadjusted purchase price of $94.7 million. The operated acreage position contains an average 95% working interest and is largely contiguous to Centennial’s existing position. Pursuant to the agreements, the Company placed $8.6 million cash in escrow accounts one business day after the signing of the agreements on December 21, 2017 and such deposits were applied as part of the payment of the purchase price upon closing of the transactions. The Company presented the cash in escrow as restricted cash within the line item Other Noncurrent Assets on the Consolidated Balance Sheet as of December 31, 2017.
95
Supplemental Information About Oil & Natural Gas Producing Activities (Unaudited)
Capitalized Costs
The aggregate amounts of costs capitalized for oil and gas exploration and development activities and the related amounts of accumulated depreciation, depletion and amortization are shown below:
(in thousands) | December 31, 2017 | December 31, 2016 | |||||
Proved properties | $ | 1,602,002 | $ | 604,022 | |||
Unproved properties | 1,952,680 | 1,905,661 | |||||
Total proved and unproved properties | 3,554,682 | 2,509,683 | |||||
Accumulated depreciation, depletion and amortization | (173,906 | ) | (14,436 | ) | |||
Net capitalized costs | $ | 3,380,776 | $ | 2,495,247 | |||
Costs Incurred For Oil and Natural Gas Producing Activities
The costs incurred in the Company’s oil and gas production, exploration, and development activities are displayed in the table below and include costs whether capitalized or expensed as well as revisions and additions to the estimated future asset retirement obligations.
Successor | Predecessor | |||||||||||||||
Year Ended December 31, 2017 | October 11, 2016 through December 31, 2016 | January 1, 2016 through October 10, 2016 | Year ended December 31, 2015 | |||||||||||||
(in thousands) | ||||||||||||||||
Acquisition costs: | ||||||||||||||||
Proved properties | $ | 54,550 | $ | 561,251 | $ | 16,386 | $ | 14,268 | ||||||||
Unproved properties | 350,567 | 1,905,660 | 39,399 | 28,955 | ||||||||||||
Development costs | 585,866 | 44,602 | 53,512 | 87,452 | ||||||||||||
Exploration costs | 21,542 | 1,468 | 920 | 84 | ||||||||||||
Total | $ | 1,012,525 | $ | 2,512,981 | $ | 110,217 | $ | 130,759 | ||||||||
Results of Oil and Natural Gas Producing Activities
The results of operations for oil and natural gas producing activities (excluding corporate overhead and interest costs) are presented below:
Successor | Predecessor | |||||||||||||||
Year Ended December 31, 2017 | October 11, 2016 through December 31, 2016 | January 1, 2016 through October 10, 2016 | Year ended December 31, 2015 | |||||||||||||
(in thousands) | ||||||||||||||||
Revenues: | ||||||||||||||||
Oil, natural gas and NGL sales | $ | 429,902 | $ | 29,717 | $ | 69,116 | $ | 90,460 | ||||||||
Costs: | ||||||||||||||||
Lease operating expenses | 41,336 | 3,541 | 11,036 | 21,173 | ||||||||||||
Severance and ad valorem taxes | 23,173 | 1,636 | 3,696 | 5,021 | ||||||||||||
Gathering, processing and transportation expenses | 34,259 | 2,187 | 4,583 | 5,732 | ||||||||||||
Depreciation, depletion and amortization | 161,628 | 14,877 | 62,964 | 90,084 | ||||||||||||
Impairment and abandonment expenses | (29 | ) | — | 2,545 | 7,619 | |||||||||||
Exploration expense | 14,373 | 1,468 | 920 | 84 | ||||||||||||
Contract termination and rig stacking | — | — | — | 2,387 | ||||||||||||
Income tax (expense) benefit | 29,930 | — | (406 | ) | (572 | ) | ||||||||||
Results of operations | $ | 125,232 | $ | 6,008 | $ | (16,222 | ) | $ | (41,068 | ) | ||||||
Estimated Quantities of Proved Oil and Gas Reserves
The reserve estimates presented below were made in accordance with GAAP requirements for disclosures about oil and natural gas producing activities and SEC Regulation S-X for oil and natural gas reporting reserves estimation and disclosure. The Company retained Netherland, Sewell & Associates, Inc., an independent petroleum engineering firm, to prepare the estimates of
96
all of its proved reserves as of December 31, 2017, 2016 and 2015. The individuals performing reserves estimates possess professional qualifications and demonstrate competency in reserves estimation and evaluation. The estimates of proved reserves are inherently imprecise and are continually subject to revision based on production history, results of additional exploration and development, price changes and other factors.
Reserve estimates are based on an unweighted arithmetic average of commodity prices during the 12-month period, using the closing prices on the first day of each month, as defined by the SEC. The following prices, as adjusted for transportation, quality, and basis differentials, were used in the calculation of the standardized measure of discounted future net cash flows (“standardized measure”):
Successor | Predecessor | |||||||||||||||
Year Ended December 31, 2017 | October 11, 2016 through December 31, 2016 | January 1, 2016 through October 10, 2016 | Year ended December 31, 2015 | |||||||||||||
Oil (per Bbl) | $ | 48.43 | $ | 38.49 | $ | 36.98 | $ | 41.85 | ||||||||
Gas (per Mcf) | 2.74 | 0.98 | 1.24 | 1.71 | ||||||||||||
NGLs (per Bbl) | 25.92 | 14.59 | 13.28 | 13.94 | ||||||||||||
97
As of December 31, 2017, all of the Company’s oil and gas reserves are attributable to properties within the United States. The table below presents a summary of changes in quantities of proved oil and gas reserves in the Company’s estimated proved reserves:
Crude Oil (MBbls) | Natural Gas (MMcf) | Natural Gas Liquids (MBbls) | Total (MBoe) | ||||||||
Total proved reserves: | |||||||||||
Balance - January 1, 2015 (Predecessor) | 19,850 | 27,414 | 1,551 | 25,970 | |||||||
Extensions and discoveries | 9,444 | 11,927 | 1,432 | 12,864 | |||||||
Revisions to previous estimates | (5,109 | ) | (5,204 | ) | 995 | (4,981 | ) | ||||
Purchases of reserves in place | 844 | 1,363 | 204 | 1,275 | |||||||
Production | (1,830 | ) | (3,058 | ) | (331 | ) | (2,671 | ) | |||
Balance - December 31, 2015 (Predecessor) | 23,199 | 32,442 | 3,851 | 32,457 | |||||||
Extensions and discoveries | 5,851 | 6,410 | 773 | 7,692 | |||||||
Revisions to previous estimates | 1,025 | (1,521 | ) | (110 | ) | 662 | |||||
Purchases of reserves in place | 1,600 | 2,130 | 245 | 2,200 | |||||||
Production | (1,584 | ) | (2,660 | ) | (253 | ) | (2,280 | ) | |||
Balance - October 11, 2016 (Predecessor) | 30,091 | 36,801 | 4,506 | 40,731 | |||||||
Extensions and discoveries | 7,063 | 12,219 | 1,225 | 10,325 | |||||||
Revisions to previous estimates | 184 | 16,445 | 983 | 3,906 | |||||||
Purchases of reserves in place | 9,651 | 83,992 | 5,152 | 28,802 | |||||||
Production | (523 | ) | (1,113 | ) | (96 | ) | (805 | ) | |||
Balance - December 31, 2016 (Successor) | 46,466 | 148,344 | 11,770 | 82,959 | |||||||
Extensions and discoveries | 47,870 | 174,458 | 17,465 | 94,411 | |||||||
Revisions to previous estimates | 10,751 | 16,154 | 3,114 | 16,556 | |||||||
Purchases of reserves in place | 3,211 | 6,822 | 435 | 4,784 | |||||||
Divestitures of reserves in place | (371 | ) | (812 | ) | (120 | ) | (626 | ) | |||
Production | (6,994 | ) | (17,754 | ) | (1,678 | ) | (11,630 | ) | |||
Balance - December 31, 2017 (Successor) | 100,933 | 327,212 | 30,986 | 186,454 | |||||||
Proved developed reserves: | |||||||||||
December 31, 2014 | 8,026 | 11,959 | 766 | 10,785 | |||||||
December 31, 2015 | 9,347 | 12,711 | 1,603 | 13,068 | |||||||
October 11, 2016 | 11,346 | 14,973 | 1,927 | 15,769 | |||||||
December 31, 2016 | 14,551 | 42,190 | 3,618 | 25,200 | |||||||
December 31, 2017 | 41,786 | 126,065 | 12,133 | 74,929 | |||||||
Proved undeveloped reserves: | |||||||||||
December 31, 2014 | 11,823 | 15,455 | 785 | 15,184 | |||||||
December 31, 2015 | 13,852 | 19,731 | 2,248 | 19,389 | |||||||
October 11, 2016 | 18,745 | 21,828 | 2,579 | 24,962 | |||||||
December 31, 2016 | 31,914 | 106,154 | 8,152 | 57,759 | |||||||
December 31, 2017 | 59,147 | 201,147 | 18,853 | 111,525 | |||||||
Notable changes in proved reserves for the year ended December 31, 2017 included the following:
• | Extensions and discoveries. In 2017, total extensions and discoveries of 94.4 MMBoe were primarily attributable to increased drilling activity as a result of the Company’s six-rig drilling program effective throughout the year. These additions include 66.6 MMBoe in PUDs and 27.8 MMBoe in the conversion of unproved locations to PDP wells primarily in the Upper Wolfcamp A zone. |
• | Revisions to previous estimates. In 2017, revisions to previous estimates of 16.6 MMBoe are composed of positive revisions of 26.4 MMBoe primarily relating to adjustments to PUD well locations scheduled to be drilled at longer lateral lengths as |
98
well as additional positive performance revisions attributable to more wells drilled with longer lateral lengths in 2017. These positive revisions were partially offset by 9.8 MMBoe of negative revisions associated with PUD reclassification to unproven reserves as they are no longer expected to be developed within the five years of their initial recording in accordance with SEC rules.
• | Purchases of reserves in place. In 2017, purchases of reserves of 4.8 MMBoe was primarily attributable to the GMT Acquisition in June. Refer to Note 3—Property Acquisitions for further details. |
Notable changes in proved reserves for the period from October 11, 2016 to December 31, 2016 included the following:
• | Extensions and discoveries. During the period, total extensions and discoveries were primarily attributable to 10.3 MMBoe proved reserves added as a result of drilling activity. |
• | Revisions to previous estimates. During the period, revisions to previous estimates were primarily attributable to 3.9 MMBoe due to improved results in completion techniques and adjustments of natural gas and NGL treatment through the gas plants. |
• | Purchases of reserves in place. During the period, purchases of proved reserves primarily attributable to the acquisition of 28.8 MMBoe as a result of Silverback Acquisition in December 2016. Refer to Note 3—Property Acquisitions for further details. |
Notable changes in proved reserves for the period from January 1, 2016 to October 10, 2016 included the following:
• | Extensions and discoveries. During the period, total extensions and discoveries were primarily attributable to 7.7 MMBoe proved reserves added as a result of drilling activity. |
• | Revisions to previous estimates. During the period, revisions to previous estimates were primarily attributable to 0.7 MMBoe due to positive performance revisions. |
• | Purchases of reserves in place. During the period, purchases of reserves primarily attributable 2.2 MMBoe of proved reserves in the Reeves County, Texas. Refer to Note 3—Property Acquisitions for further details. |
Notable changes in proved reserves for the year ended December 31, 2015 included the following:
• | Extensions and discoveries. During the period, total extensions and discoveries were primarily attributable to 12.9 MMBoe proved reserves added as a result of drilling activity. |
• | Revisions to previous estimates. In 2015, revisions to previous estimates were primarily attributable to negative revisions of 5.0 MMBoe. The significant decrease in commodity prices seen in 2015 resulted in negative revisions related to the conversion of approximately 6.8 MMBoe from PUDs to unproved reserves, partially offset by a positive revision in performance. |
• | Purchases of reserves in place. In 2015, purchases of reserves primarily attributable 1.3 MMBoe of proved reserves in the Delaware Basin in September 2015. |
99
Standardized Measure of Discounted Future Net Cash Flows
As required by FASB ASC Topic 932, Extractive Activities - Oil and Gas, the standardized measure of discounted future net cash flows is computed by applying first-day-of-the-month average prices, year-end costs and legislated tax rates and a discount factor of 10 percent to net proved reserves. The standardized measure includes costs for future dismantlement, abandonment and rehabilitation obligations. Future income tax expenses are calculated by applying appropriate year-end tax rates to future pretax net cash flows relating to proved oil and natural gas reserves, less the tax basis of properties involved. Future income tax expenses give effect to permanent differences, tax credits and loss carryforwards relating to the proved oil and natural gas reserves. This calculation does not necessarily result in an estimate of the fair value of the Company’s oil and gas properties.
The following table presents the Company’s standardized measure of discounted future net cash flows:
Successor | Predecessor | |||||||||||||||
Year Ended December 31, 2017 | October 11, 2016 through December 31, 2016 | January 1, 2016 through October 10, 2016 | Year ended December 31, 2015 | |||||||||||||
(in thousands) | ||||||||||||||||
Future cash inflows | $ | 6,586,516 | $ | 2,105,585 | $ | 1,217,641 | $ | 1,079,962 | ||||||||
Future development costs | (880,767 | ) | (482,162 | ) | (297,559 | ) | (277,837 | ) | ||||||||
Future production costs | (2,233,266 | ) | (640,306 | ) | (413,410 | ) | (450,058 | ) | ||||||||
Future income tax expenses | (542,587 | ) | (136,587 | ) | (5,614 | ) | (6,643 | ) | ||||||||
Future net cash flows | 2,929,896 | 846,530 | 501,058 | 345,424 | ||||||||||||
10% discount to reflect timing of cash flows | (1,426,570 | ) | (471,438 | ) | (291,345 | ) | (210,355 | ) | ||||||||
Standardized measure of discounted future net cash flows | $ | 1,503,326 | $ | 375,092 | $ | 209,713 | $ | 135,069 | ||||||||
The following summarizes the principal sources of change in the standardized measure of discounted future net cash flows:
Successor | Predecessor | |||||||||||||||
(in thousands) | Year Ended December 31, 2017 | October 11, 2016 through December 31, 2016 | January 1, 2016 through October 10, 2016 | Year ended December 31, 2015 | ||||||||||||
Standardized measure of discounted future net cash flows, beginning of period | $ | 375,092 | $ | 209,713 | $ | 135,069 | $ | 365,883 | ||||||||
Sales of oil, natural gas and NGLs, net of production costs | (331,134 | ) | (22,354 | ) | (49,801 | ) | (58,534 | ) | ||||||||
Purchase of minerals in place | 56,658 | 127,842 | 10,145 | 14,416 | ||||||||||||
Divestiture of minerals in place | (4,607 | ) | — | — | — | |||||||||||
Extensions and discoveries, net of future development costs | 842,756 | 55,825 | 46,438 | 57,894 | ||||||||||||
Previously estimated development costs incurred during the period | 139,246 | 10,891 | 11,743 | 16,100 | ||||||||||||
Net change in prices and production costs | 281,026 | (978 | ) | 6,661 | (494,734 | ) | ||||||||||
Change in estimated future development costs | (60,301 | ) | 571 | 28,998 | 247,642 | |||||||||||
Revisions of previous quantity estimates | 253,399 | 20,190 | 3,673 | (51,342 | ) | |||||||||||
Accretion of discount | 42,753 | 4,753 | 11,319 | 37,517 | ||||||||||||
Net change in income taxes | (156,574 | ) | (47,990 | ) | (1,568 | ) | 1,601 | |||||||||
Net change in timing of production and other | 65,012 | 16,629 | 7,036 | (1,374 | ) | |||||||||||
Standardized measure of discounted future net cash flows, end of period | $ | 1,503,326 | $ | 375,092 | $ | 209,713 | $ | 135,069 | ||||||||
100
Selected Quarterly Financial Data (Unaudited)
Successor | |||||||||||||||
Quarters Ended | |||||||||||||||
(in thousands) | March 31 | June 30 | September 30 | December 31 | |||||||||||
2017 | |||||||||||||||
Net revenues | $ | 61,097 | $ | 91,064 | $ | 111,611 | $ | 166,130 | |||||||
Operating expenses | 53,905 | 67,810 | 85,066 | 117,841 | |||||||||||
Total operating income (loss) | 7,192 | 23,254 | 26,545 | 48,289 | |||||||||||
Other income (expense) | 3,515 | 9,013 | (2,052 | ) | (2,271 | ) | |||||||||
Income tax (expense) benefit | — | (9,069 | ) | (8,233 | ) | (12,628 | ) | ||||||||
Net income (loss) attributable to common shareholders | 9,823 | 20,762 | 14,447 | 30,536 | |||||||||||
Income (loss) per share: | |||||||||||||||
Basic | $ | 0.04 | $ | 0.09 | $ | 0.06 | $ | 0.12 | |||||||
Diluted | $ | 0.04 | $ | 0.09 | $ | 0.06 | $ | 0.12 | |||||||
Predecessor | Successor | |||||||||||||||||||
Periods Ended | Period Ended | |||||||||||||||||||
(in thousands) | March 31 | June 30 | September 30 | October 1, 2016 through October 10, 2016 | October 11, 2016 through December 31, 2016 | |||||||||||||||
2016 | ||||||||||||||||||||
Net revenues | $ | 15,121 | $ | 23,347 | $ | 27,321 | $ | 3,327 | $ | 29,717 | ||||||||||
Operating expenses | 29,855 | 30,251 | 32,228 | 183,465 | 36,800 | |||||||||||||||
Total operating income (loss) | (14,734 | ) | (6,904 | ) | (4,907 | ) | (180,138 | ) | (7,083 | ) | ||||||||||
Other income (expense) | 273 | (9,635 | ) | (227 | ) | (2,858 | ) | (1,902 | ) | |||||||||||
Income tax (expense) benefit | — | 406 | — | — | — | |||||||||||||||
Net income (loss) | (14,461 | ) | (16,133 | ) | (5,134 | ) | (182,996 | ) | (8,081 | ) | ||||||||||
Income (loss) per share: | ||||||||||||||||||||
Basic | $ | (0.05 | ) | |||||||||||||||||
Diluted | $ | (0.05 | ) | |||||||||||||||||
101
ITEM 9. CHANGES IN AND DISAGREEMENTS WITH ACCOUNTANTS ON ACCOUNTING AND FINANCIAL DISCLOSURE
None.
ITEM 9A. CONTROLS AND PROCEDURES
Evaluation of Disclosure Control and Procedures
In accordance with Exchange Act Rules 13a-15 and 15d-15, the Company has evaluated, under the supervision and with the participation of management, including the principal executive officer and principal financial officer, the effectiveness of the design and operation of disclosure controls and procedures (as defined in Rules 13a-15(e) and 15d-15(e) under the Exchange Act) as of December 31, 2017. Our disclosure controls and procedures are designed to provide reasonable assurance that the information required to be disclosed in reports that the Company files under the Exchange Act is accumulated and communicated to management, including the principal executive officer and principal financial officer, as appropriate, to allow timely decisions regarding required disclosure and is recorded, processed, summarized and reported within the time periods specified in the rules and forms of the SEC. Based upon that evaluation, the principal executive officer and principal financial officer concluded that the Company’s disclosure controls and procedures were effective as of December 31, 2017 at the reasonable assurance level.
Management’s Annual Report on Internal Control Over Financial Reporting
Management, including the principal executive officer and principal financial officer, is responsible for establishing and maintaining adequate internal control over financial reporting as defined in Rule 13a-15(f) under the Exchange Act. The Company’s internal control over financial reporting is designed to provide reasonable assurance regarding the reliability of financial reporting and the preparation of the consolidated financial statements for external purposes in accordance with GAAP.
Because of its inherent limitations, internal control over financial reporting may not prevent or detect misstatements. Also, projections of any evaluation of effectiveness to future periods are subject to the risk that controls may become inadequate because of changes in conditions, or that the degree of compliance with the policies or procedures may deteriorate.
Management assessed the effectiveness of the Company’s internal control over financial reporting as of December 31, 2017, using the criteria in Internal Control-Integrated Framework (2013) issued by the Committee of Sponsoring Organizations of the Treadway Commission (COSO). Based on this evaluation, management believes that the Company’s internal control over financial reporting was effective as of December 31, 2017.
This Annual Report on Form 10-K includes an attestation report of KPMG LLP, the Company’s independent registered public accounting firm, on the Company’s internal control over financial reporting as of December 31, 2017, which is included in this Annual Report on Form 10-K.
Changes in Internal Control over Financial Reporting
There were no changes in the system of internal control over financial reporting (as defined in Rule 13a-15(f) and Rule 15d-15(f) under the Exchange Act) during the quarter ended December 31, 2017 that have materially affected, or are reasonably likely to materially affect, the Company’s internal control over financial reporting.
ITEM 9B. OTHER INFORMATION
None.
102
PART III
ITEM 10. DIRECTORS, EXECUTIVE OFFICERS AND CORPORATE GOVERNANCE
The information required in response to this item will be set forth in our definitive proxy statement for the 2018 annual meeting of stockholders and is incorporated herein by reference.
ITEM 11. EXECUTIVE COMPENSATION
The information required in response to this item will be set forth in our definitive proxy statement for the 2018 annual meeting of stockholders and is incorporated herein by reference.
ITEM 12. SECURITY OWNERSHIP OF CERTAIN BENEFICIAL OWNERS AND MANAGEMENT AND RELATED STOCKHOLDER MATTERS
The information required in response to this item will be set forth in our definitive proxy statement for the 2018 annual meeting of stockholders and is incorporated herein by reference.
103
ITEM 13. CERTAIN RELATIONSHIPS AND RELATED TRANSACTIONS, AND DIRECTOR INDEPENDENCE
The information required in response to this item will be set forth in our definitive proxy statement for the 2018 annual meeting of stockholders and is incorporated herein by reference.
ITEM 14. PRINCIPAL ACCOUNTING FEES AND SERVICES
The information required in response to this item will be set forth in our definitive proxy statement for the 2018 annual meeting of stockholders and is incorporated herein by reference.
104
PART IV
ITEM 15. EXHIBITS AND FINANCIAL STATEMENTS SCHEDULES
Page | ||
(a)(1) | The following financial statements are included in Part II, Item 8 of this Annual Report on Form 10-K: | |
(2) | Financial statement schedules—None | |
(3) | Exhibits: | |
Exhibit Number | Description of Exhibits | ||
2.1 | |||
2.2 | |||
2.3 | |||
3.1 | |||
3.2 | |||
3.3 | |||
3.4 | |||
3.5 | |||
4.1 | |||
4.2 | |||
4.3 | |||
4.4 | |||
4.5 | |||
10.1 | |||
105
10.2 | |||
10.3 | |||
10.4 | |||
10.5 | |||
10.6 | |||
10.7 | |||
10.8 | |||
10.9 | |||
10.10 | |||
10.11 | |||
10.12# | |||
10.13# | |||
10.14# | |||
10.15# | |||
10.16*# | |||
21.1 | |||
23.1* | |||
23.2* | |||
31.1* | |||
31.2* | |||
32.1* | |||
32.2* | |||
106
99.1 | |||
99.2 | |||
99.3* | |||
101.INS* | XBRL Instance Document. | ||
101.SCH* | XBRL Taxonomy Extension Schema Document. | ||
101.CAL* | XBRL Taxonomy Extension Calculation Linkbase Document. | ||
101.DEF* | XBRL Taxonomy Extension Definition Linkbase Document. | ||
101.LAB* | XBRL Taxonomy Extension Label Linkbase Document. | ||
101.PRE* | XBRL Taxonomy Extension Presentation Linkbase Document. | ||
* Filed herewith.
# Management contract or compensatory plan or agreement.
ITEM 16. FORM 10-K SUMMARY
None.
107
SIGNATURES
Pursuant to the requirements of the Securities Exchange Act of 1934, the registrant has duly caused this report to be signed on its behalf by the undersigned thereto duly authorized.
CENTENNIAL RESOURCE DEVELOPMENT, INC. | ||
By: | /s/ GEORGE S. GLYPHIS | |
George S. Glyphis Chief Financial Officer, Treasurer and Assistant Secretary | ||
Pursuant to the requirements of the Securities Act of 1934, this registration statement has been signed by the following persons in the capacities and on the dates indicated.
Signature | Title | Date | ||
/s/ MARK G. PAPA | ||||
Mark G. Papa | Chairman, President and Chief Executive Officer (Principal Executive Officer) | February 26, 2018 | ||
/s/ GEORGE S. GLYPHIS | ||||
George S. Glyphis | Chief Financial Officer, Treasurer and Assistant Secretary (Principal Financial Officer) | February 26, 2018 | ||
/s/ BRENT P. JENSEN | ||||
Brent P. Jensen | Vice President and Chief Accounting Officer (Principal Accounting Officer) | February 26, 2018 | ||
/s/ MAIRE A. BALDWIN | ||||
Maire A. Baldwin | Director | February 26, 2018 | ||
/s/ KARL E. BANDTEL | ||||
Karl E. Bandtel | Director | February 26, 2018 | ||
/s/ MATTHEW G. HYDE | ||||
Matthew G. Hyde | Director | February 26, 2018 | ||
/s/ PIERRE F. LAPEYRE, JR. | ||||
Pierre F. Lapeyre, Jr. | Director | February 26, 2018 | ||
/s/ DAVID M. LEUSCHEN | ||||
David M. Leuschen | Director | February 26, 2018 | ||
/s/ JEFFREY H. TEPPER | ||||
Jeffrey H. Tepper | Director | February 26, 2018 | ||
/s/ ROBERT M. TICHIO | ||||
Robert M. Tichio | Director | February 26, 2018 | ||
/s/ TONY R. WEBER | ||||
Tony R. Weber | Director | February 26, 2018 | ||
108