Attached files
| file | filename |
|---|---|
| EX-23.1 - EXHIBIT 23.1 - Xperi Corp | xper-20171231xexhibit231.htm |
| EX-32.1 - EXHIBIT 32.1 - Xperi Corp | xper-20171231xexhibit321.htm |
| EX-31.2 - EXHIBIT 31.2 - Xperi Corp | xper-20171231xexhibit312.htm |
| EX-31.1 - EXHIBIT 31.1 - Xperi Corp | xper-20171231xexhibit311.htm |
| EX-21.1 - EXHIBIT 21.1 - Xperi Corp | xper-20171231xexhibit211.htm |
| EX-10.31+ - EXHIBIT 10.31+ - Xperi Corp | xper-20171231xexhibit1031.htm |
| EX-10.30+ - EXHIBIT 10.30+ - Xperi Corp | xper-20171231xexhibit1030.htm |
UNITED STATES
SECURITIES AND EXCHANGE COMMISSION
Washington, DC 20549
_______________________________________________________________
FORM 10-K
______________________________________________________________
(Mark One)
x ANNUAL REPORT PURSUANT TO SECTION 13 OR 15(d) OF THE SECURITIES EXCHANGE ACT OF 1934
For the fiscal year ended December 31, 2017
OR
o TRANSITION REPORT PURSUANT TO SECTION 13 OR 15(d) OF THE SECURITIES EXCHANGE ACT OF 1934
Commission File Number: 001-37956
_______________________________________________________________
XPERI CORPORATION
(Exact Name of Registrant as Specified in Its Charter)
_______________________________________________________________
Delaware | 81- 4465732 | |
(State or Other Jurisdiction of Incorporation or Organization) | (I.R.S. Employer Identification No.) | |
3025 Orchard Parkway, San Jose, California | 95134 | |
(Address of Principal Executive Offices) | (Zip Code) | |
(Registrant’s Telephone Number, Including Area Code)
_______________________________________________________________
Securities registered pursuant to Section 12(b) of the Act:
Title of each class | Name of each exchange on which registered | |
Common stock, par value $0.001 per share | The NASDAQ Global Select Market | |
Securities registered pursuant to Section 12(g) of the Act: None
Indicate by check mark if the registrant is a well-known seasoned issuer, as defined in Rule 405 of the Securities Act. Yes ý No ¨
Indicate by check mark if the registrant is not required to file reports pursuant to Section 13 or Section 15(d) of the Securities Exchange Act. Yes ¨ No ý
Indicate by check mark whether the registrant (1) has filed all reports required to be filed by Section 13 or 15(d) of the Securities Exchange Act of 1934 during the preceding 12 months (or for such shorter period that the registrant was required to file such reports), and (2) has been subject to such filing requirements for the past 90 days. Yes ý No ¨
Indicate by check mark whether the registrant has submitted electronically and posted on its corporate Web site, if any, every Interactive Data File required to be submitted and posted pursuant to Rule 405 of Regulation S-T during the preceding 12 months (or for such shorter period that the registrant was required to submit and post such files). Yes ý No ¨
Indicate by check mark if disclosure of delinquent filers pursuant to Item 405 of Regulation S-K is not contained herein, and will not be contained, to the best of registrant’s knowledge, in definitive proxy or information statements incorporated by reference in Part III of this Form 10-K or any amendment to this Form 10-K. ¨
Indicate by check mark whether the registrant is a large accelerated filer, an accelerated filer, a non-accelerated filer, a smaller reporting company, or an emerging growth company. See the definitions of “large accelerated filer,” “accelerated filer,” “smaller reporting company” and “emerging growth company” in Rule 12b-2 of the Exchange Act (Check one):
Large accelerated filer ý Accelerated filer ¨ Non-accelerated filer ¨ (Do not check if a smaller reporting company) Smaller reporting company ¨ Emerging growth company ¨
If an emerging growth company, indicate by check mark if the Registrant has elected not to use the extended transition period for complying with any new or revised financial accounting standards provided pursuant to Section 13(a) of the Exchange Act. ¨
Indicate by check mark whether the registrant is a shell company (as defined in Rule 12b-2 of the Securities Exchange Act). Yes ¨ No ý
The aggregate market value of the registrant’s common stock held by non-affiliates of the registrant as of June 30, 2017 was $1,440,065,213 (based on the closing sale price of the registrant’s common stock as reported on The NASDAQ Global Select Market).
The number of shares outstanding of the registrant’s common stock as of February 2, 2018 was 49,292,756.
DOCUMENTS INCORPORATED BY REFERENCE:
Portions of the registrant’s Proxy Statement for the registrant’s 2018 Annual Meeting of Stockholders will be filed with the Commission within 120 days after the close of the registrant’s 2017 fiscal year and are incorporated by reference in Part III.
XPERI CORPORATION
ANNUAL REPORT ON FORM 10-K
FOR THE YEAR ENDED DECEMBER 31, 2017
TABLE OF CONTENTS
Page | ||
2
Cautionary Statement Regarding Forward-Looking Statements
This Annual Report contains forward-looking statements, which are subject to the safe harbor provisions created by the Private Securities Litigation Reform Act of 1995. Words such as “expects,” “anticipates,” “plans,” “believes,” “seeks,” “estimates,” “could,” “would,” “may,” “intends,” “targets” and similar expressions or variations of such words are intended to identify forward-looking statements, but are not the exclusive means of identifying forward-looking statements in this Annual Report. The identification of certain statements as “forward-looking” is not intended to mean that other statements not specifically identified are not forward-looking. All statements other than statements about historical facts are statements that could be deemed forward-looking statements, including, but not limited to, statements that relate to our future revenue, product development, demand, acceptance and market share, growth rate, competitiveness, gross margins, levels of research, development and other related costs, expenditures, the outcome or effects of and expenses related to litigation and administrative proceedings related to our patents, our intent to enforce our intellectual property, our ability to license our intellectual property, tax expenses, cash flows, our ability to liquidate and recover the carrying value of our investments, our management's plans and objectives for our current and future operations, our plans for quarterly dividends and stock repurchases, the levels of customer spending or research and development activities, general economic conditions, and the sufficiency of financial resources to support future operations and capital expenditures.
Although forward-looking statements in this Annual Report reflect the good faith judgment of our management, such statements can only be based on facts and factors currently known by us. Consequently, forward-looking statements are inherently subject to risks, uncertainties, and changes in condition, significance, value and effect, including those discussed below under the heading “Risk Factors” within Part I, Item 1A of this Annual Report and other documents we file from time to time with the Securities and Exchange Commission (the “SEC”), such as our annual reports on Form 10-K, our quarterly reports on Form 10-Q and our current reports on Form 8-K. Such risks, uncertainties and changes in condition, significance, value and effect could cause our actual results to differ materially from those expressed herein and in ways not readily foreseeable. Readers are urged not to place undue reliance on these forward-looking statements, which speak only as of the date of this Annual Report and are based on information currently and reasonably known to us. We undertake no obligation to revise or update any forward-looking statements in order to reflect any event or circumstance that may arise after the date of this Annual Report. Readers are urged to carefully review and consider the various disclosures made in this Annual Report, which attempt to advise interested parties of the risks and factors that may affect our business, financial condition, results of operations and prospects.
PART I
Item 1. Business
Corporate Information
Our principal executive offices are located at 3025 Orchard Parkway, San Jose, California 95134 USA. Our telephone number is +1 (408) 321-6000. We maintain a corporate website at www.xperi.com. The reference to our website address does not constitute incorporation by reference of the information contained on this website. Xperi, the Xperi logo, Tessera, the Tessera logo, DTS, the DTS logo, FotoNation, the FotoNation logo, Invensas, the Invensas logo, DigitalAperture, FacePower, FotoSavvy, FotoMagic, BVA, ZiBond, DBI, DTS‑HD, DTS Sound, DTS Studio Sound, DTS Headphone:X, DTS Play‑Fi, DTS:X and HD Radio are trademarks or registered trademarks of Xperi Corporation or its affiliated companies in the U.S. and other countries. All other company, brand and product names may be trademarks or registered trademarks of their respective companies.
In this Annual Report, the “Company,” “we,” “us” and “our” refer to Xperi Corporation ("Xperi"), which operates its business through its subsidiaries. Unless specified otherwise, the financial results in this Annual Report are those of the Company and its subsidiaries on a consolidated basis.
Overview
Xperi is a publicly-traded technology company with headquarters in Silicon Valley and operations around the world. Through its operating subsidiaries, Xperi creates, develops and licenses innovative audio, imaging, semiconductor packaging and interconnect technologies. We have approximately 700 employees and over 25 years of operating experience.
3
We completed the acquisition of DTS, Inc. ("DTS"), a publicly-traded developer of sound-based technologies, in December 2016. At the time of the acquisition, Tessera Technologies, Inc. and DTS were combined under the newly-formed Tessera Holding Corporation. During the first quarter of 2017, we introduced our new corporate name, Xperi Corporation, launched a new corporate logo, and began trading under a new ticker symbol XPER.
Our combined portfolio of products and technologies uniquely positions us to deliver innovative audio and imaging products
and next-generation 3D semiconductor interconnect solutions for the home, automotive and mobile markets. Our products and technologies also enable new products in emerging markets such as Internet of Things (IoT) and Augmented Reality / Virtual Reality (AR/VR). Our team of more than 400 world-class engineers is focused on creating core technologies that power intelligent, immersive, and personalized experiences.
We license our innovative products, technologies and inventions to global electronics companies which, in turn, integrate the technologies into their own consumer electronics and semiconductor products. Our technologies and inventions are widely adopted and used every day by millions of people. Our audio technologies have shipped in billions of devices for the home, mobile and automotive markets. Our imaging technologies are embedded in more than 25% of current smartphones. Our semiconductor packaging and interconnect technologies have been licensed to more than 100 customers and have shipped in over 100 billion semiconductor chips.
As a result of the DTS acquisition, we began reporting our business in two operating segments. The Product Licensing segment is comprised of our Audio and Imaging businesses, which we license through the brands DTS, HD Radio and FotoNation. These licenses typically include the delivery of software and/or hardware-based solutions to our customers or to their suppliers. Product Licensing revenue is derived primarily from sales into the home, automotive and mobile markets.
The Semiconductor and IP Licensing segment includes our Tessera and Invensas subsidiaries, which license semiconductor packaging and interconnect technologies and associated intellectual property. Semiconductor and IP Licensing revenue is derived from technology and IP licenses to semiconductor companies, foundries and packaging companies. We have a long history of developing and monetizing next-generation technologies, including chip-scale packaging solutions and low-temperature wafer bonding solutions. Today, we are actively developing 3D semiconductor packaging, interconnect and bonding solutions for semiconductors that are used in products such as smartphones, as well as computers and servers used in datacenters. We also provide engineering services to our customers to assist them in their evaluation and adoption of our technologies.
Product Licensing Segment
Overview of Solutions
The Product Licensing segment is comprised of solutions from our audio, HD Radio and imaging businesses.
Audio Solutions: Our audio business is a premier audio technology solutions provider for high definition entertainment experiences. Our audio solutions are designed to enable recording, delivery and playback of immersive high definition audio and are incorporated by hundreds of licensee customers around the world into an array of consumer electronics devices for use anywhere, at home, in the car, or on the go. We provide products and services to motion picture studios, radio and TV broadcasters, game developers and other content creators to facilitate the inclusion of compelling, realistic DTS encoded audio within their content. This in turn allows consumers to experience immersive and compelling audio encoded in DTS at theaters, in the home and on-the-go. Devices that incorporate our audio codec technology include televisions (TVs), personal computers (PCs), smartphones, tablets, automotive entertainment systems, set top boxes (STBs), video game consoles, Blu-ray Disc players, audio/video receivers (AVRs), soundbars, wireless speakers and home theater systems. We also have post-processing audio solutions designed to enhance the entertainment experience for users of consumer electronics devices, particularly those subject to the physical limitations of smaller speakers, such as TVs, PCs and mobile devices. In addition, our PlayFi technology enables consumers to experience whole-home audio through wireless speakers.
Digital Radio Solutions: HD Radio is the only digital terrestrial broadcast system approved by the Federal Communications Commission (FCC) for AM/FM radio in the U.S., offering additional channels, crystal-clear sound and advanced data services with no subscription fees. HD Radio enables a high quality in-vehicle radio experience with innovative features and digital capabilities.
Imaging Solutions: FotoNation, a pioneer in computer vision and computational imaging solutions, provides many of the critical technologies that enable millions of consumers to take incredible pictures with their smartphones. These technologies
4
underpin many of the features today’s digital users take for granted such as advanced portrait modes, face detection and tracking, and automatic effects such as face beautification. Our imaging solutions have thus become a critical technology for mobile device manufacturers and are key to enabling our driver monitoring and driver assist solutions in the car.
Innovative Technology
Within our audio product line we have a complete range of end‑to‑end solutions from content creation / mastering, through distribution and playback. We continue to expand our offerings through ongoing research and development, and strategic partnerships with content creators, chip makers, consumer electronics manufacturers, and others within the digital media ecosystem. Our innovative solution offerings are tailored specifically for each market.
Some of the audio technologies we license include:
• | DTS‑HD® Master Audio is our advanced surround sound decoder that utilizes variable bit‑rate technology to deliver ultimate audio quality while conserving file size and bandwidth, allowing for an uncompromised audio experience. |
• | HD RadioTM technology enables AM/FM radio to move from analog to digital, creating significant benefits to all participants in the radio broadcasting ecosystem. In particular, radio listeners enjoy upgraded audio quality, expanded content choices and new digital services. |
• | DTS Studio Sound™ is our premium audio processing offering that includes our latest sound processing features. Our customers can use this suite to create the ultimate in sound quality. |
• | DTS Headphone:X® includes our integrated surround headphone technology and DTS‑HD surround sound decoder, coupled with user‑driven, headphone specific tuning and personalization features for an enhanced listening experience over headphones and earbuds. |
• | DTS Play‑Fi® is a whole home wireless audio platform that allows the synchronized streaming of music directly from a mobile device or PC over a standard Wi‑Fi network to speakers anywhere the Wi-Fi network reaches. Play‑Fi is currently available on wireless speakers from many of the industry's leading brands and for mobile devices that use the Android, Kindle Fire or iOS operating systems, as well as the Windows PC platform. |
• | DTS:X™ is our state of the art object‑based audio format designed for bringing enhanced immersion and realism through more accurate spatial rendering, height audio elements, and customizations that adapt to any room speaker layout. |
The proliferation of connected devices that can support streaming and downloadable content has made our active participation within the digital ecosystem increasingly important, as the availability of DTS-encoded content helps drive consumer demand for electronics that support DTS technologies.
Our immersive audio solutions such as DTS HD and DTS:X empower content creators and are supported by all the major Hollywood studios, many cinema operators in the U.S. and Asia, and leading streaming service providers in the U.S., Europe and Asia. On the radio front, our HD Radio broadcast technology provides compelling advantages to consumers over traditional radio and is accordingly supported by more than 2,300 radio stations, including 98 of the top 100 stations in the top 10 U.S. radio markets.
Our imaging business licenses software solutions and technologies for mobile imaging and other markets. Some of the solutions we license include:
• | FacePower® empowers the camera to deliver perfect portraits, recognize its user subjects, and understand a scene by detecting and tracking faces, analyzing the face for smile, blink, age segmentation and other types of classifications based on face feature modeling for landmarks analysis. FacePower® also includes accurate eye tracking and gaze detection and tracking. Recent updates to FacePower include support for both person and object detection and tracking using convolutional neural networks and other advanced detection technologies. |
• | FotoSavvy® embeds the most sophisticated professional photography techniques in a simple “click and wow!” user interface to enable intelligent, automatic photography and videos. FotoSavvy® technologies include smart color, smart light and smart beautification to enable the best selfie experience. Also included within FotoSavvy® is FotoMagic™, a collection of technologies such as High-Dynamic Range (HDR), local tone mapping, and automatic red-eye correction. |
• | DigitalAperture™ enables capabilities similar to a digital single-lens reflex (D-SLR) camera experience in a mobile camera form factor, and addresses problems such as low light, limited aperture optics and slow speed auto-focus. The solution offers features such as electronic image and video stabilization, extended depth of field, depth sensing and zoom using single, dual or multi camera approaches. |
5
• | BioMetrics - we offer best-in-class biometric-grade face recognition and iris-based authentication solutions in a small mobile camera form factor. Our robust solution works in unconstrained environments both indoors and outdoors, to enable secure and seamless mobile transactions, personalization and secure area access. The solution also supports strong liveliness detection for anti-spoofing, and significant speed advantages when compared to competing products. |
• | AutoSuite is a product that builds on our face detection, tracking and recognition technologies to enable solutions for Driver Monitoring Systems (DMS) and Advanced Driver Assistance Systems (ADAS). These solutions are enabled by cameras placed inside vehicle cabins. Within AutoSuite, we have also enabled both face recognition and Iris Authentication for protection, personalization and enhanced user experience in automobiles. |
• | IPU (Image Processing Unit) is our unique collection of IP Cores that enable ultra-low power, low memory size and low bandwidth consumption when using FotoNation and third party imaging solutions. IPU is multi-use, feature rich and programmable. These cores are ideal for enabling intelligence on the edge where power, form factor, privacy and security are key factors. |
Product Delivery
Traditionally, our audio technology has resided on an integrated circuit (IC) chip. We license a defined and limited set of rights to incorporate our technology into these IC chips, and the IC manufacturers sell these DTS‑enabled chips to our consumer electronics products manufacturer licensees.
Over the past several years, we have been working closely with the world’s leading IC manufacturers to enable support for our audio technologies on the new programmable architectures that fuel innovation and flexibility in today’s consumer electronics products. Our partners specialize in key vertical markets and work closely with us to enable our latest technologies for these programmable parts. Together we offer these solutions to DTS licensees. Recently, DTS has gone a step further to develop both decoder and audio processing solutions for ARM‑based processors, allowing our partners to quickly integrate DTS technology into their ARM‑based processors targeted at popular, high‑level operating systems such as Android and iOS, potentially saving our customers months of porting effort and providing faster time‑to‑market solutions.
We have devoted significant time and resources to develop a broad range of solutions with key partners in certain markets, including Amlogic, Analog Devices, Cadence, Intel, Marvell, Mediatek, Mstar, NXP, Qualcomm, Realtek, Sigma Designs, Texas Instruments, and others.
In our automotive business, we engage directly with leading global auto manufacturers as well as their Tier-1 suppliers to get our radio products designed and delivered into the car. We also work with radio broadcasters to support the adoption and implementation of our HD radio technology.
Our imaging business combines proprietary hardware design with software development to offer advantages in both processing speed and lower power, providing distinctive features to smartphones, drones, activity cameras and other battery-powered devices. We license our hardware designs to customers who, in turn, typically embed the hardware as modules within a larger chip. Our software typically runs on a microprocessor with capabilities that are augmented by our hardware within a customer’s system.
Customers
We have licensed our audio technologies and trademarks to substantially all of the major consumer electronics product manufacturers worldwide. These customers include Fujitsu Ten, Harman, Huawei, LG, Microsoft, Panasonic, Samsung and Sony, among others. Our HD Radio technology is incorporated into a number of our automotive partners’ products, including vehicles from Acura, Audi, BMW, Ford, GM, Honda, Hyundai, Tesla, and Toyota, among many others.
Our imaging technologies and products have been licensed to mobile phone and digital camera manufacturers worldwide. Some of these are Huawei, LG, Nikon, Oppo, Socionext, and ZTE.
Research & Development
As demonstrated by our portfolio of industry‑recognized, advanced and widely-deployed technologies, we have a long track record of innovating in the fields of audio and imaging. Our audio business was founded more than 20 years ago on the basis of developing a unique audio solution for cinemas. Today, through a collection of world-class talent and strong research and development capabilities, we continue to focus on providing unique, cost effective and differentiated audio solutions for an ever larger universe of addressable markets.
6
Our imaging business was founded over 20 years ago with the idea of connecting digital imaging devices to other computing platforms and enhancing the imaging experience for consumers. Starting with imaging research and advanced algorithm development, FotoNation pioneered a hybrid hardware-software delivery mechanism that has enabled the industry's foremost low-power, high performance imaging capabilities on hand-held and edge devices. We have ongoing investment in world-class R&D supported by strong relationships with key OEMs and platform providers in consumer electronics.
Research and development and other related costs in our Product Licensing segment were approximately $75.8 million, $16.1 million and $9.4 million for the years ended December 31, 2017, 2016 and 2015, respectively. These costs include FotoNation research and development costs for the three years, as well as DTS research and development costs since the acquisition date of December 1, 2016.
Intellectual Property Portfolio
As of December 31, 2017, our subsidiaries comprising the Product Licensing segment owned approximately 878 United States patents and patent applications, as well as approximately 1,469 foreign patents and patent applications. The last of the issued patents to expire is in 2036.
Strategy
Our product licensing business is focused on three markets: home, automotive and mobile devices.
Home Market Strategy
The Home market consists of TVs, Blu-ray stand-alone players, Audio/Video Receivers, sound bars, wireless speakers, game consoles and set-top-boxes.
Our business strategy in the home market is focused on the following key drivers:
• | Driving the proliferation of DTS encoded content among Hollywood studios and digital distribution partners |
• | Investing in and broadening the OEM and IC footprints that support DTS technologies |
• | DTS:X expansion from AVRs and sound bars to source devices - TVs and OTT/STB (Over-The-Top Streaming/Set-Top-Box) |
• | Play-Fi embedded device and wireless speaker and sound bar penetration |
• | Developing and bringing to market a strong pipeline of innovative technology solutions including AI applications related to voice and image sensors |
Automotive Market Strategy
In the Automotive market we primarily serve automotive OEMs and tier one automotive suppliers who deliver in-dash head units containing HD Radio technology, as well as DVD players with DTS decoding and audio post-processing solutions, such as NEURAL:XTM.
Our business strategy in the Automotive market is focused on the following key drivers:
• | Proliferation of digital radio and auxiliary data services such as traffic, local weather and enhanced content |
• | Globalization of advanced digital radio solutions, including Connected Radio |
• | Developing and bringing to market integrated innovative safety solutions, such as ADAS (Advanced Driver Assistance Systems) and DMS (Driver Monitoring Systems) based on industry leading knowledge of computer vision and automotive connectivity technologies |
Mobile Market Strategy
The Mobile market consists of smartphones, tablets, PCs and gaming headsets, as well as emerging opportunities such as Augmented Reality, Virtual Reality and Mixed Reality (AR/VR/MR).
Our business strategy in the Mobile market is focused on the following key drivers:
7
• | Long time industry leadership in computer vision technology focused on human subjects leading to development of integrated solutions for 2D & 3D image capture and enhancement |
• | Integrated imaging solutions for biometrics and user authentication |
• | Further enhancement of our imaging solutions with the application of artificial intelligence-based machine learning to our industry-leading data base of 20 million real life images |
• | Premium content and DTS branded entertainment experience for applications such as movies, gaming, AR/VR/MR |
Competition
Our audio business faces strong competition in the consumer electronics market. Our primary competitor is Dolby Laboratories, which develops and markets, among other things, high‑definition audio products and services. Dolby’s long‑standing market position, brand, business relationships, resources and inclusion in various industry standards provide it with a strong competitive position.
In addition to Dolby, we compete in specific product markets with companies such as Fraunhofer IIS and various other consumer electronics product manufacturers. Many of these competitors have a wide variety of strengths that afford them competitive advantages, such as longer operating histories, greater resources, greater name recognition, or the ability to offer their technologies for a lower price or for free. We have historically competed effectively against these competitors due in part to our ability to position our brand as a premium offering that contains superior proprietary technology, the quality of our customer service, our inclusion in industry standards and our industry relationships.
Our HD Radio solution faces competition from subscription based digital service providers such as Sirius/XM, Pandora, Gracenote, and other digital audio and data service providers.
Our image processing technologies broadly compete with other image processing software vendors such as ArcSoft, Inc. as well as internal engineering and design groups of mobile phone and digital camera manufacturers that seek to provide similar technologies by employing different approaches. Over time, we expect to see new competitors and other competing technologies emerge.
Semiconductor and IP Licensing Segment
The Semiconductor and IP Licensing Segment licenses semiconductor packaging and interconnect technologies and related IP. These technology and IP assets are licensed primarily through our two subsidiaries Tessera and Invensas. Tessera’s research and development led to significant innovations in semiconductor packaging technology. We patented these innovations, often referred to as chip-scale packaging, which have been widely adopted in the electronics industry. The wave of adoption was initially led by Intel Corporation, and over time, many semiconductor companies and outsourced assembly and test companies adopted the technology and entered into license agreements with Tessera, Inc.
Invensas Corporation develops next generation semiconductor packaging and interconnect technologies for memory, mobile, computing and automotive applications. For these applications, Invensas innovates in three primary areas: (i) DRAM and flash memory, (ii) mobile semiconductor devices, and (iii) three-dimensional integrated circuit (3D-IC) assemblies. Invensas engineering teams develop and prototype these technologies in advanced assembly and test laboratories, as well as performing full product reliability testing and acceptance testing. By building collaborative partnerships with world-class manufacturing companies and high-volume equipment and materials suppliers, Invensas then licenses these technology solutions to original equipment manufacturers (OEMs), original design manufacturers (ODMs), integrated device manufacturers (IDMs), fabless device suppliers, foundries, outsourced assembly and test (OSATs) providers, and supports the technology transfer at customer-designated sites.
Within each of these three areas of innovation (memory, mobile, and 3D-IC), Invensas has created specific product solutions that address critical needs in the market. For example, Invensas innovates in the 3D-IC space. 3D-IC, which includes Through-Silicon Vias, is widely expected to be the next major inflection in semiconductor packaging and is applicable to multiple markets, including networking, data storage, computing and mobility. In August of 2015, we augmented our 3D-IC portfolio with the acquisition of Ziptronix, Inc., a leading developer of emerging low temperature wafer bonding technologies, which are targeted at the image sensor, DRAM, MEMS, RF and 2.5D logic markets. Our ZiBond® technology is a low temperature homogenous (e.g. oxide-to-oxide) direct bonding solution that forms strong bonds between wafers or die with same or different coefficients of thermal expansion (CTE). ZiBond offers multiple benefits over conventional bonding techniques such as adhesives, anodic bonding, eutectic bonding and glass frit. Bonding is performed at room temperature, which enhances overall yield and reliability, by eliminating the negative effects associated with coefficient of expansion (CTE) mismatch,
8
warpage and distortion. Higher throughput and lower cost-of-ownership are realized by using industry-standard wafer alignment and bonding equipment. Our DBI® technology is a low temperature hybrid direct bonding solution that allows wafers or die to be bonded with exceptionally fine pitch 3D electrical interconnect. Like ZiBond, the DBI alignment and bonding process is performed at room temperature. BDI leverages industry-standard wafer or die bonding equipment, enabling the high-throughput, low cost-of-ownership fabrication process required for high volume market applications. DBI can also minimize the need for Through Silicon Vias (TSVs) by allowing interconnection to occur at the bonding surface, thereby improving electrical performance. By incorporating dielectric bonding, DBI eliminates the need for under-fill while providing excellent thermal performance, reliability and hermeticity, if required.
Customers
Our semiconductor packaging and other technologies have been licensed to more than 100 companies. These customers include SK hynix, Micron and Broadcom, among others.
Research & Development
As demonstrated by our industry‑recognized, advanced and widely-deployed technologies, we have a long history of developing, licensing and delivering innovative semiconductor packaging and interconnect solutions. Many of our longstanding innovations have enabled core function and performance gains in semiconductor solutions over the years.
As we have grown, we continue to develop new technologies internally as well as seeking to acquire best-in-class technologies from outside sources. Taken together with a strong team of talented and deeply experienced research and development engineers, this base of technology and our constant efforts to innovate new, industry leading solutions, provides a strong foundation for the development of new and unique semiconductor packaging and interconnect solutions going forward.
Research and development and other related costs for the Semiconductor and Intellectual Property segment were approximately $30.0 million, $28.6 million and $22.7 million for the years ended December 31, 2017, 2016 and 2015, respectively.
Intellectual Property Portfolio
As of December 31, 2017, our subsidiaries comprising the Semiconductor and IP Licensing segment owned approximately 1,877 United States patents and patent applications, as well as approximately 1,331 foreign patents and patent applications. The last of the issued patents to expire is in 2036.
From time to time, we acquire complementary IP portfolios from other leading companies in the semiconductor industry. Our criteria for patent acquisitions include: the fit with our existing portfolios, the number and jurisdiction of patent assets, the technical and legal strength of the patents, the actual or likely adoption by industry, and the economic value of the inventions. See Part I, Item 1A- Risk Factors.
Strategy
We are focused on the development of advanced packaging and interconnect technologies to enable the next generation of mobile, consumer, and computing products. Leveraging our extensive design, simulation and prototyping capability, we partner with leaders across the semiconductor ecosystem to develop and commercialize our technologies. As an integral component of our commercialization effort, we transfer our technologies to customer-selected manufacturing sites, foundries and OSATs.
Although we are engaged with and have successfully licensed and transferred our technologies to many semiconductor companies, some of the companies that use our patented technologies have nonetheless chosen not to enter a license agreement with us. Consequently, we have initiated litigation to enforce our IP rights. We view litigation as an instrument of last resort and we use it only when our efforts to reach negotiated licenses have stalled or failed. If we are unable to secure license agreements on favorable terms through negotiations, or if licensees do not comply with the terms of their licenses, we might have to file new litigation to enforce our rights. See Part 1, Item 3-Legal Proceedings.
Competition
We compete primarily with internal technology development groups at semiconductor manufacturers, assemblers, and electronic component and system manufacturers, who may create their own solutions that compete with technologies that we license. In general, there may be several ways to solve a particular technical problem and there can be no assurance that our
9
inventions and approaches will be the ones generally adopted by the industry. We also compete with other firms in acquiring patent assets. The most significant impediment to our semiconductor and IP licensing business is the tendency for many companies to use our inventions and intellectual property without first obtaining a license from us.
Customer Concentration
Nearly all of our revenue is denominated in U.S. dollars. The following table sets forth revenue generated from customers comprising 10% or more of total revenue for the periods indicated:
Years Ended December 31, | ||||||||
2017 | 2016 | 2015 | ||||||
Micron Technology, Inc. | 11 | % | 17 | % | 15 | % | ||
Amkor Technologies, Inc. | 10 | % | 15 | % | 14 | % | ||
Samsung Electronics, Co. Ltd. | * | 25 | % | 19 | % | |||
SK hynix Inc. | * | 12 | % | 13 | % | |||
*denotes less than 10% of total revenue.
A significant portion of our revenue is derived from customers headquartered outside of the U.S., principally in Asia, and we expect this revenue will continue to account for a significant portion of total revenue in future periods. The table below lists the geographic regions of the headquarters of our customers (in thousands) and the percentage of revenue derived from each region for the periods indicated:
Years Ended December 31, | ||||||||||||||||||||
2017 | 2016 | 2015 | ||||||||||||||||||
U.S. | $ | 164,846 | 44 | % | $ | 99,594 | 38 | % | $ | 98,428 | 36 | % | ||||||||
Korea | 50,155 | 13 | 95,170 | 37 | 87,527 | 32 | ||||||||||||||
Taiwan | 33,861 | 9 | 34,763 | 13 | 57,049 | 21 | ||||||||||||||
Japan | 81,688 | 22 | 6,866 | 3 | 9,409 | 3 | ||||||||||||||
Other | 43,182 | 12 | 23,172 | 9 | 20,887 | 8 | ||||||||||||||
$ | 373,732 | 100 | % | $ | 259,565 | 100 | % | $ | 273,300 | 100 | % | |||||||||
See Note 16 - “Segment and Geographic Information” in the Notes to Consolidated Financial Statements for additional geographic information about our revenue and long-lived assets.
The international nature of our business exposes us to a number of risks, including, but not limited to:
• | laws and business practices favoring local companies; |
• | increased tax rates and withholding tax obligations on license revenue in non-U.S. jurisdictions that we may not be able to offset fully against our U.S. tax obligations; |
• | difficulties in enforcing U.S. judgments and orders against foreign persons and products made overseas; and |
• | less effective protection of intellectual property than is afforded in the U.S. or other developed countries. |
Available Information
Our Internet address is www.xperi.com where we make available, free of charge, our annual report on Form 10-K, quarterly reports on Form 10-Q, current reports on Form 8-K and any amendments to those reports, as soon as reasonably practicable after we electronically file such material with, or furnish it to, the SEC. Our SEC reports can be accessed through the investor relations section of our website. The information found on our website is not incorporated into this or any other report we file with or furnish to the SEC.
Item 1A. Risk Factors
Our operations and financial results are subject to various risks and uncertainties, including those described below, that could adversely affect our business, financial condition, results of operations, cash flows, and the trading price of our common stock.
10
Our revenue has been concentrated and we anticipate that our billings will continue to be concentrated in a limited number of customers. If we lose any of these customers, or these customers do not pay us, our revenue and billings could decrease substantially.
We have earned a significant amount of our revenue from a limited number of customers. For the year ended December 31, 2017, there were two customers that each accounted for 10% or more of total revenue. We expect that a significant portion of our billings and revenue will continue to come from a limited number of customers for the foreseeable future. If we lose any of these customers, or these customers do not pay us, our billings and revenue could decrease substantially. For example, in February 2017 we announced that we were seeking to relicense Samsung Electronics whose patent license had expired at the end of 2016. In addition, a significant portion of our recurring billings is the result of structured payment terms in connection with the settlement of litigation matters, including our settlements with Amkor Technology, Inc. and Powertech Technology Inc. If we are unable to replace the billings from an expiring license or at the end of structured payment terms of a settlement agreement with similar billings from other customers, our royalties could be adversely impacted as compared to periods prior to such expiration or the end of such payment terms.
From time to time we enter into license agreements that have fixed expiration dates and if, upon expiration or termination, we are unable to renew or replace such license agreements on terms favorable to us, our results of operations could be harmed.
From time to time we enter into license agreements that have fixed expiration dates. Upon expiration of such agreements we need to renew or replace these agreements in order to maintain our royalty base. If we are unable to replace the royalties from an expiring license, either through a renewal or with similar royalties from other customers, our results of operations could be adversely impacted as compared to periods prior to such expiration.
Furthermore, we may not be able to continue licensing customers on terms favorable to us, under the existing terms or at all, which would harm our results of operations. While we have expanded our licensable technology portfolio through internal development and patents purchased from third parties, there is no guarantee that these measures will lead to continued royalties. If we fail to continue to do business with our current licensees, our business would be materially adversely affected.
The success of our patent licensing business is dependent on the quality of our patent assets and our ability to create and implement new technologies or expand our licensable technology through acquisitions.
We derive a significant portion of our billings from patent licenses and royalties, including structured settlement payments. The success of our patent licensing business depends on our ability to continue to develop and acquire high quality patents. We devote significant resources to developing new technologies and to sourcing and acquiring patents to address the evolving needs of the semiconductor and the consumer and communication electronics industries, and we must continue to do so in the future to remain competitive. Developments in our technologies are inherently complex, and require long development cycles and a substantial investment before we can determine their commercial viability. Moreover, competition for acquiring high quality patents is intense and there is no assurance that we can continue to acquire such patents on favorable terms. We may not be able to develop and market new or improved technologies, or to develop or acquire high quality patents, in a timely or commercially acceptable fashion. Furthermore, our acquired and developed patents will expire in the future. Our current U.S. issued patents expire at various times through 2036. We need to develop or acquire successful innovations and obtain royalty-generating patents on those innovations before our current patents expire, and our failure to do so would significantly harm our business, financial position, results of operations and cash flows.
Our use of cash and substantial long-term borrowing to finance the DTS acquisition could limit future opportunities for our business, and could materially adversely affect our financial condition if we are unable to pay principal or interest on, or to refinance, such indebtedness.
The DTS acquisition was financed with existing cash balances and a $600 million secured term loan. The combination of reduced cash balances and the incurrence of substantial long-term debt could limit our ability to make future acquisitions, investments and capital expenditures that may be necessary or desirable for the operation or expansion of our business. Moreover, our ability to service the principal and interest payments on such indebtedness will depend on our continuing ability to generate requisite cash flow from our existing and acquired business operations. The terms of the indebtedness, as refinanced in January 2018, include covenants that may limit our operating flexibility and create a risk of default if we are unable to meet financial ratios and other covenant requirements. While we made a voluntary prepayment of $100 million of principal on the indebtedness in January 2018 in connection with the refinancing of the debt, we may be unable to generate sufficient cash flow to make principal and interest payments in future periods, and in any event we may be required to refinance the remaining indebtedness upon its maturity in 2023. We may be unable to refinance such indebtedness on favorable terms or at all. For example, a downgrade in our credit rating could make any such refinancing more difficult to secure on favorable
11
terms. A default under, or inability to refinance, our indebtedness could substantially adversely affect our continuing financial viability, and could lead to insolvency, bankruptcy, and the reduction or elimination of stockholders’ equity.
Our variable rate indebtedness may expose us to interest rate risk, which could cause our debt costs to increase significantly.
As of December 31, 2017, we had $594.0 million of outstanding indebtedness that was subject to floating interest rates. In January 2018 we refinanced the indebtedness, resulting in a lower interest rate, and we made a voluntary prepayment of $100 million of principal in connection with the refinancing. Changes in economic conditions outside of our control could result in higher interest rates, thereby increasing our interest expense and reducing the funds available for capital investment, operations or other purposes. At December 31 2017, a 1% increase in the effective interest rate on our outstanding debt throughout a one-year period would result in an annual increase in our interest expense of approximately $6.0 million. Any significant increase in our interest expense could negatively impact our results of operations and cash flows and also our ability to pay dividends in the future.
We are currently involved in litigation and administrative proceedings involving some of our patents and may be involved in other such actions in the future; any adverse decisions, findings of non-infringement, or invalidation or limitation of the scope of our patents could significantly harm our business.
We are currently involved in litigation involving some of our patents, and may be involved in other such actions in the future. The parties in these legal actions often challenge the infringement, validity, scope, enforceability and/or ownership of our patents. In addition, in the past requests for reexamination or review have been filed in the U.S. Patent and Trademark Office ("PTO") with respect to patent claims at issue in one or more of our litigation proceedings, and oppositions have been filed against us with respect to our patents in the European Patent Office ("EPO"). During a reexamination or review proceeding and upon completion of the proceeding, the PTO or EPO may leave a patent in its present form, narrow the scope of the patent, or cancel or find unpatentable some or all of the claims of the patent. For example, the PTO has issued several Official Actions rejecting or maintaining earlier rejections of many of the claims in some of our patents. From time to time we assert these patents and patent claims in litigation and administrative proceedings. If the PTO's adverse rulings are upheld on appeal and some or all of the claims of the patents that are subject to reexamination are canceled, our business may be significantly harmed. In addition, counterparties to our litigation and administrative proceedings may seek and obtain orders to stay these proceedings based on rejections of claims in PTO reexaminations or review proceedings, and other courts or tribunals reviewing our legal actions could make findings adverse to our interests, even if the PTO actions are not final.
We cannot predict the outcome of any of these proceedings or the myriad procedural and substantive motions in these proceedings. If there is an adverse ruling in any legal or administrative proceeding relating to the infringement, validity, enforceability or ownership of any of our patents, or if a court or an administrative body such as the PTO limits the scope of the claims of any of our patents or concludes that they are unpatentable, we could be prevented from enforcing or earning future royalties from those patents, and the likelihood that customers will take new licenses and that current licensees will continue to agree to pay under their existing licenses could be significantly reduced. The resulting reduction in license fees and royalties could significantly harm our business, consolidated financial position, results of operations and cash flows, as well as the trading price of our common stock.
Regardless of the merits of any claim, the continued maintenance of these legal and administrative proceedings may result in substantial legal expenses and diverts our management's time and attention away from our other business operations, which could significantly harm our business. Our enforcement proceedings have historically been protracted and complex. The time to resolution and complexity of our litigation, its disproportionate importance to our business compared to other companies, the propensity for delay in civil litigation, and the potential that we may lose particular motions as well as the overall litigation could all cause significant volatility in our stock price and have a material adverse effect on our business and consolidated financial position, results of operations, and cash flows.
The timing of billings under our license and settlement agreements may cause fluctuations in our quarterly or annual results of operations.
From time to time we enter into license and settlement agreements that include pricing or payment terms that result in quarter-to-quarter or year-over-year fluctuations in our revenue, billings and cash flows. The effect of these terms may also cause our aggregate annual royalty revenue or billings to grow less rapidly than annual growth in overall unit shipments in the applicable end market. Additionally, our customers may fail to pay, delay payment of or underpay what they owe to us under our license and settlement agreements, which may in turn require us to enforce our contractual rights through litigation, resulting in payment amounts and timing different than expected based on the terms of our license and settlement agreements. This also may cause our revenue, billings and cash flows to fluctuate on a quarter-to-quarter or year-over-year basis.
12
We expect to continue to be involved in material legal proceedings to enforce or protect our intellectual property and contract rights, including material litigation with existing licensees or strategic partners, that could harm our business.
From time to time, our efforts to obtain a reasonable royalty through our sales efforts do not result in the prospective customer agreeing to license our patents or our technology. In certain cases, we become involved in litigation to enforce our intellectual property rights, enforce the terms of our license agreements, determine the validity and scope of the proprietary rights of others, and defend against claims of infringement or invalidity. For example, on September 28, 2017, we filed legal proceedings against Samsung Electronics and certain of its affiliates, alleging infringement of certain of our patents. Our current legal actions, as described in Part II, Item 1 - Legal Proceedings, are examples of disputes and litigation that impact our business. If we are not able to reach agreement with customers or potential customers we may be involved in similar legal proceedings in the future, including proceedings to ensure proper and full payment of royalties by licensees under the terms of their license agreements.
Existing and any future legal actions may harm our business. For example, legal actions could cause an existing customer or strategic partner to cease making royalty or other payments to us, or to challenge the validity and enforceability of our patents or the scope of our license agreements, and could significantly damage our relationship with such customer or strategic partner and, as a result, prevent the adoption of our technologies and intellectual property by such customer or strategic partner. Litigation could also severely disrupt or shut down the business operations of our customers or strategic partners, which in turn would significantly harm our ongoing relations with them and cause us to lose royalties. Moreover, the timing and results of any of our legal proceedings are not predictable and may vary in any individual proceeding. Further, our product licensing business could be subject to great risk of claims of infringement of third-party intellectual property rights as a result of our IP licensing business. The risks of third-party infringement claims could be heightened by our need to engage in enforcement activities with respect to our existing patents, as our existing or potential licensees may seek to assert infringement claims against our DTS or other product businesses in response to our enforcement activities relating to our existing patents. For example Broadcom had filed patent litigation against our Play-Fi business which we believe was in response to our patent litigation filed against them. Competitors of our product licensing business would not be subject to such heightened risk of third-party claims, and such claims could adversely affect our product licensing business as well as impair our enforcement ability and licensing royalties.
The cost of litigation is typically very high and can be difficult to predict, and such high costs and unpredictability may negatively impact our financial results.
From time to time we identify products that we believe infringe our patents. We seek to license the companies that design, make, use, import, sell, or offer for sale those products, but sometimes those companies are unwilling to enter into a license agreement. In those circumstances, we may elect to enforce our patent rights against those companies and products. Litigation stemming from these or other disputes could harm our relationships with those companies or other licensees, or our ability to gain new customers, who may postpone licensing decisions pending the outcome of the litigation or dispute, or who may, as a result of such litigation, choose not to adopt our technologies. In addition, these legal proceedings could be very expensive and may significantly reduce our profits.
In addition, from time to time our customers with existing license agreements dispute their obligations under such agreements, or we may dispute their reporting of royalties due under such agreements. In the past, customers have threatened to initiate litigation against us regarding our licensing royalty rate practices including our adherence to licensing on fair, reasonable, and non-discriminatory terms and potential antitrust claims.
The costs associated with legal proceedings are typically high, relatively unpredictable, and not completely within our control. These costs may be materially higher than expected, which could adversely affect our operating results and lead to volatility in the price of our common stock. Whether or not determined in our favor or ultimately settled, litigation diverts our managerial, technical, legal and financial resources from our business operations. Furthermore, an adverse decision in any of these legal actions could result in a loss of our proprietary rights, subject us to significant liabilities, require us to seek licenses from others, limit the value of our licensed technology or otherwise negatively impact our stock price or our business and consolidated financial position, results of operations and cash flows.
Even if we prevail in our legal actions, significant contingencies may exist to their settlement and final resolution, including the scope of the liability of each party, our ability to enforce judgments against the parties, the ability and willingness of the parties to make any payments owed or agreed upon, and the dismissal of the legal action by the relevant court, none of which are completely within our control. Parties that may be obligated to pay us royalties or damages, or that may otherwise be subject to a judgment, could become insolvent or decide to alter their business activities or corporate structure, which could affect our ability to collect royalties or damages from, or enforce a judgment against, such parties.
13
Recent and proposed changes to U.S. patent laws, rules, and regulations may adversely impact our business.
Our business relies in part on the uniform and historically consistent application of U.S. patent laws, rules, and regulations. There have been numerous recent administrative, legislative, and judicial changes and proposed changes to patent laws and rules that may have a significant impact on our ability to protect our technology and enforce our intellectual property rights. For example, there have been and may be bills introduced in the U.S. Congress relating to patent law that could adversely impact our business depending on the scope of any bills that may ultimately be enacted into law. As another example, the U.S. Supreme Court and lower courts have in recent years issued decisions that are not favorable to patent owners. Some of these changes or potential changes may not be advantageous for us and may make it more difficult to obtain adequate patent protection, or to enforce our patents against parties using them without a license or payment of royalties. These changes or potential changes could increase the costs and uncertainties surrounding the prosecution of our patent applications and the enforcement of our patent rights and could have a negative effect on our ability to license our patents and, therefore, on the royalties we can collect.
Some of our license agreements may convert to fully paid-up licenses at the expiration of their terms, or upon certain milestones, and we may not receive royalties after that time.
From time to time we enter into license agreements that automatically convert to fully paid-up licenses upon expiration or upon reaching certain milestones. We may not receive further royalties from customers for any licensed technology under those agreements if they convert to fully paid-up licenses because such customers will be entitled to continue using some, if not all, of the relevant intellectual property or technology under the terms of the license agreements without further payment, even if relevant patents or technologies are still in effect. If we cannot find another source of royalties to replace the royalties from these license agreements converting to fully paid-up licenses, our results of operations following such conversion would be materially adversely affected.
A significant amount of our royalty revenue and billings comes from a few end markets and products, and our business could be harmed if demand for these market segments or products declines.
A significant portion of our royalties comes from the manufacture and sale of packaged semiconductor chips for DRAM, application-specific standard product semiconductors, application-specific integrated circuits, and memory. In addition, we derive substantial royalties from the incorporation of our technology into mobile devices, consumer products and computer hardware. If demand for semiconductors in any one or a combination of these market segments or products declines, our royalties may be reduced significantly and our business would be harmed.
The long-term success of our business is dependent on a royalty-based business model, which is inherently risky.
The long-term success of our business is dependent on future royalties paid to us by customers. Royalty payments under our licenses may be based, among other things, upon the number of electrical connections to the semiconductor chip in a package covered by our licensed technology, a percent of net sales, a rate per package, a per unit sold basis or a fixed quarterly amount. We are dependent upon our ability to structure, negotiate and enforce agreements for the determination and payment of royalties, as well as upon our customers’ compliance with their agreements. We face risks inherent in a royalty-based business model, many of which are outside of our control, such as the following:
• | the rate of adoption and incorporation of our technology by semiconductor manufacturers, assemblers, manufacturers of consumer and communication electronics, and the automotive and surveillance industry; |
• | the willingness and ability of materials and equipment suppliers to produce materials and equipment that support our licensed technology, in a quantity sufficient to enable volume manufacturing; |
• | the ability of our customers to purchase such materials and equipment on a cost-effective and timely basis; |
• | the length of the design cycle and the ability of us and our customers to successfully integrate certain of our imaging technologies into their integrated circuits; |
• | the demand for products incorporating semiconductors that use our licensed technology; |
• | the cyclicality of supply and demand for products using our licensed technology; |
• | the impact of economic downturns; and |
• | the impact of poor financial performance of our customers. |
It is difficult for us to verify royalty amounts owed to us under our licensing agreements, and this may cause us to lose revenue and billings.
The terms of our license agreements often require our customers to document their use of our technology and report related data to us on a quarterly basis. Although our license terms generally give us the right to audit books and records of our customers to verify this information, audits can be expensive, time consuming, and may not be cost justified based on our
14
understanding of our customers’ businesses, especially given the international nature of our customers. Our license compliance program audits certain customers to review the accuracy of the information contained in their royalty reports in an effort to decrease the likelihood that we will not receive the royalty to which we are entitled under the terms of our license agreements, but we cannot give assurances that such audits will be effective to that end.
The markets for semiconductors and related products are highly concentrated, and we may have limited opportunities to license our technologies or sell our products.
The semiconductor industry is highly concentrated in that a small number of semiconductor designers and manufacturers account for a substantial portion of the purchases of semiconductor products generally, including our products and products incorporating our technologies. Continued consolidation in the semiconductor industry may increase this concentration. Accordingly, we expect that licenses of our technologies and sales of our products will be concentrated with a limited number of customers for the foreseeable future. As we develop and acquire new technologies and integrate them into our product line, we will need to establish new relationships to sell these products. Our financial results significantly depend on our success in establishing and maintaining relationships with, and effecting substantial sales to, these customers. Even if we are successful in establishing and maintaining such relationships, our financial results will be dependent in large part on these customers' sales and business results.
We make significant investments in new products and services that may not achieve technological feasibility or profitability or that may limit our growth.
We have made and will continue to make significant investments in research, development, and marketing of new technologies, products and services, including audio, imaging, and advanced semiconductor packaging, bonding, and interconnect technologies. Investments in new technologies are speculative and technological feasibility may not be achieved. Commercial success depends on many factors including demand for innovative technology, availability of materials and equipment, selling price the market is willing to bear, competition and effective licensing or product sales. We may not achieve significant revenue or billings from new product and service investments for a number of years, if at all. Moreover, new technologies, products and services may not be profitable, and even if they are profitable, operating margins for new products and businesses may not be as high as the margins we have experienced historically or originally anticipated.
We may not be able to evolve our audio and imaging technologies, products, and services, or develop new technologies, products, and services, that are acceptable to our customers or the evolving markets, and our customers may use technologies offered at lower cost by others.
The markets for our audio and imaging technologies, products, and services are characterized by:
• | rapid technological change and product obsolescence; |
• | new and improved product introductions; |
• | changing consumer demands; |
• | increasingly competitive product landscape; and |
• | evolving industry standards. |
Our future success in our product licensing business depends upon our ability to enhance our existing technologies, products, and services and to develop enhanced and acceptable new technologies, products, and services on a timely basis. The development of enhanced and new audio and imaging technologies, products, and services is a complex and uncertain process requiring high levels of innovation, highly-skilled engineering and development personnel, and the accurate anticipation of technological and market trends. We may not be able to accurately identify, develop, market, or support new or enhanced technologies, products, or services on a timely basis, if at all. Furthermore, our new imaging and audio technologies, products, and services may never gain market acceptance, and we may not be able to respond effectively to evolving consumer demands, technological changes, product announcements by competitors, or emerging industry standards. Any failure to respond to these changes or concerns would likely prevent our imaging and audio technologies, products, and services from gaining market acceptance or maintaining market share and could lead to our imaging and audio technologies, products, and services becoming obsolete.
Furthermore, the decision by a party dominant in the entertainment value chain to provide audio technology at very low or no cost could cause our customers and other manufacturers not to utilize our audio technologies or services in the future. Our customers may choose to use technologies that their own in-house audio engineering teams have developed, or in which they have an interest. Accordingly, our revenue or billings could decline if our customers choose not to incorporate our audio technologies in their products, or if they sell fewer products incorporating our audio technologies.
15
Competing technologies may harm our business.
We expect that our technologies will continue to compete with technologies of internal design groups at semiconductor manufacturers, assemblers, electronic component and system manufacturers. The internal design groups of these companies create their own packaging and imaging solutions. If these internal design groups design around our patents or introduce unique solutions superior to our technology, they may not need to license our technology. These groups may design technology that is less expensive to implement or that enables products with higher performance or additional features. Many of these groups have substantially greater resources, greater financial strength and lower cost structures which may allow them to undercut our price. They also have the inherent advantage of access to internal corporate strategies, technology roadmaps and technical information. As a result, they may be able to bring alternative solutions to market more easily and quickly.
DTS audio technologies compete with other providers of audio products and services, with Dolby Laboratories as the primary competitor in high-definition audio processing. Dolby Laboratories enjoys certain competitive advantages in selling its digital multi-channel audio technology, having introduced such technology before we did, and having achieved mandatory standard status in product categories that we have not, including terrestrial digital TV broadcasts in the United States.
For our embedded image processing technologies such as Face Detection and our other products, our offerings compete with other image processing software vendors such as ArcSoft, Inc. as well as internal design groups of mobile phone and digital camera manufacturers providing similar technologies by employing different approaches.
In the future, our licensed technologies may also compete with other technologies that emerge. These technologies may be less expensive and provide higher or additional performance. Companies with these competing technologies may also have greater resources. Technological change could render our technologies obsolete, and new, competitive technologies could emerge that achieve broad adoption and adversely affect the use of our technologies and intellectual property.
If we do not successfully further develop and commercialize the technologies we acquire, or cultivate strategic relationships that expand our licensable portfolio, our competitive position could be harmed and our operating results adversely affected.
We attempt to expand our licensable technology portfolio and technical expertise by further developing and acquiring new technologies or developing strategic relationships with others. These strategic relationships may include the right for us to sublicense technology and intellectual property to others. However, we may not be able to acquire or obtain rights to licensable technology and intellectual property in a timely manner or upon commercially reasonable terms. Even if we do acquire such rights, some of the technologies we invest in may be commercially unproven and may not be adopted or accepted by the industry. Moreover, our research and development efforts, and acquisitions and strategic relationships, may be futile if we do not accurately predict the future needs of the semiconductor, consumer and communication electronics, and consumer imaging and audio processing industries. Our failure to acquire new technologies that are commercially viable in the semiconductor, consumer and communication electronics, and consumer imaging and audio processing industries could significantly harm our business, financial position, results of operations and cash flows.
The way we integrate internally developed and acquired technologies into our products and licensing programs may not be accepted by customers.
We have devoted, and expect to continue to devote, considerable time and resources to developing, acquiring and integrating new and existing technologies into our products and licensing programs. However, if customers do not accept the way we have integrated our technologies, they may adopt competing solutions. In addition, as we introduce new products or licensing programs, we cannot predict with certainty if and when our customers will transition to those new products or licensing programs. Moreover, with respect to certain of our imaging technologies, even after we have signed a license agreement with a customer, we will often not see significant royalties from that customer until after such technologies have been successfully designed into the customer's integrated circuits, which can take 18 months or longer. If customers fail to accept new or upgraded products or licensing programs incorporating our technologies, our financial position, results of operations and cash flows could be adversely impacted.
If we fail to protect and enforce our intellectual property rights, contract rights, and our confidential information, our business will suffer.
We rely primarily on a combination of license, development and nondisclosure agreements and other contractual provisions, as well as patent, trademark, trade secret and copyright laws, to protect our technology and intellectual property. If we fail to protect our technology, intellectual property, or contract rights, our customers and others may seek to use our technology and intellectual property without the payment of license fees and royalties, which could weaken our competitive position, reduce our operating results and increase the likelihood of costly litigation. The growth of our business depends in large part on our
16
ability to secure intellectual property rights in a timely manner, our ability to convince third parties of the applicability of our intellectual property rights to their products, and our ability to enforce our intellectual property rights.
In certain instances, we attempt to obtain patent protection for portions of our technology, and our license agreements typically include both issued patents and pending patent applications. If we fail to obtain patents in a timely manner or if the patents issued to us do not cover all of the inventions disclosed in our patent applications, others could use portions of our technology and intellectual property without the payment of license fees and royalties. For example, our business may suffer if we are unable to obtain patent protection in a timely manner from the PTO due to processing delays resulting from examiner turnover and a continuing backlog of patent applications.
We also rely on trade secret laws rather than patent laws to protect other portions of our proprietary technology. However, trade secrets can be difficult to protect. The misappropriation of our trade secrets or other proprietary information could seriously harm our business. We protect our proprietary technology and processes, in part, through confidentiality agreements with our employees, consultants, suppliers and customers. We cannot be certain that these contracts have not been and will not be breached, that we will be able to timely detect unauthorized use or transfer of our technology and intellectual property, that we will have adequate remedies for any breach, or that our trade secrets will not otherwise become known or be independently discovered by competitors. If we fail to use adequate mechanisms to protect our technology and intellectual property, or if a court fails to enforce our intellectual property rights, our business will suffer. We cannot be certain that these protection mechanisms can be successfully asserted in the future or will not be invalidated or challenged.
Further, the laws and enforcement regimes of certain countries do not protect our technology and intellectual property to the same extent as do the laws and enforcement regimes of the U.S. In certain jurisdictions we may be unable to protect our technology and intellectual property adequately against unauthorized use, which could adversely affect our business.
Our business may suffer if third parties assert that we violate their intellectual property rights.
Third parties may claim that either we or our customers are infringing upon their intellectual property rights. Even if we believe that such claims are without merit, they can be time-consuming and costly to defend against and will divert management's attention and resources away from our business. Furthermore, third parties making such claims may be able to obtain injunctive or other equitable relief that could block our ability to further develop or commercialize some or all of our products or services in the U.S. and abroad. Claims of intellectual property infringement also might require us to enter into costly settlement or license agreements, pay costly damage awards, or defend or indemnify our customers against judgments, damages, or other losses. Even if we have an agreement that provides for a third party to indemnify us against such costs, the indemnifying party may be unable to perform its contractual obligations under the agreement. If we cannot or do not license the allegedly infringed intellectual property on reasonable terms, or need to substitute similar technology from another source, our business, financial position, results of operations and cash flows could suffer.
Our licensing cycle is lengthy and costly, and our marketing, legal and sales efforts may be unsuccessful.
We generally incur significant marketing, legal and sales expenses prior to entering into our license agreements, generating a license fee and establishing a royalty stream from each licensee. The length of time it takes to establish a new licensing relationship, and/or for our customers to incorporate certain imaging technologies in their integrated circuits, can be 18 months or longer. As such, we may incur significant expenses in any particular period before any associated royalty or cash flow stream begins.
Our business incurs significant reverse engineering expenditures on products of potential licensees in order to prepare sales and marketing collateral. We employ intensive marketing and sales efforts to educate licensees, potential licensees and original equipment manufacturers about the benefits of our technologies. In addition, even if these companies adopt our technologies, they must devote significant resources to integrate fully our technologies into their operations. If our marketing and sales efforts are unsuccessful, then we may not be able to achieve widespread acceptance of our technology. In addition, ongoing litigation could impact our ability to gain new licensees which could have an adverse effect on our financial condition, results of operations and cash flows.
If our licensees delay, refuse to or are unable to make payments to us due to financial difficulties or otherwise, or shift their licensed products to other companies to lower their royalties to us, our operating results and cash flows could be adversely affected.
A number of companies in the semiconductor and consumer electronics industries face severe financial difficulties from time to time. As a result, there have been bankruptcies and restructuring of companies in these industries. As an example, in our quarter ended September 30, 2017 we recorded a bad debt charge for $1.6 million relating to past due receivables from two LeEco affiliates, based on our significant doubts about full collection due to substantial financial stress and negative payment
17
history that these affiliates exhibited recently. Other customers may face similar financial difficulties which may result in their inability to make payments to us in a timely manner, or at all. In addition, we have had a history of, and we may in the future experience, customers that delay or refuse to make payments owed to us under license or settlement agreements. Our customers may also merge with or may shift the manufacture of licensed products to companies that are not currently licensees to us. This could make the collection process complex and difficult, which could adversely impact our business, financial condition, results of operations and cash flows.
Failure by the semiconductor industry to adopt our technology for the next generation high performance chips used in consumer electronics would significantly harm our business.
To date, our technology has been used by several companies in high performance semiconductor chips, including DRAM. For example, packaging using our technology is used for DDR3 and DDR4 DRAM and we currently have customers who are paying royalties for DRAM chips in advanced packages.
We anticipate that royalties from shipments of next-generation semiconductor chips using our technology may account for a significant percentage of our future royalties. If semiconductor manufacturers do not continue to use our technology for the next-generation chips and find viable alternative technologies for use with next-generation chips, or if we do not receive royalties from the next-generation chips that use our technology, our future financial performance and cash flows could be adversely affected.
Our technology may be too expensive for certain next-generation semiconductor manufacturers, which could significantly reduce the adoption rate of our technology in next-generation chips. Even if our technology is selected for at least some of these next-generation chips, there could be delays in the introduction of products utilizing these chips that could materially affect the amount and timing of any royalty payments that we receive. Other factors that could affect adoption of our technology for next-generation semiconductor products include delays or shortages of materials and equipment and the availability of testing services.
Similarly, our audio licensing royalties from consumer electronics product manufacturers depends, in large part, upon the availability of ICs that implement our technologies. IC manufacturers incorporate our audio technologies into these ICs, which are then incorporated into consumer electronics products. We do not manufacture these ICs, but rather depend upon IC manufacturers to develop, produce and then sell them to licensed consumer electronics product manufacturers. We do not control the IC manufacturers' decisions whether or not to incorporate our technologies into their ICs, and we do not control their product development or commercialization efforts. If these IC manufacturers are unable or unwilling to implement our technologies into their ICs, production is delayed, or if they sell fewer ICs incorporating our technologies, our operating results and cash flows could be adversely affected.
The investment of our cash, cash equivalents and investments in marketable debt securities are subject to risks which may cause losses and affect the liquidity of these investments.
At December 31, 2017, we held approximately $138.3 million in cash and cash equivalents and $62.4 million in short-term investments. These investments include various financial securities such as corporate bonds and notes, municipal bonds and notes, commercial paper, treasury and agency notes and bills, and money market funds. Although we invest in high quality securities, ongoing financial events have at times adversely impacted the general credit, liquidity, market and interest rates for these and other types of debt securities. Changes in monetary policy by the Federal Reserve, government fiscal policies, and global economic and market conditions may adversely affect the value of our investment portfolio. While we have historically held our investments to maturity, we may in the future have a need to sell investments before their maturity dates, which could result in losses on the sale of those investments. For example, the DTS acquisition resulted in us liquidating a significant portion of our investments. The financial market and monetary risks associated with our investment portfolio may have a material adverse effect on our financial condition, results of operations and cash flows.
Our intellectual property business operates in a highly cyclical industry, which is subject to significant downturns.
The semiconductor industry in which our intellectual property business primarily operates has historically been cyclical and is characterized by wide fluctuations in product supply and demand. From time to time, this industry has experienced significant downturns, often in connection with, or in anticipation of, declining economic conditions, maturing product and technology cycles, and excess inventories. This cyclicality could cause our operating results to decline from one period to the next. Our business depends, in part, upon the volume of production by our customers, which, in turn, depends upon the current and anticipated market demand for semiconductors and products that use semiconductors. Semiconductor manufacturers and package assembly companies generally sharply curtail their spending during industry downturns, and historically have lowered their spending more than the decline in their revenue. As a result, our financial results have been, and will continue to be,
18
impacted by the cyclicality of the electronics industry. If we are unable to control our expenses adequately in response to lower royalties from our customers in such downturns, our results of operations and cash flows will be materially and adversely impacted.
If we are unable to maintain a sufficient amount of content released in the DTS audio format, demand for the technologies, products, and services that we offer to consumer electronics product manufacturers may significantly decline, which would adversely impact our business and prospects.
We expect to derive a significant percentage of our billings from the technologies, products, and services that we offer to manufacturers of consumer electronics products. We believe that demand for our audio technologies in growing markets for multi-channel and/or high resolution audio, including TVs, tablets, mobile phones, video game consoles, automobiles, and soundbars, will be based on the amount, quality, and popularity of content (such as movies, TV shows, music, and games) either released in the DTS audio format or capable of being coded and played in the DTS format. In particular, our ability to penetrate the growing markets in the network-connected space depends on the presence of streaming and downloadable content released in the DTS audio format. We generally do not have contracts that require providers of streaming and downloadable content to develop and release such content in a DTS audio format. Accordingly, our billings could decline if these providers elect not to incorporate DTS audio into their content or if they sell less content that incorporates DTS audio.
In addition, we may not be successful in maintaining existing relationships or developing new relationships with other existing or new content providers. As a result, we cannot assure you that a sufficient amount of content will be released in a DTS audio format to ensure that manufacturers continue offering DTS decoders in the consumer electronics products that they sell.
Demand for our HD Radio technology may be insufficient to sustain projected growth.
Demand for and adoption of HD Radio technology may not be sufficient for us to continue to increase the number of customers of our HD Radio system, which include IC manufacturers, manufacturers of broadcast transmission equipment, consumer electronics products manufacturers, component manufacturers, data service providers, manufacturers of specialized and test equipment and radio broadcasters.
Among other things, continuing and increased consumer acceptance of HD Radio technology will depend upon:
• | the number of radio stations broadcasting digitally using HD Radio technology; |
• | the willingness of automobile manufacturers to include HD Radio receivers in their vehicles; |
• | the willingness of manufacturers to incorporate HD Radio technology into their products; |
• | the cost and availability of HD Radio enabled products; and |
• | the marketing and pricing strategies that we employ and that are employed by our customers and retailers. |
If demand for HD Radio technology does not continue to increase as expected, we may not be able to increase our DTS royalties as projected.
Our HD Radio technology may not remain competitive if we do not respond to changes in technology, standards and services that affect the radio broadcasting industry.
The radio broadcasting industry is subject to technological change, evolving industry standards, regulatory restrictions and the emergence of other media technologies and services. Our HD Radio technology may not gain market acceptance over these other technologies. Various other audio technologies and services that have been developed and introduced include:
• | internet streaming, cable-based audio programming and other digital audio broadcast formats; |
• | satellite delivered digital audio radio services that offer numerous programming channels; |
• | other digital radio competitors, such as Digital Radio Mondiale, or DAB; and |
• | growth in use of portable devices for storage and playback of audio content. |
Competition arising from these or other technologies or potential regulatory change may have an adverse effect on the radio broadcasting industry or on our company and our financial condition and results of operations.
If we are unable to further penetrate the streaming and downloadable content delivery markets and adapt our technologies for those markets, our royalties and ability to grow our audio business could be adversely impacted.
Video and audio content has historically been purchased and consumed primarily via optical disc-based media. However, the growth of the internet and network-connected device usage, along with the rapid advancement of online and mobile content
19
delivery has resulted in download and streaming services becoming mainstream with consumers in various parts of the world. We expect the shift away from optical disc-based media to streaming and downloadable content consumption to continue. If we fail to continue to penetrate the streaming and downloadable content delivery market, our audio business could suffer.
The services that provide content from the cloud are not generally governed by international or national standards and are thus free to choose any media format(s) to deliver their products and services. This freedom of choice on the part of online content providers could limit our ability to grow if such content providers do not incorporate our technologies into their services, which could affect demand for our technologies.
Furthermore, our inclusion in mobile and other network-connected devices may be less profitable for us than optical disc players. The online and mobile markets are characterized by intense competition, evolving industry standards and business and distribution models, disruptive software and hardware technology developments, frequent new product and service introductions, short product and service life cycles, and price sensitivity on the part of consumers, all of which may result in downward pressure on pricing. If we are unable to adequately and timely respond to the foregoing, our business and operating results could be adversely affected.
Changes in financial accounting or taxation standards, rules, practices or interpretations may cause adverse unexpected revenue and expense fluctuations which may impact our reported results of operations.
We prepare our consolidated financial statements in accordance with U.S. generally accepted accounting principles (GAAP). These principles are subject to interpretations by the SEC and various accounting bodies. In addition, we are subject to various taxation rules in many jurisdictions. The existing taxation rules are generally complex, frequently changing and subject to interpretation. Changes to taxation rules, changes to financial accounting standards, or any changes to the interpretations of these standards or rules may adversely affect our reported financial results or the way in which we conduct business. Recent accounting pronouncements and their estimated potential impact on our business are addressed in Note 2 - “Summary of Significant Accounting Policies” in the Notes to Consolidated Financial Statements.
In May 2014, the Financial Accounting Standards Board (“FASB”) issued ASU 2014-09, “Revenue from Contracts with Customers” (“ASU 2014-09”), and since May 2014 the FASB has issued amendments to this new guidance, which collectively provides guidance for revenue recognition. ASU 2014-09 became effective for us beginning January 1, 2018 and we will adopt the new standard under the modified retrospective approach. Under the new standard, the historical practice of many licensing companies of reporting revenue from per-unit royalty-based agreements one quarter in arrears is no longer accepted and instead companies are now expected to estimate royalty-based revenue. This guidance will significantly impact our revenue recognition. First, we will no longer be allowed to follow our past practice of recording per unit license revenue on a quarter lag basis, a practice precipitated by the lack of reliable estimates for such revenue. Second, we are now required to record all or a significant majority of revenue under our fixed fee and minimum guarantee license agreements when such agreements are entered into rather than recording them over time as is our typical practice today and which generally is more closely aligned with the billing cycle and cash flows from such agreements. While the changes in revenue recognition do not impact our cash flows, the impact on our Statement of Operations under the new accounting standard may impact how investors perceive our business which could materially impact the value of our common stock.
On December 22, 2017, the Tax Cut and Jobs Act (“Tax Act”) was signed into law. The Tax Act introduced a broad range of tax reform measures that significantly change the federal income tax laws. The provisions of the Tax Act that may have significant impact on us include the permanent reduction of the corporate income tax rate from 35% to 21% effective for tax years including or commencing on January 1, 2018, one-time transition tax on post-1986 foreign unremitted earnings, provision for global intangible low-taxed income (“GILTI”), deduction for foreign-derived intangible income (“FDII”), repeal of corporate alternative minimum tax, limitation of various business deductions, modification of the maximum deduction of net operating loss with no carryback but indefinite carryforward provision, and limitation on the deductibility of executive compensation. Many provisions in the Tax Act are generally effective in tax years beginning after December 31, 2017.
We continue to analyze additional information and new guidance issued by relevant authorities related to the Tax Act which could impact the determination of the net deferred taxes subject to the remeasurement and the related impact to the assessment of valuation allowance. The prospects of supplemental legislation or regulatory processes to address questions that arise because of the Tax Act, or evolving technical interpretations of the tax law, may cause the final impact from the Tax Act to differ materially from the recorded amounts.
Our rate of taxation in foreign jurisdictions has historically been lower than our U.S. tax rate. Our international income is primarily earned by our subsidiaries organized in Ireland and the United Kingdom, and, as such, our effective tax rate can be impacted by the composition of our earnings in the U.S. and foreign jurisdictions. The Organization for Economic Cooperation and Development issued guidelines and proposals during October 2015 that may change how our tax obligations are
20
determined in many of the countries in which we do business. These potential changes could also adversely affect our effective tax rate.
Our future effective tax rate may be affected by such factors as changes in tax laws, changing interpretation and new guidance related to the Tax Act, the impact of accounting for stock-based compensation, the impact of accounting for business combinations, changes in the composition of global earnings, the expiration of statute of limitations, settlements of audits, changes in our international organization and changes in overall levels of income before tax.
We have in the past recorded, and may in the future record, significant valuation allowances on our deferred tax assets, and the recording and release of such allowances may have a material impact on our results of operations and cause fluctuations in our stock price.
The need for a valuation allowance requires an assessment of both positive and negative evidence on a jurisdiction-by-jurisdiction basis when determining whether it is more likely than not that deferred tax assets are recoverable. In making such assessment, significant weight is given to evidence that can be objectively verified. In the future, new facts and circumstances and new guidance related to the Tax Act may require us to re-evaluate our valuation allowance positions which could potentially affect our effective tax rate.
We continue to monitor the likelihood that we will be able to recover our deferred tax assets, including those for which a valuation allowance is recorded. There can be no assurance that we will generate profits in future periods enabling us to fully realize our deferred tax assets. The timing of recording a valuation allowance or the reversal of such valuation allowance is subject to objective and subjective factors that cannot be readily predicted in advance. Both the establishment of a valuation allowance and the reversal of a previously recorded valuation allowance may have a material impact on our financial results, which may lead to fluctuation in the value of our stock.
The international nature of our business exposes us to financial and regulatory risks that may have a negative impact on our consolidated financial position, results of operations and cash flows, and we may have difficulty protecting our intellectual property in some foreign countries.
We derive a significant portion of our royalties from licensees headquartered outside of the U.S. We also have operations outside of the U.S., including our research and development facilities in Ireland, Romania and the United Kingdom, to design, develop, test or market certain technologies. International operations are subject to a number of risks, including but not limited to the following:
• | changes in trade protection laws, policies and measures, and other regulatory requirements affecting trade and investment; |
• | regulatory requirements and prohibitions that differ between jurisdictions; |
• | laws and business practices favoring local companies; |
• | withholding tax obligations on license royalties that we may not be able to offset fully against our U.S. tax obligations, including the further risk that foreign tax authorities may re-characterize license fees or increase tax rates, which could result in increased tax withholdings and penalties; |
• | security concerns, including crime, political instability, terrorist activity, armed conflict and civil or military unrest; |
• | differing employment practices, labor issues and business and cultural factors; |
• | less effective protection of intellectual property than is afforded to us in the U.S. or other developed countries; and |
• | limited infrastructure and disruptions, such as large-scale outages or interruptions of service from utilities or telecommunications providers. |
Our intellectual property is also used in a large number of foreign countries. There are many countries in which we currently have no issued patents. In addition, effective intellectual property enforcement may be unavailable or limited in some foreign countries. It may be difficult for us to protect our intellectual property from misuse or infringement by other companies in these countries. We expect this to become a greater problem for us as our licensees increase their manufacturing and sales in countries which provide less protection for intellectual property. Our inability to enforce our intellectual property rights in some countries may harm our business, financial position, results of operations and cash flows.
Our business and operating results may be harmed if we are unable to manage growth in our business, if we undertake any further restructuring activities or if we dispose of a business division or dispose of or discontinue any product lines.
We have in the past expanded our operations, domestically and internationally, and may continue to do so through both internal growth and acquisitions. In December 2016, we acquired DTS, resulting in our headcount more than doubling year over year. If our growth continues, it may place a significant strain on our management team and on our operational and financial
21
systems, procedures, and controls. Our future success will depend, in part, upon the ability of our management team to manage any growth effectively, requiring our management to:
• | recruit, hire, and train additional personnel; |
• | implement and improve our operational and financial systems, procedures, and controls; |
• | maintain our cost structure at an appropriate level based on the royalties, billings and cash we forecast and generate; |
• | manage multiple concurrent development projects; and |
• | manage operations in multiple time zones with different cultures and languages. |
If we are unable to effectively manage our growth or we are unsuccessful in recruiting and retaining personnel, our business and operating results will be harmed. Moreover, if our acquisitions or other growth initiatives do not prove to be profitable, we may undertake to restructure our business, including the disposition of a business division, or the disposition or discontinuance of a product line, as we have done in previous years. Any restructuring, disposition or discontinuance would require substantial management time and attention and may divert management from other important work, and may result in significant liabilities and costs as described earlier.
Disputes regarding our intellectual property may require us to defend or indemnify certain customers or licensees, the cost of which could adversely affect our business operations and financial condition.
While we generally do not defend or indemnify our customers, some of our license agreements in our imaging and audio businesses provide limited defense and indemnities for certain actions brought by third parties against our customers, and some require us to provide technical support and information to a customer that is involved in litigation for using our technology. Our defense, indemnity and support obligations could result in substantial expenses. In addition to the time and expense required for us to defend, indemnify or supply such support to our customers, a customer’s development, marketing and sales of licensed image or audio products could be severely disrupted or shut down as a result of litigation, which in turn could have a material adverse effect on our business operations, consolidated financial position, results of operations and cash flows.
If we lose any of our key personnel or are unable to attract, train and retain qualified personnel, we may not be able to execute our business strategy effectively.
Our success depends, in large part, on the continued contributions of our key management, engineering, sales, marketing, intellectual property, legal and finance personnel, many of whom are highly skilled and would be difficult to replace. None of our senior management, key technical personnel or key sales personnel are bound by written employment contracts to remain with us for a specified period. In addition, we do not currently maintain key-person life insurance covering our key personnel or have restrictions on their post-employment ability to solicit our employees, contractors or customers if key personnel voluntarily terminate their employment. The loss of any of our senior management or other key personnel could harm our ability to implement our business strategy and respond to the rapidly changing market conditions in which we operate. Our future success will depend to a significant extent on the ability of these executives to effectively drive execution of our business strategy, and on the ability of our management team to work together effectively.
Our success also depends on our ability to attract, train and retain highly skilled managerial, engineering, sales, marketing, legal and finance personnel and on the abilities of new personnel to function effectively, both individually and as a group. Competition for qualified senior employees can be intense. We have also experienced difficulty in hiring and retaining highly skilled engineers with appropriate qualifications to support our growth and expansion. Further, we must train our new personnel, especially our technical support personnel, to respond to and support our licensees and customers. If we fail to do this, it could lead to dissatisfaction among our licensees or customers, which could slow our growth or result in a loss of business.
Our business operations could suffer in the event of information technology system failures or security breaches.
Despite system redundancy and the implementation of security measures within our internal and external information technology and networking systems, our information technology systems may be subject to security breaches, unauthorized access (malicious or accidental), misuse of information by authorized users, data leaks or unintentional exposure of information, failed process, loss of data, damages from computer viruses or malware, natural disasters, terrorism, telecommunication failures or disruption of service. Any system failure or security breach could cause interruptions in our operations in addition to the possibility of losing proprietary information and trade secrets. To the extent that any disruption or security breach results in inappropriate disclosure of our confidential information, we may incur liability or additional costs to remedy the damages caused by these disruptions or security breaches.
Decreased effectiveness of share-based compensation could adversely affect our ability to attract and retain employees.
22
We have historically used stock options, restricted stock grants and other forms of stock-based compensation as key components of employee compensation in order to align employees' interests with the interests of our stockholders, encourage employee retention and provide competitive compensation and benefit packages. We incur significant compensation costs associated with our stock-based compensation programs. Failure to obtain stockholder approval of equity compensation plans or changes to the plans could make it harder or more expensive for us to grant stock-based compensation to employees in the future. As a result, we may find it difficult to attract, retain and motivate employees, and any such difficulty could have a materially adverse impact on our business.
Failure to comply with environmental regulations could harm our business.
We use hazardous substances in the manufacturing and testing of prototype products and in the development of technologies in our research and development laboratories. We are subject to a variety of local, state and federal regulations relating to the storage, discharge, handling, emission, generation, manufacture and disposal of toxic or other hazardous substances. Our past, present or future failure to comply with environmental regulations could result in the imposition of substantial fines, suspension of production, and alteration of our manufacturing processes or cessation of operations. Compliance with such regulations could require us to acquire expensive remediation equipment or to incur other substantial expenses. Any failure to control the use, disposal, removal or storage of, or to adequately restrict the discharge of, or assist in the cleanup of, hazardous or toxic substances, could subject us to significant liabilities, including joint and several liabilities under certain statutes. The imposition of such liabilities could significantly harm our business, financial position, results of operations and cash flows.
Our effective tax rate depends on our ability to secure the tax benefits of our international corporate structure, on the application of the tax laws of various jurisdictions and on how we operate our business.
Our international corporate structure and intercompany arrangements, including the manner in which we market, develop, use and license our intellectual property, fund our operations and structure transactions with our international subsidiaries, may result in the increase or reduction of our worldwide effective tax rate. Such international corporate structure and intercompany arrangements are subject to examination by the tax authorities of the jurisdictions in which we operate, including the United States. The application of the tax laws of these jurisdictions to our international business activities is subject to interpretation and depends on our ability to operate our business in a manner consistent with our corporate structure and intercompany arrangements. Moreover, such tax laws are subject to change. Tax authorities may disagree with our intercompany transfer pricing arrangements, including our transfer of intangibles, or determine that the manner in which we operate our business does not achieve the intended tax consequences. Additionally, current and future changes in the tax laws or interpretations (such as the enactment of the Tax Act to reform U.S. taxation of international business activities) may have an adverse effect on our international corporate structure and operations. The result of an adverse determination of any of the above items could increase our worldwide effective tax rate and harm our financial position and results of operations.
We have business operations located in places that are subject to natural disasters.
Our business operations depend on our ability to maintain and protect our facilities, computer systems and personnel. Our corporate headquarters are located in the San Francisco Bay Area and we have engineering activities in several locations throughout California, which in the past have experienced severe earthquakes. We do not carry earthquake insurance for any of our facilities except for our office in Calabasas, California. Earthquakes or other natural disasters could severely disrupt our operations, and have a material adverse effect on our business, results of operations, financial condition and prospects.
We have made and may continue to make or to pursue acquisitions which could divert management's attention, cause ownership dilution to our stockholders, or be difficult to integrate, which may adversely affect our financial results.
We have made several acquisitions, and it is our current plan to continue to acquire companies, assets, patents and technologies that we believe are strategic to our future business. For example, in the fourth quarter of 2016, we acquired DTS, Inc., for approximately $955 million. In the third quarter of 2015, we acquired Ziptronix, Inc. for approximately $39 million. Investigating businesses, assets, patents or technologies and integrating newly acquired businesses, assets, patents or technologies could put a strain on our resources, could be costly and time consuming, and might not be successful. Such activities divert our management's attention from other business concerns. In addition, we might lose key employees while integrating new organizations or operations. Acquisitions could also result in customer dissatisfaction, performance problems with an acquired company or technology, potentially dilutive issuances of equity securities or the incurrence of debt, the assumption or incurrence of contingent liabilities, impairment charges related to goodwill and possible impairment charges related to other intangible assets or other unanticipated events or circumstances, any of which could harm our business.
Our plans to integrate and expand upon research and development programs and technologies obtained through acquisitions may result in products or technologies that are not adopted by the market. The market may adopt competitive solutions to our
23
products or technologies. Consequently, we might not be successful in integrating any acquired businesses, assets, products or technologies, and might not achieve anticipated revenue and cost benefits.
There are numerous risks associated with our acquisitions of businesses, technologies and patents.
We have made a number of acquisitions of businesses, technologies and patents in recent years. These acquisitions are subject to a number of risks, including but not limited to the following:
• | these acquisitions could fail to produce anticipated benefits or could have other adverse effects that we currently do not foresee. As a result, these acquisitions could result in a reduction of net income per share as compared to the net income per share we would have achieved if these acquisitions had not occurred. We may also be required to recognize impairment charges of acquired assets or goodwill, and if we decide to restructure acquired businesses, we may incur other restructuring charges; |
• | the purchase price for each acquisition is determined based on significant judgment on factors such as projected cash flow, quality and availability of the business, technology or patent. In addition, if other companies have similar interests in the same business, technology or patent, our ability to negotiate these acquisitions at favorable terms may be limited and the purchase price may be artificially inflated; |
• | following completion of these acquisitions, we may uncover additional liabilities, patent validity, infringement or enforcement issues or unforeseen expenses not discovered during our diligence process; |
• | any such additional liabilities, patent validity, infringement or enforcement issues or expenses could result in significant unanticipated costs not originally estimated, such as impairment charges of acquired assets and goodwill, and may harm our financial results; |
• | the integration of technologies, patent assets and personnel, if any, will be a time consuming and expensive process that may disrupt our operations if it is not completed in a timely and efficient manner. If our integration efforts are not successful, our results of operations could be harmed, employee morale could decline, key employees could leave, and customer relations could be damaged. In addition, we may not achieve anticipated synergies or other benefits from any of these acquisitions; |
• | we have incurred substantial direct transaction and integration costs as a result of past acquisitions. In future acquisitions, the total direct transaction costs and the costs of integration may exceed our expectations; |
• | sales by the acquired businesses may be subject to different accounting treatment than our existing businesses, especially related to the recognition of revenue. This may lead to the loss or deferral of revenue under current and emerging accounting standards; |
• | there may be a significant time lag between acquiring patent assets and recognizing royalties from those patent assets. During that time lag, material costs are likely to be incurred in preparing licensing or litigation efforts and amortization of acquired patent assets that would have a negative effect on our results of operations, cash flows and financial position; |
• | we may require external financing that is dilutive or presents risks of debt; and |
• | we are required to estimate and record fair values of contingent assets, liabilities, deferred tax assets and liabilities at the time of an acquisition. Even though these estimates are based on management's best judgment, the actual results may differ. Under the current accounting guidance, differences between actual results and management's estimate could cause our operating results to fluctuate or could adversely affect our results of operations. |
If our amortizable intangible assets (such as acquired patents) become impaired, we may be required to record a significant charge to earnings.
In addition to internal development, we intend to broaden our intellectual property portfolio through strategic relationships and acquisitions such as the acquisitions of DTS, Inc. in the fourth quarter of 2016, and Ziptronix, Inc. in the third quarter of 2015. We believe these strategic relationships and acquisitions will enhance the competitiveness and size of our current businesses and provide diversification into markets and technologies that complement our current businesses. Future acquisitions could be in the form of asset purchases, equity investments, or business combinations. As a result, we may have intangible assets which are amortized over their estimated useful lives. We review our amortizable intangible assets (such as our patent portfolio) for impairment when events or changes in circumstances indicate the carrying value may not be recoverable or the useful life is shorter than originally estimated. Factors that may be considered a change in circumstances indicating that the carrying value of our amortizable or other intangible assets may not be recoverable include a decline in future cash flows, fluctuations in market capitalization, slower growth rates in our industry or slower than anticipated adoption of our products by our customers. As we continue to review for factors that may affect our business which may not be in our control, we may be required to record a significant charge to earnings in our financial statements during the period in which any impairment of our amortizable intangible assets or equity investments is determined, resulting in an adverse impact on our business, financial position, or results of operations.
24
Current and future governmental and industry standards may significantly limit our business opportunities.
Technology standards are important in the audio and video industry as they help to assure compatibility across a system or series of products. Generally, standards adoption occurs on either a mandatory basis, requiring a particular technology to be available in a particular product or medium, or an optional basis, meaning that a particular technology may be, but is not required to be, utilized. If standards are re-examined or a new standard is developed in which we are not included, our growth in that area of our business could be significantly lower than expected.
As new technologies and entertainment media emerge, new standards relating to these technologies or media may develop. New standards may also emerge in existing markets that are currently characterized by competing formats, such as the market for PCs. We may not be successful in our efforts to include our technology in any such standards.
Changes in or failure to comply with FCC requirements could adversely impact our HD Radio revenue and royalties.
In October 2002, the Federal Communications Commission, or the FCC, selected our “In-Band, On-Channel" (“IBOC”) technology, also known as “HD Radio technology,” as the exclusive technology for introduction of terrestrial digital operations by AM and FM radio stations. In the United States, the FCC regulates the broadcast radio industry, interprets laws enacted by Congress and establishes and enforces regulations governing radio broadcasting. It is unclear what rules and regulations the FCC may adopt regarding digital audio broadcasting and what effect, if any, such rules and regulations will have on our Product Licensing Segment, the operations of stations using our HD Radio technology or consumer electronics manufacturers. Any additional rules and regulations imposed on digital audio broadcasting could adversely impact the attractiveness of HD Radio technology and negatively impact our business. Also, non-compliance by us, or by radio stations offering HD Radio broadcasts, with any FCC requirements or conditions could result in fines, additional license conditions, license revocation or other detrimental FCC actions.
Our licensing of industry standard technologies can be subject to limitations that could adversely affect our business and prospects.
When a standards-setting body adopts our technologies as explicit industry standards, we generally must agree to license such technologies on a fair, reasonable and non-discriminatory basis, which we believe means that we treat similarly situated customers similarly. In these situations, we may be required to limit the royalty rates we charge for these technologies, which could adversely affect our business. Furthermore, we may have limited control over whom we license such technologies to and may be unable to restrict many terms of the license. From time to time, we may be subject to claims that our licenses of our industry standard technologies may not conform to the requirements of the standards-setting body. Claimants in such cases could seek to restrict or change our licensing practices or our ability to license our technologies in ways that could harm our reputation and otherwise materially and adversely affect our business, operating results and prospects.
Our financial and operating results may vary, which may cause the price of our common stock to decline.
Our quarterly operating results have fluctuated in the past and are likely to do so in the future. Because our operating results are difficult to predict, one should not rely on quarterly or annual comparisons of our results of operations as an indication of our future performance. Factors that could cause our operating results to fluctuate during any period or that could adversely affect our ability to achieve our strategic objectives include those listed in this “Risk Factors" section of this report and the following:
• | the timing of, and compliance with license or service agreements and the terms and conditions for payment to us of license or service fees under these agreements; |
• | fluctuations in our royalties caused by the pricing terms of certain of our license agreements; |
• | the amount of our product and service revenue; |
• | changes in the level of our operating expenses; |
• | delays in our introduction of new technologies or market acceptance of these new technologies through new license agreements; |
• | our ability to protect or enforce our intellectual property rights or the terms of our agreements; |
• | legal proceedings affecting our patents, patent applications or license agreements; |
• | the timing of the introduction by others of competing technologies; |
• | changes in demand for semiconductor chips in the specific end markets in which we concentrate; |
• | changes in demand for camera-enabled devices including cell phones, security systems and personal computers; |
• | the timing of the conclusion of license agreements; |
• | the length of time it takes to establish new licensing arrangements; |
• | meeting the requirements for revenue recognition under generally accepted accounting principles; |
25
• | changes in generally accepted accounting principles including new accounting standards which may materially affect our revenue recognition and the comparability between revenue recognition and cash flow from customer royalties; and |
• | cyclical fluctuations in semiconductor markets generally. |
Due to fluctuations in our operating results, reports from market and security analysts, litigation-related developments, and other factors, the price at which our common stock will trade is likely to continue to be highly volatile. In future periods, if our revenue, royalties, billings, cash flows or operating results are below the estimates or expectations of public market analysts and investors, our stock price could decline.
We may not continue to pay dividends at the same rate we are currently paying them, or at all, and any decrease in or suspension of the dividend could cause our stock price to decline.
We currently pay a quarterly dividend to $0.20 per share. We also have returned capital to shareholders through stock repurchases. We anticipate that all quarterly dividends and stock repurchases will be paid out of cash, cash equivalents and short-term investments. The payment of future cash dividends is subject to the final determination each quarter by our Board of Directors that the dividend remains in our best interests, which determination will be based on a number of factors, including our earnings, financial condition, actual and forecasted cash flows, capital resources and capital requirements, alternative uses of capital, economic condition and other factors considered relevant by management and the Board of Directors. Any decrease in the amount of the dividend, or suspension or discontinuance of payment of a dividend, could cause our stock price to decline.
Our stock repurchase program could increase the volatility of the price of our common stock, and the program may be suspended or terminated at any time, which may cause the trading price of our common stock to decline.
In August 2007, we authorized a plan to repurchase our outstanding shares of common stock dependent on market conditions, share price and other factors. As of December 31, 2017, the total amount available for repurchase under the plan was $142.8 million.
The amount of repurchases under our stock repurchase program will vary. In 2015, we repurchased approximately 3,300,000 shares for an aggregate amount of $119.2 million. In 2016, we repurchased approximately 2,300,000 shares for an aggregate amount of $67.7 million. In 2017, we repurchased approximately 654,000 shares for an aggregate amount of $15.3 million. Additionally, the timing of repurchases is at our discretion and the program may be suspended or discontinued at any time. Any suspension or discontinuation could cause the market price of our stock to decline. The timing of repurchases pursuant to our stock repurchase program could affect our stock price and increase its volatility. There can be no assurance that any stock repurchases will enhance stockholder value because the market price of our common stock may decline below the levels at which we effected repurchases. Furthermore, we may engage in mergers, acquisitions, or other activity that could result in us reducing or discontinuing share repurchases for a period of time. For example, the DTS acquisition resulted in a significant decrease in cash, cash equivalents and short-term investments, as well as the issuance of approximately $600 million in debt. The terms of our current or future debt agreements could limit our ability to repurchase shares. We made no repurchases during the first six months of 2017 and repurchases during the second half of 2017 well below our repurchases in prior years.
Provisions of our certificate of incorporation and bylaws or Delaware law might delay or prevent a change of control transaction and depress the market price of our stock.
Various provisions of our certificate of incorporation and bylaws might have the effect of making it more difficult for a third party to acquire, or discouraging a third party from attempting to acquire, control of our company. These provisions could limit the price that certain investors might be willing to pay in the future for shares of our common stock. Certain of these provisions eliminate cumulative voting in the election of directors, authorize the board to issue “blank check” preferred stock, prohibit stockholder action by written consent, eliminate the right of stockholders to call special meetings, and establish advance notice procedures for director nominations by stockholders and the submission of other proposals for consideration at stockholder meetings. We are also subject to provisions of Delaware law which could delay or make more difficult a merger, tender offer or proxy contest involving our company. In particular, Section 203 of the Delaware General Corporation Law prohibits a Delaware corporation from engaging in any business combination with any interested stockholder for a period of three years unless specific conditions are met. Any of these provisions could have the effect of delaying, deferring or preventing a change in control, including without limitation, discouraging a proxy contest or making more difficult the acquisition of a substantial block of our common stock.
26
Item 1B. Unresolved Staff Comments
Not applicable.
Item 2. Properties
Our principal corporate headquarters, which houses administrative, sales, marketing and research and development facilities, are located in San Jose, California, and are held under an operating lease. We own real property, including an approximately 89,000 square foot building, in Calabasas, California, which houses additional administrative, sales, marketing, research and development facilities. We lease smaller facilities in other locations including the United States, Republic of Ireland, Romania, Hong Kong, China, the United Kingdom, Japan, South Korea, Taiwan, Singapore and Mexico. We believe that our existing space is adequate for our current operations. We believe that suitable replacement and additional space, to the extent needed, will be available in the future on commercially reasonable terms.
Item 3. Legal Proceedings
Other than to the extent the proceedings described below have concluded, we cannot predict the outcome of any of the proceedings described below. An adverse decision in any of these proceedings could significantly harm our business and our consolidated financial position, results of operations, and cash flows.
Toshiba Proceedings
Tessera, Inc. v. Toshiba Corporation, Civil Action No. 5:15-cv-02543-BLF (N.D. Cal.)
On May 12, 2015, Tessera, Inc. filed a complaint against Toshiba Corporation (“Toshiba”) in California Superior Court. Tessera, Inc.’s complaint alleges causes of action for breach of contract, breach of the implied covenant of good faith and fair dealing, and declaratory relief, generally alleging that Toshiba underpaid royalties and failed to cooperate with audits conducted pursuant to the parties’ license agreement.
On June 8, 2015, Toshiba removed the action to the U.S. District Court for the Northern District of California. On June 18, 2015, Toshiba filed its answer, affirmative defenses, and counterclaims to Tessera, Inc.’s complaint. Toshiba alleges counterclaims for declaratory judgment and breach of the implied warranty of good faith and fair dealing. The counterclaims seek, among other things, judicial determinations about the interpretation of the parties’ agreement, termination of the agreement, an accounting of the amount of alleged overpayments by Toshiba, restitution, and damages. On July 10, 2015, Tessera, Inc. filed its answer and affirmative defenses to Toshiba’s counterclaims. On March 17, 2016, Tessera, Inc. filed an amended complaint adding a claim for declaratory relief regarding a February 12, 2016 letter sent by Toshiba to Tessera, Inc. purporting to terminate the parties’ license agreement. On March 18, 2016, Toshiba filed its amended answer, affirmative defenses, and counterclaims. On April 4, 2016, Tessera, Inc. filed an answer to Toshiba’s amended counterclaims.
An initial summary judgment hearing on contract issues took place on September 22, 2016. On November 7, 2016, the Court entered an order granting Toshiba’s motion regarding the definition of “TCC,” and denying summary judgment on the other issues raised by the parties’ cross-motions. On December 6, 2016, Tessera, Inc. filed a motion pursuant to Federal Rule of Civil Procedure 54(b) seeking authorization to appeal the order and for a stay. On March 6, 2017, the Court granted the Rule 54(b) motion. The Court subsequently vacated the trial date and stayed the remainder of the district court proceedings.
On April 4, 2017, Tessera, Inc. filed a notice of appeal to the U.S. Court of Appeals for the Ninth Circuit. The parties completed briefing on November 2, 2017. A hearing for oral argument has not yet been scheduled.
Broadcom Proceedings
Certain Semiconductor Devices, Semiconductor Device Packages, and Products Containing Same, Inv. No. 337-TA-1010 (U.S. International Trade Commission, Washington, D.C.)
On May 23, 2016, Tessera Technologies, Inc., Tessera, Inc., and Invensas Corporation (collectively, “Complainants”) filed a complaint at the U.S. International Trade Commission (“the Commission”), requesting that the Commission institute an investigation against Respondents Broadcom Limited, Broadcom Corporation, Avago Technologies Limited, Avago Technologies U.S. Inc., ARRIS International plc, ARRIS Group, Inc., ARRIS Technology, Inc., ARRIS Enterprises LLC, ARRIS Solutions, Inc., Pace Americas, LLC, Pace USA LLC, Pace Ltd., ASUSTeK Computer Inc., ASUS Computer International, HTC Corporation, HTC America, Inc., NETGEAR, Inc., Arista Networks, Inc. Comcast Cable Communications, LLC, Comcast Cable Communications Management, LLC, Comcast Business Communications, LLC, Technicolor S.A.,
27
Technicolor USA, Inc., and Technicolor Connected Home USA LLC (collectively, “Respondents”). The complaint alleged that the Respondents infringe U.S. Patent Nos. 6,849,946, 6,133,136, and 6,856,007. The complaint requested that the Commission issue a permanent limited exclusion order excluding the Respondents’ infringing products from entry into the United States , and issue a permanent cease and desist order prohibiting the Respondents from, among other things, importing, selling, or distributing the infringing products.
Based on the complaint, the Commission instituted Investigation No. 337-TA-1010 on June 20, 2016. On February 27, 2017, the Administrative Law Judge (“ALJ”) granted a motion for summary determination of no violation by respondents Avago Technologies Ltd. and Avago Technologies, U.S. Inc. on the basis that the Complainants did not accuse them of any violations. The Complainants elected not to seek review of this order. All other Respondents remained parties in the Investigation. On March 15, 2017, the ALJ granted-in-part and denied-in-part the Respondents’ motion for summary determination of non-infringement of U.S. Patent No. 6,856,007. The patent remained in the investigation in certain respects, and the Complainants elected not to seek review of this order.
The evidentiary hearing took place from March 27 to March 31, 2017. The ALJ issued her final initial determination on June 30, 2017. The ALJ determined that Broadcom and the other Respondents violated section 337 of the Tariff Act. The ALJ determined that the asserted claims of U.S. Patent No. 6,849,946 are infringed by Broadcom semiconductor devices and products that contain an infringing Broadcom chip. The ALJ also determined that the asserted claims of U.S. Patent No. 6,849,946 were not shown to be invalid and that a domestic industry exists. With regard to U.S. Patent No. 6,133,136, the ALJ determined that the asserted claims are infringed and were not shown to be invalid, but also determined that a domestic industry did not exist. For U.S. Patent No. 6,856,007, the ALJ determined that one of the asserted claims is infringed, but that the other two claims are not infringed, all three asserted claims are invalid, and a domestic industry did not exist. The parties filed petitions for review by the full Commission.
On September 29, 2017, the Commission issued its notice that it would review in part the ALJ’s final initial determination. For the ’946 and ’136 patents, the Commission determined to review all issues with the exception of the findings concerning the level of skill in the art, and requested supplemental briefing on specific questions relating to the ’946 and ’136 patents. For the ’007 patent, the Commission determined to review, and on review, to take no position on, the findings related to infringement of claim 18 and the economic prong of the domestic industry requirement. The Commission determined not the review the remainder of the initial determination relating to the ’007 patent.
In December 2017, the parties reached a settlement and filed a joint motion to terminate the Investigation. On December 19, 2017, the Commission entered a determination terminating the Investigation. This matter is now concluded.
Tessera, Inc., et al. v. Broadcom Corp., Case No. DED-1-16-cv-00379 (D. Del.)
On May 23, 2016, Tessera, Inc. and Invensas Corporation filed a complaint against Broadcom Corporation (“Broadcom”) in the U.S. District Court for the District of Delaware. The complaint alleged that Broadcom infringes U.S. Patent Nos. 6,133,136, 6,849,946, and 6,856,007 and requested, among other things, that Broadcom be ordered to pay compensatory damages in an amount no less than a reasonable royalty. On September 9, 2016, the Court granted Broadcom’s unopposed motion to stay the action in light of the pending proceeding in the U.S. International Trade Commission involving the same patents.
In December 2017, the parties reached a settlement and filed a Stipulation of Dismissal with Prejudice. The Court entered an order dismissing the action on December 20, 2017. This matter is now concluded.
Tessera, Inc., et al. v. Broadcom Corp., Case No. DED-1-16-cv-00380 (D. Del.)
On May 23, 2016, Tessera, Inc. and Tessera Advanced Technologies, Inc. (collectively, “Tessera”) filed a complaint against Broadcom Corporation (“Broadcom”) in the U.S. District Court for the District of Delaware, alleging that Broadcom infringes U.S. Patent Nos. 5,666,046, 6,043,699, 6,284,563, and 6,954,001. Tessera filed an amended complaint on June 19, 2016, alleging infringement of three additional patents: U.S. Patent Nos. 6,046,076, 6,080,605, and 6,218,215. The amended complaint requested, among other things, that Broadcom be ordered to pay compensatory damages. On July 14, 2016, Broadcom filed an answer to the amended complaint. On September 8, 2016, Tessera filed a second amended complaint to reflect the issuance of a Certificate of Correction relating to U.S. Patent No. 6,954,001. On September 26, 2016, Broadcom answered the second amended complaint.
In December 2017, the parties reached a settlement and filed a Stipulation of Dismissal with Prejudice. The Court entered an order dismissing the action on December 20, 2017. This matter is now concluded.
Invensas Corp. v. Avago Technologies Limited, et al., Case No. DED-1-16-cv-1033 (D. Del.)
28
On November 7, 2016, Invensas Corporation filed a complaint against Avago Technologies Limited and Avago Technologies U.S. Inc., Emulex Corporation, LSI Corporation, and PLX Technology, Inc. (collectively “Avago”) in the U.S. District Court for the District of Delaware. The complaint alleged that Avago infringes U.S. Patent Nos. 6,849,946 and 6,133,136 and requested, among other things, that Avago be ordered to pay compensatory damages. On December 6, 2016, Avago filed an unopposed motion to stay in light of the pending proceeding in the U.S. International Trade Commission involving the same patents. The Court granted the unopposed motion to stay on December 7, 2016.
In December 2017, the parties reached a settlement and filed a Stipulation of Dismissal with Prejudice. The Court entered an order dismissing the action on December 20, 2017. This matter is now concluded.
Tessera, Inc., et al. v. Avago Technologies Limited, et al., Case No. DED-1-16-cv-1034 (D. Del.)
On November 7, 2016, Tessera, Inc. and Invensas Corporation filed a complaint against Avago Technologies Limited, Avago Technologies U.S. Inc. and Avago Technologies Wireless (U.S.A) Manufacturing Inc. (collectively “Avago”) in the U.S. District Court for the District of Delaware. The complaint alleged that Avago infringes U.S. Patent Nos. 6,573,609 and 6,972,480. On January 12, 2017 Avago filed an answer to the complaint. Tessera, Inc. and Invensas Corporation filed an amended complaint on January 31, 2017 against Avago Technologies U.S. Inc., Avago Technologies Wireless (U.S.A) Manufacturing Inc., Emulex Corporation, LSI Corporation, and PLX Technology, Inc. (collectively “Defendants”) alleging infringement of three additional patents, U.S. Patent Nos. 6,046,076, 6,080,605, and 6,218,215. The complaint requested, among other things, that Defendants be ordered to pay compensatory damages. Defendants filed an answer to the amended complaint on March 16, 2017.
In December 2017, the parties reached a settlement and filed a Stipulation of Dismissal with Prejudice. The Court entered an order dismissing the action on December 20, 2017. This matter is now concluded.
Invensas Corp. v. Mouser Electronics Inc., et al., Case No. 7 O 97/16 (Regional Court of Mannheim, Germany)
On May 23, 2016, Invensas Corporation (“Invensas”) filed a complaint against Mouser Electronics, Inc. (“Mouser”), EBV Elektronik GmbH & Co. KG, Arrow Central Europe GmbH, and Broadcom Germany GmbH in the Regional Court of Mannheim, Germany. The complaint alleged that the respondents infringe Invensas’ European Patent EP 1 186 034 B1. On August 26, 2016, the respondents filed their answer to the complaint. Invensas filed its reply on November 15, 2016, and the respondents filed a rejoinder on January 13, 2017. A bench trial took place on February 3, 2017.
On March 17, 2017, the Court issued a judgment in Invensas’ favor, finding that the respondents infringe the patent. The Court ordered that the respondents cease offering, distributing, using, or importing (or possessing for said reasons) the infringing products in Germany; recall infringing products from the German market; destroy or have destroyed infringing products in their possession in Germany; and provide an accounting of their infringing activities. The Court further ordered Invensas to post bonds of approximately €3,050,000 as security for damages that may have resulted from the preliminary enforcement of the judgment if it were ultimately overturned. Invensas posted such bonds.
The respondents appealed to the Higher Regional Court (“Oberlandesgericht”) Karlsruhe, Case No. 6 U 46/17. Invensas filed its response to the merits of the appeal on July 10, 2017.
On May 3, 2017, Invensas filed a motion to enforce the judgment and for sanctions against certain distributors, alleging that they violated the injunction. On May 19, 2017, Invensas filed a motion to enforce the judgment and for sanctions against Mouser, for failing to adequately render accounts. The parties briefed the enforcement proceedings through August 2017.
On August 9, 2017, the court informed Invensas that it did not regard the bond posted by Invensas for the preliminary enforcement of the claim for rendering of accounts against Mouser as being sufficient. On September 19, 2017, Invensas informed the court that it had posted a new bond.
On October 5, 2017, the German Federal Patent Court issued a preliminary opinion stating its tentative view that the claimed teaching of the patent is not patentable. In light of the preliminary opinion, Invensas agreed to temporarily abstain from enforcing the Mannheim court’s judgment pending the January 25, 2018 hearing in the Federal Patent Court. Invensas filed motions to temporarily suspend the enforcement proceedings with the Mannheim court on October 12, 2017. The court granted the temporary suspension for both enforcement actions by orders dated October 13, 2017.
In December 2017, the parties reached a settlement, and Invensas withdrew the infringement action and corresponding enforcement actions. The bonds were returned to Invensas. This matter is now concluded.
Invensas Corp. v. Broadcom Ltd., et al., Case No. 7 O 98/16 (Regional Court of Mannheim, Germany)
29
On May 23, 2016, Invensas filed a complaint against Broadcom Ltd. and Broadcom Corporation in the Regional Court of Mannheim, Germany, alleging infringement of Invensas’ European Patent EP 1 186 034 B1. On September 22, 2016, the respondents filed their answer to the complaint. Invensas filed its reply on November 15, 2016, and the respondents filed a rejoinder on January 13, 2017. A bench trial took place on February 3, 2017.
On March 17, 2017, the Court issued a judgment in Invensas’ favor, finding that the respondents infringe the patent. The Court ordered that the respondents cease offering, distributing, using, or importing (or possessing for said reasons) the infringing products in Germany; recall infringing products from the German market; destroy or have destroyed infringing products in their possession in Germany; and provide an accounting of their infringing activities. To make the judgment enforceable, the Court ordered Invensas to post bonds of approximately €3,600,000 as security for damages that may result from the preliminary enforcement of the judgment if it is ultimately overturned. Invensas posted such bonds.
The respondents appealed to the Higher Regional Court (“Oberlandesgericht”) Karlsruhe, Case No. 6 U 34/17. In addition to appealing the infringement decision on the merits, the respondents filed motions seeking to stay enforcement of the judgment, and to increase the amount of the security bonds to approximately €500 million. Invensas filed its response to the merits of the appeal on May 15, 2017. On May 31, 2017, the appellate court issued an order denying the motion to stay preliminary enforcement of the judgment. On June 14, 2017, Broadcom filed another motion seeking to stay enforcement of the judgment pending the decision on its motion to raise the amount of the security bonds, and Invensas responded on June 22, 2017. On August 4, 2017, the appellate court issued an order denying this second motion to stay preliminary enforcement of the judgment. A hearing regarding Broadcom’s motion to increase the security bonds took place on September 13, 2017 before the Higher Regional Court Karlsruhe. Following the hearing, the court issued an order denying Broadcom’s motion.
On June 21, 2017, Invensas filed motions to enforce the judgment and for sanctions, alleging that Broadcom violated the injunction, failed to render accounts, and failed to adequately recall products as required in the judgment. Broadcom filed its response on August 4, 2017. With regard to the enforcement of the injunction, Invensas filed a response on August 31, 2017.
With regard to the motion for sanctions for failure to render accounts, the court informed Invensas on September 11, 2017 that it did not regard the bond posted by Invensas for the preliminary enforcement of the claim for rendering of accounts as being sufficient, and prompted Invensas to reply by October 13, 2017. Invensas posted two new bonds.
With regard to the motions for sanctions for failure to render accounts and to adequately recall products, the court set a deadline of October 13, 2017 for Invensas to file a reply.
On October 5, 2017, the German Federal Patent Court issued a preliminary opinion stating its tentative view that the claimed teaching of the patent is not patentable. In light of the preliminary opinion, Invensas agreed to temporarily abstain from enforcing the Mannheim court’s judgment pending the January 25, 2018 hearing in the Federal Patent Court. Invensas filed motions to temporarily suspend the enforcement proceedings with the Mannheim court on October 12, 2017. The court granted the temporary suspension for all three enforcement actions by orders dated October 13, 2017.
In December 2017, the parties reached a settlement, and Invensas withdrew the infringement action and corresponding enforcement actions. The bonds were returned to Invensas. This matter is now concluded.
Avago Technologies GmbH v. Invensas Corp. (German Federal Patent Court, Germany)
On August 25, 2016, Avago Technologies GmbH (“Avago”), a German affiliate of Broadcom Ltd., filed a nullity action against the German part of European patent EP 1 186 034 B1 in the German Federal Patent Court. The complaint alleged that the patent was neither new nor inventive over prior art and that certain claims are not disclosed in a way to enable the person skilled in the art to practice the invention. The complaint further alleged that the patent’s priority was invalidly claimed. It requested that the German part of the patent be nullified. Invensas Corporation filed the grounds for its opposition on May 30, 2017.
The Federal Patent Court issued its preliminary opinion on October 5, 2017, stating its tentative view that the claimed teaching may not be patentable. On December 6, 2017, the parties filed responses to the court’s preliminary opinion. A hearing was scheduled for January 25, 2018.
In December 2017, the parties reached a settlement and Avago withdrew the action. As a result of the settlement, the Federal Patent Court cancelled the hearing. This matter is now concluded with the exception of formal issues relating to the amount in dispute for purposes of establishing the final court fees to be borne by Avago.
Invensas Corp. v. Broadcom Ltd., et al., Case No. KG/RK 16-912 (District Court of The Hague, Netherlands)
30
On May 23, 2016, Invensas filed a writ of summons against Broadcom Ltd., Broadcom Corporation, Broadcom Netherlands B.V., Broadcom Communications Netherlands B.V., EBV Elektronik GmbH & Co. KG, Arrow Central Europe GmbH, and Mouser Electronics Netherlands B.V. in the District Court of The Hague, Netherlands. The complaint alleged that the defendants infringe Invensas’s European Patent EP (NL) 1 186 034 B1, and requested, among other things, that the defendants cease and desist any infringement of the patent in suit in the Netherlands; inform all persons/entities to whom the defendants delivered, sold, or offered for sale any infringing products that they will no longer do so; recall allegedly infringing products; and pay damages.
The defendants filed a statement of answer to the writ of summons, and a counterclaim of invalidity, on November 9, 2016. Invensas filed its statement of answer to the defendants’ counterclaim on January 4, 2017. A bench trial took place on November 3, 2017.
In December 2017, the parties reached a settlement and the proceedings were withdrawn. This matter is now concluded.
Certain Wireless Audio Systems and Components Thereof, Inv. No. 337-TA-1071 (U.S. International Trade Commission, Washington, D.C.)
On August 10, 2017, Broadcom Limited and Avago Technologies General IP (Singapore) Pte. Ltd. (collectively, “Complainants”) filed a complaint at the U.S. International Trade Commission (“the Commission”), requesting that the Commission institute an investigation against Respondents DTS, Inc., Phorus, Inc., MartinLogan, Ltd., Paradigm Electronics Inc., Anthem Electronics, Inc., Wren Sound Systems, LLC, McIntosh Laboratory, Inc., Definitive Technology, and Polk Audio Inc. (collectively, “Respondents”). The complaint alleged that the Respondents infringe claim 20 of U.S. Patent No. 6,684,060. The complaint requested that the Commission issue a permanent limited exclusion order excluding from entry into the United States the allegedly infringing products of the Respondents. In addition, the complaint requested that the Commission issue a permanent cease and desist order prohibiting the Respondents from, among other things, importing, selling, or distributing the allegedly infringing products.
Based on the complaint, the Commission instituted Investigation No. 337-TA-1071 on September 15, 2017. The Complainants filed a motion seeking permission to file a Second Amended Complaint and that motion was granted on October 24, 2017. The Second Amended Complaint removed Anthem Electronics, Inc. as a Respondent and corrected the corporate names of Respondents Definitive Technology, LLC and Polk Audio, LLC. The Respondents filed responses to the Second Amended Complaint and Notice of Investigation on November 6, 2017.
In December 2017, the parties reached a settlement and filed a joint motion to terminate the Investigation. The Administrative Law Judge entered an initial determination terminating the Investigation on December 19, 2017. On January 18, 2018, the Commission issued a notice determining not to review the initial determination. This matter is now concluded.
Broadcom Limited, et al. v. DTS, Inc., et al., Case No. -1-16-cv-00379 (C.D. Cal.)
On August 10, 2017, Broadcom Limited and Avago Technologies General IP (Singapore) Pte. Ltd. (collectively, “Broadcom”) filed a complaint against DTS, Inc. and Phorus, Inc. (collectively “Defendants”) in the U.S. District Court for the Central District of California. The complaint alleged that Defendants infringe U.S. Patent No. 6,684,060 and requested, among other things, that Defendants be ordered to pay compensatory damages. On September 22, 2017, the parties filed a joint stipulation asking the Court to stay the action pursuant to 28 U.S.C. 1659(a) until the Commission’s determination in ITC Investigation No. 337-TA-1071 becomes final. On September 26, 2017, the Court entered an order staying the action.
In December 2017, the parties reached a settlement and filed a Stipulation of Dismissal with Prejudice. The Court entered an order dismissing the action on December 20, 2017. This matter is now concluded.
Taiwan Semiconductor Manufacturing Co. Ltd. v. Tessera, Inc., et al., Case No. 5:17-cv-0588 (N.D. Cal.)
On October 13, 2017, Taiwan Semiconductor Manufacturing Company Limited (“TSMC”) filed a complaint and motion for preliminary injunction against Tessera Technologies, Inc., Tessera, Inc., and Invensas Corporation (collectively “Tessera”) in the U.S. District Court for the Northern District of California relating to U.S. International Trade Commission Investigation No. 337-TA-1010 (the “1010 Investigation”). In the 1010 Investigation, the Administrative Law Judge held that Tessera’s right to enforce United States Patent No. 6,849,946 (the “’946 patent”) against Broadcom and the other respondents is not exhausted by a covenant not to sue (“CNS”) in an agreement between TSMC and Cypress Semiconductor Corporation (“Cypress”), the former owner of the ’946 patent, because the CNS does not grant TSMC the right to sell products to its customers, including Broadcom. TSMC’s complaint and motion for preliminary injunction sought to enjoin Tessera from: (1) asserting that the CNS
31
in the agreement between Cypress and TSMC does not cover sale of TSMC-manufactured wafers to Broadcom and therefore does not exhaust Tessera's rights in the '946 patent; (2) taking further action to enforce any exclusion order, cease-and-desist order, or “other injunctive relief” entered by the Commission as it relates to Broadcom products made from wafers manufactured by TSMC; and (3) opposing any motion to stay any exclusion order, cease-and-desist order, or “other injunctive relief” entered by the Commission as it relates to Broadcom products made from wafers manufactured by TSMC.
In December 2017, the parties reached a settlement and filed a Stipulation of Dismissal with Prejudice. The Court entered an order dismissing the action on December 19, 2017. This matter is now concluded.
Samsung Proceedings
Certain Wafer-Level Packaging Semiconductor Devices and Products Containing Same (Including Cellular Phones, Tablets, Laptops, and Notebooks) and Components Thereof, Inv. No. 337-TA-1080, (U.S. International Trade Commission, Washington, D.C.)
On September 28, 2017, Tessera Advanced Technologies, Inc. filed a complaint at the U.S. International Trade Commission (“the Commission”), requesting that the Commission institute an investigation against Samsung Electronics Co., Ltd., Samsung Electronics America, Inc., and Samsung Semiconductor, Inc. (collectively, “Samsung”). The complaint alleges that Samsung infringes U.S. Patent Nos. 6,954,001 and 6,784,557. The complaint requests that the Commission issue a permanent limited exclusion order excluding from entry into the United States Samsung’s infringing products. In addition, the complaint requests that the Commission issue a permanent cease and desist order prohibiting Samsung from, among other things, importing, selling, or distributing the infringing products.
On October 31, 2017, the Commission instituted the investigation. On November 27, 2017, Samsung filed a response to the complaint. A claim construction hearing is scheduled for March 20, 2018. An evidentiary hearing is scheduled from July 30 to August 3, 2018. The initial determination is due on November 2, 2018. The target date for completion of the investigation is March 3, 2019.
Tessera Advanced Technologies, Inc. v. Samsung Electronics America, Inc. et al, Civil Action No. 2:17-cv-07621 (D. N.J.)
On September 28, 2017, Tessera Advanced Technologies, Inc. filed a complaint against Samsung Electronics America, Inc. and Samsung Electronics Co., Ltd. (collectively, “Samsung”) in the U.S. District Court for the District of New Jersey. The complaint alleges that Samsung infringes U.S. Patent Nos. 6,954,001 and 6,784,557 and requests, among other things, that Samsung be ordered to pay compensatory damages. On November 22, 2017, Samsung filed an unopposed motion to stay the action pending resolution of a U.S. International Trade Commission investigation involving the same patents. On November 27, 2017, the Court granted Samsung’s motion. This action is currently stayed.
Invensas Corporation v. Samsung Electronics Co., Ltd., et al., Civil Action No. 1:17-cv-01363 (D. Del.)
On September 28, 2017, Invensas Corporation filed a complaint against Samsung Electronics Co., Ltd. and Samsung Austin Semiconductor, LLC (collectively, “Samsung”) in the U.S. District Court for the District of Delaware. The complaint alleges that Samsung infringes U.S. Patent Nos. 6,232,231 and 6,849,946 and requests, among other things, that Samsung be ordered to pay compensatory damages. On December 19, 2017, Samsung filed an Answer and Affirmative Defenses. A claim construction hearing is scheduled for October 10, 2018, and a jury trial is scheduled to begin on November 18, 2019.
Invensas Bonding Technologies, Inc. v. Samsung Electronics America, Inc., et al., Civil Action No. 1:17-cv-07609 (D. N.J.)
On September 28, 2017, Invensas Bonding Technologies, Inc. filed a complaint against Samsung Electronics America, Inc. and Samsung Electronics Co. Ltd. (collectively, “Samsung”) in the U.S. District Court for the District of New Jersey. The complaint alleges that Samsung infringes U.S. Patent Nos. 7,553,744, 7,807,549, 7,871,898, 8,153,505, 9,391,143, and 9,431,368 and requests, among other things, that Samsung be ordered to pay compensatory damages. On December 19, 2017, Samsung filed an Answer and Affirmative Defenses. An initial scheduling conference is scheduled for February 22, 2018.
FotoNation Limited, et al v. Samsung Electronics Co., Ltd., et al, Civil Action No. 2:17-cv-00669 (E.D. Tex.)
On September 28, 2017, FotoNation Limited and DigitalOptics Corporation MEMS (collectively, “FotoNation”) filed a complaint against Samsung Electronics America, Inc. and Samsung Electronics Co. Ltd. (collectively, “Samsung”) in the U.S. District Court for the Eastern District of Texas. On February 16, 2018, FotoNation filed an amended complaint. The amended complaint alleges that Samsung infringes U.S. Patent Nos. 8,254,674, 8,331,715, 7,860,274, 7,697,829, 7,574,016, 7,620,218,
32
7,916,897 and 8,908,932, and requests, among other things, that Samsung be ordered to pay compensatory damages. On February 1, 2018, Samsung filed a motion to transfer the action to the U.S. District Court for the District of Delaware. On February 16, 2018, Samsung filed a motion to dismiss certain counts of the amended complaint.
A claim construction hearing is scheduled for August 2, 2018. A dispositive motion hearing is scheduled for March 12, 2019. A jury trial is scheduled to begin on June 17, 2019.
Invensas Corporation v. Samsung Electronics Co., Ltd., et al., Civil Action No. 2:17-cv-00670 (E.D. Tex.)
On September 28, 2017, Invensas Corporation filed a complaint against Samsung Electronics Co., Ltd. and Samsung Electronics America, Inc. (“Samsung”) in the U.S. District Court for the Eastern District of Texas. The complaint alleges that Samsung infringes U.S. Patent Nos. 6,232,231 (the “‘231 patent”), 6,849,946 (the “‘946 patent”), 6,054,336, 6,566,167, and 6,825,554 and requests, among other things, that Samsung be ordered to pay compensatory damages. On December 19, 2017, Samsung filed an Answer and Affirmative Defenses to the Complaint. On February 1, 2018, Samsung filed a motion to transfer the action to the U.S. District Court for the District of Delaware, and a motion to sever and stay proceedings for the ‘231 and ‘946 patents.
A claim construction hearing is scheduled for August 9, 2018. The final pretrial conference is scheduled for January 28, 2019. A jury trial is scheduled to begin on February 19, 2019.
Tessera Advanced Technologies, Inc. v. Samsung Electronics Co., Ltd., et al., Civil Action No. 2:17-cv-00671 (E.D. Tex.)
On September 28, 2017, Tessera Advanced Technologies, Inc. filed a complaint against Samsung Electronics Co., Ltd. and Samsung Electronics America, Inc. (“Samsung”) in the U.S. District Court for the Eastern District of Texas. The complaint alleges that Samsung infringes U.S. Patent Nos. 6,512,298 and 6,825,616 and requests, among other things, that Samsung be ordered to pay compensatory damages. On December 19, 2017, Samsung filed an Answer and Affirmative Defenses to the Complaint.
On February 1, 2018, Samsung filed a motion to transfer the action to the U.S. District Court for the District of Delaware. On February 22, 2018, Samsung filed a motion to stay pending arbitration.
A claim construction hearing is scheduled for September 17, 2018. A jury trial is scheduled to begin on May 6, 2019.
Invensas Corporation vs. Samsung Electronics GmbH, Case no. 7 O 162/17 (Regional Court of Mannheim, Germany)
On August 30, 2017, Invensas Corporation (“Invensas”) filed a complaint against Samsung Electronics GmbH (“Samsung Germany”) in the Regional Court of Mannheim, Germany. The complaint alleged that Samsung Germany infringes Invensas’ European Patent EP 1 186 034 B1 based on its use of Broadcom chips. The complaint requested that Samsung cease offering, distributing, using, or importing (or possessing for such reasons) infringing products in Germany; recall infringing products from the German market; destroy or have destroyed infringing products in their possession in Germany; and provide an accounting of infringing activities. In December 2017, Invensas reached a settlement with Broadcom and accordingly withdrew the complaint in this action. This matter is now concluded.
Invensas Corporation vs. Samsung Electronics Co., Ltd., Case no. 7 O 161/17 (Regional Court of Mannheim, Germany)
On August 30, 2017 Invensas Corporation (“Invensas”) filed a complaint against Samsung Electronics Co. Ltd. (“Samsung”) in the Regional Court of Mannheim, Germany. The complaint alleged that the Samsung infringes Invensas’ European Patent EP 1 186 034 B1 based on its use of infringing Broadcom chips in Samsung products. In December 2017, Invensas reached a settlement with Broadcom and accordingly withdrew the complaint in this action. This matter is now concluded.
Invensas Corp. v. Samsung Electronics Co., Ltd., et al., Provisional Case No. KG/RK 17-1619 (District Court of The Hague, Netherlands)
On September 28, 2017, Invensas filed a writ of summons against Samsung Electronics Co., Ltd., Samsung Electronics Benelux B.V., Samsung Electronics Europe Logistics B.V., Bol.com B.V., and Wehkamp B.V. in the District Court of The Hague, Netherlands. The complaint alleged that the defendants infringe Invensas’ European Patent EP 1 186 034 B1 in the Netherlands, Great Britain, Spain and France, based on the use of infringing Broadcom chips in Samsung products. In December 2017, Invensas reached a settlement with Broadcom and accordingly withdrew the complaint in this action. This matter is now concluded.
33
Tessera Advanced Technologies Inc. vs. Samsung (China) Investment Co., Ltd. et al. Case No. unset (Beijing High Court, People’s Republic of China)
On January 25, 2018, Tessera Advanced Technologies Inc. (“TATI”) filed a complaint against Samsung (China) Investment Co., Ltd., Samsung Electronics Huizhou Co., Ltd. and Beijing Jiu Jiu Shun Fa Technologies Development Co., Ltd. (collectively the “Defendants”) with the Beijing High Court, People’s Republic of China. The complaint alleges that the Defendants infringe TATI’s Chinese Patent No. 02155954.6. The complaint seeks damages; an injunction prohibiting the Defendants from manufacturing, using, offering for sale, and selling infringing products in China; and orders requiring that the Defendants destroy infringing products and semi-finished products in their possession in China, as well as equipment, drawings and other objects and information used to manufacture infringing products.
Patent Office Proceedings
U.S. Patent No. 6,784,557
On January 11, 2018, Samsung Electronics Co., Ltd., Samsung Electronics America, Inc., and Samsung Semiconductor, Inc. (collectively, “Samsung”) filed a petition for inter partes review of U.S. Patent No. 6,784,557 (the “‘557 patent”) with the U.S. Patent and Trademark Office, Patent Trial and Appeal Board (the “PTAB”). The petition requests a determination that claims 1-8 of the ‘557 patent are unpatentable. Tessera Advanced Technologies, Inc.’s preliminary response is due on April 23, 2018.
U.S. Patent No. 6,043,699
On October 31, 2016, Broadcom Corporation filed with the PTAB a petition for inter partes review of U.S. Patent No. 6,043,699 (“the ’699 patent”). The petition requested a determination that claims 1-19 of the ’699 patent are unpatentable. Tessera Advanced Technologies, Inc. filed its preliminary response on February 10, 2017. On May 5, 2017, the PTAB instituted the petition on Claims 1-19. In December 2017, the parties reached a settlement and filed a joint motion to terminate the proceeding. On January 2, 2018, the PTAB granted the joint motion and terminated the proceeding. This matter is now concluded.
U.S. Patent No. 6,046,076
On June 19, 2017, Broadcom Corporation filed with the PTAB a petition for inter partes review of U.S. Patent No. 6,046,076 (“the ’076 patent”). The petition requested a determination that claims 1-4, 6, 10, and 19 of the ’076 patent are unpatentable. In December 2017, the parties reached a settlement and filed a joint motion to terminate the proceeding. On December 28, 2017, the PTAB granted the joint motion and terminated the proceeding. This matter is now concluded.
U.S. Patent No. 6,080,605
On June 19, 2017, Broadcom Corporation filed with the PTAB a petition for inter partes review of U.S. Patent No. 6,080,605 (“the ’605 patent”). The petition requested a determination that claims 1-3 of the ’605 patent are unpatentable. In December 2017, the parties reached a settlement and filed a joint motion to terminate the proceeding. On December 28, 2017, the PTAB granted the joint motion and terminated the proceeding. This matter is now concluded.
U.S. Patent No. 6,218,215
On June 19, 2017, Broadcom Corporation filed with the PTAB a petition for inter partes review of U.S. Patent No. 6,218,215 (“the ’215 patent”). The petition requested a determination that claims 1, 5, 6, 9-10 and 12-13 of the ’215 patent are unpatentable. In December 2017, the parties reached a settlement and filed a joint motion to terminate the proceeding. On December 28, 2017, the PTAB granted the joint motion and terminated the proceeding. This matter is now concluded.
U.S. Patent No. 6,278,653
On October 31, 2016, Broadcom Ltd. filed with the PTAB a petition for inter partes review of U.S. Patent No. 6,278,653 (“the ’653 patent”). The petition requested a determination that claims 1-20 of the ’653 patent are unpatentable. Invensas filed its preliminary response on February 10, 2017. On April 26, 2017, the PTAB instituted the petition on Claims 1-20. In December 2017, the parties reached a settlement and filed a joint motion to terminate the proceeding. On January 5, 2018, the PTAB granted the joint motion and terminated the proceeding. This matter is now concluded.
U.S. Patent No. 6,408,167
On October 4, 2017, Broadcom Ltd. filed with the PTAB a petition for inter partes review of U.S. Patent No. 6,408,167 (“the ’167 patent”). The petition requested a determination that claims 1-5 of the ’167 patent are unpatentable. In December 2017, the parties reached a settlement and filed a joint motion to terminate the proceeding. On December 28, 2017, the PTAB granted the joint motion and terminated the proceeding. This matter is now concluded.
34
U.S. Patent No. 6,573,609
On November 8, 2017, Broadcom Ltd. filed with the PTAB a petition for inter partes review of U.S. Patent No. 6,573,609 (“the ’609 patent”). The petition requested a determination that claims 1-73 of the ’609 patent are unpatentable. In December 2017, the parties reached a settlement and filed a joint motion to terminate the proceeding. On December 28, 2017, the PTAB granted the joint motion and terminated the proceeding. This matter is now concluded.
U.S. Patent No. 6,684,060
On September 29, 2017, DTS, Inc. and Phorus, Inc. filed with the PTAB a petition for inter partes review of Broadcom’s U.S. Patent No. 6,684,060 (“the ’060 patent”). The petition requested a determination that claims 1-29 of the ’060 patent are unpatentable. In December 2017, the parties reached a settlement and filed a joint motion to terminate the proceeding. On December 26, 2017, the PTAB granted the joint motion and terminated the proceeding. This matter is now concluded.
U.S. Patent No. 6,856,007
On May 24, 2017, Broadcom Corporation filed with the PTAB a petition for inter partes review of U.S. Patent No. 6,856,007 (“the ’007 patent”). The petition requested a determination that claims 1, 11-13, 16, 16 and 18 of the ’007 patent are unpatentable. In December 2017, the parties reached a settlement and filed a joint motion to terminate the proceeding. On January 2, 2018, the PTAB granted the joint motion and terminated the proceeding. This matter is now concluded.
U.S. Patent No. 6,954,001
On May 24, 2017, Broadcom Corporation filed with the PTAB a petition for inter partes review of U.S. Patent No. 6,954,001 (“the ’001 patent”). The petition requested a determination that claims 1-18 of the ’001 patent are unpatentable. In December 2017, the parties reached a settlement and filed a joint motion to terminate the proceeding. On January 2, 2018, the PTAB granted the joint motion and terminated the proceeding. This matter is now concluded.
U.S. Patent No. 6,972,480
On October 27, 2017, Avago Technologies U.S. Inc. and Avago Technologies Wireless (U.S.A.) Manufacturing Inc. filed with the PTAB a petition for inter partes review of U.S. Patent No. 6,972,480 (“the ’480 patent”). The petition requested a determination that claims 1-11 of the ’480 patent are unpatentable. In December 2017, the parties reached a settlement and filed a joint motion to terminate the proceeding. On January 5, 2018, the PTAB granted the joint motion and terminated the proceeding. This matter is now concluded.
U.S. Patent No. 7,809,393
On January 20, 2017, Broadcom Ltd. filed with the PTAB a petition for inter partes review of U.S. Patent No. 7,809,393 (“the ’393 patent”). The petition requested a determination that claims 1-20 of the ’393 patent are unpatentable. Tessera Advanced Technologies, Inc. (“TATI”) filed its preliminary response on May 2, 2017. On July 28, 2017, the PTAB instituted the petition on claims 1-3, 5, 6, 8, 10-15, and 17-19. The PTAB denied the petition with respect to claims 4, 7, 9, 16, and 20. In December 2017, the parties reached a settlement and filed a joint motion to terminate the proceeding. On January 2, 2018, the PTAB granted the joint motion and terminated the proceeding. This matter is now concluded.
Item 4. Mine Safety Disclosures
Not applicable.
35
PART II
Item 5. Market for Registrant's Common Equity, Related Stockholder Matters and Issuer Purchases of Equity Securities
Since February 23, 2017, our common stock has traded publicly on The NASDAQ Global Select Market under the symbol “XPER.” Prior to February 23, 2017, our common stock traded publicly on the The NASDAQ Global Select Market under the symbol “TSRA”. The price range per share is the highest and lowest bid prices, as reported by The NASDAQ Global Select Market, on any trading day during the respective quarter.
High | Low | |||||||
Fiscal Year Ended December 31, 2017 | ||||||||
First Quarter (ended March 31, 2017) | $ | 45.80 | $ | 33.70 | ||||
Second Quarter (ended June 30, 2017) | $ | 34.25 | $ | 29.80 | ||||
Third Quarter (ended September 30, 2017) | $ | 33.70 | $ | 24.70 | ||||
Fourth Quarter (ended December 31, 2017) | $ | 27.60 | $ | 17.75 | ||||
High | Low | |||||||
Fiscal Year Ended December 31, 2016 | ||||||||
First Quarter (ended March 31, 2016) | $ | 31.69 | $ | 26.21 | ||||
Second Quarter (ended June 30, 2016) | $ | 33.40 | $ | 28.57 | ||||
Third Quarter (ended September 30, 2016) | $ | 38.88 | $ | 28.91 | ||||
Fourth Quarter (ended December 31, 2016) | $ | 45.58 | $ | 36.28 | ||||
As of February 2, 2018 there were 49,292,756 outstanding shares of common stock held by 23 stockholders of record. In addition, a substantially greater number of stockholders may be "street name" or beneficial holders, whose shares are held of record by banks, brokers and other financial institutions.
In 2017, we paid quarterly dividends of $0.20 per share in each of March, June, September and December. In 2016, we paid quarterly dividends of $0.20 per share in each of March, June, September and November.
We also have historically returned capital to shareholders through stock repurchases. We anticipate that all quarterly dividends and stock repurchases will be paid out of cash, cash equivalents and short-term investments.
36
PERFORMANCE GRAPH
The following graph shows a comparison of total stockholder return for holders of our common stock, the NASDAQ Composite Index, the Philadelphia Stock Exchange Semiconductor Index, a published industry index used in previous filings, and the Russell 2000 Index, a new benchmark index to be used in current and future filings, from December 31, 2012 through December 31, 2017. Following the DTS acquisition in December 2016, our business mix has significantly shifted from predominantly semiconductor packaging and interconnect solutions, to a more diversified portfolio offering. Today, approximately half of our revenue is generated from semiconductor and interconnect solutions and half is generated from audio and imaging technology solutions. Given the fundamental change in our product portfolio, we cannot reasonably identify a published industry or a peer issuer(s) that would appropriately resemble the characteristics of our Company. Pursuant to relevant SEC rules, the Russell 2000 Index is selected as the new benchmark index as the companies included in the index are of similar market capitalizations to ours and our stock is also a component of the index. The graph and table assume that $100 was invested on December 31, 2012 in each of our common stock, the NASDAQ Composite Index, the Philadelphia Stock Exchange Semiconductor Index and the Russell 2000 Index that all dividends were reinvested. This graphic comparison is presented pursuant to the rules of the SEC.
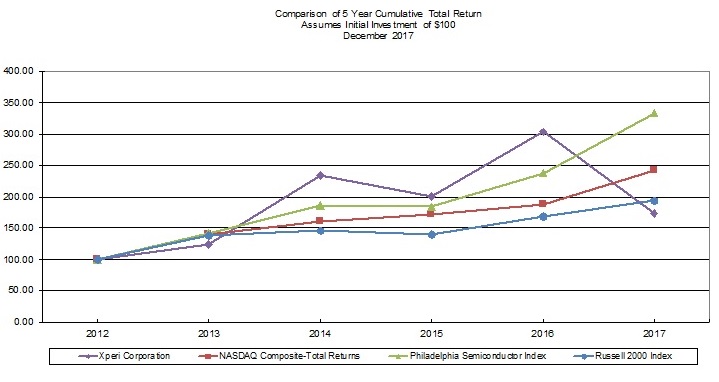
12/12 | 12/13 | 12/14 | 12/15 | 12/16 | 12/17 | ||||||||||||||||||||
Xperi Corporation | $ | 100.00 | $ | 124.24 | $ | 234.31 | $ | 201.08 | $ | 303.62 | $ | 172.60 | |||||||||||||
NASDAQ Composite | $ | 100.00 | $ | 140.12 | $ | 160.78 | $ | 171.97 | $ | 187.22 | $ | 242.71 | |||||||||||||
Philadelphia Semiconductor Index | $ | 100.00 | $ | 141.84 | $ | 186.45 | $ | 183.43 | $ | 237.22 | $ | 333.40 | |||||||||||||
Russell 2000 Index | $ | 100.00 | $ | 138.82 | $ | 145.62 | $ | 139.19 | $ | 168.85 | $ | 193.58 | |||||||||||||
This section is not “soliciting material,” is not deemed “filed” with the SEC and is not incorporated by reference in any filing of the Company under the Securities Act of 1933 or the Securities Exchange Act of 1934 (“Exchange Act”), whether made before or after the date hereof and irrespective of any general incorporation language in any such filing.
STOCK REPURCHASES
The following are our monthly stock repurchases for the fourth quarter of 2017, all of which were made as part of a publicly announced plan.
37
Total number of shares purchased | Average price paid per share | Total number of shares purchased as part of our share repurchase program | Approximate dollar value of shares that may yet be purchased under our share repurchase program (a) | |||||||||
(Shares in thousands) | ||||||||||||
2017 | ||||||||||||
October | — | $ | — | — | ||||||||
November | 269 | 19.86 | 269 | |||||||||
December | — | — | — | |||||||||
Total | 269 | $ | 19.86 | 269 | $142.8 million | |||||||
(a) Calculated as of December 31, 2017. In August 2007, our Board of Directors authorized a plan to repurchase our outstanding shares of common stock dependent on market conditions, share price and other factors. In January 2016, the Board authorized an additional $200.0 million in future repurchases under the plan. No expiration date has been specified for this plan. All repurchases in the three months ended December 31, 2017 were made under this plan.
Item 6. Selected Financial Data
The following selected consolidated financial data should be read in conjunction with “Management’s Discussion and Analysis of Financial Condition and Results of Operations” and our consolidated financial statements and the related notes appearing elsewhere in this Annual Report.
Years Ended December 31, | ||||||||||||||||||||
2017 | 2016 (1) | 2015 | 2014 | 2013 | ||||||||||||||||
(in thousands, except per share data) | ||||||||||||||||||||
Consolidated statements of operations data | ||||||||||||||||||||
Revenue: | ||||||||||||||||||||
Royalty and license fees | $ | 373,732 | $ | 259,565 | $ | 273,300 | $ | 278,807 | $ | 168,811 | ||||||||||
Total revenue | 373,732 | 259,565 | 273,300 | 278,807 | 168,811 | |||||||||||||||
Operating expenses: | ||||||||||||||||||||
Cost of revenue | 6,308 | 551 | 566 | 384 | 178 | |||||||||||||||
Research, development and other related costs | 105,849 | 44,738 | 32,181 | 32,270 | 28,063 | |||||||||||||||
Selling, general and administrative | 144,649 | 72,065 | 43,592 | 47,208 | 62,580 | |||||||||||||||
Amortization expense | 111,930 | 31,870 | 20,624 | 18,471 | 19,269 | |||||||||||||||
Litigation expense | 36,496 | 20,953 | 14,135 | 25,116 | 60,310 | |||||||||||||||
Restructuring, impairment of long-lived assets and other charges and gain on sale of patents | — | — | — | (10,338 | ) | 4,668 | ||||||||||||||
Total operating expenses | 405,232 | 170,177 | 111,098 | 113,111 | 175,068 | |||||||||||||||
Operating income (loss) | (31,500 | ) | 89,388 | 162,202 | 165,696 | (6,257 | ) | |||||||||||||
Interest expense | (28,292 | ) | (2,409 | ) | — | — | — | |||||||||||||
Other income and expense, net | 1,449 | 3,736 | 3,432 | 1,550 | 1,208 | |||||||||||||||
Income (loss) before taxes from continuing operations | (58,343 | ) | 90,715 | 165,634 | 167,246 | (5,049 | ) | |||||||||||||
Provision for (benefit from) income taxes | (1,785 | ) | 34,626 | 48,517 | (7,697 | ) | 35,860 | |||||||||||||
Income (loss) from continuing operations | (56,558 | ) | 56,089 | 117,117 | 174,943 | (40,909 | ) | |||||||||||||
Loss from discontinued operations, net of tax | — | — | (101 | ) | (4,489 | ) | (144,646 | ) | ||||||||||||
Net income (loss) | $ | (56,558 | ) | $ | 56,089 | $ | 117,016 | $ | 170,454 | $ | (185,555 | ) | ||||||||
38
Income (loss) per share: | ||||||||||||||||||||
Income (loss) from continuing operations: | ||||||||||||||||||||
Basic (2) | $ | (1.15 | ) | $ | 1.14 | $ | 2.26 | $ | 3.31 | $ | (0.77 | ) | ||||||||
Diluted (2) | $ | (1.15 | ) | $ | 1.12 | $ | 2.23 | $ | 3.27 | $ | (0.77 | ) | ||||||||
Loss from discontinued operations: | ||||||||||||||||||||
Basic (2) | $ | — | $ | — | $ | — | $ | (0.08 | ) | $ | (2.71 | ) | ||||||||
Diluted (2) | $ | — | $ | — | $ | — | $ | (0.08 | ) | $ | (2.71 | ) | ||||||||
Net income (loss): | ||||||||||||||||||||
Basic (2) | $ | (1.15 | ) | $ | 1.14 | $ | 2.26 | $ | 3.23 | $ | (3.48 | ) | ||||||||
Diluted (2) | $ | (1.15 | ) | $ | 1.12 | $ | 2.23 | $ | 3.18 | $ | (3.48 | ) | ||||||||
Cash dividends declared per share | $ | 0.80 | $ | 0.80 | $ | 0.80 | $ | 0.92 | $ | 0.70 | ||||||||||
Weighted average number of shares used in per share calculation-basic (2) | 49,251 | 49,187 | 51,802 | 52,819 | 53,346 | |||||||||||||||
Weighted average number of shares used in per share calculation-diluted (2) | 49,251 | 50,190 | 52,586 | 53,563 | 53,346 | |||||||||||||||
December 31, | ||||||||||||||||||||
2017 | 2016 | 2015 | 2014 | 2013 | ||||||||||||||||
(in thousands) | ||||||||||||||||||||
Consolidated balance sheets data: | ||||||||||||||||||||
Cash, cash equivalents and short-term investments | $ | 200,692 | $ | 113,005 | $ | 381,744 | $ | 434,421 | $ | 359,587 | ||||||||||
Working capital | $ | 148,695 | $ | 148,924 | $ | 390,880 | $ | 441,484 | $ | 353,822 | ||||||||||
Total assets | $ | 1,110,024 | $ | 1,186,436 | $ | 539,352 | $ | 577,123 | $ | 484,753 | ||||||||||
Debt (3) | $ | 594,000 | $ | 600,000 | $ | — | $ | — | $ | — | ||||||||||
Other long-term liabilities | $ | 32,415 | $ | 50,395 | $ | 3,417 | $ | 1,738 | $ | 5,827 | ||||||||||
Total stockholders’ equity | $ | 435,576 | $ | 507,785 | $ | 515,157 | $ | 541,359 | $ | 440,437 | ||||||||||
(1) The operating expenses for 2016 include one month of operating expenses for DTS and one-time expenses related to the acquisition of DTS such as transaction related costs (e.g. bankers fees, legal fees, consultant fees, etc.), severance costs and stock-based compensation expense resulting from the acceleration of equity instruments for departing executives. Additional amortization expense is also included due to the acquired intangible assets resulting from the DTS acquisition.
(2) See Note 11 of the Notes to Consolidated Financial Statements for an explanation of the methods used to determine the number of shares used to compute per share amounts.
(3) Includes both the short-term and long-term portions of debt principal and excludes approximately $14.3 million and $16.8 million in debt issuance costs as of December 31, 2017 and December 31, 2016, respectively.
Item 7. Management’s Discussion and Analysis of Financial Condition and Results of Operations
The following discussion (presented in thousands, except for percentages) should be read in conjunction with our consolidated financial statements and notes thereto.
Business Overview
Xperi is a publicly-traded technology company with headquarters in Silicon Valley and operations around the world. Through its operating subsidiaries, Xperi creates, develops and licenses innovative audio, imaging, semiconductor packaging and interconnect technologies. We have approximately 700 employees and over 25 years of operating experience.
We license our innovative products, technologies and inventions to global electronics companies who, in turn, integrate the technologies into their own consumer electronics and semiconductor products. Our technologies and inventions are widely adopted and used every day by millions of people. Our audio technologies have shipped in billions of devices for the home, mobile and automotive markets. Our imaging technologies are embedded in more than 25% of the current smartphones. Our
39
semiconductor packaging and interconnect technologies have been licensed to more than 100 customers and have shipped in over 100 billion semiconductor chips.
We completed the acquisition of DTS in December 2016. At the time of the acquisition, Tessera Technologies, Inc. and DTS were combined under the newly-formed Tessera Holding Corporation. During the first quarter of 2017, we introduced our new corporate name, Xperi Corporation, launched a new corporate logo, and began trading under a new ticker symbol XPER.
Results of Operations
Significant events occurred over the past three years that affect the comparability of our financial statements. Key events and their financial impacts include the following:
• | On December 18, 2017, we entered into agreements with Broadcom Ltd. and certain of its affiliates (“Broadcom”), customers, and suppliers to settle and dismiss all pending litigation matters. In conjunction with the settlement, Broadcom entered into a new multi-year patent license agreement with us. The settlement had a material impact on our financial results in 2017. |
• | In February 2017, we announced that we were seeking to relicense Samsung Electronics, whose patent license had expired at the end of 2016. Samsung was a significant customer in 2016 and before. The expiration of Samsung’s license agreement had a material impact on our financial results in 2017. |
• | On December 1, 2016, we completed our acquisition of DTS, Inc. ("DTS"). We incurred significant one-time expenses in the fourth quarter of 2016 related to this acquisition such as transaction costs (e.g. bankers fees, legal fees, consultant fees, etc.), severance costs and stock-based compensation expense resulting from the acceleration of equity instruments for departing executives. Additionally, our amortization expense increased significantly due to the acquired intangible assets resulting from the DTS acquisition. |
Under generally accepted accounting principles regarding business combinations, we were unable to record $51.6 million in revenue in the year ended December 31, 2017, which would have been recognized by DTS if not for the acquisition. If allowed, this revenue would have had a significant impact on the operating results as described below.
Revenue
Our revenue is generated primarily from royalty and license fees. Royalty and license fees are generated from licensing the right to use our technologies or intellectual property. Licensees generally report shipment information 30 to 60 days after the end of the quarter in which such activity takes place. We generally have recognized royalty revenue on a one quarter lag since it is more reliable than estimating our royalty revenue prior to obtaining these reports from the licensees. This practice will no longer be accepted under the new accounting guidance effective January 1, 2018. See Note 3 - “Recent Accounting Pronouncements” in Notes to Consolidated Financial Statements. The timing of revenue recognition and the amount of revenue actually recognized for each type of revenue depends upon a variety of factors, including the specific terms of each arrangement, our ability to derive fair value of each element and the nature of our deliverables and obligations. In addition, our royalty revenue will fluctuate based on a number of factors such as: (a) the timing of receipt of royalty reports; (b) the rate of adoption and incorporation of our technology by licensees; (c) the demand for products incorporating semiconductors that use our licensed technology; (d) the cyclicality of supply and demand for products using our licensed technology; (e) volume incentive pricing terms in licensing agreements that may result in significant variability in quarterly revenue recognition from customers; and (f) the impact of economic downturns.
From time to time we enter into license agreements that have fixed expiration dates. Upon expiration of such agreements, we need to renew or replace these agreements in order to maintain our revenue base. We may not be able to continue licensing customers on terms favorable to us, under the existing terms or at all, which would harm our results of operations.
In the past, we have engaged in litigation and arbitration proceedings to directly or indirectly enforce our intellectual property rights and the terms of our license agreements, including proceedings to ensure proper and full payment of royalties by our current licensees and by third parties whose products incorporate our intellectual property rights.
The following table presents our historical operating results for the periods indicated as a percentage of revenue:
40
Years ended December 31, | ||||||||
2017 | 2016 | 2015 | ||||||
Revenue: | ||||||||
Royalty and license fees | 100 | % | 100 | % | 100 | % | ||
Total Revenue | 100 | 100 | 100 | |||||
Operating expenses: | ||||||||
Cost of revenue | 1 | — | — | |||||
Research, development and other related costs | 28 | 18 | 12 | |||||
Selling, general and administrative | 39 | 28 | 16 | |||||
Amortization expense | 30 | 12 | 8 | |||||
Litigation expense | 10 | 8 | 5 | |||||
Total operating expenses | 108 | 66 | 41 | |||||
Operating income (loss) from continuing operations | (8 | ) | 34 | 59 | ||||
Interest expense | (8 | ) | (1 | ) | — | |||
Other income and expense, net | — | 2 | 1 | |||||
Income (loss) from continuing operations before taxes | (16 | ) | 35 | 60 | ||||
Provision for (benefit from) income taxes | (1 | ) | 13 | 17 | ||||
Income (loss) from continuing operations | (15 | ) | 22 | 43 | ||||
Loss from discontinued operations, net of tax | — | — | — | |||||
Net income (loss) | (15 | )% | 22 | % | 43 | % | ||
Fiscal Year 2017 and 2016
The following table sets forth our revenue by year (in thousands, except for percentages):
Years Ended December 31, | ||||||||||||||
2017 | 2016 | Increase/ (Decrease) | % Change | |||||||||||
Royalty and license fees | $ | 373,732 | $ | 259,565 | $ | 114,167 | 44 | % | ||||||
The $114.2 million or 44% increase in revenue was due to our acquisition of DTS in December 2016, offset by a reduction in licensing revenue resulting from the expiration of our patent license agreement with Samsung. This reduction in licensing revenue was partially offset by revenue from the new patent license agreement with Broadcom in the fourth quarter of 2017. The majority of per-unit royalties reported by DTS licensees in the first quarter of 2017, which are associated with fourth quarter 2016 shipments by these licensees, as well as minimum guarantee fees from DTS licensees for contracts entered into prior to the December 1, 2016 acquisition, were not recorded as revenue in 2017, as under business combination accounting guidance the earnings process was deemed to have been completed prior to the acquisition.
With changes in revenue recognition due to the adoption of ASC 606, Revenue From Contracts With Customers, in 2018, we anticipate our revenue for 2018 will be significantly lower than that for 2017 due principally to our inability to record further billings as revenue in 2018 and later periods from minimum guarantee and fixed fee licensing contracts in place prior to the start of 2018. This accounting change will not impact billings or the cash flow from these contracts. Furthermore, we may experience greater variability in quarterly and annual revenue in future periods as a result of the revenue accounting treatment applied to future minimum guarantee and fixed fee licensing contracts. Management plans to place greater emphasis on billings and cash flows rather than revenue and net operating results to internally evaluate our financial performance in future periods.
Cost of Revenue
Cost of revenue consists of royalties paid to third parties and direct compensation and related expenses to provide non-recurring engineering services. Cost of revenue for the year ended December 31, 2017 was $6.3 million, as compared to $0.6
41
million for the year ended December 31, 2016. The increase was a result of royalties paid to third parties in connection with audio revenue from the acquired DTS business.
Research, Development and Other Related Costs
Research and development targets development of audio and image enhancement technologies, chip-scale and multi-chip packaging, circuitry design, 3D-IC architectures, wafer-level packaging technology, bonding technologies and machine learning. Research, development and other related costs include expenses associated with applications engineering necessary to port and integrate our technologies and products on third party silicon and into end devices. These costs consist primarily of compensation and related costs for personnel, engineering consulting expenses associated with new product and technology development, product commercialization, quality assurance and testing costs, as well as costs related to patent applications and examinations, product "tear downs" and reverse engineering, materials, supplies and equipment depreciation. All research, development and other related costs are expensed as incurred.
Research, development and other related costs for the year ended December 31, 2017 were $105.8 million, as compared to $44.7 million for the year ended December 31, 2016, an increase of $61.1 million or 137%. The increase was primarily related to a $43.2 million increase in personnel related expenses, a $6.2 million increase in stock-based compensation and a $5.0 million increase in outside services. These increases are a direct result of adding over 230 engineers as part of the acquisition of DTS in December 2016.
Selling, General and Administrative
Selling expenses consist primarily of compensation and related costs for sales and marketing personnel engaged in sales and licensee support, reverse engineering personnel and services, marketing programs, public relations, promotional materials, travel, trade show expenses, and stock-based compensation expense. General and administrative expenses consist primarily of compensation and related costs for general management, information technology, finance personnel, legal fees and expenses, facilities costs, stock-based compensation expense, and professional services. Our general and administrative expenses, other than facilities related expenses, are not allocated to other expense line items.
Selling, general and administrative expenses for the year ended December 31, 2017 were $144.6 million, as compared to $72.1 million for the year ended December 31, 2016, an increase of $72.5 million or 101%. The increase was primarily attributable to an increase of $42.2 million in personnel related expenses, a $2.1 million increase in outside services, a $6.2 million increase in stock-based compensation, a $3.8 million increase in travel and other expenses, a $4.6 million increase in depreciation and a $4.1 million increase in materials and supplies. These increases are a direct result of adding over 185 selling, general and administrative personnel as part of the acquisition of DTS in December 2016. Additionally, marketing expenses increased $8.0 million due primarily to greater participation in product marketing conferences, one-time expenses related to the branding of our new company name, and marketing initiatives and campaigns we undertook in 2017.
Amortization Expense
Amortization expense for the year ended December 31, 2017 was $111.9 million, as compared to $31.9 million for the year ended December 31, 2016, an increase of $80.0 million. This increase was primarily attributable to intangible assets recorded in connection with the DTS acquisition in the fourth quarter of 2016.
We anticipate that amortization expenses will continue to be a significant expense since we acquired approximately $479 million in intangible assets from the acquisition of DTS and other acquisition activity in 2016, which will be amortized over the next several years. See Note 9 - "Goodwill and Identifiable Intangible Assets" in Notes to Consolidated Financial Statements for additional information.
Litigation Expense
Litigation expense for the year ended December 31, 2017 was $36.5 million, as compared to $21.0 million for the year ended December 31, 2016, an increase of $15.5 million, or 74%. This increase was primarily related to our legal proceedings with Broadcom and our new proceedings filed against Samsung, as well as reflecting an offset to litigation expense of $5.0 million in 2016 due to an insurance settlement which refunded certain litigation costs incurred in prior years.
We expect that litigation expense may continue to be a material portion of our operating expenses in future periods, and may fluctuate between periods, because of planned or ongoing litigation, as described in Part I, Item 3 - “Legal Proceedings,” and
42
because of litigation planned for or initiated from time to time in the future in order to enforce and protect our intellectual property and contract rights.
Upon expiration of the current terms of our customers’ licenses, if those licenses are not renewed, litigation may become a necessary element of an effort to secure payment of reasonable royalties for the use of our patented technology. If we initiate such litigation, our future litigation expenses may increase.
Stock-based Compensation Expense
The following table sets forth our stock-based compensation expense for the years ended December 31, 2017 and 2016 (in thousands):
Years Ended December 31, | |||||||
2017 | 2016 | ||||||
Research, development and other related costs | 13,277 | 7,104 | |||||
Selling, general and administrative | 20,185 | 13,997 | |||||
Total stock-based compensation expense | $ | 33,462 | $ | 21,101 | |||
Stock-based compensation awards included employee stock options, restricted stock awards and units, and employee stock purchases. For the year ended December 31, 2017, stock-based compensation expense was $33.5 million, of which $2.0 million related to employee stock options, $28.9 million related to restricted stock awards and units and $2.6 million related to employee stock purchases. For the year ended December 31, 2016, stock-based compensation expense was $21.1 million, of which $3.3 million related to employee stock options, $17.0 million related to restricted stock awards and units and $0.8 million related to employee stock purchases. The increase in stock-based compensation expense in 2017 compared to 2016 primarily resulted from increased awards issued and headcount due to our acquisition of DTS.
Future stock-based compensation expense will vary due to volatility in our stock price, number and type of stock awards granted and timing of modifications to stock awards, if any.
Interest Expense
Interest expense for the year ended December 31, 2017 was $28.3 million, as compared to $2.4 million for the year ended December 31, 2016. We incurred a full year of interest expense in 2017 on the debt issued December 1, 2016 in connection with the acquisition of DTS, Inc.
As disclosed in Note 18 - “Subsequent Events” in Notes to Consolidated Financial Statements, we completed a successful repricing of our debt subsequent to year-end, reducing the borrowing rate by 75 basis points, and we paid down $100 million in principal balance. We currently expect interest expense on the debt to decrease in 2018 as compared to 2017 as a result of this repricing and principal pay down.
Other Income and Expense, Net
Other income and expense, net, for the year ended December 31, 2017 was $1.4 million, as compared to $3.7 million for the year ended December 31, 2016. Other income was higher in 2016 due to interest income earned on higher cash and investment balances.
Provision for (benefit from) Income Taxes
On December 22, 2017, the Tax Act was signed into law. The Tax Act introduced a broad range of tax reform measures that significantly change the federal income tax laws. The provisions of the Tax Act that may have significant impact on us include the permanent reduction of the corporate income tax rate from 35% to 21% effective for tax years including or commencing on January 1, 2018, one-time transition tax on post-1986 foreign unremitted earnings, provision for global intangible low-taxed income (“GILTI”), deduction for foreign-derived intangible income (“FDII”), repeal of corporate alternative minimum tax, limitation of various business deductions, modification of the maximum deduction of net operating loss with no carryback but indefinite carryforward provision, and limitation on the deductibility of executive compensation. Many provisions in the Tax Act are generally effective in tax years beginning after December 31, 2017.
At December 31, 2017, we have reflected the provisional income tax effects of the Tax Act under Accounting Standards Codification Topic 740, Income Taxes. We have recorded a provisional tax expense in the Statement of Operations of
43
approximately $5.6 million, comprised of approximately $13.5 million of tax expense from recording additional valuation allowance against federal tax credits due to certain provisions of the Tax Act, offset by approximately $7.9 million of tax benefit from the remeasurement of U.S. deferred taxes using the relevant tax rate at which we expect them to reverse in the future. The estimated one-time transition tax on post-1986 foreign unremitted earnings should not have a material impact to our effective tax rate and tax liability.
We continue to examine the impact of certain provisions of the Tax Act that will become applicable in calendar year 2018 related to base erosion anti-abuse tax (“BEAT”), GILTI, deduction for FDII, and other provisions that could affect our effective tax rate in the future. Also, because there may be additional state income tax implications, we will continue to monitor changes in state and local tax laws to determine if state and local taxing authorities intend to conform or deviate from changes to U.S. federal tax legislation as a result of the Tax Act. The prospects of supplemental legislation or regulatory processes to address questions that arise because of the Tax Act, or evolving technical interpretations of the tax law, may cause the final impact from the Tax Act to differ from the provisional recorded amounts. We expect to complete our analysis within the measurement period allowed by Staff Accounting Bulletin (“SAB”) No.118, no later than the fourth quarter of calendar year 2018.
The provision for income taxes for the year ended December 31, 2017 of $1.8 million tax benefit is primarily related to losses generated from foreign operations, and tax benefit from the remeasurement of deferred taxes from the federal tax rate reduction, offset by tax expense from recording a valuation allowance against federal tax credits as a result of the Tax Act, foreign withholding taxes net of foreign tax credits, non-deductible stock-based compensation expense and other non-deductible expenses.
The provision for income taxes for the year ended December 31, 2016 of $34.6 million was primarily related to tax liability generated from U.S. and foreign operations, non-deductible acquisition costs, non-deductible stock-based compensation expense and foreign withholding taxes net of foreign tax credits. The change from income tax expense to income tax benefit for the year ended December 31, 2017 as compared to the prior year is largely attributable to a decrease in U.S. and foreign profitability for the current period.
Fiscal Year 2016 and 2015
The following table sets forth our revenue by year (in thousands, except for percentages):
Years Ended December 31, | ||||||||||||||||
2016 | 2015 | % Change | ||||||||||||||
Royalty and license fees | $ | 259,565 | $ | 273,300 | $ | (13,735 | ) | (5 | )% | |||||||
The $13.7 million or 5% decrease in revenue was due to a decrease in episodic revenue of $15.2 million which was partially offset by an increase in recurring revenue of $1.5 million for the year ended December 31, 2016 compared to the year ended December 31, 2015. Recurring revenue was up $1.5 million primarily due to the timing of revenue related to contractual arrangements for certain customers. The episodic revenue decrease was primarily the result of a $27.0 million episodic payment made by ASE in the first quarter of 2015.
Cost of Revenue
Cost of revenue for the years ended December 31, 2016 and 2015 was $0.6 million for each period.
Research, Development and Other Related Costs
Research, development and other related costs for the year ended December 31, 2016 were $44.7 million, as compared to $32.2 million for the year ended December 31, 2015, an increase of $12.5 million. The increase was primarily related to a $5.9 million increase in personnel related expenses, $3.2 million increase in stock-based compensation and a $1.8 million increase in outside services. These increases result from a higher research and development headcount as we remain committed to expanding into new technologies and from engineers acquired in the DTS acquisition.
Selling, General and Administrative
Selling, general and administrative expenses for the year ended December 31, 2016 were $72.1 million, as compared to $43.6 million for the year ended December 31, 2015, an increase of $28.5 million, or 65%. The increase was primarily attributable to
44
an increase of $11.4 million in outside services resulting from our acquisition of DTS. Additionally, the increase reflects $6.8 million of additional stock-based compensation and $4.7 million in personnel related expenses, both related to increased headcount related to the acquisition of DTS. Stock based compensation was also higher due to the acceleration in charges related to the acquisition. These increases were partially offset by a decrease in legal costs of $0.6 million.
Amortization Expense
Amortization expense for the year ended December 31, 2016 was $31.9 million, as compared to $20.6 million for the year ended December 31, 2015, an increase of $11.3 million. This increase was primarily attributable to intangible assets recorded in connection with the DTS acquisition and the purchase of certain other intangible assets in the fourth quarter of 2016.
Litigation Expense
Litigation expense for the year ended December 31, 2016 was $21.0 million, as compared to $14.1 million for the year ended December 31, 2015, an increase of $6.9 million, or 48%. We incurred $26.0 million in litigation expense during 2016 but we also recorded an offset to litigation expense of $5.0 million due to an insurance settlement which reimbursed us for certain litigation costs incurred in prior years. Without this insurance settlement, our litigation expense would have increased $11.9 million as a result of the filing of the legal proceedings against Broadcom.
Stock-based Compensation Expense
The following table sets forth our stock-based compensation expense for the years ended December 31, 2016 and 2015 (in thousands):
Years Ended December 31, | |||||||||||
2016 | 2015 | ||||||||||
Research, development and other related costs | $ | 7,104 | $ | 4,005 | |||||||
Selling, general and administrative | 13,997 | 7,512 | |||||||||
Total stock-based compensation expense | $ | 21,101 | $ | 11,517 | |||||||
Stock-based compensation awards included employee stock options, restricted stock awards and units, and employee stock purchases. For the year ended December 31, 2016, stock-based compensation expense was $21.1 million, of which $3.3 million related to employee stock options, $17.0 million related to restricted stock awards and units and $0.8 million related to employee stock purchases. For the year ended December 31, 2015, stock-based compensation expense was $11.5 million, of which $2.7 million related to employee stock options, $8.2 million related to restricted stock awards and units and $0.6 million related to employee stock purchases. The increase in stock-based compensation expense in 2016 compared to 2015 primarily resulted from the acceleration of the vesting of equity instruments and the assumption of certain awards which were both due to the acquisition of DTS. Additionally, the increase in stock-based compensation resulted from a decrease in forfeiture rates due to reduced employee turnover as compared to prior periods as the value of new grants per year has remained relatively consistent with prior years.
Interest Expense and Other Income and Expense, Net
Other income and expense, net for the year ended December 31, 2016 was $1.3 million, as compared to $3.4 million, for the year ended December 31, 2015. This decrease primarily resulted from $2.4 million in interest expense related to the addition of $600 million in debt financing we incurred on December 1, 2016 as part of the DTS acquisition.
Provision for (benefit from) Income Taxes
The provision for income taxes for the year ended December 31, 2016 of $34.6 million is primarily related to tax liability generated from U.S. and foreign operations, non-deductible acquisition costs, non-deductible stock-based compensation expense and foreign withholding taxes offset by tax credits. The provision for income taxes for the year ended December 31, 2015 of $48.5 million was primarily due to tax liability generated from U.S. and foreign operations, and foreign withholding taxes, offset by the benefit from the release of valuation allowance primarily related to Ireland deferred tax assets. The decrease in income tax expense for the year ended December 31, 2016 as compared to the prior year is largely attributable to a decrease in profits for the current period.
45
In 2015, we released valuation allowance primarily related to our Ireland deferred tax assets. The need for a valuation allowance requires an assessment of both positive and negative evidence when determining whether it is more likely than not that deferred tax assets are recoverable. Such assessment is required on a jurisdiction-by-jurisdiction basis. In making such assessment, significant weight is given to evidence that can be objectively verified. After considering both positive and negative evidence to assess the recoverability of our net deferred tax assets during the year 2015, we have determined that it is more likely than not we would realize certain other deferred tax assets (primarily related to Ireland deferred tax assets) given the timing of profits and forecasted profitability in succeeding years.
Segment Operating Results
We operate in two reportable segments: (1) Product Licensing and (2) Semiconductor and IP Licensing. There are certain corporate overhead costs that are not allocated to these reportable segments because these operating amounts are not considered in evaluating the operating performance of our business segments.
The Chief Executive Officer is also the Chief Operating Decision Maker (“CODM”) as defined by the authoritative guidance on segment reporting.
The Product Licensing segment, including our DTS and FotoNation subsidiaries, licenses its technologies and intellectual property related to audio, digital radio and imaging solutions under the brands DTS, HD Radio and FotoNation. The Product Licensing solutions typically include the delivery of software or hardware-based solutions, combined with various other intellectual property, including know how, patents, trademarks, and copyrights. Product Licensing represents revenue derived primarily from the consumer electronics market and related applications servicing the home, automotive and mobile segments.
The Semiconductor and IP Licensing segment develops and licenses semiconductor technologies and IP to manufacturers, foundries, subcontract assemblers and others. The segment includes revenue generated from the technology and IP portfolios of Tessera, Inc., Invensas and Invensas Bonding Technologies, Inc. (formally Ziptronix, Inc.). Tessera, Inc. pioneered chip-scale packaging solutions. Invensas develops advanced semiconductor packaging and 3D interconnect solutions, including wafer bonding solutions, for applications such as smartphones, tablets, laptops, PCs, data centers and automobiles. We expand our technology and IP offerings in this segment through a combination of internal R&D and acquisitions. We also provide engineering services to customers in the form of technology demonstrations and technology transfers to assist their evaluation and adoption of our technologies. Through our technology transfer service, we provide detailed documentation outlining design guidelines, process specifications, recommended equipment and process parameters as well as hands-on engineering support to assist our licensees in bringing up and qualifying our technologies at their facilities. This service allows licensees to readily leverage our years of experience and expertise in direct and hybrid bonding.
We do not identify or allocate assets by reportable segment, nor does the CODM evaluate reportable segments using discrete asset information. Reportable segments do not record inter-segment revenue and accordingly there are none to report. Although the CODM uses operating income to evaluate reportable segments, operating costs included in one segment may benefit other segments.
The following table sets forth our segment revenue, operating expenses and operating income for the years ended December 31, 2017, 2016 and 2015 (in thousands):
46
Years Ended December 31, | ||||||||||||||
2017 | 2016 | 2015 | ||||||||||||
Revenue: | ||||||||||||||
Product licensing segment | $ | 167,923 | $ | 30,499 | $ | 31,335 | ||||||||
Semiconductor and IP licensing segment | 205,809 | 229,066 | 241,965 | |||||||||||
Total revenue | 373,732 | 259,565 | 273,300 | |||||||||||
Operating expenses: | ||||||||||||||
Product licensing segment | 172,745 | 25,299 | 11,191 | |||||||||||
Semiconductor and IP licensing segment | 87,838 | 72,812 | 56,315 | |||||||||||
Unallocated operating expenses (1) | 144,649 | 72,066 | (2) | 43,592 | ||||||||||
Total operating expenses | 405,232 | 170,177 | 111,098 | |||||||||||
Operating income: | ||||||||||||||
Product licensing segment | (4,822 | ) | 5,200 | 20,144 | ||||||||||
Semiconductor and IP licensing segment | 117,971 | 156,254 | 185,650 | |||||||||||
Unallocated operating expenses (1) | (144,649 | ) | (72,066 | ) | (43,592 | ) | ||||||||
Total operating income | $ | (31,500 | ) | $ | 89,388 | $ | 162,202 | |||||||
(1) Unallocated operating expenses consist primarily of general and administrative expenses, such as administration, human resources, finance, information technology, corporate development and procurement. These expenses are not allocated because it is not practical to do so.
(2) Includes approximately $23.9 million in one-time expenses incurred by both segments related to the DTS acquisition.
For the year ended December 31, 2017, the unallocated expenses were $144.6 million compared to $72.1 million for the year ended December 31, 2016. The increase of $72.5 million was primarily attributable to higher general and administrative personnel expenses that resulted from the acquisition of DTS. For the year ended December 31, 2016, the unallocated expenses were $72.1 million compared to $43.6 million for the year ended December 31, 2015. The increase of $28.5 million from the year ended December 31, 2015 was mainly attributable to one-time transaction costs associated with the DTS acquisition, the operating costs of the DTS business since the acquisition on December 1, 2016 and increased stock-based compensation related to stock awards assumed in the DTS acquisition.
The revenue and operating income amounts in this section have been presented on a basis consistent with GAAP applied at the segment level. Of our $385.6 million in goodwill at December 31, 2017, approximately $377.9 million is allocated to our Product Licensing segment and approximately $7.7 million is allocated to our Semiconductor and IP Licensing segment.
Product Licensing Segment
Fiscal Year 2017 and 2016
47
Years Ended December 31, | |||||||||||
2017 | 2016 | ||||||||||
(in thousands) | |||||||||||
Revenue: | |||||||||||
Royalty and license fees (1) | $ | 167,923 | $ | 30,499 | |||||||
Total revenue | 167,923 | 30,499 | |||||||||
Operating expenses: | |||||||||||
Cost of revenues | 6,308 | 551 | |||||||||
Research, development and other related costs | 75,809 | 16,091 | |||||||||
Litigation | 288 | — | |||||||||
Amortization | 90,340 | 8,657 | |||||||||
Total operating expenses (2) | 172,745 | 25,299 | |||||||||
Total operating income | $ | (4,822 | ) | $ | 5,200 | ||||||
(1) Includes $0.1 million for 2016, which is not part of current segment operations.
(2) Excludes operating expenses which are not allocated on a segment basis.
Under generally accepted accounting principles regarding business combinations, we were unable to record $51.6 million in revenue in the Product Licensing segment during the year ended December 31, 2017, which would have been recognized by DTS if not for the acquisition. If allowed, this revenue would have had a significant impact on the operating results as described below.
Product Licensing segment revenue for the year ended December 31, 2017 was $167.9 million as compared to $30.5 million for the year ended December 31, 2016, an increase of $137.4 million. The increase was due to revenue from licenses added through the DTS acquisition. Upon adoption of ASC 606, we anticipate Product Licensing revenue for 2018 may be materially impacted due principally to our inability to record further billings as revenue in 2018 and later periods from minimum guarantee and fixed fee licensing contracts in place prior to the start of 2018. Further, we expect greater variability in quarterly and annual revenue in our Product Licensing segment in future periods as a result of the revenue accounting treatment applied to future minimum guarantee and fixed fee licensing contracts.
Operating expenses for the year ended December 31, 2017 were $172.7 million and consisted of cost of revenue of $6.3 million, research, development and other related costs of $75.8 million, litigation costs of $0.3 million and amortization costs of $90.3 million. The increase of $147.4 million in total operating expenses as compared to $25.3 million for the year ended December 31, 2016 was due to the acquisition of DTS. The increases were largely related to personnel-related costs including salary and benefits and stock-based compensation from the increased headcount, as well as an increase of $81.7 million in amortization due to the $479 million of intangible assets acquired in in the fourth quarter of 2016.
The operating loss in the year ended December 31, 2017 was $4.8 million compared to operating income of $5.2 million in the year ended December 31, 2016, due to the reasons stated above, in particular the amortization of intangible assets recorded in connection with the DTS acquisition, as well as the inability to record $51.6 million of revenue under purchase accounting guidance.
Fiscal Year 2016 and 2015
48
Years Ended December 31, | |||||||||||
2016 | 2015 | ||||||||||
(in thousands) | |||||||||||
Revenue: | |||||||||||
Royalty and license fees (1) | $ | 30,499 | $ | 31,335 | |||||||
Total revenue | 30,499 | 31,335 | |||||||||
Operating expenses: | |||||||||||
Cost of revenues | 551 | 566 | |||||||||
Research, development and other related costs | 16,091 | 9,443 | |||||||||
Amortization | 8,657 | 1,182 | |||||||||
Total operating expenses (2) | 25,299 | 11,191 | |||||||||
Total operating income | $ | 5,200 | $ | 20,144 | |||||||
(1) Includes $0.1 million and $1.3 million for 2016 and 2015, respectively, which are not part of current segment operations.
(2) Excludes operating expenses which are not allocated on a segment basis.
Product Licensing revenue for the year ended December 31, 2016 were $30.5 million as compared to $31.3 million for the year ended December 31, 2015, a decrease of $0.8 million. The decrease was primarily due to a contractual limit on royalties for a significant customer.
Operating expenses for the year ended December 31, 2016 were $25.3 million and consisted of cost of revenue of $0.6 million, research, development and other related costs of $16.1 million and amortization costs of $8.7 million. The increase of $14.1 million in total operating expenses as compared to $11.2 million for the year ended December 31, 2015 consisted of increases which relate primarily to the acquisition of DTS. Included in the expenses for 2016 are personnel-related costs including salary and benefits from DTS personnel, increased stock-based compensation resulting from stock awards assumed in the DTS acquisition and increased amortization resulting from the $479 million of intangible assets acquired.
Operating income for the years ended December 31, 2016 and 2015 was $5.2 million and $20.1 million, respectively, which represented a decrease of $14.9 million, for the reasons stated above.
Semiconductor and IP Licensing Segment
Fiscal Year 2017 and 2016
Years Ended December 31, | |||||||||||
2017 | 2016 | ||||||||||
(in thousands) | |||||||||||
Revenue: | |||||||||||
Royalty and license fees | $ | 205,809 | $ | 229,066 | |||||||
Total revenue | 205,809 | 229,066 | |||||||||
Operating expenses: | |||||||||||
Research, development and other related costs | 30,039 | 28,647 | |||||||||
Litigation | 36,209 | 20,953 | |||||||||
Amortization | 21,590 | 23,212 | |||||||||
Total operating expenses (1) | 87,838 | 72,812 | |||||||||
Total operating income | $ | 117,971 | $ | 156,254 | |||||||
(1) Excludes operating expenses which are not allocated on a segment basis.
Semiconductor and IP Licensing segment revenue for the year ended December 31, 2017 was $205.8 million as compared to $229.1 million for the year ended December 31, 2016, a decrease of $23.3 million. The decrease was related to the expiration
49
of our patent license agreement with Samsung, which was partially offset by revenue from the new patent license agreement with Broadcom in the fourth quarter of 2017. Upon adoption of ASC 606, we anticipate Semiconductor and IP Licensing revenue for 2018 will be significantly lower than that for 2017 due principally to our inability to record further billings as revenue in 2018 and later periods from minimum guarantee and fixed fees licensing contracts in place prior to the start of 2018. Further, we expect greater variability in quarterly and annual revenue in our Semiconductor and IP Licensing segment in future periods as a result of the revenue accounting treatment applied to future minimum guarantee and fixed fee licensing contracts, which will necessitate recognizing revenue in the quarter a contract first becomes effective.
Operating expenses for the year ended December 31, 2017 were $87.8 million and consisted of research, development and other related costs of $30.0 million, litigation costs of $36.2 million and amortization costs of $21.6 million. The increase of $15.0 million in total operating expenses as compared to $72.8 million for the year ended December 31, 2016, resulted primarily from higher litigation costs as a result of the legal proceedings against Broadcom and Samsung, and from decreased litigation costs in the third quarter of 2016 reflecting an insurance settlement payment of $5.0 million that we received in 2016.
We expect that litigation expense will continue to be a material portion of the Semiconductor and IP Licensing segment’s operating expenses in future periods, and may fluctuate significantly in some periods, because of our ongoing legal actions, as described in Part I, Item 3 -Legal Proceedings, and because we may become involved in other litigation from time to time in the future in order to enforce and protect our intellectual property and contract rights.
Operating income for the years ended December 31, 2017 and 2016 were $118.0 million and $156.3 million, respectively, which represented a decrease of $38.3 million, for the reasons stated above.
Fiscal Year 2016 and 2015
Years Ended December 31, | |||||||||||
2016 | 2015 | ||||||||||
(in thousands) | |||||||||||
Revenue: | |||||||||||
Royalty and license fees | $ | 229,066 | $ | 241,965 | |||||||
Total revenue | 229,066 | 241,965 | |||||||||
Operating expenses: | |||||||||||
Research, development and other related costs | 28,647 | 22,738 | |||||||||
Litigation | 20,953 | 14,135 | |||||||||
Amortization | 23,212 | 19,442 | |||||||||
Total operating expenses (1) | 72,812 | 56,315 | |||||||||
Total operating income | $ | 156,254 | $ | 185,650 | |||||||
(1) Excludes operating expenses which are not allocated on a segment basis.
Semiconductor and IP Licensing segment revenue for the year ended December 31, 2016 was $229.1 million as compared to $242.0 million for the year ended December 31, 2015, a decrease of $12.9 million. The decrease in revenue was due to a decrease in episodic revenue of $15.2 million which was partially offset by an increase in recurring revenue of $1.5 million for the year ended December 31, 2016 compared to the year ended December 31, 2015. The episodic revenue decrease was primarily the result of a $27.0 million episodic payment made by ASE in the first quarter of 2015.
Operating expenses for the year ended December 31, 2016 were $72.8 million and consisted of research, development and other related costs of $28.6 million, litigation costs of $21.0 million and amortization costs of $23.2 million. The increase of $16.5 million in total operating expenses as compared to $56.3 million for the year ended December 31, 2015 consisted of increases from a higher research and development headcount as we remain committed to expanding into new technologies, higher litigation costs as a result of the filing of the legal proceedings against Broadcom, and higher amortization costs which resulted from the purchase of patent assets during 2016 and the latter half of 2015.
Operating income for the years ended December 31, 2016 and 2015 was $156.3 million and $185.7 million, respectively, which represented a decrease of $29.4 million, for the reasons stated above.
Net Operating Losses and Tax Credit Carryforwards
50
As of December 31, 2017, we had federal net operating loss carryforwards of approximately $32.7 million and state net operating loss carryforwards of approximately $95.4 million. Substantially all of the federal net operating loss carryforwards are carried over from acquired entities, DTS in 2016 and Ziptronix in 2015. The state net operating loss carryforwards are carried over from acquired entities, DTS in 2016, Ziptronix in 2015, and Siimpel Corporation in 2010. The federal net operating loss carryforwards, if not utilized, will begin to expire on various dates beginning in 2026, and will continue to expire through 2034. The state net operating loss carryforwards, if not utilized, will begin to expire on various dates beginning in 2018, and will continue to expire through 2036. In addition, we have research tax credit carryforwards of approximately $10.0 million for federal purposes which were generated in the current year and carried over from DTS and Ziptronix. The federal research tax credit will start to expire in 2018 and will continue to expire through 2037. We also have research tax credit carryforwards of approximately $14.5 million for state purposes and $0.6 million for foreign purposes, which will never expire. We have $19.8 million of foreign tax credit carryforwards which will begin to expire in 2018 and will continue to expire through 2027. Under the provisions of the Internal Revenue Code, substantial changes in our or our subsidiaries' ownership may limit the amount of net operating loss and tax credit carryforwards that can be utilized annually in the future to offset taxable income. In addition, the Tax Act modifies the maximum deduction of net operating loss, eliminates carryback, and provides for indefinite carryforward for losses generated after December 31, 2017.
The need for a valuation allowance requires an assessment of both positive and negative evidence when determining whether it is more likely than not that deferred tax assets are recoverable; such assessment is required on a jurisdiction-by-jurisdiction basis. In making such assessment, significant weight is given to evidence that can be objectively verified. The new provisions in the Tax Act resulted in provisional tax amounts and related valuation allowance recorded against our federal tax credits based on currently available information and interpretations which are continuing to evolve.
Tax Effect from Stock Options
On January 1, 2017, we adopted Accounting Standards Update No. 2016-09 ("ASU 2016-09") and as a result, we recorded a credit of $0.8 million, tax-effected, to retained earnings due to the realization of unrealized excess tax benefits. ASU 2016-09 requires any excess tax benefit to be recorded as a tax benefit in the Statement of Operations. The net tax benefit from our employee stock option plan as of December 31, 2017 is $5.5 million, comprised of $1.4 million of current period excess tax benefit and $4.1 million tax benefit from our employee stock option plan. The excess tax benefit from our employee stock option plan for the year ended December 31, 2016 was $2.5 million.
Liquidity and Capital Resources
December 31, | |||||||||||
(in thousands, except for percentages) | 2017 | 2016 | 2015 | ||||||||
Cash and cash equivalents | $ | 138,260 | $ | 65,626 | $ | 22,599 | |||||
Short-term investments | 62,432 | 47,379 | 359,145 | ||||||||
Total cash, cash equivalents and short-term investments | $ | 200,692 | $ | 113,005 | $ | 381,744 | |||||
Percentage of total assets | 18 | % | 10 | % | 71 | % | |||||
Years Ended December 31, | |||||||||||
2017 | 2016 | 2015 | |||||||||
Net cash from operating activities | $ | 147,265 | $ | 153,860 | $ | 147,276 | |||||
Net cash from investing activities | $ | (18,844 | ) | $ | (592,396 | ) | $ | (21,286 | ) | ||
Net cash from financing activities | $ | (55,787 | ) | $ | 481,563 | $ | (154,299 | ) | |||
Our primary sources of liquidity and capital resources are our operating profits and our investment portfolio. Cash, cash equivalents and short-term investments were $200.7 million at December 31, 2017, an increase of $87.7 million from $113.0 million at December 31, 2016. Cash and cash equivalents were $138.3 million at December 31, 2017, an increase of $72.7 million from $65.6 million at December 31, 2016. The increase resulted from $147.3 million in cash from operations and from $9.0 million in proceeds from the exercise of stock options and employee stock purchases. This increase was partially offset by $39.5 million in dividends paid, $19.3 million in repurchases of common stock, $6.0 million in debt principal payments and $18.8 million used in investing activities.
Cash flows provided by operations were $147.3 million for the year ended December 31, 2017, primarily due to our net loss of $56.6 million being adjusted for non-cash items of depreciation of $7.2 million, amortization of intangible assets of $111.9
51
million, stock-based compensation expense of $33.5 million and $65.7 million in changes in operating assets and liabilities. These increases were partially offset by $18.3 million in deferred income taxes and other.
Cash flows provided by operations were $153.9 million for the year ended December 31, 2016, primarily due to our net income of $56.1 million being adjusted for non-cash items of amortization of intangible assets of $31.9 million, stock-based compensation expense of $21.1 million, and $30.6 million in changes in operating assets and liabilities.
Cash flows provided by operations were $147.3 million for the year ended December 31, 2015, primarily due to net income of $117.0 million, adjusted for non-cash items of deferred income tax of $18.8 million, depreciation and amortization of $22.2 million and stock-based compensation expense of $11.5 million, partially offset by changes in operating assets and liabilities of $20.3 million.
Net cash used in investing activities was $18.8 million for the year ended December 31, 2017, primarily related to the purchases of available-for-sale securities of $33.1 million and $3.3 million in capital expenditures offset by maturities and sales of short-term investments of $17.5 million.
Net cash used in investing activities was $592.4 million for the year ended December 31, 2016, resulting from $888.2 million in net cash used to acquire DTS and $161.6 million in short-term investment purchases. These uses were partially offset by $470.8 million in the sales and maturities of short-term investments.
Net cash used in investing activities was $21.3 million for the year ended December 31, 2015, primarily related to the purchases of short-term investments of $298.8 million, the acquisition of Ziptronix, Inc. for $38.6 million and the purchase of $7.6 million in intangible assets, offset by maturities and sales of short-term investments of $324.7 million.
Net cash used in financing activities was $55.8 million for the year ended December 31, 2017 principally due to dividend payments of $39.5 million, $19.3 million in repurchases of common stock and $6.0 million in debt repayments, offset by $9.0 million in proceeds from the issuance of common stock under our employee stock option programs and employee stock purchase plans.
Net cash provided by financing activities was $481.6 million for the year ended December 31, 2016 due to $583.0 million in proceeds (net of debt issuance costs) from debt financing and $8.3 million in proceeds from the issuance of common stock under our employee stock option programs and employee stock purchase plans. These increases were partially offset by stock repurchases of $70.6 million and dividend payments of $39.2 million.
Net cash used in financing activities was $154.3 million for the year ended December 31, 2015 due to stock repurchases of $123.3 million and dividend payments of $41.7 million, offset by $10.7 million in proceeds from the issuance of common stock under our employee stock option programs and employee stock purchase plans.
The primary objectives of our investment activities are to preserve principal and to maintain liquidity while at the same time capturing a market rate of return. To achieve these objectives, we maintain a diversified portfolio of debt securities including corporate bonds and notes, municipal bonds and notes, commercial paper, treasury and agency notes and bills, certificates of deposit and money market funds. We invest excess cash predominantly in high-quality investment grade debt securities with less than three years to maturity. Our marketable securities are classified as available-for-sale and are reported at fair value, with unrealized gains and losses, net of tax, recorded in accumulated other comprehensive income. The fair values for our securities are determined based on quoted market prices as of the valuation date and observable prices for similar assets.
We evaluate our investments periodically for possible other-than-temporary impairment and review factors such as the length of time and extent to which fair value has been below cost basis, the financial condition of the issuer, our ability and intent to hold the security until maturity on a more likely than not basis. If declines in the fair value of the investments are determined to be other-than-temporary, we report the credit loss portion of such decline in other income and expense, on a net basis, and the remaining noncredit loss portion in accumulated other comprehensive income. For the years ended December 31, 2017, 2016 and 2015, no impairment charges with respect to our investments were recorded.
On December 1, 2016, we entered into a Credit Agreement which provides for a $600 million seven-year term B loan facility. The Term B Loan Facility matures on November 30, 2023. Upon the closing of the Credit Agreement, we borrowed $600 million under the Term B Loan facility. These proceeds were used on December 1, 2016, together with cash and cash equivalents, to finance the acquisition of DTS. The obligations under the Credit Agreement are guaranteed by substantially all of our assets pursuant to the Security Agreement, dated December 1, 2016, among us, Royal Bank of Canada, as collateral agent, and the other pledgors party thereto. At December 31, 2017, $594 million was outstanding with an interest rate, including amortization of debt issuance costs, of 5.0%. Interest is payable quarterly. We have future minimum principal
52
payments for our debt of $6.0 million annually through 2022 with the remaining principal balance due in 2023. Additional principal payments may be required under the terms of the original note based on year-end debt ratios and cash flow generated from operations. For the year ended December 31, 2017, we were obligated to pay $34.5 million from 2017 excess cash flow within 95 days of the fiscal year-end.
As disclosed in Note 18 - “Subsequent Events” in Notes to Consolidated Financial Statements, we completed a successful repricing of our debt in January 2018, reducing the borrowing rate by 75 basis points, and paid down $100 million in principal balance. As a result of this voluntary pay-down, no further principal payments are required based on our fiscal year 2017 excess cash flow.
In August 2007, our Board of Directors ("the Board") authorized a plan to repurchase our outstanding shares of common stock dependent on market conditions, share price and other factors. In January 2016, the Board authorized an additional $200 million in future repurchases under the plan, and as of December 31, 2017, the total amount available for repurchase under the plan was $142.8 million. No expiration has been specified for this plan. Since the inception of the plan, and through December 31, 2017, we have repurchased approximately 11.1 million shares of common stock at a total cost of $307.2 million at an average price of $27.57. We plan to continue to execute authorized repurchases from time to time under the plan, although we decreased share repurchases during 2017 as compared to 2016, as we accumulated cash to pay down the indebtedness incurred to finance the DTS acquisition.
In 2015, we paid quarterly dividends of $0.20 per share in each of March, May, August and December. In 2016, we paid quarterly dividends of $0.20 per share in each of March, June, September and November. In 2017, we paid quarterly dividends of $0.20 per share in each of March, June, September and December.
We believe that based on current levels of operations and anticipated growth, our cash from operations, together with cash, cash equivalents and short-term investments currently available, will be sufficient to fund our operations, debt service, dividends and stock repurchases and acquisition needs for at least the next twelve months. Poor financial results, unanticipated expenses, unanticipated acquisitions of technologies or businesses or unanticipated strategic investments could give rise to additional financing requirements sooner than we expect. There can be no assurance that equity or debt financing will be available when needed or, if available, that such financing will be on terms satisfactory to us and not dilutive to our then-current stockholders.
Contractual Cash Obligations
Payments Due by Period | |||||||||||||||||||
Total | Less than 1 Year | 1-3 Years | 4-5 Years | Thereafter | |||||||||||||||
(In thousands) | |||||||||||||||||||
Debt (1) | $ | 594,000 | $ | 34,451 | $ | 12,000 | $ | 12,000 | $ | 535,549 | |||||||||
Operating lease obligations | $ | 30,470 | $ | 6,261 | $ | 10,412 | $ | 6,029 | $ | 7,768 | |||||||||
(1) Under our debt agreement, our debt bears a variable interest rate. See Note 10 -- "Debt" and Note 18 -- “Subsequent Events” of the Notes to Consolidated Financial Statements for additional detail.
Under certain contractual arrangements, we may be obligated to pay up to approximately $3.0 million over an estimated period of approximately two years if certain milestones are achieved.
The amounts reflected in the table above for operating lease obligations represent aggregate future minimum lease payments under non-cancelable facility and equipment operating leases. For our facilities leases, rent expense charged to operations differs from rent paid because of scheduled rent increases. Rent expense is calculated by amortizing total rental payments on a straight-line basis over the lease term.
As of December 31, 2017, we had accrued $14.7 million of unrecognized tax benefits in long term income taxes payable related to uncertain tax positions and accrued approximately $0.6 million of interest. At this time, we are unable to reasonably estimate the timing of the long-term payments or the amount by which the liability will increase or decrease over time. As a result, this amount is not included in the table above.
See Note 15 – "Commitments and Contingencies" of the Notes to Consolidated Financial Statements for additional detail.
Off-Balance Sheet Arrangements
53
As of December 31, 2017, we did not have any off-balance sheet arrangements as defined in item 303(a)(4)(ii) of Regulation S-K.
Critical Accounting Policies and Estimates
Management’s discussion and analysis of our financial condition and results of operations are based upon our consolidated financial statements. These financial statements have been prepared in conformity with generally accepted accounting principles (“GAAP”) in the United States which requires us to make estimates and judgments that affect the reported amounts of assets, liabilities, revenue and expenses, and related disclosure of contingent assets and liabilities. By their nature, these estimates and judgments are subject to an inherent degree of uncertainty. We evaluate our estimates based on our historical experience and various other assumptions that are believed to be reasonable under the circumstances. These estimates relate to revenue recognition, the assessment of recoverability of goodwill and intangible assets, the valuation and recognition of stock-based compensation expense, the valuation of investments, business combinations, recognition and measurement of deferred income tax assets and liabilities, the assessment of unrecognized tax benefits, and others. Actual results could differ from those estimates, and material effects on our operating results and financial position may result.
We believe the following accounting policies and estimates are most critical to the understanding of our consolidated financial statements. See Note 2 - “Summary of Significant Accounting Policies” of the Notes to Consolidated Financial Statements for a full description of our accounting policies.
Revenue recognition
We derive our revenue from royalty and license fees. Revenue is recognized when there is persuasive evidence of an arrangement, delivery has occurred, the fee is fixed or determinable, and collectability of the resulting receivable is reasonably assured. Determining whether and when these criteria have been satisfied requires us to make assumptions and judgments which could have a significant impact on the timing and amount of revenue we report. We make estimates and judgments when determining whether the collectability of license fees receivable from licensees is reasonably assured. If it is determined that collection is not reasonably assured, the revenue is recognized when collectibility becomes reasonably assured, assuming all other revenue recognition criteria have been met, which is generally upon receipt of cash. Management estimates regarding collectability impact the actual revenue recognized each period and the timing of the recognition of revenue. Our assumptions and judgments regarding future collectability could differ from actual events, thus materially impacting our consolidated financial statements.
We will adopt ASC 606 in fiscal year 2018, which is expected to have a significant impact on revenue recognition associated with our licensing contracts with customers. Refer to Note 3 - "Recent Accounting Pronouncements" of the Notes to Consolidated Financial Statements for a detailed discussion.
Valuation of goodwill and intangible assets
We make judgments about the recoverability of intangible assets whenever events or changes in circumstances indicate that impairment may exist. If such facts and circumstances exist, we assess recoverability by comparing the projected undiscounted net cash flows associated with the related asset or group of assets over their remaining lives against their respective carrying amounts. Impairments, if any, are based on the excess of the carrying amount over the fair value of those assets. If the useful life is shorter than originally estimated, we accelerate the rate of amortization and amortize the remaining carrying value over the new shorter useful life. Such changes could result in impairment charges or higher amortization expense in future periods, which could have a significant impact on our operating results and financial condition.
We perform an annual review of the valuation of goodwill in the fourth quarter, or more often if indicators of impairment exist. Triggering events for impairment reviews may be indicators such as adverse industry or economic trends, restructuring actions, lower projections of profitability, or a sustained decline in our market capitalization. Evaluations of possible impairment and, if applicable, adjustments to carrying values require us to estimate, among other factors, future cash flows, useful lives, and fair market values of our reporting units and assets. When we conduct our evaluation of goodwill, the fair value of goodwill is assessed using valuation techniques that require significant management estimates and judgment. Should conditions be different from management’s last assessment, significant impairments of goodwill may be required, which would adversely affect our operating results.
Stock-based compensation expense
54
Calculating stock-based compensation expense requires the input of highly subjective assumptions, including the expected life of the options, stock price volatility, dividends and the pre-vesting option forfeiture rate. We estimate the expected life of options granted based on historical exercise patterns, which we believe are representative of future behavior. We estimate the volatility of our common stock on the date of grant based on a market-based historical volatility. The assumptions used in calculating the fair value of stock-based awards represent our best estimates, but these estimates involve inherent uncertainties and the application of management judgment. As a result, if factors change and we use different assumptions, our stock-based compensation expense could be materially different in the future. In addition, we are required to estimate the expected forfeiture rate and only recognize expense for those shares expected to vest. We estimate the forfeiture rate based on historical experience of our stock-based awards that are granted, exercised and canceled. If our actual forfeiture rate is materially different from our estimate, stock-based compensation expense could be significantly different from what we have recorded in the current period. See Note 13 - “Stock-Based Compensation Expense” of the Notes to Consolidated Financial Statements for additional detail.
Valuation of investments
Our investments consist primarily of municipal bonds and notes, corporate bonds and notes, commercial paper, treasury and agency notes and bills, certificates of deposit and money market funds. We invest excess cash predominantly in high-quality investment grade marketable securities with less than three years to maturity. Our marketable securities are classified as available-for-sale and are reported at fair value, with unrealized gains and losses, net of tax, recorded in accumulated other comprehensive income (loss). Realized gains and losses, unrealized losses and declines in value determined to be other-than-temporary, if any, on available-for-sale securities are generally reported in other income and expense, net. The fair values for our securities are determined based on quoted market prices as of the valuation date, observable prices for similar assets and, in the event that observable prices for similar assets are not available, externally provided pricing models, discounted cash flow methodologies or other similar techniques. The determination of fair value when quoted market prices are not available requires significant judgment and estimation. In addition, we evaluate the investments periodically for possible other-than-temporary impairment and review factors such as the length of time and extent to which fair value has been below cost basis, the financial condition of the issuer, our intent to hold and whether we will not be required to sell the security before its anticipated recovery, on a more-likely-than-not basis. If any of these conditions and estimates change in the future, or, if different estimates are used, the fair value of the investments may change significantly and may result in other-than-temporary decline in value which could have an adverse impact on our results of operations.
Business combinations
The fair value valuation of assets acquired and liabilities assumed in a business combination under ASC 805 requires management to make significant estimates and assumptions. Critical estimates in determining the fair value of certain intangible assets include, but are not limited to: future expected cash flows from customer contracts, customer lists, and acquired developed technologies and patents; expected costs to develop in-process research and development (IPR&D)
into commercially viable products and estimating cash flows from projects when completed; brand awareness and market position, as well as assumptions about the period of time the brand will continue to be used in our product portfolio; and discount rates. For additional information, refer to Note 8 --“Business Combinations” of the Notes to Consolidated Financial Statements.
Accounting for income taxes
We must make certain estimates and judgments in determining income tax expense for financial statement purposes. These estimates and judgments are used in the calculation of tax credits, tax benefits and deductions, and in the calculation of tax assets and liabilities. Significant changes to these estimates may result in an increase or decrease to our tax provision in a subsequent period.
We must assess the likelihood that we will be able to recover our deferred tax assets. If recovery is not likely on a more-likely-than-not basis, we must increase our provision for income taxes by recording a valuation allowance against our deferred tax assets. Should there be a change in our ability to recover our deferred tax assets, our provision for income taxes would fluctuate in the period of the change.
In addition, the calculation of our tax liabilities involves dealing with uncertainties in the application of complex tax regulations. We recognize liabilities for anticipated tax audit issues in the U.S. and other tax jurisdictions based on our estimate of whether, and the extent to which, additional tax payments are probable. If we ultimately determine that payment of these
55
amounts is unnecessary, we reverse the liability and recognize a tax benefit during the period in which we determine that the liability is no longer necessary. This may occur for a variety of reasons, such as the expiration of the statute of limitations on a particular tax return or the completion of an examination by the relevant tax authority. We record an additional charge in our provision for taxes in the period in which we determine that the recorded tax liability is less than the expected ultimate assessment.
On December 22, 2017, the Tax Act was signed into law. Several key tax provisions in the legislation will affect us. We are required to recognize the effect of the tax law changes in the period of enactment, such as determining the transition tax, remeasuring our U.S. deferred tax assets and liabilities, and reassessing the net realizability of our deferred tax assets and liabilities. In December 2017, the SEC staff issued Staff Accounting Bulletin No. 118, Income Tax Accounting Implications of the Tax Cuts and Jobs Act (SAB 118), which allows us to record provisional amounts during a measurement period not to extend beyond one year of the enactment date. As the Tax Act was passed late in the fourth quarter of 2017, and ongoing guidance and accounting interpretation are expected over the next 12 months, we consider the accounting of the transition tax, deferred tax re-measurements, and other items to be provisional, and possibly subject to material change in the future. We expect to complete our analysis within the measurement period in accordance with SAB 118.
We account for uncertain tax positions in accordance with authoritative guidance related to income taxes. The application of income tax law is inherently complex. Laws and regulations in this area are voluminous, frequently changing and are often ambiguous. As such, we are required to make many subjective assumptions and judgments regarding our income tax exposures. Interpretations and guidance surrounding income tax laws and regulations are subject to change over time. As such, changes in our assumptions and judgments can materially affect amounts recognized in the consolidated balance sheets and statements of operations.
Our policy is to classify accrued interest and penalties related to the accrued liability for unrecognized tax benefits in the provision for income taxes. For the years ended December 31, 2017, 2016 and 2015, we did not recognize any significant penalties or interest related to unrecognized tax benefits. See Note 14 -“Income Taxes” of the Notes to Consolidated Financial Statements for additional detail.
Recent Accounting Pronouncements
See Note 3 – “Recent Accounting Pronouncements” of the Notes to Consolidated Financial Statements for a full description of recent accounting pronouncements including the respective expected dates of adoption.
Item 7A. Quantitative and Qualitative Disclosures About Market Risk
The primary objectives of our investment activities are to preserve principal and maintain liquidity while at the same time capturing a market rate of return. To achieve these objectives, we maintain our portfolio of cash, cash equivalents and investments in a variety of securities, which are subject to risks including:
Interest Rate Risk
Our interest rate risk relates primarily to interest expense on our debt and interest income from investments. As of December 31, 2017, a one percentage point change in interest rates on our debt throughout a one-year period would have an annual effect of approximately $6.0 million on our income before income taxes. Our interest income is sensitive to changes in the general level of US interest rates, particularly since a significant portion of our investments were, and may in the future be, in short-term marketable securities, U.S. government securities and corporate bonds. As of December 31, 2017, a one percentage point change in interest rates for our cash and investments throughout a one-year period would have an annual effect of approximately $2.0 million on our income before income taxes.
Investment Risk
We are exposed to market risk as it relates to changes in the market value of our investments in addition to the liquidity and credit worthiness of the underlying issuers of our investments. Our investments are subject to fluctuations in fair value due to the volatility of the credit markets and prevailing interest rates for such securities. Our marketable securities, consisting primarily of municipal bonds and notes, corporate bonds and notes, commercial paper, treasury and agency notes and bills, certificates of deposit and money market funds, are classified as available-for-sale securities with fair values of $62.4 million and $47.4 million as of December 31, 2017 and 2016, respectively. Unrealized losses, net of tax, on these investments were approximately $0.3 million and $0.1 million as of December 31, 2017 and 2016, respectively. We do not hold any derivative, derivative commodity instruments or other similar financial instruments in our portfolio.
56
Bank Liquidity Risk
As of December 31, 2017, we have approximately $106.4 million of cash in operating accounts that are held with domestic and international financial institutions. A majority of these balances are held with domestic financial institutions. These cash balances could be lost or become inaccessible if the underlying financial institutions fail or if they are unable to meet the liquidity requirements of their depositors and they are not supported by the federal government. We have not incurred any losses and have had full access to our operating accounts to date. We believe any failures of domestic and international financial institutions could impact our ability to fund our operations in the short term.
Exchange Rate Risk
During the year ended December 31, 2017, we derived approximately 55% of our revenue from sales outside the U.S. and we maintain research and development, sales, marketing, or business development offices in many foreign countries. Our results could be negatively affected by factors such as changes in foreign currency exchange rates, trade protection measures, longer accounts receivable collection patterns, and changes in regional or worldwide economic or political conditions. The risks from our international operations are mitigated in part by the extent to which our revenue is denominated in US dollars and, accordingly, we are not exposed to significant foreign currency risk on these items. We have limited foreign currency risk on certain revenue and operating expenses such as salaries and overhead costs of our foreign operations and a small amount of cash maintained by these operations. Revenue denominated in foreign currencies was not material during 2017, and the operating expenses for our foreign subsidiaries were not significant so a 10% fluctuation in exchange rates would not create a material impact on our business.
Our international business is subject to risks, including, but not limited to, differing economic conditions, changes in political climate, differing tax structures, other regulations and restrictions, and foreign exchange rate volatility when compared to the U.S. dollar. Accordingly, our future results could be materially impacted by changes in these or other factors.
We are also affected by exchange rate fluctuations as the financial statements of our foreign subsidiaries are translated into U.S. dollars in consolidation. As exchange rates vary, these results, when translated, may vary from expectations and could adversely or positively impact overall profitability. During 2017, the impact of foreign exchange rate fluctuations related to translation of our foreign subsidiaries' financial statements was immaterial to our consolidated financial statements.
Item 8. Financial Statements and Supplementary Data
Our consolidated balance sheets as of December 31, 2017 and 2016, and the related consolidated statements of operations, stockholders’ equity, comprehensive income (loss) and cash flows for each of the years in the three-year period ended December 31, 2017 are set forth in this Annual Report at Item 15(a)(1).
SELECTED QUARTERLY FINANCIAL INFORMATION (UNAUDITED)
The following table presents our unaudited quarterly results of operations for the eight quarters in the periods ended December 31, 2017 and 2016.
The following table should be read in conjunction with the consolidated financial statements and related notes contained elsewhere in this Annual Report. We have prepared the unaudited information on the same basis as our audited consolidated financial statements. This table includes all adjustments, consisting only of normal recurring adjustments, that we consider necessary for fair statement of our financial position and operating results for the quarters presented. Operating results for any quarter are not necessarily indicative of results for any future quarters or for a full year. We employ a calendar month-end reporting period for our quarterly reporting.
57
Three Months Ended | ||||||||||||||||||||||||||||||||
Mar 31, 2016 | Jun 30, 2016 | Sep 30, 2016 | Dec 31, 2016 (1) | Mar 31, 2017 | Jun 30, 2017 | Sep 30, 2017 | Dec 31, 2017 | |||||||||||||||||||||||||
(in thousands, except per share amounts) | ||||||||||||||||||||||||||||||||
Revenue: | ||||||||||||||||||||||||||||||||
Royalty and license fees | $ | 59,977 | $ | 67,020 | $ | 62,433 | $ | 70,135 | $ | 67,255 | $ | 91,322 | $ | 88,508 | $ | 126,647 | ||||||||||||||||
Total Revenue | 59,977 | 67,020 | 62,433 | 70,135 | 67,255 | 91,322 | 88,508 | 126,647 | ||||||||||||||||||||||||
Operating expenses: | ||||||||||||||||||||||||||||||||
Cost of revenue | 87 | 52 | 99 | 313 | 1,400 | 1,303 | 1,667 | 1,938 | ||||||||||||||||||||||||
Research, development and other related costs | 10,069 | 10,306 | 8,622 | 15,740 | 26,012 | 26,313 | 25,840 | 27,684 | ||||||||||||||||||||||||
Selling, general and administrative | 11,094 | 11,166 | 12,491 | 37,315 | 41,205 | 33,003 | 33,995 | 36,446 | ||||||||||||||||||||||||
Amortization expense | 6,022 | 6,052 | 6,052 | 13,744 | 28,555 | 28,151 | 27,769 | 27,455 | ||||||||||||||||||||||||
Litigation expense | 6,550 | 5,292 | 580 | 8,531 | 9,978 | 8,226 | 9,163 | 9,129 | ||||||||||||||||||||||||
Total operating expenses | 33,822 | 32,868 | 27,844 | 75,643 | 107,150 | 96,996 | 98,434 | 102,652 | ||||||||||||||||||||||||
Operating income (loss) | 26,155 | 34,152 | 34,589 | (5,508 | ) | (39,895 | ) | (5,674 | ) | (9,926 | ) | 23,995 | ||||||||||||||||||||
Interest expense | — | — | — | (2,409 | ) | (6,459 | ) | (7,046 | ) | (7,371 | ) | (7,416 | ) | |||||||||||||||||||
Other income and expense, net | 807 | 802 | 864 | 1,264 | 46 | 220 | 739 | 444 | ||||||||||||||||||||||||
Income (loss) before taxes | 26,962 | 34,954 | 35,453 | (6,653 | ) | (46,308 | ) | (12,500 | ) | (16,558 | ) | 17,023 | ||||||||||||||||||||
Provision for (benefit from) income taxes | 8,872 | 11,471 | 11,634 | 2,649 | (35,279 | ) | 26,557 | (4,442 | ) | 11,379 | ||||||||||||||||||||||
Net income (loss) | $ | 18,090 | $ | 23,483 | $ | 23,819 | $ | (9,302 | ) | $ | (11,029 | ) | $ | (39,057 | ) | $ | (12,116 | ) | $ | 5,644 | ||||||||||||
Earnings (loss) per share: | ||||||||||||||||||||||||||||||||
Basic | $ | 0.36 | $ | 0.48 | $ | 0.49 | $ | (0.19 | ) | $ | (0.22 | ) | $ | (0.79 | ) | $ | (0.24 | ) | $ | 0.11 | ||||||||||||
Diluted | $ | 0.36 | $ | 0.48 | $ | 0.48 | $ | (0.19 | ) | $ | (0.22 | ) | $ | (0.79 | ) | $ | (0.24 | ) | $ | 0.11 | ||||||||||||
Cash dividends declared per share | $ | 0.20 | $ | 0.20 | $ | 0.20 | $ | 0.20 | $ | 0.20 | $ | 0.20 | $ | 0.20 | $ | 0.20 | ||||||||||||||||
Weighted average number of shares used in per share calculations-basic | 49,998 | 48,836 | 48,545 | 48,603 | 49,139 | 49,475 | 49,469 | 49,217 | ||||||||||||||||||||||||
Weighted average number of shares used in per share calculations-diluted | 50,566 | 49,420 | 49,304 | 48,603 | 49,139 | 49,475 | 49,469 | 49,638 | ||||||||||||||||||||||||
(1) | Three months ended December 31, 2016 include one month of financial results of DTS following the acquisition as well as related one-time acquisition costs. All periods subsequent to December 2016 include financial results from DTS post-acquisition. |
Other Supplementary Data
The following table presents our quarterly unaudited non-GAAP financial measures for the eight quarters in the periods ended December 31, 2017 and 2016. The non-GAAP financial measures adjust for non-cash acquired intangibles, amortization charges, merger-related costs, all forms of stock-based compensation expense, restructuring, impairment of long-lived assets and other charges and related tax effects of the aforementioned adjustments. The non-GAAP financial measures also exclude the effects of FASB Accounting Standards Codification Topic 718 – Stock Compensation upon the number of diluted shares used in calculating non-GAAP earnings per share. We believe that the non-GAAP measures used in this report provide investors with important perspectives into our ongoing business performance. Our management uses these non-GAAP financial measures when evaluating our operating performance. The non-GAAP financial measures disclosed by us should not be considered a substitute for, or superior to, financial measures calculated in accordance with GAAP, and the financial results calculated in accordance with GAAP and reconciliations to those financial statements should be carefully evaluated. The non-GAAP financial measures used by us may be calculated differently from, and therefore may not be comparable to, similarly titled measures used by other companies.
58
Three Months Ended | ||||||||||||||||||||||||||||||||
Mar 31, 2016 | Jun 30, 2016 | Sep 30, 2016 | Dec 31, 2016 | Mar 31, 2017 | Jun 30, 2017 | Sep 30, 2017 | Dec 31, 2017 | |||||||||||||||||||||||||
(in thousands, except per share amounts) | ||||||||||||||||||||||||||||||||
GAAP net income (loss) | $ | 18,090 | $ | 23,483 | $ | 23,819 | $ | (9,302 | ) | $ | (11,029 | ) | $ | (39,057 | ) | $ | (12,116 | ) | $ | 5,644 | ||||||||||||
Adjustments to GAAP net income (loss): | ||||||||||||||||||||||||||||||||
Stock-based compensation expense: | ||||||||||||||||||||||||||||||||
Research, development and other related costs | 1,384 | 1,487 | 1,192 | 3,042 | 2,697 | 3,437 | 3,290 | 3,853 | ||||||||||||||||||||||||
Selling, general and administrative | 2,256 | 2,441 | 2,281 | 7,019 | 4,364 | 5,087 | 5,086 | 5,648 | ||||||||||||||||||||||||
Amortization of acquired intangibles: | 6,022 | 6,052 | 6,052 | 13,744 | 28,555 | 28,151 | 27,769 | 27,455 | ||||||||||||||||||||||||
Insurance settlement | — | — | (5,000 | ) | — | — | — | — | — | |||||||||||||||||||||||
M&A transaction costs | — | — | 1,761 | 9,339 | 1,871 | (34 | ) | — | — | |||||||||||||||||||||||
Severance from DTS acquisition | ||||||||||||||||||||||||||||||||
Research, development and other related costs | — | — | — | 1,379 | 49 | 175 | — | 510 | ||||||||||||||||||||||||
Selling, general and administrative | — | — | — | 4,716 | 481 | (193 | ) | — | 350 | |||||||||||||||||||||||
Post acquisition retention bonus to DTS employees | ||||||||||||||||||||||||||||||||
Research, development and other related costs | — | — | — | 255 | 869 | 785 | 838 | 883 | ||||||||||||||||||||||||
Selling, general and administrative | — | — | — | 986 | 2,753 | 2,781 | 2,809 | 2,785 | ||||||||||||||||||||||||
Tax adjustments for non-GAAP items | (3,180 | ) | (3,275 | ) | (1,482 | ) | (7,837 | ) | (33,808 | ) | 17,835 | (11,760 | ) | (7,051 | ) | |||||||||||||||||
Non-GAAP net income (loss) | $ | 24,572 | $ | 30,188 | $ | 28,623 | $ | 23,341 | $ | (3,198 | ) | $ | 18,967 | $ | 15,916 | $ | 40,077 | |||||||||||||||
Non-GAAP net income (loss) per share-diluted | $ | 0.48 | $ | 0.60 | $ | 0.57 | $ | 0.45 | $ | (0.07 | ) | # | $ | 0.36 | $ | 0.30 | $ | 0.77 | ||||||||||||||
Weighted average number of shares used in per share calculation-diluted* | 51,590 | 50,665 | 50,339 | 51,321 | 49,139 | # | 52,427 | 52,794 | 52,344 | |||||||||||||||||||||||
* | Non-GAAP diluted shares are based on the GAAP diluted shares adjusted for stock-based compensation expense and tax effect. |
# | Basic shares and loss per share - basic were presented in the three months ended March 31, 2017 as we had a non-GAAP net loss. |
The following table presents our revenue as recurring and episodic revenue, consistent with how management reviews our quarterly revenue:
Mar 31, 2016 | Jun 30, 2016 | Sep 30, 2016 | Dec 31, 2016 | Mar 31, 2017 | Jun 30, 2017 | Sep 30, 2017 | Dec 31, 2017 | ||||||||||||||||||||||||
Revenue: | |||||||||||||||||||||||||||||||
Recurring revenue | $ | 54,591 | $ | 66,720 | $ | 62,433 | $ | 60,035 | $ | 63,505 | $ | 91,322 | $ | 88,508 | $ | 90,574 | |||||||||||||||
Episodic revenue | 5,386 | 300 | — | 10,100 | 3,750 | — | — | 36,073 | |||||||||||||||||||||||
Total revenue | $ | 59,977 | $ | 67,020 | $ | 62,433 | $ | 70,135 | $ | 67,255 | $ | 91,322 | $ | 88,508 | $ | 126,647 | |||||||||||||||
We define recurring revenue as payments made pursuant to a license agreement or other agreement that is scheduled to occur over at least one year of time. We define episodic revenue as non-recurring since it is not payable over at least one year pursuant to a contract. Episodic revenue includes non-recurring items such as engineering fees, initial license fees, back payments resulting from audits, damages awards from courts or other tribunals, and lump sum settlement payments. Although the royalty revenue reported by our licensees on a quarterly basis is generally not assured, for ease of reference, we refer to this revenue as “recurring revenue.”
We believe that presenting episodic and recurring revenue information provides both management and investors with a more complete understanding of underlying operating results and trends of established, ongoing operations, as well as results due to unique items that can obscure underlying trends. Management recognizes that the term “episodic revenue” may be interpreted differently by other companies and may not be applicable under different circumstances. We believe that these measures are useful in assessing trends of the respective business and may therefore be a useful tool in assessing period-to-period performance trends.
Importantly, a source of episodic revenue may become a source of recurring revenue, when, for example, a company settles litigation with us by paying a settlement amount and entering into a license agreement or payment plan that calls for an initial license fee and ongoing royalty payment over several years. In that scenario, the settlement amount would be episodic revenue, as would the initial license fee, and the ongoing payments would be recurring revenue.
59
Item 9. Changes in and Disagreements with Accountants on Accounting and Financial Disclosure
Not applicable.
Item 9A. Controls and Procedures
Attached as exhibits to this Form 10-K are certifications of Xperi Corporation’s Chief Executive Officer and Chief Financial Officer, which are required in accordance with Rules 13a-15(e) and 15d-15(e) of the Exchange Act. This “Controls and Procedures” section includes information concerning the controls and controls evaluation referred to in the certifications and it should be read in conjunction with the certifications, for a more complete understanding of the topics presented.
Evaluation of Controls and Procedures
Xperi Corporation maintains disclosure controls and procedures that are designed to ensure that information required to be disclosed in our reports filed pursuant to the Exchange Act is recorded, processed, summarized and reported within the time periods specified in the SEC’s rules and forms and that such information is accumulated and communicated to our management, including our Chief Executive Officer and Chief Financial Officer, as appropriate, to allow for timely decisions regarding required disclosure. In designing and evaluating the disclosure controls and procedures, management recognizes that any controls and procedures, no matter how well designed and operated, can provide only reasonable assurance of achieving the desired control objectives, and management is required to apply its judgment in evaluating the cost-benefit relationship of possible controls and procedures.
Under the supervision and with the participation of our management, including our principal executive officer and principal financial officer, we conducted an evaluation of the effectiveness of the design and operation of our disclosure controls and procedures, as defined in Rules 13a-15(e) and 15d-15(e) under the Exchange Act as of the end of the period covered by this report (the evaluation date). Based on this evaluation, our principal executive officer and principal financial officer concluded as of the evaluation date that our disclosure controls and procedures were effective to provide reasonable assurance that the information relating to Xperi Corporation, including our consolidated subsidiaries, required to be disclosed in our SEC reports (i) is recorded, processed, summarized and reported within the time periods specified in SEC rules and forms, and (ii) is accumulated and communicated to Xperi Corporation’s management, including our principal executive officer and principal financial officer, as appropriate, to allow timely decisions regarding required disclosure.
Change in Internal Control over Financial Reporting
There has been no change in Xperi Corporation’s internal control over financial reporting, as defined in Exchange Act Rules 13a-15(f) and 15d-15(f), during Xperi Corporation’s most recent quarter that has materially affected, or is reasonably likely to materially affect, Xperi Corporation’s internal control over financial reporting.
Management’s Report on Internal Control over Financial Reporting
Our management is responsible for establishing and maintaining adequate internal control over financial reporting for Xperi Corporation. Our internal control over financial reporting is a process designed to provide reasonable assurance regarding the reliability of financial reporting and the preparation of financial statements for external purposes in accordance with U.S. generally accepted accounting principles. Xperi Corporation’s internal control over financial reporting includes those policies and procedures that (i) pertain to the maintenance of records that, in reasonable detail, accurately and fairly reflect the transactions and dispositions of the assets of Xperi Corporation; (ii) provide reasonable assurance that transactions are recorded as necessary to permit preparation of financial statements in accordance with generally accepted accounting principles, and that receipts and expenditures of Xperi Corporation are being made only in accordance with authorizations of management and directors of Xperi Corporation; and (iii) provide reasonable assurance regarding prevention or timely detection of unauthorized acquisition, use, or disposition of Xperi Corporation’s assets that could have a material effect on the financial statements.
Xperi Corporation's management assessed the effectiveness of our internal control over financial reporting as of December 31, 2017, utilizing the criteria set forth in 2013 by the Committee of Sponsoring Organizations of the Treadway Commission (COSO) in Internal Control-Integrated Framework. Based on the assessment by Xperi Corporation’s management, we determined that Xperi Corporation's internal control over financial reporting was effective as of December 31, 2017. The effectiveness of Xperi Corporation’s internal control over financial reporting as of December 31, 2017 has been audited by PricewaterhouseCoopers LLP, Xperi Corporation’s independent registered public accounting firm, as stated in their attestation report which appears on page F-1 of this Annual Report on Form 10-K.
60
Item 9B. Other Information
Not applicable.
PART III
Item 10. Directors, Executive Officers and Corporate Governance
The information required by this Item 10 is hereby incorporated by reference from the information under the captions “Executive Officers,” “Election of Directors” and “Section 16(a) Beneficial Ownership Reporting Compliance” that will be contained in the Proxy Statement for our 2018 Annual Meeting of Stockholders (the “Proxy Statement”).
We have adopted a written code of business conduct and ethics that applies to our principal executive officer, principal financial officer, principal accounting officer or controller, or persons serving similar functions. The text of our code of business conduct and ethics has been posted on our website at http://www.xperi.com. and is included as an exhibit to our Current Report on Form 8-K filed with the SEC on December 1, 2016.
Item 11. Executive Compensation
The information required by this Item 11 is incorporated by reference from the information under the captions “Election of Directors,” “Compensation Discussion and Analysis,” “Compensation of Named Executive Officers” and “Report of the Compensation Committee” that will be contained in the Proxy Statement.
Item 12. Security Ownership of Certain Beneficial Owners and Management and Related Stockholder Matters.
The information required by this Item 12 is incorporated by reference from the information under the captions “Equity Compensation Plan Information” and “Security Ownership of Certain Beneficial Owners and Management” that will be contained in the Proxy Statement.
Item 13. Certain Relationships and Related Transactions, and Director Independence
The information required by this Item 13 is incorporated by reference from the information under the captions “Certain Relationships and Related Transactions” and “Election of Directors” that will be contained in the Proxy Statement.
Item 14. Principal Accountant Fees and Services
The information required by this Item 14 is incorporated by reference from the information under the caption “Ratification of Independent Registered Public Accountants” that will be contained in the Proxy Statement.
61
PART IV
Item 15. Exhibits and Financial Statement Schedules
(a) Documents filed as part of this report:
Page Number | ||||
(1) Financial Statements | ||||
Report of Independent Registered Public Accounting Firm | ||||
Consolidated Balance Sheets | ||||
Consolidated Statements of Operations | ||||
Consolidated Statements of Comprehensive Income (loss) | ||||
Consolidated Statements of Stockholders’ Equity | ||||
Consolidated Statements of Cash Flows | ||||
Notes to Consolidated Financial Statements | ||||
(2) Financial Statement Schedule | ||||
Valuation and Qualifying Accounts | ||||
(3) Exhibits | ||||
The exhibits listed on the Exhibit Index preceding the signature page to this Annual Report are filed as part of this Annual Report. | |
62
Report of Independent Registered Public Accounting Firm
To the Board of Directors and Stockholders of Xperi Corporation
Opinions on the Financial Statements and Internal Control over Financial Reporting
We have audited the accompanying consolidated balance sheets of Xperi Corporation (formerly known as Tessera Holding Corporation which is the successor registrant to Tessera Technologies, Inc.) and its subsidiaries as of December 31, 2017 and 2016, and the related consolidated statements of operations, comprehensive income (loss), stockholders’ equity and cash flows for each of the three years in the period ended December 31, 2017, including the related notes and schedule of valuation and qualifying accounts for each of the three years in the period ended December 31, 2017 listed in the index appearing under Item 15(a)(2) (collectively referred to as the “consolidated financial statements”). We also have audited the Company's internal control over financial reporting as of December 31, 2017 based on criteria established in Internal Control - Integrated Framework (2013) issued by the Committee of Sponsoring Organizations of the Treadway Commission (COSO).
In our opinion, the consolidated financial statements referred to above present fairly, in all material respects, the financial position of the Company as of December 31, 2017 and 2016, and the results of their operations and their cash flows for each of the three years in the period ended December 31, 2017 in conformity with accounting principles generally accepted in the United States of America. Also in our opinion, the Company maintained, in all material respects, effective internal control over financial reporting as of December 31, 2017, based on criteria established in Internal Control - Integrated Framework (2013) issued by the COSO.
Basis for Opinions
The Company's management is responsible for these consolidated financial statements, for maintaining effective internal control over financial reporting, and for its assessment of the effectiveness of internal control over financial reporting, included in Management’s Report on Internal Control over Financial Reporting appearing under Item 9A. Our responsibility is to express opinions on the Company’s consolidated financial statements and on the Company's internal control over financial reporting based on our audits. We are a public accounting firm registered with the Public Company Accounting Oversight Board (United States) ("PCAOB") and are required to be independent with respect to the Company in accordance with the U.S. federal securities laws and the applicable rules and regulations of the Securities and Exchange Commission and the PCAOB.
We conducted our audits in accordance with the standards of the PCAOB. Those standards require that we plan and perform the audits to obtain reasonable assurance about whether the consolidated financial statements are free of material misstatement, whether due to error or fraud, and whether effective internal control over financial reporting was maintained in all material respects.
Our audits of the consolidated financial statements included performing procedures to assess the risks of material misstatement of the consolidated financial statements, whether due to error or fraud, and performing procedures that respond to those risks. Such procedures included examining, on a test basis, evidence regarding the amounts and disclosures in the consolidated financial statements. Our audits also included evaluating the accounting principles used and significant estimates made by management, as well as evaluating the overall presentation of the consolidated financial statements. Our audit of internal control over financial reporting included obtaining an understanding of internal control over financial reporting, assessing the risk that a material weakness exists, and testing and evaluating the design and operating effectiveness of internal control based on the assessed risk. Our audits also included performing such other procedures as we considered necessary in the circumstances. We believe that our audits provide a reasonable basis for our opinions.
Definition and Limitations of Internal Control over Financial Reporting
A company’s internal control over financial reporting is a process designed to provide reasonable assurance regarding the reliability of financial reporting and the preparation of financial statements for external purposes in accordance with generally accepted accounting principles. A company’s internal control over financial reporting includes those policies and procedures that (i) pertain to the maintenance of records that, in reasonable detail, accurately and fairly reflect the transactions and dispositions of the assets of the company; (ii) provide reasonable assurance that transactions are recorded as necessary to permit preparation of financial statements in accordance with generally accepted accounting principles, and that receipts and expenditures of the company are being made only in accordance with authorizations of management and directors of the company; and (iii) provide reasonable assurance regarding prevention or timely detection of unauthorized acquisition, use, or disposition of the company’s assets that could have a material effect on the financial statements.
F- 1
Because of its inherent limitations, internal control over financial reporting may not prevent or detect misstatements. Also, projections of any evaluation of effectiveness to future periods are subject to the risk that controls may become inadequate because of changes in conditions, or that the degree of compliance with the policies or procedures may deteriorate.
/s/ PricewaterhouseCoopers LLP
San Jose, California
February 23, 2018
We have served as the Company’s auditor since 1999, which includes periods before the Company became subject to SEC reporting requirements.
F- 2
XPERI CORPORATION
(formerly known as Tessera Holding Corporation which is the successor registrant to Tessera Technologies, Inc.)
CONSOLIDATED BALANCE SHEETS
(in thousands, except for par value)
December 31, | |||||||
2017 | 2016 | ||||||
ASSETS | |||||||
Current assets: | |||||||
Cash and cash equivalents | $ | 138,260 | $ | 65,626 | |||
Short-term investments | 62,432 | 47,379 | |||||
Accounts receivable, net of allowance for doubtful accounts of $1,181 and $0, respectively | 17,010 | 15,863 | |||||
Unbilled contract receivable | 10,866 | 51,923 | |||||
Other current assets | 16,949 | 19,150 | |||||
Total current assets | 245,517 | 199,941 | |||||
Property and equipment, net | 34,442 | 38,855 | |||||
Intangible assets, net | 431,789 | 541,879 | |||||
Long-term deferred tax assets | 5,156 | 2,742 | |||||
Goodwill | 385,574 | 382,963 | |||||
Other assets | 7,546 | 20,056 | |||||
Total assets | $ | 1,110,024 | $ | 1,186,436 | |||
LIABILITIES AND STOCKHOLDERS' EQUITY | |||||||
Current liabilities: | |||||||
Accounts payable | $ | 4,233 | $ | 7,531 | |||
Accrued legal fees | 7,483 | 7,505 | |||||
Accrued liabilities | 47,969 | 29,086 | |||||
Current portion of long-term debt | 34,451 | 6,000 | |||||
Deferred revenue | 2,686 | 895 | |||||
Total current liabilities | 96,822 | 51,017 | |||||
Long-term deferred tax liabilities | 15,085 | 32,565 | |||||
Long-term debt, net | 545,211 | 577,239 | |||||
Other long-term liabilities | 17,330 | 17,830 | |||||
Commitments and contingencies (Note 15) | |||||||
Stockholders’ equity: | |||||||
Preferred stock: $0.001 par value; 10,000 shares authorized and no shares issued and outstanding | — | — | |||||
Common stock: $0.001 par value; 150,000 shares authorized; 60,608 and 59,596 shares issued, respectively, and 49,103 and 48,854 shares outstanding, respectively | 60 | 59 | |||||
Additional paid-in capital | 686,660 | 644,194 | |||||
Treasury stock at cost; 11,505 and 10,742 shares of common stock at each period end, respectively | (319,397 | ) | (300,114 | ) | |||
Accumulated other comprehensive loss | (303 | ) | (148 | ) | |||
Retained earnings | 68,556 | 163,794 | |||||
Total stockholders’ equity | 435,576 | 507,785 | |||||
Total liabilities and stockholders’ equity | $ | 1,110,024 | $ | 1,186,436 | |||
The accompanying notes are an integral part of these consolidated financial statements.
F- 3
XPERI CORPORATION
(formerly known as Tessera Holding Corporation which is the successor registrant to Tessera Technologies, Inc.)
CONSOLIDATED STATEMENTS OF OPERATIONS
(in thousands, except per share amounts)
Years Ended December 31, | |||||||||||
2017 | 2016 | 2015 | |||||||||
Revenue: | |||||||||||
Royalty and license fees | $ | 373,732 | $ | 259,565 | $ | 273,300 | |||||
Total revenue | 373,732 | 259,565 | 273,300 | ||||||||
Operating expenses: | |||||||||||
Cost of revenue | 6,308 | 551 | 566 | ||||||||
Research, development and other related costs | 105,849 | 44,738 | 32,181 | ||||||||
Selling, general and administrative | 144,649 | 72,065 | 43,592 | ||||||||
Amortization expense | 111,930 | 31,870 | 20,624 | ||||||||
Litigation expense, net of settlement | 36,496 | 20,953 | 14,135 | ||||||||
Total operating expenses | 405,232 | 170,177 | 111,098 | ||||||||
Operating income (loss) | (31,500 | ) | 89,388 | 162,202 | |||||||
Interest expense | (28,292 | ) | (2,409 | ) | — | ||||||
Other income and expense, net | 1,449 | 3,736 | 3,432 | ||||||||
Income (loss) before taxes from continuing operations | (58,343 | ) | 90,715 | 165,634 | |||||||
Provision for (benefit from) income taxes | (1,785 | ) | 34,626 | 48,517 | |||||||
Income (loss) from continuing operations | (56,558 | ) | 56,089 | 117,117 | |||||||
Loss from discontinued operations, net of tax* | — | — | (101 | ) | |||||||
Net income (loss) | $ | (56,558 | ) | $ | 56,089 | $ | 117,016 | ||||
Income (loss) per share: | |||||||||||
Income (loss) from continuing operations: | |||||||||||
Basic | $ | (1.15 | ) | $ | 1.14 | $ | 2.26 | ||||
Diluted | $ | (1.15 | ) | $ | 1.12 | $ | 2.23 | ||||
Net income (loss): | |||||||||||
Basic | $ | (1.15 | ) | $ | 1.14 | $ | 2.26 | ||||
Diluted | $ | (1.15 | ) | $ | 1.12 | $ | 2.23 | ||||
Cash dividends declared per share | $ | 0.80 | $ | 0.80 | $ | 0.80 | |||||
Weighted average number of shares used in per share calculations-basic | 49,251 | 49,187 | 51,802 | ||||||||
Weighted average number of shares used in per share calculations-diluted | 49,251 | 50,190 | 52,586 | ||||||||
*Discontinued operations had no impact on net income per share in 2015.
The accompanying notes are an integral part of these consolidated financial statements.
F- 4
XPERI CORPORATION
(formerly known as Tessera Holding Corporation which is the successor registrant to Tessera Technologies, Inc.)
CONSOLIDATED STATEMENTS OF COMPREHENSIVE INCOME (LOSS)
(in thousands)
Years Ended December 31, | |||||||||||
2017 | 2016 | 2015 | |||||||||
Net income (loss) | $ | (56,558 | ) | $ | 56,089 | $ | 117,016 | ||||
Other comprehensive income (loss): | |||||||||||
Net unrealized gains (losses) on available-for- sale securities, net of tax | (155 | ) | 1,289 | (1,104 | ) | ||||||
Other comprehensive income (loss) | (155 | ) | 1,289 | (1,104 | ) | ||||||
Comprehensive income (loss) | $ | (56,713 | ) | $ | 57,378 | $ | 115,912 | ||||
The accompanying notes are an integral part of these consolidated financial statements.
F- 4
XPERI CORPORATION
(formerly known as Tessera Holding Corporation which is the successor registrant to Tessera Technologies, Inc.)
CONSOLIDATED STATEMENTS OF STOCKHOLDERS’ EQUITY
(in thousands)
Common Stock | Additional Paid-In Capital | Treasury Stock | Accumulated Other Comprehensive Income (Loss) | Retained Earnings | Total | |||||||||||||||||||||||||
Shares | Amount | Shares | Amount | |||||||||||||||||||||||||||
Balance at December 31, 2014 | 52,840 | $ | 58 | $ | 576,341 | 4,960 | $ | (106,231 | ) | $ | (333 | ) | $ | 71,524 | $ | 541,359 | ||||||||||||||
Net income | — | — | — | — | — | — | 117,016 | 117,016 | ||||||||||||||||||||||
Other comprehensive loss | — | — | — | — | — | (1,104 | ) | — | (1,104 | ) | ||||||||||||||||||||
Cash dividends paid on common stock | — | — | — | — | — | — | (41,677 | ) | (41,677 | ) | ||||||||||||||||||||
Issuance of common stock in connection with exercise of stock options | 465 | — | 8,995 | — | — | — | — | 8,995 | ||||||||||||||||||||||
Issuance of common stock in connection with employee common stock purchase plan | 77 | — | 1,665 | — | — | — | — | 1,665 | ||||||||||||||||||||||
Issuance of restricted stock, net of shares canceled | 350 | — | — | — | — | — | — | — | ||||||||||||||||||||||
Repurchases of common stock, shares exchanged | (105 | ) | — | — | 105 | (4,047 | ) | — | — | (4,047 | ) | |||||||||||||||||||
Repurchases of common stock | (3,333 | ) | — | — | 3,333 | (119,235 | ) | — | — | (119,235 | ) | |||||||||||||||||||
Stock-based compensation expense | — | — | 11,517 | — | — | — | — | 11,517 | ||||||||||||||||||||||
Tax effect from employee stock option plan | — | — | 668 | — | — | — | — | 668 | ||||||||||||||||||||||
Balance at December 31, 2015 | 50,294 | $ | 58 | $ | 599,186 | 8,398 | $ | (229,513 | ) | $ | (1,437 | ) | $ | 146,863 | $ | 515,157 | ||||||||||||||
Net income | — | — | — | — | — | — | 56,089 | 56,089 | ||||||||||||||||||||||
Other comprehensive gain | — | — | — | — | — | 1,289 | — | 1,289 | ||||||||||||||||||||||
Cash dividends paid on common stock | — | — | — | — | — | — | (39,158 | ) | (39,158 | ) | ||||||||||||||||||||
Issuance of common stock in connection with exercise of stock options | 350 | — | 6,285 | — | — | — | — | 6,285 | ||||||||||||||||||||||
Issuance of common stock in connection with employee common stock purchase plan | 89 | — | 1,998 | — | — | — | — | 1,998 | ||||||||||||||||||||||
Issuance of restricted stock, net of shares canceled | 465 | 1 | — | — | — | — | — | 1 | ||||||||||||||||||||||
Repurchases of common stock, shares exchanged | (91 | ) | — | — | 91 | (2,900 | ) | — | — | (2,900 | ) | |||||||||||||||||||
Repurchases of common stock | (2,253 | ) | — | — | 2,253 | (67,701 | ) | — | — | (67,701 | ) | |||||||||||||||||||
Stock-based compensation expense | — | — | 21,101 | — | — | — | — | 21,101 | ||||||||||||||||||||||
Fair value of partially vested equity awards assumed in connection with the acq. of DTS | — | — | 13,124 | — | — | — | — | 13,124 | ||||||||||||||||||||||
Tax effect from employee stock option plan | — | — | 2,500 | — | — | — | — | 2,500 | ||||||||||||||||||||||
Balance at December 31, 2016 | 48,854 | $ | 59 | $ | 644,194 | 10,742 | $ | (300,114 | ) | $ | (148 | ) | $ | 163,794 | $ | 507,785 | ||||||||||||||
Cumulative-effect adjustment from adoption of ASU 2016-09 | — | — | — | — | — | — | 829 | 829 | ||||||||||||||||||||||
Net loss | — | — | — | — | — | — | (56,558 | ) | (56,558 | ) | ||||||||||||||||||||
Other comprehensive loss | — | — | — | — | — | (155 | ) | — | (155 | ) | ||||||||||||||||||||
Cash dividends paid on common stock | — | — | — | — | — | — | (39,509 | ) | (39,509 | ) | ||||||||||||||||||||
Issuance of common stock in connection with exercise of stock options | 180 | — | 4,872 | — | — | — | — | 4,872 | ||||||||||||||||||||||
Issuance of common stock in connection with employee common stock purchase plan | 164 | — | 4,132 | — | — | — | — | 4,132 | ||||||||||||||||||||||
Issuance of restricted stock, net of shares canceled | 668 | 1 | — | — | — | — | — | 1 | ||||||||||||||||||||||
Repurchases of common stock, shares exchanged | (109 | ) | — | — | 109 | (3,944 | ) | — | — | (3,944 | ) | |||||||||||||||||||
Repurchases of common stock | (654 | ) | — | — | 654 | (15,339 | ) | — | — | (15,339 | ) | |||||||||||||||||||
Stock-based compensation expense | — | — | 33,462 | — | — | — | — | 33,462 | ||||||||||||||||||||||
Balance at December 31, 2017 | 49,103 | $ | 60 | $ | 686,660 | 11,505 | $ | (319,397 | ) | $ | (303 | ) | $ | 68,556 | $ | 435,576 | ||||||||||||||
The accompanying notes are an integral part of these consolidated financial statements.
F- 5
XPERI CORPORATION
(formerly known as Tessera Holding Corporation which is the successor registrant to Tessera Technologies, Inc.)
CONSOLIDATED STATEMENTS OF CASH FLOWS
(in thousands)
Years Ended December 31, | |||||||||||
2017 | 2016 | 2015 | |||||||||
Cash flows from operating activities: | |||||||||||
Net income (loss) | $ | (56,558 | ) | $ | 56,089 | $ | 117,016 | ||||
Adjustments to reconcile net income (loss) to net cash from operating activities: | |||||||||||
Depreciation of property and equipment | 7,201 | 2,260 | 1,590 | ||||||||
Amortization of intangible assets | 111,930 | 31,870 | 20,624 | ||||||||
Stock-based compensation expense | 33,462 | 21,101 | 11,517 | ||||||||
Bad debt expense | 2,404 | — | — | ||||||||
Deferred income tax and other, net | (18,294 | ) | 7,694 | 19,477 | |||||||
Amortization of premium or discount on investments | 372 | 4,072 | (2,601 | ) | |||||||
Patents acquired through settlement agreements | (1,664 | ) | — | — | |||||||
Loss on disposal of property and equipment | 251 | — | — | ||||||||
Amortization of debt issuance costs | 2,423 | 201 | — | ||||||||
Changes in operating assets and liabilities, net of business acquisitions: | |||||||||||
Accounts receivable | (3,551 | ) | 13,957 | 2,694 | |||||||
Unbilled contract receivable, net | 48,168 | — | — | ||||||||
Other assets | 3,458 | 18,067 | (10,051 | ) | |||||||
Accounts payable | (3,298 | ) | 1,709 | (2,685 | ) | ||||||
Accrued legal fees | (22 | ) | 4,884 | (1,819 | ) | ||||||
Accrued and other liabilities | 19,192 | (1,573 | ) | (5,074 | ) | ||||||
Deferred revenue | 1,791 | (6,471 | ) | (3,412 | ) | ||||||
Net cash from operating activities | 147,265 | 153,860 | 147,276 | ||||||||
Cash flows from investing activities: | |||||||||||
Purchases of property and equipment | (3,323 | ) | (3,794 | ) | (1,002 | ) | |||||
Proceeds from sale of property and equipment | 235 | — | — | ||||||||
Purchases of short-term available-for-sale investments | (33,102 | ) | (161,595 | ) | (298,848 | ) | |||||
Proceeds from sales of short-term investments | 1,035 | 299,524 | 149,975 | ||||||||
Proceeds from maturities of short-term investments | 16,487 | 171,255 | 174,738 | ||||||||
Acquisition, net of cash acquired | — | (888,204 | ) | (38,561 | ) | ||||||
Purchases of intangible assets | (176 | ) | (9,582 | ) | (7,588 | ) | |||||
Net cash from investing activities | (18,844 | ) | (592,396 | ) | (21,286 | ) | |||||
Cash flows from financing activities: | |||||||||||
Proceeds from debt, net | — | 583,039 | — | ||||||||
Repayment of debt | (6,000 | ) | — | — | |||||||
Dividend paid | (39,509 | ) | (39,158 | ) | (41,677 | ) | |||||
Proceeds from exercise of stock options | 4,873 | 6,285 | 8,995 | ||||||||
Proceeds from employee stock purchase program | 4,132 | 1,998 | 1,665 | ||||||||
Repurchase of common stock | (19,283 | ) | (70,601 | ) | (123,282 | ) | |||||
Net cash from financing activities | (55,787 | ) | 481,563 | (154,299 | ) | ||||||
Net increase (decrease) in cash and cash equivalents | 72,634 | 43,027 | (28,309 | ) | |||||||
Cash and cash equivalents at beginning of period | 65,626 | 22,599 | 50,908 | ||||||||
Cash and cash equivalents at end of period | $ | 138,260 | $ | 65,626 | $ | 22,599 | |||||
Supplemental disclosure of cash flow information: | |||||||||||
Interest paid | $ | 28,068 | $ | — | $ | — | |||||
Income taxes paid, net of refunds | $ | 15,678 | $ | 7,676 | $ | 36,781 | |||||
Supplemental disclosure of non-cash investing activities: | |||||||||||
Fair value of unvested DTS equity awards assumed relating to pre-acquisition services | $ | — | $ | 13,124 | $ | — | |||||
The accompanying notes are an integral part of these consolidated financial statements.
F- 6
XPERI CORPORATION
(formerly known as Tessera Holding Corporation which is the successor registrant to Tessera Technologies, Inc.)
NOTES TO CONSOLIDATED FINANCIAL STATEMENTS
NOTE 1 – THE COMPANY AND BASIS OF PRESENTATION
The Company completed the acquisition of DTS, Inc. ("DTS"), a publicly-traded developer of sound-based technologies, in December 2016. At the time of the acquisition, Tessera Technologies, Inc. and DTS were combined under the newly-formed Tessera Holding Corporation. During the first quarter of 2017, the Company introduced its new corporate name, “Xperi Corporation”, stock ticker, “XPER”, and launched a new corporate logo.
These changes have resulted in the presentation of the financial statements under the new name of Xperi Corporation (formerly known as Tessera Holding Corporation which is the successor registrant to Tessera Technologies Inc.). For more information on the acquisition of DTS, Inc., see Note 8 - “Business Combinations.”
Xperi Corporation licenses its innovative products, technologies and inventions to global electronics companies which, in turn, integrate the technologies into their own consumer electronics and semiconductor products. The Company's technologies and inventions are widely adopted and used every day by millions of people. The Company's audio technologies have shipped in billions of devices for the home, mobile and automotive markets. The Company's imaging technologies are embedded in more than 25% of current smartphones. The Company's semiconductor packaging and interconnect technologies have been licensed to more than 100 customers and have shipped in over 100 billion semiconductor chips.
The consolidated financial statements include the accounts of Xperi Corporation and each of its wholly owned subsidiaries. The accompanying consolidated financial statements have been prepared in accordance with generally accepted accounting principles (“GAAP”) in the United States (“U.S.”). All significant intercompany balances and transactions are eliminated in consolidation.
The Company’s fiscal year ends on December 31. The Company employs a calendar month-end reporting period for its quarterly reporting.
Reclassification
Certain reclassifications have been made to prior period balances in order to conform to the current period’s presentation. Refer to Note 3 – “Recent Accounting Pronouncements” for detail.
NOTE 2 – SUMMARY OF SIGNIFICANT ACCOUNTING POLICIES
Use of Estimates
The preparation of financial statements in conformity with U.S. GAAP requires management to make estimates and assumptions that affect the amounts reported in the financial statements and accompanying notes. The accounting estimates and assumptions that require management’s most significant, difficult, and subjective judgment include the recognition and measurement of current and deferred income tax assets and liabilities, the collectability of accounts receivable, the fair value measurements of goodwill, other intangible assets and investments, the assessment of the recoverability of goodwill, the assessment of useful lives and recoverability of other intangible assets and long-lived assets, the assessment of unrecognized tax benefits and the valuation and recognition of stock-based compensation expense, and business combinations, among others. Actual results experienced by the Company may differ from management’s estimates.
Cash and Cash Equivalents
The Company considers all highly liquid investments purchased with an original maturity of three months or less at the date of purchase to be cash equivalents. Cash and cash equivalents are maintained with various financial institutions. The Company’s cash equivalents are classified as available-for-sale.
Financial Instruments
F- 7
Investments consist primarily of municipal bonds and notes, corporate bonds and notes, treasury and agency notes and bills, commercial paper, certificates of deposit, and money market funds. The Company classifies all investments as current as the securities are available for use, if needed, for current operations. The Company’s cash equivalents and investments are classified as available-for-sale. Unrealized gains and losses on securities, net of tax, are recorded in accumulated other comprehensive income and reported as a separate component of stockholders’ equity. The Company evaluates the investments periodically for possible other-than-temporary impairment and reviews factors such as the length of time and extent to which fair value has been below cost basis, the financial condition of the issuer, and the Company’s ability and intent to hold the security until maturity on a more-likely-than-not basis. If the declines in the fair value of the investments are determined to be other-than-temporary, the Company reports the credit loss portion of such decline in other income and expense, net, and the remaining noncredit loss portion in accumulated other comprehensive income. The cost of securities sold is based on the specific identification method. Interest and dividend income and realized gains or losses are included in other income and expense, net.
Fair Value of Financial Instruments
The carrying amount of cash equivalents, accounts receivable, accounts payable and accrued liabilities approximates fair value due to the short-term nature of these instruments. Long-term debt approximates fair value due to the variable rate nature of the debt.
Concentration of Credit and Other Risks
Financial instruments that potentially subject the Company to significant concentrations of credit risk consist principally of cash equivalents, short-term investments and accounts receivable. The Company follows a corporate investment policy which sets credit, maturity and concentration limits and regularly monitors the composition, market risk and maturities of these investments. The Company believes that any concentration of credit risk in its accounts receivable is substantially mitigated by the Company’s evaluation process, relatively short collection terms and the high level of credit worthiness of its customers. The Company performs ongoing credit evaluations of its customers’ financial condition and limits the amount of credit extended when deemed necessary but generally requires no collateral.
At December 31, 2017, the Company had three customers representing 17%, 11% and 10% of aggregate gross trade receivables, respectively. At December 31, 2016, the Company had two customers representing 14% and 13% of aggregate gross trade receivables, respectively.
The following table sets forth revenue generated from customers which comprise 10% or more of total revenue for the periods indicated:
Years Ended December 31, | |||||||||
2017 | 2016 | 2015 | |||||||
Micron Technology, Inc. | 11 | % | 17 | % | 15 | % | |||
Amkor Technologies, Inc. | 10 | % | 15 | % | 14 | % | |||
Samsung Electronics, Co. Ltd. | * | 25 | % | 19 | % | ||||
SK hynix Inc. | * | 12 | % | 13 | % | ||||
* | denotes less than 10% of total revenue. |
Allowance for Doubtful Accounts
The Company continually monitors customer payments and maintains a reserve for estimated losses resulting from its customers' inability to make required payments. In determining the reserve, the Company evaluates the collectibility of its accounts receivable based upon a variety of factors. In cases where the Company becomes aware of circumstances that may impair a specific customer's ability to meet its financial obligations, the Company records a specific allowance against amounts due. For all other customers, the Company recognizes allowances for doubtful accounts based on its historical write-off experience in conjunction with the length of time the receivables are past due, customer creditworthiness, geographic risk and the current business environment. Actual future losses from uncollectible accounts may differ from the Company's estimates. The allowance balance was $1.2 million and zero as of December 31, 2017 and December 31, 2016, respectively.
F- 8
Goodwill and Identified Intangible Assets
Goodwill. Goodwill is recorded as the difference, if any, between the aggregate consideration paid for an acquisition and the fair value of the net tangible and identified intangible assets acquired under a business combination. Goodwill also includes acquired assembled workforce, which does not qualify as an identifiable intangible asset. The Company reviews impairment of goodwill annually in the fourth quarter, or more frequently if events or circumstances indicate that the goodwill might be impaired. The Company first assesses qualitative factors to determine whether it is necessary to perform the quantitative goodwill impairment test. If, after assessing the totality of events or circumstances, the Company determines that it is not more
likely than not that the fair value of a reporting unit is less than its carrying amount, then the quantitative goodwill impairment test is unnecessary.
If, based on the qualitative assessment, it is determined that it is more likely than not that the fair value of a reporting unit is less than its carrying amount, then the Company proceeds to perform the quantitative goodwill impairment test. The Company first determines the fair value of a reporting unit using weighted results derived from an income approach and a market approach. The income approach is estimated through the discounted cash flow method based on assumptions about future conditions such as future revenue growth rates, new product and technology introductions, gross margins, operating expenses, discount rates, future economic and market conditions, and other assumptions. The market approach estimates the fair value of the Company’s equity by utilizing the market comparable method which is based on revenue multiples from comparable companies in similar lines of business. The Company then compares the derived fair value of a reporting unit with its carrying amount. If the carrying value of a reporting unit exceeds its fair value, an impairment loss will be recognized in an amount equal to that excess, limited to the total amount of goodwill allocated to that reporting unit.
Identified intangible assets. Identified finite-lived intangible assets consist of acquired patents, existing technology, customer relationships, trademarks and trade names, non-compete agreements resulting from business combinations, and acquired patents under asset purchase agreements. The Company’s identified intangible assets are amortized on a straight-line basis over their estimated useful lives, ranging from 1 to 15 years. The Company makes judgments about the recoverability of finite-lived intangible assets whenever facts and circumstances indicate that the useful life is shorter than originally estimated or that the carrying amount of assets may not be recoverable. If such facts and circumstances exist, the Company assesses recoverability by comparing the projected undiscounted net cash flows associated with the related asset or group of assets over their remaining lives against their respective carrying amounts. Impairments, if any, are based on the excess of the carrying amount over the fair value of those assets. If the useful life is shorter than originally estimated, the Company would accelerate the rate of amortization and amortize the remaining carrying value over the new shorter useful life.
Identified indefinite-lived intangible assets include in-process research and development (IPR&D) resulting from business combinations. The Company evaluates the carrying value of indefinite-lived intangible assets on an annual basis, and an impairment charge would be recognized to the extent that the carrying amount of such assets exceeds their estimated fair value.
For further discussion of goodwill and identified intangible assets, see “Note 9 – Goodwill and Identified Intangible Assets.”
Debt Issuance Costs
Debt issuance costs are presented in the consolidated balance sheet as a deduction from the carrying amount of the long-term debt, and are amortized over the term of the associated debt to interest expense using the effective interest method. In addition, the Company elects to continue to defer the unamortized debt issuance costs when it pays down a portion of the debt as the prepayment is factored into the terms agreed to on the debt.
Treasury Stock
The Company accounts for stock repurchases using the cost method. For reissuance of treasury stock, to the extent that the reissuance price is more than the cost, the excess is recorded as an increase to capital in excess of par value. If the reissuance price is less than the cost, the difference is recorded in capital in excess of par value to the extent there is a cumulative treasury stock paid-in capital balance. Once the cumulative balance is reduced to zero, any remaining difference resulting from the sale of treasury stock below cost is recorded as a reduction of retained earnings.
Business Combinations
The Company includes the results of operations of the businesses that it has acquired in its consolidated results as of the respective dates of acquisition.
F- 9
The Company allocates the fair value of the purchase consideration of its acquisitions to the tangible assets, liabilities and intangible assets acquired, including IPR&D, based on their estimated fair values. The excess of the fair value of purchase consideration over the fair values of these identifiable assets and liabilities is recorded as goodwill. The primary items that generate goodwill include the value of the synergies between the acquired companies and the Company and the acquired assembled workforce, neither of which qualifies as an identifiable intangible asset. IPR&D is initially capitalized at fair value as an intangible asset with an indefinite life and assessed for impairment thereafter. When the IPR&D project is complete, it is reclassified as an amortizable intangible asset and is amortized over its estimated useful life. If an IPR&D project is abandoned, the Company records a charge for the value of the related intangible asset in its consolidated statement of operations in the period it is abandoned. The fair value of contingent consideration associated with acquisitions is remeasured each reporting period and adjusted accordingly. Acquisition and integration related costs are recognized separately from the business combination and are expensed as incurred.
For additional information regarding the Company's acquisitions, refer to "Note 8 – Business Combinations."
Revenue Recognition
The Company derives its revenue primarily from royalty and license fees. Revenue is recognized when there is persuasive evidence of an arrangement, delivery has occurred, the fee is fixed or determinable, and collectability of the resulting receivable is reasonably assured. Determining whether and when these criteria have been satisfied requires the Company to make assumptions and judgments that could have a significant impact on the timing and amount of revenue it reports.
License revenue is generated from license agreements for certain rights to the Company’s technologies. From time to time the Company enters into license agreements that provide for fixed license fees or royalty payments. The fixed license fees or royalty payments are recognized as revenue ratably over the contract term.
Royalty revenues are generated from a licensee's production or shipment of licensed products incorporating the Company’s intellectual property, technologies or software. Licensees with a per-unit arrangement pay a per-unit royalty for each product manufactured or sold, as set forth in each license agreement. Licensees generally report manufacturing or sales information in the quarter subsequent to when such activity takes place. Consequently, the Company recognizes revenue from these per-unit licensing agreements in the quarter as reporting is received following the quarter of manufacture or sale, provided amounts are fixed or determinable and collection is reasonably assured, since it is more reliable than estimating royalty revenue prior to obtaining these reports from the licensees. Use of this "quarter lag" method allows for the receipt of licensee royalty reports prior to the recognition of revenue.
Certain licensees of the Company have also entered into minimum guarantee arrangements, whereby licensees pay a minimum fee for the right to incorporate the Company's technology in the licensee's products over the contract term. These agreements stipulate a fee that corresponds to a minimum number of units or dollars that the customers must produce or pay, with additional per-unit fees for any units or dollars exceeding the minimum. For these agreements, the Company recognizes the minimum amount on these agreements as revenue ratably over the contract term. Consistent with the aforementioned policy for per-unit license fee agreements, the Company recognizes revenue relating to any additional per-unit fees on a quarter lag basis, since it is more reliable than estimating royalty revenue prior to obtaining these reports from the licensees. Under the acquisition method of purchase accounting, remaining guaranteed payments under existing minimum guarantee arrangements acquired from DTS were recorded as an unbilled contract receivable and other assets as part of the purchase price allocation. Accordingly, such payments will not be recognized as revenue over the remaining term of the contracts. Any new minimum guarantee arrangements with license periods starting subsequent to December 1, 2016 will be recognized as revenue ratably over the contract term in accordance with the policy described above. In addition, no revenue is recognized on shipments made or units manufactured prior to the acquisition date for per unit royalty agreements. Under the acquisition method of purchase accounting, the Company recognizes royalty revenue only on the units shipped or manufactured subsequent to the acquisition date of December 1, 2016. For additional information, refer to "Note 8 – Business Combinations."
The Company also derives revenue from software licenses for digital and video imaging technology. In some instances, the Company may enter into license agreements that involve multiple element arrangements that also include technology transfer, design, technical service and unspecified support. For technology and software licenses, revenue is recognized upon delivery or on a straight-line basis over the period in which the unspecified support or service is performed.
The Company actively monitors and enforces its intellectual property, and pursues third parties who have under-reported the amount of royalties owed under a license agreement or who utilize its intellectual property without a license. As a result of
F- 10
these activities, the Company may, from time to time, recognize royalty revenue that related to infringements or under-reporting that occurred in prior periods. Royalty revenue may also include payments resulting from periodic compliance audits of licensees, as part of a settlement of a patent infringement dispute, or judgments of license dispute. These royalty recoveries may cause revenue to be higher than expected during a particular reporting period and may not occur in subsequent periods. The Company recognizes revenue from royalty recoveries when there is persuasive evidence of an arrangement and collectability is reasonably assured. In the case of litigation settlements, the Company recognizes revenue when payments are received which is deemed to be when collectability is reasonably assured.
The Company provides payment terms to licensees based upon their financial strength, credit worthiness and the Company’s collection experience with the licensee. If the Company provides extended payment terms, revenue is deferred until payment is due.
The Company will adopt ASC 606, Revenue From Contracts With Customers, in fiscal year 2018, which is expected to have a significant impact on the timing of revenue recognition associated with its licensing contracts with customers. Refer to "Note 3 - Recent Accounting Pronouncements" for a detailed discussion.
Indemnification
The Company provides indemnification of varying scope to certain customers against claims of intellectual property infringement made by third parties arising from the use of the Company’s technologies. In accordance with authoritative guidance for accounting for guarantees, the Company evaluates estimated losses for such indemnification. The Company considers such factors as the degree of probability of an unfavorable outcome and the ability to make a reasonable estimate of the amount of loss. To date, no such claims have been filed against the Company and, as a result, no liability has been recorded in the Company’s financial statements.
As permitted under Delaware law, the Company has agreements whereby it indemnifies its officers and directors for certain events or occurrences while the officer or director is, or was, serving at the Company’s request in such capacity. The maximum potential amount of future payments the Company could be required to make under these indemnification agreements is unlimited; however, the Company believes, given the absence of any such payments in the Company’s history, and the estimated low probability of such payments in the future, that the estimated fair value of these indemnification agreements is immaterial. In addition, the Company has directors’ and officers’ liability insurance coverage that is intended to reduce its financial exposure and may enable the Company to recover a portion of any such payments.
Research, Development and Other Related Costs
Research and development is conducted primarily in-house and targets development of audio and image enhancement technologies, chip-scale and multi-chip packaging, circuitry design, 3D-IC architectures, wafer-level packaging technology, bonding technologies and machine learning. Research, development and other related costs include expenses associated with applications engineering necessary to port and integrate the Company's technologies and products on third party silicon and into end devices. These costs consist primarily of compensation and related costs for personnel, engineering consulting expenses associated with new product and technology development, product commercialization, quality assurance and testing costs, as well as costs related to patent applications and examinations, product "tear downs" and reverse engineering, materials, supplies and equipment depreciation. All research, development and other related costs are expensed as incurred.
Stock-based Compensation Expense
The Company accounts for stock-based compensation expense in accordance with the authoritative guidance on share-based payments. Under the provisions of the guidance, stock-based compensation expense is measured at the grant date based on the fair value of the option using a Black-Scholes option pricing model and is recognized as expense on a straight-line basis over the requisite service period, which is generally the vesting period. The fair value of the Company’s stock awards for non-employees is estimated based on the fair market value on each vesting date, accounted for under the variable-accounting method.
The authoritative guidance also requires that the Company measure and recognize stock-based compensation expense upon modification of the term of stock award. The stock-based compensation expense for such modification is the sum of any unamortized expense of the award before modification and the modification expense. The modification expense is the incremental amount of the fair value of the award before the modification and the fair value of the award after the modification,
F- 11
measured on the date of modification. In the case when the modification results in a longer requisite period than in the original award, the Company has elected to apply the pool method where the aggregate of the unamortized expense and the modification expense is amortized over the new requisite period on a straight-line basis. In addition, any forfeiture will be based on the original requisite period prior to the modification.
Calculating stock-based compensation expense requires the input of highly subjective assumptions, including the expected term of the stock-based awards, stock price volatility, and the pre-vesting option forfeiture rate. The Company estimates the expected life of options granted based on historical exercise patterns, which are believed to be representative of future behavior. The Company estimates the volatility of the Company’s common stock on the date of grant based on historical volatility. The assumptions used in calculating the fair value of stock-based awards represent the Company’s best estimates, but these estimates involve inherent uncertainties and the application of management judgment. As a result, if factors change and the Company uses different assumptions, its stock-based compensation expense could be materially different in the future. In addition, the Company is required to estimate the expected forfeiture rate and only recognize expense for those shares expected to vest. The Company estimates the forfeiture rate based on historical experience of its stock-based awards that are granted, exercised and cancelled. If the actual forfeiture rate is materially different from the estimate, stock-based compensation expense could be significantly different from what was recorded in the current period. The Company also grants performance share units (PSUs) to employees or consultants. PSU awards will vest if certain employee-specific or company-designated performance targets are achieved. If minimum performance thresholds are achieved, each PSU award will convert into Xperi common stock at a defined ratio depending on the degree of achievement of the performance target designated by each individual award. If minimum performance thresholds are not achieved, then no shares will be issued. Based upon the expected levels of achievement, stock-based compensation is recognized on a straight-line basis over the PSUs’ requisite service periods. The expected levels of achievement are reassessed over the requisite service periods and, to the extent that the expected levels of achievement change, stock-based compensation is adjusted in the period of change and recorded on the statements of operations and the remaining unrecognized stock-based compensation is recorded over the remaining requisite service period. See Note 13 – “Stock-based Compensation Expense” for additional detail.
Income Taxes
The Company must make certain estimates and judgments in determining income tax expense for financial statement purposes. These estimates and judgments are used in the calculation of tax credits, tax benefits, tax deductions, and in the calculation of certain deferred taxes and tax liabilities. Significant changes to these estimates may result in an increase or decrease to the Company’s tax provision in a subsequent period.
The provision for income taxes was comprised of the Company’s current tax liability and changes in deferred income tax assets and liabilities. The calculation of the current tax liability involves dealing with uncertainties in the application of complex tax laws and regulations and in determining the liability for tax positions, if any, taken on the Company’s tax returns in accordance with authoritative guidance on accounting for uncertainty in income taxes. Deferred income taxes are determined based on the differences between the financial reporting and tax basis of assets and liabilities. The Company must assess the likelihood that it will be able to recover the Company’s deferred tax assets. If recovery is not likely on a more-likely-than-not basis, the Company must increase its provision for income taxes by recording a valuation allowance against the deferred tax assets that it estimates will not ultimately be recoverable. However, should there be a change in the Company’s ability to recover its deferred tax assets, the provision for income taxes would fluctuate in the period of such change. See Note 14 – “Income Taxes” for additional detail.
On December 22, 2017, the Tax Cuts and Jobs Act (the Tax Act) was signed into law. Several key tax provisions in the legislation will affect us. The Company is required to recognize the effect of the tax law changes in the period of enactment, such as determining the transition tax, remeasuring the Company’s U.S. deferred tax assets and liabilities, and reassessing the net realizability of its deferred tax assets and liabilities. In December 2017, the SEC staff issued Staff Accounting Bulletin No. 118, Income Tax Accounting Implications of the Tax Cuts and Jobs Act (SAB 118), which allows an entity to record provisional amounts during a measurement period not to extend beyond one year of the enactment date. As the Tax Act was passed late in the fourth quarter of 2017, and ongoing guidance and accounting interpretation are expected over the next 12 months, the Company considers the accounting of the transition tax, deferred tax re-measurements, and other items to be provisional, and possibly subject to material change in the future. The Company expects to complete its analysis within the measurement period in accordance with SAB 118.
Contingencies
F- 12
From time to time, the Company may be involved in legal and administrative proceedings and claims of various types. The Company records a liability in its consolidated financial statements for these matters when a loss is known or considered probable and the amount can be reasonably estimated. Management reviews these estimates in each accounting period as additional information becomes known and adjusts the loss provision when appropriate. If the loss is not probable or cannot be reasonably estimated, a liability is not recorded in the consolidated financial statements. If a loss is probable but the amount of loss cannot be reasonably estimated, the Company discloses the loss contingency and an estimate of possible loss or range of loss (unless such an estimate cannot be made). The Company does not recognize gain contingencies until they are realized. Legal costs incurred in connection with loss contingencies are expensed as incurred. See Note 15 – "Commitments and Contingencies,” for further information regarding the Company’s pending litigation.
Property and Equipment
Property and equipment are recorded at cost, less accumulated depreciation. Depreciation is calculated using the straight-line method over the related assets' estimated useful lives:
Equipment, furniture and other | 1 to 5 years | |
Leasehold improvements | Lesser of related lease term or 5 years | |
Building and improvements | Up to 30 years | |
Expenditures that materially increase asset life are capitalized, while ordinary maintenance and repairs are expensed as incurred.
Foreign Currency Translation
The functional currency of substantially all of the Company's wholly-owned subsidiaries is the U.S. dollar. Certain subsidiaries have monetary assets and liabilities that are denominated in a currency that is different than the functional currency. The gains and losses resulting from this remeasurement and translation of monetary assets denominated in a currency that is different than the functional currency are reflected in the determination of net income (loss).
NOTE 3 – RECENT ACCOUNTING PRONOUNCEMENTS
Recently Adopted Accounting Pronouncements
In March 2016, the FASB issued ASU No. 2016-09, Compensation - Stock Compensation (Topic 718) (“ASU 2016-09”). ASU 2016-09 identifies areas for simplification involving several aspects of accounting for share-based payment transactions, including the income tax consequences, classification of awards as either equity or liabilities, an option to recognize gross stock compensation expense with actual forfeitures recognized as they occur, as well as certain classifications on the statement of cash flows. The Company adopted this update, on a prospective basis, effective January 1, 2017. The cumulative impact of this update was an adjustment of $0.8 million to retained earnings. As required by the standard, stock-based compensation ("SBC") excess tax benefits or deficiencies are now reflected in the Consolidated Statements of Operations as a component of the provision for (benefit from) income taxes, whereas they previously were recognized in equity. Additionally, the Company’s Consolidated Statements of Cash Flows now present excess tax benefits as an operating activity, with the prior periods adjusted accordingly. Finally, as permitted under the standard, the Company will continue to estimate forfeitures at each period. As a result of the adoption of the standard, the Company's Consolidated Statements of Cash Flows for the years ended December 31, 2016 and 2015 were adjusted as follows: an $8.2 million and a $0.7 million increase to net cash provided by operating activities, respectively, and an $8.2 million and a $0.7 million increase to net cash used in financing activities, respectively.
In November 2016, the FASB issued ASU No. 2016-18, "Statement of Cash Flows - Restricted Cash." This ASU provides guidance on the classification and presentation of changes in restricted cash and cash equivalents in the statement of cash flows. The Company chose to early adopt this standard effective January 1, 2017. There was no restricted cash at December 31, 2017 and 2016.
In January 2017, the FASB issued ASU No. 2017-04 to simplify the measurement of goodwill by eliminating the Step 2 impairment test. Step 2 measures a goodwill impairment loss by comparing the implied fair value of a reporting unit’s goodwill with the carrying amount of that goodwill. The new guidance requires an entity to compare the fair value of a reporting unit with its carrying amount and recognize an impairment charge for the amount by which the carrying amount exceeds the
F- 13
reporting unit’s fair value. Additionally, an entity should consider income tax effects from any tax deductible goodwill on the carrying amount of the reporting unit when measuring the goodwill impairment loss, if applicable. The new guidance becomes effective for goodwill impairment tests in fiscal years beginning after December 15, 2019, though early adoption is permitted. The Company chose to early adopt this standard in conjunction with its annual goodwill impairment testing in the fourth quarter of 2017. The adoption of this standard did not have a material impact on its consolidated financial statements. See Note 9 -- "Goodwill and Identified Intangible Assets,” for further information.
Recent Accounting Pronouncements
In May 2014, the FASB issued ASU No. 2014-09, "Revenue from Contracts with Customers" (“ASU 2014-09”), which provides guidance for revenue recognition. ASU 2014-09 affects any entity that either enters into contracts with customers to transfer goods or services or enters into contracts for the transfer of nonfinancial assets and supersedes the revenue recognition requirements in Topic 605, “Revenue Recognition,” and most industry-specific guidance. This ASU also supersedes some cost guidance included in Subtopic 605-35, “Revenue Recognition-Construction-Type and Production-Type Contracts.” The core principle of ASU 2014-09 is that a company will recognize revenue when it transfers promised goods or services to customers in an amount that reflects the consideration to which a company expects to be entitled in exchange for those goods or services. In doing so, companies will need to use more judgment and make more estimates than under today’s guidance, including identifying performance obligations in the contract, estimating the amount of variable consideration to include in the transaction price and allocating the transaction price to each separate performance obligation. The FASB has further clarified this new guidance for revenue recognition by issuing ASU No. 2016-08 (principal versus agent considerations), ASU No. 2016-10 (identifying performance obligations and licensing), ASU No. 2016-12 (narrow-scope improvements and practical expedients), and ASU No. 2016-20 (technical corrections and improvements to Topic 606). The new standard is effective for the Company beginning January 1, 2018. Under the prior standard, licensing companies generally report revenue from per-unit royalty based arrangements one quarter in arrears. Under the new guidance, the Company will be expected to estimate per-unit royalty-based revenue prior to receiving customer royalty reports. The Company also expects the standard to have a significant impact on the timing of revenue recognition associated with its fixed fee and minimum guarantee arrangements, as a majority of such revenue which is currently recognized over the license term, is expected to be recognized at the inception of the license term. The Company will adopt this standard in fiscal year 2018 using the modified retrospective method, under which the Company will record a cumulative-effect adjustment to the opening balance of retained earnings on January 1, 2018 determined on the basis of the impact of the new standard on those contracts that are not completed as of December 31, 2017. The Company has completed its review of contracts and currently expects this one-time adjustment to be between $285 million to $295 million. The Company expects this new standard to have a material impact on its revenue and net income (losses) on an ongoing basis, but no impact on the timing of customer billings or on its cash flows.
In February 2016, the FASB issued ASU No. 2016-02, "Leases" (Topic 842) (ASU 2016-02), which generally requires companies to recognize operating and financing lease liabilities and corresponding right-of-use assets on the balance sheet. This guidance will be effective for us in the first quarter of 2019 on a modified retrospective basis, and early adoption is permitted. The Company will adopt the new standard effective January 1, 2019. While the Company continues to evaluate the effect of adopting this guidance on its consolidated financial statements and related disclosures, it is expected the Company's operating leases, as disclosed in Note 15 - "Commitments and Contingencies," will be subject to the new standard. The Company will recognize right-of-use assets and operating lease liabilities on its consolidated balance sheets upon adoption, which will increase its total assets and liabilities.
In August 2016, the FASB issued ASU No. 2016-15, Statement of Cash Flows (Topic 230): Classification of Certain Cash Receipts and Cash Payments. This ASU addresses the classification of certain specific cash flow issues including debt prepayment or extinguishment costs, settlement of certain debt instruments, contingent consideration payments made after a business combination, proceeds from the settlement of certain insurance claims and distributions received from equity method investees. This ASU is effective for fiscal years beginning after December 15, 2017, and interim periods within those fiscal years, with early adoption permitted. An entity that elects early adoption must adopt all of the amendments in the same period. The Company currently does not expect adoption of this standard will have a material impact on its consolidated financial statements.
In September 2016, the FASB issued ASU No. 2016-13, Financial Instruments - Credit Losses (Topic 326): Measurement of Credit Losses on Financial Instruments (“ASU 2016-13”), which introduces an approach based on expected losses to estimate credit losses on certain types of financial instruments. It also modifies the impairment model for available-for-sale debt securities and provides for a simplified accounting model for purchased financial assets with credit deterioration since their origination. ASU 2016-13 is effective for the Company in the first quarter of the year ending December 31, 2020. The
F- 14
Company is in the process of evaluating the impact of the adoption of this new standard on its consolidated financial statements.
In October 2016, the FASB issued ASU No. 2016-16, "Intra-Entity Transfers of Assets Other Than Inventory." This ASU requires entities to recognize the income tax consequences of an intra-entity transfer of an asset other than inventory when the transfer occurs. For public entities, this ASU is effective for annual reporting periods beginning after December 15, 2017, including interim reporting periods within those annual reporting periods. Early adoption is permitted for all entities as of the beginning of an annual reporting period for which financial statements have not been issued. The Company does not expect that the adoption of this standard will have a material impact on its consolidated financial statements.
In May 2017, the FASB issued ASU No. 2017-09, Compensation-Stock Compensation (Topic 718) Scope of Modification Accounting (ASU 2017-09). ASU 2017-09 provides guidance about which changes to the terms or conditions of a share-based payment awarded require an entity to apply modification accounting. The standard is effective for interim and annual reporting periods beginning after December 15, 2017, with early adoption permitted. The Company intends to adopt the standard prospectively after the effective date and does not expect adoption of this standard will have a material impact on its consolidated financial statements.
NOTE 4 – COMPOSITION OF CERTAIN FINANCIAL STATEMENT CAPTIONS
Other current assets consisted of the following (in thousands):
December 31, 2017 | December 31, 2016 | ||||||
Prepaid income taxes | $ | 6,713 | $ | 6,645 | |||
Prepaid expenses | 6,655 | 6,609 | |||||
Other | 3,581 | 5,896 | |||||
$ | 16,949 | $ | 19,150 | ||||
Property and equipment, net consisted of the following (in thousands):
December 31, | ||||||||||
2017 | 2016 | |||||||||
Equipment, furniture and other | $ | 26,029 | $ | 28,071 | ||||||
Building and improvements | 18,222 | 18,153 | ||||||||
Land | 5,300 | 5,300 | ||||||||
Leasehold improvements | 6,469 | 6,346 | ||||||||
56,020 | 57,870 | |||||||||
Less: Accumulated depreciation and amortization | (21,578 | ) | (19,015 | ) | ||||||
$ | 34,442 | $ | 38,855 | |||||||
Depreciation and amortization expense for the years ended December 31, 2017, 2016 and 2015 amounted to $7.2 million, $2.3 million and $1.6 million, respectively.
Accrued liabilities consisted of the following (in thousands):
December 31, 2017 | December 31, 2016 | ||||||
Employee compensation and benefits | $ | 37,056 | $ | 18,584 | |||
Accrued interest | — | 2,200 | |||||
Other | 10,913 | 8,302 | |||||
$ | 47,969 | $ | 29,086 | ||||
F- 15
Accumulated other comprehensive loss consisted of the following (in thousands):
December 31, 2017 | December 31, 2016 | ||||||
Net unrealized loss on available-for-sale securities, net of tax | $ | (303 | ) | $ | (148 | ) | |
$ | (303 | ) | $ | (148 | ) | ||
NOTE 5 – FINANCIAL INSTRUMENTS
The following is a summary of marketable securities at December 31, 2017 and December 31, 2016 (in thousands):
December 31, 2017 | |||||||||||||||
Cost | Gross Unrealized Gains | Gross Unrealized Losses | Estimated Fair Values | ||||||||||||
Available-for-sale securities | |||||||||||||||
Corporate bonds and notes | $ | 45,803 | $ | — | $ | (230 | ) | $ | 45,573 | ||||||
Commercial paper | 2,392 | — | (2 | ) | 2,390 | ||||||||||
Treasury and agency notes and bills | 6,000 | — | (71 | ) | 5,929 | ||||||||||
Certificates of deposit | 8,540 | — | — | 8,540 | |||||||||||
Money market funds | 40,413 | — | — | 40,413 | |||||||||||
Total available-for-sale securities | $ | 103,148 | $ | — | $ | (303 | ) | $ | 102,845 | ||||||
Reported in: | |||||||||||||||
Cash and cash equivalents | $ | 40,413 | |||||||||||||
Short-term investments | 62,432 | ||||||||||||||
Total marketable securities | $ | 102,845 | |||||||||||||
December 31, 2016 | |||||||||||||||
Cost | Gross Unrealized Gains | Gross Unrealized Losses | Estimated Fair Values | ||||||||||||
Available-for-sale securities | |||||||||||||||
Corporate bonds and notes | $ | 36,590 | $ | 7 | $ | (95 | ) | $ | 36,502 | ||||||
Commercial paper | 5,220 | — | (4 | ) | 5,216 | ||||||||||
Treasury and agency notes and bills | 6,029 | — | (57 | ) | 5,972 | ||||||||||
Money market funds | 14,146 | — | — | 14,146 | |||||||||||
Total available-for-sale securities | $ | 61,985 | $ | 7 | $ | (156 | ) | $ | 61,836 | ||||||
Reported in: | |||||||||||||||
Cash and cash equivalents | $ | 14,457 | |||||||||||||
Short-term investments | 47,379 | ||||||||||||||
Total marketable securities | $ | 61,836 | |||||||||||||
At December 31, 2017 and December 31, 2016, the Company had $200.7 million and $113.0 million, respectively, in cash, cash equivalents and short-term investments. A significant portion of these amounts was held in marketable securities, as shown above. The remaining balance of $97.8 million and $51.2 million at December 31, 2017 and December 31, 2016, respectively, was cash held in operating accounts not included in the tables above.
The gross realized gains and losses on sales of marketable securities were not significant during the years ended December 31, 2017, 2016 and 2015.
F- 16
Unrealized losses (net of unrealized gains) of $0.3 million, net of tax, as of December 31, 2017, were related to a temporary decrease in value of the remaining available-for-sale securities and were due primarily to changes in interest rates and market and credit conditions of the underlying securities. Certain investments with a temporary decline in value are not considered to be other-than-temporarily impaired as of December 31, 2017 because the Company has the ability to hold these investments to allow for recovery, and does not anticipate having to sell these securities with unrealized losses and continues to receive interest at the maximum contractual rate. For the years ended December 31, 2017, 2016 and 2015, respectively, the Company did not record any impairment charges related to its marketable securities.
The following table summarizes the fair value and gross unrealized losses related to individual available-for-sale securities at December 31, 2017 and 2016, which have been in a continuous unrealized loss position, aggregated by investment category and length of time (in thousands):
December 31, 2017 | Less Than 12 Months | 12 Months or More | Total | ||||||||||||||||||||
Fair Value | Gross Unrealized Losses | Fair Value | Gross Unrealized Losses | Fair Value | Gross Unrealized Losses | ||||||||||||||||||
Corporate bonds and notes | $ | 30,811 | $ | (189 | ) | $ | 14,762 | $ | (41 | ) | $ | 45,573 | $ | (230 | ) | ||||||||
Treasury and agency notes and bills | — | — | 5,929 | (71 | ) | 5,929 | (71 | ) | |||||||||||||||
Commercial paper | 2,390 | (2 | ) | — | — | 2,390 | (2 | ) | |||||||||||||||
Total | $ | 33,201 | $ | (191 | ) | $ | 20,691 | $ | (112 | ) | $ | 53,892 | $ | (303 | ) | ||||||||
December 31, 2016 | Less Than 12 Months | 12 Months or More | Total | ||||||||||||||||||||
Fair Value | Gross Unrealized Losses | Fair Value | Gross Unrealized Losses | Fair Value | Gross Unrealized Losses | ||||||||||||||||||
Corporate bonds and notes | $ | 14,678 | $ | (44 | ) | $ | 13,230 | $ | (51 | ) | $ | 27,908 | $ | (95 | ) | ||||||||
Treasury and agency notes and bills | 5,972 | (57 | ) | — | — | 5,972 | (57 | ) | |||||||||||||||
Commercial paper | 5,216 | (4 | ) | — | — | 5,216 | (4 | ) | |||||||||||||||
Total | $ | 25,866 | $ | (105 | ) | $ | 13,230 | $ | (51 | ) | $ | 39,096 | $ | (156 | ) | ||||||||
The estimated fair value of marketable securities by contractual maturity at December 31, 2017 is shown below (in thousands). Actual maturities may differ from contractual maturities because issuers may have the right to call or prepay obligations without call or prepayment penalties.
Estimated Fair Value | |||
Due in one year or less | $ | 73,889 | |
Due in one to two years | 19,180 | ||
Due in two to three years | 9,776 | ||
Total | $ | 102,845 | |
NOTE 6 – DISCONTINUED OPERATIONS
The following are included in the Company's discontinued operations:
• | In 2014, the Company announced the cessation of all mems|cam manufacturing operations. As part of these efforts, the Company is no longer operating facilities in Arcadia, California, Rochester, New York, Hsinchu, Taiwan and Japan. All material assets of these operations were sold or licensed to a third party in December 2014. Discontinued operations were fully completed in 2015. |
F- 17
The business discussed above is considered discontinued operations, and accordingly, the Company has reported the results of operations and financial position of these businesses in discontinued operations within all statements of operations presented and the current balance sheet.
The results from discontinued operations were as follows (in thousands):
Years Ended December 31, | |||||||||||||
2017 | 2016 | 2015 | |||||||||||
Revenue: | |||||||||||||
Product and service revenues | $ | — | $ | — | $ | — | |||||||
Total revenue | — | — | — | ||||||||||
Operating expenses: | |||||||||||||
Cost of revenue | — | — | — | ||||||||||
Research, development and other related costs | — | — | — | ||||||||||
Selling, general and administrative | — | — | 389 | ||||||||||
Restructuring, impairment of long-lived assets and other charges and gain on sale of patents | — | — | (371 | ) | (1 | ) | |||||||
Impairment of goodwill | — | — | — | ||||||||||
Total operating expenses | — | — | 18 | ||||||||||
Other income and (expense), net | — | — | — | ||||||||||
Operating loss before taxes | — | — | (18 | ) | |||||||||
Expense (benefit) from income taxes | — | — | 83 | ||||||||||
Net loss from discontinued operations | $ | — | $ | — | $ | (101 | ) | ||||||
(1) As noted above, the Company underwent restructuring activities in 2014. Additionally, the Company sold assets and the proceeds are netted against expenses. Discontinued operations were fully completed in 2015.
There were no assets or liabilities associated with discontinued operations at December 31, 2017 and 2016.
NOTE 7 – FAIR VALUE
The Company follows the authoritative guidance fair value measurement and the fair value option for financial assets and financial liabilities. Fair value is defined as the exchange price that would be received for an asset or paid to transfer a liability, or an exit price, in the principal or most advantageous market for the asset or liability in an orderly transaction between market participants on the measurement date. The established fair value hierarchy requires an entity to maximize the use of observable inputs and minimize the use of unobservable inputs when measuring fair value. There are three levels of inputs that may be used to measure fair value:
Level 1 | Quoted prices in active markets for identical assets. | |
Level 2 | Observable market-based inputs or unobservable inputs that are corroborated by market data. | |
Level 3 | Unobservable inputs that are supported by little or no market activity and that are significant to the fair value of the assets. Level 3 assets and liabilities include financial instruments whose value is determined using pricing models, discounted cash flow methodologies, or similar techniques, as well as instruments for which the determination of fair value requires significant management judgment or estimation. | |
When applying fair value principles in the valuation of assets, the Company is required to maximize the use of quoted market prices and minimize the use of unobservable inputs. The Company calculates the fair value of its Level 1 and Level 2 instruments based on the exchange traded price of similar or identical instruments, where available, or based on other observable inputs. There were no significant transfers into or out of Level 1 or Level 2 that occurred between December 31, 2016 and December 31, 2017.
F- 18
The following is a list of the Company’s assets required to be measured at fair value on a recurring basis and where they were classified within the hierarchy as of December 31, 2017 (in thousands):
Fair Value | Quoted Prices in Active Markets for Identical Assets (Level 1) | Significant Other Observable Inputs (Level 2) | Significant Unobservable Inputs (Level 3) | ||||||||||||
Assets | |||||||||||||||
Marketable securities | |||||||||||||||
Money market funds (1) | $ | 40,413 | $ | 40,413 | $ | — | $ | — | |||||||
Certificates of deposit (2) | 8,540 | — | 8,540 | — | |||||||||||
Corporate bonds and notes (2) | 45,573 | — | 45,573 | — | |||||||||||
Treasury and agency notes and bills (2) | 5,929 | — | 5,929 | — | |||||||||||
Commercial paper (2) | 2,390 | — | 2,390 | — | |||||||||||
Total Assets | $ | 102,845 | $ | 40,413 | $ | 62,432 | $ | — | |||||||
The following footnotes indicate where the noted items were recorded in the Consolidated Balance Sheet at December 31, 2017:
(1) | Reported as cash and cash equivalents. |
(2) | Reported as short-term investments. |
The following is a list of the Company’s assets required to be measured at fair value on a recurring basis and where they were classified within the hierarchy as of December 31, 2016 (in thousands):
Fair Value | Quoted Prices in Active Markets for Identical Assets (Level 1) | Significant Other Observable Inputs (Level 2) | Significant Unobservable Inputs (Level 3) | ||||||||||||
Assets | |||||||||||||||
Marketable securities | |||||||||||||||
Money market funds (1) | $ | 14,146 | $ | 14,146 | $ | — | $ | — | |||||||
Corporate bonds and notes (2) | 36,502 | — | 36,502 | — | |||||||||||
Treasury and agency notes and bills (2) | 5,972 | — | 5,972 | — | |||||||||||
Commercial paper (2) | 5,216 | — | 5,216 | — | |||||||||||
Total Assets | $ | 61,836 | $ | 14,146 | $ | 47,690 | $ | — | |||||||
The following footnotes indicate where the noted items were recorded in the Consolidated Balance Sheet at December 31, 2016:
(1) | Reported as cash and cash equivalents. |
(2) | Reported as short-term investments. |
The Company also has outstanding debt at December 31, 2017 and 2016 that is considered a level 2 liability and is measured at fair value on a recurring basis. See Note 10 " Debt" for additional information. At December 31, 2017 and 2016, the fair value of the Company's debt is not materially different than the outstanding principal amount.
Non-Recurring Fair Value Measurements
The following table represents the activity in level 3 assets (in thousands):
F- 19
Assets held for sale | Assets included in discontinued operations and held for sale | Other | ||||||||||||
Balance at December 31, 2015 | $ | — | $ | — | $ | 4,280 | ||||||||
Assets transferred | — | — | — | |||||||||||
Assets sold | — | — | — | |||||||||||
Assets received | — | — | — | |||||||||||
Balance at December 31, 2016 | $ | — | $ | — | $ | 4,280 | (1 | ) | ||||||
Assets transferred | — | — | — | |||||||||||
Assets sold | — | — | — | |||||||||||
Assets received | — | — | 1,664 | (2 | ) | |||||||||
Balance at December 31, 2017 | $ | — | $ | — | $ | 5,944 | (3 | ) | ||||||
(1) This amount represents the value of the patents that were received as part of licensing settlements with customers. These assets were valued using a methodology based on an arms-length purchase price of bulk patent assets, with adjustments based on limited pick rights, the total available market, and remaining average patent life.
(2) This amount represents the value of patents received as part of a licensing settlement with a customer. These assets were valued using a cost methodology based on prior arms-length patent purchases by both the company and other third party acquirers.
(3) The accumulated amortization associated with the patents was $2.3 million and $1.6 million as of December 31, 2017 and 2016, respectively.
NOTE 8 - BUSINESS COMBINATIONS
DTS, Inc.
On December 1, 2016, the Company completed its acquisition of DTS for approximately $955 million, net of $53.4 million in cash acquired. DTS is a premier audio technology solutions provider for high-definition entertainment experiences. The transaction combined DTS's advanced audio technologies with the Company's existing complementary products, technologies, customer channels and intellectual property assets to enable the creation of an expanded, integrated platform to invent the future of smart sight and sound.
Purchase Price Allocation
The acquisition was accounted for under the acquisition method of accounting. Based upon the fair values acquired, the purchase price allocation is as follows (in thousands):
F- 20
Estimated Useful Life (years) | Preliminary Fair Value | Measurement Period Adjustments (1) | Final Fair Value | |||||||||||||
Cash and cash equivalents | $ | 53,377 | $ | — | $ | 53,377 | ||||||||||
Accounts receivable | 27,114 | 27,114 | ||||||||||||||
Unbilled contracts receivable, short-term | 52,845 | (3,964 | ) | (2 | ) | 48,881 | ||||||||||
Other current assets | 5,269 | 5,269 | ||||||||||||||
Prepaid income taxes | 3,278 | 3,278 | ||||||||||||||
Property and equipment | 33,573 | 33,573 | ||||||||||||||
Goodwill | 372,827 | 2,611 | (3 | ) | 375,438 | |||||||||||
Identifiable intangible assets: | ||||||||||||||||
Customer contracts and related relationships | 3-7 | 281,569 | ||||||||||||||
Developed technology | 5-6 | 143,639 | ||||||||||||||
Trademarks and tradenames | 8 | 38,483 | ||||||||||||||
Noncompete agreements | 1 | 2,231 | ||||||||||||||
In-process research and development (IPR&D) | 3,156 | |||||||||||||||
Total identifiable intangible assets | 469,078 | 469,078 | ||||||||||||||
Long-term deferred tax assets | 637 | 637 | ||||||||||||||
Unbilled contracts receivable, long-term | 12,464 | 12,464 | ||||||||||||||
Other assets | 4,423 | 4,423 | ||||||||||||||
Accounts payable | (4,006 | ) | (4,006 | ) | ||||||||||||
Accrued liabilities | (19,727 | ) | (179 | ) | (4 | ) | (19,906 | ) | ||||||||
Deferred revenue | (561 | ) | (561 | ) | ||||||||||||
Income taxes payable | (727 | ) | (727 | ) | ||||||||||||
Long-term deferred tax liabilities | (39,822 | ) | 1,532 | (5 | ) | (38,290 | ) | |||||||||
Other long-term liabilities | (15,337 | ) | (15,337 | ) | ||||||||||||
Aggregate purchase price | $ | 954,705 | $ | — | $ | 954,705 | ||||||||||
______________________________________
(1) All adjustments were recorded within the Company's consolidated balance sheet in 2017.
(2) Primarily consists of adjustment to estimates relating to products licensed by DTS prior to the acquisition date of December 1, 2016, which were reported to the Company subsequent to the acquisition date.
(3) Represents the net impact to goodwill of all measurement period adjustments recorded.
(4) Consists of miscellaneous working capital and other immaterial adjustments.
(5) Consists primarily of adjustments for the related tax impact of the measurement period adjustments noted above, and for the finalization of the analysis relating to certain acquired tax attributes and related uncertain income tax positions.
Supplemental Pro Forma Information
The following unaudited pro forma financial information assumes the companies were combined as of January 1, 2015 and includes the impact of purchase accounting and other material nonrecurring adjustments directly attributable to the acquisition. The unaudited pro forma financial information as presented below is for informational purposes only and is based on estimates and assumptions that have been made solely for purposes of developing such pro forma information. This is not necessarily indicative of the results of operations that would have been achieved if the acquisition had taken place at the beginning of 2015, nor is it necessarily indicative of future results. Consequently, actual results could differ materially from the unaudited pro forma financial information presented below. The following table presents the pro forma operating results as if DTS had been included in the Company's consolidated statements of operations as of January 1, 2015 (unaudited, in thousands):
F- 21
Revenue | Earnings | |||||||||||
Actual for the year ended December 31, 2015 | $ | 273,300 | $ | 117,016 | ||||||||
Actual for the year ended December 31, 2016 | $ | 259,565 | (1) | $ | 56,089 | (1) | ||||||
Supplemental pro forma for the year ended December 31, 2015 (unaudited) | $ | 358,911 | (2) | $ | (38,139 | ) | (2)(3)(4) | |||||
Supplemental pro forma for the year ended December 31, 2016 (unaudited) | $ | 434,971 | (2) | $ | 17 | (2)(3)(4) | ||||||
(1) Unless otherwise stated, the Company's financial results for 2016 include DTS from December 1, 2016 to December 31, 2016. Revenue recognized from licensing agreements acquired from DTS amounted to $0.2 million for the year ended December 31, 2016. Earnings of DTS included in the consolidated statement of operations for the year ended December 31, 2016 was a loss of $22.7 million.
(2) Reflects estimated reduction to historical combined revenue of $52.6 million and $12.6 million for 2015 and 2016, respectively, primarily relating to the estimated impact of purchase accounting on acquired minimum guarantee arrangements and per-unit royalties associated with licensee products manufactured or sold prior to January 1, 2015.
(3) Reflects the following pro forma adjustments to historical combined expenses (unaudited, in thousands):
2015 | 2016 | |||||||||
Estimated increase in combined amortization and depreciation expense due to acquired intangible assets and property and equipment measured at fair value | $ | 75,975 | $ | 59,092 | ||||||
Estimated increase in combined stock-based compensation expense due to assumed DTS equity awards measured at fair value | $ | 6,888 | $ | 4,781 | ||||||
Estimated increase in combined interest and other expense, net due to estimated increase in interest expense (and amortization of debt issuance costs) from new debt obtained to finance the Transaction and estimated lower interest income from lower investment holdings | $ | 28,964 | $ | 24,806 | ||||||
Elimination of Tessera and DTS non-recurring transaction costs reflected in historical results | $ | — | $ | (27,900 | ) | |||||
Estimated increase (decrease) to combined expense for non-recurring employee-related costs resulting from the acquisition, including severance and retention bonus expense | $ | 21,100 | $ | (3,436 | ) | |||||
(4) The tax effects of the pro forma adjustments are estimated using a weighted-average statutory tax rate of 23%.
Ziptronix
On August 27, 2015, the Company completed its acquisition of Ziptronix, Inc. (“Ziptronix”) for approximately $39 million in cash, net of $1.5 million in working capital (which included $1.9 million in cash) acquired. Approximately $0.7 million of the consideration was withheld until certain employees complete the term of their employment obligations. The acquisition expanded the Company's existing advanced packaging capabilities by adding a low-temperature wafer bonding technology platform that will accelerate delivery of 2.5D and 3D-IC solutions to semiconductor industry customers.
NOTE 9 – GOODWILL AND IDENTIFIED INTANGIBLE ASSETS
In 2017, the Company assessed goodwill impairment for its segments by performing a qualitative assessment. No impairment of goodwill was indicated as the Company concluded that it was more likely than not that the fair value of its reporting units exceeded its carrying amount. In addition, there have been no significant events or circumstances affecting the valuation of goodwill subsequent to the impairment testing performed in the fourth quarter of the year ended December 31, 2017.
The changes to the carrying value of goodwill from January 1, 2016 through December 31, 2017 are reflected below (in thousands):
December 31, 2015 | $ | 10,136 | |||
Goodwill acquired through the acquisition of DTS (1) | 372,827 | ||||
December 31, 2016 | $ | 382,963 | |||
Purchase price adjustment related to the acquisition of DTS (2) | 2,611 | (2) | |||
December 31, 2017 | $ | 385,574 | (3) | ||
F- 22
(1) For more information regarding these transactions, see Note 8 - " Business Combinations."
(2) Represents the net impact to goodwill of all measurement adjustments, primarily relating to unbilled contracts receivable and to certain acquired tax attributes and related uncertain income tax positions. See Note 8 - "Business Combinations."
(3) Of this amount, approximately $377.9 million is allocated to the Company's Product Licensing reporting segment and approximately $7.7 million is allocated to its Semiconductor and IP Licensing reporting segment.
Identified intangible assets consisted of the following (in thousands):
December 31, 2017 | December 31, 2016 | ||||||||||||||||||||||||
Average Life (Years) | Gross Assets | Accumulated Amortization | Net | Gross Assets | Accumulated Amortization | Net | |||||||||||||||||||
Acquired patents / core technology | 3-15 | $ | 142,584 | $ | (113,349 | ) | $ | 29,235 | $ | 140,744 | $ | (96,896 | ) | $ | 43,848 | ||||||||||
Existing technology | 5-10 | 204,394 | (61,518 | ) | 142,876 | 203,442 | (27,315 | ) | 176,127 | ||||||||||||||||
Customer contracts and related relationships | 3-9 | 291,769 | (68,267 | ) | 223,502 | 291,769 | (14,011 | ) | 277,758 | ||||||||||||||||
Trademarks/trade name | 4-10 | 40,083 | (6,111 | ) | 33,972 | 40,083 | (1,138 | ) | 38,945 | ||||||||||||||||
Non-competition agreements | 1 | 2,231 | (2,231 | ) | — | 2,231 | (186 | ) | 2,045 | ||||||||||||||||
Total amortizable intangible assets | 681,061 | (251,476 | ) | 429,585 | 678,269 | (139,546 | ) | 538,723 | |||||||||||||||||
In-Process R&D | 2,204 | — | 2,204 | $ | 3,156 | $ | — | $ | 3,156 | ||||||||||||||||
Total intangible assets | $ | 683,265 | $ | (251,476 | ) | $ | 431,789 | $ | 681,425 | $ | (139,546 | ) | $ | 541,879 | |||||||||||
Amortization expense for the years ended December 31, 2017, 2016, and 2015 amounted to $111.9 million, $31.9 million and $20.6 million, respectively. As of December 31, 2017, the estimated future amortization expense of intangible assets is as follows (in thousands):
2018 | $ | 107,941 | |
2019 | 98,855 | ||
2020 | 87,140 | ||
2021 | 79,478 | ||
2022 | 31,173 | ||
Thereafter | 24,998 | ||
$ | 429,585 | ||
NOTE 10 – DEBT
On December 1, 2016, in connection with the consummation of the acquisition of DTS, the Company entered into a Credit Agreement (the “Credit Agreement”) by and among the Company, Royal Bank of Canada, as administrative agent and collateral agent, and the lenders party thereto.
The Credit Agreement provided for a $600 million seven-year term B loan facility (the “Term B Loan Facility”). The interest rates applicable to loans outstanding under the Credit Agreement with respect to the Term B Loan Facility are (i) until the delivery of financial statements for the first full fiscal quarter ending after December 1, 2016 equal to, at the Company's option, either a base rate plus a margin of 2.25% per annum or LIBOR plus a margin of 3.25% per annum (the “Effective Date Margin”) and (ii) thereafter, (x) the Effective Date Margin or (y) so long as the ratio of consolidated indebtedness of the Company (minus all unrestricted cash and cash equivalents) to consolidated EBITDA (subject to other customary adjustments) is equal to or less than 1.50 to 1.00, equal to, at the Company's option either a base rate plus a margin of 2.00% per annum or LIBOR plus a margin of 3.00% per annum. Commencing March 31, 2017, the Term B Loan Facility will amortize in equal quarterly installments in aggregate quarterly amounts equal to 0.25% of the original principal amount of the Term B Loan
F- 23
Facility, with the balance payable on the maturity date of the Term B Loan Facility (in each case subject to adjustment for prepayments). The Term B Loan Facility matures on November 30, 2023.
Upon the closing of the Credit Agreement, the Company borrowed $600 million under the Term B Loan facility. Net proceeds were used on December 1, 2016, together with cash and cash equivalents, to finance the acquisition of DTS.
The obligations under the Credit Agreement are guaranteed by the Company pursuant to the Guaranty (the “Guaranty”), dated December 1, 2016, among the Company, Royal Bank of Canada, as administrative agent, and the other subsidiary guarantors party thereto. The obligations under the Credit Agreement are guaranteed by substantially all of the assets of the Company pursuant to the Security Agreement (the “Security Agreement”), dated December 1, 2016, among the Company, Royal Bank of Canada, as collateral agent, and the other pledgors party thereto.
The Credit Agreement contains customary events of default, upon the occurrence of which, after any applicable grace period, the lenders will have the ability to accelerate all outstanding loans thereunder.
The Credit Agreement contains customary representations and warranties and affirmative and negative covenants that, among other things, restrict the ability of the Company to create or incur certain liens, incur or guarantee additional indebtedness, merge or consolidate with other companies, transfer or sell assets and make restricted payments. These covenants are subject to a number of limitations and exceptions set forth in the Credit Agreement. The Company was in compliance with all requirements during the year ended December 31, 2017.
At December 31, 2017, $594 million was outstanding with an interest rate, including the amortization of debt issuance costs, of 5.0%. Interest is payable quarterly. There were also $14.3 million of unamortized debt issuance costs. Interest expense for 2017 was $28.3 million which includes $2.4 million in amortized debt issuance costs.
As of December 31, 2017, future minimum principal payments for long-term debt, including the current portion, are summarized as follows (in thousands):
2018 | $ | 34,451 | |
2019 | 6,000 | ||
2020 | 6,000 | ||
2021 | 6,000 | ||
2022 | 6,000 | ||
Thereafter | 535,549 | ||
Total | $ | 594,000 | |
Additional payments of debt principal must be made in the event of certain working capital conditions as outlined in the Credit Agreement. There are no penalties for these payments. There were no such additional payments made during the year ended December 31, 2017.
As disclosed in Note 18 - " Subsequent Events," the Company completed a repricing of its Term B Loans subsequent to year-end, reducing its borrowing rate by 75 basis points, to a new rate of Libor plus 250 basis points. In connection with the repricing, the Company paid down $100 million of its outstanding debt and incurred $1.1 million in third party costs.
NOTE 11 – NET INCOME (LOSS) PER SHARE
The Company has a share-based compensation plan under which employees may be granted share-based awards including shares of restricted stock and restricted stock units ("RSUs"). Non-forfeitable dividends are paid on unvested shares of restricted stock. No dividends are accrued or paid on unvested RSUs. As such, shares of restricted stock are considered participating securities under the two-class method of calculating earnings per share. The two-class method of calculating earnings per share did not have a material impact on the Company’s earnings per share calculation as of December 31, 2017, 2016 and 2015.
The following table sets forth the computation of basic and diluted shares (in thousands):
F- 24
Years Ended December 31, | ||||||||
2017 | 2016 | 2015 | ||||||
Weighted average common shares outstanding | 49,253 | 49,203 | 51,841 | |||||
Unvested common shares subject to repurchase | (2 | ) | (16 | ) | (39 | ) | ||
Total common shares-basic | 49,251 | 49,187 | 51,802 | |||||
Effect of dilutive securities: | ||||||||
Options | — | 357 | 343 | |||||
Restricted stock awards and units | — | 646 | 441 | |||||
Total common shares-diluted | 49,251 | 50,190 | 52,586 | |||||
Basic net income (loss) per share is computed using the weighted average number of common shares outstanding during the period, excluding any unvested restricted stock awards that are subject to repurchase. Diluted net income (loss) per share is computed using the treasury stock method to calculate the weighted average number of common shares and, if dilutive, potential common shares outstanding during the period. Potential dilutive common shares include unvested restricted stock awards and units and incremental common shares issuable upon the exercise of stock options, less shares from assumed proceeds. The assumed proceeds calculation includes actual proceeds to be received from the employee upon exercise and the average unrecognized stock compensation cost during the period.
For the year ended December 31, 2017, there was no difference in the weighted average number of common shares used for the calculation of basic and diluted loss per share as the effect of all potentially dilutive shares outstanding was anti-dilutive. A total of 3.0 million shares subject to stock options and restricted stock awards and units were excluded from the computation of diluted net loss per share because including them would have been anti-dilutive.
For the years ended December 31, 2016 and 2015 in the calculation of net income per share, 0.7 million and 0.1 million shares, respectively, subject to stock options and restricted stock awards and units were excluded from the computation of diluted net income per share as they were anti-dilutive.
NOTE 12 – STOCKHOLDERS’ EQUITY
Stock Repurchase Programs
In August 2007, the Company’s Board of Directors (“the Board”) authorized a plan to repurchase the Company’s outstanding shares of common stock dependent on market conditions, share price and other factors. As of December 31, 2017, the total amount authorized for repurchases is $450.0 million. As of December 31, 2017, the Company had repurchased a total of approximately 11,142,000 shares of common stock, since inception of the plan, at an average price of $27.57 per share for a total cost of $307.2 million. As of December 31, 2016, the Company had repurchased a total of approximately 10,488,000 shares of common stock, since inception of the plan, at an average price of $27.83 per share for a total cost of $291.8 million. The shares repurchased are recorded as treasury stock and are accounted for under the cost method. No expiration date has been specified for this plan. As of December 31, 2017, the total amount available for repurchase was $142.8 million. The Company plans to continue to execute authorized repurchases from time to time under the plan.
Stock Option Plans
The 2003 Plan
In February 2003, the Board adopted and the Company’s stockholders approved the 2003 Equity Incentive Plan (“2003 Plan”). Under the 2003 Plan, incentive stock options may be granted to the Company’s employees at an exercise price of no less than 100% of the fair value on the date of grant, and non-statutory stock options may be granted to the Company’s employees, non-employee directors and consultants at an exercise price of no less than 85% of the fair value. In both cases, when the optionees own stock representing more than 10% of the voting power of all classes of stock of the Company, the exercise price shall be no less than 110% of the fair value on the date of grant. Options, restricted stock awards, and restricted stock units granted under this plan generally have a term of ten years from the date of grant and vest over a four-year period. Restricted stock, performance awards, dividend equivalents, deferred stock, stock payments and stock appreciation rights may also be granted under the 2003 Plan either alone, in addition to, or in tandem with any options granted thereunder. Restricted stock awards and units are full-value awards that reduce the number of shares reserved for grant under this plan by one and one-half shares for each share granted. The vesting criteria for restricted stock awards and units is generally the passage of time or meeting certain
F- 25
performance-based objectives, and continued employment through the vesting period generally over four years. As of December 31, 2017, there were approximately 0.7 million shares reserved for future grant under this plan.
A summary of the stock option activity is presented below (in thousands, except per share amounts):
Options Outstanding | ||||||||||
Number of Shares Subject to Options | Weighted Average Exercise Price Per Share | Weighted Average Remaining Contractual Life (in years) | Aggregate Intrinsic Value | |||||||
Balance at December 31, 2014 | 1,616 | $19.34 | ||||||||
Options granted | 84 | $36.60 | ||||||||
Options exercised | (465 | ) | $19.35 | |||||||
Options canceled / forfeited / expired | (93 | ) | $19.04 | |||||||
Balance at December 31, 2015 | 1,142 | $20.63 | ||||||||
Options assumed | 586 | $29.05 | ||||||||
Options exercised | (350 | ) | $20.01 | |||||||
Options canceled / forfeited / expired | (46 | ) | $23.25 | |||||||
Balance at December 31, 2016 | 1,332 | $24.41 | ||||||||
Options granted | 70 | $22.45 | ||||||||
Options exercised | (180 | ) | $23.04 | |||||||
Options canceled / forfeited / expired | (50 | ) | $34.73 | |||||||
Balance at December 31, 2017 | 1,172 | $24.06 | 3.52 | $ | 4,538 | |||||
Vested and expected to vest at December 31, 2017 | 1,138 | 3.38 | $ | 4,482 | ||||||
Exercisable at December 31, 2017 | 950 | 2.67 | $ | 4,025 | ||||||
The following table summarizes information about stock options outstanding and exercisable under all of the Company’s plans at December 31, 2017:
Options Outstanding | Options Exercisable | |||||||||||||||
Range of Exercise Prices per Share | Number Outstanding (in thousands) | Weighted Average Remaining Contractual Life (in years) | Weighted Average Exercise Price per Share | Number Exercisable (in thousands) | Weighted Average Exercise Price per Share | |||||||||||
$12.52 - $18.65 | 122 | 4.51 | $ | 16.11 | 113 | $ | 16.06 | |||||||||
$18.74 - $18.76 | 14 | 4.08 | $ | 18.75 | 14 | $ | 18.75 | |||||||||
$18.84 - $18.84 | 367 | 0.42 | $ | 18.84 | 367 | $ | 18.84 | |||||||||
$18.89 - $19.73 | 149 | 5.41 | $ | 19.40 | 107 | $ | 19.40 | |||||||||
$20.21 - $22.19 | 143 | 5.06 | $ | 20.96 | 121 | $ | 20.84 | |||||||||
$22.24 - $26.16 | 119 | 7.89 | $ | 23.25 | 21 | $ | 25.52 | |||||||||
$27.32 - $38.65 | 105 | 4.72 | $ | 35.44 | 54 | $ | 35.28 | |||||||||
$40.87 - $40.87 | 4 | 0.13 | $ | 40.87 | 4 | $ | 40.87 | |||||||||
$41.15 - $41.15 | 6 | 1.13 | $ | 41.15 | 6 | $ | 41.15 | |||||||||
$43.77 - $43.77 | 143 | 2.78 | $ | 43.77 | 143 | $ | 43.77 | |||||||||
$12.52 - $43.77 | 1,172 | 3.52 | $ | 24.06 | 950 | $ | 23.92 | |||||||||
Restricted Stock Awards and Units
Information with respect to outstanding restricted stock awards and units as of December 31, 2017 is as follows (in thousands, except per share amounts):
F- 26
Restricted Stock and Restricted Stock Units | ||||||||||||
Number of Shares Subject to Time- based Vesting | Number of Shares Subject to Performance- based Vesting | Total Number of Shares | Weighted Average Grant Date Fair Value Per Share | |||||||||
Balance at December 31, 2014 | 502 | 633 | 1,135 | $ | 20.30 | |||||||
Awards and units granted | 472 | 90 | 562 | $ | 39.77 | |||||||
Awards and units vested / earned | (240 | ) | (144 | ) | (384 | ) | $ | 20.17 | ||||
Awards and units canceled / forfeited | (44 | ) | (60 | ) | (104 | ) | $ | 21.54 | ||||
Balance at December 31, 2015 | 690 | 519 | 1,209 | $ | 29.28 | |||||||
Awards and units granted | 596 | 86 | 682 | $ | 30.85 | |||||||
Awards assumed | 925 | — | 925 | $ | 40.13 | |||||||
Awards and units vested / earned | (398 | ) | (84 | ) | (482 | ) | $ | 32.18 | ||||
Awards and units canceled / forfeited | (117 | ) | (137 | ) | (254 | ) | $ | 29.64 | ||||
Balance at December 31, 2016 | 1,696 | 384 | 2,080 | $ | 33.91 | |||||||
Awards and units granted | 1,049 | 919 | 1,968 | $ | 32.60 | |||||||
Awards and units vested / earned | (581 | ) | (94 | ) | (675 | ) | $ | 33.70 | ||||
Awards and units canceled / forfeited | (150 | ) | (90 | ) | (240 | ) | $ | 31.07 | ||||
Balance at December 31, 2017 | 2,014 | 1,119 | 3,133 | $ | 33.35 | |||||||
Performance Awards and Units
Performance awards and units may be granted to employees or consultants based upon, among other things, the contributions, responsibilities and other compensation of the particular employee or consultant. The value and the vesting of such performance awards and units are generally linked to one or more performance goals or other specific performance goals determined by the Company, in each case on a specified date or dates or over any period or periods determined by the Company, and range from zero to 100 percent of the grant.
Employee Stock Purchase Plans
In August 2003, the Board adopted the 2003 Employee Stock Purchase Plan (the "ESPP"), which was approved by the Company’s stockholders in September 2003 and became effective February 1, 2004. Subsequently, the Board adopted the International Employee Stock Purchase Plan (the “International ESPP”) in June 2008.
The ESPP has a series of consecutive, overlapping 24-month offering periods. The first offering period commenced February 1, 2004, the effective date of the ESPP, as determined by the Board of Directors.
Individuals who own less than 5% of the Company’s voting stock, are scheduled to work more than 20 hours per week and whose customary employment is for more than five months in any calendar year may join an offering period on the first day of the offering period or the beginning of any semi-annual purchase period within that period. Individuals who become eligible employees after the start date of an offering period may join the ESPP at the beginning of any subsequent semi-annual purchase period.
Participants may contribute up to 20% of their cash earnings through payroll deductions, and the accumulated deductions will apply to the purchase of shares on each semi-annual purchase date. The purchase price per share will equal 85% of the fair market value per share on the participant’s entry date into the offering period or, if lower, 85% of the fair market value per share on the semi-annual purchase date.
An eligible employee’s right to buy the Company’s common stock under the ESPP may not accrue at a rate in excess of $25,000 of the fair market value of such shares per calendar year for each calendar year of an offering period. If the fair market value per share of the Company’s common stock on any purchase date is less than the fair market value per share on the start date of the 24-month offering period, then that offering period will automatically terminate and a new 24-month offering period will begin on the next business day. All participants in the terminated offering will be transferred to the new offering period.
As of December 31, 2017, there were approximately 443,000 shares reserved for grant under the ESPP and the International ESPP, collectively.
Dividends
F- 27
Stockholders of the Company’s common stock are entitled to receive dividends when declared by the Company’s Board of Directors. The Company has paid a quarterly dividend of $0.20 per share since March 2015. Dividends declared were $0.80, per common share in each of 2017, 2016 and 2015.
Assumed Plans
Certain stock awards plans were assumed in the DTS acquisition. The awards outstanding under these plans are included in the tables above. No future grants will be made under these plans.
NOTE 13 – STOCK-BASED COMPENSATION EXPENSE
The effect of recording stock-based compensation expense for the years ended December 31, 2017, 2016 and 2015 is as follows (in thousands):
Years Ended December 31, | |||||||||||
2017 | 2016 | 2015 | |||||||||
Cost of revenue | $ | — | $ | — | $ | — | |||||
Research, development and other related costs | 13,277 | 7,104 | 4,005 | ||||||||
Selling, general and administrative | 20,185 | 13,997 | 7,512 | ||||||||
Total stock-based compensation expense | 33,462 | 21,101 | 11,517 | ||||||||
Tax effect on stock-based compensation expense | (5,296 | ) | (6,314 | ) | (3,107 | ) | |||||
Net effect on net income | $ | 28,166 | $ | 14,787 | $ | 8,410 | |||||
Stock-based compensation expense categorized by various equity components for the years ended December 31, 2017, 2016 and 2015 is summarized in the table below (in thousands):
Years Ended December 31, | |||||||||||
2017 | 2016 | 2015 | |||||||||
Employee stock options | $ | 1,980 | $ | 3,249 | $ | 2,676 | |||||
Restricted stock awards and units | 28,909 | 17,024 | 8,232 | ||||||||
Employee stock purchase plan | 2,573 | 828 | 609 | ||||||||
Total stock-based compensation expense | $ | 33,462 | $ | 21,101 | $ | 11,517 | |||||
During the years ended December 31, 2017, 2016 and 2015, the Company granted stock options covering 70,000, zero and 84,000 shares, respectively. In December 2016, the Company assumed and granted stock awards covering 682,000 shares in connection with the DTS acquisition. The 2017, 2016 and 2015 estimated per share fair value of those grants was $4.62, $15.87 and $8.57, respectively, before estimated forfeitures.
The total fair value of restricted stock awards vested during the years ended December 31, 2017, 2016 and 2015 was $22.7 million, $15.9 million and $7.7 million, respectively.
The total intrinsic value of options exercised during the years ended December 31, 2017, 2016 and 2015 was $3.6 million, $5.5 million and $9.3 million, respectively. The intrinsic value is calculated as the difference between the market value on the date of exercise and the exercise price of the shares.
As of December 31, 2017, the unrecognized stock-based compensation balance after estimated forfeitures related to unvested stock options was $0.7 million to be recognized over an estimated weighted average amortization period of 1.8 years and $48.8 million related to restricted stock awards and units, including performance-based awards and units, to be recognized over an estimated weighted average amortization period of 2.4 years.
As of December 31, 2016, the unrecognized stock-based compensation balance after estimated forfeitures related to unvested stock options was $2.2 million to be recognized over an estimated weighted average amortization period of 1.2 years and $33.7 million related to restricted stock awards and units, including performance-based awards and units, to be recognized over an estimated weighted average amortization period of 2.4 years.
The Company uses the Black-Scholes option pricing model to determine the estimated fair value of options. The fair value of each option grant is determined on the date of grant and the expense is recorded on a straight-line basis. The assumptions used
F- 28
in the model include expected life, volatility, risk-free interest rate, and dividend yield. The Company’s determinations of these assumptions are outlined below.
Expected life – The expected life assumption is based on analysis of the Company’s historical employee exercise patterns. The expected life of options granted under the ESPP represents the offering period of two years.
Volatility – Volatility is calculated using the historical volatility of the Company’s common stock for a term consistent with the expected life. Historical volatility of the Company’s common stock is also utilized for the ESPP.
Risk-free interest rate – The risk-free interest rate assumption is based on the U.S. Treasury rate for issues with remaining terms similar to the expected life of the options.
Dividend yield – Expected dividend yield is calculated based on cash dividends declared by the Board for the previous four quarters and dividing that result by the average closing price of the Company’s common stock for the quarter. Cash dividends are not paid on options, restricted stock units or unvested restricted stock awards.
In addition, the Company estimates forfeiture rates. Forfeitures are estimated at the time of grant and revised in subsequent periods if actual forfeitures differ from those estimates. Historical data is used to estimate pre-vesting option forfeitures and record stock-based compensation expense only for those awards that are expected to vest.
The following assumptions were used to value the awards granted:
Years Ended December 31, | |||||||
2017 | 2016 | 2015 | |||||
Expected life (in years) | 4.7 | 3.8 | 3.8 | ||||
Risk-free interest rate | 1.8 | % | 1.7 | % | 1.1 - 1.4% | ||
Dividend yield | 2.9 | % | 2.4 | % | 2.1 - 2.9% | ||
Expected volatility | 29.8 | % | 29.0 | % | 34.0 - 35.6% | ||
The following assumptions were used to value the ESPP shares:
Years Ended December 31, | |||||||
2017 | 2016 | 2015 | |||||
Expected life (years) | 2.0 | 2.0 | 2.0 | ||||
Risk-free interest rate | 1.2 - 1.3% | 0.5 - 0.8% | 0.4 - 0.7% | ||||
Dividend yield | 2.0 - 2.5% | 2.4 - 3.0% | 2.1 - 3.4% | ||||
Expected volatility | 28.3 - 30.8% | 30.0 | % | 29.7 - 30.0% | |||
For the years ended December 31, 2017, 2016 and 2015, an aggregate of 164,000, 89,000 and 77,000 common shares, respectively, were purchased pursuant to the ESPP.
Modifications
From time to time, the Company enters into consulting agreements with its departing employees. Some of these agreements may include continued vesting of the departing employees’ stock awards and an extension of the exercise period from the standard 90 days from employment termination date to the termination of the consulting agreement. As a result of modifications related to former employees, the Company incurred stock-based compensation expense of $0.3 million for the year ended December 31, 2015. There were no modifications in 2016. In 2017, the impact on the Company's financial statements as a result of one modification was not material.
NOTE 14 – INCOME TAXES
The components of total income (loss) before taxes from continuing operations are as follows (in thousands):
F- 29
Years ended December 31, | ||||||||||||
2017 | 2016 | 2015 | ||||||||||
U.S. | $ | 8 | $ | 90,154 | $ | 151,862 | ||||||
Foreign | (58,351 | ) | 561 | 13,772 | ||||||||
Total income (loss) before taxes from continuing operations | $ | (58,343 | ) | $ | 90,715 | $ | 165,634 | |||||
The provision for (benefit from) income taxes consisted of the following (in thousands):
Years ended December 31, | ||||||||||||
2017 | 2016 | 2015 | ||||||||||
Current: | ||||||||||||
U.S. federal | $ | (79 | ) | $ | 9,564 | $ | 2,737 | |||||
Foreign | 16,871 | 22,552 | 26,275 | |||||||||
State and local | 77 | 8 | 319 | |||||||||
Total current | 16,869 | 32,124 | 29,331 | |||||||||
Deferred: | ||||||||||||
U.S. federal | (8,390 | ) | 2,365 | 23,478 | ||||||||
Foreign | (10,463 | ) | 392 | (4,138 | ) | |||||||
State and local | 199 | (255 | ) | (154 | ) | |||||||
Total deferred | (18,654 | ) | 2,502 | 19,186 | ||||||||
Provision for (benefit from) income taxes | $ | (1,785 | ) | $ | 34,626 | $ | 48,517 | |||||
Deferred income taxes reflect the net tax effects of temporary differences between the carrying amount of assets and liabilities for financial reporting purposes and the amounts for income tax purposes.
Significant components of the Company’s deferred tax assets and liabilities are as follows (in thousands):
December 31, | ||||||||
2017 | 2016 | |||||||
Deferred tax assets | ||||||||
Net operating loss carryforwards | $ | 17,301 | $ | 40,969 | ||||
Research tax credit | 15,433 | 9,642 | ||||||
Foreign tax credit | 12,479 | 7,201 | ||||||
Expenses not currently deductible | 13,031 | 5,193 | ||||||
Basis difference in fixed and intangible assets | 3,200 | 3,529 | ||||||
Gross deferred tax assets | 61,444 | 66,534 | ||||||
Valuation allowance | (32,032 | ) | (12,846 | ) | ||||
Net deferred tax assets | 29,412 | 53,688 | ||||||
Deferred tax liabilities | ||||||||
Acquired intangible assets, domestic | (34,408 | ) | (70,338 | ) | ||||
Acquired intangible assets, foreign | (4,903 | ) | (13,045 | ) | ||||
Unremitted earnings of foreign subsidiaries | (30 | ) | (129 | ) | ||||
Net deferred tax liabilities | $ | (9,929 | ) | $ | (29,824 | ) | ||
At December 31, 2017 and 2016, the Company had a valuation allowance of $32.0 million and $12.8 million, respectively, related to federal, state, and foreign tax attributes that the Company believes to be not realizable on a more-likely-than-not basis. The $19.2 million increase from the prior year is primarily comprised of $13.5 million attributable to additional valuation allowance recorded against federal tax credits and the remainder is related to remeasurement of deferred taxes that have a corresponding valuation allowance, both as a result of the Tax Act. The need for a valuation allowance requires an assessment of both positive and negative evidence when determining whether it is more likely than not that deferred tax assets are recoverable. Such assessment is required on a jurisdiction-by-jurisdiction basis. In making such assessment, significant weight
F- 30
is given to evidence that can be objectively verified. After considering both negative and positive evidence to assess the recoverability of the Company's net deferred tax assets at the end of 2017, management determined that it was more likely than not that the Company would not realize certain federal, state and foreign deferred tax assets given the substantial amount of tax attributes that will remain unutilized to offset forecasted future tax liabilities. The Company will continue to monitor the likelihood that it will be able to recover the deferred tax assets in the future, including those for which a valuation allowance is still recorded. This determination includes objectively verifiable positive evidence that outweighs potential negative evidence.
As of December 31, 2017, the Company had federal net operating loss carryforwards of approximately $32.7 million and state net operating loss carryforwards of approximately $95.4 million. Substantially all of the federal net operating loss carryforwards are carried over from acquired entities, DTS in 2016 and Ziptronix in 2015. The state net operating loss carryforwards are carried over from acquired entities, DTS in 2016, Ziptronix in 2015, and Siimpel Corporation in 2010. The federal net operating loss carryforwards, if not utilized, will begin to expire on various dates beginning in 2026, and will continue to expire through 2034. The state net operating loss carryforwards, if not utilized, will begin to expire on various dates beginning in 2018, and will continue to expire through 2036.
In addition, the Company has research tax credit carryforwards of approximately $10.0 million for federal purposes which were carried over from DTS and Ziptronix, as well as generated in the current year. The federal research tax credit will start to expire in 2018 and will continue to expire through 2037. The Company also has research tax credit carryforwards of approximately $14.5 million for state purposes and $0.6 million for foreign purposes, which will never expire. The Company has $19.8 million of foreign tax credit carryforwards which will begin to expire in 2018 and will continue to expire through 2027. Under the provisions of the Internal Revenue Code, substantial changes in the Company's or its subsidiaries' ownership may limit the amount of net operating loss and tax credit carryforwards that can be utilized annually in the future to offset taxable income. In addition, the Tax Act modifies the maximum deduction of net operating loss, eliminates carryback, and provides for indefinite carryforward for losses generated after December 31, 2017
A reconciliation of the statutory U.S. federal income tax rate to the Company’s effective tax rate is as follows:
Years Ended December 31, | |||||||||
2017 | 2016 | 2015 | |||||||
U.S. federal statutory rate | 35.0 | % | 35.0 | % | 35.0 | % | |||
State, net of federal benefit | (0.1 | ) | (0.5 | ) | — | ||||
Stock-based compensation expense | (2.9 | ) | 2.0 | 0.5 | |||||
Tax exempt interest | — | (0.2 | ) | (0.1 | ) | ||||
Research tax credit | 3.2 | (1.2 | ) | (0.3 | ) | ||||
Foreign withholding tax | (25.2 | ) | 24.7 | 15.7 | |||||
Transaction costs | — | 2.4 | — | ||||||
Foreign tax rate differential | (20.8 | ) | 0.4 | (2.8 | ) | ||||
Foreign tax credit | 22.9 | (23.5 | ) | (15.3 | ) | ||||
Change in valuation allowance | (23.1 | ) | — | (3.0 | ) | ||||
Re-measurement of deferred taxes | 13.5 | — | — | ||||||
Others | 0.6 | (0.9 | ) | (0.4 | ) | ||||
Total | 3.1 | % | 38.2 | % | 29.3 | % | |||
On December 22, 2017, the Tax Cut and Jobs Act (“Tax Act”) was signed into law. The Tax Act introduced a broad range of tax reform measures that significantly change the federal income tax laws. The provisions of the Tax Act that may have significant impact on the Company include the permanent reduction of the corporate income tax rate from 35% to 21% effective for tax years including or commencing on January 1, 2018, one-time transition tax on post-1986 foreign unremitted earnings, provision for GILTI, deduction for FDII, repeal of corporate alternative minimum tax, limitation of various business deductions, modification of the maximum deduction of net operating loss with no carryback but indefinite carryforward provision, and limitation on the deductibility of executive compensation. Many provisions in the Tax Act are generally effective in tax years beginning after December 31, 2017.
At December 31, 2017, the Company reflected the provisional income tax effects of the Tax Act under Accounting Standards Codification Topic 740, Income Taxes. The Company has recorded a provisional tax expense in the Statement of Operations of approximately $5.6 million, comprised of approximately $13.5 million tax expense from recording additional valuation
F- 31
allowance against federal tax credits due to certain provisions of the Tax Act, offset by approximately $7.9 million of tax benefit from the remeasurement of U.S. deferred taxes using the relevant tax rate at which the Company expects them to reverse in the future. The estimated one-time transition tax on post-1986 foreign unremitted earnings should not have a material impact to the Company's effective tax rate.
The Company continues to examine the impact of certain provisions of the Tax Act that will become applicable in calendar year 2018 related to BEAT, GILTI, deduction for FDII, and other provisions that could affect its effective tax rate in the future. The Company will record the income tax effects of GILTI and other provisions of the Tax Act as incurred beginning in calendar year 2018. Also, because there may be additional state income tax implications, the Company will continue to monitor changes in state and local tax laws to determine if state and local taxing authorities intend to conform or deviate from changes to U.S. federal tax legislation as a result of the Tax Act. The prospects of supplemental legislation or regulatory processes to address questions that arise because of the Tax Act, or evolving technical interpretations of the tax law, may cause the final impact from the Tax Act to differ from the provisionally recorded amounts. The Company expects to complete its analysis within the measurement period allowed by Staff Accounting Bulletin (“SAB”) No.118, no later than the fourth quarter of calendar year 2018.
At December 31, 2017, the Company has changed its permanent reinvestment assertion and will not permanently reinvest its foreign earnings outside the U.S. The Company anticipates that the cash from its foreign earnings may be used domestically to fund operations, settle a portion of the outstanding debt obligation, or used for other business needs. The accumulated undistributed earnings generated by its foreign subsidiaries was approximately $70.7 million, of which all was subject to the one-time transition tax on foreign unremitted earnings required by the Tax Act or has otherwise been previously subject to U.S. tax. The Company will accrue approximately $0.3 million of withholding taxes from its foreign subsidiaries on estimated cash that may be remitted back to the U.S. without restrictions.
As of December 31, 2017, unrecognized tax benefits approximated $33.5 million, of which $22.2 million would affect the effective tax rate if recognized. As of December 31, 2016, unrecognized tax benefits approximated $30.1 million, of which $23.8 million would affect the effective tax rate if recognized. The Company does not believe that its unrecognized tax benefits as of December 31, 2017 will significantly increase or decrease within the next twelve months.
The reconciliation of the Company's unrecognized tax benefits for the years ended December 31, 2016, 2015 and 2014 is as follows (in thousands):
Years Ended December 31, | ||||||||||||
2017 | 2016 | 2015 | ||||||||||
Total unrecognized tax benefits at January 1 | $ | 30,088 | $ | 3,071 | $ | 2,734 | ||||||
Gross increases and decreases due to acquisition of DTS | — | 27,584 | — | |||||||||
Gross increases and decreases due to tax positions taken in prior periods | 2,457 | 139 | 699 | |||||||||
Gross increases and decreases due to tax positions taken in the current period | 961 | 264 | 103 | |||||||||
Gross increases and decreases due to settlements with taxing authorities | — | — | — | |||||||||
Gross increases and decreases due to lapses in applicable statutes of limitations | — | (970 | ) | (465 | ) | |||||||
Total unrecognized tax benefits at December 31 | $ | 33,506 | $ | 30,088 | $ | 3,071 | ||||||
It is the Company's policy to classify accrued interest and penalties related to unrecognized tax benefits in the provision for income taxes. For the years ended December 31, 2017, 2016, and 2015, the Company recognized an insignificant amount of interest and penalties related to unrecognized tax benefits. Accrued interest and penalties were $0.6 million and $0.5 million, for the years ended December 31, 2017 and 2016, respectively.
At December 31, 2017, the Company’s 2013 through 2016 tax years were open and subject to potential examination in one or more jurisdictions. In addition, in the U.S., any net operating losses or credits that were generated in prior years but utilized in an open year may also be subject to examination. The Company is currently under examination by the Internal Revenue Service for tax year 2014. The Company is not currently under foreign income tax examination.
NOTE 15 – COMMITMENTS AND CONTINGENCIES
Lease and Purchase Commitments
F- 32
The Company leases office and research facilities and office equipment under operating leases which expire at various dates through 2029. The amounts reflected in the table below are for the aggregate future minimum lease payments under non-cancelable facility and equipment operating leases. Under lease agreements that contain escalating rent provisions, lease expense is recorded on a straight-line basis over the lease term. Rent expense for the years ended December 31, 2017, 2016 and 2015 amounted to $6.4 million, $2.8 million and $2.1 million, respectively.
As of December 31, 2017, future minimum lease payments are as follows (in thousands):
Lease Obligations | |||
2018 | $ | 6,261 | |
2019 | 5,501 | ||
2020 | 4,911 | ||
2021 | 3,253 | ||
2022 | 2,776 | ||
Thereafter | 7,768 | ||
$ | 30,470 | ||
Under certain contractual arrangements, the Company may be obligated to pay up to approximately $3.0 million over an estimated period of approximately two years if certain milestones are achieved.
Contingencies
At each reporting period, the Company evaluates whether or not a potential loss amount or a potential range of loss is probable and reasonably estimable under the provisions of the authoritative guidance that addresses accounting for contingencies. The Company is currently unable to predict the final outcome of lawsuits to which it is a party and therefore cannot determine the likelihood of loss nor estimate a range of possible loss. An adverse decision in any of these proceedings could significantly harm the Company’s business and consolidated financial position, results of operations or cash flows.
Tessera, Inc. v. Toshiba Corporation, Civil Action No. 5:15-cv-02543-BLF (N.D. Cal.)
On May 12, 2015, Tessera, Inc. filed a complaint against Toshiba Corporation (“Toshiba”) in California Superior Court. Tessera, Inc.’s complaint alleges causes of action for breach of contract, breach of the implied covenant of good faith and fair dealing, and declaratory relief, generally alleging that Toshiba underpaid royalties and failed to cooperate with audits conducted pursuant to the parties’ license agreement.
On June 8, 2015, Toshiba removed the action to the U.S. District Court for the Northern District of California. On June 18, 2015, Toshiba filed its answer, affirmative defenses, and counterclaims to Tessera, Inc.’s complaint. Toshiba alleges counterclaims for declaratory judgment and breach of the implied warranty of good faith and fair dealing. The counterclaims seek, among other things, judicial determinations about the interpretation of the parties’ agreement, termination of the agreement, an accounting of the amount of alleged overpayments by Toshiba, restitution, and damages. On July 10, 2015, Tessera, Inc. filed its answer and affirmative defenses to Toshiba’s counterclaims. On March 17, 2016, Tessera, Inc. filed an amended complaint adding a claim for declaratory relief regarding a February 12, 2016 letter sent by Toshiba to Tessera, Inc. purporting to terminate the parties’ license agreement. On March 18, 2016, Toshiba filed its amended answer, affirmative defenses, and counterclaims. On April 4, 2016, Tessera, Inc. filed an answer to Toshiba’s amended counterclaims.
An initial summary judgment hearing on contract issues took place on September 22, 2016. On November 7, 2016, the Court entered an order granting Toshiba’s motion regarding the definition of “TCC,” and denying summary judgment on the other issues raised by the parties’ cross-motions. On December 6, 2016, Tessera, Inc. filed a motion pursuant to Federal Rule of Civil Procedure 54(b) seeking authorization to appeal the order and for a stay. On March 6, 2017, the Court granted the Rule 54(b) motion. The Court subsequently vacated the trial date and stayed the remainder of the district court proceedings.
On April 4, 2017, Tessera, Inc. filed a notice of appeal to the U.S. Court of Appeals for the Ninth Circuit. The parties completed briefing on November 2, 2017. A hearing for oral argument has not yet been scheduled.
Other Litigation Matters
The Company and its subsidiaries are involved in litigation matters and claims in the normal course of business. In the past, the Company and its subsidiaries have litigated to enforce their respective patents and other intellectual property rights, to enforce the terms of license agreements, to protect trade secrets, to determine the validity and scope of the proprietary rights of others
F- 33
and to defend themselves or their customers against claims of infringement or invalidity. The Company expects it or its subsidiaries will be involved in similar legal proceedings in the future, including proceedings regarding infringement of its patents, and proceedings to ensure proper and full payment of royalties by customers under the terms of its license agreements.
The existing and any future legal actions may harm the Company’s business. For example, an adverse decision in any of these legal actions could result in a loss of the Company’s proprietary rights; reduce or limit the value of the Company’s licensed technology; negatively impact the Company’s stock price, its business, consolidated financial position, results of operations, royalties, billings, or cash flows; subject the Company to significant liabilities; or require the Company to seek licenses from others. Furthermore, legal actions could cause an existing customer or strategic partner to cease making royalty or other payments to the Company, or to challenge the validity and enforceability of patents owned by the Company’s subsidiaries or the scope of license agreements with the Company’s subsidiaries, and could significantly damage the Company’s relationship with such customer or strategic partner and, as a result, prevent the adoption of the Company’s other technologies by such customer or strategic partner. Litigation could also severely disrupt or shut down the business operations of customers or strategic partners of the Company’s subsidiaries, which in turn would significantly harm ongoing relations with them and cause the Company to lose royalty revenue.
The costs associated with legal proceedings are typically high, relatively unpredictable, and not completely within the Company’s control. These costs may be materially higher than expected, which could adversely affect the Company’s operating results and lead to volatility in the price of its common stock. Whether or not determined in the Company’s favor or ultimately settled, litigation diverts managerial, technical, legal, and financial resources from the Company’s business operations.
NOTE 16 – SEGMENT AND GEOGRAPHIC INFORMATION
The Company reports its financial results within two reportable segments: (1) Product Licensing and (2) Semiconductor and IP Licensing. There are certain corporate overhead costs that are not allocated to these reportable segments because these operating amounts are not considered in evaluating the operating performance of the Company’s business segments.
The Chief Executive Officer is also the Chief Operating Decision Maker (“CODM”) as defined by the authoritative guidance on segment reporting.
The Product Licensing segment, including the Company's DTS and FotoNation subsidiaries, licenses its technologies and intellectual property related to audio, digital radio and imaging solutions under the brands DTS, HD Radio and FotoNation. The Product Licensing solutions typically include the delivery of software or hardware-based solutions, combined with various other intellectual property, including know how, patents, trademarks, and copyrights. Product Licensing represents revenue derived primarily from the consumer electronics market and related applications servicing the home, automotive and mobile markets.
The Semiconductor and IP Licensing segment develops and licenses semiconductor technologies and IP to manufacturers, foundries, subcontract assemblers and others. The segment includes revenue generated from the technology and IP portfolios of Tessera, Inc. Invensas and Invensas Bonding Technologies, Inc. (formally Ziptronix, Inc.). Tessera, Inc. pioneered chip-scale packaging solutions. Invensas develops advanced semiconductor packaging and 3D interconnect solutions, including wafer bonding solutions, for applications such as smartphones, tablets, laptops, PCs, data centers and automobiles. The Company expands its technology and IP offerings in this segment through a combination of internal R&D and acquisitions. The Company also provides engineering services to customers in the form of technology demonstrations and technology transfers to assist their evaluation and adoption of the Company's technologies. Through the Company’s technology transfer service, the Company provides detailed documentation outlining design guidelines, process specifications, recommended equipment and process parameters as well as hands-on engineering support to assist its licensees in bringing up and qualifying its technologies at their facilities. This service allows licensees to readily leverage the Company’s years of experience and expertise in direct and hybrid bonding.
The Company does not identify or allocate assets by reportable segment, nor does the CODM evaluate reportable segments using discrete asset information. Reportable segments do not record inter-segment revenue and accordingly there are none to report. The Company does not allocate other income and expense to reportable segments. Although the CODM uses operating income to evaluate reportable segments, operating costs included in one segment may benefit other segments.
The following table sets forth the Company’s segment revenue, operating expenses and operating income (loss) for the years ended December 31, 2017, 2016 and 2015 (in thousands):
F- 34
Years Ended December 31, | ||||||||||||||
2017 | 2016 | 2015 | ||||||||||||
Revenue: | ||||||||||||||
Product licensing segment (1) | $ | 167,923 | $ | 30,499 | $ | 31,335 | ||||||||
Semiconductor and IP licensing segment | 205,809 | 229,066 | 241,965 | |||||||||||
Total revenue | 373,732 | 259,565 | 273,300 | |||||||||||
Operating expenses: | ||||||||||||||
Product licensing segment | 172,745 | 25,299 | 11,191 | |||||||||||
Semiconductor and IP licensing segment | 87,838 | 72,812 | 56,315 | |||||||||||
Unallocated operating expenses (2) | 144,649 | 72,066 | (3) | 43,592 | ||||||||||
Total operating expenses | 405,232 | 170,177 | 111,098 | |||||||||||
Operating income (loss): | ||||||||||||||
Product licensing segment | (4,822 | ) | 5,200 | 20,144 | ||||||||||
Semiconductor and IP licensing segment | 117,971 | 156,254 | 185,650 | |||||||||||
Unallocated operating expenses (2) | (144,649 | ) | (72,066 | ) | (43,592 | ) | ||||||||
Total operating income (loss) | $ | (31,500 | ) | $ | 89,388 | $ | 162,202 | |||||||
(1) Includes $0.1 million and $1.3 million for 2016 and 2015, respectively, which are not part of current segment operations.
(2) Unallocated operating expenses consist primarily of general and administrative expenses and stock-based compensation. These expenses are not allocated because it is not practical to do so.
(3) Includes approximately $23.9 million in transaction-related costs, severance, and other one-time expenses related to the DTS acquisition.
A significant portion of the Company’s revenue is derived from licensees headquartered outside of the U.S., principally in Asia, and it is expected that this revenue will continue to account for a significant portion of total revenues in future periods. The table below lists the geographic revenue from continuing operations for the periods indicated (in thousands):
Years Ended December 31, | ||||||||||||||||||||
2017 | 2016 | 2015 | ||||||||||||||||||
U.S. | $ | 164,846 | 44 | % | $ | 99,594 | 38 | % | $ | 98,428 | 36 | % | ||||||||
Japan | 81,688 | 22 | 6,866 | 3 | 9,409 | 3 | ||||||||||||||
Korea | 50,155 | 13 | 95,170 | 37 | 87,527 | 32 | ||||||||||||||
Taiwan | 33,861 | 9 | 34,763 | 13 | 57,049 | 21 | ||||||||||||||
Other | 43,182 | 12 | 23,172 | 9 | 20,887 | 8 | ||||||||||||||
$ | 373,732 | 100 | % | $ | 259,565 | 100 | % | $ | 273,300 | 100 | % | |||||||||
For the years ended December 31, 2017, 2016, and 2015, two, four and four customers, respectively, each accounted for 10% or more of total revenue.
As of December 31, 2017, 2016 and 2015 property and equipment, net, by geographical area are presented below (in thousands):
Years Ended December 31, | |||||||||||
2017 | 2016 | 2015 | |||||||||
U.S. | $ | 32,862 | $ | 36,891 | $ | 3,219 | |||||
Europe | 1,019 | 1,252 | 529 | ||||||||
Asia and other | 561 | 712 | — | ||||||||
Total | $ | 34,442 | $ | 38,855 | $ | 3,748 | |||||
F- 35
NOTE 17 – BENEFIT PLAN
The Company maintains 401(k) retirement savings plans that allow voluntary contributions by all employees upon their hire date. Eligible employees may elect to contribute up to the maximum amount allowed under Internal Revenue Service regulations. The Company can make discretionary contributions under the 401(k) plan. During the years ended December 31, 2017, 2016 and 2015, the Company contributed approximately $2.4 million, $0.8 million, and $0.4 million, respectively, to the 401(k) Plan.
NOTE 18 – SUBSEQUENT EVENTS
Declaration of a Cash Dividend
On February 1, 2018, the Board declared a cash dividend of $0.20 per share of common stock, payable on March 22, 2018, for the stockholders of record at the close of business on March 1, 2018.
Debt Repricing
On January 23, 2018, the Company completed a successful repricing of its Term B Loans, reducing its borrowing rate by 75 basis points, to a new rate of Libor plus 250 basis points. In connection with the repricing, the Company paid down $100 million of its outstanding debt and incurred $1.1 million in third party costs.
F- 36
Schedule II. Valuation and Qualifying Accounts for the Years Ended December 31, 2017, 2016 and 2015
Balance at Beginning of Year | Charged (Credited) to Expenses | Charged (Credited) to Other Accounts | Balance at End of Year | ||||||||||||
Deferred income tax asset: | |||||||||||||||
Valuation allowance | |||||||||||||||
2015 | $ | 27,087 | $ | (6,485 | ) | $ | (6,750 | ) | $ | 13,852 | |||||
2016 | $ | 13,852 | $ | (345 | ) | $ | (660 | ) | $ | 12,847 | |||||
2017 | $ | 12,847 | $ | 13,925 | $ | 5,260 | $ | 32,032 | |||||||
Balance at Beginning of Year | Charged (Credited) to Expenses | Charged (Credited) to Other Accounts | Balance at End of Year | ||||||||||||
Accounts receivable: | |||||||||||||||
Allowance for doubtful accounts | |||||||||||||||
2015 | $ | — | $ | — | $ | — | $ | — | |||||||
2016 | $ | — | $ | — | $ | — | $ | — | |||||||
2017 | $ | — | $ | 2,404 | $ | (1,223 | ) | $ | 1,181 | ||||||
F- 37
EXHIBIT INDEX
Exhibit Number | Exhibit Description | |
F- 38
F- 39
101.INS | XBRL Instance Document | |
101.SCH | XBRL Taxonomy Extension Schema Document | |
101.CAL | XBRL Taxonomy Extension Calculation Linkbase Document | |
101.DEF | XBRL Taxonomy Extension Definition Linkbase Document | |
101.LAB | XBRL Taxonomy Extension Label Linkbase Document | |
101.PRE | XBRL Taxonomy Extension Presentation Linkbase Document | |
+ | Indicates a management contract or compensatory plan or arrangement. | |
F- 40
* | The exhibits and schedules to this agreement have been omitted in reliance on Item 601(b)(2) of Regulation S-K promulgated by the SEC, and a copy thereof will be furnished supplementally to the SEC upon its request. Readers are cautioned that the representations and warranties set forth in this agreement are qualified by those schedules, and should not be relied upon as accurate or complete without reference to those schedules | |
F- 41
Item 16. Form 10-K Summary
None.
105
SIGNATURES
Pursuant to the requirements of Section 13 or 15(d) of the Securities Exchange Act of 1934, as amended (the “Exchange Act”), the registrant has duly caused this report to be signed on its behalf by the undersigned, thereunto duly authorized.
Dated: February 23, 2018
Xperi Corporation | ||
By: | /s/ Jon Kirchner | |
Jon Kirchner Chief Executive Officer | ||
POWER OF ATTORNEY
Each person whose individual signature appears below hereby authorizes and appoints Jon Kirchner and Robert Andersen, and each of them, with full power of substitution and resubstitution and full power to act without the other, as his true and lawful attorney-in-fact and agent to act in his name, place and stead and to execute in the name and on behalf of each person, individually and in each capacity stated below, and to file any and all amendments to this Annual Report on Form 10-K, and to file the same, with all exhibits thereto, and other documents in connection therewith, with the Securities and Exchange Commission, granting unto said attorneys-in-fact and agents, and each of them, full power and authority to do and perform each and every act and thing, ratifying and confirming all that said attorneys-in-fact and agents or any of them or their or his substitute or substitutes may lawfully do or cause to be done by virtue thereof.
Pursuant to the requirements of the Exchange Act, this report has been signed below by the following persons on behalf of the registrant and in the capacities and on the dates indicated.
Signature | Title | Date | ||
/s/ Jon Kirchner Jon Kirchner | Chief Executive Officer and Director (Principal Executive Officer) | February 23, 2018 | ||
/s/ Robert J. Andersen Robert J. Andersen | Executive Vice President and Chief Financial Officer (Principal Financial and Accounting Officer) | February 23, 2018 | ||
/s/ Richard S. Hill Richard S. Hill | Chairman of the Board of Directors | February 23, 2018 | ||
/s/ Tudor Brown Tudor Brown | Director | February 23, 2018 | ||
/s/ John Chenault John Chenault | Director | February 23, 2018 | ||
/s/ Dave Habiger Dave Habiger | Director | February 23, 2018 | ||
/s/ V. Sue Molina V. Sue Molina | Director | February 23, 2018 | ||
/s/ George A. Riedel George A. Riedel | Director | February 23, 2018 | ||
/s/ Christopher A. Seams Christopher A. Seams | Director | February 23, 2018 | ||
106