Attached files
| file | filename |
|---|---|
| EX-23.1 - CONSENT OF INDEPENDENT REGISTERED PUBLIC ACCOUNTING FIRM - KAISER ALUMINUM CORP | ex231-kalux12311710k.htm |
| EX-32.2 - SECTION 906-DANIEL J. RINKENBERGER - KAISER ALUMINUM CORP | ex322-kalux12311710k.htm |
| EX-32.1 - SECTION 906-JACK A. HOCKEMA - KAISER ALUMINUM CORP | ex321-kalux12311710k.htm |
| EX-31.2 - SECTION 302-DANIEL J. RINKENBERGER - KAISER ALUMINUM CORP | ex312-kalux12311710k.htm |
| EX-31.1 - SECTION 302-JACK A. HOCKEMA - KAISER ALUMINUM CORP | ex311-kalux12311710k.htm |
| EX-12.1 - COMPUTATION OF RATIO OF EARNINGS TO FIXED CHARGES - KAISER ALUMINUM CORP | ex121-kalux12311710k.htm |
UNITED STATES
SECURITIES AND EXCHANGE COMMISSION
Washington, D.C. 20549
FORM 10-K
[X] ANNUAL REPORT PURSUANT TO SECTION 13 OR 15(d) OF THE SECURITIES EXCHANGE ACT OF 1934 |
For the fiscal year ended December 31, 2017 |
[ ] TRANSITION REPORT PURSUANT TO SECTION 13 OR 15(d) OF THE SECURITIES EXCHANGE ACT OF 1934 |
For the transition period from _______________________________ to_________________________________________ |
Commission File Number: 1-09447
KAISER ALUMINUM CORPORATION
(Exact name of registrant as specified in its charter)
Delaware | 94-3030279 | |
(State or other jurisdiction of incorporation or organization) | (I.R.S. Employer Identification No.) | |
27422 Portola Parkway, Suite 200 Foothill Ranch, California | 92610-2831 | |
(Address of principal executive offices) | (Zip Code) | |
(949) 614-1740 | ||
(Registrant's telephone number, including area code) | ||
Securities registered pursuant to Section 12(b) of the Act: | ||
Title of each class | Name of each exchange on which registered | |
Common stock, par value $0.01 per share | Nasdaq Stock Market LLC | |
Securities registered pursuant to section 12(g) of the Act: | ||
None | ||
Indicate by check mark if the registrant is a well-known seasoned issuer, as defined in Rule 405 of the Securities Act. Yes þ No o
Indicate by check mark if the registrant is not required to file reports pursuant to Section 13 or Section 15(d) of Act. Yes o No þ
Indicate by check mark whether the registrant (1) has filed all reports required to be filed by Section 13 or 15(d) of the Securities Exchange Act of 1934 during the preceding 12 months (or for such shorter period that the registrant was required to file such reports), and (2) has been subject to such filing requirements for the past 90 days. Yes þ No o
Indicate by check mark whether the registrant has submitted electronically and posted on its corporate Web site, if any, every Interactive Data File required to be submitted and posted pursuant to Rule 405 of Regulation S-T (§232.405 of this chapter) during the preceding 12 months (or for such shorter period that the registrant was required to submit and post such files). Yes þ No o
Indicate by check mark if disclosure of delinquent filers pursuant to Item 405 of Regulation S-K (§229.405 of this chapter) is not contained herein, and will not be contained, to the best of registrant's knowledge, in definitive proxy or information statements incorporated by reference in Part III of this Form 10-K or any amendment of this Form 10-K. o
Indicate by check mark whether the registrant is a large accelerated filer, an accelerated filer, a non-accelerated filer, a smaller reporting company, or an emerging growth company. See the definitions of "large accelerated filer," "accelerated filer," "smaller reporting company" and "emerging growth company" in Rule 12b-2 of the Exchange Act. (Check one):
Large accelerated filer þ | Accelerated filer o |
Non-accelerated filer o (Do not check if a smaller reporting company) | Smaller reporting company o |
Emerging growth company o | |
If an emerging growth company, indicate by check mark if the registrant has elected not to use the extended transition period for complying with any new or revised financial accounting standards provided pursuant to Section 13(a) of the Exchange Act. o | |
Indicate by check mark whether the registrant is a shell company (as defined in Rule 12b-2 of the Exchange Act). Yes o No þ
The aggregate market value of the registrant's common stock held by non-affiliates of the registrant as of the last business day of the registrant's most recently completed second fiscal quarter (June 30, 2017) was approximately $1.5 billion.
As of February 15, 2018, there were 16,757,781 shares of the Common Stock of the registrant outstanding.
Documents Incorporated by Reference. Certain portions of the registrant’s definitive proxy statement related to the registrant’s 2018 annual meeting of stockholders are incorporated by reference into Part III of this Annual Report on Form 10-K.
TABLE OF CONTENTS
Business | ||
Risk Factors | ||
Unresolved Staff Comments | ||
Properties | ||
Legal Proceedings | ||
Mine Safety Disclosures | ||
Market for Registrant’s Common Equity, Related Stockholder Matters and Issuer Purchases of Equity Securities | ||
Selected Financial Data | ||
Management’s Discussion and Analysis of Financial Condition and Results of Operations | ||
Quantitative and Qualitative Disclosures About Market Risk | ||
Financial Statements and Supplementary Data | ||
Changes in and Disagreements with Accountants on Accounting and Financial Disclosure | ||
Controls and Procedures | ||
Other Information | ||
Directors, Executive Officers and Corporate Governance | ||
Executive Compensation | ||
Security Ownership of Certain Beneficial Owners and Management and Related Stockholder Matters | ||
Certain Relationships and Related Transactions and Director Independence | ||
Principal Accountant Fees and Services | ||
Exhibits and Financial Statement Schedules | ||
PART I
Forward-Looking Statements
This Annual Report on Form 10-K (this "Report") contains statements which constitute "forward-looking statements" within the meaning of the Private Securities Litigation Reform Act of 1995. These statements appear throughout this Report, including Item 1. "Business – Business Operations," Item 1A. "Risk Factors," and Item 7. "Management’s Discussion and Analysis of Financial Condition and Results of Operations." These forward-looking statements can be identified by the use of forward-looking terminology such as "believes," "expects," "may," "estimates," "will," "should," "plans" or "anticipates," or the negative of the foregoing or other variations or comparable terminology, or by discussions of strategy.
Readers are cautioned that any such forward-looking statements are not guarantees of future performance and involve significant risks and uncertainties and that actual results may vary from those in the forward-looking statements as a result of various factors. These factors include: the effectiveness of management’s strategies and decisions; general economic and business conditions, including cyclicality and other conditions in the aerospace, automotive and other end markets we serve; developments in technology; new or modified statutory or regulatory requirements; changing prices and market conditions; and other factors discussed in Item 1A. "Risk Factors" and elsewhere in this Report. No assurance can be given that these are all of the factors that could cause actual results to vary materially from the forward-looking statements.
Readers are urged to consider these factors carefully in evaluating any forward-looking statements and are cautioned not to place undue reliance on these forward-looking statements. The forward-looking statements included herein are made only as of the date of this Report and we undertake no obligation to update any information contained in this Report or to publicly release any revisions to any forward-looking statements that may be made to reflect events or circumstances that occur, or that we become aware of, after the date of this Report except as required by law.
Item 1. Business
Availability of Information
We file Annual Reports on Form 10-K, Quarterly Reports on Form 10-Q, Current Reports on Form 8-K, Proxy Statements, any amendments to those reports and other information with the Securities and Exchange Commission ("SEC"). You may inspect and, for a fee, copy any document that we file with the SEC at the SEC's Public Reference Room at 100 F Street, N.E., Washington, D.C. 20549. Please call the SEC at 1-800-SEC-0330 for further information on the Public Reference Room. You may also obtain the documents that we file electronically from the SEC's website at http://www.sec.gov. Our filings with the SEC are made available free of charge on our website at http://www.kaiseraluminum.com as soon as reasonably practicable after we file or furnish the materials with the SEC. News releases, announcements of upcoming earnings calls and events in which our management participates or hosts with members of the investment community and an archive of webcasts of such earnings calls and investor events and related investor presentations, are also available on our website. Information on our website is not incorporated into this Report.
Business Overview
Kaiser Aluminum Corporation, a Delaware corporation, manufactures and sells semi-fabricated specialty aluminum mill products for the following end market applications: aerospace and high strength ("Aero/HS products"); automotive ("Automotive Extrusions"); general engineering ("GE products"); and other industrial ("Other products"). Our fabricated aluminum mill products include flat-rolled (plate and sheet), extruded (rod, bar, hollows and shapes), drawn (rod, bar, pipe and tube) and certain cast aluminum products. Our products are differentiated based on the metallurgy and physical properties of the metal and the special characteristics that are required for particular end uses. We strategically choose to serve technically challenging applications for which we can deploy our core metallurgical and process technology capabilities to produce highly engineered mill products with characteristics that present opportunities for us to receive premium pricing and to create long-term profitable growth.
With respect to the global market for flat-rolled aluminum mill products, our focus is on heat treat plate and sheet for applications that require higher strength and other desired product attributes that cannot be achieved by common alloy rolled products. The primary end market applications of flat-rolled heat treat plate and sheet are Aero/HS products (which we sell globally) and GE products (which we predominantly sell within North America). We do not supply sheet for automotive applications, and have chosen not to supply sheet for beverage/food can applications nor common alloy rolled products for construction or other applications. Although global demand for these applications is large, the product requirements are less demanding.
1
Similarly, in the areas of aluminum extrusions, we focus on demanding Aero/HS products, Automotive Extrusions and GE products that require high strength, machinability or other specific properties where we can create and maintain a defensible competitive position because of our technical expertise, strong production capability and high product quality. We primarily serve North American demand for extruded mill products. Building and construction applications, the largest segment of North American aluminum extrusion market, rarely require extruded products with specialized properties. Since we have strategically chosen to deploy our capabilities to make differentiated products, we do not focus on building and construction applications.
Our rolling mill in Spokane, Washington ("Trentwood") produces heat treat plate and sheet for aerospace and general engineering end market applications. Our 11 extrusion/drawing facilities, 10 of which are in the United States and one of which is in Canada, serve primarily aerospace, automotive or general engineering applications. Our consolidated Net sales in 2017 totaled approximately $1.4 billion on approximately 625.7 million pounds shipped from these 12 focused facilities. We employed approximately 2,770 people at December 31, 2017.
A fundamental part of our business model is to remain neutral to the impact from fluctuations in the market price for aluminum, thereby earning profit predominately from the conversion of aluminum into semi-fabricated mill products. We refer to this as metal price neutrality. We purchase primary and scrap, or recycled, aluminum, our main raw material, at prices that fluctuate on a monthly basis, and our pricing policies generally allow us to pass the underlying cost of metal through to our customers so that we remain neutral to metal pricing. For some of our higher value added revenue products sold on a spot basis, however, the pass through of metal price movements can lag by several months, with a favorable impact to us when metal prices decline and an adverse impact to us when metal prices increase. Additionally, we sometimes enter into firm-price customer sales agreements that specify a firm underlying metal price plus a conversion price. Spot sales with lagged metal price pass through and firm-price sales agreements create metal price exposure for us, which we mitigate through a hedging program with an objective to remain metal price neutral.
We have long-standing relationships with our customers, which consist primarily of blue-chip companies including leading aerospace and automotive manufacturers, tier one aerospace and automotive suppliers and metal service centers. Approximately 51% of our shipments is sold direct to manufacturers or tier one suppliers and approximately 49% is sold to metal service centers. In our served markets, we seek to be the supplier of choice by pursuing "Best in Class" customer satisfaction driven by quality, availability, service and delivery performance. We strive to differentiate our product portfolio through our broad product offering and our KaiserSelect® products, which are engineered and manufactured to deliver enhanced product characteristics with improved consistency, so as to result in better performance, lower waste and, in many cases, lower production cost for our customers.
We further strive to enhance the efficiency of product flow to our customers and our status as a supplier of choice by tightly integrating the management of our operations across multiple production facilities, product lines and target markets. Additionally, our strategy to be a supplier of choice and low cost producer is facilitated by a culture of continuous improvement that is facilitated by the Kaiser Production System ("KPS"), an integrated application of tools such as Lean Manufacturing, Six Sigma and Total Productive Manufacturing. Using KPS, we seek to continuously reduce our own manufacturing costs and eliminate waste throughout the value chain.
We strive to strengthen our competitive position through strategic capital investment. Significant investments over the past decade have positioned us well with increased capacity and expanded manufacturing capabilities. Past investments at Trentwood more than doubled our capacity and expanded our manufacturing capability to produce thick gauge heat treat plate in order to capitalize on significant demand growth for Aero/HS products. Similarly, our past investments to add capacity and improve capabilities across our automotive manufacturing platform have enabled and continue to enable sales growth of Automotive Extrusions.
Recent capital projects have focused on further improving product quality and manufacturing cost efficiency which we believe are critical to maintaining and strengthening our position in an increasingly competitive market environment over the coming decade. As an example, as we continue to implement the multi-year modernization project at Trentwood, we are upgrading equipment throughout the process flow to reduce conversion costs, increase efficiency and further improve our competitive cost position on all products produced at Trentwood. To differentiate our product quality, the modernization will also replace legacy equipment and improve the process flow for thin gauge heat treat plate to achieve KaiserSelect® quality enhancements for both Aero/HS products and GE products. Additionally, because further expansion of Trentwood’s manufacturing capacity is a byproduct of the manufacturing efficiency improvements of this modernization project, we expect the project will allow us to continue to grow sales at a pace equal to or greater than the growth in Trentwood’s served markets.
2
Because we recognize that we operate in cyclical markets, another key component of our business model is to maintain financial strength and flexibility throughout the business cycle so that even in economic downturns we can proactively pursue strategic growth with financial and competitive strength.
Kaiser Aluminum was founded by Henry J. Kaiser in 1946 with the lease and eventual purchase of three aluminum facilities from the United States government. Over the ensuing decades, Kaiser Aluminum grew to become a fully-integrated aluminum company involved in all aspects of the aluminum industry. From 2000 to 2010, as a result of a strategic reassessment of our competitive positions in the upstream and downstream portions of the aluminum industry, we divested or closed our non-strategic bauxite mining, alumina refining, and primary aluminum operations and focused on downstream operations where we had a competitive advantage. Consequently, we no longer participate in commodity segments within the aluminum industry and focus solely on the production of semi-fabricated specialty aluminum products for major suppliers and manufacturers for applications in our chosen aerospace/high strength, automotive, general engineering and other end-markets.
Business Operations
Consistent with the manner in which our chief operating decision maker reviews and evaluates our business, our semi-fabricated products business is treated as a single operating segment, which we refer to as the Fabricated Products segment. In addition to the Fabricated Products segment, we have one business unit, All Other, which provides general and administrative support for our operations. For purposes of segment reporting under United States generally accepted accounting principles ("GAAP"), we treat the Fabricated Products segment as its own reportable segment. All Other is not considered a reportable segment.
Fabricated Products Segment
Overview
Our Fabricated Products segment focuses on producing rolled, extruded and drawn aluminum products used principally for aerospace and defense, automotive and general engineering products that include consumer durables, electronics, electrical and machinery and equipment applications. For additional information regarding net sales, total assets and long-lived assets of the Fabricated Products segment and by geographic area, and operating income (loss) of the Fabricated Products segment, see Note 15 of Notes to Consolidated Financial Statements included in this Report.
The table below provides shipment and sales information for our fabricated aluminum products by end market application (in millions of dollars except for shipment information and percentages):
Year Ended December 31, | |||||||||||||||||||||
2017 | 2016 | 2015 | |||||||||||||||||||
Shipments (mm lbs): | |||||||||||||||||||||
Aero/HS products | 233.0 | 37 | % | 243.2 | 40 | % | 243.5 | 40 | % | ||||||||||||
Automotive Extrusions | 101.0 | 16 | % | 92.9 | 15 | % | 93.5 | 15 | % | ||||||||||||
GE products | 264.7 | 43 | % | 249.9 | 41 | % | 231.4 | 38 | % | ||||||||||||
Other products | 27.0 | 4 | % | 28.3 | 4 | % | 47.0 | 7 | % | ||||||||||||
625.7 | 100 | % | 614.3 | 100 | % | 615.4 | 100 | % | |||||||||||||
Sales: | |||||||||||||||||||||
Aero/HS products | $ | 653.7 | 47 | % | $ | 675.4 | 51 | % | $ | 695.5 | 50 | % | |||||||||
Automotive Extrusions | 217.3 | 15 | % | 188.8 | 14 | % | 199.2 | 14 | % | ||||||||||||
GE products | 476.2 | 34 | % | 420.1 | 32 | % | 426.1 | 31 | % | ||||||||||||
Other products | 50.3 | 4 | % | 46.3 | 3 | % | 71.1 | 5 | % | ||||||||||||
$ | 1,397.5 | 100 | % | $ | 1,330.6 | 100 | % | $ | 1,391.9 | 100 | % | ||||||||||
Aero/HS Products. Our Aero/HS products include heat treat plate and sheet, hard alloy extruded shapes, cold finish rod and bar, seamless drawn tube and billet used for a wide variety of end uses in the global aerospace and defense industries. Typical applications are structural aircraft components that must perform consistently under extreme variations in temperature and pressure due to frequent take-offs, landings and changes in altitude. Required physical properties include high tensile strength,
3
superior fatigue resistance and exceptional durability even in harsh environments. We use high-strength 2000- and 7000-series alloys and apply a variety of thermal practices to manufacture our Aero/HS products to meet the demanding specifications required for such safety-critical applications. While competing materials such as titanium and composites have displaced aluminum for certain applications on several newer aircraft designs, aluminum continues to be the material used most extensively for structural aerospace and defense applications because it is light weight, can meet demanding performance requirements and is cost effective relative to other materials. Overall, the aerospace and defense industries' consumption of fabricated aluminum products is driven by factors that include airframe build rates, the mix of aircraft models being built and defense spending. Unanticipated changes in build rates and mix of aircraft models being built can trigger restocking or destocking throughout the long aerospace supply chain, temporarily impacting demand for our Aero/HS products. Growth in demand for aerospace plate has exceeded demand growth for other forms of Aero/HS products as aircraft manufacturers have migrated to monolithic component design, where a single piece of aluminum, usually a plate, is heavily machined to form a desired part rather than creating the same part by assembling sub-components made of aluminum sheet, extrusions or forgings that are affixed to one another using rivets, bolts or welds. As more applications convert to monolithic design, we expect aerospace plate demand to continue to grow at a pace higher than our other Aero/HS products.
Automotive Extrusions. Automotive Extrusions consist of extruded aluminum products for many North American automotive applications. Examples of the variety of extruded products that we supply to the automotive industry include extruded products for the body-in-white structural components, bumper systems, anti-lock braking systems and drawn tube for drive shafts. For some Automotive Extrusions, we perform limited fabrication, including sawing and cutting to length. Demand for Automotive Extrusions is determined based upon automotive build rates in North America and aluminum content. In recent years, automotive original equipment manufacturers ("OEMs") and their suppliers have, at an increasing pace, been converting many automotive components that historically were made of steel to aluminum to decrease weight without sacrificing structural integrity and safety performance and thereby achieve greater fuel efficiency standards mandated by stringent United States' Corporate Average Fuel Economy ("CAFE") regulations. We believe fuel efficiency standards along with consumer preference for larger vehicles will continue to drive growth in demand for aluminum extruded components in passenger vehicles as a replacement for the heavier weight of steel components. Our Automotive Extrusions are designed and produced to provide specific mechanical properties and performance attributes required in automotive applications across a broad mix of North American OEMs and automotive platforms. We believe that these attributes are not easily replicated by our competitors and are important to our customers, who are typically tier one automotive suppliers.
GE Products. Our broad portfolio of GE products consists primarily of 6000-series alloy plate, sheet, rod, bar, tube, wire and standard extruded shapes. The 6000-series alloy is an extremely versatile, medium-strength, heat treatable alloy that can be both extruded and rolled. Our GE products have a wide range of uses and applications, many of which involve further fabrication for numerous transportation and other industrial end market applications where machining of plate, rod and bar is intensive. For example, our GE products are used to produce armor for military vehicles, ordnances, manufacturing cells for semiconductor production, numerous electronic devices, after-market motor sport parts, tooling plate, parts for machinery and equipment, bolts, screws, nails and rivets. Demand growth and cyclicality for GE products tend to mirror broad economic patterns and industrial activity in North America. Demand is also impacted by the destocking and restocking of inventory throughout the supply chain.
Other Products. Other products consist of extruded, drawn and cast billet aluminum products for a variety of North American industrial end uses. Demand for Other products tends to mirror broad economic patterns and industrial activity in North America.
Manufacturing Processes
We use two main processes, flat rolling and extrusion/drawing, to produce our fabricated products in the desired forms and dimensions and with the desired physical properties. Both processes start by heating aluminum, a rolling ingot or extrusion billet, to an elevated temperature at which the metal is malleable and then applying pressure in a manner that both forces the metal into a desired shape and begins the "working" of the metal to enhance its strength and related properties.
Flat Rolling. Our manufacturing process for aluminum flat-rolled products uses ingot, a large rectangular slab of aluminum, as the starter material. The ingot is processed through a series of rolling operations that can be done at elevated (hot) or room (cold) temperatures. Finishing steps may include heat treatment, annealing, stretching, leveling or slitting to achieve the desired metallurgical, dimensional and/or performance characteristics. Aluminum flat-rolled products are manufactured in a variety of alloys, a range of tempers (hardness), gauges (thickness) and widths and various finishes. Flat-rolled aluminum semi-finished products are classified as sheet (under 0.25 inches in thickness) or plate (0.25 inches or greater in thickness).
4
Extrusion/Drawing. Our extrusion process begins with a cast billet, which is an aluminum cylinder of varying length and diameter. After heating the billet to make the metal malleable, it is placed into an extrusion press and squeezed (extruded) through a die that gives the material the desired two-dimensional cross section. The material can be quenched as it leaves the press, or processed through a post-extrusion heat treatment cycle, to control the material’s physical properties. The extrusion is straightened, typically by stretching, and then cut to length before being hardened in aging ovens. Drawing is a fabrication operation in which extruded tubes and rods are pulled through a die, or drawn. The primary purpose of drawing is to reduce the diameter and wall thickness while improving physical properties and dimensions. Material may go through multiple drawing steps to achieve the final dimensional specifications. Extruded and drawn semi-fabricated products are manufactured in a variety of alloys and a range of tempers (hardness).
Additionally, some of our locations have remelt and casting operations to produce the ingot or billet for flat rolling or extrusion. To produce the ingot or billet, we purchase primary aluminum, recycled scrap aluminum segregated by alloys and other metals (including copper, zinc and magnesium) that are necessary to create various aluminum alloys. We also recycle internally generated scrap from our own manufacturing processes. Initially in solid form, aluminum is heated in a vessel to a temperature at which it melts. While in molten form, additional metals (aluminum alloyed scrap, alloy metals, primary aluminum or high purity aluminum) are introduced to achieve the proper mixture of chemical elements for a particular alloy. When the desired chemical composition of the molten metal has been achieved, it is poured into a mold in which the molten metal cools in a controlled manner and solidifies into a rolling ingot or extrusion billet. The size of the mold determines the dimensions of the rolling ingot or extrusion billet. Our casting operations at our facilities in Kalamazoo, Michigan, London, Ontario, Los Angeles, California, Newark, Ohio and Sherman, Texas produce extrusion billet for their operations and for our other facilities that do not have casting operations. Trentwood casts rolling ingot for its own consumption.
A description of the manufacturing processes and category of products at each of our production facilities at December 31, 2017 is shown below:
Location | Types of Products | Manufacturing Process | ||
Chandler, Arizona (Extrusion) | Aero/HS, GE | Extrusion | ||
Chandler, Arizona (Tube) | Aero/HS | Extrusion/Drawing | ||
Florence, Alabama | Aero/HS, GE, Other | Drawing | ||
Jackson, Tennessee | Aero/HS, Auto, GE | Extrusion/Drawing | ||
Kalamazoo, Michigan | Auto, GE | Extrusion | ||
London, Ontario (Canada) | Auto | Extrusion | ||
Los Angeles, California | GE, Other | Extrusion | ||
Newark, Ohio | Aero/HS, GE | Extrusion/Rod Rolling | ||
Richland, Washington | GE | Extrusion | ||
Richmond, Virginia (Bellwood) | Auto, GE | Extrusion/Drawing | ||
Sherman, Texas | Auto, GE, Other | Extrusion | ||
Spokane, Washington (Trentwood) | Aero/HS, GE | Flat Rolling | ||
As reflected by the table above, many of our facilities employ the same basic manufacturing process and produce the same types of products. We make a significant effort to tightly integrate the management of our Fabricated Products segment across multiple manufacturing locations, product lines and end market applications to most efficiently and effectively serve the needs of our customers. We centralize purchasing of our primary and scrap, or recycled, aluminum requirements and related alloying agents in order to better manage price, credit and other benefits. Our sales force and the management thereof are also significantly integrated as many customers purchase a number of different products that are produced at different plant facilities. We believe that integration of our operations allows us to capture efficiencies while allowing our facilities to remain highly focused on their specific processes and end market applications.
5
Raw Materials
To make our fabricated products, we purchase primary aluminum and scrap, or recycled, aluminum from third party suppliers in varying percentages depending on various market factors, including price and availability. The price for primary aluminum purchased for the Fabricated Products segment is typically based on the Average Midwest Transaction Price ("Midwest Price"), which reflects the primary aluminum supply/demand dynamics in North America. Scrap aluminum is typically purchased at a discount to the Midwest Price but can require additional processing. The average Midwest Price is comprised of the average London Metal Exchange ("LME") plus average Midwest premium. The average LME and the average Midwest premium for 2017, 2016 and 2015 were $0.89 + $0.09, $0.73 + $0.07 and $0.75 + $0.13, respectively.
In addition to selling fabricated aluminum products to third parties, certain of our production facilities supply billet, log or other intermediate material to another of our facilities for further value added production. As an example, our Newark, Ohio facility supplies billet and log to our Jackson, Tennessee facility.
Pricing, Metal Price Risk Management and Hedging
As noted above, we purchase primary and scrap, or recycled, aluminum, our principal raw material, on a floating price basis typically based on the Midwest Price. Our pricing of fabricated aluminum products is generally intended to lock in a conversion margin (representing the value added from the fabrication process(es)) and to pass metal price fluctuation through to our customers. In order to meet our objective to be metal price neutral, we manage the risk of fluctuations in the price of aluminum through our pricing policies and use of financial derivatives. Our three principal pricing mechanisms are as follows:
• | Spot price. A majority of our customers for GE products and some of our customers for Aero/HS products pay a product price that incorporates the spot price of primary aluminum (LME plus Midwest premium) in effect at the time of shipment to a customer. Spot prices for these products change regularly based on competitive dynamics. Fluctuation in the underlying aluminum price is a significant factor influencing changes in competitive spot prices. Through spot pricing, we generally can pass metal price risk through to customers. For some of our higher value added revenue products sold on a spot basis, however, the pass through of metal price movements can lag by several months, with a favorable impact to us when metal prices decline and an adverse impact to us when metal prices increase. We, from time to time, enter into hedging transactions with third parties to minimize the impact to us of metal price swings for these higher value added revenue products. |
• | Index-based price. The pricing structure of our typical automotive and aerospace contracts calls for our customer to pay a product price that incorporates a monthly index-based price for primary aluminum, such as Platt’s Midwest price for primary aluminum. Index-based pricing typically allows us to pass metal price risk through to the customer and applies to virtually all of our Automotive Extrusions sales and the majority of our Aero/HS products sales. |
• | Firm-price. Some of our customers who commit to volumes and timing of delivery pay a firm-price, creating metal price risk that we must hedge. We are able to limit exposure to metal price risks created by firm-price customer sales contracts by using third-party hedging instruments. Total fabricated product shipments for which we were subject to price risk were, in millions of pounds, 185.6, 213.7 and 204.6 during 2017, 2016 and 2015, respectively. |
All hedging activities are managed centrally to minimize transaction costs, monitor consolidated net exposures and respond promptly to changes in market factors. Hedging activities are conducted in compliance with a policy approved by our Board of Directors and administered by our hedging committee (members of which include our principal executive officer, principal financial officer and principal accounting officer).
Sales, Marketing and Distribution
Industry sales margins for fabricated products fluctuate in response to competitive and market dynamics. Sales are made directly to customers by our sales personnel located in the United States, Canada, Europe and China and by independent sales agents in other regions of Asia, Latin America and the Middle East. Our sales and marketing efforts are focused on the markets for Aero/HS products, Automotive Extrusions, GE products and Other products.
Aero/HS Products. We sell our Aero/HS products to metal service centers, as well as directly to aerospace manufacturers and tier one suppliers. Sales are made primarily under long-term agreements as well as on an order-by-order basis. We serve this market with a North American sales force focused on Aero/HS and GE products and direct sales representatives in Western Europe and China.
6
Automotive Extrusions. Our Automotive Extrusions are sold primarily to tier one automotive suppliers. Almost all sales of Automotive Extrusions occur through direct channels using a North American direct sales force that works closely with our technical sales support organization.
GE Products. A majority of our GE products are sold to large metal service centers in North America on an order-by-order basis, with orders primarily consisting of standard catalog type items shipped with a relatively short lead-time. We service this market with a North American sales force focused on GE and Aero/HS products.
Other Products. Other products are primarily sold directly to industrial end users on an order-by-order basis using a North American direct sales force.
Customers
In 2017, our Fabricated Products segment had over 725 customers. Our two largest customers, Reliance Steel & Aluminum Co. ("Reliance") and The Boeing Company ("Boeing") accounted for approximately 27% and 12%, respectively, of our net sales in 2017. While the loss of Reliance or Boeing as customers could have a material adverse effect on us, we believe that our long-standing relationship with each is good and that the risk of losing either as a customer is remote. See Note 15 of Notes to Consolidated Financial Statements included in this Report for information about our significant concentrations.
Research and Development
We operate three research and development centers. Our Rolling and Heat Treat Center and our Metallurgical Analysis Center are both located at Trentwood. The Rolling and Heat Treat Center has complete hot rolling, cold rolling and heat treat capabilities to simulate, in small lots, processing of flat-rolled products for process and product development on an experimental scale. The Metallurgical Analysis Center consists of a full metallographic laboratory and a scanning electron microscope to support research and development programs as well as respond to plant technical service requests. The third center, our Solidification and Casting Center, is located in Newark, Ohio and has a developmental casting unit capable of casting billets and ingots for extrusion and rolling experiments. The casting unit is also capable of casting full size billets and ingots for processing on the production extrusion presses and rolling mills. See Note 1 of Notes to Consolidated Financial Statements included in this Report for information about our research and development costs.
A significant amount of our research and development is devoted to product and process development within our production operations, largely focused on controlling the manufacturing process to improve product quality, ensure consistency and enhance one or more specific product attributes. This has resulted in the creation and delivery of our highly differentiated KaiserSelect® products.
We hold numerous patents, trademarks, trade secrets and copyrights that relate to the design, use and marketing of products. We consider this intellectual property to be important, but no single property is material to the overall conduct of our business.
All Other
All Other provides general and administrative support to our operations. The expenses incurred in this business unit are not allocated to our other operations. All Other is not considered a reportable segment.
Segment and Geographical Area Financial Information
For information regarding our GAAP reporting segment and the geographical areas in which we operate, see Note 15 of Notes to Consolidated Financial Statements included in this Report.
Competition
The fabricated aluminum industry is highly competitive. We focus our fabricating operations on technically challenging applications for flat-rolled heat treat plate and sheet and extruded/drawn products that allow us to apply our core metallurgical and process technology capabilities to produce highly engineered products with differentiated characteristics. We seek to further differentiate ourselves from our competitors by providing a broad product offering and striving to deliver "Best in Class" customer satisfaction.
Our primary competitors in the global market for Aero/HS products are Arconic, Inc., Constellium N.V. and Aleris Corporation. In serving our North American customers for both Automotive Extrusions and GE products, our primary competitors are Arconic, Inc. and Sapa AS, and for certain of these products, we also compete with smaller, regional participants. In North America, we also compete with general engineering heat treat plate products imported from South Africa,
7
Europe and China. Some of our competitors are substantially larger, have greater financial resources and may have other strategic advantages.
Because many of our products are used in safety critical applications, our customers have demanding standards for product quality and consistency that make it difficult to become a qualified supplier. Suppliers must pass a rigorous qualification process to sell to both airframe and automotive manufacturers and must also make significant investments in infrastructure and specialized equipment to supply products for these high strength applications. Further, sophisticated manufacturing processes make it difficult to become a qualified supplier, even with proper equipment. For example, producing heat treat plate and sheet products, particularly for aerospace applications, requires technological expertise that only a few companies have developed through significant investment in research and development and decades of operating experience.
Employees
At December 31, 2017, we employed approximately 2,770 people, of which approximately 2,710 were employed in our Fabricated Products segment and approximately 60 were employed in our corporate group, most of whom are located in our office in Foothill Ranch, California.
The table below shows each manufacturing location, the primary union affiliation, if any, and the expiration date for the current union contracts as of December 31, 2017. As indicated below, union affiliations are with the United Steel, Paper and Forestry, Rubber, Manufacturing, Energy, Allied Industrial and Service Workers International Union, AFL-CIO, CLC ("USW"), International Association of Machinists ("IAM") and International Brotherhood of Teamsters ("Teamsters"). See Note 15 of Notes to Consolidated Financial Statements in this Report for additional information about concentration of labor subject to collective bargaining agreements.
Contract | ||||
Location | Union | Expiration Date | ||
Chandler, Arizona (Extrusion) | Non-union | — | ||
Chandler, Arizona (Tube) | USW | Apr 20181 | ||
Florence, Alabama | USW | Mar 2020 | ||
Jackson, Tennessee | Non-union | — | ||
Kalamazoo, Michigan | USW | Feb 2021 | ||
London, Ontario (Canada) | USW Canada | Feb 20181 | ||
Los Angeles, California | Teamsters | Apr 20181 | ||
Newark, Ohio | USW | Sep 2020 | ||
Richland, Washington | Non-union | — | ||
Richmond, Virginia (Bellwood) | USW/IAM | Nov 2020/Nov 2020 | ||
Sherman, Texas | IAM | Apr 2022 | ||
Spokane, Washington (Trentwood) | USW | Sep 2020 | ||
____________________
1. | We are currently in the process of negotiating the labor agreement covering employees at our London, Ontario facility and will start negotiations at our Chandler, Arizona, and Los Angeles, California facilities within the next three months. See Note 15 of Notes to Consolidated Financial Statements in Item 8. “Financial Statements and Supplementary Data” of this Report for additional information about concentration of labor subject to collective bargaining agreements. |
Environmental Matters
We are subject to a number of environmental laws and regulations, to potential fines or penalties assessed for alleged breaches of the environmental laws and regulations and to potential claims and litigation based upon such laws and regulations.
We have established procedures for regularly evaluating environmental loss contingencies. Our environmental accruals represent our undiscounted estimate of costs reasonably expected to be incurred based on presently enacted laws and regulations, existing requirements, currently available facts, existing technology and our assessment of the likely remediation actions to be taken. See Note 9 of Notes to Consolidated Financial Statements included in this Report.
8
Legal Structure
Our current corporate structure is summarized as follows:
• | We directly own 100% of the issued and outstanding shares of capital stock of Kaiser Aluminum Investments Company, a Delaware corporation ("KAIC"), which functions as an intermediate holding company. |
• | We directly own 100% of the ownership interest in Kaiser Aluminum Beijing Trading Company, which was formed in China for the primary purpose of engaging in market development and commercialization and distribution of our products in Asia. |
• | KAIC owns 100% of the ownership interests of each of: |
• | Kaiser Aluminum Fabricated Products, LLC, a Delaware limited liability company ("KAFP"), which directly holds the assets and liabilities associated with our Fabricated Products segment (excluding those assets and liabilities associated with our London, Ontario facility and certain of the assets and liabilities associated with our Fabricated Products segment’s operations in the State of Washington) and owns 100% of the ownership interest of: |
• | Kaiser Aluminum Washington, LLC, a Delaware limited liability company, which holds certain of the assets and liabilities associated with our Fabricated Products segment’s operations in the State of Washington. |
• | Kaiser Aluminum Canada Limited, an Ontario corporation, which holds the assets and liabilities associated with our London, Ontario facility; |
• | Kaiser Aluminum Mill Products, Inc., a Delaware corporation, which engages in market development and commercialization and distribution of our products in the United Kingdom; |
• | Trochus Insurance Co., Ltd., a corporation formed in Bermuda, which has historically functioned as a captive insurance company; and |
• | Kaiser Aluminum France, SAS, a corporation formed in France for the primary purpose of engaging in market development and commercialization and distribution of our products in Europe. |
Item 1A. Risk Factors
This Item may contain statements which constitute "forward-looking statements" within the meaning of the Private Securities Litigation Reform Act of 1995. See "Forward-Looking Statements" at the outset of Part I of this Report for cautionary information with respect to such forward-looking statements. Such cautionary information should be read as applying to all forward-looking statements wherever they appear in this Report. Forward-looking statements are not guarantees of future performance and involve significant risks and uncertainties. Actual results may vary from those in forward-looking statements as a result of a number of factors including those we discuss in this Item and elsewhere in this Report. In addition to the factors discussed elsewhere in this Report, the risks described below are those that we believe are material to our company. The occurrence of any of the events discussed below could significantly and adversely affect our business, prospects, financial position, results of operations and cash flows as well as the trading price of our common stock.
We operate in a highly competitive industry.
The fabricated products segment of the aluminum industry is highly competitive. We compete with others in the industry based upon quality, availability, price, customer service and delivery performance. Some of our competitors are substantially larger and may have greater financial resources than we do. Additionally, some competitors may operate more facilities than we do, be geographically closer to our customers than we are, employ more efficient or advanced technologies than we do, or have other strategic advantages. To the extent that our competitors have existing facilities or locate new production facilities in developing economies, their facilities may have a manufacturing cost advantage compared to our facilities, which are all located in North America. Foreign competitors may sell products similar to our products at lower prices as a result of lower manufacturing costs, currency exchange rates that periodically favor foreign competition or dumping those products in North America in violation of existing trade laws. Additionally, new parties may become capable of manufacturing similar products and qualifying them with our customers. The capability and incremental capacity for such products that these new competitors introduce to the market could lead to further competitive pricing pressure. We may not be able to compete by differentiating ourselves based on the quality, availability and delivery of our products or our customer service. We also may not be able to adequately reduce our selling prices or our costs to levels competitive with new or foreign competitors. Increased competition
9
could cause a reduction in our shipment volumes, our product pricing or both shipment volumes and product pricing, any one of which could have an adverse effect on our financial position, results of operations and cash flows.
We depend on a core group of significant customers.
In 2017, Reliance and Boeing were our two largest customers, representing approximately 27% and 12%, respectively, of our net sales. Our five largest customers in total accounted for approximately 53% of our 2017 net sales. Most of these customers have one or more sizable sales agreements with us. If one or more of these customers experienced a prolonged period of adverse demand, depressed business activity or financial distress, if any of these customers breached or sought relief from its contractual obligations under its sales agreements with us or if any of these customer relationships otherwise ended or materially deteriorated and such lost business was not successfully replaced, our financial position, results of operations and cash flows could be adversely affected.
We experience fluctuation in certain costs that we cannot pass through to our customers and face pressure from our customers on pricing.
We generally are unable to pass fluctuations of certain costs through to our customers, including the cost of energy, certain raw materials and freight. Further, cost cutting initiatives that many of our customers have adopted generally result in downward pressure on pricing. If we are unable to generate sufficient productivity improvements and cost savings in the future to offset reductions in our selling prices and increases in our costs that we cannot pass through to our customers, our financial position, results of operations and cash flows could be adversely affected.
Our industry is very sensitive to foreign economic, regulatory and political factors that may adversely affect our business.
We import primary aluminum from, and manufacture fabricated products used in, foreign countries. Our financial position, results of operations and cash flows could be adversely affected by numerous factors in the politically and economically diverse jurisdictions: (i) from which our input materials are sourced; (ii) in which we operate; (iii) in which our customers operate; or (iv) in which our products are consumed or further fabricated. Such factors include but are not limited to:
• | trade disputes; |
• | the implementation of controls on imports, exports or prices; |
• | the adoption of new forms of taxation and duties; |
• | the imposition of currency restrictions; |
• | inflation relative to the U.S. and related fluctuations in currency and interest rates; |
• | government regulation in the countries in which we operate, service customers or purchase raw materials; |
• | civil unrest and labor problems; |
• | the nationalization or appropriation of rights or other assets; and |
• | acts or threats of war or terrorism; |
The commercial aerospace industry is cyclical and downturns in the commercial aerospace industry could adversely affect our business.
We derive a significant portion of our revenue from products sold to the aerospace industry. Notwithstanding a secular growth trend over the past fifteen years, the aerospace industry has historically been highly cyclical. Numerous factors that influence demand for new commercial aircraft could result in cancellations or deferrals of aircraft orders and a global decrease in new commercial aircraft deliveries. These factors include but are not limited to: (i) declines or reduced growth trends in global travel and airline passenger traffic; (ii) replacement of older aircraft and fuel inefficient aircraft; (iii) changing airline strategies affecting preferences for jumbo aircraft models as opposed to single-aisle aircraft models; (iv) airline industry profitability; (v) the state of the U.S. and global economies; (vi) concerns regarding terrorism or the threat of terrorism; (vii) concerns regarding pandemics of infectious disease; and (viii) safety concerns with newly introduced aircraft. Despite existing backlogs, adverse developments in any one or more of these influencing factors may lead to reduced demand for new aircraft that utilize our products, which could adversely affect our financial position, results of operations and cash flows.
10
Reductions in demand for our products may be more severe than, and may occur prior to, reductions in demand for our customers’ products.
Most of our products undergo further fabrication by other parties before being deployed in their end uses. In particular, our Aero/HS products undergo numerous stages of further fabrication or assembly by a number of parties in the supply chain, often over the course of many months. The lead time from when we sell our Aero/HS product to when the finished product is installed on an aircraft often exceeds a year. Due to this long lead time, demand for our products may increase prior to demand for our customers' products or may decrease when our customers experience or anticipate softening demand for their products. Our customers typically respond to reduced demand for their products by depleting their inventory until their inventory falls to a new desired level. This causes a greater reduction in demand for our products than our customers experience for their products. Further, the reduction in demand for our products can be exacerbated if our customers' inventory levels had been higher than normal, if production is delayed for specific commercial airframe models, if our customers previously had purchased products from us at committed sales contract volumes that exceeded their actual need or for other reasons. The amplified reduction in demand for our products while our customers consume their inventory to meet their business needs (destocking) may adversely affect our financial position, results of operations and cash flows.
Reductions in defense spending for aerospace and non-aerospace military applications could adversely affect demand for our products.
Our products are used in a wide variety of military applications, including military aircraft, armored vehicles and ordnance. Many military programs that currently use or in the future could use our products may be subject to changes in military strategy and government priorities. Further, while many of the U.S. government programs span several years, they are often funded annually, and funding is generally subject to congressional appropriations. When U.S. and foreign governments are faced with competing national priorities, there can be significant pressure to reduce defense spending, which could reduce the demand for our products and adversely affect our financial position, results of operations and cash flows.
Our customers may reduce their demand for aluminum products in favor of alternative materials.
Our products compete with other materials for use in various customer applications. For instance, the commercial aerospace industry has used and continues to evaluate the further use of titanium, composites and carbon fiber materials as alternatives to aluminum to reduce aircraft weight and increase fuel efficiency. Additionally, while the automotive industry has continued to increase use of aluminum in vehicle production to reduce vehicle weight and achieve government-mandated fuel efficiency standards, manufacturers may revert to steel or other materials for certain applications and rely on improved drivetrain technology, more efficient engines, aerodynamics or other measures to achieve fuel efficiency goals. The willingness of customers to use materials other than aluminum could adversely affect the demand for our products, particularly our Aero/HS products and Automotive Extrusions, and thus could adversely affect our financial position, results of operations and cash flows.
Our customers may reduce their demand for our products if the government loosens CAFE standards or if oil prices remain low for a protracted period of time.
Efficient use of fossil fuels partially drives demand for aluminum in transportation applications. The U.S. Environmental Protection Agency ("EPA") and other federal regulatory agencies have generally sought to limit growth of fossil fuel usage by establishing stricter fuel efficiency standards. However, the current leaders of the EPA and other federal agencies oppose the environmental agendas of prior administrations and could relax these previously established fuel efficiency standards. Additionally, in periods of lower oil prices, the economic benefits of replacing older aircraft and automobiles with more fuel-efficient models are less compelling. A relaxation of fuel efficiency standards by the EPA or an extended period of moderate oil prices could reduce demand for new aircraft and automobiles, which could adversely affect the demand for our products and have an adverse effect on our financial position, results of operations and cash flows.
Downturns in the automotive and ground transportation industries could adversely affect our business.
The demand for our Automotive Extrusions and many of our general engineering and other industrial products is dependent on the production of cars, light trucks, SUVs and heavy duty vehicles and trailers in North America. The automotive industry is highly cyclical, as new vehicle demand is dependent on consumer spending and is tied closely to the overall strength of the North American economy. Even with the automotive industry’s growing use of aluminum to reduce vehicle weight, weak demand for, or lower production of, new cars, light trucks, SUVs and heavy duty vehicles and trailers could adversely affect the demand for our products and have an adverse effect on our financial position, results of operations and cash flows.
11
Changes in consumer demand for particular motor vehicles could adversely affect our business.
Sensitivity to fuel prices and consumer preferences can influence consumer demand for motor vehicles that have a higher content of the aluminum Automotive Extrusions that we supply. The loss of business with respect to, or a lack of commercial success of, one or more particular vehicle models for which we are a significant supplier could have an adverse impact on our financial position, results of operations and cash flows.
We may experience difficulties in the launch or production ramp-up of new products which could adversely affect our business.
As we ramp up manufacturing processes for newly introduced products, we may experience difficulties, including manufacturing disruptions, delays or other complications, which could adversely impact our ability to serve our customers, our reputation, our costs of production and, ultimately, our financial position, results of operations and cash flows.
Unplanned events may interrupt our production operations, which may adversely affect our business.
The production of fabricated aluminum products is subject to unplanned events such as explosions, fires, inclement weather, natural disasters, accidents, labor disruptions, transportation interruptions and supply interruptions. Operational interruptions could significantly curtail the production capacity of a facility for a period of time. We have redundant capacity and capability to produce many of our extruded products within our manufacturing platform to mitigate our business risk from such interruptions, but interruptions at Trentwood where our production of plate and sheet is concentrated, could significantly compromise our ability to meet our customers’ needs. Delayed delivery of our products to customers who require on-time delivery from us may cause customers to purchase alternative products at a higher cost, reschedule their own production or incur other incremental costs. Customers may be able to pursue financial claims against us for their incremental costs, and we may incur costs to correct such problems in addition to any liability resulting from such claims. Interruptions may also harm our reputation among actual and potential customers, potentially resulting in a loss of business. To the extent these losses are not covered by insurance, our financial position, results of operations and cash flows could be adversely affected by such events.
We may not be able to successfully implement our productivity enhancement and cost reduction initiatives that are necessary to offset competitive price pressure.
Over time, we have experienced pricing pressure on many of our products and anticipate continued pricing pressure in the future. Ongoing and heightened competitive price pressure makes it increasingly important for us to be a low cost producer. Although we have undertaken and expect to continue to undertake productivity enhancement and cost reduction initiatives, including significant investments in our facilities to improve our manufacturing efficiency, cost and product quality, we cannot make assurances that we will complete all of these initiatives, that we will fully realize the estimated cost savings from such activities, that short-to-medium term improvements from new efficiencies and lower cost structure achieved will become permanent or that we will be able to continue to reduce cost and increase productivity over the long term.
Our investment and other expansion projects may not be completed, start up as scheduled or deliver the expected capacity and other benefits.
Our ability to complete our investment and expansion projects and the timing and costs of doing so are subject to various risks associated with all major construction projects, many of which are beyond our control, including technical or mechanical problems and economic conditions. Additionally, the start-up of operations after such projects have been completed can be complicated and costly. If we are unable to fully complete these projects, if the actual costs for these projects exceed our expectations, if the start-up phase after completion is more complicated than anticipated or if the capacity and other benefits of these projects are less than anticipated, our financial position, results of operations and cash flows could be adversely affected.
Our business could be adversely affected by increases in the cost of aluminum.
Our largest inputs to produce fabricated aluminum products are primary aluminum and recycled scrap aluminum. The pricing of primary and recycled scrap aluminum fluctuates in response to global supply and demand. Additionally, recycled scrap aluminum is generally priced at a discount to primary aluminum that loosens and tightens in response to regional aluminum scrap supply and demand. The timing and magnitude of changes in market pricing for primary and scrap aluminum are largely unpredictable. Our pricing structures for fabricated aluminum products generally allow us to pass fluctuations in the price of primary aluminum through to our customers so that we can minimize our exposure to metal price risk. However, competitive dynamics for certain of our high value added products may limit the amount or delay the timing of selling price increases on our products to recover our increased aluminum costs, resulting in a time lag during which we may be partially exposed to metal price risk. If these events were to occur, they could have an adverse effect on our financial position, results of
12
operations and cash flows. In addition, if the market price for primary aluminum were to remain high for an extended period of time, the corresponding increase in our selling price for our fabricated products may cause some of our customers to switch to other materials in lieu of our products, causing sales of our fabricated aluminum products to decrease, which could adversely affect our financial position, results of operations and cash flows.
Our business could be adversely affected by the pricing and availability of recycled scrap aluminum.
We can efficiently use certain forms of recycled scrap aluminum in lieu of primary aluminum and alloying metals in our operations because recycled scrap aluminum trades at a discount to primary aluminum. The size of the discount to primary aluminum depends on regional scrap aluminum supply and demand dynamics. Larger discounts, generally available in periods of ample regional scrap aluminum supply relative to demand, enhance the economic advantage to us of using recycled scrap aluminum in lieu of primary aluminum and alloying metals. The timing and magnitude of changes in scrap discounts relative to primary aluminum are largely unpredictable. If the availability of recycled scrap aluminum in our regional markets were to tighten, scrap discounts relative to primary aluminum could decline and the amount of recycled scrap aluminum we could procure for use in our operations could decline, either of which could have an adverse effect on our financial position, results of operations and cash flows.
Volatile pricing for commodities, including aluminum, certain alloying metals, natural gas and electricity, can cause our liquidity to decline and lead to non-cash charges in periods of declining commodity pricing.
We execute a hedging strategy to reduce the risk to our business from the volatility of prices for aluminum, certain alloying metals, natural gas and electricity. Large price declines for these commodities could cause us to incur sizable non-cash mark to market losses on our hedge positions. Also, a market price decline for aluminum could result in a non-cash lower-of-cost-or-market inventory charge. Besides non-cash losses, lower commodity prices could reduce our liquidity due to lower borrowing availability under our revolving credit facility (caused by lower market value of our inventory which serves as collateral for the facility) and due to potential cash required for margin calls on our hedge positions. Non-cash losses and reduced liquidity could have an adverse effect on our financial position, results of operations and cash flows.
Our hedging programs may limit the income and cash flows we would otherwise expect to receive if our hedging program were not in place and may otherwise affect our business.
In the ordinary course of business, we enter into hedging transactions to limit our exposure to risks relating to changes in the market prices of primary aluminum, certain alloying metals, natural gas and electricity, as well as fluctuations in foreign currency exchange rates. To the extent that market prices or exchange rates at the expiration of these hedging transactions would have been more favorable to us than the fixed prices or rates established by these hedging transactions, our income and cash flows will be lower than they otherwise would have been. As noted above, our liquidity could also be adversely affected to the extent we incur margin calls from our hedging counterparties due to the market price of the underlying commodity or the foreign currency exchange rates deviating adversely from fixed, floor or ceiling prices or rates established by our outstanding hedging transactions. Our failure to satisfy certain covenants in the underlying hedging documents or the occurrence of an event of default thereunder could also trigger margin calls that could adversely impact our liquidity, financial position, results of operations and cash flows. Our hedging programs also expose us to the creditworthiness of our hedging counterparties, which is inherently difficult to assess and can change quickly and dramatically. Non-performance by a hedging counterparty could have an adverse effect on our financial position, results of operations and cash flows.
Covenants and events of default in our debt instruments could limit our ability to undertake certain types of transactions and adversely affect our liquidity.
Our revolving credit facility and the indenture governing our 5.875% Senior Notes due 2024 ("5.875% Senior Notes") contain a number of restrictive covenants that impose operating and financial restrictions on us and may limit our ability to engage in acts that may be in our long-term best interest, including restrictions on our ability to:
•incur additional indebtedness and guarantee indebtedness;
•pay dividends or make other distributions or repurchase or redeem capital stock;
•prepay, redeem or repurchase certain debt;
•issue certain preferred stock or similar equity securities;
•make loans and investments;
•sell assets;
13
•incur liens;
•enter into transactions with affiliates;
•alter the businesses we conduct;
•enter into agreements restricting our subsidiaries' ability to pay dividends; and
•consolidate, merge or sell all or substantially all of our assets.
In addition, restrictive covenants in our revolving credit facility require us in certain circumstances to maintain specified financial ratios and satisfy other financial condition tests. Our ability to meet those financial ratios and tests can be affected by events beyond our control and we may be unable to meet them.
A breach of the covenants or restrictions under our revolving credit facility or under the indenture governing the 5.875% Senior Notes could result in an event of default under the applicable indebtedness. Such a default may allow the creditors to accelerate the related debt. A payment default or an acceleration following an event of default under our revolving credit facility or our indenture for our 5.875% Senior Notes could trigger an event of default under the other indebtedness obligation as well as any other debt to which a cross-acceleration or cross-default provision applies, which could result in the principal of and the accrued and unpaid interest on all such debt becoming due and payable. In addition, an event of default under our revolving credit facility could permit the lenders under our revolving credit facility to terminate all commitments to extend further credit under that facility. Furthermore, if we were unable to repay any amounts due and payable under our revolving credit facility, those lenders could proceed against the collateral granted to them to secure that indebtedness. In the event our lenders or noteholders accelerate the repayment of our borrowings, we and our subsidiaries may not have sufficient assets to repay that indebtedness. As a result of these restrictions, we may be:
•limited in how we conduct our business and grow in accordance with our strategy;
•unable to raise additional debt or equity financing to operate during general economic or business downturns; or
•unable to compete effectively or to take advantage of new business opportunities.
In addition, our financial results, our level of indebtedness and our credit ratings could adversely affect the availability and terms of any additional or replacement financing.
More detailed descriptions of our revolving credit facility and the indenture governing our 5.875% Senior Notes are included in filings made by us with the SEC, along with the documents themselves, which provide the full text of these covenants.
Restrictive covenants in our debt instruments contain significant qualifications and exceptions.
While our revolving credit facility and the indenture governing the 5.875% Senior Notes place limitations on our ability to pay dividends or make other distributions, repurchase or redeem capital stock, make loans and investments and incur additional indebtedness, investors should be aware that these limitations are subject to significant qualifications and exceptions. The aggregate amount of payments made or incremental debt incurred in compliance with these limitations could be substantial.
As indicated above, more detailed descriptions of our revolving credit facility and the indenture governing our 5.875% Senior Notes are included in filings made by us with the SEC, along with the documents themselves, which provide the full text of these covenants.
Servicing our debt requires a significant amount of cash and we may not have sufficient cash flow from our business to pay our debt.
Our ability to make scheduled interest and principal payments on our debt obligations or to refinance such obligations depends on our financial condition and operating performance, which are subject to prevailing economic and competitive conditions and to certain financial, business, legislative, regulatory and other factors beyond our control. We may be unable to maintain a level of cash flows from operating activities sufficient to permit us to pay the interest, principal and premium, if any, on our indebtedness.
If our cash flows and capital resources are insufficient to fund our debt service obligations, we could face substantial liquidity problems and could be forced to reduce or delay investments and capital expenditures, dispose of material assets or operations, restructure or refinance our indebtedness or seek additional debt or equity capital. We may not be able to effect any such alternative measures, if necessary, on commercially reasonable terms or at all and, even if successful, those alternative
14
actions may not allow us to meet our scheduled debt service obligations. Our revolving credit facility and the indenture governing the 5.875% Senior Notes restrict our ability to dispose of assets and use the proceeds from those dispositions and may also restrict our ability to raise debt or certain forms of equity capital to be used to repay other indebtedness when it becomes due. We may not be able to consummate asset dispositions or to obtain proceeds in an amount sufficient to meet any debt service obligations then due.
If we cannot make scheduled payments on our debt, we will be in default and holders of the 5.875% Senior Notes could declare all outstanding principal and interest to be due and payable, the lenders under our revolving credit facility could terminate their commitments to loan money, the lenders could foreclose against the assets securing their borrowings and we could be forced into bankruptcy or liquidation.
We are a holding company and depend on our subsidiaries for cash to meet our obligations and pay any dividends.
We are a holding company and conduct all of our operations through our subsidiaries, certain of which are not guarantors of our 5.875% Senior Notes or our revolving credit facility. Accordingly, repayments of our 5.875% Senior Notes and amounts due under our revolving credit facility are dependent on the generation of cash flow by our subsidiaries and their ability to make such cash available to us by dividend, loan, debt repayment or otherwise. Our subsidiaries that are not guarantors of our revolving credit facility or the 5.875% Senior Notes have no obligation to pay amounts due on the revolving credit facility or the 5.875% Senior Notes or to make funds available for that purpose. Our subsidiaries may not be able to, or may not be permitted to, make distributions to enable us to make payments in respect of our indebtedness. Each of our subsidiaries is a distinct legal entity and, under certain circumstances, legal and contractual restrictions may limit our ability to obtain cash from our subsidiaries. In the event that we do not receive distributions from our subsidiaries, we may be unable to make required interest and principal payments on our revolving credit facility, the 5.875% Senior Notes or other indebtedness.
Our inability to receive distributions from our subsidiaries, otherwise generate sufficient cash flows to satisfy our debt obligations or refinance our indebtedness on commercially reasonable terms, or at all, would adversely affect our financial position and results of operations.
Our failure to maintain satisfactory labor relations could adversely affect our business.
At December 31, 2017, approximately 63% of our employees were represented by labor unions under labor contracts with varying durations and expiration dates. Employees at Trentwood and our Newark, Ohio facility are represented by the USW under a single contract that extends through September 2020. The USW also represents employees at five other facilities, two of which have contracts expiring in 2018. As part of any labor negotiation, the future wages, healthcare benefits and excise taxes that may result therefrom, and other benefits that we agree to, could adversely affect our future financial position, results of operations and cash flows. In addition, negotiations could divert management attention, result in unsatisfactory terms and conditions, fail in coming to any agreement at all or result in strikes, work stoppages or other union-initiated work actions, any of which could have an adverse effect on our financial position, results of operations and cash flows. Moreover, the existence of labor agreements may not prevent such union-initiated work actions.
Our participation in multi-employer union pension plans may have an adverse effect on our financial performance.
We participate in several multi-employer pension plans pursuant to our collective bargaining agreements. Our contribution amounts to these plans were established by collective bargaining and, along with benefit levels and related items, will be issues in our future collective bargaining negotiations. Based on the most recent information available to us, we believe some of these plans are underfunded and may require increased contributions from participating employers to fill the funding shortfall in the future. An employer that withdraws or partially withdraws from a multi-employer pension plan may incur a withdrawal liability for the portion of the plan’s underfunding that is allocable to the withdrawing employer under very complex actuarial and allocation rules. The failure of a withdrawing employer to fund these obligations can increase the burden of the remaining participating employers to make up the funding shortfall, which could have an adverse effect on our financial position, results of operations and cash flows. The increase or decrease in our contributions to these multi-employer pension plans will depend on our future collective bargaining, actions taken by trustees who manage the plans, actions of other participating employers, government regulations and the actual return on assets held in the plans, among other factors.
The USW has director nomination rights through which it may influence us, and interests of the USW may not align with our interests or the interests of our stockholders, debt holders and other stakeholders.
Pursuant to agreements we have with the USW, the USW has the right, subject to certain limitations, to nominate candidates which, if elected, would constitute 40% of our Board of Directors through December 31, 2020. As a result, the directors
15
nominated by the USW have a significant voice in the decisions of our Board of Directors. It is possible that the USW may seek to extend the term of the agreement and its right to nominate board members beyond 2020.
Environmental compliance, clean up and damage claims may decrease our cash flow and adversely affect our business.
We are subject to numerous environmental laws and regulations with respect to, among other things: air and water emissions and discharges; the generation, storage, treatment, transportation and disposal of solid and hazardous waste; and the release of hazardous or toxic substances, pollutants and contaminants into the environment. Compliance with these environmental laws is and will continue to be costly.
We have accrued and will accrue for costs that are reasonably expected to be incurred based on available information with respect to fines, penalties and expenses for alleged breaches of environmental laws and investigations and environmental clean up activities with respect to our continuing operations and certain of our former operations. However, actual costs could exceed accrued amounts, perhaps significantly, and such expenditures could occur sooner than anticipated, which could adversely affect our financial position, results of operations and cash flows.
Additionally, we may be subject to new claims from governmental authorities or third parties related to alleged injuries to the environment, human health or natural resources, including claims with respect to waste disposal sites, the clean up of sites currently or formerly used by us or exposure of individuals to hazardous materials. New laws or regulations or changes to existing laws and regulations may also be enacted, including government mandated green initiatives and limitations on carbon emissions that increase the cost or complexity of compliance. Costs related to any new investigation, clean-up or other remediation, fines or penalties, resolution of third-party claims or compliance with new or amended laws and regulations may be significant and could have an adverse effect on our financial position, results of operations and cash flows.
Governmental regulation relating to greenhouse gas emissions may subject us to significant new costs and restrictions on our operations.
Laws enacted by the U.S. Congress or policies of the EPA could regulate greenhouse gas emissions through cap-and-trade systems, carbon taxes or other programs under which emitters would be required to buy allowances to offset emissions of greenhouse gas, pay carbon based taxes, make significant capital investments, alter manufacturing practices or curtail production. In addition, several states, including the state of Washington, in which we have manufacturing operations, have considered and continue to consider various greenhouse gas regulation and reduction programs through legislative proposals, executive orders and ballot initiatives. Certain of our manufacturing plants use significant amounts of electricity and natural gas and certain of our plants emit amounts of greenhouse gas above certain minimum thresholds that have or may be imposed. Greenhouse gas regulations could restrict our access to natural gas and limit our ability to use natural gas and increase the price we pay for natural gas and electricity, any one of which could significantly increase our costs, reduce our competitiveness in the global economy or otherwise adversely affect our business, operations or financial results.
We may be subject to risks relating to our information technology systems.
We rely on information technology systems to process, transmit and store electronic information and manage and operate our business. A breach in cyber security could expose us, our customers, our suppliers and our employees to risks of misuse of confidential information. A breach could also result in manipulation and destruction of data, production downtimes and operations disruptions, which in turn could adversely affect our reputation, competitive position, business or results of operations. The costs related to cyber or other security threats or disruptions may not be fully insured or indemnified by other means.
In addition, from time to time we may implement new technology systems or replace and/or upgrade our current information technology systems. These upgrades or replacements may not improve our productivity to the levels anticipated and may subject us to inherent costs and risks associated with implementing, replacing and updating these systems, including potential disruption of our internal control structure, substantial capital expenditures, demands on management time and other risks of delays or difficulties in transitioning to new systems or of integrating new systems into other existing systems. Our inability to prevent information technology system disruptions or to mitigate the impact of such disruptions could have an adverse effect on us.
We may not be able to utilize all of our net operating loss carryforwards.
Our ability to utilize our net operating loss carryforwards and other tax attributes could be limited to the extent they expire before we fully utilize them or if changes in federal or certain state tax laws reduce or eliminate our ability to use them to offset income taxes. Additionally, a change in our ownership, specifically a change in ownership of more than 50% during any period
16
of 36 consecutive months ("ownership change"), as determined under the Internal Revenue Code of 1986 ("Code"), could reduce our ability to fully use our net operating loss carryforwards and other significant tax attributes.
To prevent an unintended ownership change that could compromise our tax attributes, our stockholders have (a) approved an amendment to our certificate of incorporation to implement stock transfer restrictions ("Transfer Restrictions") that will expire on May 26, 2019 and (b) ratified a tax asset protection rights plan ("Tax Asset Rights Plan"), which will expire on April 7, 2019. While both were designed to preserve our ability to fully utilize our net operating loss carryforwards and other significant tax attributes to offset future taxable income, neither the Transfer Restrictions nor the Tax Asset Rights Plan completely protects us from an ownership change that could limit our use of our net operating loss carryforwards and other valuable tax attributes.
After our net operating loss carryforwards and other significant tax attributes are fully utilized or if they become unavailable to us before we fully utilize them, our future income will not be shielded from federal and state income taxation and the funds otherwise available for general corporate purposes would be reduced.
We could engage in or approve transactions involving our common shares that inadvertently impair the use of our federal income tax attributes.
Section 382 of the Code affects our ability to use our federal income tax attributes, including our net operating loss carryforwards, following a more than 50% change in ownership during any period of 36 consecutive months, an ownership change, as determined under the Code. Certain transactions may be included in the calculation of an ownership change, including transactions involving our repurchase or issuance of our common shares. When we engage in or approve any transaction involving our common shares that may be included in the calculation of an ownership change, our practice is to first perform the calculations necessary to confirm that our ability to use our federal income tax attributes will not be affected. These calculations are complex and reflect certain necessary assumptions. Accordingly, it is possible that we could approve or engage in a transaction involving our common shares that causes an ownership change and inadvertently impairs the use of our federal income tax attributes.
The Tax Asset Rights Plan and Transfer Restrictions implemented by us to protect our tax attributes could hinder the market for our common stock.
To reduce the risk that an ownership change would jeopardize the preservation of our U.S. federal income tax attributes, including net operating loss carryforwards, for purposes of Sections 382 and 383 of the Code, we adopted the Tax Asset Rights Plan and implemented the Transfer Restrictions as discussed above. The Tax Asset Rights Plan and the Transfer Restrictions may make our stock less attractive to large institutional holders, discourage potential acquirers from attempting to take over our company, limit the price that investors might be willing to pay for shares of our common stock and otherwise hinder the market for our common stock.
The Transfer Restrictions implemented by us to protect our tax attributes may void transactions in our common stock effected by 5% stockholders.
The Transfer Restrictions in our certificate of incorporation restrict the transfer of our equity securities if, as a result of the transfer, either any person would become the owner of 4.99% or more of our stock as determined under Section 382 of the Code ("5% stockholder") or the percentage stock ownership of any 5% stockholder would be increased. The Transfer Restrictions are subject to exceptions set forth in our certificate of incorporation and will expire in accordance with their terms on May 26, 2019. Any transfer that violates the Transfer Restrictions is void and will be unwound as provided in our certificate of incorporation.
We could engage in or approve transactions involving our common shares that adversely affect significant stockholders.
Under the Transfer Restrictions in our certificate of incorporation, prior to May 26, 2019, our 5% stockholders are, in effect, required, and under the Tax Asset Rights Plan, prior to April 7, 2019, encouraged, to seek the approval of, or a determination by, our Board of Directors before they engage in certain transactions involving our common stock. We could engage in or approve transactions involving our common stock that limit our ability to approve future transactions involving our common stock by our 5% stockholders without impairing the use of our federal income tax attributes. In addition, we could engage in or approve transactions involving our common stock that cause stockholders owning less than 5% to become 5% stockholders, resulting in those stockholders' having to seek the approval of, or a determination by, our Board of Directors before they could engage in certain future transactions involving our common stock. For example, share repurchases reduce the number of our common shares outstanding and could cause a stockholder holding less than 4.99% of our stock as determined under Section 382 of the Code to become a 5% stockholder even though it has not acquired any additional shares.
17
The ownership of our stock is concentrated, with a few owners who, individually or collectively, could exert significant influence over us.
Certain investment funds, advisers and organizations each own greater than 5% of our outstanding common stock as of December 31, 2017. As a result, any of them could have significant influence over matters requiring stockholder approval, including the composition of our Board of Directors. Further, to the extent that the substantial stockholders were to act in concert, they could potentially control any action taken by our stockholders. This concentration of ownership could also facilitate or hinder proxy contests, tender offers, open market purchase programs, mergers or other purchases of our common stock that might otherwise give stockholders the opportunity to realize a premium over the then prevailing market price of our common stock or cause the market price of our common stock to decline. We cannot make assurances that the interests of our major stockholders will not conflict with our interests or the interests of our other investors.
Payment of dividends may not continue in the future and our payment of dividends and stock repurchases are subject to restrictions.
Our Board of Directors has declared a cash dividend for each quarter since the summer of 2007. In addition, our Board of Directors has authorized a stock repurchase program. The future declaration and payment of dividends and the purchase of our shares under the repurchase program, if any, are at the discretion of the Board of Directors and will depend on a number of factors, including our financial and operating results, financial position and anticipated cash requirements. Additionally, our revolving credit facility and the indenture for our 5.875% Senior Notes impose limitations on our ability to pay dividends and repurchase our common shares. We can give no assurance that dividends will be declared and paid, that dividends will not be reduced or that purchases of our shares pursuant to our repurchase program will occur in the future.
Delaware law and our governing documents may impede or discourage a takeover, which could adversely affect the value of our common stock.
Provisions of Delaware law and our certificate of incorporation and bylaws may discourage a change of control of our company or deter tender offers for our common stock. We are currently subject to anti-takeover provisions under Delaware law. These anti-takeover provisions impose various impediments to the ability of a third party to acquire control of us. Additionally, provisions of our certificate of incorporation and bylaws impose various procedural and other requirements, which could make it more difficult for stockholders to effect certain corporate actions. For example, our certificate of incorporation authorizes our Board of Directors to determine the rights, preferences and privileges and restrictions of unissued shares of preferred stock without any vote or action by our stockholders. As a result, our Board of Directors can authorize and issue shares of preferred stock with voting or conversion rights that could adversely affect the voting or other rights of holders of common stock. Our certificate of incorporation also divides our Board of Directors into three classes of directors who serve for staggered terms. A significant effect of a classified Board of Directors may be to deter hostile takeover attempts because an acquirer could experience delays in replacing a majority of directors. Moreover, stockholders are not permitted to call a special meeting.
In addition, while the Transfer Restrictions in our certificate of incorporation and the Tax Asset Rights Plan are designed to reduce the risk that an ownership change could limit our ability to fully utilize our net operating loss carryforwards and other significant tax attributes to offset future taxable income, both could have the effect of delaying or deterring a change of control of our company and may limit the price that investors might be willing to pay for shares of our common stock. The Tax Asset Rights Plan will expire on April 7, 2019, and the Transfer Restrictions will expire on May 26, 2019.
In addition to the risks discussed above, we are subject to a variety of other risks as a publicly traded U.S. manufacturing company.
As a publicly traded U.S. manufacturing company, we are subject to a variety of other risks, each of which could adversely affect our financial position, results of operations or cash flows, or the price of our common stock. These risks include but are not limited to:
• | the effects of global economic uncertainty; |
• | regulations that subject us to additional capital or margin requirements or other restrictions that make it more difficult to hedge risks associated with our business or increase the cost of our hedging activities; |
• | the ability to attract and retain key management and other personnel and develop effective succession plans; |
• | compliance with a wide variety of health and safety laws and regulations and changes to such laws and regulations; |
18
• | disputes, legal proceedings or investigations, whether meritorious or not, with respect to a variety of matters, including matters related to personal injury, employees, taxes, contracts and product liability; |
• | pursuing growth through acquisitions, including the ability to identify acceptable acquisition candidates, finance and consummate acquisitions on favorable terms and successfully integrate acquired assets or businesses; |
• | protection of intellectual property, including patents, trademarks, trade secrets and copyrights, from infringement by others and the potential defense of claims, whether meritorious or not, alleging the unauthorized use of the intellectual property of others; |
• | taxation by multiple jurisdictions and the impact of such taxation on effective tax rate and the amount of taxes paid; |
• | changes in tax laws and regulations; |
• | new or modified legislation related to health care; |
• | compliance with Section 404 of the Sarbanes-Oxley Act of 2002, including the potential impact of compliance failures; and |
• | failure to meet the expectations of investors, including as a result of factors beyond the control of an individual company. |
Item 1B. Unresolved Staff Comments
None.
Item 2. Properties
Information regarding the location, size and ownership of our principal production facilities as of December 31, 2017 is below:
Location | Square footage | Owned or Leased | |||
Chandler, Arizona (Extrusion) | 115,000 | Owned/Leased1 | |||
Chandler, Arizona (Tube) | 93,000 | Owned/Leased1 | |||
Florence, Alabama | 252,000 | Owned | |||
Jackson, Tennessee | 310,000 | Owned | |||
Kalamazoo, Michigan | 465,000 | Leased2 | |||
London, Ontario (Canada) | 311,000 | Owned | |||
Los Angeles, California | 183,000 | Owned | |||
Newark, Ohio | 1,293,000 | Owned | |||
Richland, Washington | 45,000 | Leased3 | |||
Richmond, Virginia (Bellwood) | 449,000 | Owned | |||
Sherman, Texas | 360,000 | Owned | |||
Spokane, Washington (Trentwood) | 2,874,000 | Owned/Leased4 | |||
Total | 6,750,000 | ||||
___________________________________
1. | The Chandler, Arizona (Extrusion) and Chandler, Arizona (Tube) facilities are each subject to a land lease with a lease term that expires in 2023 and 2033, respectively, subject to certain extension rights held by us. The facilities are owned by us and are not subject to any leases. |
2. | The Kalamazoo, Michigan facility is subject to a lease with a 2033 expiration date, subject to certain extension rights held by us. |
3. | The Richland, Washington facility is subject to a lease with a 2021 expiration date. |
4. | Trentwood consists of 2,753,000 square feet, which is owned by us, and 121,000 square feet, which is subject to a lease with a 2020 expiration date and a renewal option subject to certain terms and conditions. |
19
Production facilities and equipment are generally in good condition and suitable for their intended uses. For additional information regarding our production facilities, see the table under Item 1. Business "Business Operations - Fabricated Products Segment - Manufacturing Processes" of this Report.
Our corporate headquarters, located in Foothill Ranch, California, consists of 36,000 square feet at December 31, 2017 and is subject to a lease that expires in 2019.
Item 3. Legal Proceedings
None.
Item 4. Mine Safety Disclosures
Not applicable.
20
PART II
Item 5. Market for Registrant’s Common Equity, Related Stockholder Matters and Issuer Purchases of Equity Securities
Market Information
Our outstanding common stock is traded on the Nasdaq Global Select Market under the ticker symbol "KALU."
The following table sets forth the high and low sales prices of our common stock for each quarterly period for fiscal years 2017 and 2016:
High | Low | |||||||
Fiscal 2017 | ||||||||
First quarter | $ | 86.37 | $ | 74.56 | ||||
Second quarter | $ | 88.97 | $ | 76.73 | ||||
Third quarter | $ | 104.02 | $ | 88.60 | ||||
Fourth quarter | $ | 109.13 | $ | 90.93 | ||||
Fiscal 2016 | ||||||||
First quarter | $ | 85.96 | $ | 70.14 | ||||
Second quarter | $ | 96.06 | $ | 80.75 | ||||
Third quarter | $ | 94.65 | $ | 80.44 | ||||
Fourth quarter | $ | 88.68 | $ | 69.41 | ||||
Holders
As of February 15, 2018, there were approximately 576 holders of record of our common stock.
Dividends
See Note 13 and Note 18 of Notes to Consolidated Financial Statements included in this Report for information regarding dividends paid in 2017, 2016 and 2015, and declared subsequent to December 31, 2017.
We have consistently paid a quarterly cash dividend since the second quarter of 2007 to holders of our common stock, including holders of restricted stock, and have increased the dividend in each year since 2011. Nevertheless, as in the past, the future declaration and payment of dividends, if any, will be at the discretion of our Board of Directors and will depend on a number of factors, including our financial and operating results, financial position and anticipated cash requirements and contractual restrictions under our revolving credit facility, the indenture for our 5.875% Senior Notes or other indebtedness we may incur in the future. We can give no assurance that dividends will be declared and paid in the future. See Note 8 of Notes to Consolidated Financial Statements included in this Report for additional information about restrictions on dividend payments contained in the revolving credit facility and in the indenture for our 5.875% Senior Notes.
We also pay quarterly dividend equivalents to the holders of certain restricted stock units. Holders of performance shares are not paid a quarterly dividend equivalent, but instead are entitled to receive, in connection with the issuance of underlying shares of common stock for performance shares that ultimately vest, a one-time payment equal to the dividends such holder would have received if the number of such shares of common stock so issued had been held of record by such holder from the date of grant of such performance shares through the date of such issuance.
21
Stock Performance Graph
The following graph compares the cumulative total shareholder return on our common stock with: (i) the Russell 2000® index, (ii) the S&P SmallCap 600® index and (iii) the S&P SmallCap 600® Materials index. We are a component of each of these indices. The graph assumes: (i) an initial investment of $100 as of December 31, 2012 and (ii) reinvestment of all dividends. The performance graph is not necessarily indicative of the future performance of our stock price.
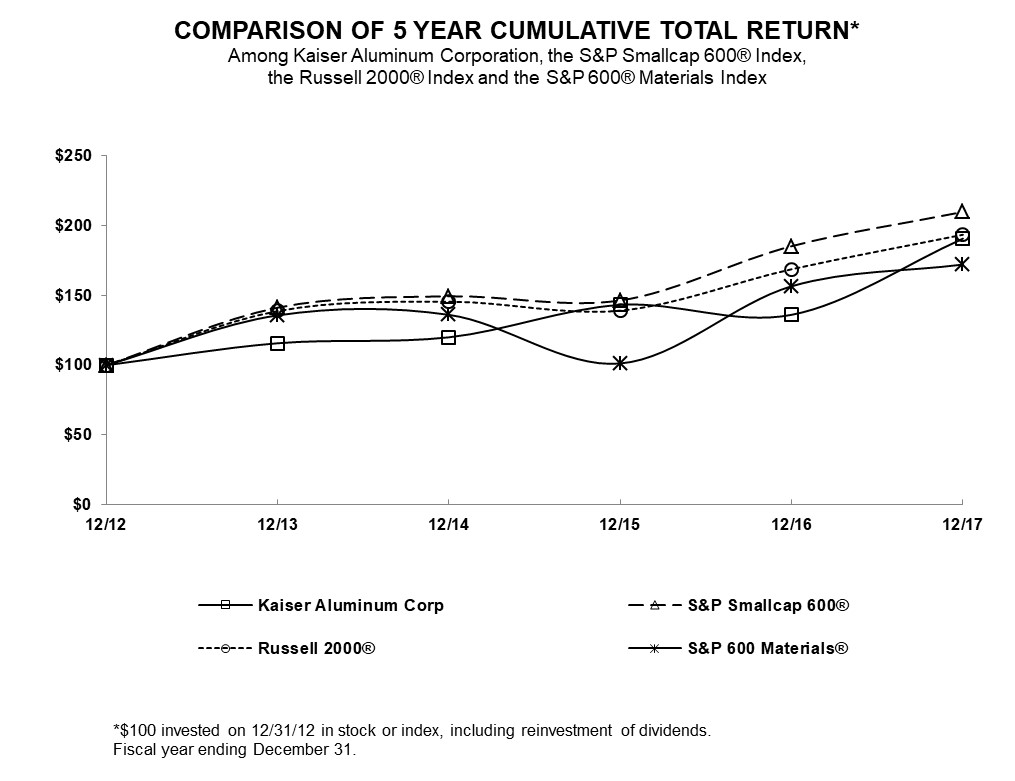
Issuer Repurchases of Equity Securities
The following table provides information regarding our repurchases of our common shares during the quarter ended December 31, 2017:
Amended and Restated 2016 Equity and Performance Incentive Plan | Stock Repurchase Plan | |||||||||||||||||
Total Number of Shares Purchased1 | Average Price per Share | Total Number of Shares Purchased2 | Average Price per Share | Maximum Dollar Value of Shares that May Yet Be Purchased Under the Program (millions)2 | ||||||||||||||
October 1, 2017 - October 31, 2017 | 300 | $ | 99.18 | 15,077 | $ | 99.58 | $ | 121.9 | ||||||||||
November 1, 2017 - November 30, 2017 | — | — | 76,211 | 95.66 | $ | 114.7 | ||||||||||||
December 1, 2017 - December 31, 2017 | — | — | 41,085 | 99.96 | $ | 110.5 | ||||||||||||
Total | 300 | $ | 99.18 | 132,373 | $ | 97.44 | N/A | |||||||||||
22
_________________________________________
1. | Under our equity incentive plans, participants may elect to have us withhold common shares to satisfy minimum statutory tax withholding obligations arising from the recognition of income and the vesting of restricted stock, restricted stock units and performance shares. When we withhold these shares, we are required to remit to the appropriate taxing authorities the market price of the shares withheld by us on the date of withholding. The withholding of common shares by us could be deemed a purchase of such common shares. All such shares withheld by us were canceled on the applicable vesting dates or dates on which income to the employees was recognized, and the number of shares withheld was determined based on the closing price per common share as reported on the Nasdaq Global Select Market on such dates. |
2. | On April 16, 2015, we announced that our Board of Directors authorized us to repurchase an indeterminate number of shares of our common stock at an aggregate market value of up to $100.0 million. On April 17, 2017, we announced that our Board of Directors authorized us to repurchase an indeterminate number of shares of our common stock at an aggregate market value of up to $100.0 million. The April 2017 authorization was in addition to the share repurchase amount authorized in April 2015. Neither plan has an expiration date. |
Item 6. Selected Financial Data
The following table represents our selected financial data. The table should be read in conjunction with Item 7. "Management’s Discussion and Analysis of Financial Condition and Results of Operations" and Item 8. "Financial Statements and Supplementary Data" of this Report (in millions of dollars, except shipments and per share amounts):
Year Ended December 31, | ||||||||||||||||||||
2017 | 2016 | 2015 | 2014 | 2013 | ||||||||||||||||
Shipments (mm lbs) | 625.7 | 614.3 | 615.4 | 588.8 | 563.7 | |||||||||||||||
Net sales | $ | 1,397.5 | $ | 1,330.6 | $ | 1,391.9 | $ | 1,356.1 | $ | 1,297.5 | ||||||||||
Net income (loss)1 | $ | 45.4 | $ | 91.7 | $ | (236.6 | ) | $ | 71.8 | $ | 104.8 | |||||||||
Net income (loss) per share - Basic | $ | 2.67 | $ | 5.15 | $ | (13.76 | ) | $ | 4.02 | $ | 5.56 | |||||||||
Net income (loss) per share - Diluted | $ | 2.63 | $ | 5.09 | $ | (13.76 | ) | $ | 3.86 | $ | 5.44 | |||||||||
Cash dividends declared per common share | $ | 2.00 | $ | 1.80 | $ | 1.60 | $ | 1.40 | $ | 1.20 | ||||||||||
Capital expenditures | $ | 75.5 | $ | 76.1 | $ | 63.1 | $ | 59.4 | $ | 70.4 | ||||||||||
Depreciation and amortization expense | $ | 39.7 | $ | 36.0 | $ | 32.4 | $ | 31.1 | $ | 28.1 | ||||||||||
_____________________
1. | Net income (loss) for 2017 included goodwill impairment and the impact of the Tax Cuts and Jobs Act (see Note 3 and Note 12, respectively, of Notes to Consolidated Financial Statements included in this Report for further details). Net income (loss) for 2015 included the impact of removing the net assets of the voluntary employees' beneficiary association that provides benefits for eligible retirees represented by certain unions and their surviving spouses and eligible dependents ("Union VEBA") and related deferred tax liabilities from our Consolidated Balance Sheets. See Note 4 of Notes to Consolidated Financial Statements included in this Report for further details. |
December 31, | ||||||||||||||||||||
2017 | 2016 | 2015 | 2014 | 2013 | ||||||||||||||||
Assets: | ||||||||||||||||||||
Fabricated Products | $ | 1,046.8 | $ | 969.4 | $ | 904.7 | $ | 878.9 | $ | 852.5 | ||||||||||
All Other | 338.4 | 474.1 | 342.2 | 860.1 | 911.7 | |||||||||||||||
Total assets1 | $ | 1,385.2 | $ | 1,443.5 | $ | 1,246.9 | $ | 1,739.0 | $ | 1,764.2 | ||||||||||
Cash and short-term investments | $ | 234.8 | $ | 286.2 | $ | 102.5 | $ | 291.7 | $ | 299.0 | ||||||||||
Long-term borrowings (at face value), including amounts due within one year | $ | 375.0 | $ | 375.0 | $ | 197.8 | $ | 400.0 | $ | 400.0 | ||||||||||
23
_____________________
1. | The 2015 Total assets reflected the removal of the Union VEBA net assets from our Consolidated Balance Sheets during the first quarter of 2015. See Note 4 of Notes to Consolidated Financial Statements included in this Report for further details. |
Item 7. Management’s Discussion and Analysis of Financial Condition and Results of Operations
Management’s discussion and analysis of financial condition and results of operations ("MD&A") is designed to provide a reader of our financial statements with a narrative from the perspective of our management on our financial condition, results of operations, liquidity and certain other factors that may affect our future results. Our MD&A is presented in the following sections:
• | Management Review of 2017 and Outlook for the Future; |
• | Results of Operations; |
• | Liquidity and Capital Resources; |
• | Contractual Obligations, Commercial Commitments and Off-Balance Sheet Arrangements; |
• | Critical Accounting Estimates and Policies; and |
• | New Accounting Pronouncements. |
Our MD&A should be read in conjunction with the consolidated financial statements and related notes included in Item 8. "Financial Statements and Supplementary Data" of this Report.
This information contains certain non-GAAP financial measures. A non-GAAP financial measure is defined as a numerical measure of a company’s financial performance that excludes or includes amounts so as to be different than the most directly comparable measure calculated and presented in accordance with generally accepted accounting principles ("GAAP") in the statements of income, balance sheets or statements of cash flows of the company. Pursuant to the requirements of Regulation G, Conditions for Use of Non-GAAP Financial Measures, we have provided a reconciliation of non-GAAP financial measures to the most directly comparable financial measure in the accompanying tables. The non-GAAP financial measures used within this presentation are value added revenue, operating income excluding non-run-rate items and ratios related thereto. These measures are presented because management uses this information to monitor and evaluate financial results and trends and believes this information to also be useful for investors.
In the discussion of operating results below, we refer to certain items as "non-run-rate items." For purposes of such discussion, non-run-rate items are items that, while they may recur from period-to-period: (i) are particularly material to results; (ii) affect costs primarily as a result of external market factors; and (iii) may not recur in future periods if the same level of underlying performance were to occur. Non-run-rate items are part of our business and operating environment but are worthy of being highlighted for the benefit of readers of our financial statements. Our intent is to allow users of the financial statements to consider our results both in light of and separately from items such as unrealized mark-to-market gains or losses on derivatives related to fluctuations in underlying metal and energy prices and currency exchange rates, lower of cost or market inventory write-downs, non-cash impairments, the impact of discount rate changes on workers' compensation liabilities, legacy environmental expenses related to predecessor operations and gains or losses related to our voluntary employee beneficiary associations ("VEBAs"). For a reconciliation of operating income (loss) excluding non-run-rate items to operating income (loss), see "Results of Operations - Segment and Business Unit Information" below.
To allow users of our financial statements to consider the impact of metal cost on our Net sales, we disclose Net sales as well as "value added revenue," which is Net sales less the Hedged Cost of Alloyed Metal. As used in this discussion, "Hedged Cost of Alloyed Metal" is the cost of our metal inputs at the Midwest Transaction Price of aluminum ("Midwest Price") plus the cost of alloying elements and any realized gains and/or losses on settled hedges related to the metal sold in the referenced period. The Midwest Price reflects supply and demand dynamics for primary aluminum in North America. For a reconciliation of value added revenue to Net sales, see "Results of Operations - Segment and Business Unit Information" below.
24
Management Review of 2017 and Outlook for the Future
Review
For the full year 2017, we had strong operating performance and achieved record shipments, despite headwinds from aerospace supply chain destocking, lower-than-anticipated automotive build rates, competitive price pressure and construction-related disruptions at our rolling mill in Spokane, Washington ("Trentwood").
Growth in overall shipments was driven by strong demand for our general engineering and automotive applications that more than offset tempered demand for aerospace applications due to supply chain destocking. Value added revenue declined from the prior year as a result of the leaner mix and the impact of price pressure on higher value added revenue products. Sales margins were compressed on high value added products as competitive price pressure prevented pass through of the increasing contained metal costs. Favorable scrap raw material prices and our initiatives to achieve more efficient raw material utilization partially offset the impact from reduced sales margins.
Despite the inefficiencies at Trentwood resulting from construction-related project work, overall manufacturing cost efficiency continued to improve as strong performance across our manufacturing platform more than offset Trentwood inefficiencies. Considering the extent of construction-related disruption at Trentwood during the year, our 2017 manufacturing efficiency improvement was a significant accomplishment, particularly given the step-change and record level we achieved in 2016.
During the year, we continued to execute on our capital investment program to further enhance quality and efficiency, expand capacity and sustain strong competitive manufacturing capabilities. Our $75.5 million capital spending in 2017 was primarily focused on modernizing the hot line and light gauge heat treat plate equipment at Trentwood. The 2017 project work around the hot line and thin gauge heat treat plate equipment led to significant construction-related downtime, but will also have a very positive impact on quality, cost and capacity in the future. Additional capital investments will be made as we complete the $150.0 million five-year modernization program.
In addition to investments to support further organic growth, during the year we returned $114.5 million of cash to shareholders through quarterly dividends and share repurchases. Consistent with our capital deployment priorities, we have steadily increased our quarterly dividend over the past seven years, increasing it 11% to $0.50 per share in early 2017 and an additional 10% to $0.55 per share in early 2018.
Going forward, we will continue to invest in organic growth and asset integrity initiatives. In addition, we will seek complementary inorganic growth opportunities to create additional value for our shareholders. Furthermore, we will continue to return cash to shareholders through quarterly dividends and disciplined share repurchases.
Outlook
As we look to our aerospace/high strength applications ("Aero/HS products"), we expect improving demand in 2018 and 2019 as supply chain destocking runs its course in 2018 and as airframe manufacturers continue to ramp-up build rates to address the large nine-year order backlog. In addition, the new defense budget strengthens the demand for the F-35 Joint Strike Fighter program and other military applications. We are very well-positioned in the marketplace and, with supply chain destocking moderating as we proceed through the year, we expect mid-single-digit year-over-year growth in our 2018 shipments for these applications. However, we continue to expect higher contained metal costs and competitive price pressure to continue in 2018.
For our automotive extrusion applications ("Automotive Extrusions"), North American build rates are expected to improve 1%-2% year-over-year following the 4% decline in builds in 2017. We expect mid-single digit year-over-year growth in 2018 for our automotive shipments and value added revenue.
We have generated a 6% compound annual growth rate in both our shipments and value added revenue for general engineering applications ("GE products") over the past three years driven by improving, broad-based industrial demand. We are cautiously optimistic about underlying demand for our GE products as we look forward. However, as we have previously discussed, we continue to experience price pressure on our high value-added products from both imports and increasing metal costs.
Overall for the full year 2018, we anticipate mid-single-digit growth in total shipments and value added revenue compared to 2017. Major maintenance costs in 2018 are expected to be similar to 2017. Capital investment over the next three years, from 2018 through 2020, will remain focused on continued improvement in quality and cost efficiency. Total annual spending is expected to be approximately $80.0 million, with sustaining capital reinvestment expected to be equivalent to approximately 75% of our annual depreciation expense.
25
As we proceed through 2018 and look longer-term, we anticipate improving results driven by growing demand for our Aero/HS products, Automotive Extrusions and GE products and continued improvement in underlying manufacturing cost efficiency.
Results of Operations
Fiscal 2017 Summary
• | Our reported operating income for 2017 was $150.7 million, including items that we consider to be non-run-rate, which netted to a charge of $8.4 million. See "Segment and Business Unit Information" below for further discussion of our operating income before non-run-rate items. |
• | We recorded incremental income tax expense of $37.2 million due to tax law changes enacted in December 2017, which, among other things, reduced the federal corporate income tax rate from 35% to 21%. The tax rate reduction required that we reduce the carrying value of our deferred tax assets related to our net operating loss carryforwards and caused the majority of the incremental tax expense. |
• | Our liquidity was approximately $526.7 million as of December 31, 2017, comprised of our cash balances, short-term investments and net borrowing availability under our revolving credit facility (on which there were no outstanding borrowings). |
• | We invested $75.5 million in capital spending for further growth, manufacturing efficiency, quality and operational security. See "Liquidity and Capital Resources - Capital Expenditures and Investments" below. |
• | In 2017, we paid $2.9 million to the Salaried VEBA and $17.1 million to the Union VEBA for our cash contributions with respect to 2016. In 2018, we expect to pay another $2.9 million to the Salaried VEBA with respect to 2017 and $12.8 million to the Union VEBA with respect to the nine months ended September 30, 2017. This $12.8 million payment will be our final cash contribution to the Union VEBA. |
• | We paid a total of approximately $35.0 million, or $2.00 per common share, in cash dividends to stockholders, including holders of restricted stock, and dividend equivalents to holders of certain restricted stock units. |
• | We repurchased 938,680 shares of common stock in 2017 for a total cost of $77.8 million pursuant to a stock repurchase program authorized by our Board of Directors. |
Consolidated Selected Operational and Financial Information
The following data should be read in conjunction with our consolidated financial statements and the notes thereto included in Item 8. "Financial Statements and Supplementary Data" of this Report. See Note 15 of Notes to Consolidated Financial Statements included in this Report for further information regarding segments.
Net Sales. We reported Net sales for 2017 of $1,397.5 million, compared to $1,330.6 million for 2016 and $1,391.9 million for 2015. The increase in Net sales during 2017 compared to 2016 primarily reflected a 2% increase in Fabricated Products segment shipment volume and a 3% increase in average realized sales price per pound. Fabricated Products segment shipment volume increased due primarily to: (i) a 8.1 million pound, or 9%, increase in Automotive Extrusions primarily related to significantly higher bumper shipments and (ii) a 14.8 million pound, or 6%, increase in GE products reflecting the continued solid underlying demand for our general engineering applications, partially offset by a 10.2 million pound, or 4%, decrease in Aero/HS products due to: (i) aerospace supply chain destocking and (ii) temporary plate capacity constraints due to the installation of upgraded equipment and controls at Trentwood. The increase in average realized sales price per pound reflected a 0.12/lb, or 14%, increase in average Hedged Cost of Alloyed Metal prices per pound, partially offset by a 0.06/lb, or 5%, decrease in average value added revenue per pound. The decrease in average value added revenue per pound reflected competitive price pressure on spot sales of Aero/HS and GE products and a leaner value added product mix with less volume of Aero/HS products and more volume of Automotive Extrusions and GE products. See the table in "Segment and Business Unit Information" below for further details.
The decrease in Net sales during 2016 compared to 2015 primarily reflected a 4% decrease in total average realized sales price per pound due to a $0.13/lb, or 13%, decrease in average Hedged Cost of Alloyed Metal prices per pound, partially offset by a $0.04/lb, or 3%, increase in average value added revenue per pound. The increase in average value added revenue per pound reflected benefits of pricing improvements on some Aero/HS products and the benefit from lower contained metal prices on some high value added products. Fabricated Products segment shipment volume declined slightly in 2016 compared to 2015 as lower shipments of other industrial products ("Other products") were largely offset by an increase in shipments of GE
26
products. Additionally, Aero/HS products and Automotive Extrusions declined slightly compared to 2015. See the table in "Segment and Business Unit Information" below for further details.
Cost of Products Sold, Excluding Depreciation and Amortization and Other Items. Cost of products sold, excluding depreciation and amortization and other items for 2017 totaled $1,105.3 million, or 79% of Net sales, compared to $1,019.5 million, or 77% of Net sales, in 2016 and $1,115.4 million, or 80% of Net sales, in 2015. The increase during 2017 compared to 2016 of $85.8 million was comprised of a $93.6 million increase in Hedged Cost of Alloyed Metal, partially offset by a $7.8 million reduction in net manufacturing conversion and other costs. The reduction in net manufacturing conversion and other costs reflected: (i) a $10.9 million favorable impact from efficient raw material usage, primarily due to favorable scrap aluminum pricing and (ii) $1.6 million of lower energy pricing, partially offset by: (i) $3.2 million of higher planned major maintenance expense and (ii) a net $1.5 million manufacturing cost increase as incremental conversion costs associated with higher shipment volume in 2017 were mitigated by favorable manufacturing cost efficiency. Of the $93.6 million increase in Hedged Cost of Alloyed Metal, $83.9 million was due to higher hedged metal prices and $9.7 million was due to higher shipment volume, as discussed in "Net Sales" above. See "Segment and Business Unit Information" below for a further discussion of the comparative results of operations for 2017 and 2016.
The decrease during 2016 compared to 2015 of $95.9 million was comprised of a decrease of $84.4 million related to lower Hedged Cost of Alloyed Metal and a decrease of $11.5 million in net manufacturing conversion and other costs. Virtually all of the $84.4 million decrease in Hedged Cost of Alloyed Metal was due to lower hedged metal prices. The $11.5 million decrease in net manufacturing conversion and other costs reflected: (i) a $14.0 million reduction in controllable manufacturing conversion costs from efficiency improvements; (ii) a $12.6 million reduction in costs resulting from coordinated efforts to increase utilization of recycled scrap aluminum in lieu of more expensive primary aluminum and alloying raw materials; and (iii) a decrease of $2.3 million from lower energy pricing. Offsetting these favorable conversion cost factors were: (i) $7.7 million of incremental costs related to a change in product mix; (ii) a $4.2 million increase in workers' compensation and benefits costs; and (iii) $5.4 million of LIFO and other charges. See "Segment and Business Unit Information" below for a further discussion of the comparative results of operations for 2016 and 2015.
Lower of Cost or Market Inventory Write-Down. See Note 1 of Notes to Consolidated Financial Statements included in this Report for information on our inventory lower of cost or market value adjustments.
Unrealized (Gain) Loss on Derivative Instruments. Unrealized (gain) loss on derivative instruments, which is included in Cost of products sold, is primarily due to changes in underlying commodity prices as well as derivative settlements and are related to our operational hedges. These hedges are intended to mitigate our exposure to changes in prices for certain products sold and consumed by us and, to a lesser extent, to mitigate our exposure to changes in foreign currency exchange rates. Unrealized (gain) loss on derivative instruments was $(19.4) million, $(18.7) million and $3.4 million for 2017, 2016 and 2015, respectively. Unrealized gain in 2017 was comprised of a $20.9 million gain on aluminum hedge positions offset by a $1.4 million loss on natural gas hedge positions and $0.1 million loss on electricity hedge positions. See Note 7 of Notes to Consolidated Financial Statements included in this Report for details on the unrealized (gain) loss on derivative instruments for 2016 and 2015.
Depreciation and Amortization. Depreciation and amortization for 2017 was $39.7 million compared to $36.0 million for 2016 and $32.4 million for 2015. The $3.7 million increase in Depreciation and amortization in 2017 compared to 2016 was due primarily to various construction-in-progress projects being placed in service during 2017 and the second half of 2016 related to capital upgrades at several of our extrusion facilities to support automotive programs that will launch over the next few years and other manufacturing cost efficiency and quality initiatives. Approximately $3.6 million of the increase in Depreciation and amortization expense in 2016 compared to 2015 was due to various construction-in-progress projects being placed in service during 2016 and the second half of 2015 related to capital upgrades at several of our extrusion facilities.
Selling, General, Administrative, Research and Development ("SG&A and R&D"). SG&A and R&D expense totaled $97.5 million in 2017 compared to $105.0 million in 2016. The decrease was due primarily to: (i) a $6.2 million decrease in short-term incentive compensation expense based on performance factors and modifiers; (ii) a $2.0 million decrease in salaries and benefits; and (iii) $0.6 million decrease in professional fees and services, partially offset by an increase of $1.3 million in long-term incentive compensation expense.
SG&A and R&D expense totaled $105.0 million in 2016 compared to $88.1 million in 2015. The increase in 2016 was due primarily to increases of: (i) $9.1 million in our short-term incentive compensation expense; (ii) $2.3 million in our long-term incentive compensation expense; (iii) $1.3 million in professional fees and services; (iv) $1.4 million in management development; and (v) approximately $1.7 million in expenses for workers' compensation, environmental costs and salaries and benefits. The increase in SG&A and R&D was also due to $1.2 million of insurance settlement proceeds we received during 2015.
27
Net Periodic Postretirement Benefit Cost Relating to Salaried VEBA. See Note 4 of Notes to Consolidated Financial Statements included in this Report for additional information regarding the Salaried VEBA.
(Gain) Loss on Removal of Union VEBA Net Assets. See Note 4 of Notes to Consolidated Financial Statements included in this Report for details on the Loss on removal of Union VEBA net assets in 2015 and our estimated liability for the final remaining variable cash contribution to be paid in 2018.
Goodwill Impairment. See Note 3 of Notes to Consolidated Financial Statements included in this Report for further details.
Other Operating Charges, Net. See Note 3 of Notes to Consolidated Financial Statements included in this Report for further details.
Interest Expense. Interest expense represents cash and non-cash interest expense incurred on our revolving credit facility, our 5.875% senior notes due 2024 ("5.875% Senior Notes"), our 8.25% senior notes due 2020 ("8.25% Senior Notes"), which were redeemed on June 1, 2016, and our 4.5% cash convertible senior notes due 2015 ("Convertible Notes"), which were settled on April 1, 2015, net of capitalized interest. Interest expense was $22.2 million, $20.3 million and $24.1 million for 2017, 2016 and 2015, respectively, net of $2.2 million, $2.9 million and $1.8 million of interest expense capitalized as part of construction-in-progress, respectively, for the three periods. Non-cash amortization of the discount on the Convertible Notes accounted for $2.4 million of the total interest expense in 2015.
Other Income (Expense), Net. See Note 11 of Notes to Consolidated Financial Statements included in this Report for details.
Income Tax (Provision) Benefit. The income tax provision for 2017 was $87.6 million, resulting in an effective tax rate of 65.9%. The difference between the effective tax rate and the projected blended statutory tax rate for 2017 was primarily due to the passage of H.R.1, commonly referred to as the Tax Cuts and Jobs Act ("Tax Act"). Incremental income tax expense related to the Tax Act included: (i) $29.0 million (or 21.8% of taxable income) related to the write down of deferred tax assets to reflect the new 21% federal corporate tax rate; (ii) $5.9 million (or 4.5% of taxable income) for transition and withholding tax associated with foreign undistributed earnings, including $2.2 million of foreign withholding tax since our earnings in Canada are no longer permanently reinvested; and (iii) $2.3 million (or 1.7% of taxable income) for certain executive compensation that can no longer be deducted under the Tax Act (see Note 12 of Notes to Consolidated Financial Statements included in this Report for further discussion on the Tax Act).
The income tax provision for 2016 was $55.5 million, resulting in an effective tax rate of 37.7%. There was no material difference between the effective tax rate and the projected blended statutory tax rate for 2016.
The income tax benefit for 2015 was $135.2 million, resulting in an effective tax rate of 36.4%. The difference between the effective tax rate and the projected blended statutory tax rate for 2015 was primarily due to: (i) a decrease in unrecognized tax benefits, including interest and penalties, of $1.8 million (or 0.5% of taxable income); (ii) state tax rate and apportionment changes in various states resulting in an increase of $4.7 million (or 1.3% of taxable income); and (iii) an increase in the valuation allowance for federal and certain state net operating losses of $2.0 million (or 0.5% of taxable income).
As a result of the Tax Act, our long-term effective tax rate is estimated to be in the mid 20% range on a go-forward basis.
Segment and Business Unit Information
Consistent with the manner in which our chief operating decision maker reviews and evaluates our business, we have one operating segment, which we refer to as Fabricated Products, that produces semi-fabricated specialty aluminum products, such as aluminum plate and sheet and extruded and drawn products, for the following end market applications: Aero/HS products, Automotive Extrusions, GE products and Other products.
We also have a business unit, All Other, which provides general and administrative support for our operations. For purposes of segment reporting under United States generally accepted accounting principles ("GAAP"), we treat the Fabricated Products segment as a reportable segment. All Other is not considered a reportable segment.
The following data should be read in conjunction with our consolidated financial statements and the notes thereto included in this Report. See Note 15 of Notes to Consolidated Financial Statements included in this Report for further information regarding segments.
28
Fabricated Products
The table below provides selected operational and financial information for our Fabricated Products segment for each period presented (in millions of dollars):
Year Ended December 31, | ||||||||||||
2017 | 2016 | 2015 | ||||||||||
Segment operating income | $ | 201.3 | $ | 229.6 | $ | 190.8 | ||||||
Impact to segment operating income of non-run-rate items: | ||||||||||||
Adjustments to plant-level LIFO1 | (3.8 | ) | (0.6 | ) | 7.0 | |||||||
Mark-to-market gain (loss) on derivative instruments | 19.4 | 18.7 | (3.4 | ) | ||||||||
Non-cash lower of cost or market inventory write-down2 | — | (4.9 | ) | (2.6 | ) | |||||||
Workers’ compensation benefit (cost) due to discounting | — | 0.3 | (0.2 | ) | ||||||||
Goodwill impairment3 | (18.4 | ) | — | — | ||||||||
Asset impairment charges | (0.8 | ) | (2.8 | ) | (0.1 | ) | ||||||
Environmental expenses4 | (0.3 | ) | (0.1 | ) | (1.7 | ) | ||||||
Total non-run-rate items | (3.9 | ) | 10.6 | (1.0 | ) | |||||||
Segment operating income excluding non-run-rate items | $ | 205.2 | $ | 219.0 | $ | 191.8 | ||||||
_____________________
1. | We manage our Fabricated Products segment business on a monthly LIFO basis at each plant, but report inventory externally on an annual LIFO basis in accordance with GAAP on a consolidated basis. This amount represents the conversion from GAAP LIFO applied on a consolidated basis for the Fabricated Products segment to monthly LIFO applied on a plant-by-plant basis. |
2. | The $4.9 million lower of cost or market inventory write-down in 2016 was due primarily to a decrease in our net realizable value of inventory (less a normal profit margin). The $2.6 million lower of cost or market inventory write-down in 2015 was due primarily to declining metal prices. |
3. | See Note 3 of Notes to Consolidated Financial Statements included in this Report for additional information relating to the impairment of goodwill and one of our customer relationship intangible assets. |
4. | Non-run-rate environmental expenses within Fabricated Products are related to activities that occurred at operating facilities prior to July 6, 2006, while such facilities were occupied by a predecessor. See Note 9 of Notes to Consolidated Financial Statements included in this Report for additional information relating to the environmental expenses. |
As noted above, segment operating income excluding non-run-rate items for 2017 was $13.8 million lower than segment operating income excluding such items for 2016. Lower operating income excluding non-run-rate items reflected: (i) a $20.5 million unfavorable sales impact due primarily to a leaner product mix and compressed sales margins, partially offset by favorable price spreads for scrap raw material purchases; (ii) $3.6 million of higher depreciation and amortization expense; and (iii) $3.2 million of higher planned major maintenance expense, partially offset by: (i) a $4.7 million improvement in net manufacturing conversion and other costs; (ii) a $5.0 million decrease in overhead and other benefits and costs; (iii) a $2.2 million decrease in incentive compensation expense; and (iv) $1.6 million of lower energy pricing.
Segment operating income excluding non-run-rate items for 2016 was $27.2 million higher than segment operating income excluding such items for 2015. The increase primarily reflected: (i) a $15.3 million favorable sales impact; (ii) a $14.0 million improvement in controllable manufacturing conversion costs; (iii) $12.6 million of favorable impact from coordinated efforts by our metal procurement group and manufacturing operations to increase utilization of recycled scrap aluminum in lieu of more expensive primary aluminum and alloying raw materials; and (iv) a $2.3 million benefit from lower energy prices. These favorable impacts were partially offset by: (i) a $5.3 million increase in incentive compensation expense; (ii) a $3.7 million increase in workers' compensation expense; (iii) a $4.6 million increase in overhead and other benefits and costs; and (iv) $3.5 million of higher depreciation expense. The favorable sales impact reflected expanded sales margins due to price improvements on certain Aero/HS products, as well as lower contained metal prices on certain high value added products.
29
The table below provides our Fabricated Products segment shipment and value added revenue information (in millions of dollars, except shipments and value added revenue per pound) by end market applications for each period presented:
Year Ended December 31, | ||||||||||||||||||||||||
2017 | 2016 | 2015 | ||||||||||||||||||||||
Aero/HS Products: | ||||||||||||||||||||||||
Shipments (mmlbs) | 233.0 | 243.2 | 243.5 | |||||||||||||||||||||
$ | $ / lb | $ | $ / lb | $ | $ / lb | |||||||||||||||||||
Net sales | $ | 653.7 | $ | 2.81 | $ | 675.4 | $ | 2.78 | $ | 695.5 | $ | 2.86 | ||||||||||||
Less: Hedged Cost of Alloyed Metal | (223.4 | ) | (0.96 | ) | (208.5 | ) | (0.86 | ) | (246.4 | ) | (1.02 | ) | ||||||||||||
Value added revenue | $ | 430.3 | $ | 1.85 | $ | 466.9 | $ | 1.92 | $ | 449.1 | $ | 1.84 | ||||||||||||
Automotive Extrusions: | ||||||||||||||||||||||||
Shipments (mmlbs) | 101.0 | 92.9 | 93.5 | |||||||||||||||||||||
$ | $ / lb | $ | $ / lb | $ | $ / lb | |||||||||||||||||||
Net sales | $ | 217.3 | $ | 2.15 | $ | 188.8 | $ | 2.03 | $ | 199.2 | $ | 2.13 | ||||||||||||
Less: Hedged Cost of Alloyed Metal | (99.6 | ) | (0.98 | ) | (77.0 | ) | (0.83 | ) | (88.7 | ) | (0.95 | ) | ||||||||||||
Value added revenue | $ | 117.7 | $ | 1.17 | $ | 111.8 | $ | 1.20 | $ | 110.5 | $ | 1.18 | ||||||||||||
GE Products: | ||||||||||||||||||||||||
Shipments (mmlbs) | 264.7 | 249.9 | 231.4 | |||||||||||||||||||||
$ | $ / lb | $ | $ / lb | $ | $ / lb | |||||||||||||||||||
Net sales | $ | 476.2 | $ | 1.80 | $ | 420.1 | $ | 1.68 | $ | 426.1 | $ | 1.84 | ||||||||||||
Less: Hedged Cost of Alloyed Metal | (261.2 | ) | (0.99 | ) | (208.9 | ) | (0.83 | ) | (226.1 | ) | (0.98 | ) | ||||||||||||
Value added revenue | $ | 215.0 | $ | 0.81 | $ | 211.2 | $ | 0.85 | $ | 200.0 | $ | 0.86 | ||||||||||||
Other Products: | ||||||||||||||||||||||||
Shipments (mmlbs) | 27.0 | 28.3 | 47.0 | |||||||||||||||||||||
$ | $ / lb | $ | $ / lb | $ | $ / lb | |||||||||||||||||||
Net sales | $ | 50.3 | $ | 1.86 | $ | 46.3 | $ | 1.64 | $ | 71.1 | $ | 1.51 | ||||||||||||
Less: Hedged Cost of Alloyed Metal | (27.0 | ) | (1.00 | ) | (23.2 | ) | (0.82 | ) | (40.8 | ) | (0.87 | ) | ||||||||||||
Value added revenue | $ | 23.3 | $ | 0.86 | $ | 23.1 | $ | 0.82 | $ | 30.3 | $ | 0.64 | ||||||||||||
Total: | ||||||||||||||||||||||||
Shipments (mmlbs) | 625.7 | 614.3 | 615.4 | |||||||||||||||||||||
$ | $ / lb | $ | $ / lb | $ | $ / lb | |||||||||||||||||||
Net sales | $ | 1,397.5 | $ | 2.23 | $ | 1,330.6 | $ | 2.17 | $ | 1,391.9 | $ | 2.26 | ||||||||||||
Less: Hedged Cost of Alloyed Metal | (611.2 | ) | (0.97 | ) | (517.6 | ) | (0.85 | ) | (602.0 | ) | (0.98 | ) | ||||||||||||
Value added revenue | $ | 786.3 | $ | 1.26 | $ | 813.0 | $ | 1.32 | $ | 789.9 | $ | 1.28 | ||||||||||||
For 2017, Net sales of Fabricated Products increased by $66.9 million to $1,397.5 million, as compared to 2016, primarily reflecting a 3% increase in total average realized sales price per pound and a 2% increase in Fabricated Products segment shipments. See "Consolidated Selected Operational and Financial Information" above for further discussion.
The decrease in Net sales of Fabricated Products during 2016 compared to 2015 was due primarily to a 4% decrease in total average realized sales price per pound and a slight decrease in Fabricated Products segment shipments. See "Consolidated Selected Operational and Financial Information" above for further discussion.
30
All Other
All Other provides support for our operations and incurs general and administrative expenses that are not allocated to the Fabricated Products segment. All Other is not considered a reportable segment. The table below presents the impact of non-run-rate items to operating loss within the All Other business unit for each period presented (in millions of dollars):
Year Ended December 31, | ||||||||||||
2017 | 2016 | 2015 | ||||||||||
Operating loss | $ | (50.6 | ) | $ | (51.8 | ) | $ | (536.7 | ) | |||
Impact to operating loss of non-run-rate items: | ||||||||||||
Net periodic postretirement benefit cost relating to Salaried VEBA1 | (4.5 | ) | (3.4 | ) | (2.4 | ) | ||||||
Gain (loss) on removal of Union VEBA net assets1 | — | 0.1 | (493.4 | ) | ||||||||
Environmental expense adjustments2 | — | — | 0.4 | |||||||||
Total non-run-rate items | (4.5 | ) | (3.3 | ) | (495.4 | ) | ||||||
Operating loss excluding non-run-rate items | $ | (46.1 | ) | $ | (48.5 | ) | $ | (41.3 | ) | |||
_______________________
1. | See Note 4 of Notes to Consolidated Financial Statements included in this Report for additional information relating to the VEBAs. |
2. | Non-run-rate environmental expense adjustments within All Other is related to activities that occurred at non-operating facilities prior to July 6, 2006, while such facilities were occupied by a predecessor. See Note 9 of Notes to Consolidated Financial Statements included in this Report for additional information relating to the environmental expenses. |
All Other operating loss excluding non-run-rate items for 2017 was $2.4 million lower than in 2016 due primarily to a decrease in employee incentive compensation expense.
All Other operating loss excluding non-run-rate items for 2016 was $7.2 million higher than in 2015 due primarily to: (i) an increase of $5.7 million in employee incentive compensation expense and (ii) a combined increase in workers' compensation, environmental costs and salaries and benefits of approximately $1.3 million.
Liquidity and Capital Resources
Summary
The following table summarizes our liquidity at the dates presented (in millions of dollars):
December 31, 2017 | December 31, 2016 | ||||||
Available cash and cash equivalents | $ | 51.1 | $ | 55.2 | |||
Short-term investments | 183.7 | 231.0 | |||||
Net borrowing availability under Revolving Credit Facility after letters of credit | 291.9 | 275.3 | |||||
Total liquidity | $ | 526.7 | $ | 561.5 | |||
Cash equivalents consist primarily of money market accounts and investments which, when purchased, have a maturity of 90 days or less. We place our cash in bank deposits and money market funds with high credit quality financial institutions, which invest primarily in commercial paper and time deposits of prime quality, short-term repurchase agreements and U.S. government agency notes. Short-term investments represent holdings in investment-grade commercial paper with a maturity of greater than 90 days.
In addition to our unrestricted cash and cash equivalents described above, we had restricted cash of $12.9 million at December 31, 2017 that was pledged or held as collateral in connection with workers’ compensation requirements and certain other agreements. From time to time, such restricted funds could be returned to us or we could be required to pledge additional cash (see Note 14 of Notes to Consolidated Financial Statements included in this Report).
31
We and certain of our subsidiaries have a credit agreement with JPMorgan Chase Bank, N.A., as administrative agent, and the other financial institutions party thereto ("Revolving Credit Facility") (see Note 8 of Notes to Consolidated Financial Statements included in this Report). There were no borrowings under our Revolving Credit Facility as of December 31, 2017 or December 31, 2016.
Cash Flows
The following table summarizes our cash flows from operating, investing and financing activities for each period presented (in millions of dollars):
Year Ended December 31, | ||||||||||||
2017 | 2016 | 2015 | ||||||||||
Total cash provided by (used in): | ||||||||||||
Operating activities: | ||||||||||||
Fabricated Products | $ | 221.2 | $ | 235.6 | $ | 227.3 | ||||||
All Other | (79.7 | ) | (70.0 | ) | (67.6 | ) | ||||||
Total cash provided by operating activities | $ | 141.5 | $ | 165.6 | $ | 159.7 | ||||||
Investing activities: | ||||||||||||
Fabricated Products | $ | (74.7 | ) | $ | (75.8 | ) | $ | (62.4 | ) | |||
All Other | 49.2 | (200.6 | ) | 82.8 | ||||||||
Total cash (used in) provided by investing activities | $ | (25.5 | ) | $ | (276.4 | ) | $ | 20.4 | ||||
Financing activities: | ||||||||||||
Fabricated Products | $ | (0.4 | ) | $ | — | $ | — | |||||
All Other | (119.0 | ) | 94.8 | (284.4 | ) | |||||||
Total cash (used in) provided by financing activities | $ | (119.4 | ) | $ | 94.8 | $ | (284.4 | ) | ||||
Operating Activities
Fabricated Products – In 2017, Fabricated Products segment operating activities provided $221.2 million of cash. Cash provided in 2017 was primarily related to: (i) $201.3 million of operating income; (ii) depreciation and amortization of $39.0 million; (iii) non-cash impairment charges of $19.2 million; (iv) an increase in accounts payable of $11.5 million driven predominantly by the timing of metal purchases and increase in metal price; and (v) an increase in other non-cash items of $6.7 million. Cash provided by operating activities was partially offset by: (i) an increase in accounts receivables of $27.9 million due primarily to the timing of sales and increase in metal price; (ii) unrealized gain on derivative instruments of $19.4 million; (iii) an increase in inventory of $6.3 million; and (iv) an increase in prepaid expenses and other current assets of $1.6 million.
In 2016, Fabricated Products segment operating activities provided $235.6 million of cash. Cash provided in 2016 was primarily related to: (i) $229.6 million of operating income; (ii) adjustments for non-cash items and depreciation and amortization of $21.9 million; (iii) a lower of cost or market inventory write-down of $4.9 million; (iv) a decrease in inventory of $13.1 million; and (v) a net increase in other operating assets and liabilities of $10.3 million. Cash provided by operating activities was partially offset by an increase in accounts receivable of $26.7 million due primarily to the timing of sales and increase in metal price.
In 2015, Fabricated Products segment operating activities provided $227.3 million of cash. Cash provided in 2015 was primarily related to: (i) $190.8 million of operating income; (ii) adjustments for non-cash items and depreciation and amortization of $37.5 million; and (iii) a decrease in accounts receivable of $17.0 million, partially offset by: (iv) an increase in inventory of $4.9 million (net of a $2.6 million lower of cost or market charge) due primarily to increased shipment volume; and (v) a decrease in accounts payable of $12.4 million due to the timing of payments and decreasing price of aluminum.
For additional information regarding Fabricated Products operating income excluding non-run-rate items, see "Results of Operations - Segment and Business Unit Information" above.
All Other – Cash outflow from All Other operating activities in 2017 consisted primarily of payments relating to: (i) general and administrative costs of $29.7 million; (ii) an annual variable cash contribution to the VEBAs of $20.0 million with respect to the 2016 year; (iii) our short-term incentive program in the amount of $6.7 million; and (iv) interest on the 5.875% Senior Notes and Revolving Credit Facility of $23.3 million.
32
Cash outflow from All Other operating activities in 2016 consisted primarily of payments relating to: (i) general and administrative costs of $27.4 million; (ii) an annual variable cash contribution to the VEBAs of $19.5 million with respect to the 2015 year; (iii) our short-term incentive program in the amount of $3.6 million; and (iv) interest on the 5.875% and 8.25% Senior Notes and Revolving Credit Facility of $20.6 million.
Cash outflow from All Other operating activities in 2015 consisted primarily of payments relating to: (i) general and administrative costs of $25.9 million; (ii) an annual variable cash contribution to the VEBAs of $13.7 million with respect to the 2014 year; (iii) our short-term incentive program in the amount of $3.4 million; (iv) interest on the Convertible Notes, 8.25% Senior Notes and Revolving Credit Facility of $22.1 million; and (v) a loss of $2.5 million on the repurchase of our 8.25% Senior Notes.
Investing Activities
Fabricated Products – Cash used in investing activities for Fabricated Products was $74.7 million in 2017, compared to $75.8 million of cash used in 2016 and $62.4 million of cash used in 2015. Cash used in 2017 primarily consisted of capital expenditures of $75.2 million, partially offset by net proceeds from the disposal of property, plant and equipment of $0.6 million. Cash used in 2016 and 2015 was substantially related to capital expenditures. See "Capital Expenditures and Investments" below for additional information.
All Other – Cash provided by investing activities during 2017 of $49.2 million primarily consisted of proceeds from the disposition of available for sale securities of $296.9 million, partially offset by purchases of available for sale securities of $247.4 million and capital expenditures of $0.3 million. Cash used in investing activities during 2016 of $200.6 million primarily consisted of $200.1 million net cash outflow in conducting investment activities with respect to our available for sale securities and capital expenditures of $0.5 million. Cash provided by investing activities during 2015 of $82.8 million primarily consisted of proceeds from the disposition of available for sale securities. A portion of the proceeds was used to settle the Convertible Notes on April 1, 2015.
Financing Activities
Fabricated Products – Cash used in financing activities was insignificant during 2017, 2016 or 2015.
All Other – Cash used in financing activities in 2017 was $119.0 million, representing: (i) $79.5 million of cash used to repurchase our common stock under our stock repurchase program; (ii) $35.0 million of cash dividends paid to stockholders, including the holders of restricted stock, and in dividend equivalents to the holders of certain restricted stock units; and (iii) $4.5 million of cash used to repurchase our common stock to satisfy withholding taxes resulting from the vesting of employee restricted stock, restricted stock units and performance shares.
Cash provided by financing activities in 2016 was $94.8 million, representing $375.0 million in proceeds from the issuance of our 5.875% Senior Notes and $1.2 million in proceeds from the exercise of stock options, partially offset by: (i) $206.0 million for the redemption of the 8.25% Senior Notes; (ii) $32.4 million of cash dividends paid to our stockholders, including holders of restricted stock, and dividend equivalents paid to holders of certain restricted stock units and to holders of performance shares granted prior to 2014, with respect to the target number of underlying shares of common stock (constituting approximately one-half of the maximum payout); (iii) $33.3 million of cash used to repurchase our common stock under our stock repurchase program; (iv) $6.8 million of debt issuance costs; and (v) $2.9 million of cash used to repurchase our common stock to satisfy withholding taxes resulting from the vesting of employee restricted stock, restricted stock units and performance shares.
Cash used in financing activities in 2015 was $284.4 million, representing: (i) net cash outlay of $175.0 million to settle the Convertible Notes; (ii) $49.2 million of cash used to repurchase our common stock under our stock repurchase program; (iii) $28.1 million of cash dividends paid to our stockholders, including holders of restricted stock, and dividend equivalents paid to holders of certain restricted stock units and to holders of performance shares granted prior to 2014, with respect to the target number of underlying shares of common stock (constituting approximately one-half of the maximum payout); (iv) a $30.0 million payment related to the repurchase of $27.2 million aggregate principal amount of our 8.25% Senior Notes; (v) $2.8 million of cash used to repurchase our common stock to satisfy withholding taxes resulting from the vesting of employee restricted stock, restricted stock units and performance shares; and (vi) $0.6 million of cash paid for financing costs related to the renewal of our Revolving Credit Facility. Cash used in financing activities in 2015 was partially offset by $1.3 million of additional tax benefit in connection with the vesting of employee non-vested shares, restricted stock units and performance shares.
33
Sources of Liquidity
We believe our available cash and cash equivalents, short-term investments, borrowing availability under the Revolving Credit Facility and funds generated from operations are our most significant sources of liquidity. While we believe these sources will be sufficient to finance our working capital requirements, planned capital expenditures and investments, debt service obligations and other cash requirements for at least the next twelve months, our ability to fund such cash requirements will depend upon our future operating performance (which will be affected by prevailing economic conditions) and financial, business and other factors, some of which are beyond our control.
The Revolving Credit Facility matures in December 2020 and provides for borrowings up to $300.0 million (subject to borrowing base limitations), of which up to a maximum of $20.0 million may be utilized for letters of credit. The Revolving Credit Facility may, subject to certain conditions and the agreement of lenders thereunder, be increased up to $400.0 million.
The table below summarizes recent availability and usage of our Revolving Credit Facility (in millions of dollars except for borrowing rate):
February 15, 2018 | December 31, 2017 | ||||||
Revolving Credit Facility borrowing commitment | $ | 300.0 | $ | 300.0 | |||
Borrowing base availability | $ | 291.9 | $ | 300.0 | |||
Less: Outstanding borrowings under Revolving Credit Facility | — | — | |||||
Less: Outstanding letters of credit under Revolving Credit Facility | 8.1 | (8.1 | ) | ||||
Net remaining borrowing availability | $ | 300.0 | $ | 291.9 | |||
Borrowing rate (if applicable)1 | 4.75 | % | 4.75 | % | |||
_______________________
1. | Such borrowing rate, if applicable, represents the interest rate for any overnight borrowings under the Revolving Credit Facility. |
We do not believe that covenants contained in the Revolving Credit Facility are reasonably likely to limit our ability to raise additional debt or equity should we choose to do so during the next 12 months, nor do we believe it is likely that during the next 12 months we will trigger the availability threshold that would require measuring and maintaining a fixed charge coverage ratio.
See Note 8 of Notes to Consolidated Financial Statements included in this Report for a description of our Revolving Credit Facility.
Debt
See "Contractual Obligations, Commercial Commitments and Off-Balance Sheet Arrangements - Contractual Obligations and Commercial Commitments" below for mandatory principal and cash interest payments on the outstanding borrowings under the 5.875% Senior Notes. See Note 8 of Notes to Consolidated Financial Statements included in this Report for further details with respect to the 5.875% Senior Notes and the redemption of our 8.25% Senior Notes.
We do not believe that covenants in the indenture governing the 5.875% Senior Notes are reasonably likely to limit our ability to obtain additional debt or equity financing should we choose to do so during the next 12 months.
Capital Expenditures and Investments
We strive to strengthen our competitive position through strategic capital investment. Significant investments over the past decade have positioned us well with increased capacity and expanded manufacturing capabilities while more recent capital projects have focused on further improving product quality and manufacturing cost efficiency, which we believe are critical to maintaining and strengthening our position in an increasingly competitive market environment over the coming decade.
The Trentwood efficiency and modernization initiative is a multi-year, $150.0 million capital investment initiative to upgrade equipment throughout the Trentwood process flow to reduce conversion costs, increase efficiency and further improve our competitive cost position on all of Trentwood's products. To differentiate our product quality, the modernization will also replace legacy equipment and improve the process flow for thin gauge plate to achieve KaiserSelect® quality enhancements for
34
both Aero/HS and GE products. A byproduct of the manufacturing efficiency improvements from upgrades completed during 2017 is incremental manufacturing capacity to enable sales growth in 2018 and beyond. The Trentwood modernization initiative was announced in December 2015 and will span several years. As of December 31, 2017, approximately 40% of the total $150.0 million capital investment remained to be spent.
Total capital expenditures were $75.5 million, $76.1 million and $63.1 million for 2017, 2016 and 2015, respectively. A significant portion of our capital spending during 2017 and 2016 was related to the Trentwood modernization project. Additionally, in all three years, we invested to support our automotive growth initiative, including upgrades to existing extrusion presses at several of our automotive-focused facilities, a new extrusion press at our London, Ontario facility in 2015 and a new extrusion press and related equipment at our Sherman, Texas facility in 2015 and 2016. The remainder of our capital spending in all three years was allocated among our manufacturing locations on projects expected to reduce operating costs, improve quality, increase capacity or enhance operational security.
We anticipate our capital spending in 2018 will be approximately $80.0 million and include continued spending on the Trentwood modernization and spending at multiple locations for efficiency improvements and operational security. Capital investment will be funded using cash generated from operations, available cash and cash equivalents, short-term investments, borrowings under the Revolving Credit Facility and/or other third-party financing arrangements. The level of anticipated capital expenditures may be adjusted from time to time depending on our business plans, our price outlook for fabricated aluminum products, our ability to maintain adequate liquidity and other factors. No assurance can be provided as to the timing of any such expenditures or the operational benefits expected therefrom.
Dividends
See Note 13 and Note 18 of Notes to Consolidated Financial Statements included in this Report for information regarding dividends paid during 2017, 2016 and 2015, and declared subsequent to December 31, 2017. See Item 5 of this Report for disclosure regarding the future declaration and payment of dividends.
Repurchases of Common Stock
See Note 13 of Notes to Consolidated Financial Statements included in this Report for information regarding repurchases of common stock in 2017 and 2016 and the amounts authorized and available for future repurchases of common stock under our stock repurchase program.
See Note 6 of Notes to Consolidated Financial Statements included in this Report for information regarding minimum statutory tax withholding obligations arising during 2017, 2016 and 2015 in connection with the vesting of non-vested shares, restricted stock units and performance shares.
Restrictions Related to Equity Capital
As discussed elsewhere in this Report, to preserve our ability to fully use our net operating loss carryforwards and other significant tax attributes, we have: (i) adopted a tax asset protection rights plan ("Tax Asset Rights Plan"), which is designed to deter transfers of our common stock that could result in an ownership change pursuant to Section 382 of the Internal Revenue Code of 1986 ("Code") and (ii) implemented stock transfer restrictions ("Transfer Restrictions"), which restrict transfers of our stock by any person who owns, or would become an owner of, 4.99% or more of our stock as determined under Section 382 of the Code. The Tax Asset Rights Plan will expire on April 7, 2019, and the Transfer Restrictions will expire on May 26, 2019.
Environmental Commitments and Contingencies
See Note 9 of Notes to Consolidated Financial Statements included in this Report for information regarding our environmental commitments and contingencies.
35
Contractual Obligations, Commercial Commitments and Off-Balance Sheet Arrangements
Contractual Obligations and Commercial Commitments
The following table and discussion provide a summary of our significant contractual obligations and commercial commitments at December 31, 2017 (in millions of dollars):
Payments Due by Period | ||||||||||||||||||||||||||||
Total | 2018 | 2019 | 2020 | 2021 | 2022 | 2023 and Thereafter | ||||||||||||||||||||||
On-Balance Sheet: | ||||||||||||||||||||||||||||
Principal and interest on 5.875% Senior Notes | $ | 518.2 | $ | 22.0 | $ | 22.0 | $ | 22.0 | $ | 22.0 | $ | 22.0 | $ | 408.2 | ||||||||||||||
Standby letters of credit | 8.4 | 7.2 | 1.2 | — | — | — | — | |||||||||||||||||||||
Uncertain tax liabilities | 0.6 | — | — | — | — | — | — | |||||||||||||||||||||
Deferred compensation plan liability | 9.8 | — | — | — | — | — | — | |||||||||||||||||||||
Capital leases | 1.2 | 0.6 | 0.5 | 0.1 | — | — | — | |||||||||||||||||||||
VEBA variable contributions | 15.7 | 15.7 | — | — | — | — | — | |||||||||||||||||||||
Off-Balance Sheet: | ||||||||||||||||||||||||||||
VEBA administrative fees | 0.9 | 0.3 | 0.3 | 0.3 | — | — | — | |||||||||||||||||||||
Purchase obligations | 449.6 | 426.5 | 13.9 | 7.0 | 1.1 | 1.0 | 0.1 | |||||||||||||||||||||
Operating leases | 39.7 | 5.7 | 5.2 | 3.1 | 2.5 | 2.2 | 21.0 | |||||||||||||||||||||
Commitment fees on Revolving Credit Facility | 3.2 | 1.1 | 1.1 | 1.0 | — | — | — | |||||||||||||||||||||
Total contractual obligations | $ | 1,047.3 | $ | 479.1 | $ | 44.2 | $ | 33.5 | $ | 25.6 | $ | 25.2 | $ | 429.3 | ||||||||||||||
Principal and Interest on 5.875% Senior Notes. Cash outlays related to our 5.875% Senior Notes consist of our principal obligations and interest obligations based on scheduled interest payments.
Standby Letters of Credit. Of the $8.4 million of standby letters of credit, $0.3 million are cash collateralized and $8.1 million represents letters of credit issued under our Revolving Credit Facility. The letters of credit provide financial assurance of our payment of obligations, primarily related to workers' compensation and environmental compliance. The specific timing of payments with respect to such matters is uncertain. The letters of credit generally automatically renew every 12 months and terminate when the underlying obligations no longer require assurance or upon the maturity of our Revolving Credit Facility in September 2020 (for those letters of credit issued under that facility).
Uncertain Tax Liabilities. At December 31, 2017, we had uncertain tax positions which ultimately could result in tax payments. As the amount of ultimate tax payments beyond 2018 is contingent on the tax authorities’ assessment, it is not practical to present annual payment information.
Deferred Compensation Plan Liability. The deferred compensation liability amount relates to our deferred compensation plan for certain key employees. As the distribution amount is contingent upon investment performance, vesting and other eligibility requirements, including retirement dates, it is not practical to present annual payment information.
Capital Leases. Capital lease spending represents non-cancelable capital commitments as of December 31, 2017. We expect capital leases to be funded through available cash generated from our operations, cash and cash equivalents, short-term investments, borrowings under our Revolving Credit Facility and/or other third-party financing arrangements.
VEBA Obligations. See Note 4 of Notes to Consolidated Financial Statements included in this Report for additional information regarding our variable cash contributions to the VEBAs.
36
Purchase Obligations. Cash outlays for purchase obligations consist primarily of commitments to purchase aluminum, energy and equipment. We have various contracts with suppliers of aluminum that require us to purchase minimum quantities of aluminum in future years at a price to be determined at the time of purchase based primarily on the underlying metal price at that time. Amounts included in the table are based on minimum quantities at the metal price at December 31, 2017. We believe the minimum quantities are lower than our current requirements for aluminum. Actual quantities and actual metal prices at the time of purchase could be different. Physical delivery commitments with energy companies are in place to cover our exposure to fluctuations in electricity and natural gas prices and are based on fixed contractual rates and quantities. Equipment purchase obligations are based on scheduled payments to equipment manufacturers.
Operating Leases. Operating leases represent multi-year obligations for certain manufacturing facilities, warehouses, office space and equipment.
Commitment Fees on Revolving Credit Facility. Future commitment fees on our Revolving Credit Facility are estimated based on the amount of unused credit under the facility at December 31, 2017 and assuming no extension of terms beyond the current maturity date of our Revolving Credit Facility, which is in December 2020. No borrowings were outstanding under our Revolving Credit Facility either throughout the year or as of December 31, 2017.
Other Off-Balance Sheet Arrangements
In addition to our off-balance sheet items discussed in the contractual obligations and commercial commitments section above:
• | See Note 5 of Notes to Consolidated Financial Statements included in this Report for information regarding our participation in multi-employer pension plans. |
• | See Note 6 of Notes to Consolidated Financial Statements included in this Report for information regarding our long-term employee incentive plans. Additional equity awards are expected to be made to employees and non-employee directors in 2018 and future years. |
Critical Accounting Estimates and Policies
Our consolidated financial statements are prepared in accordance with GAAP. In connection with the preparation of our financial statements, we are required to make assumptions and estimates about future events and apply judgments that affect the reported amounts of assets, liabilities, revenue and expenses and the related disclosures. We base our assumptions, estimates and judgments on historical experience, current trends and other factors that management believes to be relevant at the time our consolidated financial statements are prepared. On a regular basis, management reviews the accounting policies, assumptions, estimates and judgments to ensure that our financial statements are presented fairly and in accordance with GAAP. However, because future events and their effects cannot be determined with certainty, actual results could differ from our assumptions and estimates and such differences could be material.
In addition to the accounting estimates we discuss in Note 1 of Notes to Consolidated Financial Statements included in this Report, management believes that the following accounting estimates are critical to aid in fully understanding and evaluating our reported financial results and require management’s most difficult, subjective or complex judgments, resulting from the need to make estimates about the effects of matters that are inherently uncertain. Management has reviewed these critical accounting estimates and related disclosures with the Audit Committee of our Board of Directors.
37
Description | Judgments and Uncertainties | Potential Effect If Actual Results Differ From Assumptions | ||
Self-insured workers' compensation liabilities. | ||||
We are primarily self-insured for workers' compensation benefits provided to employees. Workers' compensation liabilities are estimated for incurred-but-not-reported claims based on judgment, using our historical claims data and information and analysis provided by actuarial and claim advisors, our insurance carriers and other professionals. We account for accrued liability relating to workers' compensation claims on a discounted basis. | The accounting for our self-insured workers' compensation plan involves estimates and judgments to determine our ultimate liability related to reported claims and incurred-but-not-reported claims. We consider our historical experience, severity factors, actuarial analysis and existing stop loss insurance in estimating our ultimate insurance liability. In addition, since recorded obligations represent the present value of expected payments over the life of the claims, decreases in the discount rate (used to compute the present value of the payments) would cause the estimated obligations to increase. Conversely, an increase in the discount rate would cause the estimated present value of expected payments to decrease. If our workers' compensation claim trends were to differ significantly from our historic claims experience and as the discount rate changes, we would make a corresponding adjustment to our workers' compensation accruals. | The rate used to discount future estimated workers' compensation liabilities is determined based on the U.S. Treasury bond rate with a five-year maturity date which resembles the remaining estimated life of the workers' compensation claims. A change in the discount rate of 1/4 of 1% would impact the workers' compensation liability and operating income by approximately $0.2 million. | ||
38
Description | Judgments and Uncertainties | Potential Effect If Actual Results Differ From Assumptions | ||
Income Tax. | ||||
We have substantial tax attributes available to offset the impact of future income taxes. We have a process for determining the need for a valuation allowance with respect to these attributes. The process includes an extensive review of both positive and negative evidence including our earnings history, future earnings, adverse recent occurrences, carryforward periods, an assessment of the industry and the impact of the timing differences. We expect to record a full statutory tax provision in future periods and, therefore, the benefit of any tax attributes realized will only affect future balance sheets and statements of cash flows. In accordance with GAAP, financial statements for interim periods include an income tax provision based on the effective tax rate expected to be incurred in the current year. See Note 12 of Notes to Consolidated Financial Statements included in this Report for discussion around uncertainties and provisional amounts recorded relating to the Tax Act. | Inherent within the completion of our assessment of the need for a valuation allowance, we make significant judgments and estimates with respect to future operating results, timing of the reversal of deferred tax assets and current market and industry factors. In order to determine the effective tax rate to apply to interim periods, estimates and judgments are made (by taxable jurisdiction) as to the amount of taxable income that may be generated, the availability of deductions and credits expected and the availability of net operating loss carryforwards or other tax attributes to offset taxable income. Making such estimates and judgments is subject to inherent uncertainties given the difficulty of predicting future tax rates, market conditions, customer requirements, the cost for key inputs such as energy and primary aluminum, overall operating efficiency and other factors. However, if, among other things: (i) actual results vary from our forecasts due to one or more of the factors cited above or elsewhere in this Report; (ii) income is distributed differently than expected among tax jurisdictions; (iii) one or more material events or transactions occur which were not contemplated; or (iv) certain expected deductions, credits or carryforwards are not available, it is possible that the effective tax rate for a year could vary materially from the assessments used to prepare the interim consolidated financial statements. See Note 12 of Notes to Consolidated Financial Statements included in this Report for additional discussion of these matters. | Although we believe that the judgments and estimates discussed herein are reasonable, actual results could differ and we may be exposed to losses or gains that could be material. A change in our effective tax rate by 1% would have had an impact of approximately $1.3 million to Net income for the year ended December 31, 2017. | ||
39
Description | Judgments and Uncertainties | Potential Effect If Actual Results Differ From Assumptions | ||
Acquisitions, Goodwill and Intangible Assets. | ||||
We account for acquisitions using the acquisition method of accounting, which requires the assets acquired and liabilities assumed to be recorded at the date of acquisition at their respective estimated fair values. We recognize goodwill as of the acquisition date, as a residual over the fair values of the identifiable net assets acquired. Goodwill is tested for impairment on an annual basis as well as on an interim basis as events and changes in circumstances occur. In January 2017, we prospectively adopted Accounting Standards Update ("ASU") No. 2017-04, Intangibles - Goodwill and Other (Topic 350): Simplifying the Test for Goodwill Impairment, which eliminates the second step of the two-step goodwill impairment test that required companies to determine the fair value of individual assets and liabilities of a reporting unit to measure goodwill impairment. Definite-lived intangible assets acquired are amortized over the estimated useful lives of the respective assets, to reflect the pattern in which the economic benefits of the intangible assets are consumed. In the event the pattern cannot be reliably determined, we use a straight-line amortization method. Whenever events or changes in circumstances indicate that the carrying amount of the intangible assets may not be recoverable, the intangible assets will be reviewed for impairment. | The judgments made in determining the estimated fair value assigned to each class of assets acquired and liabilities assumed, as well as asset lives, can significantly impact our results of operations. Fair values and useful lives are determined based on, among other factors, the expected future period of benefit of the asset, the various characteristics of the asset, projected cash flows and the rate used in discounting those cash flows. As the determination of an asset’s fair value and useful life involves management making certain estimates and because these estimates form the basis for the determination of whether or not an impairment charge should be recorded, these estimates are considered to be critical accounting estimates. | We do not believe there is a reasonable likelihood that there will be a material change in the estimates or assumptions we use to estimate the fair value of goodwill and intangible assets. Additionally, as of December 31, 2017, we do not believe any of our reporting units are at risk of failing the goodwill impairment test. However, if actual results are not consistent with our estimates and assumptions used in estimating future cash flows and fair values assigned to each class of assets acquired and liabilities assumed, we may be exposed to losses from impairment charges that could be material. | ||
40
Description | Judgments and Uncertainties | Potential Effect If Actual Results Differ From Assumptions | ||
Salaried VEBA. | ||||
At December 31, 2017, our financial statements include the Salaried VEBA, which we are required to reflect on our financial statements as a defined benefit postretirement plan, despite our limited legal obligations to the Salaried VEBA in regards to that plan. Liabilities and expenses for postretirement benefits are determined using actuarial methodologies and incorporate significant assumptions, including the rate used to discount the future estimated liability, the long-term rate of return ("LTRR") on plan assets and several assumptions relating to the employee workforce (i.e., retirement age and mortality). The most significant assumptions used in determining the estimated year-end obligations include the assumed discount rate and the LTRR. In addition to the above assumptions used in the actuarial valuation, changes in plan provisions could also have a material impact on the net funded status of the Salaried VEBA. Our obligation to the Salaried VEBA is to pay an annual variable contribution amount based on the level of our cash flow. The funding status of the Salaried VEBA has no impact on our annual variable contribution amount. We have no control over any aspect of the plan. We rely on information provided to us by the Salaried VEBA administrator with respect to specific plan provisions such as annual benefits expected to be paid. See Note 4 of Notes to Consolidated Financial Statements included in this Report for additional information on our benefit plans. | Since the recorded obligation represents the present value of expected postretirement benefit payments over the life of the plan, decreases in the discount rate (used to compute the present value of the payments) would cause the estimated obligation to increase. Conversely, an increase in the discount rate would cause the estimated present value of the obligation to decline. The LTRR on plan assets reflects an assumption regarding what the amount of earnings would be on existing plan assets (before considering any future contributions to the plan). Increases in the assumed LTRR would cause the projected value of plan assets available to satisfy postretirement obligations to increase, yielding a reduced net expense of these obligations. A reduction in the LTRR would reduce the amount of projected net assets available to satisfy postretirement obligations and, thus, cause the net expense of these obligations to increase. A change in plan provisions could cause the estimated obligations to change. An increase in annual benefits expected to be paid would increase the estimated present value of the obligations and conversely, a decrease in annual benefits expected to be paid would decrease the estimated present value of the obligations. | The rate used to discount future estimated liabilities is determined taking into consideration the rates available at year-end on debt instruments that could be used to settle the obligations of the plan. In relation to the Salaried VEBA, a change in the discount rate of 1/4 of 1% would impact the accumulated postretirement benefit obligation by approximately $2.2 million, impact service and interest costs by $0.1 million and have an immaterial impact on 2018 expense. The LTRR on plan assets is estimated by considering historical returns and expected returns on current and projected asset allocations. A change in the assumption for LTRR on plan assets of 1/4 of 1% would impact expense by approximately $0.1 million in 2018. | ||
New Accounting Pronouncements
For a discussion of all recently adopted and recently issued but not yet adopted accounting pronouncements, see Note 1 of Notes to Consolidated Financial Statements included in this Report.
Item 7A. Quantitative and Qualitative Disclosures About Market Risk
Our operating results are sensitive to changes in the prices of primary aluminum, certain alloying metals, natural gas and electricity, and also depend to a significant degree upon the volume and mix of all products sold. As discussed more fully in Note 7 of Notes to Consolidated Financial Statements included in this Report, we have historically utilized hedging transactions
41
to lock in a specified price or range of prices for certain products which we sell or consume in our production process, and to mitigate our exposure to changes in energy prices.
Aluminum
See Note 7 of Notes to Consolidated Financial Statements included in this Report for a discussion of our pricing of fabricated aluminum, firm-price arrangements and third-party hedging instruments.
In 2017, 2016 and 2015, settlements of derivative contracts covering 185.6 million pounds, 213.7 million pounds and 204.6 million pounds, respectively, hedged Fabricated Products shipments sold on pricing terms that created metal price risk for us. At December 31, 2017, we had derivative contracts with respect to approximately 114.4 million pounds and 47.6 million pounds to hedge sales to be made in 2018 and 2019, respectively, on pricing terms that create metal price risk for us, and 1.0 million pounds to hedge such sales to be made in each of 2020 and 2021.
Based on the aluminum derivative positions held by us to hedge firm-price customer sales agreements, we estimate that a $0.10 per pound decrease in the London Metal Exchange ("LME") market price of aluminum as of December 31, 2017 and December 31, 2016, with all other variables held constant, would have resulted in an unrealized mark-to-market loss of $16.4 million and $14.8 million, respectively, with corresponding changes to the net fair value of our aluminum derivative positions. Additionally, we estimate that a $0.01 per pound decrease in the Midwest premium for aluminum as of December 31, 2017 and December 31, 2016, with all other variables held constant, would have resulted in an unrealized mark-to-market loss of $1.6 million and $1.5 million, respectively.
Alloying Metals
We are exposed to the risk of fluctuating prices of certain alloying metals, especially copper and zinc, to the extent that changes in their prices do not highly correlate with price changes for aluminum. Copper, zinc and certain other metals are used in our remelt operations to cast rolling ingot and extrusion billet with the proper chemistry for our products. From time to time, we enter into forward contract swaps with third parties to mitigate our risk from fluctuations in the prices of alloying metals, including copper and zinc. As of December 31, 2017, we had forward swap contracts with settlement dates designed to align with the timing of scheduled purchases of zinc and copper ("Alloy Hedges") by our manufacturing facilities. Our Alloy Hedges are designated and qualify as cash flow hedges. See Note 7 of Notes to Consolidated Financial Statements included in this Report for additional information relating to these Alloy Hedges. We estimate that a $0.10 per pound decrease in the LME market price of zinc as of December 31, 2017 and December 31, 2016, with all other variables held constant, would have resulted in an unrealized mark-to market loss of $0.2 million and $0.4 million, respectively. We estimate that a $0.10 per pound decrease in the Commodity Exchange, Inc. market price of copper as of December 31, 2017, with all other variables held constant, would have resulted in an unrealized mark-to market loss of $0.1 million, with corresponding changes to the net fair value of our Alloy Hedges.
Energy
We are exposed to risk of fluctuating prices for natural gas and electricity. We, from time to time, in the ordinary course of business, enter into hedging transactions and/or physical delivery commitments with firm prices with third parties to mitigate our risk from fluctuations in natural gas and electricity prices. See Note 7 of Notes to Consolidated Financial Statements included in this Report for information regarding the volume of our derivative and physical delivery commitments with energy companies in place to cover our exposure to fluctuations in natural gas and electricity prices as of December 31, 2017.
We estimate that a $1.00 per mmbtu decrease in natural gas prices as of December 31, 2017 and December 31, 2016 would have resulted in an unrealized mark-to-market loss of $3.6 million and $5.0 million, respectively, with corresponding changes to the net fair value of our natural gas derivative positions. We estimate that a $5.00 per Mwh decrease in electricity prices as of December 31, 2017 would have resulted in an unrealized mark-to-market loss of $0.7 million, with corresponding changes to the net fair value of our electricity derivative positions.
Foreign Currency
Our primary foreign exchange exposure is the operating costs of our London, Ontario facility. A 10% change in the Canadian dollar exchange rate is estimated to have an annual operating cost impact of $1.7 million.
42
KAISER ALUMINUM CORPORATION AND SUBSIDIARY COMPANIES
Item 8. Financial Statements and Supplementary Data
Report of Independent Registered Public Accounting Firm | |
Consolidated Balance Sheets | |
Statements of Consolidated Income (Loss) | |
Statements of Consolidated Comprehensive Income (Loss) | |
Statements of Consolidated Stockholders’ Equity | |
Statements of Consolidated Cash Flows | |
Notes to Consolidated Financial Statements | |
43
REPORT OF INDEPENDENT REGISTERED PUBLIC ACCOUNTING FIRM
To the Board of Directors and Stockholders of
Kaiser Aluminum Corporation
Foothill Ranch, California
Opinions on the Consolidated Financial Statements and Internal Control over Financial Reporting
We have audited the accompanying consolidated balance sheets of Kaiser Aluminum Corporation and Subsidiary Companies (the "Company") as of December 31, 2017 and 2016, the related consolidated statements of income (loss), comprehensive income (loss), stockholders' equity, and cash flows for each of the three years in the period ended December 31, 2017, and the related notes (collectively referred to as the "consolidated financial statements"). We also have audited the Company’s internal control over financial reporting as of December 31, 2017, based on criteria established in Internal Control - Integrated Framework (2013) issued by the Committee of Sponsoring Organizations of the Treadway Commission (COSO).
In our opinion, the consolidated financial statements referred to above present fairly, in all material respects, the financial position of the Company as of December 31, 2017 and 2016, and the results of its operations and its cash flows for each of the three years in the period ended December 31, 2017, in conformity with accounting principles generally accepted in the United States of America. Also, in our opinion, the Company maintained, in all material respects, effective internal control over financial reporting as of December 31, 2017, based on criteria established in Internal Control - Integrated Framework (2013) issued by COSO.
Basis for Opinions
The Company’s management is responsible for these consolidated financial statements, for maintaining effective internal control over financial reporting, and for its assessment of the effectiveness of internal control over financial reporting, included in the accompanying Management's Annual Report on Internal Control Over Financial Reporting. Our responsibility is to express an opinion on these consolidated financial statements and an opinion on the Company’s internal control over financial reporting based on our audits. We are a public accounting firm registered with the Public Company Accounting Oversight Board (United States) (PCAOB) and are required to be independent with respect to the Company in accordance with the U.S. federal securities laws and the applicable rules and regulations of the Securities and Exchange Commission and the PCAOB.
We conducted our audits in accordance with the standards of the PCAOB. Those standards require that we plan and perform the audits to obtain reasonable assurance about whether the consolidated financial statements are free of material misstatement, whether due to error or fraud, and whether effective internal control over financial reporting was maintained in all material respects.
Our audits of the consolidated financial statements included performing procedures to assess the risks of material misstatement of the consolidated financial statements, whether due to error or fraud, and performing procedures to respond to those risks. Such procedures included examining, on a test basis, evidence regarding the amounts and disclosures in the consolidated financial statements. Our audits also included evaluating the accounting principles used and significant estimates made by management, as well as evaluating the overall presentation of the consolidated financial statements. Our audit of internal control over financial reporting included obtaining an understanding of internal control over financial reporting, assessing the risk that a material weakness exists, and testing and evaluating the design and operating effectiveness of internal control based on the assessed risk. Our audits also included performing such other procedures as we considered necessary in the circumstances. We believe that our audits provide a reasonable basis for our opinions.
Definition and Limitations of Internal Control over Financial Reporting
A company’s internal control over financial reporting is a process designed to provide reasonable assurance regarding the reliability of financial reporting and the preparation of consolidated financial statements for external purposes in accordance with generally accepted accounting principles. A company’s internal control over financial reporting includes those policies and procedures that (1) pertain to the maintenance of records that, in reasonable detail, accurately and fairly reflect the transactions and dispositions of the assets of the company; (2) provide reasonable assurance that transactions are recorded as necessary to permit preparation of consolidated financial statements in accordance with generally accepted accounting principles, and that receipts and expenditures of the company are being made only in accordance with authorizations of management and directors
44
REPORT OF INDEPENDENT REGISTERED PUBLIC ACCOUNTING FIRM (CONTINUED)
of the company; and (3) provide reasonable assurance regarding prevention or timely detection of unauthorized acquisition, use, or disposition of the company’s assets that could have a material effect on the consolidated financial statements.
Because of its inherent limitations, internal control over financial reporting may not prevent or detect misstatements. Also, projections of any evaluation of effectiveness to future periods are subject to the risk that controls may become inadequate because of changes in conditions, or that the degree of compliance with the policies or procedures may deteriorate.
/s/ DELOITTE & TOUCHE LLP
Costa Mesa, California
February 22, 2018
We have served as the Company's auditor since 2002.
45
KAISER ALUMINUM CORPORATION AND SUBSIDIARY COMPANIES
CONSOLIDATED BALANCE SHEETS
December 31, 2017 | December 31, 2016 | |||||||
(In millions of dollars, except share and per share amounts) | ||||||||
ASSETS | ||||||||
Current assets: | ||||||||
Cash and cash equivalents | $ | 51.1 | $ | 55.2 | ||||
Short-term investments | 183.7 | 231.0 | ||||||
Receivables: | ||||||||
Trade receivables, net | 165.0 | 137.7 | ||||||
Other | 15.5 | 11.9 | ||||||
Inventories | 207.9 | 201.6 | ||||||
Prepaid expenses and other current assets | 33.4 | 18.5 | ||||||
Total current assets | 656.6 | 655.9 | ||||||
Property, plant and equipment, net | 571.4 | 530.9 | ||||||
Deferred tax assets, net | 72.0 | 159.7 | ||||||
Intangible assets, net | 25.0 | 26.4 | ||||||
Goodwill | 18.8 | 37.2 | ||||||
Other assets | 41.4 | 33.4 | ||||||
Total | $ | 1,385.2 | $ | 1,443.5 | ||||
LIABILITIES AND STOCKHOLDERS’ EQUITY | ||||||||
Current liabilities: | ||||||||
Accounts payable | $ | 90.0 | $ | 75.8 | ||||
Accrued salaries, wages and related expenses | 42.6 | 49.1 | ||||||
Other accrued liabilities | 40.5 | 40.1 | ||||||
Total current liabilities | 173.1 | 165.0 | ||||||
Net liabilities of Salaried VEBA | 31.9 | 28.6 | ||||||
Deferred tax liabilities | 4.3 | 3.3 | ||||||
Long-term liabilities | 60.0 | 73.2 | ||||||
Long-term debt | 369.6 | 368.7 | ||||||
Total liabilities | 638.9 | 638.8 | ||||||
Commitments and contingencies – Note 9 | ||||||||
Stockholders’ equity: | ||||||||
Preferred stock, 5,000,000 shares authorized at both December 31, 2017 and December 31, 2016; no shares were issued and outstanding at December 31, 2017 and December 31, 2016 | — | — | ||||||
Common stock, par value $0.01, 90,000,000 shares authorized at both December 31, 2017 and December 31, 2016; 22,393,537 shares issued and 16,773,586 shares outstanding at December 31, 2017; 22,332,732 shares issued and 17,651,461 shares outstanding at December 31, 2016 | 0.2 | 0.2 | ||||||
Additional paid in capital | 1,055.9 | 1,047.4 | ||||||
Retained earnings | 85.5 | 75.2 | ||||||
Treasury stock, at cost, 5,619,951 shares at December 31, 2017 and 4,681,271 shares at December 31, 2016 | (358.6 | ) | (281.4 | ) | ||||
Accumulated other comprehensive loss | (36.7 | ) | (36.7 | ) | ||||
Total stockholders’ equity | 746.3 | 804.7 | ||||||
Total | $ | 1,385.2 | $ | 1,443.5 | ||||
The accompanying notes to consolidated financial statements are an integral part of these statements.
46
KAISER ALUMINUM CORPORATION AND SUBSIDIARY COMPANIES
STATEMENTS OF CONSOLIDATED INCOME (LOSS)
Year Ended December 31, | ||||||||||||
2017 | 2016 | 2015 | ||||||||||
(In millions of dollars, except share and per share amounts) | ||||||||||||
Net sales | $ | 1,397.5 | $ | 1,330.6 | $ | 1,391.9 | ||||||
Costs and expenses: | ||||||||||||
Cost of products sold: | ||||||||||||
Cost of products sold, excluding depreciation and amortization and other items | 1,105.3 | 1,019.5 | 1,115.4 | |||||||||
Lower of cost or market inventory write-down | — | 4.9 | 2.6 | |||||||||
Unrealized (gain) loss on derivative instruments | (19.4 | ) | (18.7 | ) | 3.4 | |||||||
Depreciation and amortization | 39.7 | 36.0 | 32.4 | |||||||||
Selling, general, administrative, research and development: | ||||||||||||
Selling, general, administrative, research and development | 97.5 | 105.0 | 88.1 | |||||||||
Net periodic postretirement benefit cost relating to Salaried VEBA | 4.5 | 3.4 | 2.4 | |||||||||
(Gain) loss on removal of Union VEBA net assets – Note 4 | — | (0.1 | ) | 493.4 | ||||||||
Total selling, general, administrative, research and development | 102.0 | 108.3 | 583.9 | |||||||||
Goodwill impairment | 18.4 | — | — | |||||||||
Other operating charges, net | 0.8 | 2.8 | 0.1 | |||||||||
Total costs and expenses | 1,246.8 | 1,152.8 | 1,737.8 | |||||||||
Operating income (loss) | 150.7 | 177.8 | (345.9 | ) | ||||||||
Other (expense) income: | ||||||||||||
Interest expense | (22.2 | ) | (20.3 | ) | (24.1 | ) | ||||||
Other income (expense), net – Note 11 | 4.5 | (10.3 | ) | (1.8 | ) | |||||||
Income (loss) before income taxes | 133.0 | 147.2 | (371.8 | ) | ||||||||
Income tax (provision) benefit | (87.6 | ) | (55.5 | ) | 135.2 | |||||||
Net income (loss) | $ | 45.4 | $ | 91.7 | $ | (236.6 | ) | |||||
Net income (loss) per common share: | ||||||||||||
Basic | $ | 2.67 | $ | 5.15 | $ | (13.76 | ) | |||||
Diluted | $ | 2.63 | $ | 5.09 | $ | (13.76 | ) | |||||
Weighted-average number of common shares outstanding (in thousands): | ||||||||||||
Basic | 16,996 | 17,813 | 17,201 | |||||||||
Diluted | 17,259 | 18,033 | 17,201 | |||||||||
Dividends declared per common share | $ | 2.00 | $ | 1.80 | $ | 1.60 | ||||||
The accompanying notes to consolidated financial statements are an integral part of these statements.
47
KAISER ALUMINUM CORPORATION AND SUBSIDIARY COMPANIES
STATEMENTS OF CONSOLIDATED COMPREHENSIVE INCOME (LOSS)
Year Ended December 31, | ||||||||||||
2017 | 2016 | 2015 | ||||||||||
(In millions of dollars) | ||||||||||||
Net income (loss) | $ | 45.4 | $ | 91.7 | $ | (236.6 | ) | |||||
Other comprehensive (loss) income, net of tax – Note 10: | ||||||||||||
Defined benefit pension plan and VEBAs | (1.4 | ) | (5.8 | ) | 65.1 | |||||||
Available for sale securities | 0.5 | 0.9 | (0.3 | ) | ||||||||
Other | 0.9 | (0.1 | ) | (0.4 | ) | |||||||
Other comprehensive (loss) income, net of tax | — | (5.0 | ) | 64.4 | ||||||||
Comprehensive income (loss) | $ | 45.4 | $ | 86.7 | $ | (172.2 | ) | |||||
The accompanying notes to consolidated financial statements are an integral part of these statements.
48
KAISER ALUMINUM CORPORATION AND SUBSIDIARY COMPANIES
STATEMENTS OF CONSOLIDATED STOCKHOLDERS’ EQUITY
Common Shares Outstanding | Common Stock | Additional Paid In Capital | Retained Earnings | Treasury Stock | Accumulated Other Comprehensive (Loss) Income | Total | |||||||||||||||||||||
(In millions of dollars, except share and per share amounts) | |||||||||||||||||||||||||||
BALANCE, December 31, 2014 | 17,607,251 | $ | 0.2 | $ | 1,028.5 | $ | 280.4 | $ | (197.1 | ) | $ | (96.1 | ) | $ | 1,015.9 | ||||||||||||
Net loss | — | — | — | (236.6 | ) | — | — | (236.6 | ) | ||||||||||||||||||
Other comprehensive income, net of tax | — | — | — | — | — | 64.4 | 64.4 | ||||||||||||||||||||
Issuance of non-vested shares to employees and non-employee directors | 62,285 | — | — | — | — | — | — | ||||||||||||||||||||
Issuance of common shares to non-employee directors | 2,436 | — | 0.2 | — | — | — | 0.2 | ||||||||||||||||||||
Issuance of common shares to employees upon vesting of restricted stock units and performance shares | 52,106 | — | — | — | — | — | — | ||||||||||||||||||||
Cancellation of employee non-vested shares | (987 | ) | — | — | — | — | — | — | |||||||||||||||||||
Cancellation of shares to cover employees’ tax withholdings upon vesting of non-vested shares | (37,009 | ) | — | (2.8 | ) | — | — | — | (2.8 | ) | |||||||||||||||||
Repurchase of common stock | (647,520 | ) | — | — | — | (49.4 | ) | — | (49.4 | ) | |||||||||||||||||
Issuance of stock related to warrants | 1,015,185 | — | — | — | — | — | — | ||||||||||||||||||||
Cash dividends on common stock and restricted shares and dividend equivalents on restricted stock units and performance shares | — | — | — | (28.1 | ) | — | — | (28.1 | ) | ||||||||||||||||||
Excess tax benefit upon vesting of non-vested shares and dividend payment on unvested shares expected to vest | — | — | 1.3 | — | — | — | 1.3 | ||||||||||||||||||||
Amortization of unearned equity compensation | — | — | 9.3 | — | — | — | 9.3 | ||||||||||||||||||||
Dividends on unvested equity awards that were canceled | — | — | — | 0.2 | — | — | 0.2 | ||||||||||||||||||||
BALANCE, December 31, 2015 | 18,053,747 | $ | 0.2 | $ | 1,036.5 | $ | 15.9 | $ | (246.5 | ) | $ | (31.7 | ) | $ | 774.4 | ||||||||||||
Cumulative-effect adjustment | — | — | 0.8 | (0.1 | ) | — | — | 0.7 | |||||||||||||||||||
BALANCE, January 1, 2016 | 18,053,747 | $ | 0.2 | $ | 1,037.3 | $ | 15.8 | $ | (246.5 | ) | $ | (31.7 | ) | $ | 775.1 | ||||||||||||
Net income | — | $ | — | $ | — | $ | 91.7 | $ | — | $ | — | $ | 91.7 | ||||||||||||||
Other comprehensive loss, net of tax | — | — | — | — | — | (5.0 | ) | (5.0 | ) | ||||||||||||||||||
Issuance of non-vested shares to employees and non-employee directors | 9,702 | — | — | — | — | — | — | ||||||||||||||||||||
Issuance of common shares to non-employee directors | 1,474 | — | 0.1 | — | — | — | 0.1 | ||||||||||||||||||||
Issuance of common shares to employees upon option exercises and vesting of restricted stock units and performance shares | 66,810 | — | 1.2 | — | — | — | 1.2 | ||||||||||||||||||||
Cancellation of employee non-vested shares | (379 | ) | — | — | — | — | — | — | |||||||||||||||||||
Cancellation of shares to cover employees’ tax withholdings upon vesting of non-vested shares | (36,055 | ) | — | (2.9 | ) | — | — | — | (2.9 | ) | |||||||||||||||||
Repurchase of common stock | (443,838 | ) | — | — | — | (34.9 | ) | — | (34.9 | ) | |||||||||||||||||
Cash dividends on common stock and restricted shares and dividend equivalents on restricted stock units and performance shares | — | — | — | (32.4 | ) | — | — | (32.4 | ) | ||||||||||||||||||
Amortization of unearned equity compensation | — | — | 11.7 | — | — | — | 11.7 | ||||||||||||||||||||
Dividends on unvested equity awards that were canceled | — | — | — | 0.1 | — | — | 0.1 | ||||||||||||||||||||
BALANCE, December 31, 2016 | 17,651,461 | $ | 0.2 | $ | 1,047.4 | $ | 75.2 | $ | (281.4 | ) | $ | (36.7 | ) | $ | 804.7 | ||||||||||||
Net income | — | $ | — | $ | — | $ | 45.4 | $ | — | $ | — | $ | 45.4 | ||||||||||||||
Issuance of non-vested shares to non-employee directors | 11,817 | — | — | — | — | — | — | ||||||||||||||||||||
Issuance of common shares to non-employee directors | 2,282 | — | 0.2 | — | — | — | 0.2 | ||||||||||||||||||||
Issuance of common shares to employees upon vesting of restricted stock units and performance shares | 103,652 | — | — | — | — | — | — | ||||||||||||||||||||
Cancellation of employee non-vested shares | (451 | ) | — | — | — | — | — | — | |||||||||||||||||||
Cancellation of shares to cover employees’ tax withholdings upon vesting of non-vested shares | (56,495 | ) | — | (4.5 | ) | — | — | — | (4.5 | ) | |||||||||||||||||
Tax effect of cumulative-effect adjustment related to prior year adoption of ASU 2016-09 | — | — | — | 0.3 | — | — | 0.3 | ||||||||||||||||||||
Repurchase of common stock | (938,680 | ) | — | — | — | (77.8 | ) | — | (77.8 | ) | |||||||||||||||||
Cancellation of treasury stock | — | — | (0.2 | ) | (0.4 | ) | 0.6 | — | — | ||||||||||||||||||
Cash dividends on common stock and restricted shares and dividend equivalents on restricted stock units | — | — | — | (35.0 | ) | — | — | (35.0 | ) | ||||||||||||||||||
Amortization of unearned equity compensation | — | — | 13.0 | — | — | — | 13.0 | ||||||||||||||||||||
BALANCE, December 31, 2017 | 16,773,586 | $ | 0.2 | $ | 1,055.9 | $ | 85.5 | $ | (358.6 | ) | $ | (36.7 | ) | $ | 746.3 | ||||||||||||
The accompanying notes to consolidated financial statements are an integral part of these statements.
49
KAISER ALUMINUM CORPORATION AND SUBSIDIARY COMPANIES
STATEMENTS OF CONSOLIDATED CASH FLOWS
Year Ended December 31, | ||||||||||||
2017 | 2016 | 2015 | ||||||||||
(In millions of dollars) | ||||||||||||
Cash flows from operating activities: | ||||||||||||
Net income (loss) | $ | 45.4 | $ | 91.7 | $ | (236.6 | ) | |||||
Adjustments to reconcile net income (loss) to net cash provided by operating activities: | ||||||||||||
Depreciation of property, plant and equipment | 38.3 | 34.5 | 30.8 | |||||||||
Amortization of definite-lived intangible assets | 1.4 | 1.5 | 1.6 | |||||||||
Amortization of debt discount and debt issuance costs | 1.2 | 1.1 | 4.3 | |||||||||
Deferred income taxes | 89.0 | 57.4 | (131.7 | ) | ||||||||
Excess tax benefit upon vesting of non-vested shares and dividend payment on unvested shares expected to vest | — | — | (1.3 | ) | ||||||||
Non-cash compensation | 13.3 | 11.8 | 9.5 | |||||||||
Lower of cost or market inventory write-down | — | 4.9 | 2.6 | |||||||||
Non-cash unrealized (gain) loss on derivative instruments | (19.4 | ) | (18.7 | ) | 3.4 | |||||||
Non-cash impairment charges | 19.2 | 2.8 | 0.1 | |||||||||
Loss on extinguishment of debt | — | 11.1 | 2.5 | |||||||||
(Gain) loss on disposition of property, plant and equipment | (0.5 | ) | 0.2 | 0.3 | ||||||||
Gain on disposition of available for sale securities | (2.3 | ) | — | — | ||||||||
Non-cash defined benefit net periodic benefit cost | 4.8 | 3.7 | 2.8 | |||||||||
Non-cash loss on removal of Union VEBA, net | — | — | 446.7 | |||||||||
Other non-cash changes in assets and liabilities | 3.9 | 1.2 | 0.6 | |||||||||
Changes in operating assets and liabilities: | ||||||||||||
Trade and other receivables | (30.9 | ) | (26.8 | ) | 17.4 | |||||||
Inventories, excluding lower of cost or market write-down | (6.3 | ) | 13.1 | (7.5 | ) | |||||||
Prepaid expenses and other current assets | (1.7 | ) | (8.0 | ) | 0.5 | |||||||
Accounts payable | 13.0 | 3.4 | (13.6 | ) | ||||||||
Accrued liabilities | (4.7 | ) | 26.2 | 12.8 | ||||||||
Annual variable cash contributions to VEBAs | (20.0 | ) | (19.5 | ) | (13.7 | ) | ||||||
Long-term assets and liabilities, net | (2.2 | ) | (26.0 | ) | 28.2 | |||||||
Net cash provided by operating activities | 141.5 | 165.6 | 159.7 | |||||||||
Cash flows from investing activities1: | ||||||||||||
Capital expenditures | (75.5 | ) | (76.1 | ) | (63.1 | ) | ||||||
Purchase of available for sale securities | (247.5 | ) | (255.3 | ) | (0.5 | ) | ||||||
Proceeds from disposition of available for sale securities | 296.9 | 55.0 | 84.0 | |||||||||
Proceeds from disposal of property, plant and equipment | 0.6 | — | — | |||||||||
Net cash (used in) provided by investing activities | (25.5 | ) | (276.4 | ) | 20.4 | |||||||
Cash flows from financing activities1: | ||||||||||||
Repayment of principal and redemption premium of 8.25% Senior Notes | — | (206.0 | ) | (30.0 | ) | |||||||
Issuance of 5.875% Senior Notes | — | 375.0 | — | |||||||||
Repayment of Convertible Notes | — | — | (175.0 | ) | ||||||||
Proceeds from cash-settled call options related to settlement of Convertible Notes | — | — | 94.9 | |||||||||
Payment for conversion premium related to settlement of Convertible Notes | — | — | (94.9 | ) | ||||||||
Cash paid for debt issuance costs | — | (6.8 | ) | (0.6 | ) | |||||||
Proceeds from stock option exercises | — | 1.2 | — | |||||||||
Repayment of capital lease | (0.4 | ) | — | — | ||||||||
Excess tax benefit upon vesting of non-vested shares and dividend payment on unvested shares expected to vest | — | — | 1.3 | |||||||||
Cancellation of shares to cover employees' tax withholdings upon vesting of non-vested shares | (4.5 | ) | (2.9 | ) | (2.8 | ) | ||||||
Repurchase of common stock | (79.5 | ) | (33.3 | ) | (49.2 | ) | ||||||
Cash dividends and dividend equivalents paid | (35.0 | ) | (32.4 | ) | (28.1 | ) | ||||||
Net cash (used in) provided by financing activities | (119.4 | ) | 94.8 | (284.4 | ) | |||||||
Net decrease in cash, cash equivalents and restricted cash during the period | (3.4 | ) | (16.0 | ) | (104.3 | ) | ||||||
Cash, cash equivalents and restricted cash at beginning of period | 67.7 | 83.7 | 188.0 | |||||||||
Cash, cash equivalents and restricted cash at end of period | $ | 64.3 | $ | 67.7 | $ | 83.7 | ||||||
_____________
1. | See Note 14 for supplemental disclosure on non-cash transactions. |
The accompanying notes to consolidated financial statements are an integral part of these statements.
50
KAISER ALUMINUM CORPORATION AND SUBSIDIARY COMPANIES
NOTES TO CONSOLIDATED FINANCIAL STATEMENTS
1. Summary of Significant Accounting Policies
In this Annual Report on Form 10-K (this "Report"), unless the context otherwise requires, references in these notes to consolidated financial statements to "Kaiser Aluminum Corporation," "we," "us," "our," "the Company" and "our Company" refer collectively to Kaiser Aluminum Corporation and its subsidiaries.
Organization and Nature of Operations. Kaiser Aluminum Corporation specializes in the production of semi-fabricated specialty aluminum mill products, such as aluminum plate and sheet and extruded and drawn products, for the following end market applications: aerospace and high strength ("Aero/HS products"), automotive applications ("Automotive Extrusions"), general engineering ("GE products") and other industrial ("Other products"). Our business is organized into one operating segment, Fabricated Products. See Note 15 for additional information regarding our reportable segment and business unit.
Principles of Consolidation and Basis of Presentation. The consolidated financial statements include the accounts of our wholly owned subsidiaries and are prepared in accordance with United States generally accepted accounting principles ("GAAP") and the rules and regulations of the Securities and Exchange Commission ("SEC"). Intercompany balances and transactions are eliminated.
Use of Estimates in the Preparation of Financial Statements. The preparation of financial statements in accordance with GAAP requires the use of estimates and assumptions that affect the reported amounts of assets and liabilities, disclosure of contingent assets and liabilities known to exist as of the date the financial statements are published and the reported amounts of revenues and expenses during the reporting period. Uncertainties with respect to such estimates and assumptions are inherent in the preparation of our consolidated financial statements; accordingly, it is possible that the actual results could differ from these estimates and assumptions, which could have a material effect on the reported amounts of our consolidated financial position and results of operations.
Foreign Currency. Certain of our foreign subsidiaries use the local currency as their functional currency; the assets and liabilities of these foreign subsidiaries are translated at exchange rates in effect at the balance sheet date; and our statement of income (loss) is translated at weighted-average monthly rates of exchange prevailing during the year. Resulting translation adjustments are recorded directly to a separate component of stockholders’ equity. Where the U.S. dollar is the functional currency of a foreign facility or subsidiary, re-measurement adjustments are recorded in Other income (expense), net.
Fair Value Measurements. We apply the fair value hierarchy established by GAAP for the recognition and measurement of certain financial assets and liabilities. An asset or liability's fair value classification within the hierarchy is determined based on the lowest level input that is significant to the fair value measurement. In determining fair value, we utilize valuation techniques that maximize the use of observable inputs and minimize the use of unobservable inputs to the extent possible and consider counterparty risk in our assessment of fair value.
The fair values of financial assets and liabilities are evaluated and measured on a recurring basis. As part of that evaluation process, we review the underlying inputs that are significant to the fair value measurement of financial instruments to determine if a transfer among hierarchy levels is appropriate. We historically have not had significant transfers into or out of each hierarchy level.
Financial assets and liabilities that we measure at fair value each period include our derivative instruments and available for sale securities, consisting of debt investment securities and investments related to our deferred compensation plan (see Note 4). Additionally, we measure at fair value once each year at December 31 the plan assets of the Salaried VEBA (defined in Note 4) and our Canadian defined benefit pension plan. We record our remaining financial assets and liabilities at carrying value.
For a majority of our non-financial assets and liabilities, which include goodwill, intangible assets, inventories and property, plant and equipment, we are not required to measure their fair value on a recurring basis. However, if certain triggering events occur (or at least annually for goodwill), an evaluation of the affected non-financial asset or liability will be required, which could result in a reduction to the carrying amount of such asset or liability. Other than the impairment charges discussed below in Property, Plant and Equipment, Net and Goodwill and Intangible Assets, we concluded that none of our other non-financial assets and liabilities subject to fair value assessments on a non-recurring basis required a material adjustment to the carrying amount of such assets and liabilities during the years ended December 31, 2017 and December 31, 2016.
51
KAISER ALUMINUM CORPORATION AND SUBSIDIARY COMPANIES
NOTES TO CONSOLIDATED FINANCIAL STATEMENTS
Cash and Cash Equivalents. We consider only those short-term, highly liquid investments which, when purchased, have maturities of 90 days or less to be cash equivalents. Our cash equivalents consist primarily of funds in commercial paper, money market funds and other highly liquid investments, which are classified within Level 1 of the fair value hierarchy with the exception of commercial paper, which is classified within Level 2 of the fair value hierarchy (see Note 7).
Restricted Cash. We are required to keep on deposit certain amounts that are pledged or held as collateral relating to workers’ compensation and other agreements. We account for such deposits as restricted cash (see Note 14). From time to time, such restricted funds could be returned to us or we could be required to pledge additional cash.
Available for Sale Securities. We account for investments in certain marketable debt securities as available for sale securities. Such securities are recorded at fair value (see Note 7), with net unrealized gains and losses, net of income taxes, reflected in Accumulated other comprehensive income (loss) as a component of Stockholders' equity. Realized gains and losses from the sale of marketable debt securities, if any, are determined on a specific identification basis. Debt investment securities with an original maturity of 90 days or less are classified as Cash and cash equivalents (see Note 2). Debt investment securities with an original maturity of greater than 90 days are presented as Short-term investments on the Consolidated Balance Sheets. In addition to debt investment securities, we also hold assets in various investment funds managed by a third-party trust in connection with our deferred compensation program (see Note 4).
Trade Receivables and Allowance for Doubtful Accounts. Trade receivables primarily consist of amounts billed to customers for products sold. Accounts receivable are generally due within 30 to 90 days. For the majority of our receivables, we establish an allowance for doubtful accounts based upon collection experience and other factors. On certain other receivables where we are aware of a specific customer’s inability or reluctance to pay, an allowance for doubtful accounts is established against amounts due, to reduce the net receivable balance to the amount we reasonably expect to collect. However, if circumstances change, our estimate of the recoverability of accounts receivable could be different. Circumstances that could affect our estimates include, but are not limited to, customer credit issues and general economic conditions. Accounts are written off once deemed to be uncollectible. Any subsequent cash collections relating to accounts that have been previously written off are typically recorded as a reduction to total bad debt expense in the period of payment. Write-offs for 2017, 2016 and 2015 were immaterial to the consolidated financial statements.
Inventories. Inventories are stated at the lower of cost or market value. On March 31, 2016, we recorded a lower of cost or market inventory write-down of $4.9 million, as a result of a decrease in our net realizable value of inventory. The net realizable value reflected commitments as of that date from customers to purchase our inventory at prices that exceeded the Midwest Transaction Price ("Midwest Price"), which reflects the primary aluminum supply/demand dynamics in North America, reduced by an approximate normal profit margin. There were no additional lower of cost or market inventory adjustments since the quarter ended March 31, 2016.
Finished products, work-in-process and raw material inventories are stated on the last-in, first-out ("LIFO") basis. At
December 31, 2017, the current cost of our inventory exceeded its stated LIFO value by $24.3 million. The stated LIFO value of our inventory represented its net realizable value (less a normal profit margin) and exceeded the current cost of our inventory by $8.5 million at December 31, 2016. Other inventories are stated on the first-in, first-out basis and consist of operating supplies, which are materials and supplies to be consumed during the production process. Inventory costs consist of material, labor and manufacturing overhead, including depreciation. Abnormal costs, such as idle facility expenses, freight, handling costs and spoilage, are accounted for as current period charges. All of our inventories at December 31, 2017 and December 31, 2016 were included in the Fabricated Products segment (see Note 2 for the components of inventories).
Replacement Parts. Replacement parts consist of preventative maintenance and capital spare parts, which are stated on the first-in, first-out basis. Replacement parts are recorded within Prepaid expenses and other current assets or Other assets depending on whether or not the expected utilization of the replacement parts is to occur within the current operating cycle.
Property, Plant and Equipment, Net. Property, plant and equipment, net is recorded at cost and includes construction in progress (see Note 2). Interest related to the construction of qualifying assets is capitalized as part of the construction costs. The amount of interest expense capitalized as construction in progress was $2.2 million, $2.9 million and $1.8 million during 2017, 2016 and 2015, respectively.
52
KAISER ALUMINUM CORPORATION AND SUBSIDIARY COMPANIES
NOTES TO CONSOLIDATED FINANCIAL STATEMENTS
Depreciation is computed using the straight-line method at rates based on the estimated useful lives of the various classes of assets. Capital lease assets and leasehold improvements are depreciated on a straight-line basis over the shorter of the estimated useful lives of the assets or the lease term. The principal estimated useful lives are as follows:
Range (in years) | |||
Land improvements | 3 | - | 25 |
Buildings and leasehold improvements | 15 | - | 45 |
Machinery and equipment | 1 | - | 24 |
Capital lease assets | 3 | - | 5 |
Depreciation expense is not included in Cost of products sold, excluding depreciation and amortization and other items, but is included in Depreciation and amortization.
Property, plant and equipment are reviewed for impairment whenever events or changes in circumstances indicate that the carrying amount of the asset or group of assets may not be recoverable. We regularly assess whether events and circumstances with the potential to trigger impairment have occurred and rely on a number of factors, including operating results, business plans, economic projections and anticipated future cash flow, to make such assessments. We use an estimate of the future undiscounted cash flows of the related asset or asset group over the estimated remaining life of such asset(s) in measuring whether the asset(s) are recoverable. Measurement of the amount of impairment, if any, is based on the difference between the carrying value of the asset(s) and the estimated fair value of such asset(s). Fair value is determined through a series of standard valuation techniques.
We recorded impairment charges of $0.8 million, $0.2 million and $0.1 million in 2017, 2016 and 2015, respectively, to reflect the scrap value of idled assets we determined not to deploy for future use. Asset impairment charges are included in Other operating charges, net in the Statements of Consolidated Income (Loss) and are included in the Fabricated Products segment.
We classify assets as held for sale only when an asset is being actively marketed and expected to sell within 12 months. Assets held for sale are initially measured at the lesser of the assets' carrying amount and the fair value less costs to sell.
Goodwill and Intangible Assets. Goodwill is tested for impairment during the fourth quarter on an annual basis, as well as on an interim basis, as warranted, at the time of relevant events and changes in circumstances. Intangible assets with definite lives are initially recognized at fair value and subsequently amortized over the estimated useful lives to reflect the pattern in which the economic benefits of the intangible assets are consumed. In the event the pattern cannot be reliably determined, we use a straight-line amortization method. Whenever events or changes in circumstances indicate that the carrying amount of the intangible assets may not be recoverable, the intangible assets are reviewed for impairment. See Note 3 for a discussion of the goodwill impairment charge recorded during 2017 related to the operations at our Chandler, Arizona (Extrusion) facility, as well as the non-cash impairment charge recorded during 2016 related to one of our customer relationship intangible assets.
Derivative Financial Instruments. Consistent with guidelines established by management and approved by our Board of Directors, we use derivative financial instruments to mitigate our exposure to changes in the market price of aluminum, alloying metals, and energy and, to a lesser extent, foreign currency exchange rates. We do not use derivative financial instruments for trading or other speculative purposes. Hedging transactions are executed centrally on behalf of all of our operations to minimize transaction costs, monitor consolidated net exposures and respond promptly to changes in market factors.
We reflect the fair value of all of our derivative instruments on our Consolidated Balance Sheets (see Note 7). The carrying values of hedges settling within one year are included in Prepaid expenses and other current assets or Other accrued liabilities. Carrying values for hedges settling beyond one year are included in Other assets or Long-term liabilities.
We do not meet the documentation requirements for hedge (deferral) accounting related to aluminum and energy derivatives. Accordingly, we record unrealized gain or loss associated with these hedges in the Statements of Consolidated Income (Loss) within Unrealized (gain) loss on derivative instruments. As such derivatives settle, we reverse any previously recorded unrealized gain or loss associated with these hedges and record the realized gain or loss within Cost of products sold, excluding depreciation and amortization and other items.
53
KAISER ALUMINUM CORPORATION AND SUBSIDIARY COMPANIES
NOTES TO CONSOLIDATED FINANCIAL STATEMENTS
Forward swap contracts for zinc and copper ("Alloy Hedges") used in our fabrication operations are designated and qualify as cash flow hedges. Unrealized gain and loss associated with the Alloy Hedges are deferred in Other comprehensive income, net of tax. As Alloy Hedges settle, we reverse any unrealized gain or loss previously recorded within Other comprehensive income, net of tax associated with settling Alloy Hedges and record the realized gain or loss within Cost of products sold, excluding depreciation and amortization and other items.
Self Insurance of Workers' Compensation and Employee Healthcare Liabilities. We self-insure the majority of the costs of workers' compensation benefits and employee healthcare benefits and rely on insurance coverage to protect us from large losses on individual claims. Workers' compensation liabilities are based on a combination of estimates for: (i) incurred-but-not-reported claims and (ii) the ultimate expense of incurred claims. Such estimates are based on judgment, using our historical claims data and information and analysis provided by actuarial and claims advisors, our insurance carriers and other professionals. Our undiscounted workers' compensation liabilities were estimated at $24.8 million and $26.8 million at December 31, 2017 and December 31, 2016, respectively. However, we account for our workers' compensation accrued liability on a discounted basis, using a discount rate of 2.25% at December 31, 2017 and 2.00% at December 31, 2016. Accrued liabilities for employee healthcare benefits, which are estimates of unpaid incurred medical and prescription drug costs as provided by our healthcare administrators, were $3.5 million and $3.6 million at December 31, 2017 and December 31, 2016, respectively.
Debt Issuance Costs. Costs incurred in connection with debt financing are deferred and amortized over the estimated term of the related borrowing. Such amortization is included in Interest expense and may be capitalized as part of construction in progress (see Note 2 and Note 8).
Conditional Asset Retirement Obligations ("CAROs"). We have CAROs at several of our Fabricated Products facilities. Our CAROs can be separated into two primary categories: (i) legal obligations related to the removal and disposal of asbestos and (ii) asset retirement obligations related to future lease terminations. The majority of our CAROs relate to the first category and consist of incremental costs that would be associated with the removal and disposal of asbestos (all of which is believed to be fully contained and encapsulated within walls, floors, ceilings or piping) of certain of our older facilities if such facilities were to undergo major renovation or be demolished. We estimate incremental costs for special handling, removal and disposal costs of materials that may or will give rise to CAROs and then discount the expected costs back to the current year using a credit-adjusted, risk-free rate. When it is unclear when or if CAROs will be triggered, we use probability weighting for possible timing scenarios to determine the probability-weighted liability amounts that should be recognized in our consolidated financial statements (see Note 9).
Environmental Contingencies. With respect to environmental loss contingencies, we record a loss contingency whenever a contingency is probable and reasonably estimable (see Note 9). Accruals for estimated losses from environmental remediation obligations are generally recognized no later than the completion of the remedial feasibility study. Such accruals are adjusted as information develops or circumstances change. Costs of future expenditures for environmental remediation obligations are not discounted to their present value. Accruals for expected environmental costs are included in Other accrued liabilities or Long-term liabilities, as appropriate (see Note 2). Environmental expense relating to continuing operations is included in Cost of products sold, excluding depreciation and amortization and other items in the Statements of Consolidated Income (Loss). Environmental expense relating to non-operating locations is included in Selling, general, administrative, research and development ("SG&A and R&D") in the Statements of Consolidated Income (Loss).
Recognition of Sales. Sales are generally recognized on a gross basis when all of the following criteria are met: (i) persuasive evidence of an arrangement exists; (ii) title, ownership and risk of loss has passed to the customer; (iii) the price to the customer is fixed or determinable; and (iv) collection of the resulting receivable is reasonably assured. A provision for estimated sales returns from and allowances to customers is made in the same period as the related revenues are recognized, based on historical experience or the specific identification of an event necessitating a reserve.
Shipping and Handling Costs. Shipping and handling costs are recorded as a component of Cost of products sold, excluding depreciation, amortization and other items.
Advertising Costs. Advertising costs, which are included in SG&A and R&D, are expensed as incurred. Advertising costs for 2017, 2016 and 2015 were $0.7 million, $0.4 million and $1.2 million, respectively.
Research and Development Costs. Research and development costs, which are included in SG&A and R&D, are expensed as incurred. Research and development costs for 2017, 2016 and 2015 were $10.0 million, $10.2 million and $9.5 million, respectively.
54
KAISER ALUMINUM CORPORATION AND SUBSIDIARY COMPANIES
NOTES TO CONSOLIDATED FINANCIAL STATEMENTS
Major Maintenance Activities. All major maintenance costs are accounted for using the direct expensing method.
Leases. For leases that contain predetermined fixed escalations of the minimum rent, we recognize the related rent expense on a straight-line basis from the date we take possession of the property to the end of the initial lease term. We record any difference between the straight-line rent amounts and the amount payable under the lease as part of deferred rent in Other accrued liabilities or Long-term liabilities, as appropriate. Deferred rent for all periods presented was not material.
Stock-Based Compensation. Stock-based compensation in the form of service-based awards is provided to executive officers, certain employees and non-employee directors and is accounted for at fair value. We measure the cost of services received in exchange for an award of equity instruments based on the grant-date fair value of the award and the number of awards expected to ultimately vest. The grant-date fair value is determined based on the stock price on the date of grant, adjusted for expected dividends or dividend equivalents to be paid during the vesting period.
We also grant performance-based awards to executive officers and other key employees. The methodology used to value these performance-based awards is based on the nature of the performance conditions within those awards. Awards that are subject to performance conditions pertaining to total shareholder return are valued on the date of grant using a Monte Carlo valuation model. The key assumptions in applying this model are an expected volatility and a risk-free interest rate. Awards with performance conditions pertaining to our cost performance and awards with performance conditions pertaining to our economic value added performance are valued based on our stock price at the date of grant. For more information on our stock-based compensation, see Note 6.
The cost of service-based awards, including time-vested restricted stock and performance shares, is recognized as an expense over the requisite service period of the award on a straight-line basis. Adjustments to expense related to forfeitures are recorded in the period in which they occur. For performance shares with performance conditions pertaining to our cost performance and economic value added performance, the related expense is updated quarterly by adjusting the estimated number of shares expected to vest based on the most probable outcome of the performance condition (see Note 6).
Income Taxes. Deferred income taxes reflect the future tax effect of temporary differences between the carrying amount of assets and liabilities for financial and income tax reporting and are measured by applying statutory tax rates in effect for the year during which the differences are expected to reverse. In accordance with Accounting Standards Codification ("ASC") Topic 740, Income Taxes ("ASC 740"), we use a "more likely than not" threshold for recognition of tax attributes that are subject to uncertainties and measure any reserves in respect of such expected benefits based on their probability. Deferred tax assets are reduced by a valuation allowance to the extent it is more likely than not that the deferred tax assets will not be realized (see Note 12).
New Accounting Pronouncements. Accounting Standards Update ("ASU") No. 2014-09, Revenue from Contracts with Customers (Topic 606) ("ASU 2014-09"), was issued in May 2014 and requires an entity to recognize revenue to depict the transfer of promised goods or services to customers in an amount that reflects the consideration to which the entity expects to be entitled in exchange for those goods or services. In August 2015, ASU 2014-09 was amended by ASU No. 2015-14, Revenue from Contracts with Customers (Topic 606): Deferral of the Effective Date, which defers the effective date of ASU 2014-09 by one year for all entities and permits early adoption on a limited basis. ASU 2014-09 was subsequently amended by five additional pronouncements that are applicable to us: (i) ASU No. 2016-10, Revenue from Contracts with Customers (Topic 606): Identifying Performance Obligations and Licensing; (ii) ASU No. 2016-11, Revenue Recognition (Topic 605) and Derivatives and Hedging (Topic 815): Rescission of SEC Guidance Because of Accounting Standards Updates 2014-09 and 2014-16 Pursuant to Staff Announcements at the March 3, 2016 EITF Meeting; (iii) ASU No. 2016-12, Revenue from Contracts with Customers (Topic 606): Narrow-Scope Improvements and Practical Expedients; (iv) ASU No. 2016-20, Revenue from Contracts with Customers (Topic 606): Technical Corrections and Improvements to Topic 606; and (v) ASU No. 2017-14, Income Statement - Reporting Comprehensive Income (Topic 220), Revenue Recognition (Topic 605), and Revenue from Contracts with Customers (Topic 606).
The primary change to our accounting policies of adopting ASU 2014-09 and its subsequent amendments discussed above (together "ASC 606") will relate to the timing of revenue recognition. Previously, we recognized revenue upon the transfer of risks and title, which was typically not until the product shipped or reached its destination. We will continue to recognize revenue upon product shipment or delivery under ASC 606 for "point-in-time" sales (under certain contracts). However, upon adopting ASC 606, contract sales for a majority of our Aero/HS products and a substantial portion of our Automotive Extrusions will convert from point-in-time to over-time recognition. On these contract sales, we will accelerate revenue recognition throughout the production process.
55
KAISER ALUMINUM CORPORATION AND SUBSIDIARY COMPANIES
NOTES TO CONSOLIDATED FINANCIAL STATEMENTS
We do not believe adopting ASC 606 will result in: (i) a change in the number of distinct performance obligations within our contractual arrangements; (ii) a change in our current capitalization and deferral policies; (iii) a change in our accounting for contract acquisition and fulfillment costs; (iv) additional contract liability balances; or (v) the adjustment of the amount of promised consideration from our customers for the effects of significant financing components. Additionally, we plan to account for shipping and handling activities that occur after the customer has obtained control of a product as fulfillment activities (i.e., an expense) rather than as a promised service (i.e., a revenue element).
As of December 31, 2017: (i) our review of our customer contracts was complete; (ii) our systems were modified to track information needed to apply ASC 606; and (iii) our employees were trained on the changes to revenue recognition policies and work procedures. We will adopt ASC 606 effective January 1, 2018 by recognizing a cumulative-effect adjustment to increase the 2018 opening balance of Retained earnings for the tax-adjusted gross profit of over-time products that were either in work-in-process, in finished goods or in transit to our customers as of December 31, 2017. We expect our adoption of ASC 606 to result in a cumulative-effect adjustment relating to the early recognition of approximately $55.6 million of Net sales based on the application of guidance to contracts not completed at the date of adoption. The cumulative-effect adjustment will be recorded in our opening balance sheet for the year ended December 31, 2018 as: (i) a Contract asset of $55.6 million; (ii) a reduction in Inventories of $42.2 million; (iii) a reduction in Deferred tax assets, net of $3.3 million; and (iv) an increase in Retained earnings of $10.1 million. We believe the impact of adopting ASC 606 will predominantly relate to the timing of revenue recognition and we do not expect it to have a material impact to our quarter-over-quarter or year-over-year results. However, changes in product mix and the stage of product completion at the end of each quarter could result in some unanticipated variability.
ASU No. 2016-02, Leases (Topic 842): Amendments to the Financial Accounting Standards Board Accounting Standards Codification ("ASU 2016-02"), was issued in February 2016. Under ASU 2016-02, lessees will need to recognize a right-of-use asset and a lease liability for virtually all of their leases (other than leases that meet the definition of a short-term lease). For income statement purposes, a dual model was retained, requiring leases to be classified as either operating or finance. Operating leases will result in straight-line expense (similar to current operating leases) while finance leases will result in a front-loaded expense pattern (similar to current capital leases). ASU 2016-02 becomes effective for us in the first quarter of 2019. We are currently assessing the impact and expect the adoption of this ASU in 2019 to have a material impact on our consolidated financial statements.
ASU No. 2017-12, Derivatives and Hedging (Topic 815): Targeted Improvements to Accounting for Hedging Activities ("ASU 2017-12"), was issued in August 2017. The amendments under ASU 2017-12 refine and expand hedge accounting requirements for both financial (e.g., interest rate) and commodity risks. Its provisions create more transparency around how economic results are presented, both on the face of the financial statements and in the related notes. It also makes certain targeted improvements to simplify the application of hedge accounting guidance. We do not expect to record a cumulative effect adjustment as a result of early adopting ASU 2017-12 in the first quarter of 2018; however, we plan to designate a significant portion of our commodity hedges as cash flow hedges beginning January 1, 2018. We therefore expect to significantly reduce or eliminate the mark-to-market adjustments that have historically been recorded within Unrealized (gain) loss on derivative instruments. These adjustments will instead be recorded within Accumulated other comprehensive loss beginning in the first quarter of 2018.
We do not anticipate any material impact on our consolidated financial statements upon the adoption of the following accounting pronouncements: (i) ASU No. 2016-01, Financial Instruments - Overall (Subtopic 825-10): Recognition and Measurement of Financial Assets and Financial Liabilities; (ii) ASU No. 2016-13, Financial Instruments - Credit Losses (Topic 326): Measurement of Credit Losses on Financial Instruments; (iii) ASU No. 2017-07, Compensation - Retirement Benefits (Topic 715): Improving the Presentation of Net Periodic Pension Cost and Net Periodic Postretirement Benefit Cost; and (iv) ASU No. 2017-09, Compensation - Stock Compensation (Topic 718): Scope of Modification Accounting.
There were no material impacts on our consolidated financial statements resulting from our early adoption in the first quarter of 2017 of the following accounting pronouncements: (i) ASU No. 2016-15, Statement of Cash Flows (Topic 230): Classification of Certain Cash Receipts and Cash Payments; (ii) ASU No. 2016-18, Statement of Cash Flows (Topic 230): Restricted Cash; and (iii) ASU No. 2017-04, Intangibles - Goodwill and Other (Topic 350): Simplifying the Test for Goodwill Impairment.
56
KAISER ALUMINUM CORPORATION AND SUBSIDIARY COMPANIES
NOTES TO CONSOLIDATED FINANCIAL STATEMENTS
2. Supplemental Balance Sheet Information
December 31, 2017 | December 31, 2016 | |||||||
(In millions of dollars) | ||||||||
Cash and Cash Equivalents | ||||||||
Cash and money market funds | $ | 23.5 | $ | 37.9 | ||||
Commercial paper | 27.6 | 17.3 | ||||||
Total | $ | 51.1 | $ | 55.2 | ||||
Trade Receivables, net | ||||||||
Billed trade receivables | $ | 165.9 | $ | 138.2 | ||||
Unbilled trade receivables | 0.3 | 0.3 | ||||||
Trade receivables, gross | 166.2 | 138.5 | ||||||
Allowance for doubtful receivables | (1.2 | ) | (0.8 | ) | ||||
Trade receivables, net | $ | 165.0 | $ | 137.7 | ||||
Inventories | ||||||||
Finished products | $ | 63.8 | $ | 73.8 | ||||
Work-in-process | 78.3 | 71.7 | ||||||
Raw materials | 61.3 | 51.1 | ||||||
Operating supplies | 4.5 | 5.0 | ||||||
Total | $ | 207.9 | $ | 201.6 | ||||
Property, Plant and Equipment, net | ||||||||
Land and improvements | $ | 21.1 | $ | 22.7 | ||||
Buildings and leasehold improvements | 92.1 | 88.6 | ||||||
Machinery and equipment | 689.1 | 615.1 | ||||||
Construction in progress | 35.1 | 34.8 | ||||||
Property, plant and equipment – gross | 837.4 | 761.2 | ||||||
Accumulated depreciation | (267.9 | ) | (230.6 | ) | ||||
Assets held for sale | 1.9 | 0.3 | ||||||
Property, plant and equipment, net | $ | 571.4 | $ | 530.9 | ||||
Other Accrued Liabilities | ||||||||
Uncleared cash disbursements | $ | 7.3 | $ | 5.8 | ||||
Accrued income taxes and other taxes payable | 6.8 | 4.3 | ||||||
Accrued annual contribution to VEBAs – Note 4 | 15.7 | 20.0 | ||||||
Accrued interest | 2.9 | 2.9 | ||||||
Other | 7.8 | 7.1 | ||||||
Total | $ | 40.5 | $ | 40.1 | ||||
57
KAISER ALUMINUM CORPORATION AND SUBSIDIARY COMPANIES
NOTES TO CONSOLIDATED FINANCIAL STATEMENTS
December 31, 2017 | December 31, 2016 | |||||||
(In millions of dollars) | ||||||||
Long-Term Liabilities | ||||||||
Workers’ compensation accruals | $ | 22.6 | $ | 25.0 | ||||
Long-term environmental accrual – Note 9 | 15.8 | 15.8 | ||||||
Long-term portion of contingent contribution to Union VEBA – Note 4 | — | 12.8 | ||||||
Other long-term liabilities | 21.6 | 19.6 | ||||||
Total | $ | 60.0 | $ | 73.2 | ||||
3. Goodwill and Intangible Assets
Goodwill. Goodwill is related to our acquisitions of the Chandler, Arizona (Extrusion) facility and the Florence, Alabama facility and is included in the Fabricated Products segment. The carrying value of our goodwill was $18.8 million as of December 31, 2017 and $37.2 million at both the beginning and the end of the year ended December 31, 2016. The carrying value as of December 31, 2017 included accumulated impairment of $18.4 million. There was no accumulated impairment reflected in the carrying values at both the beginning and the end of the year ended December 31, 2016.
Several factors identified in a qualitative review in the quarter ended June 30, 2017 indicated that long-term demand for hard alloy extruded shapes produced at the Chandler, Arizona (Extrusion) facility was less than previously assumed. Such factors included: (i) reduced build rates of wide body commercial aircraft; (ii) continued low build rates for business jets; and (iii) additional substitution away from hard alloy extruded shapes in favor of composites, titanium and/or aerospace aluminum plate in the manufacture of commercial aircraft. After testing for goodwill impairment applying Level 3 inputs and a combination of an income approach using the estimated discounted cash flow and a market-based valuation methodology, we impaired the carrying value of the goodwill related to our Chandler, Arizona (Extrusion) facility by $18.4 million as of June 30, 2017. As this goodwill is deductible for income tax purposes, the deferred tax effects were included in the impairment charge and income tax provision.
During our annual goodwill impairment test in the quarter ending December 31, 2017, we performed a quantitative impairment test and determined that no additional impairment of our goodwill was required.
Intangible Assets. In 2017 and 2016, our identifiable intangible assets related to acquired finite-lived customer relationships. Information regarding the gross carrying amount and accumulated amortization of these intangible assets was as follows as of each period presented:
December 31, 2017 | December 31, 2016 | |||||||
(In millions of dollars) | ||||||||
Gross carrying amount | $ | 34.7 | $ | 34.7 | ||||
Accumulated amortization | (9.7 | ) | (8.3 | ) | ||||
Net carrying amount | $ | 25.0 | $ | 26.4 | ||||
We recorded a $2.6 million non-cash impairment charge within Other operating charges, net during the quarter ended September 30, 2016 due to the loss of a customer. We identified no other indicators of impairment associated with the remainder of our intangible assets during the years ended December 31, 2017, December 31, 2016 or December 31, 2015.
Amortization expense relating to definite-lived intangible assets is recorded in the Fabricated Products segment over a weighted-average useful life of 25 years. Such expense was $1.4 million for 2017, $1.5 million for 2016, and $1.6 million for 2015. The expected amortization of intangible assets for each of the next five calendar years is $1.4 million and $18.0 million for years thereafter.
58
KAISER ALUMINUM CORPORATION AND SUBSIDIARY COMPANIES
NOTES TO CONSOLIDATED FINANCIAL STATEMENTS
4. Employee Benefits
Employee Plans. Employee benefit plans include:
• | A defined contribution 401(k) savings plan for hourly bargaining unit employees at nine of our production facilities based on the specific collective bargaining agreement at each facility. For active bargaining unit employees at three of these production facilities, we are required to make fixed rate contributions. For active bargaining unit employees at one of these production facilities, we are required to match certain employee contributions. For active bargaining unit employees at three of these production facilities, we are required to make both fixed rate contributions and concurrent matches. For active bargaining unit employees at two remaining production facilities, we are not required to make any contributions. Fixed rate contributions either: (i) range from (in whole dollars) $800 to $2,400 per employee per year, depending on the employee’s age, or (ii) vary between 2% to 10% of the employees’ compensation depending on their age and years of service for employees hired prior to January 1, 2004 or is a fixed 2% annual contribution for employees hired on or after January 1, 2004. |
• | A defined contribution 401(k) savings plan for salaried and certain hourly employees providing for a concurrent match of up to 4% of certain contributions made by employees plus an annual contribution of between 2% and 10% of their compensation depending on their age and years of service to employees hired prior to January 1, 2004. All new hires on or after January 1, 2004 receive a fixed 2% contribution annually. |
• | A defined benefit plan for salaried employees at our London, Ontario facility, with annual contributions based on each salaried employee’s age and years of service. At December 31, 2017, approximately 63% of the plan assets were invested in equity securities and 33% of plan assets were invested in fixed income securities. The remaining plan assets were invested in short-term securities. Our investment committee reviews and evaluates the investment portfolio. The asset mix target allocation on the long-term investments is approximately 65% in equity securities, 30% in fixed income securities and 5% in short-term securities. The plan assets of our Canadian pension plan are managed by advisors selected by us, with the investment portfolio subject to periodic review and evaluation by our investment committee. The investment of assets in the Canadian pension plan is based upon the objective of maintaining a diversified portfolio of investments in order to minimize concentration of credit and market risks (such as interest rate, currency, equity price and liquidity risks). The degree of risk and risk tolerance take into account the obligation structure of the plan, the anticipated demand for funds and the maturity profiles required from the investment portfolio in light of these demands. |
• | A non-qualified, unfunded, unsecured plan of deferred compensation for key employees who would otherwise suffer a loss of benefits under our defined contribution plan as a result of the limitations imposed by the Internal Revenue Code of 1986 ("Code"). Despite the plan being an unfunded plan, we make an annual contribution to a rabbi trust to fulfill future funding obligations, as contemplated by the terms of the plan. The assets in the trust are at all times subject to the claims of our general creditors and no participant has a claim to any assets of the trust. Plan participants are eligible to receive distributions from the trust subject to vesting and other eligibility requirements. Assets in the rabbi trust relating to the deferred compensation plan are accounted for as available for sale securities and are included in Other assets on the Consolidated Balance Sheets (see "Fair Value of Plan Assets" below). Liabilities relating to the deferred compensation plan are included in Long-term liabilities on the Consolidated Balance Sheets. |
• | An employment agreement with our chief executive officer extending through July 15, 2020. We also provide certain members of senior management, including each of our named executive officers, with benefits related to terminations of employment in specified circumstances, including in connection with a change in control, by us without cause and by the executive officer with good reason. |
Salaried VEBA Postretirement Obligation. Certain retirees who retired prior to 2004 and certain employees who were hired prior to February 2002 and have subsequently retired or will retire with the requisite age and service, along with their surviving spouses and eligible dependents, are eligible to participate in a voluntary employees' beneficiary association ("VEBA") that provides healthcare cost, medical cost and long-term care insurance cost reimbursement benefits ("Salaried VEBA"). The Salaried VEBA is managed by trustees who determine the level and type of benefits to offer to its participants and who appoint an independent fiduciary to manage the assets of the Salaried VEBA. The Salaried VEBA trustees are independent of us and not under our control. However, because we have an ongoing obligation with no express termination date to make annual variable cash contributions to the Salaried VEBA, we account for it as a defined benefit plan in our financial statements.
Our annual cash contribution payable to the Salaried VEBA varies from a minimum of zero to a maximum of $2.9 million, depending on our annual cash flow. We paid the maximum of $2.9 million to the Salaried VEBA in 2017 and we determined
59
KAISER ALUMINUM CORPORATION AND SUBSIDIARY COMPANIES
NOTES TO CONSOLIDATED FINANCIAL STATEMENTS
that in 2018 we will also pay the maximum of $2.9 million as our variable cash contribution. Such amount was calculated with respect to the 2017 calendar year and recorded within Other accrued liabilities as of December 31, 2017 (see Note 2). It will be paid during the first quarter of 2018.
Union VEBA Postretirement Obligation. Certain other eligible retirees represented by certain unions along with their surviving spouses and eligible dependents participate in a separate VEBA ("Union VEBA") that provides healthcare and medical cost reimbursement benefits. We had an obligation to make variable cash contributions to the Union VEBA with respect to periods through September 30, 2017. Our final cash contribution for the nine months ended September 30, 2017, totaling $12.8 million, will be paid during the first quarter of 2018 and was recorded within Other accrued liabilities (see Note 2). The variable contribution relating to 2016 in the amount of $17.1 million was paid in 2017.
We terminated defined benefit plan accounting with respect to the Union VEBA in 2015, after determining that our obligation to make annual variable contributions to the Union VEBA would expire as of September 2017. This resulted in a non-cash loss of $307.8 million, net of a $184.4 million tax benefit, as we removed the Union VEBA net assets and related deferred tax liabilities from our Consolidated Balance Sheet and accrued amounts estimated to be paid through the expiration of our obligation.
Key Assumptions. The following data presents the key assumptions used and the amounts reflected in our consolidated financial statements with respect to our Canadian pension plan and the Salaried VEBA. We use a December 31 measurement date for all of the plans.
Assumptions used to determine benefit obligations as of the periods presented were as follows:
Canadian Pension Plan | Salaried VEBA | |||||||||||
December 31, 2017 | December 31, 2016 | December 31, 2017 | December 31, 2016 | |||||||||
Discount rate | 3.40 | % | 3.80 | % | 3.20 | % | 3.60 | % | ||||
Rate of compensation increase | 3.00 | % | 3.00 | % | — | — | ||||||
Key assumptions made in computing the net obligation of the Salaried VEBA and in total include:
With respect to Salaried VEBA assets:
• | Based on the information received from the Salaried VEBA at December 31, 2017 and at December 31, 2016, the Salaried VEBA assets were invested in various managed proprietary funds. |
• | Our variable payment, if any, is treated as a funding/contribution policy and not counted as a Salaried VEBA asset at December 31 for actuarial purposes. |
With respect to Salaried VEBA obligations:
• | The accumulated postretirement benefit obligation ("APBO") for the Salaried VEBA was computed based on the level of benefits being provided by it at December 31, 2017 and December 31, 2016. |
• | Since the Salaried VEBA was paying a fixed annual amount to its participants at both December 31, 2017 and December 31, 2016, no future cost trend rate increase has been assumed in computing the APBO for the Salaried VEBA. |
Assumptions used to determine net periodic benefit cost for the years ended December 31 were:
Canadian Pension Plan | Salaried VEBA | |||||||||||||||||
2017 | 2016 | 2015 | 2017 | 2016 | 2015 | |||||||||||||
Discount rate | 3.80 | % | 4.10 | % | 4.00 | % | 3.60 | % | 3.90 | % | 3.60 | % | ||||||
Expected long-term return on plan assets1 | 4.45 | % | 4.45 | % | 5.10 | % | 7.75 | % | 7.75 | % | 7.75 | % | ||||||
Rate of compensation increase | 3.00 | % | 3.00 | % | 3.00 | % | — | — | — | |||||||||
60
KAISER ALUMINUM CORPORATION AND SUBSIDIARY COMPANIES
NOTES TO CONSOLIDATED FINANCIAL STATEMENTS
_____________________
1. | The expected long-term rate of return assumption for the Salaried VEBA is based on the targeted investment portfolios provided to us by the trustee of the Salaried VEBA. |
Benefit Obligations and Funded Status. The following table presents the benefit obligations and funded status of our Canadian pension and the Salaried VEBA as of December 31, 2017 and December 31, 2016 and the corresponding amounts that are included in our Consolidated Balance Sheets (in millions of dollars):
Canadian Pension Plan | Salaried VEBA | |||||||||||||||
2017 | 2016 | 2017 | 2016 | |||||||||||||
Change in benefit obligation: | ||||||||||||||||
Obligation at beginning of year | $ | 7.0 | $ | 6.1 | $ | 86.8 | $ | 77.9 | ||||||||
Foreign currency translation adjustment | 0.5 | 0.2 | — | — | ||||||||||||
Service cost | 0.3 | 0.3 | — | — | ||||||||||||
Interest cost | 0.3 | 0.3 | 3.0 | 2.9 | ||||||||||||
Prior service cost1 | — | — | 7.3 | 8.4 | ||||||||||||
Actuarial loss (gain)2 | 0.6 | 0.3 | (0.5 | ) | 4.1 | |||||||||||
Plan participants contributions | 0.1 | — | — | — | ||||||||||||
Benefits paid by Company | (0.3 | ) | (0.2 | ) | — | — | ||||||||||
Benefits paid by Salaried VEBA | — | — | (6.6 | ) | (6.5 | ) | ||||||||||
Obligation at end of year3 | 8.5 | 7.0 | 90.0 | 86.8 | ||||||||||||
Change in plan assets: | ||||||||||||||||
Fair market value of plan assets at beginning of year | 6.1 | 5.7 | 58.2 | 58.9 | ||||||||||||
Foreign currency translation adjustment | 0.5 | 0.2 | — | — | ||||||||||||
Actual return on assets | 0.5 | 0.1 | 3.6 | 2.9 | ||||||||||||
Plan participants contributions | 0.1 | — | — | — | ||||||||||||
Company contributions | 0.4 | 0.3 | 2.9 | 2.9 | ||||||||||||
Benefits paid by Company | (0.3 | ) | (0.2 | ) | — | — | ||||||||||
Benefits paid by Salaried VEBA | — | — | (6.6 | ) | (6.5 | ) | ||||||||||
Fair market value of plan assets at end of year | 7.3 | 6.1 | 58.1 | 58.2 | ||||||||||||
Net funded status4 | $ | (1.2 | ) | $ | (0.9 | ) | $ | (31.9 | ) | $ | (28.6 | ) | ||||
_____________________________
1. | The prior service cost relating to the Salaried VEBA in both 2017 and 2016 resulted from increases in the annual healthcare reimbursement benefit starting in 2018 and 2017, respectively, for plan participants. |
2. | The actuarial gain relating to the Salaried VEBA in 2017 was comprised of: (i) a $2.5 million gain due to changes in census information; (ii) a $1.0 million gain due to a change in the projected utilization rate; offset by (iii) a $3.0 million loss due to a change in the discount rate. |
The actuarial loss relating to the Salaried VEBA in 2016 was comprised of: (i) a $2.3 million loss due to changes in census information; (ii) a $2.2 million loss due to a reduction in the discount rate; offset by (iii) a $0.4 million gain due to a change in the projected utilization rate.
3. | For the Canadian pension plan, the benefit obligation is the projected benefit obligation. For the Salaried VEBA, the benefit obligation is the APBO. |
4. | Net funded status of $31.9 million and $28.6 million relating to the Salaried VEBA at December 31, 2017 and December 31, 2016, respectively, was presented as Net liabilities of Salaried VEBA on the Consolidated Balance Sheet. |
61
KAISER ALUMINUM CORPORATION AND SUBSIDIARY COMPANIES
NOTES TO CONSOLIDATED FINANCIAL STATEMENTS
The accumulated benefit obligation for the Canadian defined benefit pension plan was $7.9 million and $6.4 million at December 31, 2017 and December 31, 2016, respectively. We expect to contribute $0.5 million to the Canadian pension plan in 2018.
As of December 31, 2017, the net benefits expected to be paid in each of the next five fiscal years and in the aggregate for the five fiscal years thereafter are as follows (in millions of dollars):
Benefit Payments Due by Period | |||||||||||||||||||||||
2018 | 2019 | 2020 | 2021 | 2022 | 2023-2027 | ||||||||||||||||||
Canadian pension plan benefit payments | $ | 0.3 | $ | 0.3 | $ | 0.3 | $ | 0.4 | $ | 0.3 | $ | 1.9 | |||||||||||
Salaried VEBA benefit payments1 | 7.5 | 7.3 | 7.2 | 7.0 | 6.8 | 30.3 | |||||||||||||||||
Total net benefits | $ | 7.8 | $ | 7.6 | $ | 7.5 | $ | 7.4 | $ | 7.1 | $ | 32.2 | |||||||||||
__________________________________
1. | Such amounts are based on benefit amounts and certain key assumptions obtained from the Salaried VEBA. |
The amount of loss included in the Consolidated Balance Sheets (within Accumulated other comprehensive loss) associated with our Canadian defined benefit pension plan and the Salaried VEBA (before tax) that had not yet been reflected in net periodic benefit cost was as follows at December 31 (in millions of dollars):
Canadian Pension Plan | Salaried VEBA | |||||||||||||||
2017 | 2016 | 2017 | 2016 | |||||||||||||
Accumulated net actuarial loss | $ | (1.9 | ) | $ | (1.5 | ) | $ | (17.5 | ) | $ | (18.3 | ) | ||||
Transition assets | 0.1 | 0.1 | — | — | ||||||||||||
Prior service cost | — | — | (42.7 | ) | (40.2 | ) | ||||||||||
Cumulative loss reflected in Accumulated other comprehensive loss | $ | (1.8 | ) | $ | (1.4 | ) | $ | (60.2 | ) | $ | (58.5 | ) | ||||
The amount in Accumulated other comprehensive loss that has not yet been recognized as a component of net periodic postretirement benefit cost at December 31, 2017 that is expected to be recognized in 2018 for the Canadian pension plan was nominal at December 31, 2017. For the Salaried VEBA, such amounts were $6.2 million at December 31, 2017. Of the $6.2 million relating to the Salaried VEBA, $5.4 million is related to amortization of prior service cost and $0.8 million is related to amortization of net actuarial loss. See Note 10 for reclassification adjustments of other comprehensive (loss) income that were recognized as components of net periodic benefit cost for 2017, 2016 and 2015.
Fair Value of Plan Assets. The plan assets of our Canadian pension plan and the Salaried VEBA are measured annually on December 31 and reflected in our Consolidated Balance Sheets at fair value. In determining the fair value of the plan assets at an annual period end, we utilize primarily the results of valuations supplied by the investment advisors responsible for managing the assets of each plan, which we independently review for reasonableness. Valuation of certain Canadian pension plan and Salaried VEBA assets are based on the net asset value ("NAV") of shares held by the plans at year-end using the NAV practical expedient.
With respect to the Salaried VEBA, the investment advisors providing the valuations are engaged by the Salaried VEBA trustees. Certain Salaried VEBA plan assets are valued based upon unadjusted quoted market prices in active markets that are accessible at the measurement date for identical, unrestricted assets (e.g., liquid securities listed on an exchange). Such assets are classified within Level 1 of the fair value hierarchy. Valuation of other Salaried VEBA invested plan assets is based on significant observable inputs (e.g., valuations derived from actual market transactions, broker-dealer supplied valuations or correlations between a given U.S. market and a non-U.S. security). Valuation model inputs can generally be verified and valuation techniques do not involve significant judgment. The fair values of such financial instruments are classified within Level 2 of the fair value hierarchy.
In addition to the Canadian pension plan and Salaried VEBA, we also hold assets in various investment funds at certain registered investment companies in connection with our deferred compensation program. Such assets are accounted for as available for sale securities within Level 2 of the fair value hierarchy and are measured and recorded at fair value based on their quoted market prices (see Note 1).
62
KAISER ALUMINUM CORPORATION AND SUBSIDIARY COMPANIES
NOTES TO CONSOLIDATED FINANCIAL STATEMENTS
The following table presents the fair value of plan assets, classified under the appropriate level of the fair value hierarchy, as of each period presented (in millions of dollars):
Level 1 | Level 2 | Level 3 | Total | ||||||||||||
As of December 31, 2017: | |||||||||||||||
Plan Assets in the Fair Value Hierarchy: | |||||||||||||||
Salaried VEBA – | |||||||||||||||
Cash and money market investments | $ | 1.3 | $ | — | $ | — | $ | 1.3 | |||||||
Diversified investment funds in registered investment companies1 | 10.2 | — | — | 10.2 | |||||||||||
Total Salaried VEBA assets in the fair value hierarchy | 11.5 | — | — | 11.5 | |||||||||||
Deferred compensation program – Diversified investment funds in registered investment companies1 | — | 9.8 | — | 9.8 | |||||||||||
Total plan assets in the fair value hierarchy | $ | 11.5 | $ | 9.8 | $ | — | $ | 21.3 | |||||||
Plan Assets Measured at NAV 2: | |||||||||||||||
Salaried VEBA – Fixed income investment funds in registered investment companies3 | $ | 19.4 | |||||||||||||
Salaried VEBA – Equity investment funds in registered investment companies4 | 24.3 | ||||||||||||||
Canadian pension plan – Diversified investment funds in registered investment companies1 | 7.3 | ||||||||||||||
Total plan assets at fair value | $ | 72.3 | |||||||||||||
As of December 31, 2016: | |||||||||||||||
Plan Assets in the Fair Value Hierarchy: | |||||||||||||||
Salaried VEBA – | |||||||||||||||
Cash and money market investments | $ | 3.3 | $ | — | $ | — | $ | 3.3 | |||||||
Diversified investment funds in registered investment companies1 | 12.8 | — | — | 12.8 | |||||||||||
Total Salaried VEBA assets in the fair value hierarchy | 16.1 | — | — | 16.1 | |||||||||||
Deferred compensation program – Diversified investment funds in registered investment companies1 | — | 8.2 | — | 8.2 | |||||||||||
Total plan assets in the fair value hierarchy | $ | 16.1 | $ | 8.2 | $ | — | $ | 24.3 | |||||||
Plan Assets Measured at NAV 2: | |||||||||||||||
Salaried VEBA – Fixed income investment funds in registered investment companies3 | $ | 17.9 | |||||||||||||
Salaried VEBA – Equity investment funds in registered investment companies4 | 21.3 | ||||||||||||||
Canadian pension plan – Diversified investment funds in registered investment companies1 | 6.1 | ||||||||||||||
Total plan assets at fair value | $ | 69.6 | |||||||||||||
_________________________
1. | The plan assets are invested in investment funds that hold a diversified portfolio of: (i) U.S and international debt and equity securities; (ii) fixed income securities such as corporate bonds and government bonds; (iii) mortgage-related securities; and (iv) cash and cash equivalents. |
2. | The market value of these funds has not been categorized in the fair value hierarchy and is being presented in the table above to permit a reconciliation of the fair value hierarchy to the Consolidated Balance Sheets. Equity investment funds measured at fair value using the NAV practical expedient are managed by an investment adviser registered with the SEC |
63
KAISER ALUMINUM CORPORATION AND SUBSIDIARY COMPANIES
NOTES TO CONSOLIDATED FINANCIAL STATEMENTS
under the Investment Advisers Act of 1940 and can be redeemed with five business days notice on the 15th (or last business day prior to the 15th) and on the last business day of each month. A business day is every day that the New York Stock Exchange is open. Diversified investment funds measured at fair value using the NAV practical expedient are unitized mutual funds without externally published net asset values, which can be redeemed daily without restriction.
3. | This category represents investments in various fixed income funds with multiple registered investment companies. Such funds invest in diversified portfolios, including: (i) marketable fixed income securities, such as (a) U.S. Treasury and other government and agency securities, (b) municipal bonds, (c) mortgage-backed securities, (d) asset-backed securities, (e) corporate bonds, notes and debentures in various sectors, (f) preferred and common stock, (g) investments in affiliated and other investment companies, (h) short-term investments and other net assets, and (i) repurchase agreements and reverse repurchase agreements; (ii) other commingled investments; (iii) investment grade debt; (iv) fixed income instruments which may be represented by options, future contracts or swap agreements; and (v) cash and cash equivalents. In the prior year, the $17.9 million balance as of December 31, 2016 in the table above was presented within the Level 2 category and has been restated in the current year to properly reflect the balance within the NAV category. |
4. | This category represents investments in equity funds that invest in portfolios comprised of: (i) equity and equity-related securities of U.S. and non-U.S. issuers across all market capitalizations; (ii) common stock in investment trust funds; and (iii) other short-term investments. |
Components of Net Periodic Benefit Cost. Our results of operations included the following impacts associated with the Canadian defined benefit plan and the Salaried VEBA: (a) charges for service rendered by employees; (b) a charge for accretion of interest; (c) a benefit for the return on plan assets; and (d) amortization of net gains or losses on assets, prior service costs associated with plan amendments and actuarial differences. The following table presents the components of net periodic benefit cost for the years ended December 31 (in millions of dollars):
Canadian Pension Plan | Salaried VEBA | |||||||||||||||||||||||
2017 | 2016 | 2015 | 2017 | 2016 | 2015 | |||||||||||||||||||
Service cost1 | $ | 0.3 | $ | 0.3 | $ | 0.3 | $ | — | $ | — | $ | — | ||||||||||||
Interest cost | 0.3 | 0.3 | 0.3 | 3.0 | 2.9 | 2.7 | ||||||||||||||||||
Expected return on plan assets | (0.3 | ) | (0.3 | ) | (0.3 | ) | (4.1 | ) | (4.1 | ) | (4.3 | ) | ||||||||||||
Amortization of prior service cost2 | — | — | — | 4.7 | 4.1 | 3.0 | ||||||||||||||||||
Amortization of net actuarial loss | — | — | 0.1 | 0.9 | 0.5 | 1.0 | ||||||||||||||||||
Net periodic benefit cost | $ | 0.3 | $ | 0.3 | $ | 0.4 | $ | 4.5 | $ | 3.4 | $ | 2.4 | ||||||||||||
__________________________
1. | The service cost related to the Salaried VEBA was insignificant for all periods presented. |
2. | We amortize prior service cost on a straight-line basis over the average remaining years of service to full eligibility for benefits of the active plan participants. |
64
KAISER ALUMINUM CORPORATION AND SUBSIDIARY COMPANIES
NOTES TO CONSOLIDATED FINANCIAL STATEMENTS
The following tables present the total expense (income) related to all benefit plans for the periods presented (in millions of dollars):
Year Ended December 31, | ||||||||||||
2017 | 2016 | 2015 | ||||||||||
Included within Fabricated Products: | ||||||||||||
Canadian pension plan | $ | 0.3 | $ | 0.3 | $ | 0.4 | ||||||
Deferred compensation plan | 0.4 | 0.2 | 0.1 | |||||||||
Defined contribution plans | 8.1 | 8.1 | 7.8 | |||||||||
Multiemployer pension plans1 | 4.6 | 4.7 | 4.4 | |||||||||
Total Fabricated Products2 | 13.4 | 13.3 | 12.7 | |||||||||
Included within All Other: | ||||||||||||
Net periodic postretirement benefit cost relating to Salaried VEBA | 4.5 | 3.4 | 2.4 | |||||||||
(Gain) loss on removal of Union VEBA net assets | — | (0.1 | ) | 493.4 | ||||||||
Deferred compensation plan | 1.4 | 0.7 | 0.3 | |||||||||
Defined contribution plans | 0.8 | 0.8 | 0.8 | |||||||||
Total All Other3 | 6.7 | 4.8 | 496.9 | |||||||||
Total | $ | 20.1 | $ | 18.1 | $ | 509.6 | ||||||
___________________________
1. | See Note 5 for more information on our multiemployer defined benefit pension plans. |
2. | Substantially all of the Fabricated Products segment’s charges related to employee benefits were in Cost of products sold, excluding depreciation and amortization and other items with the remaining balance in SG&A and R&D. |
3. | Expense (income) related to VEBAs is included within the Statements of Consolidated Income (Loss) as Net periodic postretirement benefit cost relating to Salaried VEBA and (Gain) loss on removal of Union VEBA net assets. The remaining balance is reported in SG&A and R&D. |
5. Multiemployer Pension Plans
Overview. We contribute to multiemployer defined benefit pension plans under the terms of collective bargaining agreements that cover our union-represented employees at certain facilities. At December 31, 2017, approximately 52% of our total employees were union-represented employees at facilities participating in these multiemployer pension plans. We currently estimate that contributions will range from $3.0 million to $5.0 million per year through 2018.
The risks of participating in these multiemployer plans are different from single-employer plans in the following aspects:
• | Assets contributed to the multiemployer plan by one employer may be used to provide benefits to employees of other participating employers. |
• | If a participating employer stops contributing to the plan, the unfunded obligations of the plan may be borne by the remaining participating employers. |
• | If we choose to stop participating in some of our multiemployer plans, we may be required to pay those plans an amount based on the underfunded status of the plan, referred to as a withdrawal liability. |
65
KAISER ALUMINUM CORPORATION AND SUBSIDIARY COMPANIES
NOTES TO CONSOLIDATED FINANCIAL STATEMENTS
Our participation in multiemployer pension plans for the year ended December 31, 2017 is outlined in the table below:
Pension Fund | Employer Identification Number | Pension Protection Act Zone Status1 | FIP/RP Status Pending/Implemented in 20172 | Contributions of the Company | Surcharge Imposed in 2017 | Expiration Date of Collective-Bargaining Agreements | ||||||||||||||||||||
2017 | 2016 | 2015 | ||||||||||||||||||||||||
2017 | 2016 | (in millions of dollars) | ||||||||||||||||||||||||
Steelworkers Pension Trust (USW)3 | 236648508 | Green | Green | No | $ | 3.5 | $ | 3.7 | $ | 3.5 | No | Mar 2020 | - | Nov 2020 | ||||||||||||
Other Funds4 | 1.1 | 1.0 | 0.9 | |||||||||||||||||||||||
$ | 4.6 | $ | 4.7 | $ | 4.4 | |||||||||||||||||||||
________________
1. | The most recent Pension Protection Act zone status available in 2017 and 2016 for the Steelworkers Pension Trust is for the plan's year-end at December 31, 2016 and December 31, 2015, respectively. The zone status is based on information that we received from the plan and is certified by the plan's actuary. Among other factors, plans in the green zone are at least 80% funded. |
2. | The "FIP/RP Status Pending/Implemented" column indicates if a Financial Improvement Plan (FIP) or a Rehabilitation Plan (RP) is either pending or has been implemented for the plan under the Pension Protection Act. |
3. | We are party to three collective bargaining agreements with the United Steel, Paper and Forestry, Rubber, Manufacturing, Energy, Allied Industrial and Service Workers International Union, AFL-CIO,CLC ("USW") that require contributions to the Steelworkers Pension Trust. As of December 31, 2017, USW collective bargaining agreements covering employees at the Newark, Ohio ("Newark") and Spokane, Washington ("Trentwood") facilities covered 85% of our USW-represented employees and expire in September 2020. Our monthly contributions per hour worked by each bargaining unit employee at the Newark and Trentwood facilities are (in whole dollars) $1.50 and will increase to $1.75 in 2019. The union contracts covering employees at the Richmond, Virginia facility and Florence, Alabama facility cover 11% and 4% of our USW-represented employees, respectively, and expire in March 2020 and November 2020, respectively. |
4. | Other Funds consists of plans that are not individually significant. |
We were not listed in any of the plans' Forms 5500 or the Canada-Wide Industrial Pension Plan financial statements as providing more than 5% of the total contributions for any of the plan years disclosed. At December 31, 2017, financial statements and Forms 5500 were not available for the plan years ending in 2017. Further, there were no significant changes to the number of employees covered by our multiemployer plans that would affect the period-to-period comparability of the contributions for the years presented.
6. Employee Incentive Plans
Short-Term Incentive Plans ("STI Plans")
We have annual short-term incentive compensation plans for senior management and certain other employees payable at our election in cash, shares of common stock or a combination of cash and shares of common stock. Amounts earned under STI Plans are based on our adjusted earnings before interest, taxes, depreciation and amortization ("Adjusted EBITDA"), modified for certain safety, quality, delivery, cost and individual performance factors. The Adjusted EBITDA targets are determined based on the return on adjusted net assets of our Fabricated Products business. Most of our production facilities have similar programs for both hourly and salaried employees. As of December 31, 2017, we had a liability of $17.4 million recorded within Accrued salaries, wages and related expenses for estimated probable future payments relating to the 12-month performance period of our 2017 STI Plans.
Long-Term Incentive Programs ("LTI Programs")
General. Executive officers and other key employees of the Company, as well as non-employee directors of the Company, are eligible to participate in the Kaiser Aluminum Corporation 2016 Equity and Incentive Compensation Plan ("2016 Plan"). The 2016 Plan was approved by stockholders on May 26, 2016 and replaced and succeeded in its entirety the Kaiser Aluminum Corporation Amended and Restated 2006 Equity and Performance Incentive Plan. At December 31, 2017, 737,954 shares were available for awards under the 2016 Plan. We issue new shares of our common stock upon vesting under the 2016 Plan.
66
KAISER ALUMINUM CORPORATION AND SUBSIDIARY COMPANIES
NOTES TO CONSOLIDATED FINANCIAL STATEMENTS
Non-Vested Common Shares and Restricted Stock Units. We grant non-vested common shares to our non-employee directors and non-vested common shares and restricted stock units to our executive officers and other key employees. The restricted stock units have rights similar to the rights of non-vested common shares and each restricted stock unit that becomes vested entitles the recipient to receive one common share or a cash amount equaling the value of one common share. For both non-vested common shares and restricted stock units, the service period is generally one year for non-employee directors and three years for executive officers and other key employees.
Performance Shares. In addition to non-vested common shares and restricted stock units, we grant performance shares to executive officers and other key employees. Each performance share that becomes vested and earned entitles the recipient to receive one common share or a cash amount equaling the value of one common share. During the first quarter of 2017, performance shares granted in 2014 under the 2014-2016 LTI Program vested (see "Summary of Activity" below). The number of performance shares that vested resulted in the issuance of common shares was determined based on our total shareholder return ("TSR") compared to the TSR of a specified group of peer companies over a three-year performance period.
Performance shares granted in 2015 are subject to performance conditions pertaining to our TSR relative to the TSR of a specified group of peer companies over a three-year performance period ("TSR-Based Performance Shares").
Performance shares granted in 2016 consist of TSR-Based Performance Shares and performance shares subject to performance requirements pertaining to our total controllable cost performance over a three-year performance period ("CP-Based Performance Shares").
Performance shares granted in 2017 consist of TSR-Based Performance Shares, CP-Based Performance Shares and performance shares subject to performance conditions pertaining to our economic value added ("EVA") performance, determined based on our adjusted pre-tax operating income in excess of a capital charge, over a three-year performance period ("EVA-Based Performance Shares").
The number of performance shares under the 2015-2017, 2016-2018 and 2017-2019 LTI Programs that may be earned and result in the issuance of common shares ranges between 0% to 200% of the target number of underlying common shares, which is approximately one-half of the maximum payout. The performance shares granted under the 2015-2017, 2016-2018 and 2017-2019 LTI Programs will vest in 2018, 2019 and 2020, respectively.
Inputs and assumptions used in the Monte Carlo simulations to calculate the fair value at grant date of our TSR-Based Performance Shares were as follows:
Year Ended December 31, | |||||||||||
2017 | 2016 | 2015 | |||||||||
Grant date fair value | $ | 97.88 | $ | 93.02 | $ | 95.68 | |||||
Grant date stock price | $ | 79.69 | $ | 80.46 | $ | 75.41 | |||||
Expected volatility of Kaiser Aluminum1 | 22.74 | % | 17.81 | % | 19.03 | % | |||||
Expected volatility of peer companies1 | 44.19 | % | 41.22 | % | 33.73 | % | |||||
Risk-free interest rate | 1.54 | % | 1.01 | % | 0.98 | % | |||||
Dividend yield | 2.50 | % | 2.24 | % | 2.12 | % | |||||
_____________________
1. | Expected volatility based on 2.8 years of daily closing share prices from the valuation date to the end of the performance period. |
67
KAISER ALUMINUM CORPORATION AND SUBSIDIARY COMPANIES
NOTES TO CONSOLIDATED FINANCIAL STATEMENTS
Non-Cash Compensation Expense. Non-cash compensation expense relating to all awards is included in SG&A and R&D. Non-cash compensation expense by type of award under LTI Programs was as follows for each period presented (in millions of dollars):
Year Ended December 31, | |||||||||||
2017 | 2016 | 2015 | |||||||||
Non-vested common shares and restricted stock units | $ | 5.4 | $ | 4.7 | $ | 4.4 | |||||
TSR-Based Performance Shares | 4.8 | 5.4 | 4.0 | ||||||||
CP-Based Performance Shares | 2.7 | 1.3 | — | ||||||||
EVA-Based Performance Shares | 0.2 | 0.3 | 0.9 | ||||||||
Total non-cash compensation expense | $ | 13.1 | $ | 11.7 | $ | 9.3 | |||||
The following table presents the allocation of the charges detailed above, by segment (in millions of dollars):
Year Ended December 31, | |||||||||||
2017 | 2016 | 2015 | |||||||||
Fabricated Products | $ | 5.0 | $ | 4.2 | $ | 3.5 | |||||
All Other | 8.1 | 7.5 | 5.8 | ||||||||
Total non-cash compensation expense | $ | 13.1 | $ | 11.7 | $ | 9.3 | |||||
Recognized tax benefits relating to non-cash compensation expense were $4.9 million, $4.4 million and $3.5 million for 2017, 2016 and 2015, respectively.
Unrecognized Gross Compensation Cost Data. The following table presents unrecognized gross compensation cost data by type of award as of December 31, 2017:
Unrecognized Gross Compensation Costs (in millions of dollars) | Expected Period (in years) Over Which the Remaining Gross Compensation Costs Will Be Recognized | ||||
Non-vested common shares and restricted stock units | $ | 8.1 | 2.5 | ||
TSR-Based Performance Shares | $ | 4.3 | 1.6 | ||
CP-Based Performance Shares | $ | 5.2 | 1.9 | ||
EVA-Based Performance Shares | $ | 0.5 | 2.2 | ||
68
KAISER ALUMINUM CORPORATION AND SUBSIDIARY COMPANIES
NOTES TO CONSOLIDATED FINANCIAL STATEMENTS
Summary of Activity. A summary of the activity with respect to non-vested common shares, restricted stock units, TSR-Based Performance Shares, CP-Based Performance Shares and EVA-Based Performance Shares for the year ended December 31, 2017 is as follows:
Non-Vested Common Shares | Restricted Stock Units | TSR-Based Performance Shares | CP-Based Performance Shares | EVA-Based Performance Shares | ||||||||||||||||||||||||||||||
Shares | Weighted-Average Grant-Date Fair Value per Share | Units | Weighted-Average Grant-Date Fair Value per Unit | Shares | Weighted-Average Grant-Date Fair Value per Share | Shares | Weighted-Average Grant-Date Fair Value per Share | Shares | Weighted-Average Grant-Date Fair Value per Share | |||||||||||||||||||||||||
Outstanding at December 31, 2016 | 114,658 | $ | 69.51 | 61,800 | $ | 74.94 | 394,525 | $ | 90.30 | 63,678 | $ | 80.46 | — | $ | — | |||||||||||||||||||
Granted 1 | 11,817 | 86.92 | 92,275 | 76.13 | 65,044 | 97.88 | 65,044 | 79.69 | 32,504 | 79.69 | ||||||||||||||||||||||||
Vested | (46,689 | ) | 71.46 | (9,570 | ) | 76.19 | (94,082 | ) | 83.18 | — | — | — | — | |||||||||||||||||||||
Forfeited 1 | (451 | ) | 69.83 | (6,887 | ) | 77.44 | (6,383 | ) | 95.85 | (3,999 | ) | 79.93 | (1,374 | ) | 79.69 | |||||||||||||||||||
Canceled 1 | — | — | — | — | (55,288 | ) | 83.18 | — | — | — | — | |||||||||||||||||||||||
Outstanding at December 31, 2017 | 79,335 | $ | 70.96 | 137,618 | $ | 75.81 | 303,816 | $ | 95.31 | 124,723 | $ | 80.08 | 31,130 | $ | 79.69 | |||||||||||||||||||
_____________________
1. | For performance shares, the number of shares granted and forfeited are presented at their maximum payout; and the number of shares canceled includes the number of shares that did not vest due to performance results falling below those required for maximum payout. |
The weighted-average grant-date fair value per share for shares granted by type of award was as follows for each period presented:
Year Ended December 31, | |||||||||||
2017 | 2016 | 2015 | |||||||||
Non-vested common shares | $ | 86.92 | $ | 86.11 | $ | 72.09 | |||||
Restricted stock units | $ | 76.13 | $ | 75.29 | $ | 69.83 | |||||
TSR-Based Performance Shares | $ | 97.88 | $ | 93.02 | $ | 95.68 | |||||
CP-Based Performance Shares | $ | 79.69 | $ | 80.46 | $ | — | |||||
EVA-Based Performance Shares | $ | 79.69 | $ | — | $ | — | |||||
Stock Options. As of December 31, 2016, we had 1,543 fully-vested outstanding stock options exercisable to purchase common shares at $80.01 per share, all of which subsequently expired on April 2, 2017. No options were granted during the year ended December 31, 2017, and no options were outstanding as of December 31, 2017.
Participants may elect to have us withhold common shares to satisfy minimum statutory tax withholding obligations arising in connection with the exercise of stock options and vesting of non-vested shares, restricted stock units and performance shares. We cancel any such shares withheld on the applicable vesting dates or earlier dates when service requirements are satisfied, which correspond to the times at which income to the employee is recognized. When we withhold these common shares, we are required to remit to the appropriate taxing authorities the fair value of the shares withheld as of the vesting date. During 2017, 2016 and 2015, 56,495, 36,055 and 37,009 common shares, respectively, were withheld and canceled for this purpose. The withholding of common shares by us could be deemed a purchase of the common shares.
69
KAISER ALUMINUM CORPORATION AND SUBSIDIARY COMPANIES
NOTES TO CONSOLIDATED FINANCIAL STATEMENTS
7. Derivatives, Hedging Programs and Other Financial Instruments
Overview. In conducting our business, we enter into derivative transactions, including forward contracts and options, to limit our exposure to: (i) metal price risk related to our sale of fabricated aluminum products and the purchase of metal used as raw material for our fabrication operations; (ii) energy price risk relating to fluctuating prices of natural gas and electricity used in our production processes; and (iii) foreign currency requirements with respect to our foreign subsidiaries and cash commitments for equipment purchases denominated in foreign currency.
Our derivative activities are overseen by a hedging committee ("Hedging Committee"), which is composed of our chief executive officer, chief operating officer, chief financial officer, chief accounting officer, treasurer and other officers and employees selected by the chief executive officer. The Hedging Committee meets regularly to review commodity price exposure, derivative positions and strategy. Management reviews the scope of the Hedging Committee's activities with our Board of Directors.
We are exposed to counterparty credit risk on all of our derivative instruments, which we manage by monitoring the credit quality of our counterparties and allocating our hedging positions among multiple counterparties to limit exposure to any single entity. Our counterparties are major investment grade financial institutions or trading companies. Hedging transactions are governed by negotiated reciprocal credit lines, which generally require collateral to be posted above specified credit thresholds. We believe the risk of loss is remote and contained due to counterparty credit quality, our diversification practice and collateral requirements.
In a majority of our hedging counterparty agreements, our counterparty offers us a credit line that adjusts up or down, depending on our liquidity. Below specified liquidity thresholds, we may have to post collateral if the fair value of our net liability with such counterparty exceeds our reduced credit line. We manage this risk by allocating hedging transactions among multiple counterparties, using options as part of our hedging activities or both. The aggregate fair value of our derivative instruments that were in a net liability position was insignificant at both December 31, 2017 and December 31, 2016, and we had no collateral posted as of those dates.
Additionally, our firm-price customer sales commitments create incremental customer credit risk related to metal price movements. Under certain circumstances, we mitigate this risk by periodically requiring cash collateral from them, which we classify as deferred revenue and include as a component of Other accrued liabilities. At December 31, 2017, we had no cash collateral posted from any of our customers. For more information about concentration risks concerning customers and suppliers, see Note 15.
Notional Amount of Derivative Contracts. The following table summarizes our derivative positions at December 31, 2017:
Aluminum | Maturity Period (month/year) | Notional Amount of contracts (mmlbs) | |||
Fixed price purchase contracts | 1/18 through 12/21 | 165.3 | |||
Fixed price sales contracts | 5/18 through 11/19 | 1.4 | |||
Midwest premium swap contracts1 | 1/18 through 12/21 | 163.9 | |||
Alloying Metals | Maturity Period (month/year) | Notional Amount of contracts (mmlbs) | |||
Fixed price purchase contracts | 1/18 through 6/18 | 2.7 | |||
Natural Gas2 | Maturity Period (month/year) | Notional Amount of contracts (mmbtu) | |||
Fixed price purchase contracts | 1/18 through 12/20 | 3,600,000 | |||
70
KAISER ALUMINUM CORPORATION AND SUBSIDIARY COMPANIES
NOTES TO CONSOLIDATED FINANCIAL STATEMENTS
Electricity3 | Maturity Period (month/year) | Notional Amount of contracts (Mwh) | |||
Fixed price purchase contracts | 1/20 through 12/20 | 131,760 | |||
Euro | Maturity Period (month/year) | Notional Amount of contracts (euro) | |||
Fixed price purchase contracts | 1/18 through 4/18 | 301,304 | |||
_________________________
1. | Regional premiums represent the premium over the London Metal Exchange price for primary aluminum which is incurred on our purchases of primary aluminum. |
2. | As of December 31, 2017, we had derivative and/or physical delivery commitments with energy companies in place to cover exposure to fluctuations in prices for approximately 70% of the expected natural gas purchases for both 2018 and 2019, and 55% of the expected natural gas purchases for 2020. |
3. | As of December 31, 2017, we had derivative and/or physical delivery commitments with energy companies in place to cover exposure to fluctuations in prices for approximately 55% of the expected electricity purchases for both 2018 and 2019, and 46% of the expected electricity purchases for 2020. |
Non-Designated Hedges of Operational Risks. Our pricing of fabricated aluminum products is generally intended to lock in a conversion margin (representing the value added from the fabrication process(es)) and to pass through metal price fluctuations to our customers. For some of our higher value added products sold on a spot basis, the pass through of metal price movements can sometimes lag by as much as several months, with a favorable impact to us when metal prices decline and an adverse impact to us when metal prices increase. Additionally, in certain instances, we enter into firm-price arrangements with our customers for stipulated volumes to be delivered in the future. Because we generally purchase primary and secondary aluminum on a floating price basis, the lag in passing through metal price movements to customers on some of our higher value added products sold on a spot basis and the volume that we have committed to sell to our customers under a firm-price arrangement create metal price risk for us. We use third-party hedging instruments to limit exposure to metal price risk related to the metal pass through lag on some of our products and firm-price customer sales contracts.
We are exposed to risk of fluctuating prices for natural gas and electricity. We, from time to time, in the ordinary course of business, enter into hedging transactions and/or physical delivery commitments with third parties to mitigate our risk from fluctuations in natural gas and electricity prices.
We are also exposed to foreign currency exchange risk related to firm-price agreements for equipment purchases from foreign manufacturers. We use foreign currency forward contracts designed to line up with the timing and amounts of scheduled payments to the foreign equipment manufacturers to mitigate our exposure to currency exchange rate fluctuations on these purchases. Realized and unrealized periodic gains and losses of non-designated foreign currency forward contracts are reflected as a reduction or increase in Other income (expense), net.
Designated Alloying Metal Hedges. We enter into agreements with suppliers to purchase alloying metals (zinc and copper) used as raw materials in our fabrication operations at fluctuating prices that we are unable to pass along to our customers. We mitigate our exposure to metal price risk by entering into Alloy Hedges with third-party financial institutions at predetermined/fixed prices at stated delivery dates. Our Alloy Hedges are expected to be highly effective because monthly settlements correspond to forecasted physical purchases of alloying metals by our manufacturing facilities. The effective portion of the fair value on these Alloy Hedges is recorded within Other comprehensive income, net of tax, and is reclassified into the Statements of Consolidated Income (Loss) during the month of settlement to Cost of products sold (see Note 10). As of December 31, 2017, we estimate the net gain of $0.5 million will be reclassified from Accumulated other comprehensive income into Net income within the next 6 months. We incurred no ineffectiveness on these hedges during 2017.
71
KAISER ALUMINUM CORPORATION AND SUBSIDIARY COMPANIES
NOTES TO CONSOLIDATED FINANCIAL STATEMENTS
Realized and Unrealized Gain (Loss). Realized and unrealized gain (loss) included on the Statements of Consolidated Income (Loss) associated with all derivative contracts consisted of the following for each period presented (in millions of dollars):
Year Ended December 31, | ||||||||||||
2017 | 2016 | 2015 | ||||||||||
Realized (gain) loss: | ||||||||||||
Aluminum | $ | (20.4 | ) | $ | 2.0 | $ | 27.3 | |||||
Natural gas | 0.7 | 5.0 | 5.4 | |||||||||
Alloy Hedges | (0.9 | ) | — | — | ||||||||
Foreign currency | (0.1 | ) | 0.1 | — | ||||||||
Electricity | — | — | 1.9 | |||||||||
Total realized (gain) loss1 | $ | (20.7 | ) | $ | 7.1 | $ | 34.6 | |||||
Unrealized (gain) loss: | ||||||||||||
Aluminum | $ | (20.9 | ) | $ | (10.8 | ) | $ | 4.6 | ||||
Natural gas | 1.4 | (7.9 | ) | 0.5 | ||||||||
Electricity | 0.1 | — | (1.7 | ) | ||||||||
Total unrealized (gain) loss2 | $ | (19.4 | ) | $ | (18.7 | ) | $ | 3.4 | ||||
______________________
1. | Recorded within Cost of products sold, excluding depreciation, amortization and other items within the Fabricated Products segment. |
2. | Recorded within Unrealized (gain) loss on derivative instruments within the Fabricated Products segment. |
Fair Values of Derivative Contracts. The fair values of our derivative contracts are based upon trades in liquid markets. Valuation model inputs can be verified, and valuation techniques do not involve significant judgment. The fair values of such financial instruments are classified within Level 2 of the fair value hierarchy.
72
KAISER ALUMINUM CORPORATION AND SUBSIDIARY COMPANIES
NOTES TO CONSOLIDATED FINANCIAL STATEMENTS
The following table presents our financial instruments, classified under the appropriate level of the fair value hierarchy, as of the period presented (in millions of dollars):
December 31, 2017 | |||||||||||||||
Level 1 | Level 2 | Level 3 | Total | ||||||||||||
DERIVATIVE ASSETS: | |||||||||||||||
Non-Designated Hedges: | |||||||||||||||
Aluminum – | |||||||||||||||
Fixed price purchase contracts | $ | — | $ | 22.5 | $ | — | $ | 22.5 | |||||||
Midwest premium swap contracts | — | 1.7 | — | 1.7 | |||||||||||
Natural gas – Fixed price purchase contracts | — | 0.2 | — | 0.2 | |||||||||||
Designated Hedges: | |||||||||||||||
Alloying metals – Fixed price purchase contracts | — | 0.9 | — | 0.9 | |||||||||||
Total derivative assets1 | $ | — | $ | 25.3 | $ | — | $ | 25.3 | |||||||
DERIVATIVE LIABILITIES: | |||||||||||||||
Non-Designated Hedges: | |||||||||||||||
Aluminum – | |||||||||||||||
Fixed price sales contracts | $ | — | $ | (0.1 | ) | $ | — | $ | (0.1 | ) | |||||
Midwest premium swap contracts | — | (0.1 | ) | — | (0.1 | ) | |||||||||
Natural gas – Fixed price purchase contracts | — | (0.5 | ) | — | (0.5 | ) | |||||||||
Electricity – Fixed price purchase contracts | — | (0.1 | ) | — | (0.1 | ) | |||||||||
Designated Hedges: | |||||||||||||||
Alloying metals – Fixed price purchase contracts | — | — | — | — | |||||||||||
Total derivative liabilities2 | $ | — | $ | (0.8 | ) | $ | — | $ | (0.8 | ) | |||||
______________________
1. | Of the $25.3 million in total derivative assets, $18.9 million and $6.4 million were recorded within Prepaid expenses and other current assets and Other assets, respectively. |
2. | Of the $0.8 million in total derivative liabilities, $0.3 million and $0.5 million were recorded within Other accrued liabilities and Long-term liabilities, respectively. |
73
KAISER ALUMINUM CORPORATION AND SUBSIDIARY COMPANIES
NOTES TO CONSOLIDATED FINANCIAL STATEMENTS
The following table presents our financial instruments, classified under the appropriate level of the fair value hierarchy, as of the period presented (in millions of dollars):
December 31, 2016 | |||||||||||||||
Level 1 | Level 2 | Level 3 | Total | ||||||||||||
DERIVATIVE ASSETS: | |||||||||||||||
Non-Designated Hedges: | |||||||||||||||
Aluminum – | |||||||||||||||
Fixed price purchase contracts | $ | — | $ | 3.3 | $ | — | $ | 3.3 | |||||||
Midwest premium swap contracts | — | 0.9 | — | 0.9 | |||||||||||
Natural gas – Fixed price purchase contracts | — | 1.6 | — | 1.6 | |||||||||||
Total derivative assets1 | $ | — | $ | 5.8 | $ | — | $ | 5.8 | |||||||
DERIVATIVE LIABILITIES: | |||||||||||||||
Non-Designated Hedges: | |||||||||||||||
Aluminum – | |||||||||||||||
Fixed price purchase contracts | $ | — | $ | (1.1 | ) | $ | — | $ | (1.1 | ) | |||||
Midwest premium swap contracts | — | (0.2 | ) | — | (0.2 | ) | |||||||||
Natural gas – Fixed price purchase contracts | — | (0.4 | ) | — | (0.4 | ) | |||||||||
Designated Hedges: | |||||||||||||||
Alloying Metals – Fixed price purchase contracts | — | (0.1 | ) | — | (0.1 | ) | |||||||||
Total derivative liabilities2 | $ | — | $ | (1.8 | ) | $ | — | $ | (1.8 | ) | |||||
______________________
1. | Of the $5.8 million in total derivative assets, $5.0 million and $0.8 million were recorded within Prepaid expenses and other current assets and Other assets, respectively. |
2. | Of the $1.8 million in total derivative liabilities, $0.8 million and $1.0 million were recorded within Other accrued liabilities and Long-term liabilities, respectively. |
The aggregate fair value of our derivatives recorded on the Consolidated Balance Sheets at December 31, 2017 and December 31, 2016 was a net asset of $24.5 million and net asset of $4.0 million, respectively. The increase in the net asset position during 2017 was primarily due to changes in the underlying commodity and energy prices, as well as settlement of liability positions during the period. Changes in the fair value of our derivative contracts relating to non-designated hedges of operational activities are reflected in Operating income (loss).
Offsetting Information. We enter into derivative contracts with counterparties, some of which are subject to enforceable master netting arrangements and some of which are not. We reflect the fair value of our derivative contracts on a gross basis on the Consolidated Balance Sheets.
74
KAISER ALUMINUM CORPORATION AND SUBSIDIARY COMPANIES
NOTES TO CONSOLIDATED FINANCIAL STATEMENTS
The following tables present offsetting information regarding our derivatives by type of counterparty as of December 31, 2017 (in millions of dollars):
Gross Amounts of Recognized Assets | Gross Amounts Offset in the Consolidated Balance Sheets | Net Amounts of Assets Presented in the Consolidated Balance Sheets | Gross Amounts Not Offset in the Consolidated Balance Sheets | ||||||||||||||||
Net Amount | |||||||||||||||||||
Counterparty (with netting agreements) | $ | 25.3 | $ | — | $ | 25.3 | $ | 0.8 | $ | 24.5 | |||||||||
Total | $ | 25.3 | $ | — | $ | 25.3 | $ | 0.8 | $ | 24.5 | |||||||||
Gross Amounts of Recognized Liabilities | Gross Amounts Offset in the Consolidated Balance Sheets | Net Amounts of Liabilities Presented in the Consolidated Balance Sheets | Gross Amounts Not Offset in the Consolidated Balance Sheets | ||||||||||||||||
Net Amount | |||||||||||||||||||
Counterparty (with netting agreements) | $ | (0.8 | ) | $ | — | $ | (0.8 | ) | $ | (0.8 | ) | $ | — | ||||||
Total | $ | (0.8 | ) | $ | — | $ | (0.8 | ) | $ | (0.8 | ) | $ | — | ||||||
The following tables present offsetting information regarding our derivatives by type of counterparty as of December 31, 2016 (in millions of dollars):
Gross Amounts of Recognized Assets | Gross Amounts Offset in the Consolidated Balance Sheets | Net Amounts of Assets Presented in the Consolidated Balance Sheets | Gross Amounts Not Offset in the Consolidated Balance Sheets | ||||||||||||||||
Net Amount | |||||||||||||||||||
Counterparty (with netting agreements) | $ | 3.3 | $ | — | $ | 3.3 | $ | 1.0 | $ | 2.3 | |||||||||
Counterparty (with partial netting agreements) | 2.5 | — | 2.5 | 0.7 | 1.8 | ||||||||||||||
Total | $ | 5.8 | $ | — | $ | 5.8 | $ | 1.7 | $ | 4.1 | |||||||||
Gross Amounts of Recognized Liabilities | Gross Amounts Offset in the Consolidated Balance Sheets | Net Amounts of Liabilities Presented in the Consolidated Balance Sheets | Gross Amounts Not Offset in the Consolidated Balance Sheets | ||||||||||||||||
Net Amount | |||||||||||||||||||
Counterparty (with netting agreements) | $ | (1.0 | ) | $ | — | $ | (1.0 | ) | $ | (1.0 | ) | $ | — | ||||||
Counterparty (with partial netting agreements) | (0.8 | ) | — | (0.8 | ) | (0.7 | ) | (0.1 | ) | ||||||||||
Total | $ | (1.8 | ) | $ | — | $ | (1.8 | ) | $ | (1.7 | ) | $ | (0.1 | ) | |||||
75
KAISER ALUMINUM CORPORATION AND SUBSIDIARY COMPANIES
NOTES TO CONSOLIDATED FINANCIAL STATEMENTS
Fair Value of Other Financial Instruments
Available for Sale Securities. We hold debt investment securities that are accounted for as available for sale securities. The fair value of the debt investment securities, which consist of commercial paper, is determined based on valuation models that use observable market data. At December 31, 2017, all of our short-term investments had maturity dates within 8 months. We review our debt investment portfolio for other-than-temporary impairment at least quarterly or when there are changes in credit risk or other potential valuation concerns. At December 31, 2017 and December 31, 2016, the total unrealized loss, net of tax, included in Accumulated other comprehensive loss was immaterial and was not other-than-temporarily impaired. We believe that it is probable that the principal and interest will be collected in accordance with the contractual terms, and that the unrealized loss on these securities was due to normal market fluctuations, and not due to increased credit risk or other valuation concerns. The fair value input of our available for sale securities, which are classified within Level 2 of the fair value hierarchy, is calculated based on broker quotes. The amortized cost for available for sale securities approximates their fair value.
All Other Financial Assets and Liabilities. We believe that the fair value of our cash and cash equivalents, accounts receivable, accounts payable and accrued liabilities approximate their respective carrying values due to their short maturities and nominal credit risk. See Note 2 for components of cash and cash equivalents.
The following table presents our other financial assets, classified under the appropriate level of the fair value hierarchy, as of December 31, 2017 (in millions of dollars):
Level 1 | Level 2 | Level 3 | Total | ||||||||||||
Cash and cash equivalents | $ | 23.5 | $ | 27.6 | $ | — | $ | 51.1 | |||||||
Short-term investments | — | 183.7 | — | 183.7 | |||||||||||
Total | $ | 23.5 | $ | 211.3 | $ | — | $ | 234.8 | |||||||
The following table presents our other financial assets, classified under the appropriate level of the fair value hierarchy, as of December 31, 2016 (in millions of dollars):
Level 1 | Level 2 | Level 3 | Total | ||||||||||||
Cash and cash equivalents | $ | 37.9 | $ | 17.3 | $ | — | $ | 55.2 | |||||||
Short-term investments | — | 231.0 | — | 231.0 | |||||||||||
Total | $ | 37.9 | $ | 248.3 | $ | — | $ | 286.2 | |||||||
8. Debt and Credit Facility
Senior Notes
5.875% Senior Notes. In May 2016, we issued $375.0 million principal amount of 5.875% unsecured senior notes due May 15, 2024 ("5.875% Senior Notes") at 100% of the principal amount. The unamortized amount of debt issuance costs as of December 31, 2017 and December 31, 2016 was $5.4 million and $6.3 million, respectively. Interest expense, including amortization of debt issuance costs, relating to the 5.875% Senior Notes was $22.9 million and $14.5 million for the year ended December 31, 2017 and December 31, 2016, respectively. A portion of the interest relating to the 5.875% Senior Notes was capitalized as construction in progress. The effective interest rate of the 5.875% Senior Notes is approximately 6.1% per annum, taking into account the amortization of debt issuance costs.
All outstanding 5.875% Senior Notes are registered and freely transferable. The fair value of the outstanding 5.875% Senior Notes, which are Level 1 liabilities, was approximately $399.9 million and $390.8 million at December 31, 2017 and December 31, 2016, respectively.
The 5.875% Senior Notes are unsecured obligations and are guaranteed by certain of our domestic subsidiaries that own virtually all of our operating assets and through which we conduct the vast majority of our business. See Note 16 for condensed guarantor and non-guarantor financial information.
The indenture governing the 5.875% Senior Notes places limitations on our ability to, among other things: (i) incur liens; (ii) consolidate, merge or sell all or substantially all of our and certain of our subsidiaries' assets; (iii) incur or guarantee additional indebtedness; (iv) enter into transactions with affiliates; and (v) make "restricted payments" (as defined in the
76
KAISER ALUMINUM CORPORATION AND SUBSIDIARY COMPANIES
NOTES TO CONSOLIDATED FINANCIAL STATEMENTS
indenture to include certain loans, investments, dividend payments, share repurchases and prepayments and redemptions and repurchases of certain indebtedness). Many of these limitations also apply to certain of our subsidiaries. Additionally, the indenture limits the ability of certain of our subsidiaries to be subject to consensual restrictions on paying dividends to us, making loans to us, repaying indebtedness owed to us, or transferring assets to us. Certain types and amounts of restricted payments are allowed by various provisions of the indenture. In particular, the indenture provisions permit us to make restricted payments in any amount if, after giving effect to such restricted payments, our "consolidated net indebtedness" as a ratio of "EBITDA" (each term as defined in the indenture) is less than 2.75:1.00.
We may redeem the 5.875% Senior Notes at our option in whole or part at any time on or after May 15, 2019 at a redemption price of 104.406% of the principal amount, declining to 102.938%, 101.469% and 100% of the principal amount on or after May 15, 2020, May 15, 2021 and May 15, 2022, respectively, in each case plus any accrued and unpaid interest. At any time prior to May 15, 2019, we may also redeem some or all of the 5.875% Senior Notes at a redemption price equal to 100% of the principal amount, together with any accrued and unpaid interest, plus a "make-whole premium."
Holders of the 5.875% Senior Notes have the right to require us to repurchase the 5.875% Senior Notes at a price equal to 101% of the principal amount plus any accrued and unpaid interest following the occurrence of both: (i) a change of control and (ii) a ratings decline by one or both of the two major rating agencies within 60 days after the earlier of a change of control or the public notice of an upcoming change of control. A change of control includes: (i) certain ownership changes; (ii) certain recapitalizations, mergers and dispositions; (iii) certain changes in the composition of our Board of Directors; and (iv) stockholder approval of any plan or proposal for the liquidation or dissolution of us. We may also be required to offer to repurchase the 5.875% Senior Notes at 100% of the principal amount, plus any accrued and unpaid interest, with the proceeds of certain asset sales.
8.25% Senior Notes. In May 2012, we issued $225.0 million principal amount of 8.25% unsecured senior notes due June 1, 2020 ("8.25% Senior Notes"), of which $197.8 million principal amount remained outstanding at December 31, 2015. On June 1, 2016, we redeemed in full all remaining 8.25% Senior Notes at a redemption price of 104.125% of the principal amount. Interest expense, including amortization of debt issuance costs, relating to the 8.25% Senior Notes was $7.1 million and $18.8 million for 2016 and 2015, respectively. A portion of the interest relating to the 8.25% Senior Notes was capitalized as construction in progress.
Cash Convertible Senior Notes
On April 1, 2015, we settled our 4.5% unsecured cash convertible senior notes ("Convertible Notes"). The net cash outflow was $178.9 million, reflecting principal of $175.0 million and the final coupon payment of $3.9 million. We also paid a conversion premium of $94.9 million to holders of the Convertible Notes, which was completely offset by settlement proceeds of a hedge that we entered into in connection with the issuance of our Convertible Notes.
The effective interest rate for the term of the Convertible Notes was approximately 11%, taking into account the amortization of the original issuance discount and debt issuance costs. The following table provides additional information regarding the Convertible Notes (in millions of dollars):
Year Ended December 31, | |||
2015 | |||
Contractual coupon interest | $ | 2.0 | |
Amortization of discount | 2.4 | ||
Amortization of debt issuance costs | 0.3 | ||
Total interest expense1 | $ | 4.7 | |
_______________
1. | A portion of the interest relating to the Convertible Notes was capitalized as construction in progress. |
77
KAISER ALUMINUM CORPORATION AND SUBSIDIARY COMPANIES
NOTES TO CONSOLIDATED FINANCIAL STATEMENTS
Revolving Credit Facility
Our credit agreement with JPMorgan Chase Bank, N.A., as administrative agent, and the other financial institutions party thereto ("Revolving Credit Facility") provides us with a $300.0 million funding commitment through December 1, 2020. Joining the Company as borrowers ("Co-Borrowers") are three of our wholly-owned domestic operating subsidiaries: Kaiser Aluminum Investments Company, Kaiser Aluminum Fabricated Products, LLC and Kaiser Aluminum Washington, LLC.
The Revolving Credit Facility is secured by a first priority lien on substantially all of the accounts receivable, inventory and certain other related assets and proceeds of the Co-Borrowers, as well as certain machinery and equipment. Under the Revolving Credit Facility, we are able to borrow from time to time an aggregate commitment amount equal to the lesser of $300.0 million and a borrowing base comprised of: (i) 85% of eligible accounts receivable; (ii) the lesser of (a) 75% of eligible inventory and (b) 85% of the net orderly liquidation value of eligible inventory as determined in the most recent inventory appraisal ordered by the administrative agent; and (iii) certain eligible machinery and equipment supporting up to $60.0 million of borrowing availability, reduced by certain reserves, all as specified in the Revolving Credit Facility. Up to a maximum of $20.0 million of availability under the Revolving Credit Facility may be utilized for letters of credit.
Borrowings under the Revolving Credit Facility bear interest at a rate equal to either a base prime rate or LIBOR, at our option, plus, in each case, a specified variable percentage determined by reference to the then-remaining borrowing availability under the Revolving Credit Facility. The funding commitment of the Revolving Credit Facility may be increased up to $400.0 million, subject to certain conditions and the agreement of lenders thereunder.
We had $300.0 million of total borrowing availability under the Revolving Credit Facility at December 31, 2017, based on the borrowing base determination then in effect. At December 31, 2017, there were no borrowings under the Revolving Credit Facility and $8.1 million was used to support outstanding letters of credit, leaving $291.9 million of net borrowing availability. The interest rate applicable to any overnight borrowings under the Revolving Credit Facility would have been 4.75% at December 31, 2017.
Amounts owed under the Revolving Credit Facility may be accelerated upon the occurrence of various events of default including, without limitation, the failure to make principal or interest payments when due and breaches of covenants, representations and warranties set forth therein. The Revolving Credit Facility places limitations on our ability and certain of our subsidiaries to, among other things, grant liens, engage in mergers, sell assets, incur debt, enter into sale and leaseback transactions, make investments, undertake transactions with affiliates, prepay certain debt, pay dividends and repurchase shares. We are allowed to prepay debt, pay dividends and repurchase shares in any amount if, after giving effect to such payment, $52.5 million or more would be available for us to borrow under the Revolving Credit Facility, or if after giving effect to such payment, $45.0 million or more would be available to us to borrow under the Revolving Credit Facility and we maintain a fixed charge coverage ratio at or above 1.15:1.0. In addition, we are required to maintain a fixed charge coverage ratio on a consolidated basis at or above 1.0:1.0 if borrowing availability under the Revolving Credit Facility is less than $30.0 million.
9. Commitments and Contingencies
Commitments. We have a variety of financial commitments, including purchase agreements, forward foreign exchange and forward sales contracts, indebtedness and letters of credit (see Note 7 and Note 8).
Rental expenses were $7.9 million, $8.5 million and $8.2 million for 2017, 2016 and 2015, respectively. There are renewal options in various operating leases subject to certain terms and conditions. Minimum rental commitments under operating leases at December 31, 2017 were as follows (in millions of dollars):
Year Ended December 31, | ||||||||||||||||||||||||
2018 | 2019 | 2020 | 2021 | 2022 | 2023 and Thereafter | |||||||||||||||||||
Minimum rental commitments | $ | 5.7 | $ | 5.2 | $ | 3.1 | $ | 2.5 | $ | 2.2 | $ | 21.0 | ||||||||||||
CAROs. The inputs in estimating the fair value of CAROs include: (i) the timing of when any such CARO cash flows may be incurred; (ii) incremental costs associated with special handling or treatment of CARO materials; and (iii) the credit-adjusted risk-free rate applicable at the time additional CARO cash flows are estimated; all of which are considered Level 3 inputs as they involve significant judgment from us.
78
KAISER ALUMINUM CORPORATION AND SUBSIDIARY COMPANIES
NOTES TO CONSOLIDATED FINANCIAL STATEMENTS
The following table summarizes the activity relating to our CARO liabilities (in millions of dollars):
Year Ended December 31, | ||||||||||||
2017 | 2016 | 2015 | ||||||||||
Beginning balance | $ | 5.5 | $ | 4.9 | $ | 4.8 | ||||||
Liabilities incurred during the period | — | — | — | |||||||||
Liabilities settled during the period | — | (0.1 | ) | (0.2 | ) | |||||||
Accretion expense | 0.4 | 0.5 | 0.3 | |||||||||
Adjustment to accretion expense due to revisions to estimated cash flow and timing of expenditure1 | — | 0.2 | — | |||||||||
Ending balance | $ | 5.9 | $ | 5.5 | $ | 4.9 | ||||||
__________________________________________
1. | The adjustments in 2016 had a de minimis impact on the basic and diluted net income per share for 2016. |
The estimated fair value of CARO liabilities at December 31, 2017 and December 31, 2016 were based upon the application of a weighted-average credit-adjusted risk-free rate of 8.7% and 8.6%, respectively. CAROs are included in Other accrued liabilities or Long-term liabilities, as appropriate.
Environmental Contingencies. We are subject to a number of environmental laws and regulations, to potential fines or penalties assessed for alleged breaches of such laws and regulations and to potential claims based upon such laws and regulations. We are also subject to legacy environmental contingencies related to activities that occurred at operating facilities within Fabricated Products prior to July 6, 2006 while such operating facilities were being operated by a predecessor, which represent the majority of our environmental accruals. The status of these environmental contingencies are discussed below. We have established procedures for regularly evaluating environmental loss contingencies. Our environmental accruals represent our undiscounted estimate of costs reasonably expected to be incurred based on presently enacted laws and regulations, existing requirements, currently available facts, existing technology and our assessment of the likely remediation actions to be taken.
We continue to pursue remediation activities, primarily to address the historical use of oils containing polychlorinated biphenyls ("PCBs") at our Trentwood facility. Our remediation efforts are in collaboration with the Washington State Department of Ecology ("Washington State Ecology"), to which we submitted a feasibility study in 2012 of remediation alternatives and from which we received permission to begin certain remediation activities pursuant to a signed work order. As we have finished a number of sections of the work plan, we have received approval from Washington State Ecology on satisfactory completion of those sections. Additionally, in cooperation with Washington State Ecology, to determine the treatability and evaluate the feasibility of removing PCBs from ground water under the Trentwood facility, we constructed a pilot test facility and began treatment operations at the test facility in the first half of 2016. As the success of the new methodology cannot be reasonably determined at this time, it is possible we may need to make upward adjustments to our related accruals as facts and cost estimates regarding the groundwater treatment method and the operation of the treatment facility become available.
During 2013, at the request of the Ohio Environmental Protection Agency ("OEPA"), we initiated an investigational study of our Newark facility related to historical on-site waste disposal. Since 2014, we have completed a number of preliminary steps in the preparation of completing the final risk assessment and feasibility study, both of which are subject to review and approval by the OEPA. As work continues and progresses to a final risk assessment and feasibility study, we will establish and update estimates for probable and estimable remediation, if any. The actual and final cost for remediation will not be fully determinable until a final feasibility study is submitted and accepted by the OEPA and work plans are prepared, which is expected to occur in the next 18 to 24 months.
79
KAISER ALUMINUM CORPORATION AND SUBSIDIARY COMPANIES
NOTES TO CONSOLIDATED FINANCIAL STATEMENTS
The following table presents the changes in our environmental accrual, which was primarily included in Long-term liabilities (in millions of dollars):
Year Ended December 31, | ||||||||||||
2017 | 2016 | 2015 | ||||||||||
Beginning balance | $ | 17.2 | $ | 18.6 | $ | 19.3 | ||||||
Additional accruals | 0.3 | 0.1 | 1.3 | |||||||||
Less: expenditures | (0.9 | ) | (1.5 | ) | (2.0 | ) | ||||||
Ending balance | $ | 16.6 | $ | 17.2 | $ | 18.6 | ||||||
At December 31, 2017, our environmental accrual of $16.6 million represented our estimate of the incremental remediation cost based on: (i) proposed alternatives in the final feasibility study related to the Trentwood facility; (ii) currently available facts with respect to our Newark facility; and (iii) facts related to certain other locations owned or formerly owned by us. In accordance with approved and proposed remediation action plans, we expect that the implementation and ongoing monitoring could occur over a period of 30 or more years.
As additional facts are developed, feasibility studies are completed, draft remediation plans are modified, necessary regulatory approvals for the implementation of remediation are obtained, alternative technologies are developed and/or other factors change, there may be revisions to management’s estimates and actual costs may exceed the current environmental accruals. We believe at this time that it is reasonably possible that undiscounted costs associated with these environmental matters may exceed current accruals by amounts that could be, in the aggregate, up to an estimated $12.5 million over the remediation period. It is reasonably possible that our recorded estimate will change in the next 12 months.
Other Contingencies. We are party to various lawsuits, claims, investigations and administrative proceedings that arise in connection with past and current operations. We evaluate such matters on a case-by-case basis and our policy is to vigorously contest any such claims we believe are without merit. We accrue for a legal liability when it is both probable that a liability has been incurred and the amount of the loss is reasonably estimable. Quarterly, in addition to when changes in facts and circumstances require it, we review and adjust these accruals to reflect the impacts of negotiations, settlements, rulings, advice of legal counsel and other information and events pertaining to a particular case. While uncertainties are inherent in the final outcome of such matters and it is presently impossible to determine the actual cost that may ultimately be incurred, we believe that we have sufficiently accrued for such matters and that the ultimate resolution of pending matters will not have a material impact on our consolidated financial position, operating results or liquidity.
80
KAISER ALUMINUM CORPORATION AND SUBSIDIARY COMPANIES
NOTES TO CONSOLIDATED FINANCIAL STATEMENTS
10. Accumulated Other Comprehensive (Loss) Income
The following table presents the changes in the accumulated balances for each component of Accumulated other comprehensive (loss) income ("AOCI") for each period presented (in millions of dollars):
Year Ended December 31, | ||||||||||||
2017 | 2016 | 2015 | ||||||||||
Defined benefit pension plan and VEBAs: | ||||||||||||
Beginning balance | $ | (37.1 | ) | $ | (31.3 | ) | $ | (96.4 | ) | |||
Actuarial loss arising during the period | (0.3 | ) | (5.7 | ) | (12.9 | ) | ||||||
Less: income tax benefit | 0.1 | 2.1 | 4.9 | |||||||||
Net actuarial loss arising during the period | (0.2 | ) | (3.6 | ) | (8.0 | ) | ||||||
Prior service (cost) credit arising during the period | (7.3 | ) | (8.3 | ) | 6.8 | |||||||
Less: income tax benefit (expense) | 2.7 | 3.1 | (2.6 | ) | ||||||||
Net prior service (cost) credit arising during the period | (4.6 | ) | (5.2 | ) | 4.2 | |||||||
Amortization of net actuarial loss1 | 0.9 | 0.5 | 1.1 | |||||||||
Amortization of prior service cost1 | 4.7 | 4.1 | 3.0 | |||||||||
Removal of obligation relating to Union VEBA | — | — | 106.6 | |||||||||
Less: income tax expense2 | (2.1 | ) | (1.7 | ) | (41.8 | ) | ||||||
Net amortization and reclassification from AOCI to Net income (loss) | 3.5 | 2.9 | 68.9 | |||||||||
Translation impact on Canadian pension plan AOCI balance | (0.1 | ) | 0.1 | — | ||||||||
Other comprehensive (loss) income, net of tax | (1.4 | ) | (5.8 | ) | 65.1 | |||||||
Ending balance | $ | (38.5 | ) | $ | (37.1 | ) | $ | (31.3 | ) | |||
Available for sale securities: | ||||||||||||
Beginning balance | $ | 0.8 | $ | (0.1 | ) | $ | 0.2 | |||||
Unrealized gain (loss) on available for sale securities | 4.0 | 1.9 | (0.1 | ) | ||||||||
Less: income tax expense | (1.5 | ) | (0.7 | ) | — | |||||||
Net gain (loss) on available for sale securities | 2.5 | 1.2 | (0.1 | ) | ||||||||
Gain reclassified from AOCI to Net income (loss)3 | (3.2 | ) | (0.5 | ) | (0.4 | ) | ||||||
Less: income tax benefit2 | 1.2 | 0.2 | 0.2 | |||||||||
Net gain reclassified from AOCI to Net income (loss) | (2.0 | ) | (0.3 | ) | (0.2 | ) | ||||||
Other comprehensive income (loss), net of tax | 0.5 | 0.9 | (0.3 | ) | ||||||||
Ending balance | $ | 1.3 | $ | 0.8 | $ | (0.1 | ) | |||||
Other: | ||||||||||||
Beginning balance | $ | (0.4 | ) | $ | (0.3 | ) | $ | 0.1 | ||||
Unrealized gain (loss) | 2.0 | (0.2 | ) | (0.5 | ) | |||||||
Less: income tax (expense) benefit | (0.7 | ) | — | 0.1 | ||||||||
Net gain (loss) | 1.3 | (0.2 | ) | (0.4 | ) | |||||||
(Gain) loss reclassified from AOCI to Net income (loss) | (0.6 | ) | 0.1 | — | ||||||||
Less: income tax benefit2 | 0.2 | — | — | |||||||||
Net (gain) loss reclassified from AOCI to Net income (loss) | (0.4 | ) | 0.1 | — | ||||||||
Other comprehensive income (loss), net of tax | 0.9 | (0.1 | ) | (0.4 | ) | |||||||
Ending balance | $ | 0.5 | $ | (0.4 | ) | $ | (0.3 | ) | ||||
Total AOCI ending balance | $ | (36.7 | ) | $ | (36.7 | ) | $ | (31.7 | ) | |||
81
KAISER ALUMINUM CORPORATION AND SUBSIDIARY COMPANIES
NOTES TO CONSOLIDATED FINANCIAL STATEMENTS
____________
1. | Amounts amortized out of AOCI relating to Salaried VEBA adjustments were included as a component of Net periodic postretirement benefit cost relating to Salaried VEBA. |
2. | Income tax amounts reclassified out of AOCI were included as a component of Income tax (provision) benefit. |
3. | Amounts reclassified out of AOCI relating to sales of available for sale securities were included as a component of Other income (expense), net. We use the specific identification method to determine the amount reclassified out of AOCI. |
11. Other Income (Expense), Net
Other income (expense), net consisted of the following for each period presented (in millions of dollars):
Year Ended December 31, | |||||||||||
2017 | 2016 | 2015 | |||||||||
Interest income | $ | 0.2 | $ | 0.1 | $ | 0.4 | |||||
Realized gain on investments | 3.4 | 0.8 | 0.8 | ||||||||
Loss on extinguishment of debt1 | — | (11.1 | ) | — | |||||||
All other, net | 0.9 | (0.1 | ) | (3.0 | ) | ||||||
Other income (expense), net | $ | 4.5 | $ | (10.3 | ) | $ | (1.8 | ) | |||
____________
1. | Represents the loss on extinguishment of our 8.25% Senior Notes during the year ended December 31, 2016 which includes an $8.2 million premium paid to redeem the notes and a $2.9 million write-off of unamortized debt issuance costs associated with the notes. |
12. Income Tax Matters
Tax (Provision) Benefit. Income (loss) before income taxes by geographic area was as follows (in millions of dollars):
Year Ended December 31, | |||||||||||
2017 | 2016 | 2015 | |||||||||
Domestic | $ | 127.9 | $ | 143.6 | $ | (373.6 | ) | ||||
Foreign | 5.1 | 3.6 | 1.8 | ||||||||
Income (loss) before income taxes | $ | 133.0 | $ | 147.2 | $ | (371.8 | ) | ||||
Income taxes are classified as either domestic or foreign, based on whether payment is made or due to the United States or a foreign country. Certain income classified as foreign is also subject to domestic income taxes.
82
KAISER ALUMINUM CORPORATION AND SUBSIDIARY COMPANIES
NOTES TO CONSOLIDATED FINANCIAL STATEMENTS
Income tax (provision) benefit consisted of (in millions of dollars):
Federal | Foreign | State | Total | ||||||||||||
2017 | |||||||||||||||
Current | $ | 3.1 | $ | (0.8 | ) | $ | (1.0 | ) | $ | 1.3 | |||||
Deferred | (82.0 | ) | (1.0 | ) | (5.7 | ) | (88.7 | ) | |||||||
Expense applied to increase Retained earnings/ Other comprehensive income (loss) | (0.1 | ) | (0.1 | ) | — | (0.2 | ) | ||||||||
Income tax provision | $ | (79.0 | ) | $ | (1.9 | ) | $ | (6.7 | ) | $ | (87.6 | ) | |||
2016 | |||||||||||||||
Current | $ | 2.7 | $ | 0.6 | $ | (1.5 | ) | $ | 1.8 | ||||||
Deferred | (47.8 | ) | (1.2 | ) | (4.7 | ) | (53.7 | ) | |||||||
Expense applied to increase Additional paid in capital/ Other comprehensive income (loss) | (3.2 | ) | (0.1 | ) | (0.3 | ) | (3.6 | ) | |||||||
Income tax provision | $ | (48.3 | ) | $ | (0.7 | ) | $ | (6.5 | ) | $ | (55.5 | ) | |||
2015 | |||||||||||||||
Current | $ | 0.7 | $ | 2.1 | $ | 0.4 | $ | 3.2 | |||||||
Deferred | 93.2 | (1.2 | ) | 1.8 | 93.8 | ||||||||||
Benefit applied to decrease Additional paid in capital/Other comprehensive income (loss) | 33.5 | 0.4 | 4.3 | 38.2 | |||||||||||
Income tax benefit | $ | 127.4 | $ | 1.3 | $ | 6.5 | $ | 135.2 | |||||||
A reconciliation between the (provision for) benefit from income taxes and the amount computed by applying the federal statutory income tax rate to Income (loss) before income taxes is as follows (in millions of dollars):
Year Ended December 31, | |||||||||||
2017 | 2016 | 2015 | |||||||||
Amount of federal income tax (provision) benefit based on the statutory rate | $ | (46.5 | ) | $ | (51.5 | ) | $ | 130.1 | |||
(Increase) decrease in federal valuation allowances | 0.5 | (0.3 | ) | (0.6 | ) | ||||||
Non-deductible compensation (expense) benefit | (2.3 | ) | 0.3 | (0.2 | ) | ||||||
Non-deductible (expense) | — | (0.3 | ) | (0.3 | ) | ||||||
State income tax (provision) benefit, net of federal benefit 1 | (4.3 | ) | (4.2 | ) | 4.2 | ||||||
Foreign income tax (expense) benefit | (0.1 | ) | 0.5 | 0.1 | |||||||
Foreign undistributed earnings | (5.9 | ) | — | — | |||||||
Expiration of statute of limitations | — | — | 1.7 | ||||||||
Tax rate change | (29.0 | ) | — | — | |||||||
Advance pricing agreement | — | — | (0.2 | ) | |||||||
Competent Authority settlement | — | — | 0.4 | ||||||||
Income tax (provision) benefit | $ | (87.6 | ) | $ | (55.5 | ) | $ | 135.2 | |||
___________________________
1. | State income taxes were $4.0 million in 2017, but were increased by a $2.5 million change in tax rates, and offset by a $2.2 million decrease in the valuation allowance relating to certain state net operating losses. The state income taxes were $4.1 million in 2016, but were offset by a $0.2 million decrease due to lower tax rates in various states and a $0.3 million increase in the valuation allowance relating to certain state net operating losses. The state income tax benefit was $10.3 million in 2015, but was offset by a $3.1 million increase due to state tax rate and state law changes and a $3.0 million increase relating to the expiration of certain state net operating losses. |
83
KAISER ALUMINUM CORPORATION AND SUBSIDIARY COMPANIES
NOTES TO CONSOLIDATED FINANCIAL STATEMENTS
Deferred Income Taxes. Deferred income taxes reflect the net tax effects of temporary differences between the carrying amounts of assets and liabilities for financial reporting purposes and amounts used for income tax purposes. The components of our net deferred income tax assets were as follows (in millions of dollars):
Year Ended December 31, | |||||||
2017 | 2016 | ||||||
Deferred income tax assets: | |||||||
Loss and credit carryforwards | $ | 98.7 | $ | 191.8 | |||
VEBAs (see Note 4) | 11.6 | 23.2 | |||||
Other assets | 21.0 | 39.8 | |||||
Inventory | 9.3 | — | |||||
Valuation allowances | (13.0 | ) | (15.7 | ) | |||
Total deferred income tax assets | 127.6 | 239.1 | |||||
Deferred income tax liabilities: | |||||||
Property, plant and equipment | (57.7 | ) | (82.7 | ) | |||
Undistributed foreign earnings | (2.2 | ) | — | ||||
Total deferred income tax liabilities | (59.9 | ) | (82.7 | ) | |||
Net deferred income tax assets 1 | $ | 67.7 | $ | 156.4 | |||
__________________________
1. | Of the total net deferred income tax assets of $67.7 million, $72.0 million was presented as Deferred tax assets, net and $4.3 million was presented as Deferred tax liabilities on the Consolidated Balance Sheet as of December 31, 2017. Of the total net deferred income tax assets of $156.4 million, $159.7 million was presented as Deferred tax assets, net and $3.3 million was presented as Deferred tax liabilities on the Consolidated Balance Sheet as of December 31, 2016. |
Tax Attributes. At December 31, 2017, we had $275.1 million of net operating loss ("NOL") carryforwards available to reduce future cash payments for federal income taxes in the United States. H.R.1, commonly referred to as the Tax Cut and Jobs Act ("Tax Act"), allows net operating losses generated prior to December 31, 2017 (including our NOL carryforwards) to be fully deducted against 100% of taxable income until fully utilized or expired (see "Tax Cuts and Jobs Act" below for further discussion of the Tax Act). Our NOL carryforwards expire periodically through 2030.
We also had $23.3 million of alternative minimum tax ("AMT") credit carryforwards available to offset regular federal income tax requirements. Since the corporate AMT has been repealed in the Tax Act for tax years beginning after December 31, 2017, our AMT credit carryforwards that have not yet been used are refundable in future years. We will use AMT credits to offset any regular income tax liability in years 2018 through 2020, with 50% of remaining AMT credits refunded in each of the 2018, 2019, and 2020 tax years and all remaining credits refunded in tax year 2021 (see "Tax Cuts and Jobs Act" below for further discussion of the Tax Act).
In assessing the realizability of deferred tax assets, management considers whether it is "more likely than not" that some portion or all of the deferred tax assets will not be realized. The ultimate realization of deferred tax assets is dependent upon the generation of future taxable income during the periods in which those temporary differences become deductible. Management considers taxable income in carryback years, the scheduled reversal of deferred tax liabilities, tax planning strategies and projected future taxable income in making this assessment. Due to uncertainties surrounding the realization of some of our deferred tax assets, primarily including state NOL carryforwards sustained during the prior years and expiring tax benefits, we have a valuation allowance against our deferred tax assets. When recognized, the tax benefits relating to any reversal of this valuation allowance will be recorded as a reduction of income tax expense. The (decrease) increase in the valuation allowance was $(2.7) million, $(5.5) million and $2.0 million in 2017, 2016 and 2015, respectively.
The decrease in the valuation allowance for 2017 was primarily due to the expiration of state NOL carryforwards and the related reversal of their valuation allowances and the utilization of capital losses. The decrease in the valuation allowance for 2016 was primarily due to the expiration of state NOL carryforwards and the related reversal of their valuation allowances. The increase in the valuation allowance in 2015 was primarily due to unutilized state NOL carryforwards and Federal Separate Return Limitation Year losses that were expected to expire.
84
KAISER ALUMINUM CORPORATION AND SUBSIDIARY COMPANIES
NOTES TO CONSOLIDATED FINANCIAL STATEMENTS
Other. We and our subsidiaries file income tax returns in the U.S. federal jurisdiction and various states and foreign jurisdictions.
Our tax returns for certain past years are still subject to examination by taxing authorities and the use of NOL carryforwards in future periods could trigger a review of attributes and other tax matters in years that are not otherwise subject to examination.
We have gross unrecognized benefits relating to uncertain tax positions. A reconciliation of changes in the gross unrecognized tax benefits is as follows (in millions of dollars):
Year Ended December 31, | ||||||||||||
2017 | 2016 | 2015 | ||||||||||
Gross unrecognized tax benefits at beginning of period | $ | 1.8 | $ | 1.7 | $ | 2.2 | ||||||
Gross increases for tax positions of prior years | — | 0.1 | 0.1 | |||||||||
Gross decreases for tax positions of prior years | (0.3 | ) | — | — | ||||||||
Gross decrease for tax positions relating to lapse of a statute of limitation | — | — | (0.6 | ) | ||||||||
Gross unrecognized tax benefits at end of period | $ | 1.5 | $ | 1.8 | $ | 1.7 | ||||||
If and when the $1.5 million, $1.8 million and $1.7 million of gross unrecognized tax benefits at December 31, 2017, December 31, 2016 and December 31, 2015, respectively, are recognized, $0.4 million, $0.7 million and $0.6 million will be reflected, respectively, in our income tax provision and thus affect the effective tax rate in future periods.
The change during 2017 was primarily due to a change in tax positions. The change in gross unrecognized tax benefits during 2016 was primarily due to a change in tax positions. The change in gross unrecognized tax benefits during 2015 was primarily due to the expiration of statutes.
In addition, we recognize interest and penalties related to unrecognized tax benefits in the income tax provision. We had $0.1 million and $0.2 million accrued for interest and penalties at December 31, 2017 and December 31, 2016, respectively. Of these amounts, none were considered current and, as such, were included in Long-term liabilities on the Consolidated Balance Sheets at December 31, 2017 and December 31, 2016. We recognized a decrease in interest and penalty of $0.1 million in our tax provision in 2017. There was no change to interest and penalty in 2016. We recognized decrease in interest and penalty of $1.2 million in our tax provision in 2015.
In connection with the gross unrecognized tax benefits (including interest and penalties) denominated in foreign currency, we incurred a foreign currency translation adjustment in 2015. During 2015, the foreign currency impact on such liabilities resulted in currency translation adjustments of $0.1 million, which increased Other comprehensive income.
We do not expect our gross unrecognized tax benefits to significantly change within the next 12 months.
Tax Cuts and Jobs Act. On December 22, 2017, the U.S. government enacted the Tax Act, which makes broad and complex changes to the U.S. tax code, including, but not limited to: (i) reducing the U.S. federal corporate tax rate from 35% to 21%; (ii) requiring companies to pay a one-time transition tax on certain unrepatriated earnings of foreign subsidiaries; (iii) generally eliminating U.S. federal income taxes on dividends from foreign subsidiaries; (iv) requiring a current inclusion in U.S. federal taxable income of certain earnings of controlled foreign corporations; (v) eliminating the corporate AMT and changing how existing AMT credits can be realized; (vi) creating a new limitation on deductible interest expense; and (vii) changing rules related to uses and limitations of net operating loss carryforwards created in tax years beginning after December 31, 2017.
The SEC staff issued Staff Accounting Bulletin No. 118 ("SAB 118"), which provides guidance on accounting for the tax effects of the Tax Act. SAB 118 provides a measurement period that should not extend beyond one year from the Tax Act enactment date for companies to complete the accounting under ASC 740 (see Note 1). In accordance with SAB 118, a company must reflect the income tax effects of those aspects of the Tax Act for which the accounting under ASC 740 is complete. To the extent that a company’s accounting for certain income tax effects of the Tax Act is incomplete but it is able to determine a reasonable estimate, it must record a provisional estimate in the financial statements. If a company cannot determine a provisional estimate to be included in the financial statements, it should continue to apply ASC 740 on the basis of the provisions of the tax laws that were in effect immediately before the enactment of the Tax Act.
Our accounting for the following elements of the Tax Act is incomplete. However, we were able to make reasonable estimates of certain effects and, therefore, recorded provisional adjustments in the fourth quarter of 2017 as described below.
85
KAISER ALUMINUM CORPORATION AND SUBSIDIARY COMPANIES
NOTES TO CONSOLIDATED FINANCIAL STATEMENTS
Reduction of US Federal Corporate Tax Rate. The Tax Act reduces the corporate tax rate to 21%, effective January 1, 2018. For certain of our deferred tax assets, we have recorded a provisional decrease of $29.0 million, with a corresponding net increase to deferred income tax expense for the year ended December 31, 2017. While we are able to make a reasonable estimate of the impact of the reduction in corporate rate, our estimate may be affected by other analyses related to the Tax Act, including, but not limited to, our calculation of deemed repatriation of deferred foreign income and the state tax effect of adjustments made to federal temporary differences.
Deemed Repatriation Transition Tax. The Deemed Repatriation Transition Tax ("Transition Tax") is a tax on previously untaxed accumulated and current earnings and profits ("E&P") of certain of our foreign subsidiaries. To determine the amount of the Transition Tax, we must determine, in addition to other factors, the amount of post-1986 E&P of the relevant subsidiaries, as well as the amount of non-U.S. income taxes paid on such earnings. We were able to make a reasonable estimate of the Transition Tax and recorded a provisional Transition Tax obligation of $3.7 million. In addition, we have accrued $2.2 million for withholding tax since our earnings in Canada are no longer permanently reinvested. However, we are continuing to gather additional information to more precisely compute the amount of the Transition Tax.
Internal Revenue Code Section 162(m). The Tax Act modifies Section 162(m) of the Internal Revenue Code ("Section 162(m)") by: (i) expanding the scope of covered employees to include the chief financial officer; (ii) providing that any individual that becomes a covered employee for a taxable year beginning after December 31, 2016 would remain a covered employee for all future years; and (iii) eliminating the exceptions for commissions and performance-based compensation from the $1.0 million deduction limit. These changes do not apply to compensation stemming from contracts entered into on or before November 2, 2017, unless such contracts were materially modified on or after that date. Compensation agreements entered into and share-based payment awards granted after this date will be subject to the revised terms of Section 162(m). We were able to make a reasonable estimate of the Tax Act modifications to Section 162(m) and recorded a provisional Section 162(m) obligation of $2.3 million. However, we are continuing to gather additional information to more precisely compute the amount of the Section 162(m) limitation.
13. Net Income (Loss) Per Share and Stockholders' Equity
Net Income (Loss) Per Share. Basic net income (loss) per share is computed by dividing distributed and undistributed net income (loss) allocable to common shares by the weighted-average number of common shares outstanding during the applicable period. The basic weighted-average number of common shares outstanding during the period excludes unvested share-based payment awards. Diluted net income (loss) per share was calculated under the treasury stock method for 2017, 2016 and 2015, which in all years was more dilutive than the two-class method.
The following table sets forth the computation of basic and diluted net income (loss) per share for the periods presented (in millions of dollars, except share and per share amounts):
Year Ended December 31, | ||||||||||||
2017 | 2016 | 2015 | ||||||||||
Numerator: | ||||||||||||
Net income (loss) | $ | 45.4 | $ | 91.7 | $ | (236.6 | ) | |||||
Denominator – Weighted-average common shares outstanding (in thousands): | ||||||||||||
Basic | 16,996 | 17,813 | 17,201 | |||||||||
Add: dilutive effect of non-vested common shares, restricted stock units and performance shares | 263 | 220 | — | |||||||||
Diluted | 17,259 | 18,033 | 17,201 | |||||||||
Net income (loss) per common share, Basic: | $ | 2.67 | $ | 5.15 | $ | (13.76 | ) | |||||
Net income (loss) per common share, Diluted: | $ | 2.63 | $ | 5.09 | $ | (13.76 | ) | |||||
Net-share-settled warrants ("Warrants") relating to approximately 3.7 million notional common shares of our common stock at an exercise price of approximately $60.70 per share were settled during a period from July 1, 2015 through December 18, 2015. In total, we issued 1,015,185 shares of our common stock in connection with the Warrants and paid a de minimis amount in cash to the holders for fractional shares at the end of the settlement period.
86
KAISER ALUMINUM CORPORATION AND SUBSIDIARY COMPANIES
NOTES TO CONSOLIDATED FINANCIAL STATEMENTS
The following securities were excluded from the weighted-average diluted shares computation for the periods presented as their inclusion would have been anti-dilutive (in thousands of shares):
Year Ended December 31, | |||||||||
2017 | 2016 | 2015 | |||||||
Non-vested common shares, restricted stock units and performance shares | 52 | 50 | 302 | ||||||
Warrants | — | — | 639 | ||||||
Total excluded | 52 | 50 | 941 | ||||||
Dividends. During 2017, 2016 and 2015, we paid a total of approximately $35.0 million ($2.00 per common share), $32.4 million ($1.80 per common share) and $28.1 million ($1.60 per common share), respectively, in cash dividends to stockholders, including the holders of restricted stock, and dividend equivalents to the holders of certain restricted stock units and performance shares.
Treasury Stock. From time to time, we repurchase shares pursuant to a stock repurchase program authorized by our Board of Directors. Repurchase transactions will occur at such times and prices as management deems appropriate and will be funded with our excess liquidity after giving consideration to, among other things, internal and external growth opportunities and future cash flows. Repurchases may be in open-market transactions or in privately negotiated transactions and the program may be modified or terminated by our Board of Directors at any time. Repurchases of our common stock pursuant to the stock repurchase program is recorded as Treasury stock and consisted of the following for each period presented:
Year Ended December 31, | ||||||||||||
2017 | 2016 | 2015 | ||||||||||
Number of common shares repurchased | 938,680 | 443,838 | 647,520 | |||||||||
Weighted-average repurchase price (dollars per share) | $ | 82.97 | $ | 78.59 | $ | 76.35 | ||||||
Total cost of repurchased common shares (in millions of dollars) | $ | 77.8 | $ | 34.9 | $ | 49.4 | ||||||
At December 31, 2017 and December 31, 2016, $110.5 million and $88.4 million, respectively, were available to repurchase our common shares pursuant to the stock repurchase program.
Preferred Stock. In connection with a tax asset protection rights plan, our Board of Directors declared a dividend, payable April 22, 2016, of one right for each outstanding share of our common stock. In general, if the rights become exercisable, each right would allow its holder to purchase one one-hundredth of a share of our Series A Preferred Stock. The authorized number of shares of Series A Preferred Stock is 900,000.
87
KAISER ALUMINUM CORPORATION AND SUBSIDIARY COMPANIES
NOTES TO CONSOLIDATED FINANCIAL STATEMENTS
14. Supplemental Cash Flow Information
Year Ended December 31, | |||||||||||
2017 | 2016 | 2015 | |||||||||
(in millions of dollars) | |||||||||||
Interest paid | $ | 21.1 | $ | 17.7 | $ | 22.1 | |||||
Non-cash investing and financing activities (included in Accounts payable): | |||||||||||
Unpaid purchases of property and equipment | $ | 7.4 | $ | 4.6 | $ | 10.5 | |||||
Stock repurchases not yet settled | $ | 0.1 | $ | 1.8 | $ | 0.2 | |||||
Acquisition of property and equipment through capital leasing arrangements | $ | 1.2 | $ | 0.2 | $ | — | |||||
December 31, | |||||||||||
2017 | 2016 | 2015 | |||||||||
Components of cash, cash equivalents and restricted cash: | |||||||||||
Cash and cash equivalents | $ | 51.1 | $ | 55.2 | $ | 72.5 | |||||
Restricted cash included in Prepaid expenses and other current assets | 0.3 | 0.3 | 0.3 | ||||||||
Restricted cash included in Other assets | 12.9 | 12.2 | 10.9 | ||||||||
Total cash, cash equivalents and restricted cash shown in the Statements of Consolidated Cash Flows | $ | 64.3 | $ | 67.7 | $ | 83.7 | |||||
15. Segment and Geographical Area Information
Our primary line of business is the production of semi-fabricated specialty aluminum products, such as aluminum plate and sheet and extruded and drawn products, primarily used in Aero/HS products, Automotive Extrusions, GE products and Other products. We operate 11 focused production facilities in the United States and one in Canada. Consistent with the manner in which our chief operating decision maker reviews and evaluates our business, the Fabricated Products business is treated as a single operating segment. At December 31, 2017, approximately 63% of our employees were covered by collective bargaining agreements and approximately 12% of our employees were covered by collective bargaining agreements with expiration dates occurring within one year from December 31, 2017.
In addition to the Fabricated Products segment, we have a business unit, All Other, which provides general and administrative support for our operations. For purposes of segment reporting under GAAP, we treat the Fabricated Products segment as a reportable segment. All Other is not considered a reportable segment.
The accounting policies of our Fabricated Products segment are the same as those described in Note 1. Segment results are evaluated internally by management before any allocation of corporate overhead and without any charge for income taxes, interest expense or other net operating charges.
88
KAISER ALUMINUM CORPORATION AND SUBSIDIARY COMPANIES
NOTES TO CONSOLIDATED FINANCIAL STATEMENTS
The following tables provide financial information by reporting segment and business unit for each period or as of each period end, as applicable (in millions of dollars):
Year Ended December 31, | |||||||||||
2017 | 2016 | 2015 | |||||||||
Net sales: | |||||||||||
Fabricated Products | $ | 1,397.5 | $ | 1,330.6 | $ | 1,391.9 | |||||
Segment operating income (loss): | |||||||||||
Fabricated Products | 201.3 | 229.6 | 190.8 | ||||||||
All Other | (50.6 | ) | (51.8 | ) | (536.7 | ) | |||||
Total operating income (loss) | 150.7 | 177.8 | (345.9 | ) | |||||||
Interest expense | (22.2 | ) | (20.3 | ) | (24.1 | ) | |||||
Other income (expense) , net | 4.5 | (10.3 | ) | (1.8 | ) | ||||||
Income (loss) before income taxes | $ | 133.0 | $ | 147.2 | $ | (371.8 | ) | ||||
Depreciation and amortization: | |||||||||||
Fabricated Products | $ | 39.0 | $ | 35.4 | $ | 31.9 | |||||
All Other | 0.7 | 0.6 | 0.5 | ||||||||
Total depreciation and amortization | $ | 39.7 | $ | 36.0 | $ | 32.4 | |||||
Capital expenditures: | |||||||||||
Fabricated Products | $ | 75.3 | $ | 75.6 | $ | 62.4 | |||||
All Other | 0.2 | 0.5 | 0.7 | ||||||||
Total capital expenditures | $ | 75.5 | $ | 76.1 | $ | 63.1 | |||||
December 31, | |||||||||||
2017 | 2016 | 2015 | |||||||||
Assets: | |||||||||||
Fabricated Products | $ | 1,046.8 | $ | 969.4 | $ | 904.7 | |||||
All Other1 | 338.4 | 474.1 | 342.2 | ||||||||
Total assets | $ | 1,385.2 | $ | 1,443.5 | $ | 1,246.9 | |||||
__________________
1. | Assets in All Other represent primarily all of our cash, cash equivalents and restricted cash, short-term investments, financial derivative assets, deferred compensation program assets and net deferred income tax assets. |
89
KAISER ALUMINUM CORPORATION AND SUBSIDIARY COMPANIES
NOTES TO CONSOLIDATED FINANCIAL STATEMENTS
Net sales by end market applications for the Fabricated Products segment were as follows (in millions of dollars):
Year Ended December 31, | |||||||||||
2017 | 2016 | 2015 | |||||||||
Net sales: | |||||||||||
Aero/HS products | $ | 653.7 | $ | 675.4 | $ | 695.5 | |||||
Automotive Extrusions | 217.3 | 188.8 | 199.2 | ||||||||
GE products | 476.2 | 420.1 | 426.1 | ||||||||
Other products | 50.3 | 46.3 | 71.1 | ||||||||
Total net sales | $ | 1,397.5 | $ | 1,330.6 | $ | 1,391.9 | |||||
Geographic information for net sales based on country of origin, income taxes paid and long-lived assets were as follows (in millions of dollars):
Year Ended December 31, | |||||||||||
2017 | 2016 | 2015 | |||||||||
Net sales to unaffiliated customers: | |||||||||||
Fabricated Products – | |||||||||||
Domestic | $ | 1,337.3 | $ | 1,278.6 | $ | 1,321.3 | |||||
Foreign1 | 60.2 | 52.0 | 70.6 | ||||||||
Total net sales | $ | 1,397.5 | $ | 1,330.6 | $ | 1,391.9 | |||||
Income taxes paid: | |||||||||||
Fabricated Products – | |||||||||||
Domestic | $ | 1.2 | $ | 0.7 | $ | 0.6 | |||||
Foreign | 0.1 | 0.5 | 1.7 | ||||||||
Total income taxes paid | $ | 1.3 | $ | 1.2 | $ | 2.3 | |||||
December 31, | |||||||||||
2017 | 2016 | 2015 | |||||||||
Long-lived assets:2 | |||||||||||
Fabricated Products – | |||||||||||
Domestic | $ | 536.6 | $ | 494.7 | $ | 459.6 | |||||
Foreign | 30.2 | 31.4 | 30.9 | ||||||||
Total Fabricated Products long-lived assets | 566.8 | 526.1 | 490.5 | ||||||||
All Other – | |||||||||||
Domestic | 4.6 | 4.8 | 4.9 | ||||||||
Total All Other long-lived assets | 4.6 | 4.8 | 4.9 | ||||||||
Total long-lived assets | $ | 571.4 | $ | 530.9 | $ | 495.4 | |||||
__________________
1. | Foreign net sales reflect sales shipped from our London, Ontario production facility. |
2. | Long-lived assets represent Property, plant and equipment, net. |
The aggregate foreign currency transaction gain (loss) included in determining net income (loss) were immaterial for 2017, 2016 and 2015.
For the years ended December 31, 2017, December 31, 2016 and December 31, 2015, one customer represented 27%, 26% and 25%, respectively, of Fabricated Products Net sales. For the year ended December 31, 2017, a second customer represented
90
KAISER ALUMINUM CORPORATION AND SUBSIDIARY COMPANIES
NOTES TO CONSOLIDATED FINANCIAL STATEMENTS
12% of Fabricated Products Net sales. For each of the years ended December 31, 2016, and December 31, 2015, a second customer represented 10% of Fabricated Products Net sales.
One individual customer accounted for 22% and another individual customer accounted for 14% of the trade receivables balance at December 31, 2017. One individual customer accounted for 18% and two individual customers each accounted for 14% of the trade receivables balance at December 31, 2016.
Information for export sales and primary aluminum supply from our major suppliers were as follows:
Year Ended December 31, | ||||||||
2017 | 2016 | 2015 | ||||||
Percentage of Net sales: | ||||||||
Export sales | 18 | % | 19 | % | 19 | % | ||
Percentage of total annual primary aluminum supply (lbs): | ||||||||
Supply from our top five major suppliers | 85 | % | 84 | % | 86 | % | ||
Supply from our largest supplier | 36 | % | 32 | % | 28 | % | ||
Supply from our second and third largest suppliers combined | 33 | % | 32 | % | 36 | % | ||
16. Condensed Guarantor and Non-Guarantor Financial Information
During the quarter ended June 30, 2016, we issued $375.0 million aggregate principal amount of our 5.875% Senior Notes and redeemed in full the remaining principal balance of our 8.25% Senior Notes. The 5.875% Senior Notes were issued by Kaiser Aluminum Corporation ("Parent") pursuant to an indenture dated May 12, 2016 ("Indenture") with Wells Fargo Bank, National Association, as trustee ("Trustee"). The obligations of the Parent under the Indenture are guaranteed by Kaiser Aluminum Investments Company, Kaiser Aluminum Fabricated Products, LLC and Kaiser Aluminum Washington, LLC, ("Guarantor Subsidiaries"). An additional Guarantor Subsidiary, Kaiser Aluminum Alexco, LLC, merged with and into Kaiser Aluminum Fabricated Products, LLC during the first quarter of 2017. All Guarantor Subsidiaries are 100% owned by the Parent. The guarantees are full and unconditional and joint and several but have customary releases in the following situations: (i) the sale of the Guarantor Subsidiary or all of its assets; (ii) the declaration of a Guarantor Subsidiary as an unrestricted subsidiary under the Indenture; (iii) the termination or release of the Guarantor Subsidiary's guarantee of certain other indebtedness; or (iv) our exercise of legal defeasance or covenant defeasance or the discharge of our obligations under the Indenture.
The following condensed consolidating financial information as of December 31, 2017 and December 31, 2016, and for the years ended December 31, 2017, December 31, 2016 and December 31, 2015 present: (i) the financial position, results of operation and cash flows for each of (a) Parent, (b) the Guarantor Subsidiaries on a combined basis and (c) the Non-Guarantor Subsidiaries on a combined basis; (ii) the "Consolidating Adjustments," which represent the adjustments necessary to eliminate the investments in our subsidiaries, other intercompany balances and other intercompany sales and cost of sales among Parent, the Guarantor Subsidiaries and the Non-Guarantor Subsidiaries; and (iii) the resulting totals, reflecting information for us on a consolidated basis, as reported. The condensed consolidating financial information should be read in conjunction with the consolidated financial statements herein.
The "Non-Guarantor Subsidiaries" include Kaiser Aluminum Mill Products, Inc., Kaiser Aluminum Canada Limited, Trochus Insurance Company, DCO Management, LLC (which was dissolved in the fourth quarter of 2016 and ceased to exist as of January 1, 2017), Kaiser Aluminum France, S.A.S. and Kaiser Aluminum Beijing Trading Company. Kaiser Aluminum Mill Products, Inc. was included in the "Guarantor Subsidiaries" under the indenture covering the 8.25% Senior Notes but is not a Guarantor Subsidiary under the Indenture. Historical periods have not been restated to move Kaiser Aluminum Mill Products, Inc. from the Guarantor Subsidiaries category to the Non-Guarantor Subsidiaries category because the impact of this change to the financial position, results of operation and cash flows with respect to the Guarantor Subsidiaries on a combined basis and the Non-Guarantor Subsidiaries on a combined basis is immaterial.
91
KAISER ALUMINUM CORPORATION AND SUBSIDIARY COMPANIES
NOTES TO CONSOLIDATED FINANCIAL STATEMENTS
CONDENSED CONSOLIDATING BALANCE SHEET
(In millions of dollars)
December 31, 2017
Parent | Guarantor Subsidiaries | Non-Guarantor Subsidiaries | Consolidating Adjustments | Consolidated | ||||||||||||||||
ASSETS | ||||||||||||||||||||
Current assets: | ||||||||||||||||||||
Cash and cash equivalents | $ | — | $ | 48.4 | $ | 2.7 | $ | — | $ | 51.1 | ||||||||||
Short-term investments | — | 183.7 | — | — | 183.7 | |||||||||||||||
Receivables: | ||||||||||||||||||||
Trade receivables, net | — | 160.1 | 4.9 | — | 165.0 | |||||||||||||||
Intercompany receivables | 22.8 | 0.1 | 0.7 | (23.6 | ) | — | ||||||||||||||
Other | — | 14.7 | 0.8 | — | 15.5 | |||||||||||||||
Inventories | — | 198.7 | 9.2 | — | 207.9 | |||||||||||||||
Prepaid expenses and other current assets | 0.1 | 32.9 | 0.4 | — | 33.4 | |||||||||||||||
Total current assets | 22.9 | 638.6 | 18.7 | (23.6 | ) | 656.6 | ||||||||||||||
Investments in and advances to subsidiaries | 1,097.7 | 48.2 | — | (1,145.9 | ) | — | ||||||||||||||
Property, plant and equipment, net | — | 541.2 | 30.2 | — | 571.4 | |||||||||||||||
Long-term intercompany receivables | — | — | 12.4 | (12.4 | ) | — | ||||||||||||||
Deferred tax assets, net | — | 67.3 | — | 4.7 | 72.0 | |||||||||||||||
Intangible assets, net | — | 25.0 | — | — | 25.0 | |||||||||||||||
Goodwill | — | 18.8 | — | — | 18.8 | |||||||||||||||
Other assets | — | 41.4 | — | — | 41.4 | |||||||||||||||
Total | $ | 1,120.6 | $ | 1,380.5 | $ | 61.3 | $ | (1,177.2 | ) | $ | 1,385.2 | |||||||||
LIABILITIES AND STOCKHOLDERS’ EQUITY | ||||||||||||||||||||
Current liabilities: | ||||||||||||||||||||
Accounts payable | $ | 1.9 | $ | 81.4 | $ | 6.7 | $ | — | $ | 90.0 | ||||||||||
Intercompany payable | — | 23.5 | 0.1 | (23.6 | ) | — | ||||||||||||||
Accrued salaries, wages and related expenses | — | 41.0 | 1.6 | — | 42.6 | |||||||||||||||
Other accrued liabilities | 2.8 | 46.2 | 1.0 | (9.5 | ) | 40.5 | ||||||||||||||
Total current liabilities | 4.7 | 192.1 | 9.4 | (33.1 | ) | 173.1 | ||||||||||||||
Net liabilities of Salaried VEBA | — | 31.9 | — | — | 31.9 | |||||||||||||||
Deferred tax liabilities | — | — | 4.3 | — | 4.3 | |||||||||||||||
Long-term intercompany payable | — | 12.4 | — | (12.4 | ) | — | ||||||||||||||
Long-term liabilities | — | 58.0 | 2.0 | — | 60.0 | |||||||||||||||
Long-term debt | 369.6 | — | — | — | 369.6 | |||||||||||||||
Total liabilities | 374.3 | 294.4 | 15.7 | (45.5 | ) | 638.9 | ||||||||||||||
Total stockholders’ equity | 746.3 | 1,086.1 | 45.6 | (1,131.7 | ) | 746.3 | ||||||||||||||
Total | $ | 1,120.6 | $ | 1,380.5 | $ | 61.3 | $ | (1,177.2 | ) | $ | 1,385.2 | |||||||||
92
KAISER ALUMINUM CORPORATION AND SUBSIDIARY COMPANIES
NOTES TO CONSOLIDATED FINANCIAL STATEMENTS
CONDENSED CONSOLIDATING BALANCE SHEET
(In millions of dollars)
December 31, 2016
Parent | Guarantor Subsidiaries | Non-Guarantor Subsidiaries | Consolidating Adjustments | Consolidated | ||||||||||||||||
ASSETS | ||||||||||||||||||||
Current assets: | ||||||||||||||||||||
Cash and cash equivalents | $ | — | $ | 52.9 | $ | 2.3 | $ | — | $ | 55.2 | ||||||||||
Short-term investments | — | 231.0 | — | — | 231.0 | |||||||||||||||
Receivables: | ||||||||||||||||||||
Trade receivables, net | — | 133.1 | 4.6 | — | 137.7 | |||||||||||||||
Intercompany receivables | 85.8 | 0.1 | 0.6 | (86.5 | ) | — | ||||||||||||||
Other | — | 11.4 | 0.5 | — | 11.9 | |||||||||||||||
Inventories | — | 197.5 | 8.0 | (3.9 | ) | 201.6 | ||||||||||||||
Prepaid expenses and other current assets | 0.1 | 18.0 | 0.9 | (0.5 | ) | 18.5 | ||||||||||||||
Total current assets | 85.9 | 644.0 | 16.9 | (90.9 | ) | 655.9 | ||||||||||||||
Investments in and advances to subsidiaries | 1,012.4 | 40.1 | — | (1,052.5 | ) | — | ||||||||||||||
Property, plant and equipment, net | — | 499.5 | 31.4 | — | 530.9 | |||||||||||||||
Long-term intercompany receivables | 80.2 | — | 4.9 | (85.1 | ) | — | ||||||||||||||
Deferred tax assets, net | — | 154.9 | — | 4.8 | 159.7 | |||||||||||||||
Intangible assets, net | — | 26.4 | — | — | 26.4 | |||||||||||||||
Goodwill | — | 37.2 | — | — | 37.2 | |||||||||||||||
Other assets | — | 33.4 | — | — | 33.4 | |||||||||||||||
Total | $ | 1,178.5 | $ | 1,435.5 | $ | 53.2 | $ | (1,223.7 | ) | $ | 1,443.5 | |||||||||
LIABILITIES AND STOCKHOLDERS’ EQUITY | ||||||||||||||||||||
Current liabilities: | ||||||||||||||||||||
Accounts payable | $ | 2.2 | $ | 68.9 | $ | 4.7 | $ | — | $ | 75.8 | ||||||||||
Intercompany payable | — | 86.4 | 0.1 | (86.5 | ) | — | ||||||||||||||
Accrued salaries, wages and related expenses | — | 47.2 | 1.9 | — | 49.1 | |||||||||||||||
Other accrued liabilities | 2.9 | 52.6 | (0.7 | ) | (14.7 | ) | 40.1 | |||||||||||||
Total current liabilities | 5.1 | 255.1 | 6.0 | (101.2 | ) | 165.0 | ||||||||||||||
Net liabilities of Salaried VEBA | — | 28.6 | — | — | 28.6 | |||||||||||||||
Deferred tax liabilities | — | — | 3.3 | — | 3.3 | |||||||||||||||
Long-term intercompany payable | — | 85.1 | — | (85.1 | ) | — | ||||||||||||||
Long-term liabilities | — | 70.5 | 2.7 | — | 73.2 | |||||||||||||||
Long-term debt | 368.7 | — | — | — | 368.7 | |||||||||||||||
Total liabilities | 373.8 | 439.3 | 12.0 | (186.3 | ) | 638.8 | ||||||||||||||
Total stockholders’ equity | 804.7 | 996.2 | 41.2 | (1,037.4 | ) | 804.7 | ||||||||||||||
Total | $ | 1,178.5 | $ | 1,435.5 | $ | 53.2 | $ | (1,223.7 | ) | $ | 1,443.5 | |||||||||
93
KAISER ALUMINUM CORPORATION AND SUBSIDIARY COMPANIES
NOTES TO CONSOLIDATED FINANCIAL STATEMENTS
CONDENSED CONSOLIDATING STATEMENT OF COMPREHENSIVE INCOME
(In millions of dollars)
Year Ended December 31, 2017
Parent | Guarantor Subsidiaries | Non-Guarantor Subsidiaries | Consolidating Adjustments | Consolidated | ||||||||||||||||
Net sales | $ | — | $ | 1,365.3 | $ | 115.7 | $ | (83.5 | ) | $ | 1,397.5 | |||||||||
Costs and expenses: | ||||||||||||||||||||
Cost of products sold: | ||||||||||||||||||||
Cost of products sold, excluding depreciation and amortization and other items | — | 1,085.5 | 101.1 | (81.3 | ) | 1,105.3 | ||||||||||||||
Unrealized gain on derivative instruments | — | (19.4 | ) | — | — | (19.4 | ) | |||||||||||||
Depreciation and amortization | — | 37.5 | 2.2 | — | 39.7 | |||||||||||||||
Selling, general, administrative, research and development: | ||||||||||||||||||||
Selling, general, administrative, research and development | 4.5 | 88.3 | 6.9 | (2.2 | ) | 97.5 | ||||||||||||||
Net periodic postretirement benefit cost relating to Salaried VEBA | — | 4.5 | — | — | 4.5 | |||||||||||||||
Total selling, general, administrative, research and development | 4.5 | 92.8 | 6.9 | (2.2 | ) | 102.0 | ||||||||||||||
Goodwill impairment | — | 18.4 | — | — | 18.4 | |||||||||||||||
Other operating charges, net | — | 0.8 | — | — | 0.8 | |||||||||||||||
Total costs and expenses | 4.5 | 1,215.6 | 110.2 | (83.5 | ) | 1,246.8 | ||||||||||||||
Operating (loss) income | (4.5 | ) | 149.7 | 5.5 | — | 150.7 | ||||||||||||||
Other (expense) income: | ||||||||||||||||||||
Interest expense | (20.7 | ) | (1.7 | ) | — | 0.2 | (22.2 | ) | ||||||||||||
Other income, net | — | 4.0 | 0.7 | (0.2 | ) | 4.5 | ||||||||||||||
(Loss) income before income taxes | (25.2 | ) | 152.0 | 6.2 | — | 133.0 | ||||||||||||||
Income tax provision | — | (95.2 | ) | (1.9 | ) | 9.5 | (87.6 | ) | ||||||||||||
Earnings in equity of subsidiaries | 70.6 | 4.3 | — | (74.9 | ) | — | ||||||||||||||
Net income | $ | 45.4 | $ | 61.1 | $ | 4.3 | $ | (65.4 | ) | $ | 45.4 | |||||||||
Comprehensive income | $ | 45.4 | $ | 61.1 | $ | 4.3 | $ | (65.4 | ) | $ | 45.4 | |||||||||
94
KAISER ALUMINUM CORPORATION AND SUBSIDIARY COMPANIES
NOTES TO CONSOLIDATED FINANCIAL STATEMENTS
CONDENSED CONSOLIDATING STATEMENT OF COMPREHENSIVE INCOME
(In millions of dollars)
Year Ended December 31, 2016
Parent | Guarantor Subsidiaries | Non-Guarantor Subsidiaries | Consolidating Adjustments | Consolidated | ||||||||||||||||
Net sales | $ | — | $ | 1,301.6 | $ | 103.4 | $ | (74.4 | ) | $ | 1,330.6 | |||||||||
Costs and expenses: | ||||||||||||||||||||
Cost of products sold: | ||||||||||||||||||||
Cost of products sold, excluding depreciation and amortization and other items | — | 1,000.6 | 90.0 | (71.1 | ) | 1,019.5 | ||||||||||||||
Lower of cost or market inventory write-down | — | 4.9 | — | — | 4.9 | |||||||||||||||
Unrealized gain on derivative instruments | — | (18.7 | ) | — | — | (18.7 | ) | |||||||||||||
Depreciation and amortization | — | 34.0 | 2.0 | — | 36.0 | |||||||||||||||
Selling, general, administrative, research and development: | ||||||||||||||||||||
Selling, general, administrative, research and development | 4.2 | 95.0 | 8.4 | (2.6 | ) | 105.0 | ||||||||||||||
Net periodic postretirement benefit cost relating to Salaried VEBA | — | 3.4 | — | — | 3.4 | |||||||||||||||
Gain on removal of Union VEBA net assets | — | (0.1 | ) | — | — | (0.1 | ) | |||||||||||||
Total selling, general, administrative, research and development | 4.2 | 98.3 | 8.4 | (2.6 | ) | 108.3 | ||||||||||||||
Other operating charges, net | — | 2.8 | — | — | 2.8 | |||||||||||||||
Total costs and expenses | 4.2 | 1,121.9 | 100.4 | (73.7 | ) | 1,152.8 | ||||||||||||||
Operating (loss) income | (4.2 | ) | 179.7 | 3.0 | (0.7 | ) | 177.8 | |||||||||||||
Other (expense) income: | ||||||||||||||||||||
Interest (expense) income | (21.6 | ) | 1.2 | — | 0.1 | (20.3 | ) | |||||||||||||
Other (expense) income, net | (11.1 | ) | 0.9 | — | (0.1 | ) | (10.3 | ) | ||||||||||||
(Loss) income before income taxes | (36.9 | ) | 181.8 | 3.0 | (0.7 | ) | 147.2 | |||||||||||||
Income tax provision | — | (69.0 | ) | (0.6 | ) | 14.1 | (55.5 | ) | ||||||||||||
Earnings in equity of subsidiaries | 128.6 | 1.7 | — | (130.3 | ) | — | ||||||||||||||
Net income | $ | 91.7 | $ | 114.5 | $ | 2.4 | $ | (116.9 | ) | $ | 91.7 | |||||||||
Comprehensive income | $ | 86.7 | $ | 109.8 | $ | 2.1 | $ | (111.9 | ) | $ | 86.7 | |||||||||
95
KAISER ALUMINUM CORPORATION AND SUBSIDIARY COMPANIES
NOTES TO CONSOLIDATED FINANCIAL STATEMENTS
CONDENSED CONSOLIDATING STATEMENT OF COMPREHENSIVE (LOSS) INCOME
(In millions of dollars)
Year Ended December 31, 2015
Parent | Guarantor Subsidiaries | Non-Guarantor Subsidiaries | Consolidating Adjustments | Consolidated | ||||||||||||||||
Net sales | $ | — | $ | 1,361.6 | $ | 123.3 | $ | (93.0 | ) | $ | 1,391.9 | |||||||||
Costs and expenses: | ||||||||||||||||||||
Cost of products sold: | ||||||||||||||||||||
Cost of products sold, excluding depreciation and amortization and other items | — | 1,095.6 | 108.4 | (88.6 | ) | 1,115.4 | ||||||||||||||
Lower of cost or market inventory write-down | — | 2.6 | — | — | 2.6 | |||||||||||||||
Unrealized loss on derivative instruments | — | 3.4 | — | — | 3.4 | |||||||||||||||
Depreciation and amortization | — | 31.3 | 1.1 | — | 32.4 | |||||||||||||||
Selling, general, administrative, research and development: | ||||||||||||||||||||
Selling, general, administrative, research and development | 4.3 | 76.5 | 9.3 | (2.0 | ) | 88.1 | ||||||||||||||
Net periodic postretirement benefit income relating to Salaried VEBA | — | 2.4 | — | — | 2.4 | |||||||||||||||
Loss on removal of Union VEBA net assets | — | 493.4 | — | — | 493.4 | |||||||||||||||
Total selling, general, administrative, research and development | 4.3 | 572.3 | 9.3 | (2.0 | ) | 583.9 | ||||||||||||||
Other operating charges, net | — | 0.1 | — | — | 0.1 | |||||||||||||||
Total costs and expenses | 4.3 | 1,705.3 | 118.8 | (90.6 | ) | 1,737.8 | ||||||||||||||
Operating (loss) income | (4.3 | ) | (343.7 | ) | 4.5 | (2.4 | ) | (345.9 | ) | |||||||||||
Other income (expense): | ||||||||||||||||||||
Interest expense | (23.5 | ) | (0.9 | ) | — | 0.3 | (24.1 | ) | ||||||||||||
Other (expense) income, net | (2.5 | ) | 3.5 | (2.5 | ) | (0.3 | ) | (1.8 | ) | |||||||||||
(Loss) income before income taxes | (30.3 | ) | (341.1 | ) | 2.0 | (2.4 | ) | (371.8 | ) | |||||||||||
Income tax benefit | — | 122.5 | 1.3 | 11.4 | 135.2 | |||||||||||||||
(Loss) earnings in equity of subsidiaries | (206.3 | ) | 0.9 | — | 205.4 | — | ||||||||||||||
Net (loss) income | $ | (236.6 | ) | $ | (217.7 | ) | $ | 3.3 | $ | 214.4 | $ | (236.6 | ) | |||||||
Comprehensive (loss) income | $ | (172.2 | ) | $ | (153.5 | ) | $ | 3.5 | $ | 150.0 | $ | (172.2 | ) | |||||||
96
KAISER ALUMINUM CORPORATION AND SUBSIDIARY COMPANIES
NOTES TO CONSOLIDATED FINANCIAL STATEMENTS
CONDENSED CONSOLIDATING STATEMENT OF CASH FLOWS
(In millions of dollars)
Year Ended December 31, 2017
Parent | Guarantor Subsidiaries | Non-Guarantor Subsidiaries | Consolidating Adjustments | Consolidated | ||||||||||||||||
Cash flows from operating activities: | ||||||||||||||||||||
Net cash (used in) provided by operating activities | $ | (24.2 | ) | $ | 156.9 | $ | 8.8 | $ | — | $ | 141.5 | |||||||||
Cash flows from investing activities: | ||||||||||||||||||||
Capital expenditures | — | (74.7 | ) | (0.8 | ) | — | (75.5 | ) | ||||||||||||
Purchase of available for sale securities | — | (247.5 | ) | — | — | (247.5 | ) | |||||||||||||
Proceeds from disposition of available for sale securities | — | 296.9 | — | — | 296.9 | |||||||||||||||
Proceeds from disposal of property, plant and equipment | — | 0.6 | — | — | 0.6 | |||||||||||||||
Intercompany loans receivable | 143.2 | — | (7.6 | ) | (135.6 | ) | — | |||||||||||||
Net cash provided by (used in) investing activities | 143.2 | (24.7 | ) | (8.4 | ) | (135.6 | ) | (25.5 | ) | |||||||||||
Cash flows from financing activities: | ||||||||||||||||||||
Repayment of capital lease | — | (0.4 | ) | — | — | (0.4 | ) | |||||||||||||
Cancellation of shares to cover employees' tax withholdings upon vesting of non-vested shares | (4.5 | ) | — | — | — | (4.5 | ) | |||||||||||||
Repurchase of common stock | (79.5 | ) | — | — | — | (79.5 | ) | |||||||||||||
Cash dividends and dividend equivalents paid | (35.0 | ) | — | — | — | (35.0 | ) | |||||||||||||
Intercompany loans payable | — | (135.6 | ) | — | 135.6 | — | ||||||||||||||
Net cash used in financing activities | (119.0 | ) | (136.0 | ) | — | 135.6 | (119.4 | ) | ||||||||||||
Net (decrease) increase in cash and cash equivalents during the period | — | (3.8 | ) | 0.4 | — | (3.4 | ) | |||||||||||||
Cash, cash equivalents and restricted cash at beginning of period | — | 65.1 | 2.6 | — | 67.7 | |||||||||||||||
Cash, cash equivalents and restricted cash at end of period | $ | — | $ | 61.3 | $ | 3.0 | $ | — | $ | 64.3 | ||||||||||
97
KAISER ALUMINUM CORPORATION AND SUBSIDIARY COMPANIES
NOTES TO CONSOLIDATED FINANCIAL STATEMENTS
CONDENSED CONSOLIDATING STATEMENT OF CASH FLOWS
(In millions of dollars)
Year Ended December 31, 2016
Parent | Guarantor Subsidiaries | Non-Guarantor Subsidiaries | Consolidating Adjustments | Consolidated | ||||||||||||||||
Cash flows from operating activities: | ||||||||||||||||||||
Net cash provided by operating activities | $ | 177.7 | $ | 178.7 | $ | 9.2 | $ | (200.0 | ) | $ | 165.6 | |||||||||
Cash flows from investing activities: | ||||||||||||||||||||
Capital expenditures | — | (74.0 | ) | (2.1 | ) | — | (76.1 | ) | ||||||||||||
Purchase of available for sale securities | — | (255.3 | ) | — | — | (255.3 | ) | |||||||||||||
Proceeds from disposition of available for sale securities | — | 55.0 | — | — | 55.0 | |||||||||||||||
Intercompany loans receivable1 | (166.0 | ) | 110.4 | (1.3 | ) | 56.9 | — | |||||||||||||
Net cash used in investing activities | (166.0 | ) | (163.9 | ) | (3.4 | ) | 56.9 | (276.4 | ) | |||||||||||
Cash flows from financing activities: | ||||||||||||||||||||
Repayment of principal and redemption premium of 8.25% Senior Notes | (206.0 | ) | — | — | — | (206.0 | ) | |||||||||||||
Issuance of 5.875% Senior Notes | 375.0 | — | — | — | 375.0 | |||||||||||||||
Cash paid for debt issuance costs | (6.8 | ) | — | — | — | (6.8 | ) | |||||||||||||
Proceeds from stock option exercises | 1.2 | — | — | — | 1.2 | |||||||||||||||
Cancellation of shares to cover employees' tax withholdings upon vesting of non-vested shares | (2.9 | ) | — | — | — | (2.9 | ) | |||||||||||||
Repurchase of common stock | (33.3 | ) | — | — | — | (33.3 | ) | |||||||||||||
Cash dividends and dividend equivalents paid | (32.4 | ) | — | — | — | (32.4 | ) | |||||||||||||
Cash dividends paid to Parent | — | (200.0 | ) | — | 200.0 | — | ||||||||||||||
Intercompany loans payable1 | (106.5 | ) | 167.3 | (3.9 | ) | (56.9 | ) | — | ||||||||||||
Net cash (used in) provided by financing activities | (11.7 | ) | (32.7 | ) | (3.9 | ) | 143.1 | 94.8 | ||||||||||||
Net (decrease) increase in cash and cash equivalents during the period | — | (17.9 | ) | 1.9 | — | (16.0 | ) | |||||||||||||
Cash, cash equivalents and restricted cash at beginning of period | — | 83.0 | 0.7 | — | 83.7 | |||||||||||||||
Cash, cash equivalents and restricted cash at end of period | $ | — | $ | 65.1 | $ | 2.6 | $ | — | $ | 67.7 | ||||||||||
________________
1 | As a result of the Parent's additional liquidity associated with the 5.875% Senior Notes (see Note 8), we classify all intercompany receivables and payables as Intercompany loans receivable and Intercompany loans payable, respectively, and therefore categorize changes in these balances within the investing and financing sections, respectively, of the Condensed Consolidating Statement of Cash Flows. |
98
KAISER ALUMINUM CORPORATION AND SUBSIDIARY COMPANIES
NOTES TO CONSOLIDATED FINANCIAL STATEMENTS
CONDENSED CONSOLIDATING STATEMENT OF CASH FLOWS
(In millions of dollars)
Year Ended December 31, 2015
Parent | Guarantor Subsidiaries | Non-Guarantor Subsidiaries | Consolidating Adjustments | Consolidated | ||||||||||||||||
Cash flows from operating activities: | ||||||||||||||||||||
Net cash provided by (used in) operating activities | $ | 285.7 | $ | (126.3 | ) | $ | 0.3 | $ | — | $ | 159.7 | |||||||||
Cash flows from investing activities: | ||||||||||||||||||||
Capital expenditures | — | (47.9 | ) | (15.2 | ) | — | (63.1 | ) | ||||||||||||
Purchase of available for sale securities | — | (0.5 | ) | — | — | (0.5 | ) | |||||||||||||
Proceeds from disposition of available for sale securities | — | 84.0 | — | — | 84.0 | |||||||||||||||
Net cash provided by (used in) investing activities | — | 35.6 | (15.2 | ) | — | 20.4 | ||||||||||||||
Cash flows from financing activities: | ||||||||||||||||||||
Repayment of principal and redemption premium of 8.25% Senior Notes | (30.0 | ) | — | — | — | (30.0 | ) | |||||||||||||
Repayment of Convertible Notes | (175.0 | ) | — | — | — | (175.0 | ) | |||||||||||||
Proceeds from cash-settled call options related to settlement of Convertible Notes | 94.9 | — | — | — | 94.9 | |||||||||||||||
Payment for conversion premium related to settlement of Convertible Notes | (94.9 | ) | — | — | — | (94.9 | ) | |||||||||||||
Cash paid for debt issuance costs | (0.6 | ) | — | — | — | (0.6 | ) | |||||||||||||
Excess tax benefit upon vesting of non-vested shares and dividend payment on unvested shares expected to vest | — | 1.3 | — | — | 1.3 | |||||||||||||||
Cancellation of shares to cover employees' tax withholdings upon vesting of non-vested shares | (2.8 | ) | — | — | — | (2.8 | ) | |||||||||||||
Repurchase of common stock | (49.2 | ) | — | — | — | (49.2 | ) | |||||||||||||
Cash dividends and dividend equivalents paid | (28.1 | ) | — | — | — | (28.1 | ) | |||||||||||||
Intercompany loans payable | — | (12.8 | ) | 12.8 | — | — | ||||||||||||||
Net cash (used in) provided by financing activities | (285.7 | ) | (11.5 | ) | 12.8 | — | (284.4 | ) | ||||||||||||
Net decrease in cash and cash equivalents during the period | — | (102.2 | ) | (2.1 | ) | — | (104.3 | ) | ||||||||||||
Cash, cash equivalents and restricted cash at beginning of period | — | 185.2 | 2.8 | — | 188.0 | |||||||||||||||
Cash, cash equivalents and restricted cash at end of period | $ | — | $ | 83.0 | $ | 0.7 | $ | — | $ | 83.7 | ||||||||||
99
KAISER ALUMINUM CORPORATION AND SUBSIDIARY COMPANIES
NOTES TO CONSOLIDATED FINANCIAL STATEMENTS
17. Quarterly Financial Data (Unaudited)
The following tables present the unaudited financial data for each of the interim periods in 2017 and 2016 (in millions of dollars, except per share amounts):
Quarter Ended 31-Mar | Quarter Ended 30-Jun | Quarter Ended 30-Sep | Quarter Ended 31-Dec | |||||||||||||
2017 | ||||||||||||||||
Net sales | $ | 355.3 | $ | 356.3 | $ | 332.8 | $ | 353.1 | ||||||||
Cost of products sold, excluding depreciation, amortization and other items | $ | 277.8 | $ | 277.7 | $ | 267.2 | $ | 282.6 | ||||||||
Unrealized (gain) loss on derivative instruments | $ | (15.1 | ) | $ | 11.9 | $ | (10.8 | ) | $ | (5.4 | ) | |||||
Gross profit | $ | 92.6 | $ | 66.7 | $ | 76.4 | $ | 75.9 | ||||||||
Operating income | $ | 59.5 | $ | 11.4 | $ | 39.8 | $ | 40.0 | ||||||||
Net income (loss)1 | $ | 36.0 | $ | 4.7 | $ | 19.9 | $ | (15.2 | ) | |||||||
Net income (loss) per common share, Basic | $ | 2.07 | $ | 0.28 | $ | 1.18 | $ | (0.90 | ) | |||||||
Net income (loss) per common share, Diluted | $ | 2.04 | $ | 0.27 | $ | 1.16 | $ | (0.90 | ) | |||||||
Dividends declared per common share | $ | 0.50 | $ | 0.50 | $ | 0.50 | $ | 0.50 | ||||||||
________________
1 | The quarter ended June 30, 2017 reflected an $18.4 million goodwill impairment charge (see Note 3). The quarter ended December 31, 2017 included the tax provision effect of $37.2 million due to the Tax Act (see Note 12). |
Quarter Ended 31-Mar | Quarter Ended 30-Jun | Quarter Ended 30-Sep | Quarter Ended 31-Dec | |||||||||||||
2016 | ||||||||||||||||
Net sales | $ | 343.2 | $ | 334.9 | $ | 320.6 | $ | 331.9 | ||||||||
Cost of products sold, excluding depreciation, amortization and other items | $ | 262.0 | $ | 250.4 | $ | 254.7 | $ | 252.4 | ||||||||
Lower of cost or market inventory write-down | $ | 4.9 | $ | — | $ | — | $ | — | ||||||||
Unrealized gain on derivative instruments | $ | (4.0 | ) | $ | (10.9 | ) | $ | (2.0 | ) | $ | (1.8 | ) | ||||
Gross profit | $ | 80.3 | $ | 95.4 | $ | 67.9 | $ | 81.3 | ||||||||
Operating income | $ | 44.8 | $ | 57.9 | $ | 29.8 | $ | 45.3 | ||||||||
Net income | $ | 26.3 | $ | 26.0 | $ | 14.9 | $ | 24.5 | ||||||||
Net income per common share, Basic | $ | 1.47 | $ | 1.45 | $ | 0.84 | $ | 1.39 | ||||||||
Net income per common share, Diluted | $ | 1.44 | $ | 1.43 | $ | 0.82 | $ | 1.37 | ||||||||
Dividends declared per common share | $ | 0.45 | $ | 0.45 | $ | 0.45 | $ | 0.45 | ||||||||
18. Subsequent Events
Dividend Declaration. On January 16, 2018, we announced that our Board of Directors declared a quarterly cash dividend of $0.55 per common share, or approximately $9.3 million (including dividend equivalents), which was paid on February 15, 2018 to stockholders of record at the close of business on January 26, 2018.
100
Item 9. Changes in and Disagreements with Accountants on Accounting and Financial Disclosure
None.
Item 9A. Controls and Procedures
Evaluation of Disclosure Controls and Procedures. We maintain disclosure controls and procedures that are designed to ensure that information required to be disclosed in our reports under the Securities Exchange Act of 1934 is processed, recorded, summarized and reported within the time periods specified in the Securities and Exchange Commission's rules and forms and that such information is accumulated and communicated to management, including the principal executive officer and principal financial officer, to allow for timely decisions regarding required disclosure. In designing and evaluating the disclosure controls and procedures, management recognizes that any controls and procedures, no matter how well designed and operated, can provide only reasonable assurance of achieving the desired control objectives and management is required to apply our judgment in evaluating the cost-benefit relationship of possible controls and procedures. An evaluation of the effectiveness of the design and operation of our disclosure controls and procedures was performed as of the end of the period covered by this Report under the supervision of and with the participation of our management, including the principal executive officer and principal financial officer. Based on that evaluation, our principal executive officer and principal financial officer concluded that our disclosure controls and procedures were effective as of December 31, 2017 at the reasonable assurance level.
Management's Annual Report on Internal Control Over Financial Reporting. Our management is responsible for establishing and maintaining adequate internal control over financial reporting as defined in Rule 13a-15(f) under the Securities Exchange Act of 1934. Our internal control over financial reporting is designed under the supervision of our principal executive officer and principal financial officer and effected by our Board of Directors, management and other personnel, to provide reasonable assurance regarding the reliability of financial reporting and the preparation of financial statements for external purposes in accordance with accounting principles generally accepted in the United States and include those policies and procedures that:
(1) Pertain to the maintenance of records that in reasonable detail accurately and fairly reflect our transactions and the dispositions of our assets;
(2) Provide reasonable assurance that our transactions are recorded as necessary to permit preparation of financial statements in accordance with accounting principles generally accepted in the United States and that our receipts and expenditures are being made only in accordance with authorizations of our management and Board of Directors; and
(3) Provide reasonable assurance regarding prevention or timely detection of unauthorized acquisition, use or disposition of our assets that could have a material effect on our financial statements.
Because of our inherent limitations, internal control over financial reporting may not prevent or detect misstatements. Therefore, even those systems determined to be effective can provide only reasonable assurance with respect to financial statement preparation and presentation.
Under the supervision and with the participation of our management, including our principal executive officer and principal financial officer, we assessed the effectiveness of our internal control over financial reporting as of December 31, 2017, using the criteria set forth by the Committee of Sponsoring Organizations of the Treadway Commission in Internal Control - Integrated Framework as established in 2013. Based on that evaluation, our management, including our principal executive officer and principal financial officer, concluded that our internal control over financial reporting was effective as of December 31, 2017.
Deloitte & Touche LLP, the independent registered public accounting firm that audited our consolidated financial statements for the year ended December 31, 2017 included in Item 8. "Financial Statements and Supplementary Data" of this Report, has issued an attestation report on the effectiveness of our internal control over financial reporting.
Changes in Internal Controls Over Financial Reporting. We had no changes in our internal control over financial reporting during our most recently completed fiscal quarter that have materially affected, or are reasonably likely to materially affect, our internal control over financial reporting.
Item 9B. Other Information
None.
101
Part III
Item 10. Directors, Executive Officers and Corporate Governance
The information required by this item is incorporated by reference to the information included under the captions "Executive Officers," "Proposals Requiring Your Vote – Proposal 1 – Election of Directors," "Section 16(a) Beneficial Ownership Reporting Compliance" and "Corporate Governance" in our proxy statement for the 2018 annual meeting of stockholders.
Item 11. Executive Compensation
The information required by this item is incorporated by reference to the information included under the captions "Executive Compensation," "Director Compensation" and "Corporate Governance – Board Committees – Compensation Committee – Compensation Committee Interlocks and Insider Participation" in our proxy statement for the 2018 annual meeting of stockholders.
Item 12. Security Ownership of Certain Beneficial Owners and Management and Related Stockholder Matters
The information required by this item is incorporated by reference to the information included under the captions "Equity Compensation Plan Information" and "Principal Stockholders and Management Ownership" in our proxy statement for the 2018 annual meeting of stockholders.
Item 13. Certain Relationships and Related Transactions and Director Independence
The information required by this item is incorporated by reference to the information included under the captions "Certain Relationships and Related Transactions" and "Corporate Governance – Director Independence" in our proxy statement for the 2018 annual meeting of stockholders.
Item 14. Principal Accountant Fees and Services
The information required by this item is incorporated by reference to the information included under the caption "Independent Public Accountants" in our proxy statement for the 2018 annual meeting of stockholders.
102
PART IV
Item 15. Exhibits and Financial Statement Schedules
1. Financial Statements
Report of Independent Registered Public Accounting Firm | |
Consolidated Balance Sheets | |
Statements of Consolidated Income (Loss) | |
Statements of Consolidated Comprehensive Income (Loss) | |
Statements of Consolidated Stockholders’ Equity | |
Statements of Consolidated Cash Flows | |
Notes to Consolidated Financial Statements | |
2. Financial Statement Schedules
All schedules are omitted because they are either inapplicable or the required information is included in the Consolidated Financial Statements or the notes thereto included in Item 8. "Financial Statements and Supplementary Data" and incorporated herein by reference.
3. Exhibits
Exhibit Number | Description | |
3.1 | ||
3.2 | ||
3.3 | ||
3.4 | ||
3.5 | ||
3.6 | ||
3.7 | ||
103
Exhibit Number | Description | |
4.1 | ||
4.2 | ||
4.3 | ||
10.1 | ||
10.2 | ||
**10.3 | ||
**10.4 | ||
**10.5 | ||
**10.6 | ||
**10.7 | ||
**10.8 | ||
10.9 | ||
**10.10 | ||
**10.11 | ||
**10.12 | ||
104
Exhibit Number | Description | |
**10.13 | ||
**10.14 | ||
**10.15 | ||
**10.16 | ||
**10.17 | ||
**10.18 | ||
**10.19 | ||
**10.20 | ||
**10.21 | ||
**10.22 | ||
**10.23 | ||
**10.24 | ||
**10.25 | ||
**10.26 | ||
**10.27 | ||
**10.28 | ||
105
Exhibit Number | Description | |
**10.29 | ||
*12.1 | ||
21.1 | ||
*23.1 | ||
*31.1 | ||
*31.2 | ||
*32.1 | ||
*32.2 | ||
*101.INS | XBRL Instance | |
*101.SCH | XBRL Taxonomy Extension Schema | |
*101.CAL | XBRL Taxonomy Extension Calculation | |
*101.DEF | XBRL Taxonomy Extension Definition | |
*101.LAB | XBRL Taxonomy Extension Label | |
*101.PRE | XBRL Taxonomy Extension Presentation | |
_____________________________
* | Filed herewith. | |
** | Management contract or compensatory plan or arrangement required to be filed as an exhibit to this Annual Report on Form 10-K. | |
106
SIGNATURES
Pursuant to the requirements of Section 13 or 15(d) of the Securities Exchange Act of 1934, the registrant has duly caused this report to be signed on its behalf by the undersigned, thereunto duly authorized.
KAISER ALUMINUM CORPORATION | |||
/s/ Jack A. Hockema | |||
Jack A. Hockema | |||
Chief Executive Officer and Chairman | |||
Date: February 22, 2018
Pursuant to the requirements of the Securities Exchange Act of 1934, this report has been signed below by the following persons on behalf of the registrant and in the capacities and on the dates indicated.
/s/ Jack A. Hockema | Chief Executive Officer, Chairman of the Board and Director (Principal Executive Officer) | Date: February 22, 2018 | ||
Jack A. Hockema | ||||
/s/ Daniel J. Rinkenberger | Executive Vice President and Chief Financial Officer (Principal Financial Officer) | Date: February 22, 2018 | ||
Daniel J. Rinkenberger | ||||
/s/ Neal West | Vice President and Chief Accounting Officer (Principal Accounting Officer) | Date: February 22, 2018 | ||
Neal West | ||||
/s/ Carolyn Bartholomew | Director | Date: February 22, 2018 | ||
Carolyn Bartholomew | ||||
Director | ||||
David Foster | ||||
Director | ||||
L. Patrick Hassey | ||||
/s/ Teresa A. Hopp | Director | Date: February 22, 2018 | ||
Teresa A. Hopp | ||||
/s/ Lauralee Martin | Director | Date: February 22, 2018 | ||
Lauralee Martin | ||||
/s/ Alfred E. Osborne, Jr., Ph.D. | Director | Date: February 22, 2018 | ||
Alfred E. Osborne, Jr., Ph.D. | ||||
Director | ||||
Jack Quinn | ||||
/s/ Thomas M. Van Leeuwen | Director | Date: February 22, 2018 | ||
Thomas M. Van Leeuwen | ||||
/s/ Brett E. Wilcox | Director | Date: February 22, 2018 | ||
Brett E. Wilcox | ||||
107