Attached files
| file | filename |
|---|---|
| EX-99.4 - EX-99.4 - RE/MAX Holdings, Inc. | a18-6713_1ex99d4.htm |
| EX-99.3 - EX-99.3 - RE/MAX Holdings, Inc. | a18-6713_1ex99d3.htm |
| EX-99.1 - EX-99.1 - RE/MAX Holdings, Inc. | a18-6713_1ex99d1.htm |
| 8-K - 8-K - RE/MAX Holdings, Inc. | a18-6713_18k.htm |

Forward-Looking Statements and Preliminary Financial Information This presentation includes “forward-looking statements” within the meaning of the “safe harbor” provisions of the United States Private Securities Litigation Reform Act of 1995. Forward-looking statements are often identified by the use of words such as “believe,” “intend,” “expect,” “estimate,” “plan,” “outlook,” “project,” “anticipate,” “may,” “will,” “would” and other similar words and expressions that predict or indicate future events or trends that are not statements of historical matters. Forward-looking statements include statements regarding the Company’s strategic and operational plans and business models. Forward-looking statements should not be read as a guarantee of future performance or results, and will not necessarily accurately indicate the times at which such performance or results may be achieved. Forward-looking statements are based on information available at the time those statements are made and/or management’s good faith belief as of that time with respect to future events, and are subject to risks and uncertainties that could cause actual performance or results to differ materially from those expressed in or suggested by the forward-looking statements. Such risks and uncertainties include, without limitation, (1) that the Company’s preliminary results for the third quarter of 2017 are subject to change pending the completion of the Company’s quarter-end closing and review process and the audit of its financial statements for fiscal year 2017, (2) the impact of the findings and recommendations of the Special Committee on the Company and its management and operations, including reputational damage to the Company and the time and expenses incurred in implementing the recommendations of the Special Committee, (3) that, while the Special Committee investigation has been completed, the full implications of the investigation on the Company and its operations are still being evaluated and there may be unanticipated adverse or negative consequences that are not identified at this time, including reputational damage to the Company as well as the time and expense incurred in implementing the recommendations of the Special Committee, (4) any legal proceedings or governmental or regulatory investigations or actions directly or indirectly related to the underlying matters of the Special Committee’s internal investigation may result in adverse findings, the imposition of fines or other penalties, increased costs and expenses, and the diversion of management’s time and resources to address such matters, any of which may have a material adverse effect on the Company, (5) the impact of recent changes to our senior management team, (6) the impact of disclosing previously undisclosed transactions between members of our management team, including the loan from David Liniger to Adam Contos, (7) the existence and identification of control deficiencies, including disclosure controls or internal controls over financial reporting, and any impact of such control deficiencies as well as the associated costs in remediating those control deficiencies, (8) changes in business and economic activity in general, (9) changes in the real estate market or interest rates and availability of financing, (10) the Company’s ability to attract and retain quality franchisees, (11) the Company’s franchisees’ ability to recruit and retain real estate agents and mortgage loan originators, (12) changes in laws and regulations, (13) the Company’s ability to enhance, market, and protect the RE/MAX and Motto Mortgage brands, (14) fluctuations in foreign currency exchange rates, and (15) the impact of the TCJA, as well as those risks and uncertainties described in the sections entitled “Risk Factors” and “Management’s Discussion and Analysis of Financial Condition and Results of Operations” in the most recent Annual Report on Form 10-K filed with the Securities and Exchange Commission (“SEC”) and similar disclosures in subsequent periodic and current reports filed with the SEC, which are available on the investor relations page of the Company’s website at www.remax.com and on the SEC website at www.sec.gov. Readers are cautioned not to place undue reliance on forward-looking statements, which speak only as of the date on which they are made. Except as required by law, the Company does not intend, and undertakes no obligation, to update this information to reflect future events or circumstances. The preliminary financial results and other information set forth in this presentation related to the Company’s third quarter of 2017 are unaudited preliminary numbers which are subject to change. The Company has not completed its quarter-end closing and review process and the audit process for its full-year financial statements with its independent registered public accounting firm. The Company’s final results and financial information for the third quarter may vary materially from the preliminary financial information included in this presentation.
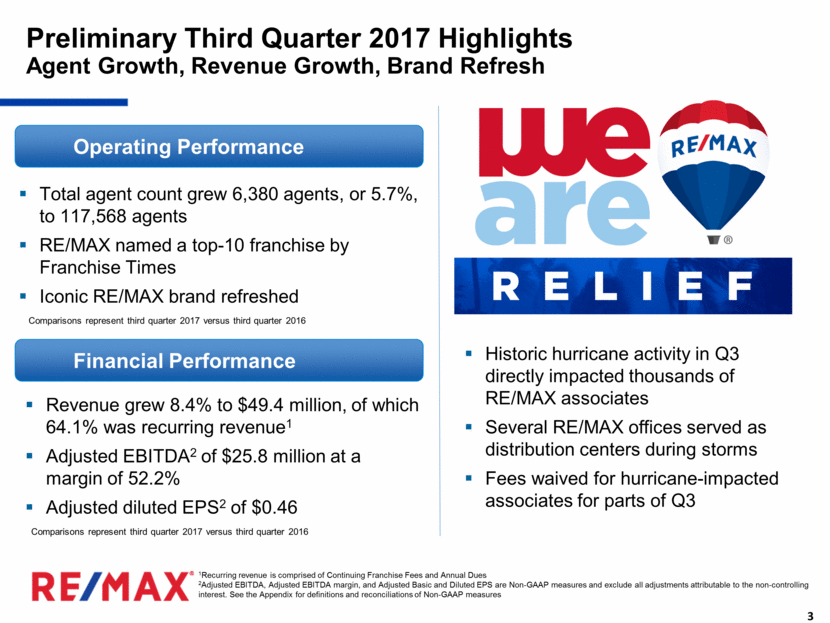
Preliminary Third Quarter 2017 Highlights Agent Growth, Revenue Growth, Brand Refresh Total agent count grew 6,380 agents, or 5.7%, to 117,568 agents RE/MAX named a top-10 franchise by Franchise Times Iconic RE/MAX brand refreshed Revenue grew 8.4% to $49.4 million, of which 64.1% was recurring revenue1 Adjusted EBITDA2 of $25.8 million at a margin of 52.2% Adjusted diluted EPS2 of $0.46 Operating Performance 1Recurring revenue is comprised of Continuing Franchise Fees and Annual Dues 2Adjusted EBITDA, Adjusted EBITDA margin, and Adjusted Basic and Diluted EPS are Non-GAAP measures and exclude all adjustments attributable to the non-controlling interest. See the Appendix for definitions and reconciliations of Non-GAAP measures Financial Performance Comparisons represent third quarter 2017 versus third quarter 2016 Historic hurricane activity in Q3 directly impacted thousands of RE/MAX associates Several RE/MAX offices served as distribution centers during storms Fees waived for hurricane-impacted associates for parts of Q3 Comparisons represent third quarter 2017 versus third quarter 2016
Iconic RE/MAX Brand Refreshed Extensive Customer Surveys Drove the Outcome More than 20,000 U.S. & Canadian consumers surveyed Contemporary twist on #1 real estate brand1 Works well across all social, digital and mobile marketing platforms 1Source: MMR Strategy Group study of unaided brand awareness in the U.S. and Canada

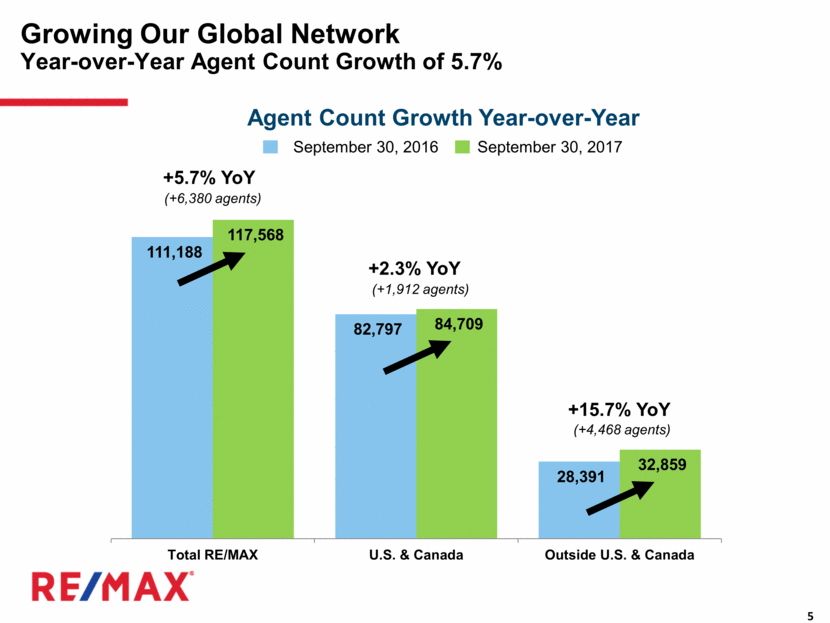
Growing Our Global Network Year-over-Year Agent Count Growth of 5.7% (+6,380 agents) +5.7% YoY +2.3% YoY (+1,912 agents) +15.7% YoY (+4,468 agents) September 30, 2016 September 30, 2017 Agent Count Growth Year-over-Year 111,188 82,797 28,391 117,568 84,709 32,859 Total RE/MAX U.S. & Canada Outside U.S. & Canada
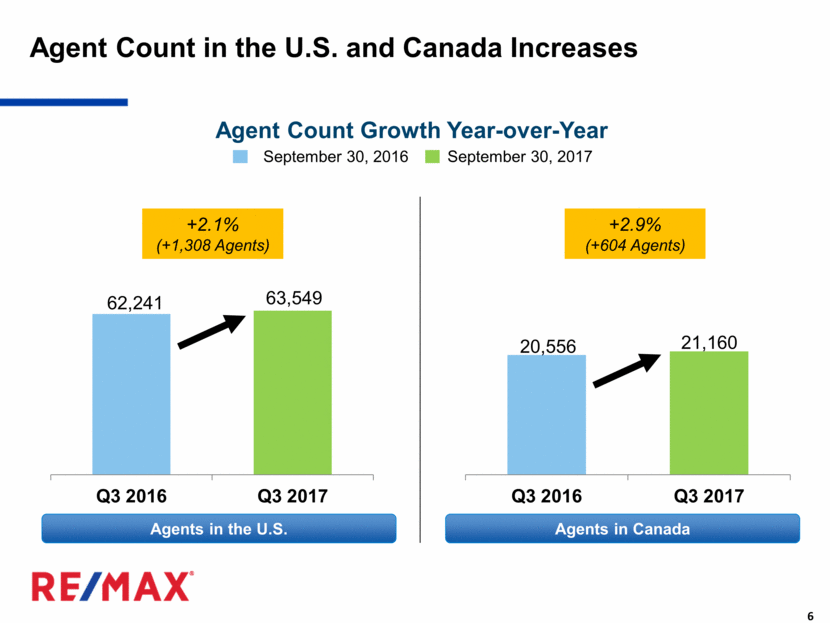
Agent Count in the U.S. and Canada Increases Agents in the U.S. Agent Count Growth Year-over-Year Agents in Canada +2.9% (+604 Agents) +2.1% (+1,308 Agents) September 30, 2016 September 30, 2017 20,556 21,160 Q3 2016 Q3 2017 62,241 63,549 Q3 2016 Q3 2017
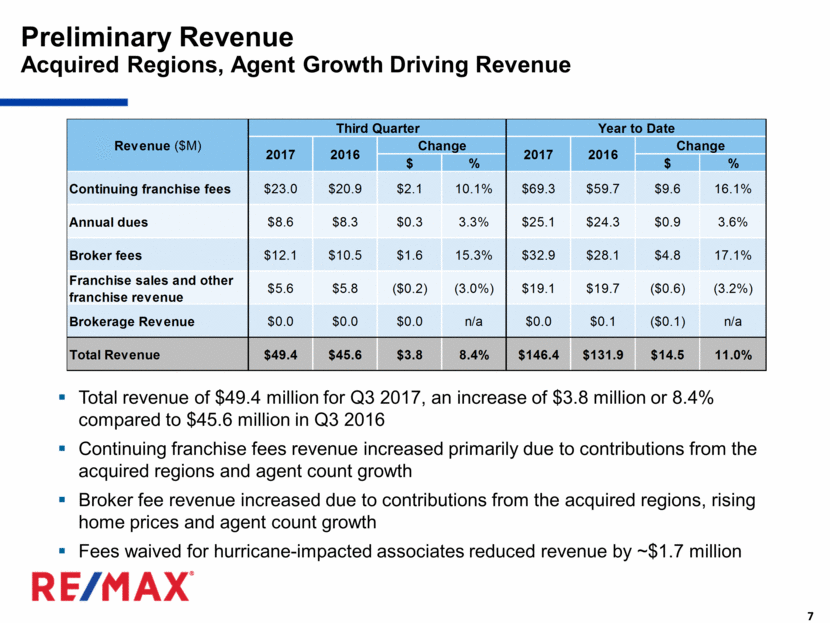
Preliminary Revenue Acquired Regions, Agent Growth Driving Revenue Total revenue of $49.4 million for Q3 2017, an increase of $3.8 million or 8.4% compared to $45.6 million in Q3 2016 Continuing franchise fees revenue increased primarily due to contributions from the acquired regions and agent count growth Broker fee revenue increased due to contributions from the acquired regions, rising home prices and agent count growth Fees waived for hurricane-impacted associates reduced revenue by ~$1.7 million Revenue ($M) Third Quarter Year to Date 2017 2016 Change 2017 2016 Change $ % $ % Continuing franchise fees $23.0 $20.9 $2.1 10.1% $69.3 $59.7 $9.6 16.1% Annual dues $8.6 $8.3 $0.3 3.3% $25.1 $24.3 $0.9 3.6% Broker fees $12.1 $10.5 $1.6 15.3% $32.9 $28.1 $4.8 17.1% Franchise sales and other franchise revenue $5.6 $5.8 ($0.2) (3.0%) $19.1 $19.7 ($0.6) (3.2%) Brokerage Revenue $0.0 $0.0 $0.0 n/a $0.0 $0.1 ($0.1) n/a Total Revenue $49.4 $45.6 $3.8 8.4% $146.4 $131.9 $14.5 11.0%
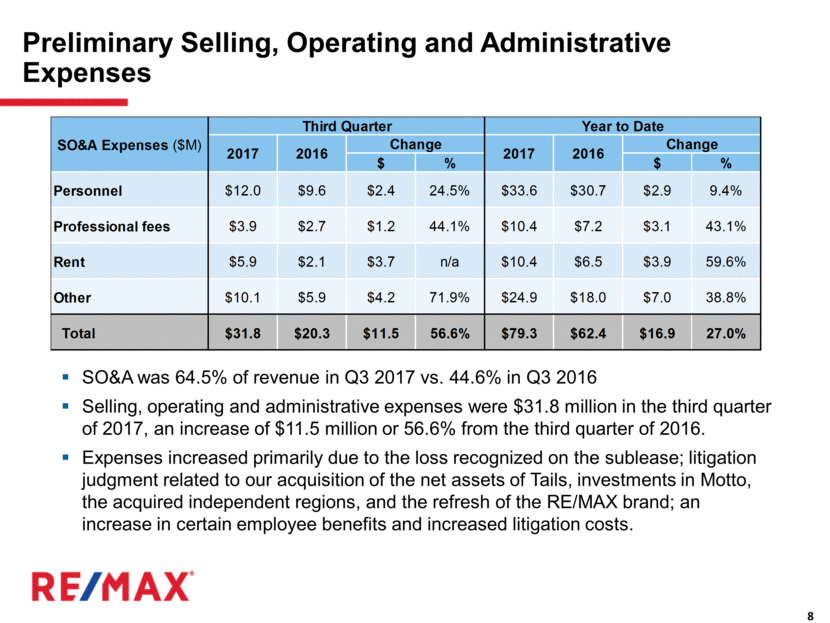
Preliminary Selling, Operating and Administrative Expenses SO&A was 64.5% of revenue in Q3 2017 vs. 44.6% in Q3 2016 Selling, operating and administrative expenses were $31.8 million in the third quarter of 2017, an increase of $11.5 million or 56.6% from the third quarter of 2016. Expenses increased primarily due to the loss recognized on the sublease; litigation judgment related to our acquisition of the net assets of Tails, investments in Motto, the acquired independent regions, and the refresh of the RE/MAX brand; an increase in certain employee benefits and increased litigation costs. $ % $ % Personnel $12.0 $9.6 $2.4 24.5% $33.6 $30.7 $2.9 9.4% Professional fees $3.9 $2.7 $1.2 44.1% $10.4 $7.2 $3.1 43.1% Rent $5.9 $2.1 $3.7 n/a $10.4 $6.5 $3.9 59.6% Other $10.1 $5.9 $4.2 71.9% $24.9 $18.0 $7.0 38.8% Total $31.8 $20.3 $11.5 56.6% $79.3 $62.4 $16.9 27.0% SO&A Expenses ($M) Third Quarter Year to Date 2017 2016 Change 2017 2016 Change
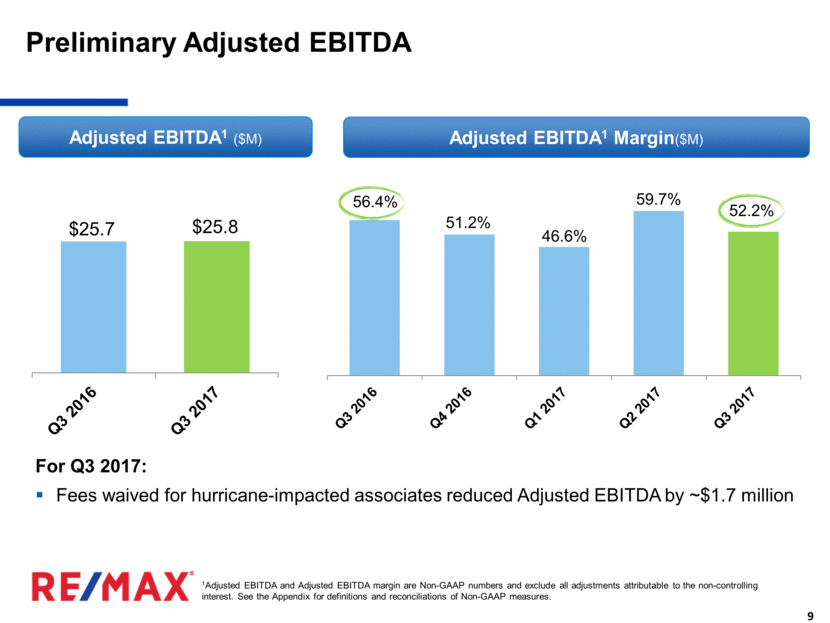
Adjusted EBITDA1 ($M) Preliminary Adjusted EBITDA For Q3 2017: Fees waived for hurricane-impacted associates reduced Adjusted EBITDA by ~$1.7 million 1Adjusted EBITDA and Adjusted EBITDA margin are Non-GAAP numbers and exclude all adjustments attributable to the non-controlling interest. See the Appendix for definitions and reconciliations of Non-GAAP measures. Adjusted EBITDA1 Margin($M) 56.4% 51.2% 46.6% 59.7% 52.2% $25.7 $25.8
Strong Balance Sheet Bolsters Ability to Reinvest and Return Capital to Shareholders Preliminary Balance Sheet & Leverage Cash balance of $83.9 million on September 30, 2017, up $26.3 million from December 31, 2016 $229.4 million in term loans1 and no revolving loans outstanding Total Debt / Adjusted EBITDA of 2.3x2 Net Debt / Adjusted EBITDA of 1.5x3 Dividend Announced quarterly dividend of $0.18 per share payable on November 29, 2017 to shareholders of record at the close of business on November 15, 2017 1Net of unamortized debt discount and debt issuance costs 2Based on twelve months ended September 30, 2017, Adjusted EBITDA of $100.2M and total debt of $229.4M, net of unamortized debt discount and debt issuance costs 3Based on twelve months ended September 30, 2017, Adjusted EBITDA of $100.2M and net debt of $145.5M, net of unamortized debt discount, debt issuance costs and cash balance at September 30, 2017

Leading Real Estate Franchisor with Recurring Revenues, High Margins and Strong Free Cash Flow #1 Real Estate Franchise Brand1 with Unmatched Global Footprint Highly Productive Network of More Than 115,000 Agents Agent-Centric Model is Different and Better Largely Recurring Fee-Based Revenue Model with Strong Margins & Cash Flow 100% Franchised Business Multiple Drivers of Shareholder Value Creation 1Source: MMR Strategy Group study of unaided brand awareness in the U.S. and Canada

[LOGO]

Appendix
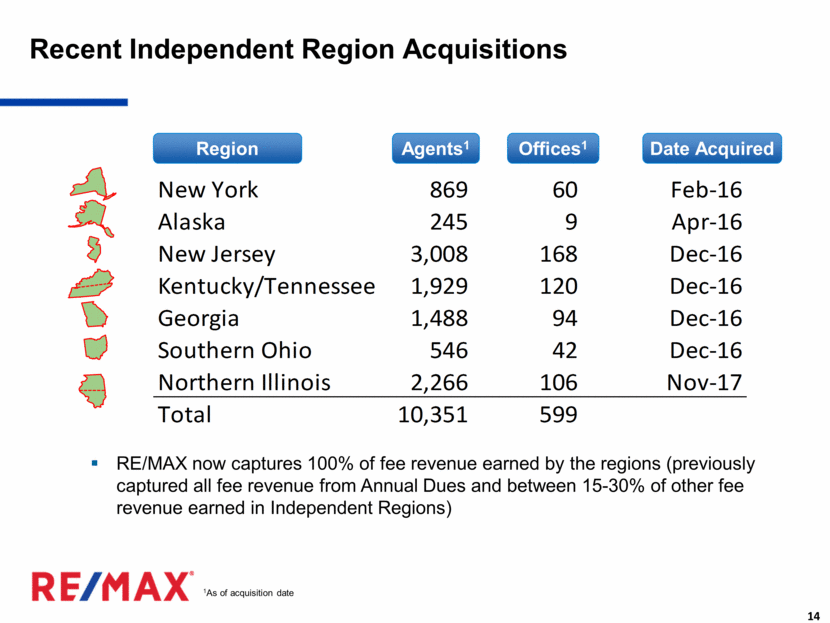
Recent Independent Region Acquisitions Region Agents1 RE/MAX now captures 100% of fee revenue earned by the regions (previously captured all fee revenue from Annual Dues and between 15-30% of other fee revenue earned in Independent Regions) Offices1 1As of acquisition date Date Acquired New York 869 60 Feb-16 Alaska 245 9 Apr-16 New Jersey 3,008 168 Dec-16 Kentucky/Tennessee 1,929 120 Dec-16 Georgia 1,488 94 Dec-16 Southern Ohio 546 42 Dec-16 Northern Illinois 2,266 106 Nov-17 Total 10,351 599
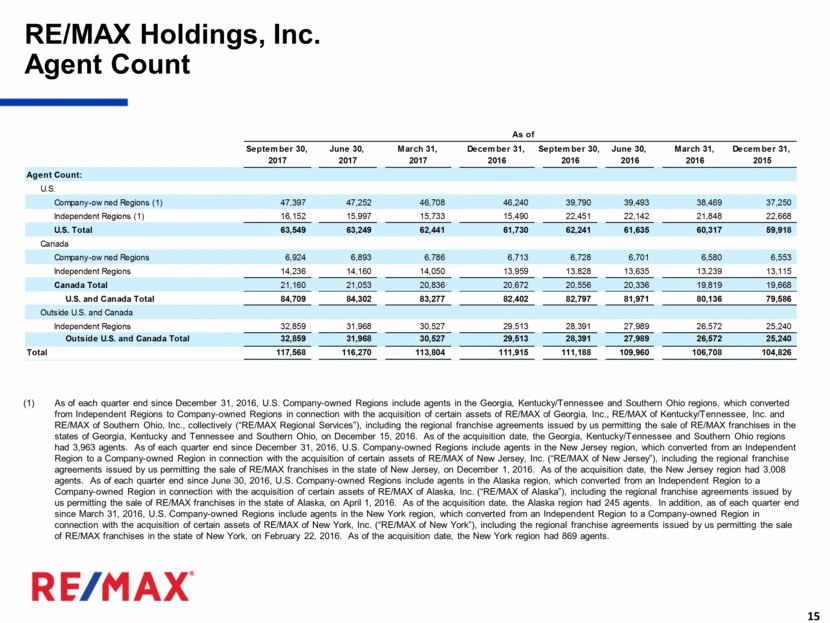
As of each quarter end since December 31, 2016, U.S. Company-owned Regions include agents in the Georgia, Kentucky/Tennessee and Southern Ohio regions, which converted from Independent Regions to Company-owned Regions in connection with the acquisition of certain assets of RE/MAX of Georgia, Inc., RE/MAX of Kentucky/Tennessee, Inc. and RE/MAX of Southern Ohio, Inc., collectively (“RE/MAX Regional Services”), including the regional franchise agreements issued by us permitting the sale of RE/MAX franchises in the states of Georgia, Kentucky and Tennessee and Southern Ohio, on December 15, 2016. As of the acquisition date, the Georgia, Kentucky/Tennessee and Southern Ohio regions had 3,963 agents. As of each quarter end since December 31, 2016, U.S. Company-owned Regions include agents in the New Jersey region, which converted from an Independent Region to a Company-owned Region in connection with the acquisition of certain assets of RE/MAX of New Jersey, Inc. (“RE/MAX of New Jersey”), including the regional franchise agreements issued by us permitting the sale of RE/MAX franchises in the state of New Jersey, on December 1, 2016. As of the acquisition date, the New Jersey region had 3,008 agents. As of each quarter end since June 30, 2016, U.S. Company-owned Regions include agents in the Alaska region, which converted from an Independent Region to a Company-owned Region in connection with the acquisition of certain assets of RE/MAX of Alaska, Inc. (“RE/MAX of Alaska”), including the regional franchise agreements issued by us permitting the sale of RE/MAX franchises in the state of Alaska, on April 1, 2016. As of the acquisition date, the Alaska region had 245 agents. In addition, as of each quarter end since March 31, 2016, U.S. Company-owned Regions include agents in the New York region, which converted from an Independent Region to a Company-owned Region in connection with the acquisition of certain assets of RE/MAX of New York, Inc. (“RE/MAX of New York”), including the regional franchise agreements issued by us permitting the sale of RE/MAX franchises in the state of New York, on February 22, 2016. As of the acquisition date, the New York region had 869 agents. RE/MAX Holdings, Inc. Agent Count As of September 30, June 30, March 31, December 31, September 30, June 30, March 31, December 31, 2017 2017 2017 2016 2016 2016 2016 2015 Agent Count: U.S. Company-owned Regions (1) 47,397 47,252 46,708 46,240 39,790 39,493 38,469 37,250 Independent Regions (1) 16,152 15,997 15,733 15,490 22,451 22,142 21,848 22,668 U.S. Total 63,549 63,249 62,441 61,730 62,241 61,635 60,317 59,918 Canada Company-owned Regions 6,924 6,893 6,786 6,713 6,728 6,701 6,580 6,553 Independent Regions 14,236 14,160 14,050 13,959 13,828 13,635 13,239 13,115 Canada Total 21,160 21,053 20,836 20,672 20,556 20,336 19,819 19,668 U.S. and Canada Total 84,709 84,302 83,277 82,402 82,797 81,971 80,136 79,586 Outside U.S. and Canada Independent Regions 32,859 31,968 30,527 29,513 28,391 27,989 26,572 25,240 Outside U.S. and Canada Total 32,859 31,968 30,527 29,513 28,391 27,989 26,572 25,240 Total 117,568 116,270 113,804 111,915 111,188 109,960 106,708 104,826
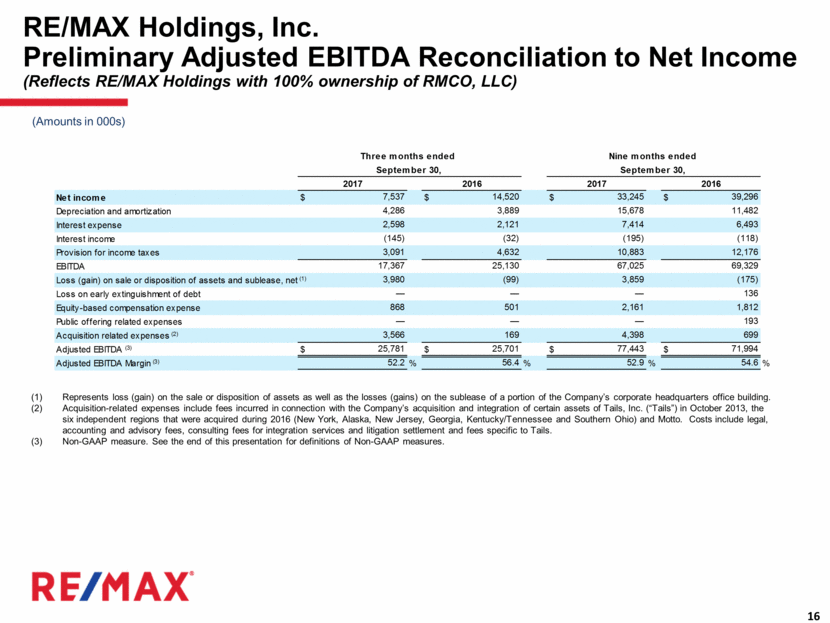
Represents loss (gain) on the sale or disposition of assets as well as the losses (gains) on the sublease of a portion of the Company’s corporate headquarters office building. Acquisition-related expenses include fees incurred in connection with the Company’s acquisition and integration of certain assets of Tails, Inc. (“Tails”) in October 2013, the six independent regions that were acquired during 2016 (New York, Alaska, New Jersey, Georgia, Kentucky/Tennessee and Southern Ohio) and Motto. Costs include legal, accounting and advisory fees, consulting fees for integration services and litigation settlement and fees specific to Tails. Non-GAAP measure. See the end of this presentation for definitions of Non-GAAP measures. RE/MAX Holdings, Inc. Preliminary Adjusted EBITDA Reconciliation to Net Income (Reflects RE/MAX Holdings with 100% ownership of RMCO, LLC) (Amounts in 000s) Net income $ 7,537 $ 14,520 $ 33,245 $ 39,296 Depreciation and amortization 4,286 3,889 15,678 11,482 Interest expense 2,598 2,121 7,414 6,493 Interest income (145) (32) (195) (118) Provision for income taxes 3,091 4,632 10,883 12,176 EBITDA 17,367 25,130 67,025 69,329 Loss (gain) on sale or disposition of assets and sublease, net (1) 3,980 (99) 3,859 (175) Loss on early extinguishment of debt — — — 136 Equity-based compensation expense 868 501 2,161 1,812 Public offering related expenses — — — 193 Acquisition related expenses (2) 3,566 169 4,398 699 Adjusted EBITDA (3) $ 25,781 $ 25,701 $ 77,443 $ 71,994 Adjusted EBITDA Margin (3) 52.2 % 56.4 % 52.9 % 54.6 % 2017 2016 Three months ended Nine months ended 2017 2016 September 30, September 30,
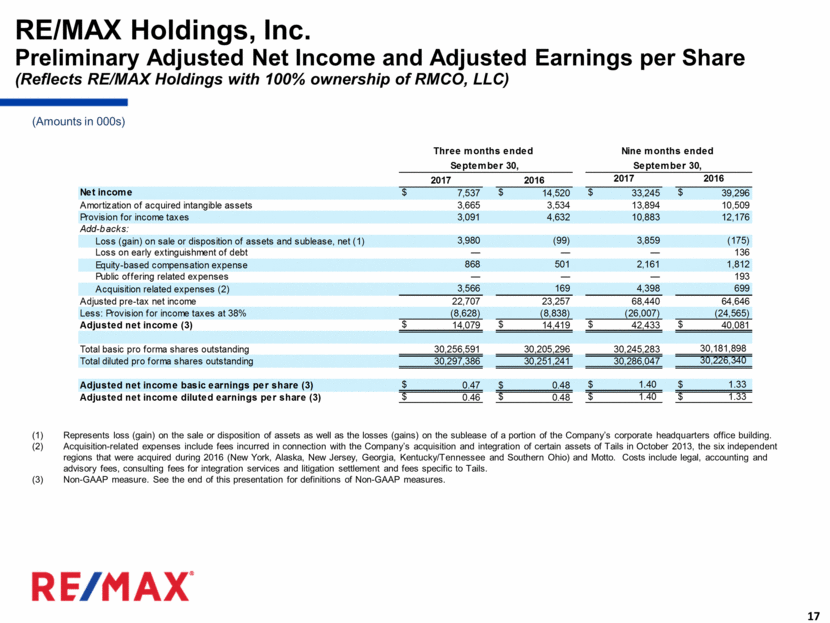
Represents loss (gain) on the sale or disposition of assets as well as the losses (gains) on the sublease of a portion of the Company’s corporate headquarters office building. Acquisition-related expenses include fees incurred in connection with the Company’s acquisition and integration of certain assets of Tails in October 2013, the six independent regions that were acquired during 2016 (New York, Alaska, New Jersey, Georgia, Kentucky/Tennessee and Southern Ohio) and Motto. Costs include legal, accounting and advisory fees, consulting fees for integration services and litigation settlement and fees specific to Tails. Non-GAAP measure. See the end of this presentation for definitions of Non-GAAP measures. RE/MAX Holdings, Inc. Preliminary Adjusted Net Income and Adjusted Earnings per Share (Reflects RE/MAX Holdings with 100% ownership of RMCO, LLC) (Amounts in 000s) Net income $ 7,537 $ 14,520 $ 33,245 $ 39,296 Amortization of acquired intangible assets 3,665 3,534 13,894 10,509 Provision for income taxes 3,091 4,632 10,883 12,176 Add-backs: Loss (gain) on sale or disposition of assets and sublease, net (1) 3,980 (99) 3,859 (175) Loss on early extinguishment of debt — — — 136 Equity-based compensation expense 868 501 2,161 1,812 Public offering related expenses — — — 193 Acquisition related expenses (2) 3,566 169 4,398 699 Adjusted pre-tax net income 22,707 23,257 68,440 64,646 Less: Provision for income taxes at 38% (8,628) (8,838) (26,007) (24,565) Adjusted net income (3) $ 14,079 $ 14,419 $ 42,433 $ 40,081 Total basic pro forma shares outstanding 30,256,591 30,205,296 30,245,283 30,181,898 Total diluted pro forma shares outstanding 30,297,386 30,251,241 30,286,047 30,226,340 Adjusted net income basic earnings per share (3) $ 0.47 $ 0.48 $ 1.40 $ 1.33 Adjusted net income diluted earnings per share (3) $ 0.46 $ 0.48 $ 1.40 $ 1.33 2017 2016 Three months ended Nine months ended 2017 2016 September 30, September 30,
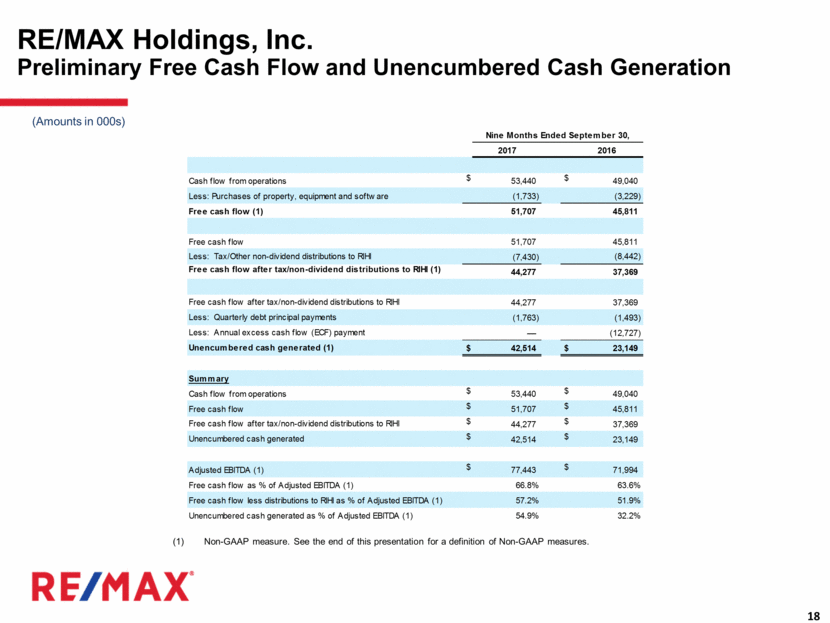
Non-GAAP measure. See the end of this presentation for a definition of Non-GAAP measures. RE/MAX Holdings, Inc. Preliminary Free Cash Flow and Unencumbered Cash Generation (Amounts in 000s) 2017 2016 Cash flow from operations $ 53,440 $ 49,040 Less: Purchases of property, equipment and software (1,733) (3,229) Free cash flow (1) 51,707 45,811 Free cash flow 51,707 45,811 Less: Tax/Other non-dividend distributions to RIHI (7,430) (8,442) Free cash flow after tax/non-dividend distributions to RIHI (1) 44,277 37,369 Free cash flow after tax/non-dividend distributions to RIHI 44,277 37,369 Less: Quarterly debt principal payments (1,763) (1,493) Less: Annual excess cash flow (ECF) payment — (12,727) Unencumbered cash generated (1) $ 42,514 $ 23,149 Summary Cash flow from operations $ 53,440 $ 49,040 Free cash flow $ 51,707 $ 45,811 Free cash flow after tax/non-dividend distributions to RIHI $ 44,277 $ 37,369 Unencumbered cash generated $ 42,514 $ 23,149 Adjusted EBITDA (1) $ 77,443 $ 71,994 Free cash flow as % of Adjusted EBITDA (1) 66.8% 63.6% Free cash flow less distributions to RIHI as % of Adjusted EBITDA (1) 57.2% 51.9% Unencumbered cash generated as % of Adjusted EBITDA (1) 54.9% 32.2% Nine Months Ended September 30,
The SEC has adopted rules to regulate the use in filings with the SEC and in public disclosures of financial measures that are not in accordance with U.S. GAAP, such as Adjusted EBITDA and the ratios related thereto, Adjusted net income, Adjusted basic and diluted earnings per share (Adjusted EPS) and Free cash flow. These measures are derived on the basis of methodologies other than in accordance with U.S. GAAP. The Company calculates Adjusted EBITDA as EBITDA (consolidated net income before depreciation and amortization, interest expense, interest income and the provision for income taxes, each of which is presented in the unaudited condensed consolidated financial statements included in the Quarterly Report on Form 10-Q), adjusted for the impact of the following items that are either non-cash or the Company does not consider representative of its ongoing operating performance: loss or gain on sale or disposition of assets and sublease, loss on early extinguishment of debt, equity-based compensation expense, professional fees and certain expenses incurred in connection with the issuance of Class A common stock as a result of RIHI’s redemption of common units in RMCO and acquisition-related expense. Adjusted EBITDA margin represents Adjusted EBITDA as a percentage of revenue. During the first quarter of 2017, the Company revised its definitions of Adjusted EBITDA and Adjusted EBITDA margin to better reflect the performance of the business and comply with SEC guidance. The Company now adjusts for equity-based compensation expense and no longer adjusts for straight-line rent expense and severance-related expenses. Adjusted EBITDA and Adjusted EBITDA margin were revised in prior periods to reflect this change for consistency in presentation. Because Adjusted EBITDA and Adjusted EBITDA margin omit certain non-cash items and other non-recurring cash charges or other items, the Company believes that each measure is less susceptible to variances that affect its operating performance resulting from depreciation, amortization and other non-cash and non-recurring cash charges or other items. The Company presents Adjusted EBITDA and the related Adjusted EBITDA margin because the Company believes they are useful as supplemental measures in evaluating the performance of its operating businesses and provides greater transparency into the Company’s results of operations. The Company’s management uses Adjusted EBITDA and Adjusted EBITDA margin as factors in evaluating the performance of the business. Adjusted EBITDA and Adjusted EBITDA margin have limitations as analytical tools, and you should not consider these measures in isolation or as a substitute for analyzing the Company’s results as reported under U.S. GAAP. Some of these limitations are: these measures do not reflect changes in, or cash requirements for, the Company’s working capital needs; these measures do not reflect the Company’s interest expense, or the cash requirements necessary to service interest or principal payments on its debt; these measures do not reflect the Company’s income tax expense or the cash requirements to pay its taxes; these measures do not reflect the cash requirements to pay dividends to stockholders of the Company’s Class A common stock and tax and other cash distributions to its non-controlling unitholders; these measures do not reflect the cash requirements to pay RIHI Inc. and Oberndorf pursuant to the tax receivable agreements; although depreciation and amortization are non-cash charges, the assets being depreciated and amortized will often require replacement in the future, and these measures do not reflect any cash requirements for such replacements; although equity-based compensation is a non-cash charge, the issuance of equity-based awards may have a dilutive impact on earnings per share; and other companies may calculate these measures differently so similarly named measures may not be comparable. The Company’s Adjusted EBITDA margin guidance does not include certain charges and costs. The adjustments to EBITDA margin in future periods are generally expected to be similar to the kinds of charges and costs excluded from Adjusted EBITDA margin in prior quarters, such as gain on sale or disposition of assets and sublease and acquisition related expenses, among others. The exclusion of these charges and costs in future periods will have a significant impact on the Company’s Adjusted EBITDA margin. The Company is not able to provide a reconciliation of the Company’s Non-GAAP financial guidance to the corresponding U.S. GAAP measures without unreasonable effort because of the uncertainty and variability of the nature and amount of these future charges and costs. Non-GAAP Financial Measures
Adjusted net income is calculated as Net income attributable to RE/MAX Holdings, assuming the full exchange of all outstanding non-controlling interests for shares of Class A common stock as of the beginning of the period (and the related increase to the provision for income taxes after such exchange), plus primarily non-cash items and other items that management does not consider to be useful in assessing the Company’s operating performance (e.g., amortization of acquired intangible assets, loss or gain on sale or disposition of assets and sublease, loss on early debt extinguishment, public-offering related expenses, acquisition-related expenses and equity-based compensation expense). Adjusted basic and diluted earnings per share (Adjusted EPS) are calculated as Adjusted net income (as defined above) divided by pro forma (assuming the full exchange of all outstanding non-controlling interests) basic and diluted weighted average shares, as applicable. When used in conjunction with GAAP financial measures, Adjusted net income and Adjusted EPS are supplemental measures of operating performance that management believes are useful measures to evaluate the Company’s performance relative to the performance of its competitors as well as performance period over period. By assuming the full exchange of all outstanding non-controlling interests, management believes these measures: facilitate comparisons with other companies that do not have a low effective tax rate driven by a non-controlling interest on a pass-through entity; facilitate period over period comparisons because they eliminate the effect of changes in Net income attributable to RE/MAX Holdings, Inc. driven by increases in its ownership of RMCO, LLC, which are unrelated to the Company’s operating performance; and eliminate primarily non-cash and other items that management does not consider to be useful in assessing the Company’s operating performance. Free cash flow is calculated as cash flows from operations less capital expenditures, both as reported under GAAP, and quantifies how much cash a company has to pursue opportunities that enhance shareholder value. The Company believes free cash flow is useful to investors as a supplemental measure as it calculates the cash flow available for working capital needs, re-investment opportunities, potential independent region and strategic acquisitions, dividend payments or other strategic uses of cash. Free cash flow after tax and non-dividend distributions to RIHI is calculated as free cash flow less tax and other non-dividend distributions paid to RIHI (the non-controlling interest holder) to enable RIHI to satisfy its income tax obligations. Similar payments would be made by the Company directly to federal and state taxing authorities as a component of the Company’s consolidated provision for income taxes if a full exchange of non-controlling interests occurred in the future. As a result and given the significance of the Company’s ongoing tax and non-dividend distribution obligations to its non-controlling interest, free cash flow after tax and non-dividend distributions, when used in conjunction with GAAP financial measures, provides a meaningful view of cash flow available to the Company to pursue opportunities that enhance shareholder value. Unencumbered cash generated is calculated as free cash flow after tax and non-dividend distributions to RIHI less quarterly debt principal payments less annual excess cash flow payment on debt, as applicable. Given the significance of the Company’s excess cash flow payment on debt, when applicable, unencumbered cash generated, when used in conjunction with GAAP financial measures, provides a meaningful view of the cash flow available to the Company to pursue opportunities that enhance shareholder value after considering its debt service obligations. Non-GAAP Financial Measures (continued)