Attached files
| file | filename |
|---|---|
| EX-32 - EXHIBIT 32 - ERIE INDEMNITY CO | ex-3212312017.htm |
| EX-31.2 - EXHIBIT 31.2 - ERIE INDEMNITY CO | ex-31212312017.htm |
| EX-31.1 - EXHIBIT 31.1 - ERIE INDEMNITY CO | ex-31112312017.htm |
| EX-23 - EXHIBIT 23 - ERIE INDEMNITY CO | ex-2312312017.htm |
| EX-10.186 - EXHIBIT 10.186 - ERIE INDEMNITY CO | ex-1018612312017.htm |
| EX-10.185 - EXHIBIT 10.185 - ERIE INDEMNITY CO | ex-1018512312017.htm |
| EX-3.9 - EXHIBIT 3.9 - ERIE INDEMNITY CO | ex-3912312017.htm |
UNITED STATES SECURITIES AND EXCHANGE COMMISSION
WASHINGTON, D.C. 20549
FORM 10-K
[X] ANNUAL REPORT PURSUANT TO SECTION 13 OR 15(d) OF THE SECURITIES EXCHANGE ACT OF 1934
For the fiscal year ended December 31, 2017
OR
[ ] TRANSITION REPORT PURSUANT TO SECTION 13 OR 15(d) OF THE SECURITIES EXCHANGE ACT OF 1934
Commission File Number 0-24000
ERIE INDEMNITY COMPANY | ||
(Exact name of registrant as specified in its charter)
Pennsylvania | 25-0466020 | |||
(State or other jurisdiction | (I.R.S. Employer | |||
of incorporation or organization) | Identification No.) | |||
100 Erie Insurance Place, Erie, Pennsylvania | 16530 | |||
(Address of principal executive offices) | (Zip code) | |||
(814) 870-2000 | ||
(Registrant's telephone number, including area code)
Securities registered pursuant to Section 12(b) of the Act:
Class A common stock, stated value $0.0292 per share, listed on the NASDAQ Stock Market, LLC | |||
(Title of each class) | (Name of each exchange on which registered) | ||
Securities registered pursuant to Section 12(g) of the Act: None
Indicate by check mark if the registrant is a well-known seasoned issuer, as defined in Rule 405 of the Securities Act. Yes X No
Indicate by check mark if the registrant is not required to file reports pursuant to Section 13 or Section 15(d) of the Act. Yes No X
Indicate by check mark whether the registrant (1) has filed all reports required to be filed by Section 13 or 15(d) of the Securities Exchange Act of 1934 during the preceding 12 months (or for such shorter period that the registrant was required to file such reports), and (2) has been subject to such filing requirements for the past 90 days. Yes X No
Indicate by check mark whether the registrant has submitted electronically and posted on its corporate Web site, if any, every Interactive Data File required to be submitted and posted pursuant to Rule 405 of Regulation S-T during the preceding 12 months (or for such shorter period that the registrant was required to submit and post such files). Yes X No ___
Indicate by check mark if disclosure of delinquent filers pursuant to Item 405 of Regulation S-K is not contained herein, and will not be contained, to the best of registrant's knowledge, in definitive proxy or information statements incorporated by reference in Part III of this Form 10-K or any amendment to this Form 10-K. [ ]
Indicate by check mark whether the registrant is a large accelerated filer, an accelerated filer, a non-accelerated filer, smaller reporting company, or an emerging growth company. See the definitions of "large accelerated filer," "accelerated filer," "smaller reporting company," and "emerging growth company" in Rule 12b-2 of the Exchange Act. (Check one):
Large accelerated filer X | Accelerated filer | Non-accelerated filer | |
Smaller reporting company | Emerging growth company | (Do not check if a smaller reporting company) | |
If an emerging growth company, indicate by check mark if the registrant has elected not to use the extended transition period for complying with any new or revised financial accounting standards provided pursuant to Section 13(a) of the Exchange Act. [ ]
Indicate by check mark whether the registrant is a shell company (as defined in Rule 12b-2 of the Exchange Act). Yes No X
Aggregate market value of voting and non-voting common stock held by non-affiliates as of the last business day of the registrant's most recently completed second fiscal quarter: $3.1 billion of Class A non-voting common stock as of June 30, 2017. There is no active market for the Class B voting common stock. The Class B common stock is closely held by few shareholders.
Indicate the number of shares outstanding of each of the registrant's classes of common stock, as of the latest practicable date:
46,189,068 shares of Class A common stock and 2,542 shares of Class B common stock outstanding on February 16, 2018.
DOCUMENTS INCORPORATED BY REFERENCE
Portions of Part III of this Form 10-K (Items 10, 11, 12, 13, and 14) are incorporated by reference to the information statement on Schedule 14(C) to be filed with the Securities and Exchange Commission no later than 120 days after December 31, 2017.
INDEX
PART | ITEM NUMBER AND CAPTION | PAGE | |
2
PART I
ITEM 1. BUSINESS
General
Erie Indemnity Company ("Indemnity", "we", "us", "our") is a publicly held Pennsylvania business corporation that has since its incorporation in 1925 served as the attorney-in-fact for the subscribers (policyholders) at the Erie Insurance Exchange ("Exchange"). The Exchange, which also commenced business in 1925, is a Pennsylvania-domiciled reciprocal insurer that writes property and casualty insurance. The Exchange has wholly owned property and casualty subsidiaries including: Erie Insurance Company, Erie Insurance Company of New York, Erie Insurance Property and Casualty Company and Flagship City Insurance Company, and a wholly owned life insurance company, Erie Family Life Insurance Company ("EFL"). We function solely as the management company and all insurance operations are the responsibility of the Exchange and its subsidiaries. We operate our business as one segment.
Our primary function, as attorney-in-fact, is to perform certain services on behalf of the subscribers at the Exchange relating to policy issuance and renewals including the sales, underwriting, and issuance of policies. This is done in accordance with a subscriber's agreement (a limited power of attorney) executed individually by each subscriber (policyholder), which appoints us as their common attorney-in-fact to transact certain business on their behalf and to manage the affairs of the Exchange. Pursuant to the subscriber's agreement and for its services as attorney-in-fact, we earn a management fee calculated as a percentage, not to exceed 25%, of the direct and assumed premiums written by the Exchange. The management fee rate is set at least annually by our Board of Directors. The process of setting the management fee rate includes the evaluation of current year operating results compared to both prior year and industry estimated results for both Indemnity and the Exchange, and consideration of several factors for both entities including: their relative financial strength and capital position; projected revenue, expense and earnings for the subsequent year; future capital needs; as well as competitive position.
Services
The services we provide to the subscribers at the Exchange are related to the sales, underwriting and issuance of policies. The sales related services we provide include agent compensation and certain sales and advertising support services. Agent compensation includes scheduled commissions to agents based upon premiums written as well as additional commissions and bonuses to agents, which are earned by achieving targeted measures. Agent compensation comprised approximately 68% of our 2017 expenses. The underwriting services we provide include underwriting and policy processing and comprised approximately 10% of our 2017 expenses. The remaining services we provide include customer service and administrative support. We also provide information technology services that support all the functions listed above that comprised approximately 10% of our 2017 expenses.
By virtue of its legal structure as a reciprocal insurer, the Exchange does not have the ability to enter into contractual relationships and therefore, Indemnity also serves as the attorney-in-fact on behalf of the Exchange for all claims handling and investment management services, which include certain common overhead and service department functions in accordance with the subscriber's agreement. The Exchange's insurance subsidiaries also utilize Indemnity for these services, including life management services for EFL, in accordance with the service agreements between each of the subsidiaries and Indemnity. Claims handling services include cost incurred in the claims process, including the adjustment, investigation, defense, recording and payment functions, as well as an allocation of costs for departments that support these claims functions. Life management services include costs incurred in the management and processing of life insurance business. Investment management services are related to investment trading activity, accounting and all other functions attributable to the investment of funds, including an allocation of costs for departments that support the investment function. The amounts incurred for these services are the responsibility of the Exchange and its insurance subsidiaries as outlined in the subscriber's agreement and the services agreements, and are reimbursed to Indemnity as cost. State insurance regulations require that intercompany service agreements and any material amendments be approved in advance by the state insurance department. See Part II, Item 8. "Financial Statements and Supplementary Data - Note 13, Related Party, of Notes to Financial Statements" contained within this report.
Erie Insurance Exchange
Our primary purpose is to manage the affairs at the Exchange for the benefit of the subscribers (policyholders). The Exchange is our sole customer and our earnings are largely generated from management fees based on the direct and assumed premiums written by the Exchange. We have no direct competition in providing these services to the Exchange.
The Exchange generates revenue by insuring preferred and standard risks, with personal lines comprising 71% of the 2017 direct and assumed written premiums and commercial lines comprising the remaining 29%. The principal personal lines products are private passenger automobile and homeowners. The principal commercial lines products are commercial multi-
3
peril, commercial automobile and workers compensation. Historically, due to policy renewal and sales patterns, the Exchange's direct and assumed written premiums are greater in the second and third quarters than in the first and fourth quarters of the calendar year.
The Exchange is represented by independent agencies that serve as its sole distribution channel. In addition to their principal role as salespersons, the independent agents play a significant role as underwriting and service providers and are an integral part of the Exchange's success.
Our results of operations are tied to the growth and financial condition of the Exchange. If any events occurred that impaired the Exchange's ability to grow or sustain its financial condition, including but not limited to reduced financial strength ratings, disruption in the independent agency relationships, significant catastrophe losses, or products not meeting customer demands, the Exchange could find it more difficult to retain its existing business and attract new business. A decline in the business of
the Exchange almost certainly would have as a consequence a decline in the total premiums paid and a correspondingly adverse
effect on the amount of the management fees we receive. We also have an exposure to a concentration of credit risk related to the unsecured receivables due from the Exchange. See Part II, Item 8. "Financial Statements and Supplementary Data - Note 14, Concentrations of Credit Risk, of Notes to Financial Statements" contained within this report. See the risk factors related to our dependency on the growth and financial condition of the Exchange in Item 1A. "Risk Factors" contained within this report.
Competition
Our primary function is to provide management services to the Exchange as set forth in the subscriber's agreement executed by each subscriber (policyholder) at the Exchange. There are a limited number of companies that provide services under a reciprocal insurance exchange structure. We do not directly compete against other such companies, given we are appointed by the subscribers at the Exchange to provide these services.
The direct and assumed premiums written by the Exchange drive our management fee which is our primary source of revenue. The property and casualty insurance industry is highly competitive. Property and casualty insurers generally compete on the basis of customer service, price, consumer recognition, coverages offered, claims handling, financial stability and geographic coverage. Vigorous competition, particularly in the personal lines automobile and homeowners lines of business, is provided by large, well-capitalized national companies, some of which have broad distribution networks of employed or captive agents, by smaller regional insurers, and by large companies who market and sell personal lines products directly to consumers. In addition, because the insurance products of the Exchange are marketed exclusively through independent insurance agents, the Exchange faces competition within its appointed agencies based upon ease of doing business, product, price, and service relationships.
Market competition bears directly on the price charged for insurance products and services subject to regulatory limitations. Industry capital levels can also significantly affect prices charged for coverage. Growth is driven by a company's ability to provide insurance services and competitive prices while maintaining target profit margins. Growth is a product of a company's ability to retain existing customers and to attract new customers, as well as movement in the average premium per policy.
The Exchange's strategic focus includes employing an underwriting philosophy and product mix targeted to produce an underwriting profit on a long-term basis through careful risk selection and rational pricing, and consistently providing superior service to policyholders and agents. The Exchange's business model is designed to provide the advantages of localized marketing and claims servicing with the economies of scale and low cost of operations from centralized support services. The Exchange also carefully selects the independent agencies that represent it and seeks to be the lead insurer with its agents in order to enhance the agency relationship and the likelihood of receiving the most desirable underwriting opportunities from its agents.
See the risk factors related to our dependency on the growth and financial condition of the Exchange in Item 1A. "Risk Factors" contained within this report for further discussion on competition in the insurance industry.
Employees
We had almost 5,300 full-time employees at December 31, 2017, of which approximately 2,600, or 49%, provide claims related services exclusively for the Exchange. The Exchange reimburses us monthly for the cost of these services.
Government Regulation
Most states have enacted legislation that regulates insurance holding company systems, defined as two or more affiliated persons, one or more of which is an insurer. Indemnity and the Exchange, and its wholly owned subsidiaries, meet the definition of an insurance holding company system.
4
Each insurance company in the holding company system is required to register with the insurance supervisory authority of its state of domicile and furnish information regarding the operations of companies within the holding company system that may materially affect the operations, management, or financial condition of the insurers within the system. Pursuant to these laws, the respective insurance departments may examine us, as the management company, and the Exchange and its wholly owned subsidiaries at any time, and may require disclosure and/or prior approval of certain transactions with the insurers and us, as an insurance holding company.
All transactions within a holding company system affecting the member insurers of the holding company system must be fair and reasonable and any charges or fees for services performed must be reasonable. Approval by the applicable insurance commissioner is required prior to the consummation of transactions affecting the members within a holding company system.
Website Access
Our annual reports on Form 10-K, quarterly reports on Form 10-Q, current reports on Form 8-K, and any amendments to those reports are available free of charge on our website at www.erieinsurance.com as soon as reasonably practicable after such material is filed electronically with the Securities and Exchange Commission. Additionally, copies of our annual report on Form 10-K are available free of charge, upon written request, by contacting Investor Relations, Erie Indemnity Company,
100 Erie Insurance Place, Erie, PA 16530, or calling (800) 458-0811.
Our Code of Conduct and Code of Ethics for Senior Financial Officers are also available on our website and in printed form upon request, and our information statement on Schedule 14(C) is available free of charge on our website at www.erieinsurance.com.
ITEM 1A. RISK FACTORS
Our business involves various risks and uncertainties, including, but not limited to those discussed in this section. The risks and uncertainties described in the risk factors below, or any additional risk outside of those discussed below, could have a material adverse effect on our business, financial condition, operating results, cash flows, or liquidity if they were to develop into actual events. This information should be considered carefully together with the other information contained in this report and in other reports and materials we file periodically with the Securities and Exchange Commission.
If the management fee rate paid by the Exchange is reduced or if there is a significant decrease in the amount of direct and assumed premiums written by the Exchange, revenues and profitability could be materially adversely affected.
We are dependent upon management fees paid by the Exchange, which represent our principal source of revenue. Pursuant to the subscriber's agreements with the subscribers at the Exchange, we may retain up to 25% of all direct and assumed premiums written by the Exchange. Therefore, management fee revenue from the Exchange is calculated by multiplying the management fee rate by the direct and assumed premiums written by the Exchange. Accordingly, any reduction in direct and assumed premiums written by the Exchange and/or the management fee rate would have a negative effect on our revenues and net income.
The management fee rate is determined by our Board of Directors and may not exceed 25% of the direct and assumed premiums written by the Exchange. The Board of Directors sets the management fee rate each December for the following year. At their discretion, the rate can be changed at any time. The process of setting the management fee rate includes the evaluation of current year operating results compared to both prior year and industry estimated results for both Indemnity and the Exchange, and consideration of several factors for both entities including: their relative financial strength and capital position; projected revenue, expense and earnings for the subsequent year; future capital needs; as well as competitive position. The evaluation of these factors could result in a reduction to the management fee rate and our revenues and profitability could be materially adversely affected.
Serving as the attorney-in-fact in the reciprocal insurance exchange structure results in the Exchange being our sole customer. We have an interest in the growth of the Exchange as our earnings are largely generated from management fees based on the direct and assumed premiums written by the Exchange. If the Exchange's ability to grow or renew policies were adversely impacted, the premium revenue of the Exchange would be adversely affected which would reduce our management fee revenue. The circumstances or events that might impair the Exchange's ability to grow include, but are not limited to, the items discussed below.
5
Unfavorable changes in macroeconomic conditions, including declining consumer confidence, inflation, high unemployment, and the threat of recession, among others, may lead the Exchange's customers to modify coverage, not renew policies, or even cancel policies, which could adversely affect the premium revenue of the Exchange, and consequently our management fee.
The Exchange faces significant competition from other regional and national insurance companies. The property and casualty insurance industry is highly competitive on the basis of product, price and service. If the Exchange's competitors offer property and casualty products with more coverage or offer lower rates, and the Exchange is unable to implement product improvements quickly enough to keep pace, its ability to grow and renew its business may be adversely impacted. Likewise, an inability to match or exceed the service provided by competitors, which is increasingly relying on digital delivery and enhanced distribution technology, may impede the Exchange's ability to maintain and/or grow its customer base. In addition, due to the Exchange's premium concentration in the automobile and homeowners insurance markets, it may be more sensitive to trends that could affect auto and home insurance coverages and rates over time, for example changing vehicle usage, ownership and driving patterns such as ride sharing, advancements in vehicle or home technology or safety features such as accident and loss prevention technologies, the development of autonomous vehicles, or residential occupancy patterns, among other factors.
The Exchange markets and sells its insurance products through independent, non-exclusive insurance agencies. These agencies are not obligated to sell only the Exchange's insurance products, and generally also sell products of the Exchange's competitors. If agencies do not maintain their current levels of marketing efforts, bind the Exchange to unacceptable risks, place business with competing insurers, or the Exchange is unsuccessful in attracting or retaining agencies in its distribution system as well as maintaining its relationships with those agencies, the Exchange's ability to grow and renew its business may be adversely impacted. Additionally, consumer preferences may cause the insurance industry as a whole to migrate to a delivery system other than independent agencies.
The Exchange maintains a brand recognized for customer service. The perceived performance, actions, conduct and behaviors of employees, independent insurance agency representatives, and third-party service partners may result in reputational harm to the Exchange's brand. Specific incidents which may cause harm include but are not limited to disputes, long customer wait times, errors in processing a claim, failure to protect sensitive customer data, and negative or inaccurate social media communications. If third-party service providers fail to perform as anticipated, the Exchange may experience operational difficulties, increased costs and reputational damage. If an extreme catastrophic event were to occur in a heavily concentrated geographic area of subscribers/policyholders, an extraordinarily high number of claims could have the potential to strain claims processing and affect the Exchange's ability to satisfy its customers. Any reputational harm to the Exchange could have the potential to impair its ability to grow and renew its business.
We also have an interest in the financial condition of the Exchange based on serving as the attorney-in-fact in the reciprocal insurance exchange structure and the Exchange being our sole customer. Our earnings are largely generated from management fees based on the direct and assumed premiums written by the Exchange. If the Exchange were to fail to maintain acceptable financial strength ratings, its competitive position in the insurance industry would be adversely affected. If a rating downgrade led to customers not renewing or canceling policies, or impacted the Exchange's ability to attract new customers, the premium revenue of the Exchange would be adversely affected which would reduce our management fee revenue. The circumstances or events that might impair the Exchange's financial condition include, but are not limited to, the items discussed below.
Financial strength ratings are an important factor in establishing the competitive position of insurance companies such as the Exchange. Higher ratings generally indicate greater financial stability and a stronger ability to meet ongoing obligations to policyholders. The Exchange's A.M. Best rating is currently A+ ("Superior"). Rating agencies periodically review insurers' ratings and change their rating criteria; therefore, the Exchange's current rating may not be maintained in the future. A significant downgrade in this or other ratings would reduce the competitive position of the Exchange, making it more difficult to attract profitable business in the highly competitive property and casualty insurance market and potentially result in reduced sales of its products and lower premium revenue.
The performance of the Exchange's investment portfolio is subject to a variety of investment risks. The Exchange's investment portfolio is comprised principally of fixed income securities, equity securities and limited partnerships. The fixed income portfolio is subject to a number of risks including, but not limited to, interest rate risk, investment credit risk, sector/concentration risk and liquidity risk. The Exchange's common stock and preferred equity securities have exposure to price risk, the risk of potential loss in estimated fair value resulting from an adverse change in prices. Limited partnerships are significantly less liquid and generally involve higher degrees of price risk than publicly traded securities. Limited partnerships, like publicly traded securities, have exposure to market volatility; but unlike fixed income securities, cash flows and return expectations are less predictable. If any investments in the Exchange's investment portfolio were to suffer a substantial decrease in value, the Exchange's financial position could be materially adversely affected through increased unrealized losses
6
or impairments. A significant decrease in the Exchange's portfolio could also put it, or its subsidiaries, at risk of failing to satisfy regulatory or rating agency minimum capital requirements.
Property and casualty insurers are subject to extensive regulatory supervision in the states in which they do business. This regulatory oversight includes, by way of example, matters relating to licensing, examination, rate setting, market conduct, policy forms, limitations on the nature and amount of certain investments, claims practices, mandated participation in involuntary markets and guaranty funds, reserve adequacy, insurer solvency, restrictions on underwriting standards, accounting standards, and transactions between affiliates. Such regulation and supervision are primarily for the benefit and protection of policyholders. Changes in applicable insurance laws, regulations, or changes in the way regulators administer those laws or regulations could adversely change the Exchange's operating environment and increase its exposure to loss or put it at a competitive disadvantage, which could result in reduced sales of its products and lower premium revenue.
As insurance industry practices and legal, judicial, social and other environmental conditions change, unexpected and unintended issues related to claims and coverage may emerge. In some instances, these emerging issues may not become apparent for some time after the Exchange has issued the affected insurance policies. As a result, the full extent of liability under the Exchange's insurance policies may not be known for many years after the policies are issued. These issues may adversely affect the Exchange's business by either extending coverage beyond its underwriting intent or by increasing the number or size of claims.
The Exchange's insurance operations are exposed to claims arising out of catastrophes. Common natural catastrophic events include hurricanes, earthquakes, tornadoes, hail storms, and severe winter weather. The frequency and severity of these catastrophes is inherently unpredictable. Changing climate conditions have added to the unpredictability, frequency and severity of natural disasters and have created additional uncertainty as to future trends and exposures. A single catastrophic occurrence or aggregation of multiple smaller occurrences within its geographical region could adversely affect the financial condition of the Exchange. Terrorist attacks could also cause losses from insurance claims related to the property and casualty insurance operations. The Exchange could incur large net losses if terrorist attacks were to occur which could adversely affect its financial condition.
If the costs of providing services to the Exchange are not controlled, our profitability could be materially adversely affected.
Pursuant to the subscriber's agreements, we are appointed as attorney-in-fact to perform services for the subscribers at the Exchange relating to policy issuance and renewal, including certain sales, underwriting, and issuance services. The most significant costs we incur in providing these services are commissions, employee costs, and technology costs.
Commissions to independent agents are the largest component of our cost of operations. Commissions include scheduled commissions to agents based upon premiums written as well as additional commissions and bonuses to agents, which are earned by achieving certain targeted measures. Changes to commission rates or bonus programs may result in increased future costs and lower profitability.
The second largest component of our cost of operations are employee costs, including salaries, healthcare, pension, and other benefit costs. Regulatory developments, provider relationships, and demographic and economic factors that are beyond our control indicate that employee healthcare costs could continue to increase. Although we actively manage these cost increases, there can be no assurance that future cost increases will not occur and reduce our profitability. The defined benefit pension plan we offer to our employees is affected by variable factors such as the interest rate used to discount pension liabilities, asset performance and changes in retirement patterns, which are beyond our control and any related future costs increases would reduce our profitability.
Technological development is necessary to facilitate ease of doing business for employees, agents and customers. As we continue to develop technology initiatives in order to remain competitive, our profitability could be negatively impacted as we invest in system development projects.
We are subject to credit risk from the Exchange because the management fees from the Exchange are not paid immediately when premiums are written.
We recognize management fees due from the Exchange as income when the premiums are written because at that time we have performed substantially all of the services we are required to perform related to policy issuance and renewal. However, the management fees are not paid to us by the Exchange until the Exchange collects the premiums from subscribers/policyholders. As a result, we hold receivables for management fees on premiums that have been written and assumed by the Exchange but not yet collected. We also hold receivables from the Exchange for claims related and administrative costs for which we are
7
reimbursed at actual costs. These costs are settled monthly. The receivable from the Exchange totaled $418.3 million, or approximately 25% of our total assets at December 31, 2017.
Our ability to attract, develop, and retain talented executives, key managers, and employees is critical to our success.
Our success is largely dependent upon our ability to attract and retain executives and other key management. The loss of the services and leadership of certain key officers and the failure to attract and develop talented new executives and managers could prevent us from successfully communicating, implementing, and executing business strategies, and therefore have a material adverse effect on our financial condition and results of operations.
Our success also depends on our ability to attract, develop, and retain a talented employee base. The inability to staff all functions of our business with employees possessing the appropriate technical expertise could have an adverse effect on our business performance. Staffing appropriately skilled employees for the handling of claims and servicing of customers, rendering of disciplined underwriting, and effective sales and marketing are critical to the core functions of our business. In addition, skilled employees in the actuarial, finance, human resources, law, and information technology areas are also essential to support our core functions.
If we are unable to ensure system availability or effectively manage technology initiatives, we may experience adverse financial consequences and/or may be unable to compete effectively.
Our business is highly dependent upon the effectiveness of our technology and information systems which support key functions of our core business operations including processing applications and premium payments, providing customer support, performing actuarial and financial analysis, and maintaining key data. Additionally, the Exchange relies heavily on technology systems for processing claims. In order to support our business processes and strategic initiatives in a cost and resource efficient manner, we must maintain the effectiveness of existing technology systems and continue to both develop new, and enhance existing, technology systems. As we invest in the development of our systems, costs and completion times could exceed original estimates, and/or the project may not deliver the anticipated benefit, or perform as expected. If we do not effectively and efficiently manage and upgrade our technology systems, our ability to serve our customers and implement our strategic initiatives could be adversely impacted.
We utilize third-party vendors for certain technology and business process functions. If our third-party software vendors are subjected to intellectual property infringement claims, we may lose the ability to use their software until the dispute is resolved.
Additionally, we depend on a large amount of data to price policies appropriately, track exposures, perform financial analysis, report to regulatory bodies, and ultimately make business decisions. Should this data be inaccurate or insufficient, risk exposure may be underestimated and/or poor business decisions may be made. This may in turn lead to adverse operational or financial performance and adverse customer or investor confidence.
If we experience difficulties with technology, data and network security, including as a result of cyber attacks, third-party relationships or cloud-based relationships, our ability to conduct our business could be adversely impacted.
In the normal course of business we collect, use, store and where appropriate, disclose data concerning individuals and businesses. We also conduct business using third-party vendors who may provide software, data storage, cloud-based computing and other technology services. Like other companies, we have on occasion experienced, and will continue to experience, cyber threats to our data and systems. Cyber threats can create significant risks such as destruction of systems or data, denial of service, disruption of transaction execution, loss or exposure of customer data, theft or exposure of our intellectual property, theft of funds or disruption of other important business functions. The business we conduct with our third-party vendors may expose us to increased risk related to data security, service disruptions or effectiveness of our control system.
We employ a company-wide cybersecurity program of technical, administrative and physical controls intended to reduce the risk of cyber threats and protect our information. Our cybersecurity philosophy and approach align to the National Institute of Standards and Technology Cybersecurity Framework and its core elements, to identify, protect, detect, respond and recover from the various forms of cyber threats. Our practices include, but are not limited to, cybersecurity protocols and controls, system monitoring and detection, vendor risk management and ongoing privacy and cybersecurity training for employees and contractors concerning cyber risk. We periodically assess the effectiveness of our cybersecurity efforts including independent validation and verification, and security assessments conducted by independent third parties. The number, complexity and sophistication of cyber threats continues to increase over time. The controls we have implemented, and continue to develop, may not be sufficient to prevent events like unauthorized physical or electronic access, denial of service, cyber attacks, or other
8
security breaches to our computer systems or those of third parties with whom we do business. In some cases, such events may not be immediately detected.
In addition, we are subject to numerous federal and state data privacy laws relating to the privacy of the nonpublic personal information of our customers, employees and others. The misuse or mishandling of information sent to or received from a customer, employee or third party could result in legal liability, regulatory action and reputational damage. Third parties on whom we rely for certain business processing functions are also subject to these risks, and their failure to adhere to these laws and regulations could negatively impact us.
To date, we are not aware of any material cybersecurity breach with respect to our systems or data. Any cyber incident or other security breach could cause disruption in our business operations and may result in other negative consequences including remediation costs, loss of revenue, additional regulatory scrutiny, fines, litigation, monetary damages and reputational harm. While we maintain cyber liability insurance to mitigate the financial risk around cyber incidents, such insurance may not cover all costs associated with the consequences of information or systems being compromised. As a result, in the event of a material cybersecurity breach, our business, cash flows, financial condition or results of operations could be materially, adversely affected.
If events occurred causing interruption of our operations, facilities, systems or business functions, it could have a material adverse effect on our operations and financial results.
We have an established business continuity plan to ensure the continuation of core business operations in the event that normal business operations could not be performed due to a catastrophic event. While we continue to test and assess our business continuity plan to ensure it meets the needs of our core business operations and addresses multiple business interruption events, there is no assurance that core business operations could be performed upon the occurrence of such an event. Systems failures or outages could compromise our ability to perform our business functions in a timely manner, which could harm our ability to conduct business and hurt our relationships with our business partners and customers. Our business continuity is also dependent on third-party systems on which our information technology systems interface and rely. Our systems and those of our third-party vendors may become vulnerable to damage or disruption due to circumstances beyond our or their control, such as from catastrophic events, power anomalies or outages, natural disasters, network failures, and viruses. The failure of our information systems for any reason could result in a material adverse effect on our business, cash flows, financial condition, or results of operations.
The performance of our investment portfolio is subject to a variety of investment risks, which may in turn have a material adverse effect on our results of operations or financial condition.
Our investment portfolio is comprised principally of fixed income securities and limited partnerships. At December 31, 2017, our investment portfolio consisted of approximately 93% fixed income securities, 5% limited partnerships, and 2% equity securities.
All of our marketable securities are subject to market volatility. To the extent that future market volatility negatively impacts our investments, our financial condition will be negatively impacted. We review the investment portfolio on a continuous basis to evaluate positions that might have incurred other-than-temporary declines in value. Inherent in management's evaluation of a security are assumptions and estimates about the operations of the issuer and its future earnings potential. The primary factors considered in our review of investment valuation include the extent and duration to which fair value is less than cost, historical operating performance and financial condition of the issuer, short- and long-term prospects of the issuer and its industry, specific events that occurred affecting the issuer, including rating downgrades, and, depending on the type of security, our intent to sell or our ability and intent to retain the investment for a period of time sufficient to allow for a recovery in value. As the process for determining impairments is highly subjective, changes in our assessments may have a material effect on our operating results and financial condition. See also Item 7A. "Quantitative and Qualitative Disclosures about Market Risk".
If the fixed income, equity, or limited partnership portfolios were to suffer a substantial decrease in value, our financial position could be materially adversely affected through increased realized/unrealized losses or impairments.
The performance of the fixed income portfolio is subject to a number of risks including, but not limited to:
• | Interest rate risk - the risk of adverse changes in the value of fixed income securities as a result of increases in market interest rates. |
9
• | Investment credit risk - the risk that the value of certain investments may decrease due to the deterioration in financial condition of, or the liquidity available to, one or more issuers of those securities or, in the case of asset-backed securities, due to the deterioration of the loans or other assets that underlie the securities, which, in each case, also includes the risk of permanent loss. |
• | Sector/Concentration risk - the risk that the portfolio may be too heavily concentrated in the securities of one or more issuers, sectors, or industries. Events or developments that have a negative impact on any particular industry, group of related industries, or geographic region may have a greater adverse effect on our investment portfolio to the extent that the portfolio is concentrated within those issuers, sectors, or industries. |
• | Liquidity risk - the risk that we will not be able to convert investment securities into cash on favorable terms and on a timely basis, or that we will not be able to sell them at all, when desired. Disruptions in the financial markets or a lack of buyers for the specific securities that we are trying to sell, could prevent us from liquidating securities or cause a reduction in prices to levels that are not acceptable to us. |
General economic conditions and other factors beyond our control can adversely affect the value of our investments and the realization of net investment income, or result in realized investment losses. In addition, downward economic trends also may have an adverse effect on our investment results by negatively impacting the business conditions and impairing credit for the issuers of securities held in our respective investment portfolios. This could reduce fair values of investments and generate significant unrealized losses or impairment charges which may adversely affect our financial results.
In addition to the fixed income securities, a portion of our portfolio is invested in limited partnerships. At December 31, 2017, we had investments in limited partnerships of $45.1 million, or 3% of total assets. In addition, we are obligated to invest up to an additional $16.3 million in limited partnerships, including private equity, mezzanine debt, and real estate partnership investments. Limited partnerships are significantly less liquid and generally involve higher degrees of price risk, the risk of potential loss in estimated fair value resulting from an adverse change in prices, than publicly traded securities. Limited partnerships, like publicly traded securities, have exposure to market volatility; but unlike fixed income securities, cash flows and return expectations are less predictable. We have made no new limited partnership commitments since 2006, and the balance of limited partnership investments is expected to decline over time as additional distributions are received.
The primary basis for the valuation of limited partnership interests are financial statements prepared by the general partner. Because of the timing of the preparation and delivery of these financial statements, the use of the most recently available financial statements provided by the general partners result in a quarter delay in the inclusion of the limited partnership results in our Statements of Operations. Due to this delay, our financial statements at December 31, 2017 do not reflect market conditions experienced in the fourth quarter of 2017.
Our equity securities have exposure to price risk. We do not hedge our exposure to equity price risk inherent in our equity investments. Equity markets, sectors, industries, and individual securities may also be subject to some of the same risks that affect our fixed income portfolio, as discussed above.
Deteriorating capital and credit market conditions or a failure to accurately estimate capital needs may significantly affect our ability to meet liquidity needs and access capital.
Sufficient liquidity and capital levels are required to pay operating expenses, income taxes, and to provide the necessary resources to fund future growth opportunities, satisfy certain financial covenants, pay dividends on common stock, and repurchase common stock. Management estimates the appropriate level of capital necessary based upon current and projected results, which include a loading for potential risks. Failure to accurately estimate our capital needs may have a material adverse effect on our financial condition until additional sources of capital can be located. Further, a deteriorating financial condition may create a negative perception of us by third parties, including rating agencies, investors, agents, and customers which could impact our ability to access additional capital in the debt or equity markets.
Our primary sources of liquidity are management fee revenue and cash flows generated from our investment portfolio. In the event our current sources do not satisfy our liquidity needs, we have the ability to access our $100 million bank revolving line of credit, from which there were no borrowings as of December 31, 2017, or liquidate assets in our investment portfolio. Volatility in the financial markets could limit our ability to sell certain of our fixed income securities or, to a greater extent, our significantly less liquid limited partnership investments, or cause such investments to sell at deep discounts.
In the event these traditional sources of liquidity are not available, we may have to seek additional financing. Our access to funds will depend upon a number of factors including current market conditions, the availability of credit, market liquidity, and
10
credit ratings. In deteriorating market conditions, there can be no assurance that we will obtain additional financing, or, if available, that the cost of financing will not substantially increase and affect our overall profitability.
We are subject to applicable insurance laws, tax statutes, and regulations, as well as claims and legal proceedings, which, if determined unfavorably, could have a material adverse effect on our business, results of operations, or financial condition.
We face a significant risk of litigation and regulatory investigations and actions in the ordinary course of operating our businesses including the risk of class action lawsuits. Our pending legal and regulatory actions include proceedings specific to us and others generally applicable to business practices in the industries in which we operate. In our operations, we are, have been, or may become subject to class actions and individual suits alleging, among other things, issues relating to sales or underwriting practices, payment of contingent or other sales commissions, product design, product disclosure, policy issuance and administration, additional premium charges for premiums paid on a periodic basis, charging excessive or impermissible fees on products, recommending unsuitable products to customers, and breaching alleged fiduciary or other duties, including our obligations to indemnify directors and officers in connection with certain legal matters. We are also subject to litigation arising out of our general business activities such as contractual and employment relationships and claims regarding the infringement of the intellectual property of others. Plaintiffs in class action and other lawsuits against us may seek very large or indeterminate amounts, including punitive and treble damages, which may remain unknown for substantial periods of time. We are also subject to various regulatory inquiries, such as information requests, subpoenas, and books and record examinations from state and federal regulators and authorities. Changes in the way regulators administer those laws, tax statutes, or regulations could adversely impact our business, cash flows, results of operations, or financial condition.
ITEM 1B. UNRESOLVED STAFF COMMENTS
None.
11
ITEM 2. PROPERTIES
Indemnity and the Exchange share a corporate home office complex in Erie, Pennsylvania, which comprises approximately 637,000 square feet. In November 2016, we began the construction of a new office building that will serve as part of our principal headquarters. The project is expected to span approximately three years and will add approximately 346,000 square feet to our existing home office complex. Additionally, we lease one office building and one warehouse facility from unaffiliated parties. We are charged rent for the related square footage we occupy.
Indemnity and the Exchange also operate 25 field offices in 12 states. Of these field offices, 17 provide both agency support and claims services and are referred to as branch offices, while seven provide only claims services and are referred to as claims offices, and one provides only agency support and is referred to as a sales office. We own three field offices and lease a portion of these buildings to the Exchange. The remaining field offices are leased from other parties as detailed below:
Number of | ||
Field office ownership: | field offices | |
Erie Indemnity Company | 3 | |
Erie Insurance Exchange | 3 | |
Erie Family Life Insurance Company | 1 | |
Unaffiliated parties (1) | 18 | |
25 | ||
(1) Lease commitments for these properties expire periodically through 2027. We
expect that most leases will be renewed or replaced upon expiration.
12
ITEM 3. LEGAL PROCEEDINGS
State Court Lawsuit Against Erie Indemnity Company
Erie Indemnity Company (“Indemnity”) was named as a defendant in a complaint filed on August 1, 2012 by alleged subscribers of the Erie Insurance Exchange (the “Exchange”) in the Court of Common Pleas Civil Division of Fayette County, Pennsylvania captioned Erie Insurance Exchange, an unincorporated association, by Joseph S. Sullivan and Anita Sullivan, Patricia R. Beltz, and Jenna L. DeBord, trustees ad litem v. Erie Indemnity Co. (the “Sullivan” lawsuit).
As subsequently amended, the complaint alleges that, beginning on September 1, 1997, Indemnity retained “Service Charges” (installment fees) and “Added Service Charges” (late fees and policy reinstatement charges) on policies written by Exchange and its insurance subsidiaries, which allegedly should have been paid to Exchange, in the amount of approximately $308 million. In addition to their claim for monetary relief on behalf of Exchange, Plaintiffs seek an accounting of all so-called intercompany transactions between Indemnity and Exchange from 1996 to date. Plaintiffs allege that Indemnity breached its contractual, fiduciary, and equitable duties by retaining Service Charges and Added Service Charges that should have been retained by Exchange. Plaintiffs bring these same claims under three separate derivative-type theories. First, Plaintiffs purport to bring suit as members of Exchange on behalf of Exchange. Second, Plaintiffs purport to bring suit as trustees ad litem on behalf of Exchange. Third, Plaintiffs purport to bring suit on behalf of Exchange pursuant to Rule 1506 of the Pennsylvania Rules of Civil Procedure, which allows shareholders to bring suit derivatively on behalf of a corporation or similar entity.
Indemnity filed a motion in the state court in November 2012 seeking dismissal of the lawsuit. On December 19, 2013, the court granted Indemnity’s motion in part, holding that the Pennsylvania Insurance Holding Company Act “provides the [Pennsylvania Insurance] Department with special competence to address the subject matter of plaintiff’s claims” and referring “all issues” in the Sullivan lawsuit to the Pennsylvania Insurance Department (the “Department”) for “its views and any determination.” The court stayed all further proceedings and reserved decision on all other grounds for dismissal raised by Indemnity. Plaintiffs sought reconsideration of the court’s order, and on January 13, 2014, the court entered a revised order affirming its prior order and clarifying that the Department “shall decide any and all issues within its jurisdiction.” On January 30, 2014, Plaintiffs asked the court to certify its order to permit an immediate appeal to the Superior Court of Pennsylvania and to stay any proceedings in the Department pending completion of any appeal. On February 18, 2014, the court issued an order denying Plaintiffs’ motion. On March 20, 2014, Plaintiffs filed a petition for review with the Superior Court, which was denied by the Superior Court on May 5, 2014.
The Sullivan matter was assigned to an Administrative Judge within the Department for determination. The parties agreed that an evidentiary hearing was not required, entered into a stipulated record, and submitted briefing to the Department. Oral argument was held before the Administrative Judge on January 6, 2015. On April 29, 2015, the Department issued a declaratory opinion and order: (1) finding that the transactions between Exchange and Indemnity in which Indemnity retained or received revenue from installment and other service charges from Exchange subscribers complied with applicable insurance laws and regulations and that Indemnity properly retained charges paid by Exchange policyholders for certain installment premium payment plans, dishonored payments, policy cancellations, and policy reinstatements; and (2) returning jurisdiction over the matter to the Fayette County Court of Common Pleas.
On May 26, 2015, Plaintiffs appealed the Department’s decision to the Pennsylvania Commonwealth Court. Oral argument was held before the Commonwealth Court en banc on December 9, 2015. On January 27, 2016, the Commonwealth Court issued an opinion vacating the Department’s ruling and directing the Department to return the case to the Court of Common Pleas, essentially holding that the primary jurisdiction referral of the trial court was improper at this time because the allegations of the complaint do not implicate the special competency of the Department.
On February 26, 2016, Indemnity filed a petition for allowance of appeal to the Pennsylvania Supreme Court seeking further review of the Commonwealth Court opinion. On March 14, 2016, Plaintiffs filed an answer opposing Indemnity’s petition for allowance of appeal; and, on March 28, 2016, Indemnity sought permission to file a reply brief in further support of its petition for allowance of appeal. On August 10, 2016, the Pennsylvania Supreme Court denied Indemnity’s petition for allowance of appeal; and the Sullivan lawsuit returned to the Court of Common Pleas of Fayette County.
On September 12, 2016, Plaintiffs filed a motion to stay the Sullivan lawsuit pending the outcome of the Federal Court Lawsuit they filed against Indemnity and former and current Directors of Indemnity on July 8, 2016. (See below.) Indemnity filed an opposition to Plaintiff’s motion to stay on September 19, 2016; and filed amended preliminary objections seeking dismissal of the Sullivan lawsuit on September 20, 2016. The motion to stay and the amended preliminary objections remain pending.
Indemnity believes that it continues to have meritorious legal and factual defenses to the Sullivan lawsuit and intends to vigorously defend against all allegations and requests for relief.
13
Federal Court Lawsuit Against Erie Indemnity Company and Directors
On February 6, 2013, a lawsuit was filed in the United States District Court for the Western District of Pennsylvania, captioned Erie Insurance Exchange, an unincorporated association, by members Patricia R. Beltz, Joseph S. Sullivan and Anita Sullivan, and Patricia R. Beltz, on behalf of herself and others similarly situate v. Richard L. Stover; J. Ralph Borneman, Jr.; Terrence W. Cavanaugh; Jonathan Hirt Hagen; Susan Hirt Hagen; Thomas B. Hagen; C. Scott Hartz; Claude C. Lilly, III; Lucian L. Morrison; Thomas W. Palmer; Martin P. Sheffield; Elizabeth H. Vorsheck; and Robert C. Wilburn (the “Beltz” lawsuit), by alleged policyholders of Exchange who are also the plaintiffs in the Sullivan lawsuit. The individuals named as defendants in the Beltz lawsuit were the then-current Directors of Indemnity.
As subsequently amended, the Beltz lawsuit asserts many of the same allegations and claims for monetary relief as in the Sullivan lawsuit. Plaintiffs purport to sue on behalf of all policyholders of Exchange, or, alternatively, on behalf of Exchange itself. Indemnity filed a motion to intervene as a Party Defendant in the Beltz lawsuit in July 2013, and the Directors filed a motion to dismiss the lawsuit in August 2013. On February 10, 2014, the court entered an order granting Indemnity’s motion to intervene and permitting Indemnity to join the Directors’ motion to dismiss; granting in part the Directors’ motion to dismiss; referring the matter to the Department to decide any and all issues within its jurisdiction; denying all other relief sought in the Directors’ motion as moot; and dismissing the case without prejudice. To avoid duplicative proceedings and expedite the Department’s review, the Parties stipulated that only the Sullivan action would proceed before the Department and any final and non-appealable determinations made by the Department in the Sullivan action will be applied to the Beltz action.
On March 7, 2014, Plaintiffs filed a notice of appeal to the United States Court of Appeals for the Third Circuit. Indemnity filed a motion to dismiss the appeal on March 26, 2014. On November 17, 2014, the Third Circuit deferred ruling on Indemnity’s motion to dismiss the appeal and instructed the parties to address that motion, as well as the merits of Plaintiffs’ appeal, in the parties’ briefing. Briefing was completed on April 2, 2015. In light of the Department’s April 29, 2015 decision in Sullivan, the Parties then jointly requested that the Beltz appeal be voluntarily dismissed as moot on June 5, 2015. The Third Circuit did not rule on the Parties’ request for dismissal and instead held oral argument as scheduled on June 8, 2015. On July 16, 2015, the Third Circuit issued an opinion and judgment dismissing the appeal. The Third Circuit found that it lacked appellate jurisdiction over the appeal, because the District Court’s February 10, 2014 order referring the matter to the Department was not a final, appealable order.
On July 8, 2016, the Beltz plaintiffs filed a new action labeled as a “Verified Derivative And Class Action Complaint” in the United States District Court for the Western District of Pennsylvania. The action is captioned Patricia R. Beltz, Joseph S. Sullivan, and Anita Sullivan, individually and on behalf of all others similarly situated, and derivatively on behalf of Nominal Defendant Erie Insurance Exchange v. Erie Indemnity Company; Kaj Ahlmann; John T. Baily; Samuel P. Black, III; J. Ralph Borneman, Jr.; Terrence W. Cavanaugh; Wilson C. Cooney; LuAnn Datesh; Patricia A. Goldman; Jonathan Hirt Hagen; Thomas B. Hagen; C. Scott Hartz; Samuel P. Katz; Gwendolyn King; Claude C. Lilly, III; Martin J. Lippert; George R. Lucore; Jeffrey A. Ludrof; Edmund J. Mehl; Henry N. Nassau; Thomas W. Palmer; Martin P. Sheffield; Seth E. Schofield; Richard L. Stover; Jan R. Van Gorder; Elizabeth A. Hirt Vorsheck; Harry H. Weil; and Robert C. Wilburn (the “Beltz II” lawsuit). The individual defendants are all present or former Directors of Indemnity (the “Directors”).
The allegations of the Beltz II lawsuit arise from the same fundamental, underlying claims as the Sullivan and prior Beltz litigation, i.e., that Indemnity improperly retained Service Charges and Added Service Charges. The Beltz II lawsuit alleges that the retention of the Service Charges and Added Service Charges was improper because, for among other reasons, that retention constituted a breach of the Subscriber’s Agreement and an Implied Covenant of Good Faith and Fair Dealing by Indemnity, breaches of fiduciary duty by Indemnity and the other defendants, conversion by Indemnity, and unjust enrichment by defendants Jonathan Hirt Hagen, Thomas B. Hagen, Elizabeth A. Hirt Vorsheck, and Samuel P. Black, III, at the expense of Exchange. The Beltz II lawsuit requests, among other things, that a judgment be entered against the Defendants certifying the action as a class action pursuant to Rule 23 of the Federal Rules of Civil Procedure; declaring Plaintiffs as representatives of the Class and Plaintiffs’ counsel as counsel for the Class; declaring the conduct alleged as unlawful, including, but not limited to, Defendants’ retention of the Service Charges and Added Service Charges; enjoining Defendants from continuing to retain the Service Charges and Added Service Charges; and awarding compensatory and punitive damages and interest.
On September 23, 2016, Indemnity filed a motion to dismiss the Beltz II lawsuit. On September 30, 2016, the Directors filed their own motions to dismiss the Beltz II lawsuit. On July 17, 2017, the Court granted Indemnity’s and the Directors’ motions to dismiss the Beltz II lawsuit, dismissing the case in its entirety. The Court ruled that “the Subscriber’s Agreement does not govern the separate and additional charges at issue in the Complaint” and, therefore, dismissed the breach of contract claim against Indemnity for failure to state a claim. The Court also ruled that the remaining claims, including the claims for breach of fiduciary duty against Indemnity and the Directors, are barred by the applicable statutes of limitation or fail to state legally cognizable claims. On August 14, 2017, Plaintiffs filed a notice of appeal to the United States Court of Appeals for the Third Circuit.
14
Indemnity believes it has meritorious legal and factual defenses and intends to vigorously defend against all allegations and requests for relief in the Beltz II lawsuit. The Directors have advised Indemnity that they intend to vigorously defend against the claims in the Beltz II lawsuit and have sought indemnification and advancement of expenses from the Company in connection with the Beltz II lawsuit.
Federal Court Lawsuit Against Erie Indemnity Company and Directors
On December 28, 2017 a lawsuit was filed in the United States District Court for the Western District of Pennsylvania captioned Lynda Ritz, individually and on behalf of all others similarly situated and derivatively on behalf of Nominal Defendant Erie Insurance Exchange v. Erie Indemnity Company, J. Ralph Borneman, Jr., Terrence W. Cavanaugh, Eugene C. Connell, LuAnn Datesh, Jonathan Hirt Hagen, Thomas B. Hagen, C. Scott Hartz, Brian A. Hudson, Sr., Claude C. Lilly, III, George R. Lucore, Thomas W. Palmer, Martin P. Sheffield, Richard L. Stover, Elizabeth A. Hirt Vorsheck, and Robert C. Wilburn, and Erie Insurance Exchange (Nominal Defendant) (the “Ritz” lawsuit). The individual named as Plaintiff is alleged to be a policyholder (subscriber) of the Erie Insurance Exchange (the “Exchange”). With the exception of Terrence W. Cavanaugh and Robert C. Wilburn, the individuals named as Defendants comprise the current Board of Directors of Indemnity. Messrs. Cavanaugh and Wilburn are former Directors of Indemnity (the “Directors”).
The Complaint alleges that since at least 2007, Erie Indemnity Company has taken “unwarranted and excessive” management fees as compensation for its services under the Subscriber’s Agreement. Count I of the Complaint purports to allege a claim for breach of alleged fiduciary duties against Indemnity and the Directors on behalf of Plaintiff and a putative class of subscribers. Count II purports to allege a claim for breach of alleged fiduciary duties against Indemnity and the Directors on behalf of Exchange. Count III purports to allege a claim for breach of contract and an alleged implied covenant of good faith and fair dealing against Indemnity on behalf of Plaintiff and a putative class. Count IV purports to allege a claim of unjust enrichment against several individually named Directors.
The Complaint seeks compensatory and punitive damages and requests the Court to enjoin Indemnity from continuing to retain excessive management fees; and order such other relief as may be appropriate.
Indemnity believes it has meritorious legal and factual defenses and intends to vigorously defend against all allegations and requests for relief in the Ritz lawsuit. The Directors have advised Indemnity that they intend to vigorously defend against the claims in the Ritz lawsuit and have sought indemnification and advancement of expenses from the Company in connection with the Ritz lawsuit.
For additional information on contingencies, see Part II, Item 8. "Financial Statements and Supplementary Data - Note 15, Commitment and Contingencies, of Notes to Financial Statements".
ITEM 4. MINE SAFETY DISCLOSURES
Not applicable.
15
PART II
ITEM 5. MARKET FOR REGISTRANT'S COMMON EQUITY, RELATED STOCKHOLDER MATTERS AND ISSUER PURCHASES OF EQUITY SECURITIES
Common Stock Market Prices and Dividends
Our Class A, non-voting common stock trades on The NASDAQ Stock MarketSM LLC under the symbol "ERIE". No established trading market exists for the Class B voting common stock. American Stock Transfer & Trust Company, LLC serves as our transfer agent and registrar. As of February 16, 2018, there were approximately 639 beneficial shareholders of record for the Class A non-voting common stock and 9 beneficial shareholders of record for the Class B voting common stock.
Historically, we have declared and paid cash dividends on a quarterly basis at the discretion of the Board of Directors. The payment and amount of future dividends on the common stock will be determined by the Board of Directors and will depend upon, among other things, our operating results, financial condition, cash requirements, and general business conditions at the time such payment is considered. The common stock high and low sales prices and cash dividends declared for each full quarter of the last two years were as follows:
2017 | 2016 | |||||||||||||||||||||||||||||||
Stock sales price | Cash dividend declared | Stock sales price | Cash dividend declared | |||||||||||||||||||||||||||||
Quarter ended | High | Low | Class A | Class B | High | Low | Class A | Class B | ||||||||||||||||||||||||
March 31 | $ | 124.73 | $ | 110.34 | $ | 0.7825 | $ | 117.375 | $ | 100.53 | $ | 89.92 | $ | 0.7300 | $ | 109.500 | ||||||||||||||||
June 30 | 126.46 | 114.06 | 0.7825 | 117.375 | 99.34 | 90.60 | 0.7300 | 109.500 | ||||||||||||||||||||||||
September 30 | 128.70 | 114.29 | 0.7825 | 117.375 | 103.69 | 96.68 | 0.7300 | 109.500 | ||||||||||||||||||||||||
December 31 | 124.10 | 116.09 | 0.8400 | 126.000 | 114.60 | 99.39 | 0.7825 | 117.375 | ||||||||||||||||||||||||
Total | $ | 3.1875 | $ | 478.125 | $ | 2.9725 | $ | 445.875 | ||||||||||||||||||||||||
Stock Performance
The following graph depicts the cumulative total shareholder return, assuming reinvestment of dividends, for the periods indicated for our Class A common stock compared to the Standard & Poor's 500 Stock Index and the Standard & Poor's Supercomposite Insurance Industry Group Index. The Standard & Poor's Supercomposite Insurance Industry Group Index is made up of 56 constituent members represented by property and casualty insurers, insurance brokers, and life insurers, and is a capitalization weighted index.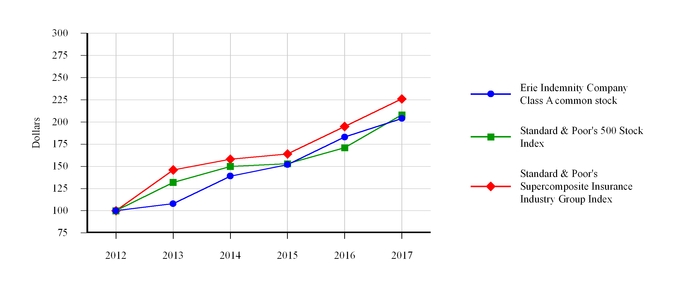
2012 | 2013 | 2014 | 2015 | 2016 | 2017 | |||||||||||||||||||
Erie Indemnity Company Class A common stock | $ | 100 | (1) | $ | 108 | $ | 139 | $ | 152 | $ | 183 | $ | 204 | |||||||||||
Standard & Poor's 500 Stock Index | 100 | (1) | 132 | 150 | 153 | 171 | 208 | |||||||||||||||||
Standard & Poor's Supercomposite Insurance Industry Group Index | 100 | (1) | 146 | 158 | 164 | 195 | 226 | |||||||||||||||||
(1) | Assumes $100 invested at the close of trading, including reinvestment of dividends, on the last trading day preceding the first day of the fifth preceding fiscal year, in our Class A common stock, the Standard & Poor's 500 Stock Index, and the Standard & Poor's Supercomposite Insurance Industry Group Index. |
16
Issuer Purchases of Equity Securities
We may purchase shares, from time-to-time, in the open market, through trading plans entered into with one or more brokerage firms pursuant to Rule 10b5-1 under the Securities Exchange Act of 1934, or through privately negotiated transactions. The purchase of shares is dependent upon prevailing market conditions and alternate uses of capital, and at times and in a manner that is deemed appropriate.
Our Board of Directors authorized a stock repurchase program effective January 1, 1999, allowing the repurchase of our outstanding Class A nonvoting common stock. Various approvals for continuation of this program have since been authorized, with the most recent occurring in October 2011 for $150 million, which was authorized with no time limitation. There were no repurchases of our Class A common stock under this program during the quarter ending December 31, 2017. We had approximately $17.8 million of repurchase authority remaining under this program, based upon trade date, at both December 31, 2017 and February 16, 2018.
See Part II, Item 8. "Financial Statements and Supplementary Data – Note 11, Capital Stock, of Notes to Financial Statements" contained within this report for discussion of additional shares purchased outside of this program.
ITEM 6. SELECTED FINANCIAL DATA
(in thousands, except per share data) | Years Ended December 31, | ||||||||||||||||||||
2017 | 2016 | 2015 | 2014 | 2013 | |||||||||||||||||
Operating Data: | |||||||||||||||||||||
Operating revenue | $ | 1,691,774 | $ | 1,596,631 | $ | 1,505,508 | $ | 1,407,119 | $ | 1,297,331 | |||||||||||
Operating expenses | 1,403,402 | 1,304,267 | 1,272,967 | 1,184,272 | 1,087,995 | ||||||||||||||||
Investment income | 28,561 | 27,828 | 33,708 | 28,417 | 37,278 | ||||||||||||||||
Interest expense, net | 1,238 | 101 | — | — | — | ||||||||||||||||
Income before income taxes | 315,695 | 320,091 | 266,249 | 251,264 | 246,614 | ||||||||||||||||
Net income | 196,999 | 210,366 | 174,678 | 167,505 | 162,611 | ||||||||||||||||
Per Share Data: | |||||||||||||||||||||
Net income per Class A share – diluted | $ | 3.76 | $ | 4.01 | $ | 3.33 | $ | 3.18 | $ | 3.08 | |||||||||||
Book value per share – Class A common and equivalent B shares | 16.40 | 15.62 | 14.72 | 13.45 | 13.96 | ||||||||||||||||
Dividends declared per Class A share | 3.1875 | 2.9725 | 2.773 | 2.586 | 2.4125 | ||||||||||||||||
Dividends declared per Class B share | 478.125 | 445.875 | 415.95 | 387.90 | 361.875 | ||||||||||||||||
Financial Position Data: | |||||||||||||||||||||
Investments | $ | 803,835 | $ | 771,450 | $ | 688,476 | $ | 702,387 | $ | 721,728 | |||||||||||
Receivables from Erie Insurance Exchange and affiliates | 418,328 | 378,540 | 348,055 | 335,220 | 300,442 | ||||||||||||||||
Long-term borrowings | 74,728 | 24,766 | — | — | — | ||||||||||||||||
Total assets | 1,665,859 | 1,548,955 | 1,407,296 | 1,319,198 | 1,213,042 | ||||||||||||||||
Total equity | 857,344 | 816,910 | 769,503 | 703,134 | 733,982 | ||||||||||||||||
17
ITEM 7. MANAGEMENT'S DISCUSSION AND ANALYSIS OF FINANCIAL CONDITION AND RESULTS OF OPERATIONS
The following discussion of financial condition and results of operations highlights significant factors influencing Erie Indemnity Company ("Indemnity", "we", "us", "our"). This discussion should be read in conjunction with the audited financial statements and related notes and all other items contained within this Annual Report on Form 10-K as these contain important information helpful in evaluating our financial condition and results of operations.
INDEX
Page Number | |
CAUTIONARY STATEMENT REGARDING FORWARD-LOOKING INFORMATION
"Safe Harbor" Statement under the Private Securities Litigation Reform Act of 1995:
Statements contained herein that are not historical fact are forward-looking statements and, as such, are subject to risks and uncertainties that could cause actual events and results to differ, perhaps materially, from those discussed herein. Forward-looking statements relate to future trends, events or results and include, without limitation, statements and assumptions on which such statements are based that are related to our plans, strategies, objectives, expectations, intentions, and adequacy of resources. Examples of forward-looking statements are discussions relating to premium and investment income, expenses, operating results, and compliance with contractual and regulatory requirements. Forward-looking statements are not guarantees of future performance and involve risks and uncertainties that are difficult to predict. Therefore, actual outcomes and results may differ materially from what is expressed or forecasted in such forward-looking statements. Among the risks and uncertainties, in addition to those set forth in our filings with the Securities and Exchange Commission, that could cause actual results and future events to differ from those set forth or contemplated in the forward-looking statements include the following:
• | dependence upon our relationship with the Exchange and the management fee under the agreement with the subscribers at the Exchange; |
• | dependence upon our relationship with the Exchange and the growth of the Exchange, including: |
◦ | general business and economic conditions; |
◦ | factors affecting insurance industry competition; |
◦ | dependence upon the independent agency system; and |
◦ | ability to maintain our reputation for customer service; |
• | dependence upon our relationship with the Exchange and the financial condition of the Exchange, including: |
◦ | the Exchange's ability to maintain acceptable financial strength ratings; |
◦ | factors affecting the quality and liquidity of the Exchange's investment portfolio; |
◦ | changes in government regulation of the insurance industry; |
◦ | emerging claims and coverage issues in the industry; and |
◦ | severe weather conditions or other catastrophic losses, including terrorism; |
• | costs of providing services to the Exchange under the subscriber's agreement; |
• | credit risk from the Exchange; |
• | ability to attract and retain talented management and employees; |
• | ability to ensure system availability and effectively manage technology initiatives; |
• | difficulties with technology or data security breaches, including cyber attacks; |
18
• | ability to maintain uninterrupted business operations; |
• | factors affecting the quality and liquidity of our investment portfolio; |
• | our ability to meet liquidity needs and access capital; and |
• | outcome of pending and potential litigation. |
A forward-looking statement speaks only as of the date on which it is made and reflects our analysis only as of that date. We undertake no obligation to publicly update or revise any forward-looking statement, whether as a result of new information, future events, changes in assumptions, or otherwise.
RECENT ACCOUNTING STANDARDS
See Part II, Item 8. "Financial Statements and Supplementary Data - Note 2, Significant Accounting Policies, of Notes to Financial Statements" contained within this report for a discussion of adopted as well as other recently issued accounting standards and the impact on our financial statements if known.
OPERATING OVERVIEW
Overview
We are a Pennsylvania business corporation that since 1925 has been the managing attorney-in-fact for the subscribers (policyholders) at the Erie Insurance Exchange ("Exchange"), a reciprocal insurer that writes property and casualty insurance. Our primary function is to perform policy issuance and renewal services on behalf of the subscribers at the Exchange. We operate our business as one segment.
The Exchange is a reciprocal insurance exchange organized under Article X of Pennsylvania's Insurance Company Law of 1921 under which individuals, partnerships, and corporations are authorized to exchange reciprocal or inter-insurance contracts with each other, or with individuals, partnerships, and corporations of other states and countries, providing indemnity among themselves from any loss which may be insured against under any provision of the insurance laws except life insurance. Each applicant for insurance to the Exchange signs a subscriber's agreement, which contains an appointment of Indemnity as their attorney-in-fact to transact the business of the Exchange on their behalf.
Pursuant to the subscriber's agreement and for its services as attorney-in-fact, we earn a management fee calculated as a percentage of the direct and assumed premiums written by the Exchange.
Our earnings are primarily driven by the management fee revenue generated for the policy issuance and renewal services we provide for the Exchange. Management fee revenue is based upon all direct and assumed premiums written by the Exchange and the management fee rate, which is not to exceed 25%. Our Board of Directors establishes the management fee rate at least annually, generally in December for the following year. The process of setting the management fee rate includes the evaluation of current year operating results compared to both prior year and industry estimated results for both Indemnity and the Exchange, and consideration of several factors for both entities including: their relative financial strength and capital position; projected revenue, expense and earnings for the subsequent year; future capital needs; as well as competitive position.
The management fee rate was set at 25% for 2017, 2016 and 2015. Our Board of Directors set the 2018 management fee rate again at 25%, its maximum level.
The policy issuance and renewal services we provide to the Exchange include sales, underwriting and policy issuance services. The sales related services we provide include agent compensation and certain sales and advertising support services. Agent compensation includes scheduled commissions to agents based upon premiums written as well as additional commissions and bonuses to agents, which are earned by achieving targeted measures. Agent compensation comprised approximately 68% of our 2017 expenses. The underwriting services we provide include underwriting and policy processing and comprised approximately 10% of our 2017 expenses. The remaining services we provide include customer service and administrative support. We also provide information technology services that support all the functions listed above that comprised approximately 10% of our 2017 expenses.
By virtue of its legal structure as a reciprocal insurer, the Exchange does not have the ability to enter into contractual relationships and therefore, Indemnity also serves as the attorney-in-fact on behalf of the Exchange for all claims handling and investment management services, which include certain common overhead and service department functions in accordance with the subscriber's agreement. The Exchange's insurance subsidiaries also utilize Indemnity for these services, including life
19
management services for EFL, in accordance with the service agreements between each of the subsidiaries and Indemnity. Claims handling services include costs incurred in the claims process, including the adjustment, investigation, defense, recording and payment functions, as well as an allocation of costs for departments that support these claims functions. Life management services include costs incurred in the management and processing of life insurance business. Investment management services are related to investment trading activity, accounting and all other functions attributable to the investment of funds, including an allocation of costs for departments that support the investment function. The amounts incurred for these services are the responsibility of the Exchange and its insurance subsidiaries as outlined in the subscriber's agreement and the services agreements, and are reimbursed to Indemnity as cost. State insurance regulations require that intercompany service agreements and any material amendments be approved in advance by the state insurance department. See Part II, Item 8. "Financial Statements and Supplementary Data - Note 13, Related Party, of Notes to Financial Statements" contained within this report.
Our results of operations are tied to the growth and financial condition of the Exchange as the Exchange is our sole customer and our earnings are largely generated from management fees based on the direct and assumed premiums written by the Exchange. The Exchange generates revenue by insuring preferred and standard risks, with personal lines comprising 71% of the 2017 direct and assumed written premiums and commercial lines comprising the remaining 29%. The principal personal lines products are private passenger automobile and homeowners. The principal commercial lines products are commercial multi-peril, commercial automobile and workers compensation.
We generate investment income from our fixed maturity, equity security, and limited partnership investment portfolios. Our portfolio is managed with the objective of maximizing after-tax returns on a risk-adjusted basis. We actively evaluate the portfolios for impairments, and record impairment write-downs on investments in instances where the fair value of the investment is substantially below cost, and it is concluded that the decline in fair value is other-than-temporary, which includes consideration for intent to sell.
Financial Overview
Years ended December 31, | ||||||||||||||||||||
(dollars in thousands, except per share data) | 2017 | % Change | 2016 | % Change | 2015 | |||||||||||||||
Total operating revenue | $ | 1,691,774 | 6.0 | % | $ | 1,596,631 | 6.1 | % | $ | 1,505,508 | ||||||||||
Total operating expenses | 1,403,402 | 7.6 | 1,304,267 | 2.5 | 1,272,967 | |||||||||||||||
Operating income | 288,372 | (1.4 | ) | 292,364 | 25.7 | 232,541 | ||||||||||||||
Total investment income | 28,561 | 2.6 | 27,828 | (17.4 | ) | 33,708 | ||||||||||||||
Interest expense, net | 1,238 | NM | 101 | NM | — | |||||||||||||||
Income before income taxes | 315,695 | (1.4 | ) | 320,091 | 20.2 | 266,249 | ||||||||||||||
Income tax expense | 118,696 | 8.2 | 109,725 | 19.8 | 91,571 | |||||||||||||||
Net income | $ | 196,999 | (6.4 | ) | % | $ | 210,366 | 20.4 | % | $ | 174,678 | |||||||||
Net income per share - diluted | $ | 3.76 | (6.2 | ) | % | $ | 4.01 | 20.6 | % | $ | 3.33 | |||||||||
NM = not meaningful
Total operating revenue increased 6.0% and 6.1% in 2017 and 2016, respectively, driven by management fee revenue growth. The two components of management fee revenue are the management fee rate we charge, and the direct and assumed premiums written by the Exchange. The management fee rate was 25% for both 2017 and 2016. The direct and assumed premiums written by the Exchange were $6.7 billion in 2017 and $6.3 billion in 2016.
Total operating expenses increased 7.6% and 2.5% in 2017 and 2016, respectively. The increase in operating expenses for 2017 was driven by increases in commissions, personnel costs and information technology-related professional fees. The increase in operating expenses for 2016 was driven by an increase in commissions, partially offset by lower non-commission expenses primarily from lower personnel costs across all expense categories.
Total investment income increased in 2017 driven by higher net investment income and realized investment gains, offset by lower earnings from limited partnership investments. Total investment income decreased in 2016 primarily due to lower earnings generated from limited partnership investments.
Income tax expense in 2017 was impacted by the enactment of the Tax Cuts and Jobs Act (TCJA) on December 22, 2017, which reduced the corporate income tax rate from 35% to 21%. Income tax expense increased by $10.1 million related to the
20
TCJA, which included an increase of $19.9 million related to the re-measurement of our net deferred tax asset partially offset by a deferred tax benefit of $9.8 million primarily related to the acceleration of pension contributions.
General Conditions and Trends Affecting Our Business
Economic conditions
Unfavorable changes in economic conditions, including declining consumer confidence, inflation, high unemployment, and the threat of recession, among others, may lead the Exchange's customers to modify coverage, not renew policies, or even cancel policies, which could adversely affect the premium revenue of the Exchange, and consequently our management fee. Further, unanticipated increased inflation costs including medical cost inflation, construction and auto repair cost inflation, and tort issues may impact the estimated loss reserves and future premium rates. If any of these items impacted the financial condition or continuing operations of the Exchange, it could have an impact on our financial results.
Financial market volatility
Our portfolio of fixed maturity, equity security, and limited partnership investments is subject to market volatility especially in periods of instability in the worldwide financial markets. Over time, net investment income could also be impacted by volatility and by the general level of interest rates, which impact reinvested cash flow from the portfolio and business operations. Depending upon market conditions, which are unpredictable and remain uncertain, considerable fluctuation could exist in the fair value of our investment portfolio and reported total investment income, which could have an adverse impact on our financial condition, results of operations, and cash flows.
CRITICAL ACCOUNTING ESTIMATES
The financial statements include amounts based upon estimates and assumptions that have a significant effect on reported amounts of assets and liabilities at the date of the financial statements and the reported amounts of revenues and expenses during the reporting period and related disclosures. We consider an accounting estimate to be critical if 1) it requires assumptions to be made that were uncertain at the time the estimate was made, and 2) different estimates that could have been used, or changes in the estimate that are likely to occur from period-to-period, could have a material impact on our Statements of Operations or Financial Position.
The following presents a discussion of those accounting policies surrounding estimates that we believe are the most critical to our reported amounts and require the most subjective and complex judgment. If actual events differ significantly from the underlying assumptions, there could be material adjustments to prior estimates that could potentially adversely affect our results of operations, financial condition, and cash flows. The estimates and the estimating methods used are reviewed continually, and any adjustments considered necessary are reflected in current earnings.
Investment Valuation
Available-for-sale securities
We make estimates concerning the valuation of all investments. Valuation techniques are used to derive the fair value of the available-for-sale securities we hold. Fair value is the price that would be received to sell an asset in an orderly transaction between willing market participants at the measurement date.
Fair value measurements are based upon observable and unobservable inputs. Observable inputs reflect market data obtained from independent sources, while unobservable inputs reflect our view of market assumptions in the absence of observable market information. We utilize valuation techniques that maximize the use of observable inputs and minimize the use of unobservable inputs.
For purposes of determining whether the market is active or inactive, the classification of a financial instrument is based upon the following definitions:
• | An active market is one in which transactions for the assets being valued occur with sufficient frequency and volume to provide reliable pricing information. |
• | An inactive (illiquid) market is one in which there are few and infrequent transactions, where the prices are not current, price quotations vary substantially, and/or there is little information publicly available for the asset being valued. |
21
We continually assess whether or not an active market exists for all of our investments and as of each reporting date re-evaluate the classification in the fair value hierarchy. All assets carried at fair value are classified and disclosed in one of the following three categories:
• | Level 1 – Quoted prices (unadjusted) in active markets for identical assets or liabilities that the reporting entity can access at the measurement date. |
• | Level 2 – Inputs other than quoted prices included within Level 1 that are observable for the asset or liability, either directly or indirectly. |
• | Level 3 – Unobservable inputs for the asset or liability. |
Level 1 includes nonredeemable preferred stock and exchange traded funds, and reflects market data obtained from independent sources, such as prices obtained from an exchange or a nationally recognized pricing service for identical instruments in active markets.
Level 2 includes those financial instruments that are valued using industry-standard models that consider various inputs, such as the interest rate and credit spread for the underlying financial instruments. All significant inputs are observable, or derived from observable information in the marketplace, or are supported by observable levels at which transactions are executed in the marketplace. Financial instruments in this category primarily include U.S. government & agency securities, corporate bonds, municipal bonds, structured securities and certain nonredeemable preferred stock.
Level 3 securities are valued based upon unobservable inputs, reflecting our estimates of value based upon assumptions used by market participants. Securities are assigned to Level 3 in cases where non-binding broker quotes are significant to the valuation and there is a lack of transparency as to whether these quotes are based upon information that is observable in the marketplace. Fair value estimates for securities valued using unobservable inputs require significant judgment due to the illiquid nature of the market for these securities and represent the best estimate of the fair value that would occur in an orderly transaction between willing market participants at the measurement date under current market conditions. Fair value for these securities are generally determined using non-binding broker quotes received from outside broker dealers based upon security type and market conditions. Remaining securities, where a price is not available, are valued using an estimate of fair value based upon indicative market prices that include significant unobservable inputs not based upon, nor corroborated by, market information, including the utilization of discounted cash flow analyses which have been risk-adjusted to take into account illiquidity and other market factors. This category primarily consists of corporate and other debt securities priced using non-binding broker quotes.
As of each reporting period, financial instruments recorded at fair value are classified based upon the lowest level of input that is significant to the fair value measurement. The presence of at least one unobservable input that has significant impact to the fair value measurement would result in classification as a Level 3 instrument. Our assessment of the significance of a particular input to the fair value measurement requires judgment, and considers factors specific to the asset, such as the relative impact on the fair value as a result of including a particular input and market conditions. We did not make any other significant judgments except as described above.
Estimates of fair values for our investment portfolio are obtained primarily from a nationally recognized pricing service. Our Level 1 category includes those securities valued using an exchange traded price provided by the pricing service. The methodologies used by the pricing service that support a Level 2 classification of a financial instrument include multiple verifiable, observable inputs including benchmark yields, reported trades, broker/dealer quotes, issuer spreads, two-sided markets, benchmark securities, bids, offers, and reference data. Pricing service valuations for Level 3 securities are based upon proprietary models and are used when observable inputs are not available in illiquid markets. In limited circumstances we adjust the price received from the pricing service when, in our judgment, a better reflection of fair value is available based upon corroborating information and our knowledge and monitoring of market conditions such as a disparity in price of comparable securities and/or non-binding broker quotes. In other circumstances, certain securities are internally priced because prices are not provided by the pricing service.
We perform continuous reviews of the prices obtained from the pricing service. This includes evaluating the methodology and inputs used by the pricing service to ensure we determine the proper classification level of the financial instrument. Price variances, including large periodic changes, are investigated and corroborated by market data. We have reviewed the pricing methodologies of our pricing service as well as other observable inputs, such as benchmark yields, reported trades, issuer spreads, two-sided markets, benchmark securities, bids, offers, reference data, and transaction volumes, and believe that the prices adequately consider market activity in determining fair value.
22
When a price from the pricing service is not available, values are determined by obtaining non-binding broker quotes and/or market comparables. When available, we obtain multiple quotes for the same security. The ultimate value for these securities is determined based upon our best estimate of fair value using corroborating market information. Our evaluation includes the consideration of benchmark yields, reported trades, issuer spreads, two-sided markets, benchmark securities, bids, offers, and reference data.
Other-than-temporary impairments
Investments are evaluated monthly for other-than-temporary impairment loss. Some factors considered in evaluating whether or not a decline in fair value is other-than-temporary include:
• | the extent and duration for which fair value is less than cost; |
• | historical operating performance and financial condition of the issuer; |
• | short- and long-term prospects of the issuer and its industry based upon analysts' recommendations; |
• | specific events that occurred affecting the issuer, including rating downgrades; |
• | intent to sell or more likely than not we would be required to sell (debt securities); and |
• | ability and intent to retain the investment for a period of time sufficient to allow for a recovery in value (equity securities). |
For available-for-sale equity securities, a charge is recorded in the Statements of Operations for positions that have experienced other-than-temporary impairments. For debt securities in which we do not expect full recovery of amortized cost, the security is deemed to be credit-impaired. Credit-related impairments and impairments on securities we intend to sell or more likely than not will be required to sell are recorded in the Statements of Operations. It is our intention to sell all debt securities with credit impairments.
Limited partnerships
The primary basis for the valuation of limited partnership interests is financial statements prepared by the general partner. Because of the timing of the preparation and delivery of these financial statements, the use of the most recently available financial statements provided by the general partners generally result in a quarter delay in the inclusion of the limited partnership results in our Statements of Operations. Due to this delay, these financial statements do not reflect the market conditions experienced in the fourth quarter of 2017.
The majority of our limited partnership holdings are considered investment companies where the general partners record assets at fair value. These limited partnerships are recorded using the equity method of accounting. We also own some real estate limited partnerships that do not meet the criteria of an investment company. These partnerships prepare audited financial statements on a cost basis. We have elected to report these limited partnerships under the fair value option, which is based on the net asset value (NAV) from our partner's capital statement reflecting the general partner's estimate of fair value for the fund's underlying assets. Fair value provides consistency in the evaluation and financial reporting for these limited partnerships and limited partnerships accounted for under the equity method.
We have three types of limited partnership investments: private equity, mezzanine debt, and real estate. Nearly all of the underlying investments in our limited partnerships are valued using a source other than quoted prices in active markets. The fair value amounts for our private equity and mezzanine debt partnerships are based upon the financial statements prepared by the general partners, who use various methods to estimate fair value including the market approach, income approach, and the cost approach. The market approach uses prices and other pertinent information from market-generated transactions involving identical or comparable assets or liabilities. Such valuation techniques often use market multiples derived from a set of comparables. The income approach uses valuation techniques to convert future cash flows or earnings to a single discounted present value amount. The measurement is based upon the value indicated by current market expectations about those future amounts. The cost approach is derived from the amount that is currently required to replace the service capacity of an asset. If information becomes available that would impair the cost of investments owned by the partnerships, then the general partner would adjust the investments to the net realizable value.
The fair value of investments in real estate limited partnerships is determined by the general partner based upon independent appraisals and/or internal valuations. Real estate projects under development are generally valued at cost and impairment tested by the general partner.
While we perform various procedures in review of the general partners' valuations, we rely on the general partners' financial statements as the best available information to record our share of the partnership unrealized gains and losses resulting from valuation changes. Due to the limited market for these investments, there is higher potential for variability. We survey each of the general partners quarterly about expected significant changes (plus or minus 10% compared to previous quarter) to
23
valuations prior to the release of the fund's quarterly and annual financial statements. Based upon that information from the general partner, we consider whether additional disclosure is warranted. We analyze limited partnerships measured at fair value based upon NAV to determine if the most recently available NAV reflects fair value at the balance sheet date, with an adjustment being made where appropriate (change of plus or minus 5% compared to most recent NAV).
We have made no new limited partnership commitments since 2006, and the balance of limited partnership investments is expected to decline over time as additional distributions are received.
Retirement Benefit Plans for Employees
Our pension plans consist of a noncontributory defined benefit pension plan covering substantially all employees and an unfunded supplemental employee retirement plan ("SERP") for certain members of executive and senior management. Although we are the sponsor of these postretirement plans and record the funded status of these plans, the Exchange and its subsidiaries reimburse us for approximately 59% of the annual benefit expense of these plans, which represents pension benefits for our employees performing claims and life insurance functions and their share of service department costs.
Our pension obligation is developed from actuarial estimates. Several statistical and other factors, which attempt to anticipate future events, are used in calculating the expense and liability related to the plans. Key factors include assumptions about the discount rates and expected rates of return on plan assets. We review these assumptions annually and modify them considering historical experience, current market conditions, including changes in investment returns and interest rates, and expected future trends.
Accumulated and projected benefit obligations are expressed as the present value of future cash payments. We discount those cash payments based upon a yield curve developed from corporate bond yield information with maturities that correspond to the payment of benefits. Lower discount rates increase present values and subsequent year pension expense, while higher discount rates decrease present values and subsequent year pension expense. The construction of the yield curve is based upon yields of corporate bonds rated AA or equivalent quality. Target yields are developed from bonds at various maturity points and a curve is fitted to those targets. Spot rates (zero coupon bond yields) are developed from the yield curve and used to discount benefit payment amounts associated with each future year. The present value of plan benefits is calculated by applying the spot/discount rates to projected benefit cash flows. A single discount rate is then developed to produce the same present value. The cash flows from the yield curve were matched against our projected benefit payments in the pension plan, which have a duration of about 19 years. This yield curve supported the selection of a 3.73% discount rate for the projected benefit obligation at December 31, 2017 and for the 2018 pension expense. The same methodology was used to develop the 4.24% and 4.57% discount rates used to determine the projected benefit obligation for 2016 and 2015, respectively, and the pension expense for 2017 and 2016, respectively. A 25 basis point decrease in the discount rate assumption, with other assumptions held constant, would increase pension cost in the following year by $4.8 million, of which our share would be approximately $2.0 million, and would increase the pension benefit obligation by $46.0 million.
Unrecognized actuarial gains and losses arise from several factors, including experience and assumption changes in the obligations and from the difference between expected returns and actual returns on plan assets. These unrecognized gains and losses are recorded in the pension plan obligation and accumulated other comprehensive income (loss) on the Statements of Financial Position. These amounts are systematically recognized to net periodic pension expense in future periods, with gains decreasing and losses increasing future pension expense. If actuarial net gains or losses exceed 5% of the greater of the projected benefit obligation and the market-related value of plan assets, the excess is recognized through the net periodic pension expense equally over the estimated service period of the employee group, which is currently 14 years.
The expected long-term rate of return for the pension plan represents the average rate of return to be earned on plan assets over the period the benefits included in the benefit obligation are to be paid. The expected long-term rate of return is less susceptible to annual revisions, as there are typically no significant changes in the asset mix. To determine the expected long-term rate of return assumption, we utilized models based upon rigorous historical analysis and forward-looking views of the financial markets based upon key factors such as historical returns for the asset class' applicable indices, the correlations of the asset classes under various market conditions and consensus views on future real economic growth and inflation. The expected future return for each asset class is then combined by considering correlations between asset classes and the volatilities of each asset class to produce a reasonable range of asset return results within which our expected long-term rate of return assumption falls. A change of 25 basis points in the expected long-term rate of return assumption, with other assumptions held constant, would have an estimated $1.8 million impact on net pension benefit cost in the following year, of which our share would be approximately $0.7 million. Based on a review of the key factors and expectations of future asset performance, we reduced the expected return on asset assumption from 7.00% to 6.75% for 2017.
24
We use a four year averaging method to determine the market-related value of plan assets, which is used to determine the expected return component of pension expense. Under this methodology, asset gains or losses that result from returns that differ from our long-term rate of return assumption are recognized in the market-related value of assets on a level basis over a four year period. The market-related asset experience during 2017 that related to the actual investment return being different from that assumed during the prior year was a gain of $67.4 million. Recognition of this gain will be deferred and recognized over a four year period, consistent with the market-related asset value methodology. Once factored into the market-related asset value, these experience gains and losses will be amortized over a period of 14 years, which is the remaining service period of the employee group.
Estimates of fair values of the pension plan assets are obtained primarily from the trustee and custodian of our pension plan. Our Level 1 category includes a money market fund that is a mutual fund for which the fair value is determined using an exchange traded price provided by the trustee and custodian. Our Level 2 category includes commingled pools. Estimates of fair values for securities held by our commingled pools are obtained primarily from the trustee and custodian. The methodologies used by the trustee and custodian that support a financial instrument Level 2 classification include multiple verifiable, observable inputs including benchmark yields, reported trades, broker/dealer quotes, issuers spreads, two-sided markets, benchmark securities, bids, offers, and reference data. There were no Level 3 investments in 2017 or 2016. We expect our net pension benefit costs to increase slightly from $34.6 million in 2017 to $35.5 million in 2018. The lower discount rate of 3.73% will increase our 2018 net pension benefit costs by approximately $10.0 million. We are making accelerated pension contributions of $80 million, of which $40 million was made in January 2018, and an additional $40 million will be made in April 2018. These additional contributions along with normal plan progression will reduce the 2018 net pension benefit costs by approximately $9.1 million, which mostly offsets the increase due to the change in discount rate. Our share of the net pension benefit costs after reimbursements was $14.3 million in 2017. We expect our share of the net pension benefit costs to be approximately $14.7 million in 2018.
The actuarial assumptions we used in determining our pension obligation may differ materially from actual results due to changing market and economic conditions, higher or lower withdrawal rates, or longer or shorter life spans of participants. While we believe that the assumptions used are appropriate, differences in actual experience or changes in assumptions may materially affect our financial position, results of operations, or cash flows. See Part II, Item 8. "Financial Statements and Supplementary Data - Note 8, Postretirement Benefits, of Notes to Financial Statements" contained within this report for additional details on the pension plans.
25
RESULTS OF OPERATIONS
We earn management fee revenue from providing policy issuance and renewal services relating to the sales, underwriting, and issuance of policies on behalf of the Exchange as a result of its attorney-in-fact relationship. A summary of the financial results of these operations is as follows:
Years ended December 31, | ||||||||||||||||||||
(dollars in thousands) | 2017 | % Change | 2016 | % Change | 2015 | |||||||||||||||
Management fee revenue, net | $ | 1,662,625 | 6.1 | % | $ | 1,567,431 | 6.2 | % | $ | 1,475,511 | ||||||||||
Service agreement revenue | 29,149 | (0.2 | ) | 29,200 | (2.7 | ) | 29,997 | |||||||||||||
Total operating revenue | 1,691,774 | 6.0 | 1,596,631 | 6.1 | 1,505,508 | |||||||||||||||
Total operating expenses | 1,403,402 | 7.6 | 1,304,267 | 2.5 | 1,272,967 | |||||||||||||||
Operating income | $ | 288,372 | (1.4 | ) | % | $ | 292,364 | 25.7 | % | $ | 232,541 | |||||||||
Gross margin | 17.0 | % | (1.3 | ) | pts. | 18.3 | % | 2.9 | pts. | 15.4 | % | |||||||||
Management fee revenue
Management fee revenue is based upon all direct and assumed premiums written by the Exchange and the management fee rate, which is determined by our Board of Directors at least annually. Management fee revenue is calculated by multiplying the management fee rate by the direct and assumed premiums written by the Exchange. The following table presents the calculation of management fee revenue:
Years ended December 31, | ||||||||||||||||||
(dollars in thousands) | 2017 | % Change | 2016 | % Change | 2015 | |||||||||||||
Direct and assumed premiums written by the Exchange | $ | 6,656,501 | 6.0 | % | $ | 6,278,126 | 6.2 | % | $ | 5,914,045 | ||||||||
Management fee rate | 25 | % | 25 | % | 25 | % | ||||||||||||
Management fee revenue, gross | 1,664,125 | 6.0 | 1,569,531 | 6.2 | 1,478,511 | |||||||||||||
Change in allowance for management fee returned on cancelled policies(1) | (1,500 | ) | NM | (2,100 | ) | NM | (3,000 | ) | ||||||||||
Management fee revenue, net of allowance | $ | 1,662,625 | 6.1 | % | $ | 1,567,431 | 6.2 | % | $ | 1,475,511 | ||||||||
NM = not meaningful
(1) Management fees are returned to the Exchange when policies are cancelled mid-term and unearned premiums are refunded. We record an estimated allowance for management fees returned on mid-term policy cancellations.
Direct and assumed premiums written by the Exchange
Direct and assumed premiums include premiums written directly by the Exchange and premiums assumed from its wholly owned property and casualty subsidiaries. Direct and assumed premiums written by the Exchange increased 6.0% to $6.7 billion in 2017, from $6.3 billion in 2016, driven by an increase in policies in force and increases in average premium per policy. Year-over-year policies in force for all lines of business increased by 3.5% in 2017 primarily as the result of continuing strong policyholder retention, compared to 3.1% in 2016. The year-over-year average premium per policy for all lines of business increased 2.4% at December 31, 2017, compared to 2.9% at December 31, 2016.
Premiums generated from new business increased 12.3% to $846 million in 2017, compared to 4.3%, or $753 million, in 2016. Underlying the trend in new business premiums was a 7.6% increase in new business policies written in 2017, compared to 0.9% in 2016, while the year-over-year average premium per policy on new business increased 4.4% at December 31, 2017, compared to 3.4% at December 31, 2016.
Premiums generated from renewal business increased 5.2% to $5.8 billion in 2017, compared to 6.4%, or $5.5 billion, in 2016. Underlying the trend in renewal business premiums were increases in average premium per policy and steady policy retention ratios. The renewal business year-over-year average premium per policy increased 2.2% at December 31, 2017, compared to 2.8% at December 31, 2016.
The Exchange implemented rate increases in 2017, 2016, and 2015 in order to meet loss cost expectations. As the Exchange writes policies with annual terms only, rate actions take 12 months to be fully recognized in written premium and 24 months to be fully recognized in earned premiums. Since rate changes are realized at renewal, it takes 12 months to implement a rate
26
change to all policyholders and another 12 months to earn the increased or decreased premiums in full. As a result, certain rate actions approved in 2016 were reflected in 2017, and recent rate actions in 2017 will be reflected in 2018. The Exchange continuously evaluates pricing and product offerings to meet consumer demands.
Personal lines – Total personal lines premiums written increased 6.9% to $4.7 billion in 2017, from $4.4 billion in 2016, driven by an increase of 3.6% in total personal lines policies in force and an increase of 3.2% in the total personal lines year-over-year average premium per policy.
Commercial lines – Total commercial lines premiums written increased 3.9% to $1.9 billion in 2017, from $1.8 billion in 2016, driven by a 2.7% increase in total commercial lines policies in force and a 1.1% increase in the total commercial lines year-over-year average premium per policy.
Future trends-premium revenue – The Exchange plans to continue its efforts to grow premiums and improve its competitive position in the marketplace. Expanding the size of its agency force through a careful agency selection process and increased market penetration in our existing operating territories will contribute to future growth as existing and new agents build their books of business.
Changes in premium levels attributable to the growth in policies in force directly affects the profitability of the Exchange and has a direct bearing on our management fee. The Exchange's continued focus on underwriting discipline and the maturing of its pricing sophistication models has contributed to its growth in new policies in force, steady policy retention ratios, and increased average premium per policy. The continued growth of its policy base is dependent upon the Exchange's ability to retain existing, and attract new, subscribers/policyholders. A lack of new policy growth or the inability to retain existing customers could have an adverse effect on the Exchange's premium level growth, and consequently our management fee.
Changes in premium levels attributable to rate changes also directly affect the profitability of the Exchange and have a direct bearing on our management fee. Pricing actions contemplated or taken by the Exchange are subject to various regulatory requirements of the states in which it operates. The pricing actions already implemented, or to be implemented, have an effect on the market competitiveness of the Exchange's insurance products. Such pricing actions, and those of the Exchange's competitors, could affect the ability of the Exchange's agents to retain and attract new business. We expect the Exchange's pricing actions to result in a net increase in direct written premium in 2018; however, exposure reductions and/or changes in mix of business as a result of economic conditions could impact the average premium written and assumed by the Exchange, as customers may reduce coverages.
Management fee rate
The management fee rate was set at 25%, the maximum rate, for 2017, 2016 and 2015. The management fee rate for 2018 was set at 25% by our Board of Directors. Changes in the management fee rate can affect our revenue and net income significantly. See also, the "Transactions/Agreements with Related Parties" section within this report.
Change in allowance for management fee returned on cancelled policies
Management fees are returned to the Exchange when subscribers/policyholders cancel their insurance coverage mid-term and unearned premiums are refunded to them. We maintain an allowance for management fees returned on mid-year policy cancellations that recognizes the management fee anticipated to be returned to the Exchange based on historical mid-term cancellation experience. Our cash flows are unaffected by the recording of this allowance.
Service agreement revenue
Service agreement revenue includes service charges we collect from subscribers/policyholders for providing extended payment terms on policies written and assumed by the Exchange, and late payment and policy reinstatement fees. The service charges are fixed dollar amounts per billed installment. Service agreement revenue totaled $29.1 million, $29.2 million and $30.0 million in 2017, 2016 and 2015, respectively. The decrease in service agreement revenue compared to the growth in policies in force reflects the continued shift to payment plans that do not incur service charges or offer a premium discount for certain payment methods. The shift to these plans is driven by the consumers' desire to avoid paying service charges and to take advantage of the discount.
27
Cost of management operations
Years ended December 31, | ||||||||||||||||||
(dollars in thousands) | 2017 | % Change | 2016 | % Change | 2015 | |||||||||||||
Commissions: | ||||||||||||||||||
Total commissions | $ | 947,481 | 6.0 | % | $ | 893,800 | 5.4 | % | $ | 847,880 | ||||||||
Non-commission expense: | ||||||||||||||||||
Underwriting and policy processing | $ | 142,819 | 5.1 | % | $ | 135,855 | 0.8 | % | $ | 134,837 | ||||||||
Information technology | 140,421 | 15.8 | 121,249 | (1.7 | ) | 123,362 | ||||||||||||
Sales and advertising | 62,059 | (2.1 | ) | 63,423 | (1.5 | ) | 64,403 | |||||||||||
Customer service | 27,827 | 13.1 | 24,604 | (16.1 | ) | 29,325 | ||||||||||||
Administrative and other | 82,795 | 26.7 | 65,336 | (10.7 | ) | 73,160 | ||||||||||||
Total non-commission expense | 455,921 | 11.1 | 410,467 | (3.4 | ) | 425,087 | ||||||||||||
Total cost of management operations | $ | 1,403,402 | 7.6 | % | $ | 1,304,267 | 2.5 | % | $ | 1,272,967 | ||||||||
Commissions – Commissions increased $53.7 million in 2017 compared to 2016, and $45.9 million in 2016 compared to 2015, primarily as a result of the increased direct and assumed premiums written by the Exchange of 6.0% and 6.2%, respectively.
Non-commission expense – Non-commission expense increased $45.5 million in 2017 compared to 2016. Underwriting and policy processing costs increased $7.0 million primarily due to increased personnel costs and underwriting report costs. Information technology costs increased $19.2 million primarily due to increased professional fees, hardware and software costs and personnel costs. Customer service costs increased $3.2 million primarily due to increased personnel costs and credit card processing fees. Administrative and other costs increased $17.5 million primarily driven by increased personnel costs, including higher incentive plan costs. The incentive plan cost increase was driven by an increase in long-term incentive plan cost due to the increase in the company stock price during 2017 coupled with lower incentive plan cost in the prior year due to incentive compensation that was forfeited by senior executives who separated from service during 2016. Additionally, the employee incentive plan program was expanded to additional employee groups beginning in 2017. Personnel costs in all expense categories were impacted by increased medical and pension costs.
In 2016, compared to 2015, non-commission expense decreased $14.6 million. Information technology costs decreased $2.1 million primarily due to decreased personnel costs somewhat offset by an increase in professional fees. Customer service costs decreased $4.7 million primarily due to decreased credit card processing fees and personnel costs. Administrative and other costs decreased $7.8 million due to decreased personnel costs, including incentive compensation forfeited by senior executives who separated from service during 2016, somewhat offset by an increase in professional fees. Personnel costs in all expense categories were impacted by decreased pension costs primarily due to an increase in the pension discount rate as well as decreased medical costs.
Gross margin
The gross margin in 2017 was 17.0%, compared to 18.3% in 2016 and 15.4% in 2015.
Total investment income
A summary of the results of our investment operations is as follows for the years ended December 31:
(dollars in thousands) | 2017 | % Change | 2016 | % Change | 2015 | |||||||||||||
Net investment income | $ | 24,608 | 19.8 | % | $ | 20,547 | 15.5 | % | $ | 17,791 | ||||||||
Net realized investment gains | 1,334 | 98.6 | 672 | 36.5 | 492 | |||||||||||||
Net impairment losses recognized in earnings | (182 | ) | 56.4 | (416 | ) | NM | (1,558 | ) | ||||||||||
Equity in earnings of limited partnerships | 2,801 | (60.1 | ) | 7,025 | (58.6 | ) | 16,983 | |||||||||||
Total investment income | $ | 28,561 | 2.6 | % | $ | 27,828 | (17.4 | )% | $ | 33,708 | ||||||||
NM = not meaningful
28
Net investment income
Net investment income primarily includes interest and dividends on our fixed maturity and equity security portfolios, net of investment expenses.
Net investment income increased by $4.1 million in 2017, compared to 2016, primarily due to higher invested balances and higher investment yields from fixed maturity investments. Net investment income increased by $2.8 million in 2016, compared to 2015, primarily due to increased income from fixed maturity investments, reflecting higher invested balances and higher investment yields, partially offset by lower income from equity securities as a result of the sale of our preferred stock holdings in the fourth quarter of 2015.
Net realized investment gains (losses)
A breakdown of our net realized investment gains (losses) is as follows for the years ended December 31:
(in thousands) | 2017 | 2016 | 2015 | |||||||||
Securities sold: | ||||||||||||
Fixed maturities | $ | 1,385 | $ | (2 | ) | $ | (193 | ) | ||||
Equity securities | (145 | ) | (33 | ) | 685 | |||||||
Common stock trading securities | 0 | 707 | 0 | |||||||||
Miscellaneous | 94 | 0 | 0 | |||||||||
Net realized investment gains (1) | $ | 1,334 | $ | 672 | $ | 492 | ||||||
(1) | See Part II, Item 8. "Financial Statements and Supplementary Data – Note 5, Investments, of Notes to Financial Statements" contained within this report for additional disclosures regarding net realized investment gains (losses). |
Net realized investment gains and losses include gains and losses resulting from the sales of our fixed maturity or equity securities.
Net realized gains were $1.3 million in 2017, compared to gains of $0.7 million in 2016 and $0.5 million in 2015. Net realized gains in 2017 were primarily due to gains from the sales of fixed maturity securities, partially offset by losses from sales of equity securities, while gains in 2016 were primarily attributable to gains from sales of common stock trading securities. Net realized gains in 2015 were due to gains from sales on nonredeemable preferred stock, which were partially offset by losses from sales of fixed maturity securities.
Net impairment losses recognized in earnings
Net impairment losses recognized in earnings were $0.2 million in 2017, compared to $0.4 million in 2016, and $1.6 million in 2015. Net impairment losses recognized in earnings in all three years were primarily due to securities in an unrealized loss position where we determined the loss was other-than-temporary based on credit factors, and also included securities in an unrealized loss position that we intended to sell prior to expected recovery of our amortized cost basis.
Equity in earnings (losses) of limited partnerships
The components of equity in earnings (losses) of limited partnerships are as follows for the years ended December 31:
(in thousands) | 2017 | 2016 | 2015 | |||||||||
Private equity | $ | 492 | $ | (2,756 | ) | $ | 12,169 | |||||
Mezzanine debt | 345 | 51 | 1,788 | |||||||||
Real estate | 1,964 | 9,730 | 3,026 | |||||||||
Equity in earnings of limited partnerships | $ | 2,801 | $ | 7,025 | $ | 16,983 | ||||||
Limited partnership earnings pertain to investments in U.S. and foreign private equity, mezzanine debt, and real estate partnerships. Valuation adjustments are recorded to reflect the changes in fair value of the underlying investments held by the limited partnerships. These adjustments are recorded as a component of equity in earnings of limited partnerships in the Statements of Operations.
Limited partnership earnings tend to be cyclical based upon market conditions, the age of the partnership, and the nature of the investments. Generally, limited partnership earnings are recorded on a quarter lag from financial statements we receive from our general partners. As a consequence, earnings from limited partnerships reported at December 31, 2017 reflect investment valuation changes resulting from the financial markets and the economy for the twelve month period ending September 30, 2017.
29
Equity in earnings of limited partnerships decreased by $4.2 million in 2017, compared to 2016, and decreased by
$10.0 million in 2016, compared to 2015. The decrease in earnings in 2017 was primarily the result of lower earnings in real estate investments that were partially offset by higher earnings from private equity investments. The decrease in earnings in 2016 was primarily the result of lower earnings from private equity investments that were partially offset by higher earnings from real estate investments.
Financial Condition of Erie Insurance Exchange
Serving in the capacity of attorney-in-fact for the Exchange, we are dependent on the growth and financial condition of the Exchange, who is our sole customer. The strength of the Exchange and its wholly owned subsidiaries is rated annually by A.M. Best Company. Higher ratings of insurance companies generally indicate financial stability and a strong ability to pay claims. The ratings are generally based upon factors relevant to policyholders and are not directed toward return to investors. The Exchange and each of its property and casualty subsidiaries are rated A+ "Superior". The outlook for the financial strength rating is stable. According to A.M. Best, this second highest financial strength rating category is assigned to those companies that, in A.M. Best's opinion, have achieved superior overall performance when compared to the standards established by A.M. Best and have a superior ability to meet obligations to policyholders over the long term. Only approximately 12% of insurance groups are rated A+ or higher, and the Exchange is included in that group.
The financial statements of the Exchange are prepared in accordance with statutory accounting principles prescribed by the Commonwealth of Pennsylvania. Financial statements prepared under statutory accounting principles focus on the solvency of the insurer and generally provide a more conservative approach than under GAAP. Statutory direct written premiums of the Exchange and its wholly owned property and casualty subsidiaries grew 6.0% to $6.7 billion in 2017 from $6.3 billion in 2016. These premiums, along with investment income, are the major sources of cash that support the operations of the Exchange. Policyholders' surplus, determined under statutory accounting principles, was $8.8 billion and $7.7 billion at December 31, 2017 and 2016, respectively. The Exchange and its wholly owned property and casualty subsidiaries' year-over-year policy retention ratio continues to be high at 89.6% at December 31, 2017 and 89.8% at December 31, 2016.
FINANCIAL CONDITION
Investments
Our investment portfolio is managed with the objective of maximizing after-tax returns on a risk-adjusted basis.
Distribution of investments
Carrying value at December 31, | ||||||||||||||
(dollars in thousands) | 2017 | % to total | 2016 | % to total | ||||||||||
Indemnity | ||||||||||||||
Fixed maturities | $ | 745,961 | 93 | % | $ | 707,341 | 90 | % | ||||||
Equity securities: | ||||||||||||||
Preferred stock | 12,752 | 2 | 0 | 0 | ||||||||||
Common stock | 0 | 0 | 5,950 | 1 | ||||||||||
Limited partnerships: | ||||||||||||||
Private equity | 31,663 | 4 | 35,228 | 5 | ||||||||||
Mezzanine debt | 3,516 | 0 | 6,010 | 1 | ||||||||||
Real estate | 9,943 | 1 | 16,921 | 3 | ||||||||||
Real estate mortgage loans | 136 | 0 | 213 | 0 | ||||||||||
Total investments | $ | 803,971 | 100 | % | $ | 771,663 | 100 | % | ||||||
We continually review our investment portfolio to evaluate positions that might incur other-than-temporary declines in value. We record impairment write-downs on investments in instances where the fair value of the investment is substantially below cost, and we conclude that the decline in fair value is other-than-temporary, which includes consideration for intent to sell. For all investment holdings, general economic conditions and/or conditions specifically affecting the underlying issuer or its industry, including downgrades by the major rating agencies, are considered in evaluating impairment in value. In addition to specific factors, other factors considered in our review of investment valuation are the length of time the fair value is below cost and the amount the fair value is below cost.
30
We individually analyze all positions with emphasis on those that have, in our opinion, declined significantly below cost. In compliance with impairment guidance for debt securities, we perform further analysis to determine if a credit-related impairment has occurred. Some of the factors considered in determining whether a debt security is credit impaired include potential for the default of interest and/or principal, level of subordination, collateral of the issue, compliance with financial covenants, credit ratings and industry conditions. We have the intent to sell all credit-impaired debt securities; therefore, the entire amount of the impairment charges are included in earnings and no impairments are recorded in other comprehensive income. For available-for-sale equity securities, a charge is recorded in the Statements of Operations for positions that have experienced other-than-temporary impairments. (See the "Results of Operations" section herein for further information.) We believe our investment valuation philosophy and accounting practices result in appropriate and timely measurement of value and recognition of impairment.
Fixed maturities
Under our investment strategy, we maintain a fixed maturity portfolio that is of high quality and well diversified within each market sector. This investment strategy also achieves a balanced maturity schedule. Our fixed maturity portfolio is managed with the goal of achieving reasonable returns while limiting exposure to risk. Our municipal bond portfolio accounts for $259.3 million, or 35%, of the total fixed maturity portfolio at December 31, 2017. The overall credit rating of the municipal portfolio without consideration of the underlying insurance is AA+.
Fixed maturities classified as available-for-sale are carried at fair value with unrealized gains and losses, net of deferred taxes, included in shareholders' equity. Net unrealized gains on fixed maturities, net of deferred taxes, amounted to $3.3 million at December 31, 2017, compared to $3.2 million at December 31, 2016.
The following table presents a breakdown of the fair value of our fixed maturity portfolio by sector and rating: (1)
At December 31, 2017 | ||||||||||||||||||||||||
(in thousands) | Non-investment | Fair | ||||||||||||||||||||||
Industry Sector | AAA | AA | A | BBB | grade | value | ||||||||||||||||||
Basic materials | $ | 0 | $ | 0 | $ | 0 | $ | 0 | $ | 13,425 | $ | 13,425 | ||||||||||||
Communications | 0 | 0 | 3,990 | 7,607 | 27,095 | 38,692 | ||||||||||||||||||
Consumer | 0 | 1,049 | 6,474 | 32,827 | 46,691 | 87,041 | ||||||||||||||||||
Diversified | 0 | 0 | 0 | 0 | 348 | 348 | ||||||||||||||||||
Energy | 0 | 998 | 2,995 | 9,167 | 15,897 | 29,057 | ||||||||||||||||||
Financial | 0 | 3,977 | 33,853 | 48,712 | 17,698 | 104,240 | ||||||||||||||||||
Government-municipal | 100,033 | 148,058 | 11,173 | 0 | 0 | 259,264 | ||||||||||||||||||
Healthcare | 0 | 0 | 0 | 0 | 502 | 502 | ||||||||||||||||||
Industrial | 0 | 0 | 6,970 | 3,374 | 24,196 | 34,540 | ||||||||||||||||||
Structured securities (2) | 69,547 | 29,798 | 14,286 | 5,873 | 8,433 | 127,937 | ||||||||||||||||||
Technology | 0 | 3,971 | 2,089 | 8,952 | 14,474 | 29,486 | ||||||||||||||||||
U.S. Treasury | 0 | 11,734 | 0 | 0 | 0 | 11,734 | ||||||||||||||||||
Utilities | 0 | 0 | 1,988 | 4,976 | 2,731 | 9,695 | ||||||||||||||||||
Total | $ | 169,580 | $ | 199,585 | $ | 83,818 | $ | 121,488 | $ | 171,490 | $ | 745,961 | ||||||||||||
(1) Ratings are supplied by S&P, Moody's, and Fitch. The table is based upon the lowest rating for each security.
(2) Structured securities include residential mortgage-backed securities. commercial mortgage-backed securities, collateralized debt obligations, and asset-backed securities.
31
Equity Securities
Our available-for-sale equity securities consist of common stock and nonredeemable preferred stock and are carried at fair value on the Statements of Financial Position with all changes in unrealized gains and losses reflected in other comprehensive income. The net unrealized loss on equity securities classified as available-for-sale, net of deferred taxes, was $0.1 million at both December 31, 2017 and December 31, 2016.
The following table presents an analysis of the fair value of our preferred and common stock securities by sector at December 31:
(in thousands) | 2017 | 2016 | ||||||||||||||
Industry sector | Preferred stock | Common stock | Preferred stock | Common stock | ||||||||||||
Financial | $ | 11,659 | $ | 0 | $ | 0 | $ | 0 | ||||||||
Funds (1) | 0 | 0 | 0 | 5,950 | ||||||||||||
Utilities | 1,093 | 0 | 0 | 0 | ||||||||||||
Total | $ | 12,752 | $ | 0 | $ | 0 | $ | 5,950 | ||||||||
(1) Includes certain exchange traded funds with underlying holdings of fixed maturity securities. These securities meet the criteria of a common stock under U.S. GAAP, and are included on the balance sheet as available-for-sale equity securities.
Limited partnerships
In 2017, investments in limited partnerships decreased from the investment levels at December 31, 2016. Changes in partnership values are a function of contributions and distributions, adjusted for market value changes in the underlying investments. The decrease in limited partnership investments was due to net distributions received from the partnerships which were partially offset by increases in underlying asset values. We have made no new limited partnership commitments since 2006, and the balance of limited partnership investments is expected to decline over time as additional distributions are received. The results from our limited partnerships are based upon financial statements received from our general partners, which are generally received on a quarter lag. As a result, the market values and earnings recorded at December 31, 2017 reflect the partnership activity experienced during the twelve month period ending September 30, 2017.
Shareholders' Equity
Postretirement benefit plans
The funded status of our postretirement benefit plans is recognized in the Statements of Financial Position, with a corresponding adjustment to accumulated other comprehensive income, net of tax. At December 31, 2017, shareholders' equity amounts related to these postretirement plans decreased by $8.1 million, net of tax at the newly enacted tax rate of 21%, of which $7.7 million represents amortization of the prior service cost and net actuarial loss and $15.8 million represents the current period actuarial loss. The 2017 actuarial loss was primarily due to the change in the discount rate assumption used to measure the future benefit obligations to 3.73% in 2017, from 4.24% in 2016, somewhat offset by the actual investment returns outperforming the assumed rate of return. At December 31, 2016, shareholders' equity amounts related to these postretirement plans decreased by $24.6 million, net of tax, of which $5.5 million represents amortization of the prior service cost and net actuarial loss and $30.1 million represents the current period actuarial loss. The 2016 actuarial loss was primarily due to the change in the discount rate assumption used to measure the future benefit obligations to 4.24% in 2016, from 4.57% in 2015. Although we are the sponsor of these postretirement plans and record the funded status of these plans, the Exchange and its subsidiaries reimburse us for approximately 59% of the annual benefit expense of these plans, which represents pension benefits for our employees performing claims and life insurance functions and their share of service department costs.
Home Office Expansion
On November 7, 2016, we entered into a credit agreement for a $100 million senior secured draw term loan credit facility ("Credit Facility") for the acquisition of real property and construction of an office building that will serve as part of our principal headquarters. As of December 31, 2017, we have drawn $75 million against the facility. Under the agreement, an additional $25 million will be drawn on June 1, 2018 ("Draw Period"). During the Draw Period, we will make monthly interest only payments under the Credit Facility and thereafter the Credit Facility converts to a fully-amortized term loan with monthly payments of principal and interest over a period of 28 years. Borrowings under the Credit Facility will bear interest at a fixed rate of 4.35%. In addition, we are required to pay a quarterly commitment fee of 0.08% on the unused portion of the Credit Facility during the Draw Period. We capitalize applicable interest charges incurred during the construction period of long-term building projects as part of the historical cost of the asset.
32
LIQUIDITY AND CAPITAL RESOURCES
Sources and Uses of Cash
Liquidity is a measure of a company's ability to generate sufficient cash flows to meet the short- and long-term cash requirements of its business operations and growth needs. Our liquidity requirements have been met primarily by funds generated from management fee revenue and income from investments. Cash provided from these sources is used primarily to fund the costs of our management operations including commissions, salaries and wages, pension plans, share repurchases, dividends to shareholders, and the purchase and development of information technology. We expect that our operating cash needs will be met by funds generated from operations.
Volatility in the financial markets presents challenges to us as we do occasionally access our investment portfolio as a source of cash. Some of our fixed income investments, despite being publicly traded, are illiquid. Volatility in these markets could impair our ability to sell certain of our fixed income securities or cause such securities to sell at deep discounts. Additionally, our limited partnership investments are significantly less liquid. We believe we have sufficient liquidity to meet our needs from other sources even if market volatility persists throughout 2018.
Cash flow activities
The following table provides condensed cash flow information for the years ended December 31:
(in thousands) | 2017 | 2016 | 2015 | |||||||||
Net cash provided by operating activities | $ | 197,126 | $ | 254,336 | $ | 217,378 | ||||||
Net cash (used in) provided by investing activities | (74,663 | ) | (136,944 | ) | 622 | |||||||
Net cash used in financing activities | (95,814 | ) | (111,209 | ) | (126,858 | ) | ||||||
Net increase in cash | $ | 26,649 | $ | 6,183 | $ | 91,142 | ||||||
Net cash provided by operating activities was $197.1 million in 2017, compared to $254.3 million in 2016 and $217.4 million in 2015. Decreased cash provided by operating activities in 2017 was primarily due to higher commissions and bonuses paid to agents, pension contributions, and general operating expenses paid, compared to 2016. Cash paid for agent commissions and bonuses increased to $923.4 million in 2017, compared to $870.6 million in 2016, due to higher scheduled commissions driven by premium growth and higher bonus award payments resulting from profitable underwriting results. We contributed $58.9 million to our pension plan in 2017, compared to $17.4 million in 2016. Additionally, our Board approved an $80 million accelerated pension contribution. We contributed $40 million in January 2018 and plan to make an additional $40 million contribution in April 2018. We are reimbursed approximately 59% of the net periodic benefit cost of the pension plans from the Exchange and its subsidiaries, which represents pension benefits for our employees performing claims and life insurance functions and their share of service department costs. Cash paid for general operating expenses increased $23.1 million to $199.1 million in 2017 driven by higher information technology-related professional fees and hardware and software costs. Somewhat offsetting the decrease in cash provided in 2017 was an increase in management fee revenue received, reflecting the increase in direct and assumed premiums written by the Exchange. In 2016, increased cash from operating activities, compared to 2015, was primarily due to an increase in management fee revenue received, reflecting the increase in direct and assumed premiums written by the Exchange, combined with lower general operating expenses paid. Somewhat offsetting this increase in cash provided was an increase in commissions and bonuses paid to agents combined with a decrease in reimbursements collected from affiliates, compared to 2015.
At December 31, 2017, we recorded a net deferred tax asset of $19.4 million, compared to $53.9 million at December 31, 2016. On December 22, 2017, the TCJA was enacted, which reduced the corporate income tax rate from 35% to 21%. The decrease in the the net deferred tax asset at December 31, 2017 was primarily due to re-measurement using the newly enacted rate of 21% and the accelerated pension contributions. Beginning in 2018, we expect our effective corporate income tax rate to decline to approximately 21% from approximately 34% as a result of the enactment of the TCJA. There was no deferred tax valuation allowance recorded at December 31, 2017.
Net cash used in investing activities totaled $74.7 million in 2017 and $136.9 million in 2016, compared to cash provided of $0.6 million in 2015. The decrease in cash used in 2017, compared to 2016, was driven by more cash being generated from the sales, maturities and calls of available-for-sale securities. Also impacting our future investing activities are limited partnership commitments, which totaled $16.3 million at December 31, 2017, and will be funded as required by the partnerships' agreements. Of this amount, the total remaining commitment to fund limited partnerships that invest in private equity securities was $6.6 million, mezzanine debt securities was $8.2 million, and real estate activities was $1.5 million. Additionally, we have committed to incur future costs related to the construction of the building that will serve as part of our principal headquarters, which is expected to cost $100 million and is being funded by the senior secured draw term loan credit
33
facility of the same amount. As of December 31, 2017, $26.3 million of costs have been incurred related to this project. Increases in purchases of available-for-sale securities and fixed assets, coupled with lower cash generated from the return of capital from limited partnerships, contributed to cash used in 2016, compared to cash provided in 2015. Somewhat offsetting the cash used in 2016 was an increase in cash generated from the sale and maturity of available-for-sale securities, compared to 2015.
Net cash used in financing activities totaled $95.8 million in 2017, $111.2 million in 2016, and $126.9 million in 2015. The decrease in cash used in 2017 and 2016 was due to the scheduled draws on the senior secured draw term loan credit facility, somewhat offset by an increase in cash paid for dividends to shareholders. Future financing activities will reflect the draw requirements under the senior secured draw term loan credit facility, which will increase the cash provided by financing activities by another $25 million in 2018, while principal payments will not commence until 2019. Dividends paid to shareholders totaled $145.8 million, $136.0 million, and $126.9 million in 2017, 2016 and 2015, respectively. We increased both our Class A and Class B shareholder regular quarterly dividends by 7.2% for 2017 and 2016. Dividends have been approved at a 7.3% increase for 2018.
No shares of our Class A nonvoting common stock were repurchased in 2017, 2016 and 2015 in conjunction with our stock repurchase program. In October 2011, our Board of Directors approved a continuation of the current stock repurchase program for a total of $150 million with no time limitation. This repurchase authority includes, and is not in addition to, any unspent amounts remaining under the prior authorization. We had approximately $17.8 million of repurchase authority remaining under this program at December 31, 2017, based upon trade date.
In 2017, 2016 and 2015, we purchased shares of our outstanding Class A nonvoting common stock outside of our publicly announced share repurchase program for certain stock-based incentive plans. In 2017, we purchased 60,332 shares for $7.3 million for our long-term incentive plan, to fund the rabbi trust for the outside director deferred stock compensation plan, and for our equity compensation plan. These shares were delivered in 2017. In 2016, we purchased 15,093 shares for $1.5 million for our long-term incentive plan and to fund the rabbi trust for the outside director deferred stock compensation plan. These shares were delivered in 2016. In 2015, we purchased 111,535 shares for $10.4 million to fund the rabbi trust for the outside director deferred stock compensation plan, for stock-based awards for executive management and an outside director, and for our long-term incentive plan. These shares were delivered in 2015.
Capital Outlook
We regularly prepare forecasts evaluating the current and future cash requirements for both normal and extreme risk events. Should an extreme risk event result in a cash requirement exceeding normal cash flows, we have the ability to meet our future funding requirements through various alternatives available to us.
Outside of our normal operating and investing cash activities, future funding requirements could be met through:
1) cash and cash equivalents, which total approximately $215.7 million at December 31, 2017, 2) a $100 million bank revolving line of credit, and 3) liquidation of assets held in our investment portfolio, including preferred stock and investment grade bonds which totaled approximately $371.0 million at December 31, 2017. Volatility in the financial markets could impair our ability to sell certain of our fixed income securities or cause such securities to sell at deep discounts. Additionally, we have the ability to curtail or modify discretionary cash outlays such as those related to shareholder dividends and share repurchase activities.
As of December 31, 2017, we have access to a $100 million bank revolving line of credit with a $25 million letter of credit sublimit that expires on November 3, 2020. As of December 31, 2017, a total of $99.1 million remains available under the facility due to $0.9 million outstanding letters of credit, which reduce the availability for letters of credit to $24.1 million. We had no borrowings outstanding on our line of credit as of December 31, 2017. Bonds with a fair value of $108.0 million were pledged as collateral on the line at December 31, 2017. These securities have no trading restrictions and are reported as available-for-sale securities in the Statements of Financial Position. The bank requires compliance with certain covenants, which include leverage ratios and debt restrictions, for our line of credit. We were in compliance with our bank covenants at December 31, 2017.
34
Contractual Obligations
We have certain obligations and commitments to make future payments under various contracts. As of December 31, 2017, the aggregate obligations were as follows:
(in thousands) | Payments due by period | |||||||||||||||||||
Total | 2018 | 2019-2020 | 2021-2022 | 2023 and thereafter | ||||||||||||||||
Long-term debt(1) | $ | 176,723 | $ | 3,957 | $ | 12,352 | $ | 12,352 | $ | 148,062 | ||||||||||
Home office expansion(2) | 88,846 | 30,139 | 58,707 | 0 | 0 | |||||||||||||||
Limited partnership commitments(3) | 16,340 | 16,340 | 0 | 0 | 0 | |||||||||||||||
Pension contribution(4) | 80,000 | 80,000 | 0 | 0 | 0 | |||||||||||||||
Other commitments(5) | 132,882 | 63,906 | 58,831 | 7,202 | 2,943 | |||||||||||||||
Operating leases – vehicles | 56,355 | 25,342 | 31,013 | 0 | 0 | |||||||||||||||
Operating leases – real estate(6) | 11,728 | 3,557 | 4,990 | 1,769 | 1,412 | |||||||||||||||
Operating leases – computer equipment | 11,307 | 5,298 | 6,009 | 0 | 0 | |||||||||||||||
Gross contractual obligations | 574,181 | 228,539 | 171,902 | 21,323 | 152,417 | |||||||||||||||
Estimated reimbursements from affiliates(7) | 167,446 | 101,618 | 57,924 | 4,988 | 2,916 | |||||||||||||||
Net contractual obligations | $ | 406,735 | $ | 126,921 | $ | 113,978 | $ | 16,335 | $ | 149,501 | ||||||||||
(1) | Long-term debt amount differs from the balance presented on the Statements of Financial Position as the long-term debt amount in the table above includes interest and principal payments based upon total expected draw commitments and excludes commitment fees. |
(2) | On July 10, 2017, we agreed to the guaranteed maximum price terms of an agreement with our construction manager for the construction of the office building that will serve as part of our principal headquarters. The expected date for substantial completion of the project is January 2020. The costs of this project are being funded by the senior secured draw term loan credit facility included in long-term debt in the table above. |
(3) | Limited partnership commitments will be funded as required for capital contributions at any time prior to the agreement expiration date. The commitment amounts are presented using the expiration date as the factor by which to age when the amounts are due. At December 31, 2017, our total commitment to fund limited partnerships that invest in private equity securities was $6.6 million, mezzanine debt was $8.2 million, and real estate activities was $1.5 million. |
(4) | Contributions anticipated in future years depend upon certain factors that cannot be reasonably predicted. Additional contributions may be made due to future plan changes, our business or investment strategy, or pending law changes. The obligations for our unfunded benefit plans, including the Supplemental Employee Retirement Plan (SERP) for our executive and senior management, are not included in gross contractual obligations. The recorded accumulated benefit obligation for this plan at December 31, 2017 is $17.1 million. We expect to have sufficient cash flows from operations to meet the future benefit payments as these become due. |
(5) | Other commitments include various agreements for services, including information technology, support, and maintenance obligations, and other obligations in the ordinary course of business. These agreements are enforceable and legally binding and specify fixed or minimum quantities to be purchased and the approximate timing of the transaction. The table above also includes agreements that contain cancellation provisions, some of which may require us to pay a termination fee. The amounts under such contracts are included in the table above as we expect to make future cash payments according to the contract terms. |
(6) | Operating leases – real estate are for 18 of our 25 field offices and two operating leases are for office space and a warehouse facility. |
(7) | We are reimbursed from the Exchange and its subsidiaries for a portion of the costs related to the pension, other commitments and operating leases. |
Balance Sheet Arrangements
Off-balance sheet arrangements include those with unconsolidated entities that may have a material current or future effect on our financial condition or results of operations, including material variable interests in unconsolidated entities that conduct certain activities. We have no material off-balance sheet obligations or guarantees, other than the unused portion of the senior secured draw term loan credit facility and limited partnership investment commitments. See the preceding Contractual Obligations section for further discussion of these commitments.
Enterprise Risk Management
The role of our Enterprise Risk Management ("ERM") function is to ensure that all significant risks are clearly identified, understood, proactively managed and consistently monitored to achieve strategic objectives for all stakeholders. Our ERM program views risk holistically across our entire group of companies. It ensures implementation of risk responses to mitigate potential impacts. See Item 1A "Risk Factors" contained in this report for a list of risk factors.
Our ERM process is founded on a governance framework that includes oversight at multiple levels of our organization, including our Board of Directors and executive management. Accountability to identify, manage, and mitigate risk is
35
embedded within all functions and areas of our business. We have defined risk tolerances to monitor and manage significant risks within acceptable levels. In addition to identifying, evaluating, prioritizing, monitoring, and mitigating significant risks, our ERM process includes extreme event analyses and scenario testing. Given our defined tolerance for risk, risk model output is used to quantify the potential variability of future performance and the sufficiency of capital and liquidity levels.
TRANSACTIONS/AGREEMENTS WITH RELATED PARTIES
Board Oversight
Our Board of Directors has a broad oversight responsibility over our intercompany relationships with the Exchange. As a consequence, our Board of Directors may be required to make decisions or take actions that may not be solely in the interest of our shareholders, such as setting the management fee rate paid by the Exchange to us and ratifying any other significant intercompany activity.
Subscriber's Agreement
We serve as attorney-in-fact for the subscribers at the Exchange, a reciprocal insurance exchange. Each applicant for insurance to a reciprocal insurance exchange signs a subscriber's agreement that contains an appointment of an attorney-in-fact. Through the designation of attorney-in-fact, we are required to provide policy issuance and renewal services to the subscribers at the Exchange, as discussed previously. Pursuant to the subscriber's agreement, we earn a management fee for these services calculated as a percentage of the direct and assumed premiums written by the Exchange.
Insurance holding company system
Most states have enacted legislation that regulates insurance holding company systems, defined as two or more affiliated persons, one or more of which is an insurer. The Exchange has the following wholly owned property and casualty subsidiaries: Erie Insurance Company, Erie Insurance Company of New York, Erie Insurance Property and Casualty Company and Flagship City Insurance Company, and a wholly owned life insurance company, Erie Family Life Insurance Company ("EFL"). Indemnity and the Exchange, and its wholly owned subsidiaries, meet the definition of an insurance holding company system.
Intercompany Agreements
Services agreements
By virtue of its legal structure as a reciprocal insurer, the Exchange does not have the ability to enter into contractual relationships and therefore, Indemnity serves as the attorney-in-fact on behalf of the Exchange for all claims handling and investment management services, which include certain common overhead and service department functions in accordance with the subscriber's agreement. The Exchange's insurance subsidiaries also utilize Indemnity for these services, including life management services for EFL, in accordance with the services agreements between each of the subsidiaries and Indemnity. The amounts incurred for these services are the responsibility of the Exchange and its insurance subsidiaries as outlined in the subscriber's agreement and the services agreements. These amounts are reimbursed to us based upon appropriate utilization statistics (employee count, square footage, vehicle count, project hours, etc.) in accordance with the subscriber's agreement and the service agreements between us and the Exchange's wholly owned subsidiaries. All reimbursements are made on an actual cost basis and do not include a profit component. These reimbursements are settled on a monthly basis. State insurance regulations require that intercompany service agreements and any material amendments be approved in advance by the state insurance department.
Leased property
We lease certain office space from the Exchange including the home office and three field office facilities. We also have a lease commitment with EFL for a field office. For the home office, rent is based on rental rates of like property in Erie, Pennsylvania and all operating expenses including utilities, cleaning, repairs, real estate taxes, property insurance and leasehold improvements are the responsibility of the tenant (Indemnity). Under the field office leases, rents are determined considering returns on invested capital and include building operating and overhead costs. Rental costs of shared facilities are allocated based upon usage or square footage occupied.
Cost Allocation
The allocation of costs affects the financial condition of us and the Exchange and its wholly owned subsidiaries. Management's role is to determine that allocations are consistently made in accordance with the subscriber's agreements with the subscribers at the Exchange, intercompany service agreements, and applicable insurance laws and regulations. Allocation of costs under these various agreements requires judgment and interpretation, and such allocations are performed using a consistent methodology, which is intended to adhere to the terms and intentions of the underlying agreements.
36
Intercompany Receivables
(dollars in thousands) | 2017 | Percent of total assets | 2016 | Percent of total assets | ||||||||||
Receivables from the Exchange and other affiliates (management fees, costs and reimbursements) | $ | 418,328 | 25.1 | % | $ | 378,540 | 24.4 | % | ||||||
Note receivable from EFL | 25,000 | 1.5 | 25,000 | 1.6 | ||||||||||
Total intercompany receivables | $ | 443,328 | 26.6 | % | $ | 403,540 | 26.0 | % | ||||||
We have significant receivables from the Exchange and its subsidiaries that result in a concentration of credit risk. These receivables include management fees due for services performed by us under the subscriber's agreement, and certain costs we incur acting as attorney-in-fact on behalf of the Exchange for all claims handling and investment management services. The Exchange's insurance subsidiaries also utilize Indemnity for these services, including life management services for EFL, in accordance with the services agreements between each of the subsidiaries and Indemnity. We continually monitor the financial strength of the Exchange. These receivables from the Exchange and its subsidiaries are settled monthly.
Surplus Note
We hold a surplus note for $25 million from EFL that is payable on demand on or after December 31, 2018; however, no principal or interest payments may be made without prior approval by the Pennsylvania Insurance Commissioner. Interest payments are scheduled to be paid semi-annually. We recognized interest income on the note of $1.7 million in 2017, 2016 and 2015.
ITEM 7A. QUANTITATIVE AND QUALITATIVE DISCLOSURES ABOUT MARKET RISK
Market Risk
Market risk is the risk of loss arising from adverse changes in interest rates, credit spreads, equity prices, or foreign exchange rates, as well as other relevant market rate or price changes. The volatility and liquidity in the markets in which the underlying assets are traded directly influence market risk. The following is a discussion of our primary risk exposures, including interest rate risk, investment credit risk, concentration risk, liquidity risk, and equity price risk, and how those exposures are currently managed as of December 31, 2017.
Interest Rate Risk
We invest primarily in fixed maturity investments, which comprised 93% of our invested assets at December 31, 2017. The value of the fixed maturity portfolio is subject to interest rate risk. As market interest rates decrease, the value of the portfolio increases with the opposite holding true in rising interest rate environments. We do not hedge our exposure to interest rate risk. A common measure of the interest sensitivity of fixed maturity assets is effective duration, a calculation that utilizes maturity, coupon rate, yield, and call terms to calculate an expected change in fair value given a change in interest rates. The longer the duration, the more sensitive the asset is to market interest rate fluctuations. Duration is analyzed quarterly to ensure that it remains in the targeted range we established.
A sensitivity analysis is used to measure the potential loss in future earnings, fair values, or cash flows of market-sensitive instruments resulting from one or more selected hypothetical changes in interest rates and other market rates or prices over a selected period. In our sensitivity analysis model, a hypothetical change in market rates is selected that is expected to reflect reasonably possible changes in those rates. The following pro forma information is presented assuming a 100-basis point increase in interest rates at December 31 of each year and reflects the estimated effect on the fair value of our fixed maturity portfolio. We used the effective duration of our fixed maturity portfolio to model the pro forma effect of a change in interest rates at December 31, 2017 and 2016.
Fixed maturities interest-rate sensitivity analysis
(dollars in thousands) | At December 31, | |||||||
2017 | 2016 | |||||||
Fair value of fixed maturity portfolio | $ | 745,961 | $ | 707,341 | ||||
Fair value assuming 100-basis point rise in interest rates | $ | 727,787 | $ | 690,454 | ||||
Effective duration (as a percentage) | 2.5 | 2.4 | ||||||
37
While the fixed maturity portfolio is sensitive to interest rates, the future principal cash flows that will be received by contractual maturity date are presented below at December 31, 2017 and 2016. Actual cash flows may differ from those stated as a result of calls, prepayments, or defaults.
Contractual repayments of principal by maturity date
(in thousands) | ||||
Fixed maturities: | December 31, 2017 | |||
2018 | $ | 70,862 | ||
2019 | 86,167 | |||
2020 | 104,561 | |||
2021 | 76,970 | |||
2022 | 37,131 | |||
Thereafter | 336,717 | |||
Total(1) | $ | 712,408 | ||
Fair value | $ | 745,961 | ||
(1) This amount excludes Indemnity's $25 million surplus note due from EFL.
(in thousands) | ||||
Fixed maturities: | December 31, 2016 | |||
2017 | $ | 54,673 | ||
2018 | 104,569 | |||
2019 | 81,367 | |||
2020 | 69,165 | |||
2021 | 67,845 | |||
Thereafter | 300,342 | |||
Total(1) | $ | 677,961 | ||
Fair value | $ | 707,341 | ||
(1) This amount excludes Indemnity's $25 million surplus note due from EFL.
Investment Credit Risk
Our objective is to earn competitive returns by investing in a diversified portfolio of securities. Our portfolios of fixed maturity securities, nonredeemable preferred stock, mortgage loans and, to a lesser extent, short-term investments are subject to credit risk. This risk is defined as the potential loss in fair value resulting from adverse changes in the borrower's ability to repay the debt. We manage this risk by performing upfront underwriting analysis and ongoing reviews of credit quality by position and for the fixed maturity portfolio in total. We do not hedge the credit risk inherent in our fixed maturity investments.
Generally, the fixed maturities in our portfolio are rated by external rating agencies. If not externally rated, we rate them internally on a basis consistent with that used by the rating agencies. We classify all fixed maturities as available-for-sale securities, allowing us to meet our liquidity needs and provide greater flexibility to appropriately respond to changes in market conditions.
The following tables show our fixed maturity investments by rating(1):
At December 31, 2017 | |||||||||||
(dollars in thousands) | Amortized cost | Fair value | Percent of total | ||||||||
AAA, AA, A | $ | 448,823 | $ | 452,983 | 61 | % | |||||
BBB | 121,821 | 121,488 | 16 | ||||||||
Total investment grade | 570,644 | 574,471 | 77 | ||||||||
BB | 61,111 | 61,521 | 8 | ||||||||
B | 94,827 | 94,996 | 13 | ||||||||
CCC, CC, C, and below | 15,217 | 14,973 | 2 | ||||||||
Total non-investment grade | 171,155 | 171,490 | 23 | ||||||||
Total | $ | 741,799 | $ | 745,961 | 100 | % | |||||
(1) Ratings are supplied by S&P, Moody's, and Fitch. The table is based upon the lowest rating for each security.
38
At December 31, 2016 | |||||||||||
(dollars in thousands) | Amortized cost | Fair value | Percent of total | ||||||||
AAA, AA, A | $ | 433,133 | $ | 436,011 | 62 | % | |||||
BBB | 118,593 | 118,547 | 17 | ||||||||
Total investment grade | 551,726 | 554,558 | 79 | ||||||||
BB | 49,914 | 50,242 | 7 | ||||||||
B | 79,918 | 81,131 | 11 | ||||||||
CCC, CC, C, and below | 20,845 | 21,410 | 3 | ||||||||
Total non-investment grade | 150,677 | 152,783 | 21 | ||||||||
Total | $ | 702,403 | $ | 707,341 | 100 | % | |||||
(1) Ratings are supplied by S&P, Moody's, and Fitch. The table is based upon the lowest rating for each security.
Approximately 17% of the fixed income portfolio is invested in structured products at December 31, 2017 compared to approximately 18% at December 31, 2016. Our structured portfolio includes residential mortgage-backed securities, commercial mortgage-backed securities, collateralized debt obligations, and asset-backed securities. The overall credit rating of the structured product portfolio is AA at both December 31, 2017 and 2016.
Our municipal bond portfolio accounts for $259.3 million, or 35% of the total fixed maturity portfolio at December 31, 2017 and $253.1 million, or 36% of the total fixed maturity portfolio at December 31, 2016. The overall credit rating of our municipal portfolio is AA+ at December 31, 2017, compared to AA at December 31, 2016.
Our limited partnership investment portfolio is exposed to credit risk, as well as price risk. Price risk is defined as the potential loss in estimated fair value resulting from an adverse change in prices. Our investments are directly affected by the impact of changes in these risk factors on the underlying investments held by our fund managers, which could vary significantly from fund to fund. We manage these risks by performing up-front due diligence on our fund managers, ongoing monitoring, and through the construction of a diversified portfolio.
We are also exposed to a concentration of credit risk with the Exchange. See the section, "Transactions/Agreements with Related Parties, Intercompany Receivables" for further discussion of this risk.
Concentration Risk
While our portfolio is well diversified within each market sector, there is an inherent risk of concentration in a particular industry or sector. We continually monitor our level of exposure to individual issuers as well as our allocation to each industry and market sector against internally established policies. See the "Financial Condition" section of Item 7. "Management's Discussion and Analysis of Financial Condition and Results of Operations" contained within this report for details of investment holdings by sector.
Liquidity Risk
Periods of volatility in the financial markets can create conditions where fixed maturity investments, despite being publicly traded, can become illiquid. However, we actively manage the maturity profile of our fixed maturity portfolio such that scheduled repayments of principal occur on a regular basis. Additionally, there is no ready market for limited partnerships, which increases the risk that these investments may not be converted to cash on favorable terms and on a timely basis.
Equity Price Risk
Our portfolio of equity securities, which includes nonredeemable preferred stock and common stock classified as available-for-sale, are carried on the Statements of Financial Position at estimated fair value. Equity securities are exposed to the risk of potential loss in estimated fair value resulting from an adverse change in prices ("price risk"). We do not hedge our exposure to price risk inherent in our equity investments.
Common stocks designated as available-for-sale securities represent investments in certain exchange traded funds with underlying holdings of fixed maturity securities. While the performance of the exchange traded funds closely tracks that of the underlying fixed maturity securities, these investments are reported as common stock based on U.S. GAAP requirements. We did not hold these investments at December 31, 2017. The average effective duration of these investments as reported by the funds was 6.3 at December 31, 2016.
39
ITEM 8. FINANCIAL STATEMENTS AND SUPPLEMENTARY DATA
Report of Independent Registered Public Accounting Firm
The Board of Directors and Shareholders of Erie Indemnity Company
Opinion on the Financial Statements
We have audited the accompanying statements of financial position of Erie Indemnity Company (the "Company") as of December 31, 2017 and 2016, and the related statements of operations, comprehensive income, shareholders' equity and cash flows, for each of the three years in the period ended December 31, 2017, and the related notes and schedules (collectively referred to as the "financial statements"). In our opinion, the financial statements present fairly, in all material respects, the financial position of the Company as of December 31, 2017 and 2016, and the results of its operations and its cash flows for each of the three years in the period ended December 31, 2017, in conformity with US generally accepted accounting principles.
We also have audited, in accordance with the standards of the Public Company Accounting Oversight Board (United States) (PCAOB), the Company's internal control over financial reporting as of December 31, 2017, based on criteria established in Internal Control-Integrated Framework issued by the Committee of Sponsoring Organizations of the Treadway Commission (2013 framework) and our report dated February 22, 2018 expressed an unqualified opinion thereon.
Basis for Opinion
These financial statements are the responsibility of the Company's management. Our responsibility is to express an opinion on the Company's financial statements based on our audits. We are a public accounting firm registered with the PCAOB and are required to be independent with respect to the Company in accordance with the US federal securities laws and the applicable rules and regulations of the Securities and Exchange Commission and the PCAOB.
We conducted our audits in accordance with the standards of the PCAOB. Those standards require that we plan and perform the audit to obtain reasonable assurance about whether the financial statements are free of material misstatement, whether due to error or fraud. Our audits included performing procedures to assess the risks of material misstatement of the financial statements, whether due to error or fraud, and performing procedures that respond to those risks. Such procedures include examining, on a test basis, evidence regarding the amounts and disclosures in the financial statements. Our audits also included evaluating the accounting principles used and significant estimates made by management, as well as evaluating the overall presentation of the financial statements. We believe that our audits provide a reasonable basis for our opinion.
/s/ Ernst & Young
We have served as the Company's auditor since 2003.
Philadelphia, PA
February 22, 2018
40
ERIE INDEMNITY COMPANY
STATEMENTS OF OPERATIONS
Years ended December 31, 2017, 2016 and 2015
(dollars in thousands, except per share data)
2017 | 2016 | 2015 | ||||||||||
Operating revenue | ||||||||||||
Management fee revenue, net | $ | 1,662,625 | $ | 1,567,431 | $ | 1,475,511 | ||||||
Service agreement revenue | 29,149 | 29,200 | 29,997 | |||||||||
Total operating revenue | 1,691,774 | 1,596,631 | 1,505,508 | |||||||||
Operating expenses | ||||||||||||
Commissions | 947,481 | 893,800 | 847,880 | |||||||||
Salaries and employee benefits | 240,181 | 213,356 | 226,713 | |||||||||
All other operating expenses | 215,740 | 197,111 | 198,374 | |||||||||
Total operating expenses | 1,403,402 | 1,304,267 | 1,272,967 | |||||||||
Operating income | 288,372 | 292,364 | 232,541 | |||||||||
Investment income | ||||||||||||
Net investment income | 24,608 | 20,547 | 17,791 | |||||||||
Net realized investment gains | 1,334 | 672 | 492 | |||||||||
Net impairment losses recognized in earnings | (182 | ) | (416 | ) | (1,558 | ) | ||||||
Equity in earnings of limited partnerships | 2,801 | 7,025 | 16,983 | |||||||||
Total investment income | 28,561 | 27,828 | 33,708 | |||||||||
Interest expense, net | 1,238 | 101 | — | |||||||||
Income before income taxes | 315,695 | 320,091 | 266,249 | |||||||||
Income tax expense | 118,696 | 109,725 | 91,571 | |||||||||
Net income | $ | 196,999 | $ | 210,366 | $ | 174,678 | ||||||
Earnings Per Share | ||||||||||||
Net income per share | ||||||||||||
Class A common stock – basic | $ | 4.23 | $ | 4.52 | $ | 3.75 | ||||||
Class A common stock – diluted | $ | 3.76 | $ | 4.01 | $ | 3.33 | ||||||
Class B common stock – basic | $ | 635 | $ | 678 | $ | 563 | ||||||
Class B common stock – diluted | $ | 634 | $ | 677 | $ | 562 | ||||||
Weighted average shares outstanding – Basic | ||||||||||||
Class A common stock | 46,186,831 | 46,188,952 | 46,186,671 | |||||||||
Class B common stock | 2,542 | 2,542 | 2,542 | |||||||||
Weighted average shares outstanding – Diluted | ||||||||||||
Class A common stock | 52,337,463 | 52,435,303 | 52,498,811 | |||||||||
Class B common stock | 2,542 | 2,542 | 2,542 | |||||||||
See accompanying notes to Financial Statements. See Note 12, "Accumulated Other Comprehensive Income (Loss)", for amounts reclassified out of accumulated other comprehensive income (loss) into the Statements of Operations.
41
ERIE INDEMNITY COMPANY
STATEMENTS OF COMPREHENSIVE INCOME
Years ended December 31, 2017, 2016 and 2015
(in thousands)
2017 | 2016 | 2015 | ||||||||||
Net income | $ | 196,999 | $ | 210,366 | $ | 174,678 | ||||||
Other comprehensive (loss) income, net of tax | ||||||||||||
Change in unrealized holding (losses) gains on available-for-sale securities | (190 | ) | 43 | (4,280 | ) | |||||||
Pension and other postretirement plans | (8,105 | ) | (24,560 | ) | 25,117 | |||||||
Total other comprehensive (loss) income, net of tax | (8,295 | ) | (24,517 | ) | 20,837 | |||||||
Comprehensive income | $ | 188,704 | $ | 185,849 | $ | 195,515 | ||||||
See accompanying notes to Financial Statements. See Note 12, "Accumulated Other Comprehensive Income (Loss)", for amounts reclassified out of accumulated other comprehensive income (loss) into the Statements of Operations.
42
ERIE INDEMNITY COMPANY
STATEMENTS OF FINANCIAL POSITION
At December 31, 2017 and 2016
(dollars in thousands, except per share data)
2017 | 2016 | |||||||
Assets | ||||||||
Current assets: | ||||||||
Cash and cash equivalents | $ | 215,721 | $ | 189,072 | ||||
Available-for-sale securities | 71,190 | 56,138 | ||||||
Receivables from Erie Insurance Exchange and affiliates | 418,328 | 378,540 | ||||||
Prepaid expenses and other current assets | 34,890 | 30,169 | ||||||
Federal income taxes recoverable | 29,900 | 5,260 | ||||||
Note receivable from Erie Family Life Insurance Company | 25,000 | 0 | ||||||
Accrued investment income | 6,853 | 6,337 | ||||||
Total current assets | 801,882 | 665,516 | ||||||
Available-for-sale securities | 687,523 | 657,153 | ||||||
Limited partnership investments | 45,122 | 58,159 | ||||||
Fixed assets, net | 83,149 | 69,142 | ||||||
Deferred income taxes, net | 19,390 | 53,889 | ||||||
Note receivable from Erie Family Life Insurance Company | 0 | 25,000 | ||||||
Other assets | 28,793 | 20,096 | ||||||
Total assets | $ | 1,665,859 | $ | 1,548,955 | ||||
Liabilities and shareholders' equity | ||||||||
Current liabilities: | ||||||||
Commissions payable | $ | 228,124 | $ | 210,559 | ||||
Agent bonuses | 122,528 | 114,772 | ||||||
Accounts payable and accrued liabilities | 104,533 | 88,153 | ||||||
Dividends payable | 39,116 | 36,441 | ||||||
Deferred executive compensation | 15,605 | 19,675 | ||||||
Total current liabilities | 509,906 | 469,600 | ||||||
Defined benefit pension plans | 207,530 | 221,827 | ||||||
Employee benefit obligations | 423 | 756 | ||||||
Deferred executive compensation | 14,452 | 13,233 | ||||||
Long-term borrowings | 74,728 | 24,766 | ||||||
Other long-term liabilities | 1,476 | 1,863 | ||||||
Total liabilities | 808,515 | 732,045 | ||||||
Shareholders' equity | ||||||||
Class A common stock, stated value $0.0292 per share; 74,996,930 shares authorized; 68,299,200 shares issued; 46,189,068 shares outstanding | 1,992 | 1,992 | ||||||
Class B common stock, convertible at a rate of 2,400 Class A shares for one Class B share, stated value $70 per share; 3,070 shares authorized; 2,542 shares issued and outstanding | 178 | 178 | ||||||
Additional paid-in-capital | 16,470 | 16,300 | ||||||
Accumulated other comprehensive loss | (156,059 | ) | (121,381 | ) | ||||
Retained earnings | 2,140,853 | 2,065,911 | ||||||
Total contributed capital and retained earnings | 2,003,434 | 1,963,000 | ||||||
Treasury stock, at cost; 22,110,132 shares held | (1,155,668 | ) | (1,155,846 | ) | ||||
Deferred compensation | 9,578 | 9,756 | ||||||
Total shareholders' equity | 857,344 | 816,910 | ||||||
Total liabilities and shareholders' equity | $ | 1,665,859 | $ | 1,548,955 | ||||
See accompanying notes to Financial Statements.
43
ERIE INDEMNITY COMPANY
STATEMENTS OF SHAREHOLDERS' EQUITY
Years ended December 31, 2017, 2016 and 2015
(dollars in thousands, except per share data)
Class A common stock | Class B common stock | Additional paid-in-capital | Accumulated other comprehensive income (loss) | Retained earnings | Treasury stock | Deferred compensation | Total shareholders' equity | |||||||||||||||||
Balance, December 31, 2014 | $ | 1,992 | $ | 178 | $ | 16,317 | $ | (117,701 | ) | $ | 1,948,438 | $ | (1,146,090 | ) | $ | — | $ | 703,134 | ||||||
Net income | 174,678 | 174,678 | ||||||||||||||||||||||
Other comprehensive income | 20,837 | 20,837 | ||||||||||||||||||||||
Dividends declared: | ||||||||||||||||||||||||
Class A $2.773 per share | (128,082 | ) | (128,082 | ) | ||||||||||||||||||||
Class B $415.95 per share | (1,058 | ) | (1,058 | ) | ||||||||||||||||||||
Net purchase of treasury stock (1) | (6 | ) | 0 | (6 | ) | |||||||||||||||||||
Deferred compensation | (9,018 | ) | 9,018 | 0 | ||||||||||||||||||||
Balance, December 31, 2015 | $ | 1,992 | $ | 178 | $ | 16,311 | $ | (96,864 | ) | $ | 1,993,976 | $ | (1,155,108 | ) | $ | 9,018 | $ | 769,503 | ||||||
Net income | 210,366 | 210,366 | ||||||||||||||||||||||
Other comprehensive loss | (24,517 | ) | (24,517 | ) | ||||||||||||||||||||
Dividends declared: | ||||||||||||||||||||||||
Class A $2.9725 per share | (137,297 | ) | (137,297 | ) | ||||||||||||||||||||
Class B $445.875 per share | (1,134 | ) | (1,134 | ) | ||||||||||||||||||||
Net purchase of treasury stock (1) | (11 | ) | 0 | (11 | ) | |||||||||||||||||||
Deferred compensation | (738 | ) | 738 | 0 | ||||||||||||||||||||
Balance, December 31, 2016 | $ | 1,992 | $ | 178 | $ | 16,300 | $ | (121,381 | ) | $ | 2,065,911 | $ | (1,155,846 | ) | $ | 9,756 | $ | 816,910 | ||||||
Net income | 196,999 | 196,999 | ||||||||||||||||||||||
Other comprehensive loss | (8,295 | ) | (8,295 | ) | ||||||||||||||||||||
Dividends declared: | ||||||||||||||||||||||||
Class A $3.1875 per share | (147,225 | ) | (147,225 | ) | ||||||||||||||||||||
Class B $478.125 per share | (1,215 | ) | (1,215 | ) | ||||||||||||||||||||
Net purchase of treasury stock (1) | 170 | 0 | 170 | |||||||||||||||||||||
Deferred compensation | (1,177 | ) | 1,177 | 0 | ||||||||||||||||||||
Rabbi trust distribution (2) | 1,355 | (1,355 | ) | 0 | ||||||||||||||||||||
AOCI reclassification (3) | (26,383 | ) | 26,383 | 0 | ||||||||||||||||||||
Balance, December 31, 2017 | $ | 1,992 | $ | 178 | $ | 16,470 | $ | (156,059 | ) | $ | 2,140,853 | $ | (1,155,668 | ) | $ | 9,578 | $ | 857,344 | ||||||
(1) Net purchases of treasury stock in 2015, 2016 and 2017 includes the repurchase of our Class A common stock in the open market that were subsequently distributed to satisfy stock based compensation awards. See Note 11, "Capital Stock", for additional information on treasury stock transactions.
(2) In 2017, a distribution of our Class A shares was made from the rabbi trust to a retired director. See Note 9, "Incentive and Deferred Compensation Plans".
(3) A one-time adjustment was made in the fourth quarter of 2017 to reclassify stranded tax effects of the components of accumulated other comprehensive income ("AOCI") resulting from enactment of TCJA from AOCI to retained earnings. See Note 2, "Significant Accounting Policies".
See accompanying notes to Financial Statements.
44
ERIE INDEMNITY COMPANY
STATEMENTS OF CASH FLOWS
Years ended December 31, 2017, 2016 and 2015
(in thousands)
2017 | 2016 | 2015 | ||||||||||
Cash flows from operating activities | ||||||||||||
Management fee received | $ | 1,627,558 | $ | 1,536,699 | $ | 1,454,902 | ||||||
Service agreement fee received | 29,149 | 29,200 | 29,997 | |||||||||
Net investment income received | 31,281 | 26,796 | 25,999 | |||||||||
Limited partnership distributions | 5,128 | 17,837 | 14,112 | |||||||||
(Decrease) increase in reimbursements collected from affiliates | (4,720 | ) | 247 | 7,775 | ||||||||
Commissions paid to agents | (800,627 | ) | (756,713 | ) | (725,714 | ) | ||||||
Agents bonuses paid | (122,743 | ) | (113,859 | ) | (96,749 | ) | ||||||
Salaries and wages paid | (171,547 | ) | (160,985 | ) | (155,303 | ) | ||||||
Pension contribution and employee benefits paid | (89,981 | ) | (44,250 | ) | (40,993 | ) | ||||||
General operating expenses paid | (199,084 | ) | (176,029 | ) | (190,301 | ) | ||||||
Income taxes paid | (106,250 | ) | (104,607 | ) | (106,347 | ) | ||||||
Interest paid | (1,038 | ) | — | — | ||||||||
Net cash provided by operating activities | 197,126 | 254,336 | 217,378 | |||||||||
Cash flows from investing activities | ||||||||||||
Purchase of investments: | ||||||||||||
Available-for-sale securities | (391,181 | ) | (369,811 | ) | (228,308 | ) | ||||||
Limited partnerships | (410 | ) | (578 | ) | (928 | ) | ||||||
Proceeds from investments: | ||||||||||||
Available-for-sale securities sales | 144,317 | 89,498 | 102,286 | |||||||||
Available-for-sale securities maturities/calls | 194,980 | 146,285 | 112,705 | |||||||||
Trading securities | — | 5,171 | — | |||||||||
Limited partnerships | 10,768 | 16,113 | 26,735 | |||||||||
Net purchase of fixed assets | (28,927 | ) | (25,208 | ) | (12,556 | ) | ||||||
Net (distributions) collections on agent loans | (4,210 | ) | 1,586 | 688 | ||||||||
Net cash (used in) provided by investing activities | (74,663 | ) | (136,944 | ) | 622 | |||||||
Cash flows from financing activities | ||||||||||||
Dividends paid to shareholders | (145,765 | ) | (135,985 | ) | (126,858 | ) | ||||||
Net proceeds from long-term borrowings | 49,951 | 24,776 | — | |||||||||
Net cash used in financing activities | (95,814 | ) | (111,209 | ) | (126,858 | ) | ||||||
Net increase in cash and cash equivalents | 26,649 | 6,183 | 91,142 | |||||||||
Cash and cash equivalents, beginning of year | 189,072 | 182,889 | 91,747 | |||||||||
Cash and cash equivalents, end of year | $ | 215,721 | $ | 189,072 | $ | 182,889 | ||||||
Supplemental disclosure of noncash transactions | ||||||||||||
Transfer of investments from limited partnerships to trading securities | $ | — | $ | 4,464 | $ | — | ||||||
See accompanying notes to Financial Statements. See Note 16, "Supplementary Data on Cash Flows", for additional supplemental cash flow information.
45
ERIE INDEMNITY COMPANY
NOTES TO FINANCIAL STATEMENTS
Note 1. Nature of Operations
Erie Indemnity Company ("Indemnity", "we", "us", "our") is a publicly held Pennsylvania business corporation that has since its incorporation in 1925 served as the attorney-in-fact for the subscribers (policyholders) at the Erie Insurance Exchange ("Exchange"). The Exchange, which also commenced business in 1925, is a Pennsylvania-domiciled reciprocal insurer that writes property and casualty insurance. We function solely as the management company and all insurance operations are the responsibility of the Exchange.
Our primary function, as attorney-in-fact, is to perform certain services on behalf of the subscribers at the Exchange relating to policy issuance and renewals including the sales, underwriting, and issuance of policies. This is done in accordance with a subscriber's agreement (a limited power of attorney) executed individually by each subscriber (policyholder), which appoints us as their common attorney-in-fact to transact certain business on their behalf and to manage the affairs of the Exchange. Pursuant to the subscriber's agreement and for its services as attorney-in-fact, we earn a management fee calculated as a percentage of the direct and assumed premiums written by the Exchange.
The services we provide to the subscribers at the Exchange are related to the sales, underwriting and issuance of policies. The sales related services we provide include agent compensation and certain sales and advertising support services. Agent compensation includes scheduled commissions to agents based upon premiums written as well as additional commissions and bonuses to agents, which are earned by achieving targeted measures. Agent compensation comprised approximately 68% of our 2017 expenses. The underwriting services we provide include underwriting and policy processing and comprised approximately 10% of our 2017 expenses. The remaining services we provide include customer service and administrative support. We also provide information technology services that support all the functions listed above that comprised approximately 10% of our 2017 expenses.
By virtue of its legal structure as a reciprocal insurer, the Exchange does not have the ability to enter into contractual relationships and therefore, Indemnity also serves as the attorney-in-fact on behalf of the Exchange for all claims handling and investment management services, which include certain common overhead and service department functions in accordance with the subscriber's agreement. The Exchange's insurance subsidiaries also utilize Indemnity for these services, including life management services for EFL, in accordance with the service agreements between each of the subsidiaries and Indemnity. Claims handling services include costs incurred in the claims process, including the adjustment, investigation, defense, recording and payment functions, as well as an allocation of costs for departments that support these claims functions. Life management services include costs incurred in the management and processing of life insurance business. Investment management services are related to investment trading activity, accounting and all other functions attributable to the investment of funds, including an allocation of costs for departments that support the investment function. The amounts incurred for these services are the responsibility of the Exchange and its insurance subsidiaries as outlined in the subscriber's agreement and the services agreements, and are reimbursed to Indemnity as cost. State insurance regulations require that intercompany service agreements and any material amendments be approved in advance by the state insurance department. See Note 13, "Related Party" contained within this report.
Our results of operations are tied to the growth and financial condition of the Exchange. If any events occurred that impaired the Exchange's ability to grow or sustain its financial condition, including but not limited to reduced financial strength ratings, disruption in the independent agency relationships, significant catastrophe losses, or products not meeting customer demands, the Exchange could find it more difficult to retain its existing business and attract new business. A decline in the business of the Exchange almost certainly would have as a consequence a decline in the total premiums paid and a correspondingly adverse effect on the amount of the management fees we receive. We also have an exposure to a concentration of credit risk related to the unsecured receivables due from the Exchange and its subsidiaries. See Note 14, "Concentrations of Credit Risk" contained within this report.
46
Note 2. Significant Accounting Policies
Basis of presentation
The accompanying financial statements have been prepared in conformity with U.S. generally accepted accounting principles ("GAAP").
Use of estimates
The preparation of financial statements in conformity with GAAP requires us to make estimates and assumptions that affect the reported amounts of assets and liabilities and disclosure of contingent assets and liabilities at the date of the financial statements and the reported amounts of revenues and expenses during the reporting period. Actual results could differ from those estimates.
Recently adopted accounting standards
On February 14, 2018, the FASB issued ASU 2018-02, "Income Statement-Reporting Comprehensive Income-Reclassification of Certain Tax Effects from Accumulated Other Comprehensive Income", which permits entities to reclassify from accumulated other comprehensive income to retained earnings tax effects stranded in accumulated other comprehensive income as a result of tax reform. ASU 2018-02 is effective for all entities for fiscal years beginning after December 15, 2018, including interim periods within those fiscal years. Early adoption is permitted for reporting periods for which financial statements have not yet been issued or made available for issuance. We have elected to early adopt this guidance in 2017 using a portfolio method, which resulted in a decrease of $26.4 million in accumulated other comprehensive income and a corresponding increase in retained earnings.
In March 2017, the FASB issued ASU 2017-08, "Receivables-Nonrefundable Fees and Other Costs", which shortens the amortization period for certain purchased callable debt securities held at a premium from maturity date to the earliest call date. ASU 2017-08 is effective for interim and annual reporting periods beginning after December 31, 2018. The guidance should be applied using a modified retrospective basis through a cumulative-effect adjustment directly to retained earnings as of the beginning of the period of adoption. Early adoption is permitted, including adoption in an interim period. We have evaluated this guidance and are already in compliance, therefore there is no impact on our financial statements.
Recently issued accounting standards
In March 2017, the FASB issued ASU 2017-07, "Compensation-Retirement Benefits", which requires the service cost component of net benefit costs to be reported with other compensation costs arising from services rendered by the pertinent employees during the period. The other components of net benefit costs are required to be presented separately from the service cost component and outside of income from operations. This amendment also allows only the service cost component to be eligible for capitalization when applicable. ASU 2017-17 is effective for interim and annual periods beginning after December 15, 2017. While the presentation of the costs within the Statements of Operations will change, we do not expect a material impact on our financial statements or related disclosures. Had the other components of net benefit costs been presented separately outside of operating income for the year ended December 31, 2017, other operating expenses would have been reduced by $1.9 million.
In June 2016, the FASB issued ASU 2016-13, "Financial Instruments-Credit Losses", which requires financial assets measured at amortized cost to be presented at the net amount expected to be collected through the use of a new forward-looking expected loss model and credit losses relating to available-for-sale debt securities to be recognized through an allowance for credit losses. ASU 2016-13 is effective for interim and annual reporting periods beginning after December 15, 2019. Early adoption for interim and annual periods beginning after December 15, 2018 is permitted. We have evaluated the impact of this guidance on our invested assets. Our investments are not measured at amortized cost, which are the investments that require the use of a new expected loss model. Our available-for-sale debt securities will continue to be monitored for credit losses which would be reflected as an allowance for credit losses rather than a reduction of the carrying value of the asset. The other material financial assets subject to this guidance include our receivables from Erie Insurance Exchange and its subsidiaries. Given the financial strength of the Exchange, demonstrated by its strong surplus position and industry ratings, it is unlikely these receivables would have significant, if any, credit loss exposure. We do not expect a material impact on our financial statements or related disclosures as a result of this guidance.
In February 2016, the FASB issued ASU 2016-02, "Leases", which requires lessees to recognize assets and liabilities arising from operating leases on the statement of financial position and to disclose key information about leasing arrangements. ASU 2016-02 is effective for fiscal years beginning after December 15, 2018, including interim periods within those fiscal years. Currently ASU 2016-02 requires leases to be recognized and measured at the beginning of the earliest period presented using a modified retrospective approach. In January 2018, the FASB issued a proposed ASU that would allow entities to recognize the cumulative effect adjustment in the year of adoption rather than the earliest period presented. Under existing guidance, we
47
recognize lease expense as a component of operating expenses in the Statements of Operations. We are evaluating our lease contracts to determine those that qualify for treatment as leases under the new guidance and the impact to our financial statements and disclosures.
In January 2016, the FASB issued ASU 2016-01, "Financial Instruments-Overall". ASU 2016-01 revises the accounting related to the classification and measurement of investments in equity securities and the presentation of certain fair value changes for financial liabilities measured at fair value. ASU 2016-01 is effective for interim and annual reporting periods beginning after December 15, 2017. At December 31, 2017 we have equity securities with a fair value of $12.8 million. Changes in the fair value of these securities were recognized as a cumulative effect adjustment of $0.1 million at January 1, 2018.
In May 2014, the FASB issued ASU 2014-09, "Revenue from Contracts with Customers". Topic 606 requires an entity to recognize revenue to depict the transfer of goods or services to customers in an amount that reflects the consideration to which the entity expects to be entitled in exchange for those goods or services. ASU 2014-09 is effective for fiscal years beginning after December 15, 2017, including interim periods within that reporting period, with early application permitted beginning in the first interim period in 2017. We adopted Topic 606 as of January 1, 2018 under the modified retrospective method recognizing the cumulative effect at the date of initial application.
We performed an analysis in accordance with the steps identified in the new guidance around the recognition, measurement, and presentation of management fee revenue. Our service fee revenue was determined to be outside of the scope of this new guidance.
Under Topic 606, we determined that we are acting as the attorney-in-fact for the subscribers at the Exchange in two capacities pursuant to the subscriber's agreement. The first is providing policy issuance and renewal services including the sales, underwriting, and issuance of policies. The second is acting as the attorney-in-fact for all claims handling and investment management services, which include certain common overhead and service department functions. Therefore, upon adoption of Topic 606 beginning January 1, 2018, the management fee, currently 25% of all direct and assumed premiums written by the Exchange, will be allocated between the two performance obligations.
The first performance obligation related to the policy issuance and renewal services continues to be recognized at the time of policy issuance or renewal because it is at the time of policy issuance or renewal when the economic benefits of the service Indemnity provides (i.e. the substantially completed policy issuance or renewal service) and the control of the promised asset (i.e. the executed insurance policy) transfers to the customer. The vast majority of the management fee will be allocated to this performance obligation beginning January 1, 2018. Therefore, the related revenue recognition pattern for the majority of our revenues remains unchanged.
The second performance obligation is acting as the attorney-in-fact on behalf of the Exchange for all claims handling and investment management services, which include certain common overhead and service department functions. The amounts incurred for these services are the responsibility of the Exchange and are reimbursed to Indemnity at cost in accordance with the subscriber's agreement. Beginning January 1, 2018, a small portion of our management fee will be allocated to this performance obligation. The majority of the revenue allocated to this performance obligation will be recognized over several years because the economic benefit of the service provided (i.e. the claims handling services) and the control of the promised asset (i.e. the claims handling services) transfers to the customer over several years. We have also determined that we are functioning in a principal capacity for this performance obligation and the expenses and related reimbursements will be presented gross on our Statements of Operations effective January 1, 2018.
The adoption will not have a material impact on our financial condition, earnings, or earnings per share, and will have no impact on our cash flows.
Cash and cash equivalents – Cash, money market accounts and other short-term, highly liquid investments with a maturity of three months or less at the date of purchase, are considered cash and cash equivalents.
Investments
Available-for-sale securities – Fixed maturity, preferred stock, and common stock securities classified as available-for-sale are reported at fair value. Common stock securities classified as available-for-sale represent certain exchange traded funds with underlying holdings of fixed maturity securities. Available-for-sale securities with a remaining maturity of 12 months or less are reported as current assets on the Statements of Financial Position. Unrealized holding gains and losses, net of related tax effects, on available-for-sale securities are recorded directly to shareholders' equity as accumulated other comprehensive
48
income (loss). Realized gains and losses on sales of available-for-sale securities are recognized in income based upon the specific identification method. Interest and dividend income are recognized as earned and recorded to net investment income.
Available-for-sale securities are evaluated monthly for other-than-temporary impairment loss. For fixed income and redeemable preferred stock (debt securities) that have experienced a decline in fair value and that we intend to sell, or for which it is more likely than not we will be required to sell the security before recovery of its amortized cost, an other-than-temporary impairment is deemed to have occurred, and is recognized in earnings. Debt securities that have experienced a decline in fair value and that we do not intend to sell, and that we will not be required to sell before recovery, are evaluated to determine if the decline in fair value is other-than-temporary.
Some factors considered in this evaluation include:
• | the extent and duration to which fair value is less than cost; |
• | historical operating performance and financial condition of the issuer; |
• | short and long-term prospects of the issuer and its industry based upon analysts' recommendations; |
• | specific events that occurred affecting the issuer, including a ratings downgrade; |
• | near term liquidity position of the issuer; and |
• | compliance with financial covenants. |
If a decline is deemed to be other-than-temporary, an assessment is made to determine the amount of the total impairment related to a credit loss and that related to all other factors. Consideration is given to all available information relevant to the collectability of the security in this determination. If the entire amortized cost basis of the security will not be recovered, a credit loss exists. Currently, we have the intent to sell all of our securities that have been determined to have a credit-related impairment. As a result, the entire amount of any impairment would be recognized in earnings. If we had securities with credit impairments that we did not intend to sell, the non-credit portion of the impairment would be recorded in other comprehensive income.
For nonredeemable preferred stock and common stock (equity securities) in an unrealized loss position where fair value is not expected to recover to our cost basis in a reasonable time period, or where we do not expect to hold the security for a period of time sufficient to allow for a recovery to our cost basis, an other-than-temporary impairment is deemed to have occurred, and is recognized in earnings.
Trading securities – Common stock securities classified as trading securities are reported at fair value. Unrealized holding gains and losses on trading securities are included in net realized gains (losses) in the Statements of Operations. Realized gains and losses on sales of trading securities are recognized in income based upon the specific identification method. Dividend income is recognized as of the ex-dividend date.
Limited partnerships – Limited partnerships include U.S. and foreign private equity, mezzanine debt, and real estate investments. The majority of our limited partnership holdings are considered investment companies and are recorded using the equity method of accounting. For these limited partnerships the general partners record assets at fair value, including any other-than-temporary impairments of these individual investments. Our ownership interest in partnerships accounted for under the equity method is generally less than 10%, and does not provide us the ability to significantly influence the operations of the partnerships. However, we believe the equity method most appropriately reflects the value of our economic interest in these investments. We also own certain real estate limited partnerships that do not meet the criteria of an investment company. These partnerships prepare audited financial statements on a cost basis. We have elected to report these limited partnerships under the fair value option, which is based on the net asset value (NAV) from our partner's capital statement reflecting the general partner's estimate of fair value for the fund's underlying assets. Limited partnerships reported under the fair value option are disclosed in Note 4, "Fair Value" as other investments. Fair value provides consistency in the evaluation and financial reporting for these limited partnerships and limited partnerships accounted for under the equity method.
Because of the timing of the preparation and delivery of financial statements for limited partnership investments, the use of the most recently available financial statements provided by the general partners results in a quarter delay in the inclusion of the limited partnership results in our Statements of Operations. Due to this delay, these financial statements do not yet reflect the market conditions experienced in the fourth quarter of 2017 for all partnerships other than the real estate limited partnerships that are reported under the fair value option.
Nearly all of the underlying investments in our limited partnerships are valued using a source other than quoted prices in active markets. The fair value amounts for our private equity and mezzanine debt partnerships are based upon the financial statements of the general partners, who use multiple methods to estimate fair value including the market approach, income approach or the cost approach. The market approach uses prices and other pertinent information from market-generated transactions involving
49
identical or comparable assets or liabilities. Such valuation techniques often use market multiples derived from a set of comparables. The income approach uses valuation techniques to convert future cash flows or earnings to a single discounted present value amount. The measurement is based upon the value indicated by current market expectations on those future amounts. The cost approach is derived from the amount that is currently required to replace the service capacity of an asset. If information becomes available that would impair the cost of investments owned by the partnerships, then the general partner would adjust to the net realizable value. For real estate limited partnerships, the general partners record these at fair value based upon an independent appraisal or internal estimates of fair value.
While we perform various procedures in review of the general partners' valuations, we rely on the general partners' financial statements as the best available information to record our share of the partnership unrealized gains and losses resulting from valuation changes. Due to the limited market for these investments, there is a greater potential for market price variability.
Unrealized gains and losses for these investments are reflected in equity in earnings (losses) of limited partnerships in our Statements of Operations in accordance with the equity method of accounting or the fair value option, as applicable. Cash contributions made to and distributions received from the partnerships are recorded in the period in which the transaction occurs.
Deferred taxes
Deferred tax assets and liabilities are recorded for temporary differences between the tax basis of assets and liabilities and the reported amounts in the financial statements, using the statutory tax rates in effect for the year in which the differences are expected to reverse. The effect on deferred tax assets and liabilities of a change in tax rates is recognized in the results of operations in the period that includes the enactment date under the law. The need for valuation allowances on deferred tax assets are estimated based upon our assessment of the realizability of such amounts.
On December 22, 2017, the Tax Cuts and Jobs Act ("TCJA") was enacted which reduced the corporate tax rate from 35% to 21% effective January 1, 2018. This resulted in a re-measurement of our net deferred taxes to reflect the new rate at which the deferred items will be realized. The re-measurement of the net deferred tax asset as an other income tax expense resulted in tax effects of items within AOCI, which did not reflect the current enacted tax rate. As a result, we elected to make a one-time adjustment to reclassify the stranded tax effects from AOCI to retained earnings in accordance with ASU 2018-02. Income tax amounts are estimates based on our initial analysis and current interpretation of this legislation. Given the complexity of the legislation, anticipated guidance from the U.S. Treasury, and the potential for additional guidance from the Securities and Exchange Commission ("SEC") or the FASB, these estimates may be adjusted during 2018.
Fixed assets
Fixed assets are stated at cost less accumulated depreciation and amortization. Fixed assets are primarily comprised of software, which includes internally used capitalized software and development costs, as well as equipment, buildings and building improvements, and leasehold improvements. Assets in use are depreciated using the straight-line method over the estimated useful life except for leasehold improvements, which are depreciated over the shorter of their economic useful life or the lease term. Software is depreciated over periods ranging from 3-7 years, equipment is depreciated over 3-10 years, and buildings and building improvements are depreciated over 20-45 years. We review long-lived assets for impairment whenever events or changes indicate that the carrying value may not be recoverable. Under these circumstances, if the fair value were less than the carrying amount of the asset, we would recognize a loss for the difference. We capitalize applicable interest charges incurred during the construction period of long-term building projects as part of the historical cost of the asset.
Agent bonus estimates
Agent bonuses are based upon an individual agency's property and casualty underwriting profitability and also include a component for growth in agency property and casualty premiums if the agency's underwriting profitability targets for the book of business are met. The estimate for agent bonuses, which are based upon the performance over 36 months, is modeled on a monthly basis using actual underwriting results for the two prior years and current year-to-date actual results and forecasted results for the remainder of the year.
At December 31 of each year, we use actual data available and record an accrual based upon the expected payment amount. These costs are included in commissions expense in the Statements of Operations.
Recognition of management fee revenue
We earn management fees from the Exchange for providing policy issuance and renewal services including certain sales, underwriting, and policy issuance services. Pursuant to the subscriber's agreements with the subscribers (policyholders) at the Exchange, we may retain up to 25% of all direct and assumed premiums written by the Exchange. Management fee revenue is calculated by multiplying the management fee rate by the direct and assumed premiums written by the Exchange. The
50
Exchange issues policies with annual terms only. Management fees are recorded as revenue upon policy issuance or renewal, as substantially all of the services required to be performed by us have been satisfied at that time. Certain activities are performed and related costs are incurred by us subsequent to policy issuance in connection with the services provided to the Exchange; however, these activities are inconsequential and perfunctory.
Recognition of service agreement revenue
Service agreement revenue consists of service charges we collect from policyholders for providing multiple payment plans on policies written by the Exchange. Service charges, which are flat dollar charges for each installment billed beyond the first installment, are recognized as revenue when bills are rendered to the policyholder. Service agreement revenue also includes late payment and policy reinstatement fees, which are also recognized as revenue when bills are rendered to the policyholder.
Note 3. Earnings Per Share
Class A and Class B basic earnings per share and Class B diluted earnings per share are calculated under the two-class method. The two-class method allocates earnings to each class of stock based upon its dividend rights. Class B shares are convertible into Class A shares at a conversion ratio of 2,400 to 1. See Note 11, "Capital Stock".
Class A diluted earnings per share are calculated under the if-converted method, which reflects the conversion of Class B shares to Class A shares. Diluted earnings per share calculations include the dilutive effect of assumed issuance of stock-based awards under compensation plans that have the option to be paid in stock using the treasury stock method. See Note 9, "Incentive and Deferred Compensation Plans".
We recorded a one-time net non-cash tax expense of $10.1 million at December 31, 2017 as a result of the enactment of the TCJA on December 22, 2017. See Note 10, "Income Taxes". This resulted in a reduction in Class A basic earnings per share of $0.22 and diluted earnings per share of $0.19, and a reduction in Class B basic earnings per share of $33 and diluted earnings per share of $32.
A reconciliation of the numerators and denominators used in the basic and diluted per-share computations is presented as follows for each class of common stock:
(dollars in thousands, except per share data) | For the years ended December 31, | ||||||||||||||||||||||||||||||||
2017 | 2016 | 2015 | |||||||||||||||||||||||||||||||
Allocated net income (numerator) | Weighted shares (denominator) | Per- share amount | Allocated net income (numerator) | Weighted shares (denominator) | Per- share amount | Allocated net income (numerator) | Weighted shares (denominator) | Per- share amount | |||||||||||||||||||||||||
Class A – Basic EPS: | |||||||||||||||||||||||||||||||||
Income available to Class A stockholders | $ | 195,386 | 46,186,831 | $ | 4.23 | $ | 208,644 | 46,188,952 | $ | 4.52 | $ | 173,248 | 46,186,671 | $ | 3.75 | ||||||||||||||||||
Dilutive effect of stock-based awards | 0 | 49,832 | — | 0 | 145,551 | — | 0 | 211,340 | — | ||||||||||||||||||||||||
Assumed conversion of Class B shares | 1,613 | 6,100,800 | — | 1,722 | 6,100,800 | — | 1,430 | 6,100,800 | — | ||||||||||||||||||||||||
Class A – Diluted EPS: | |||||||||||||||||||||||||||||||||
Income available to Class A stockholders on Class A equivalent shares | $ | 196,999 | 52,337,463 | $ | 3.76 | $ | 210,366 | 52,435,303 | $ | 4.01 | $ | 174,678 | 52,498,811 | $ | 3.33 | ||||||||||||||||||
Class B – Basic EPS: | |||||||||||||||||||||||||||||||||
Income available to Class B stockholders | $ | 1,613 | 2,542 | $ | 635 | $ | 1,722 | 2,542 | $ | 678 | $ | 1,430 | 2,542 | $ | 563 | ||||||||||||||||||
Class B – Diluted EPS: | |||||||||||||||||||||||||||||||||
Income available to Class B stockholders | $ | 1,613 | 2,542 | $ | 634 | $ | 1,721 | 2,542 | $ | 677 | $ | 1,429 | 2,542 | $ | 562 | ||||||||||||||||||
51
Note 4. Fair Value
Our available-for-sale and trading securities are recorded at fair value, which is the price that would be received to sell the asset in an orderly transaction between willing market participants as of the measurement date.
Valuation techniques used to derive the fair value of our available-for-sale and trading securities are based upon observable and unobservable inputs. Observable inputs reflect market data obtained from independent sources. Unobservable inputs reflect our own assumptions regarding fair market value for these securities. Although virtually all of our prices are obtained from third-party sources, we also perform an internal pricing review on outliers, which include securities with price changes inconsistent with current market conditions. Financial instruments are categorized based upon the following characteristics or inputs to the valuation techniques:
• | Level 1 – Quoted prices (unadjusted) in active markets for identical assets or liabilities that the reporting entity can access at the measurement date. |
• | Level 2 – Inputs other than quoted prices included within Level 1 that are observable for the asset or liability, either directly or indirectly. |
• | Level 3 – Unobservable inputs for the asset or liability. |
Estimates of fair values for our investment portfolio are obtained primarily from a nationally recognized pricing service. Our Level 1 category includes those securities valued using an exchange traded price provided by the pricing service. The methodologies used by the pricing service that support a Level 2 classification of a financial instrument include multiple verifiable, observable inputs including benchmark yields, reported trades, broker/dealer quotes, issuer spreads, two-sided markets, benchmark securities, bids, offers, and reference data. Pricing service valuations for Level 3 securities are based upon proprietary models and are used when observable inputs are not available or in illiquid markets.
In limited circumstances we adjust the price received from the pricing service when, in our judgment, a better reflection of fair value is available based upon corroborating information and our knowledge and monitoring of market conditions such as a disparity in price of comparable securities and/or non-binding broker quotes. In other circumstances, certain securities are internally priced because prices are not provided by the pricing service.
We perform continuous reviews of the prices obtained from the pricing service. This includes evaluating the methodology and inputs used by the pricing service to ensure that we determine the proper classification level of the financial instrument. Price variances, including large periodic changes, are investigated and corroborated by market data. We have reviewed the pricing methodologies of our pricing service as well as other observable inputs, such as market data, and transaction volumes and believe that the prices adequately consider market activity in determining fair value.
When a price from the pricing service is not available, values are determined by obtaining broker/dealer quotes and/or market comparables. When available, we obtain multiple quotes for the same security. The ultimate value for these securities is determined based upon our best estimate of fair value using corroborating market information. Our evaluation includes the consideration of benchmark yields, reported trades, issuer spreads, two-sided markets, benchmark securities, bids, offers, and reference data.
52
The following tables present our fair value measurements on a recurring basis by asset class and level of input:
At December 31, 2017 | ||||||||||||||||
Fair value measurements using: | ||||||||||||||||
(in thousands) | Total | Quoted prices in active markets for identical assets Level 1 | Observable inputs Level 2 | Unobservable inputs Level 3 | ||||||||||||
Available-for-sale securities: | ||||||||||||||||
U.S. treasury | $ | 11,734 | $ | 0 | $ | 11,734 | $ | 0 | ||||||||
States & political subdivisions | 259,264 | 0 | 259,264 | 0 | ||||||||||||
Foreign government securities | 503 | 0 | 503 | 0 | ||||||||||||
Corporate debt securities | 346,523 | 0 | 338,644 | 7,879 | ||||||||||||
Residential mortgage-backed securities | 25,571 | 0 | 25,571 | 0 | ||||||||||||
Commercial mortgage-backed securities | 32,804 | 0 | 32,804 | 0 | ||||||||||||
Collateralized debt obligations | 58,034 | 0 | 55,834 | 2,200 | ||||||||||||
Other debt securities | 11,528 | 0 | 11,528 | 0 | ||||||||||||
Total fixed maturities | 745,961 | 0 | 735,882 | 10,079 | ||||||||||||
Nonredeemable preferred stock | 12,752 | 2,015 | 10,737 | 0 | ||||||||||||
Total available-for-sale securities | 758,713 | 2,015 | 746,619 | 10,079 | ||||||||||||
Other investments (1) | 4,816 | — | — | — | ||||||||||||
Total | $ | 763,529 | $ | 2,015 | $ | 746,619 | $ | 10,079 | ||||||||
At December 31, 2016 | ||||||||||||||||
Fair value measurements using: | ||||||||||||||||
(in thousands) | Total | Quoted prices in active markets for identical assets Level 1 | Observable inputs Level 2 | Unobservable inputs Level 3 | ||||||||||||
Available-for-sale securities: | ||||||||||||||||
U.S. treasury | $ | 5,031 | $ | 0 | $ | 5,031 | $ | 0 | ||||||||
Government sponsored entities | 2,026 | 0 | 2,026 | 0 | ||||||||||||
States & political subdivisions | 253,132 | 0 | 253,132 | 0 | ||||||||||||
Corporate debt securities | 322,948 | 0 | 313,596 | 9,352 | ||||||||||||
Residential mortgage-backed securities | 16,102 | 0 | 16,102 | 0 | ||||||||||||
Commercial mortgage-backed securities | 36,849 | 0 | 36,849 | 0 | ||||||||||||
Collateralized debt obligations | 69,253 | 0 | 69,253 | 0 | ||||||||||||
Other debt securities | 2,000 | 0 | 2,000 | 0 | ||||||||||||
Total fixed maturities | 707,341 | 0 | 697,989 | 9,352 | ||||||||||||
Common stock | 5,950 | 5,950 | 0 | 0 | ||||||||||||
Total available-for-sale securities | 713,291 | 5,950 | 697,989 | 9,352 | ||||||||||||
Other investments (1) | 4,412 | — | — | — | ||||||||||||
Total | $ | 717,703 | $ | 5,950 | $ | 697,989 | $ | 9,352 | ||||||||
(1) | Other investments measured at fair value represent real estate funds included on the balance sheet as limited partnership investments that are reported under the fair value option using the net asset value practical expedient. These amounts are not required to be categorized in the fair value hierarchy. The investments can never be redeemed with the funds. Instead, distributions are received when liquidation of the underlying assets of the funds occur. It is estimated that the underlying assets will generally be liquidated between 5 and 10 years from the inception of the funds. The fair value of these investments is based on the net asset value (NAV) information provided by the general partner. Fair value is based on our proportionate share of the NAV based on the most recent partners' capital statements received from the general partners, which is generally one quarter prior to our balance sheet date. These values are then analyzed to determine if the NAV represents fair value at our balance sheet date, with adjustment being made where appropriate. We consider observable market data and perform a review validating the appropriateness of the NAV at each balance sheet date. It is likely that all of the investments will be redeemed at a future date for an amount different than the NAV of our ownership interest in partners' capital as of December 31, 2017 and December 31, 2016. During the years ended December 31, 2017 and 2016, no contributions were made and distributions totaling $0.5 million and $0.9 million, respectively, were received from these investments. There were no unfunded commitments related to the investments as of December 31, 2017 and $0.3 million as of December 31, 2016. |
53
We review the fair value hierarchy classifications each reporting period. Transfers between hierarchy levels may occur due to changes in available market observable inputs. Transfers in and out of level classifications are reported as having occurred at the beginning of the quarter in which the transfers occurred.
There were no transfers between Level 1 and Level 2 for the years ended December 31, 2017 and 2016.
Level 3 Assets – Year-to-Date Change:
(in thousands) | Beginning balance at December 31, 2016 | Included in earnings(1) | Included in other comprehensive income | Purchases | Sales | Transfers into Level 3(2) | Transfers out of Level 3(2) | Ending balance at December 31, 2017 | ||||||||||||||||||||||||
Available-for-sale securities: | ||||||||||||||||||||||||||||||||
Corporate debt securities | $ | 9,352 | $ | (85 | ) | $ | (41 | ) | $ | 4,954 | $ | (5,411 | ) | $ | 11,196 | $ | (12,086 | ) | $ | 7,879 | ||||||||||||
Collateralized debt obligations | 0 | 0 | 0 | 2,200 | 0 | 0 | 0 | 2,200 | ||||||||||||||||||||||||
Total fixed maturities | 9,352 | (85 | ) | (41 | ) | 7,154 | (5,411 | ) | 11,196 | (12,086 | ) | 10,079 | ||||||||||||||||||||
Total available-for-sale securities | 9,352 | (85 | ) | (41 | ) | 7,154 | (5,411 | ) | 11,196 | (12,086 | ) | 10,079 | ||||||||||||||||||||
Total Level 3 assets | $ | 9,352 | $ | (85 | ) | $ | (41 | ) | $ | 7,154 | $ | (5,411 | ) | $ | 11,196 | $ | (12,086 | ) | $ | 10,079 | ||||||||||||
Level 3 Assets – Year-to-Date Change:
(in thousands) | Beginning balance at December 31, 2015 | Included in earnings(1) | Included in other comprehensive income | Purchases | Sales | Transfers into Level 3(2) | Transfers out of Level 3(2) | Ending balance at December 31, 2016 | ||||||||||||||||||||||||
Available-for-sale securities: | ||||||||||||||||||||||||||||||||
Corporate debt securities | $ | 69 | $ | 173 | $ | 107 | $ | 13,935 | $ | (1,854 | ) | $ | 7,532 | $ | (10,610 | ) | $ | 9,352 | ||||||||||||||
Commercial mortgage-backed securities | 0 | 0 | 3 | 1,000 | 0 | 0 | (1,003 | ) | 0 | |||||||||||||||||||||||
Collateralized debt obligations | 8,577 | 4 | (5 | ) | 7,722 | (54 | ) | 2,114 | (18,358 | ) | 0 | |||||||||||||||||||||
Total fixed maturities | 8,646 | 177 | 105 | 22,657 | (1,908 | ) | 9,646 | (29,971 | ) | 9,352 | ||||||||||||||||||||||
Total available-for-sale securities | 8,646 | 177 | 105 | 22,657 | (1,908 | ) | 9,646 | (29,971 | ) | 9,352 | ||||||||||||||||||||||
Total Level 3 assets | $ | 8,646 | $ | 177 | $ | 105 | $ | 22,657 | $ | (1,908 | ) | $ | 9,646 | $ | (29,971 | ) | $ | 9,352 | ||||||||||||||
(1) | These amounts are reported in the Statements of Operations as net investment income and net realized investment gains (losses) for each of the periods presented above. |
(2) | Transfers into and/or (out) of Level 3 are primarily attributable to the availability of market observable information and the re-evaluation of the observability of pricing inputs. |
Quantitative and Qualitative Disclosures about Unobservable Inputs
When a non-binding broker quote was the only input available, the security was classified within Level 3. Use of non-binding brokers quotes totaled $10.1 million at December 31, 2017. The unobservable inputs are not reasonably available to us.
The following table presents our fair value measurements on a recurring basis by pricing source:
(in thousands) | At December 31, 2017 | |||||||||||||||
Total | Level 1 | Level 2 | Level 3 | |||||||||||||
Fixed maturities: | ||||||||||||||||
Priced via pricing services | $ | 743,761 | $ | 0 | $ | 735,882 | $ | 7,879 | ||||||||
Priced via market comparables/broker quotes | 2,200 | 0 | 0 | 2,200 | ||||||||||||
Total fixed maturities | 745,961 | 0 | 735,882 | 10,079 | ||||||||||||
Nonredeemable preferred stock: | ||||||||||||||||
Priced via pricing services | 12,752 | 2,015 | 10,737 | 0 | ||||||||||||
Total nonredeemable preferred stock | 12,752 | 2,015 | 10,737 | 0 | ||||||||||||
Other investments: | ||||||||||||||||
Priced via unobservable inputs (1) | 4,816 | — | — | — | ||||||||||||
Total other investments | 4,816 | — | — | — | ||||||||||||
Total | $ | 763,529 | $ | 2,015 | $ | 746,619 | $ | 10,079 | ||||||||
(1) | Other investments measured at fair value represent real estate funds included on the balance sheet as limited partnership investments that are reported under the fair value option using the NAV practical expedient. These amounts are not required to be categorized in the fair value hierarchy. The fair value of these investments is based on the NAV information provided by the general partner. |
There were no assets measured at fair value on a nonrecurring basis during the year ended December 31, 2017.
54
Note 5. Investments
Available-for-sale securities
The following tables summarize the cost and fair value of our available-for-sale securities:
At December 31, 2017 | ||||||||||||||||
(in thousands) | Amortized cost | Gross unrealized gains | Gross unrealized losses | Estimated fair value | ||||||||||||
Available-for-sale securities: | ||||||||||||||||
U.S. treasury | $ | 11,873 | $ | 0 | $ | 139 | $ | 11,734 | ||||||||
States & political subdivisions | 254,533 | 5,351 | 620 | 259,264 | ||||||||||||
Foreign government securities | 501 | 2 | 0 | 503 | ||||||||||||
Corporate debt securities | 346,759 | 1,688 | 1,924 | 346,523 | ||||||||||||
Residential mortgage-backed securities | 25,324 | 371 | 124 | 25,571 | ||||||||||||
Commercial mortgage-backed securities | 33,475 | 26 | 697 | 32,804 | ||||||||||||
Collateralized debt obligations | 57,838 | 237 | 41 | 58,034 | ||||||||||||
Other debt securities | 11,496 | 32 | 0 | 11,528 | ||||||||||||
Total fixed maturities | 741,799 | 7,707 | 3,545 | 745,961 | ||||||||||||
Nonredeemable preferred stock | 12,837 | 15 | 100 | 12,752 | ||||||||||||
Total available-for-sale securities | $ | 754,636 | $ | 7,722 | $ | 3,645 | $ | 758,713 | ||||||||
At December 31, 2016 | ||||||||||||||||
(in thousands) | Amortized cost | Gross unrealized gains | Gross unrealized losses | Estimated fair value | ||||||||||||
Available-for-sale securities: | ||||||||||||||||
U.S. treasury | $ | 5,093 | $ | 0 | $ | 62 | $ | 5,031 | ||||||||
Government sponsored entities | 2,004 | 22 | 0 | 2,026 | ||||||||||||
States & political subdivisions | 249,312 | 6,113 | 2,293 | 253,132 | ||||||||||||
Corporate debt securities | 321,041 | 3,293 | 1,386 | 322,948 | ||||||||||||
Residential mortgage-backed securities | 16,232 | 61 | 191 | 16,102 | ||||||||||||
Commercial mortgage-backed securities | 37,723 | 59 | 933 | 36,849 | ||||||||||||
Collateralized debt obligations | 68,998 | 351 | 96 | 69,253 | ||||||||||||
Other debt securities | 2,000 | 0 | 0 | 2,000 | ||||||||||||
Total fixed maturities | 702,403 | 9,899 | 4,961 | 707,341 | ||||||||||||
Common stock | 6,152 | 0 | 202 | 5,950 | ||||||||||||
Total available-for-sale securities | $ | 708,555 | $ | 9,899 | $ | 5,163 | $ | 713,291 | ||||||||
The amortized cost and estimated fair value of fixed maturities at December 31, 2017, are shown below by remaining contractual term to maturity. Mortgage-backed securities are allocated based upon stated maturity dates. Expected maturities may differ from contractual maturities because borrowers may have the right to call or prepay obligations with or without call or prepayment penalties.
At December 31, 2017 | ||||||||
(in thousands) | Amortized | Estimated | ||||||
cost | fair value | |||||||
Due in one year or less | $ | 71,109 | $ | 71,190 | ||||
Due after one year through five years | 313,305 | 315,436 | ||||||
Due after five years through ten years | 240,614 | 242,739 | ||||||
Due after ten years | 116,771 | 116,596 | ||||||
Total fixed maturities | $ | 741,799 | $ | 745,961 | ||||
55
Available-for-sale securities in a gross unrealized loss position are as follows. Data is provided by length of time for securities in a gross unrealized loss position.
At December 31, 2017 | |||||||||||||||||||||||||||
(dollars in thousands) | Less than 12 months | 12 months or longer | Total | ||||||||||||||||||||||||
Fair | Unrealized | Fair | Unrealized | Fair | Unrealized | No. of | |||||||||||||||||||||
value | losses | value | losses | value | losses | holdings | |||||||||||||||||||||
Available-for-sale securities: | |||||||||||||||||||||||||||
U.S. treasury | $ | 10,237 | $ | 110 | $ | 1,497 | $ | 29 | $ | 11,734 | $ | 139 | 4 | ||||||||||||||
States & political subdivisions | 52,553 | 288 | 14,361 | 332 | 66,914 | 620 | 33 | ||||||||||||||||||||
Corporate debt securities | 171,154 | 1,585 | 31,113 | 339 | 202,267 | 1,924 | 331 | ||||||||||||||||||||
Residential mortgage-backed securities | 4,156 | 29 | 7,064 | 95 | 11,220 | 124 | 11 | ||||||||||||||||||||
Commercial mortgage-backed securities | 10,836 | 85 | 11,984 | 612 | 22,820 | 697 | 19 | ||||||||||||||||||||
Collateralized debt obligations | 21,598 | 41 | 0 | 0 | 21,598 | 41 | 12 | ||||||||||||||||||||
Other debt securities | 1,499 | 0 | 0 | 0 | 1,499 | 0 | 1 | ||||||||||||||||||||
Total fixed maturities | 272,033 | 2,138 | 66,019 | 1,407 | 338,052 | 3,545 | 411 | ||||||||||||||||||||
Nonredeemable preferred stock | 10,737 | 100 | 0 | 0 | 10,737 | 100 | 6 | ||||||||||||||||||||
Total available-for-sale securities | $ | 282,770 | $ | 2,238 | $ | 66,019 | $ | 1,407 | $ | 348,789 | $ | 3,645 | 417 | ||||||||||||||
Quality breakdown of fixed maturities: | |||||||||||||||||||||||||||
Investment grade | $ | 214,586 | $ | 1,064 | $ | 62,193 | $ | 985 | $ | 276,779 | $ | 2,049 | 158 | ||||||||||||||
Non-investment grade | 57,447 | 1,074 | 3,826 | 422 | 61,273 | 1,496 | 253 | ||||||||||||||||||||
Total fixed maturities | $ | 272,033 | $ | 2,138 | $ | 66,019 | $ | 1,407 | $ | 338,052 | $ | 3,545 | 411 | ||||||||||||||
At December 31, 2016 | |||||||||||||||||||||||||||
(dollars in thousands) | Less than 12 months | 12 months or longer | Total | ||||||||||||||||||||||||
Fair | Unrealized | Fair | Unrealized | Fair | Unrealized | No. of | |||||||||||||||||||||
value | losses | value | losses | value | losses | holdings | |||||||||||||||||||||
Available-for-sale securities: | |||||||||||||||||||||||||||
U.S. treasury | $ | 5,031 | $ | 62 | $ | 0 | $ | 0 | $ | 5,031 | $ | 62 | 1 | ||||||||||||||
States & political subdivisions | 84,611 | 2,293 | 0 | 0 | 84,611 | 2,293 | 40 | ||||||||||||||||||||
Corporate debt securities | 112,453 | 987 | 8,692 | 399 | 121,145 | 1,386 | 155 | ||||||||||||||||||||
Residential mortgage-backed securities | 7,451 | 60 | 4,974 | 131 | 12,425 | 191 | 13 | ||||||||||||||||||||
Commercial mortgage-backed securities | 26,509 | 437 | 4,319 | 496 | 30,828 | 933 | 28 | ||||||||||||||||||||
Collateralized debt obligations | 27,470 | 75 | 4,208 | 21 | 31,678 | 96 | 15 | ||||||||||||||||||||
Total fixed maturities | 263,525 | 3,914 | 22,193 | 1,047 | 285,718 | 4,961 | 252 | ||||||||||||||||||||
Common stock | 5,950 | 202 | 0 | 0 | 5,950 | 202 | 1 | ||||||||||||||||||||
Total available-for-sale securities | $ | 269,475 | $ | 4,116 | $ | 22,193 | $ | 1,047 | $ | 291,668 | $ | 5,163 | 253 | ||||||||||||||
Quality breakdown of fixed maturities: | |||||||||||||||||||||||||||
Investment grade | $ | 239,041 | $ | 3,605 | $ | 16,061 | $ | 399 | $ | 255,102 | $ | 4,004 | 136 | ||||||||||||||
Non-investment grade | 24,484 | 309 | 6,132 | 648 | 30,616 | 957 | 116 | ||||||||||||||||||||
Total fixed maturities | $ | 263,525 | $ | 3,914 | $ | 22,193 | $ | 1,047 | $ | 285,718 | $ | 4,961 | 252 | ||||||||||||||
The above securities have been evaluated and determined to be temporary impairments for which we expect to recover our entire principal plus interest. The primary components of this analysis include a general review of market conditions and financial performance of the issuer along with the extent and duration at which fair value is less than cost. Any securities that we intend to sell or will more likely than not be required to sell before recovery are included in other-than-temporary impairments, which are recognized in earnings.
56
Net investment income
Investment income, net of expenses, was generated from the following portfolios for the years ended December 31:
(in thousands) | 2017 | 2016 | 2015 | |||||||||
Fixed maturities (1) | $ | 23,587 | $ | 20,175 | $ | 16,457 | ||||||
Equity securities | 82 | 171 | 1,045 | |||||||||
Cash equivalents and other | 2,486 | 1,391 | 1,174 | |||||||||
Total investment income | 26,155 | 21,737 | 18,676 | |||||||||
Less: investment expenses | 1,547 | 1,190 | 885 | |||||||||
Investment income, net of expenses | $ | 24,608 | $ | 20,547 | $ | 17,791 | ||||||
(1) | Includes interest earned on note receivable from EFL of $1.7 million in 2017, 2016 and 2015. |
Realized investment gains (losses)
Realized gains (losses) on investments were as follows for the years ended December 31:
(in thousands) | 2017 | 2016 | 2015 | |||||||||
Available-for-sale securities: | ||||||||||||
Fixed maturities: | ||||||||||||
Gross realized gains | $ | 2,996 | $ | 2,111 | $ | 1,571 | ||||||
Gross realized losses | (1,611 | ) | (2,113 | ) | (1,764 | ) | ||||||
Net realized gains (losses) | 1,385 | (2 | ) | (193 | ) | |||||||
Equity securities: | ||||||||||||
Gross realized gains | 0 | 1 | 759 | |||||||||
Gross realized losses | (145 | ) | (34 | ) | (74 | ) | ||||||
Net realized (losses) gains | (145 | ) | (33 | ) | 685 | |||||||
Trading securities: | ||||||||||||
Common stock: | ||||||||||||
Gross realized gains | 0 | 707 | 0 | |||||||||
Net realized gains | 0 | 707 | 0 | |||||||||
Miscellaneous | ||||||||||||
Gross realized gains | 96 | 0 | 0 | |||||||||
Gross realized losses | (2 | ) | 0 | 0 | ||||||||
Net realized gains | 94 | 0 | 0 | |||||||||
Net realized investment gains | $ | 1,334 | $ | 672 | $ | 492 | ||||||
Other-than-temporary impairments on fixed maturity investments recognized in earnings were $0.2 million, $0.4 million and $1.6 million for the years ended December 31, 2017, 2016 and 2015, respectively. We have the intent to sell all credit-impaired fixed maturity securities; therefore, the entire amount of the impairment charges were included in earnings and no non-credit impairments were recognized in other comprehensive income. See also Note 2, "Significant Accounting Policies".
Limited partnerships
The majority of our limited partnership holdings are considered investment companies where the general partners record assets at fair value. These limited partnerships are recorded using the equity method of accounting and are generally reported on a one-quarter lag; therefore, our year-to-date limited partnership results through December 31, 2017 are comprised of partnership financial results for the fourth quarter of 2016 and the first, second and third quarters of 2017. Given the lag in reporting, our limited partnership results do not reflect the market conditions of the fourth quarter of 2017. We also own some real estate limited partnerships that do not meet the criteria of an investment company. These partnerships prepare audited financial statements on a cost basis. We have elected to report these limited partnerships under the fair value option, which is based on the NAV from our partner's capital statement reflecting the general partner's estimate of fair value for the fund's underlying assets. Fair value provides consistency in the evaluation and financial reporting for these limited partnerships and limited partnerships accounted for under the equity method. Cash contributions made to and distributions received from the partnerships are recorded in the period in which the transaction occurs.
57
Amounts included in equity in earnings of limited partnerships by method of accounting are included below for the years ended December 31:
(in thousands) | 2017 | 2016 | 2015 | |||||||||
Equity in earnings of limited partnerships accounted for under the equity method | $ | 1,925 | $ | 6,273 | $ | 16,545 | ||||||
Change in fair value of limited partnerships accounted for under the fair value option | 876 | 752 | 438 | |||||||||
Equity in earnings of limited partnerships | $ | 2,801 | $ | 7,025 | $ | 16,983 | ||||||
The following table summarizes limited partnership investments by sector at December 31:
(in thousands) | 2017 | 2016 | ||||||
Private equity | $ | 31,663 | $ | 35,228 | ||||
Mezzanine debt | 3,516 | 6,010 | ||||||
Real estate | 5,127 | 12,509 | ||||||
Real estate - fair value option | 4,816 | 4,412 | ||||||
Total limited partnerships | $ | 45,122 | $ | 58,159 | ||||
See also Note 15, "Commitments and Contingencies", for investment commitments related to limited partnerships.
58
Note 6. Fixed Assets
The following table summarizes our fixed assets by category at December 31:
(in thousands) | 2017 | 2016 | ||||||
Software | $ | 129,553 | $ | 124,093 | ||||
Equipment | 13,858 | 11,771 | ||||||
Land, buildings, and building improvements | 7,627 | 7,627 | ||||||
Leasehold improvements | 1,375 | 1,375 | ||||||
Projects in progress | 21,898 | 17,812 | ||||||
Construction in progress | 26,312 | 9,622 | ||||||
Total fixed assets, gross | 200,623 | 172,300 | ||||||
Less: Accumulated depreciation | (117,474 | ) | (103,158 | ) | ||||
Fixed assets, net | $ | 83,149 | $ | 69,142 | ||||
Projects in progress include certain computer software and software developments costs for internal use that are not yet subject to amortization.
In 2016, we announced the construction of a new office building that will serve as part of our principal headquarters. The costs associated with this project are included in construction in progress. Capitalized interest included in construction in progress was $0.6 million for 2017. There was no capitalized interest in 2016. The project is expected to span approximately three years and is financed using a senior secured draw term loan credit facility. See Note 7, "Borrowing Arrangements".
For the years ended December 31, 2017, 2016 and 2015, depreciation and amortization of fixed assets totaled $14.8 million, $15.1 million and $15.9 million, respectively, and is included in all other operating expenses in the Statements of Operations.
59
Note 7. Borrowing Arrangements
Bank Line of Credit
As of December 31, 2017, we have access to a $100 million bank revolving line of credit with a $25 million letter of credit sublimit that expires on November 3, 2020. As of December 31, 2017, a total of $99.1 million remains available under the facility due to $0.9 million outstanding letters of credit, which reduces the availability for letters of credit to $24.1 million. We had no borrowings outstanding on our line of credit as of December 31, 2017. Bonds with a fair value of $108.0 million were pledged as collateral on the line at December 31, 2017. The securities pledged as collateral have no trading restrictions and are reported as available-for-sale securities in the Statements of Financial Position as of December 31, 2017. The banks require compliance with certain covenants, which include leverage ratios and debt restrictions, for our line of credit. We are in compliance with all covenants at December 31, 2017.
Term Loan Credit Facility
In 2016, we entered into a credit agreement for a $100 million senior secured draw term loan credit facility ("Credit Facility") for the acquisition of real property and construction of an office building that will serve as part of our principal headquarters. Under the agreement, $25 million will be drawn on December 1, 2016, June 1, 2017, December 1, 2017, and June 1, 2018 ("Draw Period"). During the Draw Period, we will make monthly interest only payments under the Credit Facility and thereafter the Credit Facility converts to a fully-amortized term loan with monthly payments of principal and interest over a period of 28 years. Borrowings under the Credit Facility will bear interest at a fixed rate of 4.35%. In addition, we are required to pay a quarterly commitment fee of 0.08% on the unused portion of the Credit Facility during the Draw Period. Total draws against the facility are $75 million as of December 31, 2017. Bonds with a fair value of $108.3 million were pledged as collateral for the facility and are reported as available-for-sale securities in the Statements of Financial Position as of December 31, 2017. The bank requires compliance with certain covenants, which include leverage ratios, debt restrictions and minimum net worth, for our Credit Facility. We are in compliance with all covenants at December 31, 2017.
Amounts drawn from the Credit Facility are reported at carrying value on our Statements of Financial Position, net of unamortized loan origination and commitment fees. The estimated fair value of this borrowing at December 31, 2017 was $72.4 million. The estimated fair value was determined using estimates based upon interest rates and credit spreads and are classified as Level 3 in the fair value hierarchy as of December 31, 2017.
The scheduled maturity of the $100 million Credit Facility begins on January 1, 2019 with annual principal payments of $1.9 million in 2019, $2.0 million in 2020, $2.0 million in 2021, $2.1 million in 2022 and $92.0 million thereafter.
60
Note 8. Postretirement Benefits
Pension plans
Our pension plans consist of a noncontributory defined benefit pension plan covering substantially all employees and an unfunded supplemental employee retirement plan ("SERP") for certain members of executive and senior management. The pension plans provide benefits to covered individuals satisfying certain age and service requirements. The defined benefit pension plan and SERP each provide benefits through a final average earnings formula.
Although we are the sponsor of these postretirement plans and record the funded status of these plans, the Exchange and its subsidiaries reimburse us for approximately 59% of the annual benefit expense of these plans, which represents pension benefits for our employees performing claims and life insurance functions and their share of service department costs. For our funded pension plan, amounts are settled in cash for the portion of pension costs allocated to the Exchange and its subsidiaries. For our unfunded plans, we pay the obligations when due and amounts are settled in cash between entities when there is a payout.
Prior to 2003, the employee pension plan purchased annuities from Erie Family Life Insurance Company ("EFL"), a wholly owned subsidiary of the Exchange, for certain plan participants that were receiving benefit payments under the pension plan. These are nonparticipating annuity contracts under which EFL has unconditionally contracted to provide specified benefits to beneficiaries; however, the pension plan remains the primary obligor to the beneficiaries. A contingent liability of $19.5 million at December 31, 2017, exists in the event EFL does not honor the annuity contracts.
Cost of pension plans
Pension plan cost includes the following components:
(in thousands) | |||||||||||||
2017 | 2016 | 2015 | |||||||||||
Service cost for benefits earned | $ | 31,106 | $ | 28,201 | $ | 30,433 | |||||||
Interest cost on benefit obligation | 34,275 | 33,125 | 30,755 | ||||||||||
Expected return on plan assets | (41,267 | ) | (39,520 | ) | (35,921 | ) | |||||||
Prior service cost amortization | 871 | 696 | 670 | ||||||||||
Net actuarial loss amortization | 9,301 | 8,111 | 14,031 | ||||||||||
Settlement cost (1) | 302 | — | — | ||||||||||
Pension plan cost (2) | $ | 34,588 | $ | 30,613 | $ | 39,968 | |||||||
(1) | The final SERP benefit for two former executives was settled with lump sum payments in 2017. |
(2) | Pension plan costs represent the total cost before reimbursements to Indemnity from the Exchange and its subsidiaries. |
Actuarial assumptions
The following table describes the assumptions at December 31 used to measure the year-end obligations and the net periodic benefit costs for the subsequent year:
2017 | 2016 | 2015 | 2014 | ||||||||||
Employee pension plan: | |||||||||||||
Discount rate | 3.73 | % | 4.24 | % | 4.57 | % | 4.17 | % | |||||
Expected return on assets | 6.75 | 7.00 | 7.00 | 7.00 | |||||||||
Compensation increases (1) | 3.32 | 3.32 | 3.32 | 3.32 | |||||||||
SERP: | |||||||||||||
Discount rate – pre-retirement/post-retirement | 3.73/3.23 | 4.24/3.74 | 4.57/4.07 | 4.17/3.67 | |||||||||
Rate of compensation increase | 5.00 | 5.00 | 5.00 | 5.00 | |||||||||
(1) | The rate of compensation increase for the employee plan is age-graded. An equivalent single compensation increase rate of 3.32% in 2017, 2016 and 2015 would produce similar results. |
The economic assumptions that have the most impact on the postretirement benefits expense are the discount rate and the long-term rate of return on plan assets. The discount rate assumption used to determine the benefit obligation for 2017 was based upon a yield curve developed from corporate bond yield information. The same methodology was employed to develop the discount rates used to determine the benefit obligation for 2016 and 2015.
61
The pension plan's expected long-term rate of return represents the average rate of return to be earned on plan assets over the period the benefits included in the benefit obligation are to be paid. To determine the expected long-term rate of return assumption, we utilized models based upon rigorous historical analysis and forward-looking views of the financial markets based upon key factors such as historical returns for the asset class' applicable indices, the correlations of the asset classes under various market conditions and consensus views on future real economic growth and inflation. The expected future return for each asset class is then combined by considering correlations between asset classes and the volatilities of each asset class to produce a reasonable range of asset return results within which our expected long-term rate of return assumption falls.
Projected benefit obligations increased $135.0 million at December 31, 2017 compared to December 31, 2016. The increase was driven by normal increases in benefit accruals, the lower discount rate and the improvement to the death benefit payable to active employees, partially offset by updated mortality tables.
Funding policy/funded status
In addition to the planned contribution of $19.0 million in January 2017, we made additional unplanned employer contributions of $20 million in August 2017 and $19.9 million in December 2017. We also made an accelerated contribution of $40 million in January 2018 and plan to contribute another $40 million in April 2018. Following our $80 million contribution in 2018, we would not expect to make a subsequent contribution until the sum of the target normal costs for plan years beginning on and after December 31, 2017 exceeds $80 million, or earlier if a contribution is necessary to fund the plan to 100%. At that time, our funding policy will again generally be to contribute an amount equal or greater of the target normal cost for the plan year, or the amount necessary to fund the plan to 100%. Additional contributions may be necessary or desirable due to future plan changes, our particular business or investment strategy, or pending law changes. The following table sets forth the funded status of the pension plans and the amounts recognized in the Statements of Financial Position at December 31:
(in thousands) | |||||||||
2017 | 2016 | ||||||||
Funded status at end of year | $ | (207,766 | ) | $ | (224,115 | ) | |||
Pension liabilities – due within one year (1) | $ | (236 | ) | $ | (2,288 | ) | |||
Pension liabilities – due after one year | (207,530 | ) | (221,827 | ) | |||||
Net amount recognized | $ | (207,766 | ) | $ | (224,115 | ) | |||
(1) The current portion of pension liabilities is included in accounts payable and accrued liabilities in the Statements of Financial Position.
Benefit obligations
Benefit obligations are described in the following tables. Accumulated and projected benefit obligations represent the obligations of a pension plan for past service as of the measurement date. The accumulated benefit obligation is the present value of pension benefits earned as of the measurement date based on employee service and compensation prior to that date. It differs from the projected benefit obligation in that the accumulated benefit obligation includes no assumptions to reflect expected future compensation. The following table sets forth a reconciliation of beginning and ending balances of the projected benefit obligation, as well as the accumulated benefit obligation at December 31:
(in thousands) | |||||||||
2017 | 2016 | ||||||||
Projected benefit obligation, beginning of year | $ | 816,659 | $ | 724,580 | |||||
Service cost for benefits earned | 31,106 | 28,201 | |||||||
Interest cost on benefit obligation | 34,275 | 33,125 | |||||||
Plan amendments | 5,050 | 2,114 | |||||||
Actuarial loss | 82,940 | 43,032 | |||||||
Benefits paid | (16,184 | ) | (14,393 | ) | |||||
Settlement cost | (2,180 | ) | — | ||||||
Projected benefit obligation, end of year | $ | 951,666 | $ | 816,659 | |||||
Accumulated benefit obligation, end of year | $ | 767,527 | $ | 657,969 | |||||
62
The following table describes plans with assets less than accumulated benefit obligation at December 31:
(in thousands) | |||||||||
2017 | 2016 | ||||||||
Projected benefit obligation | $ | 951,666 | $ | 816,659 | |||||
Accumulated benefit obligation | 767,527 | 657,969 | |||||||
Plan assets | 743,900 | 592,544 | |||||||
Both the defined benefit pension plan and the SERP had accumulated benefit obligations in excess of plan assets at December 31, 2017 and 2016.
Pension assets
The following table sets forth a reconciliation of beginning and ending balances of the fair value of plan assets at December 31:
(in thousands) | |||||||||
2017 | 2016 | ||||||||
Fair value of plan assets, beginning of year | $ | 592,544 | $ | 551,491 | |||||
Actual gain on plan assets | 108,618 | 38,028 | |||||||
Employer contributions | 61,102 | 17,418 | |||||||
Benefits paid | (16,184 | ) | (14,393 | ) | |||||
Settlements (1) | (2,180 | ) | — | ||||||
Fair value of plan assets, end of year | $ | 743,900 | $ | 592,544 | |||||
(1) | The final SERP benefit for two former executives was settled with lump sum payments in 2017. |
Accumulated other comprehensive income
Net actuarial loss and prior service cost included in accumulated other comprehensive income that were not yet recognized as components of net benefit costs were as follows:
(in thousands) | |||||||||
2017 | 2016 | ||||||||
Net actuarial loss | $ | 191,264 | $ | 185,278 | |||||
Prior service cost | 10,201 | 6,023 | |||||||
Net amount not yet recognized | $ | 201,465 | $ | 191,301 | |||||
The estimated net actuarial loss and prior service cost for the pension plans that will be amortized from accumulated other comprehensive income into pension cost during 2018 is $12.8 million and $1.1 million, respectively.
Other comprehensive income
Amounts recognized in other comprehensive income for pension plans were as follows:
(in thousands) | |||||||||
2017 | 2016 | ||||||||
Net actuarial loss arising during the year | $ | 15,588 | $ | 44,524 | |||||
Amortization of net actuarial loss | (9,301 | ) | (8,111 | ) | |||||
Amortization of prior service cost | (871 | ) | (696 | ) | |||||
Amendments (1) | 5,050 | 2,114 | |||||||
Impact due to settlement (2) | (302 | ) | — | ||||||
Total recognized in other comprehensive income | $ | 10,164 | $ | 37,831 | |||||
(1) | Effective December 31, 2016, a plan amendment was adopted to enhance the surviving spouse's death benefits, which increased the pension plan obligation by $3.6 million and the SERP obligation by $0.3 million in 2017. In 2016, a plan amendment was adopted to allow part time employees to participant in the pension plan, which added prior service cost of $1.7 million in 2016. Additionally, there were two new SERP participants in 2017 and one new participant in 2016, which contributed $1.2 million and $0.4 million, respectively. |
(2) | The final SERP benefit for two former executives was settled with lump sum payments in 2017. |
63
Asset allocation
The employee pension plan utilizes a return seeking and a liability asset matching allocation strategy. It is based upon the understanding that 1) equity investments are expected to outperform debt investments over the long-term, 2) the potential volatility of short-term returns from equities is acceptable in exchange for the larger expected long-term returns, and 3) a portfolio structured across investment styles and markets (both domestic and foreign) reduces volatility. As a result, the employee pension plan's investment portfolio utilizes a broadly diversified asset allocation across domestic and foreign equity and debt markets. The investment portfolio is composed of commingled pools that are dedicated exclusively to the management of employee benefit plan assets.
The target and actual asset allocations for the portfolio are as follows for the years ended December 31:
Target asset allocation | Target asset allocation | Actual asset allocation | Actual asset allocation | ||||||||||
Asset allocation: | 2017 | 2016 | 2017 | 2016 | |||||||||
Equity securities: | |||||||||||||
U.S. equity securities | 35 | % | (1) | 35 | % | 39 | % | 38 | % | ||||
Non-U.S. equity securities | 20 | (2) | 20 | 19 | 18 | ||||||||
Total equity securities | 55 | 55 | 58 | 56 | |||||||||
Debt securities | 44 | (3) | 44 | 41 | 43 | ||||||||
Other | 1 | (4) | 1 | 1 | 1 | ||||||||
Total | 100 | % | 100 | % | 100 | % | 100 | % | |||||
(1) | U.S. equity securities – 22% seek to achieve excess returns relative to the Russell 2000 Index, while 30% seek to achieve excess returns relative to the S&P 500. The remaining 48% of the allocation to U.S. equity securities are comprised of equity index funds that track the S&P 500. |
(2) | Non-U.S. equity securities – 11% are allocated to international small cap investments, while another 11% are allocated to international emerging market investments. The remaining 78% of the Non-U.S. equity securities are allocated to investments seeking to achieve excess returns relative to an international market index. |
(3) | Debt securities – 44% are allocated to long U.S. Treasury Strips, 44% are allocated to U.S. corporate bonds with an emphasis on long duration bonds rated A or better, while the remaining 12% are allocated to floating rate high income leverage loans. |
(4) | Institutional money market fund. |
The following tables represent the fair value measurements for the pension plan assets by major category and level of input:
At December 31, 2017 | |||||||||||||||||
Fair value measurements of plan assets using: | |||||||||||||||||
(in thousands) | Total | Quoted prices in active markets for identical assets Level 1 | Significant observable inputs Level 2 | Significant unobservable inputs Level 3 | |||||||||||||
Equity securities: | |||||||||||||||||
U.S. equity securities | $ | 288,861 | $ | 0 | $ | 288,861 | $ | 0 | |||||||||
Non-U.S. equity securities | 145,238 | 0 | 145,238 | 0 | |||||||||||||
Total equity securities | 434,099 | 0 | 434,099 | 0 | |||||||||||||
Debt securities | 303,331 | 0 | 303,331 | 0 | |||||||||||||
Other | 6,470 | 6,470 | 0 | 0 | |||||||||||||
Total | $ | 743,900 | $ | 6,470 | $ | 737,430 | $ | 0 | |||||||||
64
At December 31, 2016 | |||||||||||||||||
Fair value measurements of plan assets using: | |||||||||||||||||
(in thousands) | Total | Quoted prices in active markets for identical assets Level 1 | Significant observable inputs Level 2 | Significant unobservable inputs Level 3 | |||||||||||||
Equity securities: | |||||||||||||||||
U.S. equity securities | $ | 225,446 | $ | 0 | $ | 225,446 | $ | 0 | |||||||||
Non-U.S. equity securities | 107,953 | 0 | 107,953 | 0 | |||||||||||||
Total equity securities | 333,399 | 0 | 333,399 | 0 | |||||||||||||
Debt securities | 253,197 | 0 | 253,197 | 0 | |||||||||||||
Other | 5,948 | 5,948 | 0 | 0 | |||||||||||||
Total | $ | 592,544 | $ | 5,948 | $ | 586,596 | $ | 0 | |||||||||
Estimates of fair values of the pension plan assets are obtained primarily from the trustee and custodian of our pension plan. Our Level 1 category includes a money market fund that is a mutual fund for which the fair value is determined using an exchange traded price provided by the trustee and custodian. Our Level 2 category includes commingled pools. Estimates of fair values for securities held by our commingled pools are obtained primarily from the trustee and custodian. The methodologies used by the trustee and custodian that support a financial instrument Level 2 classification include multiple verifiable, observable inputs including benchmark yields, reported trades, broker/dealer quotes, issuers spreads, two-sided markets, benchmark securities, bids, offers, and reference data.
Estimated future benefit payments
The following table sets forth amounts of benefits expected to be paid over the next 10 years from our pension plans as of December 31:
(in thousands) | ||
Year ending December 31, | Expected future benefit payments | |
2018 | $ | 20,739 |
2019 | 23,050 | |
2020 | 25,665 | |
2021 | 28,687 | |
2022 | 31,650 | |
2023 - 2027 | 210,951 | |
Retiree health benefit plan
The retiree health benefit plan was terminated in 2006. We continue to provide retiree health benefits only to employees who met certain age and service requirements on or before July 1, 2010. The accumulated benefit obligation and net periodic benefit cost of this plan were not material to our financial statements.
Employee savings plan
All full-time and regular part-time employees are eligible to participate in a traditional qualified 401(k) or a Roth 401(k) savings plan. We match 100% of the participant contributions up to 3% of compensation and 50% of participant contributions over 3% and up to 5% of compensation. Matching contributions paid to the plan were $12.8 million in 2017, $12.1 million in 2016, and $11.6 million in 2015. The Exchange and its subsidiaries reimburse us for approximately 60% of the matching contributions. Employees are permitted to invest the employer-matching contributions in our Class A common stock. Employees, other than executive and senior officers, may sell the shares at any time without restriction, provided they are in compliance with applicable insider trading laws; sales by executive and senior officers are subject to additional pre-clearance restrictions imposed by our insider trading policies. The plan acquires shares in the open market necessary to meet the obligations of the plan. Plan participants held 0.2 million shares of our Class A common stock at December 31, 2017 and 2016.
65
Note 9. Incentive and Deferred Compensation Plans
We have two incentive plans and two deferred compensation plans for our executives, senior vice presidents and other selected officers, and two deferred compensation plans for our outside directors.
Annual incentive plan
Our annual incentive plan ("AIP") is a bonus plan that pays cash to our executives, senior vice presidents and other selected officers annually. Participants can elect to defer up to 100% of the award under either the deferred compensation plan or the incentive compensation deferral plan, which began in 2017. The awards are based on attainment of corporate and individual performance measures, which can include various financial measures. The plan includes a funding qualifier which considers our financial results, based on operating income, before a payout can be made to plan participants. If the funding qualifier is met, plan participants are eligible to receive the incentive based upon specific performance measures. The measures are established at the beginning of each year by the Executive Compensation and Development Committee of our Board of Directors ("ECDC"), with ultimate approval by the full Board of Directors. The performance measures primarily included the growth in direct written premium and statutory combined ratio of the Exchange and its property and casualty subsidiaries for all periods presented.
Long-term incentive plan
Our long-term incentive plan ("LTIP") is a performance based incentive plan designed to reward executives, senior vice presidents and other selected officers who can have a significant impact on our long-term performance and to further align the interests of such employees with those of our shareholders. The LTIP permits grants of performance shares or units, or phantom shares to be satisfied with shares of our Class A common stock or cash payment as determined by the ECDC. Participants can elect to defer up to 100% of the award under the incentive compensation deferral plan, which began in 2017. The ECDC determines the form of the award to be granted at the beginning of each performance period, which is generally a three-year period. The number of shares of the Company's common stock authorized for grant under the LTIP is 1.5 million shares, with no one person able to receive more than 250,000 shares or the equivalent of $5 million during any one performance period. We repurchase our Class A common stock on the open market to settle stock awards under the plan. We do not issue new shares of common stock to settle stock awards. LTIP awards are considered vested at the end of each applicable performance period.
The LTIP provides the recipient the right to earn performance shares or units, or phantom stock based on the level of achievement of performance goals as defined by us. Performance measures and a peer group of property and casualty companies to be used for comparison are determined by the ECDC. The performance measures for all periods presented were the reported growth in direct written premium and statutory combined ratio of the Exchange and its property and casualty subsidiaries and return on invested assets over a three-year performance period as compared to the results of the peer group over the same period. Because the award is based upon a comparison to results of a peer group over a three-year period, the award accrual is based upon estimates of probable results for the remaining performance period. This estimate is subject to variability if our results or the results of the peer group are substantially different than the results we project.
The fair value of LTIP awards is measured at each reporting date at the current share price of our Class A common stock. A liability is recorded and compensation expense is recognized ratably over the performance period.
At December 31, 2017, the plan awards for the 2015-2017 performance period were fully vested. Distributions will be made in 2018 once peer group financial information becomes available. The estimated plan award based upon the peer group information as of September 30, 2017 is $8.4 million. At December 31, 2016, the awards for the 2014-2016 performance period were fully vested. Participants had the option of receiving either cash or stock for the 2014-2016 and 2013-2015 awards. The cash award of $4.7 million was paid in June 2017 and the stock award of 46,884 shares with an average share price of $126.21 and a market value of $5.9 million was delivered to plan participants in June 2017. At December 31, 2015, the awards, granted as stock, for the 2013-2015 performance period were fully vested. The cash award of $12.6 million was paid in June 2016 and the stock award of 7,661 shares with an average share price of $96.64 and a market value of $0.7 million was delivered to plan participants in June 2016.
Earned compensation costs are allocated to related entities and reimbursed to us in cash once the payout is made. The total compensation cost charged to operations related to these LTIP awards was $10.3 million in 2017, $8.2 million in 2016, and $13.4 million in 2015. The related tax benefits recognized in income were $3.6 million in 2017, $2.9 million in 2016, and $4.7 million in 2015. The Exchange and its subsidiaries reimburse us for approximately 41% of the annual compensation cost of these plans, which represents the amount of compensation expense for our employees performing claims and life insurance functions. At December 31, 2017, there was $7.6 million of total unrecognized compensation cost for non-vested LTIP awards related to open performance periods. Unrecognized compensation is expected to be recognized over a period of two years.
66
Deferred compensation plans
Our deferred compensation plan allows executives, senior vice presidents and other selected officers to elect to defer receipt of a portion of their compensation and AIP cash awards until a later date. Employer 401(k) matching contributions that are in excess of the annual contribution or compensation limits are also credited to the participant accounts for those who elected to defer receipt of some portion of their base salary. Participants select hypothetical investment funds for their deferrals which are credited with the hypothetical returns generated.
Incentive compensation deferral plan
Effective January 1, 2017, our Board of Directors approved an unfunded, non-qualified incentive compensation deferral plan for participants of the AIP and LTIP. Participants can elect to defer up to 100% of their annual AIP award and/or up to 100% of their LTIP award for each performance period. Deferred awards will be credited to a deferred stock account as credits denominated in Class A shares of the Company stock until retirement or other separation from service from the Company. Participants are 100% vested at date of deferral. Vested share credits will be paid to participants upon separation from service in approximate equal annual installments of Class A shares for a period of three years.
Deferred compensation plans for outside directors
We have a deferred compensation plan for our outside directors that allows participants to defer receipt of a portion of their annual compensation until a later date. Participants select hypothetical investment funds for their deferrals which are credited with the hypothetical returns generated.
We also have a deferred stock compensation plan for our outside directors to further align the interests of directors with those of our shareholders that provides for a portion of the directors' annual compensation in shares of our Class A common stock. Each director vests in the grant 25% every three months over the course of a year. Dividends paid by us are credited to each director's account which vest immediately. We do not issue new shares of common stock to directors. Our practice is to repurchase shares of our Class A common stock in the open market to satisfy these awards.
Prior to October 2015, these shares were accounted for as a liability which was equal to the total number of share credits earned at the current fair market value. Directors were paid shares of our Class A common stock equal to the number of share credits in their deferred stock account upon ending board service.
In October 2015 we established a rabbi trust to hold the shares earned by outside directors. The rabbi trust purchased 9,663 shares of our common stock on the open market at an average price of $121.85 for $1.2 million in 2017, 7,432 shares at an average price of $99.23 for $0.7 million in 2016, and 94,938 shares at an average price of $94.99 for $9.0 million in 2015 to satisfy the liability of the stock compensation plan for outside directors. The rabbi trust is classified and accounted for as equity in a manner consistent with the accounting for treasury stock. Dividends received on the shares in the rabbi trust are used to purchase additional shares. The shares are distributed to the outside director from the rabbi trust upon ending board service. The annual charge related to these awards totaled $0.9 million, $0.5 million and $1.9 million in 2017, 2016 and 2015, respectively.
On January 22, 2018, we amended the rabbi trust to permit the trust to also hold the shares earned by executives, senior vice presidents, and other selected officers who receive share awards as participants in the incentive compensation deferral plan.
The following summarizes our deferred executive and outside directors' compensation liability for December 31:
(in thousands) | ||||||||||||
2017 | 2016 | 2015 | ||||||||||
Annual incentive plan awards | $ | 6,118 | $ | 6,460 | $ | 7,057 | ||||||
Long-term incentive plan awards | 10,931 | 11,321 | 14,228 | |||||||||
Employer match and hypothetical earnings on deferred compensation | 2,664 | 1,164 | 2,042 | |||||||||
Total plan awards and earnings | 19,713 | 18,945 | 23,327 | |||||||||
Total plan awards paid | (20,621 | ) | (20,418 | ) | (14,317 | ) | ||||||
Compensation deferred | 680 | 1,214 | 996 | |||||||||
Distributions from the deferred compensation plans | (853 | ) | (435 | ) | (1,688 | ) | ||||||
Forfeitures (1) | (593 | ) | (3,117 | ) | (821 | ) | ||||||
Funding of rabbi trust | (1,177 | ) | (738 | ) | (9,018 | ) | ||||||
Incentive plan and deferred compensation liabilities at end of period | $ | 30,057 | $ | 32,908 | $ | 37,457 | ||||||
(1) Forfeitures are the result of plan participants who separated from service with the Company.
67
Equity compensation plan
We also have an equity compensation plan ("ECP") which is designed to reward key employees, as determined by the ECDC or the chief executive officer, who can have a significant impact on our long-term performance and to further align the interests of such employees with those of our shareholders. The ECP permits grants of restricted shares, restricted share units and other share based awards, to be satisfied with shares of our Class A common stock or cash. The ECDC determines the form of the award to be granted at the beginning of each performance period. The number of shares of the Company's Class A common stock authorized for grant under the ECP is 100,000 shares, with no one person able to receive more than 5,000 shares in a calendar year. We do not issue new shares of common stock to satisfy plan awards. Share awards are settled through the repurchase of our Class A common stock on the open market.
Restricted share awards may be entitled to receive dividends payable during the performance period, or, if subject to performance goals, to receive dividend equivalents payable upon vesting. Dividend equivalents may provide for the crediting of interest or hypothetical reinvestment experience payable after expiration of the performance period.
Vesting conditions are determined at the time the award is granted and may include continuation of employment for a specific period, satisfaction of performance goals and the defined performance period, and the satisfaction of any other terms and conditions as determined to be appropriate. The plan is to remain in effect until December 31, 2022, unless earlier amended or terminated by our Board of Directors. Awards will be satisfied with shares of our Class A common stock for plan years 2017, 2016, and 2015. The total number of restricted stock units granted under the plan was 4,000 in 2017, 4,500 in 2016, and 5,500 in 2015. In January 2017, 3,785 Class A shares with an average share price of $109.41 and a market value of $0.4 million were delivered to plan participants to satisfy the 2014 plan year award. The total compensation charged to operations related to these ECP awards was $0.2 million in 2017, $0.8 million in 2016, and $0.4 million in 2015. The Exchange reimburses us for approximately 38% of the annual compensation cost of these plans, which represents the amount of compensation expense for our employees performing claims functions. Unearned compensation expense of $0.5 million is expected to be recognized over a period of three years.
Note 10. Income Taxes
The provision for income taxes consists of the following for the years ended December 31:
(in thousands) | ||||||||||||
2017 | 2016 | 2015 | ||||||||||
Current income tax expense | $ | 81,689 | $ | 109,727 | $ | 106,155 | ||||||
Deferred income tax expense (benefit) | 26,912 | (2 | ) | (14,584 | ) | |||||||
Other income tax expense (1) | 10,095 | — | — | |||||||||
Income tax expense | $ | 118,696 | $ | 109,725 | $ | 91,571 | ||||||
(1) | The income tax expense for 2017 was impacted by the re-measurement of our deferred tax assets and liabilities due to the enactment of the TCJA on December 22, 2017, which reduced the corporate tax rate from 35% to 21% effective January 1, 2018. |
A reconciliation of the provision for income taxes, with amounts determined by applying the statutory federal income tax rate to pre-tax income, is as follows for the years ended December 31:
(in thousands) | ||||||||||||
2017 | 2016 | 2015 | ||||||||||
Income tax at statutory rate | $ | 110,493 | $ | 112,032 | $ | 93,187 | ||||||
Change in tax rate | 10,095 | — | — | |||||||||
Tax-exempt interest | (2,278 | ) | (2,270 | ) | (2,285 | ) | ||||||
Other, net | 386 | (37 | ) | 669 | ||||||||
Income tax expense | $ | 118,696 | $ | 109,725 | $ | 91,571 | ||||||
The change in tax rate represents the tax effect of the re-measurement of deferred tax assets and liabilities due to the enactment of the TCJA. Income tax expense increased by $10.1 million related to the TCJA, which included an increase of $19.9 million related to the re-measurement of our net deferred tax asset partially offset by a deferred tax benefit of $9.8 million primarily related to the acceleration of pension contributions.
68
Income tax amounts are estimates based on our initial analysis and current interpretation of this legislation. Given the complexity of the legislation, anticipated guidance from the U.S. Treasury, and the potential for additional guidance from the SEC or the FASB, these estimates may be adjusted during 2018.
Temporary differences and carry-forwards, which give rise to deferred tax assets and liabilities, are as follows for the years ended December 31:
(in thousands) | ||||||||
2017 (1) | 2016 (1) | |||||||
Deferred tax assets: | ||||||||
Other employee benefits | $ | 14,092 | $ | 19,106 | ||||
Pension and other postretirement benefits (2) | 22,758 | 65,241 | ||||||
Allowance for management fee returned on cancelled policies | 3,024 | 4,795 | ||||||
Other | 812 | 81 | ||||||
Total deferred tax assets | 40,686 | 89,223 | ||||||
Deferred tax liabilities: | ||||||||
Depreciation | 10,204 | 18,493 | ||||||
Prepaid expenses | 5,568 | 8,120 | ||||||
Limited partnerships | 4,509 | 5,597 | ||||||
Unrealized gains on investments | 856 | 1,657 | ||||||
Other | 159 | 1,467 | ||||||
Total deferred tax liabilities | 21,296 | 35,334 | ||||||
Net deferred tax asset | $ | 19,390 | $ | 53,889 | ||||
(1) | Deferred tax balances were tax effected at 21% in 2017, the corporate tax rate effective January 1, 2018, as a result of the enactment of the TCJA on December 22, 2017. For 2016, balances were tax effected at the then effective tax rate of 35%. |
(2) | Decrease in tax assets of pension and other postretirement benefits are primarily due to the $39.9 million of unplanned additional contributions in 2017, as well as accelerated contributions in 2018. We contributed $40 million in January 2018 and plan to contribute an additional $40 million in April 2018. |
We had no valuation allowance recorded at December 31, 2017 or December 31, 2016. At December 31, 2017, we had an uncertain tax position of $2.3 million, for which a current liability was recorded. As a related temporary tax difference was also recognized, there was no impact to our results of operations or financial position. We recognized interest of $0.1 million related to this uncertain tax position in income tax expense. The IRS has examined our tax filings through tax year ended 2012. We are currently not under IRS audit, nor have we been notified of an upcoming IRS audit.
We are the attorney-in-fact for the subscribers (policyholders) at the Exchange, a reciprocal insurance exchange. In that capacity, we provide all services and facilities necessary to conduct the Exchange's insurance business. Indemnity and the Exchange together constitute a single insurance business. Consequently, we are not subject to state corporate income or franchise taxes in states where the Exchange conducts its business and the states collect premium tax in lieu of corporate income or franchise tax, as a result of the Exchange's remittance of premium taxes in those states.
69
Note 11. Capital Stock
Class A and B common stock
We have two classes of common stock: Class A which has a dividend preference and Class B which has voting power and a conversion right. Each share of Class A common stock outstanding at the time of the declaration of any dividend upon shares of Class B common stock shall be entitled to a dividend payable at the same time, at the same record date, and in an amount at least equal to 2/3 of 1.0% of any dividend declared on each share of Class B common stock. We may declare and pay a dividend in respect to Class A common stock without any requirement that any dividend be declared and paid in respect to Class B common stock. Sole shareholder voting power is vested in Class B common stock except insofar as any applicable law shall permit Class A common shareholders to vote as a class in regards to any changes in the rights, preferences, and privileges attaching to Class A common stock. Holders of Class B shares may, at their option, convert their shares into Class A shares at the rate of 2,400 Class A shares per Class B share. There were no shares of Class B common stock converted into Class A common stock in 2017, 2016 or 2015.
Stock repurchases
Our Board of Directors authorized a stock repurchase program effective January 1, 1999 allowing the repurchase of our outstanding Class A nonvoting common stock. Treasury shares are recorded in the Statements of Financial Position at total cost based upon trade date. There were no shares repurchased under this program during 2017 or 2016. In October 2011, our Board of Directors approved a continuation of the current stock repurchase program for a total of $150 million, with no time limitation. We had approximately $17.8 million of repurchase authority remaining under this program at December 31, 2017, based upon trade date.
In 2017, we purchased 60,332 shares of our outstanding Class A nonvoting common stock outside of our publicly announced share repurchase program at a total cost of $7.3 million. Of this amount, we purchased 3,785 shares for $0.4 million, or $111.55 per share, for stock-based awards in conjunction with our equity compensation plan. We purchased 9,663 shares for $1.2 million, or $121.85 per share, to fund the rabbi trust for the outside director deferred stock compensation plan. The remaining 46,884 shares were purchased at a total cost of $5.7 million, or $122.40 per share, for the vesting of stock-based awards in conjunction with our long-term incentive plan. These shares were delivered in 2017.
In 2016, we purchased 15,093 shares of our outstanding Class A nonvoting common stock outside of our publicly announced share repurchase program at a total cost of $1.5 million. Of this amount, we purchased 7,432 shares for $0.7 million, or $99.23 per share, to fund the rabbi trust for the outside director deferred stock compensation plan. The remaining 7,661 shares were purchased at a total cost of $0.8 million, or $98.20 per share, for the vesting of stock-based awards in conjunction with our long-term incentive plan. These shares were delivered in 2016.
70
Note 12. Accumulated Other Comprehensive Income (Loss)
Changes in accumulated other comprehensive income ("AOCI") (loss) by component, including amounts reclassified to other comprehensive income ("OCI") (loss) and the related line item in the Statements of Operations where net income is presented, are as follows for the year ended December 31:
(in thousands) | 2017 | 2016 | 2015 | |||||||||||||||||||||||||||
Before Tax | Income Tax | Net | Before Tax | Income Tax | Net | Before Tax | Income Tax | Net | ||||||||||||||||||||||
Investment securities: | ||||||||||||||||||||||||||||||
AOCI, beginning of year | $ | 3,954 | $ | 1,384 | $ | 2,570 | $ | 3,888 | $ | 1,361 | $ | 2,527 | $ | 10,473 | $ | 3,666 | $ | 6,807 | ||||||||||||
OCI (loss) before reclassifications - pre TCJA (1) | (648 | ) | (227 | ) | (421 | ) | (385 | ) | (135 | ) | (250 | ) | (7,651 | ) | (2,678 | ) | (4,973 | ) | ||||||||||||
OCI before reclassifications - post TCJA (1) | 1,162 | 243 | 919 | — | — | — | — | — | — | |||||||||||||||||||||
Realized investment (gains) losses | (1,240 | ) | (434 | ) | (806 | ) | 35 | 12 | 23 | (492 | ) | (172 | ) | (320 | ) | |||||||||||||||
Impairment losses | 182 | 64 | 118 | 416 | 146 | 270 | 1,558 | 545 | 1,013 | |||||||||||||||||||||
OCI (loss) | (544 | ) | (354 | ) | (190 | ) | 66 | 23 | 43 | (6,585 | ) | (2,305 | ) | (4,280 | ) | |||||||||||||||
Reclassification adjustment (2) | — | (314 | ) | 314 | — | — | — | — | — | — | ||||||||||||||||||||
AOCI, end of year | $ | 3,410 | $ | 716 | $ | 2,694 | $ | 3,954 | $ | 1,384 | $ | 2,570 | $ | 3,888 | $ | 1,361 | $ | 2,527 | ||||||||||||
Pension and other postretirement plans: | ||||||||||||||||||||||||||||||
AOCI (loss), beginning of year | $ | (190,695 | ) | $ | (66,744 | ) | $ | (123,951 | ) | $ | (152,910 | ) | $ | (53,519 | ) | $ | (99,391 | ) | $ | (191,552 | ) | $ | (67,044 | ) | $ | (124,508 | ) | |||
OCI (loss) before reclassifications | (20,314 | ) | (7,111 | ) | (13,203 | ) | (46,244 | ) | $ | (16,185 | ) | (30,059 | ) | 24,094 | 8,433 | 15,661 | ||||||||||||||
Amortization of prior service costs (3) | 871 | 306 | 565 | 695 | 243 | 452 | 668 | 234 | 434 | |||||||||||||||||||||
Amortization of net actuarial loss (3) | 8,882 | 3,109 | 5,773 | 7,764 | 2,717 | 5,047 | 13,880 | 4,858 | 9,022 | |||||||||||||||||||||
Settlement loss (3) | 302 | 106 | 196 | — | — | — | — | — | — | |||||||||||||||||||||
Impact of change in tax rate (4) | — | 1,436 | (1,436 | ) | — | — | — | — | — | — | ||||||||||||||||||||
OCI (loss) | (10,259 | ) | (2,154 | ) | (8,105 | ) | (37,785 | ) | (13,225 | ) | (24,560 | ) | 38,642 | 13,525 | 25,117 | |||||||||||||||
Reclassification adjustment (2) | — | 26,697 | (26,697 | ) | — | — | — | — | — | — | ||||||||||||||||||||
AOCI (loss), end of year | $ | (200,954 | ) | $ | (42,201 | ) | $ | (158,753 | ) | $ | (190,695 | ) | $ | (66,744 | ) | $ | (123,951 | ) | $ | (152,910 | ) | $ | (53,519 | ) | $ | (99,391 | ) | |||
Total | ||||||||||||||||||||||||||||||
AOCI (loss), beginning of year | $ | (186,741 | ) | $ | (65,360 | ) | $ | (121,381 | ) | $ | (149,022 | ) | $ | (52,158 | ) | $ | (96,864 | ) | $ | (181,079 | ) | $ | (63,378 | ) | $ | (117,701 | ) | |||
Investment securities | (544 | ) | (354 | ) | (190 | ) | 66 | 23 | 43 | (6,585 | ) | (2,305 | ) | (4,280 | ) | |||||||||||||||
Pension and other postretirement plans | (10,259 | ) | (2,154 | ) | (8,105 | ) | (37,785 | ) | (13,225 | ) | (24,560 | ) | 38,642 | 13,525 | 25,117 | |||||||||||||||
OCI (loss) | (10,803 | ) | (2,508 | ) | (8,295 | ) | (37,719 | ) | (13,202 | ) | (24,517 | ) | 32,057 | 11,220 | 20,837 | |||||||||||||||
Reclassification adjustment (2) | — | 26,383 | (26,383 | ) | — | — | — | — | — | — | ||||||||||||||||||||
AOCI (loss), end of year | $ | (197,544 | ) | $ | (41,485 | ) | $ | (156,059 | ) | $ | (186,741 | ) | $ | (65,360 | ) | $ | (121,381 | ) | $ | (149,022 | ) | $ | (52,158 | ) | $ | (96,864 | ) | |||
(1) | Deferred taxes related to unrealized gains and losses for the period from December 23, 2017 through December 31, 2017 were recognized at the 21% corporate rate following enactment of the TCJA. Prior to enactment, they were recognized at the 35% corporate rate. |
(2) | A one-time adjustment was made in the fourth quarter of 2017 to reclassify stranded tax effects of the components of AOCI resulting from enactment of TCJA from AOCI to retained earnings. As a result, the ending AOCI balances now reflect the new 21% corporate rate, which represents the rate in which the amounts are expected to be settled. See Note 2, "Significant Accounting Policies". |
(3) | These components of accumulated other comprehensive income (loss) are included in the computation of net periodic pension cost. See Note 8, "Postretirement Benefits", for additional information. |
(4) | Deferred taxes related to the December 31, 2017 portion of the pension and other postretirement component recognized in AOCI of $10.3 million were recognized at the 21% corporate rate following the enactment of the TCJA. |
71
Note 13. Related Party
Management fee
A management fee is charged to the Exchange for services we provide under subscriber's agreements with subscribers at the Exchange. The fee is a percentage of direct and assumed premiums written by the Exchange. This percentage rate is adjusted at least annually by our Board of Directors but cannot exceed 25%. The effective management fee rate charged the Exchange was 25% in 2017, 2016 and 2015. The Board of Directors elected to maintain the fee at 25% beginning January 1, 2018.
There is no provision in the subscriber's agreement for termination of our appointment as attorney-in-fact by the subscribers at the Exchange and the appointment is not affected by a policyholder's disability or incapacity.
Insurance holding company system
Most states have enacted legislation that regulates insurance holding company systems, defined as two or more affiliated persons, one or more of which is an insurer. The Exchange has the following wholly owned property and casualty subsidiaries: Erie Insurance Company, Erie Insurance Company of New York, Erie Insurance Property and Casualty Company and Flagship City Insurance Company, and a wholly owned life insurance company, Erie Family Life Insurance Company ("EFL"). Indemnity and the Exchange, and its wholly owned subsidiaries, meet the definition of an insurance holding company system.
Expense allocations
All claims handling services for the Exchange and its property and casualty insurance subsidiaries are performed by our employees who are entirely dedicated to claims related activities. All costs associated with these employees, including postretirement benefits, are reimbursed to us from the Exchange's revenues in accordance with the subscriber's agreement and the services agreements between us and the property and casualty insurance subsidiaries. We are reimbursed by EFL from its revenues for all costs, including postretirement benefits, associated with employees who perform life insurance related operating activities for EFL in accordance with its services agreement with us. See also Note 8, "Postretirement Benefits" for a discussion of intercompany expense allocations under the postretirement benefit plans. Investment management costs incurred by Indemnity on behalf of the Exchange and its subsidiaries are reimbursed to Indemnity in accordance with the subscriber's and services agreements, respectively. These services include Indemnity engaging third-party investment management services for several assets classes on behalf of the Exchange. Common overhead expenses and certain service department costs incurred by us on behalf of the Exchange and its wholly owned subsidiaries are reimbursed by the proper entity based upon appropriate utilization statistics (employee count, square footage, vehicle count, project hours, etc.) specifically measured to accomplish proportional allocations, which we believe are reasonable.
All reimbursements are made on an actual cost basis and do not include a profit component. We record these reimbursements as receivables from the Exchange and its subsidiaries with a corresponding reduction to our expenses. Reimbursements are settled on a monthly basis. The amounts incurred on behalf of the Exchange and its subsidiaries were as follows for the years ended December 31:
(in thousands) | 2017 | 2016 | ||||||
Erie Insurance Exchange (1) | ||||||||
Operating expenses | $ | 447,953 | $ | 429,985 | ||||
Investment expenses | 30,393 | 27,240 | ||||||
478,346 | 457,225 | |||||||
Erie Family Life Insurance | ||||||||
Operating expenses | $ | 41,793 | $ | 36,818 | ||||
Investment expenses | 2,196 | 2,070 | ||||||
43,989 | 38,888 | |||||||
Total cash settlements | $ | 522,335 | $ | 496,113 | ||||
(1) Includes wholly owned property and casualty subsidiaries.
Office leases
We lease certain office space from the Exchange including the home office and three field office facilities. On April 28, 2017, after securing approval from the Pennsylvania Insurance Department, a new home office lease was executed between the Exchange and Indemnity, which was retroactive to January 1, 2017, when the prior lease expired. Under the new lease, rent is based on rental rates of like property in Erie, Pennsylvania and all operating expenses including utilities, cleaning, repairs, real estate taxes, property insurance and leasehold improvements are the responsibility of the tenant (Indemnity). This lease agreement expires December 31, 2021. Under the previous lease, rents were determined considering returns on invested capital
72
and included building operating and overhead costs. Rent costs and related operating expenses of shared facilities are allocated between Indemnity, Exchange and its subsidiaries based upon usage or square footage occupied. Rent expense under the new lease totaled $6.3 million in 2017. Rent expenses totaled $14.3 million and $12.2 million in 2016 and 2015, respectively, under the prior lease agreement, which included all operating expenses. Operating expenses totaled $13.1 million in 2017. Reimbursements from the Exchange and EFL related to the use of this space totaled $4.6 million in 2017, $4.9 million in 2016 and $3.6 million in 2015. We also have a lease commitment with EFL for a branch office until 2018. Annual rentals paid to EFL under this lease totaled $0.4 million in 2017, 2016 and 2015.
Notes receivable from EFL
We are due $25 million from EFL in the form of a surplus note that was issued in 2003. The note may be repaid only out of unassigned surplus of EFL. Both principal and interest payments are subject to prior approval by the Pennsylvania Insurance Commissioner. The note bears an annual interest rate of 6.7% and will be payable on demand on or after December 31, 2018, with interest scheduled to be paid semi-annually. EFL paid annual interest to us of $1.7 million in 2017, 2016 and 2015.
Note 14. Concentrations of Credit Risk
Financial instruments could potentially expose us to concentrations of credit risk, including unsecured receivables from the Exchange. A large majority of our revenue and receivables are from the Exchange and its subsidiaries. See also Note 1, "Nature of Operations". Management fee amounts and other reimbursements due from the Exchange and its subsidiaries were $418.3 million and $378.5 million at December 31, 2017 and 2016, respectively.
Note 15. Commitments and Contingencies
We have contractual commitments to invest up to $16.3 million related to our limited partnership investments at December 31, 2017. These commitments are split between private equity securities of $6.6 million, mezzanine debt securities of $8.2 million, and real estate activities of $1.5 million. These commitments will be funded as required by the limited partnership agreements. In addition, we have commitments related to the remaining draws of the senior secured draw term loan credit facility. See Note 7, "Borrowing Arrangements".
We are involved in litigation arising in the ordinary course of conducting business. In accordance with current accounting standards for loss contingencies and based upon information currently known to us, we establish reserves for litigation when it is probable that a loss associated with a claim or proceeding has been incurred and the amount of the loss or range of loss can be reasonably estimated. When no amount within the range of loss is a better estimate than any other amount, we accrue the minimum amount of the estimable loss. To the extent that such litigation against us may have an exposure to a loss in excess of the amount we have accrued, we believe that such excess would not be material to our financial condition, results of operations, or cash flows. Legal fees are expensed as incurred. We believe that our accruals for legal proceedings are appropriate and, individually and in the aggregate, are not expected to be material to our financial condition, operations, or cash flows.
We review all litigation on an ongoing basis when making accrual and disclosure decisions. For certain legal proceedings, we cannot reasonably estimate losses or a range of loss, if any, particularly for proceedings that are in their early stages of development or where the plaintiffs seek indeterminate damages. Various factors, including, but not limited to, the outcome of potentially lengthy discovery and the resolution of important factual questions, may need to be determined before probability can be established or before a loss or range of loss can be reasonably estimated. If the loss contingency in question is not both probable and reasonably estimable, we do not establish an accrual and the matter will continue to be monitored for any developments that would make the loss contingency both probable and reasonably estimable. In the event that a legal proceeding results in a substantial judgment against, or settlement by, us, there can be no assurance that any resulting liability or financial commitment would not have a material adverse effect on our financial condition, results of operations, or cash flows.
73
Note 16. Supplementary Data on Cash Flows
A reconciliation of net income to net cash provided by operating activities as presented in the Statements of Cash Flows is as follows for the years ended December 31:
(in thousands) | ||||||||||||
2017 | 2016 | 2015 | ||||||||||
Cash flows from operating activities: | ||||||||||||
Net income | $ | 196,999 | $ | 210,366 | $ | 174,678 | ||||||
Adjustments to reconcile net income to net cash provided by operating activities: | ||||||||||||
Depreciation and amortization | 14,929 | 15,154 | 16,461 | |||||||||
Deferred income tax expense (benefit) | 26,912 | (2 | ) | (14,584 | ) | |||||||
Other income tax expense (1) | 10,095 | — | — | |||||||||
Realized (gains) losses and impairments on investments | (1,152 | ) | (256 | ) | 1,066 | |||||||
Equity in earnings of limited partnerships | (2,801 | ) | (7,025 | ) | (16,983 | ) | ||||||
Net amortization of bond premium | 7,038 | 7,436 | 8,160 | |||||||||
Decrease in deferred compensation | (2,681 | ) | (4,561 | ) | (1,526 | ) | ||||||
Limited partnership distributions | 5,128 | 17,837 | 14,112 | |||||||||
Increase in receivables from affiliates | (39,788 | ) | (30,485 | ) | (12,835 | ) | ||||||
(Increase) decrease in accrued investment income | (516 | ) | (846 | ) | 47 | |||||||
(Increase) decrease in federal income taxes recoverable | (24,640 | ) | 6,687 | (499 | ) | |||||||
(Increase) decrease in prepaid pension | (27,265 | ) | 10,524 | 20,307 | ||||||||
(Increase) decrease in prepaid expenses and other assets | (7,636 | ) | (4,674 | ) | 1,193 | |||||||
Increase in accounts payable and accrued expenses | 17,183 | 11,144 | 3,633 | |||||||||
Increase in commissions payable | 17,565 | 15,017 | 5,624 | |||||||||
Increase in accrued agent bonuses | 7,756 | 8,020 | 18,524 | |||||||||
Net cash provided by operating activities | $ | 197,126 | $ | 254,336 | $ | 217,378 | ||||||
(1) | Due to the enactment of the TCJA on December 22, 2017, income tax expense increased by $10.1 million, which included an increase of $19.9 million related to the re-measurement of our net deferred tax asset partially offset by a deferred tax benefit of $9.8 million primarily related to the acceleration of pension contributions. |
74
Note 17. Quarterly Results of Operations (unaudited)
Year ended December 31, 2017 | ||||||||||||||||||||
(in thousands, except per share data) | First quarter | Second quarter | Third quarter | Fourth quarter | Year | |||||||||||||||
Operating revenue | $ | 399,316 | $ | 448,564 | $ | 442,492 | $ | 401,402 | $ | 1,691,774 | ||||||||||
Operating expenses | 332,782 | 365,520 | 361,656 | 343,444 | 1,403,402 | |||||||||||||||
Investment income | 6,586 | 6,448 | 8,406 | 7,121 | 28,561 | |||||||||||||||
Interest expense, net | 166 | 257 | 377 | 438 | 1,238 | |||||||||||||||
Income before income taxes | 72,954 | 89,235 | 88,865 | 64,641 | 315,695 | |||||||||||||||
Net income | $ | 47,876 | $ | 58,527 | $ | 58,543 | $ | 32,053 | $ | 196,999 | ||||||||||
Earnings per share (1) | ||||||||||||||||||||
Net income per share | ||||||||||||||||||||
Class A common stock – basic | $ | 1.03 | $ | 1.26 | $ | 1.26 | $ | 0.69 | $ | 4.23 | ||||||||||
Class A common stock – diluted (2) | $ | 0.91 | $ | 1.12 | $ | 1.12 | $ | 0.61 | $ | 3.76 | ||||||||||
Class B common stock – basic | $ | 154 | $ | 189 | $ | 189 | $ | 103 | $ | 635 | ||||||||||
Class B common stock – diluted | $ | 154 | $ | 188 | $ | 189 | $ | 103 | $ | 634 | ||||||||||
(1) | The cumulative sum of quarterly basic and diluted net income per share amounts may not equal total basic and diluted net income per share for the year due to differences in weighted average shares and equivalent shares outstanding for each of the periods presented. |
(2) | Class A diluted earnings per share was reduced by $0.19 for the fourth quarter and total year as a result of increased income tax expense from enactment of the TCJA of $10.1 million. See Note 3, "Earnings Per Share" and Note 10, "Income Taxes". |
Year ended December 31, 2016 | ||||||||||||||||||||
(in thousands, except per share data) | First quarter | Second quarter | Third quarter | Fourth quarter | Year | |||||||||||||||
Operating revenue | $ | 374,728 | $ | 423,884 | $ | 418,406 | $ | 379,613 | $ | 1,596,631 | ||||||||||
Operating expenses | 307,063 | 338,125 | 336,151 | 322,928 | 1,304,267 | |||||||||||||||
Investment income | 2,559 | 7,404 | 4,326 | 13,539 | 27,828 | |||||||||||||||
Interest expense, net | — | — | — | 101 | 101 | |||||||||||||||
Income before income taxes | 70,224 | 93,163 | 86,581 | 70,123 | 320,091 | |||||||||||||||
Net income | $ | 45,895 | $ | 61,309 | $ | 57,376 | $ | 45,786 | $ | 210,366 | ||||||||||
Earnings per share (1) | ||||||||||||||||||||
Net income per share | ||||||||||||||||||||
Class A common stock – basic | $ | 0.99 | $ | 1.32 | $ | 1.23 | $ | 0.98 | $ | 4.52 | ||||||||||
Class A common stock – diluted | $ | 0.87 | $ | 1.17 | $ | 1.09 | $ | 0.87 | $ | 4.01 | ||||||||||
Class B common stock – basic | $ | 148 | $ | 197 | $ | 185 | $ | 147 | $ | 678 | ||||||||||
Class B common stock – diluted | $ | 148 | $ | 197 | $ | 185 | $ | 147 | $ | 677 | ||||||||||
(1) | The cumulative sum of quarterly basic and diluted net income per share amounts may not equal total basic and diluted net income per share for the year due to differences in weighted average shares and equivalent shares outstanding for each of the periods presented. |
Note 18. Subsequent Events
No items were identified in this period subsequent to the financial statement date that required adjustment or disclosure, other than the disclosure made in Note 9, "Incentive and Deferred Compensation Plans" regarding the amendment to the rabbi trust agreement.
75
ITEM 9. CHANGES IN AND DISAGREEMENTS WITH ACCOUNTANTS ON ACCOUNTING AND FINANCIAL DISCLOSURE
None.
ITEM 9A. CONTROLS AND PROCEDURES
Evaluation of Disclosure Controls and Procedures
We maintain disclosure controls and procedures designed to ensure that information required to be disclosed in our reports filed under the Securities Exchange Act of 1934, as amended, is recorded, processed, summarized and reported within the time periods specified in the Securities and Exchange Commission rules and forms, and that such information is accumulated and communicated to management, including our Chief Executive Officer and Chief Financial Officer, as appropriate, to allow for timely decisions regarding required disclosures.
As required by the Securities and Exchange Commission Rule 13a-15(e), we carried out an evaluation, under the supervision and with the participation of management, including our Chief Executive Officer and Chief Financial Officer, of the effectiveness of the design and operation of our disclosure controls and procedures as of December 31, 2017. Based upon the foregoing, our Chief Executive Officer and Chief Financial Officer concluded that our disclosure controls and procedures were effective.
Changes in Internal Control over Financial Reporting
There has been no change in our internal controls over financial reporting during our most recent fiscal quarter that has materially affected, or is reasonably likely to materially affect our internal controls over financial reporting. Our process for evaluating controls and procedures is continuous and encompasses constant improvement of the design and effectiveness of established controls and procedures.
Management's Report on Internal Control over Financial Reporting
Management is responsible for establishing and maintaining adequate internal control over financial reporting of Erie Indemnity Company, as defined in Rules 13a-15(f) under the Exchange Act. Under the supervision and with the participation of our management, including our Chief Executive Officer and Chief Financial Officer, we conducted an evaluation of the effectiveness of the Erie Indemnity Company's internal control over financial reporting based upon the framework in the Internal Control-Integrated Framework issued in 2013 by the Committee of Sponsoring Organizations of the Treadway Commission. Based upon our evaluation under the framework in the Internal Control-Integrated Framework issued in 2013, management has concluded that Erie Indemnity Company's internal control over financial reporting was effective as of December 31, 2017.
/s/ Timothy G. NeCastro | /s/ Gregory J. Gutting | /s/ Julie M. Pelkowski | |||
Timothy G. NeCastro | Gregory J. Gutting | Julie M. Pelkowski | |||
President and | Executive Vice President | Senior Vice President | |||
Chief Executive Officer | and Chief Financial Officer | and Controller | |||
February 22, 2018 | February 22, 2018 | February 22, 2018 | |||
Our independent auditor, Ernst & Young LLP, a registered public accounting firm, has issued an attestation report on our internal control over financial reporting. This report appears on the following page.
ITEM 9B. OTHER INFORMATION
There was no additional information in the fourth quarter of 2017 that has not already been filed in a Form 8-K.
76
Report of Independent Registered Public Accounting Firm
The Board of Directors and Shareholders of Erie Indemnity Company
Opinion on Internal Control over Financial Reporting
We have audited Erie Indemnity Company's internal control over financial reporting as of December 31, 2017, based on criteria established in Internal Control-Integrated Framework issued by the Committee of Sponsoring Organizations of the Treadway Commission (2013 framework) (the COSO criteria). In our opinion, Erie Indemnity Company (the "Company") maintained, in all material respects, effective internal control over financial reporting as of December 31, 2017, based on the COSO criteria.
We also have audited, in accordance with the standards of the Public Company Accounting Oversight Board (United States) (PCAOB), the statements of financial position of the Company as of December 31, 2017 and 2016, and the related statements of operations, comprehensive income, shareholders' equity, and cash flows for each of the three years in the period ended December 31, 2017, and the related notes and schedules (collectively referred to as the "financial statements") of the Company and our report dated February 22, 2018 expressed an unqualified opinion thereon.
Basis for Opinion
The Company's management is responsible for maintaining effective internal control over financial reporting, and for its assessment of the effectiveness of internal control over financial reporting included in the accompanying Management's Report on Internal Control over Financial Reporting. Our responsibility is to express an opinion on the Company's internal control over financial reporting based on our audit. We are a public accounting firm registered with the PCAOB and are required to be independent with respect to the Company in accordance with the U.S. federal securities laws and the applicable rules and regulations of the Securities and Exchange Commission and the PCAOB.
We conducted our audit in accordance with the standards of the PCAOB. Those standards require that we plan and perform the audit to obtain reasonable assurance about whether effective internal control over financial reporting was maintained in all material respects.
Our audit included obtaining an understanding of internal control over financial reporting, assessing the risk that a material weakness exists, testing and evaluating the design and operating effectiveness of internal control based on the assessed risk, and performing such other procedures as we considered necessary in the circumstances. We believe that our audit provides a reasonable basis for our opinion.
Definition and Limitations of Internal Control Over Financial Reporting
A company's internal control over financial reporting is a process designed to provide reasonable assurance regarding the reliability of financial reporting and the preparation of financial statements for external purposes in accordance with generally accepted accounting principles. A company's internal control over financial reporting includes those policies and procedures that (1) pertain to the maintenance of records that, in reasonable detail, accurately and fairly reflect the transactions and dispositions of the assets of the company; (2) provide reasonable assurance that transactions are recorded as necessary to permit preparation of financial statements in accordance with generally accepted accounting principles, and that receipts and expenditures of the company are being made only in accordance with authorizations of management and directors of the company; and (3) provide reasonable assurance regarding prevention or timely detection of unauthorized acquisition, use, or disposition of the company's assets that could have a material effect on the financial statements.
Because of its inherent limitations, internal control over financial reporting may not prevent or detect misstatements. Also, projections of any evaluation of effectiveness to future periods are subject to the risk that controls may become inadequate because of changes in conditions, or that the degree of compliance with the policies or procedures may deteriorate.
/s/ Ernst & Young
Philadelphia, PA
February 22, 2018
77
PART III
ITEM 10. DIRECTORS, EXECUTIVE OFFICERS AND CORPORATE GOVERNANCE
The information with respect to our outside directors, audit committee and audit committee financial experts and Section 16(a) beneficial ownership reporting compliance, is incorporated by reference to the information statement on Schedule 14(C) to be filed with the Securities and Exchange Commission no later than 120 days after December 31, 2017.
We have adopted a Code of Conduct that applies to all of our outside directors, officers and employees. We have previously filed a copy of the Code of Conduct as Exhibit 14.3 to the Registrant's Form 10-K as filed with the Securities and Exchange Commission on February 25, 2016. In addition to this, we have adopted a Code of Ethics for Senior Financial Officers that also applies to our Chief Executive Officer, Chief Financial Officer, Chief Accounting Officer and any other person performing similar functions. We have previously filed a copy of the Code of Ethics for Senior Financial Officers as Exhibit 14.4 to the Registrant's Form 8-K as filed with the Securities and Exchange Commission on June 1, 2016. Our Code of Conduct and Code of Ethics for Senior Financial Officers are also available on our website at www.erieinsurance.com.
Executive Officers of the Registrant
Name | Age as of 12/31/2017 | Principal Occupation and Positions for Past Five Years | ||
President & Chief Executive Officer: | ||||
Timothy G. NeCastro | 57 | President and Chief Executive Officer since January 2017; Chief Executive Officer, August 2016 through December 2016; President and Chief Executive Officer Designate, June 2016 through July 2016; Senior Vice President, West Region, February 2010 through June 2016; Director, Erie Family Life Insurance Company ("EFL"), Erie Insurance Company ("EIC"), Flagship City Insurance Company ("Flagship"), Erie Insurance Company of New York ("ENY") and Erie Insurance Property & Casualty Company ("EPC"). | ||
Executive Vice Presidents: | ||||
Lorianne Feltz | 48 | Executive Vice President, Claims & Customer Service since November 2016; Senior Vice President, Customer Service, January 2011 through November 2016. | ||
Gregory J. Gutting | 54 | Executive Vice President and Chief Financial Officer since August 2016; Interim Executive Vice President and Chief Financial Officer, October 2015 through July 2016; Senior Vice President and Controller, March 2009 through September 2015; Director, EFL, EIC, Flagship, ENY and EPC. | ||
Robert C. Ingram, III | 59 | Executive Vice President and Chief Information Officer since August 2012; Director, EFL, EIC, Flagship, ENY and EPC. | ||
Sean J. McLaughlin | 62 | Executive Vice President and General Counsel since January 2016; Executive Vice President, Secretary and General Counsel, August 2013 through December 2015; Chief Judge, United States District Court for the Western District of Pennsylvania, April 2013 through August 2013; United States District Judge for the Western District of Pennsylvania, October 1994 through April 2013; Director, EFL, EIC, Flagship, ENY and EPC. | ||
Douglas E. Smith | 43 | Executive Vice President, Sales & Products since November 2016; Senior Vice President, Personal Lines, November 2008 through October 2016. | ||
Dionne Wallace Oakley | 50 | Executive Vice President, Human Resources & Strategy since January 2018; Senior Vice President, Human Resources, September 2012 through December 2017. | ||
78
ITEM 11. EXECUTIVE COMPENSATION
The information required by this item with respect to executive compensation is incorporated by reference to the information statement on Schedule 14(C) to be filed with the Securities and Exchange Commission no later than 120 days after December 31, 2017.
ITEM 12. SECURITY OWNERSHIP OF CERTAIN BENEFICIAL OWNERS AND MANAGEMENT AND RELATED STOCKHOLDER MATTERS
The information with respect to security ownership of certain beneficial owners and management and securities authorized for issuance under equity compensation plans, is incorporated by reference to the information statement on Schedule 14(C) to be filed with the Securities and Exchange Commission no later than 120 days after December 31, 2017.
ITEM 13. CERTAIN RELATIONSHIPS AND RELATED TRANSACTIONS, AND DIRECTOR INDEPENDENCE
Information with respect to certain relationships with our outside directors is incorporated by reference to the information statement on Schedule 14(C) to be filed with the Securities and Exchange Commission no later than 120 days after December 31, 2017.
ITEM 14. PRINCIPAL ACCOUNTANT FEES AND SERVICES
The information required by this item is incorporated by reference to the information statement on Schedule 14(C) to be filed with the Securities and Exchange Commission no later than 120 days after December 31, 2017.
79
PART IV
ITEM 15. EXHIBITS AND FINANCIAL STATEMENT SCHEDULES
(a) The following documents are filed as part of this report:
1. Financial Statements
Included in Item 8 "Financial Statements and Supplementary Data" contained in this report.
Erie Indemnity Company:
• | Report of Independent Registered Public Accounting Firm on the Effectiveness of Internal Control over Financial Reporting |
• | Report of Independent Registered Public Accounting Firm on the Financial Statements |
• | Statements of Operations for the three years ended December 31, 2017, 2016 and 2015 |
• | Statements of Comprehensive Income for the three years ended December 31, 2017, 2016 and 2015 |
• | Statements of Financial Position as of December 31, 2017 and 2016 |
• | Statements of Shareholders' Equity for the three years ended December 31, 2017, 2016 and 2015 |
• | Statements of Cash Flows for the three years ended December 31, 2017, 2016 and 2015 |
• | Notes to Financial Statements |
2. Financial Statement Schedules
All schedules are not required, not applicable, or the information is included in the financial statements or notes thereto.
Page | |
ITEM 16. FORM 10-K SUMMARY
None.
80
SIGNATURES
Pursuant to the requirements of Section 13 or 15(d) of the Securities Exchange Act of 1934, the Registrant has duly caused this report to be signed on its behalf by the undersigned, thereunto duly authorized.
February 22, 2018 | ERIE INDEMNITY COMPANY | |
(Registrant) | ||
By: | /s/ Timothy G. NeCastro | |
Timothy G. NeCastro, President and CEO | ||
(Principal Executive Officer) | ||
Pursuant to the requirements of the Securities Exchange Act of 1934, this report has been signed below by the following persons on behalf of the Registrant and in the capacities and on the date indicated.
February 22, 2018 | /s/ Timothy G. NeCastro | |||
Timothy G. NeCastro, President and CEO | ||||
(Principal Executive Officer) | ||||
/s/ Gregory J. Gutting | ||||
Gregory J. Gutting, Executive Vice President and CFO | ||||
(Principal Financial Officer) | ||||
/s/ Julie M. Pelkowski | ||||
Julie M. Pelkowski, Senior Vice President and Controller | ||||
(Principal Accounting Officer) | ||||
Board of Directors:
/s/ J. Ralph Borneman, Jr. | /s/ Claude C. Lilly, III | |
J. Ralph Borneman, Jr. | Claude C. Lilly, III | |
/s/ Eugene C. Connell | /s/ George R. Lucore | |
Eugene C. Connell | George R. Lucore | |
/s/ LuAnn Datesh | /s/ Thomas W. Palmer | |
LuAnn Datesh | Thomas W. Palmer | |
/s/ Jonathan Hirt Hagen | /s/ Martin P. Sheffield | |
Jonathan Hirt Hagen | Martin P. Sheffield | |
/s/ Thomas B. Hagen | /s/ Richard L. Stover | |
Thomas B. Hagen, Chairman | Richard L. Stover | |
/s/ C. Scott Hartz | /s/ Elizabeth Hirt Vorsheck | |
C. Scott Hartz | Elizabeth Hirt Vorsheck | |
/s/ Brian A. Hudson, Sr. | ||
Brian A. Hudson, Sr. | ||
81
EXHIBIT INDEX
(Pursuant to Item 601 of Regulation S-K)
Exhibit | ||
Number | Description of Exhibit | |
3.8 | ||
3.9* | ||
10.12 | ||
10.104 | ||
10.145 | ||
10.146 | ||
10.152 | ||
10.153 | ||
10.154 | ||
10.156 | ||
10.157 | ||
10.158 | ||
10.159 | ||
10.160 | ||
10.162 | ||
82
Exhibit | ||
Number | Description of Exhibit | |
10.163 | ||
10.164 | ||
10.165 | ||
10.166 | ||
10.167 | ||
10.168 | ||
10.169 | ||
10.170 | ||
10.171 | ||
10.172 | ||
10.173 | ||
10.174 | ||
10.175 | ||
10.176 | ||
10.177 | ||
10.178 | ||
10.179 | ||
83
Exhibit | ||
Number | Description of Exhibit | |
10.180 | ||
10.181 | ||
10.182 | ||
10.183 | ||
10.184 | ||
10.185* | ||
10.186* | ||
10.187 | ||
10.188 | ||
10.189 | ||
14.3 | ||
14.4 | ||
23* | ||
31.1* | ||
31.2* | ||
32* | ||
101.INS* | XBRL Instance Document. | |
101.SCH* | XBRL Taxonomy Extension Schema Document. | |
101.CAL* | XBRL Taxonomy Extension Calculation Linkbase Document. | |
101.DEF* | XBRL Taxonomy Extension Definition Linkbase Document. | |
101.LAB* | XBRL Taxonomy Extension Label Linkbase Document. | |
101.PRE* | XBRL Taxonomy Extension Presentation Linkbase Document. | |
* Filed herewith.
84