Attached files
| file | filename |
|---|---|
| EX-31.2 - EXHIBIT 31.2 - CyrusOne Inc. | cone-20171231xex312.htm |
| EX-32.2 - EXHIBIT 32.2 - CyrusOne Inc. | cone-20171231xex322.htm |
| EX-32.1 - EXHIBIT 32.1 - CyrusOne Inc. | cone-20171231xex321.htm |
| EX-31.1 - EXHIBIT 31.1 - CyrusOne Inc. | cone-20171231xex311.htm |
| EX-23.1 - EXHIBIT 23.1 - CyrusOne Inc. | cone-20171231xex231.htm |
| EX-21.1 - EXHIBIT 21.1 - CyrusOne Inc. | cone-20171231xex211.htm |
| EX-12.1 - EXHIBIT 12.1 - CyrusOne Inc. | cone-20171231xex121.htm |
UNITED STATES
SECURITIES AND EXCHANGE COMMISSION
Washington, DC 20549
FORM 10-K
ý | ANNUAL REPORT PURSUANT TO SECTION 13 OR 15(d) OF THE SECURITIES EXCHANGE ACT OF 1934 |
For the fiscal year ended December 31, 2017
¨ | TRANSITION REPORT PURSUANT TO SECTION 13 OR 15(d) OF THE SECURITIES EXCHANGE ACT OF 1934 |
For the transition period ___________ to ____________
Commission File Number: 001-35789
CyrusOne Inc.
(Exact name of registrant as specified in its charter)
Maryland | 46-0691837 | |
(State or other jurisdiction of incorporation or organization) | (I.R.S. Employer Identification No.) | |
2101 Cedar Springs Road, Suite 900, Dallas, TX 75201
(Address of Principal Executive Offices) (Zip Code)
(972) 350-0060
(Registrant’s telephone number, including area code)
Securities registered pursuant to Section 12(b) of the Act:
Title of Each Class | Name of Each Exchange on Which Registered | |
Common Stock, $.01 par value | NASDAQ | |
Securities registered pursuant to Section 12 (g) of the Act: None.
Indicate by check mark if the registrant is a well-known seasoned issuer, as defined in Rule 405 of the Securities Act.
Yes ý No ¨
Indicate by check mark if the registrant is not required to file reports pursuant to Section 13 or Section 15(d) of the Act.
Yes ¨ No ý
Indicate by check mark whether the registrant (1) has filed all reports required to be filed by Section 13 or 15(d) of the Securities Exchange Act of 1934 during the preceding 12 months (or for such shorter period that the registrant was required to file such reports), and (2) has been subject to such filing requirements for the past 90 days.
Yes ý No ¨
Indicate by check mark whether the registrant has submitted electronically and posted on its corporate Web site, if any, every Interactive Data File required to be submitted and posted pursuant to Rule 405 of Regulation S-T (§ 232.405 of this chapter) during the preceding 12 months (or for such shorter period that the registrant was required to submit and post such files).
Yes ý No ¨
Indicate by check mark if disclosure of delinquent filers pursuant to Item 405 of Regulation S-K (Section 229.405 of this chapter) is not contained herein, and will not be contained, to the best of registrant’s knowledge, in definitive proxy or information statements incorporated by reference in Part III of this Form 10-K or any amendment to this Form 10-K. ý
Indicate by check mark whether the registrant is a large accelerated filer, an accelerated filer, a non-accelerated filer, a smaller reporting company or an emerging growth company. See the definitions of “large accelerated filer”, “accelerated filer”, “smaller reporting company” and "emerging growth company" in Rule 12b-2 of the Exchange Act.
Large accelerated filer | ý | Accelerated filer | ¨ |
Non-accelerated filer | ¨ | Smaller reporting company | ¨ |
Emerging growth company | ¨ | ||
If an emerging growth company, indicate by check mark if the registrant has elected not to use the extended transition period for complying with any new or revised financial accounting standards provided pursuant to Section 13(a) of the Exchange Act. ¨
Indicate by check mark whether the registrant is a shell company (as defined in Rule 12b-2 of the Act).
Yes ¨ No ý
The aggregate market value of the voting Common Stock owned by non-affiliates on June 30, 2017, was $5.1 billion, computed by reference to the closing sale price of the Common Stock on the NASDAQ Global Select Market on such date.
There were 96,125,762 shares of Common Stock outstanding as of February 13, 2018.
Portions of the definitive proxy statement relating to the Company’s 2018 Annual Meeting of Shareholders are incorporated by reference into Part III of this report to the extent described herein.
EXPLANATORY NOTE
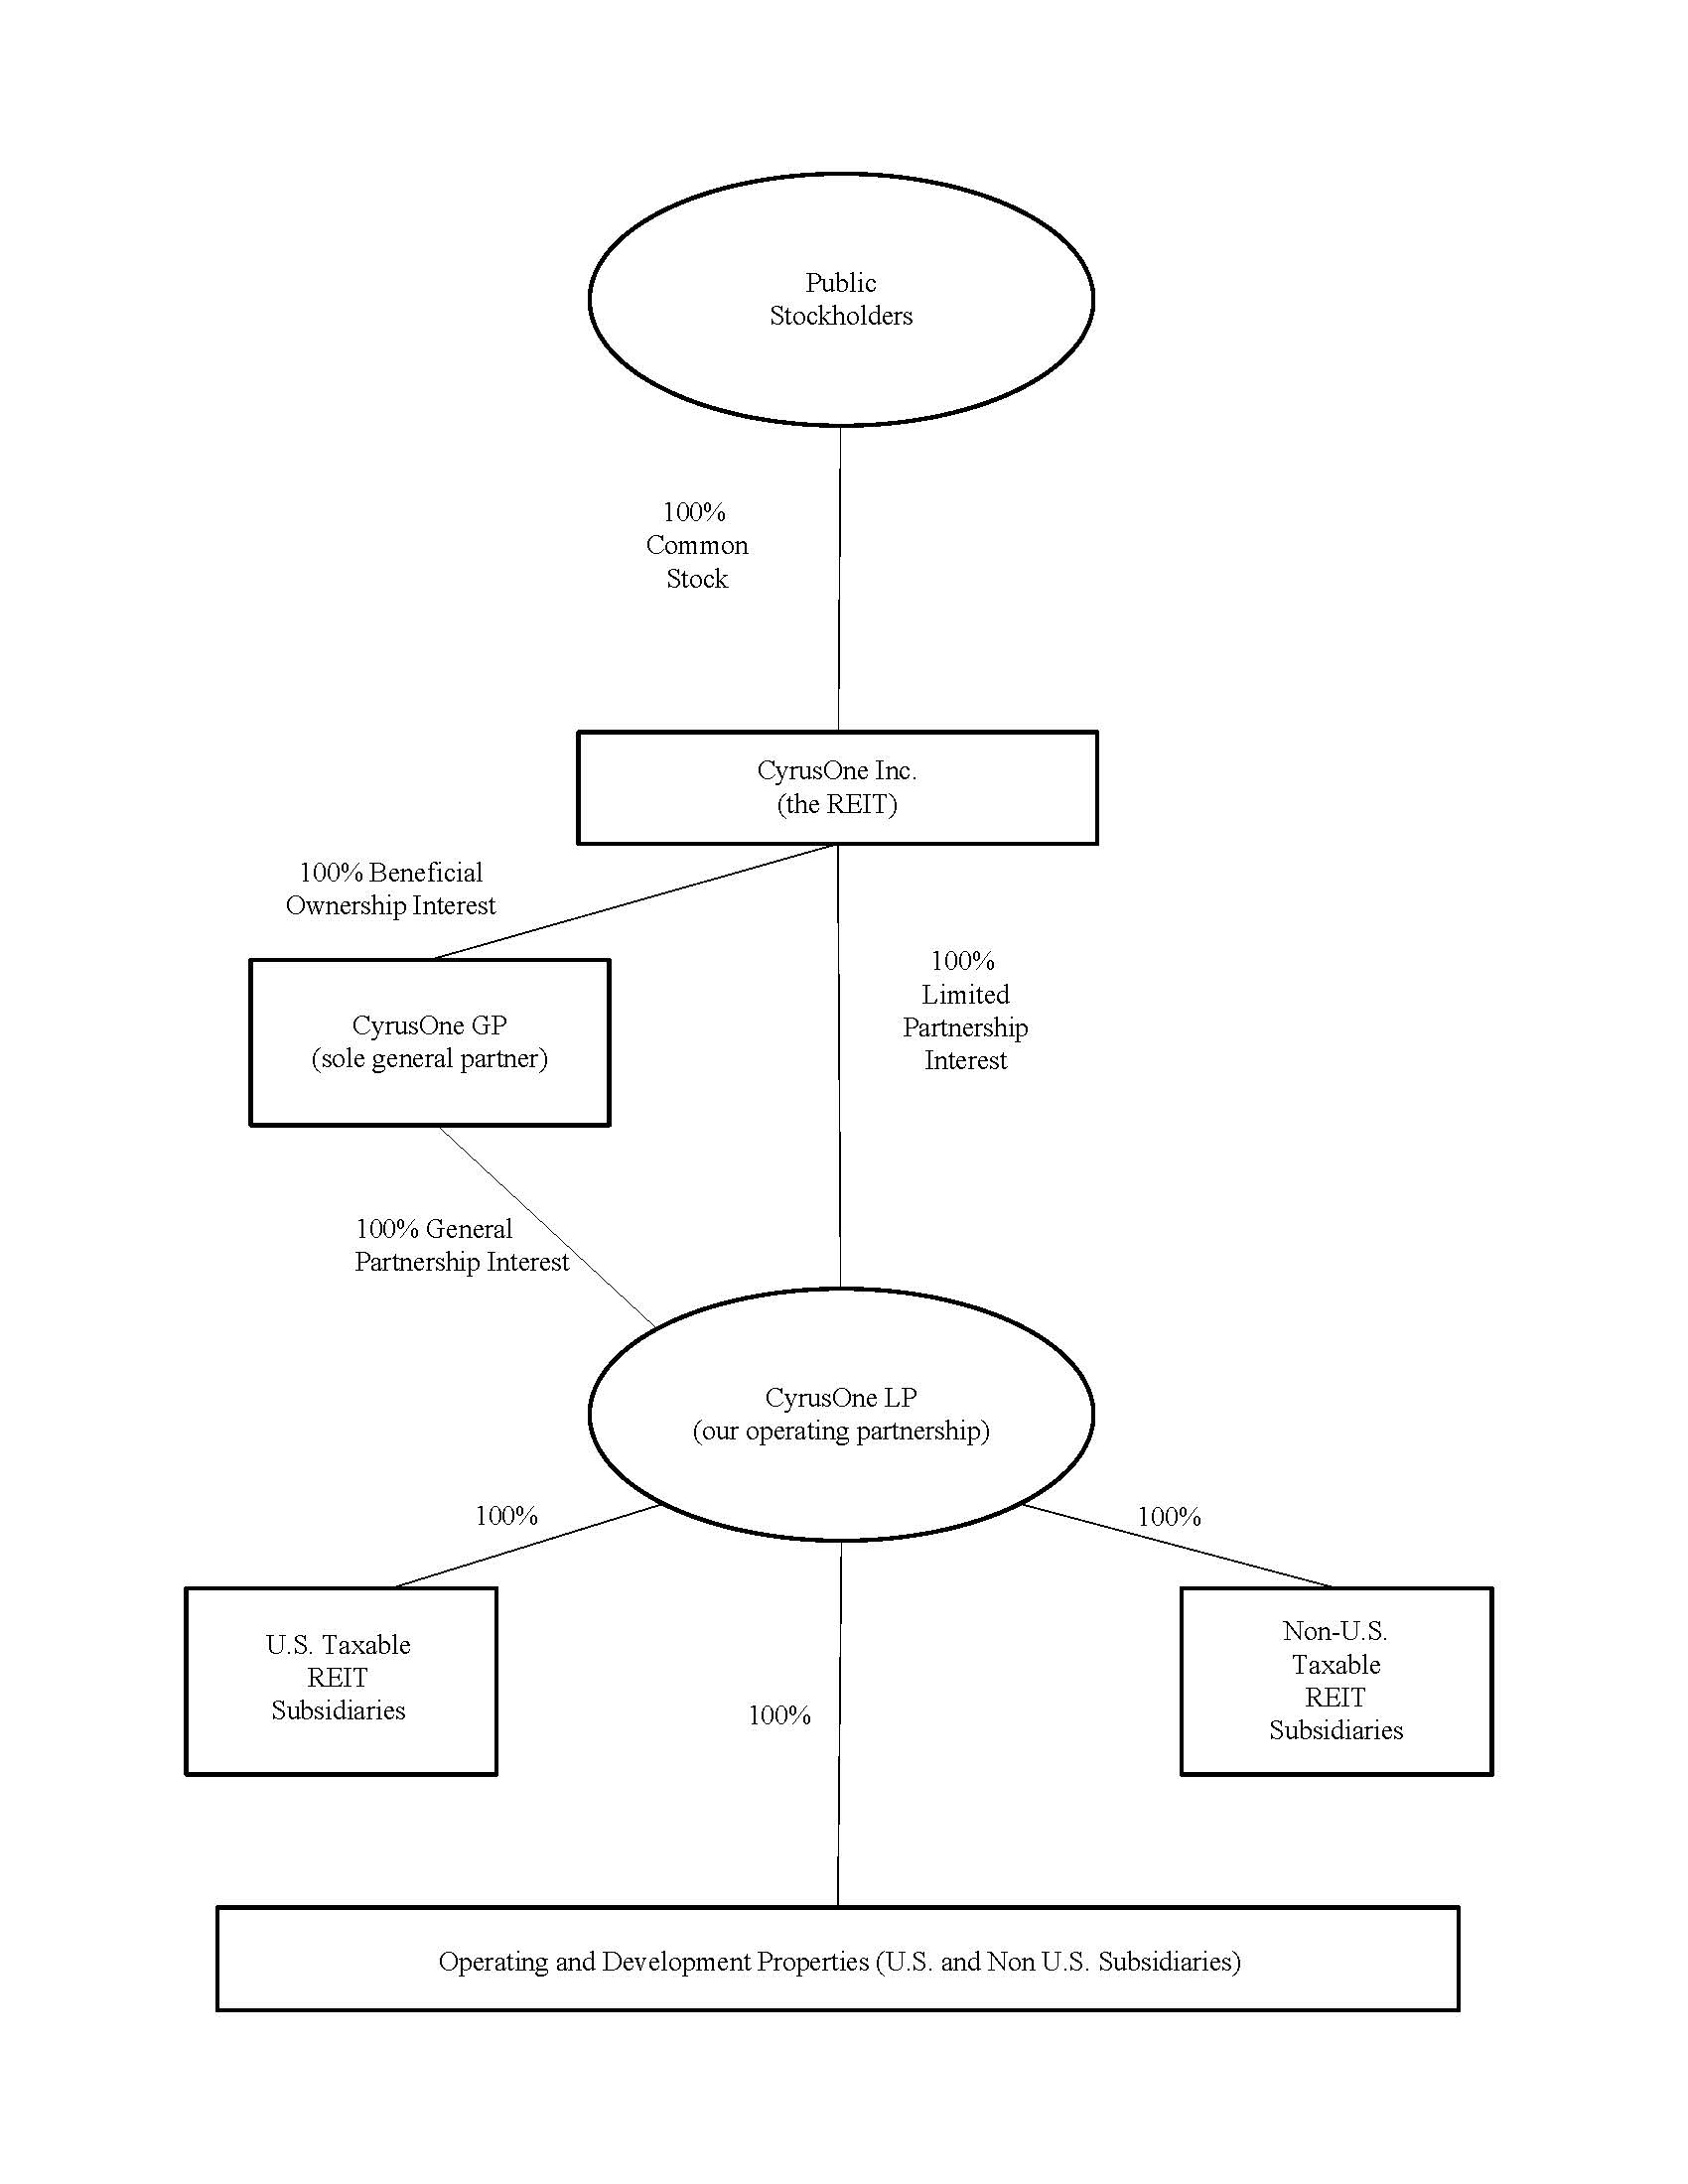
Unless otherwise indicated or unless the context requires otherwise, all references in this report to “we,” “us,” “our,” “our Company” or “the Company” refer to CyrusOne Inc., a Maryland corporation, together with its consolidated subsidiaries, including CyrusOne LP, a Maryland limited partnership. Unless otherwise indicated or unless the context requires otherwise, all references to “our operating partnership” or “the operating partnership” refer to CyrusOne LP together with its consolidated subsidiaries.
CyrusOne Inc. is a real estate investment trust (REIT) whose only material asset is its ownership of operating partnership units of CyrusOne LP. As a result, CyrusOne Inc. does not conduct business itself, other than acting as the sole beneficial owner and sole trustee of CyrusOne GP (the sole general partner of CyrusOne LP), a Maryland statutory trust, issuing public equity from time to time and guaranteeing certain debt of CyrusOne LP and certain of its subsidiaries. CyrusOne Inc. itself does not issue any indebtedness but guarantees the debt of CyrusOne LP and certain of its subsidiaries, as disclosed in this report. CyrusOne LP and its subsidiaries hold substantially all the assets of the Company. CyrusOne LP conducts the operations of the business, along with its subsidiaries, and is structured as a partnership with no publicly traded equity. Except for net proceeds from public equity issuances by CyrusOne Inc., which are generally contributed to CyrusOne LP in exchange for operating partnership units, CyrusOne LP generates the capital required for the Company's business through CyrusOne LP's operations and by CyrusOne LP's incurrence of indebtedness.
As of December 31, 2017, the total number of outstanding shares of common stock was approximately 96.1 million. CyrusOne Inc., directly or indirectly, owns all the operating partnership units of CyrusOne LP. As the direct or indirect owner of all the operating partnership units of CyrusOne LP and as sole beneficial owner and sole trustee of CyrusOne GP, which is the sole general partner of CyrusOne LP, CyrusOne Inc. has the full, exclusive and complete responsibility for the operating partnership's day-to-day management and control.
3
TABLE OF CONTENTS
PART I | ||
ITEM 1. | ||
ITEM 1A. | ||
ITEM 1B. | ||
ITEM 2. | ||
ITEM 3. | ||
ITEM 4. | ||
PART II | ||
ITEM 5. | ||
ITEM 6. | ||
ITEM 7. | ||
ITEM 7A. | ||
ITEM 8. | ||
ITEM 9. | ||
ITEM 9A. | ||
ITEM 9B. | ||
PART III | ||
ITEM 10. | ||
ITEM 11. | ||
ITEM 12. | ||
ITEM 13. | ||
ITEM 14. | ||
PART IV | ||
ITEM 15. | ||
4
SPECIAL NOTE REGARDING FORWARD-LOOKING STATEMENTS
We make statements in this Annual Report on Form 10-K that are forward-looking statements within the meaning of the federal securities laws. In particular, statements pertaining to our capital resources, portfolio performance and results of operations contain forward-looking statements. Likewise, all of our statements regarding anticipated growth in our funds from operations and anticipated market conditions, demographics and results of operations are forward-looking statements. You can identify forward-looking statements by the use of forward-looking terminology such as “believes,” “expects,” “may,” “will,” “should,” “seeks,” “approximately,” “intends,” “plans,” “estimates” or “anticipates” or the negative of these words and phrases or similar words or phrases that are predictions of or indicate future events or trends and that do not relate solely to historical matters. You can also identify forward-looking statements by discussions of strategy, plans or intentions.
Forward-looking statements involve numerous risks and uncertainties and you should not rely on them as predictions of future events. Forward-looking statements depend on assumptions, data or methods that may be incorrect or imprecise and we may not be able to realize them. The following factors, among others, could cause actual results and future events to differ materially from those set forth or contemplated in the forward-looking statements:
•loss of key customers;
•economic downturn, natural disaster or oversupply of data centers in the limited geographic areas that we serve;
•risks related to the development of our properties and our ability to successfully lease those properties;
•loss of access to key third-party service providers and suppliers;
•risks of loss of power or cooling which may interrupt our services to our customers;
•inability to identify and complete acquisitions and operate acquired properties, including the pending Zenium acquisition;
•our failure to obtain necessary outside financing on favorable terms, or at all;
•restrictions in the instruments governing our indebtedness;
•risks related to environmental matters;
•unknown or contingent liabilities related to our acquired properties;
•significant competition in our industry;
•loss of key personnel;
•risks associated with real estate assets and the industry;
• | failure to maintain our status as a REIT or to comply with the highly technical and complex REIT provisions of the Internal Revenue Code of 1986, as amended (the Code); |
•REIT distribution requirements could adversely affect our ability to execute our business plan;
•insufficient cash available for distribution to stockholders;
•future offerings of debt may adversely affect the market price of our common stock;
• | increases in market interest rates may drive potential investors to seek higher dividend yields and reduce demand for our common stock; |
•market price and volume of stock could be volatile;
•Our international activities are subject to special risks different from those faced by us in the United States;
•Any failure to comply with anti-corruption laws and regulations could have adverse effects on our business; and
•Legislative or other actions relating to taxes could have a negative effect on us.
While forward-looking statements reflect our good faith beliefs, they are not guarantees of future performance. We disclaim any obligation to publicly update or revise any forward-looking statement to reflect changes in underlying assumptions or factors of new information, data or methods, future events or other changes. For a further discussion of these and other factors that could impact our future results, performance or transactions, see the section entitled “Risk Factors.”
5
PART I
ITEM 1. BUSINESS
The Company
We are a premier data center real estate investment trust (REIT) that owns, operates and develops enterprise-class, carrier-neutral, multi-tenant and single-tenant data center properties. Our data centers are generally purpose-built facilities with redundant power and cooling. Our data centers are carrier-neutral, enabling our customers to connect to a range of telecommunication carriers. We provide mission-critical data center facilities that protect and ensure the continued operation of information technology (IT) infrastructure for nearly 1,000 customers in 45 data centers and 2 recovery centers in 12 distinct markets (10 in the U.S., plus London and Singapore). We provide twenty-four hours-a-day, seven-days-a-week security monitoring with customizable security features.
Recent Developments
On February 27, 2017, the Company effected a full physical early settlement of the previously announced forward sale agreements (the Forward Sale Agreements) entered into with Goldman, Sachs & Co. on August 10, 2016 relating to, in the aggregate, approximately 4.4 million shares of the Company’s common stock. Upon settlement, the Company issued and sold all such shares to Goldman, Sachs & Co., in its capacity as forward purchaser, in exchange for net proceeds of approximately $210.8 million, in accordance with the provisions of the Forward Sales Agreements. Such proceeds were used to finance, in part, the acquisition of the Sentinel Properties (as defined below).
On February 28, 2017, CyrusOne closed its acquisition of two data centers located in Somerset, New Jersey and Raleigh-Durham, North Carolina (the Sentinel Properties) from Sentinel Data Centers. The Company paid aggregate cash consideration of approximately $492.3 million in connection therewith, including transaction related costs of $1.5 million. The transaction was financed by the Company with proceeds from settlement of its forward equity sale described above and borrowings under its Revolving Credit Facility (as defined in Note 10).
On March 17, 2017, CyrusOne LP and CyrusOne Finance Corp. completed their offering of $500.0 million aggregate principal amount of 5.000% senior notes due 2024 (the Original 2024 Notes) and $300.0 million aggregate principal amount of 5.375% senior notes due 2027 (the Original 2027 Notes) in a private offering. The Company received proceeds of $791.2 million, net of underwriting costs of $8.8 million.
The Company used the net proceeds from the offering (i) to finance its repurchase and redemption of all of its outstanding 6.375% Senior Notes due 2022 (the 2022 Notes), of which $474.8 million in aggregate principal amount was outstanding, (ii) for the repayment of borrowings outstanding under the operating partnership’s Revolving Credit Facility and (iii) for the payment of related premiums, fees, discounts and expenses.
On June 16, 2017, CyrusOne LP entered into an amendment to its senior Second Amended and Restated Credit Agreement (as defined in Note 10) that increased the total commitments thereunder by $450.0 million to $2.0 billion and provided additional flexibility to pursue various initiatives, including joint ventures and international expansion. The amendment increased the size of the term loan maturing in January 2022 from $300.0 million to $650.0 million and expanded the Revolving Credit Facility (as defined in Note 10) by $100.0 million to $1.1 billion. Proceeds from the $350.0 million term loan increase were used to pay down borrowings under the Revolving Credit Facility. The existing $250.0 million term loan maturing in September 2021 remained unchanged. The amendment refreshes the amount available under the accordion feature of the Second Amended and Restated Credit Agreement to enable CyrusOne LP to increase the total loan commitments under the Second Amended and Restated Credit Agreement to up to $2.3 billion from time to time.
On October 18, 2017, CyrusOne announced the formation of a new strategic partnership with the execution of a commercial agreement with GDS Holdings Limited (GDS), a leading developer and operator of high-performance, large-scale data centers in China. Under this new partnership, CyrusOne and GDS expect to work together to market and cross-sell data center space and related services in both the United States and China.
In addition, CyrusOne purchased newly issued unregistered ordinary shares equivalent to 8.0 million American depository shares (ADS) of GDS at a price per ordinary share equivalent to $12.45 per ADS, a 4% discount to the October 17, 2017 closing price, for a total investment of $100.0 million. Each ADS is equivalent to eight ordinary GDS shares. CyrusOne President and Chief Executive Officer Gary Wojtaszek will join the GDS Board of Directors.
On November 3, 2017, CyrusOne LP and CyrusOne Finance Corp. completed their offering of $200.0 million aggregate principal amount of 5.000% senior notes due 2024 (the Additional 2024 Notes) and $200.0 million aggregate principal amount of 5.375% senior notes due 2027 (the Additional 2027 Notes) in a private offering. The Additional 2024 Notes have terms substantially identical to the Original 2024 Notes and the Additional 2027 Notes have terms substantially identical to the Original 2027 Notes. The Original 2024 Notes and the Additional 2024 Notes form a single class of securities, and the Original 2027 Notes and the Additional 2027 Notes form a single class of securities. The Company received proceeds of $416.1 million, net of underwriting costs of $4.4 million. The Original 2024 Notes and
6
the Additional 2024 Notes are referred to as the 2024 Notes and the Original 2027 Notes, and the Additional 2027 Notes are referred to as the 2027 Notes. In January 2018, the 2024 Notes and the 2027 Notes were registered with the SEC.
During the third quarter of 2017, the Board authorized the Company to enter into sales agreements pursuant to which the Company may issue and sell from time to time shares of its common stock having an aggregate sales price of up to $500 million (the 2017 At The Market (ATM) Stock Offering Program). The 2017 ATM Stock Offering program replaces a prior ATM stock offering program. As of December 31, 2017, the Company had approximately $200.0 million in remaining capacity under the 2017 ATM Stock Offering program available for future offerings of stock. For the year ended December 31, 2017, the Company sold approximately 8.4 million shares of its common stock under the ATM stock offering programs, generating net proceeds of approximately $493.7 million, net of sales commissions of $6.3 million.
On December 21, 2017, CyrusOne announced the execution of a definitive agreement with Quantum Strategic Partners Ltd. (Quantum), a private investment fund managed by Soros Fund Management LLC and certain other sellers named therein, to purchase Zenium Data Centers (Zenium), a leading hyperscale data center provider in Europe with four properties in London and Frankfurt, the continent’s two largest data center markets. The purchase price is expected to be approximately $442.0 million, excluding transaction-related expenses. CyrusOne has also agreed to reimburse Zenium for capital expenditures between signing and closing. The transaction is expected to close in the first half of 2018, subject to the fulfillment of customary closing conditions including applicable regulatory approvals.
Our total stock issuance for the year ended December 31, 2017 was $706.0 million which included $210.8 million under the forward sales agreements, $493.7 million under the ATM stock offering program and $1.5 million related to the employee stock purchase plans and stock options exercised.
7
The following diagram depicts our ownership structure as of December 31, 2017:
8
Our Business
We provide mission-critical data center real estate assets designed and operated to protect and ensure the continued operation of IT infrastructure for our customers. Our goal is to be the preferred global data center provider to Fortune 1000 companies, including the largest enterprises and providers of cloud services. As of December 31, 2017, our customers included 197 of the Fortune 1000, or private, or foreign enterprises of equivalent size. These 197 Fortune 1000 customers, or private or foreign enterprises of equivalent size, provided 72% of our annualized rent as of December 31, 2017. Additionally, as of December 31, 2017, our top 10 customers represented 41% of our annualized rent.
Data centers are highly specialized and secure real estate assets that serve as centralized repositories of server, storage and network equipment. They are designed to provide the space, power, cooling and network connectivity necessary to efficiently operate mission-critical IT equipment. Telecommunications carriers typically provide network access into a data center through optical fiber. The demand for data center infrastructure is being driven by many factors, but most importantly by significant growth in data as well as an increased demand for outsourcing. The market for third-party data center facilities includes, among other companies, established “traditional” enterprises that are web-enabling their applications and business processes, as well as cloud-centric companies with sophisticated technology requirements.
We cultivate long-term strategic relationships with our customers and provide them with solutions for their data center facilities and IT infrastructure requirements. Our offerings provide flexibility, reliability and security delivered through a tailored, customer service focused platform that is designed to foster long-term relationships. Our customers include those who have not historically outsourced their data center needs and are open to solutions that address their current and future needs. Our facilities are designed and constructed in a manner to allow us to offer flexibility in density and power resiliency, and the opportunity for expansion as our customers' needs grow. The CyrusOne National IX Platform delivers interconnection across states and between metro-enabled sites within the CyrusOne footprint and beyond. The platform enables high-performance, low-cost data transfer and accessibility for customers by uniting our data centers.
Our Competitive Strengths
Our ability to attract and retain the world’s largest customers is attributed to the following competitive strengths, which distinguish us from other data center operators and will enable us to continue to grow our operations.
High Quality Customer Base. The high quality of our assets, combined with our reputation for serving the needs of large enterprises, has enabled us to focus on the Fortune 1000 to build a quality customer base. We currently have nearly 1,000 customers from a broad spectrum of industries and serve nine of the top ten cloud companies. Our revenue is generated by a stable enterprise customer base, as evidenced by the fact that as of December 31, 2017, 72% of our annualized rent comes from the Fortune 1000, private or foreign enterprises of equivalent size. We serve a diversity of industries, including information technology, financial services, energy, oil and gas, mining, medical and consumer goods and services.
As of December 31, 2017, Microsoft Corporation represented 18% of our revenue.
Strategically Located Portfolio. Our portfolio is located in several domestic and international markets possessing attractive characteristics for enterprise-focused data center operations. We have domestic properties in six of the largest metropolitan areas in the U.S. (Chicago, Dallas, Houston, New York, Phoenix and San Antonio) and six of the largest metropolitan areas for Fortune 500 headquarters (Chicago, Cincinnati, Dallas, Houston, San Antonio and New York). We believe cities with large populations or a large number of corporate headquarters are likely to produce incremental demand for IT infrastructure. In addition, being located close to our current and potential customers provides chief information officers (CIOs) with additional confidence when outsourcing their data center infrastructure to us.
Modern, High Quality, Flexible Facilities. Our portfolio includes highly efficient, reliable facilities with flexibility to customize customer solutions and accessibility to hundreds of connectivity providers. To optimize the delivery of power, our properties include modern engineering technologies designed to minimize unnecessary power usage and, in our newest facilities, we are able to provide power utilization efficiency ratios that we believe to be among the best in the multi-tenant data center industry. Fortune 1000 CIOs are dividing their application stacks into various groups as some applications require 100% availability, while others may require significant power to support complex computing, or robust connectivity. Our facility design enables us to deliver different power densities and resiliencies to the same customer footprint, allowing customers to tailor solutions to meet their application needs. In addition, the National IX Platform provides access to hundreds of telecommunication and Internet carriers.
Massively Modular® Construction Methods. Our Massively Modular® data center design principles allow us to efficiently stage construction on a large scale and deliver critical power and colocation square feet (CSF) in a timeframe that we believe is one of the best in the industry. We acquire or build a large powered shell capable of scaling with our customers’ power and colocation space needs. The powered shell can be acquired or constructed for a relatively inexpensive capital cost. Once the building shell is ready, we can build individual data center halls in portions of the building space to meet the needs of customers on a modular basis. This modular data center hall construction can
9
be completed in 12 to 16 weeks to meet our customers’ immediate needs. This short construction timeframe ensures a very high utilization of the assets and minimizes the time between our capital investment and the receipt of customer revenue, favorably impacting our return on investment while also translating into lower costs for our customers. Our design principles also allow us to add incremental equipment to increase power densities as our customers’ power needs increase, which provides our customers with a significant amount of flexibility to manage their IT demands. We believe this Massively Modular® approach allows us to respond to rapidly evolving customer needs, to commit capital toward the highest return projects and to develop state-of-the-art data center facilities.
Significant Leasing Capability. Our focus on the customer, our ability to scale with their needs, and our operational excellence provide us with embedded future growth from our customer base. During 2017, we signed new leases representing $105.5 million in annualized revenue, with previously existing customers accounting for approximately 80% of this amount. Since December 31, 2016, we have increased our CSF by approximately 1,187,000 square feet or 57%, while maintaining a high percentage of CSF utilized of 83% and 85% as of December 31, 2017 and 2016, respectively.
Significant, Attractive Expansion Opportunities. As of December 31, 2017, we had 1,534,000 net rentable square feet (NRSF) of powered shell available for future development and approximately 343 acres of land that are available for future data center facility development. The powered shell available for future development in locations that are part of our domestic portfolio consist of approximately 487,000 NRSF in the Southwest (Texas and Phoenix), 579,000 NRSF in the Northeast (Raleigh-Durham, Northern Virginia and New York Metro) and 468,000 NRSF in the Midwest (Chicago and Cincinnati). Our current development properties and available acreage were selected based on extensive site selection criteria and the collective industry knowledge and experience of our management team with a focus on markets with a strong presence of and high demand by Fortune 1000 companies and providers of cloud services. As a result, we believe that our development portfolio contains properties that are located in markets with attractive supply and demand conditions and that possess suitable physical characteristics to support data center infrastructure.
Differentiated Reputation for Service. We believe that the decision CIOs make to outsource their data center infrastructure has material implications for their businesses, and, as such, CIOs look to third-party data center providers that have a reputation for serving similar organizations and that are able to deliver a customized solution. We take a consultative approach to understanding the unique requirements of our customers, and our design principles allow us to deliver a customized data center solution to match their needs. We believe that this approach has helped fuel our growth. Our current customers are also often the source of new contracts, with referrals being an important source of new customers.
Experienced Management Team. Our management team is comprised of individuals drawing on diverse knowledge and skill sets acquired through extensive experiences in the real estate, REITs, telecommunications, technology and mission-critical infrastructure industries.
Balance Sheet Positioned to Fund Continued Growth. As of December 31, 2017, we had $1,243.4 million in available liquidity, including $1,091.5 million in borrowing capacity under our Revolving Credit Facility. The Second Amended and Restated Credit Agreement also includes an accordion feature that allows us to increase the aggregate commitment by up to $300 million. We believe that we are appropriately capitalized with sufficient financial flexibility and capacity to fund our anticipated growth.
Experienced Sales Force with Robust Partner Channel. We have an experienced sales force with a particular expertise in selling to large enterprises and providers of cloud services, which can require extensive consultation and drive long sales cycles as these enterprises make the initial outsourcing decision. As of December 31, 2017, we had 48 sales-related employees. We believe the depth, knowledge, and experience of our sales team differentiates us from other data center companies, and we are not as dependent on brokers to identify and acquire customers as some other companies in the industry. To complement our direct sales efforts, we have developed a robust network of partners, including value added resellers, systems integrators and hosting providers.
Business and Growth Strategies
Our objective is to grow our revenue and earnings and maximize stockholder returns and cash flow by continuing to expand our data center infrastructure outsourcing business.
Increasing Revenue from Existing Customers and Properties. We have historically generated a significant portion of our revenue growth from our existing customers. We will continue to target our existing customers because we believe that many have significant data center infrastructure needs that have not yet been outsourced, and many will require additional data center space and power to support their growth and their increasing reliance on technology infrastructure in their operations. To address new demand, as of December 31, 2017, we have approximately 1,098,000 NRSF currently available for lease. We also have approximately 645,000 NRSF under development, as well as 1,534,000 NRSF of additional powered shell space under roof available for development.
Attracting and Retaining New Customers. Increasingly, enterprises are beginning to recognize the complexities of managing data center infrastructure in the midst of rapid technological development and innovation. We believe that these complexities, brought about by the rapidly increasing levels of Internet traffic and data, cloud adoption, obsolete existing corporate data center infrastructure, increased power and cooling requirements and increased regulatory requirements, are all driving the need for companies to outsource their data center
10
facility requirements. Consequently, this will significantly increase the percentage of companies that use third-party data center colocation services over the next several years. We believe that our high quality assets and reputation for serving cloud providers and large enterprises have been, and will be, key differentiators for us in attracting customers that are outsourcing their data center infrastructure needs.
We acquire customers through a variety of channels. We have historically managed our sales process through a direct-to-the-customer model but are now also utilizing third-party leasing agents and indirect leasing channels to expand our universe of potential new customers. Over the past few years, we have developed a robust network of partners in our indirect leasing channels, including value added resellers, systems integrators and hosting providers. These channels, in combination with our marketing strategies, have enabled us to build both a strong brand and outreach program to new customers. Throughout the life cycle of a customer’s lease with us, we maintain a disciplined approach to monitoring their experience, with the goal of providing the highest level of customer service. This personal attention fosters a strong relationship and trust with our customers, which leads to future growth and leasing renewals.
Expanding into New Markets. Our expansion strategy focuses on acquiring and developing new data centers, both domestically and internationally, in markets where our customers are located and in markets with a strong presence of and high demand by Fortune 1000 customers and providers of cloud services. We conduct extensive analysis to ensure an identified market displays strong data center fundamentals, independent of the demand presented by any particular customer. In addition, we consider markets where our existing customers want us to be located. We regularly meet with our customers to understand their business strategies and potential data center needs. We believe that this approach, combined with our Massively Modular® construction design, reduces the risk associated with expansion into new markets because it provides strong visibility into our leasing opportunities and helps to ensure targeted returns on new developments. When considering a new market, we take a disciplined approach in evaluating potential business, property and site acquisitions, including a site’s geographic attributes, availability of telecommunications and connectivity providers, access to power, and expected costs for development.
Growing Interconnection Business. In April 2013, we launched the National IX Platform, delivering interconnection across states and between metro-enabled sites within the CyrusOne facility footprint and beyond. The platform enables high-performance, low-cost data transfer and accessibility for customers seeking to connect between CyrusOne facilities, from CyrusOne to their own private data center facility, or with one another via private peering, cross connects and/or public switching environments. Interconnection within a facility or on the National IX Platform allows our customers to share information and conduct commerce in a highly efficient manner not requiring a third-party intermediary, and at a fraction of the cost normally required to establish such a connection between two enterprises. The demand for interconnection creates additional rental and revenue growth opportunities for us, and we believe that customer interconnections increase our likelihood of customer retention by providing an environment not easily replicated by competitors. We act as a trusted neutral party that enterprises, carriers and content companies utilize to connect to each other. In 2014, we became the first colocation provider in North America to receive multi-site certification from the Open-IX Association, a non-profit industry group formed to promote better standards for data center interconnection and Internet Exchanges in North America.
Our Portfolio
As of December 31, 2017, our property portfolio included 45 data centers and 2 recovery centers in 12 distinct markets (10 in the U.S., plus London and Singapore) collectively providing approximately 5,717,000 net rentable square feet and powered by approximately 540 megawatts (MW) of available critical load capacity. Since December 31, 2016, the NRSF increased by 1,813,000. These increases were in San Antonio 248,000, Northern Virginia 519,000, New York Metro 213,000, Raleigh-Durham 167,000, Phoenix 373,000 and the remaining properties accounted for the balance. We own 33 of the buildings in which our data center facilities are located. We lease the remaining 14 buildings, which account for approximately 652,000 NRSF, or approximately 11% of our total operating NRSF. These leased buildings accounted for 18% of our total annualized rent as of December 31, 2017. We also had approximately 645,000 NRSF under development, as well as an aggregate of approximately 1,534,000 NRSF of additional powered shell space under roof available for development. In addition, we have approximately 343 acres of land that are available for future data center shell development. Along with our primary product offering, leasing of colocation space, certain of our customers are also interested in ancillary office and other space. We believe our existing operating portfolio and development pipeline will allow us to meet the evolving needs of our existing customers and continue to attract new customers. The following tables provide an overview of our operating and development properties as of December 31, 2017.
11
CyrusOne Inc.
Data Center Portfolio
As of December 31, 2017
(unaudited)
Operating Net Rentable Square Feet (NRSF)(a) | Powered Shell Available for Future Development (NRSF)(k) | Available Critical Load Capacity (MW)(l) | ||||||||||||||||||||
Stabilized Properties(b) | Metro Area | Annualized Rent(c) | Colocation Space (CSF)(d) | CSF Leased(e) | CSF Utilized(f) | Office & Other(g) | Office & Other Leased (h) | Supporting Infrastructure(i) | Total(j) | |||||||||||||
Dallas - Carrollton | Dallas | $ | 67,585,708 | 304,622 | 89 | % | 89 | % | 64,973 | 62 | % | 111,406 | 481,001 | 16,000 | 38 | |||||||
Houston - Houston West I | Houston | 42,497,450 | 112,133 | 96 | % | 97 | % | 11,343 | 99 | % | 37,244 | 160,720 | 3,000 | 28 | ||||||||
Cincinnati - 7th Street** | Cincinnati | 36,405,768 | 196,696 | 92 | % | 92 | % | 5,744 | 100 | % | 175,148 | 377,588 | 46,000 | 16 | ||||||||
Dallas - Lewisville* | Dallas | 36,257,388 | 114,054 | 94 | % | 94 | % | 11,374 | 95 | % | 54,122 | 179,550 | — | 21 | ||||||||
Northern Virginia - Sterling II | Northern Virginia | 30,309,953 | 158,998 | 100 | % | 100 | % | 8,651 | 100 | % | 55,306 | 222,955 | — | 30 | ||||||||
Somerset I | New York Metro | 28,531,926 | 96,918 | 88 | % | 88 | % | 26,613 | 85 | % | 88,991 | 212,522 | 2,000 | 11 | ||||||||
Chicago - Aurora I | Chicago | 27,652,512 | 113,032 | 96 | % | 96 | % | 34,008 | 100 | % | 223,478 | 370,518 | 27,000 | 71 | ||||||||
Totowa - Madison* | New York Metro | 25,970,252 | 51,290 | 89 | % | 89 | % | 22,477 | 100 | % | 58,964 | 132,731 | — | 6 | ||||||||
Cincinnati - North Cincinnati | Cincinnati | 25,398,959 | 65,303 | 97 | % | 97 | % | 44,886 | 75 | % | 52,950 | 163,139 | 65,000 | 14 | ||||||||
San Antonio III | San Antonio | 24,337,608 | 131,767 | 100 | % | 100 | % | 9,309 | 100 | % | 43,126 | 184,202 | — | 24 | ||||||||
Houston - Houston West II | Houston | 23,301,914 | 79,540 | 87 | % | 87 | % | 4,355 | 88 | % | 55,042 | 138,937 | 11,000 | 12 | ||||||||
Wappingers Falls I* | New York Metro | 22,968,754 | 37,000 | 86 | % | 86 | % | 20,167 | 97 | % | 15,077 | 72,244 | — | 3 | ||||||||
San Antonio I | San Antonio | 21,042,190 | 43,891 | 100 | % | 100 | % | 5,989 | 83 | % | 45,650 | 95,530 | 11,000 | 12 | ||||||||
Phoenix - Chandler II | Phoenix | 19,884,192 | 74,082 | 100 | % | 100 | % | 5,639 | 38 | % | 25,519 | 105,240 | — | 12 | ||||||||
Northern Virginia - Sterling I | Northern Virginia | 17,291,618 | 77,961 | 100 | % | 100 | % | 5,618 | 77 | % | 48,598 | 132,177 | — | 12 | ||||||||
Raleigh-Durham I | Raleigh-Durham | 17,078,401 | 75,664 | 88 | % | 88 | % | 9,507 | 100 | % | 82,119 | 167,290 | 246,000 | 12 | ||||||||
Houston - Galleria | Houston | 16,864,199 | 63,469 | 61 | % | 61 | % | 23,259 | 51 | % | 24,927 | 111,655 | — | 14 | ||||||||
Phoenix - Chandler I | Phoenix | 16,783,940 | 74,041 | 100 | % | 100 | % | 34,582 | 12 | % | 38,452 | 147,075 | 31,000 | 16 | ||||||||
Phoenix - Chandler III | Phoenix | 16,596,885 | 67,937 | 100 | % | 100 | % | 2,440 | — | % | 30,415 | 100,792 | — | 14 | ||||||||
Northern Virginia - Sterling III | Northern Virginia | 15,218,979 | 79,122 | 100 | % | 100 | % | 7,264 | 100 | % | 33,603 | 119,989 | — | 15 | ||||||||
Austin II | Austin | 13,666,086 | 43,772 | 95 | % | 95 | % | 1,821 | 100 | % | 22,433 | 68,026 | — | 5 | ||||||||
San Antonio II | San Antonio | 13,569,018 | 64,221 | 100 | % | 100 | % | 11,255 | 100 | % | 41,127 | 116,603 | — | 12 | ||||||||
Florence | Cincinnati | 13,361,160 | 52,698 | 99 | % | 99 | % | 46,848 | 87 | % | 40,374 | 139,920 | — | 9 | ||||||||
Phoenix - Chandler IV | Phoenix | 11,264,335 | 73,433 | 100 | % | 100 | % | 3,039 | 100 | % | 26,533 | 103,005 | — | 12 | ||||||||
Cincinnati - Hamilton* | Cincinnati | 9,073,368 | 46,565 | 76 | % | 76 | % | 1,077 | 100 | % | 35,336 | 82,978 | — | 10 | ||||||||
London - Great Bridgewater* | International | 5,680,892 | 10,000 | 94 | % | 94 | % | — | — | % | 514 | 10,514 | — | 1 | ||||||||
Northern Virginia - Sterling IV | Northern Virginia | 5,439,076 | 81,291 | 100 | % | 100 | % | 5,523 | 100 | % | 34,322 | 121,136 | — | 15 | ||||||||
Cincinnati - Mason | Cincinnati | 5,394,151 | 34,072 | 100 | % | 100 | % | 26,458 | 98 | % | 17,193 | 77,723 | — | 4 | ||||||||
Dallas - Midway* | Dallas | 5,356,920 | 8,390 | 100 | % | 100 | % | — | — | % | — | 8,390 | — | 1 | ||||||||
Phoenix - Chandler VI | Phoenix | 5,274,000 | 148,434 | 58 | % | 94 | % | 1,000 | 100 | % | 32,037 | 181,471 | 10,000 | 12 | ||||||||
Stamford - Riverbend* | New York Metro | 5,150,002 | 20,000 | 23 | % | 23 | % | — | — | % | 8,484 | 28,484 | — | 2 | ||||||||
Norwalk I* | New York Metro | 3,766,807 | 13,240 | 88 | % | 92 | % | 4,085 | 72 | % | 40,610 | 57,935 | 87,000 | 2 | ||||||||
Dallas - Marsh* | Dallas | 2,600,005 | 4,245 | 100 | % | 100 | % | — | — | % | — | 4,245 | — | 1 | ||||||||
Chicago - Lombard | Chicago | 2,274,283 | 13,516 | 61 | % | 61 | % | 4,115 | 100 | % | 12,230 | 29,861 | 29,000 | 3 | ||||||||
Stamford - Omega* | New York Metro | 1,233,557 | — | — | % | — | % | 18,552 | 84 | % | 3,796 | 22,348 | — | — | ||||||||
Totowa - Commerce* | New York Metro | 691,429 | — | — | % | — | % | 20,460 | 43 | % | 5,540 | 26,000 | — | — | ||||||||
Cincinnati - Blue Ash* | Cincinnati | 616,664 | 6,193 | 36 | % | 36 | % | 6,821 | 100 | % | 2,165 | 15,179 | — | 1 | ||||||||
South Bend - Crescent* | Chicago | 576,976 | 3,432 | 43 | % | 43 | % | — | — | % | 5,125 | 8,557 | 11,000 | 1 | ||||||||
Houston - Houston West III | Houston | 493,602 | — | — | % | — | % | 10,272 | 100 | % | 10,654 | 20,926 | 209,000 | — | ||||||||
Singapore - Inter Business Park* | International | 365,132 | 3,200 | 22 | % | 22 | % | — | — | % | — | 3,200 | — | 1 | ||||||||
South Bend - Monroe | Chicago | 119,741 | 6,350 | 23 | % | 23 | % | — | — | % | 6,478 | 12,828 | 4,000 | 1 | ||||||||
Cincinnati - Goldcoast | Cincinnati | 96,090 | 2,728 | — | % | — | % | 5,280 | — | % | 16,481 | 24,489 | 14,000 | 1 | ||||||||
Stabilized Properties - Total | $ | 638,041,890 | 2,653,300 | 91 | % | 93 | % | 524,804 | 77 | % | 1,661,569 | 4,839,673 | 822,000 | 470 | ||||||||
12
CyrusOne Inc. | ||||||||||||||||||||||
Data Center Portfolio | ||||||||||||||||||||||
As of December 31, 2017 | ||||||||||||||||||||||
(Unaudited) | ||||||||||||||||||||||
Operating Net Rentable Square Feet (NRSF)(a) | Powered Shell Available for Future Development (NRSF)(k) | Available Critical Load Capacity (MW)(l) | ||||||||||||||||||||
Metro Area | Annualized Rent(c) | Colocation Space (CSF)(d) | CSF Leased(e) | CSF Utilized(f) | Office & Other(g) | Office & Other Leased (h) | Supporting Infrastructure(i) | Total(j) | ||||||||||||||
Stabilized Properties - Total | $ | 638,041,890 | 2,653,300 | 91 | % | 93 | % | 524,804 | 77 | % | 1,661,569 | 4,839,673 | 822,000 | 470 | ||||||||
Pre-Stabilized Properties(b) | ||||||||||||||||||||||
Austin III | Austin | 9,488,450 | 61,838 | 47 | % | 47 | % | 15,055 | 83 | % | 20,629 | 97,522 | 67,000 | 3 | ||||||||
Northern Virginia - Sterling V | Northern Virginia | 8,874,654 | 242,730 | 41 | % | 44 | % | 900 | — | % | 112,662 | 356,292 | 244,000 | 30 | ||||||||
Houston - Houston West III (DH #1) | Houston | 2,756,377 | 52,932 | 22 | % | 24 | % | — | — | % | 21,128 | 74,060 | — | 6 | ||||||||
Dallas - Carrollton (DH #6) | Dallas | 1,579,500 | 74,865 | 33 | % | 51 | % | — | — | % | 21,224 | 96,089 | — | 3 | ||||||||
Phoenix - Chandler V | Phoenix | 1,505,032 | 71,515 | 50 | % | 50 | % | 996 | 50 | % | 16,399 | 88,910 | 94,000 | 6 | ||||||||
Chicago - Aurora II (DH #1) | Chicago | 175,668 | 76,665 | 21 | % | 21 | % | 10,045 | — | % | 13,875 | 100,585 | 272,000 | 16 | ||||||||
San Antonio IV | San Antonio | — | 32,802 | — | % | — | % | 3,577 | — | % | 27,191 | 63,570 | 35,000 | 6 | ||||||||
All Properties - Total | $ | 662,421,571 | 3,266,647 | 80 | % | 83 | % | 555,377 | 75 | % | 1,894,677 | 5,716,701 | 1,534,000 | 540 | ||||||||
* | Indicates properties in which we hold a leasehold interest. |
** | The information provided for the Cincinnati - 7th Street property includes data for two facilities, one of which we lease and one of which we own. |
(a) | Represents the total square feet of a building under lease or available for lease based on engineers' drawings and estimates but does not include space held for development or space used by CyrusOne. |
(b) | Stabilized properties include data halls that have been in service for at least 24 months or are at least 85% utilized. Pre-stabilized properties include data halls that have been in service for less than 24 months and are less than 85% utilized. |
(c) | Represents monthly contractual rent (defined as cash rent including customer reimbursements for metered power) under existing customer leases as of December 31, 2017, multiplied by 12. For the month of December 2017, customer reimbursements were $67.8 million annualized and consisted of reimbursements by customers across all facilities with separately metered power. Customer reimbursements under leases with separately metered power vary from month-to-month based on factors such as our customers' utilization of power and the suppliers' pricing of power. From January 1, 2016 through December 31, 2017, customer reimbursements under leases with separately metered power constituted between 10.2% and 12.6% of annualized rent. |
(d) | CSF represents the NRSF at an operating facility that is currently leased or readily available for lease as colocation space, where customers locate their servers and other IT equipment. |
(e) | Percent leased is determined based on CSF being billed to customers under signed leases as of December 31, 2017 divided by total CSF. Leases signed but not commenced as of December 31, 2017 are not included. |
(f) | Utilization is calculated by dividing CSF under signed leases for colocation space (whether or not the lease has commenced billing) by total CSF. |
(g) | Represents the NRSF at an operating facility that is currently leased or readily available for lease as space other than CSF, which is typically office and other space. |
(h) | Percent leased is determined based on Office & Other space being billed to customers under signed leases as of December 31, 2017 divided by total Office & Other space. Leases signed but not commenced as of December 31, 2017 are not included. |
(i) | Represents infrastructure support space, including mechanical, telecommunications and utility rooms, as well as building common areas. |
(j) | Represents the NRSF at an operating facility that is currently leased or readily available for lease. This excludes existing vacant space held for development. |
(k) | Represents space that is under roof that could be developed in the future for operating NRSF, rounded to the nearest 1,000. |
(l) | Critical load capacity represents the aggregate power available for lease and exclusive use by customers expressed in terms of megawatts. The capacity reported is for non-redundant megawatts, as we can develop flexible solutions to our customers at multiple resiliency levels. Does not sum to total due to rounding. |
13
CyrusOne Inc.
NRSF Under Development
As of December 31, 2017
(Dollars in millions)
(unaudited)
NRSF Under Development (a) | Under Development Costs(b) | ||||||||||||||||||
Facilities | Metropolitan Area | Estimated Completion Date | Colocation Space (CSF) | Office & Other | Supporting Infrastructure | Powered Shell(b) | Total | Critical Load MW Capacity(c) | Actual to Date(d) | Estimated Costs to Completion(e) | Total | ||||||||
Austin III | Austin | 1Q'18 | — | — | — | — | — | 3 | $ | 5 | $6-8 | $11-13 | |||||||
Somerset II | New York Metro | 1Q'18 | — | — | — | 210,000 | 210,000 | — | 15 | 9-10 | 24-25 | ||||||||
Northern Virginia - Sterling V | Northern Virginia | 1Q'18 | 33,000 | — | 8,000 | — | 41,000 | 3 | 5 | 17-19 | 22-24 | ||||||||
Phoenix - Chandler VI | Phoenix | 1Q'18 | — | — | — | — | — | 12 | 17 | 10-16 | 27-33 | ||||||||
Dallas - Carrollton | Dallas | 2Q'18 | 51,000 | — | 2,000 | — | 53,000 | 15 | 4 | 49-55 | 53-59 | ||||||||
Dallas - Allen | Dallas | 2Q'18 | 79,000 | 27,000 | 60,000 | 175,000 | 341,000 | 6 | 5 | 53-59 | 58-64 | ||||||||
Total | 163,000 | 27,000 | 70,000 | 385,000 | 645,000 | 39 | $ | 51 | $144-167 | $195-218 | |||||||||
(a) | Represents NRSF at a facility for which activities have commenced or are expected to commence in the next 2 quarters to prepare the space for its intended use. Estimates and timing are subject to change. |
(b) | Represents NRSF under construction that, upon completion, will be powered shell available for future development into operating NRSF. |
(c) | Critical load capacity represents the aggregate power available for lease and exclusive use by customers expressed in terms of megawatts. The capacity reported is for non-redundant megawatts, as we can develop flexible solutions to our customers at multiple resiliency levels. |
(d) | Actual to date is the cash investment as of December 31, 2017. There may be accruals above this amount for work completed, for which cash has not yet been paid. |
(e) | Represents management’s estimate of the total costs required to complete the current NRSF under development. There may be an increase in costs if customers require greater power density. |
14
Customer Diversification
Our portfolio is currently leased to approximately 1,000 customers, many of which are leading global companies. The following table sets forth information regarding the 20 largest customers, including their affiliates, in our portfolio based on annualized rent as of December 31, 2017:
CyrusOne Inc.
Customer Diversification(a)
As of December 31, 2017
(unaudited)
Principal Customer Industry | Number of Locations | Annualized Rent(b) | Percentage of Portfolio Annualized Rent(c) | Weighted Average Remaining Lease Term in Months(d) | |||||
1 | Information Technology | 9 | $ | 118,237,061 | 17.8 | % | 93.0 | ||
2 | Information Technology | 9 | 26,994,022 | 4.1 | % | 46.9 | |||
3 | Information Technology | 4 | 25,234,226 | 3.8 | % | 86.7 | |||
4 | Financial Services | 1 | 19,754,228 | 3.0 | % | 159.0 | |||
5 | Telecommunication Services | 2 | 15,742,896 | 2.4 | % | 9.4 | |||
6 | Research and Consulting Services | 3 | 15,124,425 | 2.3 | % | 36.4 | |||
7 | Healthcare | 2 | 14,612,770 | 2.2 | % | 120.0 | |||
8 | Energy | 5 | 13,574,772 | 2.0 | % | 8.2 | |||
9 | Energy | 1 | 12,611,653 | 1.9 | % | 26.5 | |||
10 | Industrials | 4 | 11,224,802 | 1.7 | % | 20.4 | |||
11 | Telecommunication Services | 7 | 10,177,171 | 1.5 | % | 35.9 | |||
12 | Financial Services | 2 | 9,038,727 | 1.4 | % | 68.2 | |||
13 | Information Technology | 4 | 8,762,775 | 1.3 | % | 55.7 | |||
14 | Information Technology | 2 | 7,383,843 | 1.1 | % | 75.1 | |||
15 | Information Technology | 3 | 6,806,882 | 1.0 | % | 120.4 | |||
16 | Energy | 2 | 6,624,678 | 1.0 | % | 7.9 | |||
17 | Financial Services | 1 | 6,600,225 | 1.0 | % | 29.0 | |||
18 | Consumer Staples | 4 | 6,309,460 | 1.0 | % | 38.5 | |||
19 | Telecommunication Services | 5 | 5,885,604 | 0.9 | % | 16.1 | |||
20 | Consumer Staples | 2 | 5,216,417 | 0.8 | % | 51.5 | |||
$ | 345,916,637 | 52.2 | % | 70.6 | |||||
(a) | Customers and their affiliates are consolidated. |
(b) | Represents monthly contractual rent (defined as cash rent including customer reimbursements for metered power) under existing customer leases as of December 31, 2017, multiplied by 12. For the month of December 2017, customer reimbursements were $67.8 million annualized and consisted of reimbursements by customers across all facilities with separately metered power. Customer reimbursements under leases with separately metered power vary from month-to-month based on factors such as our customers' utilization of power and the suppliers' pricing of power. From January 1, 2016 through December 31, 2017, customer reimbursements under leases with separately metered power constituted between 10.2% and 12.6% of annualized rent. |
(c) | Represents the customer’s total annualized rent divided by the total annualized rent in the portfolio as of December 31, 2017, which was approximately $662.4 million. |
(d) | Weighted average based on customer’s percentage of total annualized rent expiring and is as of December 31, 2017, assuming that customers exercise no renewal options and exercise all early termination rights that require payment of less than 50% of the remaining rents. Early termination rights that require payment of 50% or more of the remaining lease payments are not assumed to be exercised because such payments approximate the profitability margin of leasing that space to the customer, such that we do not consider early termination to be economically detrimental to us. |
15
Lease Distribution
The following table sets forth information relating to the distribution of customer leases in the properties in our portfolio, based on NRSF under lease as of December 31, 2017:
CyrusOne Inc.
Lease Distribution
As of December 31, 2017
(unaudited)
NRSF Under Lease(a) | Number of Customers(b) | Percentage of All Customers | Total Leased NRSF(c) | Percentage of Portfolio Leased NRSF | Annualized Rent(d) | Percentage of Annualized Rent | |||||||
0-999 | 685 | 70 | % | 148,208 | 3 | % | $ | 70,402,796 | 11 | % | |||
1,000-2,499 | 118 | 12 | % | 185,717 | 4 | % | 37,259,253 | 5 | % | ||||
2,500-4,999 | 67 | 7 | % | 234,626 | 5 | % | 45,074,048 | 7 | % | ||||
5,000-9,999 | 44 | 4 | % | 306,553 | 7 | % | 60,282,199 | 9 | % | ||||
10,000+ | 74 | 7 | % | 3,744,050 | 81 | % | 449,403,275 | 68 | % | ||||
Total | 988 | 100 | % | 4,619,154 | 100 | % | $ | 662,421,571 | 100 | % | |||
(a) | Represents all leases in our portfolio, including colocation, office and other leases. |
(b) | Represents the number of customers occupying data center, office and other space as of December 31, 2017. This may vary from total customer count as some customers may be under contract, but have yet to occupy space. |
(c) | Represents the total square feet at a facility under lease and that has commenced billing, excluding space held for development or space used by CyrusOne. A customer’s leased NRSF is estimated based on such customer’s direct CSF or office and light-industrial space plus management’s estimate of infrastructure support space, including mechanical, telecommunications and utility rooms, as well as building common areas. |
(d) | Represents monthly contractual rent (defined as cash rent including customer reimbursements for metered power) under existing customer leases as of December 31, 2017, multiplied by 12. For the month of December 2017, customer reimbursements were $67.8 million annualized and consisted of reimbursements by customers across all facilities with separately metered power. Customer reimbursements under leases with separately metered power vary from month-to-month based on factors such as our customers' utilization of power and the suppliers' pricing of power. From January 1, 2016 through December 31, 2017, customer reimbursements under leases with separately metered power constituted between 10.2% and 12.6% of annualized rent. |
16
Lease Expiration
The following table sets forth a summary schedule of the customer lease expirations for leases in place as of December 31, 2017, plus available space, for each of the 10 full calendar years beginning January 1, 2018, at the properties in our portfolio.
CyrusOne Inc.
Lease Expirations
As of December 31, 2017
(unaudited)
Year(a) | Number of Leases Expiring(b) | Total Operating NRSF Expiring | Percentage of Total NRSF | Annualized Rent(c) | Percentage of Annualized Rent | Annualized Rent at Expiration(d) | Percentage of Annualized Rent at Expiration | |||||||||
Available | 1,097,547 | 18 | % | |||||||||||||
Month-to-Month | 555 | 56,214 | 1 | % | $ | 17,836,114 | 3 | % | $ | 18,047,234 | 2 | % | ||||
2018 | 2,249 | 554,759 | 10 | % | 133,521,351 | 20 | % | 136,908,269 | 18 | % | ||||||
2019 | 1,352 | 485,080 | 9 | % | 83,799,237 | 12 | % | 86,330,774 | 12 | % | ||||||
2020 | 1,314 | 483,807 | 9 | % | 64,655,451 | 10 | % | 67,967,365 | 9 | % | ||||||
2021 | 607 | 499,613 | 9 | % | 78,682,720 | 12 | % | 89,013,555 | 12 | % | ||||||
2022 | 222 | 538,570 | 9 | % | 45,783,999 | 7 | % | 62,049,815 | 8 | % | ||||||
2023 | 78 | 162,285 | 3 | % | 19,934,650 | 3 | % | 27,242,178 | 4 | % | ||||||
2024 | 39 | 223,937 | 4 | % | 30,482,675 | 5 | % | 39,275,747 | 5 | % | ||||||
2025 | 39 | 178,710 | 3 | % | 26,985,449 | 4 | % | 31,523,317 | 4 | % | ||||||
2026 | 26 | 577,649 | 10 | % | 74,754,446 | 11 | % | 81,745,331 | 11 | % | ||||||
2027 | 16 | 396,494 | 7 | % | 45,812,150 | 7 | % | 59,126,790 | 8 | % | ||||||
2028 - Thereafter | 14 | 462,036 | 8 | % | 40,173,329 | 6 | % | 49,029,966 | 7 | % | ||||||
Total | 6,511 | 5,716,701 | 100 | % | $ | 662,421,571 | 100 | % | $ | 748,260,341 | 100 | % | ||||
(a) | Leases that were auto-renewed prior to December 31, 2017 are shown in the calendar year in which their current auto-renewed term expires. Unless otherwise stated in the footnotes, the information set forth in the table assumes that customers exercise no renewal options and exercise all early termination rights that require payment of less than 50% of the remaining rents. Early termination rights that require payment of 50% or more of the remaining lease payments are not assumed to be exercised. |
(b) | Number of leases represents each agreement with a customer. A lease agreement could include multiple spaces and a customer could have multiple leases. |
(c) | Represents monthly contractual rent (defined as cash rent including customer reimbursements for metered power) under existing customer leases as of December 31, 2017, multiplied by 12. For the month of December 2017, customer reimbursements were $67.8 million annualized and consisted of reimbursements by customers across all facilities with separately metered power. Customer reimbursements under leases with separately metered power vary from month-to-month based on factors such as our customers' utilization of power and the suppliers' pricing of power. From January 1, 2016 through December 31, 2017, customer reimbursements under leases with separately metered power constituted between 10.2% and 12.6% of annualized rent. |
(d) | Represents the final monthly contractual rent under existing customer leases that had commenced as of December 31, 2017, multiplied by 12. |
17
Regulation
General
Properties in our markets are subject to various laws, ordinances and regulations, including regulations relating to common areas. In addition to the regulations described below, we are subject to various federal, state and local regulations, such as state and local fire and life safety regulations. We believe that each of our properties has, or is expected to have when required, the necessary permits and approvals for us to operate our business.
Americans With Disabilities Act
Our properties must comply with Title III of the Americans with Disabilities Act of 1990, or the ADA, to the extent that such properties are “public accommodations” as defined by the ADA. The ADA may require removal of structural barriers to access by persons with disabilities in certain public areas of our properties where such removal is readily achievable. We believe that our properties are in substantial compliance with the ADA and that we will not be required to make substantial capital expenditures to address the requirements of the ADA. However, noncompliance with the ADA could result in imposition of fines or an award of damages to private litigants. The obligation to make readily achievable accommodations is an ongoing one, and we will continue to assess our properties and to make alterations as appropriate in this respect.
Environmental Matters
We are subject to laws and regulations relating to the protection of the environment, the storage, management and disposal of hazardous materials, emissions to air and discharges to water, the cleanup of contaminated sites and health and safety matters. These include various regulations promulgated by the Environmental Protection Agency and other federal, state, and local regulatory agencies and legislative bodies relating to our operations, including those involving power generators, batteries, and fuel storage to support co-location infrastructure. While we believe that our operations are in substantial compliance with environmental, health, and human safety laws and regulations, as an owner or operator of property and in connection with the current and historical use of hazardous materials and other operations at its sites, we could incur significant costs, including fines, penalties and other sanctions, cleanup costs and third-party claims for property damages or personal injuries, as a result of violations of or liabilities under environmental laws and regulations. Fuel storage tanks are present at many of our properties, and if releases were to occur, we may be liable for the costs of cleaning up resulting contamination. Some of our sites also have a history of previous commercial operations, including past underground storage tanks.
Some of the properties may contain asbestos-containing building materials. Environmental laws require that asbestos-containing building materials be properly managed and maintained, and may impose fines and penalties on building owners or operators for failure to comply with these requirements.
Environmental consultants have conducted, as appropriate, Phase I or similar non-intrusive environmental site assessments on recently acquired properties and if appropriate, additional environmental inquiries and assessments on recently acquired properties. Nonetheless, we may acquire or develop sites in the future with unknown environmental conditions from historical operations. Although we are not aware of any sites at which we currently have material remedial obligations, the imposition of remedial obligations as a result of spill or the discovery of contaminants in the future could result in significant additional costs to us.
Our operations also require us to obtain permits and/or other governmental approvals and to develop response plans in connection with the use of our generators or other operations. These requirements could restrict our operations or delay the development of data centers in the future. In addition, from time to time, federal, state or local government regulators enact new or revise existing legislation or regulations that could affect us, either beneficially or adversely. As a result, we could incur significant costs in complying with environmental laws or regulations that are promulgated in the future.
Insurance
We carry comprehensive liability, fire, extended coverage, business interruption and rental loss insurance covering all of the properties in our portfolio under a blanket policy. In the opinion of our management, our policy specifications, limits and insurance carriers are appropriate given the relative risk of loss, the cost of coverage and industry practice. We cannot provide any assurance that the business interruption or property insurance we have will cover all losses that we may experience, that the insurance carrier will be solvent, that rates will remain commercially reasonable, that insurance carriers will not cancel our policies, or that the insurance carriers will pay all claims made by us. Certain circumstances, such as acts of war, are generally uninsurable under our policies. See also “Risk Factors-Risks Related to Our Business and Operations." Any losses to our properties that are not covered by insurance, or that exceed our policy coverage limits, could adversely affect our business, financial condition and results of operations.
18
Competition
We compete with numerous developers, owners and operators of technology-related real estate, many of which own properties similar to ours in the same markets in which our properties are located. If our competitors offer space at rental rates below current market rates or below the rental rates we currently charge our customers, or if our competitors offer space that tenants perceive to be superior to ours (based on factors such as available power, security considerations, location or connectivity), we may lose potential customers and we may be pressured to reduce our rental rates below those we currently charge in order to retain customers when our customers’ leases expire or incur costs to improve our properties. In addition, our customers have the option of building their own data center space which can also place pressure on our rental rates.
As a developer of data center space and provider of interconnection services, we also compete for the services of key third-party providers of services, including engineers and contractors with expertise in the development of data centers. There is competition for the services of specialized contractors and other third-party providers required for the development of data centers, increasing the cost of engaging such providers and the risk of delays in completing our development projects.
In addition, we face competition from real estate developers in our sector and in other industries for the acquisition of additional properties suitable for the development of data centers. Such competition may reduce the number of properties available for acquisition, increase the price of these properties and reduce the demand for data center space in the markets we seek to serve.
Employees
We employ approximately 416 persons. None of these employees are represented by a labor union.
Financial Information
For financial information related to our operations, please refer to the financial statements including the notes thereto, included in this Annual Report on Form 10-K.
How to Obtain Our SEC Filings
We file annual, quarterly and current reports, proxy statements and other information with the Securities and Exchange Commission (SEC). All reports we file with the SEC will be available free of charge via EDGAR through the SEC website at http://www.sec.gov. In addition, the public may read and copy materials we file with the SEC at the SEC’s public reference room located at 100 F Street, N.E., Washington, D.C. 20549. Information about the Public Reference Room may be obtained by calling the SEC at 1-800-SEC-0330. We make available our reports on Forms 10-K, 10-Q, and 8-K (as well as all amendments to these reports), and other information, free of charge, at the "Investors" section of our website at http://www.cyrusone.com. The information found on, or otherwise accessible through, our website is not incorporated by reference into, nor does it form a part of, this report or any other document that we file with the SEC.
19
ITEM 1A. RISK FACTORS
You should carefully consider all the risks described below, as well as the other information contained in this document when evaluating your investment in our securities. Any of the following risks could materially and adversely affect our business, results of operations or financial condition. The risks and uncertainties described below are those that we currently believe may materially affect our Company. Additional risks and uncertainties of which we are unaware or that we currently deem immaterial also may become important factors that affect our Company. The occurrence of any of the following risks might cause you to lose all or a part of your investment. Some statements in this Form 10-K, including statements in the following risk factors, constitute forward-looking statements. Please refer to the section entitled “Special Note Regarding Forward-Looking Statements.”
Risks Related to Our Business and Operations
A small number of customers account for a significant portion of our revenue. The loss or significant reduction in business from one or more of our large customers could significantly harm our business, financial condition and results of operations, and impact the amount of cash available for distribution to our stockholders.
We currently depend, and expect to continue to depend, upon a relatively small number of customers for a significant percentage of our revenue. Our top 10 customers collectively accounted for approximately 41% of our total annualized rent as of December 31, 2017. We have one customer which accounted for approximately 18% of our total annualized rent as of December 31, 2017. As a result of this customer concentration, our business, financial condition and results of operations, including the amount of cash available for distribution to our stockholders, could be adversely affected if we lose one or more of our larger customers, if one or more of such customers significantly reduce their business with us or if we choose not to enforce, or to enforce less vigorously, any rights that we may have now or in the future against these significant customers because of our desire to maintain our relationship with them.
A significant percentage of our customer base is also concentrated in three industry sectors: information technology, financial services and energy sectors. Enterprises in the information technology, financial services and energy industries comprised approximately 42%, 19% and 11%, respectively, of our annualized rent as of December 31, 2017. A downturn in one of these industries could negatively impact the financial condition of one or more of our information technology, financial services or energy customers, including several of our larger customers. In addition, instability in financial markets and economies generally may adversely affect our customers’ ability to replace or renew maturing liabilities on a timely basis, access the capital markets to meet liquidity and capital expenditure requirements and may result in adverse effects on our customers’ financial condition and results of operations. As a result of these factors, customers could default on their obligations to us, delay the purchase of new services from us or decline to renew expiring leases, any of which could have an adverse effect on our business, financial condition and results of operations.
Additionally, if any customer becomes a debtor in a case under the U.S. Bankruptcy Code, applicable bankruptcy laws may limit our ability to terminate our contract with such customer solely because of the bankruptcy or recover any amounts owed to us under our agreements with such customer. In addition, applicable bankruptcy laws could allow the customer to reject and terminate its agreement with us, with limited ability for us to collect the full amount of our damages. Our business, including our revenue and cash available for distribution to our stockholders, could be adversely affected if any of our significant customers were to become bankrupt or insolvent.
A significant percentage of our customer leases expire each year or are on a month-to-month basis, and many of our leases contain early termination provisions. If leases with our customers are not renewed on the same or more favorable terms or are terminated early by our customers, our business, financial condition and results of operations could be substantially harmed.
Our customers may not renew their leases upon expiration. This risk is increased by the significant percentage of our customer leases that expire every year. As of December 31, 2017, leases representing 20%, 12% and 10% of the annualized rent for our portfolio will expire during 2018, 2019 and 2020, respectively, and an additional 3% of the 2017 annualized rent for our portfolio was from month-to-month leases. While historically we have retained a significant number of our customers, including those leasing from us on a month-to-month basis, upon expiration our customers may elect not to renew their leases or renew their leases at lower rates, for less space, for fewer services or for shorter terms. If we are unable to successfully renew or continue our customer leases on the same or more favorable terms or subsequently re-lease available data center space when such leases expire, our business, financial condition and results of operations could be adversely affected.
In addition, many of our leases contain early termination provisions that allow our customers to reduce the term of their leases subject to payment of an early termination charge that is often a specified portion of the remaining rent payable on such leases. The exercise by customers of early termination options could have an adverse effect on our business, financial condition and results of operations.
20
We generate a substantial portion of our revenue from a small number of metropolitan markets, which makes us more susceptible to regional economic downturns.
Our properties are located in 12 distinct markets (10 in the U.S., plus London and Singapore). Dallas, Cincinnati, Houston, New York Metro, Northern Virginia, Phoenix and San Antonio accounted for approximately 89% of our annualized rent as of December 31, 2017. As such, we are potentially susceptible to local economic conditions and the supply of, and demand for, data center space in these markets. If there is a downturn in the economy, a natural disaster or an oversupply of, or decrease in demand for, data centers in these markets, our business could be adversely affected to a greater extent than if we owned a real estate portfolio that was more diversified in terms of both geography and industry focus.
Even if we have additional space available for lease at any one of our data centers, our ability to meet existing customer requirements or lease this space to existing or new customers could be constrained by our ability to provide sufficient electrical power and cooling capacity.
Customers are increasing their deployment of high-density IT equipment in our data centers, which has increased the demand for power and cooling capacity. As current and future customers increase their power footprint in our facilities over time, we may be required to upgrade or add to our existing infrastructure or add additional infrastructure to meet customer requirements. Power and cooling systems are difficult and expensive to upgrade, and such changes may be required at a time or on a timeline during which we lack the financial or operational ability to make such changes. Our failure to timely upgrade or add additional infrastructure could result in a failure to meet the requirements of our existing customers, or limit our ability to increase occupancy rates or density within our existing facilities, whether for new or existing customers. Similarly, even when successful in implementing such changes, we may not be able to pass on any additional costs to our customers.
We do not own all of the buildings in which our data centers are located. Instead, we lease or sublease certain of our data center spaces and the ability to retain these leases or subleases could be a significant risk to our ongoing operations.
We do not own 14 buildings that account for approximately 652,000 NRSF, or approximately 11% of our total operating NRSF. These leased buildings accounted for 18% of our total annualized rent as of December 31, 2017. In addition, future companies that we acquire, particularly outside of the U. S., may lease facilities instead of owning them. Our business could be harmed if we are unable to renew the leases for these data centers on favorable terms or at all. Additionally, in several of our smaller facilities we sublease our space, and our rights under these subleases are dependent on our sublandlord retaining its rights under the prime lease. When the primary terms of our existing leases expire, we generally have the right to extend the terms of our leases for one or more renewal periods, subject to, in the case of several of our subleases, our sublandlord renewing its term under the prime lease. For four of these leases and subleases, the renewal rent will be determined based on the fair market value of rental rates for the property, and the then prevailing rental rates may be higher than the current rental rates under the applicable lease. The rent for the remaining leases and subleases will be based on a fixed percentage increase over the base rent during the year immediately prior to expiration. Several of our data centers are leased or subleased from other data center companies, which may increase our risk of non-renewal or renewal on less than favorable terms. If renewal rates are less favorable than those we currently have, we may be required to increase revenues within existing data centers to offset such increase in lease payments. Failure to increase revenues to sufficiently offset these projected higher costs would adversely impact our operating income. Upon the end of our renewal options, we would have to renegotiate our lease terms with the applicable landlords.
Additionally, if we are unable to renew the lease at any of our data centers, we could lose customers due to the disruptions in their operations caused by the relocation. We could also lose those customers that choose our data centers based on their locations. In addition, it is not typical for us to relocate data center infrastructure equipment, such as generators, power distribution units and cooling units, from their initial installation. The costs of relocating such equipment to different data centers could be prohibitive and, as such, we could lose the value of this equipment. For these reasons, any lease that cannot be renewed could adversely affect our business, financial condition and results of operations.
Any losses to our properties that are not covered by insurance, or that exceed our coverage limits, could adversely affect our business, financial condition and results of operations.
The properties in our portfolio are subject to risks, including from causes related to riots, war, terrorism or acts of God. For example, our properties located in Texas are generally subject to risks related to tropical storms, tornadoes, hurricanes, floods and other severe weather or natural events and our properties located in the Midwest are generally subject to risks related to earthquakes, tornadoes and other severe weather. All our properties could have unknown title defects or encumbrances. While we carry commercial property insurance including business interruption, flood and earth movement covering all of the properties in our portfolio, and title insurance on a substantial number of our properties, the amount of insurance coverage may not be sufficient to fully cover losses we may incur.
21
If we experience a loss that is uninsured or exceeds our policy coverage limits, we could lose the capital invested in the damaged properties as well as the anticipated future cash flows from those properties. In addition, if the damaged properties were subject to recourse indebtedness, we could continue to be liable for the indebtedness even if these properties were irreparably damaged or subject of a loss.
In addition, even if a title defect or damage to our properties is covered by insurance, a disruption of our business caused by a casualty event may result in the loss of business or customers. The business interruption insurance we carry may not fully compensate us for the loss of business or customers due to an interruption caused by a title defect or casualty event.
A failure of an insurance company to make payments to us upon an event of loss covered by an insurance policy could adversely affect our business, financial condition and results of operations. We monitor our insurance carrier's financial strength rating and financial size category by only placing insurance with carriers who have an A.M. Best Rating of A- XII or better. However, it can be difficult to evaluate the stability and net assets or capitalization of insurance companies, and any insurance company's ability to meet its claim payment obligations.
Any failure of our physical infrastructure or services could lead to significant costs and disruptions that could reduce our revenues and harm our brand and reputation.
Our business depends on providing customers with a highly reliable data center environment. We may fail to provide such service as a result of numerous factors, including:
•human error;
•failure to timely deploy adequate infrastructure to meet customer requirements;
•unexpected equipment failure;
•power loss or telecommunications failures;
•improper building maintenance by us, our vendors, or by our landlords in the buildings that we lease;
•physical or electronic security breaches;
•fire, tropical storm, hurricane, tornado, flood, earthquake and other natural disasters;
•water damage;
•war, terrorism and any related conflicts or similar events worldwide; and
•sabotage and vandalism.
Problems at one or more of our data centers, whether or not within our control, could result in service interruptions or equipment damage. Substantially all of our leases include terms requiring us to meet certain service level commitments primarily in terms of electrical output to, and maintenance of environmental conditions in, the data center raised floor space leased by customers. Any failure to meet these commitments or any equipment damage in our data centers, including as a result of mechanical failure, power outage, human error on our part or other reasons, could subject us to liability under our lease terms, including service level credits against customer rent payments, or, in certain cases of repeated failures, the right by the customer to terminate the lease. For example, although our data center facilities are engineered to reliably power and cool our customers’ computing equipment, it is possible that an outage could adversely affect a facility’s power and cooling capabilities. Depending on the frequency and duration of these outages, the affected customers may have the right to terminate their lease, which could have a negative impact on our business. We may also be required to expend significant financial resources to upgrade or add to existing infrastructure to meet customer requirements for power and cooling, and we may not be financially or operationally able to do so in a timely manner.
We may be vulnerable to security breaches which could disrupt our operations and have a material adverse effect on our financial performance and operating results.
Security breaches, or disruption, of our or our customers' physical or information technology infrastructure, networks and related management systems could result in, among other things, unauthorized access to our facilities, a breach of our and our customers’ networks and information technology infrastructure, the misappropriation of our or our customers’ or their customers’ proprietary or confidential information, interruptions or malfunctions in our or our customers’ operations, delays or interruptions to our ability to meet customer needs, breach of our legal, regulatory or contractual obligations, inability to access or rely upon critical business records or other disruptions in our operations. These breaches may result from human error, equipment failure, or fraud or malice on the part of employees or third parties. We may be required to expend significant financial resources to protect against or respond to such breaches. Techniques used to breach security change frequently, and are generally not recognized until launched against a target, so we may not be able to promptly detect that a security breach or unauthorized access has occurred. We also may not be able to implement security measures in a timely manner or, if and when implemented, we may not be able to determine the extent to which these measures could be circumvented. As we provide assurances to our customers that we provide a high level of security, such a compromise could be particularly harmful to our brand and reputation. Any breaches that may occur could expose us to increased risk of lawsuits, material monetary damages, potential violations of applicable privacy and other laws, penalties and fines, loss of existing or potential customers, harm to our reputation and increases in our security and insurance costs, which could
22
have a material adverse effect on our business, financial condition and results of operations. In the event of a breach resulting in loss of data, such as personally identifiable information or other such data protected by data privacy or other laws, we may be liable for damages, fines and penalties for such losses under applicable regulatory frameworks despite not handling the data. Further, the regulatory framework around data custody, data privacy and breaches varies by jurisdiction and is an evolving area of law. We may not be able to limit our liability or damages in the event of such a loss.
Our growth depends on the development of our properties and our ability to successfully lease those properties, and any delays or unexpected costs associated with such projects or the ability to lease such properties may harm our growth prospects, future business, financial condition and results of operations.
Our growth depends in part upon successfully developing properties into operating data center space. Current and future development projects will involve substantial planning, allocation of significant company resources and certain risks, including risks related to zoning, regulatory approvals, construction costs and delays, as well as our ability to raise capital, including both debt and equity, to finance such projects. These projects will also require us to carefully select and rely on the experience of one or more general contractors and associated subcontractors during the construction process. Should a general contractor or significant subcontractor experience financial or other problems during the construction process, we could experience significant delays, increased costs to complete the project and other negative impacts to our expected returns, as well as reputational risk. Site selection is also a critical factor in our expansion plans, and there may not be suitable properties available in our markets at a location that is attractive to our customers and has the necessary combination of access to multiple network providers, a significant supply of electrical power, high ceilings and the ability to sustain heavy floor loading. Furthermore, while we may prefer to locate new data centers adjacent to our existing data centers, we may be limited by the inventory and location of suitable properties.
In addition, in developing new properties, we will be required to secure an adequate supply of power from local utilities, which may include unanticipated costs. For example, we could incur increased costs to develop utility substations on our properties in order to accommodate our power needs. Any inability to secure an appropriate power supply on a timely basis or on acceptable financial terms could adversely affect our ability to develop the property on an economically feasible basis, or at all.
These and other risks could result in delays or increased costs or prevent the completion of our development projects and growth of our business, which could adversely affect our business, financial condition and results of operations.
In addition, we have in the past undertaken development projects prior to obtaining commitments from customers to lease the related data center space. We will likely choose to undertake future development projects under similar terms. Such development involves the risk that we will be unable to attract customers to the relevant properties on a timely basis or at all. If we are unable to attract customers and our properties remain vacant or underutilized for a significant amount of time, our business, financial condition and results of operations could be adversely affected.
We are dependent upon third-party suppliers for power and certain other services, and we are vulnerable to service failures of our third-party suppliers and to price increases by such suppliers.
We rely on third-party local utilities to provide power to our data centers. We are therefore subject to an inherent risk that such local utilities may fail to deliver such power in adequate quantities or on a consistent basis, and our recourse against the utility and ability to control such failures may be limited. If power delivered from the local utility is insufficient or interrupted, we would be required to provide power through the operation of our on-site generators, generally at a significantly higher operating cost than we would pay for an equivalent amount of power from the local utility. We may not be able to pass on the higher cost to our customers. In addition, if the generator power were to fail, we would generally be subject to paying service level credits to our customers, who may in certain instances also have the right to terminate their leases. Furthermore, any sustained loss of power could reduce the confidence of our customers in our services thereby impairing our ability to attract and retain customers, which would adversely affect both our ability to generate revenues and our results of operations.
In addition, even when power supplies are adequate, we may be subject to pricing risks and unanticipated costs associated with obtaining power from various utility companies. While we actively seek to lock-in utility rates, many factors beyond our control may increase the rate charged by the local utility. For instance, municipal utilities in areas experiencing financial distress may increase rates to compensate for financial shortfalls unrelated to either the cost of production or the demand for electricity. Utilities may be dependent on, and be sensitive to price increases for, a particular type of fuel, such as coal, oil or natural gas. In addition, the price of these fuels and the electricity generated from them could increase as a result of proposed legislative measures related to climate change or efforts to regulate carbon emissions. In any of these cases, increases in the cost of power at any of our data centers could put those locations at a competitive disadvantage relative to data centers served by utilities that can provide less expensive power. These pricing risks are particularly acute with respect to our customer leases that are structured on a full-service gross basis, where the customer pays a fixed amount for both colocation rental and power. Our business, financial condition and results of operations could be adversely affected in the event of an increase in utility rates under these leases, which, as of
23
December 31, 2017, accounted for approximately 17% of our leased NRSF, because we may be limited in our ability to pass on such costs to these customers.
We depend on third parties to provide network connectivity to the customers in our data centers, and any delays or disruptions in connectivity may adversely affect our business, financial condition and results of operations.
Our customers require internet connectivity and connectivity to the fiber networks of multiple third-party telecommunications carriers. In order for us to attract and retain customers, our data centers need to provide sufficient access for customers to connect to those carriers. While we provide space and facilities in our data centers for carriers to locate their equipment and connect customers to their networks, any carrier may elect not to offer its services within our data centers or may elect to discontinue its service. Furthermore, carriers may periodically experience business difficulties which could affect their ability to provide telecommunications services, or the service provided by a carrier may be inadequate or of poor quality. If carriers were to terminate connectivity within our data centers or if connectivity were to be degraded or interrupted, it could put that data center at a competitive disadvantage versus a competitor’s data center that does provide adequate connectivity. A material loss of adequate third-party connectivity could have an adverse effect on the businesses of our customers and, in turn, our own results of operations and cash flow.
Furthermore, each new data center that we develop requires significant amounts of capital to be expended by third-party telecommunications carriers for the construction and operation of a sophisticated redundant fiber network. The construction required to connect multiple carrier facilities to our data centers is complex and involves factors outside of our control, including regulatory requirements, the availability of construction resources and the sufficiency of such third-party telecommunications carriers’ financial resources to fund the construction. Additionally, hardware or fiber failures could cause significant loss of connectivity. If we are unable to establish highly diverse network connectivity to our data centers, or if such network connectivity is materially delayed, is discontinued or is subject to failure, our ability to attract new customers or retain existing customers may be negatively affected and, as a result our results of operations and cash flows may be adversely affected.
The loss of access to key third-party technical service providers and suppliers could adversely affect our current and any future development projects.
Our success depends, to a significant degree, on having timely access to certain key third-party technical personnel who are in limited supply and great demand, such as engineering firms and construction contractors capable of developing our properties, and to key suppliers of electrical and mechanical equipment that complement the design of our data center facilities. For any future development projects, we will continue to rely on these personnel and suppliers to develop and equip our data centers. Competition for such technical expertise is intense, and there are a limited number of electrical and mechanical equipment suppliers that design and produce the equipment that we require. We may not always have or retain access to such key service providers and equipment suppliers, which could adversely affect our current and any future development projects.
The long sales cycle for data center services may adversely affect our business, financial condition and results of operations.
A customer’s decision to lease space in one of our data centers and to purchase additional services typically involves a significant commitment of resources, significant contract negotiations regarding the service level commitments, and significant due diligence on the part of the customer regarding the adequacy of our facilities, including the adequacy of carrier connections. As a result, the sale of data center space has a long sales cycle. Furthermore, we may expend significant time and resources in pursuing a particular sale or customer that may not result in revenue. Our inability to adequately manage the risks associated with the data center sales cycle may adversely affect our business, financial condition and results of operations.
Our international activities are subject to special risks different from those faced by us in the United States, and we may not be able to effectively manage our international business.
Our activities are primarily based in the United States with a more limited presence in Europe and Southeast Asia and, through our strategic partnership with GDS, the People’s Republic of China (PRC). In addition, upon the consummation of the Zenium Acquisition, which is expected to occur in the first half of 2018, subject to customary closing conditions and regulatory approvals, we will increase our presence in Europe. Expanding our international activities involves risks not generally associated with activities or investments in the United States, including:
•our limited knowledge of and relationships with sellers, customers, contractors, suppliers or other parties in these markets;
•complexity and costs associated with staffing and managing international development and operations;
•difficulty in hiring qualified management, sales and construction personnel and service providers in a timely fashion;
•problems securing and maintaining the necessary physical and telecommunications infrastructure;
• | multiple, conflicting and changing legal, regulatory, entitlement and permitting, and tax and treaty environments with which we have limited familiarity; |
24
•exposure to increased taxation, confiscation or expropriation;
• | fluctuations in foreign currency exchange rates, currency transfer restrictions and limitations on our ability to distribute cash earned in foreign jurisdictions to the United States; |
•longer payment cycles and problems collecting accounts receivable;
•laws and regulations on content distributed over the Internet that are more restrictive than those in the United States;
• | evolving and uncertain local laws, regulations and licenses, including the implementation and enforcement thereof, particularly in the PRC; |
• | difficulty in enforcing agreements in non-U.S. jurisdictions, including those entered into in connection with our acquisitions, or with our investment in and strategic partnership with GDS, or in the event of a default by one or more of our customers, suppliers or contractors; |
•political and economic instability, including sovereign credit risk, in certain geographic regions;
•the uncertain impact of the United Kingdom’s vote to leave the European Union (commonly known as "Brexit"); and
•exposure to restrictive foreign labor law practices.
Our inability to overcome these risks could adversely affect our foreign operations, partnerships and growth prospects and could harm our business, financial condition and results of operations.
We may be unable to identify and complete acquisitions and successfully operate acquired properties.
We continually evaluate the market for available properties and may acquire data centers or properties suited for data center development when opportunities exist. For example, on December 21, 2017, we announced our pending acquisition of Zenium. Our ability to complete this acquisition, or any other acquisitions, on favorable terms and to successfully develop and operate acquired properties involves significant risks, including:
• | we may be unable to acquire a desired property because of competition from other data center companies or real estate investors; |
• | even if we are able to acquire a desired property, competition from other potential acquirers may significantly increase the purchase price of such property; |
•we may be unable to realize the intended benefits from acquisitions or achieve anticipated operating or financial results;
•we may be unable to finance the acquisition on favorable terms or at all;
•we may underestimate the costs to make necessary improvements to acquired properties;
• | we may be unable to quickly and efficiently integrate new acquisitions into our existing operations resulting in disruptions to our operations or the diversion of our management’s attention; |
•acquired properties may be subject to reassessment, which may result in higher than expected tax payments;
•we may not be able to access sufficient power on favorable terms or at all;
•market conditions may result in higher than expected vacancy rates and lower than expected rental rates;
•we may incur impairment losses or other charges related to acquired assets or properties;
•we may face challenges in retaining the customers of acquired properties; and
•we may incur significant costs associated with unrealized transactions.
Many of these risks will be outside of our control and any one of them could result in increased costs, decreases in the amount of expected revenue, and diversion of our management's time and energy, which could adversely affect our business, financial condition and results of operations. In addition, even if we successfully operate acquired properties, we may not realize the full benefits of the acquisition, including the synergies, operating efficiencies, or sales or growth opportunities that are expected. If we are unable to successfully acquire, develop and operate data center properties, our ability to grow our business and compete will be significantly impaired, which could adversely affect our business, financial condition and results of operations.
We face risks with our international acquisitions associated with investing in unfamiliar metropolitan areas.
We have announced our intention to acquire and may continue to acquire properties on a strategic and selective basis in international metropolitan areas that are new to us. For example, on December 21, 2017, we announced our pending acquisition of Zenium, which, if consummated, will result in our ownership of two facilities in Frankfurt, a new market to us. When we acquire properties located in new markets, we may face risks associated with a lack of market knowledge or understanding of the local economy and culture, forging new business relationships in the area and unfamiliarity with local government and permitting procedures. In addition, due diligence, transaction and structuring costs may be higher than those we may face in the United States. We work to mitigate such risks through extensive diligence and research and associations with experienced partners; however, we cannot assure you that all such risks will be eliminated.
25
Any failure to comply with anti-corruption laws and regulations could have adverse effects on our business.
We are subject to laws concerning our business operations, sales and marketing activities in foreign countries where we conduct business. For example, we are subject to the U.S. Foreign Corrupt Practices Act, or the FCPA, which generally prohibits companies and any individuals or entities acting on their behalf from offering or making improper payments or providing benefits to foreign officials for the purpose of obtaining or keeping business. We are also subject to various other anti-bribery, anti-corruption and international trade laws in the U.S. and certain foreign countries, such as the U.K. Bribery Act. Our strategic partnership with GDS is subject to PRC laws and regulations related to anti-corruption, which prohibit bribery of government agencies, state or government owned or controlled enterprises or entities, of government officials or officials that work for state or government owned enterprises or entities, as well as bribery of non-government entities or individuals. There is a risk that our employees, business partners and other third parties could violate these laws, and we could be sanctioned or held liable for actions taken by our employees, business partners and other third parties with respect to our business. We could incur significant expenses in investigating any potential violation and could incur severe criminal or civil sanctions and/or fines as a result of violations or settlements regarding such laws. In addition, any allegations, settlements or violations could materially and adversely impact our reputation and our relationships with current and future customers, suppliers, employees and business partners.
If the PRC government deems that the contractual arrangements in relation to the consolidated variable interest entities of GDS do not comply with PRC regulatory restrictions on foreign investment in the relevant industries, or if these regulations or the interpretation of existing regulations change in the future, we could fail to realize any benefits from our investment in and relationship with GDS.
The PRC government regulates telecommunications-related businesses through strict business licensing requirements and other government regulations. These laws and regulations also include limitations on foreign ownership of PRC companies that engage in telecommunications-related businesses. Because GDS is a Cayman Islands company, GDS is classified as a foreign enterprise under PRC laws and regulations, and its wholly owned PRC subsidiaries are foreign-invested enterprises, or FIEs. GDS conducts its business in China through contractual arrangements with its consolidated variable interest entities, or VIEs, and their shareholders. These contractual arrangements are intended to provide GDS with effective control over its consolidated VIEs and enables GDS to receive substantially all of the economic benefits of its consolidated VIEs in consideration for the services provided by its wholly-owned PRC subsidiaries.
There are substantial uncertainties regarding the interpretation and application of PRC laws and regulations, and there can be no assurance that the PRC government, such as the Ministry of Industry and Information Technology, or the MIIT, or the Ministry of Commerce, or the MOFCOM, or other authorities that regulate providers of data center service and other participants in the telecommunications industry would agree that the corporate structure of GDS or any of the above contractual arrangements comply with PRC licensing, registration or other regulatory requirements, with existing policies or with requirements or policies that may be adopted in the future. PRC laws and regulations governing the validity of these contractual arrangements are uncertain and the relevant government authorities have broad discretion in interpreting these laws and regulations.
If the corporate and contractual structure of GDS is deemed by the MOFCOM or MIIT or other regulators having competent authority to be illegal, either in whole or in part, GDS may lose control of its consolidated VIEs and have to modify such structure to comply with regulatory requirements. However, there can be no assurance that GDS could achieve this without material disruption to its business. Further, if its corporate and contractual structure is found to be in violation of any existing or future PRC laws or regulations, the relevant regulatory authorities would have broad discretion in dealing with such violations. Furthermore, new PRC laws, rules and regulations may be introduced to impose additional requirements that may be applicable to the corporate structure and contractual arrangements of GDS. Occurrence of any of these events could materially and adversely affect the business, financial condition and results of operations of GDS and, as a result, could materially limit key anticipated benefits from our investment in and relationship with GDS.
The results of the United Kingdom’s referendum on withdrawal from the European Union may have a negative effect on global economic conditions, financial markets and our business, which could adversely affect our results of operations.
We currently have a limited presence in Europe, but have announced our intention to acquire four data centers located in London and Frankfurt. In June 2016, a majority of voters in the United Kingdom elected to withdraw from the European Union in a national referendum. The referendum was advisory, and the terms of any withdrawal are subject to a negotiation period that could last at least two years from March 29, 2017, the date the government of the United Kingdom formally initiated the withdrawal process. Nevertheless, the referendum has created significant uncertainty about the future relationship between the United Kingdom and the European Union, and has given rise to calls for the governments of other European Union member states to consider withdrawal. These developments, or the perception that any of them could occur, have had and may continue to have a material adverse effect on global economic conditions and the stability of global financial markets, and could significantly reduce global market liquidity and restrict the ability of key market participants to operate in certain financial markets. Asset valuations, currency exchange rates
26
and credit ratings may be especially subject to increased market volatility. Lack of clarity about future United Kingdom laws and regulations as the United Kingdom determines which European Union laws to replace or replicate in the event of a withdrawal could depress economic activity and restrict our access to capital in the United Kingdom. If the United Kingdom and the European Union are unable to negotiate acceptable withdrawal terms or if other European Union member states pursue withdrawal, barrier-free access between the United Kingdom and other European Union member states or among the European economic area overall could be diminished or eliminated. Any of these factors may adversely affect our business, financial condition and results of operations.
Our customers may choose to develop or relocate into new data centers or expand their own existing data centers, which could result in the loss of one or more key customers or reduce demand for our newly developed data centers.
In the future, our customers may choose to develop or relocate to new data centers or expand or consolidate into their existing data centers that we do not own. In the event that any of our key customers were to do so, it could result in a loss of business to us or put pressure on our pricing. If we lose a customer, we cannot provide assurance that we would be able to replace that customer at a competitive rate or at all, which could adversely affect our business, financial condition and results of operations.
A decrease in the demand for data center space could adversely affect our business, financial condition and results of operations.
Our portfolio of properties consists primarily of data center space. The adverse effect on our business, financial condition and results of operations from a decreased demand for data center space would likely be greater than if we owned a portfolio with a more diversified customer base or less specialized use. Adverse developments in the outsourced data center space industry could lead to reduced corporate IT spending or reduced demand for outsourced data center space. Changes in industry practice or in technology, such as server virtualization technology, more efficient or miniaturization of computing or networking devices, or devices that require higher power densities than today’s devices, could also reduce demand for the physical data center space we provide or make the customer improvements in our facilities obsolete or in need of significant upgrades to remain viable.
Our properties are not suitable for use other than as data centers, which could make it difficult to sell or reposition them if we are not able to lease available space.
Our data centers are designed solely to house and run computer servers and related information technology equipment and, therefore, contain extensive electrical and mechanical systems and infrastructure. As a result, they are not suited for use by customers as anything other than as data centers and major renovations and expenditures would be required in order for us to re-lease vacant space for more traditional uses, or for us to sell a property to a buyer for use other than as a data center, which could materially adversely affect our business, results of operations and financial condition.
We may have difficulty managing our growth.
We have significantly and rapidly expanded the size of our Company. For example, we increased our footprint by 46% from approximately 3,904,000 NRSF at the end of 2016 to approximately 5,717,000 NRSF by December 31, 2017. Our growth may significantly strain our management, operational and financial resources and systems. An inability to manage our growth effectively or the increased strain on our management, our resources and systems could materially adversely affect our business, financial condition and results of operations.
To fund our growth strategy and refinance our indebtedness, we depend on external sources of capital, which may not be available to us on commercially reasonable terms or at all.
In order to maintain our qualification as a REIT, we are required under the Code, among other things, to distribute at least 90% of our REIT taxable income annually, determined without regard to the dividends paid deduction and excluding any net capital gains. Even if we maintain our qualification as a REIT, we will be subject to U.S. federal income tax at regular corporate rates to the extent that we distribute less than 100% of our REIT taxable income, determined without regard to the dividends paid deduction and including any net capital gains, as well as U.S. federal income tax at regular corporate rates for income recognized by our taxable REIT subsidiaries (each, a TRS). Because of these distribution requirements, we will likely not be able to fund future capital needs, including any necessary acquisition financing, from operating cash flow. Consequently, we intend to rely on third-party capital markets sources for debt or equity financing to fund our growth strategy. In addition, we may need third-party capital markets sources to refinance our indebtedness at maturity. Continued or increased turbulence in the U.S., European and other international financial markets and economies, tighter credit conditions and increasing interest rates may adversely affect our ability to replace or renew maturing liabilities on a timely basis, access the capital markets to meet liquidity and capital expenditure requirements and may result in adverse effects on our business, financial condition and results of operations. As such, we may not be able to obtain the debt or equity financing on favorable terms or at all. Our access to third-party sources of capital also depends, in part, on:
27
•the market’s perception of our growth potential;
•our then-current debt levels;
•market demand for REIT assets;
•our historical and expected future earnings, cash flow and cash distributions;
•the market price per share of our common stock; and
•our lenders' ability to meet their financing commitments.
In addition, our ability to access additional capital may be limited by the terms of our then-existing indebtedness which may restrict our incurrence of additional debt. If we cannot obtain capital when needed, we may not be able to acquire or develop properties when strategic opportunities arise or refinance our debt at maturity, and we may need to increase our liquidity by disposing of properties possibly on disadvantageous terms or renewing leases on less favorable terms than we otherwise would, which could adversely affect our business, financial condition and results of operations.
We have significant outstanding indebtedness that involves significant debt service obligations, limits our operational and financial flexibility, exposes us to interest rate fluctuations and exposes us to the risk of default under our debt obligations.
As of December 31, 2017, we had a total combined indebtedness, including capital lease obligations and lease financing arrangements, of approximately $2,231.4 million. We also currently have the ability to borrow up to an additional $1,091.5 million under our Revolving Credit Facility, net of outstanding letters of credit of approximately $8.5 million, subject to satisfying certain financial tests. Our Second Amended and Restated Credit Agreement also contains an accordion feature that, as of December 31, 2017, allows the operating partnership to request an increase in the total commitment by up to $300.0 million. There are no limits on the amount of indebtedness we may incur other than limits contained in the indentures governing our 2024 Notes and 2027 Notes, our Second Amended and Restated Credit Agreement or future agreements that we may enter into or as may be set forth in any policy limiting the amount of indebtedness we may incur adopted by CyrusOne’s board of directors. A substantial level of indebtedness could have adverse consequences for our business, financial condition and results of operations because it could, among other things:
• | require us to dedicate a substantial portion of our cash flow from operations to make principal and interest payments on our indebtedness, thereby reducing our cash flow available to fund working capital, capital expenditures and other general corporate purposes, including to make distributions on our common stock as currently contemplated or as necessary to maintain our qualification as a REIT; |
• | require us to maintain certain debt coverage and other financial metrics at specified levels, thereby reducing our financial flexibility and, in the event of a failure to comply with such requirements, creating the risk of a material adverse effect on our ability to fulfill our obligations under our debt and on our business and prospects generally; |
• | make it more difficult for us to satisfy our financial obligations, including borrowings under the Second Amended and Restated Credit Agreement; |
• | increase our vulnerability to general adverse economic and industry conditions; |
• | expose us to increases in interest rates for our variable rate debt; |
• | limit our ability to borrow additional funds on favorable terms or at all to expand our business or ease liquidity constraints; |
• | limit our ability to refinance all or a portion of our indebtedness on or before maturity on the same or more favorable terms or at all; |
• | limit our flexibility in planning for, or reacting to, changes in our business and our industry; |
• | place us at a competitive disadvantage relative to competitors that have less indebtedness; |
• | increase our risk of property losses as the result of foreclosure actions initiated by lenders in the event we should incur mortgage or other secured debt obligations; and |
• | require us to dispose of one or more of our properties at disadvantageous prices or raise equity that may dilute the value of our common stock in order to service our indebtedness or to raise funds to pay such indebtedness at maturity. |
The agreements governing our indebtedness place significant operational and financial restrictions on us and our subsidiaries, reducing our operational flexibility and creating default risks.
The agreements governing our indebtedness contain covenants, and the terms of any future agreements may contain covenants, that place restrictions on us and our subsidiaries. These covenants restrict, among other things, our and our subsidiaries’ ability to:
• | merge, consolidate or transfer all, or substantially all, of our or our subsidiaries’ assets; |
• | incur or guarantee additional debt or issue preferred stock; |
• | make certain investments or acquisitions; |
• | create liens on our or our subsidiaries’ assets; |
28
• | sell assets; |
• | make capital expenditures; |
• | incur restrictions on the payment of dividends or other distributions from our restricted subsidiaries; |
• | make distributions on or repurchase our stock; |
• | enter into transactions with affiliates; |
• | issue or sell stock of our subsidiaries; and |
• | change the nature of our business. |
These covenants could impair our ability to grow our business, take advantage of attractive business opportunities or successfully compete. These covenants could also impair our ability to plan for or react to market conditions or meet capital needs, or our ability to finance our operations, strategic acquisitions, investments or alliances or other capital needs or to engage in other business activities that would be in our interest. In addition, the indentures governing our 2024 Notes and 2027 Notes and our Second Amended and Restated Credit Agreement require us to maintain specified financial ratios and satisfy financial condition tests. The indentures governing our 2024 Notes and 2027 Notes also require our operating partnership and its subsidiaries to maintain total unencumbered assets of at least 150% of the aggregate principal amount of their outstanding unsecured debt on a consolidated basis. Our ability to comply with these metrics or tests may be affected by events beyond our control, including prevailing economic, financial and industry conditions. A breach of any of these covenants or covenants under any other agreements governing our indebtedness could result in an event of default. Cross-default provisions in our debt agreements could cause an event of default under one debt agreement to trigger an event of default under our other debt agreements. Upon the occurrence of an event of default under any of our debt agreements, the lenders or holders thereof could elect to declare all outstanding debt under such agreements to be immediately due and payable. If we were unable to repay or refinance the accelerated debt, the lenders or holders, as applicable, could proceed against any assets pledged to secure that debt, including foreclosing on or requiring the sale of our data centers, and our assets may not be sufficient to repay such debt in full.
We may become subject to litigation or threatened litigation which may divert management time and attention, require us to pay damages and expenses or restrict the operation of our business.
We may become subject to disputes with commercial parties with whom we maintain relationships or other parties with whom we do business, including as a result of any breach in our security systems or downtime in our critical electrical and cooling systems. Any such dispute could result in litigation between us and the other parties. Whether or not any dispute actually proceeds to litigation, we may be required to devote significant management time and attention to its resolution (through litigation, settlement or otherwise), which would detract from our management’s ability to focus on our business. Any such resolution could involve the payment of damages or expenses by us, which may be significant. In addition, any such resolution could involve our agreement with terms that restrict the operation of our business.
We could incur significant costs related to environmental matters.
We are subject to laws and regulations relating to the protection of the environment, including those governing the management and disposal of hazardous materials, the cleanup of contaminated sites and health and safety matters. We could incur significant costs, including fines, penalties and other sanctions, cleanup costs and third-party claims for property damages or personal injuries, as a result of violations of or liabilities under environmental laws and regulations. Some environmental laws impose liability on current owners or operators of property regardless of fault or the lawfulness of past disposal activities. For example, many of our sites contain above ground fuel storage tanks and, in some cases, currently contain or formerly contained underground fuel storage tanks, for back-up generator use. Some of our sites also have a history of previous commercial operations. We also may acquire or develop sites in the future with unknown environmental conditions from historical operations. Although we are not aware of any sites at which we currently have material remedial obligations, the imposition of remedial obligations as a result of spills or the discovery of contaminants in the future could result in significant additional costs. We also could incur significant costs complying with current environmental laws or regulations or those that are promulgated in the future.
We may incur significant costs complying with the Americans with Disabilities Act, or ADA, and similar laws, which
could materially adversely affect our financial condition and operating results.
Under the ADA, all places of public accommodation must meet federal requirements related to access and use by disabled persons. A number of additional federal, state and local laws may also require modifications to our properties. We have not conducted an audit or investigation of all of our properties to determine our compliance with the ADA. If one of our properties is not in compliance with the ADA, we would be required to incur additional costs to bring the property into compliance. Additional federal, state and local laws may require modifications to our properties, or restrict our ability to renovate our properties. We cannot predict the ultimate amount of the cost of compliance with the ADA or other legislation. If we incur substantial costs to comply with the ADA and any other similar legislation, our financial condition and results of operations could be materially adversely affected.
29
We may be adversely affected by regulations related to climate change.
If we, or other companies with which we do business, become subject to existing or future laws and regulations related to climate change, our business could be impacted adversely. For example, in the normal course of business, we enter into agreements with providers of electric power for our data centers, and the costs of electric power comprise a significant component of our operating expenses. Changes in regulations that affect electric power providers, such as regulations related to the control of greenhouse gas emissions or other climate change related matters, could adversely affect the costs of electric power and increase our operating costs and may adversely affect our business, financial condition and results of operations or those of our customers.
We may incur significant costs complying with other regulations.
Our properties are subject to various federal, state and local regulations, such as state and local fire and life safety regulations. If one of our properties is not in compliance with these various regulations, we may be required to pay fines or private damage awards. We do not know whether existing regulations will change or whether future regulations will require us to make significant unanticipated expenditures that may adversely affect our business, financial condition and results of operations.
We may be subject to unknown or contingent liabilities related to properties or businesses that we acquire for which we may have limited or no recourse against the sellers.
Assets and entities that we have acquired or may acquire in the future, including the properties contributed to us by Cincinnati Bell Inc. (CBI), our former parent, may be subject to unknown or contingent liabilities for which we may have limited or no recourse against the sellers. Unknown or contingent liabilities might include liabilities for clean-up or remediation of environmental conditions, claims of customers, vendors or other persons dealing with the acquired entities, tax liabilities and other liabilities whether incurred in the ordinary course of business or otherwise. In the future, we may enter into transactions with limited representations and warranties or with representations and warranties that do not survive the closing of the transactions, in which event we would have no or limited recourse against the sellers of such properties. While we usually require the sellers to indemnify us with respect to breaches of representations and warranties that survive, such indemnification, if obtained, is often limited and subject to various materiality thresholds, a significant deductible, an aggregate cap on losses or a survival period.
As a result, there is no guarantee that we will recover any amounts with respect to losses due to breaches by the sellers of their representations and warranties. In addition, the total amount of costs and expenses that we may incur with respect to liabilities associated with acquired properties and entities may exceed our expectations, which may adversely affect our business, financial condition and results of operations. Finally, indemnification agreements between us and the sellers typically provide that the sellers will retain certain specified liabilities relating to the assets and entities acquired by us. While the sellers are generally contractually obligated to pay all losses and other expenses relating to such retained liabilities, there can be no guarantee that such arrangements will not require us to incur losses or other expenses as well.
The failure to successfully implement changes to our information technology system could adversely affect our business.
From time to time, we make changes to our information technology system to meet our business and financial reporting needs. Transitioning to new or upgraded systems can create difficulties, including potential disruption to our financial reporting data, security vulnerabilities and decreases in productivity until personnel become familiar with new systems. In addition, our management information systems will require modification and refinement as we grow and as our business needs change, which could prolong difficulties we experience with systems transitions, and we may not always employ the most effective systems for our purposes. If we experience difficulties in implementing new or upgraded information systems or experience significant system failures, or if we are unable to successfully modify our management information systems and respond to changes in our business needs, our operating results could be harmed or we may fail to meet our reporting obligations.
We face significant competition and may be unable to lease vacant space, renew existing leases or re-lease space as leases expire, which may adversely affect our business, financial condition and results of operations.
We compete with numerous developers, owners and operators of technology-related real estate and data centers, many of which own properties similar to ours in the same markets, as well as various other public and privately held companies that may provide data center colocation as part of a more expansive managed services offering, and local developers. In addition, we may face competition from new entrants into the data center market. Some of our competitors may have significant advantages over us, including greater name recognition, longer operating histories, lower operating costs, pre-existing relationships with current or potential customers, greater financial, marketing and other resources, access to less expensive power and access to attractive land for development. These advantages could allow our competitors to respond more quickly to strategic opportunities or changes in our industries or markets. If our competitors offer data center space that our existing or potential customers perceive to be superior to ours based on numerous factors, including power, security considerations, location or network connectivity, or if they offer
30
rental rates below our or current market rates, we may lose existing or potential customers, incur costs to improve our properties or be forced to reduce our rental rates.
Some of our competitors may adopt aggressive pricing policies, especially if they are not highly leveraged or have lower return thresholds than we do. As a result, we may suffer from pricing pressure that would adversely affect our ability to generate revenues. Some of these competitors may also provide our target customers with additional benefits, including bundled communication services or cloud services, and may do so in a manner that is more attractive to our potential customers than obtaining space in our data centers. Competitors could also operate more successfully or form alliances to acquire significant market share.
Finally, as our customers evolve their IT strategies, we must remain flexible and evolve along with industry and market shifts. Ineffective planning and execution in our cloud strategy and product development lifecycle may cause difficulty in sustaining competitive advantage in our products and services.
Future joint venture investments could be adversely affected by our lack of sole decision-making authority, our reliance on co-venturers’ financial condition and disputes between us and our co-venturers.
We may in the future co-invest with third parties through partnerships, joint ventures or other entities, acquiring non-controlling interests in or sharing responsibility for managing the affairs of a property, partnership, joint venture or other entity. In these events, we would not be in a position to exercise sole decision-making authority regarding the property, partnership, joint venture or other entity. Investments in partnerships, joint ventures, or other entities may, under certain circumstances, involve risks not present when a third party is not involved, including the possibility that partners or co-venturers might become bankrupt or fail to fund their share of required capital contributions. Partners or co-venturers may have economic, tax or other business interests or goals which are inconsistent with our business interests or goals, and may be in a position to take actions contrary to our policies or objectives. Our future joint venture partners may take actions that are not within our control, which would require us to dispose of the joint venture asset or transfer it to a taxable REIT subsidiary in order for CyrusOne Inc. to maintain its status as a REIT. Such investments may also lead to impasses, for example, as to whether to sell a property, because neither we nor the partner or co-venturer would have full control over the partnership or joint venture. Disputes between us and future partners or co-venturers may result in litigation or arbitration that would increase our expenses and prevent our officers and/or directors from focusing their time and effort on our day-to-day business. Consequently, actions by or disputes with partners or co-venturers may subject properties owned by the partnership or joint venture to additional risk. In addition, we may in certain circumstances be liable for the actions of future third-party partners or co-venturers. Each of these factors may result in returns on these investments being less than we expect or in losses and our financial and operating results may be adversely affected.
The loss of any of our key personnel, including our executive officers or key sales associates, could adversely affect our business, financial condition and results of operations.
Our success will continue to depend to a significant extent on our executive officers and key sales associates. Each of our executive officers has a national or regional industry reputation that attracts business and investment opportunities and assists us in negotiations with lenders, existing and potential customers and industry personnel. The loss of key sales associates could hinder our ability to continue to benefit from existing and potential customers. We cannot provide any assurance that we will be able to retain our current executive officers or key sales associates. The loss of any of these individuals could adversely affect our business, financial condition and results of operations.
Our data center infrastructure may become obsolete, and we may not be able to upgrade our power and cooling systems cost-effectively, or at all.
The markets for the data centers we own and operate, as well as the industries in which our customers operate, are characterized by rapidly changing technology, evolving industry standards, frequent new service introductions, shifting distribution channels and changing customer demands. Our data center infrastructure may become obsolete due to the development of new systems to deliver power to or eliminate heat from the servers that we house. Additionally, our data center infrastructure could become obsolete as a result of the development of new server technology that does not require the levels of critical load and heat removal that our facilities are designed to provide and could be run less expensively on a different platform. In addition, our power and cooling systems are difficult and expensive to upgrade. Accordingly, we may not be able to efficiently upgrade or change these systems to meet new demands without incurring significant costs that we may not be able to pass on to our customers. The obsolescence of our power and cooling systems could have a material negative impact on our business, financial condition and results of operations. Furthermore, potential future regulations that apply to industries we serve may require customers in those industries to seek specific requirements from their data centers that we are unable to provide. These may include physical security requirements applicable to the defense industry and government contractors and privacy and security regulations applicable to the financial services and health care industries. If such regulations were adopted, we could lose some customers or be unable to attract new customers in certain industries, which would have a material adverse effect on our results of operations.
31
Declining real estate valuations and impairment charges could adversely affect our earnings and financial condition.
We review each of our properties for indicators that its carrying amount may not be recoverable. Examples of such indicators may include a significant decrease in market price, a significant adverse change in the extent to or manner in which the property is being used or in its physical condition, an accumulation of costs significantly in excess of the amount originally expected for the acquisition or development, or a history of operating or cash flow losses. When such impairment indicators exist, we review an estimate of the future undiscounted net cash flows (excluding interest charges) expected to result from the real estate investment’s use and eventual disposition and compare it to the carrying value of the property. We consider factors such as future operating income, trends and prospects, as well as the effects of leasing demand, competition and other factors. If our future undiscounted net cash flow evaluation indicates that we are unable to recover the carrying value of a real estate investment, an impairment loss is recorded to the extent that the carrying value exceeds the estimated fair value of the property. For example, we recorded an impairment of $59.5 million related primarily to two properties for the year ended December 31, 2017. These losses have a direct impact on our net income because recording an impairment loss results in an immediate negative adjustment to net income. The evaluation of anticipated cash flows is highly subjective and is based in part on assumptions regarding future occupancy, rental rates and capital requirements that could differ materially from actual results in future periods. A worsening real estate market may cause us to re-evaluate the assumptions used in our impairment analysis. Impairment charges could adversely affect our business, financial condition and results of operations.
Our contracts with our customers may adversely affect our earnings and financial condition.
In the ordinary course of business, we enter into agreements with our customers pursuant to which our customers lease or otherwise contract for the use of data center space from us. These contracts typically contain indemnification and liability provisions, in addition to service level commitments, which could potentially impose a significant cost on us in the event of losses arising out of certain breaches of such agreements, services to be provided by us or our subcontractors or from third-party claims. Customers increasingly are looking to pass through their regulatory obligations and other liabilities to their outsourced data center providers and we may not be able to limit our liability or damages in an event of loss suffered by such customers whether as a result of our breach of agreement or otherwise. Further, liabilities and standards for damages and enforcement actions, including the regulatory framework applicable to different types of losses, vary by jurisdiction, and we may be subject to greater liability for certain losses in certain jurisdictions. Additionally, in connection with our acquisitions, we have assumed and expect to assume existing agreements with customers that may subject us to greater liability for such an event of loss. If such an event of loss occurred, we could be liable for material monetary damages and could incur significant legal fees in defending against such an action, which could adversely affect our financial condition and results of operations.
Any failure of the National IX Platform could lead to significant costs and disruptions that could reduce our revenue and harm our business reputation and financial results.
We have deployed the National IX Platform throughout several of our properties, and expect that we will further deploy it throughout our portfolio to meet customer demand. The National IX Platform allows our customers to connect to third-party carriers and other customers. We may be required to incur substantial additional costs to operate and expand the National IX Platform. The National IX Platform is subject to failure resulting from numerous factors, including but not limited to:
•human error;
•equipment failure;
•physical, electronic, and cyber-security breaches;
•fire, earthquake, hurricane, flood, tornado and other natural disasters in our facilities;
•failure to properly connect to third-party carriers or other customers;
•fiber cuts;
•power loss;
•terrorist acts;
•sabotage and vandalism; and
• | failure of business partners who provide components of the National IX Platform or third-party connectivity from the National IX Platform. |
Problems with the National IX Platform, whether or not within our control, could result in service interruptions or significant equipment damage. We have service level commitment obligations to certain of our customers, including our significant customers. As a result, service interruptions in the National IX Platform could result in difficulty maintaining service level commitments to these customers and in potential claims related to such failures. In addition, any loss of service, equipment damage or inability to meet our service level commitment obligations could reduce the confidence of our customers and could consequently impair our ability to obtain and retain customers, which would adversely affect both our ability to generate revenues and our operating results.
32
Risks Related to the Real Estate Industry
Our performance and value are subject to risks associated with real estate assets and with the real estate industry.
Our ability to make expected distributions to our stockholders depends on our ability to generate revenues in excess of expenses, scheduled principal payments on debt and capital expenditure requirements. Events and conditions generally applicable to owners and operators of real property that are beyond our control may decrease cash available for distribution to our stockholders and the value of our properties. These events include:
•local oversupply, increased competition or reduction in demand for technology-related space;
•inability to collect rent from customers;
•vacancies or our inability to rent space on favorable terms;
•inability to finance property development and acquisitions on favorable terms;
•increased operating costs to the extent not paid for by our customers;
•costs of complying with changes in governmental regulations;
• | the relative illiquidity of real estate investments, especially the specialized real estate properties that we hold and seek to acquire and develop; and |
•changing market demographics.
Illiquidity of real estate investments, particularly our data centers, could significantly impede our ability to respond to adverse changes in the performance of our properties, which could harm our financial condition.
Because real estate investments are relatively illiquid, our ability to promptly sell one or more properties in our portfolio in response to adverse changes in the real estate market or in the performance of such properties may be limited, thus harming our financial condition. The real estate market is affected by many factors that are beyond our control, including:
•adverse changes in national and local economic and market conditions;
•changes in interest rates and in the availability, cost and terms of debt financing;
•changes in governmental laws and regulations, fiscal policies and zoning ordinances and costs of compliance therewith;
•the ongoing cost of capital improvements that are not passed on to our customers, particularly in older structures;
•changes in operating expenses; and
• | civil unrest, acts of war, terrorism and natural disasters, including fires, earthquakes, tropical storms, hurricanes, and floods, which may result in uninsured and underinsured losses. |
The risks associated with the illiquidity of real estate investments are even greater for our data center properties. Our data centers are highly specialized real estate assets containing extensive electrical and mechanical systems that are uniquely designed to house and maintain our customers’ equipment, and, as such, have little, if any, traditional office space. As a result, most of our data centers are not suited for use by customers as anything other than as data centers and major renovations and expenditures would be required in order for us to re-lease data center space for more traditional commercial or industrial uses, or for us to sell a property to a buyer for use other than as a data center. Further, we operate a branded platform based business that would not easily be separated on an asset by asset basis.
Risks Related to Our Organizational Structure
Our rights and the rights of our stockholders to take action against our directors and officers are limited.
Maryland law provides that a director has no liability in the capacity as a director if he or she performs his or her duties in good faith, in a manner he or she reasonably believes to be in the company’s best interests and with the care that an ordinarily prudent person in a like position would use under similar circumstances. As permitted by the Maryland General Corporation Law (MGCL), our charter limits the liability of our directors and officers to the company and our stockholders for money damages, except for liability resulting from:
•actual receipt of an improper benefit or profit in money, property or services; or
• | a final judgment based upon a finding of active and deliberate dishonesty by the director or officer that was material to the cause of action adjudicated. |
In addition, our charter authorizes us to obligate the company, and our bylaws require us, to indemnify our directors and officers for actions taken by them in those capacities and to pay or reimburse their reasonable expenses in advance of final disposition of a proceeding to the maximum extent permitted by Maryland law, and we have entered into indemnification agreements with our directors and executive officers. As a result, we and our stockholders may have more limited rights against our directors and officers than might otherwise exist under common law. Accordingly, in the event that any of our directors or officers are exculpated
33
from, or indemnified against, liability but whose actions impede our performance, our stockholders’ ability to recover damages from that director or officer will be limited.
Conflicts of interest exist or could arise in the future with our operating partnership or its partners.
Conflicts of interest exist or could arise in the future as a result of the relationships between us and our affiliates, on the one hand, and our operating partnership or any partner thereof, on the other. Our directors and officers have duties to our company under applicable Maryland law in connection with their direction of the management of our company. At the same time, we, as trustee, have duties to CyrusOne GP, which, in turn, as general partner of our operating partnership, has duties to our operating partnership and to the limited partners under Maryland law in connection with the management of our operating partnership. Under Maryland law, the general partner of a Maryland limited partnership has fiduciary duties of care and loyalty, and an obligation of good faith, to the partnership and its partners. While these duties and obligations cannot be eliminated entirely in the limited partnership agreement, Maryland law permits the parties to a limited partnership agreement to specify certain types or categories of activities that do not violate the general partner’s duty of loyalty and to modify the duty of care and obligation of good faith, so long as such modifications are not unreasonable. These duties as general partner of our operating partnership to the partnership and its partners may come into conflict with the interests of our company. Under the partnership agreement of our operating partnership, the limited partners of our operating partnership expressly agree that the general partner of our operating partnership is acting for the benefit of the operating partnership, the limited partners of our operating partnership and our stockholders, collectively. The general partner is under no obligation to give priority to the separate interests of the limited partners in deciding whether to cause our operating partnership to take or decline to take any actions. If there is a conflict between the interests of us or our stockholders, on the one hand, and the interests of the limited partners of our operating partnership, on the other, the partnership agreement of our operating partnership provides that any action or failure to act by the general partner that gives priority to the separate interests of us or our stockholders that does not result in a violation of the contractual rights of the limited partners of our operating partnership under the partnership agreement will not violate the duties that the general partner owes to our operating partnership and its partners.
Additionally, the partnership agreement of our operating partnership expressly limits our liability by providing that we and our directors, officers, agents and employees will not be liable or accountable to our operating partnership or its partners for money damages. In addition, our operating partnership is required to indemnify us, our directors, officers and employees, the general partner and its trustees, officers and employees, employees of our operating partnership and any other persons whom the general partner may designate from and against any and all claims arising from operations of our operating partnership in which any indemnitee may be involved, or is threatened to be involved, as a party or otherwise unless it is established by a final judgment that the act or omission of the indemnitee constituted fraud, intentional harm or gross negligence on the part of the indemnitee, the claim is brought by the indemnitee (other than to enforce the indemnitee’s rights to indemnification or advance of expenses) or the indemnitee is found to be liable to our operating partnership, and then only with respect to each such claim.
No reported decision of a Maryland appellate court has interpreted provisions that are similar to the provisions of the partnership agreement of our operating partnership that modify the fiduciary duties of the general partner of our operating partnership, and we have not obtained an opinion of counsel regarding the enforceability of the provisions of the partnership agreement that purport to waive or modify the fiduciary duties and obligations of the general partner of our operating partnership.
Our charter and bylaws and the partnership agreement of our operating partnership contain provisions that may delay, defer or prevent an acquisition of our common stock or a change in control.
Our charter and bylaws contain a number of provisions, the exercise or existence of which could delay, defer or prevent a transaction or a change in control that might involve a premium price for our stockholders or otherwise be in their best interests, including the following:
• | Our Charter Contains Restrictions on the Ownership and Transfer of Our Stock. In order for us to qualify as a REIT, no more than 50% of the value of outstanding shares of our stock may be owned, beneficially or constructively, by five or fewer individuals at any time during the last half of each taxable year other than the first year for which we elect to be taxed as a REIT. Subject to certain exceptions, our charter prohibits any stockholder from owning beneficially or constructively more than 9.8% in value or in number of shares, whichever is more restrictive, of the outstanding shares of our common stock, or 9.8% in value of the aggregate of the outstanding shares of all classes or series of our stock. We refer to these restrictions collectively as the “ownership limits.” The constructive ownership rules under the Code are complex and may cause the outstanding stock owned by a group of related individuals or entities to be deemed to be constructively owned by one individual or entity. As a result, the acquisition of less than 9.8% of our outstanding common stock or the outstanding shares of all classes or series of our stock by an individual or entity could cause that individual or entity or another individual or entity to own constructively in excess of the relevant ownership limits. Our charter also prohibits any person from owning shares of our stock that would result in our being “closely held” under Section 856(h) of the Code or otherwise cause us to fail to qualify as a REIT. Any attempt to own or transfer shares of our common stock |
34
or of any of our other capital stock in violation of these restrictions may result in the shares being automatically transferred to a charitable trust or may be void. These ownership limits may prevent a third-party from acquiring control of us if our board of directors does not grant an exemption from the ownership limits, even if our stockholders believe the change in control is in their best interests. Although it is under no continuing obligation to do so, our board of directors has granted some limited exemptions from the ownership limits applicable to other holders of our common stock, subject to certain initial and ongoing conditions designed to protect our status as a REIT, including, if deemed advisable, the receipt of an Internal Revenue Service (IRS) private letter ruling or an opinion of counsel.
• | Our Board of Directors Has the Power to Cause Us to Issue Additional Shares of Our Stock Without Stockholder Approval. Our charter authorizes us to issue additional authorized but unissued shares of common or preferred stock. In addition, our board of directors may, without stockholder approval, amend our charter to increase the aggregate number of our shares of stock or the number of shares of stock of any class or series that we have authority to issue and classify or reclassify any unissued shares of common or preferred stock and set the preferences, rights and other terms of the classified or reclassified shares. As a result, our board of directors may establish a series of shares of common or preferred stock that could delay or prevent a transaction or a change in control that might involve a premium price for our shares of common stock or otherwise be in the best interests of our stockholders. |
Certain provisions of Maryland law may limit the ability of a third-party to acquire control of us.
Certain provisions of the MGCL may have the effect of inhibiting a third-party from acquiring us or of impeding a change of control under circumstances that otherwise could provide our common stockholders with the opportunity to realize a premium over the then-prevailing market price of such shares, including:
• | “business combination” provisions that, subject to limitations, prohibit certain business combinations between an “interested stockholder” (defined generally as any person who beneficially owns 10% or more of the voting power of our outstanding shares of voting stock or an affiliate or associate of the corporation who, at any time within the two-year period immediately prior to the date in question, was the beneficial owner of 10% or more of the voting power of the then outstanding stock of the corporation) or an affiliate of any interested stockholder and us for five years after the most recent date on which the stockholder becomes an interested stockholder, and thereafter imposes two super-majority stockholder voting requirements on these combinations; and |
• | “control share” provisions that provide that holders of “control shares” of our company (defined as voting shares of stock that, if aggregated with all other shares of stock owned or controlled by the acquirer, would entitle the acquirer to exercise one of three increasing ranges of voting power in electing directors) acquired in a “control share acquisition” (defined as the direct or indirect acquisition of issued and outstanding “control shares”) have no voting rights except to the extent approved by our stockholders by the affirmative vote of at least two-thirds of all of the votes entitled to be cast on the matter, excluding all interested shares. |
Pursuant to the Maryland Business Combination Act, our board of directors has by resolution exempted from the provisions of the Maryland Business Combination Act business combinations between any other person and us, provided that such business combination is first approved by our board of directors (including a majority of our directors who are not affiliates or associates of such person). Our bylaws contain a provision exempting from the Maryland Control Share Acquisition Act any and all acquisitions by any person of shares of our stock. There can be no assurance that these exemptions or resolutions will not be amended or eliminated at any time in the future.
Additionally, Title 3, Subtitle 8 of the MGCL permits our board of directors, without stockholder approval and regardless of what is currently provided in our charter or bylaws, to implement certain takeover defenses, such as a classified board, some of which we do not have.
Our bylaws designate the Circuit Court for Baltimore City, Maryland, as the sole and exclusive forum for certain types of actions and proceedings that may be initiated by our stockholders, which could limit our stockholders’ ability to bring a claim in a judicial forum that the stockholders believe is a more favorable judicial forum for disputes with us or our directors, officers or other employees.
Our bylaws provide that, subject to limited exceptions, the Circuit Court for Baltimore City, Maryland, is the sole and exclusive
forum for (a) any derivative action or proceeding brought on our behalf, (b) any action asserting a claim of breach of any duty owed by any of our directors, officers or other employees to us or our stockholders, (c) any action asserting a claim against us or any of our directors, officers or other employees arising pursuant to any provision of the MGCL, our charter or our bylaws or (d) any action asserting a claim against us or any of our directors, officers or other employees that is governed by the internal affairs doctrine. This provision may limit a stockholder’s ability to bring a claim in a judicial forum that it believes is more favorable for
35
disputes against us or our directors, officers or employees, which may discourage such lawsuits against us and our directors, officers and other employees.
Risks Related to Status as a REIT
If we fail to remain qualified as a REIT, we will be subject to U.S. federal income tax as a regular corporation and could face a substantial tax liability, which would reduce the amount of cash available for distribution to our stockholders.
CyrusOne Inc. has elected to be taxed as a REIT under the Code commencing with our initial taxable year ending December 31, 2013. We intend to continue to operate in a manner that will allow us to remain qualified as a REIT. Our qualification as a REIT depends on our satisfaction of certain asset, income, organizational, distribution, stockholder ownership and other requirements on a continuing basis. Our ability to satisfy the asset tests depends upon our analysis of the characterization and fair market values of our assets, some of which are not susceptible to a precise determination, and for which we do not obtain independent appraisals.
We have received a private letter ruling from the IRS with respect to certain issues relevant to our qualification as a REIT. In general, the ruling provides, subject to the terms and conditions contained therein, that certain structural components of our properties (e.g., relating to the provision of electricity, heating, ventilation and air conditioning, regulation of humidity, security and fire protection, and telecommunications services) and intangible assets, and certain services that we may provide, directly or through subsidiaries, to our tenants, will not adversely affect our qualification as a REIT. Although we may generally rely upon the ruling, no assurance can be given that the IRS will not challenge our qualification as a REIT on the basis of other issues or facts outside the scope of the ruling.
If we were to fail to qualify as a REIT in any taxable year, we would be subject to U.S. federal income tax, including, for taxable years beginning prior to January 1, 2018, any applicable alternative minimum tax, on our taxable income at regular corporate rates, and dividends paid to our stockholders would not be deductible by us in computing our taxable income. Any resulting corporate tax liability could be substantial and would reduce the amount of cash available for distribution to our stockholders, which in turn could have an adverse impact on the value of our common stock. Unless we were entitled to relief under certain Code provisions, we would also be disqualified from re-electing to be taxed as a REIT for the four taxable years following the year in which we failed to qualify as a REIT.
Qualifying as a REIT involves highly technical and complex provisions of the Code.
Qualification as a REIT involves the application of highly technical and complex Code provisions for which only limited judicial and administrative authorities exist. Even a technical or inadvertent violation could jeopardize our REIT qualification. Our continued qualification as a REIT will depend on our satisfaction of certain asset, income, organizational, distribution, stockholder ownership and other requirements on a continuing basis. In addition, our ability to satisfy the requirements to qualify as a REIT may depend in part on the actions of third parties over which we have no control or only limited influence, including in cases where we own an equity interest in an entity that is classified as a partnership for U.S. federal income tax purposes.
Dividends payable by REITs generally do not qualify for the reduced tax rates available for some dividends, but certain stockholders may be entitled to deduct up to 20% of dividends payable by REITs.
"Qualified dividend income" payable to U.S. stockholders that are individuals, trusts or estates is generally subject to tax at preferential rates, but dividends payable by REITs generally do not constitute “qualified dividend income”. For taxable years beginning after December 31, 2017 and before January 1, 2026, however, U.S. stockholders that are individuals, trusts or estates generally will be entitled to deduct up to 20% of “qualified REIT dividends”. A “qualified REIT dividend” is any dividend from a REIT received during the taxable year that is not designated by the REIT as a “capital gain dividend” or as “qualified dividend income”.
REIT distribution requirements could adversely affect our ability to execute our business plan.
We generally must distribute annually at least 90% of our REIT taxable income, determined without regard to the dividends paid deduction and excluding any net capital gains, in order for us to qualify as a REIT (assuming that certain other requirements are also satisfied) so that U.S. federal corporate income tax does not apply to earnings that we distribute. To the extent that we satisfy this distribution requirement and qualify for taxation as a REIT but distribute less than 100% of our REIT taxable income, determined without regard to the dividends paid deduction and including any net capital gains, we will be subject to U.S. federal corporate income tax on our undistributed net taxable income. In addition, we will be subject to a 4% nondeductible excise tax if the actual amount that we distribute to our stockholders in a calendar year is less than a minimum amount specified under U.S. federal tax laws. We intend to make distributions to our stockholders to comply with the REIT requirements of the Code.
From time to time, we may generate taxable income greater than our cash flow as a result of differences in timing between the recognition of taxable income and the actual receipt of cash or the effect of nondeductible capital expenditures, the creation of
36
reserves or required debt or amortization payments. If we do not have other funds available in these situations, we could be required to borrow funds on unfavorable terms, sell assets at disadvantageous prices or distribute amounts that would otherwise be invested in future acquisitions to make distributions sufficient to enable us to pay out enough of our taxable income to satisfy the REIT distribution requirement and to avoid corporate income tax and the 4% excise tax in a particular year. These alternatives could increase our costs or reduce our equity. Thus, compliance with the REIT requirements may hinder our ability to grow, which could adversely affect the value of our common stock.
Even if we remain qualified as a REIT, we may face other tax liabilities that reduce our cash flow.
Even if we remain qualified for taxation as a REIT, we may be subject to certain U.S. federal, state and local taxes on our income and assets, including taxes on any undistributed income and state or local income, property and transfer taxes. For example, in order to meet the REIT qualification requirements, we may hold some of our assets or conduct certain of our activities through one or more TRS or other subsidiary corporations that will be subject to federal, state, and local corporate-level income taxes as regular C corporations. In addition, we may incur a 100% excise tax on transactions with a TRS if they are not conducted on an arm’s length basis. Any of these taxes would decrease cash available for distribution to our stockholders.
Complying with REIT requirements may cause us to forgo otherwise attractive opportunities.
To qualify as a REIT, we must ensure that, at the end of each calendar quarter, at least 75% of the value of our assets consists of cash, cash items, government securities and “real estate assets” (as defined in the Code), including certain mortgage loans and securities. The remainder of our investments (other than government securities, qualified real estate assets and securities issued by a TRS) generally cannot include more than 10% of the outstanding voting securities of any one issuer or more than 10% of the total value of the outstanding securities of any one issuer. In addition, in general, no more than 5% of the value of our total assets (other than government securities, qualified real estate assets and securities issued by a TRS) can consist of the securities of any one issuer, and no more than 25% (or 20% for tax years beginning on or after January 1, 2018) of the value of our total assets can be represented by securities of one or more TRS. If we fail to comply with these requirements at the end of any calendar quarter, we must correct the failure within 30 days after the end of the calendar quarter or qualify for certain statutory relief provisions to avoid losing our REIT qualification and suffering adverse tax consequences. As a result, we may be required to liquidate or forgo otherwise attractive investments. These actions could have the effect of reducing our income and amounts available for distribution to our stockholders.
In addition to the asset tests set forth above, to continue to qualify as a REIT we must continually satisfy tests concerning, among other things, the sources of our income, the amounts we distribute to our stockholders and the ownership of our stock. We may be unable to pursue investments that would be otherwise advantageous to us in order to satisfy the source-of-income or asset-diversification requirements for qualifying as a REIT. Thus, compliance with the REIT requirements may hinder our ability to make certain attractive investments.
Complying with REIT requirements may limit our ability to hedge effectively and may cause us to incur tax liabilities.
The REIT provisions of the Code substantially limit our ability to hedge our assets and liabilities. Any income from a hedging transaction that we enter into to manage risk of interest rate changes with respect to borrowings made or to be made to acquire or carry real estate assets does not constitute “gross income” for purposes of the 75% or 95% gross income tests that apply to REITs, provided that certain identification requirements are met. To the extent that we enter into other types of hedging transactions or fail to properly identify such transaction as a hedge, the income is likely to be treated as non-qualifying income for purposes of both of the gross income tests. As a result of these rules, we may be required to limit our use of advantageous hedging techniques or implement those hedges through a TRS. This could increase the cost of our hedging activities because our TRS may be subject to tax on gains or expose us to greater risks associated with changes in interest rates than we would otherwise want to bear. In addition, losses in our TRS will generally not provide any tax benefit, except that such losses may be carried forward to offset future taxable income of the TRS.
Changes to U.S. federal income tax laws could materially and adversely affect us and our stockholders.
The present U.S. federal income tax treatment of REITs and their shareholders may be modified, possibly with retroactive effect, by legislative, judicial or administrative action at any time, which could affect the U.S. federal income tax treatment of an investment in our shares. The U.S. federal income tax rules, including those dealing with REITs, are constantly under review by persons involved in the legislative process, the IRS and the U.S. Treasury Department, which results in statutory changes as well as frequent revisions to regulations and interpretations.
The recently enacted Tax Cuts and Jobs Act ("TCJA") makes substantial changes to the Code. Among those changes are a significant permanent reduction in the generally applicable corporate tax rate, a temporary reduction in the highest marginal income tax rate applicable to individuals subject to a “sunset” provision, the elimination or modification of various currently allowed deductions
37
(including substantial limitations on the deductibility of interest), certain additional limitations on the deduction of net operating losses and preferential rates of taxation on most ordinary REIT dividends and certain business income derived by non-corporate taxpayers in comparison to other ordinary income recognized by such taxpayers. The effect of these, and the many other, changes made in the TCJA is highly uncertain, both in terms of their direct effect on the taxation of an investment in our common stock and their indirect effect on the value of our assets or shares of our common stock or market conditions generally. Furthermore, many of the provisions of the TCJA will require guidance through the issuance of Treasury regulations in order to assess their effect. There may be a substantial delay before such regulations are promulgated, increasing the uncertainty as to the ultimate effect of the statutory amendments on us. There may also be technical corrections legislation proposed with respect to the TCJA, the effect and timing of which cannot be predicted and which may be adverse to us or our stockholders. See Note 19, Income Taxes to our audited consolidated financial statements for a further discussion of the TCJA.
Risks Related to our Debt and Equity Securities
Our cash available for distribution to stockholders may not be sufficient to make distributions at expected levels, and we may need to borrow in order to make such distributions; consequently, we may not be able to make such distributions in full.
If cash available for distribution generated by our assets is less than our estimate or if such cash available for distribution decreases in future periods from expected levels, our inability to make the expected distributions could result in a decrease in the market price of our common stock. Distributions made by us will be authorized and determined by our board of directors in its sole discretion out of funds legally available therefor and will be dependent upon a number of factors, including restrictions under applicable law and our capital requirements. We may not be able to make or sustain distributions in the future. To the extent that we decide to make distributions in excess of our current and accumulated earnings and profits, such distributions would generally be considered a return of capital for U.S. federal income tax purposes to the extent of the holder’s adjusted tax basis in its shares. A return of capital is not taxable, but it has the effect of reducing the holder’s adjusted tax basis in its investment. To the extent that distributions exceed the adjusted tax basis of a holder’s shares, they will be treated as gain from the sale or exchange of such stock. If we borrow to fund distributions, our future interest costs would increase, thereby reducing our earnings and cash available for distribution from what they otherwise would have been.
Future offerings of debt, which would be senior to our common stock upon liquidation, and/or preferred equity securities, which may be senior to our common stock for purposes of distributions or upon liquidation, may adversely affect the market price of our common stock.
In the future, we may attempt to increase our capital resources by making additional offerings of debt or preferred equity securities, including medium-term notes, trust preferred securities, senior or subordinated notes and preferred stock. Upon liquidation, holders of our debt securities and shares of preferred stock and lenders with respect to other borrowings will receive distributions of our available assets prior to the holders of our common stock. Additional equity offerings may dilute the holdings of our existing stockholders or reduce the market price of our common stock, or both. Holders of our common stock are not entitled to preemptive rights or other protections against dilution. Our preferred stock, if issued, could have a preference on liquidating distributions or a preference on distribution payments that could limit our ability to make a distribution to the holders of our common stock. Because our decision to issue securities in any future offering will depend on market conditions and other factors beyond our control, we cannot predict or estimate the amount, timing or nature of our future offerings. Thus, our stockholders bear the risk of our future offerings reducing the market price of our common stock and diluting their stock holdings in us.
Increases in market interest rates may cause potential investors to seek higher dividend yields and therefore reduce demand for our common stock and result in a decline in our stock price.
One of the factors that may influence the price of our common stock is the dividend yield on our common stock (the amount of dividends as a percentage of the price of our common stock) relative to market interest rates. An increase in market interest rates, which are currently at low levels relative to historical rates, may lead prospective purchasers of our common stock to expect a higher dividend yield, which we may be unable or choose not to provide. Higher interest rates would likely increase our borrowing costs and potentially decrease the cash available for distribution. Thus, higher market interest rates could cause the market price of our common stock to decline.
The number of shares available for future sale could adversely affect the market price of our common stock.
We cannot predict whether future issuances of shares of our common stock or the availability of shares of our common stock for resale in the open market will decrease the market price per share of our common stock. Sales of a substantial number of shares of our common stock in the public market, or the perception that such sales might occur, could adversely affect the market price of the shares of our common stock. For example, upon physical settlement of the Forward Sale Agreements, we issued approximately 4.4 million shares of our common stock. Physical settlement of the Forward Sale Agreements resulted in dilution to our earnings
38
per share. We have registered shares of common stock that were reserved for issuance under our Restated 2012 Long Term Incentive Plan and under our 2014 Employee Stock Purchase Plan, and they can generally be freely sold in the public market, assuming any applicable restrictions and vesting requirements are satisfied. If any or all of these holders cause a large number of their shares to be sold in the public market, the sales could reduce the trading price of our common stock and could impede our ability to raise future capital on terms acceptable to us or at all.
The market price and trading volume of our common stock may be volatile.
The market price of our common stock may be volatile. In addition, the trading volume in our common stock may fluctuate and cause significant price variations to occur. If the market price of our common stock declines significantly, a holder may be unable to resell shares at a profit or at all. We cannot provide any assurance that the market price of our common stock will not fluctuate or decline significantly in the future.
Some of the factors that could negatively affect the market price of our common stock or result in fluctuations in the price or trading volume of our common stock include:
•actual or anticipated variations in our quarterly results of operations or distributions;
•changes in our funds from operations or earnings estimates;
•publication of research reports about us or the real estate, technology or data center industries;
•increases in market interest rates that may cause purchasers of our shares to demand a higher yield;
•changes in market valuations of similar companies;
•adverse market reaction to any additional debt we may incur in the future;
•additions or departures of key personnel;
•actions by institutional stockholders;
•speculation in the press or investment community about our company or industry or the economy in general;
•the occurrence of any of the other risk factors presented in this Annual Report on Form 10-K; and
•general market and economic conditions.
Our earnings and cash distributions will affect the market price of shares of our common stock.
To the extent that the market value of a REIT’s equity securities is based primarily upon market perception of the REIT’s growth potential and its current and potential future cash distributions, whether from operations, sales, acquisitions, development or refinancing and is secondarily based upon the value of the underlying assets, shares of our common stock may trade at prices that are higher or lower than the net asset value per share. To the extent we retain operating cash flow for investment purposes, working capital reserves or other purposes rather than distributing the cash flow to stockholders, these retained funds, while increasing the value of our underlying assets, may negatively impact the market price of our common stock. Our failure to meet market expectations with regard to future earnings and cash distributions would likely adversely affect the market price of our common stock.
39
ITEM 1B. UNRESOLVED STAFF COMMENTS
None.
ITEM 2. PROPERTIES
The information set forth under the caption “Our Portfolio” in Item 1 of this Annual Report on Form 10-K is incorporated by reference herein.
ITEM 3. LEGAL PROCEEDINGS
In the ordinary course of our business, from time to time, we are subject to claims and administrative proceedings. We do not believe any currently outstanding matters would have, individually or in the aggregate, a material effect on our business, financial condition and results of operations or liquidity and cash flows.
ITEM 4. MINE SAFETY DISCLOSURES
Not applicable.
40
PART II
ITEM 5. MARKET FOR REGISTRANT’S COMMON EQUITY, RELATED STOCKHOLDER MATTERS AND ISSUER PURCHASE OF EQUITY SECURITIES.
A)Market Information
Our common stock is listed on the NASDAQ Global Select Market under the symbol “CONE”. The following table sets forth the high and low sales price of our common stock and the distributions we declared with respect to the periods indicated.
Market Price | |||||||||
High | Low | Dividend declared | |||||||
First Quarter 2016 | $ | 45.92 | $ | 32.42 | $ | 0.38 | |||
Second Quarter 2016 | 55.66 | 42.26 | 0.38 | ||||||
Third Quarter 2016 | 57.00 | 47.13 | 0.38 | ||||||
Fourth Quarter 2016 | 49.61 | 38.80 | 0.38 | ||||||
First Quarter 2017 | 51.91 | 44.66 | 0.42 | ||||||
Second Quarter 2017 | 59.35 | 50.56 | 0.42 | ||||||
Third Quarter 2017 | 65.73 | 53.75 | 0.42 | ||||||
Fourth Quarter 2017 | 64.62 | 57.02 | 0.42 | ||||||
B)Holders
As of February 13, 2018, CyrusOne Inc. had 96,125,762 outstanding shares.
C)Distribution Policy
We have made distributions in the form of dividends each quarter since the completion of our IPO as shown in the table above. In order to comply with the REIT requirements of the Code, we plan to continue to make quarterly distributions to our shareholders of at least 90% of our taxable income. Distributions made by us will be authorized and determined by our board of directors in its sole discretion out of funds legally available therefore and will be dependent upon a number of factors, including restrictions under applicable law and other factors. If we have underestimated our cash available for distribution, we may need to increase our borrowings in order to fund our intended distributions. Notwithstanding the foregoing, our Second Amended and Restated Credit Agreement and indentures restrict CyrusOne LP from making distributions to holders of its operating partnership units, or redeeming or otherwise repurchasing shares of its operating partnership units, after the occurrence and during the continuance of an event of default, except in limited circumstances including as necessary to enable CyrusOne Inc. to maintain its qualification as a REIT and to minimize the payment of income taxes.
D)Recent Sales of Unregistered Securities
None.
The following graph compares the cumulative total stockholder return on CyrusOne Inc.’s common stock for the year ended December 31, 2017, with the cumulative total return on the S&P 500 Market Index and the MSCI US REIT Index (RMZ). The comparison assumes that $100 was invested on January 18, 2013, the date of the Company's IPO, in CyrusOne Inc.’s common stock and in each of these indices and assumes reinvestment of dividends, if any.
41
E) Stock Performance
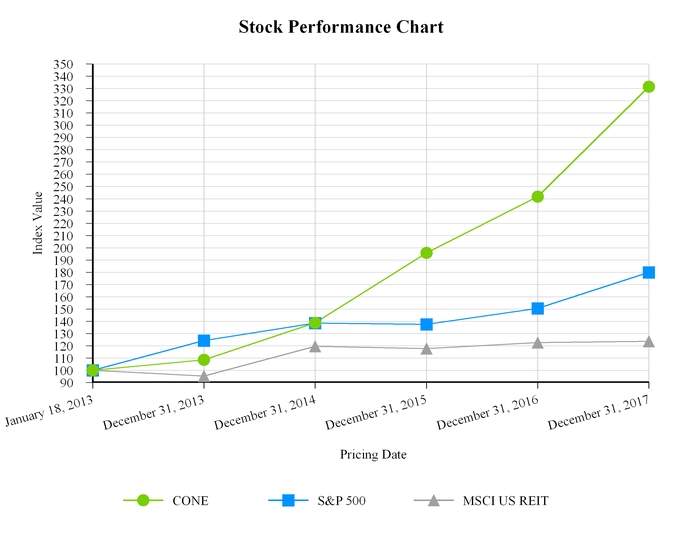
Pricing Date | CONE | S&P 500 | MSCI US REIT | ||||||
January 18, 2013 | $ | 100.00 | $ | 100.00 | $ | 100.00 | |||
December 31, 2013 | 108.62 | 124.39 | 95.41 | ||||||
December 31, 2014 | 138.71 | 138.56 | 119.53 | ||||||
December 31, 2015 | 195.91 | 137.55 | 117.73 | ||||||
December 31, 2016 | 241.75 | 150.66 | 122.70 | ||||||
December 31, 2017 | 331.51 | 179.92 | 123.76 | ||||||
F) Issuer Purchases of Equity Securities
None.
42
ITEM 6. SELECTED FINANCIAL DATA
The following table sets forth selected financial and operating data on a consolidated and combined historical basis.
Our business was originally comprised of the historical data center activities and holdings of CBI. CBI operated a Cincinnati-based data center business for 10 years before acquiring Cyrus Networks LLC, a data center operator in Texas. In anticipation of our IPO, these businesses were combined under our operating partnership, CyrusOne LP, which was created as a Maryland limited partnership on July 31, 2012. CyrusOne Inc., a Maryland corporation, was also formed on July 31, 2012, and is the parent of the wholly owned general partner of the operating partnership. Effective December 31, 2013, CyrusOne Inc. qualified as a real estate investment trust for federal income tax purposes. Certain activities are conducted through our taxable REIT subsidiaries, CyrusOne TRS Inc., a Delaware corporation, and CyrusOne Finance Corp., a Maryland corporation.
The financial information presented below as of December 31, 2017 and 2016, for the years ended December 31, 2017, December 31, 2016 and December 31, 2015 has been derived from our audited consolidated financial statements included elsewhere in the Form 10-K. The financial information for the year ended December 31, 2014 and the periods ended January 23, 2013 (January 1, 2013 to January 23, 2013) and December 31, 2013 (January 24, 2013 to December 31, 2013) has been derived from our audited consolidated and combined financial statements not included in this Form 10-K. The historical financial information as of December 31, 2013 has been derived from CBI's combined financial statements not included in this Form 10-K and is presented as the "Predecessor" in the financial information.
The following selected financial data should be read in conjunction with our combined historical financial statements and the related notes and with “Management’s Discussion and Analysis of Financial Condition and Results of Operations,” which are included elsewhere in this Form 10-K.
43
IN MILLIONS, except per share data | ||||||||||||||||||
Successor | Predecessor | |||||||||||||||||
2017 | 2016 | 2015 | 2014 | January 24, 2013 to December 31, 2013 | January 1, 2013 to January 23, 2013 | |||||||||||||
Statement of Operations Data: | ||||||||||||||||||
Revenue | $ | 672.0 | $ | 529.1 | $ | 399.3 | $ | 330.9 | $ | 248.4 | $ | 15.1 | ||||||
Costs and expenses: | ||||||||||||||||||
Property operating expenses | 235.1 | 187.5 | 148.7 | 124.5 | 88.4 | 4.8 | ||||||||||||
Sales and marketing | 17.0 | 16.9 | 12.1 | 12.8 | 9.9 | 0.7 | ||||||||||||
General and administrative | 67.0 | 60.7 | 46.6 | 34.6 | 26.5 | 1.5 | ||||||||||||
Depreciation and amortization | 258.9 | 183.9 | 141.5 | 118.0 | 89.9 | 5.3 | ||||||||||||
Restructuring costs (a) | — | — | — | — | 0.7 | — | ||||||||||||
Transaction and acquisition integration costs (b) | 10.4 | 4.3 | 14.1 | 1.0 | 1.3 | 0.1 | ||||||||||||
Transaction-related compensation (c) | — | — | — | — | — | 20.0 | ||||||||||||
Asset impairments and loss on disposal (d) | 59.5 | 5.3 | 13.5 | — | 2.8 | — | ||||||||||||
Operating income (loss) | 24.1 | 70.5 | 22.8 | 40.0 | 28.9 | (17.3 | ) | |||||||||||
Interest expense | 68.1 | 48.8 | 41.2 | 39.5 | 41.2 | 2.5 | ||||||||||||
Other income | — | — | — | — | (0.1 | ) | — | |||||||||||
Loss on extinguishment of debt (e) | 36.5 | — | — | 13.6 | 1.3 | — | ||||||||||||
Income tax (expense) benefit | (3.0 | ) | (1.8 | ) | (1.8 | ) | (1.4 | ) | (1.9 | ) | (0.4 | ) | ||||||
Income (loss) from continuing operations | (83.5 | ) | 19.9 | (20.2 | ) | (14.5 | ) | (15.4 | ) | (20.2 | ) | |||||||
Loss on sale of real estate improvements (f) | — | — | — | — | (0.2 | ) | — | |||||||||||
Net income (loss) from continuing operations | (83.5 | ) | 19.9 | (20.2 | ) | (14.5 | ) | (15.6 | ) | $ | (20.2 | ) | ||||||
Noncontrolling interest in net loss | — | — | (4.8 | ) | (6.7 | ) | (10.3 | ) | ||||||||||
Net income (loss) attributed to common shareholders | $ | (83.5 | ) | $ | 19.9 | $ | (15.4 | ) | $ | (7.8 | ) | $ | (5.3 | ) | ||||
Per share data: | ||||||||||||||||||
Basic weighted average common shares outstanding | 88.9 | 78.3 | 54.3 | 29.2 | 20.9 | |||||||||||||
Diluted weighted average common shares outstanding | 88.9 | 79.0 | 54.3 | 29.2 | 20.9 | |||||||||||||
Basic and diluted income (loss) per common share | $ | (0.95 | ) | $ | 0.24 | $ | (0.30 | ) | $ | (0.30 | ) | $ | (0.28 | ) | ||||
Dividends declared per share | $ | 1.68 | $ | 1.52 | $ | 1.26 | $ | 0.84 | $ | 0.64 | ||||||||
Balance Sheet Data (at year end): | ||||||||||||||||||
Investment in real estate, net | $ | 3,058.4 | $ | 2,023.1 | $ | 1,392.0 | $ | 1,051.4 | $ | 883.8 | ||||||||
Total assets | 4,312.1 | 2,852.4 | 2,195.6 | 1,571.0 | 1,506.8 | |||||||||||||
Debt (g) | 2,099.5 | 1,250.9 | 1,008.7 | 657.7 | 541.7 | |||||||||||||
Lease financing arrangements (h) | 131.9 | 135.7 | 150.0 | 53.4 | 56.3 | |||||||||||||
Noncontrolling interest/Parent net investment (i) | — | — | — | 256.2 | 455.6 | |||||||||||||
Other Financial Data: | ||||||||||||||||||
Capital expenditures | $ | 1,406.8 | $ | 731.1 | $ | 234.5 | $ | 284.2 | $ | 220.9 | $ | 7.7 | ||||||
(a) | Represents a restructuring charge recognized in 2013 as a result of moving certain administrative functions to the Company's corporate office. |
(b) | Represents legal, accounting and consulting fees incurred in connection with the formation transactions, completed and potential business combinations, integration of acquisitions, failed transactions and costs of secondary offerings. |
(c) | Represents compensation expense for the year ended December 31, 2013 related to a long-term incentive plan tied to the IPO. On April 8, 2013, CBI reimbursed the Company for $19.6 million of these costs. |
(d) | See Item 7 for discussion of costs incurred in 2017, 2016 and 2015. In 2013, amount recognized represents asset impairments recognized on real estate related equipment. |
(e) | See Item 7 for discussion of costs incurred in 2017. The 2014 amount represents a loss of $13.6 million associated with the repurchase of 6.375% senior notes and the write-off of deferred financing costs. The 2013 amount represents a loss of $1.3 million associated with the termination of the financing obligations for two of our facilities by purchasing the properties from the former lessors. |
(f) | Represents the loss that was recognized on the sale of equipment in connection with upgrading of the equipment at various data center facilities. |
(g) | See Note 10, Long-Term Debt, Capital Lease Obligations and Lease Financing Arrangements to our audited consolidated financial statements included elsewhere in the Annual Report on Form 10-K for details of Long-term debt as of December 31, 2017 and 2016. As of December 31, 2015 and 2014, debt |
44
consisted of our $525 million 6.375% senior notes due 2022, revolving credit facility, term loan facility and capital lease obligations. As of December 31, 2013, debt consisted of our $525 million 6.375% senior notes due 2022 and capital lease obligations.
(h) | Lease financing arrangements represent leases of real estate where we were involved in the construction of structural improvements to develop buildings into data centers. When we bear substantially all the construction period risk, such as managing or funding construction, we are deemed to be the accounting owner of the leased property. These transactions generally do not qualify for sale-leaseback accounting due to our continued involvement in these data center operations. For these transactions, at the lease inception date, we recognize the fair value of the leased building as an asset in investment in real estate and as a liability in lease financing arrangements. See Note 10, Long-Term Debt, Capital Lease Obligations and Lease Financing Arrangements to our audited consolidated financial statements. |
(i) | Parent's net investment represents CBI's net investment in CyrusOne Inc., CyrusOne GP, CyrusOne LP and its subsidiaries. Prior to November 20, 2012, these entities were not separate legal entities. |
45
ITEM 7. MANAGEMENT’S DISCUSSION AND ANALYSIS OF FINANCIAL CONDITION AND RESULTS OF OPERATIONS
You should read the following discussion and analysis of our results of operations, financial condition and liquidity in conjunction with our consolidated financial statements and the related notes included elsewhere in this Annual Report on Form 10-K. Some of the information contained in this discussion and analysis or set forth elsewhere in this report, including information with respect to our plans and strategies for our business, statements regarding the industry outlook, our expectations regarding the future performance of our business and the other non-historical statements contained herein are forward-looking statements. See “Special Note Regarding Forward-Looking Statements.” You should also review the “Risk Factors” section of this report for a discussion of important factors that could cause actual results to differ materially from the results described herein or implied by such forward-looking statements.
The consolidated financial statements included in this Form 10-K reflect the historical financial position, results of operations and cash flows of CyrusOne for all periods presented.
Overview
Our Company. We are a premier data center real estate investment trust (REIT). We own, operate and develop enterprise-class, carrier-neutral, multi-tenant and single-tenant data center properties. Our data centers are generally purpose-built facilities with redundant power and cooling. They are not network specific and enable customer connectivity to a range of telecommunication carriers. We provide mission-critical data center facilities that protect and ensure the continued operation of information technology (IT) infrastructure for nearly 1,000 customers in 45 data centers and 2 recovery centers in 12 distinct markets (10 in the U.S., plus London and Singapore). We provide twenty-four hours-a-day, seven-days-a-week security monitoring with customizable security features.
We provide mission-critical data center real estate assets that protect and ensure the continued operation of IT infrastructure for our customers. Our goal is to be the preferred global data center provider to Fortune 1000 and providers of cloud services, including the largest enterprises and providers of cloud services. As of December 31, 2017, our customers included 197 of the Fortune 1000, private or foreign enterprises of equivalent size, and nine of the top ten cloud providers. These 197 Fortune 1000 customers, private or foreign enterprises of equivalent size and nine providers of cloud services, provided 72% of our annualized rent as of December 31, 2017. Additionally, as of December 31, 2017, our top 10 customers represented 41% of our annualized rent.
We cultivate long-term strategic relationships with our customers and provide them with solutions for their data center facilities and IT infrastructure requirements. Our offerings provide flexibility, reliability and security delivered through a tailored, customer service focused platform that is designed to foster long-term relationships. We focus on attracting customers that have not historically outsourced their data center needs and providing them with solutions that address their current and future needs. Our facilities and construction design allow us to offer flexibility in density and power resiliency, and the opportunity for expansion as our customers' needs grow. The CyrusOne National IX Platform delivers interconnection across states and between metro-enabled sites within the CyrusOne footprint and beyond. The platform enables high-performance, low-cost data transfer and accessibility for customers by uniting our data centers.
Our Portfolio. As of December 31, 2017, our property portfolio included 45 data centers and 2 recovery centers in 12 distinct markets (10 in the U.S., plus London and Singapore) collectively providing approximately 5,717,000 NRSF and powered by approximately 540 MW of available critical load capacity. Since December 31, 2016, the NRSF increased by 1,813,000. The increases were in San Antonio of 248,000, Northern Virginia of 519,000, New York Metro of 213,000, Raleigh-Durham of 167,000, Phoenix of 373,000 and the remaining properties accounted for the balance. We own 33 of the buildings in which our data center facilities are located. We lease the remaining 14 buildings, which account for approximately 652,000 NRSF, or approximately 11% of our total operating NRSF. These leased buildings accounted for 18% of our total annualized rent as of December 31, 2017. We also had approximately 645,000 NRSF under development, as well as an aggregate of approximately 1,534,000 NRSF of additional powered shell space under roof available for development. In addition, we have approximately 343 acres of land that are available for future data center shell development. Along with our primary product offering, leasing of colocation space, certain of our customers are also interested in ancillary office and other space. We believe our existing operating portfolio and development pipeline will allow us to meet the evolving needs of our existing customers and continue to attract new customers.
Business Model
Revenue. As of December 31, 2017, we had approximately 1,000 customers (not including customers that have signed leases but have not begun occupying space), many of which have signed leases for multiple sites and multiple services, amenities and/or features. We generate recurring revenues from leasing colocation space and nonrecurring revenues from the initial installation and set-up of customer equipment. We provide customers with data center services pursuant to leases with a customary initial term of three to ten years. As of December 31, 2017, the weighted average initial term of our leases was approximately 5.6 years and the
46
weighted average remaining term was 4.4 years based upon annualized rent. Lease expirations through 2020, excluding month-to-month leases, represent 28% of our total NRSF, or 42% of our aggregate annualized rent as of December 31, 2017. At the end of the lease term, customers may sign a new lease or automatically renew pursuant to the terms of their lease. The automatic renewal period could be for varying lengths, depending on the terms of the contract, such as, for the original lease term, one year or month-to-month. As of December 31, 2017, 1% of the NRSF in our portfolio was subject to month-to-month leases.
Costs and expenses. Our property operating expenses generally consist of electricity (including the cost to power data center equipment), salaries and benefits of data center operations personnel, real estate taxes, security, rent, insurance and other site operating and maintenance costs. Our property operating expenses are expected to increase as we expand our existing data center facilities and develop new facilities.
Our sales and marketing expenses consist of salaries and benefits of our sales personnel, marketing and advertising costs. Sales and marketing expenses are expected to increase as our business continues to grow.
General and administrative expenses consist of salaries and benefits of management and support functions, legal costs and consulting costs, board fees and other governance related expenses. These costs increased during 2017 as we augmented our team and back office infrastructure, including IT systems, to support the growth and expansion of our business.
Depreciation and amortization expense consists of depreciation on property, amortization of intangible assets and amortization of deferred sales commissions. Depreciation and amortization expense is expected to increase in future periods as we acquire and develop new properties and expand our existing data center facilities.
Key Operating Metrics
Annualized Rent. We calculate annualized rent as monthly contractual rent (defined as cash rent including customer reimbursements for metered power) under existing customer leases as of December 31, 2017, multiplied by 12. Monthly contractual rent is primarily for data center space, power and connectivity; however, it includes rent for office space and other ancillary services. For the month of December 2017, customer reimbursements were $67.8 million annualized and consisted of reimbursements by customers across all facilities with separately metered power. Other companies may not define annualized rent in the same manner. Accordingly, our annualized rent may not be comparable to others. Management believes annualized rent provides a useful measure of our currently in place lease revenue.
Colocation Square Feet (CSF). We calculate CSF as the NRSF at an operating facility that is currently leased or readily available for lease as colocation space, where customers locate their servers and IT equipment.
Utilization Rate. We calculate utilization rate by dividing CSF under signed leases for available space (whether or not the customer has occupied the space) by total CSF. Utilization rate differs from Percent leased. Percent leased is determined based on CSF being billed to customers under signed leases divided by total CSF. Leases signed but not commenced are not included in Percent leased.
Recurring Rent Churn. We calculate recurring rent churn as any reduction in recurring rent due to customer terminations, service reductions or net pricing decreases as a percentage of rent at the beginning of the period, excluding any impact from metered power reimbursements or other usage-based or variable billing.
Capital Expenditures. Expenditures that expand, improve or extend the life of real estate and non-real estate property are deemed capital expenditures. Management views its capital expenditures as comprised of acquisition of real estate, development of real estate, recurring real estate expenditures and all other non-real estate capital expenditures. Purchases of land or buildings from third parties represent acquisitions of real estate. Discretionary capital spending that expands or improves our data centers is deemed development of real estate. Replacements of data center assets are considered recurring real estate expenditures. Purchases of software, computer equipment and furniture and fixtures are included in all other non-real estate capital expenditures.
Factors That May Influence Future Results of Operations
Rental Income. Our revenue growth will depend on our ability to maintain our existing revenue base and to sell new capacity that becomes available as a result of our development activities. As of December 31, 2017, we have customer leases for approximately 80% of our CSF. Our ability to grow revenue will also be affected by our ability to maintain or increase rental rates at our properties. We believe the current rates charged to our customers generally reflect appropriate market rates. This is consistent with our relatively flat historical re-leasing spreads. As such, we do not anticipate significant rate increases or decreases in the aggregate as contracts renew. However, negative trends in one or more of these factors could adversely affect our revenue in future periods. Future economic downturns, regional downturns affecting our markets or oversupply of, or decrease in demand for, data center colocation services could impair our ability to attract new customers or renew existing customers’ leases on favorable terms, and this could adversely affect our ability to maintain or increase revenues.
47
Leasing Arrangements. As of December 31, 2017, 17% of our leased NRSF was to customers on a full-service gross basis. Under a full-service gross model, the customer pays a fixed monthly rent amount, and we are responsible for all data center facility electricity, maintenance and repair costs, property taxes, insurance and other utilities associated with that customer’s space. For leases under this model, fluctuations in our customers’ monthly utilization of power and the prices our utility providers charge us impact our profitability. As of December 31, 2017, 83% of our leased NRSF was to customers with separately metered power. Under the metered power model, the customer pays us a fixed monthly rent amount, plus its actual costs of sub-metered electricity used to power its data center equipment, plus an estimate of costs for electricity used to power supporting infrastructure for the data center, expressed as a factor of the customer’s actual electricity usage. We are responsible for all other costs listed in the description of the full-service gross model above. Fluctuations in a customer’s utilization of power and the supplier pricing of power do not impact our profitability under the metered power model. In future periods, we expect more of our contracts to be structured to bill power on a metered power basis.
Growth and Expansion Activities. Our ability to grow our revenue and profitability will depend on our ability to acquire and develop data center space globally at an appropriate cost and to lease the data center space to customers on favorable terms. During the year ended December 31, 2017, we increased our operational NRSF by 1,813,000, bringing our total operating NRSF to approximately 5,717,000 at December 31, 2017. Our portfolio, as of December 31, 2017, also included approximately 645,000 NRSF under development, as well as 1,534,000 NRSF of additional powered shell space under roof available for development. In addition, we have approximately 343 acres of land that are available for future data center shell development. We expect that the eventual construction of this future development space will enable us to accommodate a portion of the future demand of our existing and future customers and increase our future revenue, profitability and cash flows.
Scheduled Lease Expirations. Our ability to maintain low recurring rent churn and renew expiring customer leases on favorable terms will impact our results of operations. Our data center uncommitted capacity as of December 31, 2017, was approximately 1,098,000 NRSF. Excluding month-to-month leases, leases representing 10% and 9% of our total NRSF are scheduled to expire in 2018 and 2019, respectively. These leases represented approximately 20% and 12% of our annualized rent as of December 31, 2017. Month-to-month leases represented 3% of our annualized rent as of December 31, 2017. Recurring rent churn was 3.9% for the year ended December 31, 2017, as compared to 10.8%, which included company initiated churn of approximately 2.6%, for the year ended December 31, 2016. Our recurring rent churn for each quarter in 2017 ranged from 0.6% to 1.4%, in comparison to a range of 1.3% to 3.8% in 2016.
Conditions in Significant Markets. Our properties are located in12 distinct markets (10 in the U.S., plus London and Singapore). Dallas, Cincinnati, Houston, New York Metro, Northern Virginia, Phoenix and San Antonio accounted for approximately 88% of our annualized rent as of December 31, 2017. Positive or negative conditions in these markets could impact our overall profitability.
48
Related Party Transactions
The following related party transactions are based on agreements and arrangements that were in place during the reporting periods presented. At December 31, 2015, CBI owned 9.5% of the outstanding common stock of CyrusOne Inc. and no operating partnership units, at which point it ceased to be a related party of CyrusOne Inc. As of December 31, 2017, CBI owned less than 5.0% of the outstanding common stock of CyrusOne Inc. See Note 18 to our audited consolidated financial statements included elsewhere in this Annual Report on Form 10-K for additional information on these arrangements.
IN MILLIONS | |||
December 31, 2015 | |||
Revenue: | |||
Data center colocation agreement provided to CBT and CBTS(a) | $ | 7.8 | |
229 West 7th Street lease provided to CBT(b) | 1.9 | ||
Goldcoast Drive/Parkway (Mason) lease(c) | 0.3 | ||
Transition services provided to CBTS (network interfaces)(d) | 0.3 | ||
Data center leases provided to CBTS(e) | 12.0 | ||
Total revenue | $ | 22.3 | |
Operating costs and expenses: | |||
Transition services agreement by CBTS(f) | 0.7 | ||
Charges for services provided by CBT (connectivity)(g) | 1.0 | ||
209 West 7th Street rent provided by CBT(h) | 0.2 | ||
Total operating costs and expenses | $ | 1.9 | |
(a) We lease colocation space in our data centers to Cincinnati Bell Telephone Company LLC (CBT) and Cincinnati Bell Technology Solutions (CBTS) subsidiaries of CBI. In November 2012, we entered into separate data center colocation agreements with CBI whereby we will continue to lease colocation space to each of them at certain of our data centers. The data center colocation agreement with CBI provides for CBI’s lease of data center space, power and cooling in our Cincinnati - 7th Street (7th Street), Cincinnati - North Cincinnati (Lebanon), Cincinnati - Hamilton (Hamilton) and Florence data center facilities for a period of five years. These agreements were renewed in 2017 for three years with a renewal option.
(b) CBT occupies space in our 229 West Seventh Street facility that is utilized in its network operations. In November 2012, in connection with our purchase of this property, we entered into an agreement to lease this space to CBT for a period of five years, with three renewal options of five years each, plus a proportionate share of building operating costs. Commencing on January 1, 2014, and on January 1 of each year thereafter, such base rent shall increase by 1% of the previous year’s base rent. In 2017, the lease was renewed for three years.
(c) In November 2012, we entered into agreements to lease office space to CBT at our Cincinnati - Goldcoast (Goldcoast) data center facility and to CBTS at our Cincinnati - Mason (Mason) data center facility. The term of these agreements are five years each. Both agreements contain three five-year renewal options at market rates. These agreements were not renewed.
(d) In November 2012, we entered into a new transition services agreement with CBTS where we have provided them with network interface services. The annual fee to be paid by CBTS for these services may decline in future periods as CBTS migrates its network interfaces onto an independent architected and managed CBTS network. These services were provided on a month-to-month basis, until such the services in question were fully transitioned and the agreement terminated in 2017.
(e) As of December 31, 2015, CBTS is named the lessor for two customer data center leases. In 2012, we entered into an agreement with CBTS whereby we perform all obligations of CBTS under the lease agreements. CBTS confers the benefits received under such lease agreements to us and CBTS is granted sufficient usage rights in each of our data centers so that it remains as lessor under each such lease agreement. As of December 31, 2017, CBTS continues to perform billing and collections on one of these leases.
(f) In January 2012, we entered into a transition services agreement with CBTS where CBTS provided us with network support, services calls, monitoring and management, storage and backup and IT systems support. Under the CBTS services agreement, CBTS has agreed to provide us with certain managed storage and backup services. These services were provided on a month-to-month basis, and charges were based on the variable amount of gigabytes managed by CBTS each month. CBTS charged us a rate of $0.56 per gigabyte. The services under this agreement ended January 31, 2016.
(g) Under the CBT services agreement, CBT provides us with connectivity services for a period of five years related to several of our data center facilities. These services are related to the use of fiber and circuit assets that are currently a part of the CBI network. The annual fee for these services is subject to reduction if we terminate certain services. As of 2017, we continue to utilize these services.
(h) In November 2012, we entered into an agreement to lease space at CBT’s 209 West Seventh Street facility for a period of five years, with three renewal options of five years each, plus our proportionate share of building operating costs. In December 2017 we exercised a five year renewal option however we reduced the square footage being leased.
49
Other Related Party Transactions
Our director, Lynn A. Wentworth, is a member of the board of directors of CBI, and serves as the chair of its audit and finance committee.
The spouse of one of our former directors, who served until May 2015, is a partner with Skadden, Arps, Slate, Meagher & Flom LLP (Skadden). For the year ended December 31, 2015, CyrusOne paid Skadden an immaterial amount for services rendered.
50
Results of Operations
Comparison of Years Ended December 31, 2017 and 2016
IN MILLIONS, except per share data | |||||||||||
For the Year Ended December 31, | 2017 | 2016 | $ Change 2017 vs. 2016 | % Change 2017 vs. 2016 | |||||||
Revenue | $ | 672.0 | $ | 529.1 | $ | 142.9 | 27.0 | % | |||
Costs and expenses: | |||||||||||
Property operating expenses | 235.1 | 187.5 | 47.6 | 25.4 | % | ||||||
Sales and marketing | 17.0 | 16.9 | 0.1 | 0.6 | % | ||||||
General and administrative | 67.0 | 60.7 | 6.3 | 10.4 | % | ||||||
Depreciation and amortization | 258.9 | 183.9 | 75.0 | 40.8 | % | ||||||
Transaction and acquisition integration costs | 10.4 | 4.3 | 6.1 | n/m | |||||||
Asset impairments and loss on disposal | 59.5 | 5.3 | 54.2 | n/m | |||||||
Costs and expenses | 647.9 | 458.6 | 189.3 | 41.3 | % | ||||||
Operating income | 24.1 | 70.5 | (46.4 | ) | (65.8 | )% | |||||
Interest expense | 68.1 | 48.8 | 19.3 | 39.5 | % | ||||||
Loss on extinguishment of debt | 36.5 | — | 36.5 | n/m | |||||||
Net income (loss) before income taxes | (80.5 | ) | 21.7 | (102.2 | ) | n/m | |||||
Income tax expense | (3.0 | ) | (1.8 | ) | (1.2 | ) | 66.7 | % | |||
Net income (loss) | $ | (83.5 | ) | $ | 19.9 | $ | (103.4 | ) | n/m | ||
Operating margin | 3.6 | % | 13.3 | % | |||||||
Capital expenditures *: | |||||||||||
Purchase of fixed assets | $ | 492.3 | $ | 131.1 | $ | 361.2 | n/m | ||||
Other development | 910.1 | 594.6 | 315.5 | 53.1 | % | ||||||
Other development recurring real estate | 4.4 | 5.4 | (1.0 | ) | (18.5 | )% | |||||
Total | $ | 1,406.8 | $ | 731.1 | $ | 675.7 | 92.4 | % | |||
Metrics information: | |||||||||||
Colocation square feet* | 3,267,000 | 2,080,000 | 1,187,000 | 57 | % | ||||||
Utilization rate* | 83 | % | 85 | % | |||||||
Income (loss) per share - basic and diluted | $ | (0.95 | ) | $ | 0.24 | ||||||
Dividends declared per share | $ | 1.68 | $ | 1.52 | |||||||
* | See “Key Operating Metrics” for a definition of capital expenditures, CSF and utilization rate. |
Revenue
For the year ended December 31, 2017, Revenue was $672.0 million, an increase of $142.9 million, or 27.0%, compared to $529.1 million for the year ended December 31, 2016. The purchase of the Aurora Properties (as defined in Note 6) from CME on March 31, 2016 and the acquisition of the Sentinel Properties on February 28, 2017 (the Acquisitions) resulted in an increase in revenue of $47.4 million for the year ended December 31, 2017. Metered power reimbursements increased $17.1 million, which includes $4.9 million from the two acquisitions mentioned above. Equipment sales for the year ended December 31, 2017 were $12.3 million compared to $14.7 million for the corresponding period in 2016. The addition of new customers and growth from existing customers, net of churn and items mentioned above, resulted in increased revenue of $85.7 million for the year ended December 31, 2017.
As of December 31, 2017, we had approximately 5,717,000 NRSF, an increase of approximately 1,813,000 NRSF from December 31, 2016. As of December 31, 2017, we had 197 Fortune 1000 customers, private or foreign enterprises of equivalent
51
size, compared to 181 Fortune 1000 customers, private or foreign enterprises of equivalent size, as of December 31, 2016. As of December 31, 2017, we had a total of nearly 1,000 customers.
Our capacity at December 31, 2017 was approximately 3,267,000 colocation square feet (CSF), which is an increase of 57% from December 31, 2016. The utilization rate of our data center facilities was 83% as of December 31, 2017, compared to 85% as of December 31, 2016. We have a few data centers in the lease-up stage, and we refer to these as pre-stabilized properties. Excluding these properties, the utilization rate for our stabilized portfolio was 93% as of December 31, 2017, as compared to 92% as of December 31, 2016.
Recurring rent churn was 3.9% for the year ended December 31, 2017, as compared to 10.8%, which included company initiated churn of approximately 2.6%, for the year ended December 31, 2016.
Costs and Expenses
Property operating expenses—For the year ended December 31, 2017, Property operating expenses were $235.1 million, an increase of $47.6 million, or 25.4%, compared to $187.5 million for the year ended December 31, 2016. The Acquisitions resulted in an increase to Property operating expenses of $14.3 million. Equipment cost of sales increased $0.4 million for the year ended December 31, 2017. Excluding the impact of the Acquisitions and equipment cost of sales, Property operating expenses increased by $32.9 million. Electricity costs increased $15.8 million, property taxes increased $8.9 million and contract services, payroll-related and other costs increased $8.2 million, primarily to support our additional CSF deployed.
Sales and marketing expenses—For the year ended December 31, 2017, Sales and marketing expenses were $17.0 million, an increase of $0.1 million, or 0.6%, compared to $16.9 million for the year ended December 31, 2016. The Acquisitions resulted in an increase to Sales and marketing expenses of $0.2 million, increase in employee-related costs of $1.1 million, and severance-related costs of $0.5 million as a result of a reduction-in-force for the marketing department, offset by a decrease in advertising and other expenses of $1.7 million.
General and administrative expenses—For the year ended December 31, 2017, General and administrative expenses were $67.0 million, an increase of $6.3 million, compared to $60.7 million for the year ended December 31, 2016. The Acquisitions resulted in an increase to General and administrative expenses of $0.5 million. Employee-related costs increased by $5.9 million due to higher payroll and related costs to support the growth in the business. The Company incurred $2.4 million related to implementing new accounting standards and investing in system implementations. This increase was offset by a decrease in professional fees and other of $2.5 million.
Depreciation and amortization expense—For the year ended December 31, 2017, Depreciation and amortization expense was $258.9 million, an increase of $75.0 million, or 40.8%, compared to $183.9 million for the year ended December 31, 2016. The Acquisitions resulted in an increase in Depreciation and amortization expense of $32.7 million for the year ended December 31, 2017. The remainder of the increase was driven by assets that were placed in service after the fourth quarter of 2016. Depreciation and amortization expense is expected to increase in future periods as we acquire and develop new properties, and expand our existing data center facilities.
Transaction and acquisition integration costs—For the year ended December 31, 2017, the Company incurred costs of $10.4 million primarily related to diligence efforts on certain targeted acquisitions including unrealized acquisitions and costs incurred for the Sentinel integration. For the year ended December 31, 2016, the Company incurred costs of $4.3 million associated with diligence efforts on certain targeted acquisitions, including unrealized acquisitions.
Asset impairments and loss on disposal—For the year ended December 31, 2017, we recognized Asset impairments and loss on disposal of $59.5 million, which includes the impairment loss of $54.4 million for our Norwalk I, Stamford - Riverbend and Stamford - Omega facilities. Additionally, during the year ended December 31, 2017, we recognized an impairment of $3.6 million related to our leased facility in Singapore, a loss on disposal of $1.1 million related to equipment at our Chicago - Aurora facility and $0.4 million related to other equipment sales. For the year ended December 31, 2016, we recognized Asset impairment and loss on disposal of $5.3 million which related primarily to two properties, South Bend - Crescent, a leased facility, and Cincinnati - Goldcoast, an owned facility.
Non-Operating Expenses
Interest expense—For the year ended December 31, 2017, Interest expense was $68.1 million, an increase of $19.3 million, or 39.5%, as compared to $48.8 million for the year ended December 31, 2016. The increase was primarily a result of additional average borrowings under our Revolving Credit Facility, the issuance of the 2024 Notes and 2027 Notes in March 2017 and November 2017 and the redemption of the 2022 Notes, partially offset by $6.3 million due to an increase in capitalized interest.
52
Loss on extinguishment of debt—For the year ended December 31, 2017, Loss on extinguishment of debt was $36.5 million, primarily due to costs associated with the repurchase of the $474.8 million in aggregate face value of our 2022 Notes for total consideration of $515.1 million, including accrued and unpaid interest of $10.3 million. Deferred financing costs, bond premium and legal fees related to the 2022 Notes of $6.2 million were written off. In addition, $0.3 million related to the Second Amended and Restated Credit Agreement were written off due to the exit of certain lenders from the credit facility.
Income tax expense—For the year ended December 31, 2017, Income tax expense was $3.0 million, an increase of $1.2 million, as compared to $1.8 million for the year ended December 31, 2016.
Capital Expenditures
For the year ended December 31, 2017, capital expenditures were $1,406.8 million, including the purchase price of the Sentinel Properties on February 28, 2017 for $492.3 million. Other capital expenditures for the year ended December 31, 2017 related primarily to development projects underway in Northern Virginia, Phoenix, Dallas, Chicago, San Antonio and Cincinnati; and the purchase of land parcels in Allen, Texas, Quincy, Washington and Atlanta, Georgia for future development for approximately $20.2 million.
For the year ended December 31, 2016, capital expenditures were $731.1 million, including the purchase price of the Chicago-Aurora I data center in Aurora, Illinois for $131.1 million. Other capital expenditures for the year ended December 31, 2016 related primarily to development projects in our Phoenix, Houston, Dallas, San Antonio, Chicago and Northern Virginia markets. Also, during the year ended December 31, 2016, the Company purchased four land parcels for development for approximately $54.5 million.
53
Results of Operations
Comparison of Years Ended December 31, 2016 and 2015
IN MILLIONS, except per share data | |||||||||||
For the Year Ended December 31, | 2016 | 2015 | $ Change 2016 vs. 2015 | % Change 2016 vs. 2015 | |||||||
Revenue | $ | 529.1 | $ | 399.3 | $ | 129.8 | 32.5 | % | |||
Costs and expenses: | |||||||||||
Property operating expenses | 187.5 | 148.7 | 38.8 | 26.1 | % | ||||||
Sales and marketing | 16.9 | 12.1 | 4.8 | 39.7 | % | ||||||
General and administrative | 60.7 | 46.6 | 14.1 | 30.3 | % | ||||||
Depreciation and amortization | 183.9 | 141.5 | 42.4 | 30.0 | % | ||||||
Transaction and acquisition integration costs | 4.3 | 14.1 | (9.8 | ) | (69.5 | )% | |||||
Asset impairments and loss on disposal | 5.3 | 13.5 | (8.2 | ) | (60.7 | )% | |||||
Costs and expenses | 458.6 | 376.5 | 82.1 | 21.8 | % | ||||||
Operating income | 70.5 | 22.8 | 47.7 | 209.2 | % | ||||||
Interest expense | 48.8 | 41.2 | 7.6 | 18.4 | % | ||||||
Net income (loss) before income taxes | 21.7 | (18.4 | ) | 40.1 | n/m | ||||||
Income tax expense | (1.8 | ) | (1.8 | ) | — | — | % | ||||
Net income (loss) | $ | 19.9 | $ | (20.2 | ) | 40.1 | n/m | ||||
Noncontrolling interest in net loss | — | (4.8 | ) | 4.8 | n/m | ||||||
Net income (loss) attributed to common stockholders | $ | 19.9 | $ | (15.4 | ) | 35.3 | n/m | ||||
Operating margin | 13.3 | % | 5.7 | % | |||||||
Capital expenditures *: | |||||||||||
Acquisitions of real estate | $ | 131.1 | $ | 17.3 | $ | 113.8 | 657.8 | % | |||
Development of real estate | 594.6 | 214.8 | 379.8 | 176.8 | % | ||||||
Recurring real estate | 5.4 | 2.4 | 3.0 | 125.0 | % | ||||||
Total | $ | 731.1 | $ | 234.5 | $ | 496.6 | 211.8 | % | |||
Metrics information: | |||||||||||
Colocation square feet* | 2,080,000 | 1,574,000 | 506,000 | 32 | % | ||||||
Utilization rate* | 85 | % | 86 | % | |||||||
Loss per share - basic and diluted | $ | 0.24 | $ | (0.30 | ) | ||||||
Dividends declared per share | $ | 1.52 | $ | 1.26 | |||||||
* | See “Key Operating Metrics” for a definition of capital expenditures, CSF and utilization rate. |
Revenue
Revenue for the year ended December 31, 2016 was $529.1 million, an increase of $129.8 million, or 32.5%, compared to $399.3 million for the year ended December 31, 2015. The acquisition of Cervalis on July 1, 2015 as discussed in Note 6, resulted in an increase in revenue of $36.8 million for the six months ended June 30, 2016. The 15-year lease for data center space at the Aurora Properties with the CME Group, entered into on April 1, 2016, increased revenue by $19.0 million for the year ended December 31, 2016. Equipment sales and termination fees for 2016 were $14.7 million and $18.1 million, compared to $3.6 million and $0.1 million for 2015, respectively. The addition of new customers and growth from existing customers, net of churn, equipment sales and termination fee revenue, resulted in increased revenue of $44.9 million for the year ended December 31, 2016. As of December 31, 2016, we had approximately 3,904,000 NRSF, an increase of approximately 950,000 NRSF from December 31, 2015. As of December 31, 2016, we had 181 Fortune 1000 customers or private or foreign enterprises of equivalent size, compared to 173 Fortune 1000 customers or private or foreign enterprises of equivalent size as of December 31, 2015. As of December 31, 2016,
54
we had a total of 932 customers (not including customers that have signed leases but have not begun occupying space) as compared to approximately 930 customers as of December 31, 2015.
Our capacity at December 31, 2016 was approximately 2,080,000 CSF, which is an increase of 32% from December 31, 2015. The utilization rate of our data center facilities was 85% as of December 31, 2016, compared to 86% as of December 31, 2015. As of December 31, 2016, we have added to the portfolio two newly constructed data centers that are in the early stages of lease up. In all, we have three data centers in the lease-up stage, and we refer to these as pre-stabilized properties. Excluding these properties, the utilization rate for our stabilized portfolio was 92% as of December 31, 2016 as compared to 86% as of December 31, 2015.
Recurring rent churn was 10.8%, which includes company initiated churn of approximately 2.6%, for the year ended December 31, 2016, compared to 5.0% for the year ended December 31, 2015.
Costs and Expenses
Property operating expenses—For the year ended December 31, 2016, Property operating expenses were $187.5 million, an increase of $38.8 million, or 26.1%, compared to $148.7 million for the year ended December 31, 2015. The acquisition of Cervalis on July 1, 2015 resulted in an increase in Property operating expenses of $13.2 million. The purchase of the Aurora Properties from CME on March 31, 2016 increased Property operating expenses by $6.1 million. Equipment cost of sales was $12.0 million and $0.6 million for the years ended December 31, 2016 and 2015, respectively. Excluding the impact of Cervalis, Aurora and equipment cost of sales, Property operating expenses increased $8.1 million. Costs to operate our facilities increased by $4.1 million for payroll and employee related costs, $3.1 million for electricity costs, $0.9 million for additional security, property taxes and other costs, primarily to support our additional CSF deployed. During the year ended December 31, 2015, we incurred $1.4 million of lease exit costs.
Sales and marketing expenses—For the year ended December 31, 2016, Sales and marketing expenses were $16.9 million, an increase of $4.8 million, or 39.7%, compared to $12.1 million for the year ended December 31, 2015. The acquisition of Cervalis on July 1, 2015 resulted in an increase in Sales and marketing expenses of $1.0 million. The remaining increase was primarily due to higher payroll-related costs of $1.8 million and advertising and other costs of $2.0 million.
General and administrative expenses—For the year ended December 31, 2016, General and administrative expenses were $60.7 million, an increase of $14.1 million compared to $46.6 million for the year ended December 31, 2015. The acquisition of Cervalis on July 1, 2015 resulted in an increase in General and administrative expenses of $0.7 million. Severance and management transition costs were $1.9 million and $6.0 million for the year ended December 31, 2016 and 2015, respectively. Payroll costs increased $7.2 million due to higher payroll taxes because of a large vesting of equity awards granted at the time of the IPO, higher recruiting, relocation and payroll costs to support the increased growth in business. Professional fees for legal, consulting and temporary staffing increased $5.8 million. Provision for bad debt increased $1.6 million. Increased costs of investor relations, commercial insurance and other costs accounted for the remaining increase of $2.9 million.
Depreciation and amortization expense—For the year ended December 31, 2016, Depreciation and amortization expense was $183.9 million, an increase of $42.4 million, or 30.0%, compared to $141.5 million for the year ended December 31, 2015. The acquisition of Cervalis on July 1, 2015 and the purchase of the Aurora Properties from CME on March 31, 2016 resulted in an increase in Depreciation and amortization expense of $22.8 million for the year ended December 31, 2016. The remainder of the increase was driven by assets that were placed in service after the fourth quarter of 2015. Depreciation and amortization expense is expected to increase in future periods as we acquire and develop new properties and expand our existing data center facilities.
Transaction and acquisition integration costs—For the year ended December 31, 2016, the Company incurred costs of $4.3 million associated with diligence efforts on certain targeted acquisitions including unrealized acquisitions. For the year ended December 31, 2015, the Company incurred $12.9 million in transaction related costs primarily related to the acquisition of Cervalis. During the fourth quarter of 2015, the Company incurred costs of $1.2 million related to secondary equity offerings and costs associated with a transaction that the Company decided not to pursue.
Asset impairments and loss on disposal of assets—For the year ended December 31, 2016, we recognized Asset impairment and loss on disposal of $5.3 million which related primarily to two properties, South Bend-Crescent, a leased facility, and Cincinnati-Goldcoast, an owned facility. For the year ended December 31, 2015, we recognized Asset impairment and loss on disposal of $13.5 million which related primarily to the exit of Austin 1, which is a leased facility, and loss on disposal of certain other assets.
Non-Operating Expenses
Interest expense—For the year ended December 31, 2016, Interest expense was $48.8 million, an increase of $7.6 million, or 18.4%, as compared to $41.2 million for the year ended December 31, 2015. The increase was primarily a result of additional
55
borrowings under our Second Amended and Restated Credit Agreement, the issuance of 6.375% senior notes in July 2015 and increased interest expense related to Lease financing arrangements, partially offset by a reduction in Interest expense due to an increase in capitalized interest. The capitalized interest was $10.6 million and $6.1 million for the years ended December 31, 2016 and 2015, respectively.
Income tax expense—For both years ended December 31, 2016 and 2015, Income tax expense was $1.8 million.
Capital Expenditures
For the year ended December 31, 2016, capital expenditures were $731.1 million, as compared to $234.5 million for the year ended December 31, 2015. This included the purchase of the Aurora Properties for $131.1 million, the purchase of four properties for development in Northern Virginia, Chicago and Phoenix for approximately $54.5 million and $545.5 million for other developments primarily in Northern Virginia, Phoenix, San Antonio, Carrollton and Houston.
Key Performance Indicators
Funds from Operations and Normalized Funds from Operations
We use Funds from Operations (FFO) and Normalized Funds from Operations (Normalized FFO), which are non-GAAP financial measures commonly used in the REIT industry, as supplemental performance measures. We use FFO and Normalized FFO as supplemental performance measures because, when compared period over period, they capture trends in occupancy rates, rental rates and operating costs. We also believe that, as widely recognized measures of the performance of REITs, FFO and Normalized FFO are used by investors as a basis to evaluate REITs.
We calculate FFO as net income (loss) computed in accordance with GAAP before real estate depreciation and amortization and Asset impairments and gain or loss on disposal. While it is consistent with the definition of FFO promulgated by the National Association of Real Estate Investment Trusts, our computation of FFO may differ from the methodology for calculating FFO used by other REITs. Accordingly, our FFO may not be comparable to others.
We calculate Normalized FFO as FFO plus amortization of customer relationship intangibles, transaction and acquisition integration costs, legal claim costs and lease exit costs, and other special items including loss on extinguishment of debt, new accounting standards and system implementation costs, and severance and management transition costs, as appropriate. Other REITs may not calculate Normalized FFO in the same manner. Accordingly, our Normalized FFO may not be comparable to others.
In addition, because FFO and Normalized FFO exclude real estate depreciation and amortization and real estate impairments, and capture neither the changes in the value of our properties that result from use or from market conditions, nor the level of capital expenditures and leasing commissions necessary to maintain the operating performance of our properties, all of which have real economic effect and could materially impact our results from operations, the utility of FFO and Normalized FFO as measures of our performance is limited. Therefore, FFO and Normalized FFO should be considered only as supplements to net income (loss) as measures of our performance. FFO and Normalized FFO should not be used as measures of our liquidity or as indicative of funds available to fund our cash needs, including our ability to make distributions. FFO and Normalized FFO also should not be used as supplements to or substitutes for cash flow from operating activities computed in accordance with GAAP.
56
The following table reflects the computation of FFO and Normalized FFO for the years ended December 31, 2017, 2016 and 2015:
CyrusOne Inc.
Reconciliation of Net (Loss) Income to FFO and Normalized FFO
(Dollars in millions)
Year Ended | |||||||||
December 31, | |||||||||
2017 | 2016 | 2015 | |||||||
Net (loss) income | $ | (83.5 | ) | $ | 19.9 | $ | (20.2 | ) | |
Adjustments: | |||||||||
Real estate depreciation and amortization | 226.9 | 157.6 | 117.0 | ||||||
Asset impairments and loss on disposal | 59.5 | 5.3 | 13.5 | ||||||
Funds from Operations (FFO) | $ | 202.9 | $ | 182.8 | $ | 110.3 | |||
Loss on extinguishment of debt | 36.5 | — | — | ||||||
New accounting standards and system implementation costs | 2.4 | — | — | ||||||
Amortization of customer relationship intangibles | 25.1 | 20.1 | 18.5 | ||||||
Transaction and acquisition integration costs | 10.4 | 4.3 | 14.1 | ||||||
Severance and management transition costs | 0.5 | 1.9 | 6.0 | ||||||
Legal claim costs | 1.1 | 1.1 | 0.4 | ||||||
Lease exit costs | — | — | 1.4 | ||||||
Normalized Funds from Operations (Normalized FFO) | $ | 278.9 | $ | 210.2 | $ | 150.7 | |||
Net Operating Income
We use Net Operating Income (NOI), which is a non-GAAP financial measure commonly used in the REIT industry, as a supplemental performance measure. We use NOI as a supplemental performance measure because, when compared period over period, it captures trends in occupancy rates, rental rates and operating costs. We also believe that, as a widely recognized measure of the performance of REITs, NOI is used by investors as a basis to evaluate REITs.
We calculate NOI as revenue less property operating expenses, each of which are presented in the accompanying consolidated statements of operations. However, the utility of NOI as a measure of our performance is limited. Other REITs may not calculate NOI in the same manner. Accordingly, our NOI may not be comparable to others. Therefore, NOI should be considered only as a supplement to revenue and to net income (loss) as a measure of our performance. NOI should not be used as a measure of our liquidity or as indicative of funds available to fund our cash needs, including our ability to make distributions. NOI also should not be used as a supplement to or substitute for cash flow from operating activities computed in accordance with GAAP.
57
The following table reflects the computation of NOI and Net (Loss) Income for the years ended December 31, 2017, 2016 and 2015:
CyrusOne Inc.
Reconciliation of Revenue to Net Operating Income to Net (Loss) Income
(Dollars in millions)
Year Ended | |||||||||
December 31, | |||||||||
2017 | 2016 | 2015 | |||||||
Revenue | $ | 672.0 | $ | 529.1 | $ | 399.3 | |||
Property operating expenses | 235.1 | 187.5 | 148.7 | ||||||
Net Operating Income | $ | 436.9 | $ | 341.6 | $ | 250.6 | |||
Sales and marketing | 17.0 | 16.9 | 12.1 | ||||||
General and administrative | 67.0 | 60.7 | 46.6 | ||||||
Depreciation and amortization | 258.9 | 183.9 | 141.5 | ||||||
Transaction and acquisition integration costs | 10.4 | 4.3 | 14.1 | ||||||
Asset impairments and loss on disposal | 59.5 | 5.3 | 13.5 | ||||||
Interest expense | 68.1 | 48.8 | 41.2 | ||||||
Loss on extinguishment of debt | 36.5 | — | — | ||||||
Income tax expense | 3.0 | 1.8 | 1.8 | ||||||
Net (Loss) Income | $ | (83.5 | ) | $ | 19.9 | $ | (20.2 | ) | |
Financial Condition, Liquidity and Capital Resources and Material Terms of Our Indebtedness
Liquidity and Capital Resources
We are required to distribute at least 90% of our REIT taxable income, determined without regard to the dividends paid deduction and excluding any net capital gains, to our stockholders on an annual basis in order to maintain our status as a REIT for federal income tax purposes. Accordingly, we intend to make, but are not contractually bound to make, regular quarterly distributions to common stockholders from cash flow from operating activities. All such distributions are at the discretion of our board of directors.
We have an effective shelf registration statement that allows us to offer for sale unspecified amounts of various classes of equity and debt securities and warrants. As circumstances warrant, we may issue debt, equity and/or warrants from time to time on an opportunistic basis, dependent upon market conditions and available pricing.
During the third quarter of 2017, the Board authorized the 2017 ATM Stock Offering Program. The 2017 ATM Stock Offering program replaces a prior ATM Stock Offering program. For the year ended December 31, 2017, the Company sold approximately 8.4 million shares of its common stock under the ATM stock offering programs, generating net proceeds of approximately $493.7 million after giving effect to sales agent commissions of $6.3 million. As of December 31, 2017, there was $200.0 million under the 2017 ATM Stock Offering program available for future offerings of stock.
On February 27, 2017, the Company effected a full physical early settlement of the previously announced Forward Sale Agreements entered into with Goldman, Sachs & Co. on August 10, 2016 relating to, in the aggregate, approximately 4.4 million shares of the Company’s common stock. Upon settlement, the Company issued and sold all such shares to Goldman, Sachs & Co., in its capacity as forward purchaser, in exchange for net proceeds of approximately $210.8 million, in accordance with the provisions of the Forward Sales Agreements.
Our total stock issuance for the year ended December 31, 2017 was $706.0 million which included $210.8 million under the forward sales agreements, $493.7 million under the ATM stock offering programs and $1.5 million related to the employee stock purchase plans and stock options exercised.
As of December 31, 2017, the total number of outstanding shares of common stock was approximately 96.1 million.
58
Short-term Liquidity
Our short-term liquidity requirements primarily consist of operating, sales and marketing, and general and administrative expenses, dividend payments and capital expenditures composed primarily of acquisition and development costs for data center properties. For the year ended December 31, 2017, our capital expenditures, including the purchase of the Sentinel Properties on February 28, 2017 for $492.3 million, were $1,406.8 million. Our capital expenditures are discretionary, excluding leases under contract, and have been utilized to expand our existing data center properties, acquire or construct new facilities, or both. We intend to continue to pursue additional growth opportunities and are prepared to commit additional resources to support this growth. We expect to fund future capital expenditures from the cash available on our balance sheet, borrowings under our Revolving Credit Facility and other financings including potential issuances of debt and equity securities. We expect our total estimated capital expenditures for 2018 to be between $850 million and $900 million which excludes the acquisition of Zenium.
Long-term Liquidity
Our long-term liquidity requirements primarily consist of operating, sales and marketing, and general and administrative expenses, distributions to stockholders and the acquisition and development of additional data center properties. We expect to meet our long-term liquidity requirements with cash flows from our operations, issuances of debt and equity securities, and borrowings under our Revolving Credit Facility.
As of December 31, 2017, our Long-term debt, Capital lease obligations and Lease financing arrangements were $2,231.4 million, consisting of $706.8 million of 2024 Notes (including bond premium), $510.5 million of 2027 Notes (including bond premium), $900.0 million outstanding, in the aggregate, under the 2022 Term Loan and 2021 Term Loan, Capital lease obligations of $10.1 million and Lease financing arrangements of $131.9 million, partially offset by deferred financing costs of $27.9 million. Available capacity under the Revolving Credit Facility as of December 31, 2017, was $1,091.5 million, which included $1.1 billion under the Revolving Credit Facility less letters of credit of $8.5 million. Total liquidity as of December 31, 2017 was $1,243.4 million, which included availability of $1,091.5 million under the Revolving Credit Facility and Cash and cash equivalents of $151.9 million.
Material Terms of Our Indebtedness
See Note 10, Long-term debt, Capital lease obligations and Lease financing arrangements for the material terms of our indebtedness under the Second Amended and Restated Credit Agreement and our 2024 Notes, 2027 Notes and the 2022 Notes (which 2022 notes were extinguished in 2017).
Cash Flows
Our primary sources of cash during 2017 were earnings from our operations, net proceeds from our Second Amended and Restated Credit Agreement, and net proceeds from the issuances of common stock, 2024 Notes and 2027 Notes. Our primary uses of cash during 2017 were capital expenditures for the Sentinel Acquisition, the development of real estate, funding our operations and payment of dividends.
The following table summarizes our cash flows for the years ended December 31, 2017, 2016 and 2015.
IN MILLIONS | |||||||||
Year Ended December 31, 2017 | Year Ended December 31, 2016 | Year Ended December 31, 2015 | |||||||
Cash provided by operations | $ | 289.5 | $ | 180.6 | $ | 140.2 | |||
Cash used in investing activities | (1,506.8 | ) | (729.6 | ) | (625.6 | ) | |||
Cash provided by financing activities | 1,354.6 | 549.3 | 463.2 | ||||||
Comparison of Years Ended December 31, 2017 and 2016
Cash provided by operating activities for the year ended December 31, 2017 was $289.5 million compared to $180.6 million for the year ended December 31, 2016, an increase of $108.9 million. The increase was primarily driven by an increase in net operating income of $95.3 million. Deferred revenue net of straight-line rent adjustments increased by $11.0 million, primarily due to up- front payments received for modifications requested by customers. This increase was offset by the following: an increase in leasing commissions paid in 2017 of $5.2 million due to execution of long-term contracts and the timing and amounts of interest payments, net of amounts capitalized, of $4.9 million. All other operating accounts resulted in the remaining difference.
59
Cash used in investing activities for the year ended December 31, 2017 was $1,506.8 million compared to $729.6 million for the year ended December 31, 2016. Our capital expenditures for 2017 included the purchase of the Sentinel Properties for $492.3 million. Capital expenditure for 2017 of $914.5 million related primarily to development projects underway in Northern Virginia, Phoenix, Dallas, Chicago, San Antonio and Cincinnati; and the purchase of 48 acres in Quincy, Washington and 66 acres in Allen, Texas, and 44 acres outside of Atlanta, Georgia. In addition, we made an investment in GDS of $100.0 million.
During the year ended December 31, 2016, our capital expenditures included the purchase of the Aurora Properties for $131.1 million, the purchase of four properties for development in Northern Virginia, Chicago and Phoenix for approximately $54.5 million and $545.5 million for other developments primarily in Northern Virginia, Phoenix, San Antonio, Carrollton and Houston.
Cash provided by financing activities for the year ended December 31, 2017 was $1,354.6 million compared to $549.3 million for the year ended December 31, 2016. During the year ended December 31, 2017, cash provided by financing activities was due to proceeds from the issuance of senior notes of $1,217.8 million, issuance of common stock, net of issuance costs, of $705.7 million and net borrowings under the credit facility of $115.0 million. Cash used in financing activities during the year ended December 31, 2017 was due to the repurchase and redemption of the 2022 Notes of $474.8 million and payment of debt extinguishment of $30.4 million, payment of debt issuance costs relating to the issuance of the 2024 Notes and the 2027 Notes of $19.0 million, dividends paid to stockholders of $145.7 million, tax payments upon the exercise of equity awards of $6.9 million and other items of $7.1 million.
During the year ended December 31, 2016, cash provided by financing activities was due to net borrowings from the credit facility of $250.0 million and the net proceeds from issuances of common stock of $447.1 million. Cash used in financing activities during the year of 2016 was due to dividends paid to stockholders of $114.3 million, tax payments upon the exercise of equity awards of $14.2 million and other items of $19.4 million.
Comparison of Years Ended December 31, 2016 and 2015
Cash flow increased by $40.4 million for the year ended December 31, 2016. Cash provided by operations was $180.6 million for the year ended December 31, 2016, compared to $140.2 million for the year ended December 31, 2015. The increase was primarily driven by an increase in net operating income of $91.0 million. This increase was offset by the following: Deferred revenue and straight-line rent recognized increased $18.0 million primarily due to free rent periods on long-term, large contracts; leasing commissions paid in 2016 increased $5.2 million as a result of obtaining these large, long-term contracts; and Interest expense increased $7.6 million. The remaining increase was partially offset by increased sales and marketing and general and administrative expenses.
Cash used in investing activities was $729.6 million for the year ended December 31, 2016, compared to $625.6 million for the year ended December 31, 2015. Our capital expenditures for 2016 included the purchase of the Aurora Properties for $131.1 million, the purchase of four properties for development in Northern Virginia, Chicago and Phoenix for approximately $54.5 million and $545.5 million for other developments primarily in Northern Virginia, Phoenix, San Antonio, Carrollton and Houston. Cash used in investing activities for 2015 related primarily to the acquisition of Cervalis in July 2015 for $398.4 million. Capital expenditures for 2015 included the development of additional square footage and power in our Phoenix 2, Houston West 3, Carrollton and Northern Virginia data centers and the purchase of Austin 4 in February 2015. The change in Restricted cash accounted for the remaining change.
Cash provided by financing activities was $549.3 million for the year ended December 31, 2016, compared to $463.2 million for the year ended December 31, 2015. During the year of 2016, cash provided by financing activities was due to net borrowings from the credit facility of $250.0 million and the net proceeds from issuances of common stock of $447.1 million. Cash used in financing activities during the year of 2016 was due to dividends paid to stockholders of $114.3 million, tax payments upon the exercise of equity awards of $14.2 million and other items of $19.4 million. During the year ended December 31, 2015, cash provided by financing activities was due to the issuance of common stock of $799.5 million and net borrowings from the credit facility and 6.375% senior notes of $353.8 million. Cash used in financing activities during 2015 was due to the cost of the acquisition of partnership units of $596.4 million, dividends paid to stockholders of $80.8 million and other items of $12.9 million.
60
Contractual Obligations
The following contractual obligations table summarizes our contractual obligations as of December 31, 2017:
IN MILLIONS | Total | < 1 Year | 1-3 Years | 3-5 years | Thereafter | ||||||||||
2024 Notes (1) | $ | 700.0 | $ | — | $ | — | $ | — | $ | 700.0 | |||||
2027 Notes (1) | 500.0 | — | — | — | 500.0 | ||||||||||
Term loans (1) | 900.0 | — | — | 900.0 | — | ||||||||||
Capital lease obligations | 10.1 | 2.0 | 3.9 | 2.9 | 1.3 | ||||||||||
Interest payments on senior notes, credit agreement, capital leases and lease financing arrangements (2) | 633.1 | 100.2 | 198.3 | 162.8 | 171.8 | ||||||||||
Non-cancellable operating leases | 14.1 | 4.8 | 4.0 | 1.1 | 4.2 | ||||||||||
Construction commitments and purchase obligations (3) | 69.8 | 67.8 | 2.0 | — | — | ||||||||||
Lease financing arrangements and other liabilities (4) | 132.1 | 7.2 | 28.7 | 12.0 | 84.2 | ||||||||||
Total (5) | $ | 2,959.2 | $ | 182.0 | $ | 236.9 | $ | 1,078.8 | $ | 1,461.5 | |||||
(1) | Represents the principal portion of the 2024 Notes, 2027 Notes and Term Loans. |
(2) | Includes contractual interest payments on the 2024 Notes, 2027 Notes, Revolving Credit Facility, Term Loans, capital leases and lease financing arrangements assuming no early payment of debt in future periods and the exercise of the one-year extension option on the Revolving Credit Facility. |
(3) | We have issued purchase orders for construction related activities. CyrusOne has non-cancellable purchase commitments related to certain services and contracts related to construction of data center facilities and equipment. These agreements range from one to two years and provide for payments for early termination or require minimum payments for the remaining term. |
(4) | Represents lease financing arrangements of $131.9 million for leased data centers where we are deemed the accounting owner, and asset retirement obligations of $0.2 million. |
(5) | Employment contracts have been excluded from this table for named executive officers as the Proxy and other SEC filings have those details. All other employees are subject to at-will employment. |
The contractual obligations table is presented as of December 31, 2017. The amount of these obligations can be expected to change over time as new contracts are initiated and existing contracts are completed, terminated or modified.
Contingencies
We are periodically involved in litigation, claims and disputes. Liabilities are established for these claims when losses associated with these matters are judged to be probable and the loss can be reasonably estimated. Based on information currently available, consultation with counsel and established reserves, management believes the outcome of all claims will not individually, nor in the aggregate, have a material effect on our financial position, results of operations or cash flows. For the year ended December 31, 2017, we were not involved in any material lawsuits that required us to recognize an expense.
Off-Balance Sheet Arrangements
Indemnification
During the normal course of business, we make certain indemnities, commitments and guarantees under which we may be required to make payments in relation to certain transactions. These include (i) intellectual property indemnities to customers in connection with the use, sale and/or license of products and services, (ii) indemnities to vendors and service providers pertaining to claims based on our negligence or willful misconduct and (iii) indemnities involving the representations and warranties in certain contracts. In addition, we have made contractual commitments to several employees providing for payments upon the occurrence of certain prescribed events. The majority of these indemnities, commitments and guarantees do not provide for any limitation on the maximum potential for future payments that we could be obligated to make.
61
Critical Accounting Policies and Estimates
Our discussion and analysis of financial condition and results of operations are based upon our consolidated financial statements, which have been prepared in accordance with U.S. GAAP. The preparation of these consolidated financial statements in conformity with U.S. GAAP requires us to make estimates and assumptions that affect the reported amounts of assets and liabilities at the date of the financial statements and the reported amount of revenue and expenses in the reporting period. Our management evaluates these estimates on an ongoing basis, based upon information currently available and on various assumptions management believes are reasonable as of the date of the financial statements.
Our actual results may differ from these estimates. We have provided a summary of our significant accounting policies in Note 4 to our audited consolidated financial statements included elsewhere in this Form 10-K. We describe below those accounting policies that require material subjective or complex judgments and that have the most significant impact on our financial condition and results of operations:
•revenue recognition; and
•accounting for real estate and other definite-lived assets.
Revenue Recognition—Colocation rentals are generally billed monthly in advance, and some contracts have escalating payments over the term of the contract. If rents escalate without the lessee gaining access to or control over additional leased space or power, and the lessee takes possession of, or controls the physical use of the property (including all contractually committed power) at the beginning of the lease term, the rental payments by the lessee are recognized as revenue on a straight-line basis over the term of the lease. If rents escalate because the lessee gains access to and control over additional leased space or power, revenue is recognized in proportion to the additional space or power in the periods that the lessee has control over the use of the additional space or power. The excess of revenue recognized over amounts contractually due is recognized in Other assets in the accompanying consolidated balance sheets.
Some of our leases are structured on a full-service gross basis in which the customer pays a fixed amount for both colocation rent and power. Other leases provide that the customer will be billed for power based upon actual usage which is separately metered. Power is generally billed one month in arrears, and an estimate of this revenue is accrued in the month that the associated costs are incurred. We generally are not entitled to reimbursements for real estate taxes, insurance or other operating expenses. In certain leases, we receive an administrative fee when we manage the meters for our customers.
Revenue is recognized for services or products that are deemed separate units of accounting. When a customer makes an advance payment or they are contractually obligated to pay any amounts in advance, which is not deemed a separate unit of accounting, Deferred revenue liability is recorded. This revenue is recognized ratably over the expected term of the lease, unless the pattern of service suggests otherwise. As of December 31, 2017 and December 31, 2016, Deferred revenue was $111.6 million and $76.7 million, respectively.
Certain customer leases require specified levels of service or performance. If we fail to meet these service levels, our customers may be eligible to receive credits on their contractual billings. These credits are recognized against revenue when an event occurs that gives rise to such credits. Customer credits were immaterial for each of the periods presented.
A provision for doubtful accounts is recognized when the collection of contractual rent, straight-line rent or customer reimbursements are deemed to be uncollectible.
Accounting for Real Estate and Other Definite-Lived Assets—Investment in real estate consist of land, buildings, improvements and integral equipment utilized in our data center operations. Real estate acquired from third parties has been recorded at its acquisition cost. Additions and improvements which extend an asset’s useful life or increase its functionality are capitalized and depreciated over the asset’s remaining life. Maintenance and repairs are expensed as incurred.
When we are involved in the construction of structural improvements to leased property, we are deemed the accounting owner of the leased real estate. In these instances, we bear substantially all the construction period risk, including managing or funding construction. As we have substantially all of the construction risks, we are deemed the “owner” of the asset under construction for accounting purposes during the construction period, and are therefore required to capitalize the construction costs on the accompanying consolidated balance sheets. At inception, the fair value of the building, excluding land, is recorded as an asset, and the construction and modification costs to the building that are not funded by us would be recorded as a liability. As construction progresses, the value of the asset and obligation increases by the fair value of the structural improvements. At completion of the construction, Sales-Leaseback Accounting under ASC 840-40-25 is also evaluated. Due to our continuing involvement with the lessor, Sales-Leaseback Accounting is precluded and the liability is not derecognized. When the asset is placed in service, depreciation commences, and the leased real estate is depreciated to the lesser of (i) its estimated fair value at the end of the term
62
or (ii) the expected amount of the unamortized obligation at the end of the term. The associated obligation is presented as Lease financing arrangements in the accompanying consolidated balance sheets.
When we are not deemed the accounting owner of leased real estate, we further evaluate the lease to determine whether the lease should be classified as a capital or operating lease. One of the following four characteristics must be present to classify a lease as a capital lease: (i) the lease transfers ownership of the property to the lessee by the end of the lease term, (ii) the lease contains a bargain purchase option, (iii) the lease term is equal to 75% or more of the estimated economic life of the leased property or (iv) the net present value of the lease payments is at least 90% of the fair value of the leased property.
Construction in progress includes direct and indirect expenditures for the construction and expansion of our data centers and is stated at its acquisition cost. Independent contractors perform substantially all of the construction and expansion efforts of our data centers. Construction in progress includes costs incurred under construction contracts including project management services, engineering and schematic design services, design development, construction services and other construction-related fees and services. Interest, property taxes and certain labor costs are also capitalized during the construction of an asset. These costs are depreciated over the estimated useful life of the related assets.
Depreciation is calculated using the straight-line method over the estimated useful life of the asset. Useful lives range from nine to thirty years for buildings, three to thirty years for building improvements, and two to twenty years for equipment. Leasehold improvements are amortized over the shorter of the asset’s useful life or the remaining lease term, including renewal options which are reasonably assured.
We estimate the useful lives of real estate and other definite-life long-lived assets in order to determine the amount of depreciation and amortization expense to be recorded during any reporting period. Depreciation of our real estate, and other tangible assets, except for leasehold improvements, is based on the straight-line method over the estimated economic useful life. Depreciation of leasehold improvements is based on a straight-line method over the lesser of the economic useful life or term of the lease, including optional renewal periods if renewal of the lease is reasonably assured. Amortization of acquired customer relationships and other intangible assets are estimated using an amortization method to match the projected benefit derived from this asset.
Management reviews the carrying value of long-lived assets, including intangible assets with finite lives, when events or changes in circumstances indicate that the carrying amount of the assets may not be recoverable. Examples of such indicators may include a significant adverse change in the extent to which or manner in which the property is being used, an accumulation of costs significantly in excess of the amount originally expected for acquisition or development, or a history of operating or cash flow losses. When such indicators exist, we review an estimate of the undiscounted future cash flows expected to result from the use of an asset (or group of assets) and its eventual disposition and compare such amount to its carrying amount. We consider factors such as future operating income, leasing demand, competition and other factors. If our undiscounted net cash flows indicate that we are unable to recover the carrying value of the asset, an impairment loss is recognized. An impairment loss is measured as the amount by which the asset’s carrying value exceeds its estimated fair value.
For the year ended December 31, 2017, we recognized Asset impairments and loss on disposal of $59.5 million which includes the impairment loss of $54.4 million as mentioned above, an impairment of $3.6 million related to our leased facility in Singapore, a loss on disposal of $1.1 million related to equipment at our Chicago - Aurora facility and $0.4 million related to other equipment sales. For the year ended December 31, 2016, we recognized Asset impairment and loss on disposal of $5.3 million which related primarily to two properties, Crescent, a leased facility, and Goldcoast, an owned facility. For the year ended December 31, 2015, we recognized Asset impairment and loss on disposal of $13.5 million which related primarily to the exit of Austin 1, which is a leased facility, and loss on disposal of certain other assets.
The estimate of expected future cash flows is inherently uncertain and relies to a considerable extent on estimates and assumptions, including current and future market conditions, projected growth in our CSF, projected recurring rent churn, lease renewal rates and our ability to generate new leases on favorable terms. It may be more difficult to sign new customers to fill some of our smaller data centers because the available space at these locations is relatively small. If there are changes to any of these estimates and assumptions in future periods, an impairment loss could occur.
Recently Issued Accounting Standards
Refer to Note 5 for our audited consolidated financial statements for further information on recently issued accounting standards. We do not expect the adoption of these new accounting standards to have a material impact on our financial condition, results of operations or cash flows on a prospective basis.
63
Inflation
Our customer leases generally do not provide for annual increases in rent based on inflation. As a result, we bear the risk of increases in the costs of operating and maintaining our data center facilities. Some of our leases have annual escalators, typically ranging from 1-3%; however, these escalators are not based on inflation and as a result we bear the risk of increases in operating costs in excess of the annual escalator. Some of our leases are structured to pass-through the cost of sub-metered utilities. In the future, we expect more of our leases to pass-through utility costs.
64
ITEM 7A. Quantitative and Qualitative Disclosures About Market Risk
Interest Rate Risk
We have exposure to interest rate risk, arising from variable-rate borrowings under our Second Amended and Restated Credit Agreement and our fixed-rate long-term debt. As of December 31, 2017, the credit facility had commitments of $1.1 billion under the Revolving Credit Facility, $650.0 million under the 2022 Term Loan and $250.0 million under the 2021Term Loan. As of December 31, 2017, there were outstanding borrowings of $650.0 million under the 2022 Term Loan and $250.0 million under the 2021Term Loan. As of December 31, 2017, there were no outstanding borrowings under the Revolving Credit Facility.
The Revolving Credit Facility is scheduled to mature in November 2020 and includes a one-year extension option, which if exercised by CyrusOne LP would extend the maturity date to November 2021, subject to certain conditions. The 2022 Term Loan of $650.0 million is scheduled to mature in January 2022. The 2021 Term Loan of $250.0 million is scheduled to mature in September 2021. The Revolving Credit Facility currently bears interest at a rate per annum equal to LIBOR plus 1.55% and the 2022 Term Loan and 2021 Term Loan currently bear interest at a rate per annum equal to LIBOR plus 1.50%. The margins are subject to adjustment.
On March 17, 2017, CyrusOne LP and CyrusOne Finance Corp. completed their offering of $500.0 million aggregate principal amount of Original 2024 Notes and $300.0 million aggregate principal amount of Original 2027 Notes in a private offering.
On November 3, 2017, CyrusOne LP and CyrusOne Finance Corp. completed their offering of $200.0 million aggregate principal amount of Additional 2024 Notes and $200.0 million aggregate principal amount of Additional 2027 Notes in a private offering.
The 2024 Notes will mature on March 15, 2024 and the 2027 Notes will mature on March 15, 2027, in each case unless earlier redeemed or repurchased. As of December 31, 2017, the 2024 Notes had an outstanding balance of $706.8 million, including bond premium and the 2027 Notes had an outstanding balance of $510.5 million, including bond premium.
The following table sets forth the carrying value and fair value face amounts, maturity date and average interest rates at December 31, 2017, for our fixed-rate and variable-rate debt, excluding capital leases and other financing arrangements:
IN MILLIONS | 2018 | 2019 | 2020 | 2021 | 2022 | Thereafter | Total Carrying Value | Total Fair Value | |||||||||||||
Fixed-rate debt (2024 Notes) | — | — | — | — | — | $ | 706.8 | $ | 706.8 | $ | 728.0 | ||||||||||
Average interest rate on fixed-rate debt | — | — | — | — | — | 5.000 | % | ||||||||||||||
Fixed-rate debt (2027 Notes) | — | — | — | — | — | $ | 510.5 | $ | 510.5 | $ | 527.5 | ||||||||||
Average interest rate on fixed-rate debt | — | — | — | — | — | 5.375 | % | ||||||||||||||
Variable-rate debt (2022 Term Loan) | — | — | — | — | $ | 650.0 | — | $ | 650.0 | $ | 650.0 | ||||||||||
Average interest rate on variable-rate debt | — | — | — | — | 2.624 | % | — | ||||||||||||||
Variable-rate debt (2021 Term Loan) | — | — | — | $ | 250.0 | — | — | $ | 250.0 | $ | 250.0 | ||||||||||
Average interest rate on variable-rate debt | — | — | — | 2.624 | % | — | — | ||||||||||||||
The fair values of our 2024 Notes and 2027 Notes as of December 31, 2017 were based on the quoted market prices for these notes, which is considered Level 1 of the fair value hierarchy. The carrying value of the Revolving Credit Facility, the 2022 Term Loan and the 2021 Term Loan approximates estimated fair value as of December 31, 2017, due to the variability of interest rates and the stability of our credit ratings. These fair value measurements are considered Level 3 of the fair value hierarchy.
Foreign Currency Risk
Substantially all of our revenue and expenses are denominated in U.S. dollars. We do not currently employ forward contracts or other financial instruments to mitigate foreign currency risk. As our international operations grow, we may engage in activities to hedge our exposure to foreign currency risk, including borrowings in foreign denominations and swaps.
65
Commodity Price Risk
Certain of our operating costs are subject to price fluctuations caused by the volatility of the underlying commodity prices, including electricity used in our data center operations, and building materials, such as steel and copper, used in the construction of our data centers. In addition, the lead time to purchase certain equipment for our data centers is substantial which could result in increased costs for these construction projects. In addition, we have entered into several contracts to purchase electricity. As of December 31, 2017, these contracts represent less than our forecasted usage. We intend to obtain additional fixed price contracts as our electricity usage grows.
We do not currently employ forward contracts or other financial instruments to mitigate the risk of commodity price risk other than the electricity contracts discussed above.
66
ITEM 8. CONSOLIDATED FINANCIAL STATEMENTS AND SUPPLEMENTARY DATA
INDEX TO THE CONSOLIDATED FINANCIAL STATEMENTS | Page No. |
Consolidated Financial Statements of CyrusOne Inc. | |
67
REPORT OF INDEPENDENT REGISTERED PUBLIC ACCOUNTING FIRM
To the stockholders and the Board of Directors of CyrusOne Inc.
Opinion on the Financial Statements
We have audited the accompanying consolidated balance sheets of CyrusOne Inc. and subsidiaries (the "Company") as of December 31, 2017 and 2016, and the related consolidated statements of operations, comprehensive income (loss), equity, and cash flows for each of the three years in the period ended December 31, 2017, and the related notes and the schedules listed in the Index at Item 15(a) (collectively referred to as the “financial statements.”) In our opinion, the financial statements present fairly, in all material respects, the financial position of the Company as of December 31, 2017 and 2016, and the results of its operations and its cash flows for each of the three years in the period ended December 31, 2017, in conformity with accounting principles generally accepted in the United States of America.
We have also audited, in accordance with the standards of the Public Company Accounting Oversight Board (United States) (PCAOB), the Company’s internal control over financial reporting as of December 31, 2017, based on the criteria established in Internal Control - Integrated Framework (2013) issued by the Committee of Sponsoring Organizations of the Treadway Commission and our report dated February 22, 2018 expressed an unqualified opinion on the Company’s internal control over financial reporting.
Basis for Opinion
These financial statements are the responsibility of the Company’s management. Our responsibility is to express an opinion on the Company’s financial statements based on our audits. We are a public accounting firm registered with the PCAOB and are required to be independent with respect to the Company in accordance with the U.S. federal securities laws and the applicable rules and regulations of the Securities and Exchange Commission and the PCAOB.
We conducted our audits in accordance with the standards of the PCAOB. Those standards require that we plan and perform the audit to obtain reasonable assurance about whether the financial statements are free of material misstatement, whether due to error or fraud. Our audits included performing procedures to assess the risks of material misstatement of the financial statements, whether due to error or fraud, and performing procedures that respond to those risks. Such procedures included examining, on a test basis, evidence regarding the amounts and disclosures in the financial statements. Our audits also included evaluating the accounting principles used and significant estimates made by management, as well as evaluating the overall presentation of the financial statements. We believe that our audits provide a reasonable basis for our opinion.
/s/ Deloitte & Touche LLP
Dallas, Texas
February 22, 2018
We have served as the Company’s auditor since 2011.
68
REPORT OF INDEPENDENT REGISTERED PUBLIC ACCOUNTING FIRM
To the stockholders and the Board of Directors of CyrusOne Inc.
Dallas, TX
Opinion on Internal Control over Financial Reporting
We have audited the internal control over financial reporting of CyrusOne Inc. and subsidiaries (the "Company") as of December 31, 2017, based on criteria established in Internal Control - Integrated Framework (2013) issued by the Committee of Sponsoring Organizations of the Treadway Commission. In our opinion, the Company maintained, in all material respects, effective internal control over financial reporting as of December 31, 2017, based on the criteria established in Internal Control - Integrated Framework (2013) issued by COSO.
We have also audited, in accordance with the standards of the Public Company Accounting Oversight Board (United States) (PCAOB), the consolidated financial statements as of and for the year ended December 31, 2017, of the Company and our report dated February 22, 2018, expressed an unqualified opinion on those financial statements.
Basis for Opinion
The Company’s management is responsible for maintaining effective internal control over financial reporting and for its assessment of the effectiveness of internal control over financial reporting, included in the accompanying Management’s Annual Report on Internal Control over Financial Reporting. Our responsibility is to express an opinion on the Company’s internal control over financial reporting based on our audit. We are a public accounting firm registered with the PCAOB and are required to be independent with respect to the Company in accordance with the U.S. federal securities laws and the applicable rules and regulations of the Securities and Exchange Commission and the PCAOB.
We conducted our audit in accordance with the standards of the PCAOB. Those standards require that we plan and perform the audit to obtain reasonable assurance about whether effective internal control over financial reporting was maintained in all material respects. Our audit included obtaining an understanding of internal control over financial reporting, assessing the risk that a material weakness exists, testing and evaluating the design and operating effectiveness of internal control based on the assessed risk, and performing such other procedures as we considered necessary in the circumstances. We believe that our audit provides a reasonable basis for our opinion.
Definition and Limitations of Internal Control over Financial Reporting
A company’s internal control over financial reporting is a process designed to provide reasonable assurance regarding the reliability of financial reporting and the preparation of financial statements for external purposes in accordance with generally accepted accounting principles. A company’s internal control over financial reporting includes those policies and procedures that (1) pertain to the maintenance of records that, in reasonable detail, accurately and fairly reflect the transactions and dispositions of the assets of the company; (2) provide reasonable assurance that transactions are recorded as necessary to permit preparation of financial statements in accordance with generally accepted accounting principles, and that receipts and expenditures of the company are being made only in accordance with authorizations of management and directors of the company; and (3) provide reasonable assurance regarding prevention or timely detection of unauthorized acquisition, use, or disposition of the company’s assets that could have a material effect on the financial statements.
Because of its inherent limitations, internal control over financial reporting may not prevent or detect misstatements. Also, projections of any evaluation of effectiveness to future periods are subject to the risk that controls may become inadequate because of changes in conditions, or that the degree of compliance with the policies or procedures may deteriorate.
/s/ Deloitte & Touche LLP
Dallas, Texas
February 22, 2018
69
CYRUSONE INC.
Consolidated Balance Sheets
IN MILLIONS, except share and per share amounts | ||||||
As of December 31, | 2017 | 2016 | ||||
Assets | ||||||
Investment in real estate: | ||||||
Land | $ | 177.1 | $ | 142.7 | ||
Buildings and improvements | 1,371.4 | 1,008.9 | ||||
Equipment | 1,813.9 | 1,042.9 | ||||
Construction in progress | 478.4 | 407.1 | ||||
Subtotal | 3,840.8 | 2,601.6 | ||||
Accumulated depreciation | (782.4 | ) | (578.5 | ) | ||
Net investment in real estate | 3,058.4 | 2,023.1 | ||||
Cash and cash equivalents | 151.9 | 14.6 | ||||
Rent and other receivables (net of allowance for doubtful accounts of $2.1 as of December 31, 2017 and December 31, 2016) | 90.5 | 83.3 | ||||
Goodwill | 455.1 | 455.1 | ||||
Intangible assets (net of accumulated amortization of $136.1 and $110.7 as of December 31, 2017 and December 31, 2016, respectively) | 203.0 | 150.2 | ||||
Other assets | 353.2 | 126.1 | ||||
Total assets | $ | 4,312.1 | $ | 2,852.4 | ||
Liabilities and equity | ||||||
Accounts payable and accrued expenses | $ | 255.2 | $ | 227.1 | ||
Deferred revenue | 111.6 | 76.7 | ||||
Capital lease obligations | 10.1 | 10.8 | ||||
Long-term debt, net | 2,089.4 | 1,240.1 | ||||
Lease financing arrangements | 131.9 | 135.7 | ||||
Total liabilities | 2,598.2 | 1,690.4 | ||||
Commitment and contingencies | ||||||
Equity | ||||||
Preferred stock, $.01 par value, 100,000,000 authorized; no shares issued or outstanding | — | — | ||||
Common stock, $.01 par value, 500,000,000 shares authorized and 96,137,874 and 83,536,250 shares issued and outstanding at December 31, 2017 and December 31, 2016, respectively | 1.0 | 0.8 | ||||
Additional paid in capital | 2,125.6 | 1,412.3 | ||||
Accumulated deficit | (486.9 | ) | (249.8 | ) | ||
Accumulated other comprehensive income (loss) | 74.2 | (1.3 | ) | |||
Total stockholders’ equity | 1,713.9 | 1,162.0 | ||||
Total liabilities and equity | $ | 4,312.1 | $ | 2,852.4 | ||
The accompanying notes are an integral part of the consolidated financial statements.
70
CYRUSONE INC.
Consolidated Statements of Operations
IN MILLIONS, except per share data | |||||||||
For the Year Ended December 31, | 2017 | 2016 | 2015 | ||||||
Revenue: | |||||||||
Base revenue and other | $ | 602.4 | $ | 476.7 | $ | 354.6 | |||
Metered power reimbursements | 69.6 | 52.4 | 44.7 | ||||||
Revenue | 672.0 | 529.1 | 399.3 | ||||||
Costs and expenses: | |||||||||
Property operating expenses | 235.1 | 187.5 | 148.7 | ||||||
Sales and marketing | 17.0 | 16.9 | 12.1 | ||||||
General and administrative | 67.0 | 60.7 | 46.6 | ||||||
Depreciation and amortization | 258.9 | 183.9 | 141.5 | ||||||
Transaction and acquisition integration costs | 10.4 | 4.3 | 14.1 | ||||||
Asset impairments and loss on disposal | 59.5 | 5.3 | 13.5 | ||||||
Costs and expenses | 647.9 | 458.6 | 376.5 | ||||||
Operating income | 24.1 | 70.5 | 22.8 | ||||||
Interest expense | 68.1 | 48.8 | 41.2 | ||||||
Loss on extinguishment of debt | 36.5 | — | — | ||||||
Net (loss) income before income taxes | (80.5 | ) | 21.7 | (18.4 | ) | ||||
Income tax expense | (3.0 | ) | (1.8 | ) | (1.8 | ) | |||
Net (loss) income | (83.5 | ) | 19.9 | (20.2 | ) | ||||
Noncontrolling interest in net loss | — | — | (4.8 | ) | |||||
Net (loss) income attributed to common stockholders | $ | (83.5 | ) | $ | 19.9 | $ | (15.4 | ) | |
Basic weighted average common shares outstanding | 88.9 | 78.3 | 54.3 | ||||||
Diluted weighted average common shares outstanding | 88.9 | 79.0 | 54.3 | ||||||
(Loss) Income per share - basic and diluted | $ | (0.95 | ) | $ | 0.24 | $ | (0.30 | ) | |
The accompanying notes are an integral part of the consolidated financial statements.
71
CYRUSONE INC.
Consolidated Statements of Comprehensive Income (Loss)
IN MILLIONS | |||||||||
For the Year Ended December 31, | 2017 | 2016 | 2015 | ||||||
Net (loss) income | $ | (83.5 | ) | $ | 19.9 | $ | (20.2 | ) | |
Other comprehensive (loss) income: | |||||||||
Foreign currency translation adjustments | (0.1 | ) | (0.9 | ) | (0.2 | ) | |||
Unrealized gain on equity investment | 75.6 | — | — | ||||||
Comprehensive (loss) income | (8.0 | ) | 19.0 | (20.4 | ) | ||||
Comprehensive loss attributable to noncontrolling interests | — | — | (4.8 | ) | |||||
Comprehensive (loss) income attributable to CyrusOne Inc. | $ | (8.0 | ) | $ | 19.0 | $ | (15.6 | ) | |
The accompanying notes are an integral part of the consolidated financial statements.
72
CYRUSONE INC.
Consolidated Statements of Equity
IN MILLIONS | Shares of common stock outstanding | Common Stock | Accumulated Deficit | Paid-In Capital | Accumulated Other Comprehensive Income (Loss) | Total Shareholders' Equity/ Parent’s Net Investment | Non-Controlling Interest | Total Equity | |||||||||||||||
Balance as of January 1, 2015 | 38.7 | $ | 0.4 | $ | (55.9 | ) | $ | 516.5 | $ | (0.2 | ) | $ | 460.8 | $ | 256.2 | $ | 717.0 | ||||||
Net loss | — | — | (20.2 | ) | — | — | (20.2 | ) | — | (20.2 | ) | ||||||||||||
Noncontrolling interest allocated net loss | — | — | 4.8 | — | — | 4.8 | (4.8 | ) | — | ||||||||||||||
Stock issuance costs | — | — | — | (0.8 | ) | — | (0.8 | ) | — | (0.8 | ) | ||||||||||||
Foreign currency translation adjustments | — | — | — | — | (0.2 | ) | (0.2 | ) | — | (0.2 | ) | ||||||||||||
Stock-based compensation | 0.3 | — | — | 14.4 | — | 14.4 | — | 14.4 | |||||||||||||||
Tax payment upon exercise of equity awards | — | — | — | (0.8 | ) | — | (0.8 | ) | — | (0.8 | ) | ||||||||||||
Issuance of common stock | 33.6 | 0.3 | — | 799.2 | — | 799.5 | — | 799.5 | |||||||||||||||
Redemption of noncontrolling interest | — | — | — | (412.3 | ) | — | (412.3 | ) | (184.1 | ) | (596.4 | ) | |||||||||||
Conversion of operating partnership units to common stock | — | — | — | 51.0 | — | 51.0 | (51.0 | ) | — | ||||||||||||||
Dividends declared, $1.26 per share | — | — | (74.6 | ) | — | — | (74.6 | ) | (16.3 | ) | (90.9 | ) | |||||||||||
Balance as of December 31, 2015 | 72.6 | $ | 0.7 | $ | (145.9 | ) | $ | 967.2 | $ | (0.4 | ) | $ | 821.6 | $ | — | $ | 821.6 | ||||||
Net income | — | — | 19.9 | — | — | 19.9 | — | 19.9 | |||||||||||||||
Stock issuance costs | — | — | — | (1.6 | ) | — | (1.6 | ) | — | (1.6 | ) | ||||||||||||
Stock-based compensation | 0.6 | — | — | 12.3 | — | 12.3 | — | 12.3 | |||||||||||||||
Tax payment upon exercise of equity awards | (0.5 | ) | — | — | (14.2 | ) | — | (14.2 | ) | — | (14.2 | ) | |||||||||||
Issuance of common stock | 10.8 | 0.1 | — | 448.6 | — | 448.7 | — | 448.7 | |||||||||||||||
Foreign currency translation adjustment | — | — | — | — | (0.9 | ) | (0.9 | ) | (0.9 | ) | |||||||||||||
Dividends declared, $1.52 per share | — | — | (123.8 | ) | — | — | (123.8 | ) | — | (123.8 | ) | ||||||||||||
Balance as of December 31, 2016 | 83.5 | $ | 0.8 | $ | (249.8 | ) | $ | 1,412.3 | $ | (1.3 | ) | $ | 1,162.0 | $ | — | $ | 1,162.0 | ||||||
Net loss | — | — | (83.5 | ) | — | — | (83.5 | ) | — | (83.5 | ) | ||||||||||||
Stock issuance costs | — | — | — | (0.3 | ) | — | (0.3 | ) | — | (0.3 | ) | ||||||||||||
Stock-based compensation | (0.1 | ) | — | — | 14.7 | — | 14.7 | — | 14.7 | ||||||||||||||
Tax payment upon exercise of equity awards | (0.1 | ) | — | — | (6.9 | ) | — | (6.9 | ) | — | (6.9 | ) | |||||||||||
Issuance of common stock | 12.8 | 0.2 | — | 705.8 | — | 706.0 | — | 706.0 | |||||||||||||||
Foreign currency translation adjustment | — | — | — | — | (0.1 | ) | (0.1 | ) | — | (0.1 | ) | ||||||||||||
Unrealized gain on equity investment | — | — | — | — | 75.6 | 75.6 | — | 75.6 | |||||||||||||||
Dividends declared, $1.68 per share | — | — | (153.6 | ) | — | — | (153.6 | ) | — | (153.6 | ) | ||||||||||||
Balance at December 31, 2017 | 96.1 | $ | 1.0 | $ | (486.9 | ) | $ | 2,125.6 | $ | 74.2 | $ | 1,713.9 | $ | — | $ | 1,713.9 | |||||||
The accompanying notes are an integral part of the consolidated financial statements.
73
CYRUSONE INC.
Consolidated Statements of Cash Flows
IN MILLIONS | |||||||||
For the Year Ended December 31, | 2017 | 2016 | 2015 | ||||||
Cash flows from operating activities: | |||||||||
Net (loss) income | $ | (83.5 | ) | $ | 19.9 | $ | (20.2 | ) | |
Adjustments to reconcile net (loss) income to net cash provided by operating activities: | |||||||||
Depreciation and amortization | 258.9 | 183.9 | 141.5 | ||||||
Provision for bad debt | 0.2 | 1.6 | — | ||||||
Asset impairments and loss on disposal | 59.5 | 5.3 | 13.5 | ||||||
Loss on extinguishment of debt | 36.5 | — | — | ||||||
Non-cash interest expense and change in interest accrual | 16.5 | 4.8 | 3.4 | ||||||
Stock-based compensation expense | 14.7 | 12.3 | 14.4 | ||||||
Change in operating assets and liabilities: | |||||||||
Rent receivables and other assets | (64.3 | ) | (51.7 | ) | (23.9 | ) | |||
Accounts payable and accrued expenses | 17.0 | 7.0 | 7.0 | ||||||
Deferred revenues | 34.0 | (2.5 | ) | 5.4 | |||||
Due to affiliates | — | — | (0.9 | ) | |||||
Net cash provided by operating activities | 289.5 | 180.6 | 140.2 | ||||||
Cash flows from investing activities: | |||||||||
Capital expenditures – asset acquisitions, net of cash acquired | (492.3 | ) | (131.1 | ) | (17.3 | ) | |||
Capital expenditures – other development | (914.5 | ) | (600.0 | ) | (217.2 | ) | |||
Business acquisition, net of cash acquired | — | — | (389.6 | ) | |||||
Equity investment | (100.0 | ) | — | — | |||||
Net cash used in investing activities | (1,506.8 | ) | (731.1 | ) | (624.1 | ) | |||
Cash flows from financing activities: | |||||||||
Issuance of common stock | 706.0 | 448.7 | 799.5 | ||||||
Stock issuance costs | (0.3 | ) | (1.6 | ) | (0.8 | ) | |||
Acquisition of operating partnership units | — | — | (596.4 | ) | |||||
Dividends paid | (145.7 | ) | (114.3 | ) | (80.8 | ) | |||
Borrowings from credit facility | 1,390.0 | 710.0 | 260.0 | ||||||
Payments on credit facility | (1,275.0 | ) | (460.0 | ) | (10.0 | ) | |||
Payments on senior notes | (474.8 | ) | — | — | |||||
Proceeds from issuance of senior notes | 1,217.8 | — | 103.8 | ||||||
Debt issuance costs | (19.0 | ) | (8.7 | ) | (5.4 | ) | |||
Payments on capital leases and lease financing arrangements | (9.8 | ) | (9.1 | ) | (5.9 | ) | |||
Payment of note payable | — | (1.5 | ) | — | |||||
Interest paid by lenders on issuance of the senior notes | 2.7 | — | — | ||||||
Payment of debt extinguishment costs | (30.4 | ) | — | — | |||||
Tax payment upon exercise of equity awards | (6.9 | ) | (14.2 | ) | (0.8 | ) | |||
Net cash provided by financing activities | 1,354.6 | 549.3 | 463.2 | ||||||
Net increase (decrease) in cash, cash equivalents and restricted cash | 137.3 | (1.2 | ) | (20.7 | ) | ||||
Cash, cash equivalents and restricted cash at beginning of period | 14.6 | 15.8 | 36.5 | ||||||
Cash, cash equivalents and restricted cash at end of period | $ | 151.9 | $ | 14.6 | $ | 15.8 | |||
Supplemental disclosures | |||||||||
Cash paid for interest | $ | 68.8 | $ | 55.0 | $ | 43.7 | |||
Cash paid for income taxes | 2.2 | 1.2 | 3.4 | ||||||
Capitalized interest | 17.0 | 10.6 | 6.1 | ||||||
Non-cash investing and financing activities: | |||||||||
Acquisition and development of properties in accounts payable and other liabilities | 115.5 | 132.7 | 59.2 | ||||||
Dividends payable | 41.8 | 33.9 | 23.6 | ||||||
The accompanying notes are an integral part of the consolidated financial statements.
74
CYRUSONE INC.
Notes to Consolidated Financial Statements
1. Description of Business
CyrusOne Inc., together with CyrusOne GP, a wholly owned subsidiary of CyrusOne Inc., through which CyrusOne Inc. wholly owns CyrusOne LP (the operating partnership) and the subsidiaries of the operating partnership (collectively, “CyrusOne”, “we”, “us”, “our”, and the “Company”) owns, operates and develops enterprise-class, carrier-neutral, multi-tenant and single-tenant data center properties. Our customers operate in a number of industries, including information technology, financial services, energy, oil and gas, mining, medical and consumer goods and services. We currently operate 45 data centers and 2 recovery centers located in the United States, United Kingdom and Singapore.
2. Formation and Recent Developments
Formation
On January 24, 2013, CyrusOne Inc. completed its initial public offering (the IPO) of common stock. During 2014, 2015 and 2016, the Company completed public offerings of 16.0 million, 27.3 million, and 10.3 million shares of its common stock and received $355.9 million, $799.3 million and $419.8 million net proceeds, respectively, from these public offerings.
On December 14, 2015, CyrusOne Inc. completed a public secondary offering of 1.4 million shares of common stock on behalf of CBI. The Company received no proceeds from the offering. On December 31, 2015, CyrusOne Inc. completed an issuance of approximately 6.3 million newly issued shares of common stock in exchange for an equal number of operating partnership units of CyrusOne LP, held by a subsidiary of CBI. As of December 31, 2015, CBI owned 9.5% of the common stock of CyrusOne Inc.
As of December 31, 2017 and 2016, CBI owned less than 5.0% of the common stock of CyrusOne Inc. As of December 31, 2017, all of the 96.1 million outstanding operating partnership units of CyrusOne LP are owned, directly or indirectly, by CyrusOne Inc.
Recent Developments
On February 27, 2017, the Company effected a full physical early settlement of the previously announced forward sale agreements (the Forward Sale Agreements) entered into with Goldman, Sachs & Co. on August 10, 2016 relating to, in the aggregate, approximately 4.4 million shares of the Company’s common stock. Upon settlement, the Company issued and sold all such shares to Goldman, Sachs & Co., in its capacity as forward purchaser, in exchange for net proceeds of approximately $210.8 million, in accordance with the provisions of the Forward Sales Agreements. Such proceeds were used to finance, in part, the acquisition of the Sentinel Properties (as defined below).
On February 28, 2017, CyrusOne closed its acquisition of two data centers located in Somerset, New Jersey and Raleigh-Durham, North Carolina (the Sentinel Properties) from Sentinel Data Centers. The Company paid aggregate cash consideration of approximately $492.3 million in connection therewith, including transaction related costs of $1.5 million. The transaction was financed by the Company with proceeds from settlement of its forward equity sale described above and borrowings under its Revolving Credit Facility (as defined in Note 10).
On March 17, 2017, CyrusOne LP and CyrusOne Finance Corp. completed their offering of $500.0 million aggregate principal amount of 5.000% senior notes due 2024 (the Original 2024 Notes) and $300.0 million aggregate principal amount of 5.375% senior notes due 2027 (the Original 2027 Notes) in a private offering. The Company received proceeds of $791.2 million, net of underwriting costs of $8.8 million.
The Company used the net proceeds from the offering (i) to finance its repurchase and redemption of all of its outstanding 6.375% Senior Notes due 2022 (the 2022 Notes), of which $474.8 million in aggregate principal amount was outstanding, (ii) for the repayment of borrowings outstanding under the operating partnership’s Revolving Credit Facility and (iii) for the payment of related premiums, fees, discounts and expenses.
On June 16, 2017, CyrusOne LP entered into an amendment to its senior Second Amended and Restated Credit Agreement (as defined in Note 10) that increased the total commitments thereunder by $450.0 million to $2.0 billion and provided additional flexibility to pursue various initiatives, including joint ventures and international expansion. The amendment increased the size of the term loan maturing in January 2022 from $300.0 million to $650.0 million and expanded the Revolving Credit Facility (as defined in Note 10) by $100.0 million to $1.1 billion. Proceeds from the $350.0 million term loan increase were used to pay down borrowings under the Revolving Credit Facility. The existing $250.0 million term loan maturing in September 2021 remained unchanged. The amendment refreshes the amount available under the accordion feature of the Second Amended and Restated Credit Agreement to enable CyrusOne LP to increase the total loan commitments under the Second Amended and Restated Credit Agreement to up to $2.3 billion from time to time.
75
CYRUSONE INC.
Notes to Consolidated Financial Statements - (continued)
On October 18, 2017, CyrusOne announced the formation of a new strategic partnership with the execution of a commercial agreement with GDS Holdings Limited (GDS), a leading developer and operator of high-performance, large-scale data centers in China. Under this new partnership, CyrusOne and GDS will work together to market and cross-sell data center space and related services in both the United States and China.
In addition, CyrusOne purchased newly issued unregistered ordinary shares equivalent to 8.0 million American depository shares (ADS) of GDS at a price per ordinary share equivalent to $12.45 per ADS, a 4% discount to the October 17, 2017 closing price, for a total investment of $100 million. Each ADS is equivalent to eight ordinary GDS shares. CyrusOne President and Chief Executive Officer Gary Wojtaszek will join the GDS Board of Directors.
On November 3, 2017, CyrusOne LP and CyrusOne Finance Corp. completed their offering of $200.0 million aggregate principal amount of 5.000% senior notes due 2024 (the Additional 2024 Notes) and $200.0 million aggregate principal amount of 5.375% senior notes due 2027 (the Additional 2027 Notes) in a private offering. The Additional 2024 Notes have terms substantially identical to the Original 2024 Notes and the Additional 2027 Notes have terms substantially identical to the Original 2027 Notes. The Original 2024 Notes and the Additional 2024 Notes form a single class of securities, and the Original 2027 Notes and the Additional 2027 Notes form a single class of securities. The Company received proceeds of $416.1 million, net of underwriting costs of $4.4 million. The Original 2024 Notes and the Additional 2024 Notes are referred to as the 2024 Notes and the Original 2027 Notes and the Additional 2027 Notes are referred to as the 2027 Notes.
During the third quarter of 2017, the Board authorized the Company to enter into sales agreements pursuant to which the Company may issue and sell from time to time shares of its common stock having an aggregate sales price of up to $500 million (the 2017 At The Market (ATM) Stock Offering Program). The 2017 ATM Stock Offering program replaces a prior ATM stock offering program. For the year ended December 31, 2017, the Company sold approximately 8.4 million shares of its common stock under the ATM stock offering programs, generating net proceeds of approximately $493.7 million, net of sales commissions of $6.3 million.
On December 21, 2017, CyrusOne announced the execution of a definitive agreement with Quantum Strategic Partners Ltd. (Quantum), a private investment fund managed by Soros Fund Management LLC and certain other sellers named therein, to purchase Zenium Data Centers (Zenium), a leading hyperscale data center provider in Europe with four properties in London and Frankfurt, the continent’s two largest data center markets. The purchase price is expected to be approximately $442.0 million, excluding transaction-related expenses. CyrusOne has also agreed to reimburse Zenium for capital expenditures between signing and closing. The transaction is expected to close in the first half of 2018, subject to the fulfillment of customary closing conditions including applicable regulatory approvals.
In connection with the issuance of the 2024 Notes and the 2027 Notes, CyrusOne LP and CyrusOne Finance Corp. agreed to use commercially reasonable efforts to file and cause to become effective a registration statement to be used in connection with the exchange of 2024 Notes and 2027 Notes for freely tradeable notes with substantially identical terms in all material respects to the 2024 Notes and 2027 Notes, and to complete an exchange offer. In January 2018, upon completion of the exchange offer, all validly tendered 2024 Notes and 2027 Notes were exchanged for notes that are registered with the Securities and Exchange Commission (SEC) and are freely tradeable.
Our total stock issuance for the year ended December 31, 2017 was $706.0 million which included $210.8 million under the forward sales agreements, $493.7 million under the ATM stock offering program and $1.5 million related to the employee stock purchase plans and stock options exercised.
3. Basis of Presentation
The accompanying financial statements as of December 31, 2017 and December 31, 2016, and for the years ended December 31, 2017, December 31, 2016 and December 31, 2015, are prepared on a consolidated basis.
In addition, the accompanying financial statements have been prepared in accordance with accounting principles generally accepted in the United States of America (GAAP). All intercompany transactions and balances have been eliminated in consolidation. All prior year amounts have been presented to conform to current year's presentation. Base revenue and other, and metered power reimbursements for the years ended December 31, 2016 and 2015 have been presented separately to conform with the presentation for the year ended December 31, 2017. There is no change to total revenue as a result of this change in presentation.
We adopted ASU No. 2016-18, Restricted Cash, during 2017 (See Note 5 for additional details). The statement of cash flows for prior periods has been presented to conform to the current year's presentation.
76
CYRUSONE INC.
Notes to Consolidated Financial Statements - (continued)
4. Significant Accounting Policies
Use of Estimates—Preparation of the consolidated financial statements in conformity with GAAP requires management to make estimates and assumptions that affect the amounts reported in the consolidated financial statements and accompanying notes. These estimates and assumptions are based on management’s knowledge of current events and actions that we may undertake in the future. Estimates are used in determining the fair value of leased real estate, including purchase price allocations for business combinations and asset acquisitions, the useful lives of real estate and other long-lived assets, future cash flows associated with goodwill and other long-lived asset impairment testing, deferred tax assets and liabilities, available-for-sale securities and loss contingencies. Actual results may differ from these estimates and assumptions.
Investment in Real Estate—Investment in real estate consist of land, buildings, improvements and integral equipment utilized in our data center operations. Real estate acquired from third parties has been recorded at its acquisition cost. Additions and improvements which extend an asset’s useful life or increase its functionality are capitalized and depreciated over the asset’s remaining life. Maintenance and repairs are expensed as incurred.
When we are involved in the construction of structural improvements to leased property, we are deemed the accounting owner of the leased real estate. In these instances, we bear substantially all the construction period risk, including managing or funding construction. As we have substantially all of the construction risks, we are deemed the “owner” of the asset under construction for accounting purposes during the construction period, and are therefore required to capitalize the construction costs on the accompanying consolidated balance sheets. At inception, the fair value of the building, excluding land, is recorded as an asset, and the construction and modification costs to the building that are not funded by us would be recorded as a liability. As construction progresses, the value of the asset and obligation increases by the fair value of the structural improvements. At completion of the construction, Sales-Leaseback Accounting under ASC 840-40-25 is also evaluated. Due to our continuing involvement with the lessor, Sales-Leaseback Accounting is precluded and the liability is not derecognized. When the asset is placed in service, depreciation commences, and the leased real estate is depreciated to the lesser of (i) its estimated fair value at the end of the term or (ii) the expected amount of the unamortized obligation at the end of the term. The associated obligation is presented as Lease financing arrangements in the accompanying consolidated balance sheets.
When we are not deemed the accounting owner of leased real estate, we further evaluate the lease to determine whether the lease should be classified as a capital or operating lease. One of the following four characteristics must be present to classify a lease as a capital lease: (i) the lease transfers ownership of the property to the lessee by the end of the lease term, (ii) the lease contains a bargain purchase option, (iii) the lease term is equal to 75% or more of the estimated economic life of the leased property or (iv) the net present value of the lease payments is at least 90% of the fair value of the leased property.
Construction in progress includes direct and indirect expenditures for the construction and expansion of our data centers and is stated at its acquisition cost. Independent contractors perform substantially all of the construction and expansion efforts of our data centers. Construction in progress includes costs incurred under construction contracts including project management services, engineering and schematic design services, design development, construction services and other construction-related fees and services. Interest, property taxes and certain labor costs are also capitalized during the construction of an asset. These costs are depreciated over the estimated useful life of the related assets. Capitalized interest in 2017, 2016, and 2015 was $17.0 million, $10.6 million, and $6.1 million, respectively.
Depreciation is calculated using the straight-line method over the estimated useful life of the asset. Useful lives range from nine to thirty years for buildings, three to thirty years for building improvements, and two to twenty years for equipment. Leasehold improvements are amortized over the shorter of the asset’s useful life or the remaining lease term, including renewal options which are reasonably assured.
Management reviews the carrying value of long-lived assets, including intangible assets with finite lives, when events or changes in circumstances indicate that the carrying amount of the assets may not be recoverable. Examples of such indicators may include a significant adverse change in the extent to which or manner in which the property is being used, an accumulation of costs significantly in excess of the amount originally expected for acquisition or development, or a history of operating or cash flow losses. When such indicators exist, we review an estimate of the undiscounted future cash flows expected to result from the use of an asset (or group of assets) and its eventual disposition and compare such amount to its carrying amount. We consider factors such as future operating income, leasing demand, competition and other factors. If our undiscounted net cash flows indicate that we are unable to recover the carrying value of the asset, an impairment loss is recognized. An impairment loss is measured as the amount by which the asset’s carrying value exceeds its estimated fair value.
Business Combinations and Asset Acquisitions—The Company applies the purchase method for business combinations, where all tangible and identifiable intangible assets acquired and all liabilities assumed are recorded at fair value. Any excess purchase price is recorded as goodwill. Transaction costs associated with business combinations are expensed as incurred. Revenues and
77
CYRUSONE INC.
Notes to Consolidated Financial Statements - (continued)
the results of operations of the acquired business are included in the accompanying consolidated financial statements commencing on the date of acquisition.
The Company applies a screen test to determine when a set is not a business. When substantially all of the fair value of the gross assets acquired (or disposed of) is concentrated in a single identifiable asset or a group of similar identifiable assets, the set is not a business. Upon adoption of ASU 2017-01, Business Combinations, most acquisitions of investment properties will meet the definition of an asset. Purchase price paid for assets acquired is allocated between identified tangible and intangible assets acquired. Transaction costs associated with asset acquisitions are capitalized. Revenues and the results of operations of the acquired assets are included in the accompanying consolidated financial statements commencing on the date of the asset acquisition. The Company early adopted ASU 2017-01, Business Combinations, on January 1, 2017.
Cash and Cash Equivalents—Cash and cash equivalents include all non-restricted cash held in financial institutions and other non-restricted highly liquid short-term investments with original maturities at acquisition of three months or less.
Restricted Cash—Restricted cash includes cash equivalents held to collateralize standby letters of credit and/or deposited in escrow to fund construction or pending potential acquisition transactions. In addition, we may have other cash that is not immediately available for use in current operations.
Goodwill—We evaluate goodwill for possible impairment at least annually or upon the occurrence of a triggering event. A triggering event is an event or circumstance that would more likely than not reduce the fair value of a reporting unit below its carrying amount, including sales of properties defined as businesses for which the relative size of the sold property is significant to the reporting unit, that could impact our goodwill impairment calculations.
For our annual impairment evaluation, we have the option of performing a qualitative or quantitative goodwill impairment analysis. A qualitative analysis, Step zero, analyzes the macro-economic environment in which we operate for any significant changes such as deterioration in the market that the Company operates or overall financial performance such as declining cash flows. Also, entity specific changes are analyzed such as change in management, strategy or composition of reporting unit. A quantitative analysis, Step one, requires the Company to estimate the fair value of the reporting unit and compare the fair value to the carrying value to identify whether the value of the recorded goodwill is impaired. Changes in certain assumptions could have a significant impact on the impairment test for goodwill under Step one. The most critical assumptions are projected future growth rates, operating margins, capital expenditures, tax rates, terminal values and discount rates. These assumptions are subject to change as our long-term plans and strategies are updated each year. In January 2017, the FASB issued ASU 2017-04 in order to simplify the test for goodwill impairment by eliminating Step 2, which measures a goodwill impairment loss by comparing the implied fair value of a reporting unit's goodwill with the carrying amount of that goodwill. Under the amendments in this update, an entity should perform its annual goodwill impairment test by comparing the fair value of a reporting unit with its carrying amount and should recognize an impairment charge for the amount by which the carrying amount exceeds the reporting unit's fair value. However, the loss recognized should not exceed the total amount of goodwill allocated to that reporting unit. Early adoption is permitted. We adopted this standard on January 1, 2017.
During the fourth quarter of 2017 and 2016, we applied Step zero and determined that it is more likely than not that the fair value of the reporting unit is more than the carrying amount and therefore determined that the two step method for goodwill impairment testing was not necessary. During the fourth quarter of 2015, we performed a detailed, quantitative assessment. Based on the Company's annual assessment of goodwill, no impairment has been recognized through December 31, 2017.
Long-Lived and Intangible Assets—Intangible assets represent purchased assets that lack physical substance, but can be separately distinguished from goodwill because of contractual or other legal rights or because the asset is capable of being sold or exchanged, either on its own or in combination with a related contract, asset, or liability. Intangible assets with finite lives consist of trademarks, a trade name, customer relationships, and a favorable leasehold interest.
Rent and Other Receivables—Receivables consist principally of trade receivables from customers and are generally unsecured and due within 30 to 120 days. Unbilled receivables arise from services rendered but not yet billed. Expected credit losses associated with trade receivables are recorded as an allowance for doubtful accounts. The allowance for doubtful accounts is estimated based upon historic patterns of credit losses for aged receivables as well as specific provisions for certain identifiable, potentially uncollectible balances. When internal collection efforts on accounts have been exhausted, the accounts are written-off and the associated allowance for doubtful accounts is reduced.
At December 31, 2017 and 2016, there were no customers with receivables that made up 10% or more of the Company's Rent and other receivables balance.
Deferred Leasing Costs—Deferred leasing costs are presented with Other assets in the accompanying consolidated balance sheets. Leasing commissions incurred at the commencement of a new lease are capitalized and amortized over the average term of the
78
CYRUSONE INC.
Notes to Consolidated Financial Statements - (continued)
customer lease. Amortization of deferred leasing costs is presented with Depreciation and amortization in the accompanying consolidated statements of operations. If a lease terminates prior to the expiration of the lease, the remaining unamortized cost is written off to amortization expense. As of December 31, 2017 and 2016, deferred leasing costs were $32.6 million and $23.3 million, respectively. Amortization expense was $7.6 million, $6.1 million and $5.2 million for the years ended December 31, 2017, 2016 and 2015, respectively.
Deferred Financing Costs—Deferred financing costs include costs incurred in connection with issuance of debt, including our senior notes, term loans and revolving credit facilities. These costs are presented in the balance sheet as a direct reduction from the carrying amount of the debt liability. These financing costs are deferred and amortized to expense over the term of the instrument and are included as a component of Interest expense.
Lease Financing Arrangements—Lease financing arrangements represent leases of real estate where we are involved in the construction of structural improvements to develop buildings into data centers. When we bear substantially all the construction period risk, such as managing or funding construction, we are deemed to be the accounting owner of the leased property and, at the lease inception date, we are required to record at fair value the property and associated liability on our consolidated balance sheets. These transactions generally do not qualify for sale-leaseback accounting due to our continued involvement in these data center operations.
Revenue Recognition—Colocation rentals are generally billed monthly in advance, and some contracts have escalating payments over the term of the contract. If rents escalate without the lessee gaining access to or control over additional leased space or power, and the lessee takes possession of, or controls the physical use of the property (including all contractually committed power) at the beginning of the lease term, the rental payments by the lessee are recognized as revenue on a straight-line basis over the term of the lease. If rents escalate because the lessee gains access to and control over additional leased space or power, revenue is recognized in proportion to the additional space or power in the periods that the lessee has control over the use of the additional space or power. The excess of revenue recognized over amounts contractually due is recognized in Other assets in the accompanying consolidated balance sheets. As of December 31, 2017 and 2016, straight-line rent receivable was $100.0 million and $67.6 million, respectively.
Revenue is recognized for services or products that are deemed separate units of accounting. When a customer makes an advance payment or they are contractually obligated to pay any amounts in advance, which is not deemed a separate unit of accounting, Deferred revenue liability is recorded. This revenue is recognized ratably over the expected term of the lease, unless the pattern of service suggests otherwise. As of December 31, 2017 and 2016, Deferred revenue was $111.6 million and $76.7 million, respectively.
Some of our leases are structured on a full-service gross basis in which the customer pays a fixed amount for both colocation rent and power. Other leases provide that the customer will be billed for power based upon actual usage which is separately metered. Power is generally billed one month in arrears, and an estimate of this revenue is accrued in the month that the associated costs are incurred. In certain leases, we receive an administrative fee when we manage the meters for our customers. We generally are not entitled to reimbursements for real estate taxes, insurance or other operating expenses.
Certain customer leases require specified levels of service or performance. If we fail to meet these service levels, our customers may be eligible to receive credits on their contractual billings. These credits are recognized against revenue when an event occurs that gives rise to such credits. Customer credits were immaterial for each of the years presented. A provision for doubtful accounts is recognized when the collection of contractual rent, straight-line rent or customer reimbursements are deemed to be uncollectible.
Sales and Marketing Expense—Sales and marketing expense is comprised of compensation and benefits associated with Sales and marketing personnel as well as advertising and marketing costs. Costs related to advertising expense were $2.4 million, $4.1 million and $2.2 million for the years ended December 31, 2017, 2016 and 2015, respectively.
Depreciation and Amortization Expense—Depreciation expense is recognized over the estimated useful lives of real estate applying the straight-line method. The useful life of leased real estate and leasehold improvements is the lesser of the economic useful life of the asset or the term of the lease, including optional renewal periods if renewal of the lease is reasonably assured. The residual value of leased real estate is estimated as the lesser of (i) the expected fair value of the asset at the end of the lease term or (ii) the expected amount of the unamortized liability at the end of the lease term. Estimated useful lives are periodically reviewed. Depreciation expense was $226.2 million, $157.7 million and $117.8 million for the years ended December 31, 2017, 2016 and 2015, respectively.
Amortization expense is recognized over the estimated useful lives of finite-lived intangibles. Finite-lived intangibles include trademarks, customer relationships, favorable leasehold interests, in-place leases, trade names and deferred leasing costs. See Note 9, Goodwill, Intangible and Other Long-Lived Assets, for details.
79
CYRUSONE INC.
Notes to Consolidated Financial Statements - (continued)
Transaction and Acquisition Integration Costs—Transaction costs represent incremental legal, accounting and professional fees incurred in connection with consummated business combinations; integration costs post an asset acquisition; and costs associated with diligence efforts on certain targeted and unrealized acquisitions. Integration costs represent incremental costs to integrate a consummated acquisition. These costs are expensed as incurred and do not include any recurring costs from our ongoing operations.
Income Taxes—The income tax provision consists of an amount for taxes currently payable and an amount for tax consequences deferred to future periods. CyrusOne Inc. has elected to be taxed as a REIT under the Internal Revenue Code of 1986, as amended (the Code), commencing with our initial taxable year ending December 31, 2013. Provided we continue to meet the various qualification tests mandated under the Code, we are generally not subject to corporate level federal income tax on the earnings distributed currently to our stockholders. If we fail to qualify as a REIT in any taxable year, our taxable income will be subject to federal income tax at regular corporate rates and, for taxable years beginning prior to January 1, 2018, any applicable alternative minimum tax, and we may not be able to qualify as a REIT for four subsequent taxable years.
While CyrusOne Inc. and the operating partnership do not pay federal income taxes, we are still subject to foreign, state and local income taxes in the locations in which we conduct business. Our taxable REIT subsidiaries (each a TRS) are also subject to federal and state income taxes to the extent they earn taxable income.
Deferred income taxes are recognized in certain entities. Deferred income taxes are provided for temporary differences in the basis between financial statement and income tax assets and liabilities. Deferred income taxes are recalculated annually at rates then in effect. Valuation allowances are recorded to reduce deferred tax assets to amounts that are more likely than not to be realized. The ultimate realization of the deferred tax assets depends upon our ability to generate future taxable income during the periods in which basis differences and other deductions become deductible and prior to the expiration of the net operating loss carryforwards.
The Company and its subsidiaries file income tax returns in the U.S. federal jurisdiction as well as various foreign, state and local jurisdictions. The Company's previous tax filings are subject to normal reviews by regulatory agencies until the related statute of limitations expires. With a few exceptions, the Company is no longer subject to U. S. federal, state or local examinations for years prior to 2012, and we have no liabilities for uncertain tax positions as of December 31, 2017 or 2016.
Foreign Currency Translation and Transactions—The financial position of foreign subsidiaries is translated at the exchange rates in effect at the end of the period, while revenues and expenses are translated at average rates of exchange during the period. Gains or losses from translation of foreign operations where the local currency is the functional currency are included as components of other comprehensive (loss) income. Gains or losses from foreign currency transactions are included in determining net (loss) income.
Comprehensive (Loss) Income—Comprehensive (loss) income represents the change in net assets of a company from transactions and other events from nonowner sources. Comprehensive (loss) income comprises all components of net (loss) income and all components of other comprehensive (loss) income.
(Loss)/Income Per Share—Basic EPS includes only the weighted average number of common shares outstanding during the period. Diluted EPS includes the weighted average number of common shares and the dilutive effect of stock options, restricted stock and share unit awards outstanding during the period, when such instruments are dilutive.
All outstanding unvested share-based payment awards that contain rights to nonforfeitable dividends are treated as participating in undistributed earnings with common shareholders. Awards of this nature are considered participating securities and the two-class method of computing basic and diluted EPS is applied.
Stock-Based Compensation—Our board of directors adopted the 2012 Long-Term Incentive Plan (LTIP), which was amended and restated by our stockholders on May 2, 2016. The LTIP is administered by the compensation committee of the board of directors. Awards issuable under the LTIP include common stock, restricted stock, restricted stock units, stock options and other incentive awards. See Note 17 for additional details relating to these awards.
Share-based compensation expense is based on the estimated grant-date fair value. CyrusOne Inc. recognizes share-based compensation expense on a straight-line basis over the requisite service period for time-based awards and on a graded vesting basis for performance-based awards. We adopted ASU No. 2016-09, Improvements to Employee Share-Based Payment Accounting (Subtopic 718) in the fourth quarter of 2016 and elected to account for forfeitures as they occur. Prior to the adoption of this ASU, CyrusOne estimated forfeitures based on historical activity, expected employee turnover, and other qualitative factors which were adjusted for changes in estimates and award vesting.
CyrusOne Inc. uses the Black-Scholes-Merton option pricing model to calculate the fair value of stock options. This option valuation model requires the use of subjective assumptions, including the estimated fair value of the underlying common stock, the expected
80
CYRUSONE INC.
Notes to Consolidated Financial Statements - (continued)
stock price volatility, and the expected term of the option. The estimated fair value of the underlying common stock is based on third-party valuations. Our volatility estimates are based on a peer group of companies. We estimate the expected term of the awards to be the weighted average mid-point between the vesting date and the end of the contractual term.
For interim and annual periods, we use our year-to-date actual results, financial forecasts, and other available information to estimate the probability of the award vesting based on the performance metrics.
Fair Value Measurements—Fair value measurements are utilized in accounting for business combinations, testing of goodwill and other long-lived assets for impairment, recording unrealized gain/loss on available-for-sale securities and disclosures. Fair value of financial and non-financial assets and liabilities is defined as an exit price, representing the amount that would be received to sell an asset or paid to transfer a liability in an orderly transaction between market participants. The three-tier hierarchy for inputs used in measuring fair value, which prioritizes the inputs used in the methodologies of measuring fair value for asset and liabilities, is as follows:
Level 1—Observable inputs for identical instruments such as quoted market prices;
Level 2—Inputs include quoted prices for similar assets and liabilities in active markets, quoted prices for identical or similar assets or liabilities in markets that are not active, inputs other than quoted prices that are observable for the asset or liability (i.e., interest rates, yield curves, etc.), and inputs that are derived principally from or corroborated by observable market data by correlation or other means (market corroborated inputs); and
Level 3—Unobservable inputs that reflect our determination of assumptions that market participants would use in pricing the asset or liability. These inputs are developed based on the best information available, including our own data.
Business Segments—Business segments are components of an enterprise for which separate financial information is available and regularly viewed by the chief operating decision maker to assess performance and allocate resources. Our chief operating decision maker, the Company's Chief Executive Officer, reviews our financial information on an aggregate basis. Furthermore, our data centers have similar economic characteristics and customers across all geographic locations, and our service offerings have similar production processes, deliver services in a similar manner and use the same types of facilities and similar technologies. As a result, we have concluded that we have one reportable business segment. For the year ended December 31, 2017, one customer, Microsoft Corporation, represented approximately 18% of our revenue.
5. Recently Issued Accounting Standards
Accounting Standards Update (ASU) No. 2014-09 (ASU 2014-09), Revenue from Contracts with Customers (Topic 606), as amended.
On May 28, 2014, the Financial Accounting Standards Board (FASB) issued ASU 2014-09, which supersedes the revenue recognition requirements in Topic 605, "Revenue Recognition" and most industry-specific guidance. The core principle of ASU 2014-09 is that a company will recognize revenue when it transfers promised goods or services to customers in an amount that reflects the consideration to which the company expects to be entitled in exchange for those goods or services. On July 9, 2015, the FASB deferred the effective date of ASU 2014-09. The new revenue standard is effective for fiscal years, and interim periods within those years, beginning after December 15, 2017 (January 1, 2018 for CyrusOne) and allows either a full retrospective adoption to all periods presented or a modified retrospective adoption approach with the cumulative effect of initial application of the revised guidance recognized at the date of initial application. We are continuing to evaluate the impact of ASU 2014-09 on our consolidated financial statements. We have identified each of our revenue streams and developed views of how they will be impacted by this adoption. Our evaluation is that the timing of revenue recognition for our various revenue streams would not be materially impacted by the adoption of this standard. As we continue our assessment we are reviewing, in detail, selected revenue contracts to verify and support our initial conclusions. We will adopt the modified retrospective approach with any cumulative effect recognized in retained earnings on the date of adoption which is expected to be immaterial. We will be adopting this Standard with an effective date of January 1, 2018.
ASU No. 2016-01 (ASU 2016-01), Financial Instruments - Overall (Topic 825-10)
On January 5, 2016, the FASB issued ASU 2016-01. Equity investments (except those accounted for under the equity method of accounting or those that result in consolidation of the investee) are to be measured at fair value with changes in fair value recognized in net income. However, an entity may choose to measure equity investments that do not have readily determinable fair values at cost minus impairment, if any, plus or minus changes resulting from observable price changes in orderly transactions for the identical or a similar investment of the same issuer. Equity investments without readily determinable fair values are to be assessed for impairment using a quantitative approach. ASU 2016-01 should be applied by means of a cumulative-effect adjustment to the
81
CYRUSONE INC.
Notes to Consolidated Financial Statements - (continued)
balance sheet as of the beginning of the fiscal year of adoption. The guidance is effective for annual periods beginning after December 15, 2017. The adoption of 2016-01 could have a material impact for our financial statements. In 2017 we recorded an increase to the value of our equity method investment due to an unrealized gain of $75.6 million which is recorded in Accumulated other comprehensive income (loss) in the consolidated balance sheets.
ASU No. 2016-02 (ASU 2016-02), Leases (Topic 842)
On February 25, 2016, the FASB issued ASU 2016-02. Lessees will need to recognize on their balance sheet a right-of-use asset and a lease liability for virtually all of their leases (other than leases that meet the definition of a short-term lease). The liability will be equal to the present value of lease payments. The asset will be based on the liability, adjusted for any initial direct costs of the lease, lease incentives or early lease payments, where applicable. For income statement purposes, the FASB retained a dual model, requiring leases to be classified as either operating or finance. Operating leases will result in straight-line expense (similar to current operating leases) while finance leases will result in a front-loaded expense pattern (similar to current capital leases). Classification will be based on criteria that are largely similar to those applied in current lease accounting. The standard is effective for CyrusOne beginning January 1, 2019. Early adoption is permitted. The new standard must be adopted using a modified retrospective transition, and provides for certain practical expedients. Transition will require application of the new guidance at the beginning of the earliest comparative period presented. We are beginning to evaluate the impact of ASU 2016-02 on our consolidated financial statements and plan to adopt the standard on January 1, 2019.
ASU 2016-02 originally stated that companies would be required to bifurcate certain lease revenues between lease and non-lease components, however, the FASB issued an exposure draft in January 2018 (2018 Exposure Draft) which, if adopted as written, would allow lessors a practical expedient by class of underlying assets to account for lease and non-lease components as a single lease component if certain criteria are met. Additionally, only incremental direct leasing costs may be capitalized under this new guidance, which is consistent with the Company’s existing policies. ASU 2016-02 originally required a modified retrospective method of adoption, however, the 2018 Exposure Draft indicates that companies may be permitted to recognize a cumulative-effect adjustment to the opening balance of retained earnings in the period of adoption. The pronouncement allows some optional practical expedients. The Company expects to adopt this new guidance on January 1, 2019 and will continue to evaluate the impact of this guidance until it becomes effective.
ASU No. 2016-13 (ASU 2016-13), Measurement of Credit Losses on Financial Instruments (Subtopic 326)
In June 2016, the FASB issued guidance which requires a financial asset measured at amortized cost basis to be presented at the net amount expected to be collected. The amendments affect entities holding financial assets and net investment in leases that are not accounted for at fair value through net income. The amendments affect loans, debt securities, trade receivables, net investments in leases, off-balance-sheet credit exposures, reinsurance receivables, and any other financial assets not excluded from the scope that have the contractual right to receive cash. The guidance is effective for annual periods beginning after December 15, 2019. Early adoption is permitted. We are currently evaluating the full impact of the new standard.
ASU No. 2016-18 (ASU 2016-18), Restricted Cash (Subtopic 230)
In November 2016, the FASB issued guidance which addresses the diversity in the classification and presentation of changes in restricted cash on the statement of cash flows. The amendment requires that a statement of cash flows explain the change during the period in total cash, cash equivalents, and amounts generally described as restricted cash or restricted cash equivalents. The guidance is effective for annual periods beginning after December 15, 2017. Early adoption is permitted.
We adopted ASU 2016-18 in the fourth quarter of 2017 with retrospective adoption to all periods presented. Accordingly, restricted cash balances are included along with cash and cash equivalents at the end of the period and beginning of the period in our consolidated statements of cash flows for all periods presented. Line items showing changes in restricted cash balances have been eliminated from our consolidated statements of cash flows.
82
CYRUSONE INC.
Notes to Consolidated Financial Statements - (continued)
The following table provides a reconciliation of cash, cash equivalents and restricted cash reported within the statement of financial position that sum to the total of the same such amounts shown in our statements of cash flows for the years ended December 31, 2017, 2016, and 2015 (in millions):
Year Ended December 31, | |||||||||
2017 | 2016 | 2015 | |||||||
Cash and cash equivalents | $ | 151.9 | $ | 14.6 | $ | 14.3 | |||
Restricted cash | — | — | 1.5 | ||||||
Total cash, cash equivalents, and restricted cash shown in the statement of cash flows | $ | 151.9 | $ | 14.6 | $ | 15.8 | |||
The balance of total cash, cash equivalents and restricted cash as of January 1, 2015, was $36.5 million.
ASU No. 2017-01 (ASU 2017-01), Business Combinations (Topic 805)
In January 2017, the FASB issued guidance which clarifies the definition of a business with the objective of adding guidance to assist entities with evaluating whether transactions should be accounted for as acquisitions (or disposals) of assets or businesses. The definition of a business affects many areas of accounting including acquisitions, disposals, goodwill and consolidation. Under this new guidance, the Company expects most acquisitions of investment property will meet the definition of an asset and, thus, be accounted for as asset acquisitions. Consistent with existing guidance, transaction costs associated with asset acquisitions are capitalized while transaction costs associated with business combinations are expensed as incurred. The guidance is effective for annual periods beginning after December 15, 2017. Early adoption is permitted. We adopted this standard on January 1, 2017, and applied the new guidance for the acquisition of the Sentinel Properties.
ASU No. 2017-04 (ASU 2017-04), Goodwill and Other (Topic 350)
In January 2017, the FASB issued ASU 2017-04 in order to simplify the test for goodwill impairment by eliminating Step 2, which measures a goodwill impairment loss by comparing the implied fair value of a reporting unit's goodwill with the carrying amount of that goodwill. Under the amendments in this Update, an entity should perform its annual goodwill impairment test by comparing the fair value of a reporting unit with its carrying amount and should recognize an impairment charge for the amount by which the carrying amount exceeds the reporting unit's fair value. However, the loss recognized should not exceed the total amount of goodwill allocated to that reporting unit. The guidance is effective for CyrusOne beginning on January 1, 2020 and early adoption is permitted for interim or annual goodwill impairment tests performed on testing dates after January 1, 2017. We adopted this standard on January 1, 2017. The adoption of this standard did not have any impact on our consolidated financial statements.
ASU No. 2017-05 (ASU 2017-05), Other Income—Gains and Losses from the Derecognition of Nonfinancial Assets (Subtopic 610-20)—Clarifying the Scope of Asset Derecognition Guidance and Accounting for Partial Sales of Nonfinancial Assets
In February 2017, the FASB issued ASU 2017-05, Other Income – Gains and Losses from the Derecognition of Nonfinancial Assets (Topic 610-20), which requires that all entities account for the derecognition of a business in accordance with ASC 810, Consolidations, including instances in which the business is considered in substance real estate. The ASU is effective for annual periods, and interim periods therein, beginning after December 15, 2017. Early application is permitted. We are currently evaluating the full impact of the new standard.
83
CYRUSONE INC.
Notes to Consolidated Financial Statements - (continued)
6. Acquisitions and Purchase of Fixed Assets
Asset Acquisitions
On February 28, 2017, CyrusOne acquired two data centers located in Raleigh-Durham, North Carolina and Somerset, New Jersey from Sentinel Data Centers. This transaction provided enhanced geographic diversification, established a presence in the Southeast and expanded the Company's footprint in the Northeast. The two properties consist of more than 160,000 colocation square feet and approximately 21 megawatts of power capacity, with nearly 85% of the power capacity leased.
The Company applied ASU No. 2017-01, Business Combinations, to this acquisition and determined that substantially all of the fair value of the gross assets was concentrated in a group of similar identifiable assets. The Company did not acquire an organized workforce or a contract that provided access to an organized workforce. As a result, the Company determined to account for the transaction as an acquisition of assets.
The consolidated financial statements of CyrusOne Inc. include the operating results of the Sentinel Properties from February 28, 2017, the date of acquisition. The following table summarizes the estimated fair values of all assets acquired at the date of acquisition:
IN MILLIONS | ||||
Net investment in real estate | $ | 420.3 | ||
Cash and cash equivalents | 3.2 | |||
Intangible assets: | ||||
Above/Below market leases | 2.3 | |||
In-place leases | 75.8 | |||
Other assets | 2.4 | |||
Payables | (5.4 | ) | ||
Deferred revenue | (0.9 | ) | ||
Capital lease obligation | (2.2 | ) | ||
Net assets acquired attributable to CyrusOne Inc. | 495.5 | |||
Cash acquired | (3.2 | ) | ||
Net cash paid at acquisition | $ | 492.3 | ||
In December 2017, CyrusOne purchased a 44 acre site outside of Atlanta, Georgia. In July of 2017, CyrusOne purchased 66 acres of land in Allen, Texas with an option to purchase an additional 24 acres. In April of 2017, CyrusOne purchased 48 acres of land in Quincy, Washington. The Company purchased these parcels of land for future development for approximately $20.2 million in the aggregate.
On March 31, 2016, CyrusOne LP purchased CME Group's Chicago-Aurora I data center in (the Aurora Properties) Aurora, Illinois for $131.1 million, including transaction related costs, in an all cash transaction. The purchase enhances the geographic diversification of CyrusOne, provides access to a high quality enterprise customer base and strengthens our product portfolio. The transaction adds to CyrusOne Inc.'s existing data center platform an approximately 428,000 square-foot facility data center serving the Chicago metropolitan region. In addition, CyrusOne acquired approximately 15 acres of land directly adjacent to the data center for future development.
On April 1, 2016, the CME Group entered into a 15-year lease for data center space at the Aurora facility. The agreement is expected to enhance the range of services available to the Company and CME Group's mutual customers through connectivity, hosting and data offerings.
Other than the Aurora purchase, during the year ended December 31, 2016, the Company purchased four parcels of land for development for approximately $54.5 million.
Business Combination
On July 1, 2015, CyrusOne LP acquired 100% of Cervalis, a privately-held owner and operator of data centers for $398.4 million, excluding transaction-related expenses, in an all cash transaction. Cervalis has four data center facilities and two work recovery
84
CYRUSONE INC.
Notes to Consolidated Financial Statements - (continued)
facilities serving the New York metropolitan area. CyrusOne LP financed the acquisition with proceeds of CyrusOne Inc.'s June 2015 common stock offering and CyrusOne LP and CyrusOne Finance Corp.'s July 2015 6.375% senior notes offering as well as drawing under CyrusOne Inc.'s Revolving Credit Facility. The acquisition of Cervalis enhances the geographic diversification of CyrusOne, provides access to a high quality enterprise customer base and strengthens our product portfolio. The goodwill recorded for this acquisition relates to the incremental value that Cervalis brings to the existing CyrusOne operations. The customer relationships intangible is expected to be amortized over fifteen years. This acquisition was accounted for as a business combination. For the year ended December 31, 2015, transaction and integration costs related to the Cervalis Acquisition were $12.9 million.
The consolidated financial statements include the operating results of Cervalis from the date of acquisition. The following table summarizes the estimated fair values of all assets acquired and liabilities assumed at the date of acquisition:
Cash | $ | 1.1 | |
Rent and other receivables | 10.5 | ||
Restricted cash | 8.8 | ||
Net investment in real estate | 197.8 | ||
Goodwill | 178.9 | ||
Customer relationships | 117.4 | ||
Trade name | 2.3 | ||
Other long-term assets | 5.6 | ||
Total assets acquired | 522.4 | ||
Current liabilities | 18.3 | ||
Capital lease obligations | 1.7 | ||
Long-term debt | 1.5 | ||
Lease financing arrangements | 101.4 | ||
Total liabilities | 122.9 | ||
Net assets acquired attributable to CyrusOne Inc. | 399.5 | ||
Cash acquired | (1.1 | ) | |
Net cash paid at acquisition | $ | 398.4 | |
The acquisition of Cervalis in July 2015 resulted in an increase in revenue of $37.7 million for year ended December 31, 2015.
The unaudited pro forma combined historical results of CyrusOne, as if Cervalis had been acquired and the financing transactions had been consummated as of January 1, 2015 are:
IN MILLIONS | |||
For the year ended December 31, | 2015 | ||
Revenue | $ | 438.6 | |
Net loss | (10.9 | ) | |
Loss per share - basic and diluted | $ | (0.16 | ) |
These amounts have been calculated after applying CyrusOne's policies and adjusting the results to reflect changes to Depreciation and amortization to property and equipment, amongst others, and amortizing intangible assets had been recorded as of January 1, 2015. These pro forma combined results of operation are presented for informative purposes only and they do not purport to be indicative of the results of operation that actually would have resulted had the acquisition occurred on the date indicated, or that may result in the future.
85
CYRUSONE INC.
Notes to Consolidated Financial Statements - (continued)
7. Investment in Real Estate
A schedule of our gross investment in real estate follows:
IN MILLIONS | ||||||||||||||||||
As of December 31, | 2017 | 2016 | ||||||||||||||||
Land | Building and Improvements | Equipment | Land | Building and Improvements | Equipment | |||||||||||||
Dallas - Carrollton | $ | 16.1 | $ | 61.8 | $ | 210.7 | $ | 16.1 | $ | 57.6 | $ | 154.0 | ||||||
Houston - Houston West I | 1.4 | 85.2 | 49.8 | 1.4 | 85.0 | 48.4 | ||||||||||||
Cincinnati - 7th Street | 0.9 | 110.6 | 33.1 | 0.9 | 110.6 | 21.0 | ||||||||||||
Dallas - Lewisville | — | 76.7 | 37.4 | — | 76.7 | 33.7 | ||||||||||||
Northern Virginia - Sterling II | — | 28.8 | 112.3 | — | 28.7 | 111.8 | ||||||||||||
Somerset I | 12.1 | 124.8 | 83.7 | — | — | — | ||||||||||||
Chicago - Aurora I | 2.4 | 32.4 | 125.0 | 2.4 | 28.5 | 99.9 | ||||||||||||
Totowa - Madison | — | 28.5 | 55.1 | — | 28.3 | 50.8 | ||||||||||||
Cincinnati - North Cincinnati | 4.0 | 77.4 | 9.9 | 4.0 | 77.3 | 9.0 | ||||||||||||
San Antonio III | — | 40.3 | 96.8 | — | — | — | ||||||||||||
Houston - Houston West II | 2.8 | 22.8 | 50.1 | 2.8 | 23.1 | 49.0 | ||||||||||||
Wappingers Falls I | — | 11.3 | 18.0 | — | 11.3 | 17.1 | ||||||||||||
San Antonio I | 4.6 | 31.7 | 34.8 | 4.6 | 32.1 | 33.6 | ||||||||||||
Phoenix - Chandler II | — | 16.2 | 38.9 | — | 16.1 | 38.8 | ||||||||||||
Northern Virginia - Sterling I | 7.0 | 20.0 | 59.4 | 7.0 | 19.7 | 47.2 | ||||||||||||
Raleigh-Durham I | 2.1 | 78.0 | 76.0 | — | — | — | ||||||||||||
Houston - Galleria | — | 68.6 | 17.6 | — | 68.6 | 16.6 | ||||||||||||
Phoenix - Chandler I | 14.8 | 58.2 | 65.9 | 14.8 | 56.8 | 56.5 | ||||||||||||
Phoenix - Chandler III | — | 11.4 | 50.0 | — | 9.9 | 44.5 | ||||||||||||
Northern Virginia - Sterling III | — | 22.2 | 61.3 | — | — | — | ||||||||||||
Austin II | 2.0 | 23.4 | 7.0 | 2.0 | 23.4 | 6.6 | ||||||||||||
San Antonio II | 7.0 | 29.0 | 60.4 | 7.0 | 29.0 | 59.4 | ||||||||||||
Florence | 2.2 | 42.0 | 5.3 | 2.2 | 41.9 | 4.9 | ||||||||||||
Phoenix - Chandler IV | — | 18.3 | 40.9 | — | — | — | ||||||||||||
Cincinnati - Hamilton | — | 50.2 | 6.0 | — | 50.2 | 5.0 | ||||||||||||
London - Great Bridgewater | — | 28.4 | 1.1 | — | 25.9 | 0.9 | ||||||||||||
Northern Virginia - Sterling IV | 4.6 | 20.0 | 73.7 | 4.6 | 11.0 | 33.4 | ||||||||||||
Cincinnati - Mason | — | 20.3 | 1.6 | — | 20.2 | 1.4 | ||||||||||||
Dallas - Midway | — | 2.0 | 0.4 | — | 2.0 | 0.4 | ||||||||||||
Phoenix - Chandler VI | 10.5 | 15.7 | 49.2 | 10.5 | — | — | ||||||||||||
Stamford - Riverbend | — | 2.9 | 6.9 | — | 4.3 | 14.5 | ||||||||||||
Norwalk I | — | 13.5 | 9.4 | — | 19.0 | 26.6 | ||||||||||||
Dallas - Marsh | — | 0.1 | 0.6 | — | 0.1 | 0.6 | ||||||||||||
Chicago - Lombard | 0.7 | 4.7 | 7.7 | 0.7 | 4.7 | 7.9 | ||||||||||||
Stamford - Omega | — | 2.6 | 0.7 | — | 3.2 | 1.5 | ||||||||||||
Totowa - Commerce | — | 4.1 | 1.6 | — | 4.1 | 1.4 | ||||||||||||
Cincinnati - Blue Ash | — | 0.7 | 0.2 | — | 0.6 | 0.1 | ||||||||||||
South Bend - Crescent | — | 1.7 | 0.1 | — | 1.7 | 0.2 | ||||||||||||
Houston - Houston West III | 18.4 | 17.9 | 30.7 | 18.4 | 9.4 | 13.5 | ||||||||||||
Singapore - Inter Business Park | — | — | — | — | 8.2 | 0.1 | ||||||||||||
South Bend - Monroe | — | 2.5 | 0.3 | — | 2.5 | 0.3 | ||||||||||||
Cincinnati - Goldcoast | 0.2 | 4.0 | 0.1 | 0.2 | 4.0 | 0.1 | ||||||||||||
Austin III | 3.3 | 10.6 | 33.9 | 3.3 | 9.7 | 31.8 | ||||||||||||
Northern Virginia - Sterling V | 24.1 | 35.7 | 108.8 | 24.1 | — | — | ||||||||||||
86
CYRUSONE INC.
Notes to Consolidated Financial Statements - (continued)
IN MILLIONS | ||||||||||||||||||
As of December 31, | 2017 | 2016 | ||||||||||||||||
Land | Building and Improvements | Equipment | Land | Building and Improvements | Equipment | |||||||||||||
Phoenix - Chandler V | — | 5.9 | 20.5 | — | — | — | ||||||||||||
San Antonio IV | — | — | 17.9 | — | — | — | ||||||||||||
Austin I | — | — | — | — | 3.5 | 0.2 | ||||||||||||
Austin Land A | 8.0 | — | 0.2 | 8.0 | — | 0.2 | ||||||||||||
Chicago - Aurora II | 2.6 | 8.3 | 42.9 | 2.6 | — | — | ||||||||||||
Chicago - Aurora Land B | 5.1 | — | — | 5.1 | — | — | ||||||||||||
Dallas - Allen | 12.0 | — | — | — | — | — | ||||||||||||
Quincy Land A | 3.1 | — | — | — | — | — | ||||||||||||
Atlanta I | 5.1 | — | — | — | — | — | ||||||||||||
Total | $ | 177.1 | $ | 1,371.4 | $ | 1,813.9 | $ | 142.7 | $ | 1,008.9 | $ | 1,042.9 | ||||||
In addition, Construction in progress was $478.4 million and $407.1 million as of December 31, 2017 and December 31, 2016, respectively, as we continue to build data center facilities.
For the year ended December 31, 2017, our capital expenditures were $1,406.8 million, as shown on the statement of cash flows. This included the purchase price of the Sentinel Properties on February 28, 2017 for $492.3 million and $914.5 million for other developments primarily in Northern Virginia, Phoenix, Dallas, Chicago, San Antonio and Cincinnati; and the purchase of parcels of land in Allen, Texas, Quincy, Washington and Atlanta, Georgia for future development.
For the year ended December 31, 2016, our capital expenditures were $731.1 million, as shown on the statement of cash flows. This included the purchase of the Aurora Properties for $131.1 million, the purchase of four properties for development in Northern Virginia - Sterling, Chicago - Aurora and Phoenix - Chandler II for approximately $54.5 million and $545.5 million for other developments primarily in Northern Virginia - Sterling, Phoenix - Chandler II, San Antonio, Dallas - Carrollton and Houston - Houston West III.
For the year ended December 31, 2017, we recognized Asset impairments and loss on disposal of $59.5 million which includes the impairment loss of $54.4 million as mentioned below, and an impairment of $3.6 million related to our leased facility in Singapore, a loss on disposal of $1.1 million related to equipment at our Chicago - Aurora facility and $0.4 million related to other equipment.
During the year ended December 31, 2017, we incurred an impairment loss of $54.4 million for our Norwalk I, Stamford - Riverbend and Stamford - Omega facilities, which are in the Connecticut market and were acquired as part of the Cervalis acquisition in July 2015. These are leased facilities and Cervalis was deemed to be the accounting owner of the buildings, excluding land, due to their involvement in the construction of structural improvements to these facilities and continuing involvement once construction was completed. Upon acquisition of Cervalis, all assets acquired and liabilities assumed were recorded at their estimated fair values. For new leases, our sales cycle is typically up to two years, and our revenue and profit expectations were recently revised as compared to the assumptions contained at the time of the acquisition. Due to lack of demand we have experienced for data centers in the Connecticut market, we have revised our expectations for operations of these facilities through the end of their lease terms. The amount of impairment recognized was the excess of the carrying value over the fair value of the assets. Fair value was determined by the discounted cash flow method based on management's best estimates of a market participant using available and knowable information.
For the year ended December 31, 2016, we recognized Asset impairment and loss on disposal of $5.3 million which related primarily to two properties, South Bend - Crescent, a leased facility, and Cincinnati - Goldcoast, an owned facility. For the year ended December 31, 2015, we recognized Asset impairment and loss on disposal of $13.5 million which related primarily to the exit of Austin I, which is a leased facility, and loss on disposal of certain other assets.
87
CYRUSONE INC.
Notes to Consolidated Financial Statements - (continued)
8. Notes Receivable
The carrying amount of notes receivable was $3.3 million and $6.6 million as of December 31, 2017 and 2016, respectively, and consisted of the following:
IN MILLIONS | ||||||
For the year ended December 31, | 2017 | 2016 | ||||
Note 1 | $ | 1.8 | $ | 2.2 | ||
Note 2 | 0.6 | — | ||||
Note 3 | 0.5 | 3.9 | ||||
Note 4 | 0.4 | 0.5 | ||||
Total | $ | 3.3 | $ | 6.6 | ||
Each of the above notes are from different customers. Note 1 matures in September 2021, and the payments are approximately $50,000 per month. Note 2 matures in November 2019, and the payments are approximately $26,000 per month. Note 3 matures in February 2018, and the payments are approximately $300,000 per month. Note 4 matures in October 2020, and the payments are approximately $12,000 per month. These notes are included in Rent and other receivables on the consolidated balance sheets.
9. Goodwill, Intangible and Other Long-Lived Assets
The carrying amount of Goodwill was $455.1 million as of December 31, 2017 and 2016. See Note 6 for the increase in above/below market leases and in-place leases.
Summarized below are the carrying values for the major classes of intangible assets:
IN MILLIONS | |||||||||||||||||||
For the year ended December 31, | 2017 | 2016 | |||||||||||||||||
Weighted- Average Remaining Life (in years) | Gross Carrying Amount | Accumulated Amortization | Total | Gross Carrying Amount | Accumulated Amortization | Total | |||||||||||||
Customer relationships | 11 | $ | 247.1 | $ | (123.0 | ) | $ | 124.1 | $ | 247.1 | $ | (106.3 | ) | $ | 140.8 | ||||
Trademark/tradename | 6 | 9.7 | (5.3 | ) | 4.4 | 9.7 | (3.9 | ) | 5.8 | ||||||||||
Favorable leasehold interest | 47 | 4.1 | (0.5 | ) | 3.6 | 4.1 | (0.5 | ) | 3.6 | ||||||||||
In place customer leases | 8 | 75.9 | (7.1 | ) | 68.8 | — | — | — | |||||||||||
Above and below market leases | 8 | 2.3 | (0.2 | ) | 2.1 | — | — | — | |||||||||||
Total | $ | 339.1 | $ | (136.1 | ) | $ | 203.0 | $ | 260.9 | $ | (110.7 | ) | $ | 150.2 | |||||
There were no goodwill or intangible asset impairments for the years ended December 31, 2017 or 2016.
Amortization expense for acquired intangible assets was $25.1 million, $20.1 million and $18.5 million for the years ended December 31, 2017, 2016 and 2015, respectively.
88
CYRUSONE INC.
Notes to Consolidated Financial Statements - (continued)
The following table presents estimated amortization expense for each of the next five years and thereafter, commencing January 1, 2018:
IN MILLIONS | |||
2018 | $ | 24.7 | |
2019 | 22.4 | ||
2020 | 21.3 | ||
2021 | 20.3 | ||
2022 | 19.7 | ||
Thereafter | 94.6 | ||
Total | $ | 203.0 | |
10. Long-Term Debt, Capital Lease Obligations and Lease Financing Arrangements
Long-term debt, Capital lease obligations and Lease financing arrangements presented in the accompanying consolidated financial statements consist of the following:
IN MILLIONS | ||||||
For the year ended December 31, | 2017 | 2016 | ||||
Credit facilities: | ||||||
Revolving Credit Facility | $ | — | $ | 235.0 | ||
2021 Term Loan | 250.0 | 250.0 | ||||
2022 Term Loan | 650.0 | 300.0 | ||||
2024 Notes, including bond premium | 706.8 | — | ||||
2027 Notes, including bond premium | 510.5 | — | ||||
2022 Notes, including bond premium | — | 477.3 | ||||
Deferred financing costs | (27.9 | ) | (22.2 | ) | ||
Long-term debt, net | 2,089.4 | 1,240.1 | ||||
Capital lease obligations | 10.1 | 10.8 | ||||
Lease financing arrangements | 131.9 | 135.7 | ||||
Total | $ | 2,231.4 | $ | 1,386.6 | ||
Credit Facility—On October 9, 2014, CyrusOne LP entered into a credit agreement which provided for a $450.0 million senior unsecured revolving credit facility replacing the previous credit facility, and a $150.0 million senior unsecured term loan. On June 22, 2015, CyrusOne increased the revolving credit facility to $650.0 million and $300.0 million under the term loan. In addition, the credit agreement contained an accordion feature that allowed CyrusOne LP to increase the aggregate commitment by up to $250.0 million.
On March 17, 2016, CyrusOne LP entered into a first amended and restated credit agreement (the First Amended and Restated Credit Agreement) which amended and restated in its entirety the then-existing credit agreement, as amended to such date. The First Amended and Restated Credit Agreement provided for an additional $250.0 million senior unsecured term loan facility (the 2021 Term Loan) in addition to the existing $300.0 million senior unsecured term loan facility (the 2022 Term Loan, and together with the 2021 Term Loan, the Term Loans) and the existing $650.0 million revolving credit facility (the Revolving Credit Facility). The First Amended and Restated Credit Agreement had an accordion feature under which CyrusOne LP was permitted to request an increase in the total commitments up to an amount not to exceed $250.0 million. Deferred financing costs of $2.1 million related to this amendment and restatement were recorded.
On November 21, 2016, CyrusOne LP entered into a second amended and restated credit agreement which amended and restated in its entirety the First Amended and Restated Credit Agreement and, among other things, increased the available commitments
89
CYRUSONE INC.
Notes to Consolidated Financial Statements - (continued)
under the Revolving Credit Facility to $1.0 billion. Deferred financing costs of $6.6 million related to this amendment and restatement were recorded.
On June 16, 2017, CyrusOne LP entered into an amendment to its senior unsecured second amended and restated credit agreement (as amended, the Second Amended and Restated Credit Agreement) that increased the total commitments thereunder by $450.0 million to $2.0 billion and provided additional flexibility to pursue various initiatives, including joint ventures and international expansion. The amendment increased the size of the 2022 Term Loan maturing in January 2022 from $300.0 million to $650.0 million and expanded the Revolving Credit Facility by $100.0 million to $1.1 billion. Proceeds from the $350.0 million 2022 Term Loan increase were used to pay down borrowings under the Revolving Credit Facility. The existing $250.0 million 2021Term Loan maturing in September 2021 remained unchanged. In addition, the amendment refreshes the amount available under the accordion feature of the Second Amended and Restated Credit Agreement to enable CyrusOne LP to increase the total loan commitments under the Second Amended and Restated Credit Agreement to up to $2.3 billion from time to time.
The Revolving Credit Facility is scheduled to mature in November 2020 and includes a one-year extension option, which if exercised by CyrusOne LP would extend the maturity date to November 2021, subject to certain conditions. The 2022 Term Loan of $650.0 million is scheduled to mature in January 2022. The 2021 Term Loan of $250.0 million is scheduled to mature in September 2021. The Revolving Credit Facility currently bears interest at a rate per annum equal to LIBOR plus 1.55% and the 2022 Term Loan and 2021 Term Loan currently bear interest at a rate per annum equal to LIBOR plus 1.50%. The margins are subject to adjustment. As of December 31, 2017, the interest rate for the Term Loans was 2.99%.
Deferred financing costs of $2.7 million related to the June 2017 amendment to the Second Amended and Restated Credit Agreement were recorded. Existing deferred financing costs of $0.3 million were recorded to Loss on extinguishment of debt due to the exit of certain lenders from the credit facility.
We pay commitment fees for the unused amount of borrowings on the Revolving Credit Facility and letter of credit fees on any outstanding letters of credit. The commitment fees are up to 0.25% per annum of the actual daily amount by which the aggregate revolving commitments exceed the sum of outstanding revolving loans and letter of credit obligations. Commitment fees related to the Second Amended and Restated Credit Agreement were $1.9 million and $1.6 million for the years ended December 31, 2017 and 2016, respectively.
As of December 31, 2017, there were no outstanding borrowings under the Revolving Credit Facility and aggregate borrowings of $900.0 million on the Term Loans. In addition, the Second Amended and Restated Credit Agreement contains an accordion feature that allows CyrusOne LP to increase the aggregate commitment by up to $300.0 million.
At December 31, 2017, available capacity under the Revolving Credit Facility was $1,091.5 million, which included $1.1 billion under the Revolving Credit Facility less letters of credit of $8.5 million. Total liquidity at December 31, 2017 was $1,243.4 million, which included availability of $1,091.5 million under the Revolving Credit Facility and Cash and cash equivalents of $151.9 million.
5.000% Senior Notes due 2024 and 5.375% Senior Notes due 2027—On March 17, 2017, CyrusOne LP and CyrusOne Finance Corp. (collectively, the Issuers) completed their offering of $500.0 million aggregate principal amount of the Original 2024 Notes and $300.0 million aggregate principal amount of the Original 2027 Notes in a private offering. The Company received proceeds of $791.2 million, net of underwriting costs of $8.8 million. In addition, the Company incurred approximately $2.1 million in other costs. Total deferred financing costs of $10.9 million related to the offering were recorded.
On November 3, 2017, CyrusOne LP and CyrusOne Finance Corp. completed their offering of $200.0 million aggregate principal amount of the Additional 2024 Notes and $200.0 million aggregate principal amount of the Additional 2027 Notes in a private offering. The Additional 2024 Notes have terms substantially identical to the Original 2024 Notes and the Additional 2027 Notes have terms substantially identical to the Original 2027 Notes. The Original 2024 Notes and the Additional 2024 Notes form a single class of securities, and the Original 2027 Notes and the Additional 2027 Notes for a single class of securities. The Company received proceeds of $416.1 million, net of underwriting costs of $4.4 million. The proceeds included bond premium of $17.8 million and accrued interest of $2.7 million. In addition, the Company incurred approximately $1.0 million in other costs.
The Issuers agreed to use commercially reasonable efforts to file an exchange offer registration statement with the SEC, to have the registration statement declared effective and to complete an exchange offer. On January 8, 2018, all validly tendered 2024 Notes and 2027 Notes were exchanged for notes registered with the SEC.
The senior notes are senior unsecured obligations of the Issuers, which rank equally in right of payment with all existing and future unsecured senior indebtedness of the Issuers. The senior notes are effectively subordinated in right of payment to any secured
90
CYRUSONE INC.
Notes to Consolidated Financial Statements - (continued)
indebtedness of the Issuers to the extent of the value of the assets securing such indebtedness. The senior notes are guaranteed on a joint and several basis by CyrusOne Inc., CyrusOne GP and all of CyrusOne LP’s existing domestic subsidiaries that guarantee the Second Amended and Restated Credit Agreement. Each of CyrusOne LP’s restricted subsidiaries (other than any designated excluded subsidiary or receivables entity) that guarantees any other indebtedness of CyrusOne LP or other indebtedness of the guarantors will be required to guarantee the senior notes in the future. Each such guarantee is a senior unsecured obligation of the applicable guarantor, ranking equally with all existing and future unsecured senior indebtedness of such guarantor and effectively subordinated to all existing and future secured indebtedness of such guarantor to the extent of the value of the assets securing that indebtedness. The senior notes are structurally subordinated to all liabilities (including trade payables) of each subsidiary of CyrusOne LP that does not guarantee the senior notes.
The 2024 Notes and the 2027 Notes bear interest at a rate of 5.000% and 5.375% per annum, respectively. The interest on the senior notes is payable semi-annually on March 15 and September 15 of each year, to persons who are registered holders of the 2024 Notes and 2027 Notes on the immediately preceding March 1 and September 1, respectively.
The 2024 Notes will mature on March 15, 2024. However, prior to March 15, 2020, the Issuers may, at their option, redeem some or all of the 2024 Notes at a redemption price equal to 100% of the principal amount of the 2024 Notes, together with accrued and unpaid interest and additional interest, if any, plus a “make-whole” premium. On or after March 15, 2020, the Issuers may, at their option, redeem some or all of the 2024 Notes at any time at declining redemption prices equal to (i) 102.500% beginning on March 15, 2020, (ii) 101.250% beginning on March 15, 2021 and (iii) 100.000% beginning on March 15, 2022 and thereafter, plus, in each case, accrued and unpaid interest and additional interest, if any, to the applicable redemption date. In addition, before March 15, 2020, and subject to certain conditions, the Issuers may, at their option, redeem up to 40% of the aggregate principal amount of 2024 Notes with the net proceeds of certain equity offerings at 105.000% of the principal amount thereof, plus accrued and unpaid interest and additional interest, if any, to the date of redemption; provided that (i) at least 55% of the aggregate principal amount of 2024 Notes remains outstanding and (ii) the redemption occurs within 90 days of the closing of any such equity offering.
The 2027 Notes will mature on March 15, 2027. However, prior to March 15, 2022, the Issuers may, at their option, redeem some or all of the 2027 Notes at a redemption price equal to 100% of the principal amount of the 2027 Notes, together with accrued and unpaid interest and additional interest, if any, plus a “make-whole” premium. On or after March 15, 2022, the Issuers may, at their option, redeem some or all of the 2027 Notes at any time at declining redemption prices equal to (i) 102.688% beginning on March 15, 2022, (ii) 101.792% beginning on March 15, 2023, (iii) 100.896% beginning on March 15, 2024 and (iv) 100.000% beginning on March 15, 2025 and thereafter, plus, in each case, accrued and unpaid interest and additional interest, if any, to the applicable redemption date. In addition, before March 15, 2020, and subject to certain conditions, the Issuers may, at their option, redeem up to 40% of the aggregate principal amount of 2027 Notes with the net proceeds of certain equity offerings at 105.375% of the principal amount thereof, plus accrued and unpaid interest and additional interest, if any, to the date of redemption; provided that (i) at least 55% of the aggregate principal amount of 2027 Notes remains outstanding and (ii) the redemption occurs within 90 days of the closing of any such equity offering.
6.375%Senior Notes due 2022—On November 20, 2012, CyrusOne LP and CyrusOne Finance Corp. issued $525.0 million of 6.375% senior notes due 2022 (the 2022 Notes). In March 2017, the Company repurchased all of its 2022 Notes with an aggregate face value of $474.8 million for total consideration of $515.1 million, including accrued and unpaid interest of $10.3 million. Deferred financing costs, bond premium and legal fees related to the 2022 Notes of $6.2 million were written off which resulted in a loss on extinguishment of debt of $36.2 million.
Debt Covenants —The Second Amended and Restated Credit Agreement requires us to maintain certain financial covenants including the following, in each case on a consolidated basis:
•A minimum fixed charge ratio;
•Maximum total and secured leverage ratios;
•A minimum consolidated tangible net worth ratio;
•A maximum secured recourse indebtedness ratio;
•A minimum unencumbered debt yield ratio; and
•A maximum ratio of unsecured indebtedness to unencumbered asset value.
Notwithstanding these limitations, we will be permitted, subject to the terms and conditions of the Second Amended and Restated Credit Agreement, to distribute to our stockholders cash dividends in an amount not to exceed 95% of our Funds From Operations (FFO), as defined in the Second Amended and Restated Credit Agreement for any period. Similarly, our indentures permit dividends and distributions necessary for us to maintain our status as a REIT.
91
CYRUSONE INC.
Notes to Consolidated Financial Statements - (continued)
The Company’s most restrictive covenants are generally included in the Second Amended and Restated Credit Agreement. In order to continue to have access to amounts available to it under the Second Amended and Restated Credit Agreement, the Company must remain in compliance with all covenants.
The indentures governing the senior notes contains affirmative and negative covenants customarily found in indebtedness of this type, including a number of covenants that, among other things, restrict, subject to certain exceptions, the Company’s ability to: incur secured or unsecured indebtedness; pay dividends or distributions on its equity interests, or redeem or repurchase equity interests of the Company; make certain investments or other restricted payments; enter into transactions with affiliates; enter into agreements limiting the ability of the operating partnership’s subsidiaries to pay dividends or make certain transfers and other payments to the operating partnership or to other subsidiaries; sell assets; and merge, consolidate or transfer all or substantially all of the operating partnership’s assets. Notwithstanding the foregoing, the covenants contained in the indentures do not restrict the Company’s ability to pay dividends or distributions to stockholders to the extent (i) no default or event of default exists or is continuing under the indentures and (ii) the Company believes in good faith that we qualify as a REIT under the Code and the payment of such dividend or distribution is necessary either to maintain its status as a REIT or to enable it to avoid payment of any tax that could be avoided by reason of such dividend or distribution. The Company and its subsidiaries are also required to maintain total unencumbered assets of at least 150% of their unsecured debt on a consolidated basis, provided that for the purposes of such calculation their Revolving Credit Facility shall be treated as unsecured indebtedness, in each case subject to certain qualifications set forth in the indenture.
As of December 31, 2017, we believe we were in compliance with all covenants.
Notes Payable—The Company's note payable for approximately $1.5 million with a third-party for installation of electrical infrastructure at one of the Company's locations was repaid in July 2016.
Deferred financing costs—Deferred financing costs are costs incurred in connection with obtaining long-term financing. Deferred financing costs were incurred in connection with the issuance of the Revolving Credit Facility, the 2022 Term Loan, the 2021 Term Loan, 2024 Notes and 2027 Notes. As of December 31, 2017, and 2016, deferred financing costs totaled $27.9 million and $22.2 million, respectively. Amortization of deferred financing costs, included in Interest expense in the consolidated statements of operations, totaled $4.7 million, $4.1 million, and $3.4 million for the years ended December 31, 2017, 2016 and 2015, respectively.
Capital lease obligations—We use leasing as a source of financing for certain of our data center facilities and related equipment. We currently operate four data center facilities under leases recognized as capital leases. We have options to extend the initial lease term on all but one of these leases.
Lease financing arrangements—Lease financing arrangements represent leases of real estate in which we are involved in the construction of structural improvements to develop buildings into data centers. When we bear substantially all the construction period risk, such as managing or funding construction, we are deemed to be the accounting owner of the leased property and, at the lease inception date, we are required to record at fair value the property and associated liability on our balance sheet. These transactions generally do not qualify for sale-leaseback accounting due to our continued involvement in these data center operations.
Interest expense on Capital lease obligations and Lease financing arrangements was $9.0 million, $10.6 million and $7.8 million for the years ended December 31, 2017, 2016 and 2015, respectively.
The following table summarizes aggregate maturities of total future value and present value of the minimum payments associated with our Lease financing arrangements for the five years subsequent to December 31, 2017, and thereafter:
IN MILLIONS | Future Value of Payments | Interest | Present Value of Payments | ||||||
2018 | $ | 14.9 | $ | 7.9 | $ | 7.0 | |||
2019 | 15.1 | 7.4 | 7.7 | ||||||
2020 | 27.8 | 6.8 | 21.0 | ||||||
2021 | 11.5 | 5.8 | 5.7 | ||||||
2022 | 11.8 | 5.5 | 6.3 | ||||||
Thereafter | 100.6 | 16.4 | 84.2 | ||||||
Total lease financing arrangements | $ | 181.7 | $ | 49.8 | $ | 131.9 | |||
92
CYRUSONE INC.
Notes to Consolidated Financial Statements - (continued)
The following table summarizes aggregate maturities of the Revolving Credit Facility and Term Loans, 2024 Notes and 2027 Notes, and capital leases for the five years subsequent to December 31, 2017, and thereafter:
IN MILLIONS | Revolving Credit Facility/Term Loans | Senior Notes | Capital Leases | Total | ||||||||
2018 | $ | — | $ | — | $ | 2.0 | $ | 2.0 | ||||
2019 | — | — | 1.9 | 1.9 | ||||||||
2020 | — | — | 2.0 | 2.0 | ||||||||
2021 | 250.0 | — | 2.0 | 252.0 | ||||||||
2022 | 650.0 | — | 0.9 | 650.9 | ||||||||
Thereafter | — | 1,200.0 | 1.3 | 1,201.3 | ||||||||
Total debt | $ | 900.0 | $ | 1,200.0 | $ | 10.1 | $ | 2,110.1 | ||||
The payment of interest on capital leases over the next five years and thereafter will be $0.8 million, $0.6 million, $0.5 million, $0.3 million, $0.1 million and $0.1 million, respectively.
11. Fair Value Measurements
The fair value of Cash and cash equivalents, Restricted cash, Rent and other receivables and Accounts payable and accrued expenses approximate their carrying value because of the short-term nature of these instruments.
The carrying value and fair value of other financial instruments are as follows:
IN MILLIONS | ||||||||||||
For the year ended December 31, | 2017 | 2016 | ||||||||||
Carrying Value | Fair Value | Carrying Value | Fair Value | |||||||||
2024 Notes | $ | 706.8 | $ | 728.0 | $ | — | $ | — | ||||
2027 Notes | 510.5 | 527.5 | — | — | ||||||||
2022 Notes | — | — | 477.3 | 502.1 | ||||||||
Revolving Credit Facility and Term Loans | 900.0 | 900.0 | 785.0 | 785.0 | ||||||||
Equity investment | 100.0 | 175.6 | — | — | ||||||||
The fair value of our 2024 Notes and 2027 Notes as of December 31, 2017 and our 2022 Notes as of December 31, 2016 were based on the quoted market price for these notes, which is considered Level 1 of the fair value hierarchy. The carrying value of the Revolving Credit Facility, the 2022 Term Loan and the 2021 Term Loan approximates estimated fair value as of December 31, 2017 and 2016, due to the variability of interest rates and the stability of our credit ratings. Deferred financing costs of $27.9 million and $22.2 million for the years ended December 31, 2017 and 2016, respectively, are not included in the carrying value of these instruments as shown above. These fair value measurements are considered Level 3 of the fair value hierarchy.
On October 18, 2017, CyrusOne announced the formation of a new strategic partnership with the execution of a commercial agreement with GDS, a leading developer and operator of high-performance, large-scale data centers in China. In addition, CyrusOne purchased newly issued unregistered ordinary shares equivalent to 8.0 million American depository shares (ADS) at a price per Class A ordinary share equivalent to $12.45 per ADS, a 4% discount to the October 17, 2017 closing price, for a total investment of $100 million. Each ADS is equivalent to eight ordinary shares. This investment is recorded in Other assets in the consolidated balance sheets.
The fair value of the investment in GDS as of December 31, 2017, was based on the quoted market price for the stock, adjusted for a discount related to the lock-up period, which is considered Level 2 of the fair value hierarchy. The estimated fair value of the equity investment in GDS as of December 31, 2017 is $175.6 million. The increase in the value of the equity investment is due to an unrealized gain of $75.6 million which is recorded in Accumulated other comprehensive income (loss) in the consolidated balance sheet as of December 31, 2017.
The Company also uses fair value measurements in assessing and if required, recording an impairment loss for investments in real estate. During the year ended December 31, 2017, we incurred an impairment loss of $54.4 million for our Norwalk I, Stamford - Riverbend and Stamford - Omega facilities. The amount of impairment recognized was the excess of the carrying value over the fair value of the assets. Fair value was determined by the discounted cash flow method based on management's best estimates of a market participant using available and knowable information. Unobservable inputs (Level 3) were a discount rate of 12%, a
93
CYRUSONE INC.
Notes to Consolidated and Combined Financial Statements - (continued)
long-term growth rate of 3%, a market rent and expense growth rate of 2% and a capitalization rate of 9%. The fair value of the assets, at the time of impairment, was $31.7 million.
12. Noncontrolling Interest - Operating Partnership
As of December 31, 2015, Cincinnati Bell Inc. (CBI), owned approximately 9.5% of the Company’s common stock. As of December 31, 2017 and 2016, CBI owned less than 5.0% of the Company's common stock.
Since December 31, 2015, CyrusOne Inc. has had no noncontrolling interests, and all of the operating partnership units of CyrusOne LP were owned, directly or indirectly, by the Company. The following table shows the distributions and net loss attributed to CBI for the year ended December 31, 2015:
For the year ended December 31, | 2015 | |||||
(in millions, except unit amount) | The Company | CBI | ||||
Operating partnership units | 72.6 | — | ||||
Ownership % | 100.0 | % | — | % | ||
Portion of net loss | $ | (15.4 | ) | $ | (4.8 | ) |
Distributions | $ | (74.6 | ) | $ | (16.3 | ) |
13. Dividends
We have declared cash dividends on common shares and distributions on operating partnership units for the years ended December 31, 2017 and 2016 as presented in the table below:
Record date | Payment date | Cash dividend per share or operating partnership unit |
March 25, 2016 | April 15, 2016 | $0.38 |
June 24, 2016 | July 15, 2016 | $0.38 |
September 30, 2016 | October 14, 2016 | $0.38 |
December 30, 2016 | January 13, 2017 | $0.38 |
March 31, 2017 | April 14, 2017 | $0.42 |
June 30, 2017 | July 14, 2017 | $0.42 |
September 29, 2017 | October 13, 2017 | $0.42 |
December 29, 2017 | January 12, 2018 | $0.42 |
As of December 31, 2017 and 2016 we had a dividend payable of $41.8 million and $33.9 million, respectively. On February 21, 2018, we announced a regular cash dividend of $0.46 per common share payable to shareholders of record as of March 29, 2018. The dividend will be paid on April 13, 2018.
14. Customer Leases
Customer lease arrangements customarily contain provisions that allow either for renewal or continuation on a month-to-month arrangement. Certain leases contain early termination rights. At lease inception, early termination is generally not deemed reasonably assured due to the significant economic penalty incurred by the lessee to exercise its termination right and to relocate their equipment.
94
CYRUSONE INC.
Notes to Consolidated Financial Statements - (continued)
The future minimum lease payments to be received under non-cancellable operating leases, excluding month-to-month arrangements and submetered power, for the next five years are shown below:
IN MILLIONS | |||
2018 | $ | 530.2 | |
2019 | 414.1 | ||
2020 | 352.5 | ||
2021 | 289.2 | ||
2022 | 231.1 | ||
15. Employee Benefit Plans
Currently, our employees participate in health care plans sponsored by CyrusOne, which provide medical, dental, vision and prescription benefits. We incurred $2.7 million, $4.4 million and $3.1 million of expenses related to these plans for the years ended December 31, 2017, 2016 and 2015, respectively.
CyrusOne offers a retirement savings plan to its employees. CyrusOne's matching contribution to its retirement savings plan was $1.5 million, $1.5 million and $1.1 million for the years ended December 31, 2017, 2016 and 2015, respectively.
16. (Loss) Income per Share
Basic (loss) income per share is calculated using the weighted average number of shares of common stock outstanding during the period. In addition, net (loss) income applicable to participating securities and the participating securities are both excluded from the computation of basic (loss) income per share.
Diluted (loss) income per share is calculated using the weighted average number of shares and units of common outstanding during the period, including restricted stock outstanding and shares contingently issuable under the Forward Sales Agreement (as defined below). If there is net income during the period, the dilutive impact of common stock equivalents outstanding would also be reflected.
On August 15, 2016, CyrusOne Inc. completed a public offering of 3.4 million shares of its common stock for $164.8 million, net of underwriting discounts of approximately $6.9 million. In connection with this offering, on August 10, 2016, CyrusOne Inc. entered into (a) a forward sale agreement with Goldman, Sachs & Co. with respect to 3.4 million shares of its common stock, and (b) an additional forward sale agreement with Goldman, Sachs & Co. with respect to approximately 1.0 million shares of its common stock in connection with the underwriters' exercise of their option to purchase these shares. This contract had no effect on our diluted share count at December 31, 2016.
The following table reflects the computation of basic and diluted net (loss) income per share:
IN MILLIONS, except per share amounts | Year Ended | Year Ended | Period Ended | |||||||||||||||
For December 31, | 2017 | 2016 | 2015 | |||||||||||||||
Basic | Diluted | Basic | Diluted | Basic | Diluted | |||||||||||||
Numerator: | ||||||||||||||||||
Net (loss) income | $ | (83.5 | ) | $ | (83.5 | ) | $ | 19.9 | $ | 19.9 | $ | (15.4 | ) | $ | (15.4 | ) | ||
Less: Restricted stock dividends | (0.9 | ) | (0.9 | ) | (0.7 | ) | (0.7 | ) | (1.0 | ) | (1.0 | ) | ||||||
Net (loss) income available to stockholders | $ | (84.4 | ) | $ | (84.4 | ) | $ | 19.2 | $ | 19.2 | $ | (16.4 | ) | $ | (16.4 | ) | ||
Denominator: | ||||||||||||||||||
Weighted average common outstanding-basic | 88.9 | 88.9 | 78.3 | 78.3 | 54.3 | 54.3 | ||||||||||||
Performance-based restricted stock and units(1)(2) | — | 0.7 | — | |||||||||||||||
Weighted average shares outstanding-diluted | 88.9 | 79.0 | 54.3 | |||||||||||||||
EPS: | ||||||||||||||||||
Net (loss) income per share-basic | $ | (0.95 | ) | $ | 0.24 | $ | (0.30 | ) | ||||||||||
Effect of dilutive shares: | ||||||||||||||||||
Net (loss) income per share-diluted | $ | (0.95 | ) | $ | 0.24 | $ | (0.30 | ) | ||||||||||
95
CYRUSONE INC.
Notes to Consolidated Financial Statements - (continued)
(1) We have excluded 0.4 million weighted average shares of restricted stock, and 0.1 million of weighted average stock options which are securities convertible into common stock from our diluted earnings per share as of December 31, 2017. These amounts were deemed anti-dilutive.
(2) We have excluded 1.9 million weighted average shares of restricted stock, and 13.1 million of weighted average operating partnership units which are securities convertible into common stock from our diluted earnings per share as of December 31, 2015. These amounts were deemed anti-dilutive.
17. Stock-Based Compensation Plans
Stock-based compensation expense was as follows:
For the periods ended December 31, | 2017 | 2016 | 2015 | ||||||
Founders | $ | — | $ | 0.3 | $ | 5.2 | |||
2013 Grants | — | 0.1 | 1.2 | ||||||
2014 Grants | 0.1 | 1.2 | 3.0 | ||||||
2015 Grants | 1.8 | 3.5 | 5.0 | ||||||
2016 Grants | 6.6 | 7.2 | — | ||||||
2017 Grants | 6.2 | — | — | ||||||
Total | $ | 14.7 | $ | 12.3 | $ | 14.4 | |||
The board of directors of CyrusOne Inc. adopted the 2012 Long-Term Incentive Plan (LTIP) prior to the IPO, which was amended and restated on May 2, 2016. The LTIP is administered by the compensation committee of the board of directors. Awards issuable under the LTIP include common stock, restricted stock, restricted stock units, stock options and other incentive awards. CyrusOne Inc. has reserved a total of 8.9 million shares of CyrusOne Inc. common stock for issuance pursuant to the LTIP, which may be adjusted for changes in capitalization and certain corporate transactions. To the extent that an award, if forfeitable, expires, terminates or lapses, or an award is otherwise settled in cash without the delivery of shares of common stock to the participant, then any unpaid shares subject to the award will be available for future grant or issuance under the LTIP. The payment of dividend equivalents in cash in conjunction with any outstanding awards will not be counted against the shares available for issuance under the LTIP. The related stock compensation expense incurred by CyrusOne Inc. is allocated to the operating partnership. Shares available under the LTIP at December 31, 2017, were approximately 5.5 million. Shares vest according to each agreement and as long as the employee remains employed with the Company. The Company has granted awards with time-based vesting, performance-based vesting and market-based vesting features. The performance-based vesting metrics granted have varied and are described in each of the grant years below.
The market-based metric is total stockholder return (TSR), which is a non-GAAP measure and is the shareholder return compared to the MSCI US REIT Index (REIT Index) as defined in the award agreements. The TSR awards granted in 2013 had three-year cliff vesting. Subsequent to 2013, the market-based restricted stock/units vest annually based upon the achievement of certain criteria for each of the three-year measurement periods. The first two years are capped at 100% of the target. If at the end of the third year total performance over the three-year period exceeds the REIT Index by more than 2%, up to 200% of these awards may vest. The market-based awards will vest based on the below scales. The scales are linear between each point and awards are interpolated between the points.
- If CyrusOne's TSR is less than the return of the Index = 0%
- If CyrusOne's TSR is equal to or greater than the return of the Index = 100%; up to 200% if CyrusOne's TSR exceeds the return of the Index by 2%
- If CyrusOne's TSR exceeds the return of the Index, but is negative, any calculated vesting amount will be reduced by 50%
The Company uses the Black-Scholes option-pricing model for time and performance-based options and a Monte Carlo simulation for market-based awards. The fair values of these awards use assumptions such as volatility, risk-free interest rate, and expected term of the awards.
The holders of restricted stock have all the rights and privileges of shareholders including the right to vote. The holders of restricted stock units do not have all of the rights and privileges of shareholders and do not have the right to vote. These rights will be acquired upon the settlement of the restricted stock units and the issuance of shares. The time-based restricted stock units have the right to receive dividends that are payable within ten days following the date the dividends are payable to shareholders. Market-based restricted stock units accrue dividends which are paid upon the settlement of the units.
96
CYRUSONE INC.
Notes to Consolidated Financial Statements - (continued)
Compensation expense is measured based on the estimated grant-date fair value. Expense for time-based grants is recognized under a straight-line method. For market-based grants, expense is recognized under a graded expense attribution method. For performance-based grants, expense is recognized under a graded expense attribution method if it is probable that the performance targets will be achieved. Any dividends declared with respect to the performance and market-based shares shall be accrued by the Company and distributed on the vesting date provided that the applicable performance goal has been attained.
The compensation expense for the year ended December 31, 2016 includes $0.8 million due to the acceleration of equity awards of a senior executive who left the Company. The compensation expense for the year ended December 31, 2015 includes $2.4 million due to the acceleration of equity awards of two senior executives who left the Company.
Founders Grants
On January 24, 2013, the Company granted one million shares of time-based restricted stock, which had an aggregate value of $19.0 million on the grant date and vested on January 24, 2016.
2013 Grants
On April 17, 2013, the Company issued performance and market-based awards in the form of stock options and restricted stock. For these awards, vesting was tied 50% to the achievement of a non-GAAP performance measure (cumulative EBITDA targets, as defined in the agreement) using the scale, described below under 2014 Grants, over the 2013-2015 performance period, and 50% to a market-based performance measure. The portion of the awards tied to cumulative EBITDA vested annually over a three-year period based on the Company attaining predetermined cumulative EBITDA targets. The stock option awards have a contractual life of 10 years from the award date and were granted with an exercise price equal to $23.58. Total awards granted in 2013 had a grant date fair value of $25.4 million. As of December 31, 2017, there was no unearned compensation related to the awards granted in 2013 as all such awards are fully vested.
2014 Grants
On February 7, 2014, the Company issued performance and market-based awards under the LTIP in the form of restricted stock. For these awards, vesting was tied 50% to the achievement of a non-GAAP performance measure (cumulative Adjusted EBITDA targets, as defined in the agreement) over the 2014-2016 performance period, and 50% to a market-based performance measure. The portion of the awards tied to cumulative Adjusted EBITDA vested annually over a three-year period based on the Company attaining predetermined cumulative Adjusted EBITDA targets and as long as the employee remained employed with the Company.
The cumulative EBITDA targets are based on the below scales. The scales are linear between each point and awards are interpolated between the points.
- Below 90% of performance target = 0%
- At 90% of performance target = 50%
- At 100% of performance target = 100%
- At or above 115% of performance target = up to 200%
In addition, during the year ended December 31, 2014, the Company also granted from time-to-time a total of 46,313 additional time-based restricted shares which had an aggregate value of $1.0 million on the grant date. These shares cliff vested either one year after the grant date or three years after the grant date.
Total awards granted in 2014 had a grant date fair value of $12.9 million. As of December 31, 2017, there was no unearned compensation related to the awards granted in 2014 as all such awards are fully vested.
2015 Grants
On February 10, 2015, the Company issued awards under the LTIP in the form of options and restricted stock. The stock options are time-based and vest annually on a pro-rata basis over three years. Twenty percent of the restricted stock awards are subject to time-based vesting and eighty percent of the restricted stock awards are equally split between performance-based and market-based vesting. The performance-based metric is return on assets, which is a non-GAAP measure that is defined in the award agreement. The time-based restricted stock will vest pro-rata annually over three years. The performance and market-based restricted stock will vest annually based upon the achievement of certain criteria for each year of the three-year measurement periods. The first two years are capped at 100% of the target with a cumulative true-up to a maximum of 200% possible in year three.
The performance-based awards will vest based on the same scales as the awards granted during 2014.
97
CYRUSONE INC.
Notes to Consolidated Financial Statements - (continued)
In addition, during the year ended December 31, 2015, the Company also granted from time to time a total of 50,300 shares of time-based restricted stock and 67,012 shares of performance-based restricted stock for various new employee hires with vesting schedules ranging from annual to cliff vesting in three years.
Total awards granted in 2015 had a grant date fair value of $13.8 million. For the year ended December 31, 2017, the unearned compensation representing the unvested portion of the awards granted in 2015 totaled $0.3 million, with a weighted average vesting period of 0.2 years.
2016 Grants
On February 1, 2016, the Company issued 641,097 shares of time, performance and market-based awards under the LTIP in the form of restricted stock. The grant date fair value of time and performance-based restricted shares was $36.99. The grant date fair value of market-based restricted shares was $43.66. The Company issued stock options on February 1, 2016. The stock option awards have a contractual life of 10 years from the award date and were granted with an exercise price equal to $36.99. The Company issued 222,461 options with a grant date fair value of $6.99.
The performance-based metric is return on assets, which is a non-GAAP measure and is defined in the award agreement. The time-based restricted stock awards generally vest pro-rata annually over a three-year period. The performance and market-based restricted stock awards vest annually based upon the achievement of certain criteria for each of the three-year measurement periods. The first two years are capped at 100% of the target with a cumulative true-up to a maximum of 200% possible in year three. Certain employees were also awarded time-based restricted stock that cliff vest at the end of three years. The stock options are time-based and vest annually on a pro-rata basis over three years.
The performance-based awards will vest based on the same scales as the awards granted during 2014.
In addition, during the year ended December 31, 2016, for various new employee hires, the following grants were made:
• | 5,894 shares of time-based restricted stock which cliff vest in three years from the date of each grant. |
• | 47,667 shares of time-based restricted stock which vest annually on a pro rata basis over a three-year period from the date of each grant. |
Total awards granted in 2016 had a grant date fair value of $22.6 million. As of December 31, 2017, unearned compensation representing the unvested portion of the awards granted in 2016 totaled $7.1 million, with a weighted average vesting period of 1.1 years.
2017 Grants
On February 13, 2017, the Company issued time and market-based awards under the LTIP in the form of restricted stock units and restricted stock. The Company granted 119,218 time-based restricted stock units that generally vest annually on a pro-rata basis over a three-year period and 18,179 shares of time-based restricted stock that generally vest over a one-year period with a grant date fair value of $48.13, and 129,146 market-based restricted stock units, at target, with a grant date fair value of $63.23.
In addition, during the year ended December 31, 2017 the Company granted from time to time a total of 20,852 time-based restricted stock units that vest annually on a pro rata basis over a three-year period.
Total awards granted in 2017 had a grant date fair value of $15.9 million. As of December 31, 2017, unearned compensation representing the unvested portion of the awards granted in 2017 totaled $9.5 million, with a weighted average vesting period of 1.6 years.
98
CYRUSONE INC.
Notes to Consolidated Financial Statements - (continued)
Restricted Stock and Stock Option Activity
The following table summarizes the unvested restricted stock/unit activity and the weighted average fair value of these shares at the date of grant for the year ended December 31, 2017:
For the year ended December 31, | 2017 | ||||
Shares | Weighted Average Grant Date Fair Value | ||||
Non-vested at January 1 | 1,274,713 | $ | 28.95 | ||
Granted | 287,395 | 55.46 | |||
Vested | (446,623 | ) | 26.83 | ||
Forfeited | (135,385 | ) | 21.92 | ||
Non-vested at December 31 | 980,100 | $ | 38.66 | ||
The non-vested shares/units at December 31, 2015 were 1,585,010.
The following table summarizes the stock option activity for the year ended December 31, 2017:
For the year ended December 31, | 2017 | ||||
Options | Weighted Average Exercise Price | ||||
Outstanding at January 1 | 434,268 | $ | 31.89 | ||
Granted | — | — | |||
Exercised | (18,809 | ) | 36.79 | ||
Forfeited or expired | — | — | |||
Outstanding at December 31 | 415,459 | 31.67 | |||
Exercisable at December 31 | 235,395 | 29.45 | |||
Vested and expected to vest | 415,459 | $ | 31.67 | ||
The outstanding options at December 31, 2015 were 334,402.
The aggregate intrinsic value of options outstanding and options exercisable is based on the Company's closing stock price on the last trading day of the fiscal year for in-the-money options. The aggregate intrinsic value represents the cumulative difference between the fair market value of the underlying common stock and the option exercise prices. The total intrinsic value of options exercised during 2017 was $0.5 million, 2016 was $1.3 million and 2015 was immaterial.
The aggregate intrinsic value of options outstanding at December 31, 2017 was $11.6 million. The aggregate intrinsic value of options exercisable at December 31, 2017 was $7.1 million.
99
CYRUSONE INC.
Notes to Consolidated Financial Statements - (continued)
Stock Option Assumptions
The following table summarizes the stock option assumptions for the years ended December 31, 2017, 2016 and 2015:
Options Outstanding | Options Exercisable | Assumption Range | |||||||
Exercise Prices | Number of Shares | Weighted Average Remaining Contractual Terms (Years) | Number of Shares | Weighted Average Remaining Contractual Terms (Years) | Risk-Free Interest Rate | Expected Annual Dividend Yield | Expected Terms in Years | Expected Volatility | |
2015 | |||||||||
$23.58 | 142,556 | 7.3 | 43,460 | 7.3 | 0.92% | 3.4% | 6.0 | 35% | |
$28.42 | 178,704 | 9.1 | 35,346 | 9.1 | 1.6% - 1.75% | 4.4% | 5.5-6.5 | 32.5% - 37.5% | |
$30.74 | 12,719 | 9.6 | — | 0.0 | 1.6% - 1.75% | 4.4% | 5.5-6.5 | 32.5% - 37.5% | |
2016 | |||||||||
$23.58 | 67,601 | 6.3 | 67,601 | 6.3 | 0.92% | 3.4% | 6.0 | 35% | |
$28.42 | 143,358 | 8.1 | 47,786 | 8.1 | 1.6% - 1.75% | 4.4% | 5.5-6.5 | 32.5% - 37.5% | |
$30.74 | 12,719 | 8.6 | 4,240 | 8.6 | 1.6% - 1.75% | 4.4% | 5.5-6.5 | 32.5% - 37.5% | |
$36.99 | 210,590 | 9.1 | 18,530 | 9.1 | 1.47% - 1.64% | 4.1% | 5.5-6.5 | 27.5% - 35.0% | |
2017 | |||||||||
$23.58 | 67,322 | 5.3 | 67,322 | 5.3 | 0.92% | 3.4% | 6.0 | 35% | |
$28.42 | 143,358 | 7.1 | 95,572 | 7.1 | 1.6% - 1.75% | 4.4% | 5.5-6.5 | 32.5% - 37.5% | |
$30.74 | 12,719 | 7.6 | 8,479 | 7.6 | 1.6% - 1.75% | 4.4% | 5.5-6.5 | 32.5% - 37.5% | |
$36.99 | 192,060 | 8.1 | 64,022 | 8.1 | 1.47% - 1.64% | 4.1% | 5.5-6.5 | 27.5% - 35.0% | |
18. Related Party Transactions
CBI
Prior to November 20, 2012, CyrusOne Inc., CyrusOne GP, CyrusOne LP and its subsidiaries were operated by CBI. The consolidated financial statements reflect the following transactions with CBI and its affiliated entities, including Cincinnati Bell Telephone (CBT) and Cincinnati Bell Technology Solutions (CBTS). At December 31, 2015, CBI owned 9.5% of the outstanding common stock of CyrusOne Inc. and no operating partnership units, at which point it ceased to be a related party of CyrusOne Inc. As of December 31, 2017 and December 31, 2016, CBI owned less than 5% of the outstanding common stock of CyrusOne Inc.
Revenues—The Company records revenues from CBI under contractual service arrangements. These services include leasing of data center space, power and cooling in certain of our data center facilities, network interface services and office space.
Operating Expenses—The Company records expenses from CBI incurred in relation to network support, services calls, monitoring and management, storage and backup, IT systems support, and connectivity services.
100
CYRUSONE INC.
Notes to Consolidated Financial Statements - (continued)
The following related party transactions are based on agreements and arrangements that were in place during 2015. Revenues and expenses for the period presented were as follows:
IN MILLIONS | |||
December 31, 2015 | |||
Revenue: | |||
Data center colocation agreement provided to CBT and CBTS | $ | 7.8 | |
229 West 7th Street lease provided to CBT | 1.9 | ||
Goldcoast Drive/Parkway (Mason) lease | 0.3 | ||
Transition services provided to CBTS (network interfaces) | 0.3 | ||
Data center leases provided to CBTS | 12.0 | ||
Total revenue | $ | 22.3 | |
Operating costs and expenses: | |||
Transition services agreement by CBTS | $ | 0.7 | |
Charges for services provided by CBT (connectivity) | 1.0 | ||
209 West 7th Street rent provided by CBT | 0.2 | ||
Total operating costs and expenses | $ | 1.9 | |
Other Related Party Transactions
Our director, Lynn A. Wentworth, is a member of the board of directors of CBI, and serves as the chair of its audit and finance committee.
19. Income Taxes
CyrusOne Inc. elected to be taxed as a REIT under the Code, commencing with our taxable year ended December 31, 2013. To remain qualified as a REIT, we are required to distribute at least 90% of our taxable income to our stockholders and meet various other requirements imposed by the Code relating to such matters as operating results, asset holdings, distribution levels and diversity of stock ownership. Provided we continue to qualify for taxation as a REIT, we are generally not subject to corporate level federal income tax on the earnings distributed currently to our stockholders. It is our policy and intent, subject to change, to distribute 100% of our taxable income and therefore no provision is required in the accompanying financial statements for federal income taxes with regards to activities of CyrusOne Inc. and its subsidiary pass-through entities.
We have elected to designate two subsidiaries as taxable REIT subsidiaries (each a TRS). The activities of a TRS may include performing services for our tenants that would otherwise be considered impermissible for REITs. The income of a TRS is subject to federal and state taxes. While CyrusOne Inc. and the operating partnership do not pay federal income taxes, we are still subject to foreign, state, and local income taxes in the locations in which we conduct business. Income tax expense for the years ended December 31, 2017, 2016 and 2015 was $3.0 million, $1.8 million and $1.8 million, respectively.
For certain entities we calculate deferred tax assets and liabilities for temporary differences in the basis between financial statement and income tax assets and liabilities. Deferred income taxes are recalculated annually at rates then in effect. Valuation allowances are recorded to reduce deferred tax assets to amounts that are more likely than not to be realized. The ultimate realization of the deferred tax assets depends upon our ability to generate future taxable income during the periods in which basis differences and other deductions become deductible and prior to the expiration of the net operating loss carryforwards. Deferred tax assets (net of valuation allowance) and liabilities were accrued, as necessary, for the years ended December 31, 2017 and 2016. Historically, we have recorded a full valuation allowance on our foreign net deferred tax assets related to our foreign generated net operating losses due to the uncertainty of their realization. In 2013 and 2014, management determined it was necessary to record a full valuation allowance on all of our domestic and foreign net deferred tax assets due to the uncertainty of their realization. Accordingly, at December 31, 2017 and at December 31, 2016, the net domestic and foreign deferred tax assets were zero.
The Company adopted ASU No. 2015-17, Income Taxes (Topic 740), in the fourth quarter of 2016 and applied it prospectively to all deferred tax assets and liabilities. The adoption had no effect on our consolidated financial statements.
101
CYRUSONE INC.
Notes to Consolidated Financial Statements - (continued)
In 2017 and 2016, we paid all our dividends in cash. The following table summarizes the taxability of our common stock dividends per share for the years ended December 31, 2017 and 2016:
For the year ended December 31, | 2017 | 2016 | ||||
Common Stock dividend per share: | ||||||
Ordinary income | $ | — | $ | 0.20 | ||
Return of capital | 1.64 | 1.26 | ||||
Total dividend | $ | 1.64 | $ | 1.46 | ||
Common stock dividends may be characterized for federal income tax purposes as "ordinary income", "qualified dividend income", "capital gains dividends", non-taxable return of capital, "qualified REIT dividends" (but only for taxable years beginning after December 31, 2017 and before January 1, 2026) or a combination of the foregoing. Common stock dividends that exceed our current and accumulated earnings and profits (calculated for tax purposes) constitute a return of capital rather than a dividend and generally reduce the stockholder's basis in the common stock. To the extent that a dividend exceeds both current and accumulated earnings and profits and the stockholder's basis in the common stock, it will generally be treated as gain from the sale or exchange of that stockholder's common stock. At the beginning of each year, we notify our stockholders of the taxability of the common stock dividends paid during the preceding year.
Tax Cuts and Jobs Act of 2017 (the TCJA)
The TCJA was signed into law on December 22, 2017. The TCJA significantly changed the U.S. federal income tax laws applicable to businesses and their owners, including REITs and their stockholders. Technical corrections or other amendments to the TCJA or administrative guidance interpreting the TCJA may be forthcoming at any time. We cannot predict with certainty the long-term effect of the TCJA or any future law changes on REITs or their stockholders. Below illustrates some of the key changes in the TCJA that may directly impact REITs and their stockholders with respect to an investment in REITs. The changes described below are effective for taxable years beginning after December 31, 2017, unless otherwise noted. Investors should consult with their tax advisors regarding the effect of the TCJA for their particular circumstances.
Income Tax Rates. Under the TCJA, the corporate income tax rate is reduced from a maximum marginal rate of 35% to a flat rate of 21%. Our REIT is not subject to federal income taxes and we do not anticipate that our taxable REIT subsidiaries will materially benefit from this federal tax rate reduction, nor should there be a material impact on our deferred taxes as a result of the rate reduction. The rate of U.S. federal withholding tax on distributions made to non-U.S. shareholders by a REIT that are attributable to gains from the sale or exchange of U.S. real property interests will also be reduced from 35% to 21%.
The TCJA also reduces the highest marginal income tax rate applicable to individuals from 39.6% to 37% (excluding the 3.8% Medicare tax on net investment income) for tax years beginning after December 31, 2017 and before January 1, 2026. Individuals will continue to pay a maximum 20% rate on long term capital gains and qualified dividend income. Generally, dividends payable by REITs do not constitute qualified dividend income. However, the TCJA also allows non-corporate U.S. shareholders to deduct 20% of “qualified REIT dividends” for tax years beginning after December 31, 2017 and before January 1, 2026. A “qualified REIT dividend” is any dividend from a REIT received during the taxable year that is not designated by the REIT as a capital gain dividend or as qualified dividend income.
Limitation on Deductibility of Business Interest. Under the TCJA, in general, the deductibility of interest for a business, other than certain small businesses, is limited to 30% of the business’ adjusted taxable income (which, for purposes of the limitation on the deductibility of business interest, is defined as taxable income computed without regard to certain items of income or deduction, including the deductions for business interest and net operating losses). However, there is an exception to this limitation requirement for a “real property trade or business”, assuming a valid Internal Revenue Service election has been made. A “real property trade or business” is any property development, redevelopment, construction, reconstruction, acquisition, conversion, rental, operation, management, leasing, or brokerage trade or business. REITs are considered a real property trade or business and as such, may make an election to be exempt from the interest limitation requirements. If such election is made by a REIT, the REIT would be required to use a less favorable tax depreciation method to depreciate its real property used in a trade or business. We are currently evaluating the feasibility of making this election in 2018 and if made, we do not believe the required change to a less favorable depreciation method will have a material impact on our financials.
102
CYRUSONE INC.
Notes to Consolidated Financial Statements - (continued)
20. Commitments and Contingencies
Operating Leases
We lease certain data center facilities and equipment from third parties. Operating lease expense was $8.2 million, $7.5 million and $7.4 million for the years ended December 31, 2017, 2016 and 2015, respectively. Certain of these leases provide for renewal options with fixed rent escalations beyond the initial lease term.
At December 31, 2017, future minimum lease payments required under operating leases having initial or remaining non-cancellable lease terms in excess of one year are as follows:
IN MILLIONS | |||
2018 | $ | 4.8 | |
2019 | 2.3 | ||
2020 | 1.7 | ||
2021 | 0.6 | ||
2022 | 0.5 | ||
Thereafter | 4.2 | ||
Total | $ | 14.1 | |
Standby Letters of Credit
As of December 31, 2017, CyrusOne Inc. had outstanding letters of credit of $8.5 million as security for obligations under the terms of the lease agreements.
Performance Guarantees
Customer contracts generally require specified levels of performance related to uninterrupted service and cooling temperatures. If these performance standards are not met, we could be obligated to issue billing credits to the customer. Management assesses the probability that a performance standard will not be achieved. As of December 31, 2017 and 2016, no accruals for performance guarantees were required.
Indemnifications
During the normal course of business, CyrusOne has made certain indemnities, commitments and guarantees under which it may be required to make payments in relation to certain transactions. These include (i) intellectual property indemnities to customers in connection with the use, sale, and/or license of products and services, (ii) indemnities to vendors and service providers pertaining to claims based on negligence or willful misconduct and (iii) indemnities involving the representations and warranties in certain contracts. In addition, CyrusOne has made contractual commitments to several employees providing for payments upon the occurrence of certain prescribed events. The majority of these indemnities, commitments and guarantees do not provide for any limitation on the maximum potential for future payments that we could be obligated to make.
Purchase Commitments
CyrusOne has non-cancellable purchase commitments for certain services and contracts related to construction of data center facilities and equipment. These agreements range from one to two years and provide for payments for early termination or require minimum payments for the remaining term. As of December 31, 2017, the minimum commitments for these arrangements were approximately $69.8 million.
Contingencies
CyrusOne is involved in legal, tax and regulatory proceedings arising from the conduct of its business activities. Liabilities are established for loss contingencies when losses associated with such claims are deemed to be probable, and the loss can be reasonably estimated. Based on information currently available and consultation with legal counsel, we believe that the outcome of all claims will not, individually or in the aggregate, have a material effect on our financial statements.
103
CYRUSONE INC.
Notes to Consolidated Financial Statements - (continued)
21. Guarantors
CyrusOne LP and CyrusOne Finance Corp., as “LP Co-issuer” and “Finance Co-issuer,” respectively, had $706.8 million aggregate principal amount of their 2024 Notes and $510.5 million aggregate principal amount of their 2027 Notes outstanding at December 31, 2017. As of December 31, 2017, the 2024 Notes and 2027 Notes are fully and unconditionally and jointly and severally guaranteed on a senior unsecured basis by CyrusOne Inc. (Parent Guarantor), CyrusOne GP (General Partner), and CyrusOne LP’s wholly owned domestic subsidiaries, CyrusOne LLC, CyrusOne TRS Inc., CyrusOne Foreign Holdings LLC, Cervalis Holdings LLC, Cervalis LLC, CyrusOne-NJ LLC and CyrusOne-NC LLC (such subsidiaries, together, the Guarantor Subsidiaries). Non-Guarantor Subsidiaries consist of wholly owned subsidiaries organized outside of the United States, as well as CyrusOne Government Services LLC, a Delaware limited liability company, Warhol TRS LLC, a Delaware limited liability company (Warhol TRS), Warhol Partnership LLC, a Delaware limited liability company (Warhol Partnership), Warhol REIT LLC, a Delaware limited liability company (Warhol REIT and, together with Warhol TRS and Warhol Partnership, the Warhol Entities), and Cheetah Asia Holdings LLC, each of which is an indirect wholly owned subsidiary of CyrusOne LP, and the Finance Co-Issuer. None of the Non-Guarantor Subsidiaries guarantee the 2024 Notes and 2027 Notes. Subject to the provisions of the indentures governing the 2024 Notes and 2027 Notes, in certain circumstances, a Guarantor may be released from its guarantee obligation, including:
• | upon the sale or other disposition (including by way of consolidation or merger) of such Guarantor or of all of the capital stock of such Guarantor such that such Guarantor is no longer a restricted subsidiary under the indentures, |
• | upon the sale or disposition of all or substantially all of the assets of the Guarantor, |
• | upon the LP Co-issuer designating such Guarantor as an unrestricted subsidiary under the terms of the indentures, |
• | if such Guarantor is no longer a guarantor or other obligor of any other indebtedness of the LP Co-issuer or the Parent Guarantor, |
• | upon the LP Co-issuer designating such Guarantor as an excluded subsidiary under the terms of the indentures, and |
• | upon the defeasance or discharge of the New Notes in accordance with the terms of the indentures. |
The entity structure of each Issuer and guarantor of the 2024 Notes and 2027 Notes is described below.
CyrusOne Inc. – CyrusOne Inc. is the Parent Guarantor and became a separate registrant with the SEC upon completion of its IPO on January 24, 2013.
CyrusOne GP – CyrusOne GP is the general partner and 1% owner of CyrusOne LP and has no other assets or operations.
Issuers – The Issuers are CyrusOne LP and CyrusOne Finance Corp. CyrusOne Finance Corp., a wholly owned subsidiary of CyrusOne LP, was formed for the sole purpose of acting as co-issuer of senior notes and has no other assets or operations. CyrusOne LP, in addition to being the co-issuer of the 2024 Notes and 2027 Notes, is also the 100% owner, either directly or indirectly, of the Guarantor Subsidiaries and Non-Guarantor Subsidiaries.
Guarantor Subsidiaries – The guarantors of the 2024 Notes and 2027 Notes include CyrusOne LLC, CyrusOne TRS Inc., CyrusOne Foreign Holdings LLC, Cervalis Holdings LLC, Cervalis LLC, CyrusOne-NJ LLC and CyrusOne-NC LLC, which agreed to provide unconditional guarantees of the Issuers’ obligations under the 2024 Notes and 2027 Notes. The guarantee of each Guarantor Subsidiary is (i) a senior unsecured obligation of such Guarantor Subsidiary, (ii) pari passu in right of payment with any existing and future unsecured senior indebtedness of such Guarantor Subsidiary, (iii) senior in right of payment to any future subordinated indebtedness of such Guarantor Subsidiary and (iv) effectively subordinated in right of payment to all existing and future secured indebtedness of such Guarantor Subsidiary, to the extent of the value of the collateral securing that indebtedness. CyrusOne LLC, together with CyrusOne Foreign Holdings LLC, directly or indirectly owns 100% of the Non-Guarantor Subsidiaries, except for the Warhol Entities, Cheetah Asia Holdings LLC and GDS Holdings Limited which are directly or indirectly owned by CyrusOne LP.
Non-Guarantor Subsidiaries consist of wholly owned subsidiaries which conduct operations in the United Kingdom and Singapore, as well as CyrusOne Government Services LLC, a Delaware limited liability company, the Warhol Entities, Cheetah Asia Holdings LLC and GDS Holdings Limited, each of which is directly or indirectly owned by CyrusOne LP, and the Finance Co-Issuer. The Warhol Entities do not have any assets or operations other than the ownership by Warhol TRS of 0.2% of Warhol Partnership, the ownership by Warhol Partnership of 100% of Warhol REIT, and the ownership by Warhol REIT of 100% of CyrusOne Foreign Holdings LLC.
The following schedules present the balance sheets as of December 31, 2017 and 2016, and the statements of operations and comprehensive (loss) income for the years ended December 31, 2017, 2016 and 2015, and the statements of cash flows for the years ended December 31, 2017, 2016 and 2015 for the Parent Guarantor, General Partner, LP Co-issuer, Finance Co-issuer, Guarantor Subsidiaries, and Non-Guarantor Subsidiaries.
104
CYRUSONE INC.
Notes to Consolidated Financial Statements - (continued)
The consolidating statements of cash flows for the year ended December 31, 2017 includes the purchase of the Sentinel Properties on February 28, 2017. The consolidating statements of cash flows for the year ended December 31, 2016 includes the purchase of CME in March 2016. The condensed consolidating statements of cash flows for the year ended December 31, 2015, includes the acquisition of Cervalis in July 2015. The results for the CME and Sentinel Properties purchases are included in the Guarantor Subsidiaries financial statements subsequent to the respective acquisitions. The results for Cervalis are included in the Guarantor Subsidiaries financial statements subsequent to the acquisition.
Consolidating Balance Sheets
IN MILLIONS | As of December 31, 2017 | |||||||||||||||||||||||
Parent Guarantor | General Partner | LP Co-issuer | Finance Co-issuer | Guarantor Subsidiaries | Non- Guarantors | Eliminations/Consolidations | Total | |||||||||||||||||
Land | $ | — | $ | — | $ | — | $ | — | $ | 177.1 | $ | — | $ | — | $ | 177.1 | ||||||||
Buildings and improvements | — | — | — | — | 1,340.8 | 28.4 | 2.2 | 1,371.4 | ||||||||||||||||
Equipment | — | — | — | — | 1,803.9 | 1.1 | 8.9 | 1,813.9 | ||||||||||||||||
Construction in progress | — | — | — | — | 471.7 | 0.1 | 6.6 | 478.4 | ||||||||||||||||
Subtotal | — | — | — | — | 3,793.5 | 29.6 | 17.7 | 3,840.8 | ||||||||||||||||
Accumulated depreciation | — | — | — | — | (778.6 | ) | (3.8 | ) | — | (782.4 | ) | |||||||||||||
Net investment in real estate | — | — | — | — | 3,014.9 | 25.8 | 17.7 | 3,058.4 | ||||||||||||||||
Cash and cash equivalents | — | — | — | — | 151.2 | 0.7 | — | 151.9 | ||||||||||||||||
Investment in subsidiaries | 1,718.0 | 17.2 | 2,190.2 | — | — | — | (3,925.4 | ) | — | |||||||||||||||
Rent and other receivables, net | — | — | — | — | 87.9 | 2.6 | — | 90.5 | ||||||||||||||||
Intercompany receivable | 20.0 | — | 1,656.4 | — | — | — | (1,676.4 | ) | — | |||||||||||||||
Goodwill | — | — | — | — | 455.1 | — | — | 455.1 | ||||||||||||||||
Intangible assets, net | — | — | — | — | 203.0 | — | — | 203.0 | ||||||||||||||||
Other assets | — | — | 0.5 | — | 174.4 | 178.3 | — | 353.2 | ||||||||||||||||
Total assets | $ | 1,738.0 | $ | 17.2 | $ | 3,847.1 | $ | — | $ | 4,086.5 | $ | 207.4 | $ | (5,584.1 | ) | $ | 4,312.1 | |||||||
Accounts payable and accrued expenses | $ | 41.8 | $ | — | $ | 19.7 | — | $ | 192.8 | $ | 0.9 | $ | — | $ | 255.2 | |||||||||
Deferred revenue | — | — | — | — | 110.8 | 0.8 | — | 111.6 | ||||||||||||||||
Intercompany payable | — | — | 20.0 | — | 1,656.4 | — | (1,676.4 | ) | — | |||||||||||||||
Capital lease obligations | — | — | — | — | 5.4 | 4.7 | — | 10.1 | ||||||||||||||||
Long-term debt, net | — | — | 2,089.4 | — | — | — | — | 2,089.4 | ||||||||||||||||
Lease financing arrangements | — | — | — | — | 104.6 | 27.3 | — | 131.9 | ||||||||||||||||
Total liabilities | 41.8 | — | 2,129.1 | — | 2,070.0 | 33.7 | (1,676.4 | ) | 2,598.2 | |||||||||||||||
Total stockholders' equity | 1,696.2 | 17.2 | 1,718.0 | — | 2,016.5 | 173.7 | (3,907.7 | ) | 1,713.9 | |||||||||||||||
Total liabilities and equity | $ | 1,738.0 | $ | 17.2 | $ | 3,847.1 | $ | — | $ | 4,086.5 | $ | 207.4 | $ | (5,584.1 | ) | $ | 4,312.1 | |||||||
105
CYRUSONE INC.
Notes to Consolidated Financial Statements - (continued)
IN MILLIONS | As of December 31, 2016 | |||||||||||||||||||||||
Parent Guarantor | General Partner | LP Co-issuer | Finance Co-issuer | Guarantor Subsidiaries | Non- Guarantors | Eliminations/Consolidations | Total | |||||||||||||||||
Land | $ | — | $ | — | $ | — | $ | — | $ | 142.7 | $ | — | $ | — | $ | 142.7 | ||||||||
Buildings and improvements | — | — | — | — | 973.6 | 34.1 | 1.2 | 1,008.9 | ||||||||||||||||
Equipment | — | — | — | — | 1,036.8 | 1.0 | 5.1 | 1,042.9 | ||||||||||||||||
Construction in progress | — | — | — | — | 406.4 | — | 0.7 | 407.1 | ||||||||||||||||
Subtotal | — | — | — | — | 2,559.5 | 35.1 | 7.0 | 2,601.6 | ||||||||||||||||
Accumulated depreciation | — | — | — | — | (571.3 | ) | (7.2 | ) | — | (578.5 | ) | |||||||||||||
Net investment in real estate | — | — | — | — | 1,988.2 | 27.9 | 7.0 | 2,023.1 | ||||||||||||||||
Cash and cash equivalents | — | — | — | — | 13.4 | 1.2 | — | 14.6 | ||||||||||||||||
Investment in subsidiaries | 1,170.3 | 11.7 | 1,376.1 | — | 2.0 | — | (2,560.1 | ) | — | |||||||||||||||
Rent and other receivables, net | — | — | — | — | 81.8 | 1.5 | — | 83.3 | ||||||||||||||||
Intercompany receivable | 18.6 | — | 1,057.7 | — | — | 0.5 | (1,076.8 | ) | — | |||||||||||||||
Goodwill | — | — | — | — | 455.1 | — | — | 455.1 | ||||||||||||||||
Intangible assets, net | — | — | — | — | 150.2 | — | — | 150.2 | ||||||||||||||||
Other assets | — | — | — | — | 123.4 | 2.7 | — | 126.1 | ||||||||||||||||
Total assets | $ | 1,188.9 | $ | 11.7 | $ | 2,433.8 | $ | — | $ | 2,814.1 | $ | 33.8 | $ | (3,629.9 | ) | $ | 2,852.4 | |||||||
Accounts payable and accrued expenses | $ | 33.9 | $ | — | $ | 4.8 | — | $ | 187.7 | $ | 0.7 | $ | — | $ | 227.1 | |||||||||
Deferred revenue | — | — | — | — | 76.0 | 0.7 | — | 76.7 | ||||||||||||||||
Intercompany payable | — | — | 18.6 | — | 1,058.2 | — | (1,076.8 | ) | — | |||||||||||||||
Capital lease obligations | — | — | — | — | 5.6 | 5.2 | — | 10.8 | ||||||||||||||||
Long-term debt, net | — | — | 1,240.1 | — | — | — | — | 1,240.1 | ||||||||||||||||
Lease financing arrangements | — | — | — | — | 110.5 | 25.2 | — | 135.7 | ||||||||||||||||
Total liabilities | 33.9 | — | 1,263.5 | — | 1,438.0 | 31.8 | (1,076.8 | ) | 1,690.4 | |||||||||||||||
Total stockholders' equity | 1,155.0 | 11.7 | 1,170.3 | — | 1,376.1 | 2.0 | (2,553.1 | ) | 1,162.0 | |||||||||||||||
Total liabilities and equity | $ | 1,188.9 | $ | 11.7 | $ | 2,433.8 | $ | — | $ | 2,814.1 | $ | 33.8 | $ | (3,629.9 | ) | $ | 2,852.4 | |||||||
106
CYRUSONE INC.
Notes to Consolidated Financial Statements - (continued)
Consolidating Statements of Operations and Comprehensive Income (Loss)
IN MILLIONS | Year Ended December 31, 2017 | |||||||||||||||||||||||
Parent Guarantor | General Partner | LP Co-issuer | Finance Co-issuer | Guarantor Subsidiaries | Non- Guarantors | Eliminations/Consolidations | Total | |||||||||||||||||
Revenue: | ||||||||||||||||||||||||
Base revenue and other | $ | — | $ | — | $ | — | $ | — | $ | 598.2 | $ | 4.2 | $ | — | $ | 602.4 | ||||||||
Metered power reimbursements | — | — | — | — | 68.2 | 1.4 | — | 69.6 | ||||||||||||||||
Revenue | — | — | — | — | 666.4 | 5.6 | — | 672.0 | ||||||||||||||||
Costs and expenses: | ||||||||||||||||||||||||
Property operating expenses | — | — | — | — | 232.5 | 2.6 | — | 235.1 | ||||||||||||||||
Sales and marketing | — | — | — | — | 17.0 | — | — | 17.0 | ||||||||||||||||
General and administrative | — | — | — | — | 66.8 | 0.2 | — | 67.0 | ||||||||||||||||
Depreciation and amortization | — | — | — | — | 257.8 | 1.1 | — | 258.9 | ||||||||||||||||
Transaction and acquisition integration costs | — | — | — | — | 10.4 | — | — | 10.4 | ||||||||||||||||
Asset impairments and loss on disposal | — | — | — | — | 55.9 | 3.6 | — | 59.5 | ||||||||||||||||
Total costs and expenses | — | — | — | — | 640.4 | 7.5 | — | 647.9 | ||||||||||||||||
Operating income | — | — | — | — | 26.0 | (1.9 | ) | — | 24.1 | |||||||||||||||
Interest expense | — | — | 76.2 | — | — | 2.6 | (10.7 | ) | 68.1 | |||||||||||||||
Loss on extinguishment of debt | — | — | 36.5 | — | — | — | — | 36.5 | ||||||||||||||||
(Loss) income before income taxes | — | — | (112.7 | ) | — | 26.0 | (4.5 | ) | 10.7 | (80.5 | ) | |||||||||||||
Income tax expense | — | — | — | — | (3.0 | ) | — | — | (3.0 | ) | ||||||||||||||
Equity (loss) earnings related to investment in subsidiaries | (18.7 | ) | (0.2 | ) | 94.0 | — | (4.6 | ) | — | (70.5 | ) | — | ||||||||||||
Net (loss) income | (18.7 | ) | (0.2 | ) | (18.7 | ) | — | 18.4 | (4.5 | ) | (59.8 | ) | (83.5 | ) | ||||||||||
Other comprehensive income | — | — | — | — | — | 75.5 | — | 75.5 | ||||||||||||||||
Comprehensive (loss) income | $ | (18.7 | ) | $ | (0.2 | ) | $ | (18.7 | ) | $ | — | $ | 18.4 | $ | 71.0 | $ | (59.8 | ) | $ | (8.0 | ) | |||
IN MILLIONS | Year Ended December 31, 2016 | |||||||||||||||||||||||
Parent Guarantor | General Partner | LP Co-issuer | Finance Co-issuer | Guarantor Subsidiaries | Non- Guarantors | Eliminations/Consolidations | Total | |||||||||||||||||
Revenue: | ||||||||||||||||||||||||
Base revenue and other | $ | — | $ | — | $ | — | $ | — | $ | 472.6 | $ | 4.1 | $ | — | $ | 476.7 | ||||||||
Metered power reimbursements | — | — | — | — | 51.1 | 1.3 | — | 52.4 | ||||||||||||||||
Revenue | — | — | — | — | 523.7 | 5.4 | — | 529.1 | ||||||||||||||||
Costs and expenses: | ||||||||||||||||||||||||
Property operating expenses | — | — | — | — | 185.2 | 2.3 | — | 187.5 | ||||||||||||||||
Sales and marketing | — | — | — | — | 16.9 | — | — | 16.9 | ||||||||||||||||
General and administrative | — | — | — | — | 60.5 | 0.2 | — | 60.7 | ||||||||||||||||
Depreciation and amortization | — | — | — | — | 185.3 | (1.4 | ) | — | 183.9 | |||||||||||||||
Transaction and acquisition integration costs | — | — | — | — | 4.3 | — | — | 4.3 | ||||||||||||||||
Asset impairments and loss on disposal | — | — | — | — | 5.3 | — | — | 5.3 | ||||||||||||||||
Total costs and expenses | — | — | — | — | 457.5 | 1.1 | — | 458.6 | ||||||||||||||||
Operating income | — | — | — | — | 66.2 | 4.3 | — | 70.5 | ||||||||||||||||
Interest expense | — | — | 49.1 | — | — | 2.8 | (3.1 | ) | 48.8 | |||||||||||||||
Income (loss) before income taxes | — | — | (49.1 | ) | — | 66.2 | 1.5 | 3.1 | 21.7 | |||||||||||||||
Income tax expense | — | — | — | — | (1.8 | ) | — | — | (1.8 | ) | ||||||||||||||
Equity (loss) earnings related to investment in subsidiaries | 15.9 | 0.2 | 65.0 | — | 0.6 | — | (81.7 | ) | — | |||||||||||||||
Net income (loss) | 15.9 | 0.2 | 15.9 | — | 65.0 | 1.5 | (78.6 | ) | 19.9 | |||||||||||||||
Other comprehensive loss | — | — | — | — | — | (0.9 | ) | — | (0.9 | ) | ||||||||||||||
Comprehensive income (loss) attributable to common stockholders | $ | 15.9 | $ | 0.2 | $ | 15.9 | $ | — | $ | 65.0 | $ | 0.6 | $ | (78.6 | ) | $ | 19.0 | |||||||
107
CYRUSONE INC.
Notes to Consolidated Financial Statements - (continued)
IN MILLIONS | Year Ended December 31, 2015 | |||||||||||||||||||||||
Parent Guarantor(1) | General Partner | LP Co-issuer | Finance Co-issuer | Guarantor Subsidiaries | Non- Guarantors | Eliminations/Consolidations | Total | |||||||||||||||||
Revenue: | ||||||||||||||||||||||||
Base revenue and other | $ | — | $ | — | $ | — | $ | — | $ | 350.3 | $ | 4.3 | $ | — | $ | 354.6 | ||||||||
Metered power reimbursements | — | — | — | — | 43.5 | 1.2 | — | 44.7 | ||||||||||||||||
Revenue | — | — | — | — | 393.8 | 5.5 | — | 399.3 | ||||||||||||||||
Costs and expenses: | ||||||||||||||||||||||||
Property operating expenses | — | — | — | — | 146.0 | 2.7 | — | 148.7 | ||||||||||||||||
Sales and marketing | — | — | — | — | 12.0 | 0.1 | — | 12.1 | ||||||||||||||||
General and administrative | — | — | — | — | 46.6 | — | — | 46.6 | ||||||||||||||||
Depreciation and amortization | — | — | — | — | 138.7 | 2.8 | — | 141.5 | ||||||||||||||||
Transaction and acquisition integration costs | — | — | — | — | 14.1 | — | — | 14.1 | ||||||||||||||||
Asset impairments and loss on disposal | — | — | — | — | 13.5 | — | — | 13.5 | ||||||||||||||||
Total costs and expenses | — | — | — | — | 370.9 | 5.6 | — | 376.5 | ||||||||||||||||
Operating income (loss) | — | — | — | — | 22.9 | (0.1 | ) | — | 22.8 | |||||||||||||||
Interest expense | — | — | 39.7 | — | — | 3.2 | (1.7 | ) | 41.2 | |||||||||||||||
(Loss) income before income taxes | — | — | (39.7 | ) | — | 22.9 | (3.3 | ) | 1.7 | (18.4 | ) | |||||||||||||
Income tax expense | — | — | — | — | (1.8 | ) | — | — | (1.8 | ) | ||||||||||||||
Equity (loss) earnings related to investment in subsidiaries | (17.1 | ) | (0.2 | ) | 17.8 | — | (3.3 | ) | — | 2.8 | — | |||||||||||||
Net (loss) income | (17.1 | ) | (0.2 | ) | (21.9 | ) | — | 17.8 | (3.3 | ) | 4.5 | (20.2 | ) | |||||||||||
Noncontrolling interest in net loss | — | — | — | — | — | — | 4.8 | 4.8 | ||||||||||||||||
Net (loss) income attributed to common stockholders | (17.1 | ) | (0.2 | ) | (21.9 | ) | — | 17.8 | (3.3 | ) | 9.3 | (15.4 | ) | |||||||||||
Other comprehensive loss | — | — | — | — | — | (0.2 | ) | — | (0.2 | ) | ||||||||||||||
Comprehensive (loss) income attributable to common stockholders | $ | (17.1 | ) | $ | (0.2 | ) | $ | (21.9 | ) | $ | — | $ | 17.8 | $ | (3.5 | ) | $ | 9.3 | $ | (15.6 | ) | |||
108
CYRUSONE INC.
Notes to Consolidated Financial Statements - (continued)
Consolidating Statements of Cash Flows
IN MILLIONS | Year Ended December 31, 2017 | |||||||||||||||||||||||
Parent Guarantor | General Partner | LP Co-issuer | Finance Co-issuer | Guarantor Subsidiaries | Non- Guarantors | Eliminations/Consolidations | Total | |||||||||||||||||
Net cash (used in) provided by operating activities | $ | — | $ | — | $ | (60.3 | ) | $ | — | $ | 339.7 | $ | (0.6 | ) | $ | 10.7 | $ | 289.5 | ||||||
Cash flows from investing activities: | ||||||||||||||||||||||||
Capital expenditures - asset acquisitions, net of cash acquired | — | — | — | — | (492.3 | ) | — | — | (492.3 | ) | ||||||||||||||
Capital expenditures - other development | — | — | — | — | (903.8 | ) | — | (10.7 | ) | (914.5 | ) | |||||||||||||
Equity investment | — | — | — | — | — | (100.0 | ) | — | (100.0 | ) | ||||||||||||||
Investment in subsidiaries | (705.3 | ) | (7.1 | ) | (705.3 | ) | — | (0.7 | ) | — | 1,418.4 | — | ||||||||||||
Return of investment | 145.7 | — | — | — | — | — | (145.7 | ) | — | |||||||||||||||
Intercompany borrowings | 6.5 | — | (598.8 | ) | — | — | 0.5 | 591.8 | — | |||||||||||||||
Net cash provided by (used in) investing activities | (553.1 | ) | (7.1 | ) | (1,304.1 | ) | — | (1,396.8 | ) | (99.5 | ) | 1,853.8 | (1,506.8 | ) | ||||||||||
Cash flows from financing activities: | ||||||||||||||||||||||||
Issuance of common stock | 706.0 | — | — | — | — | — | — | 706.0 | ||||||||||||||||
Stock issuance costs | (0.3 | ) | — | — | — | — | — | — | (0.3 | ) | ||||||||||||||
Dividends paid | (145.7 | ) | — | (145.7 | ) | — | — | — | 145.7 | (145.7 | ) | |||||||||||||
Intercompany borrowings | — | — | (6.5 | ) | — | 598.2 | — | (591.7 | ) | — | ||||||||||||||
Borrowings from credit facility | — | — | 1,390.0 | — | — | — | — | 1,390.0 | ||||||||||||||||
Payments on credit facility | — | — | (1,275.0 | ) | — | — | — | — | (1,275.0 | ) | ||||||||||||||
Payments on senior notes | — | — | (474.8 | ) | — | — | — | — | (474.8 | ) | ||||||||||||||
Proceeds from issuance of debt | — | — | 1,217.8 | — | — | — | — | 1,217.8 | ||||||||||||||||
Debt issuance costs | — | — | (19.0 | ) | — | — | — | — | (19.0 | ) | ||||||||||||||
Payments on capital leases and lease financing arrangements | — | — | — | — | (8.6 | ) | (1.2 | ) | — | (9.8 | ) | |||||||||||||
Interest paid by lenders on issuance of the senior notes | — | — | 2.7 | — | — | — | — | 2.7 | ||||||||||||||||
Payment of debt extinguishment costs | — | — | (30.4 | ) | — | — | — | — | (30.4 | ) | ||||||||||||||
Tax payment upon exercise of equity awards | (6.9 | ) | — | — | — | — | — | — | (6.9 | ) | ||||||||||||||
Contributions/distributions from parent | — | 7.1 | 705.3 | — | 605.3 | 100.8 | (1,418.5 | ) | — | |||||||||||||||
Net cash provided by (used in) financing activities | 553.1 | 7.1 | 1,364.4 | — | 1,194.9 | 99.6 | (1,864.5 | ) | 1,354.6 | |||||||||||||||
Net increase (decrease) in cash, cash equivalents and restricted cash | — | — | — | — | 137.8 | (0.5 | ) | — | 137.3 | |||||||||||||||
Cash, cash equivalents and restricted cash at beginning of period | — | — | — | — | 13.4 | 1.2 | — | 14.6 | ||||||||||||||||
Cash, cash equivalents and restricted cash at end of period | $ | — | $ | — | $ | — | $ | — | $ | 151.2 | $ | 0.7 | $ | — | $ | 151.9 | ||||||||
109
CYRUSONE INC.
Notes to Consolidated Financial Statements - (continued)
IN MILLIONS | Year Ended December 31, 2016 | |||||||||||||||||||||||
Parent Guarantor | General Partner | LP Co-issuer | Finance Co-issuer | Guarantor Subsidiaries | Non- Guarantors | Eliminations/Consolidations | Total | |||||||||||||||||
Net cash (used in) provided by operating activities | $ | — | $ | — | $ | (45.4 | ) | $ | — | $ | 221.8 | $ | — | $ | 4.2 | $ | 180.6 | |||||||
Cash flows from investing activities: | ||||||||||||||||||||||||
Capital expenditures - asset acquisitions, net of cash acquired | — | — | — | — | (131.1 | ) | — | — | (131.1 | ) | ||||||||||||||
Capital expenditures - other development | — | — | — | — | (598.9 | ) | (1.1 | ) | — | (600.0 | ) | |||||||||||||
Investment in subsidiaries | (448.2 | ) | (4.5 | ) | (448.2 | ) | — | — | — | 900.9 | — | |||||||||||||
Return of investment | 112.3 | — | — | — | — | — | (112.3 | ) | — | |||||||||||||||
Intercompany borrowings | 15.3 | — | (66.3 | ) | — | — | (0.5 | ) | 51.5 | — | ||||||||||||||
Net cash provided by (used in) investing activities | (320.6 | ) | (4.5 | ) | (514.5 | ) | — | (730.0 | ) | (1.6 | ) | 840.1 | (731.1 | ) | ||||||||||
Cash flows from financing activities: | ||||||||||||||||||||||||
Issuance of common stock | 448.7 | — | — | — | — | — | — | 448.7 | ||||||||||||||||
Stock issuance costs | (1.6 | ) | — | — | — | — | — | — | (1.6 | ) | ||||||||||||||
Dividends paid | (112.3 | ) | — | (114.3 | ) | — | — | — | 112.3 | (114.3 | ) | |||||||||||||
Intercompany borrowings | — | — | (15.3 | ) | — | 71.0 | — | (55.7 | ) | — | ||||||||||||||
Borrowings from credit facility | — | — | 710.0 | — | — | — | — | 710.0 | ||||||||||||||||
Payments on credit facility | — | — | (460.0 | ) | — | — | — | — | (460.0 | ) | ||||||||||||||
Payments on capital leases and lease financing arrangements | — | — | — | — | (8.0 | ) | (1.1 | ) | — | (9.1 | ) | |||||||||||||
Tax payment upon exercise of equity awards | (14.2 | ) | — | — | — | — | — | — | (14.2 | ) | ||||||||||||||
Contributions/distributions from parent | — | 4.5 | 448.2 | — | 448.2 | — | (900.9 | ) | — | |||||||||||||||
Payment of note payable | — | — | — | — | (1.5 | ) | — | — | (1.5 | ) | ||||||||||||||
Debt issuance costs | — | — | (8.7 | ) | — | — | — | — | (8.7 | ) | ||||||||||||||
Net cash provided by (used in) financing activities | 320.6 | 4.5 | 559.9 | — | 509.7 | (1.1 | ) | (844.3 | ) | 549.3 | ||||||||||||||
Net increase (decrease) in cash, cash equivalents and restricted cash | — | — | — | — | 1.5 | (2.7 | ) | — | (1.2 | ) | ||||||||||||||
Cash, cash equivalents and restricted cash at beginning of period | — | — | — | — | 11.9 | 3.9 | — | 15.8 | ||||||||||||||||
Cash, cash equivalents and restricted cash at end of period | $ | — | $ | — | $ | — | $ | — | $ | 13.4 | $ | 1.2 | $ | — | $ | 14.6 | ||||||||
110
CYRUSONE INC.
Notes to Consolidated Financial Statements - (continued)
IN MILLIONS | Year Ended December 31, 2015 | |||||||||||||||||||||||
Parent Guarantor | General Partner | LP Co-issuer | Finance Co-issuer | Guarantor Subsidiaries | Non- Guarantors | Eliminations/Consolidations | Total | |||||||||||||||||
Net cash (used in) provided by operating activities | $ | — | $ | — | $ | (19.6 | ) | $ | — | $ | 156.2 | $ | 1.9 | $ | 1.7 | $ | 140.2 | |||||||
Cash flows from investing activities: | ||||||||||||||||||||||||
Capital expenditures - purchase of fixed assets | — | — | — | — | (17.3 | ) | — | — | (17.3 | ) | ||||||||||||||
Capital expenditures - other development | — | — | — | — | (216.7 | ) | (0.5 | ) | — | (217.2 | ) | |||||||||||||
Business acquisition, net of cash acquired | — | — | — | — | (389.6 | ) | — | — | (389.6 | ) | ||||||||||||||
Investment in subsidiaries | (203.1 | ) | (2.0 | ) | (203.1 | ) | — | (0.4 | ) | — | 408.6 | — | ||||||||||||
Return of investment | 62.6 | — | 102.0 | — | (17.9 | ) | — | (146.7 | ) | — | ||||||||||||||
Intercompany borrowings | — | — | (348.4 | ) | — | — | — | 348.4 | — | |||||||||||||||
Net cash (used in) provided by investing activities | (140.5 | ) | (2.0 | ) | (449.5 | ) | — | (641.9 | ) | (0.5 | ) | 610.3 | (624.1 | ) | ||||||||||
Cash flows from financing activities: | ||||||||||||||||||||||||
Issuance of common stock | 799.5 | — | — | — | — | — | — | 799.5 | ||||||||||||||||
Stock issuance costs | (0.8 | ) | — | — | — | — | — | — | (0.8 | ) | ||||||||||||||
Acquisition of operating partnership units | (596.4 | ) | — | — | — | — | — | — | (596.4 | ) | ||||||||||||||
Dividends paid | (61.0 | ) | — | (80.8 | ) | — | (80.8 | ) | — | 141.8 | (80.8 | ) | ||||||||||||
Intercompany borrowings | — | — | — | — | 348.4 | — | (348.4 | ) | — | |||||||||||||||
Borrowings from credit facility | — | — | 260.0 | — | — | — | — | 260.0 | ||||||||||||||||
Proceeds from issuance of debt | — | — | 103.8 | — | — | — | — | 103.8 | ||||||||||||||||
Payments on credit facility | — | — | (10.0 | ) | — | — | — | — | (10.0 | ) | ||||||||||||||
Payments on capital leases and lease financing arrangements | — | — | — | — | (5.0 | ) | (0.9 | ) | — | (5.9 | ) | |||||||||||||
Tax payment upon exercise of equity awards | (0.8 | ) | — | — | — | — | — | — | (0.8 | ) | ||||||||||||||
Contributions/distributions from parent | — | 2.0 | 201.5 | — | 201.5 | 0.4 | (405.4 | ) | — | |||||||||||||||
Debt issuance costs | — | — | (5.4 | ) | — | — | — | — | (5.4 | ) | ||||||||||||||
Net cash provided by (used in) financing activities | 140.5 | 2.0 | 469.1 | — | 464.1 | (0.5 | ) | (612.0 | ) | 463.2 | ||||||||||||||
Net (decrease) increase in cash, cash equivalents and restricted cash | — | — | — | — | (21.6 | ) | 0.9 | — | (20.7 | ) | ||||||||||||||
Cash, cash equivalents and restricted cash at beginning of period | — | — | — | — | 33.5 | 3.0 | — | 36.5 | ||||||||||||||||
Cash, cash equivalents and restricted cash at end of period | $ | — | $ | — | $ | — | $ | — | $ | 11.9 | $ | 3.9 | $ | — | $ | 15.8 | ||||||||
111
CYRUSONE INC.
Notes to Consolidated Financial Statements - (continued)
22. Quarterly Financial Information (Unaudited)
The table below reflects the unaudited selected quarterly information for the years ended December 31, 2017 and 2016:
IN MILLIONS, except per share amounts | |||||||||||||||
2017 | |||||||||||||||
First Quarter | Second Quarter | Third Quarter | Fourth Quarter | Total | |||||||||||
Revenue | $ | 149.3 | $ | 166.9 | $ | 175.3 | $ | 180.5 | $ | 672.0 | |||||
Operating income (loss) | 19.8 | 16.7 | (36.3 | ) | 23.9 | 24.1 | |||||||||
Net (loss) income | (30.4 | ) | (0.8 | ) | (55.1 | ) | 2.8 | (83.5 | ) | ||||||
Net (loss) income attributed to common shareholders | (30.4 | ) | (0.8 | ) | (55.1 | ) | 2.8 | (83.5 | ) | ||||||
Basic and diluted (loss) income per share | $ | (0.36 | ) | $ | (0.01 | ) | $ | (0.61 | ) | $ | 0.03 | $ | (0.95 | ) | |
IN MILLIONS, except per share amounts | |||||||||||||||
2016 | |||||||||||||||
First Quarter | Second Quarter | Third Quarter | Fourth Quarter | Total | |||||||||||
Revenue | $ | 117.8 | $ | 130.1 | $ | 143.8 | $ | 137.4 | $ | 529.1 | |||||
Operating income | 17.9 | 21.1 | 18.8 | 12.7 | 70.5 | ||||||||||
Net income | 5.6 | 9.1 | 4.4 | 0.8 | 19.9 | ||||||||||
Net income attributed to common stockholders | 5.6 | 9.1 | 4.4 | 0.8 | 19.9 | ||||||||||
Basic and diluted income per share | $ | 0.07 | $ | 0.11 | $ | 0.05 | $ | 0.01 | $ | 0.24 | |||||
112
ITEM 9. | CHANGES IN AND DISAGREEMENTS WITH ACCOUNTANTS ON ACCOUNTING AND FINANCIAL DISCLOSURE |
None.
ITEM 9A. CONTROLS AND PROCEDURES
Conclusion Regarding the Effectiveness of Disclosure Controls and Procedures
Under the supervision and with the participation of our management, including our Chief Executive Officer and the Chief Financial Officer (our principal executive officer and principal financial officer, respectively), we have evaluated our disclosure controls and procedures (as defined in Rules 13a-15(e) and 15d-15(e) under the Securities Exchange Act of 1934, as amended (the Exchange Act)) as of December 31, 2017. Based upon that evaluation, the Chief Executive Officer and the Chief Financial Officer have concluded that, as of December 31, 2017, the Company’s disclosure controls and procedures were effective in ensuring information required to be disclosed by the Company in reports that it files or submits under the Securities Exchange Act of 1934 is recorded, processed, summarized and reported within the time periods specified in the rules and forms of the SEC and is accumulated and communicated to the Company’s management, including the Chief Executive Officer and Chief Financial Officer, as appropriate to allow timely decisions regarding required disclosure.
Management’s Annual Report on Internal Control Over Financial Reporting
Management is responsible for establishing and maintaining adequate internal control over financial reporting. Under the supervision and with the participation of management, including the Chief Executive Officer and Chief Financial Officer, management assessed the effectiveness of internal control over financial reporting as of December 31, 2017 based on the Internal Control-Integrated Framework (2013) issued by the Committee of Sponsoring Organizations of the Treadway Commission. Based on that assessment, management has concluded that our internal control over financial reporting was effective at December 31, 2017, to provide reasonable assurance regarding the reliability of our financial reporting and the preparation of our financial statements for external purposes in accordance with U.S. generally accepted accounting principles. Due to its inherent limitations, internal control over financial reporting may not prevent or detect misstatements.
Deloitte & Touche LLP, our independent registered public accounting firm, has audited our financial statements included in this Annual Report on Form 10-K and has issued its attestation report on the effectiveness of our internal control over financial reporting as of December 31, 2017.
Changes in Internal Control Over Financial Reporting
There has been no change in our internal control over financial reporting during the fourth quarter ended December 31, 2017, that has materially affected, or is reasonably likely to materially affect, our internal control over financial reporting.
113
ITEM 9B. OTHER INFORMATION
Not applicable.
PART III
Item 10. Directors, Executive Officers and Corporate Governance
The information required by this item can be found in the Proxy Statement for the 2018 Annual Meeting of Shareholders and is incorporated herein by reference.
The Company has a Code of Business Conduct and Ethics that applies to all employees, including the Company’s principal executive officer, principal financial officer, and principal accounting officer, as well as to the members of the Board of Directors of the Company. The code is available at investor.cyrusone.com/corporate-governance.cfm. The Company intends to disclose any changes in, or waivers from, this code by posting such information on the same website or by filing a Form 8-K, in each case to the extent such disclosure is required by rules of the SEC or NASDAQ.
Items 11. Executive Compensation
The information required by this item can be found in the Proxy Statement for the 2018 Annual Meeting of Shareholders and is incorporated herein by reference.
Items 12. Security Ownership of Certain Beneficial Owners and Management and Related Stockholder Matters
The information required by this item can be found in the Proxy Statement for the 2018 Annual Meeting of Shareholders and is incorporated herein by reference.
Item 13. Certain Relationships and Related Transactions, and Director Independence
The information required by this item can be found in the Proxy Statement for the 2018 Annual Meeting of Shareholders and is incorporated herein by reference.
Item 14. Principal Accountant Fees and Services
The information required by this item can be found in the Proxy Statement for the 2018 Annual Meeting of Shareholders and is incorporated herein by reference.
PART IV
ITEM 15. EXHIBITS, FINANCIAL STATEMENT SCHEDULES
(a)Consolidated Financial Statements and Schedules. The following consolidated financial statements and schedules are included in this report:
(1)FINANCIAL STATEMENTS
The response to this portion of Item 15 is submitted under Item 8 of this Annual Report on Form 10-K.
(2)FINANCIAL STATEMENT SCHEDULES
Schedule II—Valuation and Qualifying Accounts
Schedule III—Consolidated Real Estate and Accumulated Depreciation. The response to this portion of Item 15 is required to be filed by Item 8 of this Annual Report on Form 10-K.
All other schedules for which provision is made in the applicable accounting regulations of the SEC are not required under the related instructions or are inapplicable and therefore have been omitted.
(3)EXHIBITS
Exhibits may be obtained from us upon request at a charge that reflects the reproduction cost of such Exhibits. Requests should be made to the Secretary of CyrusOne Inc., 2101 Cedar Springs Road, Suite 900, Dallas, Texas 75201. Exhibits are also available, free of charge, on the SEC's website at www.sec.gov.
114
Schedule II.
Valuation and Qualifying Accounts
Beginning | Charge | (Deductions)/ | End | |||||||||
(dollars in millions) | of Period | to Expenses | Additions | of Period | ||||||||
Allowance for Doubtful Accounts | ||||||||||||
2017 | $ | 2.1 | $ | 0.2 | $ | (0.2 | ) | $ | 2.1 | |||
2016 | 1.0 | 1.6 | (0.5 | ) | 2.1 | |||||||
2015 | 1.0 | — | — | 1.0 | ||||||||
Deferred Tax Valuation Allowance | ||||||||||||
2017 | $ | 6.5 | $ | 0.7 | $ | — | $ | 7.2 | ||||
2016 | 6.3 | 0.2 | — | 6.5 | ||||||||
2015 | 5.7 | 0.6 | — | 6.3 | ||||||||
115
Schedule III. Real Estate Properties and Accumulated Depreciation
CyrusOne Inc. | As of December 31, 2017 | ||||||||||||||||||||||||||||||
(dollars in millions) | Initial Costs | Cost Capitalized Subsequent to Acquisition | Gross Carrying Amount | ||||||||||||||||||||||||||||
Description | Land | Building and Improvements | Equipment | Land | Building and Improvements | Equipment | Land | Building and Improvements | Equipment | Accumulated Depreciation | Acquisition | ||||||||||||||||||||
Dallas - Carrollton | $ | 16.1 | $ | — | $ | — | $ | — | $ | 61.8 | $ | 210.7 | $ | 16.1 | $ | 61.8 | $ | 210.7 | $ | 76.7 | 2012 | ||||||||||
Houston - Houston West I | 1.4 | 21.4 | 0.1 | — | 63.8 | 49.7 | 1.4 | 85.2 | 49.8 | 73.7 | 2010 | ||||||||||||||||||||
Cincinnati - 7th Street | 0.9 | 42.2 | — | — | 68.4 | 33.1 | 0.9 | 110.6 | 33.1 | 86.5 | 1999 | ||||||||||||||||||||
Dallas - Lewisville | — | 46.2 | 2.2 | — | 30.5 | 35.2 | — | 76.7 | 37.4 | 62.0 | 2010 | ||||||||||||||||||||
Northern Virginia - Sterling II | — | — | — | — | 28.8 | 112.3 | — | 28.8 | 112.3 | 16.4 | 2013 | ||||||||||||||||||||
Somerset I | 12.1 | 124.6 | 83.3 | — | 0.2 | 0.4 | 12.1 | 124.8 | 83.7 | 12.2 | 2017 | ||||||||||||||||||||
Chicago - Aurora I | 2.4 | 26.0 | 97.3 | — | 6.4 | 27.7 | 2.4 | 32.4 | 125.0 | 24.0 | 2016 | ||||||||||||||||||||
Totowa - Madison | — | 28.3 | 45.6 | — | 0.2 | 9.5 | — | 28.5 | 55.1 | 20.4 | 2015 | ||||||||||||||||||||
Cincinnati - North Cincinnati | 4.0 | 12.3 | — | 65.1 | 9.9 | 4.0 | 77.4 | 9.9 | 37.0 | 2008 | |||||||||||||||||||||
San Antonio III | — | — | — | — | 40.3 | 96.8 | — | 40.3 | 96.8 | 9.0 | 2017 | ||||||||||||||||||||
Houston - Houston West II | 2.0 | — | — | 0.8 | 22.8 | 50.1 | 2.8 | 22.8 | 50.1 | 28.0 | 2013 | ||||||||||||||||||||
Wappingers Falls I | — | 9.9 | 13.3 | — | 1.4 | 4.7 | — | 11.3 | 18.0 | 9.5 | 2015 | ||||||||||||||||||||
San Antonio I | 4.6 | 3.0 | — | — | 28.7 | 34.8 | 4.6 | 31.7 | 34.8 | 26.2 | 2011 | ||||||||||||||||||||
Phoenix - Chandler II | — | — | — | — | 16.2 | 38.9 | — | 16.2 | 38.9 | 15.6 | 2014 | ||||||||||||||||||||
Northern Virginia - Sterling I | 6.9 | — | — | 0.1 | 20.0 | 59.4 | 7.0 | 20.0 | 59.4 | 18.1 | 2013 | ||||||||||||||||||||
Raleigh-Durham I | 2.1 | 73.5 | 71.3 | — | 4.5 | 4.7 | 2.1 | 78.0 | 76.0 | 9.8 | 2017 | ||||||||||||||||||||
Houston - Galleria | — | 56.0 | 2.0 | — | 12.6 | 15.6 | — | 68.6 | 17.6 | 49.1 | 2010 | ||||||||||||||||||||
Phoenix - Chandler I | 14.8 | — | — | — | 58.2 | 65.9 | 14.8 | 58.2 | 65.9 | 36.5 | 2011 | ||||||||||||||||||||
Phoenix - Chandler III | — | 0.9 | 2.5 | — | 10.5 | 47.5 | — | 11.4 | 50.0 | 6.4 | 2016 | ||||||||||||||||||||
Northern Virginia - Sterling III | — | — | — | — | 22.2 | 61.3 | — | 22.2 | 61.3 | 6.2 | 2017 | ||||||||||||||||||||
Austin II | 2.0 | — | — | — | 23.4 | 7.0 | 2.0 | 23.4 | 7.0 | 14.5 | 2011 | ||||||||||||||||||||
San Antonio II | 6.7 | — | — | 0.3 | 29.0 | 60.4 | 7.0 | 29.0 | 60.4 | 10.4 | 2013 | ||||||||||||||||||||
Florence | 2.2 | 7.7 | — | — | 34.3 | 5.3 | 2.2 | 42.0 | 5.3 | 28.5 | 2005 | ||||||||||||||||||||
Phoenix - Chandler IV | — | — | — | — | 18.3 | 40.9 | — | 18.3 | 40.9 | 2.2 | 2017 | ||||||||||||||||||||
Cincinnati - Hamilton | — | 9.5 | — | — | 40.7 | 6.0 | — | 50.2 | 6.0 | 36.2 | 2007 | ||||||||||||||||||||
London - Great Bridgewater | — | 16.5 | — | — | 11.9 | 1.1 | — | 28.4 | 1.1 | 3.8 | 2011 | ||||||||||||||||||||
Northern Virginia - Sterling IV | 4.6 | 9.6 | 0.1 | — | 10.4 | 73.6 | 4.6 | 20.0 | 73.7 | 5.6 | 2016 | ||||||||||||||||||||
Cincinnati - Mason | — | — | — | — | 20.3 | 1.6 | — | 20.3 | 1.6 | 13.8 | 2004 | ||||||||||||||||||||
Dallas - Midway | — | 1.8 | — | — | 0.2 | 0.4 | — | 2.0 | 0.4 | 2.3 | 2010 | ||||||||||||||||||||
Phoenix - Chandler VI | 10.5 | — | — | — | 15.7 | 49.2 | 10.5 | 15.7 | 49.2 | 1.3 | 2016 | ||||||||||||||||||||
Stamford - Riverbend* | — | 4.3 | 13.2 | — | (1.4 | ) | (6.3 | ) | — | 2.9 | 6.9 | 3.2 | 2015 | ||||||||||||||||||
Norwalk I* | — | 18.3 | 25.3 | — | (4.8 | ) | (15.9 | ) | — | 13.5 | 9.4 | 2.9 | 2015 | ||||||||||||||||||
Dallas - Marsh | — | — | — | — | 0.1 | 0.6 | — | 0.1 | 0.6 | 0.6 | 2010 | ||||||||||||||||||||
Chicago - Lombard | 0.7 | 3.2 | — | — | 1.5 | 7.7 | 0.7 | 4.7 | 7.7 | 6.0 | 2008 | ||||||||||||||||||||
Stamford - Omega* | — | 3.2 | 0.6 | — | (0.6 | ) | 0.1 | — | 2.6 | 0.7 | 0.5 | 2015 | |||||||||||||||||||
Totowa - Commerce | — | 4.1 | 0.8 | — | — | 0.8 | — | 4.1 | 1.6 | 0.9 | 2015 | ||||||||||||||||||||
Cincinnati - Blue Ash* | — | 2.6 | — | — | (1.9 | ) | 0.2 | — | 0.7 | 0.2 | 0.4 | 2009 | |||||||||||||||||||
South Bend - Crescent | — | 1.1 | — | — | 0.6 | 0.1 | — | 1.7 | 0.1 | 1.8 | 2008 | ||||||||||||||||||||
Houston - Houston West III | 18.3 | — | — | 0.1 | 17.9 | 30.7 | 18.4 | 17.9 | 30.7 | 5.9 | 2013 | ||||||||||||||||||||
Singapore - Inter Business Park* | — | 9.0 | — | — | (9.0 | ) | — | — | — | — | — | 2011 | |||||||||||||||||||
South Bend - Monroe | — | — | — | — | 2.5 | 0.3 | — | 2.5 | 0.3 | 1.6 | 2007 | ||||||||||||||||||||
Cincinnati - Goldcoast* | 0.6 | — | — | (0.4 | ) | 4.0 | 0.1 | 0.2 | 4.0 | 0.1 | 3.0 | 2007 | |||||||||||||||||||
Austin III | 3.3 | — | — | — | 10.6 | 33.9 | 3.3 | 10.6 | 33.9 | 6.8 | 2015 | ||||||||||||||||||||
Northern Virginia - Sterling V | 24.1 | — | — | — | 35.7 | 108.8 | 24.1 | 35.7 | 108.8 | 4.1 | 2016 | ||||||||||||||||||||
Phoenix - Chandler V | — | — | — | — | 5.9 | 20.5 | — | 5.9 | 20.5 | 0.3 | 2017 | ||||||||||||||||||||
San Antonio IV | — | — | — | — | — | 17.9 | — | — | 17.9 | 0.9 | 2017 | ||||||||||||||||||||
Austin Land A | 7.9 | — | — | 0.1 | — | 0.2 | 8.0 | — | 0.2 | 0.1 | 2013 | ||||||||||||||||||||
Chicago - Aurora II | 2.6 | — | — | — | 8.3 | 42.9 | 2.6 | 8.3 | 42.9 | 1.5 | 2016 | ||||||||||||||||||||
Chicago - Aurora Land B | 5.1 | — | — | — | — | — | 5.1 | — | — | — | 2016 | ||||||||||||||||||||
Dallas - Allen | 12.0 | — | — | — | — | — | 12.0 | — | — | — | 2017 | ||||||||||||||||||||
116
(dollars in millions) | Initial Costs | Cost Capitalized Subsequent to Acquisition | Gross Carrying Amount | ||||||||||||||||||||||||||||
Description | Land | Building and Improvements | Equipment | Land | Building and Improvements | Equipment | Land | Building and Improvements | Equipment | Accumulated Depreciation | Acquisition | ||||||||||||||||||||
Quincy Land A | 3.1 | — | — | — | — | — | 3.1 | — | — | — | 2017 | ||||||||||||||||||||
Atlanta I | 5.1 | — | — | — | — | — | 5.1 | — | — | — | 2017 | ||||||||||||||||||||
$ | 176.1 | $ | 535.2 | $ | 357.6 | $ | 1.0 | $ | 836.2 | $ | 1,456.3 | $ | 177.1 | $ | 1,371.4 | $ | 1,813.9 | $ | 782.4 | ||||||||||||
The aggregate cost of the total properties for federal income tax purposes was $4,257.7 million at December 31, 2017. In addition, Construction in progress was $478.4 million as we continue to build data center facilities.
* Reductions in Cost Capitalized Subsequent to Acquisition due to impairment losses recorded for the respective facility.
117
Historical Cost and Accumulated Depreciation and Amortization
The following table reconciles the historical cost and accumulated depreciation for the years ended December 31, 2017, 2016 and 2015.
Years Ended December 31, | |||||||||
(amounts in millions) | 2017 | 2016 | 2015 | ||||||
Property | |||||||||
Balance—beginning of period | $ | 2,601.6 | $ | 1,827.6 | $ | 1,378.4 | |||
Disposals | (3.4 | ) | (12.0 | ) | (7.0 | ) | |||
Impairments | (71.8 | ) | (4.9 | ) | (9.3 | ) | |||
Additions (acquisitions and improvements) | 1,314.4 | 790.9 | 465.5 | ||||||
Balance, end of period | $ | 3,840.8 | $ | 2,601.6 | $ | 1,827.6 | |||
Accumulated Depreciation | |||||||||
Balance—beginning of period | $ | 578.5 | $ | 435.6 | $ | 327.0 | |||
Disposals | (1.9 | ) | (7.9 | ) | (2.7 | ) | |||
Impairments | (14.1 | ) | — | — | |||||
Additions (depreciation and amortization expense) | 219.9 | 150.8 | 111.3 | ||||||
Balance, end of period | $ | 782.4 | $ | 578.5 | $ | 435.6 | |||
118
The exhibits required by Item 601 of Regulation S-K are listed below:
Exhibit No. | Exhibit Description |
10.6† | |
119
120
121
12.1+ | |
21.1+ | |
23.1+ | |
31.1+ | |
31.2+ | |
32.1+ | |
32.2+ | |
(101.INS)* | XBRL Instance Document. |
(101.SCH)* | XBRL Taxonomy Extension Schema Document. |
(101.CAL)* | XBRL Taxonomy Extension Calculation Linkbase Document. |
(101.DEF)* | XBRL Taxonomy Extension Definition Linkbase Document. |
(101.LAB)* | XBRL Taxonomy Extension Label Linkbase Document. |
(101.PRE)* | XBRL Taxonomy Extension Presentation Linkbase Document. |
+ | Filed herewith. |
* | Submitted electronically with this report. |
† | This exhibit is a management contract or compensation plan or arrangement. |
122
SIGNATURES
Pursuant to the requirements of Section 13 or 15(d) of the Securities Exchange Act of 1934, the registrant has duly caused this report to be signed on its behalf by the undersigned thereunto duly authorized, on the 22nd day of February, 2018.
CyrusOne Inc. | |||
By: | /s/ Gary J. Wojtaszek | ||
Gary J. Wojtaszek | |||
President, Chief Executive Officer, and Director | |||
By: | /s/ Diane M. Morefield | ||
Diane M. Morefield | |||
Executive Vice President and Chief Financial Officer | |||
By: | /s/ Amitabh Rai | ||
Amitabh Rai | |||
Senior Vice President and Chief Accounting Officer | |||
123
Pursuant to the requirements of the Securities Exchange Act of 1934, this report has been signed below by the following persons on behalf of the registrant and in the capacities and on the date indicated.
Signature | Title | Date | ||
/s/ Gary J. Wojtaszek | President, Chief Executive Officer | February 22, 2018 | ||
Gary J. Wojtaszek | and Director | |||
/s/ Alex Shumate | Chairman of the Board of Directors | February 22, 2018 | ||
Alex Shumate | ||||
/s/ David H. Ferdman | Director | February 22, 2018 | ||
David H. Ferdman | ||||
/s/ John W. Gamble Jr. | Director | February 22, 2018 | ||
John W. Gamble Jr. | ||||
/s/ Michael A. Klayko | Director | February 22, 2018 | ||
Michael A. Klayko | ||||
/s/ T. Tod Nielsen | Director | February 22, 2018 | ||
T. Tod Nielsen | ||||
/s/ William E. Sullivan | Director | February 22, 2018 | ||
William E. Sullivan | ||||
/s/ Lynn Wentworth | Director | February 22, 2018 | ||
Lynn Wentworth | ||||
124