Attached files
| file | filename |
|---|---|
| EX-32.1 - EX-32.1 - ZYNGA INC | znga-ex321_9.htm |
| EX-31.2 - EX-31.2 - ZYNGA INC | znga-ex312_10.htm |
| EX-31.1 - EX-31.1 - ZYNGA INC | znga-ex311_8.htm |
| EX-23.1 - EX-23.1 - ZYNGA INC | znga-ex231_7.htm |
| EX-21.1 - EX-21.1 - ZYNGA INC | znga-ex211_6.htm |
UNITED STATES
SECURITIES AND EXCHANGE COMMISSION
Washington, D.C. 20549
FORM 10-K
|
☒ |
ANNUAL REPORT PURSUANT TO SECTION 13 OR 15(d) OF THE SECURITIES EXCHANGE ACT OF 1934 |
For the fiscal year ended December 31, 2017
OR
|
☐ |
TRANSITION REPORT PURSUANT TO SECTION 13 OR 15(d) OF THE SECURITIES EXCHANGE ACT OF 1934 |
For the transition period from to
Commission File Number: 001-35375
Zynga Inc.
(Exact Name of Registrant as Specified in Its Charter)
|
Delaware |
|
42-1733483 |
|
(State or Other Jurisdiction of Incorporation or Organization) |
|
(I.R.S. Employer Identification Number) |
|
|
|
|
|
699 Eighth Street San Francisco, CA (Address of principal executive offices) |
|
94103 (Zip Code) |
(855) 449-9642
(Registrant’s telephone number, including area code)
Securities registered pursuant to Section 12(b) of the Act:
|
Title of each class: |
|
Name of each exchange on which registered: |
|
Class A Common Stock, par value $0.00000625 per share |
|
The Nasdaq Global Select Market |
Securities registered pursuant to Section 12(g) of the Act:
None
Indicate by check mark if the registrant is a well-known seasoned issuer, as defined in Rule 405 of the Securities Act. Yes ☒ No ☐
Indicate by check mark if the registrant is not required to file reports pursuant to Section 13 or 15(d) of the Act. Yes ☐ No ☒
Indicate by check mark whether the registrant (1) has filed all reports required to be filed by Section 13 or 15(d) of the Securities Exchange Act of 1934 during the preceding 12 months (or for such shorter period that the registrant was required to file such reports), and (2) has been subject to such filing requirements for the past 90 days. Yes ☒ No ☐
Indicate by check mark whether the registrant has submitted electronically and posted on its corporate Web site, if any, every Interactive Data File required to be submitted and posted pursuant to Rule 405 of Regulation S-T (§ 232.405 of this chapter) during the preceding 12 months (or for such shorter period that the registrant was required to submit and post such files). Yes ☒ No ☐
Indicate by check mark if disclosure of delinquent filers pursuant to Item 405 of Regulation S-K (§ 229.405 of this chapter) is not contained herein, and will not be contained, to the best of registrant’s knowledge, in definitive proxy or information statements incorporated by reference in Part III of this Form 10-K or any amendment to this Form 10-K. ☐
Indicate by check mark whether the registrant is a large accelerated filer, an accelerated filer, a non-accelerated filer, a smaller reporting company, or an emerging growth company. See the definitions of “large accelerated filer,” “accelerated filer”, “smaller reporting company”, and “emerging growth company” in Rule 12b-2 of the Exchange Act. (Check one):
|
Large accelerated filer |
☒ |
|
Accelerated filer |
☐ |
|
Non-accelerated filer |
☐ |
(Do not check if a smaller reporting company) |
Smaller reporting company |
☐ |
Emerging growth company ☐
If an emerging growth company, indicate by check mark if the registrant has elected to not use the extended transition period for complying with any new or reviewed financial accounting standards provided pursuant to Section 13(a) of the Exchange Act. ☐
Indicate by check mark whether the registrant is a shell company (as defined in Exchange Act Rule 12b-2). Yes ☐ No ☒
The aggregate market value of the voting stock held by non-affiliates of the registrant on June 30, 2017, based upon the closing price of $3.64 of the registrant’s Class A Common Stock as reported on the NASDAQ Global Select Market, was approximately $2.833 billion, which excludes 87.3 million shares of the registrant’s common stock held on June 30, 2017 by then current executive officers, directors, and stockholders that the registrant has concluded are affiliates of the registrant.
As of January 31, 2018, there were 784,145,281 shares of the registrant’s Class A common stock outstanding, 66,733,744 shares of the registrant’s Class B common stock outstanding and 20,517,472 shares of the registrant’s Class C common stock outstanding.
DOCUMENTS INCORPORATED BY REFERENCE
Portions of the registrant’s Proxy Statement for the 2018 Annual Meeting of Stockholders are incorporated herein by reference in Part III of this Annual Report on Form 10-K to the extent stated herein. The proxy statement will be filed with the Securities and Exchange Commission within 120 days of the registrant’s fiscal year ended December 31, 2017.
Form 10-K
For the Fiscal Year Ended December 31, 2017
|
|
|
Page |
|
|
|
|
|
|
|
|
|
Item 1. |
2 |
|
|
Item 1A. |
6 |
|
|
Item 1B. |
24 |
|
|
Item 2. |
24 |
|
|
Item 3. |
24 |
|
|
Item 4. |
24 |
|
|
|
|
|
|
|
|
|
|
Item 5. |
25 |
|
|
Item 6. |
27 |
|
|
Item 7. |
Management’s Discussion and Analysis of Financial Condition and Results of Operations |
29 |
|
Item 7A. |
48 |
|
|
Item 8. |
49 |
|
|
Item 9. |
Changes in and Disagreements with Accountants on Accounting and Financial Disclosure |
85 |
|
Item 9A. |
85 |
|
|
Item 9B. |
85 |
|
|
|
|
|
|
|
|
|
|
Item 10. |
86 |
|
|
Item 11. |
86 |
|
|
Item 12. |
Security Ownership of Certain Beneficial Owners and Management and Related Stockholder Matters |
86 |
|
Item 13. |
Certain Relationships and Related Transactions, and Director Independence |
86 |
|
Item 14. |
86 |
|
|
|
|
|
|
|
|
|
|
Item 15. |
87 |
|
|
|
|
|
|
|
90 |
Zynga, the Zynga logo and other trademarks or service marks of Zynga appearing in this report are the property of Zynga. Trade names, trademarks and service marks of other companies appearing in this report are the property of their respective holders.
References in this report to “DAUs” mean daily active users of our games, “MAUs” mean monthly active users of our games, “MUUs” mean monthly unique users of our games, “ABPU” means average daily bookings per average DAU and “MUPs” mean monthly unique payers in our games. Unless otherwise indicated, these metrics are based on internally-derived measurements across all platforms on which our games are played. For further information about ABPU, DAUs, MAUs, MUPs, and MUUs as measured by us, see the section titled “Management’s Discussion and Analysis of Financial Condition and Results of Operations—Key Metrics.”
CAUTIONARY NOTE ABOUT FORWARD-LOOKING STATEMENTS
This Annual Report on Form 10-K contains forward looking statements reflecting our current expectations that involve risks and uncertainties. These forward-looking statements include, but are not limited to, statements related to industry prospects, our future economic performance including anticipated revenues and expenditures, results of operations or financial position, and other financial items, our business plans and objectives, including our growth strategies and intended product releases, and may include certain assumptions that underlie the forward-looking statements. Forward-looking statements often include words such as “outlook,” “projected,” “intends,” “will,” “anticipate,” “believe,” “target,” “expect,” and statements in the future tense are generally forward-looking.
We have based these forward-looking statements largely on our current expectations and projections about future events and trends that we believe may affect our financial condition, results of operations, business strategy, short-term and long-term business operations and objectives, and financial needs. The achievement or success of the matters covered by such forward-looking statements involves significant risks, uncertainties and assumptions, including those described in “Part I. Item 1A. Risk Factors” of this Annual Report on Form 10-K. Moreover, we operate in a very competitive and rapidly changing environment and industry. New risks may also emerge from time to time. It is not possible for our management to predict all of the risks related to our business and operations, nor can we assess the impact of all factors on our business or the extent to which any factor, or combination of factors, may cause actual results to differ materially from those contained in any forward-looking statements we may make. In light of these risks, uncertainties and assumptions, the forward-looking events and circumstances discussed in this Annual Report on Form 10-K may not occur and actual results could differ materially and adversely from those anticipated, predicted or implied in the forward-looking statements.
Although we believe that the expectations reflected in the forward-looking statements are reasonable, we cannot guarantee that the future results, levels of activity, performance or events and circumstances reflected in the forward-looking statements will be achieved or occur, and reported results should not be considered as an indication of future performance. Given these risks and uncertainties, readers are cautioned not to place undue reliance on such forward-looking statements.
Except as required by law, we undertake no obligation to update any forward-looking statements for any reason to conform these statements to actual results or to changes in our expectations.
1
Overview
Zynga Inc. (“Zynga” or “we” or the “Company”) is a leading provider of social game services. We develop, market and operate social games as live services played on mobile platforms such as Apple’s iOS operating system (“iOS”) and Google’s Android operating system (“Android”) and on social networking sites such as Facebook. Generally, all of our games are free to play, and we generate revenue through the sale of in-game virtual goods (“online game revenue”) and advertising services (“advertising revenue”).
We are a pioneer and innovator of social games and a leader in making “play” a core activity on mobile devices and social networking sites. We believe our leadership position in social games is the result of our significant investment in our people, content, brand, technology and infrastructure. Our leadership position in social games is defined by the following:
|
|
• |
Engaged and Global Community of Players. According to our internal analytics system, in 2017, we had 80 million monthly active users (“MAUs”), of which 89% were mobile MAUs, and 21 million daily active users (“DAUs”), of which 90% were mobile DAUs. |
|
|
• |
Leading Portfolio of Social Games. We have developed a number of popular social games including CSR Racing 2, FarmVille, Words With Friends and Zynga Poker, as well as our Slots portfolio of games. |
|
|
• |
Scalable Technology and Data. We leverage our technology to increase player engagement, cross-promote our portfolio of games, continually enhance existing games, launch new games and build the Zynga brand. We believe our scale results in network effects that deliver compelling value to our players, and we are committed to making significant investments to grow our community of players, their engagement and monetization over time. We believe that combining data analytics with creative game design enables us to create a superior player experience. |
Consistent with our free-to-play business model, a small portion of our players have historically been payers. Because the opportunity for social interactions increases as the number of players increases, we believe that maintaining and growing our overall number of players, including the number of players who may not purchase virtual goods, is important to the success of our business. As a result, we believe that the number of players who choose to purchase virtual goods will continue to constitute a small portion of our overall players.
Our top three online game revenue-generating games historically have contributed a significant portion of our revenue, though the games that represent our top three online game revenue-generating games vary over time. Our top three online game revenue-generating games accounted for 45%, 44% and 53% of our online game revenue in 2017, 2016 and 2015, respectively. In 2017, our top three online game revenue-generating games were Zynga Poker, CSR Racing 2 and Hit It Rich! Slots. With respect to advertising and other revenue, our Words with Friends games generated a substantial portion of our advertising and other revenue in 2017, 2016 and 2015.
Our operations are headquartered in San Francisco, California, and we have several operating locations in the U.S. as well as various international office locations in North America, Asia and Europe. We were originally organized in April 2007 and completed our initial public offering in December 2011. Our Class A common stock is listed on the NASDAQ Global Select Market under the symbol “ZNGA.”
Our Mission & Strengths
Our mission is to connect the world through games. We pursue that mission in the following ways:
|
|
• |
A galvanizing company vision. We believe that our vision for social gaming distinguishes us from others in the market. Zynga was founded with the simple premise that it is more fun to play games with other people and that social gaming is the best path to the mass market. Our approach is to build games around social features and systems to deliver a higher quality player experience with increased levels of engagement, organic acquisition and long-term retention. |
|
|
• |
Proven brands in popular genres. We believe that we have a portfolio of established brands such as CSR Racing 2, FarmVille, Hit it Rich! Slots, Words With Friends and Zynga Poker in some of the fastest growing mobile gaming categories including Action Strategy, Casual, Social Casino and Invest Express. We are committed to leveraging our experience in live services to grow our existing portfolio of games and introduce new intellectual property in these categories. |
2
|
|
• |
Talented teams and strong analytics. We have passionate teams of people focused on increasing the effectiveness and predictability of our live game services and new game development. Our teams balance the art and science of game making by combining creative innovation with a player-centric, data driven approach to surprise and delight players. |
Our Leading Portfolio of Social Games
Our strategy is focused on growing and creating games that we believe will stand the test of time and have the potential to engage players for years as enduring entertainment brands. Our portfolio includes:
|
|
• |
CSR Racing 2 – a visually stunning, fast-paced racing game allowing players to customize their collection of supercars and race against their friends. |
|
|
• |
Farmville – our FarmVille games deliver players a free-to-play web and mobile experience where they can invest in a world all their own and express themselves by building, expanding and nurturing their own virtual farm. |
|
|
• |
Slots – our free-to-play portfolio of slots games deliver players authentic, Vegas-style mobile gameplay with a diverse mix of popular entertainment brands. |
|
|
• |
Words With Friends – features friendly competition and allows our players to quickly connect with their friends and family, while also providing the opportunity to build relationships throughout the game experience. |
|
|
• |
Zynga Poker – allows our players to experience the thrill of the win as they compete against friends and family in one of their favorite casino card games. |
Our Network
We believe it is more fun for players to engage in our games with their friends and family. Players also progress faster in our games by connecting with their friends and other players in our network to instantly get what they need to complete quests, obtain virtual items and enhance their experience. We aspire to leverage our existing and new games to bring the best social playing experiences to our audience. Our network enables users to discover new games, find and connect with new friends, and challenge, cooperate and compete with their friends, all of which drive higher user engagement for games on our network.
Our Revenues
We generate revenue from the following services:
Virtual Goods and Paid Downloads
Our primary revenue source is the sale of virtual currency that players use to buy in-game virtual goods. Virtual currency can also be earned for free through by the player game play or by accepting promotional offers from our advertising partners. We also generate revenue when players purchase mobile game downloads.
Advertising and Licensing
Our advertising services offer creative ways for marketers and advertisers to reach and engage with our players while allowing continued operation of a free-to-play business model. Our advertising offerings include:
|
|
• |
Mobile Ads in our mobile games that include banner and interstitial advertisements; |
|
|
• |
Display Ads in our online web games that include banner advertisements; |
|
|
• |
Engagement Ads and Offers in which players can answer certain questions, watch-to-earn engagements or sign up for third party services to receive virtual currency and in-game bonuses; |
|
|
• |
Branded Virtual Goods and Sponsorships that integrate relevant advertising and messaging within game play; |
|
|
• |
Licensing our brands. |
The goal of our advertisement offerings are to enhance the player experience while delivering real value to advertisers.
3
Marketing and Distribution
We acquire our players through unpaid channels by cross-promoting new games to our existing audience and through paid advertising channels. We have been able to build a large community of players through the viral and sharing features provided by social networks, the social innovations in our games and the network effects of our games. We also advertise our games within other mobile applications and on social networks such as Facebook via various in-app advertising partners. In 2017, 2016 and 2015 we spent $147.2 million, $132.5 million and $128.9 million, respectively, on these player acquisition costs.
Agreements with Apple, Google and Facebook
Our revenue depends on our continued ability to publish our games on mobile platforms, primarily iOS and Android, and on social networking sites, primarily Facebook. In 2017, we derived 51% of our revenue and bookings from Apple, 33% of our revenue and 34% of our bookings from Google and 12% of our revenue and 11% of our bookings from Facebook. In 2017, an increasing number of our players played our games on mobile platforms.
Our use of mobile platforms and data derived from mobile platforms is governed by the standard terms of service of the mobile platforms, primarily Apple and Google. Our use of the Facebook platform and data derived from Facebook is also governed by Facebook’s standard terms of service except for certain limited addenda. Any of these operators could unilaterally alter their terms of service in a manner that could harm our business.
Research and Development
We believe continued investment in enhancing existing games and developing new games, and in software development tools and code modification, is important to attaining our strategic objectives. Our research and development expenses were $256.0 million, $320.3 million and $361.9 million in 2017, 2016 and 2015, respectively, which included stock-based compensation expense of $42.2 million, $84.2 million and $94.5 million, respectively, for research and development personnel.
Technology and Tools
We have invested extensively in developing our proprietary technology stack, which has the ability to handle sudden bursts of activity for millions of players over a short period of time with high levels of performance and reliability. Our proprietary technology stack includes cloud computing management, a shared code base, network and cross-promotional features and proprietary data analytics. Our technology stack also supports the growth of our 2D and 3D game engines across our mobile games in addition to supporting high-level security and anti-fraud infrastructure. We are also investing in machine learning. We believe that investing in technology and tools can create competitive advantages as well as extend our technology leadership. We will continue to innovate and optimize across our technology and tools to deliver cost-effective, high performance and highly available social games.
Intellectual Property
Our business is significantly based on the creation, acquisition, use and protection of intellectual property. Some of this intellectual property is in the form of software code, patented technology and trade secrets that we use to develop our games and to enable them to run properly on multiple platforms. Other intellectual property we create includes product and feature names and audio-visual elements, including graphics, music, story lines and interface design.
While most of the intellectual property we use is created by us, we have also acquired rights to proprietary intellectual property. We have also obtained rights to use intellectual property through licenses and service agreements with third parties. These licenses typically limit our use of intellectual property to specific uses and for specific time periods.
We protect our intellectual property rights by relying on federal, state and common law protections, as well as contractual restrictions. We actively seek patent protection covering our inventions and we acquire patents we believe may be useful or relevant to our business. We control access to our proprietary technology by entering into confidentiality and invention assignment agreements with our employees and contractors, and confidentiality agreements with third parties. We also actively engage in monitoring and enforcement activities with respect to infringing uses of our trademarks, copyrights and domain names by third parties.
In addition to these contractual arrangements, we also rely on a combination of trade secrets, copyrights, trademarks, trade dress, domain names and patents to protect our games and other intellectual property. We typically own the copyrights to the software code to our content, as well as the trademarks for the brands or titles under which our games are marketed. We pursue the registration of our domain names, copyrights, trademarks, patents, and service marks in the U.S. and, for some, in locations outside the U.S. Our registered trademarks in the U.S. include “Zynga” and the names of our games, among others.
4
Competition
We face significant competition in all aspects of our business. Specifically, we compete for the leisure time, attention and discretionary spending of our players with other social game developers on the basis of a number of factors, including quality of player experience, brand awareness and reputation and access to distribution channels.
We believe we compete favorably on these factors. However, our industry is evolving rapidly and is becoming increasingly competitive. Other developers of social games could develop more compelling content that competes with our social games and adversely affects our ability to attract and retain players and their entertainment time. These competitors, including companies of which we may not be currently aware, may take advantage of social networks, access to a large user base and their network effects to grow rapidly and virally.
Our competitors include:
|
|
• |
Developers for Mobile and Web Games: We face competition from a number of competitors who develop mobile and web games. These competitors, some of which have significant financial, technical and other resources, greater brand recognition and longer operating histories, may create games that appeal to our players. The mobile game sector specifically is characterized by frequent product introductions, rapidly emerging mobile platforms, new technologies and new mobile application storefronts. Some of these competitors include Activision Blizzard (the parent company of King Digital), Aristocrat, DoubleU, Electronic Arts (EA Mobile), Glu Mobile, Jam City, Machine Zone, Netmarble (the parent company of Kabam), Niantic, Playtika, SciGames Interactive, Supercell, Vivendi (the parent company of Gameloft) and others. Because our games are free to play, we compete primarily on the basis of player experience rather than price. We also expect new competitors to enter the market and existing competitors to allocate more resources to develop and market competing games and applications. |
|
|
• |
Other Game Developers: Our players may also play other games on personal computers and consoles, some of which include social features that compete with our social games and have community functions where game developers can engage with their players. Some of these competitors include Activision Blizzard, Disney, Electronic Arts, Nintendo, Riot Games, SEGA, Sony, Take-Two Interactive, and Ubisoft. |
|
|
• |
Other Forms of Media and Entertainment: We compete more broadly for the leisure time and attention of our players with providers of other forms of Internet and mobile entertainment, including social networking, online casual entertainment and music. To the extent existing or potential players choose to read, watch or listen to online content or streaming video or radio, play interactive video games at home or on their computer or mobile devices rather than play social games, these content services pose a competitive threat. |
Government Regulation
We are subject to various federal, state and international laws and regulations that affect companies conducting business on the Internet and mobile platforms, including those relating to privacy, use and protection of player and employee personal information and data (including the collection of data from minors), the Internet, behavioral tracking, mobile applications, content, advertising and marketing activities (including sweepstakes, contests and giveaways), and anti-corruption. Additional laws in all of these areas are likely to be passed in the future, which could result in significant limitations on or changes to the ways in which we can collect, use, host, store or transmit the personal information and data of our customers or employees, communicate with our players, and deliver products and services, and may significantly increase our compliance costs. As our business expands to include new uses or collection of data that are subject to privacy or security regulations, our compliance requirements and costs will increase and we may be subject to increased regulatory scrutiny.
Some of our games and features are based upon traditional casino games, such as slots and poker. We have structured and operate these games and features with gambling laws in mind and believe that these games and features do not constitute gambling. Our games are offered for entertainment purposes only and do not offer an opportunity to win real money.
Seasonality
Approximately 23% of our revenue was derived from the “advertising and other” category in 2017. Advertising budgets are generally highest during the fourth quarter and decline significantly in the first quarter of the following year, which affects the revenues we derive from advertisements in our games. Additionally, we generally experience increases in game downloads and resulting online game revenues in the fourth quarter and first quarter corresponding to increases in smartphone and tablet purchases during the holiday shopping season.
5
Employees
Our future success depends upon the continued service of our key technical and management personnel and upon our ability to continue to attract and retain qualified employees, particularly our senior management team and highly skilled game designers, product managers and engineers. We currently have favorable employee relations, but the competition for technical personnel is intense, and the loss of key employees or the inability to hire such employees when needed could have a material adverse impact on our business and financial condition. As of December 31, 2017, we had 1,555 full-time employees.
Financial Information about Segments and Geographic Areas
We have one operating segment with one business activity, developing and monetizing social games. Financial information about our one segment and geographic areas is incorporated into this section by reference to our consolidated financial statements including Note 15 —“Geographical Information” in the notes to the consolidated financial statements.
Available Information
Our website is located at www.zynga.com and our investor relations website is located at http://investor.zynga.com. We make available (free of charge and available for download) on our investor relations website our Annual Reports on Form 10-K, Quarterly Reports on Form 10-Q, Current Reports on Form 8-K, proxy statements and other Securities and Exchange Commission (“SEC”) filings, and any amendments to those reports and any other filings that we file with or furnish to the SEC as soon as reasonably practicable after they are filed. These reports and filings are also available at the SEC’s website at www.sec.gov and at the SEC’s Public Reference Room at 100 F Street, NE, Washington, D.C. 20549. Information on the operation of the Public Reference Room can be obtained by calling the SEC at 1-800-SEC-0330.
We post an audio version of our earnings calls and may webcast certain events we participate in or host with members of the investment community on our investor relations website. Additionally, we provide notifications of news or announcements regarding our financial performance, including SEC filings, investor events, press and earnings releases as part of our investor relations website. Investors and others can receive notifications of new information posted on our investor relations website in real time by signing up for email alerts and RSS feeds. Further corporate governance information, including our certificate of incorporation, bylaws, governance guidelines, board committee charters and committee memberships, and code of conduct, is also available on our investor relations website under the heading “Corporate Governance.” The contents of our websites are not incorporated by reference into this Annual Report on Form 10-K or in any other report or document we file with the SEC, and any references to our websites are intended to be inactive textual references only.
We have identified the following risks and uncertainties that may have a material adverse effect on our business, financial condition, results of operations or reputation. The risks described below are not the only risks we face. Additional risks not presently known to us or that we currently believe are not material may also significantly affect our business, financial condition, results of operations or reputation. Our business could be harmed by any of these risks. The trading price of our Class A common stock could decline due to any of these risks, and you may lose all or part of your investment. In assessing these risks, you should also refer to the other information contained in this Annual Report on Form 10-K, including our consolidated financial statements and related notes.
Risks Related to Our Business and Industry
Our business will suffer if we are unable to entertain our players, develop new games, improve the experience of our existing games, and successfully monetize our games.
Our business depends on developing, publishing and continuing to service “free-to-play” games that consumers will download and spend time and money playing. We are primarily focused on mobile gaming, offering our games on mobile devices, including smartphones and tablets on Apple’s iOS and Google’s Android operating systems, and on social networking platforms such as Facebook. We have devoted and we expect to continue to devote substantial resources to the research, development, analytics and marketing of our games. Our development and marketing efforts are focused on both improving the experience of our existing games (frequently through new content and feature releases for our live services) and developing new games. We generate revenue primarily through the sale of in-game virtual items and advertising. For games distributed through third-party platforms, we are required to share a portion of our revenues from in-game sales with the platform providers. Due to our focus on mobile gaming, these costs are expected to remain a significant operating expense. In order to remain profitable, we need to generate sufficient bookings and revenues from our existing and new game offerings to offset our ongoing development, marketing and operating costs.
6
Successfully monetizing “free-to-play” games is difficult, and requires that we deliver valuable and entertaining player experiences that a sufficient number of players will pay for or we are able to otherwise sufficiently monetize our games (for example, by serving in-game advertising). The success of our games depends, in part, on unpredictable and volatile factors beyond our control including consumer preferences, competing games, new mobile platforms and the availability of other entertainment experiences. If our games do not meet consumer expectations, or if they are not brought to market in a timely and effective manner, our ability to grow revenue and our financial performance will be negatively affected.
We focus our efforts on four categories: Action Strategy, Casual, Social Casino and Invest Express. In addition to the market factors noted above, our ability to successfully develop games for mobile platforms and their ability to achieve commercial success will depend on our ability to:
|
|
• |
effectively market our games to existing and new players; |
|
|
• |
achieve benefits from our player acquisition costs; |
|
|
• |
achieve viral organic growth and gain customer interest in our games through free or more efficient channels; |
|
|
• |
adapt to changing player preferences; |
|
|
• |
adapt to new technologies and feature sets for mobile and other devices (for example, in 2017 we incurred expenses related to upgrading games to support Apple’s new iPhoneX and releasing new features in CSR Racing 2 using Apple’s ARKit platform); |
|
|
• |
expand and enhance games after their initial release; |
|
|
• |
attract, retain and motivate talented and experienced game designers, product managers and engineers; |
|
|
• |
partner with mobile platforms and obtain featuring opportunities; |
|
|
• |
continue to adapt game feature sets for an increasingly diverse set of mobile devices, including various operating systems and specifications, limited bandwidth, and varying processing power and screen sizes; |
|
|
• |
minimize launch delays and cost overruns on the development of new games and features; |
|
|
• |
achieve and maintain successful customer engagement and effectively monetize our games; |
|
|
• |
maintain a quality social game experience and retain our players; |
|
|
• |
develop games that can build upon or become franchise games; |
|
|
• |
compete successfully against a large and growing number of existing market participants; |
|
|
• |
accurately forecast the timing and expense of our operations, including game and feature development, marketing and customer acquisition, customer adoption, and success of bookings growth; |
|
|
• |
minimize and quickly resolve bugs or outages; and |
|
|
• |
acquire and successfully integrate high quality mobile game assets, personnel or companies. |
These and other uncertainties make it difficult to know whether we will succeed in continuing to develop successful live service games and launch new games and features in accordance with our operating plan. If we do not succeed in doing so, our business, financial condition, results of operations or reputation will suffer.
Our industry is intensely competitive and subject to rapid changes. If consumers prefer our competitors’ products or services over our own, our operating results could suffer.
Competition in the gaming industry, especially the mobile gaming segment, is intense and subject to rapid changes, including due to evolving consumer preferences and emerging technologies. Many new games are introduced in each major industry segment (mobile, web, PC, and console), but only a relatively small number of titles account for a significant portion of total revenue in each segment. Our competitors that develop mobile and web games vary in size and include companies such as Activision Blizzard (the parent company of King Digital), Aristocrat, DoubleU, Electronic Arts (EA Mobile), Glu Mobile, Jam City, Machine Zone, Netmarble (the parent company of Kabam), Niantic, Playtika, SciGames Interactive, Supercell, Vivendi (the parent company of Gameloft) and others. In addition, online game developers and distributors who are primarily focused on specific international markets, such as Giant Interactive and Tencent in Asia, and high-profile companies with significant online presences that to date have not actively focused on social games, such as Facebook, Apple, Google, Amazon and Microsoft, may decide to develop social games. Some of these current and potential competitors have significant resources for developing or acquiring additional games, may be able to incorporate their own strong brands and assets into their games, have a more diversified set of revenue sources than we do and may be less severely affected by changes in consumer preferences, regulations or other developments that may impact our industry.
7
As there are relatively low barriers to entry to develop a mobile or online game, we expect new game competitors to enter the market and existing competitors to allocate more resources to develop and market competing games and applications. We also compete or will compete with a vast number of small companies and individuals who are able to create and launch games and other content for devices and platforms using relatively limited resources and with relatively limited start-up time or expertise. The proliferation of titles in these open developer channels makes it difficult for us to differentiate ourselves from other developers and to compete for players without substantially increasing our marketing expenses and development costs. As an entertainment company, we also face competition for the leisure time, attention and discretionary spending of our players from other non-gaming activities, such as social media and messaging applications, personal computer and console games, television, movies, sports and the Internet. Increasing competition could result in loss of players, increasing player acquisition and retention costs, and loss of talent, all of which could harm our business, financial condition or results of operations.
We rely on third-party platforms such as the Apple App Store, the Google Play Store and Facebook to distribute our games and collect revenue. If we are unable to maintain a good relationship with such platform providers, if their terms and conditions or pricing changed to our detriment, if we violate, or if a platform provider believes that we have violated, the terms and conditions of its platform, or if any of these platforms loses market share or falls out of favor or is unavailable for a prolonged period of time, our business will suffer.
We derive a significant portion of our bookings from distribution of our games on the Apple App Store, the Google Play Store, and Facebook and the virtual items we sell in our games are purchased using the payment processing systems of these platform providers. Additionally, we have historically acquired a significant number of our players through Facebook. In 2017, we derived 51% of our revenue and bookings from Apple, 33% of our revenue and 34% of our bookings from Google and 12% of our revenue and 11% of our bookings from Facebook.
We are subject to the standard policies and terms of service of third-party platforms, which govern the promotion, distribution, content and operation generally of games on the platform. Each platform provider has broad discretion to change and interpret its terms of service and other policies with respect to us and other developers, and those changes may be unfavorable to us. A platform provider may also change its fee structure, add fees associated with access to and use of its platform, alter how we are able to advertise on the platform, change how the personal information of its users is made available to application developers on the platform, limit the use of personal information for advertising purposes, or restrict how players can share information with their friends on the platform or across platforms. For example, in December 2017, Apple revised its App Store Guidelines to require the disclosure of the odds of receiving certain types of virtual goods from “loot boxes” (or similar mechanisms that offer a paid license to randomized virtual items) before customers purchase a license for the virtual goods. We are continuing to evaluate how Apple will interpret this revision, whether Google, Facebook and other platform providers adopt similar rules, and how this rule may affect our business, operations and financial results.
In addition, third-party platforms also impose certain file size limitations, which may limit the ability of players to download some of our larger games in over-the-air updates. Aside from these over-the-air file size limitations, a larger game file size could cause players to delete our games once the file size grows beyond the capacity of their devices’ storage limitations or could reduce the number of downloads of these games.
Such terms of use changes may decrease the visibility or availability of our games, limit our distribution capabilities, prevent access to our existing games, reduce the amount of bookings and revenue we may recognize from in-game purchases, increase our costs to operate on these platforms or result in the exclusion or limitation of our games on such platforms. Any such changes could adversely affect our business, financial condition or results of operations.
If we violate, or a platform provider believes we have violated, its terms of service (or if there is any change or deterioration in our relationship with these platform providers), that platform provider could limit or discontinue our access to the platform. A platform provider could also limit or discontinue our access to the platform if it establishes more favorable relationships with one or more of our competitors or it determines that we are a competitor. Any limit or discontinuation of our access to any platform could adversely affect our business, financial condition or results of operations.
We also rely on the continued popularity, customer adoption, and functionality of third-party platforms. In the past, some of these platform providers have been unavailable for short periods of time or experienced issues with their in-app purchasing functionality. If either of these events recurs on a prolonged, or even short-term, basis or other similar issues arise that impact players’ ability to access our games, access social features or purchase a license to virtual items, our business, financial condition, results of operations or reputation may be harmed.
8
We rely on third-party hosting and cloud computing providers, like Amazon Web Services (“AWS”), to operate certain aspects of our business. A significant portion of our game traffic is hosted by a single vendor, and any failure, disruption or significant interruption in our network or hosting and cloud services could adversely impact our operations and harm our business.
Our technology infrastructure is critical to the performance of our games and to player satisfaction, as well as our corporate functions. Our games and company systems run on a complex distributed system, or what is commonly known as cloud computing. We own, operate and maintain elements of this system, but significant elements of this system are operated by third-parties that we do not control and which would require significant time and expense to replace. We expect this dependence on third-parties to continue. We have suffered interruptions in service in the past, including when releasing new software versions or bug fixes, and if any such interruption were significant and/or prolonged it could adversely affect our business, financial condition, results of operations or reputation.
In particular, a significant portion, if not almost all, of our game traffic, data storage, data processing and other computing services and systems is hosted by AWS. AWS provides us with computing and storage capacity pursuant to an agreement that continues until terminated by either party. The agreement requires AWS to provide us their standard computing and storage capacity and related support in exchange for timely payment by us. We have experienced, and may in the future experience, disruptions, outages and other performance problems due to a variety of factors, including infrastructure changes, human or software errors and capacity constraints. If a particular game is unavailable when players attempt to access it or navigation through a game is slower than they expect, players may stop playing the game and may be less likely to return to the game as often, if at all.
Any failure, disruption or interference with our use of hosted cloud computing services and systems provided by third-parties, like AWS, could adversely impact our business, financial condition or results of operations. To the extent we do not effectively respond to any such interruptions, upgrade our systems as needed and continually develop our technology and network architecture to accommodate traffic, our business, financial condition or results of operations could be adversely affected. In addition, we do not maintain insurance policies covering losses relating to our systems and we do not have business interruption insurance. Furthermore, our disaster recovery systems and those of third-parties with which we do business may not function as intended or may fail to adequately protect our critical business information in the event of a significant business interruption, which may cause interruption in service of our games, security breaches or the loss of data or functionality, leading to a negative effect on our business, financial condition or results of operations.
Our operating results are volatile and difficult to predict, and our stock price may decline if we fail to meet the expectations of securities analysts or investors.
Our bookings, revenue, player metrics and operating results have fluctuated in the past and could vary significantly from quarter-to-quarter and year-to-year, and may fail to match our past performance or the expectations of securities analysts or investors because of a variety of factors, some of which are outside of our control. Factors that may contribute to the variability of our operating results include the risk factors listed in these “Risk Factors” and the factors discussed in the section titled “Management’s Discussion and Analysis of Financial Condition and Results of Operations — Factors Affecting Our Performance.”
In particular, it is difficult to predict when bookings from one of our games will begin to decline, the decay rate for any particular game (i.e., the speed at which the popularity and player usage for a game declines) and the commercial success of our new games and features. The success of our business depends on our ability to consistently and timely launch new games and features that achieve significant popularity and have the potential to become franchise games as bookings from our older games decline. It is difficult for us to predict with certainty when we will launch a new game as games may require longer development schedules or soft launch periods to meet our quality standards and our players’ expectations. For example, our experience with our launches in 2014 and 2015 caused us to extend soft launch periods for certain of our games before worldwide launch, including a delay in the launch of Dawn of Titans and CSR Racing 2 from 2015 to 2016, which resulted in a delay in significant bookings for the games. If decay rates are higher than expected in a particular quarterly period and/or we experience delays in the launch of new games that we expect to offset decay rates of other games and/or new games do not monetize well, we may not meet our expectations or the expectations of securities analysts or investors for a given quarter.
In addition, we recognize revenue from the sale of our virtual goods in accordance with U.S. GAAP, which is complex and based on our assumptions and historical data with respect to the sale and use of various types of virtual goods. In the event of changes in our assumptions or new trends in the mix of virtual goods sold, the amount of revenue that we recognize in any particular period may fluctuate significantly. In addition, changes in the policies of Facebook, Apple, Google or other third party platforms or accounting policies promulgated by the SEC and national accounting standards bodies affecting software and virtual goods revenue recognition could further significantly affect the way we report revenue related to our products. Such changes could have an adverse effect on our reported revenue, net income and earnings per share under U.S. GAAP. For further information regarding our revenue recognition policy, see the section titled “Management’s Discussion and Analysis of Financial Condition and Results of Operations—Critical Accounting Policies—Revenue Recognition”.
9
Given the rapidly evolving social game industry in which we operate, our historical operating results may not be useful in predicting our future operating results. In addition, metrics we have developed or those available from third parties regarding our industry and the performance of our games, including DAUs, MAUs, MUUs, MUPs and ABPU may not be indicative of our future financial performance.
A small number of games have generated a majority of our revenue, and we must continue to launch, innovate and enhance games that players like and attract and retain a significant number of players in order to grow our revenue and sustain our competitive position.
Historically, we have depended on a small number of games for a majority of our revenue and we expect that this dependency will continue for the foreseeable future. Bookings and revenue from many of our games may decline over time after reaching a peak of popularity and player usage. As a result, our business depends on our ability to engage with players by consistently and timely launching new games and enhancing existing games with new content, features and events. We believe that certain games have the potential to become franchises that we plan to invest in and support with new games releases (such as Words With Friends 2 and CSR Racing 2) and introduction of new features to existing games (such as new events within Zynga Poker). Constant game enhancement requires the investment of significant resources, particularly with older games, and such costs on average have increased.
It is difficult to consistently anticipate player demand on a large scale, particularly as we develop games in new categories or new markets, including international markets and mobile platforms. If we do not successfully launch games that attract and retain a significant number of players and extend the life of our existing games, our market share, brand and financial results will be harmed.
We rely on a small portion of our total players for nearly all of our revenue and if we fail to grow our player base, or if player engagement continues to decline, bookings, revenue and operating results will be harmed.
Compared to all players who play our games in any period, only a small portion are paying players. In the fourth quarter of 2017, we had approximately 1.2 million average MUPs (excluding payers of Daily Celebrity Crossword, Solitaire, our Facebook Messenger games and games recently acquired from Peak Games), who represented approximately 2.4% of our average Monthly Unique Users. In order to sustain and grow our revenue levels, we must attract, retain and increase the number of paying players or more effectively monetize our players through advertising and other strategies. To retain players, we must devote significant resources so that the games they play retain their interest and attract them to our other games. We might not succeed in our efforts to increase the monetization rates of our users, particularly if we are unable to retain our paying players. If we fail to grow or sustain the number of our paying players, if the rates at which we attract and retain paying players declines or if the average amount our players pay declines, our business may not grow and our financial results will suffer.
Our business will suffer if we are unable to successfully acquire or integrate acquired companies into our business or otherwise manage the growth associated with multiple acquisitions.
We have acquired games, businesses, personnel and technologies in the past, and we intend to continue to evaluate and pursue acquisitions and strategic investments. For example, in the fourth quarter of 2017, we acquired the casual card game division of Peak Games. If we are unable to obtain the anticipated benefits from these acquisitions and strategic investments, or we encounter difficulties in integrating their operations with ours, our financial condition and results of operations could be materially harmed.
Challenges and risks from such investments and acquisitions include:
|
|
• |
negative effects on products and product pipeline from the changes and potential disruption that may follow the acquisition; |
|
|
• |
diversion of our management’s attention; |
|
|
• |
declining employee morale and retention issues resulting from changes in compensation, or changes in management, reporting relationships, or future prospects; |
|
|
• |
the need to integrate the operations, systems, technologies, products and personnel of each acquired company, the inefficiencies and lack of control that may result if such integration is delayed or not implemented, and unforeseen difficulties and expenditures that may arise in connection with integration; |
|
|
• |
the difficulty in determining the appropriate purchase price of acquired companies may lead to the overpayment from certain acquisitions and the potential impairment of intangible assets and goodwill acquired in the acquisitions; |
|
|
• |
the difficulty in successfully evaluating and utilizing the acquired products, technology or personnel; |
|
|
• |
the potential incurrence of debt, contingent liabilities, amortization expenses or restructuring charges in connection with any acquisition; |
10
|
|
• |
the need to implement controls, procedures and policies appropriate for a larger public company at companies that prior to acquisition may not have as robust controls, procedures and policies; |
|
|
• |
the difficulty in accurately forecasting and accounting for the financial impact of an acquisition transaction, including accounting charges and integrating and reporting results for acquired companies that do not historically follow U.S. GAAP; |
|
|
• |
the fact that we may be required to pay contingent consideration in excess of the initial fair value, and contingent consideration may become payable at a time when we do not have sufficient cash available to pay such consideration; |
|
|
• |
under purchase accounting, we may be required to write off deferred revenue which may impair our ability to recognize revenue that would have otherwise been recognizable which may impact our financial performance or that of the acquired company; |
|
|
• |
risks associated with our expansion into new international markets and doing business internationally, including those described under the risk factor caption “Our international operations are subject to increased challenges and risks”; |
|
|
• |
in the case of foreign acquisitions, the need to integrate operations across different cultures and languages and to address the particular economic, currency, political and regulatory risks associated with specific countries; |
|
|
• |
the need to transition operations and players onto our existing or new platforms and the potential loss of, or harm to, our relationships with employees, players and other suppliers as a result of integration of new businesses; |
|
|
• |
the ability to exert control of acquired businesses that include earn out provisions in the agreements relating to such acquisitions or the potential to fund other obligations related to a product that has not met expectations; |
|
|
• |
our dependence on the accuracy and completeness of statements and disclosures made or actions taken by the companies we acquire or their representatives, when conducting due diligence and evaluating the results of such due diligence; and |
|
|
• |
liability for activities of the acquired company before the acquisition, including intellectual property and other litigation claims or disputes, information security vulnerabilities, violations of laws, rules and regulations, commercial disputes, tax liabilities and other known and unknown liabilities. |
The benefits of an acquisition or investment may also take considerable time to develop, and we cannot be certain that any particular acquisition or investment will produce the intended benefits, which could adversely affect our business, financial condition or results of operations. Our ability to grow through future acquisitions will depend on the availability of suitable acquisition and investment candidates at an acceptable cost, our ability to compete effectively to attract these candidates and the availability of financing to complete larger acquisitions. Acquisitions could result in potential dilutive issuances of equity securities, use of significant cash balances or incurrence of debt (and increased interest expense), contingent liabilities or amortization expenses related to intangible assets or write-offs of goodwill and/or intangible assets, which could adversely affect our results of operations and dilute the economic and voting rights of our stockholders. For more information, see Note 6 – “Goodwill and Other Intangible Assets, Net” in the notes to the consolidated financial statements included herein.
The value of our virtual goods is highly dependent on how we manage the economies in our games. If we fail to manage our game economies properly, our business may suffer.
Paying players purchase a license to virtual goods in our games because of the perceived value of these goods, which is dependent on the relative ease of obtaining an equivalent good by playing our game. The perceived value of these virtual goods can be impacted by various actions that we take in the games including offering discounts for virtual goods, giving away virtual goods in promotions or providing easier non-paid means to secure these goods. Managing game economies is difficult, and relies on our assumptions and judgement. If we fail to manage our virtual economies properly or fail to promptly and successfully respond to any such disruption, our reputation may suffer and our players may be less likely to play our games and to purchase virtual goods from us in the future, which would cause our business, financial condition and results of operations to suffer.
Our revenue may be harmed by the proliferation of “cheating” programs and scam offers that seek to exploit our games and players, which may negatively affect game-playing experience and may lead players to stop playing our games.
Unrelated third parties have developed, and may continue to develop, “cheating” programs that enable players to exploit vulnerabilities in our games, play them in an automated way, collude to alter the intended game play or obtain unfair advantages over other players who do play fairly. These programs harm the experience of players who play fairly, may disrupt the virtual economies of our games and may reduce the demand for virtual items. In addition, unrelated third parties have attempted to scam our players with fake offers for virtual goods or other game benefits. We devote significant resources to discover, discourage and disable these cheating and scam programs and activities. If we are unable to do so quickly, our operations may be disrupted, our reputation damaged and players may stop playing our games. These cheating programs and scam offers may lead to lost revenue from paying players,
11
increased cost of developing technological measures to combat these programs and activities, legal claims, and increased customer service costs needed to respond to dissatisfied players.
Some of our players may make sales or purchases of virtual goods used in our games through unauthorized or fraudulent third-party websites, which may reduce our revenue.
Virtual goods in our games have no monetary value outside of our games. Nonetheless, some of our players may make sales and/or purchases of our virtual goods, such as virtual coins for our Slots franchise games or Zynga Poker virtual poker chips, through unauthorized third-party sellers in exchange for real currency. These unauthorized or fraudulent transactions are usually arranged on third-party websites and the virtual goods offered may have been obtained through unauthorized means such as exploiting vulnerabilities in our games, from scamming our players with fake offers for virtual goods or other game benefits, or from credit card fraud. We do not generate any revenue from these transactions. These unauthorized purchases and sales from third-party sellers could impede our revenue and profit growth by, among other things:
|
|
• |
decreasing revenue from authorized transactions; |
|
|
• |
creating downward pressure on the prices we charge players for our virtual currency and virtual goods; |
|
|
• |
increasing chargebacks from unauthorized credit card transactions; |
|
|
• |
causing us to lose revenue from dissatisfied players who stop playing a particular game; |
|
|
• |
increasing costs we incur to develop technological measures to curtail unauthorized transactions; |
|
|
• |
resulting in negative publicity or harm our reputation with players and partners; and |
|
|
• |
increasing customer support costs to respond to dissatisfied players. |
To discourage unauthorized purchases and sales of our virtual goods, we state in our terms of service that the buying or selling of virtual currency and virtual goods from unauthorized third party sellers may result in bans from our games or legal action. We have banned players as a result of such activities. We have also filed lawsuits against third parties attempting to “sell” virtual goods from our games, particularly poker chips from Zynga Poker, outside of our games. We have also employed technological measures to help detect unauthorized transactions and continue to develop additional methods and processes by which we can identify unauthorized transactions and block such transactions. However, there can be no assurance that our efforts to prevent or minimize these unauthorized or fraudulent transactions will be successful.
We are subject to laws and regulations concerning privacy, information security, data protection, consumer protection and protection of minors, and these laws and regulations are continually evolving. Our actual or perceived failure to comply with these laws and regulations could harm our business.
We receive, store and process personal information and other player data, and we enable our players to share their personal information with each other and with third parties, including on the Internet and mobile platforms. There are numerous federal, state and local laws around the world regarding privacy and the storing, sharing, use, processing, disclosure and protection of personal information and other player data on the Internet and mobile platforms, the scope of which are changing, subject to differing interpretations, and may be inconsistent between countries or conflict with other rules.
Various government and consumer agencies have called for new regulation and changes in industry practices and are continuing to review the need for greater regulation for the collection of information concerning consumer behavior on the Internet, including regulation aimed at restricting certain targeted advertising practices. For example, the European Union’s General Data Protection Regulation (“GDPR”), which will become effective in May 2018, creates new individual privacy rights and imposes worldwide obligations on companies processing personal data of European Union users, which has created a greater compliance burden for us and other companies with European users, and subject violators to substantial monetary penalties. There is also increased attention being given to the collection of data from minors. For instance, the Children’s Online Privacy Protection Act (“COPPA”) requires companies to obtain parental consent before collecting personal information from children under the age of 13 and in January 2014, the Federal Trade Commission announced a settlement with Apple related to in-app purchases made by minors. Compliance with GDPR, COPPA and similar legal requirements has required us to devote significant operational resources and incur significant expenses.
All of our games are subject to our privacy policy and our terms of service located in application storefronts, within our games and on our corporate website. We generally comply with industry standards and are subject to the terms of our privacy-related obligations to players and third parties. We strive to comply with all applicable laws, policies, legal obligations and certain industry codes of conduct relating to privacy and data protection, to the extent reasonably attainable. However, it is possible that these obligations may be interpreted and applied in a manner that is inconsistent from one jurisdiction to another and may conflict with
12
other rules or our practices. For example, foreign laws and regulations are often more restrictive than those in the U.S. In particular, the European Union and its member states traditionally have taken broader views regarding what data types are subject to data protection, and have imposed legal obligations on companies in this regard, as is the case with GDPR. It is also possible that new laws, policies, legal obligations or industry codes of conduct may be passed, or existing laws, policies, legal obligations or industry codes of conduct may be interpreted in such a way that could prevent us from being able to offer services to citizens of a certain jurisdiction or may make it costlier or more difficult for us to do so. Any failure or perceived failure by us to comply with our privacy policy and terms of service, our privacy-related obligations to players or other third parties, or our privacy-related legal obligations, or any compromise of security that results in the unauthorized release or transfer of personally identifiable information or other player data, may result in governmental enforcement actions, litigation or public statements against us by consumer advocacy groups or others and could cause our players to lose trust in us, which could have an adverse effect on our business, financial condition or results of operations. Additionally, if third parties we work with, such as players, vendors or developers violate applicable laws or our policies, such violations may also put our players’ information at risk and could in turn have an adverse effect on our business, financial condition or results of operations.
Security breaches, computer viruses and computer hacking attacks could harm our business, financial condition, results of operations or reputation.
Security breaches, computer malware and computer hacking attacks have become more prevalent in our industry. Any security breach caused by hacking, which involves efforts to gain unauthorized access to information or systems, or to cause intentional malfunctions or loss or corruption of data, software, hardware or other computer equipment, or the inadvertent transmission of computer viruses could adversely affect our business, financial condition, results of operations or reputation. We have experienced and will continue to experience hacking attacks of varying degrees from time to time, including denial-of-service attacks. Because of our prominence in the social game industry, we believe we are a particularly attractive target for hackers.
In addition, we store sensitive information, including personal information about our employees, and our games involve the storage and transmission of players’ personal information on equipment, networks and corporate systems run by us or managed by third-parties including Facebook, Apple, Microsoft, Amazon, and Google. Many states have passed laws requiring notification to players when there is a security breach of certain personal data, such as the 2002 amendment to California’s Information Practices Act, or requiring the adoption of minimum information security standards that are often vaguely defined and difficult to practically implement. The costs of compliance with these laws have increased and may increase in the future. Our corporate systems, third-party systems and security measures may be breached due to the actions of outside parties, employee error, malfeasance, a combination of these, or otherwise, and, as a result, an unauthorized party may obtain access to our data, our employees’ data, our players’ data or any third party data we may possess. Any such security breach could require us to comply with various breach notification laws and may expose us to litigation, remediation and investigation costs, increased costs for security measures, loss of revenue, damage to our reputation and potential liability.
Any restructuring actions and cost reduction initiatives that we undertake may not deliver the expected results and these actions may adversely affect our business.
We have implemented a number of restructurings during the last several years in which we implemented certain restructuring actions and cost reduction initiatives to streamline operations and improve cost efficiencies to better align our operating expenses with our revenue, including reducing our headcount, rationalizing our product pipeline, reducing marketing and technology expenditures and consolidating and closing certain facilities. We plan to continue to manage costs to better and more efficiently manage our business. Our restructuring plans and other such efforts could result in disruptions to our operations and adversely affect our business, financial condition or results of operations. For more information, see Note 9 – “Restructuring” in the notes to the consolidated financial statements included herein.
We actively monitor our costs, however, if we do not fully realize or maintain the anticipated benefits of any restructuring actions and cost reduction initiatives, our business, financial condition or results of operations could be adversely affected, and additional restructuring initiatives may be necessary. In addition, we cannot be sure that the cost reduction initiatives will be as successful in reducing our overall expenses as expected or that additional costs will not offset any such reductions. If our operating costs are higher than we expect or if we do not maintain adequate control of our costs and expenses, our operating results will suffer.
13
In addition, our cost-cutting measures could negatively impact our business, financial condition or results of operations including but not limited to, delaying the introduction of new games, features or events, interrupting live services, impairing our control environment, delaying introduction of new technology, impacting our ability to react nimbly to game or technology issues, or impacting employee retention and morale.
If we are able to develop new games and features that achieve success, it is possible that these games and features could divert players of our other games without growing our overall user base, which could harm operating results.
Although it is important to our future success that we develop new games and features that are popular with players, it is possible that new games and features may reduce the amount of time players spend with our other games. In particular, we plan to continue leveraging our existing games to cross-promote new games and features, which may encourage players of existing games to divert some of their playing time and discretionary spending away from our existing games. If new games and game features do not grow our player base, increase the overall amount of time our players spend with our games, or generate sufficient new bookings to offset any declines from our other games, our bookings and revenue could be adversely affected.
We derive a significant portion of our revenues from advertisements and offers that are incorporated into our free-to-play games through relationships with third parties. If we are unable to continue to compete for these advertisements and offers, or if any events occur that negatively impact our relationships with advertisers, our advertising revenues and operating results would be negatively impacted.
We derive a significant portion of our revenues though advertisements and offers we serve to players. We need to maintain good relationships with advertisers to provide us with a sufficient inventory of advertisements and offers. Online advertising, including through mobile games and other mobile applications, is an intensely competitive industry. Many large companies, such as Amazon, Facebook and Google, invest significantly in data analytics to make their websites and platforms more attractive to advertisers. In order for our advertising business to continue to succeed, we need to continue to demonstrate the reach of our player network and success of our advertising partners. If our relationship with any advertising partners terminates for any reason, or if the commercial terms of our relationships are changed or do not continue to be renewed on favorable terms, we would need to qualify new advertising partners, which could negatively impact our revenues, at least in the short term.
In addition, internet-connected devices and operating systems controlled by third parties increasingly contain features that allow device users to disable functionality that allows for the delivery of advertising on their devices. Device and browser manufacturers may include or expand these features as part of their standard device specifications. For example, when Apple announced that UDID, a standard device identifier used in some applications, was being superseded and would no longer be supported, application developers were required to update their apps to utilize alternative device identifiers such as universally unique identifier, or, more recently, identifier-for-advertising, which simplify the process for Apple users to opt out of behavioral targeting. If users elect to utilize the opt-out mechanisms in greater numbers, our ability to deliver effective advertising campaigns on behalf of our advertisers would suffer, which could cause our business, financial condition, or results of operations to suffer. Finally, the revenues that we derive from advertisements and offers is subject to seasonality, as companies’ advertising budgets are generally highest during the fourth quarter and decline significantly in the first quarter of the following year, which negatively impacts our revenues in the first quarter.
We have a history of net losses and our revenue, bookings and operating margins may decline. We also may incur substantial net losses in the future and may not achieve or sustain profitability.
The industry in which we operate is highly competitive and rapidly changing, and relies heavily on successful new product launches and continually introducing compelling content, products and services. As such, if we fail to deliver such content, products and services, do not execute our strategy successfully or if our new content launches are delayed, our revenue, bookings and audience numbers may decline, and our operating results will suffer. As of December 31, 2017, we had an accumulated deficit of $1.7 billion.
In addition, our operating margin may experience downward pressure as a result of increasing competition and the other risks discussed in this report. We expect to continue to expend substantial financial and other resources on game development, our technology stack, game engines, game technology and tools, the expansion of our network, international expansion and marketing. Our operating costs will increase and our operating margins may decline if we do not effectively manage costs, launch new products on schedule that monetize successfully and enhance our franchise games so that these games continue to monetize successfully. In addition, weak economic conditions or other factors could cause our business to further contract, requiring us to implement significant additional cost cutting measures, including a decrease in research and development and sales and marketing, which could harm our long-term prospects.
14
If our revenues do not increase to offset any additional expenses, if we fail to manage or experience unexpected increases in operating expenses or if we are required to take additional charges related to impairments or restructurings, our financial results and results of operations may suffer.
We rely on assumptions and estimates to calculate certain of our key metrics, and real or perceived inaccuracies in such metrics may harm our reputation and negatively affect our business.
The numbers of our DAUs, MAUs, MUUs, MUPs, and ABPU are calculated using metrics tracked by our internal analytics systems based on tracking activity of user accounts. The analytics systems and the resulting data have not been independently verified. While these numbers are based on what we believe to be reasonable calculations for the applicable period of measurement, there are inherent challenges in measuring usage and user engagement across our user base and factors relating to user activity and systems may impact these numbers. The calculation of these metrics and examples of how user activity and our systems may impact the calculation of the metrics is described in detail under the heading titled “Management’s Discussion and Analysis of Financial Condition and Results of Operations—Key Measures and Metrics.”
Our accuracy in calculating these metrics is further challenged by our focus on mobile gaming. As described under the heading titled “Management’s Discussion and Analysis of Financial Condition and Results of Operations—Key Measures and Metrics,” we rely on the accuracy and transparency of data provided by individuals and reported by third parties to calculate our metrics and eliminate duplication of data. For purposes of calculating MUUs and MUPs, for certain periods, we are unable to distinguish whether players of certain games are also players of our other games. As a result, we exclude players of these games from our calculation of MUUs and MUPs for those periods to avoid potential double counting.
Our advertisers and investors rely on our key metrics as a representation of our performance. We regularly review and may adjust our processes for calculating our internal metrics to improve their accuracy. If we determine that we can no longer calculate any of our key metrics with a sufficient degree of accuracy, and we cannot find an adequate replacement for the metric, our business, financial condition or results of operations may be harmed. In addition, if advertisers, platform partners or investors do not perceive our user metrics to be accurate representations of our user base or user engagement, or if we discover material inaccuracies in our user metrics, our reputation may be harmed and advertisers and platform partners may be less willing to allocate their budgets or resources to our products and services, which could negatively affect our business, financial condition or results of operations.
Our business and growth may suffer if we fail to attract, retain and motivate key personnel.
Our ability to compete and grow depends in large part on the efforts and talents of our employees and executives. Our success depends in a large part upon the continued service of our senior management team. We have seen significant changes in our management team in recent years, including the appointment of Frank Gibeau as our Chief Executive Officer, the appointment of Mark Pincus as our Executive Chairman and the addition of a new Chief Financial Officer, Chief Operating Officer, President of Publishing, Chief People Officer and Chief Legal Officer. Mr. Pincus and Mr. Gibeau are both critical to our vision, strategic direction, culture, products and technology, and the continued retention of our entire senior management team is important to the success of our operating plan. We do not have employment agreements, other than offer letters, with our senior management team, and we do not maintain key-man insurance for members of our senior management team. The loss of any member of our senior management team could cause disruption and harm our business, financial condition, results of operations or reputation.
In addition, our ability to execute our strategy depends on our continued ability to identify, hire, develop, motivate and retain highly skilled employees, particularly in the competitive fields of game design, product management and engineering. These employees are in high demand, and we devote significant resources to identifying, recruiting, hiring, training, successfully integrating and retaining them. We have continued to experience significant turnover in our headcount, which has placed and will continue to place significant demands on our management and our operational, financial and technological infrastructure. As of December 31, 2017, approximately 22% of our employees had been with us for less than one year and approximately 39% for less than two years.
We believe that two critical components of our success and our ability to retain our best people are our culture and our competitive compensation practices. As we operate as a public company, we may find it difficult to maintain our entrepreneurial, execution-focused culture. In addition, recent volatility in our operating results and the trading price of our Class A common stock may cause our employee base to be more vulnerable to be targeted for recruitment by competitors. Competition for highly skilled employees is intense, particularly in the San Francisco Bay Area, where our headquarters is located. If we are unable to identify, hire and retain our senior management team and our key employees, our business, financial condition or results of operations could be harmed. Moreover, if our team fails to work together effectively to execute our plans and strategies on a timely basis, our business, financial condition or results of operations could be harmed.
15
We have historically hired a number of key personnel through acquisitions, and as competition with other game companies for attractive target companies with a skilled employee base persists and increases, we may incur significant expenses and difficulty in continuing this practice. In addition, volatility in our operating results and the trading price of our Class A common stock may negatively impact our perceived reputation and make it more difficult and more expensive to successfully retain employees through acquisitions. The loss of talented employees with experience in the assets we acquire could result in significant disruptions to our business and the integration of acquired assets and businesses. If we do not succeed in recruiting, retaining, and motivating these key employees, we may not achieve the anticipated results of acquisitions.
Our core values of focusing on our players and acting for the long-term may conflict with the short-term expectations of analysts.
We believe surprising and delighting our players is essential to our success and serves the best, long-term interests of Zynga and our stockholders. Therefore, we have made in the past and we may make in the future, significant investments or changes in strategy that we think will benefit us in the long-term, even if our decision has the potential to negatively impact our operating results in the short term. For example, we delayed the launches of Dawn of Titans and CSR Racing 2 from 2015 to 2016. Although launching Dawn of Titans or CSR Racing 2 in 2015 may have offered short-term bookings, we determined that both games needed more time in soft launch to achieve their full potential. In addition, our decisions may not result in the long-term benefits that we expect, in which case the success of our games, business, financial condition or results of operations could be harmed.
If the use of mobile devices as game platforms and the proliferation of mobile devices generally do not increase, our business could be adversely affected.
The number of people using mobile Internet-enabled devices has increased dramatically over time and we expect that this trend will continue. However, the mobile market, particularly the market for mobile games, may not grow in the way we anticipate. Our future success is substantially dependent upon the continued growth of the market for mobile games. In addition, we do not currently offer our games on all mobile devices. If the mobile devices on which our games are available decline in popularity or become obsolete faster than anticipated, we could experience a decline in bookings and revenue and may not achieve the anticipated return on our development efforts. Any such declines in the growth of the mobile market or in the use of mobile devices for games could harm our business, financial condition or results of operations.
If we do not successfully invest in, establish and maintain awareness of our brand and games, if we incur excessive expenses promoting and maintaining our brand, or our games or if our games contain defects or objectionable content, our business, financial condition, results of operations or reputation could be harmed.
We believe that establishing and maintaining our brand is critical to maintaining and creating favorable relationships with players, platform providers, advertisers and content licensors, as well as competing for key talent. Increasing awareness of our brand and recognition of our games is particularly important in connection with our strategic focus on developing games based on our own intellectual property and successfully cross-promoting our games. In addition, globalizing and extending our brand and recognition of our games requires significant investment and extensive management time to execute successfully. Although we make significant sales and marketing expenditures in connection with the launch of our games, these efforts may not succeed in increasing awareness of our brand or the new games. If we fail to increase and maintain brand awareness and consumer recognition of our games, our potential revenues could be limited, our costs could increase and our business, financial condition, results of operations or reputation could suffer.
In addition, if a game contains objectionable content or the messaging functionality of our games is abused, we could experience damage to our reputation and brand. Despite reasonable precautions, some consumers may be offended by certain of our game content, the third-party advertisements displayed in certain of our games, or by treatment of other users. If consumers believe that a game we published or third-party advertisement displayed in a game contains objectionable content, it could harm our brand and consumers could refuse to play it and could pressure the platform providers to remove the game from their platforms. For example, we rely on third-party advertising partners to display ads within our games, we have experienced (and may experience in the future) instances where offensive or objectionable content has been displayed in our games through our advertising partners. While this may violate the terms of our agreements with these advertising partners, our reputation and player experience may suffer. Furthermore, steps that we may take in response to such instances, such as temporarily or permanently shutting off access of such advertising partner to our network, may negatively impact our revenue in such period.
Similarly, our games may contain errors, bugs, flaws, corrupted data, defects and other vulnerabilities, some of which may only become apparent after their launch, particularly as we launch new games and rapidly release new features to existing games under tight time constraints. Any such errors, flaws, defects and vulnerabilities may be exploited by cheating programs and other forms of misappropriation, disrupt our operations, adversely affect the game experience of our players, harm our reputation, cause our players to stop playing our games, divert our resources and delay market acceptance of our games, any of which could result in legal liability to us or harm our business, financial condition or results of operations.
16
Our web-based games rely on Adobe Flash, and our business and operating results could be harmed if web browsers cease to support Adobe Flash and we cannot find substitute software for our web-based games.
Our web-based games currently rely on Adobe Flash, a multimedia and software platform used to show items such as videos, graphics, games and animations on websites. In July 2017, Adobe announced that it will stop updating and distributing the Adobe Flash technology at the end of 2020. Many providers of web-browsers have also communicated roadmaps for phasing out and removing Adobe Flash from their respective web-browsers by 2020. We are continuing to evaluate solutions to provide uninterrupted access to our web games. If we are unable to implement these solutions in time, or measures that we take disrupt our game experience, these games may become unavailable or their audiences may further decline, which would harm our business, financial condition and results of operations.
Failure to protect or enforce our intellectual property rights or the costs involved in such enforcement could harm our business, financial condition or results of operations.
We regard the protection of our trade secrets, copyrights, trademarks, service marks, trade dress, domain names, patents, and other product rights as critical to our success. We strive to protect our intellectual property rights by relying on federal, state and common law rights, as well as contractual restrictions and business practices. We enter into confidentiality and invention assignment agreements with our employees and contractors and confidentiality agreements with parties with whom we conduct business in order to limit access to, and disclosure and use of, our proprietary information. However, these contractual arrangements and business practices may not prevent the misappropriation of our proprietary information or deter independent development of similar technologies by others.
We pursue the registration of our copyrights, trademarks, service marks, domain names, and patents in the U.S. and in certain locations outside the U.S. This process can be expensive and time-consuming, may not always be successful depending on local laws or other circumstances, and we also may choose not to pursue registrations in every location depending on the nature of the project to which the intellectual property rights pertain. We may, over time, increase our investments in protecting our creative works.
Litigation may be necessary to enforce our intellectual property rights, protect our trade secrets or determine the validity and scope of proprietary rights claimed by others. For example, we have brought actions to protect our “Zynga Poker,” “Ville,” and “With Friends” franchises against third-party uses of those intellectual property assets and brands. Any litigation of this nature, regardless of outcome or merit, could result in substantial costs, adverse publicity, and diversion of management and technical resources, any of which could adversely affect our business, financial condition or results of operations. If we fail to maintain, protect and enhance our intellectual property rights, our business, financial condition or results of operations may be harmed.
Our ability to acquire and maintain licenses to intellectual property may affect our revenue and profitability. Competition for these licenses may make them more expensive and increase our costs.
While most of the intellectual property we use in our games is created by us, we also acquire rights to third-party intellectual property. For example, we use licensed intellectual property as creative assets in games such as Willy Wonka and the Chocolate Factory Slots, Hit It Rich! Slots, Spin it Rich! Slots, Wizard of Oz: Magic Match, Wizard of Oz Slots and Black Diamond Casino.
Proprietary licenses typically limit our use of intellectual property to specific uses and for specific time periods, and include other contractual obligations with which we must comply. Competition for these licenses is intense, and often results in increased advances, minimum payment guarantees and royalties that we must pay to the licensor. If we are unable to obtain and remain in compliance with the terms of these licenses or obtain additional licenses on reasonable economic terms, our revenue and profitability may be adversely impacted.
In addition, many of our games are built on propriety source code of third parties, such as Unity. If we are unable to renew licenses to proprietary source code underlying our games, or the terms and conditions of these licenses change at the time of renewal our business, financial condition or results of operations could be negatively impacted. We rely on third parties, including Unity, to maintain versions of their proprietary engines that allow us to ship our games on multiple platforms. If a third party from whom we license source code discontinues support for one or more of these platforms, our business, financial condition or results of operations could be negatively impacted.
We are, and may in the future be, subject to intellectual property disputes, which are costly to defend and could require us to pay significant damages and could limit our ability to use certain technologies in the future.
From time to time, we have faced, and we may face in the future, allegations that we have infringed the trademarks, copyrights, patents and other intellectual property rights of third parties, including from our competitors, non-practicing entities and former employers of our personnel. Intellectual property litigation may be protracted and expensive, and the results are difficult to predict. As
17
the result of any court judgment or settlement, we may be obligated to cancel the launch of a new game, stop offering a game or certain features of a game in a particular geographic region or worldwide, pay royalties or significant settlement costs, purchase licenses or modify our games and features, or develop substitutes.
In addition, we use open source software in our games and expect to continue to use open source software in the future. From time to time, we may face claims from companies that incorporate open source software into their products, claiming ownership of, or demanding release of, the source code, the open source software and/or derivative works that were developed using such software, or otherwise seeking to enforce the terms of the applicable open source license. These claims could also result in litigation, require us to purchase a costly license or require us to devote additional research and development resources to change our games, any of which would have a negative effect on our business, financial condition or results of operations.
We are involved in legal proceedings that may result in adverse outcomes.
We are involved in claims, suits, government investigations, and proceedings arising in the ordinary course of our business, including actions with respect to intellectual property claims, privacy, data protection or law enforcement matters, tax matters, labor and employment claims, commercial and acquisition-related claims, as well as stockholder derivative actions, class action lawsuits, and other matters. Such claims, suits, government investigations, and proceedings are inherently uncertain and their results cannot be predicted with certainty. Regardless of their outcomes, such legal proceedings can have an adverse impact on us because of legal costs, diversion of management and other personnel, and other factors. In addition, it is possible that a resolution of one or more such proceedings could result in liability, penalties, or sanctions, as well as judgments, consent decrees, or orders preventing us from offering certain features, functionalities, products, or services, or requiring a change in our business practices, products or technologies, which could in the future materially and adversely affect our business, financial condition or results of operations. See the section titled “Legal Matters” included in Note 14 – “Commitments and Contingencies” in the notes to the consolidated financial statements included herein.
Our business is subject to a variety of U.S. and foreign laws, many of which are unsettled and still developing and which could subject us to claims or otherwise harm our business.
We are subject to a variety of laws in the U.S. and abroad that affect our business, including state and federal laws regarding consumer protection, electronic marketing, protection of minors, data protection, competition, taxation, intellectual property, export and national security, that are continuously evolving and developing. The scope and interpretation of the laws that are or may be applicable to us are often uncertain and may be conflicting, particularly laws outside the U.S. There is a risk that these laws may be interpreted in a manner that is not consistent with our current practices, and could have an adverse effect on our business. It is also likely that as our business grows and evolves and our games are played in a greater number of countries, we will become subject to laws and regulations in additional jurisdictions or other jurisdictions may claim that we are required to comply with their laws and regulations.
We are potentially subject to a number of foreign and domestic laws and regulations that affect the offering of certain types of content, such as that which depicts violence, many of which are ambiguous, still evolving and could be interpreted in ways that could harm our business or expose us to liability. In addition, there are ongoing academic, political and regulatory discussions in the U.S., Europe, Australia and other jurisdictions regarding whether social casino applications should be subject to a higher level or different type of regulation than other social game applications to protect consumers, in particular minors and persons susceptible to addiction to social casino games, and, if so, what this regulation should include. If new social casino regulations are imposed, or other regulations are interpreted to apply to our social casino games, certain of (or all of) our casino-themed games may become subject to the rules and regulations and expose us to civil and criminal penalties if we do not comply. Heightened regulation could increase the cost of running our social casino games, make our games more difficult to access, decrease our user base or otherwise harm our business, financial condition or results of operations.
It is difficult to predict how existing laws will be applied to our business or the new laws to which we may become subject. If we are not able to comply with these laws or regulations or if we become liable under these laws or regulations, we could be directly harmed, and we may be forced to implement new measures to reduce our exposure to this liability. This may require us to expend substantial resources or to modify our games, which would harm our business, financial condition and results of operations. In addition, the increased attention focused upon liability issues as a result of lawsuits and legislative proposals could harm our reputation or otherwise impact the growth of our business. Any costs incurred as a result of this potential liability could harm our business, financial condition or results of operations.
It is possible that a number of laws and regulations may be adopted or construed to apply to us in the U.S. and elsewhere that could restrict the online and mobile industries, including player privacy, advertising, taxation, content suitability, copyright, distribution and antitrust. Furthermore, the growth and development of electronic commerce and virtual goods may prompt calls for more stringent consumer protection laws that may impose additional burdens on companies such as ours conducting business through the Internet and mobile devices. We anticipate that scrutiny and regulation of our industry will increase and we will be required to devote legal and other resources to addressing such regulation. For example, existing laws or new laws regarding the marketing of in-
18
app purchases, labeling of free-to-play games, regulation of currency and banking institutions unclaimed property and money transmission may be interpreted to cover our games and the virtual currency, goods or payments that we receive. If that were to occur we may be required to seek licenses, authorizations or approvals from relevant regulators, the granting of which may be dependent on us meeting certain capital and other requirements and we may be subject to additional regulation and oversight, all of which could significantly increase our operating costs. Changes in current laws or regulations or the imposition of new laws and regulations in the U.S. or elsewhere regarding these activities may lessen the growth of social game services and impair our business, financial condition or results of operations.
Our international operations are subject to increased challenges and risks.
Continuing to expand our business to attract players in countries other than the U.S. is a critical element of our business strategy. An important part of targeting international markets is developing offerings that are localized and customized for the players in those markets. We expect to continue to expand our international operations in the future by opening new international studio locations and expanding our offerings in new languages. Our ability to expand our business and to attract talented employees and players in an increasing number of international markets will require considerable management attention and resources and is subject to the particular challenges of supporting a rapidly growing business in an environment of multiple languages, cultures, customs, legal systems, alternative dispute systems, regulatory systems and commercial infrastructures. We have experienced difficulties in the past and have not been successful in all the countries we have entered. Expanding our international focus may subject us to risks that we have not faced before or increase risks that we currently face, including risks associated with:
|
|
• |
inability to offer certain games in certain foreign countries; |
|
|
• |
recruiting and retaining talented and capable management and employees in foreign countries; |
|
|
• |
challenges caused by distance, language and cultural differences; |
|
|
• |
developing and customizing games and other offerings that appeal to the tastes and preferences of players in international markets; |
|
|
• |
competition from local game makers with intellectual property rights and significant market share in those markets and with a better understanding of player preferences; |
|
|
• |
utilizing, protecting, defending and enforcing our intellectual property rights; |
|
|
• |
negotiating agreements with local distribution platforms that are sufficiently economically beneficial to us and protective of our rights; |
|
|
• |
the inability to extend proprietary rights in our brand, content or technology into new jurisdictions; |
|
|
• |
implementing alternative payment methods for virtual goods in a manner that complies with local laws and practices and protects us from fraud; |
|
|
• |
compliance with applicable foreign laws and regulations, including privacy laws and laws relating to content and consumer protection (for example, the United Kingdom’s Office of Fair Trading’s 2014 principles relating to in-app purchases in free-to-play games that are directed toward children 16 and under); |
|
|
• |
compliance with anti-bribery laws, including the Foreign Corrupt Practices Act; |
|
|
• |
credit risk and higher levels of payment fraud; |
|
|
• |
currency exchange rate fluctuations; |
|
|
• |
protectionist laws and business practices that favor local businesses in some countries; |
|
|
• |
double taxation of our international earnings and potentially adverse tax consequences due to changes in the tax laws of the U.S. or the foreign jurisdictions in which we operate; |
|
|
• |
political, economic and social instability; |
|
|
• |
higher costs associated with doing business internationally; |
|
|
• |
export or import regulations; and |
|
|
• |
trade and tariff restrictions. |
If we are unable to manage the complexity of our global operations successfully, our business, financial condition and operating results could be adversely affected. Additionally, our ability to successfully gain market acceptance in any particular market is uncertain, and the distraction of our senior management team could harm our business, financial condition or results of operations.
19
The vote by the United Kingdom to exit from the European Union could harm our business, financial condition or results of operations.
On March 29, 2017, the United Kingdom triggered Article 50 of the Treaty on European Union by notifying the European Council of its intention to withdraw from the European Union (commonly referred to as the “Brexit”). Negotiations have commenced to determine the future terms of the United Kingdom’s relationship with the European Union, including the terms of trade between the U.K. and the European Union. The effects of Brexit will depend on any agreements the United Kingdom makes to retain access to European Union markets either during a transitional period or more permanently. Brexit could lead to legal uncertainty and potentially divergent national laws and regulations as the United Kingdom determines which European Union laws to replace or replicate.
The announcement of Brexit caused (and the actual exit of the United Kingdom from the European Union is expected to cause future) significant volatility in global stock markets, which could cause our stock price to be subject to wide fluctuations, and significant fluctuations in foreign currency exchange rates, which will affect our financial results as we report in U.S. dollars and may affect our ability to attract and retain employees in the United Kingdom. The announcement of Brexit also created (and the actual exit of the United Kingdom from the European Union may create future) global economic uncertainty, which may cause our players to reduce the amount of money they spend on our games. The actual exit of the United Kingdom from the European Union could cause disruptions to and create uncertainty surrounding our business, including affecting our NaturalMotion operations and relationships with existing and future players, suppliers and employees. Any of these effects of Brexit, and others we cannot anticipate, could harm our business, financial condition or results of operations.
Companies and governmental agencies may restrict access to Facebook, our website, mobile applications or the Internet generally, which could lead to the loss or slower growth of our player base.
Our players generally need to access the Internet and in particular platforms such as Facebook, Apple, Google and our website to play our games. Companies and governmental agencies could block access to Facebook, our website, mobile applications or the Internet generally for a number of reasons such as security or confidentiality concerns or regulatory reasons, or they may adopt policies that prohibit employees from accessing Facebook, Apple, Google and our website or other social platforms. If companies or governmental entities block or limit such or otherwise adopt policies restricting players from playing our games, our business could be negatively impacted and could lead to the loss or slower growth of our player base.
Changes in tax laws or tax rulings could materially affect our effective tax rates, financial position and results of operations.
The tax regimes we are subject to or operate under are unsettled and may be subject to significant change. Changes in tax laws or tax rulings, or changes in interpretations of existing laws, could cause us to be subject to additional income-based taxes and non-income taxes (such as payroll, sales, use, value-added, net worth, property, and goods and services taxes), which in turn could materially affect our financial position and results of operations. In December 2017, the U.S. federal government enacted the Tax Cuts and Jobs Act (“2017 Tax Act”). The 2017 Tax Act significantly changed the existing U.S. corporate income tax laws by, among other things, lowering the corporate tax rate, implementing a territorial tax system, and imposing a one-time deemed repatriation toll tax on cumulative undistributed foreign earnings. The 2017 Tax Act will have a meaningful impact on our provision for income taxes. Due to the timing of the enactment and the complexity involved in applying the provisions of the 2017 Tax Act, we made reasonable estimates of the effects and recorded provisional amounts in our financial statements for the year ended December 31, 2017. The U.S. Treasury Department, the Internal Revenue Service (IRS), and other standard-setting bodies may issue guidance on how provisions of the 2017 Tax Act will be applied or otherwise administered that is different from our interpretation. As we collect and prepare necessary data, and interpret the 2017 Tax Act and any additional guidance issued by the IRS or other standard-setting bodies, we may make adjustments to the provisional amounts that could materially affect our financial position and results of operations as well as our effective tax rate in the period in which the adjustments are made. In addition, many countries in the European Union, as well as a number of other countries and organizations such as the Organization for Economic Cooperation and Development, have recently proposed or recommended changes to existing tax laws or have enacted new laws that could impact our tax obligations. Any significant changes to our future effective tax rate, including final resolution of provisional amounts relating to effects of the 2017 Tax Act, may result in a material adverse effect on our business, financial condition, results of operations, or cash flows. For more information, see Note 7 – “Income Taxes” in the notes to the consolidated financial statements included herein.
20
We may have exposure to greater than anticipated tax liabilities.
Our income tax obligations are based in part on our corporate operating structure and intercompany arrangements, including the manner in which we develop, value, manage, and use our intellectual property and the valuation of our intercompany transactions. The tax laws applicable to our business, including the laws of the U.S. and other jurisdictions, are subject to interpretation and certain jurisdictions are aggressively interpreting their laws in new ways in an effort to raise additional tax revenue. Our existing corporate structure and intercompany arrangements have been implemented in a manner we believe is in compliance with current prevailing tax laws. However, the taxing authorities of the jurisdictions in which we operate may challenge our methodologies for valuing developed technology or intercompany arrangements, which could impact our worldwide effective tax rate and harm our financial position and results of operations.
We may require additional capital to meet our financial obligations and support business growth, and this capital might not be available on acceptable terms or at all.
We intend to continue to make significant investments to support our business growth and may require additional funds to respond to business challenges, including the need to develop new games and features or enhance our existing games, improve our operating infrastructure or acquire complementary businesses, personnel and technologies. Accordingly, we may need to engage in equity or debt financings to secure additional funds. If we raise additional funds through future issuances of equity or convertible debt securities, our existing stockholders could suffer significant dilution, and any new equity securities we issue could have rights, preferences and privileges superior to those of holders of our Class A common stock. Any debt financing that we secure in the future could involve restrictive covenants relating to our capital raising activities and other financial and operational matters, which may make it more difficult for us to obtain additional capital and to pursue business opportunities, including potential acquisitions. We may not be able to obtain additional financing on terms favorable to us, if at all. If we are unable to obtain adequate financing or financing on terms satisfactory to us when we require it, our ability to continue to support our business growth and to respond to business challenges could be significantly impaired, and our business, financial condition or results of operations may be harmed.
We own our corporate headquarters located in San Francisco, California. The occurrence of an earthquake or other natural disaster at or near any of our facilities could cause damage to our facilities and equipment, which could require us to curtail or cease operations.
Our principal offices are located in the San Francisco Bay Area, an area known for earthquakes, and are thus vulnerable to damage. We own our corporate headquarters and lease certain office space to commercial tenants. All of our facilities are also vulnerable to damage from natural or manmade disasters, including power loss, fire, explosions, floods, communications failures, terrorist attacks and similar events. If any disaster were to occur, our ability to operate our business at our facilities could be impaired, we could incur significant losses, recovery from which may require substantial time and expense.
Risks Related to Our Class A Common Stock
The three class structure of our common stock has the effect of concentrating voting control with those stockholders who held our stock prior to our initial public offering, including our founder and certain other executive officers, employees and directors and their affiliates; this limits our other stockholders’ ability to influence corporate matters.
Our Class C common stock has 70 votes per share, our Class B common stock has seven votes per share and our Class A common stock has one vote per share. Mr. Pincus, our Executive Chairman, beneficially owned approximately 10% of our total outstanding capital stock as of December 31, 2017, which represented approximately 70% of the voting power of our outstanding capital stock as of such date. As a result, Mr. Pincus has significant influence over the management and affairs of the Company and control over matters requiring stockholder approval, including the election of directors and significant corporate transactions, such as a merger or other sale of our Company or our assets. Mr. Pincus may hold this voting power for the foreseeable future, subject to additional issuances of stock by the Company or sales by Mr. Pincus. This concentrated voting control limits the ability of our other stockholders to influence corporate matters and could adversely affect the market price of our Class A common stock.
Future transfers or sales by holders of Class B common stock or Class C common stock will result in those shares converting to Class A common stock, which will have the effect, over time, of increasing the relative voting power of those stockholders who retain their existing shares of Class B or Class C common stock. In addition, as shares of Class B common stock are transferred or sold and converted to Class A common stock, the sole holder of Class C common stock, Mr. Pincus, will have greater relative voting control to the extent he retains his existing shares of Class C common stock, and as a result he could in the future continue to control a majority of our total voting power. Mr. Pincus is entitled to vote the shares he beneficially owns in his own interests and may do so.
21
Our share price has been and will likely continue to be volatile.
The trading price of our Class A common stock has been, and is likely to continue to be, highly volatile and could be subject to wide fluctuations in response to various factors, some of which are beyond our control. During the 2017 fiscal year, the stock price of our Class A common stock ranged from $2.40 to $4.34. In addition to the factors discussed in these “Risk Factors” and elsewhere in this filing, factors that may cause volatility in our share price include:
|
|
• |
changes in projected operational and financial results; |
|
|
• |
issuance of new or updated research or reports by securities analysts; |
|
|
• |
market rumors or press reports; |
|
|
• |
announcements related to our share repurchase program; |
|
|
• |
our announcement of significant transactions; |
|
|
• |
the use by investors or analysts of third-party data (such as AppData, AppAnnie, comScore, and SensorTower) regarding our business and operating metrics which may not reflect our actual performance or financial results; |
|
|
• |
fluctuations in the valuation of companies perceived by investors to be comparable to us; |
|
|
• |
the activities, public announcements and financial performance of our commercial partners, such as Facebook, Apple and Google; |
|
|
• |
fluctuations in the trading volume of our shares, or the size of our public float relative to the total number of shares of our Class A, Class B and Class C common stock that are issued and outstanding; |
|
|
• |
share price and volume fluctuations attributable to inconsistent trading volume levels of our shares; and |
|
|
• |
general economic and market conditions. |
Furthermore, the stock markets have experienced extreme price and volume fluctuations that have affected and continue to affect the market prices of equity securities of many companies. These fluctuations often have been unrelated or disproportionate to the operating performance of those companies. These broad market and industry fluctuations, as well as general economic, political and market conditions such as recessions, interest rate changes or international currency fluctuations, may negatively impact the market price of our Class A common stock. In the past, companies that have experienced volatility in the market price of their stock have been subject to securities class action litigation. We have been the target of this type of litigation as described in the section titled “Legal Matters” included in Note 14 —“Commitments and Contingencies” in the notes to the consolidated financial statements included herein. Securities litigation against us could result in substantial costs and divert our management’s attention from other business concerns, which could harm our business.
In addition, in November 2016, the 2016 Share Repurchase Program was authorized for up to $200 million of our outstanding Class A common stock that remains in effect through the end of October 2018. The timing and amount of any stock repurchases will be determined based on market conditions, share price and other factors. The 2016 Share Repurchase Program does not require us to repurchase any specific number of shares of our Class A common stock, and may be modified, suspended or terminated at any time without notice. The 2016 Share Repurchase Program will be funded from existing cash on hand or other sources of financing as the Company may determine to be appropriate. Share repurchases under these authorizations may be made through a variety of methods, which may include open market purchases, privately negotiated transactions, block trades, accelerated share repurchase transactions, purchases through 10b5-1 plans or by any combination of such methods. Repurchases of our Class A common stock in the open market could result in increased volatility in our stock price. There is no guarantee that we will do any share repurchases under the 2016 Share Repurchase Program or otherwise in the future.
Certain provisions in our charter documents and under Delaware law could limit attempts by our stockholders to replace or remove our Board of Directors or current management and limit the market price of our Class A common stock.
Provisions in our certificate of incorporation and bylaws may have the effect of delaying or preventing changes in our Board of Directors or management. Our certificate of incorporation and bylaws include provisions that:
|
|
• |
establish an advance notice procedure for stockholder proposals to be brought before an annual meeting, including proposed nominations of persons for election to our Board of Directors; |
|
|
• |
prohibit cumulative voting in the election of directors; and |
|
|
• |
reflect three classes of common stock, as discussed above. |
22
These provisions may frustrate or prevent any attempts by our stockholders to replace or remove our current management by making it more difficult for stockholders to replace members of our Board of Directors, which is responsible for appointing the members of our management. In addition, because we are incorporated in Delaware, we are governed by the provisions of Section 203 of the Delaware General Corporation Law, which generally prohibits a Delaware corporation from engaging in any of a broad range of business combinations with any “interested” stockholder for a period of three years following the date on which the stockholder became an “interested” stockholder.
Our Class A common stock price may be volatile due to third-party data regarding our games.
Third parties, such as AppData, AppAnnie, comScore, and SensorTower publish daily data about us and other social game companies with respect to DAUs and MAUs, monthly revenue, time spent per user and other information concerning social game usage. These metrics can be volatile, particularly for specific games, and in many cases do not accurately reflect the actual levels of usage of our games across all platforms and may not correlate to our bookings or revenue from the sale of virtual goods. There is a possibility that third parties could change their methodologies for calculating these metrics in the future. To the extent that securities analysts or investors base their views of our business or prospects on such third-party data, the price of our Class A common stock may be volatile and may not reflect the performance of our business.
If securities or industry analysts do not publish research about our business, or publish negative reports about our business, our share price and trading volume could decline.
The trading market for our Class A common stock, to some extent, depends on the research and reports that securities or industry analysts publish about our business. We do not have any control over these analysts. If one or more of the analysts who cover us downgrade our shares or lower their opinion of our shares, our share price would likely decline. If one or more of these analysts cease coverage of our company or fail to regularly publish reports on us, we could lose visibility in the financial markets, which could cause our share price or trading volume to decline.
If we are unable to implement and maintain effective internal control over financial reporting in the future, the accuracy and timeliness of our financial reporting may be adversely affected.
If we are unable to maintain adequate internal controls for financial reporting in the future, or if our auditors are unable to express an opinion as to the effectiveness of our internal controls as required pursuant to the Sarbanes-Oxley Act, investor confidence in the accuracy of our financial reports may be impacted or the market price of our Class A common stock could be negatively impacted.
The requirements of being a public company may strain our resources, divert management’s attention and affect our ability to attract and retain qualified Board members.
We are subject to the reporting requirements of the Securities Exchange Act of 1934, as amended (the “Exchange Act”), the Sarbanes-Oxley Act, the Dodd-Frank Act, the listing requirements of the NASDAQ Global Select Market and other applicable securities rules and regulations. Compliance with these rules and regulations has increased and will continue to increase our legal and financial compliance costs, make some activities more difficult, time-consuming or costly and increase demand on our systems and resources. The Exchange Act requires, among other things, that we file annual, quarterly and current reports with respect to our business and operating results.
As a result of disclosure of information in our public filings with the SEC as required of a public company, our business and financial condition have become more visible, which we believe may result in threatened or actual litigation, including by competitors and other third parties. If such claims are successful, our business, financial condition or results of operations could be harmed, and even if the claims do not result in litigation or are resolved in our favor, these claims, and the time and resources necessary to resolve them, could divert the resources of our management and harm our business, financial condition or results of operations.
We have no plans to pay dividends for the foreseeable future.
We have never declared or paid any cash dividends on our common stock and do not have any plans to pay cash dividends in the foreseeable future. Any determination to pay dividends in the future will be at the discretion of our Board of Directors. Accordingly, investors must rely on sales of their Class A common stock after price appreciation, which may never occur, as the only way to realize any future gains on their investments.
23
ITEM 1B. UNRESOLVED STAFF COMMENTS
None.
We own our San Francisco, California corporate headquarters, an office building of approximately 669,000 square feet. We use approximately 317,000 square feet for our operations and lease most of the remainder to third-party tenants under leases that range in terms from month-to-month to terms through 2027. Our corporate headquarters currently accommodates our principal executive, development, engineering, marketing, business development, human resources, finance, legal, information technology and administrative activities.
We lease additional domestic office space in San Francisco, California; Santa Clara, California; Carlsbad, California; Culver City, California; Eugene, Oregon; Austin, Texas; Chicago, Illinois; and New York, New York. We lease offices for our foreign operations in Toronto, Canada; Victoria, Canada; Bangalore, India; Dublin, Ireland; Helsinki, Finland; Istanbul, Turkey; Warwickshire, England; Oxford, England; Brighton, England; and London, England. These additional domestic and international facilities total approximately 247,000 square feet, excluding properties for which we cannot reliably estimate square footage. The excluded properties include shared corporate office spaces whereby rent is determined based on the number of individuals utilizing the space over a specified period of time.
We believe that our existing facilities are sufficient for our current needs. We believe that suitable additional or substitute space will be available as needed to accommodate changes in our operations.
For a description of our material legal proceedings, see the section titled “Legal Matters’ included in Note 14 —“Commitments and Contingencies” in the notes to the consolidated financial statements, which is incorporated by reference herein.
ITEM 4. MINE SAFETY DISCLOSURES
Not applicable.
24
ITEM 5. MARKET FOR REGISTRANT’S COMMON EQUITY, RELATED STOCKHOLDER MATTERS AND ISSUER PURCHASES OF EQUITY SECURITIES
Our Class A common stock has been listed on the NASDAQ Global Select Market under the symbol “ZNGA” since December 16, 2011. Prior to that time, there was no public market for our stock. The following table sets forth for the indicated periods the high and low closing prices per share for our Class A common stock on the NASDAQ Global Select Market.
|
|
|
High |
|
|
Low |
|
||
|
First Quarter 2016 |
|
$ |
2.65 |
|
|
$ |
1.78 |
|
|
Second Quarter 2016 |
|
$ |
2.68 |
|
|
$ |
2.18 |
|
|
Third Quarter 2016 |
|
$ |
3.02 |
|
|
$ |
2.47 |
|
|
Fourth Quarter 2016 |
|
$ |
3.08 |
|
|
$ |
2.52 |
|
|
First Quarter 2017 |
|
$ |
2.95 |
|
|
$ |
2.40 |
|
|
Second Quarter 2017 |
|
$ |
3.86 |
|
|
$ |
2.73 |
|
|
Third Quarter 2017 |
|
$ |
4.02 |
|
|
$ |
3.47 |
|
|
Fourth Quarter 2017 |
|
$ |
4.34 |
|
|
$ |
3.63 |
|
Our Class B common stock and Class C common stock are not listed nor traded on any stock exchange, but are convertible into shares of our Class A common stock on a one-for-one basis.
Holders of Record
Many of our shares of Class A common stock are held by brokers and other institutions on behalf of our stockholders and accordingly, we are unable to estimate the total number of stockholders represented by these record holders. Excluding such brokers and institutions, as of December 31, 2017, there were approximately 203 stockholders of record of our Class A common stock and the closing price of our Class A common stock was $4.00 per share as reported on the NASDAQ Global Select Market. As of December 31, 2017, there were also approximately 403 stockholders of record of our Class B common stock and Mr. Pincus, our Executive Chairman of our Board of Directors, remains the only holder of Class C common stock.
Dividend Policy
We have never declared or paid any cash dividend on our Class A common stock. We intend to retain any future earnings and do not expect to pay dividends in the foreseeable future.
Issuer Purchases of Equity Securities
In November 2016, we authorized the 2016 Share Repurchase Program. During 2016, we repurchased 12.3 million shares of our Class A common stock under the 2016 Share Repurchase Program at a weighted average price of $2.76 per share for a total of $34.2 million. During 2017, we repurchased 36.3 million shares of our Class A common stock under the 2016 Share Repurchase Program at a weighted average price of $2.78 per share for a total of $101.0 million.
Repurchases of our Class A common stock during the fourth quarter of 2017 were as follows:
|
Period |
|
Total Number of Shares Purchased |
|
|
Average Price Paid per Share |
|
|
Total Number of Shares Purchased as Part of Publicly Announced Programs |
|
|
Maximum Dollar Value That May Yet Be Purchased Under the Program |
|
||||
|
October 1 - October 31, 2017 |
|
|
— |
|
|
$ |
— |
|
|
|
— |
|
|
$ |
72,872,462 |
|
|
November 1 - November 30, 2017 |
|
|
2,077,862 |
|
|
$ |
3.89 |
|
|
|
2,077,862 |
|
|
$ |
64,783,192 |
|
|
December 1 - December 31, 2017 |
|
|
— |
|
|
$ |
— |
|
|
|
— |
|
|
$ |
64,783,192 |
|
|
Total |
|
|
2,077,862 |
|
|
$ |
3.89 |
|
|
|
2,077,862 |
|
|
|
|
|
25
Stock Performance Graph
The following graph compares the cumulative total stockholder return for our Class A common stock, the Standard and Poor’s 500 Stock Index (the “S&P 500 Index”) and the NASDAQ Composite Index. The measurement points in the graph below are December 16, 2011 (the first trading day of our Class A common stock on the NASDAQ Global Select Market) and December 29, 2017 (the last trading day of 2017). The graph assumes that $100 was invested on December 16, 2011 in our Class A common stock, the S&P 500 Index and the NASDAQ Composite Index. As we have not paid any dividends, our cumulative total return calculation is based solely upon stock price appreciation and not upon reinvestment of any dividends. The stock price performance on the following graph is not necessarily indicative of future stock price performance.
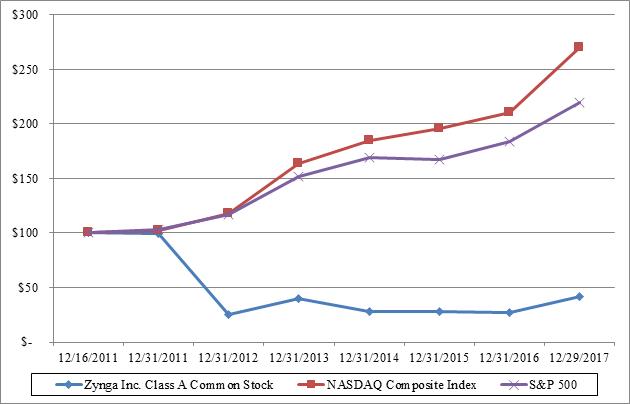
The information furnished under the heading “Stock Performance Graph”, including the performance graph, shall not be deemed “filed” for purposes of Section 18 of the Exchange Act or otherwise subject to the liabilities of that section, nor shall it be deemed incorporated by reference into any other filing under the Securities Act of 1933, as amended or the Exchange Act, except as expressly set forth by specific reference in such a filing.
26
ITEM 6. SELECTED CONSOLIDATED FINANCIAL AND OTHER DATA
The following selected consolidated financial and other data should be read in conjunction with “Management’s Discussion and Analysis of Financial Condition and Results of Operations” and our audited consolidated financial statements and related notes, which are included elsewhere in this Annual Report on Form 10-K. The consolidated statements of operations data for the years ended December 31, 2017, 2016 and 2015 as well as the consolidated balance sheet data as of December 31, 2017 and 2016 are derived from the audited consolidated financial statements that are included in Item 8 – Financial Statements and Supplementary Data in this Annual Report on Form 10-K. The consolidated statement of operations data for the 12 months ended December 31, 2014 and 2013 as well as the consolidated balance sheet data as of December 31, 2015, 2014 and 2013, are derived from audited consolidated financial statements that are not included in this Annual Report on Form 10-K. Our historical results are not necessarily indicative of the results to be expected in the future.
|
|
|
Year Ended December 31, |
|
|||||||||||||||||
|
|
|
2017 |
|
|
2016 |
|
|
2015 |
|
|
2014 |
|
|
2013 |
|
|||||
|
|
|
(in thousands, except per share, user and ABPU data) |
|
|||||||||||||||||
|
Consolidated Statements of Operations Data: |
|
|
|
|
|
|
|
|
|
|
|
|
|
|
|
|
|
|
|
|
|
Revenue: |
|
|
|
|
|
|
|
|
|
|
|
|
|
|
|
|
|
|
|
|
|
Online game |
|
$ |
665,593 |
|
|
$ |
547,291 |
|
|
$ |
590,755 |
|
|
$ |
537,619 |
|
|
$ |
759,572 |
|
|
Advertising and other |
|
|
195,797 |
|
|
|
194,129 |
|
|
|
173,962 |
|
|
|
152,791 |
|
|
|
113,694 |
|
|
Total revenue |
|
|
861,390 |
|
|
|
741,420 |
|
|
|
764,717 |
|
|
|
690,410 |
|
|
|
873,266 |
|
|
Costs and expenses: |
|
|
|
|
|
|
|
|
|
|
|
|
|
|
|
|
|
|
|
|
|
Cost of revenue |
|
|
258,971 |
|
|
|
238,546 |
|
|
|
235,985 |
|
|
|
213,570 |
|
|
|
248,358 |
|
|
Research and development |
|
|
256,012 |
|
|
|
320,300 |
|
|
|
361,931 |
|
|
|
396,553 |
|
|
|
413,001 |
|
|
Sales and marketing |
|
|
212,030 |
|
|
|
183,637 |
|
|
|
169,573 |
|
|
|
157,364 |
|
|
|
104,403 |
|
|
General and administrative |
|
|
108,653 |
|
|
|
92,509 |
|
|
|
143,284 |
|
|
|
167,664 |
|
|
|
162,918 |
|
|
Impairment of intangible assets |
|
|
— |
|
|
|
20,677 |
|
|
|
— |
|
|
|
— |
|
|
|
10,217 |
|
|
Total costs and expenses |
|
|
835,666 |
|
|
|
855,669 |
|
|
|
910,773 |
|
|
|
935,151 |
|
|
|
938,897 |
|
|
Income (loss) from operations |
|
|
25,724 |
|
|
|
(114,249 |
) |
|
|
(146,056 |
) |
|
|
(244,741 |
) |
|
|
(65,631 |
) |
|
Interest income |
|
|
5,309 |
|
|
|
3,057 |
|
|
|
2,568 |
|
|
|
3,266 |
|
|
|
4,148 |
|
|
Other income (expense), net |
|
|
6,550 |
|
|
|
6,461 |
|
|
|
13,306 |
|
|
|
8,248 |
|
|
|
(3,386 |
) |
|
Income (loss) before income taxes |
|
|
37,583 |
|
|
|
(104,731 |
) |
|
|
(130,182 |
) |
|
|
(233,227 |
) |
|
|
(64,869 |
) |
|
Provision for (benefit from) income taxes |
|
|
10,944 |
|
|
|
3,442 |
|
|
|
(8,672 |
) |
|
|
(7,327 |
) |
|
|
(27,887 |
) |
|
Net income (loss) |
|
$ |
26,639 |
|
|
$ |
(108,173 |
) |
|
$ |
(121,510 |
) |
|
$ |
(225,900 |
) |
|
$ |
(36,982 |
) |
|
Net income (loss) per share attributable to common stockholders |
|
|
|
|
|
|
|
|
|
|
|
|
|
|
|
|
|
|
|
|
|
Basic |
|
$ |
0.03 |
|
|
$ |
(0.12 |
) |
|
$ |
(0.13 |
) |
|
$ |
(0.26 |
) |
|
$ |
(0.05 |
) |
|
Diluted |
|
$ |
0.03 |
|
|
$ |
(0.12 |
) |
|
$ |
(0.13 |
) |
|
$ |
(0.26 |
) |
|
$ |
(0.05 |
) |
|
Weighted average common shares used to compute net income (loss) per share attributable to common stockholders: |
|
|
|
|
|
|
|
|
|
|
|
|
|
|
|
|
|
|
|
|
|
Basic |
|
|
869,067 |
|
|
|
878,827 |
|
|
|
913,511 |
|
|
|
874,509 |
|
|
|
799,794 |
|
|
Diluted |
|
|
897,165 |
|
|
|
878,827 |
|
|
|
913,511 |
|
|
|
874,509 |
|
|
|
799,794 |
|
|
Other Non-GAAP Financial and Operational Data: |
|
|
|
|
|
|
|
|
|
|
|
|
|
|
|
|
|
|
|
|
|
Bookings(1) |
|
$ |
853,809 |
|
|
$ |
754,533 |
|
|
$ |
699,955 |
|
|
$ |
694,300 |
|
|
$ |
716,176 |
|
|
Other Non-GAAP Financial and Operational Data - Revised(6): |
|
|
|
|
|
|
|
|
|
|
|
|
|
|
|
|
|
|
|
|
|
Average DAUs (in millions)(2) |
|
|
21 |
|
|
|
19 |
|
|
|
21 |
|
|
|
26 |
|
|
|
36 |
|
|
Average MAUs (in millions)(3) |
|
|
80 |
|
|
|
64 |
|
|
|
81 |
|
|
|
110 |
|
|
|
164 |
|
|
Average MUUs (in millions)(4) |
|
|
52 |
|
|
|
55 |
|
|
|
57 |
|
|
|
70 |
|
|
|
104 |
|
|
ABPU(5) |
|
$ |
0.111 |
|
|
$ |
0.111 |
|
|
$ |
0.093 |
|
|
$ |
0.074 |
|
|
$ |
0.054 |
|
|
Other Non-GAAP Financial and Operational Data - As Reported: |
|
|
|
|
|
|
|
|
|
|
|
|
|
|
|
|
|
|
|
|
|
Average DAUs (in millions)(2) |
|
|
N/A |
|
|
|
N/A |
|
|
|
N/A |
|
|
|
27 |
|
|
|
37 |
|
|
Average MAUs (in millions)(3) |
|
|
N/A |
|
|
|
N/A |
|
|
|
N/A |
|
|
|
118 |
|
|
|
171 |
|
|
Average MUUs (in millions)(4) |
|
|
N/A |
|
|
|
N/A |
|
|
|
N/A |
|
|
|
81 |
|
|
|
112 |
|
|
ABPU(5) |
|
|
N/A |
|
|
|
N/A |
|
|
|
N/A |
|
|
$ |
0.071 |
|
|
$ |
0.053 |
|
|
(1) |
See the section titled “Non-GAAP Financial Measures” below for how we define and calculate bookings, a reconciliation between bookings and revenue – the most directly comparable U.S. GAAP financial measure – and a discussion about the limitation of bookings. |
|
(2) |
DAUs are the number of individuals who played one of our games during a particular day, as recorded by our internal analytics systems. Average DAUs is the average of the DAUs for each day during the period reported. See the section titled “Management’s Discussion and Analysis of Financial Condition and Results of Operations—Key Metrics—Key Operating Metrics—DAUs” for more information on how we define and calculate DAUs. |
|
(3) |
MAUs are the number of individuals who played a particular game during a 30-day-period, as recorded by our internal analytics systems. Average MAUs is the average of the MAUs at each month-end during the period reported. See the section titled “Management’s Discussion and Analysis of Financial Condition and Results of Operations—Key Metrics—Key Operating Metrics—MAUs” for more information on how we define and calculate MAUs. |
|
(4) |
MUUs are the number of unique individuals who played any of our games on a particular platform during a 30-day period, as recorded by our internal analytics systems. Average MUUs is the average of the MUUs at each month-end during the period reported. We are unable to distinguish whether players of certain games are also players of other Zynga games. As a result of this, we exclude players of these games from our calculation of the applicable key operating metric to avoid potential double counting. See the section titled “Management’s Discussion and Analysis of Financial Condition and Results of Operations—Key Metrics—Key Operating Metrics—MUUs” for more information on how we define and calculate MUUs. |
27
|
(5) |
ABPU is defined as our total bookings in a given period, divided by the number of days in that period, divided by the average DAUs during the period. See the section titled “Management’s Discussion and Analysis of Financial Condition and Results of Operations—Key Metrics—Key Operating Metrics—ABPU” for more information on how we define and calculate ABPU. |
|
(6) |
In the first quarter of 2015, the Company modified its calculation to take into account our business’ transition to mobile and updates to our operating metrics which utilize additional third party data to help us identify whether a player that logged in under two or more accounts is the same individual. As a result of these changes, we revised the definitions for DAUs, MAUs, MUUs and MUPs in the first quarter of 2015. Additionally, in the third quarter of 2015, the company made a subsequent modification to its calculation of MUUs to further reduce duplication of users of both web and mobile platforms. For comparative purposes, the above key operating metrics have been revised to reflect the Company’s current definitions and calculations for all periods presented. |
Stock-based compensation expense included in the consolidated statements of operations data above was as follows (in thousands):
|
|
|
Year Ended December 31, |
|
|||||||||||||||||
|
|
|
2017 |
|
|
2016 |
|
|
2015 |
|
|
2014 |
|
|
2013 |
|
|||||
|
Cost of revenue |
|
$ |
1,838 |
|
|
$ |
3,720 |
|
|
$ |
4,547 |
|
|
$ |
4,623 |
|
|
$ |
468 |
|
|
Research and development |
|
|
42,176 |
|
|
|
84,236 |
|
|
|
94,548 |
|
|
|
83,673 |
|
|
|
61,931 |
|
|
Sales and marketing |
|
|
7,281 |
|
|
|
7,254 |
|
|
|
7,501 |
|
|
|
5,927 |
|
|
|
8,079 |
|
|
General and administrative |
|
|
13,220 |
|
|
|
12,251 |
|
|
|
24,979 |
|
|
|
35,010 |
|
|
|
13,915 |
|
|
Total stock-based compensation |
|
$ |
64,515 |
|
|
$ |
107,461 |
|
|
$ |
131,575 |
|
|
$ |
129,233 |
|
|
$ |
84,393 |
|
|
|
|
As of December 31, |
|
|||||||||||||||||
|
|
|
2017 |
|
|
2016 |
|
|
2015 |
|
|
2014 |
|
|
2013 |
|
|||||
|
Consolidated Balance Sheets Data: |
|
|
|
|
|
|
|
|
|
|
|
|
|
|
|
|
|
|
|
|
|
Cash, cash equivalents and short-term investments |
|
$ |
681,376 |
|
|
$ |
852,467 |
|
|
$ |
987,250 |
|
|
$ |
1,147,909 |
|
|
$ |
1,541,970 |
|
|
Property and equipment, net |
|
|
266,589 |
|
|
|
269,439 |
|
|
|
273,221 |
|
|
|
297,919 |
|
|
|
348,793 |
|
|
Working capital(1) |
|
|
548,239 |
|
|
|
721,836 |
|
|
|
876,084 |
|
|
|
713,901 |
|
|
|
964,897 |
|
|
Total assets |
|
|
1,979,333 |
|
|
|
1,905,849 |
|
|
|
2,124,630 |
|
|
|
2,348,793 |
|
|
|
2,279,085 |
|
|
Deferred revenue |
|
|
134,575 |
|
|
|
142,156 |
|
|
|
129,043 |
|
|
|
193,805 |
|
|
|
189,915 |
|
|
Total stockholders’ equity |
|
|
1,641,240 |
|
|
|
1,580,664 |
|
|
|
1,786,901 |
|
|
|
1,895,692 |
|
|
|
1,877,271 |
|
|
(1) |
Working capital is defined as total current assets less total current liabilities. |
Non-GAAP Financial Measures
Bookings
To provide investors with additional information about our financial results, we disclose within this Annual Report on Form 10-K, bookings, a non-GAAP financial measure. We have provided below a reconciliation between bookings and revenue, the most directly comparable GAAP financial measure.
Bookings is a non-GAAP financial measure that is equal to revenue recognized plus or minus the change in deferred revenue during the period. We record the sale of virtual goods as deferred revenue and then recognize that revenue over the estimated life of the purchased virtual goods or as the virtual goods are consumed. Advertising sales, consisting of certain branded virtual goods and sponsorships are also deferred and recognized over the estimated average life of the branded virtual good, similar to online game revenue. For additional discussion of the estimated average life of durable virtual goods, see the section titled “Management’s Discussion and Analysis of Financial Condition and Results of Operations—Revenue Recognition” elsewhere in this Annual Report on Form 10-K.
We use bookings to evaluate the results of our operations, generate future operating plans and assess the performance of our company. While we believe that this non-GAAP financial measure is useful in evaluating our business, this information should be considered as supplemental in nature and is not intended to be considered in isolation of, as a substitute for, or as superior to, revenue recognized in accordance with U.S. GAAP. In addition, other companies, including companies in our industry, may calculate bookings differently or not at all, which reduces its usefulness as a comparative measure.
28
The following table is a reconciliation of revenue to bookings for each of the periods presented:
|
|
|
Year Ended December 31, |
|
|||||||||||||||||
|
|
|
2017 |
|
|
2016 |
|
|
2015 |
|
|
2014 |
|
|
2013 |
|
|||||
|
|
|
(in thousands) |
|
|||||||||||||||||
|
Reconciliation of Revenue to Bookings: |
|
|
|
|
|
|
|
|
|
|
|
|
|
|
|
|
|
|
|
|
|
Revenue |
|
$ |
861,390 |
|
|
$ |
741,420 |
|
|
$ |
764,717 |
|
|
$ |
690,410 |
|
|
$ |
873,266 |
|
|
Change in deferred revenue |
|
|
(7,581 |
) |
|
|
13,113 |
|
|
|
(64,762 |
) |
|
|
3,890 |
|
|
|
(157,090 |
) |
|
Bookings |
|
$ |
853,809 |
|
|
$ |
754,533 |
|
|
$ |
699,955 |
|
|
$ |
694,300 |
|
|
$ |
716,176 |
|
Limitations of Bookings
Key limitations of bookings are:
|
|
• |
bookings do not reflect that we defer and recognize online game revenue and revenue from certain advertising transactions over the estimated average life of durable virtual goods or as virtual goods are consumed; and |
|
|
• |
other companies, including companies in our industry, may calculate bookings differently or not at all, which reduces their usefulness as a comparative measure. |
Because of these limitations, bookings should be considered along with other financial performance measures, including revenue, net income (loss) and our other financial results presented in accordance with U.S. GAAP.
ITEM 7. MANAGEMENT’S DISCUSSION AND ANALYSIS OF FINANCIAL CONDITION AND RESULTS OF OPERATIONS
You should read the following discussion of our financial condition and results of operations in conjunction with the consolidated financial statements and the related notes included elsewhere in this Annual Report on Form 10-K. The following discussion contains forward-looking statements that reflect our plans, estimates and beliefs. Our actual results could differ materially from those discussed in the forward-looking statements. Factors that could cause or contribute to these differences include those discussed below and elsewhere in this Annual Report on Form 10-K, particularly in “Special Note Regarding Forward-Looking Statements” and “Risk Factors.” The forward-looking statements included in this Annual Report on Form 10-K are made only as of the date hereof.
Overview
We are a leading provider of social game services with approximately 80 million average MAUs during 2017. We develop, market and operate social games as live services played on mobile platforms, such as iOS and Android, and social networking sites such as Facebook. Generally, all of our games are free to play, and we generate revenue through the sale of in-game virtual goods (“online game revenue”) and advertising services (“advertising revenue”).
We are a pioneer and innovator of social games and a leader in making “play” a core activity on mobile devices and social networking sites. Our objective is to become the worldwide leader in play by connecting the world through games.
Consistent with our free-to-play business model, a small portion of our players have historically been payers. Because the opportunity for social interactions increases as the number of players increases, we believe that maintaining and growing our overall number of players, including the number of players who may not purchase virtual goods, is important to the success of our business. As a result, we believe that the number of players who choose to purchase virtual goods will continue to constitute a small portion of our overall players.
Our top three online game revenue-generating games historically have contributed a significant portion of our revenue, though the games that represent our top three online game revenue-generating games vary over time. Our top three online game revenue-generating games accounted for 45%, 44%, and 53% of our online game revenue in 2017, 2016 and 2015, respectively. In 2017, our top three online game revenue generating games were Zynga Poker, CSR Racing 2, and Hit It Rich! Slots. With respect to advertising and other revenue, our Words with Friends games generated a substantial portion of our advertising and other revenue in 2017, 2016 and 2015.
29
How We Generate Revenue
We operate our social games as live services that allow players to play for free. We generate revenue primarily from the sale of in-game virtual goods and advertising services. Revenue growth will continue to depend largely on our ability to attract and retain players and more effectively monetize our player base through the sale of in-game virtual goods and advertising services. We intend to do this through the launch of new games, enhancements to current games and expansion into new markets and distribution platforms.
Online game. We provide our players with the opportunity to purchase virtual goods that enhance their game-playing experience. We believe players choose to pay for virtual goods for the same reasons they are willing to pay for other forms of entertainment – they enjoy the additional playing time or added convenience, the ability to personalize their own game boards, the satisfaction of leveling up, and the opportunity for sharing creative expressions. We believe players are more likely to purchase virtual goods when they are connected to and playing with their friends, whether those friends play for free or also purchase virtual goods. Players may also elect to pay a one-time download fee to obtain certain mobile games free of third-party advertisements.
In 2017, our business continued generating a higher percentage of revenue and bookings through mobile platforms than through the Facebook platform. In 2017, we estimate that 51%, 33% and 12% of our revenue and 51%, 34% and 11% of our bookings were generated from Apple, Google and Facebook, respectively, while in 2016, we estimate that 46%, 29% and 20% of revenue and 47%, 30% and 18% of our bookings were generated from Apple, Google and Facebook, respectively. This information is estimated because certain payment methods we accept and certain advertising networks do not allow us to determine the platform used.
For all payment transactions in our games under Facebook’s local currency-based payments model, Facebook remits to us an amount equal to 70% of the price we requested to be charged to our players. On platforms other than Facebook, players purchase our virtual goods through various widely accepted payment methods offered in the games, including Apple iTunes accounts, Google Wallet, PayPal and credit cards.
Advertising and other. Advertising revenue primarily includes mobile and display ads, engagement ads and offers, and branded virtual goods and sponsorships. We generally report our advertising revenue net of amounts due to advertising agencies and brokers. Other revenue includes software licensing and maintenance related to technology acquired in our acquisition of NaturalMotion as well as the licensing of our brands.
Key Metrics
We regularly review a number of metrics, including the following key financial and operating metrics, to evaluate our business, measure our performance, identify trends in our business, prepare financial projections and make strategic decisions.
Key Financial Metrics
Bookings. Bookings is a non-GAAP financial measure that is equal to revenue recognized plus or minus the change in deferred revenue during the period. We record the sale of virtual goods as deferred revenue and then recognize that revenue over the estimated average life of the purchased virtual goods or as the virtual goods are consumed. Advertising sales consisting of certain branded virtual goods and sponsorships are also deferred and recognized over the estimated average life of the branded virtual good, similar to online game revenue. Bookings, is a fundamental top-line metric we use to manage our business, as we believe it is a useful indicator of the sales activity in a given period. Over the long-term, the factors impacting our revenue and bookings are the same. However, in the short term, there are factors that may cause revenue to exceed or be less than bookings in any period.
We use bookings to evaluate the results of our operations, generate future operating plans and assess the performance of our company. While we believe that this non-GAAP financial measure is useful in evaluating our business, this information should be considered as supplemental in nature and is not intended to be considered in isolation of, as a substitute for, or as superior to, revenue recognized in accordance with U.S. GAAP. In addition, other companies, including companies in our industry, may calculate bookings differently or not at all, which reduces its usefulness as a comparative measure.
30
Key Operating Metrics
We manage our business by tracking several operating metrics: “DAUs,” which measure daily active users of our games, “MAUs,” which measure monthly active users of our games, “MUUs,” which measure monthly unique users of our games, “MUPs,” which measure monthly unique payers in our games, and “ABPU,” which measures our average daily bookings per average DAU, each of which is recorded by our internal analytics systems. The numbers for these operating metrics are calculated using internal company data based on tracking of user account activity. We also use information provided by third parties, including third party network logins provided by platform providers, to help us track whether a player logged in under two or more different user accounts is the same individual. We believe that the amounts are reasonable estimates of our user base for the applicable period of measurement; however, factors relating to user activity and systems may impact these numbers.
DAUs. We define DAUs as the number of individuals who played one of our games during a particular day. Under this metric, an individual who plays two different games on the same day is counted as two DAUs. We use information provided by third parties to help us identify individuals who play the same game to reduce this duplication. However, because we do not always have the third party network login data to link an individual who has played under multiple user accounts, a player may be counted as multiple DAUs. Average DAUs for a particular period is the average of the DAUs for each day during that period. We use DAUs as a measure of audience engagement.
MAUs. We define MAUs as the number of individuals who played one of our games in the 30-day period ending with the measurement date. Under this metric, an individual who plays two different games in the same 30-day period is counted as two MAUs. We use information provided by third parties to help us identify individuals who play the same game to reduce this duplication. However, because we do not always have the third party network login data to link an individual who has played under multiple user accounts, a player may be counted as multiple MAUs. Average MAUs for a particular period is the average of the MAUs at each month-end during that period. We use MAUs as a measure of total game audience size.
MUUs. We define MUUs as the number of individuals who played one or more of our games, which we were able to verify were played by the same individual in the 30-day period ending with the measurement date. An individual who plays more than one of our games in a given 30-day period would be counted as a single MUU to the extent we can verify that the games were played by the same individual. However, because we do not always have the third party network login data necessary to link an individual who has paid under multiple user accounts in a given 30-day period, an individual may be counted as multiple MUUs. Because many of our players play more than one game in a given 30-day period, MUUs are always equal to or lower than MAUs in any given time period. Average MUUs for a particular period is the average of the MUUs at each month end during that period. We use MUUs as a measure of total audience reach across our network of games.
MUPs. We define MUPs as the number of individuals who made a payment at least once during the applicable 30-day period through a payment method for which we can quantify the number of individuals, including payers from certain mobile games. MUPs does not include individuals who use certain payment methods for which we cannot quantify the number of unique payers. However, because we do not always have the third party network login data necessary to link an individual who has paid under multiple user accounts in a 30-day period, a player who has paid using multiple user accounts may be counted as multiple MUPs. MUPs are presented as an average of the three months in the applicable quarter. We use MUPs as a measure of the number of individuals who made payments across our network of games during a 30-day period.
ABPU. We define ABPU as our total bookings in a given period, divided by the number of days in that period, divided by the average DAUs during the period. We believe that ABPU provides useful information to investors and others in understanding and evaluating our results in the same manner as management. We use ABPU as a measure of overall monetization across all of our players through the sale of virtual goods and advertising.
Our business model for social games is designed so that, as there are more players that play our games, social interactions increase and the more valuable the games and our business become. All engaged players of our games help drive our bookings and, consequently, both online game revenue and advertising revenue. Virtual goods are purchased by players who are socializing with, competing against or collaborating with other players, most of whom do not buy virtual goods. Accordingly, we primarily focus on bookings, DAUs, MAUs, MUUs, MUPs and ABPU, which together we believe best reflect key audience metrics.
31
The table below shows average DAUs, MAUs, MUPs and ABPU for the last eight quarters:
|
|
|
For the Three Months Ended |
|
|||||||||||||||||||||||||||||
|
|
|
Dec 31, 2017 |
|
|
Sep 30, 2017 |
|
|
Jun 30, 2017 |
|
|
Mar 31, 2017 |
|
|
Dec 31, 2016 |
|
|
Sep 30, 2016 |
|
|
Jun 30, 2016 |
|
|
Mar 31, 2016 |
|
||||||||
|
|
|
(users and payers in millions) |
|
|||||||||||||||||||||||||||||
|
Average DAUs(1) |
|
|
22 |
|
|
|
21 |
|
|
|
21 |
|
|
|
21 |
|
|
|
18 |
|
|
|
18 |
|
|
|
18 |
|
|
|
19 |
|
|
Average MAUs(1) |
|
|
86 |
|
|
|
80 |
|
|
|
80 |
|
|
|
72 |
|
|
|
63 |
|
|
|
66 |
|
|
|
61 |
|
|
|
68 |
|
|
Average MUUs(2) |
|
|
49 |
|
|
|
51 |
|
|
|
52 |
|
|
|
56 |
|
|
|
56 |
|
|
|
57 |
|
|
|
50 |
|
|
|
56 |
|
|
Average MUPs(2) |
|
|
1.2 |
|
|
|
1.2 |
|
|
|
1.2 |
|
|
|
1.3 |
|
|
|
1.2 |
|
|
|
1.3 |
|
|
|
0.9 |
|
|
|
1.0 |
|
|
ABPU |
|
$ |
0.113 |
|
|
$ |
0.113 |
|
|
$ |
0.109 |
|
|
$ |
0.107 |
|
|
$ |
0.120 |
|
|
$ |
0.116 |
|
|
$ |
0.107 |
|
|
$ |
0.103 |
|
|
(1) |
Games referenced in footnote (2) below are included incrementally in DAU and MAU because we do not have the third party network login data to link an individual who has played under multiple user accounts. As such, actual DAU and MAU may be lower than reported due to the potential duplication of these individuals. |
|
(2) |
For the fourth quarter of 2017, MUUs and MUPs exclude Daily Celebrity Crossword, Solitaire, our Facebook Messenger games, and games recently acquired from Peak Games. For the first, second and third quarters of 2017, MUUs and MUPs exclude Daily Celebrity Crossword, Solitaire, and our Facebook Messenger games. For the third and fourth quarters of 2016, MUUs and MUPs exclude Daily Celebrity Crossword and Vegas Diamond Slots. For the first and second quarters of 2016, MUUs and MUPs exclude Black Diamond Casino, Vegas Diamond Slots, Yummy Gummy and Crazy Kitchen. These games are excluded to avoid potential double counting of MUUs and MUPs as our systems are unable to distinguish whether a player of these games is also a player of the Company’s other games during the applicable time periods. |
Average DAUs and MAUs increased in the first quarter of 2017 primarily due to the contribution from Solitaire, which was acquired from Harpan LLC (“Harpan”) in February 2017, in addition to strong performance from Zynga Poker. Average DAUs were flat, while average MAUs increased in the second quarter of 2017 due to the contribution from games on mobile messenger platforms (i.e. iMessage and Facebook Messenger), in addition to strong performance from Solitaire and Words With Friends. Average DAUs and MAUs were flat in the third quarter of 2017. Average DAUs and MAUs increased in the fourth quarter of 2017 primarily due to the contribution from games acquired from the casual card game division of Peak Oyun Yazilim Ve Pazarlama Anoim Sirketi (“Peak Games”) in December 2017, in addition to strong performance from Words With Friends. When comparing the fourth quarter of 2017 to the fourth quarter of 2016, average DAUs and MAUs increased primarily due to the contribution from games acquired in 2017 in addition to strong performance from Zynga Poker and Words With Friends. For average MAUs, the fourth quarter year over year increase was also attributed to the contribution from games on mobile messenger platforms.
Average MUUs were flat in the first quarter of 2017 and subsequently decreased in the second, third and fourth quarters of 2017. The decrease was primarily due to declines in unique users for FarmVille 2 and our Slots games. When comparing the fourth quarter of 2017 to the fourth quarter of 2016, average MUUs decreased primarily due to declines in unique users for FarmVille 2, Looney Tunes Dash!, and our Slots games. Average MUPs were relatively consistent throughout 2017.
ABPU decreased in the first quarter of 2017 due to average DAUs increasing faster than bookings. ABPU increased in the second and third quarters of 2017 due to an increase in bookings as there was no change in average DAUs. ABPU was flat in the fourth quarter of 2017 and decreased when compared to the fourth quarter of 2016 due to average DAU increasing faster than bookings.
Other Metrics
Although our management primarily focuses on the operating metrics above, we also monitor periodic trends in our paying players of our games. The table below shows average monthly unique payer bookings, average MUPs and unique payer bookings per unique payer for the last eight quarters:
|
|
|
For the Three Months Ended |
|
|||||||||||||||||||||||||||||
|
|
|
Dec 31, 2017 |
|
|
Sep 30, 2017 |
|
|
Jun 30, 2017 |
|
|
Mar 31, 2017 |
|
|
Dec 31, 2016 |
|
|
Sep 30, 2016 |
|
|
Jun 30, 2016 |
|
|
Mar 31, 2016 |
|
||||||||
|
Average monthly unique payer bookings (in millions)(1) |
|
$ |
52 |
|
|
$ |
55 |
|
|
$ |
54 |
|
|
$ |
54 |
|
|
$ |
50 |
|
|
$ |
48 |
|
|
$ |
40 |
|
|
$ |
42 |
|
|
Average MUPs (in millions)(2) |
|
|
1.2 |
|
|
|
1.2 |
|
|
|
1.2 |
|
|
|
1.3 |
|
|
|
1.2 |
|
|
|
1.3 |
|
|
|
0.9 |
|
|
|
1.0 |
|
|
Monthly unique payer bookings per MUP(3) |
|
$ |
45 |
|
|
$ |
46 |
|
|
$ |
45 |
|
|
$ |
42 |
|
|
$ |
41 |
|
|
$ |
37 |
|
|
$ |
43 |
|
|
$ |
44 |
|
|
(1) |
Average monthly unique payer bookings represent the monthly average amount of bookings for the applicable quarter that we received through payment methods for which we can quantify the number of unique payers and excludes bookings from certain payment methods for which we cannot quantify the number of unique payers. Also excluded are bookings from advertising. For the fourth quarter of 2017, bookings from Daily Celebrity Crossword, Solitaire, our Facebook Messenger Games, and games recently acquired from Peak Games are excluded. For the first, second and third quarters of 2017, bookings from Daily Celebrity Crossword, Solitaire and our Facebook Messenger games are excluded. For the third and fourth quarters of 2016, bookings from Daily Celebrity Crossword and Vegas Diamond Slots are excluded. For the first and second quarters of 2016, bookings from Black Diamond Casino, Vegas Diamond Slots, Yummy Gummy and Crazy Kitchen are excluded. |
32
|
(2) |
For the fourth quarter of 2017, MUPs exclude Daily Celebrity Crossword, Solitaire, our Facebook Messenger games and games recently acquired from Peak Games. For the first, second and third quarters of 2017, MUPs exclude Daily Celebrity Crossword, Solitaire and our Facebook Messenger games. For the third and fourth quarters of 2016, MUPs exclude Daily Celebrity Crossword and Vegas Diamond Slots. For the first and second quarters of 2016, MUPs exclude Black Diamond Casino, Vegas Diamond Slots, Yummy Gummy and Crazy Kitchen. |
|
(3) |
Monthly unique payer bookings per MUP is calculated by dividing average monthly unique payer bookings by average MUPs. |
Average monthly unique payer bookings increased in the first quarter of 2017 primarily due to the unique payer bookings contribution from new games, namely Dawn of Titans (launched in December 2016), in addition to unique payer bookings growth from existing games, primarily Zynga Poker and Wizard of Oz: Magic Match. Average monthly unique payer bookings were relatively flat in the second and third quarters of 2017, while average monthly unique payer bookings decreased in the fourth quarter of 2017 due to a slight decline in unique payer bookings from existing web and mobile games, such as Wizard of Oz: Magic Match and Zynga Poker. When comparing the fourth quarter of 2017 to the fourth quarter of 2016, average monthly unique payer bookings increased primarily due to unique payer bookings growth from Zynga Poker.
Average monthly unique payer bookings per MUP increased in the first quarter of 2017 due to monthly unique payer bookings increasing faster than average MUPs, while average monthly unique payer bookings per MUP increased in the second quarter of 2017 due to a sequential decline in average MUPs. Average monthly unique payer bookings per MUP were relatively flat in the third and fourth quarters of 2017. When comparing the fourth quarter of 2017 to the fourth quarter of 2016, average monthly unique payer bookings per MUP increased due to an increase in monthly unique payer bookings.
Although we monitor our unique payer metrics, we focus on monetization, including in-game advertising, of all of our players and not just those who are payers. Accordingly, we strive to enhance content and our players’ game experience to increase our bookings and ABPU, which is a measure of overall monetization across all of our players through the sale of virtual goods and advertising. Future growth in audience and engagement will depend on our ability to retain current players, attract new players, launch new games and expand into new markets and distribution platforms, and the success of our network. Our operating metrics may not correlate directly to quarterly bookings or revenue trends in the short term.
2017 Highlights
|
|
• |
Mobile Growth. During 2017, we delivered a 29% increase in mobile revenue year over year, primarily driven by the revenue and bookings contributions from Zynga Poker and CSR Racing 2. |
|
|
• |
Game Launches. During 2017, we launched Words With Friends 2 and Crosswords With Friends on mobile platforms and Boggle With Friends on mobile and web platforms. |
|
|
• |
Acquisitions. During the first quarter of 2017, we purchased Solitaire games from Harpan for approximately $42.5 million in cash and during the fourth quarter of 2017, we acquired the casual card game division of Peak Games for $99.7 million in cash. |
|
|
• |
Share Repurchase Programs. In November 2016, the 2016 Share Repurchase Program was authorized for up to $200 million of our outstanding Class A common stock. During 2017, we repurchased 36.3 million shares of our Class A common stock under the 2016 Share Repurchase Program at a weighted average price of $2.78 per share for a total of $101.0 million. |
|
|
• |
Rental Income. During the second quarter of 2017, the Company entered into an industrial gross lease agreement to provide approximately 287,000 square feet of its office space in San Francisco, California to a tenant for total minimum rental payments of $167.3 million to be received by the Company over the term of the lease. |
|
|
• |
Tax Cuts and Job Act. On December 22, 2017, the Tax Cuts and Jobs Act (“the 2017 Tax Act”) was signed into law by the President of the United States. Refer to header “Tax Cuts and Job Act” below for further discussion on the 2017 impact and future expected impact. |
|
|
• |
Zindagi Settlement. The Company reached an agreement to settle the contingent consideration with Zindagi Games Inc. (“Zindagi”), resulting in $11.9 of million expense recorded to the consolidated statements of operations in 2017 and the release of $1.1 million previously held in escrow. |
33
Factors Affecting Our Performance
Platform agreements. Our games are primarily distributed, marketed and promoted through third parties, primarily Apple’s App Store, the Google Play Store and Facebook. Virtual goods for our games are purchased through the payment processing systems of these platform providers. To date, we have generated a significant portion of our bookings, revenue and players through the Apple, Google, and Facebook platforms and expect to continue to do so for the foreseeable future. We are generating an increasing portion of our bookings, revenue, and players through the Apple App Store and Google Play Store and expect that this trend will continue as we launch more games for mobile devices. Apple, Google and Facebook generally have the discretion to change their platforms’ terms of service and other policies with respect to us or other developers in their sole discretion, and those changes may be unfavorable to us.
Launch of new games and release of enhancements. Our revenue and bookings results have been driven by the launch of new mobile and web games and the release of fresh content and new features in existing games. Our future success depends on our ability to innovate and provide fresh content to keep our existing players engaged as well as launch and monetize new titles on various platforms. Although the amount of revenue and bookings we generate from an enhancement to an existing game or launch of a new game or can vary significantly, we expect our revenue and bookings to be correlated to our success in releasing engaging content and features for our existing games and the success and timely launch of our new games. In addition, revenue and bookings from many of our games may decline over time after reaching a peak of popularity and player usage. We often refer to the speed of this decline as the decay rate of a game. As a result of this decline in the revenue and bookings of our games, our business depends on our ability to consistently release fresh content for our existing games and launch new games that achieve significant popularity and have the potential to become franchise games.
Game monetization. We generate most of our bookings and revenue from the sale of virtual goods in our games. The degree to which our players choose to pay for virtual goods in our games is driven by our ability to create content and virtual goods that enhance the game-play experience. Our revenue, bookings and overall financial performance are affected by the number of players and the effectiveness of our monetization of players through the sale of virtual goods and advertising. In addition, mobile and international players have historically monetized at a lower level than web and U.S. players, respectively. The percentage of paying mobile and international players may increase or decrease based on a number of factors, including growth in mobile games as a percentage of total game audience and our overall international players, localization of content and the availability of payment options.
Investment in game development. In order to develop new games and enhance the content and features in our existing games, we must continue to invest in a significant amount of engineering and creative resources. These expenditures generally occur in advance of the launch of a new game or the release of new content, and the resulting revenue may not equal or exceed our development costs, or the game or feature may be abandoned in its entirety.
Player acquisition costs. We utilize advertising and other forms of player acquisition and retention to grow and retain our player audience. These expenditures generally relate to the promotion of new game launches and ongoing performance-based programs to drive new player acquisition and lapsed player reactivation. Over time, these acquisition and retention-related programs may become either less effective or more costly, negatively impacting our operating results. Additionally, as our player base becomes more heavily concentrated on mobile platforms, our ability to drive traffic to our games through unpaid channels may become diminished, and the overall cost of marketing our games may increase.
New market development. We are investing in new distribution channels, mobile platforms and international markets to expand our reach and grow our business. For example, we have continued to hire additional employees and acquire companies with experience developing mobile applications. Our ability to be successful will depend on our ability to develop a successful mobile network, obtain new players and retain existing players on new and existing social networks and attract advertisers.
As we expand into new markets and distribution channels, we expect to incur headcount, marketing and other operating costs in advance of the associated revenue and bookings. Our financial performance will be impacted by our investment in these initiatives and their success.
Hiring and retaining key personnel. Our ability to compete depends in large part on our ability to hire and retain key talent and match that key talent to our current business needs. We are continually reviewing our hiring and retention programs against best practices and for optimal efficiencies. In addition to employee attrition, we have also implemented, and continue to implement, certain cost reduction initiatives to better align our operating expenses with our revenue, including reducing or redeploying our headcount, hiring in lower cost geographies, and consolidating certain facilities.
Tax Cuts and Jobs Act
On December 22, 2017, the 2017 Tax Act was enacted into law. Beginning January 1, 2018, the 2017 Tax Act reduces the U.S. federal corporate tax rate from 35% to 21%, requires companies to pay a one-time transition tax on earnings of certain foreign
34
subsidiaries that were previously tax deferred, creates new taxes on certain foreign sourced earnings, repeals the Alternative Minimum Tax (“AMT”), and expands the number of individuals whose compensation is subject to a $1.0 million cap on deductibility, amongst other changes. In certain cases, as described below, we have made a reasonable estimate of the effects on our existing deferred tax balances and refundable AMT credit. In other cases, we have not been able to make a reasonable estimate and continue to account for those items based on our existing accounting under ASC 740 Income Taxes and the provisions of the tax laws that were in effect immediately prior to enactment. We will continue to refine our calculations as additional analysis is completed.
For items which we have been able to determine a reasonable estimate, we recognized a provisional tax benefit of $5.0 million during the fourth quarter of 2017 as a result of the 2017 Tax Act’s enactment, which is included as a component of the provision for income tax. The components of the provisional tax benefit recognized include:
Deferred tax assets and liabilities. Certain deferred tax assets and liabilities have been re-measured based on the rates at which they are expected to reverse in the future, which is generally 21%. However, we are still analyzing certain aspects of the 2017 Tax Act and refining our calculations, which could affect the measurement of these balances or give rise to new deferred tax amounts. The related provisional income tax benefit recorded to the consolidated statement of operations for the year ended December 31, 2017, net of valuation allowance, was $2.4 million.
AMT credit. As part of the 2017 Tax Act, corporate AMT was repealed. AMT credits generated by the Company in previous years are refundable in tax years beginning after 2017 and before 2022 with any remaining credits being fully refundable in 2022. The related provisional income tax benefit recorded to the consolidated statement of operations for the year ended December 31, 2017 for the AMT credit refund was $2.6 million. The receivable for the refundable AMT credit was recorded to non-current other assets within the consolidated balance sheet as of December 31, 2017.
Officer compensation. For tax years beginning after December 31, 2017, the 2017 Tax Act expanded the number of individuals whose compensation is subject to a $1.0 million cap on deductibility and includes performance-based compensation (such as bonuses) in the calculation. As a result, the Company recorded a provisional amount to reduce the future tax benefit related to officers’ stock-based compensation. However, there was no net impact to the provision for income tax as the provisional amount was offset by an equal reduction in the Company's deferred tax asset valuation allowance.
One-time transitional tax. As part of the 2017 Tax Act, total foreign earnings and profits (“E&P”) after 1986, that were previously deferred from U.S. federal taxation, are subject to a one-time tax on the mandatory deemed repatriation of foreign earnings. The Company’s provisional analysis of the one-time transition tax resulted in no additional taxes being owed due to the overall accumulated E&P deficit.
With respect to global intangible low-taxed income (“GILTI”) provisions of the 2017 Tax Act, the Company is continuing to evaluate how the provisions will be accounted for. The GILTI provisions allow companies to make an accounting policy election to either (i) account for GILTI as a component of tax expense in the period in which the entity is subject to the rules or (ii) account for GILTI in the entity’s measurement of deferred taxes. As of December 31, 2017, the Company has not elected a method due to its continuing analysis of the GILTI provisions. The elected method will depend, in part, on analyzing global income to determine whether the Company expects to have future U.S. inclusions in its taxable income related to GILTI and, if so, the impact that is expected.
Results of Operations
Revenue
|
|
|
|
Year Ended December 31, |
|
|
2016 to 2017 |
|
|
2015 to 2016 |
|
|||||||||||
|
|
|
|
2017 |
|
|
2016 |
|
|
2015 |
|
|
% Change |
|
|
% Change |
|
|||||
|
|
|
|
(in thousands) |
|
|
|
|
|
|
|
|
|
|||||||||
|
Revenue by type: |
|
|
|
|
|
|
|
|
|
|
|
|
|
|
|
|
|
|
|
|
|
|
Online game |
|
|
$ |
665,593 |
|
|
$ |
547,291 |
|
|
$ |
590,755 |
|
|
|
22 |
% |
|
|
(7 |
)% |
|
Advertising and other |
|
|
|
195,797 |
|
|
|
194,129 |
|
|
|
173,962 |
|
|
|
1 |
% |
|
|
12 |
% |
|
Total revenue |
|
|
$ |
861,390 |
|
|
$ |
741,420 |
|
|
$ |
764,717 |
|
|
|
16 |
% |
|
|
(3 |
)% |
35
2017 Compared to 2016. Total revenue increased $120.0 million in 2017 as compared to 2016 as a result of both increases in online game revenue and advertising and other revenue. Bookings increased $99.3 million in 2017 due to increases in both online game and advertising and other bookings. Average DAUs increased from 19 million in 2016 to 21 million in 2017, ABPU was flat at $0.111 in 2016 and 2017 and average MUPs increased from 1.1 million in 2016 to 1.2 million in 2017.
Online game revenue increased $118.3 million in 2017 as compared to 2016. This increase is primarily attributable to increases in revenue from CSR Racing 2, Zynga Poker, The Wizard of Oz: Magic Match and Dawn of Titans in the amounts of $72.7 million, $41.0 million, $35.1 million and $31.2 million, respectively. Online game revenue increased for Zynga Poker due to growth in bookings and audience metrics in this game, while online game revenue increased for The Wizard of Oz: Magic Match, CSR Racing 2 and Dawn of Titans as these games were launched in May 2016, June 2016 and December 2016, respectively. The overall increase in online game revenue was offset by decreases in online game revenue from Empires and Allies 2, FarmVille 2, FarmVille 2: Country Escape and FarmVille: Harvest Swap in the amounts of $28.8 million, $15.3 million, $9.4 million and $9.0 million, respectively, due to the overall decay rate in bookings and audience metrics in these games. All other games accounted for the net increase of $0.8 million.
During 2017, changes in our estimated average life of durable virtual goods for various games resulted in an increase in revenue and income from operations of $1.3 million, which is the result of adjusting the remaining recognition period of deferred revenue generated in prior periods at the time of a change in estimate. During 2016, changes in our estimated average life of durable virtual goods for various games resulted in a decrease in revenue and income from operations of $0.1 million. We also recognized $4.0 million of revenue and income from operations during 2016 for games that had been discontinued as there was no further service obligation. These changes in estimates did not impact our reported earnings per share in 2017 or 2016.
International revenue as a percentage of total revenue was 34% and 32% in 2017 and 2016, respectively.
In 2017, Zynga Poker and CSR Racing 2 were our top online game revenue-generating games and comprised 22% and 14%, respectively, of our online game revenue for the period. In 2016, Zynga Poker, Wizard of Oz Slots, Hit It Rich! Slots and FarmVille 2 were our top online game revenue-generating games and comprised 19%, 13%, 12% and 11%, respectively, of our online game revenue for the period. No other game generated more than 10% of online game revenue during either of these periods.
Consumable virtual goods accounted for 44% and 48% of online game revenue in 2017 and 2016, respectively. Durable virtual goods accounted for 56% and 52% 2017 and 2016, respectively. The estimated weighted average life of durable virtual goods was eight months in 2017 compared to nine months in 2016.
Advertising and other revenue increased $1.7 million from 2016 to 2017 due to an increase in licensing revenue of $1.8 million and in-game offers, engagement ads, and other revenue of $0.5 million. These increases were offset by a net decrease in in-game display ad revenue of $0.6 million. The net decrease in in-game display ad revenue was a function of a lower return on our advertisements as our effective cost per thousand impressions (“eCPM”) declined from the prior year due to a shift in our advertising product mixture, partially offset by a one-time benefit from an advertising network deal in the fourth quarter of 2017 for Words with Friends.
2016 Compared to 2015. Total revenue decreased $23.3 million in 2016 as compared to 2015 as a result of a decrease in online game revenue, offset by an increase in advertising and other revenue. Bookings increased $54.6 million in 2016 compared to 2015 due to increases in both online game and advertising and other bookings resulting from new game launches in 2016. ABPU increased from $0.093 in 2015 to $0.111 in 2016, and average MUP increased from 0.9 million in 2015 to 1.1 million in 2016, while average DAUs decreased from 21 million in 2015 to 19 million in 2016.
Online game revenue decreased $43.5 million in 2016 as compared to 2015. This decrease was primarily attributable to decreases in revenue from FarmVille 2, FarmVille 2: Country Escape, and Hit It Rich! Slots, in the amounts of $49.1 million, $38.9 million, and $24.4 million, respectively, due to the overall decay rate in bookings and audience metrics in these games. The overall decrease in online game revenue was offset by increases in revenue from Empires & Allies, CSR Racing 2, Black Diamond Slots and Willy Wonka and the Chocolate Factory Slots in the amounts of $31.2 million, $18.3 million, $17.4 million and, $16.6 million, respectively. Online game revenue increased for Empires & Allies and Black Diamond Slots as these games were launched in May 2015 and September 2015, respectively, while online game revenue increased for Willy Wonka and the Chocolate Factory Slots and CSR Racing 2 as these games were launched in March 2016 and June 2016, respectively. All other games accounted for the remaining net decrease of $14.6 million.
The decrease in online game revenue was supplemented by changes in estimated average life of durable virtual goods. During 2016, changes in our estimated average life of durable virtual goods for various games resulted in a decrease in revenue and income from operations of $0.1 million, which is the result of adjusting the remaining recognition period of deferred revenue generated in prior periods at the time of a change in estimate. During 2015, changes in our estimated average life of durable virtual goods resulted in an increase in revenue and income from operations of $1.0 million. We also recognized $4.0 million of revenue and income from
36
operations in 2016 due to changes in our estimated average life of durable virtual goods for games that have been discontinued, as there is no further service obligation after the closure of these games whereas during 2015, we recognized $9.9 million in revenue and income from operations for games that have been discontinued. These changes in estimates did not impact our reported earnings per share in 2016, and had a $0.01 per share impact on our reported loss per share in 2015.
International revenue as a percentage of total revenue was 32% and 34% in 2016 and 2015, respectively.
In 2016, Zynga Poker, Wizard of Oz Slots, Hit It Rich! Slots, and FarmVille 2 were our top online game revenue-generating games and comprised 19%, 13%, 12%, and 11%, respectively, of our online game revenue for the period. No other game generated more than 10% of our online game revenue during 2016. In 2015, FarmVille 2, Zynga Poker, Hit It Rich! Slots, FarmVille 2: Country Escape and, Wizard of Oz Slots were our top online game revenue-generating games and comprised 19%, 18%, 16%, 14%, and 10%, respectively, of our online game revenue for the period. No other game generated more than 10% of our online game revenue during 2015.
Consumable virtual goods accounted for 48% and 46% of online game revenue in 2016 and 2015, respectively. Durable virtual goods accounted for 52% and 54% of online game revenue in 2016 and 2015, respectively. The estimated weighted-average life of durable virtual goods was nine months in 2016 compared to ten months in 2015.
Advertising and other revenue increased $20.2 million from 2015 to 2016 primarily due to a $19.7 million increase in in-game display ads as a result of better optimization and performance on mobile platforms driving higher effective cost per thousand impressions (“eCPM”). The increases in in-game display ads were driven by the Company’s transition from web to mobile, as mobile revenue as a percentage of total revenue grew from 64% in 2015 to 77% in 2016 and mobile bookings as a percentage of total bookings grew from 68% in 2015 to 80% in 2016. The increase was also attributed to a $2.5 million increase in in-game offers, engagement ads and other advertising revenue. These increases were offset by a $2.0 million decrease in in-game sponsorships, which were historically more prevalent in our web games, such as FarmVille.
Cost of revenue
|
|
|
Year Ended December 31, |
|
|
2016 to 2017 |
|
|
2015 to 2016 |
|
|||||||||||
|
|
|
2017 |
|
|
2016 |
|
|
2015 |
|
|
% Change |
|
|
% Change |
|
|||||
|
|
|
(in thousands) |
|
|
|
|
|
|
|
|
|
|||||||||
|
Cost of revenue |
|
$ |
258,971 |
|
|
$ |
238,546 |
|
|
$ |
235,985 |
|
|
|
9 |
% |
|
|
1 |
% |
2017 Compared to 2016. Cost of revenue increased $20.4 million in 2017 as compared to 2016. The increase was primarily attributable to a $36.8 million increase in payment processing fees from bookings generated from mobile payment processors, offset by a $12.6 million decrease in amortization of intangibles for intangibles that were fully amortized in the first quarter of 2017 and impairment charges taken in 2016 related to intangibles acquired as part of the Rising Tide acquisition, as well as a $5.3 million decrease in hosting costs due to data center migration.
2016 Compared to 2015. Cost of revenue increased $2.6 million in 2016 as compared to 2015. The increase was primarily attributable to a $28.6 million increase in payment processing fees from bookings generated from mobile payment processors, offset by a $13.4 million decrease in hosting costs due to data center migration and a $12.5 million decrease in depreciation expense due to the consolidation of data center facilities and the related disposition of certain data center assets in prior periods.
Research and development
|
|
|
Year Ended December 31, |
|
|
2016 to 2017 |
|
|
2015 to 2016 |
|
|||||||||||
|
|
|
2017 |
|
|
2016 |
|
|
2015 |
|
|
% Change |
|
|
% Change |
|
|||||
|
|
|
(in thousands) |
|
|
|
|
|
|
|
|
|
|||||||||
|
Research and development |
|
$ |
256,012 |
|
|
$ |
320,300 |
|
|
$ |
361,931 |
|
|
|
(20 |
)% |
|
|
(12 |
)% |
2017 Compared to 2016. Research and development expenses decreased $64.3 million in 2017 as compared to 2016. The decrease was primarily attributable to a $42.1 million decrease in stock-based compensation expense, $21.0 million decrease in headcount-related expenses, and $9.1 million decrease in third-party consulting expenses. During 2017, we also recorded a benefit of $0.9 million to adjust the fair value of the contingent consideration liabilities for Zindagi and PuzzleSocial and during 2016, we recorded a benefit of $9.4 million to adjust the fair value of the contingent consideration liabilities related to the Rising Tide and Zindagi acquisitions.
37
2016 Compared to 2015. Research and development expenses decreased $41.6 million in 2016 as compared to 2015. The decrease was primarily attributable to a $15.1 million decrease in the estimated fair value of the contingent consideration liabilities for our acquisitions (we recorded a net expense of $6.1 million in 2015 for Spooky Cool Labs and Rising Tide and a net benefit of $9.1 million in 2016 for Rising Tide, Zindagi and PuzzleSocial), a $14.0 million decrease in restructuring expense, and a $10.3 million decrease in stock-based compensation expense.
Sales and marketing
|
|
|
Year Ended December 31, |
|
|
2016 to 2017 |
|
|
2015 to 2016 |
|
|||||||||||
|
|
|
2017 |
|
|
2016 |
|
|
2015 |
|
|
% Change |
|
|
% Change |
|
|||||
|
|
|
(in thousands) |
|
|
|
|
|
|
|
|
|
|||||||||
|
Sales and marketing |
|
$ |
212,030 |
|
|
$ |
183,637 |
|
|
$ |
169,573 |
|
|
|
15 |
% |
|
|
8 |
% |
2017 Compared to 2016. Sales and marketing expenses increased $28.4 million in 2017 as compared to 2016. The increase was primarily attributable to a $14.7 million increase in player acquisition costs for Zynga Poker, CSR Racing 2 and Solitaire, $6.8 million increase in headcount-related expense, and $4.6 million increase in other marketing costs, primarily related to the launch of Words With Friends 2 in 2017.
2016 Compared to 2015. Sales and marketing expenses increased $14.1 million in 2016 as compared to 2015. The increase was primarily attributable to a $12.0 million increase in player acquisition costs spent on newer titles such as CSR Racing 2, Willy Wonka and the Chocolate Factory Slots, and Wizard of Oz: Magic Match and a $4.8 million increase in headcount-related expenses.
General and administrative
|
|
|
Year Ended December 31, |
|
|
2016 to 2017 |
|
|
2015 to 2016 |
|
|||||||||||
|
|
|
2017 |
|
|
2016 |
|
|
2015 |
|
|
% Change |
|
|
% Change |
|
|||||
|
|
|
(in thousands) |
|
|
|
|
|
|
|
|
|
|||||||||
|
General and administrative |
|
$ |
108,653 |
|
|
$ |
92,509 |
|
|
$ |
143,284 |
|
|
|
17 |
% |
|
|
(35 |
)% |
2017 Compared to 2016. General and administrative expenses increased $16.1 million in 2017 as compared to 2016. The increase was primarily attributable to an $11.9 million settlement of the Zindagi legal matter (refer to Note 14 – “Commitments and Contingencies” in the notes to the consolidated financial statements for further discussion), $9.1 million increase in legal costs primarily from ongoing legal matters and $2.7 million increase in acquisition related costs, primarily related to the Harpan and Peak Game acquisitions, offset by a $4.5 million reduction in headcount-related expenses.
2016 Compared to 2015. General and administrative expenses decreased $50.8 million in 2016 as compared to 2015. The decrease was primarily attributable to a $18.7 million decrease in restructuring expense, a $12.7 million decrease in stock-based compensation expense, a $7.3 decrease in headcount-related expenses, and a $4.9 million decrease in third-party consulting and legal expenses.
Impairment of intangible assets
In the third quarter of 2016, we recorded $20.7 million of impairment on intangible assets. Our updated financial forecast as of September 30, 2016, indicated a reduction of future undiscounted cash flows for certain games associated with developed technology previously acquired from Rising Tide and Zindagi. As a result, we performed an impairment analysis and determined the estimated fair values of Rising Tide’s and Zindagi’s intangible assets to be $18.2 million and $2.5 million lower, respectively, than their carrying values as of September 30, 2016.
Interest income
|
|
|
Year Ended December 31, |
|
|
2016 to 2017 |
|
|
2015 to 2016 |
|
|||||||||||
|
|
|
2017 |
|
|
2016 |
|
|
2015 |
|
|
% Change |
|
|
% Change |
|
|||||
|
|
|
(in thousands) |
|
|
|
|
|
|
|
|
|
|||||||||
|
Interest income |
|
$ |
5,309 |
|
|
$ |
3,057 |
|
|
$ |
2,568 |
|
|
|
74 |
% |
|
|
19 |
% |
2017 Compared to 2016. Interest income increased $2.3 million in 2017 as compared to 2016. The increase was primarily attributable to the mix of investments during 2017, driven by our investment in short-term securities during the third and fourth quarters of 2017.
38
2016 Compared to 2015. Interest income increased $0.5 million in 2016. The increase was primarily attributed to a slightly higher rate of return on our cash and cash equivalents in 2016.
Other income (expense), net
|
|
|
Year Ended December 31, |
|
|
2016 to 2017 |
|
|
2015 to 2016 |
|
|||||||||||
|
|
|
2017 |
|
|
2016 |
|
|
2015 |
|
|
% Change |
|
|
% Change |
|
|||||
|
|
|
(in thousands) |
|
|
|
|
|
|
|
|
|
|||||||||
|
Other income (expense), net |
|
$ |
6,550 |
|
|
$ |
6,461 |
|
|
$ |
13,306 |
|
|
|
1 |
% |
|
|
NM |
|
2017 Compared to 2016. Other income, net increased $0.1 million in 2017 as compared to 2016.
2016 Compared to 2015. Other income, net decreased $6.8 million in 2016 as compared to 2015. The decrease was primarily attributable to a $6.2 million gain recorded in the first quarter of 2015 related to the sale of an equity investment.
Provision for (benefit from) income taxes
|
|
|
Year Ended December 31, |
|
|
2016 to 2017 |
|
|
2015 to 2016 |
|
|||||||||||
|
|
|
2017 |
|
|
2016 |
|
|
2015 |
|
|
% Change |
|
|
% Change |
|
|||||
|
|
|
(in thousands) |
|
|
|
|
|
|
|
|
|
|||||||||
|
Provision for (benefit from) income taxes |
|
$ |
10,944 |
|
|
$ |
3,442 |
|
|
$ |
(8,672 |
) |
|
|
NM |
|
|
|
NM |
|
2017 Compared to 2016. The provision for income taxes increased by $7.5 million in 2017 as compared to 2016. The increase was primarily attributable to a $7.6 million increase in net tax expense related to changes in the jurisdictional mix of earnings. The $5.0 million benefit recognized in 2017 from enactment of the 2017 Tax Act is offset by a $4.0 million release of our U.S. valuation allowance related to the acquisition of PuzzleSocial in 2016.
2016 Compared to 2015. The provision for income taxes increased by $12.1 million in 2016 as compared to 2015. The increase was primarily attributable to a benefit of $2.7 million recorded in the fourth quarter of 2015 related to a reduction in tax risk reserves that did not reoccur and $6.4 million less of a benefit recognized for the release of our U.S. valuation allowance related to the acquisition of PuzzleSocial compared to the release of our U.S. valuation allowance related to the acquisition of Rising Tide for the same period in the prior year. In addition, there was a net $3.0 million increase in foreign tax expense related to changes in our jurisdictional mix of earnings between the two periods.
39
Quarterly Results of Operations Data
The following tables set forth our unaudited quarterly consolidated statements of operations for each of the eight quarters ended December 31, 2017. We also present other financial and operations data and a reconciliation of revenue to bookings for the same periods. We have prepared the quarterly consolidated statements of operations data on a basis consistent with the audited consolidated financial statements included in this Annual Report on Form 10-K. In the opinion of management, the financial information reflects all adjustments, consisting only of normal recurring adjustments that we consider necessary for a fair presentation of this data. This information should be read in conjunction with the audited consolidated financial statements and related notes included in Item 8 – Financial Statements and Supplementary Data in this Annual Report on Form 10-K. The results of historical periods are not necessarily indicative of the results of operations for a full year or any future period.
|
|
|
For the Three Months Ended |
|
|||||||||||||||||||||||||||||
|
|
|
Dec 31, 2017 |
|
|
Sep 30, 2017 |
|
|
Jun 30, 2017 |
|
|
Mar 31, 2017 |
|
|
Dec 31, 2016 |
|
|
Sep 30, 2016 |
|
|
Jun 30, 2016 |
|
|
Mar 31, 2016 |
|
||||||||
|
|
|
(in thousands, except per share data) |
|
|||||||||||||||||||||||||||||
|
Consolidated Statements of Operations Data: |
|
|
|
|
|
|
|
|
|
|
|
|
|
|
|
|
|
|
|
|
|
|
|
|
|
|
|
|
|
|
|
|
|
Online game |
|
$ |
173,114 |
|
|
$ |
175,253 |
|
|
$ |
163,745 |
|
|
$ |
153,481 |
|
|
$ |
140,157 |
|
|
$ |
134,254 |
|
|
$ |
135,823 |
|
|
$ |
137,057 |
|
|
Advertising and other |
|
|
60,166 |
|
|
|
49,342 |
|
|
|
45,486 |
|
|
|
40,803 |
|
|
|
50,383 |
|
|
|
48,170 |
|
|
|
45,912 |
|
|
|
49,664 |
|
|
Total revenue |
|
|
233,280 |
|
|
|
224,595 |
|
|
|
209,231 |
|
|
|
194,284 |
|
|
|
190,540 |
|
|
|
182,424 |
|
|
|
181,735 |
|
|
|
186,721 |
|
|
Costs and expenses: |
|
|
|
|
|
|
|
|
|
|
|
|
|
|
|
|
|
|
|
|
|
|
|
|
|
|
|
|
|
|
|
|
|
Cost of revenue |
|
|
64,015 |
|
|
|
65,907 |
|
|
|
64,172 |
|
|
|
64,877 |
|
|
|
62,629 |
|
|
|
62,675 |
|
|
|
56,103 |
|
|
|
57,139 |
|
|
Research and development |
|
|
61,229 |
|
|
|
60,966 |
|
|
|
64,615 |
|
|
|
69,202 |
|
|
|
92,417 |
|
|
|
73,913 |
|
|
|
66,233 |
|
|
|
87,737 |
|
|
Sales and marketing |
|
|
60,265 |
|
|
|
53,944 |
|
|
|
51,201 |
|
|
|
46,620 |
|
|
|
46,860 |
|
|
|
49,802 |
|
|
|
40,631 |
|
|
|
46,344 |
|
|
General and administrative |
|
|
38,711 |
|
|
|
23,826 |
|
|
|
23,551 |
|
|
|
22,565 |
|
|
|
23,095 |
|
|
|
21,656 |
|
|
|
25,374 |
|
|
|
22,384 |
|
|
Impairment of intangible assets |
|
|
— |
|
|
|
— |
|
|
|
— |
|
|
|
— |
|
|
|
— |
|
|
|
20,677 |
|
|
|
— |
|
|
|
— |
|
|
Total costs and expenses |
|
|
224,220 |
|
|
|
204,643 |
|
|
|
203,539 |
|
|
|
203,264 |
|
|
|
225,001 |
|
|
|
228,723 |
|
|
|
188,341 |
|
|
|
213,604 |
|
|
Income (loss) from operations |
|
|
9,060 |
|
|
|
19,952 |
|
|
|
5,692 |
|
|
|
(8,980 |
) |
|
|
(34,461 |
) |
|
|
(46,299 |
) |
|
|
(6,606 |
) |
|
|
(26,883 |
) |
|
Net income (loss) |
|
$ |
12,929 |
|
|
$ |
18,091 |
|
|
$ |
5,093 |
|
|
$ |
(9,474 |
) |
|
$ |
(35,432 |
) |
|
$ |
(41,737 |
) |
|
$ |
(4,446 |
) |
|
$ |
(26,558 |
) |
|
Net income (loss) per share - basic |
|
$ |
0.01 |
|
|
$ |
0.02 |
|
|
$ |
0.01 |
|
|
$ |
(0.01 |
) |
|
$ |
(0.04 |
) |
|
$ |
(0.05 |
) |
|
$ |
(0.01 |
) |
|
$ |
(0.03 |
) |
|
Net income (loss) per share - diluted |
|
$ |
0.01 |
|
|
$ |
0.02 |
|
|
$ |
0.01 |
|
|
$ |
(0.01 |
) |
|
$ |
(0.04 |
) |
|
$ |
(0.05 |
) |
|
$ |
(0.01 |
) |
|
$ |
(0.03 |
) |
|
|
|
For the Three Months Ended |
|
|||||||||||||||||||||||||||||
|
|
|
Dec 31, 2017 |
|
|
Sep 30, 2017 |
|
|
Jun 30, 2017 |
|
|
Mar 31, 2017 |
|
|
Dec 31, 2016 |
|
|
Sep 30, 2016 |
|
|
Jun 30, 2016 |
|
|
Mar 31, 2016 |
|
||||||||
|
|
|
(dollars in thousands) |
|
|||||||||||||||||||||||||||||
|
Other Non-GAAP Financial and Operational Data: |
|
|
|
|
|
|
|
|
|
|
|
|
|
|
|
|
|
|
|
|
|
|
|
|
|
|
|
|
|
|
|
|
|
Bookings |
|
$ |
223,786 |
|
|
$ |
213,487 |
|
|
$ |
209,178 |
|
|
$ |
207,358 |
|
|
$ |
201,532 |
|
|
$ |
196,723 |
|
|
$ |
174,653 |
|
|
$ |
181,625 |
|
|
|
|
For the Three Months Ended |
|
|||||||||||||||||||||||||||||
|
|
|
Dec 31, 2017 |
|
|
Sep 30, 2017 |
|
|
Jun 30, 2017 |
|
|
Mar 31, 2017 |
|
|
Dec 31, 2016 |
|
|
Sep 30, 2016 |
|
|
Jun 30, 2016 |
|
|
Mar 31, 2016 |
|
||||||||
|
|
|
(in thousands) |
|
|||||||||||||||||||||||||||||
|
Reconciliation of Revenue to Bookings: |
|
|
|
|
|
|
|
|
|
|
|
|
|
|
|
|
|
|
|
|
|
|
|
|
|
|
|
|
|
|
|
|
|
Revenue |
|
$ |
233,280 |
|
|
$ |
224,595 |
|
|
$ |
209,231 |
|
|
$ |
194,284 |
|
|
$ |
190,540 |
|
|
$ |
182,424 |
|
|
$ |
181,735 |
|
|
$ |
186,721 |
|
|
Change in deferred revenue |
|
|
(9,494 |
) |
|
|
(11,108 |
) |
|
|
(53 |
) |
|
|
13,074 |
|
|
|
10,992 |
|
|
|
14,299 |
|
|
|
(7,082 |
) |
|
|
(5,096 |
) |
|
Bookings |
|
$ |
223,786 |
|
|
$ |
213,487 |
|
|
$ |
209,178 |
|
|
$ |
207,358 |
|
|
$ |
201,532 |
|
|
$ |
196,723 |
|
|
$ |
174,653 |
|
|
$ |
181,625 |
|
40
Liquidity and Capital Resources
|
|
|
Year Ended December 31, |
|
|||||||||
|
|
|
2017 |
|
|
2016 |
|
|
2015 |
|
|||
|
|
|
(in thousands) |
|
|||||||||
|
Consolidated Statements of Cash Flows Data: |
|
|
|
|
|
|
|
|
|
|
|
|
|
Acquisition of property and equipment |
|
$ |
(9,971 |
) |
|
$ |
(10,313 |
) |
|
$ |
(7,832 |
) |
|
Depreciation and amortization |
|
|
30,294 |
|
|
|
41,770 |
|
|
|
54,315 |
|
|
Cash flows provided by (used in) operating activities |
|
|
94,577 |
|
|
|
60,016 |
|
|
|
(44,447 |
) |
|
Cash flows provided by (used in) investing activities |
|
|
(460,156 |
) |
|
|
204,103 |
|
|
|
749,573 |
|
|
Cash flows provided by (used in) financing activities |
|
|
(117,963 |
) |
|
|
(150,327 |
) |
|
|
(93,545 |
) |
As of December 31, 2017 and December 31, 2016, we had cash and cash equivalents of $372.9 million and $852.5 million, respectively, which generally consisted of cash, money market funds, corporate debt securities and U.S government-issued obligations. In 2017 and 2016, we made capital expenditures of $10.0 million and $10.3 million, respectively, which included hardware and software to support business operations.
In November 2016, we authorized the 2016 Share Repurchase Program. During 2016, we repurchased 12.3 million shares of our Class A common stock under the 2016 Share Repurchase Program at a weighted average price of $2.76 per share for a total of $34.2 million. During 2017, we repurchased 36.3 million shares of our Class A common stock under the 2016 Share Repurchase Program at a weighted average price of $2.78 per share for a total of $101.0 million.
In October 2015, we authorized the 2015 Share Repurchase Program. In the fourth quarter of 2015, we repurchased 37.9 million shares of our Class A common stock under the repurchase program at a weighted average price of $2.60 per share for a total of $98.9 million. In the first quarter of 2016, we repurchased 42.2 million shares of our Class A common stock at a weighted average price of $2.40 for a total of $101.9 million, completing the repurchase plan put in place during the fourth quarter of 2015.
Operating Activities
2017 Compared to 2016. After our net income of $26.6 million is adjusted to exclude certain non-cash items, operating activities provided $94.6 million of cash and cash equivalents during 2017 primarily from higher bookings. Significant non-cash items included stock-based compensation expense of $64.5 million and depreciation and amortization of $30.3 million. Stock-based compensation expense decreased $42.9 million from 2016 to 2017 primarily due to higher stock-based compensation expense in 2016 related to non-recurring restricted stock units (“ZSUs”) expense associated with the NaturalMotion acquisition and declines in grant activity in 2017. Depreciation and amortization decreased by $11.5 million primarily due to lower amortization expense from fully amortized intangibles, as well as the one-time impairment taken in 2016 related to intangibles acquired as part of the Rising Tide acquisition. The change in our operating assets and liabilities during 2017 resulted in a $29.8 million outflow of cash, primarily due to changes in accounts receivable, other assets and deferred revenue of $26.4 million, $8.1 million and $7.6 million, respectively, offset by changes in other liabilities of $11.2 million. The increase in accounts receivable was primarily driven by a change in timing of fiscal year ends of one of our largest payment processors, resulting in two months of accounts receivable due at December 31, 2017 compared to only one month at December 31, 2016.
2016 Compared to 2015. After our net loss of $108.2 million is adjusted to exclude certain non-cash items, operating activities provided $60.0 million of cash during 2016, primarily due to higher bookings. Significant non-cash items included stock-based compensation expense of $107.5 million, depreciation and amortization of $41.8 million and impairment of intangible assets of $20.7 million. Stock-based compensation expense decreased $24.1 million, primarily due to stock option grants related to the NaturalMotion acquisition fully vesting during 2015 and the first half of 2016 and a decrease in expense from 2015 forfeited awards. Depreciation and amortization decreased by $12.5 million, primarily due to the consolidation of data facilities and the related disposition of certain data center assets. Changes in our operating assets and liabilities decreased $0.1 million in 2016 primarily due to changes in deferred revenue of $13.1 million, offset by changes in other liabilities of $12.8 million. The contingent consideration liability for Rising Tide was settled during the fourth quarter of 2016 for $10.2 million. As of December 31, 2015, the fair value of the contingent consideration was $18.5 million. As a result of settling the full contingent consideration, the change in other liabilities reported within operating activities includes the non-cash portion of $8.3 million, with the remaining $10.2 million reported within financing activities.
Investing Activities
2017 Compared to 2016. Investing activities resulted in cash outflow of $460.2 million during 2017. The primary outflow of cash associated with investing activities was a net purchase of $308.6 million of short-term investments during 2017, while no
41
purchases of short-term investments were made in the prior year. Additionally, cash outflows of $142.2 million were used for the 2017 acquisitions of Harpan and Peak Games; the Company expects to continue seeking acquisition opportunities in the future. Finally, capital expenditures resulted in cash outflows of $10.0 million in 2017, which were in line with cash outflows of $10.3 million in the prior year. We expect capital expenditures of approximately $8.5 million in 2018.
2016 Compared to 2015. Investing activities resulted in cash inflow of $204.1 million during 2016. The primary inflow of cash associated with investing activities was $244.8 million of sales and maturities of short-term investments. The primary outflow of cash was $33.6 million for business combinations, net of cash acquired, primarily due to the acquisition of Zindagi in the first quarter of 2016 for closing consideration of $12.5 million (net of prepaid compensation expense of $2.5 million, which was reported in operating activities) and the acquisition of PuzzleSocial in the third quarter of 2016 for closing consideration of $19.4 million (net of cash acquired of $0.6 million). Capital expenditures were $10.3 million in 2016, which mainly related to the investment in hardware and software to support business operations.
Financing Activities
2017 Compared to 2016. Financing activities resulted in cash outflow of $118.0 million during 2017. The primary outflow of cash associated with financing activities was $105.0 million of repurchases of Class A common stock in the first, second and fourth quarters of 2017; in the prior year, repurchases of Class A common stock resulted in cash outflow of $142.6 million. Additionally, the Company paid $21.7 million on taxes on behalf of employees related to the net settlement of equity awards in 2017, versus only $3.4 million in the prior year.
2016 Compared to 2015. Financing activities used $150.3 million during 2016. The primary outflow of cash associated with financing activities was $142.6 million of repurchases of Class A common stock in the first and fourth quarters of 2016. An additional, $4.0 million of share repurchases were recorded in accounts payable and other current liabilities as of December 31, 2016, in the amounts of $1.4 million and $2.6 million, respectively, and will be paid in the first quarter of 2017. The contingent consideration liability for Rising Tide was settled during the fourth quarter of 2016 for $10.2 million, which is reported as an outflow within financing activities.
Credit Facility
On November 2, 2016, the Company voluntarily terminated its Amended and Restated Revolving Credit Agreement, dated as of June 20, 2013, as amended on July 1, 2015 (as amended, the “Credit Agreement”) among the Company, the lenders party thereto, and Morgan Stanley Senior Funding, Inc., as the administrative agent. Prior to its termination, the Credit Agreement provided the Company with a $200 million revolving line of credit. The Credit Agreement was terminated because it no longer served the Company’s needs and allows the Company to save costs otherwise incurred in connection with maintaining the line of credit. The pay-off amount in connection with the termination of the Credit Agreement was $0.1 million and primarily consisted of commitment fees. The Company did not incur any early termination penalties in connection with the termination.
Off-Balance Sheet Arrangements
We did not have any off-balance sheet arrangements during 2017, 2016 and 2015.
42
Contractual Obligations (1)
|
|
|
Lease |
|
|
Licensor and Marketing |
|
|
Other |
|
|
Total |
|
||||
|
|
|
(in thousands) |
|
|||||||||||||
|
2018 |
|
$ |
8,301 |
|
|
$ |
8,875 |
|
|
$ |
8,048 |
|
|
$ |
25,224 |
|
|
2019 |
|
|
7,891 |
|
|
|
8,750 |
|
|
|
2,246 |
|
|
|
18,887 |
|
|
2020 |
|
|
5,777 |
|
|
|
2,250 |
|
|
|
383 |
|
|
|
8,410 |
|
|
2021 |
|
|
4,988 |
|
|
|
— |
|
|
|
— |
|
|
|
4,988 |
|
|
2022 |
|
|
1,574 |
|
|
|
— |
|
|
|
— |
|
|
|
1,574 |
|
|
Thereafter |
|
|
— |
|
|
|
— |
|
|
|
— |
|
|
|
— |
|
|
Total |
|
$ |
28,531 |
|
|
$ |
19,875 |
|
|
$ |
10,677 |
|
|
$ |
59,083 |
|
|
(1) |
The amounts represented in the table reflect our minimum cash obligations for the respective calendar years based on contractual terms, but do not necessarily represent the periods in which they will be expensed in the Company’s consolidated statement of operations. |
Lease Commitments
Our lease commitments consist of operating leases primarily for facilities. We do not have any capital lease obligations, and all of our property and equipment has been purchased with cash.
Licensor and Marketing Commitments
Licensor commitments include minimum guarantee royalty payments due to licensors for use of their brands, properties and other licensed content in our games, as well as marking commitments for specified spend related to our marketing products.
Other Commitments
Other commitments primarily include costs for hosting of data systems and other services. Excluded from other commitments is our uncertain income tax position liability of $9.0 million, as the Company cannot make a reasonably reliable estimate of the period of cash settlement.
Legal Commitments
We have a legal commitment of $11.9 million related to the settlement of the Zindagi matter, to be paid in the first quarter of 2018, which is not reflected in the table above. Refer to Note 14 – "Commitments and Contingencies" in the notes to the consolidated financial statements for further discussion
Contingent Consideration Liability
Under the original terms of the acquisition agreements with Zindagi and PuzzleSocial, the maximum amount of additional consideration that could be earned by the sellers and payable by us is $60.0 million and $42.0 million, respectively. The amounts payable are contingent upon the achievement of certain performance targets after the date of acquisition. As of December 31, 2017, there is no estimated contingent consideration liability for any acquisitions. Refer to Note 14 – "Commitments and Contingencies" in the notes to the consolidated financial statements for further discussion on the Zindagi contingent consideration.
Critical Accounting Policies and Estimates
The preparation of financial statements in conformity with U.S. GAAP requires management to make estimates and assumptions that affect the reported amounts in our consolidated financial statements and related notes. Our significant accounting policies are described in Note 1 to our consolidated financial statements included in this Annual Report on form 10-K. We have identified below our critical accounting policies and estimates that we believe require the greatest amount of judgment. These estimates and judgments have a significant impact on our consolidated financial statements. Actual results could differ materially from those estimates. The accounting policies that reflect our more significant estimates and judgments and that we believe are the most critical to fully understand and evaluate our reported financial results include the following:
|
|
• |
Revenue recognition |
|
|
• |
Income taxes |
|
|
• |
Business combinations |
43
|
|
• |
Software development costs |
|
|
• |
Stock-based compensation expense |
|
|
• |
Goodwill |
|
|
• |
Impairment of long-lived assets |
|
|
• |
Licenses and royalties |
Revenue Recognition
We derive revenue from the sale of virtual goods associated with our online games and the sale of advertising.
Online Game. We operate our games as live services that allow players to play for free. Within these games, players can purchase virtual currency to obtain virtual goods to enhance their game-playing experience. On platforms other than Facebook, players purchase our virtual currency and/or virtual goods through various widely accepted payment methods offered in the games, including Apple iTunes accounts, Google Wallet, PayPal and credit cards. When playing our games through the Facebook platform, players can pay for our virtual currency using Facebook local currency payments. Advance payments from customers for virtual goods that are non-refundable and relate to non-cancellable contracts that specify our obligations are recorded to deferred revenue. All other advance payments that do not meet these criteria are recorded as customer deposits.
For revenue earned through mobile platforms, including iOS and Android, we recognize online game revenue based on the gross amount paid by the player because we are the principal in the transaction. Accordingly, we record the related platform and payment processing fees as cost of revenue in the period incurred.
Our players utilize Facebook’s local currency-based payments program to purchase virtual currency in our games. For all payment transactions in our games under Facebook’s local currency-based payments model, Facebook remits to us 70% of the price we request to be charged to the game player for each transaction. We recognize revenue net of the amounts retained by Facebook related to Facebook local currency-based payments because Facebook may choose to alter our recommended price, for example by offering a discount or other incentives to players playing on their platform. Additionally, we do not receive information from Facebook indicating the amount of such discounts offered to our paying players or regarding the actual cash paid by our players to Facebook. Accordingly, we are unable to determine the gross amount paid by our players to Facebook.
We recognize revenue when all of the following conditions are satisfied: there is persuasive evidence of an arrangement; the service has been provided to the player; the collection of our fees is reasonably assured; and the amount of fees to be paid by the player is fixed or determinable. For purposes of determining when the service has been provided to the player, we have determined that an implied obligation exists to the paying player to continue displaying the purchased virtual goods within the online game over their estimated life or until they are consumed. Accordingly, we categorize our virtual goods as either consumable or durable. Consumable virtual goods represent goods that can be consumed by a specific player action. Common characteristics of consumable goods may include virtual goods that are no longer displayed on the player’s game board after a short period of time, do not provide the player any continuing benefit following consumption, or often times enable a player to perform an in-game action immediately. For the sale of consumable virtual goods, we recognize revenue as the goods are consumed, which approximates one month from sale of the virtual good. Durable virtual goods represent virtual goods that are accessible to the player over an extended period of time. We recognize revenue from the sale of durable virtual goods ratably over the estimated average playing period of paying players for the applicable game, which represents our best estimate of the average life of the durable virtual good. If we do not have the ability to differentiate revenue attributable to durable virtual goods from consumable virtual goods for a specific game, we recognize revenue on the sale of the virtual goods for that game ratably over the estimated average period that paying players typically play the applicable game.
We have had sufficient data to separately account for consumable and durable virtual goods for substantially all of our web games, thus allowing us to recognize revenue related to consumable goods upon consumption for our web-based games. However, for our standalone mobile games, we do not have the requisite data to separately account for consumable and durable virtual goods and have therefore recorded mobile revenue ratably over the estimated average payer life. We expect that in future periods there will be changes in the mix of durable and consumable virtual goods offered and sold, reduced virtual good sales in some existing games, changes in estimates in average paying payer life and/or changes in our ability to make such estimates. When such changes occur, and in particular if more of our revenue in any period is derived from virtual goods for which revenue is recognized over the estimated average playing period, or the estimated average playing period increases on average, the amount of revenue that we recognize in a current or future period may be reduced, perhaps significantly. Conversely, if the estimated average playing period decreases on average, the amount of revenue that we recognize in a current or future period may be accelerated, perhaps significantly.
44
On a quarterly basis, we determine the estimated average playing period for paying players by game beginning at the time of a payer’s first purchase in that game and ending on a date when that paying player is no longer playing the game. To determine when paying players are no longer playing a given game, we analyze monthly cohorts of paying players for that game who made their first in-game payment between six and 18 months prior to the beginning of each quarter and determine whether each player within the cohort is an active or inactive player as of the date of our analysis. To determine which players are inactive, we analyze the dates that each paying player last logged into that game. We determine a paying player to be inactive once they have reached a period of inactivity for which it is probable that a player will not return to a specific game. For the payers deemed inactive as of our analysis date, we analyze the dates they last logged into that game to determine the rate at which inactive players stopped playing. Based on these dates we then project a date at which all paying players for each monthly cohort are expected to cease playing our games. We then average the time periods from first purchase date and the date the last player is expected to cease playing the game for each of the monthly cohorts to determine the total playing period for that game. To determine the estimated average playing period we then divide this total playing period by two. The use of this “average” approach is supported by our observations that paying players typically become inactive at a relatively consistent rate for our games. If future data indicates paying players do not become inactive at a relatively consistent rate, we will modify our calculations accordingly. When a new game is launched and only a limited period of paying player data is available for our analysis, then we also consider other factors, such as the estimated average playing period for other recently launched games with similar characteristics, to determine the estimated average playing period.
Future usage patterns may differ from historical usage patterns and therefore the estimated average playing periods may change in the future. We assess the estimated average playing period of our virtual goods quarterly.
Advertising. We have contractual relationships with agencies, advertising brokers and directly with advertisers for advertisements within our games. We generally report our advertising revenue net of amounts retained by advertising networks, agencies, and brokers because we are not the principal for the advertisement transaction. However, certain advertisement placements that are directly between us and the end advertiser are recognized gross equal to the price paid to the Company by the end advertiser since we are the principal in the direct advertising arrangement.
We recognize advertising revenue for engagement advertisements and offers, mobile advertisements, branded virtual goods and sponsorships and other advertisements as advertisements are delivered to customers as long as evidence of the arrangement exists, the price is fixed or determinable, and collectability as reasonably assured. Price is determined to be fixed or determinable when there is a fixed price included a master contract, insertion order, or a third party statement of advertising activity. For engagement advertisements and offers, mobile advertisements, and other advertisements, delivery occurs when the advertisement has been displayed or the offer has been completed by the customer, as evidenced by third party verification reports supporting the number of advertisements displayed or offers completed. Certain branded in-game sponsorships that involve virtual goods are deferred and recognized over the estimated life of the branded virtual good or as consumed, similar to online game revenue. For these branded virtual goods and sponsorships, we determine the delivery criteria has been met based on delivery reporting received from third parties.
Multiple-Element Arrangements. We allocate arrangement consideration in multiple-deliverable revenue arrangements at the inception of an arrangement to all deliverables based on the relative selling price method, generally based on our best estimate of selling price.
Taxes Collected from Customers. We present taxes collected from customers and remitted to governmental authorities on a net basis within our consolidated statement of operations.
Income Taxes
We account for income taxes using an asset and liability approach, which requires the recognition of taxes payable or refundable for the current year and deferred tax liabilities and assets for the future tax consequences of events that have been recognized in our financial statements or tax returns. The measurement of current and deferred tax assets and liabilities is based on provisions of enacted tax laws at the end of the reporting period; the effect of future changes in tax laws or rates are not anticipated (refer to the header “Tax Cuts and Jobs Act” earlier in MD&A for further discussion on the impact to the enacted tax laws in 2017). If necessary, the measurement of deferred tax assets is reduced by the amount of any tax benefits that are not expected to be realized based on available evidence.
We account for uncertain tax positions by reporting a liability for unrecognized tax benefits resulting from uncertain tax positions taken or expected to be taken in a tax return. We recognize interest and penalties, if any, related to unrecognized tax benefits in the provision for income tax.
In January 2018, the SEC staff issued Staff Accounting Bulletin No. 118, Income Tax Accounting Implications of the Tax Cuts and Jobs Act (“SAB 118”) to provide guidance for companies that have not completed their accounting for the income tax effects of
45
the 2017 Tax Act in the period of enactment. Specifically, SAB 118 states that companies that have not completed accounting for the effects of the 2017 Tax Act by financial reporting deadlines may report provisional amounts based on reasonable estimates for items for which the accounting is incomplete. Those provisional amounts will be subject to adjustment during a measurement period that begins in the reporting period that includes the 2017 Tax Act’s enactment date and ends when a company has obtained, prepared and analyzed the information needed to complete the accounting requirements under ASC 740 Income Taxes. The measurement period should not extend beyond one year from the enactment date. Furthermore, SAB 118 states that if a company cannot make a reasonable estimate for an income tax effect, it should not account for that effect until it can make such an estimate.
In accordance with SAB 118, we have recorded provisional amounts, which primarily consist of $2.4 million income tax benefit in connection with the re-measurement of certain deferred tax assets and liabilities and $2.6 million income tax benefit in connection with the refundable AMT credit. These amounts have been recorded as provisional as we believe that additional analysis of our deferred tax assets and liabilities is necessary, as well as the evaluation of potential correlative adjustments. Any subsequent adjustment to these amounts will be recorded to current tax expense in the period the analysis is completed, not to exceed the fourth quarter of 2018.
We have determined that we cannot make a reasonable estimate of the income tax effect with respect to global intangible low-taxed income (GILTI) provisions of the 2017 Tax Act. The GILTI provisions allow companies to make an accounting policy election to either (i) account for GILTI as a component of tax expense in the period in which the entity is subject to the rules or (ii) account for GILTI in the entity’s measurement of deferred taxes. Our ultimate accounting policy election will depend on our estimates of future taxable income related to GILTI.
Business Combinations
In line with our growth strategy, we have completed acquisitions to expand our social games and mobile offerings, obtain employee talent and expand into new markets. We account for acquisitions of entities that include inputs and processes and have the ability to create outputs as business combinations. We allocate the purchase price of the acquisition, which includes the estimated acquisition date fair value of contingent consideration (if applicable), to the tangible assets, liabilities and identifiable intangible assets acquired based on their estimated fair values at the acquisition date. The excess of the purchase price over those fair values is recorded as goodwill. Determining the fair value of such items requires judgment, including estimating future cash flows or the cost to recreate an acquired asset. If actual results are lower than initial estimates, we could be required to record impairment charges in the future. Acquired intangible assets with definite lives are amortized over their estimated useful lives generally on a straight-line basis, unless evidence indicates a more appropriate method. Intangible assets with indefinite lives are not amortized but rather tested for impairment annually, or more frequently if circumstances indicate an impairment may exist.
Acquisition-related expenses are expensed as incurred. During the one-year period beginning with the acquisition date, we may record certain purchase accounting adjustments related to the fair value of assets acquired and liabilities assumed against goodwill. After the final determination of the fair value of assets acquired or liabilities assumed, any subsequent adjustments are recorded to our consolidated statements of operations. The fair value of contingent consideration liabilities assumed from an acquisition are remeasured each reporting period and the changes in the fair value is recorded within operating expenses in our consolidated statement of operations each reporting period.
Software Development Costs
We review internal use software development costs associated with new games or updates to existing games on a quarterly basis to determine if the costs qualify for capitalization. Our studio teams follow an agile development process, whereas the preliminary project stage remains ongoing until just prior to worldwide launch, at which time final feature selection occurs. As such, the development costs are expensed as incurred to research and development in our consolidated statement of operations. We did not capitalize any software development costs in 2017, 2016 or 2015.
Stock-Based Compensation Expense
We recognize stock-based compensation expense for ZSUs based on grant date fair value on a straight-line basis over the requisite service period for the entire award. For certain performance based ZSUs, we recognize the stock-based compensation expense based upon the grant date fair value on an accelerated attribution basis over the requisite service period of the award.
46
We estimate the fair value of stock options using the Black-Scholes option-pricing model. This model requires the use of the following assumptions: expected volatility of our Class A common stock, which is based on our own calculated historical rate; expected life of the option award, which we elected to calculate using the simplified method; expected dividend yield, which is 0%, as we have not paid and do not have any plans to pay dividends on our common stock; and the risk-free interest rate, which is based on the U.S. Treasury rate in effect at the time of grant with maturities equal to the stock option award’s expected life. During the fourth quarter of 2015, we changed the basis of estimating our expected volatility from using peer group data to using our own historical calculated rate. If any of the assumptions used in the Black-Scholes model changes significantly, stock-based compensation expense for future awards may differ materially compared to awards previously granted previously. We record stock-based compensation expense for stock options on a straight-line basis over the vesting term.
Stock-based compensation expense is recorded net of forfeitures as they are occur.
Goodwill
Goodwill is evaluated annually for impairment, or more frequently if circumstances indicate that impairment may exist.
When conducting our annual goodwill impairment assessment, we perform a quantitative evaluation of whether goodwill is impaired by comparing the fair value of our single reporting unit to its carrying value. If the carrying value of the reporting unit exceeds its fair value, then we record the amount by which the carrying value exceeds its fair value, if any, as impairment to goodwill. For our annual goodwill impairment analysis performed in the fourth quarter of 2017, our estimates of fair value were based on the market approach, which estimated the fair value of our reporting unit based on the Company’s market capitalization at the annual testing date. The result of the quantitative evaluation indicated that the estimated fair value of the reporting unit exceeded its carrying value. Accordingly, we concluded goodwill was not impaired.
Impairment of Long-Lived Assets
Long-lived assets, including other intangible assets not considered indefinite-lived intangible assets, are reviewed for impairment whenever events or changes in circumstances indicate an asset’s carrying value may not be recoverable. If such circumstances are present, we assess the recoverability of the long-lived assets by comparing the carrying value to the undiscounted future cash flows associated with the related assets. If the future net undiscounted cash flows are less than the carrying value of the assets, the assets are considered impaired and an expense, equal to the amount required to reduce the carrying value of the assets to the estimated fair value, is recorded as an impairment of intangible assets in the consolidated statements of operations. Significant judgment is required to estimate the amount and timing of future cash flows and the relative risk of achieving those cash flows.
Assumptions and estimates about future values and remaining useful lives are complex and often subjective. They can be affected by a variety of factors, including external factors such as industry and economic trends, and internal factors such as changes in our business strategy and our internal forecasts. For example, if our future operating results do not meet current forecasts, we may be required to record future impairment charges for acquired intangible assets. Impairment charges could materially decrease our future net income and result in lower asset values on our balance sheet. In the third quarter of 2016, we recorded an $18.2 million and $2.5 million impairment charge associated with developed technology previously acquired from Rising Tide and Zindagi, respectively. There were no impairment charges recorded during 2017 or 2015.
Licenses and Royalties
We obtain licenses from third parties for use of their brands, properties and other licensed content in our games (e.g., Hit It Rich! Slots). Our licensing agreements typically include minimum guarantee royalty payments, which are due over the term of the agreement and are recoupable against future royalty obligations that would otherwise become payable. These advance payments are capitalized as prepaid royalties when paid and amortized once the licensed product is launched in our game. Amortization is recorded as cost of revenue and is calculated as (i) the contractual royalty rate based on actual net product sales as defined in the licensing agreement or (ii) the straight-line method over the remaining estimated useful life of the licensed product, whichever is greater.
47
Each quarter, we evaluate the recoverability of our prepaid royalties as well as any contractual commitments not yet paid to determine amounts that we deem unlikely to be recovered through product sales. To evaluate the future recoverability of prepaid royalties and guarantees, we consider the terms of the agreement, game development plans, forecasted and actual financial performance of the game as well as other qualitative factors such as the success of similar games and similar genres published by the Company. To the extent that this evaluation indicates that the remaining prepaid and guaranteed royalty payments are not recoverable, the Company records an impairment charge in the period that impairment is indicated. Any impairment losses determined before the launch of a product are recorded as research and development, while any impairment losses determined post-launch are recorded as cost of revenue in our consolidated statement of operations.
Recent Accounting Pronouncements
For information with respect to recent accounting pronouncements and the impact of these pronouncements on our consolidated financial statements, see Note 1 – “Overview and Summary of Significant Accounting Policies” in the notes to the consolidated financial statements included elsewhere in this Annual Report on Form 10-K.
ITEM 7A. QUANTITATIVE AND QUALITATIVE DISCLOSURE ABOUT MARKET RISK
Interest Rate Fluctuation Risk
At December 31, 2017, our cash and cash equivalents and short-term investments consist of cash, money market funds, and corporate debt securities. The primary objective of our investment activities is to preserve principal, ensure liquidity and maximize income without significantly increasing risk. Our short-term investments consist of corporate debt securities which may be subject to market risk due to changes in prevailing interest rates that may cause the fair values of our investments to fluctuate. Based on a sensitivity analysis, we have determined that a hypothetical 100 basis points increase in interest rates would have resulted in a decrease in the fair values of our investments of approximately $0.8 million as of December 31, 2017. Such losses would only be realized if we sold the investments prior to maturity.
Foreign Currency Exchange Risk
We have foreign currency risks related to our revenue and operating expenses incurred outside the U.S. and denominated in currencies other than the functional currency of the entities in which they are recorded. Accordingly, we are subject to fluctuations due to changes in foreign currency exchange rates, particularly changes in the Euro, Chinese Yuan, Japanese Yen, British Pound, Canadian Dollar, Australian Dollar, Turkish Lira, and Indian Rupee. The volatility of exchange rates depends on many factors that we cannot forecast with reliable accuracy. Although we have experienced and will continue to experience fluctuations in our net income (loss) as a result of transaction gains (losses) related to revaluing certain cash balances, trade accounts receivable, trade accounts payable, current liabilities and intercompany balances that are denominated in currencies other than the U.S. dollar, we believe such a change would not have a material impact on our results of operations.
48
ITEM 8. FINANCIAL STATEMENTS AND SUPPLEMENTARY DATA
Zynga Inc.
INDEX TO CONSOLIDATED FINANCIAL STATEMENTS
|
|
Page No. |
|
50 |
|
|
Consolidated Financial Statements |
|
|
52 |
|
|
53 |
|
|
54 |
|
|
55 |
|
|
56 |
|
|
57 |
The supplementary financial information required by this Item 8 is included in Item 7 under the caption “Quarterly Results of Operations Data,” which is incorporated herein by reference.
49
Report of Independent Registered Public Accounting Firm
To the Stockholders and the Board of Directors of Zynga Inc.
Opinion on the Financial Statements
We have audited the accompanying consolidated balance sheets of Zynga Inc. (the Company) as of December 31, 2017 and 2016, and the related consolidated statements of operations, comprehensive income (loss), stockholders’ equity and cash flows for each of the three years in the period ended December 31, 2017, and the related notes and the financial statement schedule listed in the Index at Item 15(a)2 (collectively referred to as the “financial statements”). In our opinion, the financial statements present fairly, in all material respects, the financial position of the Company at December 31, 2017 and 2016, and the results of its operations and its cash flows for each of the three years in the period ended December 31, 2017, in conformity with U.S. generally accepted accounting principles.
We also have audited, in accordance with the standards of the Public Company Accounting Oversight Board (United States) (PCAOB), the Company's internal control over financial reporting as of December 31, 2017, based on criteria established in Internal Control-Integrated Framework issued by the Committee of Sponsoring Organizations of the Treadway Commission (2013 framework) and our report dated February 20, 2018 expressed an unqualified opinion thereon.
Basis for Opinion
These financial statements are the responsibility of the Company's management. Our responsibility is to express an opinion on the Company’s financial statements based on our audits. We are a public accounting firm registered with the PCAOB and are required to be independent with respect to the Company in accordance with the U.S. federal securities laws and the applicable rules and regulations of the Securities and Exchange Commission and the PCAOB.
We conducted our audits in accordance with the standards of the PCAOB. Those standards require that we plan and perform the audit to obtain reasonable assurance about whether the financial statements are free of material misstatement, whether due to error or fraud. Our audits included performing procedures to assess the risks of material misstatement of the financial statements, whether due to error or fraud, and performing procedures that respond to those risks. Such procedures included examining, on a test basis, evidence regarding the amounts and disclosures in the financial statements. Our audits also included evaluating the accounting principles used and significant estimates made by management, as well as evaluating the overall presentation of the financial statements. We believe that our audits provide a reasonable basis for our opinion.
/s/ Ernst & Young LLP
We have served as the Company’s auditor since 2009.
San Jose, CA
February 20, 2018
50
Report of Independent Registered Public Accounting Firm
To the Stockholders and the Board of Directors of Zynga Inc.
Opinion on Internal Control over Financial Reporting
We have audited Zynga Inc.’s internal control over financial reporting as of December 31, 2017, based on criteria established in Internal Control—Integrated Framework issued by the Committee of Sponsoring Organizations of the Treadway Commission (2013 framework) (the COSO criteria). In our opinion Zynga Inc. (the Company) maintained, in all material respects, effective internal control over financial reporting as of December 31, 2017, based on the COSO criteria.
We also have audited, in accordance with the standards of the Public Company Accounting Oversight Board (United States) (PCAOB), the consolidated balance sheets of the Company as of December 31, 2017 and 2016, and the related consolidated statements of operations, comprehensive income (loss), stockholders’ equity and cash flows for each of the three years in the period ended December 31, 2017, and the related notes and the financial statement schedule listed in the Index at Item 15(a)2 and our report dated February 20, 2018 expressed an unqualified opinion thereon.
Basis for Opinion
The Company’s management is responsible for maintaining effective internal control over financial reporting and for its assessment of the effectiveness of internal control over financial reporting included in the accompanying Management’s Report on Internal Control over Financial Reporting. Our responsibility is to express an opinion on the Company’s internal control over financial reporting based on our audit. We are a public accounting firm registered with the PCAOB and are required to be independent with respect to the Company in accordance with the U.S. federal securities laws and the applicable rules and regulations of the Securities and Exchange Commission and the PCAOB.
We conducted our audit in accordance with the standards of the PCAOB. Those standards require that we plan and perform the audit to obtain reasonable assurance about whether effective internal control over financial reporting was maintained in all material respects.
Our audit included obtaining an understanding of internal control over financial reporting, assessing the risk that a material weakness exists, testing and evaluating the design and operating effectiveness of internal control based on the assessed risk, and performing such other procedures as we considered necessary in the circumstances. We believe that our audit provides a reasonable basis for our opinion.
Definition and Limitations of Internal Control Over Financial Reporting
A company’s internal control over financial reporting is a process designed to provide reasonable assurance regarding the reliability of financial reporting and the preparation of financial statements for external purposes in accordance with generally accepted accounting principles. A company’s internal control over financial reporting includes those policies and procedures that (1) pertain to the maintenance of records that, in reasonable detail, accurately and fairly reflect the transactions and dispositions of the assets of the company; (2) provide reasonable assurance that transactions are recorded as necessary to permit preparation of financial statements in accordance with generally accepted accounting principles, and that receipts and expenditures of the company are being made only in accordance with authorizations of management and directors of the company; and (3) provide reasonable assurance regarding prevention or timely detection of unauthorized acquisition, use, or disposition of the company’s assets that could have a material effect on the financial statements.
Because of its inherent limitations, internal control over financial reporting may not prevent or detect misstatements. Also, projections of any evaluation of effectiveness to future periods are subject to the risk that controls may become inadequate because of changes in conditions, or that the degree of compliance with the policies or procedures may deteriorate.
/s/ Ernst & Young LLP
San Jose, CA
February 20, 2018
51
Zynga Inc.
(In thousands, except par value)
|
|
|
December 31, |
|
|
December 31, |
|
||
|
|
|
2017 |
|
|
2016 |
|
||
|
Assets |
|
|
|
|
|
|
|
|
|
Current assets: |
|
|
|
|
|
|
|
|
|
Cash and cash equivalents |
|
$ |
372,870 |
|
|
$ |
852,467 |
|
|
Short-term investments |
|
|
308,506 |
|
|
|
— |
|
|
Accounts receivable, net of allowance of $0 at December 31, 2017 and December 31, 2016 |
|
|
103,677 |
|
|
|
77,260 |
|
|
Restricted cash |
|
|
12,807 |
|
|
|
6,199 |
|
|
Prepaid expenses |
|
|
24,253 |
|
|
|
22,951 |
|
|
Other current assets |
|
|
8,837 |
|
|
|
6,599 |
|
|
Total current assets |
|
|
830,950 |
|
|
|
965,476 |
|
|
Goodwill |
|
|
730,464 |
|
|
|
613,335 |
|
|
Intangible assets, net |
|
|
64,258 |
|
|
|
25,430 |
|
|
Property and equipment, net |
|
|
266,589 |
|
|
|
269,439 |
|
|
Restricted cash |
|
|
20,000 |
|
|
|
3,050 |
|
|
Prepaid expenses |
|
|
23,821 |
|
|
|
18,598 |
|
|
Other non-current assets |
|
|
43,251 |
|
|
|
10,521 |
|
|
Total assets |
|
$ |
1,979,333 |
|
|
$ |
1,905,849 |
|
|
Liabilities and stockholders’ equity |
|
|
|
|
|
|
|
|
|
Current liabilities: |
|
|
|
|
|
|
|
|
|
Accounts payable |
|
$ |
18,938 |
|
|
$ |
23,999 |
|
|
Income tax payable |
|
|
6,677 |
|
|
|
1,889 |
|
|
Deferred revenue |
|
|
134,007 |
|
|
|
141,998 |
|
|
Other current liabilities |
|
|
123,089 |
|
|
|
75,754 |
|
|
Total current liabilities |
|
|
282,711 |
|
|
|
243,640 |
|
|
Deferred revenue |
|
|
568 |
|
|
|
158 |
|
|
Deferred tax liabilities, net |
|
|
5,902 |
|
|
|
5,791 |
|
|
Other non-current liabilities |
|
|
48,912 |
|
|
|
75,596 |
|
|
Total liabilities |
|
|
338,093 |
|
|
|
325,185 |
|
|
Stockholders’ equity: |
|
|
|
|
|
|
|
|
|
Common stock, $0.00000625 par value, and additional paid-in capital - authorized shares: 2,020,517; shares outstanding: 870,660 shares (Class A, 783,376, Class B, 66,767 and Class C, 20,517) as of December 31, 2017 and 886,850 (Class A, 770,269, Class B, 96,064 and Class C, 20,517) as of December 31, 2016 |
|
|
3,426,505 |
|
|
|
3,349,714 |
|
|
Accumulated other comprehensive income (loss) |
|
|
(93,497 |
) |
|
|
(128,694 |
) |
|
Accumulated deficit |
|
|
(1,691,768 |
) |
|
|
(1,640,356 |
) |
|
Total stockholders’ equity |
|
|
1,641,240 |
|
|
|
1,580,664 |
|
|
Total liabilities and stockholders’ equity |
|
$ |
1,979,333 |
|
|
$ |
1,905,849 |
|
See accompanying notes to consolidated financial statements.
52
Zynga Inc.
Consolidated Statements of Operations
(In thousands, except per share data)
|
|
|
Year Ended December 31, |
|
|||||||||
|
|
|
2017 |
|
|
2016 |
|
|
2015 |
|
|||
|
Revenue: |
|
|
|
|
|
|
|
|
|
|
|
|
|
Online game |
|
$ |
665,593 |
|
|
$ |
547,291 |
|
|
$ |
590,755 |
|
|
Advertising and other |
|
|
195,797 |
|
|
|
194,129 |
|
|
|
173,962 |
|
|
Total revenue |
|
|
861,390 |
|
|
|
741,420 |
|
|
|
764,717 |
|
|
Costs and expenses: |
|
|
|
|
|
|
|
|
|
|
|
|
|
Cost of revenue |
|
|
258,971 |
|
|
|
238,546 |
|
|
|
235,985 |
|
|
Research and development |
|
|
256,012 |
|
|
|
320,300 |
|
|
|
361,931 |
|
|
Sales and marketing |
|
|
212,030 |
|
|
|
183,637 |
|
|
|
169,573 |
|
|
General and administrative |
|
|
108,653 |
|
|
|
92,509 |
|
|
|
143,284 |
|
|
Impairment of intangible assets |
|
|
— |
|
|
|
20,677 |
|
|
|
— |
|
|
Total costs and expenses |
|
|
835,666 |
|
|
|
855,669 |
|
|
|
910,773 |
|
|
Income (loss) from operations |
|
|
25,724 |
|
|
|
(114,249 |
) |
|
|
(146,056 |
) |
|
Interest income |
|
|
5,309 |
|
|
|
3,057 |
|
|
|
2,568 |
|
|
Other income (expense), net |
|
|
6,550 |
|
|
|
6,461 |
|
|
|
13,306 |
|
|
Income (loss) before income taxes |
|
|
37,583 |
|
|
|
(104,731 |
) |
|
|
(130,182 |
) |
|
Provision for (benefit from) income taxes |
|
|
10,944 |
|
|
|
3,442 |
|
|
|
(8,672 |
) |
|
Net income (loss) |
|
$ |
26,639 |
|
|
$ |
(108,173 |
) |
|
$ |
(121,510 |
) |
|
|
|
|
|
|
|
|
|
|
|
|
|
|
|
Net income (loss) per share attributable to common stockholders: |
|
|
|
|
|
|
|
|
|
|
|
|
|
Basic |
|
$ |
0.03 |
|
|
$ |
(0.12 |
) |
|
$ |
(0.13 |
) |
|
Diluted |
|
$ |
0.03 |
|
|
$ |
(0.12 |
) |
|
$ |
(0.13 |
) |
|
|
|
|
|
|
|
|
|
|
|
|
|
|
|
Weighted average common shares used to compute net income (loss) per share attributable to common stockholders: |
|
|
|
|
|
|
|
|
|
|
|
|
|
Basic |
|
|
869,067 |
|
|
|
878,827 |
|
|
|
913,511 |
|
|
Diluted |
|
|
897,165 |
|
|
|
878,827 |
|
|
|
913,511 |
|
See accompanying notes to consolidated financial statements.
53
Zynga Inc.
Consolidated Statements of Comprehensive Income (Loss)
(In thousands)
|
|
|
Year Ended December 31, |
|
|||||||||
|
|
|
2017 |
|
|
2016 |
|
|
2015 |
|
|||
|
Net income (loss) |
|
$ |
26,639 |
|
|
$ |
(108,173 |
) |
|
$ |
(121,510 |
) |
|
Other comprehensive income (loss): |
|
|
|
|
|
|
|
|
|
|
|
|
|
Change in foreign currency translation adjustment |
|
|
35,352 |
|
|
|
(76,410 |
) |
|
|
(23,480 |
) |
|
Net change in unrealized gains (losses) on available-for-sale marketable securities, net of tax |
|
|
(155 |
) |
|
|
104 |
|
|
|
267 |
|
|
Other comprehensive income (loss), net of tax: |
|
|
35,197 |
|
|
|
(76,306 |
) |
|
|
(23,213 |
) |
|
Comprehensive income (loss): |
|
$ |
61,836 |
|
|
$ |
(184,479 |
) |
|
$ |
(144,723 |
) |
See accompanying notes to consolidated financial statements.
54
Zynga Inc.
Consolidated Statements of Stockholders’ Equity
(In thousands)
|
|
|
|
|
|
|
|
|
|
|
|
|
|
|
|
|
|
|
|
|
|
|
|
|
|
|
|
|
|
|
|
|
|
|
|
|
|
|
|
|
|
|
|
|
|
|
|
|
Accumulated |
|
|
|
|
|
|
|
|
|
|
|
|
|
Class A, B and C Common Stock |
|
|
Additional Paid-In |
|
|
Treasury |
|
|
Other Comprehensive |
|
|
Accumulated |
|
|
Total Stockholders' |
|
||||||||||
|
|
|
Shares |
|
|
Amount |
|
|
Capital |
|
|
Stock |
|
|
Income (Loss) |
|
|
Deficit |
|
|
Equity |
|
|||||||
|
Balances at December 31, 2014 |
|
|
905,860 |
|
|
$ |
5 |
|
|
$ |
3,096,977 |
|
|
$ |
— |
|
|
$ |
(29,175 |
) |
|
$ |
(1,172,115 |
) |
|
$ |
1,895,692 |
|
|
Exercise of stock options and ESPP |
|
|
7,075 |
|
|
|
— |
|
|
|
7,567 |
|
|
|
— |
|
|
|
— |
|
|
|
— |
|
|
|
7,567 |
|
|
Vesting of ZSUs, net of tax withholdings |
|
|
27,966 |
|
|
|
1 |
|
|
|
(2,130 |
) |
|
|
(772 |
) |
|
|
— |
|
|
|
— |
|
|
|
(2,901 |
) |
|
Contributed capital, related to common control acquisition |
|
|
— |
|
|
|
— |
|
|
|
1,854 |
|
|
|
— |
|
|
|
— |
|
|
|
(1,963 |
) |
|
|
(109 |
) |
|
Stock-based compensation expense |
|
|
717 |
|
|
|
— |
|
|
|
129,591 |
|
|
|
— |
|
|
|
— |
|
|
|
— |
|
|
|
129,591 |
|
|
Vesting of common stock following the early exercise of options |
|
|
— |
|
|
|
— |
|
|
|
170 |
|
|
|
— |
|
|
|
— |
|
|
|
— |
|
|
|
170 |
|
|
Repurchases of common stock |
|
|
(38,001 |
) |
|
|
— |
|
|
|
— |
|
|
|
(98,902 |
) |
|
|
— |
|
|
|
— |
|
|
|
(98,902 |
) |
|
Retirements of treasury stock |
|
|
— |
|
|
|
— |
|
|
|
— |
|
|
|
732 |
|
|
|
— |
|
|
|
(732 |
) |
|
|
— |
|
|
Tax cost (benefit) from stock-based expense |
|
|
— |
|
|
|
— |
|
|
|
516 |
|
|
|
— |
|
|
|
— |
|
|
|
— |
|
|
|
516 |
|
|
Net income (loss) |
|
|
— |
|
|
|
— |
|
|
|
— |
|
|
|
— |
|
|
|
— |
|
|
|
(121,510 |
) |
|
|
(121,510 |
) |
|
Other comprehensive income (loss) |
|
|
— |
|
|
|
— |
|
|
|
— |
|
|
|
— |
|
|
|
(23,213 |
) |
|
|
— |
|
|
|
(23,213 |
) |
|
Balances at December 31, 2015 |
|
|
903,617 |
|
|
$ |
6 |
|
|
$ |
3,234,545 |
|
|
$ |
(98,942 |
) |
|
$ |
(52,388 |
) |
|
$ |
(1,296,320 |
) |
|
$ |
1,786,901 |
|
|
Exercise of stock options and ESPP |
|
|
6,989 |
|
|
|
— |
|
|
|
5,921 |
|
|
|
— |
|
|
|
— |
|
|
|
— |
|
|
|
5,921 |
|
|
Vesting of ZSUs, net of tax withholdings |
|
|
30,794 |
|
|
|
— |
|
|
|
(2,582 |
) |
|
|
(841 |
) |
|
|
— |
|
|
|
— |
|
|
|
(3,423 |
) |
|
Stock-based compensation expense |
|
|
— |
|
|
|
— |
|
|
|
111,824 |
|
|
|
— |
|
|
|
— |
|
|
|
— |
|
|
|
111,824 |
|
|
Repurchases of common stock |
|
|
(54,550 |
) |
|
|
— |
|
|
|
— |
|
|
|
(136,080 |
) |
|
|
— |
|
|
|
— |
|
|
|
(136,080 |
) |
|
Retirements of treasury stock |
|
|
— |
|
|
|
— |
|
|
|
— |
|
|
|
235,863 |
|
|
|
— |
|
|
|
(235,863 |
) |
|
|
— |
|
|
Net income (loss) |
|
|
— |
|
|
|
— |
|
|
|
— |
|
|
|
— |
|
|
|
— |
|
|
|
(108,173 |
) |
|
|
(108,173 |
) |
|
Other comprehensive income (loss) |
|
|
— |
|
|
|
— |
|
|
|
— |
|
|
|
— |
|
|
|
(76,306 |
) |
|
|
— |
|
|
|
(76,306 |
) |
|
Balances at December 31, 2016 |
|
|
886,850 |
|
|
$ |
6 |
|
|
$ |
3,349,708 |
|
|
$ |
— |
|
|
$ |
(128,694 |
) |
|
$ |
(1,640,356 |
) |
|
$ |
1,580,664 |
|
|
Exercise of stock options and ESPP |
|
|
5,365 |
|
|
|
— |
|
|
|
8,769 |
|
|
|
— |
|
|
|
— |
|
|
|
— |
|
|
|
8,769 |
|
|
Vesting of ZSUs, net of tax withholdings |
|
|
14,768 |
|
|
|
— |
|
|
|
(427 |
) |
|
|
(21,292 |
) |
|
|
— |
|
|
|
— |
|
|
|
(21,719 |
) |
|
Stock-based compensation expense |
|
|
— |
|
|
|
— |
|
|
|
64,515 |
|
|
|
— |
|
|
|
— |
|
|
|
— |
|
|
|
64,515 |
|
|
Repurchases of common stock |
|
|
(36,323 |
) |
|
|
(1 |
) |
|
|
— |
|
|
|
(101,035 |
) |
|
|
— |
|
|
|
— |
|
|
|
(101,036 |
) |
|
Retirements of treasury stock |
|
|
— |
|
|
|
— |
|
|
|
— |
|
|
|
122,327 |
|
|
|
— |
|
|
|
(122,327 |
) |
|
|
— |
|
|
Adoption of ASU 2016-09 |
|
|
— |
|
|
|
— |
|
|
|
3,935 |
|
|
|
— |
|
|
|
— |
|
|
|
44,276 |
|
|
|
48,211 |
|
|
Net income (loss) |
|
|
— |
|
|
|
— |
|
|
|
— |
|
|
|
— |
|
|
|
— |
|
|
|
26,639 |
|
|
|
26,639 |
|
|
Other comprehensive income (loss) |
|
|
— |
|
|
|
— |
|
|
|
— |
|
|
|
— |
|
|
|
35,197 |
|
|
|
— |
|
|
|
35,197 |
|
|
Balances at December 31, 2017 |
|
|
870,660 |
|
|
$ |
5 |
|
|
$ |
3,426,500 |
|
|
$ |
— |
|
|
$ |
(93,497 |
) |
|
$ |
(1,691,768 |
) |
|
$ |
1,641,240 |
|
See accompanying notes to consolidated financial statements.
55
Zynga Inc.
Consolidated Statements of Cash Flows
(In thousands)
|
|
|
Year Ended December 31, |
|
|||||||||
|
|
|
2017 |
|
|
2016 |
|
|
2015 |
|
|||
|
Cash flows from operating activities: |
|
|
|
|
|
|
|
|
|
|
|
|
|
Net income (loss) |
|
$ |
26,639 |
|
|
$ |
(108,173 |
) |
|
$ |
(121,510 |
) |
|
Adjustments to reconcile net income (loss) to net cash provided by (used in) operating activities: |
|
|
|
|
|
|
|
|
|
|
|
|
|
Depreciation and amortization |
|
|
30,294 |
|
|
|
41,770 |
|
|
|
54,315 |
|
|
Stock-based compensation expense |
|
|
64,515 |
|
|
|
107,461 |
|
|
|
131,575 |
|
|
(Gain) loss from sales of investments, assets and other, net |
|
|
(238 |
) |
|
|
26 |
|
|
|
(5,558 |
) |
|
Tax benefits from stock-based awards |
|
|
— |
|
|
|
— |
|
|
|
989 |
|
|
Excess tax (benefits) from stock-based awards |
|
|
— |
|
|
|
— |
|
|
|
(989 |
) |
|
Accretion and amortization on marketable securities |
|
|
(636 |
) |
|
|
323 |
|
|
|
5,711 |
|
|
Change in deferred income taxes and other |
|
|
3,780 |
|
|
|
(1,988 |
) |
|
|
(12,693 |
) |
|
Impairment of intangible assets |
|
|
— |
|
|
|
20,677 |
|
|
|
— |
|
|
Changes in operating assets and liabilities: |
|
|
|
|
|
|
|
|
|
|
|
|
|
Accounts receivable, net |
|
|
(26,417 |
) |
|
|
3,834 |
|
|
|
10,148 |
|
|
Other assets |
|
|
(8,124 |
) |
|
|
(2,501 |
) |
|
|
(18,096 |
) |
|
Accounts payable |
|
|
(3,666 |
) |
|
|
(3,613 |
) |
|
|
10,934 |
|
|
Deferred revenue |
|
|
(7,581 |
) |
|
|
13,113 |
|
|
|
(64,762 |
) |
|
Income tax payable |
|
|
4,788 |
|
|
|
1,889 |
|
|
|
— |
|
|
Other liabilities |
|
|
11,223 |
|
|
|
(12,802 |
) |
|
|
(34,511 |
) |
|
Net cash provided by (used in) operating activities |
|
|
94,577 |
|
|
|
60,016 |
|
|
|
(44,447 |
) |
|
Cash flows from investing activities: |
|
|
|
|
|
|
|
|
|
|
|
|
|
Purchases of short-term investments |
|
|
(348,594 |
) |
|
|
— |
|
|
|
(101,091 |
) |
|
Sales and maturities of short-term investments |
|
|
40,000 |
|
|
|
244,837 |
|
|
|
867,198 |
|
|
Acquisition of property and equipment |
|
|
(9,971 |
) |
|
|
(10,313 |
) |
|
|
(7,832 |
) |
|
Business acquisitions, net of cash acquired |
|
|
(133,701 |
) |
|
|
(33,630 |
) |
|
|
(20,023 |
) |
|
Proceeds from sale of property and equipment |
|
|
273 |
|
|
|
3,209 |
|
|
|
814 |
|
|
Proceeds from sale of equity method investment |
|
|
— |
|
|
|
— |
|
|
|
10,507 |
|
|
Other investing activities, net |
|
|
(8,163 |
) |
|
|
— |
|
|
|
— |
|
|
Net cash provided by (used in) investing activities |
|
|
(460,156 |
) |
|
|
204,103 |
|
|
|
749,573 |
|
|
Cash flows from financing activities: |
|
|
|
|
|
|
|
|
|
|
|
|
|
Taxes paid related to net share settlement of stockholders' equity awards |
|
|
(21,719 |
) |
|
|
(3,422 |
) |
|
|
(2,902 |
) |
|
Repurchases of common stock |
|
|
(105,013 |
) |
|
|
(142,596 |
) |
|
|
(88,409 |
) |
|
Proceeds from issuance of common stock |
|
|
8,769 |
|
|
|
5,921 |
|
|
|
7,567 |
|
|
Excess tax benefits from stock-based awards |
|
|
— |
|
|
|
— |
|
|
|
989 |
|
|
Acquisition-related contingent consideration payment |
|
|
— |
|
|
|
(10,230 |
) |
|
|
(10,790 |
) |
|
Net cash provided by (used in) financing activities |
|
|
(117,963 |
) |
|
|
(150,327 |
) |
|
|
(93,545 |
) |
|
|
|
|
|
|
|
|
|
|
|
|
|
|
|
Effect of exchange rate changes on cash and cash equivalents |
|
|
3,945 |
|
|
|
(3,542 |
) |
|
|
(667 |
) |
|
|
|
|
|
|
|
|
|
|
|
|
|
|
|
Net increase (decrease) in cash and cash equivalents |
|
|
(479,597 |
) |
|
|
110,250 |
|
|
|
610,914 |
|
|
Cash and cash equivalents, beginning of period |
|
|
852,467 |
|
|
|
742,217 |
|
|
|
131,303 |
|
|
Cash and cash equivalents, end of period |
|
$ |
372,870 |
|
|
$ |
852,467 |
|
|
$ |
742,217 |
|
|
|
|
|
|
|
|
|
|
|
|
|
|
|
|
Supplemental cash flow information: |
|
|
|
|
|
|
|
|
|
|
|
|
|
Income taxes paid |
|
$ |
4,024 |
|
|
$ |
1,033 |
|
|
$ |
2,803 |
|
See accompanying notes to consolidated financial statements.
56
Zynga Inc.
Notes to Consolidated Financial Statements
1. Overview and Summary of Significant Accounting Policies
Organization and Description of Business
Zynga Inc. (“Zynga,” or “we” or the “Company”) is a leading provider of social game services. We develop, market and operate social games as live services played on mobile platforms such as iOS and Android and social networking sites such as Facebook. Generally, all of our games are free to play, and we generate revenue through the sale of in-game virtual goods and advertising services. Our operations are headquartered in San Francisco, California, and we have several operating locations in the U.S. as well as various international office locations in North America, Asia and Europe.
We completed our initial public offering in December 2011 and our Class A common stock is listed on the NASDAQ Global Select Market under the symbol “ZNGA.”
Basis of Presentation and Consolidation
The accompanying consolidated financial statements are presented in accordance with United States generally accepted accounting principles (“U.S. GAAP”). The consolidated financial statements include the operations of the Company and its wholly owned subsidiaries. All significant intercompany balances and transactions have been eliminated in the consolidation.
Use of Estimates
The preparation of financial statements in conformity with U.S. GAAP requires management to make estimates and assumptions that affect the reported amounts in the consolidated financial statements and notes thereto. Significant estimates and assumptions reflected in the financial statements include, but are not limited to, the estimated lives of virtual goods that we use for revenue recognition, useful lives of property and equipment and intangible assets, accrued liabilities, income taxes, accounting for business combinations, stock-based compensation expense and evaluation of recoverability of goodwill, intangible assets, and long-lived assets. Actual results could differ materially from those estimates.
Changes in our estimated average life of durable virtual goods during 2017 for various games resulted in an increase in revenue and income from operations of $1.3 million, which is the result of adjusting the remaining recognition period of deferred revenue generated in prior periods at the time of a change in estimate. During 2016, changes in our estimated average life of durable virtual goods resulted in a decrease in revenue and income from operations of $0.1 million. In 2016, we also recognized $4.0 million of revenue and income from operations for games that had been discontinued, as there was no further service obligation after the closure of these games. During 2015, changes in our estimated average life of durable virtual goods resulted in an increase in revenue and income from operations of $1.0 million. In 2015, we also recognized $9.9 million of revenue and income from operations for games that been discontinued. These changes in estimates did not impact our reported earnings per share in 2017 or 2016, but had a $0.01 per share impact on our reported loss per share in 2015.
Segments
We have one operating and reportable segment, which is at the consolidated company level. The Chief Operating Decision Maker (“CODM”), our Chief Executive Officer, manages our operations on a consolidated basis for purposes of assessing performance and allocating resources.
Revenue Recognition
We derive revenue from the sale of virtual goods associated with our online games and the sale of advertising.
Online Game. We operate our games as live services that allow players to play for free. Within these games, players can purchase virtual currency to obtain virtual goods to enhance their game-playing experience. On platforms other than Facebook, players purchase our virtual currency and/or virtual goods through various widely accepted payment methods offered in the games, including Apple iTunes accounts, Google Wallet, PayPal and credit cards. When playing our games through the Facebook platform, players can pay for our virtual currency using Facebook local currency payments. Advance payments from customers for virtual goods that are non-refundable and relate to non-cancellable contracts that specify our obligations are recorded to deferred revenue. All other advance payments that do not meet these criteria are recorded as customer deposits.
57
For revenue earned through mobile platforms, including iOS and Android, we recognize online game revenue based on the gross amount paid by the player because we are the principal in the transaction. Accordingly, we record the related platform and payment processing fees as cost of revenue in the period incurred.
Our players utilize Facebook’s local currency-based payments program to purchase virtual currency in our games. For all payment transactions in our games under Facebook’s local currency-based payments model, Facebook remits to us 70% of the price we request to be charged to the game player for each transaction. We recognize revenue net of the amounts retained by Facebook related to Facebook local currency-based payments because Facebook may choose to alter our recommended price, for example by offering a discount or other incentives to players playing on their platform. Additionally, we do not receive information from Facebook indicating the amount of such discounts offered to our paying players or regarding the actual cash paid by our players to Facebook. Accordingly, we are unable to determine the gross amount paid by our players to Facebook.
We recognize revenue when all of the following conditions are satisfied: there is persuasive evidence of an arrangement; the service has been provided to the player; the collection of our fees is reasonably assured; and the amount of fees to be paid by the player is fixed or determinable. For purposes of determining when the service has been provided to the player, we have determined that an implied obligation exists to the paying player to continue displaying the purchased virtual goods within the online game over their estimated life or until they are consumed. Accordingly, we categorize our virtual goods as either consumable or durable. Consumable virtual goods represent goods that can be consumed by a specific player action. Common characteristics of consumable goods may include virtual goods that are no longer displayed on the player’s game board after a short period of time, do not provide the player any continuing benefit following consumption, or often times enable a player to perform an in-game action immediately. For the sale of consumable virtual goods, we recognize revenue as the goods are consumed, which approximates one month from sale of the virtual good. Durable virtual goods represent virtual goods that are accessible to the player over an extended period of time. We recognize revenue from the sale of durable virtual goods ratably over the estimated average playing period of paying players for the applicable game, which represents our best estimate of the average life of the durable virtual good. If we do not have the ability to differentiate revenue attributable to durable virtual goods from consumable virtual goods for a specific game, we recognize revenue on the sale of the virtual goods for that game ratably over the estimated average period that paying players typically play the applicable game.
We have had sufficient data to separately account for consumable and durable virtual goods for substantially all of our web games, thus allowing us to recognize revenue related to consumable goods upon consumption for our web-based games. However, for our standalone mobile games, we do not have the requisite data to separately account for consumable and durable virtual goods and have therefore recorded mobile revenue ratably over the estimated average payer life. We expect that in future periods there will be changes in the mix of durable and consumable virtual goods offered and sold, reduced virtual good sales in some existing games, changes in estimates in average paying payer life and/or changes in our ability to make such estimates. When such changes occur, and in particular if more of our revenue in any period is derived from virtual goods for which revenue is recognized over the estimated average playing period, or the estimated average playing period increases on average, the amount of revenue that we recognize in a current or future period may be reduced, perhaps significantly. Conversely, if the estimated average playing period decreases on average, the amount of revenue that we recognize in a current or future period may be accelerated, perhaps significantly.
On a quarterly basis, we determine the estimated average playing period for paying players by game beginning at the time of a payer’s first purchase in that game and ending on a date when that paying player is no longer playing the game. To determine when paying players are no longer playing a given game, we analyze monthly cohorts of paying players for that game who made their first in-game payment between six and 18 months prior to the beginning of each quarter and determine whether each player within the cohort is an active or inactive player as of the date of our analysis. To determine which players are inactive, we analyze the dates that each paying player last logged into that game. We determine a paying player to be inactive once they have reached a period of inactivity for which it is probable that a player will not return to a specific game. For the payers deemed inactive as of our analysis date, we analyze the dates they last logged into that game to determine the rate at which inactive players stopped playing. Based on these dates we then project a date at which all paying players for each monthly cohort are expected to cease playing our games. We then average the time periods from first purchase date and the date the last player is expected to cease playing the game for each of the monthly cohorts to determine the total playing period for that game. To determine the estimated average playing period we then divide this total playing period by two. The use of this “average” approach is supported by our observations that paying players typically become inactive at a relatively consistent rate for our games. If future data indicates paying players do not become inactive at a relatively consistent rate, we will modify our calculations accordingly. When a new game is launched and only a limited period of paying player data is available for our analysis, then we also consider other factors, such as the estimated average playing period for other recently launched games with similar characteristics, to determine the estimated average playing period.
Future usage patterns may differ from historical usage patterns and therefore the estimated average playing periods may change in the future. We assess the estimated average playing period of our virtual goods quarterly.
58
Advertising. We have contractual relationships with agencies, advertising brokers and directly with advertisers for advertisements within our games. We generally report our advertising revenue net of amounts retained by advertising networks, agencies, and brokers because we are not the principal for the advertisement transaction. However, certain advertisement placements that are directly between us and the end advertiser are recognized gross equal to the price paid to the Company by the end advertiser since we are the principal in the direct advertising arrangement.
We recognize advertising revenue for engagement advertisements and offers, mobile advertisements, branded virtual goods and sponsorships and other advertisements as advertisements are delivered to customers as long as evidence of the arrangement exists, the price is fixed or determinable, and collectability as reasonably assured. Price is determined to be fixed or determinable when there is a fixed price included a master contract, insertion order, or a third party statement of advertising activity. For engagement advertisements and offers, mobile advertisements, and other advertisements, delivery occurs when the advertisement has been displayed or the offer has been completed by the customer, as evidenced by third party verification reports supporting the number of advertisements displayed or offers completed. Certain branded in-game sponsorships that involve virtual goods are deferred and recognized over the estimated life of the branded virtual good or as consumed, similar to online game revenue. For these branded virtual goods and sponsorships, we determine the delivery criteria has been met based on delivery reporting received from third parties.
Multiple-Element Arrangements. We allocate arrangement consideration in multiple-deliverable revenue arrangements at the inception of an arrangement to all deliverables based on the relative selling price method, generally based on our best estimate of selling price.
Taxes Collected from Customers. We present taxes collected from customers and remitted to governmental authorities on a net basis within our consolidated statement of operations.
Cash and Cash Equivalents
Cash and cash equivalents consist of cash on hand, money market funds, corporate debt and U.S. government-issued obligations with maturities of 90 days or less from the date of purchase.
Short-Term Investments
Short-term investments consist of corporate debt securities. The fair value of short-term investments is determined as the exit price in the principal market in which we would transact. Based on our intentions regarding our short-term investments, all short-term investments are classified as available-for-sale and are reported at fair value with unrealized gains and losses recorded as a separate component of other comprehensive income, net of income taxes. Realized gains and losses are determined using the specific-identification method and are reflected as a component of other income (expense), net in the consolidated statements of operations.
We assess whether an other-than-temporary loss on our investments has occurred due to declines in fair value or other market conditions. When we determine that a decline in fair value is other-than-temporary, the cost basis of the individual security is written down to the fair value with the amount of the write-down recorded as a realized loss within other income (expense), net. The new cost basis will not be adjusted for subsequent recoveries in fair value. Determination of whether declines in fair value are other than temporary requires judgment regarding the amount and timing of recovery. No such impairments of short-term investments have been recorded in any of the periods presented.
Restricted Cash
Restricted cash consists of collateral for royalty agreements and funds held in escrow in accordance with the terms of our business acquisition agreements.
Accounts Receivable and Allowance for Doubtful Accounts
Accounts receivable are recorded at the original invoiced amount less an allowance for any potential uncollectible amounts. In evaluating our ability to collect outstanding receivable balances, we consider many factors, including the age of the balance, the customer’s payment history and current creditworthiness and current economic conditions that may affect our customers’ ability to pay. Bad debts are written off after all collection efforts have ceased. We do not require collateral from our customers.
59
Property and Equipment, Net
Property and equipment, net are recorded at historical cost less accumulated depreciation. Depreciation is recorded using the straight-line method over the estimated useful lives of the assets. Leasehold improvements are amortized using the straight-line method over the shorter of the estimated useful lives of the improvements or the lease term.
The estimated useful lives of property and equipment are as follows:
|
Property and Equipment |
|
Useful Life |
|
Computer equipment |
|
3 years |
|
Software |
|
2 to 3 years |
|
Building and building improvements |
|
7 to 39 years |
|
Furniture and fixtures |
|
2 years |
|
Leasehold improvements |
|
Shorter of useful life (generally up to 7 years) or remaining lease term |
Business Combinations
We account for acquisitions of entities that include inputs and processes and have the ability to create outputs as business combinations. We allocate the purchase price of the acquisition, which includes the estimated acquisition date fair value of contingent consideration (if applicable), to the tangible assets, liabilities and identifiable intangible assets acquired based on their estimated fair values at the acquisition date. The excess of the purchase price over those fair values is recorded as goodwill. Determining the fair value of such items requires judgment, including estimating future cash flows or the cost to recreate an acquired asset. If actual results are lower than initial estimates, we could be required to record impairment charges in the future. Acquired intangible assets with definite lives are amortized over their estimated useful lives generally on a straight-line basis, unless evidence indicates a more appropriate method. Intangible assets with indefinite lives are not amortized but rather tested for impairment annually, or more frequently if circumstances indicate an impairment may exist.
Acquisition-related expenses are expensed as incurred. During the one-year period beginning with the acquisition date, we may record certain purchase accounting adjustments related to the fair value of assets acquired and liabilities assumed against goodwill. After the final determination of the fair value of assets acquired or liabilities assumed, any subsequent adjustments are recorded to our consolidated statements of operations. The fair value of contingent consideration liabilities assumed from an acquisition are remeasured each reporting period and the changes in the fair value is recorded within operating expenses in our consolidated statement of operations each reporting period.
Software Development Costs
We review internal use software development costs associated with new games or updates to existing games on a quarterly basis to determine if the costs qualify for capitalization. Our studio teams follow an agile development process, whereas the preliminary project stage remains ongoing until just prior to worldwide launch, at which time final feature selection occurs. As such, the development costs are expensed as incurred to research and development in our consolidated statement of operations. We did not capitalize any software development costs in 2017, 2016 or 2015
Goodwill and Indefinite-Lived Intangible Assets
Goodwill and indefinite-lived intangible assets are evaluated annually for impairment, or more frequently if circumstances exist that indicate that impairment may exist.
When conducting our annual goodwill impairment assessment, we perform a quantitative evaluation of whether goodwill is impaired by comparing the fair value of our single reporting unit to its carrying value. If the carrying value of the reporting unit exceeds its fair value, then we record the amount by which the carrying value exceeds its fair value, if any, as impairment to goodwill. For our annual goodwill impairment analysis performed in the fourth quarter of 2017, our estimates of fair value were based on the market approach, which estimated the fair value of our reporting unit based on the Company’s market capitalization at the annual testing date. The result of the quantitative evaluation indicated that the estimated fair value of the reporting unit exceeded its carrying value. Accordingly, we concluded goodwill was not impaired.
60
At least annually, we test recoverability of indefinite-lived intangible assets using a qualitative approach that considers whether it is more likely than not that the fair value of the intangible asset exceeds its carrying value. If qualitative factors indicate that it is more likely than not that the indefinite-lived intangible asset is impaired, a quantitative analysis is performed and the amount of any impairment loss recorded, if any, is measured as the difference between the carrying value and the fair value of the impaired intangible asset. We concluded that indefinite-lived intangible assets were not impaired as of December 31, 2017.
Intangible Assets
Intangible assets generally consist of definite-lived intangibles assets acquired from a prior business combination and are carried at historical cost less accumulated amortization. Amortization is generally recorded on a straight-lined basis, unless another method is deemed more appropriate, over the estimated useful lives of the assets, generally 12 to 84 months.
Impairment of Long-Lived Assets
Long-lived assets, including other intangible assets not considered indefinite-lived intangible assets, are reviewed for impairment whenever events or changes in circumstances indicate an asset’s carrying value may not be recoverable. If such circumstances are present, we assess the recoverability of the long-lived assets by comparing the carrying value to the undiscounted future cash flows associated with the related assets. If the future net undiscounted cash flows are less than the carrying value of the assets, the assets are considered impaired and an expense, equal to the amount required to reduce the carrying value of the assets to the estimated fair value, is recorded as an impairment of intangible assets in the consolidated statements of operations. Significant judgment is required to estimate the amount and timing of future cash flows and the relative risk of achieving those cash flows.
Assumptions and estimates about future values and remaining useful lives are complex and often subjective. They can be affected by a variety of factors, including external factors such as industry and economic trends, and internal factors such as changes in our business strategy and our internal forecasts. For example, if our future operating results do not meet current forecasts, we may be required to record future impairment charges for acquired intangible assets. Impairment charges could materially decrease our future net income and result in lower asset values on our balance sheet. In the third quarter of 2016, we recorded an $18.2 million and $2.5 million impairment charge associated with developed technology previously acquired from Rising Tide and Zindagi, respectively. There were no impairment charges recorded during 2017 or 2015.
Licenses and Royalties
We obtain licenses from third parties for use of their brands, properties and other licensed content in our games (e.g., Hit It Rich! Slots). Our licensing agreements typically include minimum guarantee royalty payments, which are due over the term of the agreement and are recoupable against future royalty obligations that would otherwise become payable. These advance payments are capitalized as prepaid royalties when paid and amortized once the licensed product is launched in our game. Amortization is recorded as cost of revenue and is calculated as (i) the contractual royalty rate based on actual net product sales as defined in the licensing agreement or (ii) the straight-line method over the remaining estimated useful life of the licensed product, whichever is greater.
Each quarter, we evaluate the recoverability of our prepaid royalties as well as any contractual commitments not yet paid to determine amounts that we deem unlikely to be recovered through product sales. To evaluate the future recoverability of prepaid royalties and guarantees, we consider the terms of the agreement, game development plans, forecasted and actual financial performance of the game as well as other qualitative factors such as the success of similar games and similar genres published by the Company. To the extent that this evaluation indicates that the remaining prepaid and guaranteed royalty payments are not recoverable, the Company records an impairment charge in the period that impairment is indicated. Any impairment losses determined before the launch of a product are recorded as research and development, while any impairment losses determined post-launch are recorded as cost of revenue in our consolidated statement of operations.
Stock-Based Compensation Expense
We recognize stock-based compensation expense for ZSUs based on grant date fair value on a straight-line basis over the requisite service period for the entire award. For certain performance based ZSUs, we recognize the stock-based compensation expense based upon the grant date fair value on an accelerated attribution basis over the requisite service period of the award.
We estimate the fair value of stock options using the Black-Scholes option-pricing model. This model requires the use of the following assumptions: expected volatility of our Class A common stock, which is based on our own calculated historical rate; expected life of the option award, which we elected to calculate using the simplified method; expected dividend yield, which is 0%, as we have not paid and do not have any plans to pay dividends on our common stock; and the risk-free interest rate, which is based on the U.S. Treasury rate in effect at the time of grant with maturities equal to the stock option award’s expected life. During the fourth
61
quarter of 2015, we changed the basis of estimating our expected volatility from using peer group data to using our own historical calculated rate. If any of the assumptions used in the Black-Scholes model changes significantly, stock-based compensation expense for future awards may differ materially compared to awards previously granted previously. We record stock-based compensation expense for stock options on a straight-line basis over the vesting term.
Stock-based compensation expense is recorded net of forfeitures as they are occur.
Income Taxes
We account for income taxes using an asset and liability approach, which requires the recognition of taxes payable or refundable for the current year and deferred tax liabilities and assets for the future tax consequences of events that have been recognized in our financial statements or tax returns. The measurement of current and deferred tax assets and liabilities is based on provisions of enacted tax laws at the end of the reporting period; the effect of future changes in tax laws or rates are not anticipated (refer to the header “Tax Cuts and Jobs Act” earlier in MD&A for further discussion on the impact to the enacted tax laws in 2017). If necessary, the measurement of deferred tax assets is reduced by the amount of any tax benefits that are not expected to be realized based on available evidence.
We account for uncertain tax positions by reporting a liability for unrecognized tax benefits resulting from uncertain tax positions taken or expected to be taken in a tax return. We recognize interest and penalties, if any, related to unrecognized tax benefits in the provision for income tax.
In January 2018, the SEC staff issued Staff Accounting Bulletin No. 118, Income Tax Accounting Implications of the Tax Cuts and Jobs Act (“SAB 118”) to provide guidance for companies that have not completed their accounting for the income tax effects of the 2017 Tax Act in the period of enactment. Specifically, SAB 118 states that companies that have not completed accounting for the effects of the 2017 Tax Act by financial reporting deadlines may report provisional amounts based on reasonable estimates for items for which the accounting is incomplete. Those provisional amounts will be subject to adjustment during a measurement period that begins in the reporting period that includes the 2017 Tax Act’s enactment date and ends when a company has obtained, prepared and analyzed the information needed to complete the accounting requirements under ASC 740 Income Taxes. The measurement period should not extend beyond one year from the enactment date. Furthermore, SAB 118 states that if a company cannot make a reasonable estimate for an income tax effect, it should not account for that effect until it can make such an estimate.
In accordance with SAB 118, we have recorded provisional amounts, which primarily consist of $2.4 million income tax benefit in connection with the re-measurement of certain deferred tax assets and liabilities and $2.6 million income tax benefit in connection with the refundable AMT credit. These amounts have been recorded as provisional as we believe that additional analysis of our deferred tax assets and liabilities is necessary, as well as the evaluation of potential correlative adjustments. Any subsequent adjustment to these amounts will be recorded to current tax expense in the period the analysis is completed, not to exceed the fourth quarter of 2018.
We have determined that we cannot make a reasonable estimate of the income tax effect with respect to global intangible low-taxed income (GILTI) provisions of the 2017 Tax Act. The GILTI provisions allow companies to make an accounting policy election to either (i) account for GILTI as a component of tax expense in the period in which the entity is subject to the rules or (ii) account for GILTI in the entity’s measurement of deferred taxes. Our ultimate accounting policy election will depend on our estimates of future taxable income related to GILTI.
Refer to the Note 7 – “Income Taxes” for further discussion on the impact of tax laws enacted during 2017.
Foreign Currency Transactions
Generally, the functional currency of our international subsidiaries is the U.S. dollar or the local currency that the international subsidiary operates in. For these subsidiaries where the U.S. dollar is not the functional currency, foreign currency denominated monetary assets and liabilities are re-measured into U.S. dollars at reporting period-end exchange rates and foreign currency denominated nonmonetary assets and liabilities are re-measured into U.S. dollars at historical exchange rates. Gains or losses from foreign currency re-measurement of monetary assets and liabilities and transaction settlements are included in other income (expense), net in the consolidated statements of operations. For foreign subsidiaries where the functional currency is the local currency, we use the exchange rates at the prevailing balance sheet date to translate assets and liabilities, and the average exchange rates during the period to translate revenues and expenses into U.S. dollars. We record translation gains and losses in accumulated other comprehensive income (loss) as a component of stockholders’ equity.
62
Concentration of Credit Risk and Significant Customers
Financial instruments, which potentially expose us to concentrations of credit risk, consist primarily of cash and cash equivalents, short-term investments, accounts receivable and lease receivables. Substantially all of our cash and cash equivalents are maintained with three financial institutions with high credit standings. We perform periodic evaluations of the relative credit standing of these institutions.
Accounts receivable and lease receivables are unsecured and represent amounts due to us based on contractual obligations where a signed and executed contract or click-through agreement exists. In cases where we are aware of circumstances that may impair a specific customer or tenant’s ability to meet its financial obligations, we record a specific allowance as a reduction to the accounts or lease receivable balance to reduce the receivable to its net realizable value.
Apple, Google and Facebook are significant distribution, marketing, promotion and payment platforms for our social games. MoPub is a significant advertising partner that serves advertisements in our games. A significant portion of our 2017, 2016 and 2015 revenue was generated from players who accessed our games through these platforms or were served advertisements in our games on behalf of advertisers. As of December 31, 2017 and December 31, 2016, 34% and 27% of our accounts receivable, respectively, were amounts owed to us by Apple, 19% and 23% of our accounts receivable, respectively, were amounts owed to us by Google, 10% and 12% of our accounts receivable, respectively, were amounts owed to us by Facebook, and 15% and 10% of our accounts receivable, respectively, were amounts owed to us by MoPub.
Advertising Expense
Costs for advertising are expensed as incurred. Advertising costs, which are included in sales and marketing expense, primarily consisting of player acquisition costs, totaled $147.2 million, $132.5 million and $128.9 million for 2017, 2016 and 2015 respectively.
Recent Accounting Pronouncements
In May 2014, the Financial Accounting Standards Board (“FASB”) issued Accounting Standards Update (“ASU”) 2014-09, “Revenue from Contracts with Customers (Topic 606),” which requires revenue to be recognized when promised goods or services are transferred to customers in an amount that reflects the consideration that is expected to be received for those goods or services. ASU 2014-09 supersedes the existing revenue recognition guidance and is effective for interim and annual reporting periods beginning after December 15, 2017. The standard permits the use of either a full retrospective or modified retrospective (cumulative effect) transition method. We will apply the modified retrospective approach when we adopt the standard in the first quarter of 2018.
Based on our assessment of the standard, a key change in the standard that impacts our revenue recognition relates to the explicit collectability threshold a contract must meet before revenue can be recognized. For certain advertising arrangements where we have assessed that collectability is not reasonably assured due to unfavorable payment terms or a history of slow collections, the current practice is to defer revenue recognition until payment is received. However, under the new standard, we will be required to make an assessment of collectability at the inception of the contract and if deemed probable for collection, recognize revenue at the amount we expect to be entitled to as advertisements are delivered, which will result in an acceleration in revenue recognition compared to the current method. Another change in the standard that impacts our revenue recognition relates to the distinction between functional intellectual property and symbolic intellectual property for licensing arrangements. The current practice is to recognize revenue when a license is delivered (i.e. at a point in time). However, under the new standard, we will be required to make a distinction based on the nature of the license and recognize revenue at a point in time for functional intellectual property and over time for symbolic intellectual property. For our licensing arrangements of symbolic intellectual property (such as trademarks, brands and character images), this will result in a deceleration of revenue recognition when compared to the current method.
We previously disclosed the standard would also have an impact on our software licensing related to NaturalMotion technology, which is currently recognized as revenue over time, rather than a point in time. However, as a result of a restructuring plan we implemented in the second quarter of 2017, we will no longer provide maintenance services for any new software licenses sold after June 30, 2017. Therefore, the requirement to estimate the standalone selling price of software licenses separate from any associated maintenance services and recognize revenue for the license when control is transferred will only apply to a small subset of our existing licensing contracts. While this change will result in an acceleration in revenue recognition compared to the current method, the impact will not be material.
As a result of adoption, we expect to record a transition adjustment in the range of $3.0 to $5.0 million. We do not, however, anticipate significant changes to our current business processes and systems to support the adoption of the standard in the first quarter of 2018. Additionally, we are finalizing the required disclosures, including the disaggregation of revenue, reconciliation of contract balances and significant judgments used to allow users of our financial statements to understand the nature, amount, timing and uncertainty of revenue and cash flows arising from contracts with our customers.
63
In February 2016, the FASB issued ASU 2016-02, “Leases (Topic 842),” which requires a lessee to recognize assets and liabilities on the balance sheet for leases with lease terms greater than 12 months. For lessors, accounting for leases will remain substantially the same as in prior periods. The standard is effective in the first quarter of 2019 and early adoption is permitted. While the Company expects adoption of this new standard to increase reported assets and liabilities, we are currently in the process of further evaluating the timing of adoption of ASU 2016-02 as well as the full impact on our consolidated financial statements.
In August 2016, the FASB issued ASU 2016-15, “Statement of Cash Flows (Topic 230): Classification of Certain Cash Receipts and Cash Payments,” which provides guidance on specific topics related to how certain cash receipts and cash payments are classified in the statement of cash flows. In November 2016, the FASB issued ASU 2016-18, “Statement of Cash Flows (Topic 230): Restricted Cash,” which requires companies to include amounts generally described as restricted cash and restricted cash equivalents in cash and cash equivalents when reconciling beginning-of-period and end-of-period total amounts shown on the statement of cash flows. Both standards are effective for interim and annual reporting periods beginning after December 15, 2017 with early adoption permitted. We will adopt the standards in the first quarter of 2018. While we continue to assess the potential impact of the new standards, we expect the adoption of these standards will have a material impact on our consolidated financial statements due to the balance of our restricted cash.
In January 2017, the FASB issued ASU 2017-01, “Business Combinations (Topic 805) Clarifying the Definition of a Business,” which clarifies the definition of a business to assist entities with evaluating whether transactions should be accounted for as acquisitions (or disposals) of assets or businesses. The definition of a business affects many areas of accounting including acquisitions, disposals, goodwill and consolidation. The standard is effective for interim and annual periods beginning after December 15, 2017 and early adoption is permitted. We will adopt the standard prospectively in the first quarter of 2018 and the impact of this accounting standard update will be fact dependent, but we expect that some transactions that were previously accounted for as business combinations or disposal transactions will be accounted for as asset purchases or asset sales under the accounting standard update.
In March 2016, the FASB issued ASU 2016-09, “Stock Compensation (Topic 718): Improvements to Employee Shared-Based Payment Accounting”, which simplifies and improves several aspects of the accounting for employee share-based payment transactions for public entities. The new guidance requires companies to record excess tax benefits and tax deficiencies as income tax benefit or expense in the statement of operations when the awards vest or are settled, eliminates the requirement to reclassify cash flows related to excess tax benefits from operating activities to financing activities on the statement of cash flows and provides the option to recognize forfeitures as they occur, rather than estimate expected forfeitures. We adopted the standard in the first quarter of 2017. Upon adoption, we recognized the previously unrecognized excess tax benefits using the modified retrospective transition method, which resulted in a cumulative-effect adjustment of $48.2 million to reduce the opening balance of accumulated deficit in 2017. These previously unrecognized excess tax benefits were recorded as a deferred tax asset, which was fully reserved for by an accompanying valuation allowance. Without the valuation allowance, our deferred tax assets would have increased by $97.3 million. Further, we elected to apply the change in classification of excess tax benefits as an operating activity in the statement of cash flow prospectively and thus no prior periods were adjusted. We also elected to account for forfeitures as they occur and adopted using the modified retrospective transition method, which resulted in a cumulative-effect adjustment of $3.9 million increase to the opening balance additional-paid-in-capital in 2017.
In January 2017, the FASB issued ASU 2017-04, “Intangibles-Goodwill and Other (Topic 350): Simplifying the Test for Goodwill Impairment,” to simplify the subsequent measurement of goodwill by removing the requirement to perform a hypothetical purchase price allocation to compute the implied fair value of goodwill to measure impairment. Instead, any goodwill impairment will equal the amount by which a reporting unit’s carrying value exceeds its fair value, not to exceed the carrying amount of goodwill. The guidance is effective for annual or any interim goodwill impairment test in fiscal years beginning after December 15, 2019, with early adoption permitted for impairment tests performed after January 1, 2017. We elected to early adopt this standard prospectively beginning with our annual goodwill impairment test in the fourth quarter of 2017. There was no financial statement impact upon adoption.
64
2. Short-Term Investments
The following tables summarize our amortized cost, gross unrealized gains and losses and fair value of our short-term investments as of December 31, 2017 (in thousands):
|
|
|
December 31, 2017 |
|
|||||||||||||
|
|
|
|
|
|
|
Gross |
|
|
Gross |
|
|
|
|
|
||
|
|
|
Amortized |
|
|
Unrealized |
|
|
Unrealized |
|
|
Aggregate |
|
||||
|
|
|
Cost |
|
|
Gains |
|
|
Losses |
|
|
Fair Value |
|
||||
|
Corporate debt securities |
|
$ |
308,684 |
|
|
$ |
— |
|
|
$ |
(178 |
) |
|
$ |
308,506 |
|
|
Total available-for-sale short-term investments |
|
$ |
308,684 |
|
|
$ |
— |
|
|
$ |
(178 |
) |
|
$ |
308,506 |
|
We had no available-for-sale short-term investments securities as of December 31, 2016.
All of our available-for-sale short-term investments have contractual maturities of one year or less as of December 31, 2017.
Changes in market interest rates and bond yields cause our short-term investments to fall below their cost basis, resulting in unrealized losses. As of December 31, 2017, we had unrealized losses of $0.2 million related to short-term investments that had a fair value of $143.0 million. At December 31, 2017, none of these investments were in a material continuous unrealized loss position for more than 12 months.
As of December 31, 2017, we did not consider any of our short-term investments to be other-than-temporarily impaired. We do not intend to sell, nor do we believe it is more likely than not that we will be required to sell, any of the securities in an unrealized loss position. When evaluating our investments for other-than-temporary impairment, we review factors such as the length of time and extent to which fair value has been below its cost basis, the financial condition of the issuer, our ability and intent to hold the security to maturity and whether it is more likely than not that we will be required to sell the investment before recovery of the amortized cost basis.
3. Fair Value Measurements
Our financial assets consist of cash equivalents, short-term investments and accounts receivable. Short-term investments and cash equivalents, which consist of money market funds, U.S government and government agency debt securities and corporate debt securities, are reported at fair value. Accounts receivable, net is stated at its net realizable amount, which approximates fair value.
Our financial liabilities consist of accounts payable and accrued liabilities, which are stated at the invoiced or estimated payout amount, respectively, which approximates fair value, as well as contingent consideration obligations as a result of prior business acquisitions, which are reported at fair value.
As of December 31, 2016, our contingent consideration liability represented the estimated fair value of the additional consideration payable in connection with our acquisitions of Zindagi Games, Inc. (“Zindagi”) in the first quarter of 2016 and PuzzleSocial, Inc. (“PuzzleSocial”) in the third quarter of 2016. We initially estimated the acquisition date fair value of the contingent consideration liabilities using discounted cash flow models, and applied a discount rate that appropriately captured a market participant’s view of the risk associated with the respective obligations. The significant unobservable inputs used in the fair value measurement of the acquisition-related contingent consideration payable were forecasted future cash flows, the timing of those cash flows and the risk-adjusted discount rate for each contingent obligation. During the second quarter of 2017, it was determined the future performance of the acquired games would not meet the required performance targets.
With regards to PuzzleSocial, as of December 31, 2017, we continue to not expect the future performance to meet the required performance targets for the acquisition. Accordingly, the estimated contingent consideration liability for PuzzleSocial remained at zero as of December 31, 2017. With regards to the Zindagi matter, refer to Note 14 – “Commitments and Contingencies”, which further discusses a settlement that was reached in the fourth quarter of 2017 with the prior owners.
The change in fair value to the contingent consideration for both acquisitions during 2017 resulted in a net benefit of $0.9 million recorded to the statement of operations during the year. The net benefit was recognized within research and development expense in our consolidated statement of operations.
We estimate fair value as the exit price, which represents the amount that would be received to sell an asset or paid to transfer a liability in an orderly transaction between knowledgeable and willing market participants.
65
The valuation techniques used to measure the fair value of the Company’s financial instruments, all of which have counterparties with high credit ratings, were valued based on quoted market prices or model driven valuations using significant inputs derived from or corroborated by observable market data. We use a three-tier value hierarchy, which prioritizes the inputs used in measuring fair value as follows:
Level 1 — Observable inputs that reflect quoted prices (unadjusted) for identical assets or liabilities in active markets.
Level 2 — Includes inputs, other than Level 1 inputs, that are directly or indirectly observable in the marketplace.
Level 3 — Unobservable inputs that are supported by little or no market activity.
The composition of our financial assets and liabilities among the three levels of the fair value hierarchy are as follows (in thousands):
|
|
|
December 31, 2017 |
|
|||||||||||||
|
|
|
Level 1 |
|
|
Level 2 |
|
|
Level 3 |
|
|
Total |
|
||||
|
Assets: |
|
|
|
|
|
|
|
|
|
|
|
|
|
|
|
|
|
Cash equivalents: |
|
|
|
|
|
|
|
|
|
|
|
|
|
|
|
|
|
Money market funds |
|
$ |
177,577 |
|
|
$ |
— |
|
|
$ |
— |
|
|
$ |
177,577 |
|
|
Corporate debt securities |
|
|
— |
|
|
|
44,923 |
|
|
|
— |
|
|
|
44,923 |
|
|
Short-term investments: |
|
|
|
|
|
|
|
|
|
|
|
|
|
|
|
|
|
Corporate debt securities |
|
|
— |
|
|
|
308,506 |
|
|
|
— |
|
|
|
308,506 |
|
|
Total financial assets |
|
$ |
177,577 |
|
|
$ |
353,430 |
|
|
$ |
— |
|
|
$ |
531,006 |
|
|
Liabilities: |
|
|
|
|
|
|
|
|
|
|
|
|
|
|
|
|
|
Contingent consideration |
|
$ |
— |
|
|
$ |
— |
|
|
$ |
— |
|
|
$ |
— |
|
|
|
|
December 31, 2016 |
|
|||||||||||||
|
|
|
Level 1 |
|
|
Level 2 |
|
|
Level 3 |
|
|
Total |
|
||||
|
Assets: |
|
|
|
|
|
|
|
|
|
|
|
|
|
|
|
|
|
Cash equivalents: |
|
|
|
|
|
|
|
|
|
|
|
|
|
|
|
|
|
Money market funds |
|
$ |
439,330 |
|
|
$ |
— |
|
|
$ |
— |
|
|
$ |
439,330 |
|
|
U.S. government and government agency debt securities |
|
|
— |
|
|
|
19,987 |
|
|
|
— |
|
|
|
19,987 |
|
|
Corporate debt securities |
|
|
— |
|
|
|
269,768 |
|
|
|
— |
|
|
|
269,768 |
|
|
Total financial assets |
|
$ |
439,330 |
|
|
$ |
289,755 |
|
|
$ |
— |
|
|
$ |
729,085 |
|
|
Liabilities: |
|
|
|
|
|
|
|
|
|
|
|
|
|
|
|
|
|
Contingent consideration |
|
$ |
— |
|
|
$ |
— |
|
|
$ |
901 |
|
|
$ |
901 |
|
We did not have any transfers between valuation levels from December 31, 2016 to December 31, 2017.
The following table presents the activity for the year ended December 31, 2017 related to our Level 3 liabilities (in thousands):
|
Level 3 Liabilities: |
|
Zindagi |
|
|
PuzzleSocial |
|
|
Total |
|
|||
|
Contingent consideration liability – December 31, 2016 |
|
$ |
180 |
|
|
$ |
721 |
|
|
$ |
901 |
|
|
Fair value adjustments |
|
|
(180 |
) |
|
|
(721 |
) |
|
|
(901 |
) |
|
Contingent consideration liability – December 31, 2017 |
|
$ |
— |
|
|
$ |
— |
|
|
$ |
— |
|
66
4. Property and Equipment, Net
Property and equipment, net consist of the following (in thousands):
|
|
|
December 31, |
|
|
December 31, |
|
||
|
|
|
2017 |
|
|
2016 |
|
||
|
Computer equipment |
|
$ |
21,583 |
|
|
$ |
27,046 |
|
|
Software |
|
|
32,509 |
|
|
|
31,102 |
|
|
Land |
|
|
89,130 |
|
|
|
89,130 |
|
|
Building and building improvements |
|
|
199,070 |
|
|
|
197,689 |
|
|
Furniture and fixtures |
|
|
10,376 |
|
|
|
10,494 |
|
|
Leasehold improvements |
|
|
7,965 |
|
|
|
8,071 |
|
|
Total property and equipment, gross |
|
$ |
360,633 |
|
|
$ |
363,532 |
|
|
Less accumulated depreciation |
|
|
(94,044 |
) |
|
|
(94,093 |
) |
|
Total property and equipment, net |
|
$ |
266,589 |
|
|
$ |
269,439 |
|
During the fourth quarter of 2015, we completed the exit of one of our data centers in Santa Clara, and initiated the sale of certain computer data center equipment, resulting in the assets meeting held for sale criteria. Accordingly, these assets were written down to their fair value and reclassified from property and equipment to other current assets, with $83.9 million and $80.7 million being reclassified from computer equipment and accumulated depreciation respectively, for a net amount of $3.2 million. The $3.2 million reflects the fair value of the assets less estimated costs to sell. During the first and second quarters of 2016, $0.4 million and $1.2 million of the assets meeting held for sale criteria were sold, respectively. During the second quarter of 2016, we finalized the sale of these assets and decreased the fair value of the assets less estimated costs to sell to $2.9 million, resulting in a loss of $0.3 million, which was recorded in other income (expense), net in our consolidated statement of operations. During the third quarter of 2016, we collected $1.3 million in cash related to the remaining balance of assets meeting the held for sale criteria.
5. Acquisitions
2017 Acquisitions
Acquisition of Solitaire Mobile Gaming Applications
On February 14, 2017, we purchased Solitaire mobile game applications (“Solitaire”) from Harpan LLC (“Harpan”) and, in connection with the transaction, executed noncompetition agreements with the founders. We acquired these games to expand our card game portfolio. The total consideration paid to Harpan was approximately $42.5 million in cash, of which approximately $35.1 million was allocated to the business combination and the remaining $7.4 million was allocated to the noncompetition agreements with a useful life of two years.
The following table summarizes the purchase date fair value of acquired net intangible assets (excluding the noncompetition agreement) from Harpan (in thousands):
|
|
|
Total |
|
|
|
Developed technology, useful life of 5 years |
|
$ |
20,471 |
|
|
Goodwill |
|
|
14,610 |
|
|
Total |
|
$ |
35,081 |
|
Goodwill, which is deductible for tax purposes, represents the excess of the purchase price over the fair value of the net intangible assets acquired and is primarily attributable to the expected synergies at the time of the acquisition.
Acquisition of Peak Casual Card Game Division
On December 12, 2017, we acquired the casual card game division of Peak Oyun Yazilim Ve Pazarlama Anonim Sirketi (“Peak Games”) to expand our card game portfolio, and in connection with the transaction, executed noncompetition agreements with Peak Games and its founder for a term of three years subsequent to the closing date. The total consideration paid to Peak Games was approximately $99.7 million in cash, of which $98.6 million was allocated to the business combination, $1.0 million was allocated to the noncompetition agreement with a useful life of three years and the remaining $0.1 million was allocated to a transition service agreement with Peak Games for certain data and reporting services over the next twelve months.
67
The following table summarizes the purchase date fair value of the net tangible assets, intangible assets (excluding the noncompetition agreement) and the related goodwill acquired from Peak Games (in thousands):
|
|
|
Total |
|
|
|
Developed technology, useful life of 5 years |
|
$ |
24,000 |
|
|
Trade names, useful life of 7 years |
|
|
2,000 |
|
|
Goodwill |
|
|
72,120 |
|
|
Net tangible assets acquired |
|
|
500 |
|
|
Total assets acquired |
|
$ |
98,620 |
|
Goodwill, which is deductible for tax purposes, represents the excess of the purchase price over the fair value of the net tangible and intangible assets acquired and is primarily attributable to the expected synergies at the time of the acquisition.
Transaction costs incurred by the Company in connection with the Peak and Solitaire acquisitions, including professional fees, were $3.0 million and recorded in our consolidated statement of operations during 2017.
The results of operations for the games acquired from Peak Games and Harpan have been included in our consolidated statement of operations since the dates of acquisition. Pro forma results of operations related to our acquisitions have not been presented as they are not material to our 2017 consolidated statement of operations.
2016 Acquisitions
Acquisition of Zindagi
On January 1, 2016, we acquired the assets of Zindagi, a provider of social games, for purchase consideration of approximately $13.8 million, which consisted of cash paid of $12.5 million (net of prepaid compensation expense of $2.5 million) and contingent consideration with a fair value of $1.3 million as of March 31, 2016. The contingent consideration was originally payable based on the achievement of certain future performance targets during the three year period following the acquisition date, with a maximum of $60.0 million. We record changes in the fair value of contingent consideration liabilities within operating expenses in our consolidated statement of operations during the period in which a change in the estimate of fair value is made. As discussed further at Note 14 – “Commitments and Contingencies” and Note 3 – “Fair Value Measurements”, a settlement was reached during the fourth quarter of 2017 to settle a number of claims from the prior owners of the acquired assets. We acquired Zindagi to accelerate our ability to execute against new opportunities in Slots and other game genres.
The following table summarizes the purchase date fair value of intangible assets acquired from Zindagi (in thousands, unaudited):
|
|
|
Total |
|
|
|
Developed technology, useful life of 3 years |
|
$ |
3,257 |
|
|
Goodwill |
|
|
10,503 |
|
|
Total |
|
$ |
13,760 |
|
Goodwill, which is deductible for tax purposes, represents the excess of the purchase price over the fair value of the intangible assets acquired, and is primarily attributable to the assembled workforce of the acquired business and expected synergies at the time of the acquisition.
Acquisition of PuzzleSocial
On July 1, 2016, we acquired 100% of the equity interests of PuzzleSocial, a provider of mobile crossword puzzle games, for purchase consideration of approximately $20.4 million, which consisted of cash paid of $20.0 million and contingent consideration with a fair value of $0.4 million as of the acquisition date (see Note 3 – “Fair Value Measurements” for changes in this estimate). The contingent consideration may be payable based on the achievement of certain future performance targets during the two and a half year period following the acquisition date, with a maximum of $42.0 million. We record changes in the fair value of contingent consideration liabilities within operating expenses in our consolidated statement of operations during the period in which a change in the estimate of fair value is made. We acquired PuzzleSocial as its crossword puzzle game complements our existing Words With Friends portfolio with a similar audience of word game players.
68
The following table summarizes the purchase date fair value of net tangible and intangible assets acquired from PuzzleSocial (in thousands, unaudited):
|
|
|
Total |
|
|
|
Developed technology, useful life of 4.5 years |
|
$ |
6,923 |
|
|
Customer base, useful life of 1 year |
|
|
3,499 |
|
|
Net tangible assets acquired |
|
|
2,144 |
|
|
Goodwill |
|
|
11,811 |
|
|
Deferred tax liabilities |
|
|
(3,948 |
) |
|
Total |
|
$ |
20,429 |
|
Goodwill, which is not deductible for tax purposes, represents the excess of the purchase price over the fair value of the net tangible and intangible assets acquired, and is primarily attributable to the assembled workforce of the acquired business and expected synergies at the time of the acquisition.Transaction costs incurred by the Company in connection with the Zindagi and PuzzleSocial acquisitions, including professional fees, were $0.5 million, of which $0.2 million was included in our consolidated statement of operations in 2015 related to the Zindagi acquisition and the remaining $0.3 million was included in our consolidated statement of operations in 2016.
The results of operations for the acquisitions of Zindagi and PuzzleSocial have been included in our consolidated statement of operations since the dates of acquisition. Pro forma results of operations related to our acquisitions have not been presented as they is not material to our 2017 consolidated statements.
6. Goodwill and Intangible Assets, Net
The following table presents the changes to goodwill from December 31, 2015 to December 31, 2017 (in thousands):
|
Goodwill – December 31, 2015 (1) |
|
$ |
657,671 |
|
|
Additions |
|
|
23,191 |
|
|
Foreign currency translation and other adjustments (2) |
|
|
(67,527 |
) |
|
Goodwill – December 31, 2016 (1) |
|
$ |
613,335 |
|
|
Additions |
|
|
86,730 |
|
|
Foreign currency translation adjustments |
|
|
30,399 |
|
|
Goodwill – December 31, 2017 (1) |
|
$ |
730,464 |
|
|
(1) |
There are no accumulated impairment losses at the beginning or end of any period presented. |
|
(2) |
The foreign currency translation adjustments are primarily related to translation gains (losses) on goodwill associated with the acquisition of NaturalMotion denominated in British pounds. The other adjustments include the impact of adjustments to goodwill resulting from changes in net assets (liabilities) acquired and other adjustments, pursuant to our business combinations policy. |
The details of our intangible assets as of December 31, 2017 are as follows (in thousands):
|
|
|
December 31, 2017 |
|
|||||||||
|
|
|
Gross Carrying |
|
|
Accumulated |
|
|
Net Book |
|
|||
|
|
|
Value |
|
|
Amortization |
|
|
Value |
|
|||
|
Developed technology |
|
$ |
197,908 |
|
|
$ |
(147,427 |
) |
|
$ |
50,481 |
|
|
Trademarks, branding and domain names |
|
|
18,272 |
|
|
|
(10,152 |
) |
|
|
8,120 |
|
|
Noncompetition agreements |
|
|
8,390 |
|
|
|
(3,079 |
) |
|
|
5,311 |
|
|
Acquired lease intangibles |
|
|
5,708 |
|
|
|
(5,362 |
) |
|
|
346 |
|
|
Total |
|
$ |
230,278 |
|
|
$ |
(166,020 |
) |
|
$ |
64,258 |
|
69
The details of our intangible assets as of December 31, 2016 are as follows (in thousands):
|
|
|
December 31, 2016 |
|
|||||||||
|
|
|
Gross Carrying |
|
|
Accumulated |
|
|
Net Book |
|
|||
|
|
|
Value |
|
|
Amortization |
|
|
Value |
|
|||
|
Developed technology |
|
$ |
150,826 |
|
|
$ |
(132,123 |
) |
|
$ |
18,703 |
|
|
Trademarks, branding and domain names |
|
|
16,290 |
|
|
|
(10,063 |
) |
|
|
6,227 |
|
|
Acquired lease intangibles |
|
|
5,708 |
|
|
|
(5,208 |
) |
|
|
500 |
|
|
Total |
|
$ |
172,824 |
|
|
$ |
(147,394 |
) |
|
$ |
25,430 |
|
Our trademarks, branding and domain names intangible assets include $6.1 million of indefinite-lived intangible assets as of December 31, 2017 and December 31, 2016. The remaining assets were, and continue to be, amortized on a straight-line basis. As of December 31, 2017, the weighted-average remaining useful lives of our acquired intangible assets are 4.3 years for developed technology, 7.0 years for trademarks, branding, and domain names, 2.3 years for acquired lease intangibles, 1.5 years for noncompetition agreements, and 4.1 years in total, for all acquired intangible assets. Amortization expense related to other intangible assets for 2017, 2016 and 2015 were $16.2 million, $29.0 million – exclusive of a $20.7 million impairment charge – and $27.4 million, respectively.
As of December 31, 2017, future amortization expense related to the intangible assets that is expected to be recognized as shown below (in thousands):
|
Year ending December 31: |
|
|
|
|
|
2018 |
|
$ |
17,807 |
|
|
2019 |
|
|
12,965 |
|
|
2020 |
|
|
11,712 |
|
|
2021 |
|
|
9,315 |
|
|
2022 |
|
|
5,768 |
|
|
Thereafter |
|
|
571 |
|
|
Total |
|
$ |
58,138 |
|
7. Income Taxes
On December 22, 2017, the 2017 Tax Act was enacted into law. Beginning January 1, 2018, the 2017 Tax Act reduces the U.S. federal corporate tax rate from 35% to 21%, requires companies to pay a one-time transition tax on earnings of certain foreign subsidiaries that were previously tax deferred, creates new taxes on certain foreign sourced earnings, repeals the Alternative Minimum Tax (“AMT”), and expands the number of individuals whose compensation is subject to a $1.0 million cap on deductibility, amongst other changes. In certain cases, as described below, we have made a reasonable estimate of the effects on our existing deferred tax balances and refundable AMT credit. In other cases, we have not been able to make a reasonable estimate and continue to account for those items based on our existing accounting under ASC 740 Income Taxes and the provisions of the tax laws that were in effect immediately prior to enactment. We will continue to refine our calculations as additional analysis is completed.
For items which we have been able to determine a reasonable estimate, we recognized a provisional tax benefit of $5.0 million during the fourth quarter of 2017 as a result of the 2017 Tax Act’s enactment, which is included as a component of the provision for income tax. The components of the provisional tax benefit recognized include:
Deferred tax assets and liabilities. Certain deferred tax assets and liabilities have been re-measured based on the rates at which they are expected to reverse in the future, which is generally 21%. However, we are still analyzing certain aspects of the 2017 Tax Act and refining our calculations, which could affect the measurement of these balances or give rise to new deferred tax amounts. The related provisional income tax benefit recorded to the consolidated statement of operations for the year ended December 31, 2017, net of valuation allowance, was $2.4 million.
AMT credit. As part of the 2017 Tax Act, corporate AMT was repealed. AMT credits generated by the Company in previous years are refundable in tax years beginning after 2017 and before 2022 with any remaining credits being fully refundable in 2022. The related provisional income tax benefit recorded to the consolidated statement of operations for the year ended December 31, 2017 for the AMT credit refund was $2.6 million. The receivable for the refundable AMT credit was recorded to non-current other assets within the consolidated balance sheet as of December 31, 2017.
70
Officer compensation. For tax years beginning after December 31, 2017, the 2017 Tax Act expanded the number of individuals whose compensation is subject to a $1.0 million cap on deductibility and includes performance-based compensation (such as bonuses) in the calculation. As a result, the Company recorded a provisional amount to reduce the future tax benefit related to officers’ stock-based compensation. However, there was no net impact to the provision for income tax as the provisional amount was offset by an equal reduction in the Company's deferred tax asset valuation allowance.
One-time transitional tax. As part of the 2017 Tax Act, total foreign earnings and profits (“E&P”) after 1986, that were previously deferred from U.S. federal taxation, are subject to a one-time tax on the mandatory deemed repatriation of foreign earnings. The Company’s provisional analysis of the one-time transition tax resulted in no additional taxes being owed due to the overall accumulated E&P deficit.
With respect to global intangible low-taxed income (“GILTI”) provisions of the 2017 Tax Act, the Company is continuing to evaluate how the provisions will be accounted for. The GILTI provisions allow companies to make an accounting policy election to either (i) account for GILTI as a component of tax expense in the period in which the entity is subject to the rules or (ii) account for GILTI in the entity’s measurement of deferred taxes. As of December 31, 2017, the Company has not elected a method due to its continuing analysis of the GILTI provisions. The elected method will depend, in part, on analyzing global income to determine whether the Company expects to have future U.S. inclusions in its taxable income related to GILTI and, if so, the impact that is expected.
Income (loss) before income taxes consists of the following for the periods shown below (in thousands):
|
|
|
Year Ended December 31, |
|
|||||||||
|
|
|
2017 |
|
|
2016 |
|
|
2015 |
|
|||
|
United States |
|
$ |
(6,081 |
) |
|
$ |
(62,037 |
) |
|
$ |
(83,432 |
) |
|
International |
|
|
43,664 |
|
|
|
(42,694 |
) |
|
|
(46,750 |
) |
|
Total |
|
$ |
37,583 |
|
|
$ |
(104,731 |
) |
|
$ |
(130,182 |
) |
The provision for (benefit from) income taxes consists of the following for the periods shown below (in thousands):
|
|
|
Year Ended December 31, |
|
|||||||||
|
|
|
2017 |
|
|
2016 |
|
|
2015 |
|
|||
|
Current: |
|
|
|
|
|
|
|
|
|
|
|
|
|
Federal |
|
$ |
(2,132 |
) |
|
$ |
(30 |
) |
|
$ |
(30 |
) |
|
State |
|
|
142 |
|
|
|
2 |
|
|
|
(2,863 |
) |
|
Foreign |
|
|
13,562 |
|
|
|
7,178 |
|
|
|
3,817 |
|
|
Total current tax expense |
|
$ |
11,572 |
|
|
$ |
7,150 |
|
|
$ |
924 |
|
|
Deferred: |
|
|
|
|
|
|
|
|
|
|
|
|
|
Federal |
|
$ |
(1,231 |
) |
|
$ |
(2,809 |
) |
|
$ |
(8,818 |
) |
|
State |
|
|
300 |
|
|
|
(20 |
) |
|
|
(504 |
) |
|
Foreign |
|
|
303 |
|
|
|
(879 |
) |
|
|
(274 |
) |
|
Total deferred tax expense (benefit) |
|
$ |
(628 |
) |
|
$ |
(3,708 |
) |
|
$ |
(9,596 |
) |
|
Provision for (benefit from) income taxes |
|
$ |
10,944 |
|
|
$ |
3,442 |
|
|
$ |
(8,672 |
) |
71
The reconciliation of federal statutory income tax provision (benefit) to our effective income tax provision is as follows (in thousands):
|
|
|
Year Ended December 31, |
|
|||||||||
|
|
|
2017 |
|
|
2016 |
|
|
2015 |
|
|||
|
Expected provision (benefit) at U.S. federal statutory rate of 35% |
|
$ |
13,154 |
|
|
$ |
(36,656 |
) |
|
$ |
(45,564 |
) |
|
State income taxes - net of federal benefit |
|
|
142 |
|
|
|
2 |
|
|
|
(2,863 |
) |
|
Income taxed at foreign rates |
|
|
(3,643 |
) |
|
|
20,112 |
|
|
|
18,406 |
|
|
Equity-based compensation |
|
|
(2,898 |
) |
|
|
4,295 |
|
|
|
1,125 |
|
|
Tax reserve for uncertain tax positions |
|
|
3,101 |
|
|
|
2,382 |
|
|
|
1,827 |
|
|
Change in valuation allowance |
|
|
(51,976 |
) |
|
|
14,786 |
|
|
|
17,526 |
|
|
Impact of change in enacted tax rates |
|
|
48,296 |
|
|
|
69 |
|
|
|
(18 |
) |
|
Acquisition costs |
|
|
— |
|
|
|
110 |
|
|
|
650 |
|
|
Contingent consideration |
|
|
(252 |
) |
|
|
(2,781 |
) |
|
|
— |
|
|
Officer's compensation limitation |
|
|
2,582 |
|
|
|
— |
|
|
|
— |
|
|
Investment in subsidiaries |
|
|
1,676 |
|
|
|
— |
|
|
|
— |
|
|
Other |
|
|
762 |
|
|
|
1,123 |
|
|
|
239 |
|
|
|
|
$ |
10,944 |
|
|
$ |
3,442 |
|
|
$ |
(8,672 |
) |
Our provisional analysis of the one-time transition tax liability for our foreign subsidiaries enacted by the 2017 Tax Act did not result in additional taxes being owed, considering our accumulated deficit position at December 31, 2017. Additionally, no other income taxes (state or foreign) have been provided for any remaining undistributed foreign earnings not subject to the transition tax, or any additional outside basis difference inherent in these entities, as these amounts continue to be indefinitely reinvested in foreign operations. As of December 31, 2017, the cumulative amount of earnings upon which income taxes have not been provided is approximately $48.8 million.
Deferred tax assets and liabilities are recognized for the future tax consequences of differences between the carrying amounts of assets and liabilities and their respective tax basis using enacted tax rates in effect for the year in which the differences are expected to be reversed. Our deferred tax assets and liabilities are as follows (in thousands):
|
|
|
Year Ended December 31, |
|
|||||
|
|
|
2017 |
|
|
2016 |
|
||
|
Deferred tax assets: |
|
|
|
|
|
|
|
|
|
Net operating loss carryforwards |
|
$ |
66,680 |
|
|
$ |
53,474 |
|
|
Tax credit carryforwards |
|
|
98,718 |
|
|
|
52,564 |
|
|
Acquired intangible assets |
|
|
25,692 |
|
|
|
26,110 |
|
|
Stock-based compensation |
|
|
7,467 |
|
|
|
16,087 |
|
|
Accrued expenses |
|
|
5,505 |
|
|
|
8,605 |
|
|
Other accrued compensation |
|
|
4,747 |
|
|
|
5,059 |
|
|
Charitable contributions |
|
|
2,886 |
|
|
|
4,495 |
|
|
State taxes |
|
|
248 |
|
|
|
3,168 |
|
|
Deferred revenue |
|
|
312 |
|
|
|
481 |
|
|
Other |
|
|
423 |
|
|
|
— |
|
|
Total deferred tax assets |
|
$ |
212,678 |
|
|
$ |
170,043 |
|
|
Less: Valuation allowance |
|
|
(209,652 |
) |
|
|
(164,907 |
) |
|
Deferred tax assets, net of valuation allowance |
|
$ |
3,026 |
|
|
$ |
5,136 |
|
|
|
|
|
|
|
|
|
|
|
|
Deferred tax liabilities: |
|
|
|
|
|
|
|
|
|
Goodwill |
|
$ |
(3,210 |
) |
|
$ |
(3,396 |
) |
|
Deferred rent |
|
|
(1,073 |
) |
|
|
(69 |
) |
|
Depreciation |
|
|
(3,839 |
) |
|
|
(7,215 |
) |
|
Other |
|
|
— |
|
|
|
(247 |
) |
|
Total deferred tax liabilities |
|
$ |
(8,122 |
) |
|
$ |
(10,927 |
) |
|
Net deferred taxes |
|
$ |
(5,096 |
) |
|
$ |
(5,791 |
) |
72
As a result of the adoption of ASU 2016-09 in the first quarter of 2017, the Company recognized the previously unrecognized excess tax benefits from stock-based compensation which increased the net operating loss and tax credit carryforward deferred tax assets and equally offsetting valuation allowance by $97.3 million. Additionally, as a result of the 2017 Tax Act, the Company’s deferred tax assets and liabilities have been re-measured with the enacted tax rate of 21% as of December 31, 2017, while the deferred tax assets and liabilities as of December 31, 2016 were measured with the then enacted tax rate of 35%.
Due to our history of net operating losses, we believe it is more likely than not that certain federal, state, and foreign deferred tax assets will not be realized in future periods as of December 31, 2017.
Net operating loss and tax credit carryforwards as of December 31, 2017 are as follows (in thousands):
|
|
|
Amount |
|
|
Expiration years |
|
|
Net operating losses, federal |
|
$ |
409,273 |
|
|
2029 – 2036 |
|
Net operating losses, state |
|
|
299,631 |
|
|
2021 – 2036 |
|
Tax credits, federal |
|
|
89,218 |
|
|
2030 – 2037 |
|
Tax credits, state |
|
|
82,617 |
|
|
2019 – indefinite |
The federal and state net operating loss carryforwards are subject to various annual limitations under Section 382 of the Internal Revenue Code and similar state provisions.
The following table reflects changes in the gross unrecognized tax benefits (in thousands):
|
December 31, 2014 |
|
$ |
140,889 |
|
|
Additions based on tax positions related to 2015 |
|
|
8,876 |
|
|
Additions for tax positions of prior years |
|
|
82 |
|
|
Reductions for tax positions of prior years |
|
|
(2,817 |
) |
|
Decreases related to settlements of prior year tax positions |
|
|
(4,185 |
) |
|
December 31, 2015 |
|
$ |
142,845 |
|
|
Additions based on tax positions related to 2016 |
|
|
9,043 |
|
|
Additions for tax positions of prior years |
|
|
68 |
|
|
Reductions for tax positions of prior years |
|
|
(856 |
) |
|
December 31, 2016 |
|
$ |
151,100 |
|
|
Additions based on tax positions related to 2017 |
|
|
8,598 |
|
|
Additions for tax positions of prior years |
|
|
427 |
|
|
Decreases related to expiration of prior year tax positions |
|
|
(31 |
) |
|
Decreases related to settlements of prior year tax positions |
|
|
(54 |
) |
|
December 31, 2017 |
|
$ |
160,040 |
|
We classify uncertain tax positions as non-current unrecognized tax liabilities unless expected to be paid within one year or otherwise directly related to an existing deferred tax asset, in which case the uncertain tax position is recorded as an offset to the asset on the consolidated balance sheet. As of December 31, 2017, $151.0 million of our gross unrecognized tax benefits were recorded as a reduction of the related deferred tax assets and the remaining $9.0 million of our gross unrecognized tax benefits were recorded as non-current liabilities in our consolidated balance sheets.
If the balance of gross unrecognized tax benefits of $160.0 million as of December 31, 2017 was realized, this would have resulted in a tax benefit of $9.0 million within our provision for income taxes at such time. If the balance of gross unrecognized tax benefits of $151.1 million as of December 31, 2016 was realized, this would have resulted in a tax benefit of $10.3 million within our provision of income taxes at such time.
During all years presented, we recognized interest and penalties related to unrecognized tax benefits within the provision for income taxes on the consolidated statements of operations. The amount of interest and penalties recorded to the consolidated statements of operations during 2017 and 2016, were $0.3 million and $0.1 million, respectively, and the amount of interest and penalties accrued as of December 31, 2017 and 2016 was $1.0 million and $0.7 million, respectively. There were no interest and penalties recorded to the consolidated statements of operations during 2015.
73
We file income tax returns in the U.S. federal jurisdiction as well as many U.S. states and certain foreign jurisdictions. The material jurisdictions in which we are subject to potential examination include the U.S., United Kingdom and Ireland. We are subject to examination in these jurisdictions for all years since our inception in 2007. Fiscal years outside the normal statute of limitation remain open to audit by tax authorities due to tax attributes generated in those early years which have been carried forward and may be audited in subsequent years when utilized. We do not expect any material changes to our unrecognized tax benefits within the next twelve months.
8. Other Current and Non-Current Liabilities
Other current liabilities consist of the following (in thousands):
|
|
|
December 31, |
|
|
December 31, |
|
||
|
|
|
2017 |
|
|
2016 |
|
||
|
Accrued accounts payable |
|
$ |
38,046 |
|
|
$ |
24,119 |
|
|
Accrued compensation liability |
|
|
33,815 |
|
|
|
22,554 |
|
|
Accrued restructuring liability |
|
|
3,674 |
|
|
|
4,987 |
|
|
Accrued payable from acquisitions |
|
|
12,800 |
|
|
|
5,990 |
|
|
Accrued lease incentive obligation |
|
|
20,059 |
|
|
|
— |
|
|
Other current liabilities |
|
|
14,695 |
|
|
|
18,104 |
|
|
Total other current liabilities |
|
$ |
123,089 |
|
|
$ |
75,754 |
|
Accrued compensation liability represents employee bonus and other payroll withholding expenses. Other current liabilities include various expenses that we accrue for transaction taxes, customer deposits and accrued vendor expenses.
Other non-current liabilities consist of the following (in thousands):
|
|
|
December 31, |
|
|
December 31, |
|
||
|
|
|
2017 |
|
|
2016 |
|
||
|
Accrued payable from acquisitions |
|
$ |
20,000 |
|
|
$ |
3,951 |
|
|
Accrued restructuring liability |
|
|
10,856 |
|
|
|
14,485 |
|
|
Unrecognized tax liability |
|
|
8,975 |
|
|
|
52,779 |
|
|
Other non-current liabilities |
|
|
9,081 |
|
|
|
4,381 |
|
|
Total other non-current liabilities |
|
$ |
48,912 |
|
|
$ |
75,596 |
|
9. Restructuring
We recorded the following net restructuring charges within our consolidated statements of operations for the years presented (in thousands):
|
|
|
Year Ended December 31, |
|
|||||||||
|
|
|
2017 |
|
|
2016 |
|
|
2015 |
|
|||
|
Cost of revenue |
|
$ |
— |
|
|
$ |
— |
|
|
$ |
1,066 |
|
|
Research and development |
|
|
2,347 |
|
|
|
124 |
|
|
|
14,081 |
|
|
Sales and marketing |
|
|
149 |
|
|
|
— |
|
|
|
787 |
|
|
General and administrative |
|
|
688 |
|
|
|
1,814 |
|
|
|
20,547 |
|
|
Total restructuring charges |
|
$ |
3,184 |
|
|
$ |
1,938 |
|
|
$ |
36,481 |
|
74
Significant restructuring activities related to the Company’s employees and other charges, summarized by plan, are presented in the table below (in thousands):
|
|
|
Q4 2017 |
|
|
Q3 2017 |
|
|
Q2 2017 |
|
|
Q2 2015 |
|
|
|
|
|
||||
|
|
|
Restructuring Plan |
|
|
Restructuring Plan |
|
|
Restructuring Plan |
|
|
Restructuring Plan |
|
|
Total |
|
|||||
|
Restructuring liability – December 31, 2015 |
|
$ |
— |
|
|
$ |
— |
|
|
$ |
— |
|
|
$ |
26,406 |
|
|
$ |
26,406 |
|
|
Restructuring expense and adjustments |
|
|
— |
|
|
|
— |
|
|
|
— |
|
|
|
926 |
|
|
|
926 |
|
|
Cash payments |
|
|
— |
|
|
|
— |
|
|
|
— |
|
|
|
(7,944 |
) |
|
|
(7,944 |
) |
|
Restructuring liability – December 31, 2016 |
|
|
— |
|
|
|
— |
|
|
|
— |
|
|
|
19,388 |
|
|
|
19,388 |
|
|
Restructuring expense and adjustments |
|
|
1,466 |
|
|
|
918 |
|
|
|
1,242 |
|
|
|
(451 |
) |
|
|
3,175 |
|
|
Cash payments |
|
|
(1,095 |
) |
|
|
(911 |
) |
|
|
(1,242 |
) |
|
|
(4,785 |
) |
|
|
(8,033 |
) |
|
Restructuring liability – December 31, 2017 |
|
$ |
371 |
|
|
$ |
7 |
|
|
$ |
— |
|
|
$ |
14,152 |
|
|
$ |
14,530 |
|
|
|
|
|
|
|
|
|
|
|
|
|
|
|
|
|
|
|
|
|
|
|
|
Cumulative costs to date, as of December 31, 2017 |
|
$ |
1,466 |
|
|
$ |
918 |
|
|
$ |
1,242 |
|
|
$ |
34,324 |
|
|
$ |
37,950 |
|
|
Total costs expected to be incurred, as of December 31, 2017 |
|
$ |
2,610 |
|
|
$ |
920 |
|
|
$ |
1,252 |
|
|
$ |
34,324 |
|
|
$ |
39,106 |
|
Q4 2017 Restructuring Plan
During the fourth quarter of 2017, we implemented a restructuring plan, which included a reduction in work force to reduce the Company’s long-term cost structure. As a result of ongoing initiatives associated with this restructuring plan, we recorded $1.5 million of expense in the year ended December 31, 2017, which is included in operating expenses in our consolidated statement of operations. The $1.5 million restructuring charge is primarily comprised of employee severance costs. The remaining costs are expected to be paid out within the next 1.9 years.
Q3 2017 Restructuring Plan
During the third quarter of 2017, we implemented a restructuring plan, which included a reduction in work force to reduce the Company’s long-term cost structure. As a result of ongoing initiatives associated with this restructuring plan, we recorded $0.9 million of expense in the year ended December 31, 2017, which is included in operating expenses in our consolidated statement of operations. The $0.9 million restructuring charge is comprised of $0.6 million of employee severance costs and $0.3 million of other costs. The remaining costs are expected to be paid out over the next quarter.
Q2 2017 Restructuring Plan
During the second quarter of 2017, we implemented a restructuring plan, which included a reduction in work force to reduce the Company’s long-term cost structure. As a result of ongoing initiatives associated with this restructuring plan, we recorded expense of $1.2 million in the year ended December 31, 2017, which is included in operating expenses in our consolidated statement of operations. The $1.2 million restructuring charge is comprised of $1.1 million of employee severance costs and $0.1 million of other costs. There remaining costs are expected to be paid out over the next quarter.
Q2 2015 Restructuring Plan
During the second quarter of 2015, we implemented a restructuring plan, which included a reduction in work force to reduce the Company’s long-term cost structure. As a result of ongoing initiatives associated with this restructuring plan, we recorded a net benefit of $0.4 million in the year ended December 31, 2017, which is included in operating expenses in our consolidated statement of operations. The $0.4 million restructuring benefit is comprised of other costs. For the year ended December 31, 2016, we recorded expense of $0.9 million in our consolidated statement of operations, which is comprised of $0.7 million of lease termination costs, $0.1 million of employee severance costs and $0.1 million of other costs. For the year ended December 31, 2015, we recorded expense of $33.8 million in our consolidated statements of operations, which is comprised of $10.7 million of employee severance costs and $23.1 million related to lease termination costs. The remaining costs are expected to be paid within the next 4.4 years.
75
10. Stockholders’ Equity
Common Stock
Our three classes of common stock are Class A, Class B and Class C common stock. The following are the rights and privileges of our classes of common stock:
Dividends. The holders of outstanding shares of our Class A, Class B and Class C common stock are entitled to receive dividends out of funds legally available at the times and in the amounts which our Board of Directors may determine.
Voting Rights. Holders of our Class A common stock are entitled to one vote per share, holders of our Class B common stock are entitled to seven votes per share and holders of our Class C common stock are entitled to 70 votes per share. In general, holders of our Class A, Class B and Class C common stock will vote together as a single class on all matters submitted to a vote of stockholders, unless otherwise required by law. Delaware law could require either our Class A, Class B, or our Class C common stock to vote separately as a single class in the following circumstances:
|
|
• |
If we were to seek to amend our Certificate of Incorporation to increase the authorized number of shares of a class of stock, or to increase or decrease the par value of a class of stock; and |
|
|
• |
If we were to seek to amend our Certificate of Incorporation in a manner that altered or changed the powers, preferences or special rights of a class of stock in a manner that affected its holders adversely. |
Liquidation. Upon our liquidation, dissolution or winding-up, the assets legally available for distribution to our stockholders would be distributable ratably among the holders of our Class A, Class B and Class C common stock.
Preemptive or Similar Rights. None of our Class A, Class B, or Class C common stock is entitled to preemptive rights or subject to redemption.
Conversion. Our Class A common stock is not convertible into any other shares of our capital stock. Each share of our Class B and Class C common stock is convertible at any time, at the option of the holder, into one share of our Class A common stock. In addition, after the closing of our initial public offering, upon sale or transfer of shares of either Class B or Class C common stock, whether or not for value, each such transferred or sold share shall automatically convert into one share of Class A common stock, except for certain transfers described in our amended and restated certificate of incorporation. Our Class B and Class C common stock will convert automatically into Class A common stock on the date on which the number of outstanding shares of Class B and Class C common stock together represent less than 10% of the aggregate combined voting power of our capital stock. Once transferred and converted into Class A common stock, the Class B and Class C common stock may not be reissued.
Stock Repurchases
In November 2016, we authorized the 2016 Share Repurchase Program. In 2016, we repurchased 12.3 million shares of our Class A common stock under the repurchase program at a weighted average price of $2.76 per share for a total of $34.2 million. In 2017, we repurchased 36.3 million shares for our Class A common stock under the repurchase program at a weighted average price of $2.78 per share for a total of $101.0 million.
In October 2015, we authorized the 2015 Share Repurchase Program. In 2015, we repurchased 37.9 million shares of our Class A common stock under the repurchase program at a weighted average price of $2.60 per share for a total of $98.9 million. In 2016, we repurchased 42.2 million shares of our Class A common stock at a weighted average price of $2.40 for a total of $101.9 million, completing the 2015 repurchase plan put in place in 2015.
All of our stock repurchases under the both programs were made through open market purchases under Rule 10b5-1 plans.
Equity Incentive Plans and Stock-Based Compensation Expense
In 2007, we adopted the 2007 Equity Incentive Plan (the “2007 Plan”) for the purpose of granting stock options and ZSUs to employees, directors and non-employees. Concurrent with the effectiveness of our initial public offering on December 15, 2011, we adopted the 2011 Equity Incentive Plan (the “2011 Plan”), and all remaining common shares reserved for future grant or issuance under the 2007 Plan were added to the 2011 Plan. The 2011 Plan was adopted for purposes of granting stock options and ZSUs to employees, directors and non-employees. The number of shares of our Class A common stock reserved for future issuance under our 2011 Plan will automatically increase on January 1 of each year, beginning on January 1, 2012, and continuing through and including January 1, 2021, by 4% of the total number of shares of our capital stock outstanding as of December 31 of the preceding calendar year.
76
We recorded stock-based compensation expense related to grants of employee stock options, ZSUs and performance-based awards in our consolidated statements of operations as follows (in thousands):
|
|
|
Year Ended December 31, |
|
|||||||||
|
|
|
2017 |
|
|
2016 |
|
|
2015 |
|
|||
|
Cost of revenue |
|
$ |
1,838 |
|
|
$ |
3,720 |
|
|
$ |
4,547 |
|
|
Research and development |
|
|
42,176 |
|
|
|
84,236 |
|
|
|
94,548 |
|
|
Sales and marketing |
|
|
7,281 |
|
|
|
7,254 |
|
|
|
7,501 |
|
|
General and administrative |
|
|
13,220 |
|
|
|
12,251 |
|
|
|
24,979 |
|
|
Total stock-based compensation expense |
|
$ |
64,515 |
|
|
$ |
107,461 |
|
|
$ |
131,575 |
|
Stock Option Activity
All stock options granted under the 2011 Plan generally vest over four to five years, with 25% to 20% vesting after one year with the remainder vesting monthly thereafter over 36 to 48 months, respectively. The stock options have a contract term of 10 years and the related expense is determined using the Black-Scholes option pricing model on the date of grant.
The following table presents the weighted-average grant date fair value of stock options and related assumptions used to estimate the fair value in our consolidated financial statements:
|
|
|
Year Ended December 31, |
|
|||||||||
|
|
|
2017 |
|
|
2016 |
|
|
2015 |
|
|||
|
Expected term, in years |
|
|
6 |
|
|
|
6 |
|
|
|
6 |
|
|
Risk-free interest rates |
|
|
2.12 |
% |
|
|
1.53 |
% |
|
|
1.65 |
% |
|
Expected volatility |
|
|
46 |
% |
|
|
50 |
% |
|
|
53 |
% |
|
Dividend yield |
|
|
— |
|
|
|
— |
|
|
|
— |
|
|
Weighted-average estimated fair value of stock options granted during the year |
|
$ |
1.75 |
|
|
$ |
1.30 |
|
|
$ |
1.51 |
|
The following table shows stock option activity for 2017 (in thousands, except weighted-average exercise price and remaining contractual term):
|
|
|
Outstanding Options |
|
|||||||||||||
|
|
|
Stock Options |
|
|
Weighted- Average Exercise Price |
|
|
Aggregate Intrinsic Value of Stock Options Outstanding |
|
|
Weighted- Average Contractual Term (in years) |
|
||||
|
Balance as of December 31, 2016 |
|
|
36,858 |
|
|
$ |
2.08 |
|
|
$ |
26,411 |
|
|
|
6.81 |
|
|
Granted |
|
|
1,681 |
|
|
|
3.76 |
|
|
|
|
|
|
|
|
|
|
Forfeited, expired and cancelled |
|
|
(3,084 |
) |
|
|
3.63 |
|
|
|
|
|
|
|
|
|
|
Exercised |
|
|
(2,491 |
) |
|
|
1.33 |
|
|
|
|
|
|
|
|
|
|
Balance as of December 31, 2017 |
|
|
32,964 |
|
|
$ |
2.07 |
|
|
$ |
64,114 |
|
|
|
6.32 |
|
|
As of December 31, 2017 |
|
|
|
|
|
|
|
|
|
|
|
|
|
|
|
|
|
Exercisable options |
|
|
16,880 |
|
|
$ |
1.43 |
|
|
$ |
43,878 |
|
|
|
4.11 |
|
|
Vested and expected to vest |
|
|
32,964 |
|
|
$ |
2.07 |
|
|
$ |
64,114 |
|
|
|
6.32 |
|
The aggregate intrinsic value of stock options exercised during 2017, 2016 and 2015 was $4.9 million, $8.1 million and $9.1 million, respectively. The total grant date fair value of options that vested during 2017, 2016 and 2015 was $8.0 million, $6.0 million and $10.2 million, respectively.
As of December 31, 2017, total unrecognized stock-based compensation expense of $20.8 million related to unvested stock options is expected to be recognized over a weighted-average recognition period of approximately 3.5 years.
ZSU Activity
ZSUs are granted to eligible employees under the 2011 Plan. In general, ZSU awards vest in annual or quarterly installments over a period of four years, are subject to the employee’s continuing service to us and do not have an expiration date. The cost of ZSUs is determined using the fair value of our common stock on the date of grant.
77
The following table shows a summary of ZSU activity for 2017 (in thousands, except weighted-average fair value):
|
|
|
Outstanding ZSUs |
|
|||||||||
|
|
|
|
|
|
|
Weighted- |
|
|
|
|
|
|
|
|
|
|
|
|
|
Average Grant Date |
|
|
Aggregate |
|
||
|
|
|
|
|
|
|
Fair Value |
|
|
Intrinsic Value of |
|
||
|
|
|
Shares |
|
|
(per share) |
|
|
Unvested ZSUs |
|
|||
|
Unvested as of December 31, 2016 |
|
|
59,452 |
|
|
$ |
2.66 |
|
|
$ |
152,792 |
|
|
Granted |
|
|
22,210 |
|
|
|
3.52 |
|
|
|
|
|
|
Vested |
|
|
(20,774 |
) |
|
|
2.83 |
|
|
|
|
|
|
Forfeited |
|
|
(15,410 |
) |
|
|
2.67 |
|
|
|
|
|
|
Unvested as of December 31, 2017 |
|
|
45,478 |
|
|
$ |
3.00 |
|
|
$ |
181,912 |
|
As of December 31, 2017, total unamortized stock-based compensation expense relating to ZSUs amounted to $117.2 million over a weighted-average recognition period of approximately 2.4 years.
Performance-Based Awards
Certain executives were eligible to receive performance-based ZSUs, which are subject to performance and time-based vesting requirements. The target number of shares of the performance-based awards are adjusted based on our business performance measured against the performance goals approved by the Compensation Committee at the beginning of the performance period. Generally, if the performance criteria are satisfied, one-half of the award vests immediately and the other half vests on the one-year anniversary. Stock-based compensation expense for performance-based ZSUs granted in connection with our executive compensation plan is recorded based on the probability of achievement of certain performance milestones. In 2017, 2016 and 2015, no expense was recorded in connection with shares granted under our executive compensation plan.
Certain employees are eligible to receive performance-based ZSUs, which are subject to performance and time-based vesting requirements. The target number of shares of the performance-based awards are adjusted based on our business performance measured against the performance goals approved by the Compensation Committee at the date of employment with the Company. Generally, if the performance criteria are satisfied, 25% of the award will vest immediately or soon after with the remaining vesting ratably for each quarter or six month periods thereafter. Stock-based compensation expense for performance-based ZSUs granted to these employees is recorded based on the probability of achievement of the performance milestones. In 2017, we recorded $2.4 million of stock-based compensation expense related to these performance-based ZSUs. Additionally, during 2017, one performance-based ZSU award was modified to eliminate the performance vesting requirements, thus only requiring time-based vesting. At the time of modification, there was no incremental compensation costs recorded.
2011 Employee Stock Purchase Plan
Our 2011 Employee Stock Purchase Plan (“2011 ESPP”), was approved by our Board of Directors in September 2011 and by our stockholders in November 2011 and amended in August 2012. The number of shares of our Class A common stock reserved for future issuance under our 2011 ESPP will automatically increase on January 1 of each year, beginning on January 1, 2012, and continuing through and including January 1, 2021, by the lesser of 2% of the total number of shares of our capital stock outstanding as of December 31 of the preceding calendar year or 25,000,000 shares.
Our 2011 ESPP permits participants to purchase shares of our Class A common stock through payroll deductions up to 15% of their earnings, subject to a maximum of 5,000 shares available for purchase on any purchase date. Unless otherwise determined by the administrator, the purchase price of the shares will be 85% of the lower of the fair market value of our Class A common stock on the first day of an offering or on the date of purchase. The ESPP offers two purchase dates within each annual period, resulting in a six-month and twelve-month look-back. Further, the ESPP contains an automatic reset feature after the first six months of each annual period, such that if the fair market value of our Class A common stock has decreased from the original offering date, the offering will automatically terminate and all participants will be re-enrolled in the new, lower-priced offering for the remaining six months. Participants may end their participation at any time during an offering and will be refunded their accrued contributions that have not yet been used to purchase shares. Participation ends automatically upon termination of employment.
As of December 31, 2017, there were $2.6 million of employee contributions withheld by the Company. During 2017, the Company recognized $2.3 million of stock-based compensation expense related to the 2011 ESPP.
78
Employee Savings Plan
We have a defined contribution plan, which is qualified under Section 401(k) of the Internal Revenue Code. Participating employees may contribute up to 90% of their eligible compensation, or the statutory limit, whichever is lower. In 2017, 2016 and 2015, we contributed one dollar for each dollar a participant contributed, with a maximum contribution of 3% of each employee’s eligible compensation, subject to a maximum total contribution mandated by the IRS. The total expense for these savings plans was $4.5 million, $4.5 million and $4.8 million in 2017, 2016 and 2015, respectively.
Common Stock Reserved for Future Issuance
As of December 31, 2017, we had reserved shares of common stock for future issuance as follows (in thousands):
|
|
|
December 31, 2017 |
|
|
|
Stock options outstanding |
|
|
32,964 |
|
|
ZSUs outstanding |
|
|
45,478 |
|
|
2011 Equity Incentive Plan |
|
|
126,918 |
|
|
2011 Employee Stock Purchase Plan |
|
|
92,875 |
|
|
Total |
|
|
298,235 |
|
11. Accumulated Other Comprehensive Income (Loss)
The following table shows a summary of changes in accumulated other comprehensive income (loss) by component from December 31, 2015 to December 31, 2017 (in thousands):
|
|
|
Foreign Currency Translation |
|
|
Unrealized Gains (Losses) on Available- for-Sale Marketable Securities |
|
|
Total |
|
|||
|
Balance as of December 31, 2015 |
|
$ |
(52,261 |
) |
|
$ |
(127 |
) |
|
$ |
(52,388 |
) |
|
Other comprehensive income (loss) before reclassifications |
|
|
(76,410 |
) |
|
|
104 |
|
|
|
(76,306 |
) |
|
Amounts reclassified from accumulated other comprehensive income (loss) |
|
|
— |
|
|
|
— |
|
|
|
— |
|
|
Net other comprehensive income (loss) |
|
|
(76,410 |
) |
|
|
104 |
|
|
|
(76,306 |
) |
|
Balance as of December 31, 2016 |
|
$ |
(128,671 |
) |
|
$ |
(23 |
) |
|
$ |
(128,694 |
) |
|
Other comprehensive income (loss) before reclassifications |
|
|
35,352 |
|
|
|
(155 |
) |
|
|
35,197 |
|
|
Amounts reclassified from accumulated other comprehensive income (loss) |
|
|
— |
|
|
|
— |
|
|
|
— |
|
|
Net other comprehensive income (loss) |
|
|
35,352 |
|
|
|
(155 |
) |
|
|
35,197 |
|
|
Balance as of December 31, 2017 |
|
$ |
(93,319 |
) |
|
$ |
(178 |
) |
|
$ |
(93,497 |
) |
12. Net Income (Loss) Per Share of Common Stock
We compute net income (loss) per share of common stock using the two-class method required for participating securities. Prior to the date of the initial public offering, we considered all series of our convertible preferred stock to be participating securities due to their non-cumulative dividend rights. Additionally, we consider shares issued upon the early exercise of options subject to repurchase and unvested restricted shares to be participating securities, because holders of such shares have non-forfeitable dividend rights in the event we declare a dividend for common shares. In accordance with the two-class method, net income allocated to these participating securities, which include participation rights in undistributed net income, is subtracted from net income (loss) to determine total net income (loss) to be allocated to common stockholders.
79
Basic net income (loss) per share is computed by dividing net income (loss) attributable to common stockholders by the weighted-average number of common shares outstanding during the period. Diluted net income (loss) per share is computed by dividing net income (loss) attributable to common stockholders by the weighted-average number of common shares outstanding, including potential dilutive securities. In computing diluted net income (loss) per share, net income (loss) attributable to common shareholders is re-allocated to reflect the potential impact of dilutive securities, including stock options, unvested ZSUs, unvested performance-based ZSUs and ESPP withholdings. For periods in which we have generated a net loss or there is no income attributable to common stockholders, we do not include dilutive securities in our calculation of diluted net income (loss) per share, as the impact of these awards is anti-dilutive.
The following table sets forth the computation of basic and diluted net income (loss) per share of common stock (in thousands, except per share data):
|
|
|
Year Ended December 31, |
|
|||||||||||||||||||||||||||||||||
|
|
|
2017 |
|
|
2016 |
|
|
2015 |
|
|||||||||||||||||||||||||||
|
|
|
Class |
|
|
Class |
|
|
Class |
|
|
Class |
|
|
Class |
|
|
Class |
|
|
Class |
|
|
Class |
|
|
Class |
|
|||||||||
|
|
|
A |
|
|
B |
|
|
C |
|
|
A |
|
|
B |
|
|
C |
|
|
A |
|
|
B |
|
|
C |
|
|||||||||
|
BASIC: |
|
|
|
|
|
|
|
|
|
|
|
|
|
|
|
|
|
|
|
|
|
|
|
|
|
|
|
|
|
|
|
|
|
|
|
|
|
Net income (loss) attributable to common stockholders – basic |
|
$ |
23,795 |
|
|
$ |
2,204 |
|
|
$ |
629 |
|
|
$ |
(92,988 |
) |
|
$ |
(12,660 |
) |
|
$ |
(2,525 |
) |
|
$ |
(103,628 |
) |
|
$ |
(15,153 |
) |
|
$ |
(2,729 |
) |
|
Weighted-average common shares outstanding – basic |
|
|
776,625 |
|
|
|
71,925 |
|
|
|
20,517 |
|
|
|
755,460 |
|
|
|
102,850 |
|
|
|
20,517 |
|
|
|
779,071 |
|
|
|
113,923 |
|
|
|
20,517 |
|
|
Net income (loss) per share attributable to common stockholders – basic |
|
$ |
0.03 |
|
|
$ |
0.03 |
|
|
$ |
0.03 |
|
|
$ |
(0.12 |
) |
|
$ |
(0.12 |
) |
|
$ |
(0.12 |
) |
|
$ |
(0.13 |
) |
|
$ |
(0.13 |
) |
|
$ |
(0.13 |
) |
|
DILUTED: |
|
|
|
|
|
|
|
|
|
|
|
|
|
|
|
|
|
|
|
|
|
|
|
|
|
|
|
|
|
|
|
|
|
|
|
|
|
Net income (loss) attributable to common stockholders – basic |
|
$ |
23,795 |
|
|
$ |
2,204 |
|
|
$ |
629 |
|
|
$ |
(92,988 |
) |
|
$ |
(12,660 |
) |
|
$ |
(2,525 |
) |
|
$ |
(103,628 |
) |
|
$ |
(15,153 |
) |
|
$ |
(2,729 |
) |
|
Reallocation of net income (loss) as a result of conversion of Class C shares to Class A shares |
|
|
629 |
|
|
|
— |
|
|
|
— |
|
|
|
(2,525 |
) |
|
|
— |
|
|
|
— |
|
|
|
(2,729 |
) |
|
|
— |
|
|
|
— |
|
|
Reallocation of net income (loss) as a result of conversion of Class B shares to Class A shares |
|
|
2,204 |
|
|
|
— |
|
|
|
— |
|
|
|
(12,660 |
) |
|
|
— |
|
|
|
— |
|
|
|
(15,153 |
) |
|
|
— |
|
|
|
— |
|
|
Reallocation of net income (loss) to Class B and Class C shares |
|
|
— |
|
|
|
180 |
|
|
|
(20 |
) |
|
|
— |
|
|
|
— |
|
|
|
— |
|
|
|
— |
|
|
|
— |
|
|
|
— |
|
|
Net income (loss) attributable to common stockholders – diluted |
|
$ |
26,628 |
|
|
$ |
2,384 |
|
|
$ |
609 |
|
|
$ |
(108,173 |
) |
|
$ |
(12,660 |
) |
|
$ |
(2,525 |
) |
|
$ |
(121,510 |
) |
|
$ |
(15,153 |
) |
|
$ |
(2,729 |
) |
|
Weighted-average common shares outstanding – basic |
|
|
776,625 |
|
|
|
71,925 |
|
|
|
20,517 |
|
|
|
755,460 |
|
|
|
102,850 |
|
|
|
20,517 |
|
|
|
779,071 |
|
|
|
113,923 |
|
|
|
20,517 |
|
|
Conversion of Class C to Class A common shares outstanding |
|
|
20,517 |
|
|
|
— |
|
|
|
— |
|
|
|
20,517 |
|
|
|
— |
|
|
|
— |
|
|
|
20,517 |
|
|
|
— |
|
|
|
— |
|
|
Conversion of Class B to Class A common shares outstanding |
|
|
71,925 |
|
|
|
— |
|
|
|
— |
|
|
|
102,850 |
|
|
|
— |
|
|
|
— |
|
|
|
113,923 |
|
|
|
— |
|
|
|
— |
|
|
Weighted-average effect of dilutive securities: |
|
|
|
|
|
|
|
|
|
|
|
|
|
|
|
|
|
|
|
|
|
|
|
|
|
|
|
|
|
|
|
|
|
|
|
|
|
Stock options and employee stock purchase plan |
|
|
9,879 |
|
|
|
8,390 |
|
|
|
— |
|
|
|
— |
|
|
|
— |
|
|
|
— |
|
|
|
— |
|
|
|
— |
|
|
|
— |
|
|
ZSUs |
|
|
16,935 |
|
|
|
— |
|
|
|
— |
|
|
|
— |
|
|
|
— |
|
|
|
— |
|
|
|
— |
|
|
|
— |
|
|
|
— |
|
|
Performance-based ZSUs |
|
|
1,284 |
|
|
|
— |
|
|
|
— |
|
|
|
— |
|
|
|
— |
|
|
|
— |
|
|
|
— |
|
|
|
— |
|
|
|
— |
|
|
Weighted-average common shares outstanding – diluted |
|
|
897,165 |
|
|
|
80,315 |
|
|
|
20,517 |
|
|
|
878,827 |
|
|
|
102,850 |
|
|
|
20,517 |
|
|
|
913,511 |
|
|
|
113,923 |
|
|
|
20,517 |
|
|
Net income (loss) per share attributable to common stockholders – diluted |
$ |
0.03 |
|
|
$ |
0.03 |
|
|
$ |
0.03 |
|
|
$ |
(0.12 |
) |
|
$ |
(0.12 |
) |
|
$ |
(0.12 |
) |
|
$ |
(0.13 |
) |
|
$ |
(0.13 |
) |
|
$ |
(0.13 |
) |
|
The following weighted-average employee equity awards were excluded from the calculation of diluted net income (loss) per share because their effect would have been anti-dilutive for the periods presented (in thousands):
|
|
|
Year Ended December 31, |
|
|||||||||
|
|
|
2017 |
|
|
2016 |
|
|
2015 |
|
|||
|
Stock options and employee stock purchase plan |
|
|
17,331 |
|
|
|
28,380 |
|
|
|
29,412 |
|
|
Restricted shares |
|
|
349 |
|
|
|
3,899 |
|
|
|
8,716 |
|
|
ZSUs |
|
|
5,087 |
|
|
|
61,183 |
|
|
|
63,764 |
|
|
Total |
|
|
22,767 |
|
|
|
93,462 |
|
|
|
101,892 |
|
80
13. Leases
Rental Income
During the second quarter of 2017, the Company entered into an industrial gross lease agreement to provide approximately 287,000 square feet of its office space in San Francisco, California to a tenant for total minimum rental payments of $167.3 million to be received over the term of the lease. The tenant will occupy approximately 43% of the Company owned building, and the agreement provides for escalating rent payments and various lease incentives, including a rent holiday and tenant improvement allowances, that will be straight-lined over the lease term concluding in February 2027. In connection with executing the lease agreement, the Company accrued deferred lease origination costs of $6.5 million. The Company provided the tenant access to the building starting in September 2017and recorded both a lease incentive receivable and obligation to pay for $24.9 million of tenant improvements at that time. Accordingly, the Company commenced its recognition of monthly rental income in September 2017, net of the lease incentives and amortization of the lease origination costs, within other income and expense, net in the consolidated statement of operations.
As of December 31, 2017, cash to be received from future minimum rentals for the noncancelable lease term are as follows (in thousands):
|
Year ending December 31: |
|
|
|
|
|
2018 |
|
$ |
5,534 |
|
|
2019 |
|
|
11,345 |
|
|
2020 |
|
|
14,369 |
|
|
2021 |
|
|
20,287 |
|
|
2022 |
|
|
20,896 |
|
|
Thereafter |
|
|
93,982 |
|
|
Total |
|
$ |
166,413 |
|
The Company has other lease and sub-lease arrangements for its owned or leased office facilities, however, the amounts are not material to the consolidated financial statements.
Lease Commitments
We have entered into operating leases for primarily office facilities. As of December 31, 2017, future minimum lease payments related to the Company’s leases are as follows (in thousands):
|
Year ending December 31: |
|
|
|
|
|
2018 |
|
$ |
8,301 |
|
|
2019 |
|
|
7,891 |
|
|
2020 |
|
|
5,777 |
|
|
2021 |
|
|
4,988 |
|
|
2022 |
|
|
1,574 |
|
|
Thereafter |
|
|
— |
|
|
Total |
|
$ |
28,531 |
|
Rent expense on operating leases for facilities for 2017, 2016 and 2015 totaled $5.7 million, $5.3 million and $4.5 million, respectively.
14. Commitments and Contingencies
The amounts represented in the tables below reflect our minimum cash obligations for the respective calendar years based on contractual terms, but do not necessarily represent the periods in which these costs will be expensed in the Company’s consolidated statement of operations.
81
Licensor and Marketing Commitments
We have entered into several contracts with licensors that contain minimum contractual and marketing commitments that may not be dependent on any deliverables. As of December 31, 2017, future minimum contractual royalty payments due to licensors and marketing commitments for the licensed products are as follows (in thousands):
|
Year ending December 31: |
|
|
|
|
|
2018 |
|
$ |
8,875 |
|
|
2019 |
|
|
8,750 |
|
|
2020 |
|
|
2,250 |
|
|
Thereafter |
|
|
— |
|
|
Total |
|
$ |
19,875 |
|
Other Purchase Commitments
We have entered into several contracts primarily for hosting of data systems and other services. As of December 31, 2017, future minimum purchase commitments that have initial or remaining non-cancelable terms are as follows (in thousands):
|
Year ending December 31: |
|
|
|
|
|
2018 |
|
$ |
8,048 |
|
|
2019 |
|
|
2,246 |
|
|
2020 |
|
|
383 |
|
|
Thereafter |
|
|
— |
|
|
Total |
|
$ |
10,677 |
|
Excluded from tables above is our uncertain income tax position liability of $9.0 million, as the Company cannot make a reasonably reliable estimate of the period of cash settlement. We also have a legal commitment of $11.9 million related to the settlement of the Zindagi matter, to be paid in the first quarter of 2018, which is not reflected in the tables above. Refer to the header “Legal Matters” below for further discussion.
Credit Facility
On November 2, 2016, the Company voluntarily terminated the Credit Agreement. Prior to its termination, the Credit Agreement provided the Company with a $200 million revolving line of credit. The Credit Agreement was terminated because it no longer served the Company’s needs and allows the Company to save costs otherwise incurred in connection with maintaining the line of credit. The pay-off amount in connection with the termination of the Credit Agreement was $0.1 million and primarily consisted of commitment fees. The Company did not incur any early termination penalties in connection with the termination.
Legal Matters
The Company is involved in legal and regulatory proceedings on an ongoing basis. Some of these proceedings are in early stages and may seek an indeterminate amount of damages. If the Company believes that a loss arising from such matters is probable and can be reasonably estimated, the Company accrues the estimated liability in its financial statements. If only a range of estimated losses can be determined, the Company accrues an amount within the range that, in its judgment, reflects the most likely outcome; if none of the estimates within that range is a better estimate than any other amount, the Company accrues the low end of the range. For proceedings in which an unfavorable outcome is reasonably possible but not probable and an estimate of the loss or range of losses arising from the proceeding can be made, the Company discloses such an estimate, if material. If such a loss or range of losses is not reasonably estimable, the Company discloses that fact. In assessing the materiality of a proceeding, the Company evaluates, among other factors, the amount of monetary damages claimed, as well as the potential impact of non-monetary remedies sought by plaintiffs that may require changes to business practices in a manner that could have a material adverse impact on the Company’s business. Legal expenses are recognized as incurred.
Derivative Litigation
Since August 3, 2012, eight stockholder derivative lawsuits have been filed in State or Federal courts in California and Delaware purportedly on behalf of the Company against certain current and former directors and executive officers of the Company. The derivative plaintiffs allege that the defendants breached their fiduciary duties and violated California Corporations Code section 25402 in connection with the Company’s initial public offering in December 2011 and the Company’s secondary offering in April 2012 by allegedly making false or misleading statements regarding the Company’s business and financial projections.
82
Beginning on August 3, 2012, three of the actions were filed in San Francisco County Superior Court. On October 2, 2012, the court consolidated those three actions as In re Zynga Shareholder Derivative Litigation, Lead Case CGC-12-522934. On March 14, 2013, the plaintiffs filed a First Amended Complaint in that consolidated California state action. On March 21, 2013, the court endorsed a stipulation among the parties staying the action pending the ruling on the motion to dismiss in a related federal securities class action. On March 24, 2014, the court endorsed a stipulation among the parties staying the action pending a ruling on a motion to dismiss the First Amended Complaint in the federal securities class action. On April 24, 2015, the court endorsed a stipulation among the parties staying the action until the Delaware Chancery Court ruled on the defendants’ motion to stay or dismiss in the action described below. On May 2, 2016, the court endorsed a stipulation among the parties staying the action until final resolution of plaintiff’s appeal in the Delaware derivative action that is discussed in further detail below. At a status conference on March 8, 2017, the court stayed the action, in light of the Company’s formation of a special litigation committee discussed below. At a status conference on September 29, 2017, the court extended the stay in the action until April 9, 2018.
Beginning on August 16, 2012, four stockholder derivative actions were filed in the U.S. District Court for the Northern District of California. On December 3, 2012, the court consolidated these four actions as In re Zynga Inc. Derivative Litigation, Lead Case No. 12-CV-4327-JSW. On March 11, 2013, the court endorsed a stipulation among the parties staying the action pending the ruling on the motion to dismiss in a related federal securities class action. On March 21, 2014, the court issued an order continuing the stay pending a ruling on a motion to dismiss the First Amended Complaint in the federal securities class action. On April 27, 2015, the court endorsed a stipulation among the parties staying the action until the Delaware Chancery Court ruled on the defendants’ motion to stay or dismiss in the action described below. On April 27, 2016, the court endorsed a stipulation among the parties staying the action until final resolution of plaintiff’s appeal in the Delaware derivative action discussed below. On January 26, 2017, the court endorsed a stipulation among the parties providing for a further stay of this action until July 14, 2017. On August 17, 2017, the court endorsed a stipulation among the parties providing for a further stay of this action until September 29, 2017. On October 27, 2017, the court endorsed a stipulation among the parties provided for further stay of this action until April 9, 2018.
On April 4, 2014, a derivative action was filed in the Court of Chancery of the State of Delaware captioned Sandys v. Pincus, et al. Case No. 9512-CB. On December 9, 2014, the defendants filed a motion to stay or dismiss the action. The court held a hearing on defendants’ motion on November 17, 2015, and on February 29, 2016, the court granted the Company’s motion to dismiss. On March 29, 2016, plaintiff filed a notice of appeal of the court’s order dismissing the action. On December 5, 2016, the Delaware Supreme Court reversed the Court of Chancery’s dismissal and remanded the case for further proceedings. On June 7, 2017, the court endorsed a stipulation among the parties staying the action through July 31, 2017, in light of the Company’s formation of a special litigation committee. On July 18, 2017, the court endorsed a stipulation among the parties continuing the stay in the action through September 7, 2017. On September 11, 2017, the court endorsed a stipulation among the parties continuing the stay in the action through October 31, 2017.
The derivative actions include claims for, among other things, unspecified damages in favor of the Company, certain corporate actions to purportedly improve the Company’s corporate governance, and an award of costs and expenses to the derivative plaintiffs, including attorneys’ fees. Because the derivative actions are in the early stages of the litigation process, the Company is not in a position to assess whether any loss or adverse effect on the Company’s financial condition is probable or remote, or to estimate the range of potential loss, if any.
On February 3, 2017, the Company’s Board of Directors established a special litigation committee (the “Special Litigation Committee”) currently consisting of Janice Roberts and Carol Mills, to investigate the claims asserted against certain former and current officers and directors of the Company in the shareholder derivative suits described above (collectively, the “Derivative Litigation”). The Company’s Board of Directors determined that each member of the Special Litigation Committee is disinterested and independent with respect to the Derivative Litigation. The Special Litigation Committee will determine what actions are appropriate and in the best interests of the Company, and decide whether it is in the best interests of the Company to pursue, dismiss or consensually resolve the claims asserted in the Derivative Litigation. The Special Litigation Committee’s findings and determinations shall be final and not subject to review by the Company’s Board of Directors and in all respects shall be binding upon the Company.
Mayer et al. v. Zynga
On March 31, 2017, Umrao Mayer, George Simmons, Zindagi Games, Inc., and Cam Tech Building, LLC initiated an arbitration against the Company. In their Statement of Claims, the claimants asserted five claims for relief, including breach of contracts, breach of the implied covenant of good faith and fair dealing, estoppel, conversion, and declaratory relief with respect to allegedly unlawful Non-Competition, Non-Solicitation and Non-Disparagement agreements entered into with Messrs. Mayer and Simmons (the “Non-Solicitation Agreements”). The primary allegations made by the claimants are that the Company (i) breached an Asset Purchase Agreement dated December 30, 2015 between Zindagi Games, Inc., Messrs. Mayer and Simmons, and the Company (the “Zindagi Acquisition Agreement”) by failing to provide the claimants an opportunity to achieve an earnout payment, (ii) unlawfully withheld an escrow payment due under the Zindagi Acquisition Agreement, (iii) improperly terminated Messrs. Mayer
83
and Simmons on November 29, 2016, (iv) breached a lease agreement, and (v) required Messrs. Mayer and Simmons to enter into the Non-Solicitation Agreements, which contained unlawful non-solicitation and non-competition provisions. The claimants asserted that they are entitled to compensatory damages in excess of $60 million, the release of $875,000 plus interest held in escrow, exemplary damages, damages for the remaining lease payments, declaratory relief, and attorneys’ fees and costs. On May 1, 2017, the Company filed its response, including a general denial of the allegations and a counterclaim for $2.5 million due to the termination of Messrs. Mayer and Simmons for “Cause” under the Zindagi Acquisition Agreement. The Company also sought its attorneys’ fees and costs. On September 6, 2017, the claimants and the Company agreed to amend certain provisions of the Non-Solicitation Agreements prospectively. However, the Company expressly reserved the right to pursue claims for violation by the claimants of the Non-Solicitation Agreements arising before September 6, 2017. On September 11, 2017, the claimants dismissed their claim for declaratory relief regarding the enforceability of the Non-Solicitation Agreements. On September 26, 2017, the Company amended its response to include new counterclaims for breaches of the contract and fraudulent concealment arising out of allegations that Messrs. Mayer and Simmons improperly handled the Company’s confidential information. The parties completed fact discovery on November 3, 2017, and expert discovery was completed on November 22, 2017. On December 7, 2017, the parties executed a settlement in principle following a mediation. A final settlement agreement was executed on December 22, 2017, whereby the Company agreed to release $1.1 million held in escrow from the acquisition date purchase consideration and an additional cash settlement payment of $11.9 million. The release of the escrow was completed prior to December 31, 2017 and resulted in a decrease in restricted cash and other current liabilities on the Company’s consolidated balance sheet. The cash settlement payment was issued subsequent to December 31, 2017 and accordingly, the Company recorded an $11.9 million obligation within other current liabilities with a corresponding expense within general and administrative expenses in the consolidated statement of operations. The settlement has now been satisfied in full, and all parties’ arbitration claims have subsequently been dismissed.
Other
The Company is, at various times, also party to various other legal proceedings and claims not previously discussed which arise in the ordinary course of business. In addition, the Company may receive notifications alleging infringement of patent or other intellectual property rights. Adverse results in any such litigation, legal proceedings or claims may include awards of substantial monetary damages, expensive legal fees, costly royalty or licensing agreements, or orders preventing us from offering certain games, features, or services, and may also result in changes in the Company’s business practices, which could result in additional costs or a loss of revenue and could otherwise harm the Company’s business. Although the results of such litigation cannot be predicted with certainty, the Company believes that the amount or range of reasonably possible losses related to such pending or threatened litigation will not have a material adverse effect on its business, operating results, cash flows, or financial condition should such litigation be resolved unfavorably.
15. Geographical Information
The following represents our revenue based on the geographic location of our players (in thousands):
|
|
|
Year Ended December 31, |
|
|||||||||
|
|
|
2017 |
|
|
2016 |
|
|
2015 |
|
|||
|
United States |
|
$ |
567,315 |
|
|
$ |
507,473 |
|
|
$ |
506,268 |
|
|
All other countries(1) |
|
|
294,075 |
|
|
|
233,947 |
|
|
|
258,449 |
|
|
Total revenue |
|
$ |
861,390 |
|
|
$ |
741,420 |
|
|
$ |
764,717 |
|
|
(1) |
No country, other than the U.S., exceeded 10% of our total revenue for any periods presented. |
The following represents our property and equipment, net by location (in thousands):
|
|
|
Year Ended December 31, |
|
|||||||||
|
|
|
2017 |
|
|
2016 |
|
|
2015 |
|
|||
|
United States |
|
$ |
263,037 |
|
|
$ |
267,324 |
|
|
$ |
269,721 |
|
|
All other countries |
|
|
3,552 |
|
|
|
2,115 |
|
|
|
3,500 |
|
|
Total property and equipment, net |
|
$ |
266,589 |
|
|
$ |
269,439 |
|
|
$ |
273,221 |
|
84
ITEM 9. CHANGES IN AND DISAGREEMENTS WITH ACCOUNTANTS ON ACCOUNTING AND FINANCIAL DISCLOSURE
ITEM 9A. CONTROLS AND PROCEDURES
Evaluation of Disclosure Controls and Procedures
Our management, with the participation of our Chief Executive Officer and Chief Financial Officer, evaluated the effectiveness of our disclosure controls and procedures as of the end of the period covered by this Annual Report on Form 10-K. The term “disclosure controls and procedures,” as defined in Rules 13a-15(e) and 15d-15(e) under the Exchange Act, means controls and other procedures of a company that are designed to ensure that information required to be disclosed by a company in the reports that it files or submits under the Exchange Act is recorded, processed, summarized and reported, within the time periods specified in the SEC rules and forms. Disclosure controls and procedures include, without limitation, controls and procedures designed to ensure that information required to be disclosed by a company in the reports that it files or submits under the Exchange Act is accumulated and communicated to the company’s management, including its principal executive and principal financial officers, as appropriate to allow timely decisions regarding required disclosure. Based on the evaluation of our disclosure controls and procedures as of December 31, 2017, our Chief Executive Officer and Chief Financial Officer concluded that, as of such date, our disclosure controls and procedures were effective at the reasonable assurance level.
Management’s Report on Internal Control over Financial Reporting
Our management is responsible for establishing and maintaining adequate internal control over financial reporting, as defined in Rule 13a-15(f) of the Exchange Act. Our management conducted an evaluation of the effectiveness of our internal control over financial reporting based on the framework in Internal Control—Integrated Framework issued by the Committee of Sponsoring Organizations of the Treadway Commission (2013 Framework). Based on this evaluation, management concluded that our internal control over financial reporting was effective as of December 31, 2017. Management reviewed the results of its assessment with our Audit Committee. The effectiveness of our internal control over financial reporting as of December 31, 2017 has been audited by Ernst & Young LLP, an independent registered public accounting firm, as stated in its report which is included in Item 8 under the caption “Report of Ernst & Young, LLP, Independent Registered Public Accounting Firm” which is incorporated herein by reference.
Changes in Internal Control over Financial Reporting
There were no changes in our internal control over financial reporting identified in management’s evaluation pursuant to Rules 13a-15(d) or 15d-15(d) of the Exchange Act during the quarter ended December 31, 2017 that materially affected, or are reasonably likely to materially affect, our internal control over financial reporting.
Limitations on Effectiveness of Controls and Procedures
In designing and evaluating the disclosure controls and procedures, management recognizes that any controls and procedures, no matter how well designed and operated, can provide only reasonable assurance of achieving the desired control objectives. In addition, the design of disclosure controls and procedures must reflect the fact that there are resource constraints and that management is required to apply judgment in evaluating the benefits of possible controls and procedures relative to their costs.
None.
85
ITEM 10. DIRECTORS, EXECUTIVE OFFICERS AND CORPORATE GOVERNANCE
The information required by this item is incorporated by reference to Zynga’s Proxy Statement for its 2017 Annual Meeting of Stockholders to be filed with the SEC within 120 days after the end of the fiscal year ended December 31, 2017.
Our Board of Directors has adopted a Code of Business Conduct and Ethics applicable to all officers, directors and employees, which is available on our website (www.zynga.com) under “Corporate Governance.” We will provide a copy of these documents to any person, without charge, upon request, by writing to us at Zynga Inc., Investor Relations Department, 699 Eighth Street, San Francisco, California 94103. We intend to satisfy the disclosure requirement under Item 5.05 of Form 8-K regarding an amendment to, or waiver from, a provision of our Code of Business Conduct and Ethics by posting such information on our website at the address and the location specified above.
ITEM 11. EXECUTIVE COMPENSATION
The information required by this item is incorporated by reference to Zynga’s Proxy Statement for its 2017 Annual Meeting of Stockholders to be filed with the SEC within 120 days after the end of the fiscal year ended December 31, 2017.
ITEM 12. SECURITY OWNERSHIP OF CERTAIN BENEFICIAL OWNERS AND MANAGEMENT AND RELATED STOCKHOLDER MATTERS
The information required by this item is incorporated by reference to Zynga’s Proxy Statement for its 2017 Annual Meeting of Stockholders to be filed with the SEC within 120 days after the end of the fiscal year ended December 31, 2017.
ITEM 13. CERTAIN RELATIONSHIPS AND RELATED TRANSACTIONS AND DIRECTOR INDEPENDENCE
The information required by this item is incorporated by reference to Zynga’s Proxy Statement for its 2017 Annual Meeting of Stockholders to be filed with the SEC within 120 days after the end of the fiscal year ended December 31, 2017.
ITEM 14. PRINCIPAL ACCOUNTING FEES AND SERVICES
The information required by this item is incorporated by reference to Zynga’s Proxy Statement for its 2017 Annual Meeting of Stockholders to be filed with the SEC within 120 days after the end of the fiscal year ended December 31, 2017.
86
ITEM 15. EXHIBITS, FINANCIAL STATEMENT SCHEDULES
(a) Documents filed as part of this report:
|
1. |
Consolidated Financial Statements: See Index to Consolidated Financial Statements under Item 8 on page 49 of this Annual Report on Form 10-K. |
|
2. |
Financial Statements Schedule: |
Schedule II: Valuation and Qualifying Accounts
|
Allowance for Doubtful Accounts and Sales Credits |
|
Balance at Beginning of Year |
|
|
Charged to Expenses/ Against Revenue |
|
|
Write-Offs Net of Recoveries |
|
|
Balance at End of Year |
|
||||
|
Year Ended December 31, 2017 |
|
$ |
— |
|
|
$ |
— |
|
|
$ |
— |
|
|
$ |
— |
|
|
Year Ended December 31, 2016 |
|
$ |
— |
|
|
$ |
— |
|
|
$ |
— |
|
|
$ |
— |
|
|
Year Ended December 31, 2015 |
|
$ |
— |
|
|
$ |
— |
|
|
$ |
— |
|
|
$ |
— |
|
All other schedules have been omitted because they are not required, not applicable, or the required information is otherwise included.
|
3. |
Exhibits: |
|
|
|
|
|
Incorporated by Reference |
|
|
||||||||
|
Exhibit No. |
|
Description of Exhibit |
|
Form |
|
File No. |
|
Exhibit |
|
Filing Date |
|
Filed Herewith |
||
|
3.1 |
|
Seventeenth Amended and Restated Certificate of Incorporation of Zynga Inc. |
|
8-K |
|
001-35375 |
|
3.1 |
|
06/11/2014 |
|
|
||
|
3.2 |
|
|
8-K |
|
001-35375 |
|
3.1 |
|
3/1/2016 |
|
|
|||
|
4.1 |
|
|
S-1/A |
|
333-175298 |
|
4.1 |
|
11/4/2011 |
|
|
|||
|
10.1 |
|
|
S-1/A |
|
333-175298 |
|
10.1 |
|
8/11/2011 |
|
|
|||
|
10.2+ |
|
|
S-1/A |
|
333-175298 |
|
10.2 |
|
12/2/2011 |
|
|
|||
|
10.3+ |
|
Forms of Stock Option Agreement and Stock Option Exercise Agreement under 2007 Equity Incentive Plan |
|
S-1/A |
|
333-175298 |
|
10.3 |
|
11/17/2011 |
|
|
||
|
10.4+ |
|
|
S-1/A |
|
333-175298 |
|
10.26 |
|
11/17/2011 |
|
|
|||
|
10.5+ |
|
|
DEF 14A |
|
001-35378 |
|
Appendix A |
|
4/28/2015 |
|
|
|||
|
10.6+ |
|
Forms of Stock Option Grant Notice and Option Agreement under 2011 Equity Incentive Plan |
|
S-1/A |
|
333-175298 |
|
10.5 |
|
11/17/2011 |
|
|
||
|
10.7+ |
|
|
10-Q
|
|
001-35375 |
|
10.3
|
|
5/8/2012
|
|
|
|||
|
10.8+ |
|
Form of 2011 Equity Incentive Plan Performance Cash Award Agreement |
|
8-K |
|
001-35375 |
|
10.1 |
|
4/4/2013 |
|
|
||
87
|
|
|
|
|
Incorporated by Reference |
|
|
||||||||
|
Exhibit No. |
|
Description of Exhibit |
|
Form |
|
File No. |
|
Exhibit |
|
Filing Date |
|
Filed Herewith |
||
|
10.9+ |
|
Zynga Inc. 2011 Employee Stock Purchase Plan, as amended on August 15, 2012 |
|
S-8 |
|
333-206185 |
|
4.6 |
|
8/7/2015 |
|
|
||
|
10.10+ |
|
|
S-1/A |
|
333-175298 |
|
10.6 |
|
11/17/2011 |
|
|
|||
|
10.11+ |
|
|
10-Q |
|
001-35375 |
|
10.1 |
|
5/5/2017 |
|
|
|||
|
10.12+ |
|
|
10-K |
|
001-35375 |
|
10.12 |
|
2/19/2016 |
|
|
|||
|
10.13+ |
|
Amended and Restated Offer Letter, between Zynga Inc. and Mark Pincus |
|
S-1/A |
|
333-175298 |
|
10.10 |
|
11/17/2011 |
|
|
||
|
10.14+ |
|
Amended and Restated Offer Letter, between Zynga Inc. and Mark Pincus |
|
8-K |
|
001-35375 |
|
10.2 |
|
3/1/2016 |
|
|
||
|
10.15+ |
|
|
8-K |
|
001-35375 |
|
10.1 |
|
3/1/2016 |
|
|
|||
|
10.16+ |
|
|
10-Q |
|
001-35375 |
|
101 |
|
8/5/2016 |
|
|
|||
|
10.17+ |
|
|
10-Q |
|
001-35375 |
|
10.2 |
|
8/5/2016 |
|
|
|||
|
10.18+ |
|
|
8-K |
|
001-35375 |
|
10.1 |
|
9/30/2016 |
|
|
|||
|
10.19+ |
|
|
10-Q |
|
001-35375 |
|
10.2 |
|
5/5/2017 |
|
|
|||
|
10.20+ |
|
|
10-Q |
|
001-35375 |
|
10.1 |
|
11/8/2017 |
|
|
|||
|
10.21† |
|
|
S-1/A |
|
333-175298 |
|
10.15 |
|
11/17/2011 |
|
|
|||
|
10.22† |
|
|
10-Q |
|
001-35375 |
|
10.1 |
|
7/30/2012 |
|
|
|||
|
10.23# |
|
|
10-K |
|
001-35375 |
|
10.30 |
|
02/25/2013 |
|
|
|||
|
10.24† |
|
|
S-1/A |
|
333-175298 |
|
10.16 |
|
11/4/2011 |
|
|
|||
|
10.25† |
|
|
10-Q |
|
001-35375 |
|
10.2 |
|
7/30/2012 |
|
|
|||
|
10.26† |
|
|
10-Q |
|
001-35375 |
|
10.3 |
|
7/30/2012 |
|
|
|||
|
10.27† |
|
|
10-K |
|
001-35375 |
|
10.34 |
|
02/25/2013 |
|
|
|||
88
|
|
|
|
|
Incorporated by Reference |
|
|
||||||||
|
Exhibit No. |
|
Description of Exhibit |
|
Form |
|
File No. |
|
Exhibit |
|
Filing Date |
|
Filed Herewith |
||
|
21.1 |
|
|
|
|
|
|
|
|
|
|
X |
|||
|
23.1 |
|
|
|
|
|
|
|
|
|
|
X |
|||
|
24.1 |
|
|
|
|
|
|
|
|
|
|
X |
|||
|
31.1 |
|
|
|
|
|
|
|
|
|
|
X |
|||
|
31.2 |
|
|
|
|
|
|
|
|
|
|
X |
|||
|
32.1• |
|
|
|
|
|
|
|
|
|
|
X |
|||
|
101.INS* |
|
XBRL Instance Document |
|
|
|
|
|
|
|
|
|
|
||
|
101.SCH* |
|
XBRL Taxonomy Extension Schema Document |
|
|
|
|
|
|
|
|
|
|
||
|
101.CAL* |
|
XBRL Taxonomy Extension Calculation Linkbase Document |
|
|
|
|
|
|
|
|
|
|
||
|
101.DEF* |
|
XBRL Taxonomy Extension Definition Linkbase Document |
|
|
|
|
|
|
|
|
|
|
||
|
101.LAB* |
|
XBRL Taxonomy Extension Labels Linkbase Document |
|
|
|
|
|
|
|
|
|
|
||
|
101.PRE* |
|
XBRL Taxonomy Extension Presentation Linkbase Document |
|
|
|
|
|
|
|
|
|
|
||
|
+ |
Indicates management contract or compensatory plan. |
|
† |
Confidential treatment has been granted for certain information contained in this exhibit. Such information has been omitted and was filed separately with the Securities and Exchange Commission. |
|
• |
The certifications attached as Exhibit 32.1 accompany this Annual Report on Form 10-K pursuant to 18 U.S.C. Section 1350, as adopted pursuant to Section 906 of the Sarbanes-Oxley Act of 2002, and shall not be deemed “filed” by the Registrant for purposes of Section 18 of the Securities Exchange Act of 1934, as amended. |
89
Pursuant to the requirements of Section 13 or 15(d) of the Securities Exchange Act of 1934, the Registrant has duly caused this Annual Report on Form 10-K to be signed on its behalf by the undersigned, thereunto duly authorized on February 20, 2018.
|
ZYNGA INC. |
||
|
|
|
|
|
By: |
|
/s/ Frank Gibeau |
|
|
|
Frank Gibeau Chief Executive Officer (On behalf of Registrant) |
|
|
|
|
|
By: |
|
/s/ Gerard Griffin |
|
|
|
Gerard Griffin Chief Financial Officer (On behalf of Registrant) |
|
|
|
|
|
By: |
|
/s/ Jeffrey Buckley |
|
|
|
Jeffrey Buckley Chief Accounting Officer (On behalf of Registrant) |
90
KNOW ALL PERSONS BY THESE PRESENTS, that each person whose signature appears below constitutes and appoints Gerard Griffin and Phuong Y. Phillips, and each of them, as his or her true and lawful attorneys-in-fact and agents, with full power of substitution and resubstitution, for him or her and in his or her name, place, and stead, in any and all capacities, to sign any and all amendments to this Annual Report on Form 10-K, and to file the same, with all exhibits thereto, and other documents in connection therewith, with the Securities and Exchange Commission, granting unto said attorneys-in-fact and agents, and each of them, full power and authority to do and perform each and every act and thing requisite and necessary to be done in connection therewith, as fully to all intents and purposes as he or she might or could do in person, hereby ratifying and confirming that all said attorneys-in-fact and agents, or any of them or their or his or her substitute or substitutes, may lawfully do or cause to be done by virtue hereof.
Pursuant to the requirements of the Securities Exchange Act of 1934, this Annual Report on Form 10-K has been signed below by the following persons on behalf of the Registrant and in the capacities and on the dates indicated:
|
Signature |
|
Title |
|
Date |
|
|
|
|
|
|
|
/s/ Mark Pincus |
|
Chairman of the Board |
|
February 20, 2018 |
|
Mark Pincus |
||||
|
|
|
|
|
|
|
/s/ Frank Gibeau |
|
Chief Executive Officer and Director |
|
February 20, 2018 |
|
Frank Gibeau |
||||
|
|
|
|
|
|
|
/s/ Gerard Griffin |
|
Chief Financial Officer (Principal Financial Officer) |
|
February 20, 2018 |
|
Gerard Griffin |
||||
|
|
|
|
|
|
|
/s/ Jeffrey Buckley |
|
Chief Accounting Officer (Principal Accounting Officer) |
|
February 20, 2018 |
|
Jeffrey Buckley |
||||
|
|
|
|
|
|
|
/s/ Regina E. Dugan |
|
Director |
|
February 20, 2018 |
|
Regina E. Dugan |
||||
|
|
|
|
|
|
|
/s/ William “Bing” Gordon |
|
Director |
|
February 20, 2018 |
|
William “Bing” Gordon |
||||
|
|
|
|
|
|
|
/s/ Louis J. Lavigne, Jr. |
|
Director |
|
February 20, 2018 |
|
Louis J. Lavigne, Jr. |
||||
|
|
|
|
|
|
|
/s/ Carol G. Mills |
|
Director |
|
February 20, 2018 |
|
Carol G. Mills |
||||
|
|
|
|
|
|
|
/s/ Janice M. Roberts |
|
Director |
|
February 20, 2018 |
|
Janice M. Roberts |
||||
|
|
|
|
|
|
|
/s/ Ellen F. Siminoff |
|
Director |
|
February 20, 2018 |
|
Ellen F. Siminoff |
91