Attached files
| file | filename |
|---|---|
| EX-99.1 - EX-99.1 - GENTHERM Inc | thrm-ex991_14.htm |
| 8-K - 8-K - GENTHERM Inc | thrm-8k_20171231.htm |
Gentherm Inc. 2017 Fourth Quarter and Full Year Results February 20, 2018 Exhibit 99.2
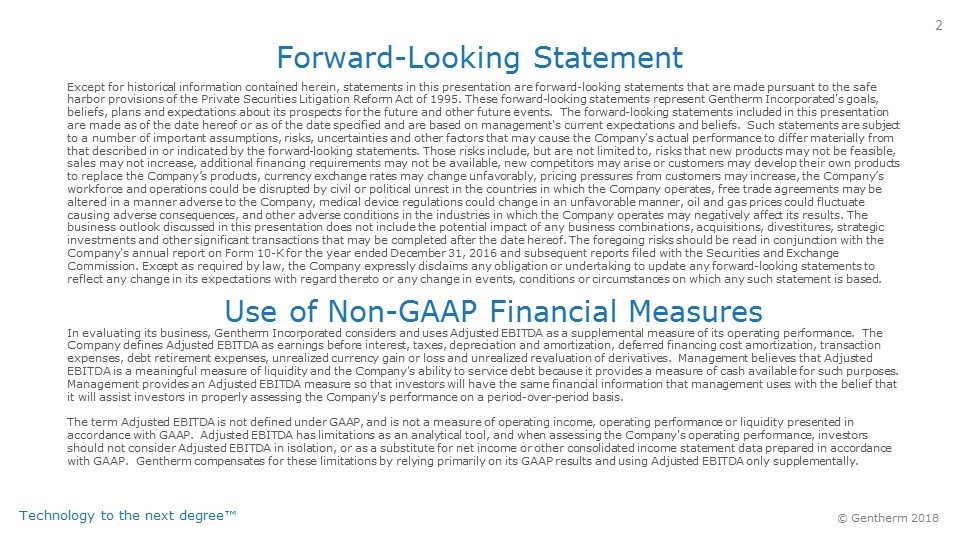
Forward-Looking Statement Except for historical information contained herein, statements in this presentation are forward-looking statements that are made pursuant to the safe harbor provisions of the Private Securities Litigation Reform Act of 1995. These forward-looking statements represent Gentherm Incorporated's goals, beliefs, plans and expectations about its prospects for the future and other future events. The forward-looking statements included in this presentation are made as of the date hereof or as of the date specified and are based on management's current expectations and beliefs. Such statements are subject to a number of important assumptions, risks, uncertainties and other factors that may cause the Company's actual performance to differ materially from that described in or indicated by the forward looking statements. Those risks include, but are not limited to, risks that new products may not be feasible, sales may not increase, additional financing requirements may not be available, new competitors may arise or customers may develop their own products to replace the Company’s products, currency exchange rates may change unfavorably, pricing pressures from customers may increase, the Company’s workforce and operations could be disrupted by civil or political unrest in the countries in which the Company operates, free trade agreements may be altered in a manner adverse to the Company, medical device regulations could change in an unfavorable manner, oil and gas prices could fluctuate causing adverse consequences, and other adverse conditions in the industries in which the Company operates may negatively affect its results. The business outlook discussed in this presentation does not include the potential impact of any business combinations, acquisitions, divestitures, strategic investments and other significant transactions that may be completed after the date hereof. The foregoing risks should be read in conjunction with the Company's annual report on Form 10-K for the year ended December 31, 2016 and subsequent reports filed with the Securities and Exchange Commission. Except as required by law, the Company expressly disclaims any obligation or undertaking to update any forward-looking statements to reflect any change in its expectations with regard thereto or any change in events, conditions or circumstances on which any such statement is based. Use of Non-GAAP Financial Measures In evaluating its business, Gentherm Incorporated considers and uses Adjusted EBITDA as a supplemental measure of its operating performance. The Company defines Adjusted EBITDA as earnings before interest, taxes, depreciation and amortization, deferred financing cost amortization, transaction expenses, debt retirement expenses, unrealized currency gain or loss and unrealized revaluation of derivatives. Management believes that Adjusted EBITDA is a meaningful measure of liquidity and the Company's ability to service debt because it provides a measure of cash available for such purposes. Management provides an Adjusted EBITDA measure so that investors will have the same financial information that management uses with the belief that it will assist investors in properly assessing the Company's performance on a period-over-period basis. The term Adjusted EBITDA is not defined under GAAP, and is not a measure of operating income, operating performance or liquidity presented in accordance with GAAP. Adjusted EBITDA has limitations as an analytical tool, and when assessing the Company's operating performance, investors should not consider Adjusted EBITDA in isolation, or as a substitute for net income or other consolidated income statement data prepared in accordance with GAAP. Gentherm compensates for these limitations by relying primarily on its GAAP results and using Adjusted EBITDA only supplementally.
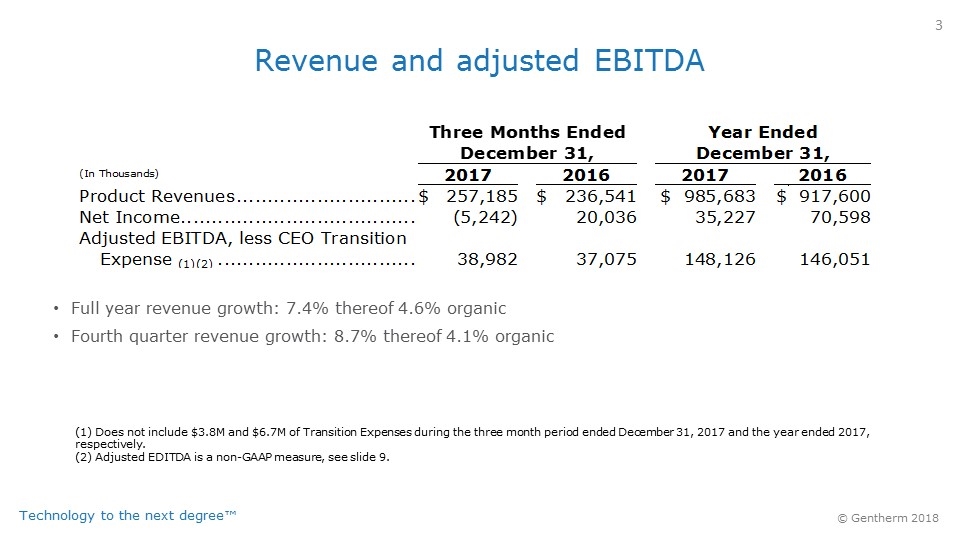
Revenue and adjusted EBITDA (1) Does not include $3.8M and $6.7M of Transition Expenses during the three month period ended December 31, 2017 and the year ended 2017, respectively. (2) Adjusted EDITDA is a non-GAAP measure, see slide 9. Full year revenue growth: 7.4% thereof 4.6% organic Fourth quarter revenue growth: 8.7% thereof 4.1% organicThree Months EndedDecember 31,Year EndedDecember 31,(In Thousands)2017201620172016Product Revenues$257,185$236,541$985,683$917,600Net Income(5,242)20,03635,22770,598Adjusted EBITDA, less CEO Transition Expense (1)(2)38,98237,075148,126146,051

Automotive 2017 Highlights Launched systems on 141 vehicle nameplates with 22 OEMs Launched record number 28 steering wheel heater solutions Launched first thermoelectric Battery Thermal Management with German OEM and NA OEM Honda NA and Bosch Global Supplier of the Year Awards Acquisition of Etratech
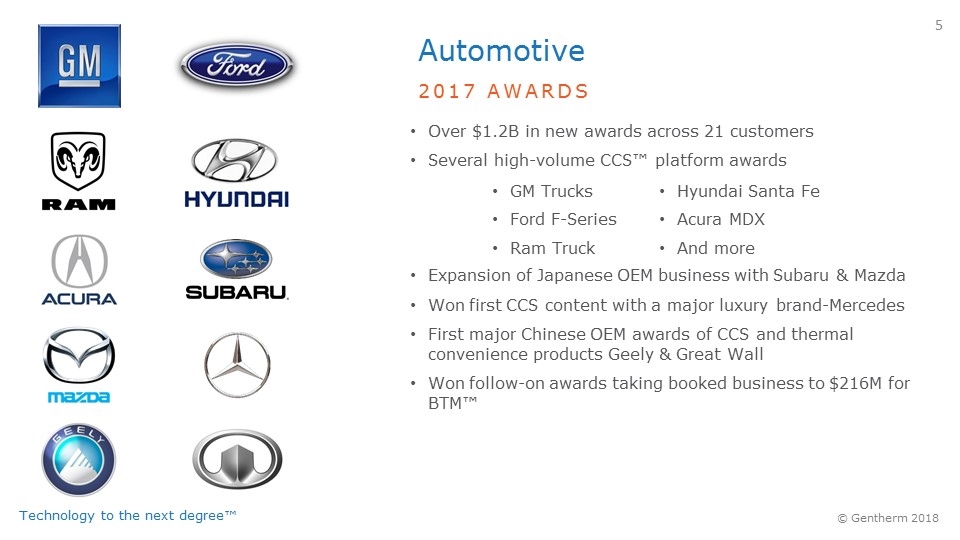
Automotive 2017 AWARDS Over $1.2B in new awards across 21 customers Several high-volume CCS™ platform awards GM Trucks Ford F-Series Ram Truck Expansion of Japanese OEM business with Subaru & Mazda Won first CCS content with a major luxury brand-Mercedes First major Chinese OEM awards of CCS and thermal convenience products Geely & Great Wall Won follow-on awards taking booked business to $216M for BTM™ Hyundai Santa Fe Acura MDX And more

CSZ 2017 HIGHLIGHTS Thermal test chamber for a NASA space project Launched new FilteredFlo® Pediatric Underbody Blanket Successfully passed critical design review gate with US Airforce for non-invasive warming and cooling device Launched 100V Norm-O-Temp® providing a solution for the Japanese Normothermia market Awarded CSZ WarmAir® system with St. Joseph Heath Integrated Health Care System (17 hospital system) 3-year extension with our largest customer Completed direct sales force development
GPT Regulation drives methane reduction market – ERA Grant Australian LNG market Expansion of offshore platform success to new areas 2017 HIGHLIGHTS
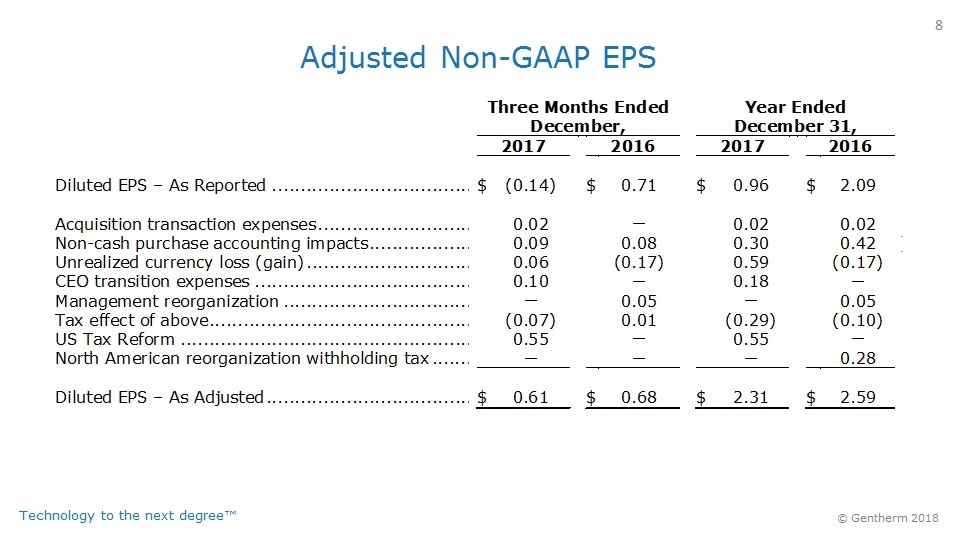
Adjusted Non-GAAP EPS Three Months EndedDecember,Year EndedDecember 31,2017201620172016Diluted EPS – As Reported$(0.14)$0.71$0.96$2.09Acquisition transaction expenses0.02—0.020.02Non-cash purchase accounting impacts0.090.080.300.42)Unrealized currency loss (gain)0.06(0.17)0.59(0.17)CEO transition expenses0.10—0.18—Management reorganization—0.05—0.05Tax effect of above(0.07)0.01(0.29)(0.10)US Tax Reform0.55—0.55—North American reorganization withholding tax———0.28Diluted EPS – As Adjusted$0.61$0.68$2.31$2.59
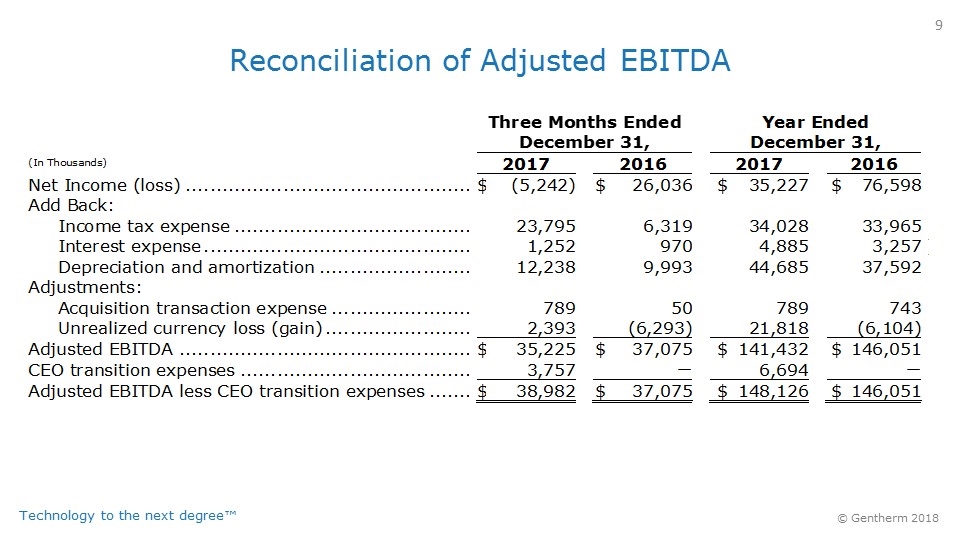
Reconciliation of Adjusted EBITDA Three Months EndedDecember 31,Year EndedDecember 31,(In Thousands)2017201620172016Net Income (loss)$(5,242)$26,036$35,227$76,598Add Back: Income tax expense23,7956,31934,02833,965 Interest expense1,2529704,8853,257) Depreciation and amortization12,2389,99344,68537,592Adjustments: Acquisition transaction expense78950789743 Unrealized currency loss (gain)2,393(6,293)21,818(6,104)Adjusted EBITDA$35,225$37,075$141,432$146,051CEO transition expenses3,757—6,694—Adjusted EBITDA less CEO transition expenses$38,982$37,075$148,126$146,051
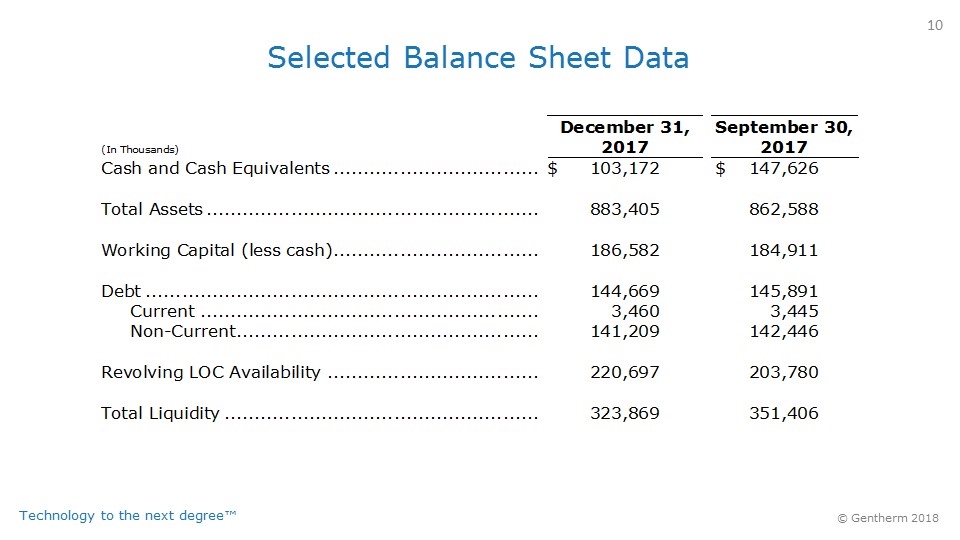
Selected Balance Sheet Data (In Thousands)December 31, 2017September 30, 2017Cash and Cash Equivalents$103,172$147,626Total Assets883,405862,588Working Capital (less cash)186,582184,911Debt144,669145,891 Current3,4603,445 Non-Current141,209142,446Revolving LOC Availability220,697203,780Total Liquidity323,869351,406
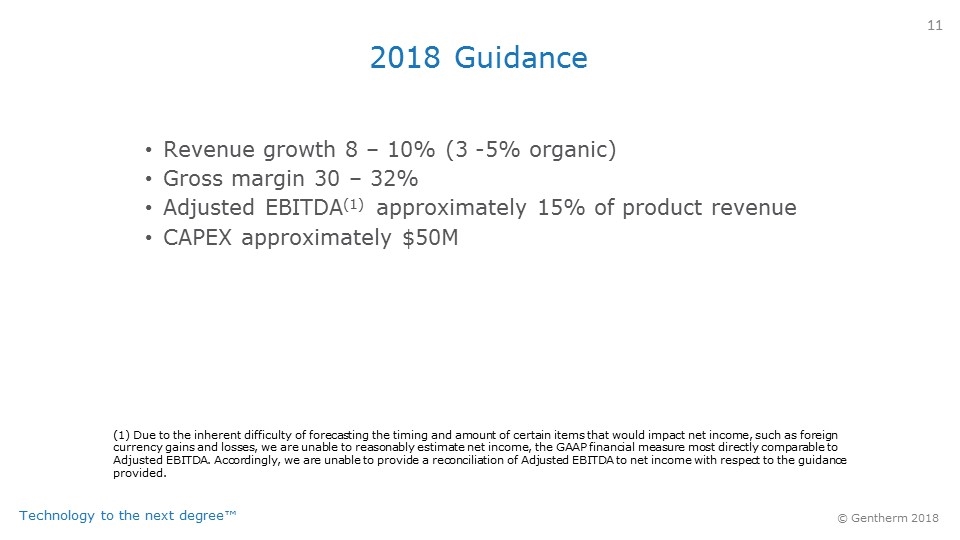
2018 Guidance Revenue growth 8 – 10% (3 -5% organic) Gross margin 30 – 32% Adjusted EBITDA(1) approximately 15% of product revenue CAPEX approximately $50M (1) Due to the inherent difficulty of forecasting the timing and amount of certain items that would impact net income, such as foreign currency gains and losses, we are unable to reasonably estimate net income, the GAAP financial measure most directly comparable to Adjusted EBITDA. Accordingly, we are unable to provide a reconciliation of Adjusted EBITDA to net income with respect to the guidance provided.
