Attached files
| file | filename |
|---|---|
| EX-32.1 - EX-32.1 - Mondelez International, Inc. | d466496dex321.htm |
| EX-31.2 - EX-31.2 - Mondelez International, Inc. | d466496dex312.htm |
| EX-31.1 - EX-31.1 - Mondelez International, Inc. | d466496dex311.htm |
| EX-23.1 - EX-23.1 - Mondelez International, Inc. | d466496dex231.htm |
| EX-21.1 - EX-21.1 - Mondelez International, Inc. | d466496dex211.htm |
| EX-12.1 - EX-12.1 - Mondelez International, Inc. | d466496dex121.htm |
| EX-10.37 - EX-10.37 - Mondelez International, Inc. | d466496dex1037.htm |
| EX-10.31 - EX-10.31 - Mondelez International, Inc. | d466496dex1031.htm |
| EX-10.13 - EX-10.13 - Mondelez International, Inc. | d466496dex1013.htm |
Table of Contents
UNITED STATES
SECURITIES AND EXCHANGE COMMISSION
WASHINGTON, D.C. 20549
FORM 10-K
(Mark one)
| ☒ | ANNUAL REPORT PURSUANT TO SECTION 13 OR 15(d) OF THE SECURITIES EXCHANGE ACT OF 1934 |
For the fiscal year ended December 31, 2017
OR
| ☐ | TRANSITION REPORT PURSUANT TO SECTION 13 OR 15(d) OF THE SECURITIES EXCHANGE ACT OF 1934 |
COMMISSION FILE NUMBER 1-16483

Mondelēz International, Inc.
(Exact name of registrant as specified in its charter)
| Virginia | 52-2284372 | |
| (State or other jurisdiction of incorporation or organization) |
(I.R.S. Employer Identification No.) | |
| Three Parkway North, Deerfield, Illinois | 60015 | |
| (Address of principal executive offices) | (Zip Code) | |
Registrant’s telephone number, including area code: 847-943-4000
Securities registered pursuant to Section 12(b) of the Act:
| Title of each class |
Name of each exchange on which registered | |
| Class A Common Stock, no par value | The Nasdaq Global Select Market | |
| 2.375% Notes due 2021 | New York Stock Exchange LLC | |
| 1.000% Notes due 2022 | New York Stock Exchange LLC | |
| 1.625% Notes due 2023 | New York Stock Exchange LLC | |
| 1.625% Notes due 2027 | New York Stock Exchange LLC | |
| 2.375% Notes due 2035 | New York Stock Exchange LLC | |
| 4.500% Notes due 2035 | New York Stock Exchange LLC | |
| 3.875% Notes due 2045 | New York Stock Exchange LLC |
Securities registered pursuant to Section 12(g) of the Act: None
Indicate by check mark if the registrant is a well-known seasoned issuer, as defined in Rule 405 of the Securities Act. Yes ☒ No ☐
Indicate by check mark if the registrant is not required to file reports pursuant to Section 13 or Section 15(d) of the Act. Yes ☐ No ☒
Note: Checking the box above will not relieve any registrant required to file reports pursuant to Section 13 or 15(d) of the Exchange Act from their obligations under those Sections.
Indicate by check mark whether the registrant (1) has filed all reports required to be filed by Section 13 or 15(d) of the Securities Exchange Act of 1934 during the preceding 12 months (or for such shorter period that the registrant was required to file such reports), and (2) has been subject to such filing requirements for the past 90 days. Yes ☒ No ☐
Indicate by check mark whether the registrant has submitted electronically and posted on its corporate Web site, if any, every Interactive Data File required to be submitted and posted pursuant to Rule 405 of Regulation S-T (§ 232.405 of this chapter) during the preceding 12 months (or for such shorter period that the registrant was required to submit and post such files). Yes ☒ No ☐
Indicate by check mark if disclosure of delinquent filers pursuant to Item 405 of Regulation S-K (§ 229.405 of this chapter) is not contained herein, and will not be contained, to the best of registrant’s knowledge, in definitive proxy or information statements incorporated by reference in Part III of this Form 10-K or any amendment to this Form 10-K. ☐
Indicate by check mark whether the registrant is a large accelerated filer, an accelerated filer, a non-accelerated filer, a smaller reporting company, or emerging growth company. See the definitions of “large accelerated filer,” “accelerated filer,” “smaller reporting company,” and “emerging growth company” in Rule 12b-2 of the Exchange Act.
| Large accelerated filer ☒ | Accelerated filer ☐ |
Non-accelerated filer ☐ | Smaller reporting company ☐ | |||
| (Do not check if a smaller reporting company) | ||||||
| Emerging growth company ☐ | ||||||
If an emerging growth company, indicate by check mark if the registrant has elected not to use the extended transition period for complying with any new or revised financial accounting standards provided pursuant to Section 13(a) of the Exchange Act. ☐
Indicate by check mark whether the registrant is a shell company (as defined in Rule 12b-2 of the Act). Yes ☐ No ☒
The aggregate market value of the shares of Class A Common Stock held by non-affiliates of the registrant, computed by reference to the closing price of such stock on June 30, 2017, was $63 billion. At February 2, 2018, there were 1,487,328,466 shares of the registrant’s Class A Common Stock outstanding.
Documents Incorporated by Reference
Portions of the registrant’s definitive proxy statement to be filed with the Securities and Exchange Commission in connection with its annual meeting of shareholders expected to be held on May 16, 2018 are incorporated by reference into Part III hereof.
Table of Contents
In this report, for all periods presented, “we,” “us,” “our,” “the Company” and “Mondelēz International” refer to Mondelēz International, Inc. and subsidiaries. References to “Common Stock” refer to our Class A Common Stock.
i
Table of Contents
Forward-Looking Statements
This report contains a number of forward-looking statements. Words, and variations of words, such as “will,” “may,” “expect,” “would,” “could,” “might,” “intend,” “plan,” “believe,” “estimate,” “anticipate,” “likely,” “deliver,” “drive,” “seek,” “aim,” “potential,” “objective,” “project,” “outlook” and similar expressions are intended to identify our forward-looking statements, including but not limited to statements about: our future performance, including our future revenue growth and margins; our strategy for growing our people, growing our business and growing our impact; price volatility and pricing actions; the cost environment and measures to address increased costs; our tax rate, tax positions and estimates of the impact of U.S. tax reform on our 2017 and future results; market share; the United Kingdom’s planned exit from the European Union and its impact on our results; the costs of, timing of expenditures under and completion of our restructuring program; snack category growth, our effect on demand and our market position; consumer snacking behaviors; commodity prices and supply; investments; research, development and innovation; political and economic conditions and volatility; currency exchange rates, controls and restrictions; our operations in Venezuela and Argentina; our e-commerce channel strategies; manufacturing and distribution capacity; changes in laws and regulations and regulatory compliance; matters related to the acquisition of a biscuit operation in Vietnam; potential impacts from changing to highly inflationary accounting in selected countries; overhead costs; pension liabilities related to the JDE coffee business transactions; our JDE ownership interest; the financial impact of the Keurig Dr Pepper transaction and our investment and governance rights in Keurig Dr Pepper following closing of the transaction; the outcome and effects on us of legal proceedings and government investigations; the estimated value of goodwill and intangible assets; amortization expense for intangible assets; impairment of goodwill and intangible assets and our projections of operating results and other factors that may affect our impairment testing; our accounting estimates and judgments and the impact of new accounting pronouncements; pension obligations, expenses, contributions and assumptions; employee benefit plan expenses, obligations and assumptions; compensation expense; sustainability initiatives; the Brazilian indirect tax matter; remediation efforts related to and the financial and other impacts of the malware incident; our liquidity, funding sources and uses of funding, including our use of commercial paper; interest expense; our risk management program, including the use of financial instruments and the effectiveness of our hedging activities; working capital; capital expenditures and funding; share repurchases; dividends; long-term value and return on investment for our shareholders; compliance with financial and long-term debt covenants; guarantees; and our contractual obligations.
These forward-looking statements involve risks and uncertainties, many of which are beyond our control. Important factors that could cause actual results to differ materially from those described in our forward-looking statements include, but are not limited to, risks from operating globally including in emerging markets; changes in currency exchange rates, controls and restrictions; continued volatility of commodity and other input costs; weakness in economic conditions; weakness in consumer spending; pricing actions; tax matters including changes in tax rates and laws, disagreements with taxing authorities and imposition of new taxes; use of information technology and third party service providers; unanticipated disruptions to our business, such as the malware incident, cyberattacks or other security breaches; competition; acquisitions and divestitures; the restructuring program and our other transformation initiatives not yielding the anticipated benefits; changes in the assumptions on which the restructuring program is based; protection of our reputation and brand image; management of our workforce; consolidation of retail customers and competition with retailer and other economy brands; changes in our relationships with suppliers or customers; legal, regulatory, tax or benefit law changes, claims or actions; our ability to innovate and differentiate our products; strategic transactions; the timely and successful closing of the Keurig Dr Pepper transaction and the finalization of the terms of our participation in the transaction; significant changes in valuation factors that may adversely affect our impairment testing of goodwill and intangible assets; perceived or actual product quality issues or product recalls; failure to maintain effective internal control over financial reporting; volatility of and access to capital or other markets; pension costs; and our ability to protect our intellectual property and intangible assets. We disclaim and do not undertake any obligation to update or revise any forward-looking statement in this report except as required by applicable law or regulation.
1
Table of Contents
General
We are one of the world’s largest snack companies with global net revenues of $25.9 billion and net earnings of $2.9 billion in 2017. We manufacture and market delicious snack food and beverage products for consumers in approximately 160 countries around the world. Our portfolio includes many iconic snack brands including Nabisco, Oreo, LU and belVita biscuits; Cadbury, Milka, Cadbury Dairy Milk and Toblerone chocolate; Trident gum; Halls candy and Tang powdered beverages.
We are proud members of the Standard and Poor’s 500, Nasdaq 100 and Dow Jones Sustainability Index. Our Common Stock trades on The Nasdaq Global Select Market under the symbol “MDLZ.” We have been incorporated in the Commonwealth of Virginia since 2000.
Strategy
We intend to leverage our core strengths, including our advantaged geographic footprint, market leadership positions and portfolio of iconic brands and innovation platforms, to grow our people, grow our business and grow our impact.
| • | Grow our People: We strive to inspire our people to engage in challenging and rewarding career experiences and to contribute their talent to create a great place to work. We collaborate globally, scale ideas quickly and develop world-class capabilities. Our culture is fast-moving, bold, innovative and accountable, reflecting the traits and skills necessary to thrive in a competitive global marketplace. To support and build on the success of our people in a continually-evolving business environment, we invest in our people and their development, foster respect for one another, celebrate diversity and commit to authenticity at every level. We also work to create an environment in which our people can demonstrate innovative and courageous leadership to make a difference in every role they play in the Company. As reflected in our actions and our investments in our people, we value their contributions and celebrate their success. |
| • | Grow our Business: We aim to deliver strong, profitable long-term growth by accelerating our core snacks business and expanding the reach of our Power Brands globally. Leveraging our Power Brands (including Oreo, LU and belVita biscuits; Milka, Cadbury Dairy Milk and Toblerone chocolate; Trident gum and Halls candy) and our innovation platforms, we plan to innovate boldly and connect with our consumers wherever they are. As consumers seek out foods that have better well-being credentials, we are actively evolving our portfolio by expanding the well-being brands in our portfolio, enhancing the nutrition and ingredient profile of our Power Brands and inspiring consumers to snack mindfully by providing more portion control treats. We plan to reach consumers in new markets around the world, using both traditional and digital channels. While we already have a strong presence in modern grocery stores, we are increasing our presence in higher growth non-grocery channels, including e-commerce. To fuel these investments, we have been working to optimize our cost structure. These efforts include reinventing our supply chain, including adding and upgrading to more efficient production lines, while reducing the complexity of our product offerings, ingredients and number of suppliers. We also continue to aggressively manage our overhead costs. We have embedded zero-based budgeting practices across the organization to identify potential areas of cost reductions and capture and sustain savings within our ongoing operating budgets. Through these actions, we are leveraging our brands, platforms and capabilities to drive long-term value and return on investment for our shareholders. |
| • | Grow our Impact: We are focused on helping people snack in balance and enjoy life with products that are safely and sustainably sourced, produced and delivered. We are committed to driving business growth while making positive change in the world. We use our global scale and focus where we can have the greatest impact on people and planet - including communities, safety, sustainability and well-being snacks. This includes reducing our environmental footprint, empowering farmers in our supply chain and supporting the communities where our snacks are sourced, produced and sold. |
2
Table of Contents
Reportable Segments
Our operations and management structure are organized into four reportable operating segments:
| • | Latin America |
| • | Asia, Middle East, and Africa (“AMEA”) |
| • | Europe |
| • | North America |
On October 1, 2016, we integrated our Eastern Europe, Middle East, and Africa (“EEMEA”) operating segment into our Europe and Asia Pacific operating segments to further leverage and optimize the operating scale built within the Europe and Asia Pacific regions. Russia, Ukraine, Turkey, Belarus, Georgia and Kazakhstan were combined within our Europe region, while the remaining Middle East and African countries were combined within our Asia Pacific region to form the AMEA operating segment. We have reflected the segment change as if it had occurred in all periods presented.
We manage our operations by region to leverage regional operating scale, manage different and changing business environments more effectively and pursue growth opportunities as they arise in our key markets. Our regional management teams have responsibility for the business, product categories and financial results in the regions.
We use segment operating income to evaluate segment performance and allocate resources. We believe it is appropriate to disclose this measure to help investors analyze segment performance and trends. For a definition and reconciliation of segment operating income to consolidated pre-tax earnings as well as other information on our segments, see Note 16, Segment Reporting.
Our segment net revenues for each of the last three years were:
| For the Years Ended December 31, | ||||||||||||
| 2017 | 2016 | 2015 | ||||||||||
| (in millions) | ||||||||||||
| Net revenues: |
||||||||||||
| Latin America |
$ | 3,566 | $ | 3,392 | $ | 4,988 | ||||||
| AMEA |
5,739 | 5,816 | 6,002 | |||||||||
| Europe |
9,794 | 9,755 | 11,672 | |||||||||
| North America |
6,797 | 6,960 | 6,974 | |||||||||
|
|
|
|
|
|
|
|||||||
| $ | 25,896 | $ | 25,923 | $ | 29,636 | |||||||
|
|
|
|
|
|
|
|||||||
Our segment operating income for each of the last three years was:
| For the Years Ended December 31, | ||||||||||||||||||||||||
| 2017 | 2016 | 2015 | ||||||||||||||||||||||
| (in millions) | ||||||||||||||||||||||||
| Segment operating income: |
||||||||||||||||||||||||
| Latin America |
$ | 565 | 14.5% | $ | 271 | 8.7% | $ | 485 | 14.6% | |||||||||||||||
| AMEA |
516 | 13.3% | 506 | 16.2% | 389 | 11.7% | ||||||||||||||||||
| Europe |
1,680 | 43.3% | 1,267 | 40.6% | 1,350 | 40.5% | ||||||||||||||||||
| North America |
1,120 | 28.9% | 1,078 | 34.5% | 1,105 | 33.2% | ||||||||||||||||||
|
|
|
|
|
|
|
|
|
|
|
|
|
|||||||||||||
| $ | 3,881 | 100.0% | $ | 3,122 | 100.0% | $ | 3,329 | 100.0% | ||||||||||||||||
|
|
|
|
|
|
|
|
|
|
|
|
|
|||||||||||||
The deconsolidation of our global coffee business in 2015, the deconsolidation of our Venezuela operations beginning with our 2016 results, currency and other items significantly affect the comparability of our consolidated and segment operating results from year to year. Please see Management’s Discussion and Analysis of Financial Condition and Results of Operations for a review of our operating results.
Our brands span five product categories:
| • | Biscuits (including cookies, crackers and salted snacks) |
| • | Chocolate |
| • | Gum & candy |
| • | Beverages (including coffee through July 2, 2015 and powdered beverages) |
| • | Cheese & grocery |
3
Table of Contents
During 2017, our segments contributed to our net revenues in the following product categories:
| Percentage of 2017 Net Revenues by Product Category | ||||||||||||||||||||||||
| Gum & | Cheese & | |||||||||||||||||||||||
| Segment |
Biscuits | Chocolate | Candy | Beverages | Grocery | Total | ||||||||||||||||||
| Latin America |
3.0% | 3.4% | 3.5% | 2.6% | 1.3% | 13.8% | ||||||||||||||||||
| AMEA |
6.3% | 7.8% | 3.5% | 2.2% | 2.3% | 22.1% | ||||||||||||||||||
| Europe |
11.1% | 19.0% | 3.0% | 0.5% | 4.2% | 37.8% | ||||||||||||||||||
| North America |
21.2% | 1.1% | 4.0% | – | – | 26.3% | ||||||||||||||||||
|
|
|
|
|
|
|
|
|
|
|
|
|
|||||||||||||
| 41.6% | 31.3% | 14.0% | 5.3% | 7.8% | 100.0% | |||||||||||||||||||
|
|
|
|
|
|
|
|
|
|
|
|
|
|||||||||||||
Within our product categories, the classes of products that contributed 10% or more to consolidated net revenues were:
| For the Years Ended December 31, | ||||||||||||||||||||
| 2017 | 2016 | 2015 | ||||||||||||||||||
| Biscuits - Cookies and crackers |
36% | 36% | 34% | |||||||||||||||||
| Chocolate - Tablets, bars and other |
31% | 30% | 27% | |||||||||||||||||
Significant Divestitures and Acquisitions
For information on our significant divestitures and acquisitions, please refer to Note 2, Divestitures and Acquisitions, and specifically, in connection with our global coffee business deconsolidation, see the discussions under JDE Coffee Business Transactions and Keurig Transaction.
Customers
No single customer accounted for 10% or more of our net revenues from continuing operations in 2017. Our five largest customers accounted for 15.6% and our ten largest customers accounted for 21.4% of net revenues from continuing operations in 2017.
Seasonality
Demand for our products is generally balanced over the first three quarters of the year and increases in the fourth quarter primarily because of holidays and other seasonal events. Depending on when Easter falls, Easter holiday sales may shift between the first and second quarter. We build inventory based on expected demand and typically fill customer orders within a few days of receipt so the backlog of unfilled orders is not material. Funding for working capital items, including inventory and receivables, is normally sourced from operating cash flows and short-term commercial paper borrowings. For additional information on our liquidity, working capital management, cash flow and financing activities, see Liquidity and Capital Resources, Note 1, Summary of Significant Accounting Policies, and Note 7, Debt and Borrowing Arrangements, appearing later in this 10-K filing.
Competition
We face competition in all aspects of our business. Competitors include large multinational as well as numerous local and regional companies. Some competitors have different profit objectives and investment time horizons than we do and therefore approach pricing and promotional decisions differently. We compete based on product quality, brand recognition and loyalty, service, product innovation, taste, convenience, nutritional value, the ability to identify and satisfy consumer preferences, effectiveness of sales and marketing, routes to market and distribution networks, promotional activity and price. Improving our market position or introducing a new product requires substantial research, development, advertising and promotional expenditures. We believe these investments lead to better products for the consumer and support our growth and market position.
4
Table of Contents
Distribution and Marketing
Across our segments, we generally sell our products to supermarket chains, wholesalers, supercenters, club stores, mass merchandisers, distributors, convenience stores, gasoline stations, drug stores, value stores and other retail food outlets. We distribute our products through direct store delivery, company-owned and satellite warehouses, distribution centers and other facilities. We use the services of independent sales offices and agents in some of our international locations.
Consumers are also increasingly shopping online. And we are building a global e-commerce organization and capabilities to pursue online growth with partners in key markets around the world, including both pure e-tailers and brick-and-mortar retailers. We continue to invest in both talent and capabilities. Our e-commerce channel strategies will play a critical role in our ambition to be the best snacking company in the world.
We conduct marketing efforts through three principal sets of activities: (i) consumer marketing and advertising including on-air, print, outdoor, digital and social media and other product promotions; (ii) consumer sales incentives such as coupons and rebates; and (iii) trade promotions to support price features, displays and other merchandising of our products by our customers.
Raw Materials and Packaging
We purchase and use large quantities of commodities, including cocoa, dairy, wheat, palm and other vegetable oils, sugar and other sweeteners, flavoring agents and nuts. In addition, we purchase and use significant quantities of packaging materials to package our products and natural gas, fuels and electricity for our factories and warehouses. We monitor worldwide supply, commodity cost and currency trends so we can cost-effectively secure ingredients, packaging and fuel required for production.
A number of external factors such as weather conditions, commodity market conditions, currency fluctuations and the effects of governmental agricultural or other programs affect the cost and availability of raw materials and agricultural materials used in our products. We address higher commodity costs and currency impacts primarily through hedging, higher pricing and manufacturing and overhead cost control. We use hedging techniques to limit the impact of fluctuations in the cost of our principal raw materials; however, we may not be able to fully hedge against commodity cost changes, and our hedging strategies may not protect us from increases in specific raw material costs.
While the costs of our principal raw materials fluctuate, we believe there will continue to be an adequate supply of the raw materials we use and that they will generally remain available from numerous sources. For additional information on our commodity costs, refer to the Commodity Trends section within Management’s Discussion and Analysis of Financial Condition and Results of Operations.
Intellectual Property
Our intellectual property rights (including trademarks, patents, copyrights, registered designs, proprietary trade secrets, technology and know-how) are material to our business.
We own numerous trademarks and patents in many countries around the world. Depending on the country, trademarks remain valid for as long as they are in use or their registration status is maintained. Trademark registrations generally are for renewable, fixed terms. We also have patents for a number of current and potential products. Our patents cover inventions ranging from basic packaging techniques to processes relating to specific products and to the products themselves. Our issued patents extend for varying periods according to the date of patent application filing or grant and the legal term of patents in the various countries where patent protection is obtained. The actual protection afforded by a patent, which can vary from country to country, depends upon the type of patent, the scope of its coverage as determined by the patent office or courts in the country, and the availability of legal remedies in the country. While our patent portfolio is material to our business, the loss of one patent or a group of related patents would not have a material adverse effect on our business.
5
Table of Contents
From time to time, we grant third parties licenses to use one or more of our trademarks, patents and/or proprietary trade secrets in connection with the manufacture, sale or distribution of third party products. Similarly, we sell some products under brands, patents and/or proprietary trade secrets we license from third parties. In our agreement with Kraft Foods Group, Inc. (“Kraft Foods Group,” which is now part of The Kraft Heinz Company), we each granted the other party various licenses to use certain of our and their respective intellectual property rights in named jurisdictions following the spin-off of our North American grocery business.
Research and Development
We pursue four objectives in research and development: product safety and quality, growth through new products, superior consumer satisfaction and reduced costs. Our innovation efforts focus on anticipating consumer demands and adapting quickly to changing market trends. Wellness products and healthy snacking are a significant focus of our current research and development initiatives. These initiatives aim to accelerate our growth and margins by addressing consumer needs and market trends and leveraging our global innovation platforms, Power Brands and breakthrough technologies. In September 2016, we announced our plan to invest $65 million over 2017-2018 to build out and modernize our network of global research and development facilities. We are focusing our technical resources at nine large locations to drive global growth and innovation. We celebrated the official opening of our Wroclaw Poland Technical Center in 2017. Our global Technical Centers will enable greater effectiveness, improved efficiency and accelerated project delivery. These locations are in Curitiba, Brazil; Suzhou, China; Thane, India; Mexico City, Mexico; East Hanover, New Jersey; Wroclaw, Poland; Jurong, Singapore; Bournville, United Kingdom and Reading, United Kingdom.
At December 31, 2017, we had approximately 2,450 scientists and engineers, of which 1,900 are primarily focused on research and development and the remainder are primarily focused on quality assurance and regulatory affairs. Our research and development expense was $366 million in 2017, $376 million in 2016 and $409 million in 2015.
Regulation
Our food products and ingredients are subject to local, national and multinational regulations related to labeling, health and nutrition claims, packaging, pricing, marketing and advertising, privacy and related areas. In addition, various jurisdictions regulate our operations by licensing and inspecting our manufacturing plants and facilities, enforcing standards for select food products, grading food products, and regulating trade practices related to the sale and pricing of our food products. Many of the food commodities we use in our operations are subject to government agricultural policy and intervention, and the scrutiny of human rights issues in industry supply chains has led to developing regulation in many countries. These policies have substantial effects on prices and supplies and are subject to periodic governmental and administrative review.
Examples of laws and regulations that affect our business include selective food taxes, labeling requirements such as front-of-pack labeling and nutrient profiling, marketing restrictions, potential withdrawal of trade concessions as dispute settlement retaliation and sanctions on sales or sourcing of raw materials. We will continue to monitor developments in laws and regulations. At this time, we do not expect the cost of complying with new laws and regulations will be material. Also refer to Note 1, Summary of Significant Accounting Policies – Currency Translation and Highly Inflationary Accounting, for additional information on government regulations and currency-related impacts on our operations in the United Kingdom, Argentina and other countries.
Environmental Regulation
Throughout the countries in which we do business, we are subject to local, national and multinational environmental laws and regulations relating to the protection of the environment. We have programs across our business units designed to meet applicable environmental compliance requirements. In the United States, the laws and regulations include the Clean Air Act, the Clean Water Act, the Resource Conservation and Recovery Act and the Comprehensive Environmental Response, Compensation, and Liability Act. Based on information currently available, we believe that our compliance with environmental laws and regulations will not have a material effect on our financial results.
6
Table of Contents
Sustainability
A key strategic goal for us is to Grow our Impact. Building positive impact for people and our planet is at the core of who we are. We call our commitment to drive business growth with positive change in the world Impact For Growth. Many of the challenges facing people and the planet are interrelated. Our core programs and initiatives holistically address both by working to reduce our environmental footprint, empower farmers and support the communities where our snacks are sourced. We continue to leverage our global operating scale to secure sustainable raw materials and work with suppliers to drive meaningful social and environmental changes, focusing on where we can make the most impact. For example, we launched our Cocoa Life program in 2012 and will continue to invest up to $400 million through 2022 to build a sustainable cocoa supply. We are also improving sustainability in our wheat supply by working with farmers in North America and through our Harmony program in Europe.
Our 2020 sustainability goals aim to place us at the forefront in the fight against climate change with ambitious targets for an end-to-end approach to reduce our carbon footprint, including reducing our absolute CO2 emissions from manufacturing and addressing deforestation in key raw material supply chains. We are working to cut our absolute water footprint in manufacturing, focusing on priority sites where water is most scarce. We are also working to reduce waste in manufacturing and packaging.
We have been recognized for our ongoing economic, environmental and social contributions. This year we were again listed on the Dow Jones Sustainability Index (“DJSI”) – World and North American Indices. The DJSI selects the top 10% of global companies and top 20% of North American companies based on an extensive review of financial and sustainability programs within each industry. We are at the 92nd percentile of our industry and achieved perfect scores in health and nutrition and environmental reporting.
We also participate in the CDP Climate and Water disclosures and continue to work to reduce our carbon and water footprints. We are committed to continue this and other related work in the areas of sustainable resources and agriculture, well-being snacks, community partnerships and safety of our products and people.
Employees
We employed through our consolidated subsidiaries approximately 83,000 people worldwide at December 31, 2017 and approximately 90,000 at December 31, 2016. Employees represented by labor unions or workers’ councils represent approximately 64% of our 71,000 employees outside the United States and approximately 28% of our 12,000 U.S. employees. Our business units are subject to various local, national and multinational laws and regulations relating to their relationships with their employees. In accordance with European Union requirements, we also have established a European Workers Council composed of management and elected members of our workforce. We or our subsidiaries are a party to numerous collective bargaining agreements and we work to renegotiate these collective bargaining agreements on satisfactory terms when they expire.
International Operations
Based on where we sell our products, we generated 75.8% of our 2017 net revenues, 75.6% of our 2016 net revenues and 78.7% of our 2015 net revenues from continuing operations outside the United States. We sell our products to consumers in approximately 160 countries. At December 31, 2017, we had operations in more than 80 countries and made our products at approximately 140 manufacturing and processing facilities in 51 countries. Refer to Note 16, Segment Reporting, for additional information on our U.S. and non-U.S. operations. Refer to Item 2, Properties, for more information on our manufacturing and other facilities. Also, for a discussion of risks related to our operations outside the United States, see Item 1A, Risk Factors.
7
Table of Contents
Executive Officers of the Registrant
The following are our executive officers as of February 9, 2018:
| Name |
Age |
Title |
||||
| Dirk Van de Put | 57 | Chief Executive Officer | ||||
| Brian T. Gladden | 52 | Executive Vice President and Chief Financial Officer | ||||
| Maurizio Brusadelli | 49 | Executive Vice President and President, Asia, Middle East and Africa | ||||
| Timothy P. Cofer | 49 | Executive Vice President and Chief Growth Officer | ||||
| Robin S. Hargrove | 52 | Executive Vice President, Research, Development, Quality and Innovation | ||||
| Alejandro R. Lorenzo | 46 | Executive Vice President and President, Latin America | ||||
| Karen J. May | 59 | Executive Vice President, Human Resources | ||||
| Daniel P. Myers | 62 | Executive Vice President, Integrated Supply Chain | ||||
| Gerhard W. Pleuhs | 61 | Executive Vice President and General Counsel | ||||
| Henry Glendon (Glen) Walter IV | 49 | Executive Vice President and President, North America | ||||
| Hubert Weber | 55 | Executive Vice President and President, Europe | ||||
Mr. Van de Put became Chief Executive Officer and a director in November 2017. He formerly served as President and Chief Executive Officer of McCain Foods Limited, a multinational frozen food provider, from July 2011 to November 2017 and as its Chief Operating Officer from May 2010 to July 2011. Mr. Van de Put served as President and Chief Executive Officer, Global Over-the-Counter, Consumer Health Division of Novartis AG, a global healthcare company, from 2009 to 2010. Prior to that, he worked for 24 years in a variety of leadership positions for several global food and beverage providers, including Danone SA, The Coca-Cola Company and Mars, Incorporated.
Mr. Gladden became Executive Vice President and Chief Financial Officer in December 2014. He joined Mondelēz International in October 2014. Prior to that, he served as Senior Vice President and Chief Financial Officer of Dell Inc., a provider of technology products and services, from June 2008 to February 2014, and as President and Chief Executive Officer of SABIC Innovative Plastics, a manufacturer of industrial plastics, from August 2007 to May 2008. Mr. Gladden spent 19 years at the General Electric Company, a multinational conglomerate, in a variety of key leadership positions, including Vice President and General Manager, Resin Business and Chief Financial Officer, GE Plastics.
Mr. Brusadelli became Executive Vice President and President, Asia Pacific in January 2016 and Executive Vice President and President, Asia, Middle East and Africa in October 2016. He previously served as President Biscuits Business, South East Asia, Japan and Sales Asia Pacific from September 2015 to December 2015, President Markets and Sales Asia Pacific from September 2014 to September 2015 and President United Kingdom and Ireland from September 2012 to August 2014. Prior to that, Mr. Brusadelli held various positions of increasing responsibility. Mr. Brusadelli joined Mondelēz International in 1993.
Mr. Cofer became Executive Vice President and Chief Growth Officer in January 2016 and served as Interim President, North America from April to November 2017. Mr. Cofer served as Executive Vice President and President, Asia Pacific and EEMEA from September 2013 to December 2015 and Executive Vice President and President, Europe from August 2011 to September 2013. Prior to that, Mr. Cofer held various positions of increasing responsibility. Mr. Cofer joined Mondelēz International in 1992.
Mr. Hargrove became Executive Vice President, Research, Development, Quality and Innovation in April 2015. Prior to that, he served as Senior Vice President, Research, Development & Quality for Mondelēz Europe from January 2013 to March 2015. Before joining Mondelēz International, Mr. Hargrove worked at PepsiCo, Inc., a global food and beverage company, for 19 years in a variety of leadership positions, most recently as Senior Vice President, Research and Development, Europe from December 2006 to December 2012.
Mr. Lorenzo became Executive Vice President and President, Latin America in January 2017. Prior to that, he served as President, Global Biscuits Category from January 2015 to December 2016 and President, Brazil from September 2012 to December 2014. Prior to that, Mr. Lorenzo held various positions of increasing responsibility. Mr. Lorenzo joined Mondelēz International in 2003.
8
Table of Contents
Ms. May became Executive Vice President, Human Resources in October 2005. Prior to that, she was Corporate Vice President, Human Resources for Baxter International Inc., a healthcare company, from February 2001 to September 2005.
Mr. Myers became Executive Vice President, Integrated Supply Chain in September 2011. Prior to that, he worked for Procter & Gamble, a consumer products company, for 33 years in a variety of leadership positions, most recently serving as Vice President, Product Supply for P&G’s Global Hair Care business from September 2007 to August 2011.
Mr. Pleuhs became Executive Vice President and General Counsel in April 2012. In this role, Mr. Pleuhs oversees the legal, compliance, security, corporate and governance affairs functions within Mondelēz International. He has served in various positions of increasing responsibility since joining Mondelēz International in 1990. Mr. Pleuhs has a law degree from the University of Kiel, Germany and is licensed to practice law in Germany and admitted as house counsel in Illinois.
Mr. Walter became Executive Vice President and President, North America in November 2017. Before joining Mondelēz International, Mr. Walter worked at The Coca-Cola Company, a global beverage company, in a variety of leadership positions, most recently as Chief Executive Officer of Coca-Cola Industries China from February 2014 to October 2017 and President and Chief Operating Officer of Cola-Cola Refreshments in North America from January 2013 to February 2014.
Mr. Weber became Executive Vice President and President Europe in September 2013. He served as President of the European and Global Coffee category from September 2010 to September 2013. Prior to that, Mr. Weber held various positions of increasing responsibility. He joined Mondelēz International in 1988.
Ethics and Governance
We adopted the Mondelēz International Code of Conduct, which qualifies as a code of ethics under Item 406 of Regulation S-K. The code applies to all of our employees, including our principal executive officer, principal financial officer, principal accounting officer or controller, and persons performing similar functions. Our code of ethics is available free of charge on our web site at www.mondelezinternational.com and will be provided free of charge to any shareholder submitting a written request to: Corporate Secretary, Mondelēz International, Inc., Three Parkway North, Deerfield, IL 60015. We will disclose any waiver we grant to an executive officer or director under our code of ethics, or certain amendments to the code of ethics, on our web site at www.mondelezinternational.com.
In addition, we adopted Corporate Governance Guidelines, charters for each of the Board’s four standing committees and the Code of Business Conduct and Ethics for Non-Employee Directors. All of these materials are available on our web site at www.mondelezinternational.com and will be provided free of charge to any shareholder requesting a copy by writing to: Corporate Secretary, Mondelēz International, Inc., Three Parkway North, Deerfield, IL 60015.
Available Information
Our Internet address is www.mondelezinternational.com. Our Annual Reports on Form 10-K, Quarterly Reports on Form 10-Q, Current Reports on Form 8-K and amendments to those reports filed or furnished pursuant to Section 13(a) or 15(d) of the Securities Exchange Act of 1934, as amended (the “Exchange Act”), are available free of charge as soon as possible after we electronically file them with, or furnish them to, the U.S. Securities and Exchange Commission (the “SEC”). You can access our filings with the SEC by visiting www.mondelezinternational.com. The information on our web site is not, and shall not be deemed to be, a part of this Annual Report on Form 10-K or incorporated into any other filings we make with the SEC.
You should read the following risk factors carefully when evaluating our business and the forward-looking information contained in this Annual Report on Form 10-K. Any of the following risks could materially and adversely affect our business, operating results, financial condition and the actual outcome of matters described in this Annual Report on Form 10-K. While we believe we have identified and discussed below the key risk factors affecting our business, there may be additional risks and uncertainties that we do not presently know or that we do not currently believe to be significant that may adversely affect our business, performance or financial condition in the future.
9
Table of Contents
We operate in a highly competitive industry.
The food and snacking industry is highly competitive. Our principal competitors include major international food, snack and beverage companies that operate in multiple geographic areas and numerous local and regional companies. If we do not effectively respond to challenges from our competitors, our business could be adversely affected.
Competitor and customer pressures may require that we reduce our prices. These pressures may also restrict our ability to increase prices in response to commodity and other cost increases. Failure to effectively and timely assess, change and set proper pricing or effective trade incentives may negatively impact our operating results and achievement of our strategic and financial goals. The rapid emergence of new distribution channels, such as e-commerce, may create consumer price deflation, affecting our retail customer relationships and presenting additional challenges to increasing prices in response to commodity or other cost increases. We may need to increase or reallocate spending on marketing, advertising, new product innovation, and existing and new distribution channels to protect or increase market share. These expenditures might not result in trade and consumer acceptance of our efforts. If we reduce prices or our costs increase but we cannot increase sales volumes to offset those changes, then our financial condition and results of operations will suffer.
In addition, like other companies in our industry, we are under pressure to continue to improve the efficiency of our overall cost structure. We are pursuing a transformation agenda with the goals of focusing our portfolio, improving our cost structure and operating model, and accelerating our growth. If we do not achieve these objectives or do not implement transformation in a way that minimizes disruptions to our business, our financial condition and results of operations could be materially and adversely affected.
Maintaining and enhancing our reputation and brand image is essential to our business success.
Our success depends on our ability to maintain and enhance our brand quality and image, extend our brands into new geographies and to new distribution platforms, including e-commerce, and expand our brand image with new and renewed product offerings.
We seek to enhance our brand image through product renovation, innovation and marketing investments, including advertising and consumer promotions. Failure to effectively address the continuing global focus on well-being, changing consumer perceptions of certain ingredients, nutritional expectations of our products, and increased attention from the media, shareholders, activists and other stakeholders on the role of food marketing could adversely affect our brand image. Undue caution or inaction on our part in addressing these challenges and trends could weaken our competitive position. Such pressures could also lead to stricter regulations and increased focus on food and snacking marketing practices. Increased legal or regulatory restrictions on our advertising, consumer promotions and labeling, or our response to those restrictions, could limit our efforts to maintain, extend and expand our brands. Moreover, adverse publicity or regulatory or legal action against us on product quality and safety, where we manufacture our products, or environmental risks or human and workplace rights across our supply chain could damage our reputation and brand image. Such actions could undermine our customers’ confidence and reduce demand for our products, even if the regulatory or legal action is unfounded or these matters are immaterial to our operations. Our product sponsorship relationships could also subject us to negative publicity.
In addition, our success in maintaining and enhancing our brand image depends on our ability to anticipate change and adapt to a rapidly changing marketing and media environment, including our increasing reliance on social media and online dissemination of marketing and advertising campaigns. A variety of legal and regulatory restrictions limit how and to whom we market our products. These restrictions may limit our brand renovation, innovation and promotion plans, particularly as social media and the communications environment continue to evolve. Negative posts or comments about us or our brands on social media or web sites (whether factual or not) or security breaches related to use of our social media and failure to respond effectively to these posts, comments or activities could seriously damage our reputation and brand image across the various regions in which we operate. In addition, we might fail to invest sufficiently in maintaining, extending and expanding our brands, our marketing efforts might not achieve desired results and we might be required to recognize impairment charges on our brands or related intangible assets or goodwill. Furthermore, third parties may sell counterfeit or spurious versions of our products that are inferior or pose safety risks. If consumers confuse these counterfeit products for our products or have a bad experience with the counterfeit brand, they might refrain from purchasing our brands in the future, which could harm our brand image and sales. If we do not successfully maintain and enhance our reputation and brand image, then our brands, product sales, financial condition and results of operations could be materially and adversely affected.
10
Table of Contents
We are subject to risks from operating globally.
We are a global company and generated 75.8% of our 2017 net revenues, 75.6% of our 2016 net revenues and 78.7% of our 2015 net revenues outside the United States. We manufacture and market our products in approximately 160 countries and have operations in more than 80 countries. Therefore, we are subject to risks inherent in global operations. Those risks include:
| • | compliance with U.S. laws affecting operations outside of the United States, including anti-bribery laws such as the Foreign Corrupt Practices Act (“FCPA”); |
| • | compliance with antitrust and competition laws, trade laws, data privacy laws, anti-bribery laws, and a variety of other local, national and multinational regulations and laws in multiple regimes; |
| • | currency devaluations or fluctuations in currency values, including in developing markets such as Argentina, Brazil, China, Mexico, Russia, Turkey, Egypt, Nigeria, Ukraine and South Africa as well as in developed markets such as the United Kingdom and other countries within the European Union; |
| • | the imposition of increased or new tariffs, quotas, trade barriers or similar restrictions on our sales or key commodities like cocoa, potential changes in U.S. trade programs and trade relations with other countries, or regulations, taxes or policies that might negatively affect our sales; |
| • | changes in capital controls, including currency exchange controls, government currency policies such as demonetization in India or other limits on our ability to import raw materials or finished product into various countries or repatriate cash from outside the United States; |
| • | increased sovereign risk, such as default by or deterioration in the economies and credit ratings of governments, particularly in our Latin America and AMEA regions; |
| • | changes in local regulations and laws, the uncertainty of enforcement of remedies in non-U.S. jurisdictions, and foreign ownership restrictions and the potential for nationalization or expropriation of property or other resources; |
| • | varying abilities to enforce intellectual property and contractual rights; |
| • | discriminatory or conflicting fiscal policies; |
| • | greater risk of uncollectible accounts and longer collection cycles; and |
| • | design, implementation and use of effective control environment processes across our diverse operations and employee base. |
In addition, political and economic changes or volatility, geopolitical regional conflicts, terrorist activity, political unrest, civil strife, acts of war, travel or immigration restrictions, public corruption, expropriation and other economic or political uncertainties could interrupt and negatively affect our business operations or customer demand. High unemployment or the slowdown in economic growth in some markets could constrain consumer spending. Declining consumer purchasing power could result in loss of market share and adversely impact our profitability. Continued instability in the banking and governmental sectors of certain countries or the dynamics and uncertainties associated with the United Kingdom’s planned exit from the European Union (“Brexit”), including currency exchange rate fluctuations and volatility in global stock markets, could have a negative effect on our business. All of these factors could result in increased costs or decreased revenues, and could materially and adversely affect our product sales, financial condition, results of operations, and our relationships with customers, suppliers and employees in the short or long term.
Tax matters, including changes in tax laws and rates, disagreements with taxing authorities and imposition of new taxes, could adversely impact our results of operations and financial condition.
In December 2017, the United States enacted tax reform legislation (“U.S. tax reform”). The legislation implements many new U.S. domestic and international tax provisions. Many aspects of the U.S. tax reform are unclear, and although additional clarifying guidance is expected to be issued in the future (by the Internal Revenue Service (“IRS”), the U.S. Treasury Department or via a technical correction law change), it may not be clarified for some time. In addition, many U.S. states have not yet updated their laws to take into account the new federal legislation. As a result, we have not yet been able to determine the full impact of the new laws on our results of operations and financial condition. It is possible that U.S. tax reform, or interpretations under it, could change and could have an adverse effect on us, and such effect could be material.
11
Table of Contents
In addition, foreign jurisdictions may also enact tax legislation that could significantly affect our ongoing operations. For example, foreign tax authorities could impose rate changes along with additional corporate tax provisions that would disallow or tax perceived base erosion or profit shifting. Aspects of U.S. tax reform may lead foreign jurisdictions to respond by enacting additional tax legislation that is unfavorable to us.
Adverse changes in the underlying profitability or financial outlook of our operations in several jurisdictions could lead to changes in the realizability of our deferred tax assets and result in a charge to our income tax provision. Additionally, changes in tax laws in the U.S. or in other countries where we have significant operations could materially affect deferred tax assets and liabilities and our income tax provision.
We are also subject to tax audits by governmental authorities. Although we believe our tax estimates are reasonable, if a taxing authority disagrees with the positions we have taken, we could face additional tax liabilities, including interest and penalties. Unexpected results from one or more such tax audits could significantly adversely affect our income tax provision and our results of operations.
Our operations in certain emerging markets expose us to political, economic and regulatory risks.
Our growth strategy depends in part on our ability to expand our operations in emerging markets, including among others Brazil, China, India, Mexico, Russia, Argentina, Ukraine, the Middle East, Africa and Southeast Asia. However, some emerging markets have greater political, economic and currency volatility and greater vulnerability to infrastructure and labor disruptions than more established markets. In many countries, particularly those with emerging economies, engaging in business practices prohibited by laws and regulations with extraterritorial reach, such as the FCPA and the U.K. Bribery Act, or local anti-bribery laws may be more common. These laws generally prohibit companies and their employees, contractors or agents from making improper payments to government officials, including in connection with obtaining permits or engaging in other actions necessary to do business. Failure to comply with these laws could subject us to civil and criminal penalties that could materially and adversely affect our reputation, financial condition and results of operations.
In addition, competition in emerging markets is increasing as our competitors grow their global operations and low cost local manufacturers improve and expand their production capacities. Our success in emerging markets is critical to achieving our growth strategy. If we cannot successfully increase our business in emerging markets and manage associated political, economic and regulatory risks, our product sales, financial condition and results of operations could be adversely affected, such as occurred when we deconsolidated and changed to the cost method of accounting for our Venezuelan operations at the close of 2015 or any potential impact on our business in Venezuela from future economic or political developments.
Our use of information technology and third party service providers exposes us to cybersecurity breaches and other business disruptions that could adversely affect us.
We use information technology and third party service providers to support our global business processes and activities, including supporting critical business operations; communicating with our suppliers, customers and employees; maintaining effective accounting processes and financial and disclosure controls; engaging in mergers and acquisitions and other corporate transactions; conducting research and development activities; meeting regulatory, legal and tax requirements; and executing various digital marketing and consumer promotion activities. Global shared service centers managed by third parties provide an increasing amount of services to conduct our business, including a number of accounting, internal control, human resources and computing functions.
12
Table of Contents
Continuity of business applications and services has been, and may in the future be, disrupted by events such as infection by viruses or malware, like the global malware incident in June 2017 that affected a significant portion of our global sales, distribution and financial networks (the “malware incident”) (see Management’s Discussion and Analysis of Financial Condition and Results of Operations – Malware Incident); other cybersecurity attacks; issues with or errors in systems’ maintenance or security; migration of applications to the cloud; power outages; hardware or software failures; denial of service; telecommunication failures; natural disasters; terrorist attacks; and other catastrophic occurrences. Further, cybersecurity breaches of our or third party systems, whether from circumvention of security systems, denial-of-service attacks or other cyberattacks, hacking, phishing attacks, computer viruses, ransomware or malware, employee or insider error, malfeasance, social engineering, physical breaches or other actions may cause confidential information belonging to us or our employees, customers, consumers, partners, suppliers, or governmental or regulatory authorities to be misused or breached. When risks such as these materialize, the need for us to coordinate with various third party service providers and for third party service providers to coordinate amongst themselves might make it more challenging to resolve the related issues. Additionally, if new initiatives, such as those related to e-commerce and direct sales, increase the amount of confidential information that we process and maintain, this could increase our potential exposure to a cybersecurity breach. If our controls, disaster recovery and business continuity plans or those of our third party providers do not effectively respond to or resolve the issues related to any such disruptions in a timely manner, our product sales, financial condition and results of operations may be materially and adversely affected, and we might experience delays in reporting our financial results, loss of intellectual property and damage to our reputation or brands.
We continue to devote focused resources to network security, backup and disaster recovery, enhanced training and other security measures to protect our systems and data; we are also in the process of enhancing the monitoring and detection of threats in our environment. However, security measures cannot provide absolute security or guarantee that we will be successful in preventing or responding to every breach or disruption on a timely basis. In addition, due to the constantly evolving nature of security threats, we cannot predict the form and impact of any future incident, and the cost and operational expense of implementing, maintaining and enhancing protective measures to guard against increasingly complex and sophisticated cyber threats could increase significantly.
We regularly move data across national borders to conduct our operations and consequently are subject to a variety of continuously evolving and developing laws and regulations in numerous jurisdictions regarding privacy, data protection and data security, including those related to the collection, storage, handling, use, disclosure, transfer and security of personal data. Privacy and data protection laws may be interpreted and applied differently from country to country and may create inconsistent or conflicting requirements. The European Union’s General Data Protection Regulation (“GDPR”), which greatly increases the jurisdictional reach of European Union law and becomes effective in May 2018, adds a broad array of requirements for handling personal data including the public disclosure of significant data breaches, and imposes substantial penalties for non-compliance of up to the greater of €20 million or 4% of global annual revenue for the preceding financial year. Our efforts to comply with GDPR and other privacy and data protection laws may impose significant costs and challenges that are likely to increase over time, and we could incur substantial penalties or litigation related to violation of existing or future data privacy laws and regulations.
Unanticipated business disruptions could adversely affect our ability to provide our products to our customers.
We manufacture and source products and materials on a global scale. We utilize an integrated supply chain – a complex network of suppliers and material needs, owned manufacturing locations, co-manufacturing locations, distribution networks, shared service delivery centers and information systems that support our ability to provide our products to our customers consistently. Factors that are hard to predict or beyond our control, like weather (including any potential effects of climate change), natural disasters, supply and commodity shortages, fire, explosions, terrorism, political unrest, cybersecurity breaches, generalized labor unrest or health pandemics could damage or disrupt our operations or our suppliers’ or co-manufacturers’ operations. If we do not effectively respond to disruptions in our operations, for example, by finding alternative suppliers or replacing capacity at key or sole manufacturing or distribution locations, or cannot quickly repair damage to our information, production or supply systems, we may be late in delivering or unable to deliver products to our customers such as occurred in connection with the malware incident (see Management’s Discussion and Analysis of Financial Condition and Results of Operations – Malware Incident), and the quality and safety of our products might be negatively affected. If a material or extended disruption occurs, we may lose our customers’ or business partners’ confidence or suffer damage to our reputation, and long-term consumer demand for our products could decline. In addition, we might not have the functions, processes or organizational capability necessary to achieve on our anticipated timeframes our strategic ambition to reconfigure our supply chain and drive efficiencies to fuel growth. Further, our ability to supply
13
Table of Contents
multiple markets with a streamlined manufacturing footprint may be negatively impacted by portfolio complexity, significant changes in trade policies, changes in volume produced and changes to regulatory restrictions or labor-related constraints on our ability to adjust production capacity in the markets in which we operate. These events could materially and adversely affect our product sales, financial condition and results of operations.
We are subject to currency exchange rate fluctuations.
At December 31, 2017, we sold our products in approximately 160 countries and had operations in more than 80 countries. Consequently, a significant portion of our business is exposed to currency exchange rate fluctuations. Our financial results and capital ratios are sensitive to movements in currency exchange rates because a large portion of our assets, liabilities, revenue and expenses must be translated into U.S. dollars for reporting purposes or converted into U.S. dollars to service obligations such as our U.S. dollar-denominated indebtedness and to pay dividends to our shareholders. In addition, movements in currency exchange rates can affect transaction costs because we source product ingredients from various countries. We seek to mitigate our exposure to exchange rate fluctuations, primarily on cross-currency transactions, but our efforts may not be successful. Accordingly, changes in the currency exchange rates that we use to translate our results into U.S. dollars for financial reporting purposes or for transactions involving multiple currencies could materially and adversely affect our financial condition and results of operations.
Commodity and other input prices are volatile and may increase or decrease significantly or availability of commodities may become constrained.
We purchase and use large quantities of commodities, including cocoa, dairy, wheat, palm and other vegetable oils, sugar and other sweeteners, flavoring agents and nuts. In addition, we purchase and use significant quantities of packaging materials to package our products and natural gas, fuels and electricity for our factories and warehouses. Prices for these raw materials, other supplies and energy are volatile and can fluctuate due to conditions that are difficult to predict. These conditions include global competition for resources, currency fluctuations, political conditions, severe weather, the potential longer-term consequences of climate change on agricultural productivity, crop disease or pests, water risk, health pandemics, consumer or industrial demand, and changes in governmental trade, alternative energy and agricultural programs. Increasing focus on climate change, deforestation, water, plastic waste, animal welfare and human rights concerns and other risks associated with the global food system may lead to increased government intervention and consumer or activist responses, and could adversely affect our or our suppliers’ reputation and business and our ability to procure the materials we need to operate our business. Many of the commodities we purchase are grown by smallholder farmers, and they might lack the capacity to invest to increase productivity or adapt to changing conditions. Although we monitor our exposure to commodity prices and hedge against input price increases, we cannot fully hedge against changes in commodity costs, and our hedging strategies may not protect us from increases in specific raw material costs. Continued volatility in the prices of commodities and other supplies we purchase or changes in the types of commodities we purchase as we continue to evolve our product and packaging portfolio could increase or decrease the costs of our products, and our profitability could suffer as a result. Moreover, increases in the price of our products, including increases to cover higher input costs, may result in lower sales volumes, while decreases in input costs could require us to lower our prices and thereby affect our revenues, profits or margins. Likewise, constraints in the supply of key commodities may limit our ability to grow our net revenues and earnings. If our mitigation activities are not effective, if we are unable to price to cover increased costs or must reduce our prices, or if we are limited by supply constraints, our financial condition and results of operations could be materially adversely affected.
Complying with changes in and inconsistencies among laws and regulations in many countries in which we operate could increase our costs.
Our activities throughout the world are highly regulated and subject to government oversight. Various laws and regulations govern food production, packaging, storage, distribution, sales, advertising, labeling and marketing, as well as licensing, trade, labor, tax and environmental matters, and health and safety practices. Government authorities regularly change laws and regulations as well as their interpretations. Our compliance with new or revised laws and regulations or the interpretation and application of existing laws and regulations could materially and adversely affect our product sales, financial condition and results of operations. For instance, our financial condition and results of operations could be negatively affected by the regulatory and economic impact of changes in taxation and trade relations among the United States and other countries, including any changes to or repeal of the North American Free Trade Agreement, or changes in the European Union such as Brexit.
14
Table of Contents
We may be unable to hire or retain and develop key personnel or a highly skilled and diverse global workforce or manage changes in our workforce.
We must hire, retain and develop effective leaders and a highly skilled and diverse global workforce. We compete to hire new personnel with a variety of capabilities in the many countries in which we manufacture and market our products and then to develop and retain their skills and competencies. Unplanned turnover, failure to attract and develop personnel with key emerging capabilities such as e-commerce and digital marketing skills, or failure to develop adequate succession plans for leadership positions or to hire and retain a diverse global workforce with the skills and in the locations we need to operate and grow our business could deplete our institutional knowledge base and erode our competitiveness. Changes in immigration laws and policies could also make it more difficult for us to recruit or relocate skilled employees.
We also face increased personnel-related risks in connection with implementing the changes in our transformation agenda related to our operating model and business processes, including building a global shared services capability and reconfiguring our supply chain. These risks could lead to operational challenges, including increased competition for employees with the skills we require to achieve our business goals; higher employee turnover, including of employees with key capabilities; and challenges in developing the capabilities necessary to build and effectively execute a shared services function and transform our business processes. Furthermore, we might be unable to manage appropriately changes in, or that affect, our workforce or satisfy the legal requirements associated with how we manage and compensate our employees. This includes our management of employees represented by labor unions or workers’ councils, who represent approximately 64% of our 71,000 employees outside the United States and approximately 28% of our 12,000 U.S. employees. Strikes, work stoppages or other forms of labor unrest by our employees or those of our suppliers or distributors, or situations like the renegotiation of collective bargaining agreements that expired in February 2016 and that cover eight U.S. facilities, could cause disruptions to our supply chain, manufacturing or distribution processes.
These risks could materially and adversely affect our reputation, ability to meet the needs of our customers, product sales, financial condition and results of operations.
Our retail customers are consolidating and we must leverage our value proposition in order to compete against retailer and other economy brands.
Retail customers, such as supermarkets, warehouse clubs and food distributors in the European Union, the United States and other major markets, continue to consolidate, form buying alliances or be acquired by new entrants in the food retail market, resulting in fewer, larger customers. Large retail customers and customer alliances can delist our products or reduce the shelf space allotted to our products and demand lower pricing, increased promotional programs or longer payment terms. Retail customers might also adopt these tactics in their dealings with us in response to the significant growth in online retailing for consumer products, which is outpacing the growth of traditional retail channels. In addition, larger retail customers have the scale to develop supply chains that permit them to operate with reduced inventories or to develop and market their own retailer and other economy brands that compete with some of our products. Our products must provide higher quality or value to our consumers than the less expensive alternatives, particularly during periods of economic uncertainty. Consumers may not buy our products if consumers perceive little difference between the quality or value of our products and those of retailer or other economy brands. If consumers switch to purchasing or otherwise prefer the retailer or other economy brands, then we could lose market share or sales volumes, or we may need to shift our product mix to lower margin offerings.
Retail consolidation also increases the risk that adverse changes in our customers’ business operations or financial performance will have a corresponding material adverse effect on us. For example, if our customers cannot access sufficient funds or financing, then they may delay, decrease or cancel purchases of our products, or delay or fail to pay us for previous purchases.
If we do not effectively respond to retail consolidation, increasing retail power and competition from retailer and other economy brands, our reputation, brands, product sales, financial condition and results of operations could be materially and adversely affected.
15
Table of Contents
We are subject to changes in our relationships with significant customers or suppliers.
During 2017, our five largest customers accounted for 15.6% of our net revenues. There can be no assurance that our customers will continue to purchase our products in the same mix or quantities or on the same terms as in the past, particularly as increasingly powerful retailers continue to demand lower pricing and develop their own brands. The loss of or disruptions related to significant customers could result in a material reduction in sales or change in the mix of products we sell to a significant customer. This could materially and adversely affect our product sales, financial condition and results of operations.
Additionally, disputes with significant suppliers, including disputes related to pricing or performance, could adversely affect our ability to supply products to our customers or operate our business and could materially and adversely affect our product sales, financial condition and results of operations.
We may decide or be required to recall products or be subjected to product liability claims.
We could decide, or laws or regulations could require us, to recall products due to suspected or confirmed deliberate or unintentional product contamination including contamination of ingredients we use in our products that third parties supply, spoilage or other adulteration, product mislabeling or product tampering. In addition, if another company recalls or experiences negative publicity related to a product in a category in which we compete, consumers might reduce their overall consumption of products in this category. Any of these events could materially and adversely affect our reputation, brands, product sales, financial condition and results of operations.
We may also suffer losses if our products or operations or those of our suppliers violate applicable laws or regulations, or if our or our suppliers’ products cause injury, illness or death. In addition, our marketing could face claims of false or deceptive advertising or other criticism. A significant product liability or other legal judgment against us, a related regulatory enforcement action, a widespread product recall or attempts to manipulate us based on threats related to the safety of our products could materially and adversely affect our reputation and profitability. Moreover, even if a product liability, consumer fraud or other claim is unsuccessful, has no merit or is not pursued, the negative publicity surrounding assertions against our products or processes could materially and adversely affect our reputation, brands, product sales, product inventory, financial condition and results of operations.
We could be subject to legal or tax claims or other regulatory enforcement actions.
We are a large snack food company operating in highly regulated environments and constantly evolving legal, tax and regulatory frameworks around the world. Consequently, we are subject to greater risk of litigation, legal or tax claims, or other regulatory enforcement actions. There can be no assurance that our employees, contractors or agents will not violate policies and procedures we have implemented to promote compliance with existing laws and regulations. Moreover, a failure to maintain effective control environment processes, including in connection with the development of our global shared services capability, could lead to violations, unintentional or otherwise, of laws and regulations. Litigation, legal or tax claims, or regulatory enforcement actions arising out of our failure or alleged failure to comply with applicable laws, regulations or controls, could subject us to civil and criminal penalties that could materially and adversely affect our reputation, product sales, financial condition and results of operations.
We must correctly predict, identify and interpret changes in consumer preferences and demand and offer new and improved products that meet those changes.
Consumer preferences for food and snacking products change continually. Our success depends on our ability to predict, identify and interpret the tastes, dietary habits, packaging, sales channel and other preferences of consumers around the world and to offer products that appeal to these preferences. Moreover, weak economic conditions, recession, equity market volatility or other factors, such as severe weather events, could affect consumer preferences and demand. If we do not offer products that appeal to consumers or if we misjudge consumer demand for our products, our sales and market share will decrease and our profitability could suffer.
16
Table of Contents
We must distinguish between short-term fads and trends and long-term changes in consumer preferences. If we do not accurately predict which shifts in consumer preferences or category trends will be long-term, or if we fail to introduce new and improved products to satisfy those changing preferences, our sales could decline. In addition, because of our varied and geographically diverse consumer base, we must offer an array of products that satisfy the broad spectrum of consumer preferences. If we fail to expand our product offerings successfully across product categories, or if we do not rapidly develop products in faster growing and more profitable categories, demand for our products could decrease and our profitability could suffer.
Prolonged negative perceptions concerning the health, environmental and social implications of certain food products and ingredients could influence consumer preferences and acceptance of some of our products and marketing programs. For example, consumers have increasingly focused on well-being, including reducing sodium and added sugar consumption. Developing more well-being products and contemporizing our brands by refining their ingredient and nutrition profiles are critical to our growth. In addition, consumer preferences differ by region, and we must monitor and adjust our use of ingredients to respond to these regional preferences. We might be unsuccessful in our efforts to effectively respond to changing consumer preferences and social expectations. Continued negative perceptions and failure to satisfy consumer preferences could materially and adversely affect our reputation, product sales, financial condition and results of operations.
We may not successfully identify, complete or manage strategic transactions.
We regularly evaluate a variety of potential strategic transactions, including acquisitions, divestitures, joint ventures, equity method investments and other strategic alliances that could further our strategic business objectives. We may not successfully identify, complete or manage the risks presented by these strategic transactions. Our success depends, in part, upon our ability to identify suitable transactions; negotiate favorable contractual terms; comply with applicable regulations and receive necessary consents, clearances and approvals (including regulatory and antitrust clearances and approvals); integrate or separate businesses; realize the full extent of the benefits, cost savings or synergies presented by strategic transactions; effectively implement control environment processes with employees joining us as a result of a transaction; minimize adverse effects on existing business relationships with suppliers and customers; achieve accurate estimates of fair value; minimize potential loss of customers or key employees; and minimize indemnities and potential disputes with buyers, sellers and strategic partners. In addition, execution or oversight of strategic transactions may result in the diversion of management attention from our existing business and may present financial, managerial and operational risks.
With respect to acquisitions and joint ventures in particular, we are also exposed to potential risks based on our ability to conform standards, controls, policies and procedures, and business cultures; consolidate and streamline operations and infrastructures; identify and eliminate, as appropriate, redundant and underperforming operations and assets; manage inefficiencies associated with the integration of operations; and coordinate timely and ongoing compliance with antitrust and competition laws in the United States, the European Union and other jurisdictions. Joint ventures and similar strategic alliances pose additional risks, as we share ownership and in some cases management responsibilities with one or more other parties whose objectives for the alliance may diverge from ours over time, who may not have the same priorities, strategies or resources as we do, or whose interpretation of applicable policies may differ from our own. Transactions or ventures into which we enter might not meet our financial and non-financial control and compliance expectations or yield the anticipated benefits. Depending on the nature of the business ventures, including whether they operate globally, these ventures could also be subject to many of the same risks we are, including political, economic, regulatory and compliance risks, currency exchange rate fluctuations, and volatility of commodity and other input prices. Either partner might fail to recognize an alliance relationship that could expose the business to higher risk or make the venture not as productive as expected.
Furthermore, we may not be able to complete, on terms favorable to us, desired or proposed divestitures of businesses that do not meet our strategic objectives or our growth or profitability targets. Our divestiture activities, or related activities such as reorganizations, restructuring programs and transformation initiatives, may require us to recognize impairment charges or to take action to reduce costs that remain after we complete a divestiture. Gains or losses on the sales of, or lost operating income from, those businesses may also affect our profitability.
Any of these risks could materially and adversely affect our business, product sales, financial condition and results of operations.
17
Table of Contents
We could fail to maintain effective internal control over financial reporting.
The accuracy of our financial reporting depends on the effectiveness of our internal control over financial reporting. Internal control over financial reporting can provide only reasonable assurance with respect to the preparation and fair presentation of financial statements and may not prevent or detect misstatements because of its inherent limitations. These limitations include, among others, the possibility of human error, inadequacy or circumvention of controls and fraud. If we do not maintain effective internal control over financial reporting or design and implement controls sufficient to provide reasonable assurance with respect to the preparation and fair presentation of our financial statements, including in connection with controls executed for us by third parties, we might fail to timely detect any misappropriation of corporate assets or inappropriate allocation or use of funds and could be unable to file accurate financial reports on a timely basis. As a result, our reputation, results of operations and stock price could be materially adversely affected.
Weak financial performance, downgrades in our credit ratings, illiquid global capital markets and volatile global economic conditions could limit our access to the global capital markets, reduce our liquidity and increase our borrowing costs.
We access the long-term and short-term global capital markets to obtain financing. Our financial performance, our short-and long-term debt credit ratings, interest rates, the stability of financial institutions with which we partner, the liquidity of the overall global capital markets and the state of the global economy, including the food industry, could affect our access to, and the availability or cost of, financing on acceptable terms and conditions and our ability to pay dividends in the future. There can be no assurance that we will have access to the global capital markets on terms we find acceptable.
We regularly access the commercial paper markets in the United States and Europe for ongoing funding requirements. A downgrade in our credit ratings by a credit rating agency could increase our borrowing costs and adversely affect our ability to issue commercial paper. Disruptions in the global commercial paper market or other effects of volatile economic conditions on the global credit markets also could reduce the amount of commercial paper that we could issue and raise our borrowing costs for both short- and long-term debt offerings.
Limitations on our ability to access the global capital markets, a reduction in our liquidity or an increase in our borrowing costs could materially and adversely affect our financial condition and results of operations.
Volatility in the equity markets, interest rates, our participation in multiemployer pension plans and other factors could increase our costs relating to our employees’ pensions.
We sponsor a number of defined benefit pension plans for our employees throughout the world and also contribute toward our employees’ pensions under defined benefit plans that we do not sponsor. At the end of 2017, the projected benefit obligation of the defined benefit pension plans we sponsor was $12.6 billion and plan assets were $11.0 billion.
For defined benefit pension plans that we maintain, the difference between plan obligations and assets, or the funded status of the plans, significantly affects the net periodic benefit costs of our pension plans and the ongoing funding requirements of those plans. Our largest funded defined benefit pension plans are funded with trust assets invested in a globally diversified portfolio of investments, including equities and corporate and government debt. Among other factors, changes in interest rates, mortality rates, early retirement rates, investment returns, funding requirements in the jurisdictions in which the plans operate and the market value of plan assets can affect the level of plan funding, cause volatility in the net periodic pension cost and increase our future funding requirements. Legislative and other governmental regulatory actions may also increase funding requirements for our pension plans’ benefits obligation. Volatility in the global capital markets may increase the risk that we will be required to make additional cash contributions to the pension plans and recognize further increases in our net periodic pension cost.
We also participate in multiemployer pension plans. Our exposure under those plans may extend beyond what our obligation would be with respect to our own employees. Our contributions to a multiemployer plan may increase beyond our bargaining obligations depending on the financial condition of the multiemployer plan and the financial viability of other employers in the plan. We may be required to participate in funding the unfunded obligations of the plan allocable to a withdrawing employer, and our costs might increase as a result. Further, if we partially or completely withdraw from a multiemployer pension plan, we may be required to pay a partial or complete withdrawal liability. This withdrawal liability will generally increase if there is also a mass withdrawal of other participating employers or if the plan terminates. (See Note 9, Benefit Plans, to the consolidated financial statements for more information on our multiemployer pension plans.)
18
Table of Contents
A significant increase in our pension benefit obligations or funding requirements could curtail our ability to invest in the business and adversely affect our financial condition and results of operations.
Our failure to protect our valuable intellectual property rights could reduce the value of our products and brands.
We consider our intellectual property rights, particularly and most notably our trademarks, but also our patents, trade secrets, copyrights and licensing agreements, to be a significant and valuable part of our business. We attempt to protect our intellectual property rights by taking advantage of a combination of patent, trademark, copyright and trade secret laws in various countries, as well as licensing agreements, third party nondisclosure and assignment agreements and policing of third party misuses of our intellectual property. Our failure to obtain or adequately protect our intellectual property rights, or any change in law or other changes that serve to lessen or remove the current legal protections of our intellectual property, may diminish our competitiveness and could materially harm our business.
We may be unaware of third party claims of intellectual property infringement relating to our technology, brands or products. Any litigation regarding patents or other intellectual property could be costly and time-consuming and could divert management’s and other key personnel’s attention from our business operations. Third party claims of intellectual property infringement might require us to pay monetary damages or enter into costly license agreements. We also may be subject to injunctions against development and sale of certain of our products. Any of these occurrences could materially and adversely affect our reputation, ability to introduce new products or improve the quality of existing products, product sales, financial condition and results of operations.
Item 1B. Unresolved Staff Comments.
None.
19
Table of Contents
On December 31, 2017, we had approximately 138 manufacturing and processing facilities in 51 countries and 108 distribution centers and depots worldwide. During 2017, we disposed of 12 manufacturing facilities mainly in business divestitures and we reduced the number of distribution centers we own or lease by 22. In addition to our owned or leased properties listed below, we also utilize a highly distributed network of warehouses and distribution centers that are owned or leased by third party logistics partners, contract manufacturers, co-packers or other strategic partners. We believe we have or will add sufficient capacity to meet our planned operating needs. It is our practice to maintain all of our plants and other facilities in good condition.
| As of December 31, 2017 | ||||||||
| Number of | Number of | |||||||
| Manufacturing | Distribution | |||||||
| Facilities | Facilities | |||||||
| Latin America (1) |
17 | 3 | ||||||
| AMEA |
49 | 32 | ||||||
| Europe |
57 | 14 | ||||||
| North America |
15 | 59 | ||||||
|
|
|
|
|
|||||
| Total |
138 | 108 | ||||||
|
|
|
|
|
|||||
| Owned |
125 | 15 | ||||||
| Leased |
13 | 93 | ||||||
|
|
|
|
|
|||||
| Total |
138 | 108 | ||||||
|
|
|
|
|
|||||
| (1) | Excludes our deconsolidated Venezuela operations. See Note 1, Summary of Significant Accounting Policies – Currency Translation and Highly Inflationary Accounting: Venezuela, for additional information. |
Information regarding legal proceedings is available in Note 12, Commitments and Contingencies, to the consolidated financial statements in this report.
Item 4. Mine Safety Disclosures.
Not applicable.
20
Table of Contents
Item 5. Market for Registrant’s Common Equity, Related Stockholder Matters and Issuer Purchases of Equity Securities.
We have listed our Common Stock on The Nasdaq Global Select Market under the symbol “MDLZ.” At January 31, 2018, there were 52,572 holders of record of our Common Stock. Information regarding the market price of our Common Stock and dividends declared during the last two fiscal years is included in Note 17, Quarterly Financial Data (Unaudited), to the consolidated financial statements.
Comparison of Five-Year Cumulative Total Return
The following graph compares the cumulative total return on our Common Stock with the cumulative total return of the S&P 500 Index and the Mondelēz International performance peer group index. The graph assumes, in each case, that an initial investment of $100 is made at the beginning of the five-year period. The cumulative total return reflects market prices at the end of each year and the reinvestment of dividends each year.
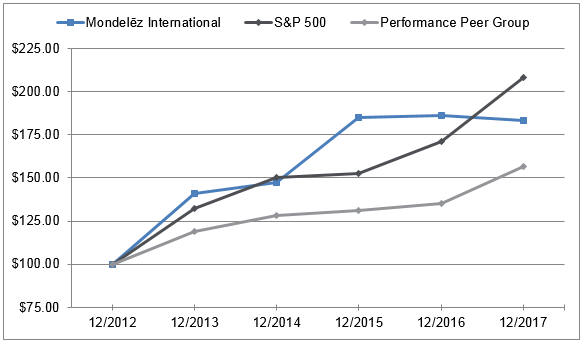
| As of December 31, |
Mondelēz International |
S&P 500 | Performance Peer Group |
|||||||||
| 2012 |
$ | 100.00 | $ | 100.00 | $ | 100.00 | ||||||
| 2013 |
141.09 | 132.39 | 119.11 | |||||||||
| 2014 |
147.56 | 150.51 | 128.15 | |||||||||
| 2015 |
185.03 | 152.59 | 131.35 | |||||||||
| 2016 |
186.08 | 170.84 | 135.12 | |||||||||
| 2017 |
183.14 | 208.14 | 156.68 | |||||||||
The Mondelēz International performance peer group consists of the following companies considered our market competitors or that have been selected on the basis of industry, global focus or industry leadership: Campbell Soup Company, The Coca-Cola Company, Colgate-Palmolive Company, Danone S.A., General Mills, Inc., The Hershey Company, Kellogg Company, The Kraft Heinz Company, Nestlé S.A., PepsiCo, Inc., The Procter & Gamble Company and Unilever PLC. The Kraft Heinz Company performance history is included for 2016 and 2017 only as the company was formed in 2015.
21
Table of Contents
Issuer Purchases of Equity Securities
Our stock repurchase activity for each of the three months in the quarter ended December 31, 2017 was:
| Period |
Total Number of Shares Purchased (1) |
Average Price Paid per Share (1) |
Total Number of Shares Purchased as Part of Publicly Announced Plans or Programs (2) |
Approximate Dollar Value of Shares That May Yet Be Purchased Under the Plans or Programs (2) |
||||||||||||
| October 1-31, 2017 |
1,227,255 | $ | 41.00 | 1,219,740 | $ | 978,678,089 | ||||||||||
| November 1-30, 2017 |
1,310,860 | 42.78 | 1,308,300 | 922,700,280 | ||||||||||||
| December 1-31, 2017 |
6,510,143 | 43.08 | 6,477,334 | 643,678,089 | ||||||||||||
|
|
|
|
|
|||||||||||||
| For the Quarter Ended |
9,048,258 | 42.75 | 9,005,374 | |||||||||||||
|
|
|
|
|
|||||||||||||
| (1) | The total number of shares purchased (and the average price paid per share) reflects: (i) shares purchased pursuant to the repurchase program described in (2) below; and (ii) shares tendered to us by employees who used shares to exercise options and to pay the related taxes for grants of restricted stock and deferred stock units that vested, totaling 7,515 shares, 2,560 shares and 32,809 shares for the fiscal months of October, November and December 2017, respectively. |
| (2) | Our Board of Directors authorized the repurchase of $13.7 billion of our Common Stock through December 31, 2018. Specifically, on March 12, 2013, our Board of Directors authorized the repurchase of up to the lesser of 40 million shares or $1.2 billion of our Common Stock through March 12, 2016. On August 6, 2013, our Audit Committee, with authorization delegated from our Board of Directors, increased the repurchase program capacity to $6.0 billion of Common Stock repurchases and extended the expiration date to December 31, 2016. On December 3, 2013, our Board of Directors approved an increase of $1.7 billion to the program related to a new accelerated share repurchase program, which concluded in May 2014. On July 29, 2015, our Finance Committee, with authorization delegated from our Board of Directors, approved a $6.0 billion increase that raised the repurchase program capacity to $13.7 billion and extended the program through December 31, 2018. On January 31, 2018 our Finance Committee, with authorization delegated from our Board of Directors, approved an increase of $6.0 billion in the share repurchase program, raising the authorization to $19.7 billion of Common Stock repurchases, and extended the program through December 31, 2020. See related information in Note 11, Capital Stock. |
22
Table of Contents
Item 6. Selected Financial Data
Mondelēz International, Inc.
Selected Financial Data – Five Year Review (1)
| 2017 | 2016 | 2015 | 2014 | 2013 | ||||||||||||||||
| (in millions, except per share and employee data) | ||||||||||||||||||||
| Continuing Operations (2) |
||||||||||||||||||||
| Net revenues |
$ | 25,896 | $ | 25,923 | $ | 29,636 | $ | 34,244 | $ | 35,299 | ||||||||||
| Earnings from continuing operations, net of taxes |
2,936 | 1,669 | 7,291 | 2,201 | 2,332 | |||||||||||||||
| Net earnings attributable to Mondelēz International: |
||||||||||||||||||||
| Per share, basic |
1.93 | 1.07 | 4.49 | 1.29 | 1.30 | |||||||||||||||
| Per share, diluted |
1.91 | 1.05 | 4.44 | 1.28 | 1.29 | |||||||||||||||
| Cash Flow and Financial Position (3) |
||||||||||||||||||||
| Net cash provided by operating activities |
2,593 | 2,838 | 3,728 | 3,562 | 6,410 | |||||||||||||||
| Capital expenditures |
1,014 | 1,224 | 1,514 | 1,642 | 1,622 | |||||||||||||||
| Property, plant and equipment, net |
8,677 | 8,229 | 8,362 | 9,827 | 10,247 | |||||||||||||||
| Total assets |
63,109 | 61,538 | 62,843 | 66,771 | 72,464 | |||||||||||||||
| Long-term debt |
12,972 | 13,217 | 14,557 | 13,821 | 14,431 | |||||||||||||||
| Total Mondelēz International shareholders’ equity |
26,111 | 25,161 | 28,012 | 27,750 | 32,373 | |||||||||||||||
| Shares outstanding at year end (4) |
1,488 | 1,528 | 1,580 | 1,664 | 1,705 | |||||||||||||||
| Per Share and Other Data |
||||||||||||||||||||
| Book value per shares outstanding |
17.55 | 16.47 | 17.73 | 16.68 | 18.99 | |||||||||||||||
| Dividends declared per share (5) |
0.82 | 0.72 | 0.64 | 0.58 | 0.54 | |||||||||||||||
| Common Stock closing price at year end |
42.80 | 44.33 | 44.84 | 36.33 | 35.30 | |||||||||||||||
| Number of employees |
83,000 | 90,000 | 99,000 | 104,000 | 107,000 | |||||||||||||||
| (1) | The selected financial data should be read in conjunction with Management’s Discussion and Analysis of Financial Condition and Results of Operations and our consolidated financial statements and related notes included elsewhere in this Annual Report on Form 10-K and Annual Reports on Form 10-K for earlier periods. A significant portion of our business is exposed to currency exchange rate fluctuation as a large portion of our assets, liabilities, revenue and expenses must be translated into U.S. dollars for reporting purposes. Refer to Management’s Discussion and Analysis of Financial Condition and Results of Operations for a discussion of operating results on a constant currency basis where noted. |
| (2) | Significant items impacting the comparability of our results from continuing operations include: Spin-Off Costs in 2013-2014; restructuring programs in 2013-2017; cost savings initiatives in 2013; the contribution of our global coffee businesses and investment in JDE and related gain in 2015; gain on equity method investment transactions in 2016-2017; other divestitures and sales of property in 2013 and 2015-2017; acquisitions in 2013 and 2015-2016; the Cadbury acquisition-related Integration Program in 2013-2014; the benefit from the Cadbury acquisition-related indemnification resolution in 2013; losses on debt extinguishment in 2013-2017; unrealized gains on the coffee business transaction currency hedges in 2014-2015; debt tender offers completed in 2013-2016; loss on deconsolidation of Venezuela in 2015; the remeasurement of net monetary assets in Venezuela in 2013-2015; accounting calendar changes in 2013 and 2015; impairment charges related to intangible assets in 2014-2017; losses related to interest rate swaps in 2015-2016; benefits from the resolution of tax matters in 2017; CEO transition remuneration in 2017; malware incident incremental expenses in 2017; and our provision for income taxes in all years, including the U.S. tax reform discrete net tax benefit in 2017. Please refer to Notes 1, Summary of Significant Accounting Policies; 2, Divestitures and Acquisitions; 5, Goodwill and Intangible Assets; 6, 2014-2018 Restructuring Program; 7, Debt and Borrowing Arrangements; 8, Financial Instruments; 12, Commitments and Contingencies; 14, Income Taxes; and 16, Segment Reporting, for additional information regarding items affecting comparability of our results from continuing operations. |
| (3) | Items impacting comparability primarily relate to the Keurig and JDE coffee business transactions in 2014-2016, the loss on deconsolidation of Venezuela in 2015 and the receipt of net cash proceeds from the resolution of the Starbucks arbitration in 2013. Refer to the Annual Report on Form 10-K for the year ended December 31, 2015, for additional information on the resolution of the Starbucks arbitration in 2013. Beginning in 2015, debt issuance costs related to recognized debt liabilities were recorded as a deduction from the related debt obligations instead of as long-term other assets on the consolidated balance sheet. We made this reclassification in the prior periods presented for consistency. |
| (4) | Refer to Note 11, Capital Stock, for additional information on our share repurchase program in 2013-2017. |
| (5) | Refer to the Equity and Dividends section within Management’s Discussion and Analysis of Financial Condition and Results of Operations for information on our dividends. |
23
Table of Contents
Item 7. Management’s Discussion and Analysis of Financial Condition and Results of Operations.
The following discussion and analysis contains forward-looking statements. It should be read in conjunction with the other sections of this Annual Report on Form 10-K, including the consolidated financial statements and related notes contained in Item 8, Forward-Looking Statements and Item 1A, Risk Factors.
Description of the Company
We manufacture and market primarily snack food products, including biscuits (cookies, crackers and salted snacks), chocolate, gum & candy and various cheese & grocery products, as well as powdered beverage products. We have operations in more than 80 countries and sell our products in approximately 160 countries.
We aim to deliver strong, profitable long-term growth by accelerating our core snacks business and expanding the reach of our Power Brands globally. To fuel investments in our Power Brands and global and digital reach, we have been working to optimize our cost structure. These efforts include reinventing our supply chain operations and aggressively managing overhead costs. Through these actions, we’re leveraging our brands, platforms and capabilities to drive long-term value and return on investment for our shareholders.
U.S. Tax Reform
On December 22, 2017, the United States enacted tax reform legislation that included a broad range of business tax provisions, including but not limited to a reduction in the U.S. federal tax rate from 35% to 21% as well as provisions that limit or eliminate various deductions or credits. The legislation also causes U.S. allocated expenses (e.g. interest and general administrative expenses) to be taxed and imposes a new tax on U.S. cross-border payments. Furthermore, the legislation includes a one-time transition tax on accumulated foreign earnings and profits.
In response to the enactment of U.S. tax reform, the SEC issued guidance to address the complexity in accounting for this new legislation. When the initial accounting for items under the new legislation is incomplete, the guidance allows us to recognize provisional amounts when reasonable estimates can be made or to continue to apply the prior tax law if a reasonable estimate of the impact cannot be made. The SEC has provided up to a one-year window for companies to finalize the accounting for the impacts of this new legislation and we anticipate finalizing our accounting during 2018.
While our accounting for the new U.S. tax legislation is not complete, we have made reasonable estimates for some provisions and recognized a $59 million discrete net tax benefit in our 2017 financial statements. This net benefit is primarily comprised of a $1,311 million provisional deferred tax benefit from revaluing our net U.S. deferred tax liabilities to reflect the new U.S. corporate tax rate as well as an additional $61 million provisional deferred tax benefit related to changes in our indefinite reinvestment assertion, partially offset by a $1,317 million provisional charge for the estimated transition tax. However, as of the date of this Form 10-K, we are continuing to evaluate the accounting impacts of the legislation, as we continue to assemble and analyze all the information required to prepare and analyze these effects and await additional guidance from the U.S. Treasury Department, the IRS or other standard-setting bodies. Additionally, we continue to analyze other information and regulatory guidance, and accordingly we may record additional provisional amounts or adjustments to provisional amounts in future periods. See Note 14, Income Taxes, for further details on the impacts of U.S. tax reform.
Malware Incident
On June 27, 2017, a global malware incident impacted our business. The malware affected a significant portion of our global sales, distribution and financial networks. In the last four days of the second quarter and during the third quarter, we executed business continuity and contingency plans to contain the impact, minimize damages and restore our systems environment. To date, we have not found, nor do we expect to find, any instances of Company or personal data released externally. We have now restored our main operating systems and processes as well as enhanced our system security.
24
Table of Contents
During 2017, we estimate that the loss of revenue as a result of the malware incident had a negative impact of 0.4% on our net revenue and Organic Net Revenue growth. We also incurred incremental expenses of $84 million predominantly during the second half of 2017 as part of the recovery effort. We believe the recovery from this incident is largely resolved, and we do not expect significant ongoing impacts or incremental expenses from this incident in future periods. We also continue to make progress on our efforts to strengthen our security measures and mitigate cybersecurity risk. Refer to our Risk Factors section for a discussion of potential risks to our operations from cybersecurity threats.
Coffee Business Transactions
JDE Coffee Business Transactions:
On July 2, 2015, we completed transactions to combine our wholly owned coffee businesses with those of D.E Master Blenders 1753 B.V. to create a new company, Jacob Douwe Egberts (“JDE”). In connection with these transactions, in 2015, we recorded a final pre-tax gain of $6.8 billion ($6.6 billion after-tax) from the deconsolidation of our legacy coffee businesses. We also recorded approximately $1.0 billion of cumulative pre-tax net gains ($436 million in 2015 and $628 million in 2014) and cash related to currency hedging. See Note 2, Divestitures and Acquisitions—JDE Coffee Business Transactions, for additional details. As further described below, in March 2016, we exchanged a portion of our investment in JDE for an investment in Keurig Green Mountain Inc. (“Keurig”). As of December 31, 2017, we hold a 26.5% voting interest, a 26.4% ownership interest and a 26.2% profit and dividend sharing interest in JDE. We recorded JDE equity earnings of $129 million in 2017 and $100 million in 2016 and equity losses of $58 million in 2015. We also recorded $49 million of cash dividends received during the first quarter of 2017.
Keurig Transaction:
Following the March 3, 2016 Acorn Holdings B.V. acquisition of Keurig, on March 7, 2016, we exchanged a portion of our equity interest in JDE for an interest in Keurig valued at $2.0 billion. We recorded the difference between the fair value of the Keurig interest and our basis in JDE shares as a $43 million gain. Following the exchange, our ownership interest in JDE became 26.5% and we owned a 24.2% interest in Keurig. Our initial $2.0 billion investment in Keurig includes a $1.6 billion Keurig equity interest and a $0.4 billion shareholder loan receivable, which are reported on a combined basis within equity method investments on our consolidated balance sheet. The shareholder loan has a 5.5% interest rate and is payable at the end of a seven-year term on February 27, 2023. We recorded Keurig equity earnings of $208 million in 2017 (of which, approximately $119 million relates to the provisional tax benefit Keurig recorded as a result of U.S. tax reform), and $77 million in 2016. We recorded shareholder loan interest of $24 million in 2017 and $20 million in 2016. Additionally, we received shareholder loan interest payments of $30 million in 2017 and $14 million in 2016 and dividends of $14 million in 2017 and $4 million in 2016. See Note 2, Divestitures and Acquisitions, for additional details on the Keurig transaction.
Planned Keurig Dr Pepper Transaction:
On January 29, 2018, we announced that we would exchange our ownership interest in Keurig for equity in Keurig Dr Pepper, which is contingent upon the successful completion of a planned merger of Keurig with Dr Pepper Snapple Group, Inc. Following the close of the merger in mid-2018, we expect our ownership in Keurig Dr Pepper to be 13-14%. We expect to account for this new investment under the equity method as we have for Keurig, resulting in our recognizing our share of their earnings within our earnings and our share of their dividends within our cash flows. We will have the right to nominate two directors to the board of Keurig Dr Pepper and will have certain governance rights over Keurig Dr Pepper following the transaction.
Venezuela Deconsolidation
Effective as of the close of the 2015 fiscal year, we deconsolidated our Venezuelan subsidiaries due to a loss of control over our Venezuelan operations and an other-than-temporary lack of currency exchangeability. We recorded a $778 million pretax loss on December 31, 2015 as we reduced the value of our investment in Venezuela and all Venezuelan receivables held by our other subsidiaries to realizable fair value, resulting in full impairment.
As of the start of 2016, we no longer included net revenues, earnings or net assets of our Venezuelan subsidiaries within our GAAP consolidated financial statements and we excluded Venezuela from our non-GAAP results for all historical periods presented to facilitate comparisons of operating results. See Note 1, Summary of Significant Accounting Policies – Currency Translation and Highly Inflationary Accounting: Venezuela, for more information on our Venezuela operations, including currency remeasurement losses and the loss on deconsolidation.
25
Table of Contents
| • | Net revenues were approximately $25.9 billion in both 2017 and 2016, a decrease of 0.1% in 2017 and a decrease of 12.5% in 2016. Business deconsolidations and divestitures reduced net revenues during 2015-2017, with net revenues in 2016 most significantly affected by the deconsolidations of our historical coffee business and Venezuelan operations in 2015 as well as significant unfavorable currency translation impacts in 2016 and 2015. |
| • | Organic Net Revenue increased 0.9% to $25.5 billion in 2017 and increased 1.5% to $26.4 billion in 2016. Organic Net Revenue is on a constant currency basis and excludes revenue from deconsolidated coffee and Venezuelan operations, divestitures and an acquisition. We use Organic Net Revenue as it provides improved year-over-year comparability of our underlying operating results (see the definition of Organic Net Revenue and our reconciliation with net revenues within Non-GAAP Financial Measures appearing later in this section). |
| • | Diluted EPS attributable to Mondelēz International increased 81.9% to $1.91 in 2017 and decreased 76.4% to $1.05 in 2016. Diluted EPS increased in 2017 as prior-year refinancing and higher restructuring activities drove lower interest and overhead costs in 2017. We also recorded benefits from resolving two local indirect tax matters and gains from divesting non-core businesses during 2017. Diluted EPS was significantly lower in 2016 primarily as a result of the $6.8 billion gain recorded in 2015 in connection with the JDE coffee business transactions as well as a number of other significant items that affected the comparability of our reported results. See our Discussion and Analysis of Historical Results appearing later in this section for further details. |
| • | Adjusted EPS increased 15.1% to $2.14 in 2017 and increased 21.6% to $1.86 in 2016. On a constant currency basis, Adjusted EPS increased 14.5% to $2.13 in 2017 and increased 25.5% to $1.92 in 2016. Lower manufacturing costs and overhead costs, driven by strong productivity efforts, were significant drivers of Adjusted EPS growth in both years. Adjusted EPS and Adjusted EPS on a constant currency basis are non-GAAP financial measures. We use these measures as they provide improved year-over-year comparability of our underlying results (see the definition of Adjusted EPS and our reconciliation with diluted EPS within Non-GAAP Financial Measures appearing later in this section). |
We seek to achieve profitable, long-term growth and manage our business to attain this goal using our key operating metrics: Organic Net Revenue, Adjusted Operating Income and Adjusted EPS. We use these non-GAAP financial metrics and related computations such as margins internally to evaluate and manage our business and to plan and make near-and long-term operating and strategic decisions. As such, we believe these metrics are useful to investors as they provide supplemental information in addition to our U.S. Generally Accepted Accounting Principles (“U.S. GAAP”) financial results. We believe providing investors with the same financial information that we use internally ensures that investors have the same data to make comparisons of our historical operating results, identify trends in our underlying operating results and gain additional insight and transparency on how we evaluate our business. We believe our non-GAAP financial measures should always be considered in relation to our GAAP results and we have provided reconciliations between our GAAP and non-GAAP financial measures within Non-GAAP Financial Measures appearing later in this section.
In addition to monitoring our key operating metrics, we monitor a number of developments and trends that could impact our revenue and profitability objectives.
Long-Term Demographics and Consumer Trends – Snack food consumption is highly correlated to GDP growth, urbanization of populations and rising discretionary income levels associated with a growing middle class, particularly in emerging markets. Over the long term, we expect these trends to continue leading to growth in consumer behaviors such as more frequent, smaller meals, snacking and greater use of convenience foods. We also recognize changing consumer trends such as the increased emphasis on well-being, time compression and wide participation across an evolving retail and digital landscape. To position ourselves for long-term growth, we are investing in our well-being and other snack offerings, product and marketing innovation and new routes to market including e-commerce.
26
Table of Contents
Demand – We monitor consumer spending and our market share within the food and beverage categories in which we sell our products. In recent years, low GDP growth, economic recessionary pressures, weak consumer confidence, a historically strong U.S. dollar and changing consumer trends have slowed category and our net revenue growth. While we have begun to see some improvements in global economic growth and a weaker U.S. dollar in 2017, there are still geopolitical and economic uncertainties, and category growth continues to be soft. Growth in our global snacking categories (excluding Venezuela) decreased from approximately 3.4% in 2015 and 2.4% in 2016 to 2.1% in 2017. We continue to make investments in our brand and snacks portfolio, while building strong routes to market to address the needs of consumers in emerging and developed markets. In doing so, we anticipate driving demand in our categories and growing our position in these markets.
Volatility of Global Markets – Our growth strategy depends in part on our ability to expand our operations, particularly in emerging markets. Some emerging markets have greater political, economic and currency volatility and greater vulnerability to infrastructure and labor disruptions than more established markets. Volatility in these markets affects demand for and the costs of our products and requires frequent changes in how we operate our business. Refer to Note 1, Summary of Significant Accounting Policies—Venezuela, for further discussion of these issues and their impacts on our Venezuela operations. We expect continued volatility across our markets, particularly emerging markets. As such, we are focused on investing in our global Power Brands and routes to market while we protect our margins through the management of costs and pricing.
Competition – We operate in highly competitive markets that include global, regional and local competitors. Our advantaged geographic footprint, operating scale and portfolio of brands have all significantly contributed to building our market-leading positions across most of the product categories in which we sell. To grow and maintain our market positions, we focus on meeting consumer needs and preferences through new product innovations and product quality. We also continue to optimize our manufacturing and other operations and invest in our brands through ongoing research and development, advertising, marketing and consumer promotions.
Pricing – We adjust our product prices based on a number of variables including demand, the competitive environment and changes in our product input costs. Our net revenue growth and profitability may be affected as we adjust prices to address new conditions. Over 2015-2017, we generally increased prices in response to higher commodity costs, currency and other market factors. In 2018, we anticipate changing market conditions to continue to impact pricing. Price competition may continue to affect net revenues or market share in the near term as the market adjusts to changes in input costs and other market conditions.
Operating Costs – Our operating costs include raw materials, labor, selling, general and administrative expenses, taxes, currency impacts and financing costs. We manage these costs through cost saving and productivity initiatives, sourcing and hedging programs, pricing actions, refinancing and tax planning. We continue to renegotiate collective bargaining agreements covering eight U.S. facilities that expired beginning in February 2016. We have plans to ensure business continuity during the renegotiations. To remain competitive on our operating structure, we continue to work on programs to expand our profitability and margins, such as our 2014-2018 Restructuring Program, which is designed to bring about significant reductions in our operating cost structure in both our supply chain and overhead costs. Effective on October 1, 2016, we also integrated our EEMEA region operations into our Europe and Asia Pacific operating segments. This change had a favorable impact on our operating performance due to greater leverage of our European and AMEA regional businesses and resulting cost structure.
Taxes – While the 2017 U.S. tax reform reduced the U.S. corporate tax rate and included beneficial depreciation provisions, other provisions could have an adverse effect on our results. Specifically, new provisions that cause U.S. allocated expenses (e.g. interest and general administrative expenses) to be taxed and impose a tax on U.S. cross-border payments could adversely impact our effective tax rate. We will continue to evaluate the impacts as additional guidance on implementing the legislation becomes available.
27
Table of Contents
Currency – As a global company with 75.8% of our net revenues generated outside the United States, we are continually exposed to changes in global economic conditions and currency movements. In 2017, the U.S. dollar began to weaken relative to other currencies in which we operate, while in 2015 and 2016, the U.S. dollar generally was stronger as a number of countries experienced significant declines in or devaluations of their currency. The currency movements created volatility in our reported results of operations. Unfavorable currency translation impacts were 12.6 percentage points (or 12.0 percentage points excluding currency impacts related to Venezuela) of the 13.5% net revenue decrease in 2015 and 4.6 percentage points of the 12.5% net revenue decrease in 2016. In 2017, the 0.1% net revenue decrease reflected 0.3 percentage points of favorable currency translation impacts as the U.S. dollar generally weakened against a number of currencies this past year. As currency movements can make comparisons of year-over-year operating performance challenging, we isolate the impact of currency and also report growth on a constant currency basis, holding prior-year currency exchange rates constant, so that prior-year and current-year results can be compared on a consistent basis.
Historically, we have also been exposed to currency devaluation risks impacting earnings particularly, but not only, in connection with our Venezuela operations that were deconsolidated at the close of the 2015 fiscal year. In the months following the Brexit vote in June 2016, there was significant volatility in the global stock markets and currency exchange rates. The value of the British pound sterling relative to the U.S. dollar declined significantly and negatively affected our translated results reported in U.S. dollars. In December 2017, the European Union and United Kingdom agreed to begin trade negotiations, and we could experience additional volatility in the British pound sterling as the Brexit negotiations move forward.
To partially offset the translation of certain of our overseas operations, including the United Kingdom, we enter into net investment hedges primarily in the form of local currency denominated debt and cross-currency swaps and other financial instruments. We generally do not hedge against currency translation and primarily seek to hedge against economic losses on cross-currency transactions. Due to limited markets for hedging currency transactions and other factors, we may not be able to effectively hedge all of our cross-currency transaction risks. Local economies, monetary policies and currency hedging availability can affect our ability to hedge against currency-related economic losses. While we work to mitigate our exposure to currency risks, factors such as continued global and local market volatility, actions by foreign governments, political uncertainty, limited hedging opportunities and other factors could lead to unfavorable currency impacts in the future. We monitor currency-related risks and economies at risk of qualifying for highly inflationary accounting under U.S. GAAP, such as Argentina and Ukraine. While we work to safeguard our business, currency devaluations could adversely affect future demand for our products, our financial results and operations, and our relationships with customers, suppliers and employees in the short or long-term. We may not be able to fully offset the increased risks related to currency devaluations and Brexit, which could impact profitability should the currency-related conditions continue. See Note 1, Summary of Significant Accounting Policies – Currency Translation and Highly Inflationary Accounting, and Note 8, Financial Instruments, for additional information.
Financing Costs – We regularly evaluate our variable and fixed-rate debt. We continue to use low-cost, short- and long-term debt to finance our ongoing working capital, capital expenditures and other investments, dividends and share repurchases. We also expect to use existing cash or short-term borrowings to finance the estimated $1.3 billion U.S. tax reform transition tax liability payable through 2026. During 2017, we retired $1.5 billion of long-term debt and issued lower-cost, short-term commercial paper and long-term Swiss franc debt. During 2016, we retired $6.2 billion of our long-term debt and issued lower-cost, long-term euro, Swiss franc and U.S. dollar-denominated debt. Our weighted-average interest rate on our total debt as of December 31, 2017 was 2.1%, down from 2.2% as of December 31, 2016 and down from 3.7% as of December 31, 2015. We also continue to use interest rate swaps and other financial instruments to manage our exposure to interest rate and cash flow variability, protect the value of our existing currency assets and liabilities and protect the value of our debt. For example, through February 8, 2018, we entered into cross-currency interest rate swaps and forwards with an aggregate notional value of $3.2 billion to hedge our non-U.S. net investments against adverse movements in exchange rates. We designated these swaps and forwards as net investment hedges related to our operations in our Europe and AMEA regions. We expect a favorable impact on our prospective financing costs as we reduce some of the financing costs and related currency impacts within our interest costs. Refer to Note 7, Debt and Borrowing Arrangements, and Note 8, Financial Instruments, for additional information on our debt and derivative activity.
28
Table of Contents
Discussion and Analysis of Historical Results
Items Affecting Comparability of Financial Results
The following table includes significant income or (expense) items that affected the comparability of our results of operations and our effective tax rates. Please refer to the notes to the consolidated financial statements indicated below for more information. Refer also to the Consolidated Results of Operations – Net Earnings and Earnings per Share Attributable to Mondelēz International table for the after-tax per share impacts of these items.
| For the Years Ended December 31, | ||||||||||||||||
| See Note | 2017 | 2016 | 2015 | |||||||||||||
| (in millions, except percentages) | ||||||||||||||||
| JDE coffee business transactions: |
Note 2 | |||||||||||||||
| Gain on contribution |
$ | – | $ | – | $ | 6,809 | ||||||||||
| Incremental costs for readying the businesses |
– | – | (278 | ) | ||||||||||||
| Currency-related hedging net gains (1) |
– | – | 436 | |||||||||||||
| Venezuela: |
Note 1 | |||||||||||||||
| Historical operating income (2) |
– | – | 266 | |||||||||||||
| Remeasurement of net monetary assets: |
||||||||||||||||
| Q1 2015: 11.50 to 12.00 bolivars to the U.S. dollar |
– | – | (11 | ) | ||||||||||||
| Loss on deconsolidation |
– | – | (778 | ) | ||||||||||||
| 2014-2018 Restructuring Program: |
Note 6 | |||||||||||||||
| Restructuring charges |
(535 | ) | (714 | ) | (711 | ) | ||||||||||
| Implementation charges |
(257 | ) | (372 | ) | (291 | ) | ||||||||||
| Gain on equity method investment transactions (3) |
Note 2 | 40 | 43 | – | ||||||||||||
| Loss on debt extinguishment and related expenses |
Note 7 | (11 | ) | (427 | ) | (753 | ) | |||||||||
| Loss related to interest rate swaps |
Note 7 & 8 | – | (97 | ) | (34 | ) | ||||||||||
| CEO transition remuneration (4) |
See (4) below | (14 | ) | – | – | |||||||||||
| Intangible asset impairment charges |
Note 5 | (109 | ) | (137 | ) | (71 | ) | |||||||||
| Divestitures, acquisitions and sales of property |
Note 2 | |||||||||||||||
| Gain on sale of intangible assets |
– | 15 | – | |||||||||||||
| Net gain on divestitures |
186 | 9 | 13 | |||||||||||||
| Divestiture-related costs (5) |
(34 | ) | (86 | ) | – | |||||||||||
| Acquisition-related costs |
– | (1 | ) | (8 | ) | |||||||||||
| Other acquisition integration costs |
(3 | ) | (7 | ) | (9 | ) | ||||||||||
| Gains on sales of property |
– | 46 | – | |||||||||||||
| Mark-to-market (losses)/gains from derivatives (6) |
Note 8 | (96 | ) | (94 | ) | 56 | ||||||||||
| Benefits from the resolution of tax matters (7) |
Note 12 | 281 | – | – | ||||||||||||
| Malware incident incremental expenses |
(84 | ) | – | – | ||||||||||||
| U.S. tax reform discrete net tax benefit (8) |
Note 14 | 59 | – | – | ||||||||||||
| Effective tax rate |
Note 14 | 22.0% | 8.9% | 7.5% | ||||||||||||
| (1) | To lock in an expected U.S. dollar value of the cash to be received in euros upon closing of the JDE coffee business transactions, we entered into currency exchange forward contracts beginning in May 2014, when the transaction was announced. We recognized related currency hedging net gains of $436 million in 2015. See Note 2, Divestitures and Acquisitions, for more information on the JDE coffee business transactions and related hedging transactions. |
| (2) | Excludes the impact of remeasurement losses and 2014-2018 Restructuring Program charges that are shown separately. |
| (3) | The gain on equity method investment transactions is recorded outside of pre-tax operating results on the consolidated statement of earnings. |
| (4) | Please see the Non-GAAP Financial Measures section at the end of this item for additional discussion of CEO transition remuneration. |
| (5) | Divestiture-related costs in 2017 totaled $34 million ($31 million in operating income and $3 million in interest and other expense, net). |
| (6) | Unrealized gains or losses on commodity and forecasted currency transaction derivatives. 2015 amounts exclude coffee commodity and currency derivative impacts that are included within the coffee operating results throughout the following sections. |
| (7) | Refer to Note 12, Commitments and Contingencies – Tax Matters, for more information. Primarily includes the reversal of tax liabilities in connection with the resolution of a Brazilian indirect tax matter and settlement of pre-acquisition Cadbury tax matters. |
| (8) | Refer to Note 14, Income Taxes, for more information on the impact of the U.S. tax reform. |
29
Table of Contents
Consolidated Results of Operations
The following discussion compares our consolidated results of operations for 2017 with 2016 and 2016 with 2015.
2017 compared with 2016
| For the Years Ended December 31, |
||||||||||||||||
| 2017 | 2016 | $ change | % change | |||||||||||||
| (in millions, except per share data) | ||||||||||||||||
| Net revenues |
$ | 25,896 | $ | 25,923 | $ | (27) | (0.1)% | |||||||||
| Operating income |
3,506 | 2,569 | 937 | 36.5% | ||||||||||||
| Earnings from continuing operations |
2,936 | 1,669 | 1,267 | 75.9% | ||||||||||||
| Net earnings attributable to |
2,922 | 1,659 | 1,263 | 76.1% | ||||||||||||
| Diluted earnings per share attributable to |
1.91 | 1.05 | 0.86 | 81.9% | ||||||||||||
Net Revenues – Net revenues decreased $27 million (0.1%) to $25,896 million in 2017, and Organic Net Revenue (1) increased $220 million (0.9%) to $25,490 million. Power Brands net revenues increased 2.9%, including a favorable currency impact, and Power Brands Organic Net Revenue increased 2.1%. Emerging markets net revenues increased 3.7%, including a favorable currency impact, and emerging markets Organic Net Revenue increased 3.6%. The underlying changes in net revenues and Organic Net Revenue are detailed below:
| 2017 | ||||
| Change in net revenues (by percentage point) |
||||
| Total change in net revenues |
(0.1)% | |||
| Add back the following items affecting comparability: |
||||
| Favorable currency |
(0.3)pp | |||
| Impact of acquisition |
(0.2)pp | |||
| Impact of divestitures |
1.5pp | |||
|
|
|
|||
| Total change in Organic Net Revenue (1) |
0.9% | |||
|
|
|
|||
| Higher net pricing |
1.5pp | |||
| Unfavorable volume/mix |
(0.6)pp | |||
| (1) | Please see the Non-GAAP Financial Measures section at the end of this item. |
Net revenue decline of 0.1% was driven by the impact of divestitures, partially offset by our underlying Organic Net Revenue growth of 0.9%, favorable currency and the impact of an acquisition. The impact of divestitures resulted in a year-over-year decline in net revenues of $383 million for 2017. Our underlying Organic Net Revenue increase was driven by higher net pricing, partially offset by unfavorable volume/mix. Net pricing was up, which includes the benefit of carryover pricing from 2016 as well as the effects of input cost-driven pricing actions taken during 2017. Higher net pricing was reflected in Latin America and AMEA, partially offset by lower net pricing in North America and Europe. Unfavorable volume/mix was reflected in all segments except Europe, in part due to expected shipments that we did not realize following the second quarter malware incident. Favorable year-over-year currency impacts increased net revenues by $77 million, due primarily to the strength of several currencies relative to the U.S. dollar, including the Brazilian real, euro, Russian ruble, Australian dollar, Indian rupee and South African rand, partially offset by the strength of the U.S. dollar relative to several currencies, including the Egyptian pound, British pound sterling, Argentinean peso, Nigerian naira, Turkish lira, Philippine peso and Chinese yuan. The November 2, 2016 acquisition of a business and license to manufacture, market and sell Cadbury-branded biscuits in additional key markets added $59 million (constant currency basis) of incremental net revenues for 2017.
30
Table of Contents
Operating Income – Operating income increased $937 million (36.5%) to $3,506 million in 2017, Adjusted Operating Income (1) increased $376 million (9.9%) to $4,178 million and Adjusted Operating Income on a constant currency basis (1) increased $376 million (9.9%) to $4,178 million due to the following:
| Operating | ||||||||
| Income | Change | |||||||
| (in millions) | ||||||||
| Operating Income for the Year Ended December 31, 2016 |
$ | 2,569 | ||||||
| 2014-2018 Restructuring Program costs (2) |
1,086 | |||||||
| Intangible asset impairment charges (3) |
137 | |||||||
| Mark-to-market losses from derivatives (4) |
94 | |||||||
| Acquisition integration costs (5) |
7 | |||||||
| Acquisition-related costs (5) |
1 | |||||||
| Divestiture-related costs (6) |
86 | |||||||
| Operating income from divestitures (6) |
(153 | ) | ||||||
| Gain on divestiture (6) |
(9 | ) | ||||||
| Gain on sale of intangible assets (7) |
(15 | ) | ||||||
| Other/rounding |
(1 | ) | ||||||
|
|
|
|||||||
| Adjusted Operating Income (1) for the Year Ended December 31, 2016 |
$ | 3,802 | ||||||
| Higher net pricing |
370 | |||||||
| Higher input costs |
(173 | ) | ||||||
| Unfavorable volume/mix |
(160 | ) | ||||||
| Lower selling, general and administrative expenses |
405 | |||||||
| Gains on sales of property in 2016 (8) |
(46 | ) | ||||||
| VAT-related settlement in 2016 |
(54 | ) | ||||||
| Property insurance recovery |
27 | |||||||
| Impact from acquisition (8) |
8 | |||||||
| Other |
(1 | ) | ||||||
|
|
|
|||||||
| Total change in Adjusted Operating Income (constant currency) (1) |
376 | 9.9% | ||||||
| Currency translation |
– | |||||||
|
|
|
|||||||
| Total change in Adjusted Operating Income (1) |
376 | 9.9% | ||||||
|
|
|
|||||||
| Adjusted Operating Income (1) for the Year Ended December 31, 2017 |
$ | 4,178 | ||||||
| 2014-2018 Restructuring Program costs (2) |
(792 | ) | ||||||
| Intangible asset impairment charges (3) |
(109 | ) | ||||||
| Mark-to-market losses from derivatives (4) |
(96 | ) | ||||||
| Malware incident incremental expenses |
(84 | ) | ||||||
| Acquisition integration costs (5) |
(3 | ) | ||||||
| Divestiture-related costs (6) |
(31 | ) | ||||||
| Operating income from divestitures (6) |
61 | |||||||
| Net gain on divestitures (6) |
186 | |||||||
| Benefits from resolution of tax matters (9) |
209 | |||||||
| CEO transition remuneration |
(14 | ) | ||||||
| Other/rounding |
1 | |||||||
|
|
|
|||||||
| Operating Income for the Year Ended December 31, 2017 |
$ | 3,506 | 36.5% | |||||
|
|
|
|||||||
| (1) | Refer to the Non-GAAP Financial Measures section at the end of this item. |
| (2) | Refer to Note 6, 2014-2018 Restructuring Program, for more information. |
| (3) | Refer to Note 2, Divestitures and Acquisitions, and Note 5, Goodwill and Intangible Assets, for more information on trademark impairments. |
| (4) | Refer to Note 8, Financial Instruments, Note 16, Segment Reporting, and Non-GAAP Financial Measures appearing later in this section for more information on the unrealized gains/losses on commodity and forecasted currency transaction derivatives. |
| (5) | Refer to Note 2, Divestitures and Acquisitions, for more information on the acquisition of a biscuit business in Vietnam. |
| (6) | Refer to Note 2, Divestitures and Acquisitions, for more information on the 2017 sales of a confectionery business in France, a grocery business in Australia and New Zealand, certain licenses of KHC-owned brands used in our grocery business within our Europe region, sale of one of our equity method investments and sale of a confectionary business in Japan. Additionally, the 2016 amount includes a sale of a confectionery business in Costa Rica. |
| (7) | Refer to Note 2, Divestitures and Acquisitions, for more information on the 2016 intangible asset sale in Finland. |
31
Table of Contents
| (8) | Refer to Note 2, Divestitures and Acquisitions, for more information on the 2016 purchase of a license to manufacture, market and sell Cadbury-branded biscuits in additional key markets and other property sales in 2016. |
| (9) | Refer to Note 12, Commitments and Contingencies – Tax Matters, for more information. Primarily includes the reversal of tax liabilities in connection with the resolution of a Brazilian indirect tax matter and settlement of pre-acquisition Cadbury tax matters. |
During 2017, we realized higher net pricing while input costs increased modestly. Higher net pricing, which included the carryover impact of pricing actions taken in 2016 as well as the effects of input cost-driven pricing actions taken during 2017, was driven by Latin America and AMEA, partially offset by lower net pricing in North America and Europe. The increase in input costs was driven by higher raw material costs which were partially offset by lower manufacturing costs due to productivity. Unfavorable volume/mix was driven by North America, Latin America and AMEA, which was partially offset by favorable volume/mix in Europe.
Total selling, general and administrative expenses decreased $629 million from 2016, due to a number of factors noted in the table above, including in part, the benefits from the resolution of tax matters, lower implementation costs incurred for the 2014-2018 Restructuring Program, lower divestiture-related costs, a property insurance recovery in AMEA and lower intangible asset impairment charges. The decreases were partially offset by gains on sales of property in 2016, unfavorable currency impact, Value-added tax (“VAT”) related settlements in 2016 and incremental expenses incurred due to the malware incident.
Excluding the factors noted above, selling, general and administrative expenses decreased $405 million from 2016. The decrease was driven primarily by lower overhead costs and lower advertising and consumer promotion costs due to continued cost reduction efforts in both areas.
Currency changes during the year did not impact operating income as the strength of the U.S. dollar relative to several currencies, including the Egyptian pound, British pound sterling and Argentinean peso, was offset by the strength of several currencies relative to the U.S. dollar, including the euro, Brazilian real, Russian ruble, Australian dollar, Indian rupee and South African rand.
Operating income margin increased from 9.9% in 2016 to 13.5% in 2017. The increase in operating income margin was driven primarily by an increase in our Adjusted Operating Income margin, lower 2014-2018 Restructuring Program costs, the benefits from the resolution of tax matters, the net gain on divestitures and lower divestiture-related costs, partially offset by incremental costs related to the malware incident and CEO transition remuneration costs. Adjusted Operating Income margin increased from 15.0% in 2016 to 16.3% in 2017. The increase in Adjusted Operating Income margin was driven primarily by lower overheads and lower advertising and consumer promotion costs due to continued cost reduction efforts in both areas.
32
Table of Contents
Net Earnings and Earnings per Share Attributable to Mondelēz International – Net earnings attributable to Mondelēz International of $2,922 million increased by $1,263 million (76.1%) in 2017. Diluted EPS attributable to Mondelēz International was $1.91 in 2017, up $0.86 (81.9%) from 2016. Adjusted EPS (1) was $2.14 in 2017, up $0.28 (15.1%) from 2016. Adjusted EPS on a constant currency basis (1) was $2.13 in 2017, up $0.27 (14.5%) from 2016.
| Diluted EPS | ||||
| Diluted EPS Attributable to Mondelēz International for the Year Ended December 31, 2016 |
$ | 1.05 | ||
| 2014-2018 Restructuring Program costs (2) |
0.51 | |||
| Intangible asset impairment charges (2) |
0.06 | |||
| Mark-to-market losses from derivatives (2) |
0.05 | |||
| Acquisition integration costs (2) |
0.01 | |||
| Divestiture-related costs (2) |
0.05 | |||
| Net earnings from divestitures (2) |
(0.08 | ) | ||
| Gain on sale of intangible assets (2) |
(0.01 | ) | ||
| Loss related to interest rate swaps (3) |
0.04 | |||
| Loss on debt extinguishment and related expenses (4) |
0.17 | |||
| Gain on equity method investment transaction (5) |
(0.03 | ) | ||
| Equity method investee acquisition-related and other adjustments (6) |
0.04 | |||
|
|
|
|||
| Adjusted EPS (1) for the Year Ended December 31, 2016 |
$ | 1.86 | ||
| Increase in operations |
0.22 | |||
| Increase in equity method investment net earnings |
0.02 | |||
| Gains on sales of property in 2016 (2) |
(0.02 | ) | ||
| VAT-related settlements in 2016 |
(0.04 | ) | ||
| Property insurance recovery |
0.01 | |||
| Impact from acquisition (2) |
– | |||
| Lower interest and other expense, net (7) |
0.08 | |||
| Changes in shares outstanding (8) |
0.05 | |||
| Changes in income taxes (9) |
(0.05 | ) | ||
|
|
|
|||
| Adjusted EPS (constant currency) (1) for the Year Ended December 31, 2017 |
$ | 2.13 | ||
| Favorable currency translation |
0.01 | |||
|
|
|
|||
| Adjusted EPS (1) for the Year Ended December 31, 2017 |
$ | 2.14 | ||
| 2014-2018 Restructuring Program costs (2) |
(0.39 | ) | ||
| Intangible asset impairment charges (2) |
(0.05 | ) | ||
| Mark-to-market losses from derivatives (2) |
(0.06 | ) | ||
| Malware incident incremental expenses |
(0.04 | ) | ||
| Acquisition integration costs (2) |
– | |||
| Divestiture-related costs (2) |
(0.02 | ) | ||
| Net earnings from divestitures (2) |
0.03 | |||
| Net gain on divestitures (2) |
0.11 | |||
| Benefits from resolution of tax matters (2) |
0.13 | |||
| CEO transition remuneration |
(0.01 | ) | ||
| U.S. tax reform discrete net tax benefit (10) |
0.04 | |||
| Gain on equity method investment transaction (11) |
0.02 | |||
| Equity method investee acquisition-related and other adjustments (6) |
0.01 | |||
|
|
|
|||
| Diluted EPS Attributable to Mondelēz International for the Year Ended December 31, 2017 |
$ | 1.91 | ||
|
|
|
|||
| (1) | Refer to the Non-GAAP Financial Measures section appearing later in this section. |
| (2) | See the Operating Income table above and the related footnotes for more information. |
| (3) | Refer to Note 8, Financial Instruments, for more information on our interest rate swaps, which we no longer designate as cash flow hedges effective the first quarter of 2016 due to changes in financing and hedging plans. |
| (4) | Refer to Note 7, Debt and Borrowing Arrangements, for more information on our loss on debt extinguishment and related expenses in connection with our debt tender offers. |
| (5) | Refer to Note 2, Divestitures and Acquisitions – Keurig Transaction, for more information on the 2016 acquisition of an interest in Keurig. |
33
Table of Contents
| (6) | Includes our proportionate share of unusual or infrequent items, such as acquisition and divestiture-related costs, restructuring program costs and discrete U.S. tax reform impacts recorded by our JDE and Keurig equity method investees. |
| (7) | Excludes the currency impact on interest expense related to our non-U.S. dollar-denominated debt which is included in currency translation. |
| (8) | Refer to Note 10, Stock Plans, for more information on our equity compensation programs, Note 11, Capital Stock, for more information on our share repurchase program and Note 15, Earnings Per Share, for earnings per share weighted-average share information. |
| (9) | Refer to Note 14, Income Taxes, for more information on the items affecting income taxes. |
| (10) | Refer to Note 14, Income Taxes, for more information on the impact of the U.S. tax reform. |
| (11) | Refer to Note 2, Divestitures and Acquisitions, for more information on the 2017 sale of an interest in one of our equity method investments. |
2016 compared with 2015
| For the Years Ended December 31, |
||||||||||||||||
| 2016 | 2015 | $ change | % change | |||||||||||||
| (in millions, except per share data) | ||||||||||||||||
| Net revenues |
$ | 25,923 | $ | 29,636 | $ | (3,713 | ) | (12.5)% | ||||||||
| Operating income |
2,569 | 8,897 | (6,328 | ) | (71.1)% | |||||||||||
| Earnings from continuing operations |
1,669 | 7,291 | (5,622 | ) | (77.1)% | |||||||||||
| Net earnings attributable to Mondelēz International |
1,659 | 7,267 | (5,608 | ) | (77.2)% | |||||||||||
| Diluted earnings per share attributable to |
1.05 | 4.44 | (3.39 | ) | (76.4)% | |||||||||||
Net Revenues – Net revenues decreased $3,713 million (12.5%) to $25,923 million in 2016, and Organic Net Revenue (1) increased $390 million (1.5%) to $26,411 million. Power Brands net revenues decreased 10.9%, primarily due to the deconsolidation of our historical coffee business, unfavorable currency and the deconsolidation of our historical Venezuelan operations, and Power Brands Organic Net Revenue increased 3.3%. Emerging markets net revenues decreased 19.1%, primarily due to the deconsolidation of our historical Venezuelan operations, unfavorable currency and the deconsolidation of our historical coffee business, and emerging markets Organic Net Revenue increased 2.7%. The underlying changes in net revenues and Organic Net Revenue are detailed below:
| 2016 | ||||
| Change in net revenues (by percentage point) |
||||
| Total change in net revenues |
(12.5)% | |||
| Add back of the following items affecting comparability: |
||||
| Historical coffee business (1) |
5.6pp | |||
| Unfavorable currency |
4.8pp | |||
| Historical Venezuelan operations (2) |
3.7pp | |||
| Impact of accounting calendar change |
0.3pp | |||
| Impact of acquisitions |
(0.4)pp | |||
| Impact of divestitures |
– | |||
|
|
|
|||
| Total change in Organic Net Revenue (3) |
1.5% | |||
|
|
|
|||
| Higher net pricing |
1.6pp | |||
| Unfavorable volume/mix |
(0.1)pp | |||
| (1) | Includes our historical global coffee business prior to the July 2, 2015 JDE coffee business transactions. Refer to Note 2, Divestitures and Acquisitions, and Non-GAAP Financial Measures appearing later in this section for more information. |
| (2) | Includes the historical results of our Venezuelan subsidiaries (including Venezuela currency impacts) prior to the December 31, 2015 deconsolidation. Refer to Note 1, Summary of Significant Accounting Policies – Currency Translation and Highly Inflationary Accounting: Venezuela, for more information. |
| (3) | Please see the Non-GAAP Financial Measures section at the end of this item. |
34
Table of Contents
Net revenue decline of 12.5% was driven by the impact of the deconsolidation of our historical coffee business, unfavorable currency, the deconsolidation of our historical Venezuelan operations and the year-over-year impact of the 2015 accounting calendar change, partially offset by our underlying Organic Net Revenue growth of 1.5%, and the impact of acquisitions. The adjustment for deconsolidating our historical coffee business resulted in a year-over-year decrease in net revenues of $1,627 million for 2016. Unfavorable currency impacts decreased net revenues by $1,233 million, due primarily to the strength of the U.S. dollar relative to several currencies, including the Argentinean peso, British pound sterling, Mexican peso, Brazilian real, Chinese yuan and Russian ruble. The deconsolidation of our historical Venezuelan operations resulted in a year-over-year decrease in net revenues of $1,217 million for 2016. The North America segment accounting calendar change in 2015 resulted in a year-over-year decrease in net revenues of $76 million for 2016. Our underlying Organic Net Revenue growth was driven by higher net pricing, partially offset by unfavorable volume/mix. Net pricing was up, which includes the benefit of carryover pricing from 2015 as well as the effects of input cost-driven pricing actions taken during 2016. Higher net pricing was reflected in Latin America and AMEA, partially offset by lower net pricing in Europe and North America. Unfavorable volume/mix was reflected in Latin America and AMEA, mostly offset by favorable volume/mix in Europe and North America. Unfavorable volume/mix in Latin America and AMEA was largely due to price elasticity as well as strategic decisions to exit certain low-margin product lines. The impact of acquisitions primarily includes the July 15, 2015 acquisition of a biscuit operation in Vietnam, which added $71 million of incremental net revenues for 2016, and the November 2, 2016 acquisition of a business and a license to manufacture, market and sell Cadbury-branded biscuits in additional key markets, which added $16 million of incremental net revenues for 2016.
35
Table of Contents
Operating Income – Operating income decreased $6,328 million (71.1%) to $2,569 million in 2016, Adjusted Operating Income (1) increased $486 million (14.7%) to $3,802 million and Adjusted Operating Income on a constant currency basis (1) increased $657 million (19.8%) to $3,973 million due to the following:
| Operating Income |
Change | |||||||
| (in millions) | ||||||||
| Operating Income for the Year Ended December 31, 2015 |
$ | 8,897 | ||||||
| 2012-2014 Restructuring Program costs (2) |
(4 | ) | ||||||
| 2014-2018 Restructuring Program costs (2) |
1,002 | |||||||
| Intangible asset impairment charges (3) |
71 | |||||||
| Mark-to-market gains from derivatives (4) |
(56 | ) | ||||||
| Acquisition integration costs (5) |
9 | |||||||
| Acquisition-related costs (5) |
8 | |||||||
| Operating income from divestiture (6) |
(182 | ) | ||||||
| Gain on divestiture (6) |
(13 | ) | ||||||
| Operating income from Venezuelan subsidiaries (7) |
(281 | ) | ||||||
| Remeasurement of net monetary assets in Venezuela (7) |
11 | |||||||
| Loss on deconsolidation of Venezuela (7) |
778 | |||||||
| Costs associated with the coffee business transactions (8) |
278 | |||||||
| Gain on the JDE coffee business transactions (8) |
(6,809 | ) | ||||||
| Reclassification of historical coffee business operating income (9) |
(342 | ) | ||||||
| Reclassification of equity method investment earnings (10) |
(51 | ) | ||||||
|
|
|
|||||||
| Adjusted Operating Income (1) for the Year Ended December 31, 2015 |
$ | 3,316 | ||||||
| Higher net pricing |
422 | |||||||
| Higher input costs |
(131 | ) | ||||||
| Favorable volume/mix |
11 | |||||||
| Lower selling, general and administrative expenses |
318 | |||||||
| Gains on sales of property (11) |
46 | |||||||
| Higher VAT-related settlements |
24 | |||||||
| Impact from acquisitions (11) |
4 | |||||||
| Impact of accounting calendar change (12) |
(36 | ) | ||||||
| Other |
(1 | ) | ||||||
|
|
|
|||||||
| Total change in Adjusted Operating Income (constant currency) (1) |
657 | 19.8 | % | |||||
| Unfavorable currency translation |
(171 | ) | ||||||
|
|
|
|||||||
| Total change in Adjusted Operating Income (1) |
486 | 14.7 | % | |||||
|
|
|
|||||||
| Adjusted Operating Income (1) for the Year Ended December 31, 2016 |
$ | 3,802 | ||||||
| 2014-2018 Restructuring Program costs (2) |
(1,086 | ) | ||||||
| Intangible asset impairment charges (3) |
(137 | ) | ||||||
| Mark-to-market losses from derivatives (4) |
(94 | ) | ||||||
| Acquisition integration costs (5) |
(7 | ) | ||||||
| Acquisition-related costs (5) |
(1 | ) | ||||||
| Divestiture-related costs (13) |
(86 | ) | ||||||
| Operating income from divestiture (6) |
153 | |||||||
| Gain on divestiture (6) |
9 | |||||||
| Gain on sale of intangible assets (14) |
15 | |||||||
| Other/rounding |
1 | |||||||
|
|
|
|
|
|||||
| Operating Income for the Year Ended December 31, 2016 |
$ | 2,569 | (71.1 | )% | ||||
|
|
|
|||||||
| (1) | Refer to the Non-GAAP Financial Measures section at the end of this item. |
| (2) | Refer to Note 6, 2014-2018 Restructuring Program, for more information. Refer to the Annual Report on Form 10-K for the year ended December 31, 2016 for additional information in Note 6, Restructuring Programs. |
36
Table of Contents
| (3) | Refer to Note 5, Goodwill and Intangible Assets, for more information on the impairment charges recorded in 2016 and 2015 related to trademarks. |
| (4) | Refer to Note 8, Financial Instruments, Note 16, Segment Reporting, and Non-GAAP Financial Measures appearing later in this section for more information on these unrealized gains and losses on commodity and forecasted currency transaction derivatives. |
| (5) | Refer to Note 2, Divestitures and Acquisitions, for more information on the acquisition of a biscuit business in Vietnam. |
| (6) | Refer to Note 2, Divestitures and Acquisitions, for more information on the December 1, 2016 sale of a confectionery business in Costa Rica. The sale of the confectionery business in Costa Rica generated a pre-tax and after-tax gain of $9 million in 2016. Refer to our Annual Report on Form 10-K for the year ended December 31, 2016 for more information on the April 23, 2015 divestiture of Ajinomoto General Foods, Inc. (“AGF”). The divestiture of AGF generated a pre-tax gain of $13 million and after-tax loss of $9 million in 2015. |
| (7) | Includes the historical results of our Venezuelan subsidiaries prior to the December 31, 2015 deconsolidation. Refer to Note 1, Summary of Significant Accounting Policies – Currency Translation and Highly Inflationary Accounting: Venezuela, for more information on the deconsolidation and remeasurement loss in 2015. |
| (8) | Refer to Note 2, Divestitures and Acquisitions, for more information on the JDE coffee business transactions. |
| (9) | Includes our historical global coffee business prior to the July 2, 2015 divestiture. We reclassified the results of our historical coffee business from Adjusted Operating Income and included them with equity method investment earnings in Adjusted EPS to facilitate comparisons of past and future coffee operating results. Refer to Note 2, Divestitures and Acquisitions, and Non-GAAP Financial Measures appearing later in this section for more information. |
| (10) | Historically, we have recorded income from equity method investments within our operating income as these investments operated as extensions of our base business. Beginning in the third quarter of 2015, to align with the accounting for JDE earnings, we began to record the earnings from our equity method investments in after-tax equity method investment earnings outside of operating income. In periods prior to July 2, 2015, we have reclassified the equity method earnings from Adjusted Operating Income to evaluate our operating results on a consistent basis. |
| (11) | Refer to Note 2, Divestitures and Acquisitions, for more information on the 2016 purchase of a license to manufacture, market and sell Cadbury-branded biscuits in additional key markets and other property sales in 2016. |
| (12) | Refer to Note 1, Summary of Significant Accounting Policies – Accounting Calendar Change, for more information on the accounting calendar change in 2015. |
| (13) | Includes costs incurred and accrued related to the planned sale of a confectionery business in France. Refer to Note 2, Divestitures and Acquisitions, for more information. |
| (14) | Refer to Note 2, Divestitures and Acquisitions, for more information on the 2016 intangible asset sale in Finland. |
During 2016, we realized higher net pricing while input costs increased modestly. Higher net pricing, which included the carryover impact of pricing actions taken in 2015, was reflected in Latin America and AMEA, partially offset by lower net pricing in Europe and North America. The increase in input costs was driven by higher raw material costs, in part due to higher currency exchange transaction costs on imported materials, which were partially offset by lower manufacturing costs due to productivity. Favorable volume/mix was driven by Europe and North America, which was mostly offset by unfavorable volume/mix in Latin America and AMEA.
Total selling, general and administrative expenses decreased $1,037 million from 2015, due to a number of factors noted in the table above, including in part, the deconsolidation of our historical coffee business, a favorable currency impact, lower costs associated with the JDE coffee business transactions, the deconsolidation of our Venezuelan operations, gains on the sales of property, VAT-related settlements and the absence of devaluation charges related to our net monetary assets in Venezuela in 2016. The decreases were partially offset by increases from divestiture-related costs associated with the planned sale of a confectionery business in France, the reclassification of equity method investment earnings, higher implementation costs incurred for the 2014-2018 Restructuring Program and the impact of acquisitions.
Excluding the factors noted above, selling, general and administrative expenses decreased $318 million from 2015. The decrease was driven primarily by lower overhead costs due to continued cost reduction efforts.
We recorded a benefit of $54 million in 2016 from VAT-related settlements in Latin America as compared to $30 million in 2015. Unfavorable currency impacts decreased operating income by $171 million due primarily to the strength of the U.S. dollar relative to most currencies, including the British pound sterling, Argentinean peso and Mexican peso.
Operating income margin decreased from 30.0% in 2015 to 9.9% in 2016. The decrease in operating income margin was driven primarily by last year’s pre-tax gain on the JDE coffee business transactions, the deconsolidation of our historical coffee business, the deconsolidation of our Venezuelan operations, the unfavorable year-over-year change in mark-to-market gains/losses from derivatives, higher costs incurred for the 2014-2018 Restructuring Program, divestiture-related costs associated with the planned sale of a confectionery business in France, higher intangible asset impairment charges and the reclassification of equity method earnings. The items that decreased our operating income margin were partially offset by the prior-year loss on the Venezuela deconsolidation, an increase in our Adjusted Operating Income margin and the absence of costs associated with the JDE coffee business transactions. Adjusted Operating Income margin increased from 12.7% in 2015 to 15.0% in 2016. The increase in Adjusted Operating Income margin was driven primarily by lower overheads from cost reduction programs, improved gross margin reflecting productivity efforts, gains on sales of property and VAT-related settlements.
37
Table of Contents
Net Earnings and Earnings per Share Attributable to Mondelēz International – Net earnings attributable to Mondelēz International of $1,659 million decreased by $5,608 million (77.2%) in 2016. Diluted EPS attributable to Mondelēz International was $1.05 in 2016, down $3.39 (76.4%) from 2015. Adjusted EPS (1) was $1.86 in 2016, up $0.33 (21.6%) from 2015. Adjusted EPS on a constant currency basis (1) was $1.92 in 2016, up $0.39 (25.5%) from 2015.
| Diluted EPS | ||||
| Diluted EPS Attributable to Mondelēz International for the Year Ended December 31, 2015 |
$ | 4.44 | ||
| 2014-2018 Restructuring Program costs (2) |
0.45 | |||
| Intangible asset impairment charges (3) |
0.03 | |||
| Mark-to-market gains from derivatives (4) |
(0.03 | ) | ||
| Acquisition integration costs (5) |
– | |||
| Acquisition-related costs (5) |
– | |||
| Net earnings from divestiture (6) |
(0.07 | ) | ||
| Loss on divestiture (6) |
0.01 | |||
| Net earnings from Venezuelan subsidiaries (7) |
(0.10 | ) | ||
| Remeasurement of net monetary assets in Venezuela (7) |
0.01 | |||
| Loss on deconsolidation of Venezuela (7) |
0.48 | |||
| Gain on the JDE coffee business transactions (8) |
(4.05 | ) | ||
| (Income) / costs associated with the JDE coffee business transactions (8) |
(0.01 | ) | ||
| Loss related to interest rate swaps (9) |
0.01 | |||
| Loss on debt extinguishment and related expenses (10) |
0.29 | |||
| Equity method investee acquisition-related and other adjustments (11) |
0.07 | |||
|
|
|
|||
| Adjusted EPS (1) for the Year Ended December 31, 2015 |
$ | 1.53 | ||
| Increase in operations |
0.28 | |||
| Decrease in operations from historical coffee business, |
(0.05 | ) | ||
| Gains on sales of property (5) |
0.02 | |||
| VAT-related settlements |
0.03 | |||
| Impact of acquisitions (5) |
– | |||
| Impact of accounting calendar change (13) |
(0.01 | ) | ||
| Lower interest and other expense, net (14) |
– | |||
| Changes in shares outstanding (15) |
0.08 | |||
| Changes in income taxes (16) |
0.04 | |||
|
|
|
|||
| Adjusted EPS (constant currency) (1) for the Year Ended December 31, 2016 |
$ | 1.92 | ||
| Unfavorable currency translation |
(0.06 | ) | ||
|
|
|
|||
| Adjusted EPS (1) for the Year Ended December 31, 2016 |
$ | 1.86 | ||
| 2014-2018 Restructuring Program costs (2) |
(0.51 | ) | ||
| Intangible asset impairment charges (3) |
(0.06 | ) | ||
| Mark-to-market losses from derivatives (4) |
(0.05 | ) | ||
| Acquisition integration costs (5) |
(0.01 | ) | ||
| Acquisition-related costs (5) |
– | |||
| Divestiture-related costs (17) |
(0.05 | ) | ||
| Net earnings from divestiture (6) |
0.08 | |||
| Gain on divestiture (6) |
– | |||
| Gain on sale of intangible assets (5) |
0.01 | |||
| Loss related to interest rate swaps (9) |
(0.04 | ) | ||
| Loss on debt extinguishment and related expenses (10) |
(0.17 | ) | ||
| Gain on equity method investment transaction (18) |
0.03 | |||
| Equity method investee acquisition-related and other adjustments (11) |
(0.04 | ) | ||
|
|
|
|||
| Diluted EPS Attributable to Mondelēz International for the Year Ended December 31, 2016 |
$ | 1.05 | ||
|
|
|
|||
| (1) | Refer to the Non-GAAP Financial Measures section appearing later in this section. |
| (2) | Refer to Note 6, 2014-2018 Restructuring Program, for more information. |
| (3) | Refer to Note 5, Goodwill and Intangible Assets, for more information on the impairment charges recorded in 2016 and 2015 related to trademarks. |
38
Table of Contents
| (4) | Refer to Note 8, Financial Instruments, Note 16, Segment Reporting, and Non-GAAP Financial Measures appearing later in this section for more information on these unrealized gains and losses on commodity and forecasted currency transaction derivatives. |
| (5) | Refer to Note 2, Divestitures and Acquisitions, for more information on the 2016 purchase of a license to manufacture, market and sell Cadbury-branded biscuits in additional key markets, 2016 intangible asset sale in Finland, 2015 acquisitions of a biscuit operation in Vietnam and Enjoy Life Foods and other property sales in 2016. |
| (6) | Refer to Note 2, Divestitures and Acquisitions, for more information on the December 1, 2016 sale of a confectionery business in Costa Rica. The sale of the confectionery business in Costa Rica generated a pre-tax and after-tax gain of $9 million in 2016. Refer to our Annual Report on Form 10-K for the year ended December 31, 2016 for more information on the April 23, 2015 divestiture of AGF. The divestiture of AGF generated a pre-tax gain of $13 million and after-tax loss of $9 million in 2015. |
| (7) | Includes the historical results of our Venezuelan subsidiaries prior to the December 31, 2015 deconsolidation. Refer to Note 1, Summary of Significant Accounting Policies – Currency Translation and Highly Inflationary Accounting: Venezuela, for more information on the deconsolidation and remeasurement loss in 2015. |
| (8) | Refer to Note 2, Divestitures and Acquisitions, for more information on the JDE coffee business transactions. Net gains of $436 million in 2015 on the currency hedges related to the coffee business transactions were recorded in interest and other expense, net and are included in the income/(costs) associated with the coffee business transactions of $(0.01) in the table above. |
| (9) | Refer to Note 8, Financial Instruments, for more information on our interest rate swaps, which we no longer designate as cash flow hedges due to a change in financing and hedging plans. |
| (10) | Refer to Note 7, Debt and Borrowing Arrangements, for more information on our loss on debt extinguishment and related expenses in connection with our debt tender offers. |
| (11) | Includes our proportionate share of unusual or infrequent items, such as acquisition and divestiture-related costs and restructuring program costs, recorded by our JDE and Keurig equity method investees. |
| (12) | Includes our historical global coffee business prior to the July 2, 2015 deconsolidation. We reclassified the results of our historical coffee business from Adjusted Operating Income and included them with equity method investment earnings in Adjusted EPS to facilitate comparisons of past and future coffee operating results. Refer to Note 2, Divestitures and Acquisitions, and Non-GAAP Financial Measures appearing later in this section for more information. |
| (13) | Refer to Note 1, Summary of Significant Accounting Policies, for more information on the accounting calendar change in 2015. |
| (14) | Excludes the favorable currency impact on interest expense related to our non-U.S. dollar-denominated debt which is included in currency translation. |
| (15) | Refer to Note 10, Stock Plans, for more information on our equity compensation programs, Note 11, Capital Stock, for more information on our share repurchase program and Note 15, Earnings Per Share, for earnings per share weighted-average share information. |
| (16) | Refer to Note 14, Income Taxes, for more information on items affecting income taxes. |
| (17) | Includes costs incurred and accrued related to the planned sale of a confectionery business in France. Refer to Note 2, Divestitures and Acquisitions, for more information. |
| (18) | Refer to Note 2, Divestitures and Acquisitions – Keurig Transaction, for more information on the 2016 acquisition of an interest in Keurig. |
Results of Operations by Reportable Segment
Our operations and management structure are organized into four reportable operating segments:
| • | Latin America |
| • | AMEA |
| • | Europe |
| • | North America |
On October 1, 2016, we integrated our EEMEA operating segment into our Europe and Asia Pacific operating segments to further leverage and optimize the operating scale built within the Europe and Asia Pacific regions. Russia, Ukraine, Turkey, Belarus, Georgia and Kazakhstan were combined within our Europe operating segment, while the remaining Middle East and African countries were combined within our Asia Pacific region to form a new AMEA regional operating segment. We have reflected the segment change as if it had occurred in all periods presented.
We manage our operations by region to leverage regional operating scale, manage different and changing business environments more effectively and pursue growth opportunities as they arise in our key markets. Our regional management teams have responsibility for the business, product categories and financial results in the regions.
Historically, we have recorded income from equity method investments within our operating income as these investments were part of our base business. Beginning in the third quarter of 2015, to align with the accounting for our new coffee equity method investment in JDE, we began to record the earnings from our equity method investments in equity method investment earnings outside of segment operating income. For the six months ended December 31, 2015, after-tax equity method investment net earnings were less than $1 million on a combined basis. Earnings from equity method investments through July 2, 2015 recorded within segment operating income were $52 million in AMEA and $4 million in North America. See Note 1, Summary of Significant Accounting Policies – Principles of Consolidation, and Note 2, Divestitures and Acquisitions, for additional information.
39
Table of Contents
In 2015, we also began to report stock-based compensation for our corporate employees within general corporate expenses that were reported within our North America region. We reclassified $32 million of corporate stock-based compensation expense in 2015 from the North America segment to general corporate expenses.
We use segment operating income to evaluate segment performance and allocate resources. We believe it is appropriate to disclose this measure to help investors analyze segment performance and trends. See Note 16, Segment Reporting, for additional information on our segments and Items Affecting Comparability of Financial Results earlier in this section for items affecting our segment operating results.
Our segment net revenues and earnings, reflecting our current segment structure for all periods presented, were:
| For the Years Ended December 31, | ||||||||||||
| 2017 | 2016 | 2015 | ||||||||||
| (in millions) | ||||||||||||
| Net revenues: |
||||||||||||
| Latin America (1) |
$ | 3,566 | $ | 3,392 | $ | 4,988 | ||||||
| AMEA (2) |
5,739 | 5,816 | 6,002 | |||||||||
| Europe (2) |
9,794 | 9,755 | 11,672 | |||||||||
| North America |
6,797 | 6,960 | 6,974 | |||||||||
|
|
|
|
|
|
|
|||||||
| Net revenues |
$ | 25,896 | $ | 25,923 | $ | 29,636 | ||||||
|
|
|
|
|
|
|
|||||||
| (1) | Net revenues of $1,217 million for 2015 from our Venezuelan subsidiaries are included in our consolidated financial statements. Beginning in 2016, we account for our Venezuelan subsidiaries using the cost method of accounting and no longer include net revenues of our Venezuelan subsidiaries within our consolidated financial statements. Refer to Note 1, Summary of Significant Accounting Policies – Currency Translation and Highly Inflationary Accounting: Venezuela, for more information. |
| (2) | On July 2, 2015, we contributed our global coffee businesses primarily from our Europe and AMEA segments. Net revenues of our global coffee business were $1,561 million in Europe and $66 million in AMEA for the year ended December 31, 2015. Refer to Note 2, Divestitures and Acquisitions – JDE Coffee Business Transactions, for more information. |
| For the Years Ended December 31, | ||||||||||||
| 2017 | 2016 | 2015 | ||||||||||
| (in millions) | ||||||||||||
| Earnings before income taxes: |
||||||||||||
| Operating income: |
||||||||||||
| Latin America |
$ | 565 | $ | 271 | $ | 485 | ||||||
| AMEA |
516 | 506 | 389 | |||||||||
| Europe |
1,680 | 1,267 | 1,350 | |||||||||
| North America |
1,120 | 1,078 | 1,105 | |||||||||
| Unrealized (losses)/gains on hedging activities |
(96 | ) | (94 | ) | 96 | |||||||
| General corporate expenses |
(287 | ) | (291 | ) | (383 | ) | ||||||
| Amortization of intangibles |
(178 | ) | (176 | ) | (181 | ) | ||||||
| Net gain on divestitures |
186 | 9 | 6,822 | |||||||||
| Loss on deconsolidation of Venezuela |
– | – | (778 | ) | ||||||||
| Acquisition-related costs |
– | (1 | ) | (8 | ) | |||||||
|
|
|
|
|
|
|
|||||||
| Operating income |
3,506 | 2,569 | 8,897 | |||||||||
| Interest and other expense, net |
(382 | ) | (1,115 | ) | (1,013 | ) | ||||||
|
|
|
|
|
|
|
|||||||
| Earnings before income taxes |
$ | 3,124 | $ | 1,454 | $ | 7,884 | ||||||
|
|
|
|
|
|
|
|||||||
40
Table of Contents
Latin America
| For the Years Ended December 31, |
||||||||||||||||
| 2017 | 2016 | $ change | % change | |||||||||||||
| (in millions) | ||||||||||||||||
| Net revenues |
$ | 3,566 | $ | 3,392 | $ | 174 | 5.1% | |||||||||
| Segment operating income |
565 | 271 | 294 | 108.5% | ||||||||||||
| For the Years Ended December 31, |
||||||||||||||||
| 2016 | 2015 | $ change | % change | |||||||||||||
| (in millions) | ||||||||||||||||
| Net revenues |
$ | 3,392 | $ | 4,988 | $ | (1,596) | (32.0)% | |||||||||
| Segment operating income |
271 | 485 | (214) | (44.1)% | ||||||||||||
2017 compared with 2016:
Net revenues increased $174 million (5.1%), due to higher net pricing (7.7 pp) and favorable currency (1.9 pp), partially offset by unfavorable volume/mix (4.2 pp) and the impact of a divestiture (0.3 pp). Higher net pricing was reflected across all categories driven primarily by Argentina, Brazil and Mexico. Favorable currency impacts were due primarily to the strength of several currencies in the region relative to the U.S. dollar, primarily the Brazilian real, partially offset by the strength of the U.S. dollar relative to the Argentinean peso and Mexican peso. Unfavorable volume/mix, which occurred across most of the region, was largely due to the impact of pricing-related elasticity. In addition, only a portion of the shipments delayed at the end of the second quarter due to the malware incident was recovered. Unfavorable volume/mix was driven by declines in all categories except chocolate and candy. On December 1, 2016, we sold a small confectionery business in Costa Rica.
Segment operating income increased $294 million (108.5%), primarily due to higher net pricing, the benefit from the resolution of a Brazilian indirect tax matter of $153 million, lower manufacturing costs, lower costs incurred for the 2014-2018 Restructuring Program, favorable currency and lower advertising and consumer promotion costs. These favorable items were partially offset by higher raw material costs, unfavorable volume/mix and higher other selling, general and administrative expenses (net of prior-year VAT-related settlements).
2016 compared with 2015:
Net revenues decreased $1,596 million (32.0%), due to the deconsolidation of our Venezuelan operations (21.9 pp), unfavorable currency (14.8 pp), unfavorable volume/mix (5.3 pp) and the impact of a divestiture (0.1 pp), partially offset by higher net pricing (10.1 pp). The deconsolidation of our Venezuelan operations resulted in a year-over-year decrease in net revenues of $1,217 million. Unfavorable currency impacts were due primarily to the strength of the U.S. dollar relative to most currencies in the region, including the Argentinean peso and Mexican peso. Unfavorable volume/mix, which primarily occurred in Brazil and Argentina, was largely due to the impact of pricing-related elasticity as well as strategic decisions to exit certain low-margin product lines. Unfavorable volume/mix was driven by declines in all categories except for cheese & grocery. Higher net pricing was reflected across all categories driven primarily by Argentina, Brazil and Mexico.
Segment operating income decreased $214 million (44.1%), primarily due to higher raw material costs, the deconsolidation of our Venezuelan operations, unfavorable volume/mix and unfavorable currency. These unfavorable items were partially offset by higher net pricing, lower other selling, general and administrative expenses (including higher year-over year VAT-related settlements), lower manufacturing costs, lower advertising and consumer promotion costs, lower costs incurred for the 2014-2018 Restructuring Program and the absence of remeasurement losses in 2016 related to our net monetary assets in Venezuela.
41
Table of Contents
AMEA
| For the Years Ended December 31, |
||||||||||||||||
| 2017 | 2016 | $ change | % change | |||||||||||||
| (in millions) | ||||||||||||||||
| Net revenues |
$ | 5,739 | $ | 5,816 | $ | (77) | (1.3)% | |||||||||
| Segment operating income |
516 | 506 | 10 | 2.0% | ||||||||||||
| For the Years Ended December 31, |
||||||||||||||||
| 2016 | 2015 | $ change | % change | |||||||||||||
| (in millions) | ||||||||||||||||
| Net revenues |
$ | 5,816 | $ | 6,002 | $ | (186) | (3.1)% | |||||||||
| Segment operating income |
506 | 389 | 117 | 30.1% | ||||||||||||
2017 compared with 2016:
Net revenues decreased $77 million (1.3%), due to the impact of divestitures (2.2 pp), unfavorable currency (1.8 pp) and unfavorable volume/mix (0.2 pp), partially offset by higher net pricing (2.9 pp). The impact of divestitures, primarily related to the grocery & cheese business in Australia and New Zealand that was divested on July 4, 2017, resulted in a year-over-year decline in net revenues of $128 million for 2017. Unfavorable currency impacts were due primarily to the strength of the U.S. dollar relative to several currencies in the region, including the Egyptian pound, Nigerian naira, Philippine peso, Chinese yuan and Japanese yen, partially offset by the strength of several other currencies in the region relative to the U.S. dollar, including the Australian dollar, Indian rupee and South African rand. Unfavorable volume/mix was driven by declines in refreshment beverages, cheese & grocery, gum and candy, partially offset by gains in chocolate and biscuits. In addition, only a portion of the shipments delayed at the end of the second quarter due to the malware incident was recovered. Higher net pricing was reflected across all categories except cheese & grocery.
Segment operating income increased $10 million (2.0%), primarily due to higher net pricing, lower other selling, general and administrative expenses (including a property insurance recovery), lower manufacturing costs and lower advertising and consumer promotion costs. These favorable items were mostly offset by higher raw material costs, unfavorable currency, unfavorable volume/mix, higher costs incurred for the 2014-2018 Restructuring Program, the impact of divestitures and higher intangible asset impairment charges.
2016 compared with 2015:
Net revenues decreased $186 million (3.1%), due to unfavorable currency (3.9 pp), the adjustment for deconsolidating our historical coffee business (1.1 pp) and unfavorable volume/mix (1.0 pp), partially offset by higher net pricing (1.7 pp) and the impact of an acquisition (1.2 pp). Unfavorable currency impacts were due primarily to the strength of the U.S. dollar relative to most currencies in the region, including the Chinese yuan, Indian rupee, South African rand, Egyptian pound, Nigerian naira, Philippine peso and Australian dollar, partially offset by the strength of the Japanese yen relative to the U.S. dollar. The adjustment for deconsolidating our historical coffee business resulted in a year-over-year decrease in net revenues of $66 million. Unfavorable volume/mix, including the unfavorable impact of strategic decisions to exit certain low-margin product lines, was driven by declines in candy, refreshment beverages, cheese & grocery and chocolate, partially offset by gains in biscuits and gum. Higher net pricing was driven by chocolate, candy, biscuits and refreshment beverages, partially offset by lower net pricing in gum and cheese & grocery. The acquisition of a biscuit operation in Vietnam in July 2015 added net revenues of $71 million (constant currency basis).
Segment operating income increased $117 million (30.1%), primarily due to lower manufacturing costs, higher net pricing, lower other selling, general and administrative expenses, lower costs incurred for the 2014-2018 Restructuring Program, the absence of costs associated with the coffee business transactions and the impact of the Vietnam acquisition. These favorable items were partially offset by higher raw material costs, the reclassification of equity method investment earnings, unfavorable volume/mix, unfavorable currency, the deconsolidation of our historical coffee business and the impact of divestitures.
42
Table of Contents
Europe
| For the Years Ended December 31, |
||||||||||||||||
| 2017 | 2016 | $ change | % change | |||||||||||||
| (in millions) | ||||||||||||||||
| Net revenues |
$ | 9,794 | $ | 9,755 | $ | 39 | 0.4% | |||||||||
| Segment operating income |
1,680 | 1,267 | 413 | 32.6% | ||||||||||||
| For the Years Ended December 31, |
||||||||||||||||
| 2016 | 2015 | $ change | % change | |||||||||||||
| (in millions) | ||||||||||||||||
| Net revenues |
$ | 9,755 | $ | 11,672 | $ | (1,917) | (16.4)% | |||||||||
| Segment operating income |
1,267 | 1,350 | (83) | (6.1)% | ||||||||||||
2017 compared with 2016:
Net revenues increased $39 million (0.4%), due to favorable volume/mix (1.4 pp), favorable currency (1.0 pp), and the impact of an acquisition (0.6 pp), partially offset by the impact of divestitures (2.5 pp) and lower net pricing (0.1 pp). Favorable volume/mix was driven by chocolate and biscuits, partially offset by declines in gum, cheese & grocery, candy and refreshment beverages. In addition, a portion of the shipments delayed at the end of the second quarter due to the malware incident was not recovered. Favorable currency impacts reflected the strength of several other currencies relative to the U.S. dollar, primarily the euro and Russian ruble, partially offset by the strength of the U.S. dollar against several currencies in the region, including the British pound sterling and Turkish lira. The November 2016 acquisition of a business and license to manufacture, market and sell Cadbury-branded biscuits added net revenues of $59 million (constant currency basis). The impact of divestitures, primarily due to the sale of a confectionery business in France, resulted in a year-over-year decline in net revenues of $234 million for 2017. Lower net pricing was driven by biscuits, mostly offset by higher net pricing in all other categories.
Segment operating income increased $413 million (32.6%), primarily due to lower manufacturing costs, lower costs incurred for the 2014-2018 Restructuring Program, lower other selling, general and administrative expenses, lower divestiture-related costs, lower advertising and consumer promotion costs, the benefit from the settlement of a Cadbury tax matter, favorable volume/mix, lower intangible asset impairment charges, favorable currency and the impact of an acquisition. These favorable items were partially offset by higher raw material costs, the impact of divestitures, incremental costs incurred due to the malware incident, lower net pricing and a prior-year gain on the sale of an intangible asset.
2016 compared with 2015:
Net revenues decreased $1,917 million (16.4%), due to the adjustment for deconsolidating our historical coffee business (12.9 pp), unfavorable currency (4.4 pp), lower net pricing (0.4 pp) and the impact of divestitures (0.2 pp), partially offset by favorable volume/mix (1.3 pp) and the impact of an acquisition (0.2 pp). The adjustment for deconsolidating our historical coffee business resulted in a year-over-year decrease in net revenues of $1,561 million. Unfavorable currency impacts reflected the strength of the U.S. dollar against most currencies in the region, primarily the British pound sterling. Lower net pricing was reflected across most categories except candy and gum. Favorable volume/mix, including the unfavorable impact of strategic decisions to exit certain low-margin product lines, was driven by biscuits, chocolate and cheese & grocery, partially offset by declines in gum, candy and refreshment beverages. The purchase of the license to manufacture, market and sell Cadbury-branded biscuits in November 2016 added net revenues of $16 million (constant currency basis).
Segment operating income decreased $83 million (6.1%), primarily due to the deconsolidation of our historical coffee business, unfavorable currency, higher raw material costs, divestiture-related costs, higher costs incurred for the 2014-2018 Restructuring Program, lower net pricing, higher intangible asset impairment charges and the impact of divestitures. These unfavorable items were partially offset by the absence of costs associated with the JDE coffee business transactions, lower manufacturing costs, lower other selling, general and administrative expenses, favorable volume/mix and a gain on the sale of an intangible asset.
43
Table of Contents
North America
| For the Years Ended | ||||||||||||||||
| December 31, | ||||||||||||||||
| 2017 | 2016 | $ change | % change | |||||||||||||
| (in millions) | ||||||||||||||||
| Net revenues |
$ | 6,797 | $ | 6,960 | $ | (163 | ) | (2.3)% | ||||||||
| Segment operating income |
1,120 | 1,078 | 42 | 3.9 % | ||||||||||||
| For the Years Ended | ||||||||||||||||
| December 31, | ||||||||||||||||
| 2016 | 2015 | $ change | % change | |||||||||||||
| (in millions) | ||||||||||||||||
| Net revenues |
$ | 6,960 | $ | 6,974 | $ | (14 | ) | (0.2)% | ||||||||
| Segment operating income |
1,078 | 1,105 | (27 | ) | (2.4)% | |||||||||||
2017 compared with 2016:
Net revenues decreased $163 million (2.3%), due to unfavorable volume/mix (1.8 pp), lower net pricing (0.6 pp) and the impact of divestitures (0.1 pp), partially offset by favorable currency (0.2 pp). Unfavorable volume/mix, primarily caused by shipments delayed at the end of the second quarter due to the malware incident that were not recovered, was driven by declines in gum, biscuits and candy, partially offset by a gain in chocolate. Lower net pricing was reflected in biscuits and chocolate, partially offset by higher net pricing in candy and gum. Favorable currency impact was due to the strength of the Canadian dollar relative to the U.S. dollar.
Segment operating income increased $42 million (3.9%), primarily due to lower costs incurred for the 2014-2018 Restructuring Program, lower other selling, general and administrative expenses (net of the prior-year’s gain on sale of property), lower manufacturing costs, lower advertising and consumer promotion costs and lower raw material costs. These favorable items were partially offset by unfavorable volume/mix, incremental costs incurred due to the malware incident, lower net pricing, the impact of divestitures and prior-year gain on the sale of an intangible asset.
2016 compared with 2015:
Net revenues decreased $14 million (0.2%), due to the impact of an accounting calendar change made in the prior year (1.1 pp), unfavorable currency (0.3 pp) and lower net pricing (0.2 pp), mostly offset by favorable volume/mix (1.4 pp). The prior-year change in North America’s accounting calendar resulted in a year-over-year decrease in net revenues of $76 million. Unfavorable currency impact was due to the strength of the U.S. dollar relative to the Canadian dollar. Lower net pricing was reflected in biscuits and candy, partially offset by higher net pricing in chocolate and gum. Favorable volume/ mix, including the unfavorable impact of strategic decisions to exit certain low-margin product lines, was driven by gains in biscuits and candy, partially offset by declines in gum and chocolate.
Segment operating income decreased $27 million (2.4%), primarily due to higher costs incurred for the 2014-2018 Restructuring Program, higher advertising and consumer promotion costs, intangible asset impairment charges, the year-over-year impact of the prior-year accounting calendar change, higher raw material costs and lower net pricing. These unfavorable items were mostly offset by lower other selling, general and administrative expenses (including the gain on sale of property), lower manufacturing costs, favorable volume/mix and the gain on the sale of an intangible asset.
44
Table of Contents
We prepare our consolidated financial statements in conformity with U.S. GAAP. The preparation of these financial statements requires the use of estimates, judgments and assumptions that affect the reported amounts of assets and liabilities at the date of the financial statements and reported amounts of revenues and expenses during the periods presented. Actual results could differ from those estimates and assumptions. Note 1, Summary of Significant Accounting Policies, to the consolidated financial statements includes a summary of the significant accounting policies we used to prepare our consolidated financial statements. We have discussed the selection and disclosure of our critical accounting policies and estimates with our Audit Committee. The following is a review of our most significant assumptions and estimates.
Goodwill and Non-Amortizable Intangible Assets:
We have historically annually tested goodwill and non-amortizable intangible assets for impairment as of October 1. This year, we voluntarily changed the annual impairment assessment date from October 1 to July 1. We believe this measurement date, which represents a change in the method of applying an accounting principle, is preferable because it better aligns with our strategic business planning process and financial forecasts which are key components of the annual impairment tests. The change in the measurement date did not delay, accelerate or prevent an impairment charge. Each quarter, we have evaluated goodwill and intangible asset impairment risks and recognized any related impairments to date. As such, the change in the annual test date was applied on July 1, 2017.
We assess goodwill impairment risk throughout the year by performing a qualitative review of entity-specific, industry, market and general economic factors affecting our goodwill reporting units. We review our operating segment and reporting unit structure for goodwill testing annually or as significant changes in the organization occur. Annually, we may perform qualitative testing, or depending on factors such as prior-year test results, current year developments, current risk evaluations and other practical considerations, we may elect to do quantitative testing instead. In our quantitative testing, we compare a reporting unit’s estimated fair value with its carrying value. We estimate a reporting unit’s fair value using a discounted cash flow method which incorporates planned growth rates, market-based discount rates and estimates of residual value. This year, for our Europe and North America reporting units, we used a market-based, weighted-average cost of capital of 7.2% to discount the projected cash flows of those operations. For our Latin America and AMEA reporting units, we used a risk-rated discount rate of 10.2%. Estimating the fair value of individual reporting units requires us to make assumptions and estimates regarding our future plans and industry and economic conditions, and our actual results and conditions may differ over time. If the carrying value of a reporting unit’s net assets exceeds its fair value, we would recognize an impairment charge for the amount by which the carrying value exceeds the reporting unit fair value.
In 2017, 2016 and 2015, there were no impairments of goodwill. In connection with our 2017 annual impairment testing, each of our reporting units had sufficient fair value in excess of carrying value. While all reporting units passed our annual impairment testing, if we do not meet business performance expectations or specific valuation factors outside of our control, such as discount rates, change significantly, then the estimated fair values of a reporting unit or reporting units might decline and lead to a goodwill impairment in the future.
Annually, we assess non-amortizable intangible assets for impairment by performing a qualitative review and assessing events and circumstances that could affect the fair value or carrying value of the indefinite-lived intangible assets. If significant potential impairment risk exists for a specific asset, we quantitatively test it for impairment by comparing its estimated fair value with its carrying value. We determine estimated fair value using planned growth rates, market-based discount rates and estimates of royalty rates. If the carrying value of the asset exceeds its estimated fair value, the asset is impaired and its carrying value is reduced to the estimated fair value.
45
Table of Contents
During our 2017 annual testing of non-amortizable intangible assets, we recorded $70 million of impairment charges in the third quarter of 2017 related to five trademarks. The impairments arose due to lower than expected product growth in part driven by decisions to redirect support from these trademarks to other regional and global brands. We recorded charges related to candy and gum trademarks of $52 million in AMEA, $11 million in Europe, $5 million in Latin America and $2 million in North America. The impairment charges were calculated as the excess of the carrying value over the estimated fair value of the intangible assets on a global basis and were recorded within asset impairment and exit costs. We primarily use a relief of royalty valuation method, which utilizes estimates of future sales, growth rates, royalty rates and discount rates in determining a brand’s global fair value. We also noted thirteen brands, including the five impaired trademarks, with $963 million of aggregate book value as of December 31, 2017 that each had a fair value in excess of book value of 10% or less. We believe our current plans for each of these brands will allow them to continue to not be impaired, but if we do not meet the product line expectations or specific valuation factors outside of our control, such as discount rates, change significantly, then a brand or brands could become impaired in the future. In 2016, we recorded charges related to biscuits, candy and gum trademarks of $41 million in AMEA, $32 million in North America, $22 million in Europe, and $3 million in Latin America. In 2015, we recorded a $44 million charge related to candy and biscuit trademarks in AMEA, $22 million in Europe and $5 million in Latin America.
Refer to Note 5, Goodwill and Intangible Assets, for additional information.
Trade and marketing programs:
We promote our products with trade and sales incentives as well as marketing and advertising programs. These programs include, but are not limited to, new product introduction fees, discounts, coupons, rebates and volume-based incentives as well as cooperative advertising, in-store displays and consumer marketing promotions. Trade and sales incentives are recorded as a reduction to revenues based on amounts estimated due to customers and consumers at the end of a period. We base these estimates principally on historical utilization and redemption rates. For interim reporting purposes, advertising and consumer promotion expenses are charged to operations as a percentage of volume, based on estimated sales volume and estimated program spending. We do not defer costs on our year-end consolidated balance sheet and all marketing and advertising costs are recorded as an expense in the year incurred.
Employee Benefit Plans:
We sponsor various employee benefit plans throughout the world. These include primarily pension plans and postretirement healthcare benefits. For accounting purposes, we estimate the pension and postretirement healthcare benefit obligations utilizing assumptions and estimates for discount rates; expected returns on plan assets; expected compensation increases; employee-related factors such as turnover, retirement age and mortality; and health care cost trends. We review our actuarial assumptions on an annual basis and make modifications to the assumptions based on current rates and trends when appropriate. Our assumptions also reflect our historical experiences and management’s best judgment regarding future expectations. These and other assumptions affect the annual expense and obligations recognized for the underlying plans.
As permitted by U.S. GAAP, we generally amortize the effect of changes in the assumptions over future periods. The cost or benefit of plan changes, such as increasing or decreasing benefits for prior employee service (prior service cost), is deferred and included in expense on a straight-line basis over the average remaining service period of the employees expected to receive benefits.
Since pension and postretirement liabilities are measured on a discounted basis, the discount rate significantly affects our plan obligations and expenses. The expected return on plan assets assumption affects our pension plan expenses, as many of our pension plans are partially funded. The assumptions for discount rates and expected rates of return and our process for setting these assumptions are described in Note 9, Benefit Plans, to the consolidated financial statements.
46
Table of Contents
While we do not anticipate further changes in the 2018 assumptions for our U.S. and non-U.S. pension and postretirement health care plans, as a sensitivity measure, a fifty-basis point change in our discount rates or the expected rate of return on plan assets would have the following effects, increase/(decrease), on our annual benefit plan costs:
| As of December 31, 2017 | ||||||||||||||||
| U.S. Plans | Non-U.S. Plans | |||||||||||||||
| Fifty-Basis-Point | Fifty-Basis-Point | |||||||||||||||
| Increase | Decrease | Increase | Decrease | |||||||||||||
| (in millions) | ||||||||||||||||
| Effect of change in discount rate on |
$ | (16 | ) | $ | 17 | $ | (67 | ) | $ | 76 | ||||||
| Effect of change in expected rate of return on |
(8 | ) | 8 | (43 | ) | 43 | ||||||||||
| Effect of change in discount rate on |
(3 | ) | 4 | (1 | ) | 1 | ||||||||||
Income Taxes:
As a global company, we calculate and provide for income taxes in each tax jurisdiction in which we operate. The provision for income taxes includes the amounts payable or refundable for the current year, the effect of deferred taxes and impacts from uncertain tax positions. Our provision for income taxes is significantly affected by shifts in the geographic mix of our pre-tax earnings across tax jurisdictions, changes in tax laws and regulations, tax planning opportunities available in each tax jurisdiction and the ultimate outcome of various tax audits.
Deferred tax assets and liabilities are recognized for the expected future tax consequences of temporary differences between the financial statement and tax bases of our assets and liabilities and for operating losses and tax credit carryforwards. Deferred tax assets and liabilities are measured using enacted tax rates that will apply to taxable income in the years in which those differences are expected to be recovered or settled. Valuation allowances are established for deferred tax assets when it is more likely than not that a tax benefit will not be realized.
We believe our tax positions comply with applicable tax laws and that we have properly accounted for uncertain tax positions. We recognize tax benefits in our financial statements from uncertain tax positions only if it is more likely than not that the tax position will be sustained by the taxing authorities based on the technical merits of the position. The amount we recognize is measured as the largest amount of benefit that is greater than 50 percent likely of being realized upon resolution. We evaluate uncertain tax positions on an ongoing basis and adjust the amount recognized in light of changing facts and circumstances, such as the progress of a tax audit or expiration of a statute of limitations. We believe the estimates and assumptions used to support our evaluation of uncertain tax positions are reasonable. However, final determination of historical tax liabilities, whether by settlement with tax authorities, judicial or administrative ruling or due to expiration of statutes of limitations, could be materially different from estimates reflected on our consolidated balance sheet and historical income tax provisions. The outcome of these final determinations could have a material effect on our provision for income taxes, net earnings or cash flows in the period in which the determination is made.
As a result of the U.S. tax reform and the related SEC guidance, we included provisional estimates in our consolidated financial statements for some impacts of the new tax legislation. We were unable to make a reasonable estimate for other provisions of the legislation and did not include an estimate in our consolidated financial statements. See Note 14, Income Taxes, for further discussion of the provisional amounts related to U.S. tax reform included in our financial statements and a discussion of the items for which no estimate could be made, as well as additional information on our effective tax rate, current and deferred taxes, valuation allowances and unrecognized tax benefits.
Contingencies:
See Note 12, Commitments and Contingencies, to the consolidated financial statements.
New Accounting Guidance:
See Note 1, Summary of Significant Accounting Policies, to the consolidated financial statements for a discussion of new accounting standards.
47
Table of Contents
Liquidity and Capital Resources
We believe that cash from operations, our revolving credit facilities and our authorized long-term financing will provide sufficient liquidity for our working capital needs, planned capital expenditures, future contractual obligations, share repurchases, transition tax liability on our historical accumulated foreign earnings due to the U.S. tax reform and payment of our anticipated quarterly dividends. We continue to utilize our commercial paper program, international credit lines and long-term debt issuances for regular funding requirements. We also use intercompany loans with our international subsidiaries to improve financial flexibility. Overall, we do not expect any negative effects to our funding sources that would have a material effect on our liquidity.
Net Cash Provided by Operating Activities:
Operating activities provided net cash of $2,593 million in 2017, $2,838 million in 2016 and $3,728 million in 2015. Cash flows from operating activities were lower in 2017 than 2016 primarily due to increases in working capital including higher tax and VAT-related payments in 2017 and lower operating cash flows from divested businesses, partially offset by higher net earnings and lower pension contributions in 2017. Cash flows from operating activities were lower in 2016 than 2015 due to higher contributions to our pension benefit plans in 2016 and higher working capital cash improvements in 2015 than in 2016.
Net Cash Provided by/(Used in) Investing Activities:
Net cash used in investing activities was $301 million in 2017 and $1,029 million in 2016 and net cash provided by investing activities was $2,649 million in 2015. The decrease in net cash used in investing activities in 2017 relative to 2016 was due to higher net proceeds received from divestitures in 2017, no acquisition-related payments in 2017 as in 2016, and lower capital expenditures in 2017. The increase in net cash used in investing activities in 2016 relative to 2015 primarily relates to $4.7 billion of proceeds, net of divested cash and transaction costs, from the contribution of our global coffee businesses to JDE, the divestiture of AGF and the cash receipt of $1.0 billion due to the settlement of currency exchange forward contracts related to our coffee business transactions in 2015.
Capital expenditures were $1,014 million in 2017, $1,224 million in 2016 and $1,514 million in 2015. We continue to make capital expenditures primarily to modernize manufacturing facilities and support new product and productivity initiatives. We expect 2018 capital expenditures to be up to $1.0 billion, including capital expenditures in connection with our 2014-2018 Restructuring Program. We expect to continue to fund these expenditures from operations.
Net Cash Used in Financing Activities:
Net cash used in financing activities was $3,361 million in 2017, $1,862 million in 2016 and $5,883 million in 2015. The increase in net cash used in financing activities in 2017 relative to 2016 was primarily due to lower net issuances of short-term and long-term debt as well as an increase in dividends paid, partly offset by lower Common Stock repurchases compared to the prior year. The decrease in net cash used in financing activities in 2016 relative to 2015 was primarily due to higher short-term debt issuances and $1.0 billion of lower share repurchases following the exceptional year of share repurchases using proceeds from the global coffee business transactions in 2015.
Debt:
From time to time we refinance long-term and short-term debt. Refer to Note 7, Debt and Borrowing Arrangements, for details of our tender offers, debt issuances and maturities during 2016-2017. The nature and amount of our long-term and short-term debt and the proportionate amount of each varies as a result of current and expected business requirements, market conditions and other factors. Due to seasonality, in the first and second quarters of the year, our working capital requirements grow, increasing the need for short-term financing. The second half of the year typically generates higher cash flows. As such, we may issue commercial paper or secure other forms of financing throughout the year to meet short-term working capital needs.
During 2016, one of our subsidiaries, Mondelez International Holdings Netherlands B.V. (“MIHN”), issued debt totaling $4.5 billion. The operations held by MIHN generated approximately 74.5% (or $19.3 billion) of the $25.9 billion of consolidated net revenue during fiscal year 2017 and represented approximately 75.5% (or $19.8 billion) of the $26.2 billion of net assets as of December 31, 2017.
On February 3, 2017, our Board of Directors approved a new $5 billion long-term financing authority to replace the prior authority. As of December 31, 2017, we had $4.7 billion of long-term financing authority remaining.
48
Table of Contents
In the next 12 months, we expect $1.2 billion of long-term debt will mature as follows: fr.250 million Swiss franc notes ($257 million as of December 31, 2017) in January 2018, $478 million in February 2018, £76 million sterling notes ($103 million as of December 31, 2017) in July 2018, and $322 million in August 2018. We expect to fund these repayments with a combination of cash from operations and the issuance of commercial paper or long-term debt.
Our total debt was $17.7 billion at December 31, 2017 and $17.2 billion at December 31, 2016. Our debt-to-capitalization ratio was 0.40 at December 31, 2017 and 0.41 at December 31, 2016. At December 31, 2017, the weighted-average term of our outstanding long-term debt was 6.2 years. Our average daily commercial borrowings were $4.4 billion in 2017, $2.2 billion in 2016 and $2.2 billion in 2015. We had $3.4 billion of commercial paper borrowings outstanding at December 31, 2017 and $2.4 billion outstanding as of December 31, 2016. We expect to continue to use commercial paper to finance various short and long-term financing needs and to continue to comply with our long-term debt covenants. Refer to Note 7, Debt and Borrowing Arrangements, for more information on our debt and debt covenants.
We regularly monitor worldwide supply, commodity cost and currency trends so we can cost-effectively secure ingredients, packaging and fuel required for production. During 2017, the primary drivers of the increase in our aggregate commodity costs were higher currency-related costs on our commodity purchases and increased costs for dairy, cocoa, sugar, packaging and other raw materials.
A number of external factors such as weather conditions, commodity market conditions, currency fluctuations and the effects of governmental agricultural or other programs affect the cost and availability of raw materials and agricultural materials used in our products. We address higher commodity costs and currency impacts primarily through hedging, higher pricing and manufacturing and overhead cost control. We use hedging techniques to limit the impact of fluctuations in the cost of our principal raw materials; however, we may not be able to fully hedge against commodity cost changes, such as dairy, where there is a limited ability to hedge, and our hedging strategies may not protect us from increases in specific raw material costs. Due to competitive or market conditions, planned trade or promotional incentives, fluctuations in currency exchange rates or other factors, our pricing actions may also lag commodity cost changes temporarily.
We expect price volatility and a slightly higher aggregate cost environment to continue in 2018. While the costs of our principal raw materials fluctuate, we believe there will continue to be an adequate supply of the raw materials we use and that they will generally remain available from numerous sources.
49
Table of Contents
Off-Balance Sheet Arrangements and Aggregate Contractual Obligations
We have no significant off-balance sheet arrangements other than the contractual obligations discussed below.
Guarantees:
As discussed in Note 12, Commitments and Contingencies, we enter into third-party guarantees primarily to cover the long-term obligations of our vendors. As part of these transactions, we guarantee that third parties will make contractual payments or achieve performance measures. At December 31, 2017, we had no material third-party guarantees recorded on our consolidated balance sheet.
Guarantees do not have, and we do not expect them to have, a material effect on our liquidity.
Aggregate Contractual Obligations:
The following table summarizes our contractual obligations at December 31, 2017.
| Payments Due | ||||||||||||||||||||
| Total | 2018 | 2019-20 | 2021-22 | 2023 and Thereafter |
||||||||||||||||
| (in millions) | ||||||||||||||||||||
| Debt (1) |
$ | 14,196 | $ | 1,162 | $ | 3,545 | $ | 4,127 | $ | 5,362 | ||||||||||
| Interest expense (2) |
3,330 | 348 | 556 | 431 | 1,995 | |||||||||||||||
| Capital leases |
3 | 1 | 2 | – | – | |||||||||||||||
| Operating leases (3) |
920 | 245 | 352 | 169 | 154 | |||||||||||||||
| Purchase obligations: (4) |
||||||||||||||||||||
| Inventory and production costs |
5,328 | 3,083 | 1,645 | 256 | 344 | |||||||||||||||
| Other |
831 | 694 | 130 | 6 | 1 | |||||||||||||||
|
|
|
|
|
|
|
|
|
|
|
|||||||||||
| 6,159 | 3,777 | 1,775 | 262 | 345 | ||||||||||||||||
| U.S. tax reform transition liability (5) |
1,317 | 128 | 200 | 200 | 789 | |||||||||||||||
| Other long-term liabilities (6) |
423 | 21 | 135 | 65 | 202 | |||||||||||||||
|
|
|
|
|
|
|
|
|
|
|
|||||||||||
| Total |
$ | 26,348 | $ | 5,682 | $ | 6,565 | $ | 5,254 | $ | 8,847 | ||||||||||
|
|
|
|
|
|
|
|
|
|
|
|||||||||||
| (1) | Amounts include the expected cash payments of our debt excluding capital leases, which are presented separately in the table above. The amounts also exclude $64 million of net unamortized non-cash bond premiums, discounts, bank fees and mark-to-market adjustments related to our interest rate swaps recorded in total debt. |
| (2) | Amounts represent the expected cash payments of our interest expense on our long-term debt. Interest calculated on our euro, British pound sterling and Swiss franc notes was forecasted using currency exchange rates as of December 31, 2017. An insignificant amount of interest expense was excluded from the table for a portion of our other non-U.S. debt obligations due to the complexities involved in forecasting expected interest payments. |
| (3) | Operating lease payments represent the minimum rental commitments under non-cancelable operating leases. |
| (4) | Purchase obligations for inventory and production costs (such as raw materials, indirect materials and supplies, packaging, co-manufacturing arrangements, storage and distribution) are commitments for projected needs to be utilized in the normal course of business. Other purchase obligations include commitments for marketing, advertising, capital expenditures, information technology and professional services. Arrangements are considered purchase obligations if a contract specifies all significant terms, including fixed or minimum quantities to be purchased, a pricing structure and approximate timing of the transaction. Most arrangements are cancelable without a significant penalty and with short notice (usually 30 days). Any amounts reflected on the consolidated balance sheet as accounts payable and accrued liabilities are excluded from the table above. |
| (5) | In connection with the U.S. tax reform, we currently estimate paying a $1.3 billion transition tax liability through 2026. The amounts and timing of our tax payments are likely to change as a result of additional guidance expected to be issued in 2018. See Note 14, Income Taxes, for additional information on the U.S. tax reform and its impact on our financial statements. |
| (6) | Other long-term liabilities include estimated future benefit payments for our postretirement health care plans through December 31, 2027 of $235 million. We are unable to reliably estimate the timing of the payments beyond 2027; as such, they are excluded from the above table. There are also another $126 million of various other long-term liabilities that are expected to be paid over the next 5 years. In addition, the following long-term liabilities included on the consolidated balance sheet are excluded from the table above: accrued pension costs, unrecognized tax benefits, insurance accruals and other accruals. As of December 31, 2017, our unrecognized tax benefit, including associated interest and penalties, classified as a long-term payable is $649 million. We currently expect to make approximately $289 million in contributions to our pension plans in 2018. |
50
Table of Contents
Stock Plans:
See Note 10, Stock Plans, to the consolidated financial statements for more information on our stock plans and grant activity during 2015-2017.
Share Repurchases:
See Note 11, Capital Stock, to the consolidated financial statements for more information on our share repurchase program.
Between 2013 and 2017, our Board of Directors authorized the repurchase of a total of $13.7 billion of our Common Stock through December 31, 2018. On January 31, 2018, our Finance Committee, with authorization delegated from our Board of Directors, approved an increase of $6.0 billion in the share repurchase program, raising the authorization to $19.7 billion of Common Stock repurchases, and extended the program through December 31, 2020. We repurchased approximately $13 billion of shares ($2.2 billion in 2017, $2.6 billion in 2016, $3.6 billion in 2015, $1.9 billion in 2014 and $2.7 billion in 2013), at a weighted-average cost of $38.86 per share, through December 31, 2017. The number of shares that we ultimately repurchase under our share repurchase program may vary depending on numerous factors, including share price and other market conditions, our ongoing capital allocation planning, levels of cash and debt balances, other demands for cash, such as acquisition activity, general economic or business conditions and board and management discretion. Additionally, our share repurchase activity during any particular period may fluctuate. We may accelerate, suspend, delay or discontinue our share repurchase program at any time, without notice.
Dividends:
We paid dividends of $1,198 million in 2017, $1,094 million in 2016 and $1,008 million in 2015. On August 2, 2017, the Finance Committee, with authorization delegated from our Board of Directors, approved a 16% increase in the quarterly dividend to $0.22 per common share or $0.88 per common share on an annualized basis. On July 19, 2016, our Board of Directors approved a 12% increase in the quarterly dividend to $0.19 per common share or $0.76 per common share on an annual basis. On July 23, 2015, our Board of Directors approved a 13% increase in the quarterly dividend to $0.17 per common share or $0.68 per common share on an annual basis. The declaration of dividends is subject to the discretion of our Board of Directors and depends on various factors, including our net earnings, financial condition, cash requirements, future prospects and other factors that our Board of Directors deems relevant to its analysis and decision making.
For U.S. income tax purposes only, the Company has determined that 100% of the distributions paid to its shareholders in 2017 are characterized as a qualified dividend paid from U.S. earnings and profits. Shareholders should consult their tax advisors for a full understanding of the tax consequences of the receipt of dividends.
51
Table of Contents
We use non-GAAP financial information and believe it is useful to investors as it provides additional information to facilitate comparisons of historical operating results, identify trends in our underlying operating results and provide additional insight and transparency on how we evaluate our business. We use non-GAAP financial measures to budget, make operating and strategic decisions and evaluate our performance. We have detailed the non-GAAP adjustments that we make in our non-GAAP definitions below. The adjustments generally fall within the following categories: acquisition & divestiture activities, gains and losses on intangible asset sales and non-cash impairments, major program restructuring activities, constant currency and related adjustments, major program financing and hedging activities and other major items affecting comparability of operating results. We believe the non-GAAP measures should always be considered along with the related U.S. GAAP financial measures. We have provided the reconciliations between the GAAP and non-GAAP financial measures below, and we also discuss our underlying GAAP results throughout our Management’s Discussion and Analysis of Financial Condition and Results of Operations in this Form 10-K.
Our primary non-GAAP financial measures are listed below and reflect how we evaluate our current and prior-year operating results. As new events or circumstances arise, these definitions could change. When our definitions change, we provide the updated definitions and present the related non-GAAP historical results on a comparable basis (1).
| • | “Organic Net Revenue” is defined as net revenues excluding the impacts of acquisitions, divestitures (2), our historical global coffee business (3), our historical Venezuelan operations, accounting calendar changes and currency rate fluctuations (4). We also evaluate Organic Net Revenue growth from emerging markets and our Power Brands. |
| • | Our emerging markets include our Latin America region in its entirety; the AMEA region, excluding Australia, New Zealand and Japan; and the following countries from the Europe region: Russia, Ukraine, Turkey, Kazakhstan, Belarus, Georgia, Poland, Czech Republic, Slovak Republic, Hungary, Bulgaria, Romania, the Baltics and the East Adriatic countries. (Our developed markets include the entire North America region, the Europe region excluding the countries included in the emerging markets definition, and Australia, New Zealand and Japan from the AMEA region.) |
| • | Our Power Brands include some of our largest global and regional brands such as Oreo, Chips Ahoy!, Ritz, TUC/Club Social and belVita biscuits; Cadbury Dairy Milk, Milka and Lacta chocolate; Trident gum; Halls candy and Tang powdered beverages. |
| • | “Adjusted Operating Income” is defined as operating income excluding the impacts of the 2012-2014 Restructuring Program (5); the 2014-2018 Restructuring Program (5); Venezuela remeasurement and deconsolidation losses and historical operating results; gains or losses (including non-cash impairment charges) on goodwill and intangible assets; divestiture (2) or acquisition gains or losses and related integration and acquisition costs; the JDE coffee business transactions (3) gain and net incremental costs; the operating results of divestitures (2); our historical global coffee business operating results (3); mark-to-market impacts from commodity and forecasted currency transaction derivative contracts (6); equity method investment earnings historically reported within operating income (7); benefits from resolution of tax matters (8) ; CEO transition remuneration (9) and incremental expenses related to the malware incident. We also present “Adjusted Operating Income margin,” which is subject to the same adjustments as Adjusted Operating Income. We also evaluate growth in our Adjusted Operating Income on a constant currency basis (4). |
| • | “Adjusted EPS” is defined as diluted EPS attributable to Mondelēz International from continuing operations excluding the impacts of the 2012-2014 Restructuring Program (5); the 2014-2018 Restructuring Program (5); Venezuela remeasurement and deconsolidation losses and historical operating results; losses on debt extinguishment and related expenses; gains or losses (including non-cash impairment charges) on goodwill and intangible assets; divestiture (2) or acquisition gains or losses and related integration and acquisition costs; the JDE coffee business transactions (3) gain, transaction hedging gains or losses and net incremental costs; gain on equity method investment transactions; net earnings from divestitures (2); mark-to-market impacts from commodity and forecasted currency transaction derivative contracts (6); gains or losses on interest rate swaps no longer designated as accounting cash flow hedges due to changed financing and hedging plans; benefits from resolution of tax matters (8); CEO transition remuneration (9); incremental expenses related to the malware incident and the U.S. tax reform discrete impacts (10). Similarly, within Adjusted EPS, our equity method investment net earnings exclude our proportionate share of our investees’ unusual or infrequent items (11). We also evaluate growth in our Adjusted EPS on a constant currency basis (4). |
52
Table of Contents
| (1) | When items no longer impact our current or future presentation of non-GAAP operating results, we remove these items from our non-GAAP definitions. During 2017, we added to the non-GAAP definitions the exclusion of: benefits from the resolution of tax matters (see footnote (8) below), CEO transition remuneration (see footnote (9) below), incremental expenses related to the malware incident (discussed under Malware Incident) and the U.S. tax reform discrete impacts (see footnote (10) below). |
| (2) | Divestitures include completed sales of businesses and exits of major product lines upon completion of a sale or licensing agreement. |
| (3) | We continue to have an ongoing interest in the legacy coffee business we deconsolidated in 2015 as part of the JDE coffee business transactions. For historical periods prior to the July 15, 2015 coffee business deconsolidation, we have reclassified any net revenue or operating income from the historical coffee business and included them where the coffee equity method investment earnings are presented within Adjusted EPS. As such, Organic Net Revenue and Adjusted Operating Income in all periods do not include the results of our legacy coffee businesses, which are shown within Adjusted EPS. |
| (4) | Constant currency operating results are calculated by dividing or multiplying, as appropriate, the current-period local currency operating results by the currency exchange rates used to translate the financial statements in the comparable prior-year period to determine what the current-period U.S. dollar operating results would have been if the currency exchange rate had not changed from the comparable prior-year period. |
| (5) | Non-GAAP adjustments related to the 2014-2018 Restructuring Program reflect costs incurred that relate to the objectives of our program to transform our supply chain network and organizational structure. Costs that do not meet the program objectives are not reflected in the non-GAAP adjustments. Refer to our Annual Report on Form 10-K for the year ended December 31, 2016 for more information on the 2012-2014 Restructuring Program. |
| (6) | During the third quarter of 2016, we began to exclude unrealized gains and losses (mark-to-market impacts) from outstanding commodity and forecasted currency transaction derivatives from our non-GAAP earnings measures until such time that the related exposures impact our operating results. Since we purchase commodity and forecasted currency transaction contracts to mitigate price volatility primarily for inventory requirements in future periods, we made this adjustment to remove the volatility of these future inventory purchases on current operating results to facilitate comparisons of our underlying operating performance across periods. We also discontinued designating commodity and forecasted currency transaction derivatives for hedge accounting treatment. To facilitate comparisons of our underlying operating results, we have recast all historical non-GAAP earnings measures to exclude the mark-to-market impacts. |
| (7) | Historically, we have recorded income from equity method investments within our operating income as these investments operated as extensions of our base business. Beginning in the third quarter of 2015, we began to record the earnings from our equity method investments in after-tax equity method investment earnings outside of operating income following the deconsolidation of our coffee business. Refer to Note 1, Summary of Significant Accounting Policies, in our Annual Report on Form 10-K for the year ended December 31, 2016 for more information. |
| (8) | During 2017, we recorded benefits from the reversal of tax liabilities in connection with the resolution of a Brazilian indirect tax matter and settlement of pre-acquisition Cadbury tax matters. See Note 12, Commitments and Contingencies—Tax Matters, for additional information. |
| (9) | On November 20, 2017, Dirk Van de Put succeeded Irene Rosenfeld as CEO of Mondelēz International in advance of her retirement at the end of March 2018. In order to incent Mr. Van de Put to join us, we provided him compensation with a total combined target value of $42.5 million to make him whole for incentive awards he forfeited or grants that were not made to him when he left his former employer. The compensation we granted took the form of cash, deferred stock units, performance share units and stock options. In connection with Irene Rosenfeld’s retirement, we made her outstanding grants of performance share units for the 2016-2018 and 2017-2019 performance cycles eligible for continued vesting and approved a $0.5 million salary for her service as Chairman from January through March 2018. We refer to these elements of Mr. Van de Put’s and Ms. Rosenfeld’s compensation arrangements together as “CEO transition remuneration.” We are excluding amounts we expense as CEO transition remuneration from our 2017 and future non-GAAP results because those amounts are not part of our regular compensation program and are incremental to amounts we would have incurred as ongoing CEO compensation. As a result, in 2017, we excluded amounts expensed for the cash payment to Mr. Van de Put and partial vesting of his equity grants. In 2018, we expect to exclude amounts paid for Ms. Rosenfeld’s service as Chairman and partial vesting of Mr. Van de Put’s and Ms. Rosenfeld’s equity grants. |
| (10) | On December 22, 2017, the United States enacted tax reform legislation that included a broad range of business tax provisions. As further detailed in Note 14, Income Taxes, our accounting for the new legislation is not complete and we have made reasonable estimates for some tax provisions. We exclude the discrete U.S. tax reform impacts from our Adjusted EPS as they do not reflect our ongoing tax obligations under U.S. tax reform. |
| (11) | We have excluded our proportionate share of our equity method investees’ unusual or infrequent items such as acquisition and divestiture related costs, restructuring program costs and discrete U.S. tax reform impacts, in order to provide investors with a comparable view of our performance across periods. Although we have shareholder rights and board representation commensurate with our ownership interests in our equity method investees and review the underlying operating results and unusual or infrequent items with them each reporting period, we do not have direct control over their operations or resulting revenue and expenses. Our use of equity method investment net earnings on an adjusted basis is not intended to imply that we have any such control. Our GAAP “diluted EPS attributable to Mondelēz International from continuing operations” includes all of the investees’ unusual and infrequent items. |
We believe that the presentation of these non-GAAP financial measures, when considered together with our U.S. GAAP financial measures and the reconciliations to the corresponding U.S. GAAP financial measures, provides you with a more complete understanding of the factors and trends affecting our business than could be obtained absent these disclosures. Because non-GAAP financial measures vary among companies, the non-GAAP financial measures presented in this report may not be comparable to similarly titled measures used by other companies. Our use of these non-GAAP financial measures is not meant to be considered in isolation or as a substitute for any U.S. GAAP financial measure. A limitation of these non-GAAP financial measures is they exclude items detailed below that have an impact on our U.S. GAAP reported results. The best way this limitation can be addressed is by evaluating our non-GAAP financial measures in combination with our U.S. GAAP reported results and carefully evaluating the following tables that reconcile U.S. GAAP reported figures to the non-GAAP financial measures in this Form 10-K.
53
Table of Contents
Organic Net Revenue:
Applying the definition of “Organic Net Revenue”, the adjustments made to “net revenues” (the most comparable U.S. GAAP financial measure) were to exclude the impact of currency, our historical Venezuelan operations, the adjustment for deconsolidating our historical coffee business, an accounting calendar change, acquisitions and divestitures. We believe that Organic Net Revenue reflects the underlying growth from the ongoing activities of our business and provides improved comparability of results. We also evaluate our Organic Net Revenue growth from emerging markets and Power Brands, and these underlying measures are also reconciled to U.S. GAAP below.
| For the Year Ended December 31, 2017 | For the Year Ended December 31, 2016 | |||||||||||||||||||||||
| Emerging | Developed | Emerging | Developed | |||||||||||||||||||||
| Markets | Markets | Total | Markets | Markets | Total | |||||||||||||||||||
| (in millions) | (in millions) | |||||||||||||||||||||||
| Net Revenue |
$ | 9,707 | $ | 16,189 | $ | 25,896 | $ | 9,357 | $ | 16,566 | $ | 25,923 | ||||||||||||
| Impact of currency |
(19 | ) | (58 | ) | (77 | ) | – | – | – | |||||||||||||||
| Impact of acquisitions |
– | (59 | ) | (59 | ) | – | – | – | ||||||||||||||||
| Impact of divestitures |
– | (270 | ) | (270 | ) | (10 | ) | (643 | ) | (653 | ) | |||||||||||||
|
|
|
|
|
|
|
|
|
|
|
|
|
|||||||||||||
| Organic Net Revenue |
$ | 9,688 | $ | 15,802 | $ | 25,490 | $ | 9,347 | $ | 15,923 | $ | 25,270 | ||||||||||||
|
|
|
|
|
|
|
|
|
|
|
|
|
|||||||||||||
| For the Year Ended December 31, 2017 | For the Year Ended December 31, 2016 (3) | |||||||||||||||||||||||
| Power | Non-Power | Power | Non-Power | |||||||||||||||||||||
| Brands | Brands | Total | Brands | Brands | Total | |||||||||||||||||||
| (in millions) | (in millions) | |||||||||||||||||||||||
| Net Revenue |
$ | 18,913 | $ | 6,983 | $ | 25,896 | $ | 18,372 | $ | 7,551 | $ | 25,923 | ||||||||||||
| Impact of currency |
(97 | ) | 20 | (77 | ) | – | – | – | ||||||||||||||||
| Impact of acquisitions |
(59 | ) | – | (59 | ) | – | – | – | ||||||||||||||||
| Impact of divestitures |
– | (270 | ) | (270 | ) | – | (653 | ) | (653 | ) | ||||||||||||||
|
|
|
|
|
|
|
|
|
|
|
|
|
|||||||||||||
| Organic Net Revenue |
$ | 18,757 | $ | 6,733 | $ | 25,490 | $ | 18,372 | $ | 6,898 | $ | 25,270 | ||||||||||||
|
|
|
|
|
|
|
|
|
|
|
|
|
|||||||||||||
| For the Year Ended December 31, 2016 | For the Year Ended December 31, 2015 | |||||||||||||||||||||||
| Emerging | Developed | Emerging | Developed | |||||||||||||||||||||
| Markets | Markets | Total | Markets | Markets | Total | |||||||||||||||||||
| (in millions) | (in millions) | |||||||||||||||||||||||
| Net Revenue |
$ | 9,357 | $ | 16,566 | $ | 25,923 | $ | 11,570 | $ | 18,066 | $ | 29,636 | ||||||||||||
| Impact of currency |
895 | 338 | 1,233 | – | – | – | ||||||||||||||||||
| Historical Venezuelan operations (1) |
– | – | – | (1,217 | ) | – | (1,217 | ) | ||||||||||||||||
| Historical coffee business (2) |
– | – | – | (442 | ) | (1,185 | ) | (1,627 | ) | |||||||||||||||
| Impact of accounting calendar change |
– | – | – | – | (76 | ) | (76 | ) | ||||||||||||||||
| Impact of acquisitions |
(71 | ) | (21 | ) | (92 | ) | – | – | – | |||||||||||||||
| Impact of divestitures |
(10 | ) | (643 | ) | (653 | ) | (8 | ) | (687 | ) | (695 | ) | ||||||||||||
|
|
|
|
|
|
|
|
|
|
|
|
|
|||||||||||||
| Organic Net Revenue |
$ | 10,171 | $ | 16,240 | $ | 26,411 | $ | 9,903 | $ | 16,118 | $ | 26,021 | ||||||||||||
|
|
|
|
|
|
|
|
|
|
|
|
|
|||||||||||||
| For the Year Ended December 31, 2016 | For the Year Ended December 31, 2015 (3) | |||||||||||||||||||||||
| Power | Non-Power | Power | Non-Power | |||||||||||||||||||||
| Brands | Brands | Total | Brands | Brands | Total | |||||||||||||||||||
| (in millions) | (in millions) | |||||||||||||||||||||||
| Net Revenue |
$ | 18,372 | $ | 7,551 | $ | 25,923 | $ | 20,612 | $ | 9,024 | $ | 29,636 | ||||||||||||
| Impact of currency |
856 | 377 | 1,233 | – | – | – | ||||||||||||||||||
| Historical Venezuelan operations (1) |
– | – | – | (823 | ) | (394 | ) | (1,217 | ) | |||||||||||||||
| Historical coffee business (2) |
– | – | – | (1,199 | ) | (428 | ) | (1,627 | ) | |||||||||||||||
| Impact of accounting calendar change |
– | – | – | (59 | ) | (17 | ) | (76 | ) | |||||||||||||||
| Impact of acquisitions |
(92 | ) | – | (92 | ) | – | – | – | ||||||||||||||||
| Impact of divestitures |
– | (653 | ) | (653 | ) | – | (695 | ) | (695 | ) | ||||||||||||||
|
|
|
|
|
|
|
|
|
|
|
|
|
|||||||||||||
| Organic Net Revenue |
$ | 19,136 | $ | 7,275 | $ | 26,411 | $ | 18,531 | $ | 7,490 | $ | 26,021 | ||||||||||||
|
|
|
|
|
|
|
|
|
|
|
|
|
|||||||||||||
| (1) | Includes the historical results of our Venezuelan subsidiaries prior to the December 31, 2015 deconsolidation. Refer to Note 1, Summary of Significant Accounting Policies – Currency Translation and Highly Inflationary Accounting: Venezuela, for more information. |
| (2) | Includes our historical global coffee business prior to the July 2, 2015 JDE coffee business transactions. Refer to Note 2, Divestitures and Acquisitions, and our non-GAAP definitions appearing earlier in this section for more information. |
| (3) | Each year we reevaluate our Power Brands and confirm the brands in which we will continue to make disproportionate investments. As such, we may make changes in our planned investments in primarily regional Power Brands following our annual review cycles. For 2017, we made limited changes to our list of regional Power Brands and as such, we reclassified 2016 and 2015 Power Brand net revenues on a basis consistent with the current list of Power Brands. |
54
Table of Contents
Adjusted Operating Income:
Applying the definition of “Adjusted Operating Income”, the adjustments made to “operating income” (the most comparable U.S. GAAP financial measure) were to exclude 2012-2014 Restructuring Program costs; 2014-2018 Restructuring Program costs; impairment charges related to intangible assets; mark-to-market impacts from commodity and forecasted currency transaction derivative contracts; incremental expenses related to the malware incident; acquisition integration costs; acquisition-related costs; divestiture-related costs; the operating results of divestitures; net gain on divestitures; gain on sale of intangible assets; benefits from the resolution of tax matters; CEO transition remuneration; Venezuela historical operating results and remeasurement and deconsolidation losses; the JDE coffee business transactions gain and net incremental costs; operating income from our historical coffee business and equity method investment earnings reclassified to after-tax earnings in Q3 2015 in connection with the coffee business transactions. We also present “Adjusted Operating Income margin,” which is subject to the same adjustments as Adjusted Operating Income, and evaluate Adjusted Operating Income on a constant currency basis. We believe these measures provide improved comparability of underlying operating results.
| For the Years Ended | ||||||||||||||||
| December 31, | ||||||||||||||||
| 2017 | 2016 | $ Change | % Change | |||||||||||||
| (in millions) | ||||||||||||||||
| Operating Income |
$ | 3,506 | $ | 2,569 | $ | 937 | 36.5% | |||||||||
| 2014-2018 Restructuring Program costs (1) |
792 | 1,086 | (294 | ) | ||||||||||||
| Intangible asset impairment charges (2) |
109 | 137 | (28 | ) | ||||||||||||
| Mark-to-market losses from derivatives (3) |
96 | 94 | 2 | |||||||||||||
| Malware incident incremental expenses |
84 | – | 84 | |||||||||||||
| Acquisition integration costs (4) |
3 | 7 | (4 | ) | ||||||||||||
| Acquisition-related costs (4) |
– | 1 | (1 | ) | ||||||||||||
| Divestiture-related costs (5) |
31 | 86 | (55 | ) | ||||||||||||
| Operating income from divestiture (5) |
(61 | ) | (153 | ) | 92 | |||||||||||
| Net gain on divestitures (5) |
(186 | ) | (9 | ) | (177 | ) | ||||||||||
| Gain on sale of intangible assets (6) |
– | (15 | ) | 15 | ||||||||||||
| Benefits from resolution of tax matters (7) |
(209 | ) | – | (209 | ) | |||||||||||
| CEO transition remuneration |
14 | – | 14 | |||||||||||||
| Other/rounding |
(1 | ) | (1 | ) | – | |||||||||||
|
|
|
|
|
|
|
|||||||||||
| Adjusted Operating Income |
$ | 4,178 | $ | 3,802 | $ | 376 | 9.9% | |||||||||
| Currency translation |
– | – | – | |||||||||||||
|
|
|
|
|
|
|
|||||||||||
| Adjusted Operating Income (constant currency) |
$ | 4,178 | $ | 3,802 | $ | 376 | 9.9% | |||||||||
|
|
|
|
|
|
|
|||||||||||
55
Table of Contents
| For the Years Ended | ||||||||||||||||
| December 31, | ||||||||||||||||
| 2016 | 2015 | $ Change | % Change | |||||||||||||
| (in millions) | ||||||||||||||||
| Operating Income |
$ | 2,569 | $ | 8,897 | $ | (6,328 | ) | (71.1)% | ||||||||
| 2012-2014 Restructuring Program costs (1) |
– | (4 | ) | 4 | ||||||||||||
| 2014-2018 Restructuring Program costs (1) |
1,086 | 1,002 | 84 | |||||||||||||
| Intangible asset impairment charges (2) |
137 | 71 | 66 | |||||||||||||
| Mark-to-market losses/(gains) from derivatives (3) |
94 | (56 | ) | 150 | ||||||||||||
| Acquisition integration costs (4) |
7 | 9 | (2 | ) | ||||||||||||
| Acquisition-related costs (4) |
1 | 8 | (7 | ) | ||||||||||||
| Divestiture-related costs (5) |
86 | – | 86 | |||||||||||||
| Operating income from divestiture (5) |
(153 | ) | (182 | ) | 29 | |||||||||||
| Net gain on divestiture (5) |
(9 | ) | (13 | ) | 4 | |||||||||||
| Gain on sale of intangible assets (6) |
(15 | ) | – | (15 | ) | |||||||||||
| Operating income from Venezuelan subsidiaries (8) |
– | (281 | ) | 281 | ||||||||||||
| Remeasurement of net monetary assets in Venezuela (8) |
– | 11 | (11 | ) | ||||||||||||
| Loss on deconsolidation of Venezuela (8) |
– | 778 | (778 | ) | ||||||||||||
| Costs associated with JDE coffee business transactions (9) |
– | 278 | (278 | ) | ||||||||||||
| Gain on the JDE coffee business transactions (9) |
– | (6,809 | ) | 6,809 | ||||||||||||
| Reclassification of historical coffee business operating income (10) |
– | (342 | ) | 342 | ||||||||||||
| Reclassification of equity method investment earnings (11) |
– | (51 | ) | 51 | ||||||||||||
| Other/rounding |
(1 | ) | – | (1 | ) | |||||||||||
|
|
|
|
|
|
|
|||||||||||
| Adjusted Operating Income |
$ | 3,802 | $ | 3,316 | $ | 486 | 14.7% | |||||||||
| Impact of unfavorable currency |
171 | – | 171 | |||||||||||||
|
|
|
|
|
|
|
|||||||||||
| Adjusted Operating Income (constant currency) |
$ | 3,973 | $ | 3,316 | $ | 657 | 19.8% | |||||||||
|
|
|
|
|
|
|
|||||||||||
| (1) | Refer to Note 6, 2014-2018 Restructuring Program, for more information. Refer to the Annual Report on Form 10-K for the year ended December 31, 2016 for additional information in Note 6, Restructuring Programs. |
| (2) | Refer to Note 2, Divestitures and Acquisitions, and Note 5, Goodwill and Intangible Assets, for more information on trademark impairments. |
| (3) | Refer to Note 8, Financial Instruments, Note 16, Segment Reporting, and Non-GAAP Financial Measures appearing earlier in this section for more information on these unrealized losses/gains on commodity and forecasted currency transaction derivatives. |
| (4) | Refer to Note 2, Divestitures and Acquisitions, for more information on the acquisition of a biscuit business in Vietnam. |
| (5) | Refer to Note 2, Divestitures and Acquisitions, for more information on the 2017 sales of a confectionery business in France, a grocery business in Australia and New Zealand, certain licenses of KHC-owned brands used in our grocery business within our Europe region, sale of one of our equity method investments and sale of a confectionary business in Japan. Additionally, the 2016 amount includes a sale of a confectionery business in Costa Rica. |
| (6) | Refer to Note 2, Divestitures and Acquisitions, for more information on the 2016 intangible asset sale in Finland. |
| (7) | Refer to Note 12, Commitments and Contingencies – Tax Matters, for more information. Primarily includes the reversal of tax liabilities in connection with the resolution of a Brazilian indirect tax matter and settlement of pre-acquisition Cadbury tax matters. |
| (8) | Includes the historical results of our Venezuelan subsidiaries prior to the December 31, 2015 deconsolidation. Refer to Note 1, Summary of Significant Accounting Policies – Currency Translation and Highly Inflationary Accounting: Venezuela, for more information on the deconsolidation and remeasurement loss in 2015. |
| (9) | Refer to Note 2, Divestitures and Acquisitions, for more information on the JDE coffee business transactions. |
| (10) | Includes our historical global coffee business prior to the July 2, 2015 deconsolidation. We reclassified the results of our historical coffee business from Adjusted Operating Income and included them with equity method investment earnings in Adjusted EPS to facilitate comparisons of past and future coffee operating results. Refer to Note 2, Divestitures and Acquisitions, and Non-GAAP Financial Measures appearing later in this section for more information. |
| (11) | Historically, we have recorded income from equity method investments within our operating income as these investments operated as extensions of our base business. Beginning in the third quarter of 2015, to align with the accounting for JDE earnings, we began to record the earnings from our equity method investments in equity method investment earnings outside of operating income. In periods prior to July 2, 2015, we have reclassified the equity method earnings from Adjusted Operating Income to evaluate our operating results on a consistent basis. |
56
Table of Contents
Adjusted EPS:
Applying the definition of “Adjusted EPS” (1), the adjustments made to “diluted EPS attributable to Mondelēz International” (the most comparable U.S. GAAP financial measure) were to exclude 2014-2018 Restructuring Program costs; impairment charges related to intangible assets; mark-to-market impacts from commodity and forecasted currency transaction derivative contracts; incremental expenses related to the malware incident; acquisition integration costs; divestiture-related costs; net earnings from divestitures; after-tax gains/losses on divestitures; gain on sale of intangible assets; benefits from the resolution of tax matters; CEO transition remuneration; losses on interest rate swaps no longer designated as accounting cash flow hedges due to changed financing and hedging plans; losses on debt extinguishment and related expenses; U.S. tax reform discrete net tax benefit; Venezuela historical operating results and remeasurement and deconsolidation losses; the JDE coffee business transactions gain, hedging gains and net incremental costs; operating income from our historical coffee business; equity method investment earnings reclassified to after-tax earnings in Q3 2015 in connection with the coffee business transactions; gain on equity method investment transactions; and our proportionate share of unusual or infrequent items recorded by our JDE and Keurig equity method investees. We also evaluate Adjusted EPS on a constant currency basis. We believe Adjusted EPS provides improved comparability of underlying operating results.
| For the Years Ended | ||||||||||||||||
| December 31, | ||||||||||||||||
| 2017 | 2016 | $ Change | % Change | |||||||||||||
| Diluted EPS attributable to Mondelēz International |
$ | 1.91 | $ | 1.05 | $ | 0.86 | 81.9% | |||||||||
| 2014-2018 Restructuring Program costs (2) |
0.39 | 0.51 | (0.12 | ) | ||||||||||||
| Intangible asset impairment charges (2) |
0.05 | 0.06 | (0.01 | ) | ||||||||||||
| Mark-to-market losses from derivatives (2) |
0.06 | 0.05 | 0.01 | |||||||||||||
| Malware incident incremental expenses |
0.04 | – | 0.04 | |||||||||||||
| Acquisition integration costs (2) |
– | 0.01 | (0.01 | ) | ||||||||||||
| Divestiture-related costs (2) |
0.02 | 0.05 | (0.03 | ) | ||||||||||||
| Net earnings from divestitures (2) |
(0.03 | ) | (0.08 | ) | 0.05 | |||||||||||
| Net gain on divestitures (2) |
(0.11 | ) | – | (0.11 | ) | |||||||||||
| Gain on sale of intangible assets (2) |
– | (0.01 | ) | 0.01 | ||||||||||||
| Benefits from resolution of tax matters (2) |
(0.13 | ) | – | (0.13 | ) | |||||||||||
| CEO transition remuneration |
0.01 | – | 0.01 | |||||||||||||
| Loss related to interest rate swaps (3) |
– | 0.04 | (0.04 | ) | ||||||||||||
| Loss on debt extinguishment and related expenses (4) |
– | 0.17 | (0.17 | ) | ||||||||||||
| U.S. tax reform discrete net tax benefit (5) |
(0.04 | ) | – | (0.04 | ) | |||||||||||
| Gain on equity method investment transactions (6) |
(0.02 | ) | (0.03 | ) | 0.01 | |||||||||||
| Equity method investee acquisition-related |
(0.01 | ) | 0.04 | (0.05 | ) | |||||||||||
|
|
|
|
|
|
|
|||||||||||
| Adjusted EPS |
$ | 2.14 | $ | 1.86 | $ | 0.28 | 15.1% | |||||||||
| Impact of favorable currency |
(0.01 | ) | – | (0.01 | ) | |||||||||||
|
|
|
|
|
|
|
|||||||||||
| Adjusted EPS (constant currency) |
$ | 2.13 | $ | 1.86 | $ | 0.27 | 14.5% | |||||||||
|
|
|
|
|
|
|
|||||||||||
57
Table of Contents
| For the Years Ended | ||||||||||||||||
| December 31, | ||||||||||||||||
| 2016 | 2015 | $ Change | % Change | |||||||||||||
| Diluted EPS attributable to Mondelēz International |
$ | 1.05 | $ | 4.44 | $ | (3.39 | ) | (76.4)% | ||||||||
| 2014-2018 Restructuring Program costs (2) |
0.51 | 0.45 | 0.06 | |||||||||||||
| Intangible asset impairment charges (2) |
0.06 | 0.03 | 0.03 | |||||||||||||
|
Mark-to-market losses/(gains) from derivatives (2) |
0.05 | (0.03 | ) | 0.08 | ||||||||||||
| Acquisition integration costs (2) |
0.01 | – | 0.01 | |||||||||||||
| Net earnings from divestiture (2) |
(0.08 | ) | (0.07 | ) | (0.01 | ) | ||||||||||
| Divestiture-related costs (2) |
0.05 | – | 0.05 | |||||||||||||
| Net loss on divestiture (2) |
– | 0.01 | (0.01 | ) | ||||||||||||
| Gain on sale of intangible assets (2) |
(0.01 | ) | – | (0.01 | ) | |||||||||||
| Net earnings from Venezuelan subsidiaries (8) |
– | (0.10 | ) | 0.10 | ||||||||||||
| Loss on deconsolidation of Venezuela (8) |
– | 0.48 | (0.48 | ) | ||||||||||||
| Remeasurement of net monetary assets in Venezuela (8) |
– | 0.01 | (0.01 | ) | ||||||||||||
| Gain on the JDE coffee business transactions (9) |
– | (4.05 | ) | 4.05 | ||||||||||||
| (Income)/costs associated with the JDE coffee business transactions (9) |
– | (0.01 | ) | 0.01 | ||||||||||||
| Loss related to interest rate swaps (3) |
0.04 | 0.01 | 0.03 | |||||||||||||
| Loss on debt extinguishment and related |
0.17 | 0.29 | (0.12 | ) | ||||||||||||
| Gain on equity method investment transactions (6) |
(0.03 | ) | – | (0.03 | ) | |||||||||||
| Equity method investee acquisition-related |
0.04 | 0.07 | (0.03 | ) | ||||||||||||
|
|
|
|
|
|
|
|||||||||||
| Adjusted EPS |
$ | 1.86 | $ | 1.53 | $ | 0.33 | 21.6 | % | ||||||||
| Impact of unfavorable currency |
0.06 | – | 0.06 | |||||||||||||
|
|
|
|
|
|
|
|||||||||||
| Adjusted EPS (constant currency) |
$ | 1.92 | $ | 1.53 | $ | 0.39 | 25.5 | % | ||||||||
|
|
|
|
|
|
|
|||||||||||
| (1) | The tax expense/(benefit) of each of the pre-tax items excluded from our GAAP results was computed based on the facts and tax assumptions associated with each item, and such impacts have also been excluded from Adjusted EPS. |
| • | For the year ended December 31, 2017, taxes for the: 2014-2018 Restructuring Program costs were $(190) million, intangible asset impairment charges were $(30) million, acquisition integration costs were zero, gain on equity method investment transactions were $15 million, net gain on divestitures were $7 million, net earnings on divestitures were $15 million, divestiture-related costs were $8 million, loss on debt extinguishment and related costs were $(4) million, malware incident incremental costs were $(27) million, benefits from resolution of tax matters were $75 million, equity method investee acquisition-related and other adjustments were $35 million, CEO transition remuneration were $(5) million, mark-to-market gains/(losses) from derivatives were $(6) million and U.S. tax reform were $(59) million. |
| • | For the year ended December 31, 2016, taxes for the: 2014-2018 Restructuring Program costs were $(288) million, intangible asset impairment charges were $(37) million, gain on sale of intangible assets were $3 million, acquisition integration costs were zero, net earnings from divestitures were $40 million, divestiture-related costs were $(15) million, loss on debt extinguishment and related costs were $(163) million, loss related to interest rate swaps were $(36) million and mark-to-market gains/(losses) from derivatives were $(11) million. |
| • | For the year ended December 31, 2015, taxes for the: 2014-2018 Restructuring Program costs were $(262) million, income/costs associated with the JDE coffee business transactions were $145 million, net earnings from Venezuelan subsidiaries were $107 million, gain on the JDE coffee business transactions were $183 million, intangible asset impairment charges were $(13) million, net earnings from divestitures were $80 million, loss on debt extinguishment and related costs were $(275) million, loss related to interest rate swaps were $(13) million and mark-to-market gains/(losses) from derivatives were $15 million. |
| (2) | See the Adjusted Operating Income table above and the related footnotes for more information. |
| (3) | Refer to Note 8, Financial Instruments, for more information on our interest rate swaps, which we no longer designate as cash flow hedges during the first quarter of 2016 due to changes in financing and hedging plans. |
| (4) | Refer to Note 7, Debt and Borrowing Arrangements, for more information on our loss on debt extinguishment and related expenses in connection with our debt discharge. |
| (5) | Refer to Note 14, Income Taxes, for more information on the impact of the U.S. tax reform. |
| (6) | Refer to Note 2, Divestitures and Acquisitions, for more information on the 2017 sale of one of our equity method investments and the 2016 acquisition of an interest in Keurig. |
| (7) | Includes our proportionate share of unusual or infrequent items, such as acquisition and divestiture-related costs, restructuring program costs and discrete U.S. tax reform impacts recorded by our JDE and Keurig equity method investees. |
| (8) | Includes the historical results of our Venezuelan subsidiaries prior to the December 31, 2015 deconsolidation. Refer to Note 1, Summary of Significant Accounting Policies – Currency Translation and Highly Inflationary Accounting: Venezuela, for more information on the deconsolidation and remeasurement loss in 2015. |
| (9) | Refer to Note 2, Divestitures and Acquisitions, for more information on the JDE coffee business transactions. Net gains of $436 million in 2015 on the currency hedges related to the JDE coffee business transactions were recorded in interest and other expense, net and are included in (income)/costs associated with the JDE coffee business transactions of $(0.01) in the table above. |
58
Table of Contents
Item 7A. Quantitative and Qualitative Disclosures about Market Risk.
As we operate globally, we are primarily exposed to currency exchange rate, commodity price and interest rate market risks. We monitor and manage these exposures as part of our overall risk management program. Our risk management program focuses on the unpredictability of financial markets and seeks to reduce the potentially adverse effects that the volatility of these markets may have on our operating results. We principally utilize derivative instruments to reduce significant, unanticipated earnings fluctuations that may arise from volatility in currency exchange rates, commodity prices and interest rates. For additional information on our derivative activity and the types of derivative instruments we use to hedge our currency exchange, commodity price and interest rate exposures, see Note 8, Financial Instruments.
Many of our non-U.S. subsidiaries operate in functional currencies other than the U.S. dollar. Fluctuations in currency exchange rates create volatility in our reported results as we translate the balance sheets, operating results and cash flows of these subsidiaries into the U.S. dollar for consolidated reporting purposes. The translation of non-U.S. dollar denominated balance sheets and statements of earnings of our subsidiaries into the U.S. dollar for consolidated reporting generally results in a cumulative translation adjustment to other comprehensive income within equity. A stronger U.S. dollar relative to other functional currencies adversely affects our consolidated earnings and net assets while a weaker U.S. dollar benefits our consolidated earnings and net assets. While we hedge significant forecasted currency exchange transactions as well as certain net assets of non-U.S. operations and other currency impacts, we cannot fully predict or eliminate volatility arising from changes in currency exchange rates on our consolidated financial results. See Consolidated Results of Operations and Results of Operations by Reportable Segment under Discussion and Analysis of Historical Results for currency exchange effects on our financial results. For additional information on the impact of currency policies, recent currency devaluations, the deconsolidation of our Venezuelan operation and the historical remeasurement of our Venezuelan net monetary assets on our financial condition and results of operations, also see Note 1, Summary of Significant Accounting Policies—Currency Translation and Highly Inflationary Accounting.
We also continually monitor the market for commodities that we use in our products. Input costs may fluctuate widely due to international demand, weather conditions, government policy and regulation and unforeseen conditions. To manage input cost volatility, we enter into forward purchase agreements and other derivative financial instruments. We also pursue productivity and cost saving measures and take pricing actions when necessary to mitigate the impact of higher input costs on earnings.
We regularly evaluate our variable and fixed-rate debt as well as current and expected interest rates in the markets in which we raise capital. Our primary exposures include movements in U.S. Treasury rates, corporate credit spreads, London Interbank Offered Rates (“LIBOR”), Euro Interbank Offered Rate (“EURIBOR”) and commercial paper rates. We periodically use interest rate swaps and forward interest rate contracts to achieve a desired proportion of variable versus fixed rate debt based on current and projected market conditions. Our weighted-average interest rate on our total debt was 2.1% as of December 31, 2017, down from 2.2% as of December 31, 2016.
There were no significant changes in the types of derivative instruments we use to hedge our exposures between
December 31, 2016 and December 31, 2017. See Note 8, Financial Instruments, for more information on 2017 and 2018 derivative activity.
Value at Risk:
We use a value at risk (“VAR”) computation to estimate: 1) the potential one-day loss in the fair value of our interest rate-sensitive financial instruments; and 2) the potential one-day loss in pre-tax earnings of our currency and commodity price-sensitive derivative financial instruments. The VAR analysis was done separately for our currency exchange, fixed income and commodity risk portfolios as of each quarter end during the periods presented below. The instruments included in the VAR computation were currency exchange forwards and options for currency exchange risk, debt and swaps for interest rate risk, and commodity forwards, futures and options for commodity risk. Excluded from the computation were anticipated transactions, currency trade payables and receivables, and net investments in non-U.S. subsidiaries, which the above-mentioned instruments are intended to hedge.
59
Table of Contents
The VAR model assumes normal market conditions, a 95% confidence interval and a one-day holding period. A parametric delta-gamma approximation technique was used to determine the expected return distribution in interest rates, currencies and commodity prices for the purpose of calculating the fixed income, currency exchange and commodity VAR, respectively. The parameters used for estimating the expected return distributions were determined by observing interest rate, currency exchange, and commodity price movements over the prior quarter for the calculation of VAR amounts at December 31, 2017 and 2016, and over each of the four prior quarters for the calculation of average VAR amounts during each year. The values of currency and commodity options do not change on a one-to-one basis with the underlying currency or commodity and were valued accordingly in the VAR computation.
As of December 31, 2017 and December 31, 2016, the estimated potential one-day loss in fair value of our interest rate-sensitive instruments, primarily debt, and the estimated potential one-day loss in pre-tax earnings from our currency and commodity instruments, as calculated in the VAR model, were:
| Pre-Tax Earnings Impact | Fair Value Impact | |||||||||||||||||||||||||||||||
| At 12/31/17 | Average | High | Low | At 12/31/17 | Average | High | Low | |||||||||||||||||||||||||
| (in millions) | ||||||||||||||||||||||||||||||||
| Instruments sensitive to: |
||||||||||||||||||||||||||||||||
| Interest rates |
$ 31 | $ 45 | $ 55 | $ 31 | ||||||||||||||||||||||||||||
| Foreign currency rates |
$ 15 | $ 16 | $ 22 | $ 11 | ||||||||||||||||||||||||||||
| Commodity prices |
14 | 17 | 24 | 14 | ||||||||||||||||||||||||||||
| Pre-Tax Earnings Impact | Fair Value Impact | |||||||||||||||||||||||||||||||
| At 12/31/16 | Average | High | Low | At 12/31/16 | Average | High | Low | |||||||||||||||||||||||||
| (in millions) | ||||||||||||||||||||||||||||||||
| Instruments sensitive to: |
||||||||||||||||||||||||||||||||
| Interest rates |
$ 62 | $ 62 | $ 91 | $ 45 | ||||||||||||||||||||||||||||
| Foreign currency rates |
$ 10 | $ 18 | $ 26 | $ 10 | ||||||||||||||||||||||||||||
| Commodity prices |
16 | 12 | 16 | 10 | ||||||||||||||||||||||||||||
This VAR computation is a risk analysis tool designed to statistically estimate the maximum expected daily loss, under the specified confidence interval and assuming normal market conditions, from adverse movements in interest rates, currency exchange rates and commodity prices. The computation does not represent actual losses in fair value or earnings we will incur, nor does it consider the effect of favorable changes in market rates. We cannot predict actual future movements in market rates and do not present these VAR results to be indicative of future movements in market rates or to be representative of any actual impact that future changes in market rates may have on our future financial results.
60
Table of Contents
Item 8. Financial Statements and Supplementary Data.
Report of Independent Registered Public Accounting Firm
To the Board of Directors and Shareholders of Mondelēz International, Inc.
Opinions on the Financial Statements and Internal Control over Financial Reporting
We have audited the accompanying consolidated balance sheets of Mondelēz International, Inc. and its subsidiaries as of December 31, 2017 and 2016, and the related consolidated statements of earnings, comprehensive earnings, equity and cash flows for each of the three years in the period ended December 31, 2017, including the related notes and financial statement schedule listed in the index appearing under Item 15(a) (collectively referred to as the “consolidated financial statements”). We also have audited the Company’s internal control over financial reporting as of December 31, 2017, based on criteria established in Internal Control—Integrated Framework (2013) issued by the Committee of Sponsoring Organizations of the Treadway Commission (COSO).
In our opinion, the consolidated financial statements referred to above present fairly, in all material respects, the financial position of the Company as of December 31, 2017 and 2016, and the results of their operations and their cash flows for each of the three years in the period ended December 31, 2017 in conformity with accounting principles generally accepted in the United States of America. Also in our opinion, the Company maintained, in all material respects, effective internal control over financial reporting as of December 31, 2017, based on criteria established in Internal Control—Integrated Framework (2013) issued by the COSO.
Basis for Opinions
The Company’s management is responsible for these consolidated financial statements, for maintaining effective internal control over financial reporting, and for its assessment of the effectiveness of internal control over financial reporting, included in the Report of Management on Internal Control Over Financial Reporting appearing under Item 9A. Our responsibility is to express opinions on the Company’s consolidated financial statements and on the Company’s internal control over financial reporting based on our audits. We are a public accounting firm registered with the Public Company Accounting Oversight Board (United States) (“PCAOB”) and are required to be independent with respect to the Company in accordance with the U.S. federal securities laws and the applicable rules and regulations of the Securities and Exchange Commission and the PCAOB.
We conducted our audits in accordance with the standards of the PCAOB. Those standards require that we plan and perform the audits to obtain reasonable assurance about whether the consolidated financial statements are free of material misstatement, whether due to error or fraud, and whether effective internal control over financial reporting was maintained in all material respects.
Our audits of the consolidated financial statements included performing procedures to assess the risks of material misstatement of the consolidated financial statements, whether due to error or fraud, and performing procedures that respond to those risks. Such procedures included examining, on a test basis, evidence regarding the amounts and disclosures in the consolidated financial statements. Our audits also included evaluating the accounting principles used and significant estimates made by management, as well as evaluating the overall presentation of the consolidated financial statements. Our audit of internal control over financial reporting included obtaining an understanding of internal control over financial reporting, assessing the risk that a material weakness exists, and testing and evaluating the design and operating effectiveness of internal control based on the assessed risk. Our audits also included performing such other procedures as we considered necessary in the circumstances. We believe that our audits provide a reasonable basis for our opinions.
61
Table of Contents
Definition and Limitations of Internal Control over Financial Reporting
A company’s internal control over financial reporting is a process designed to provide reasonable assurance regarding the reliability of financial reporting and the preparation of financial statements for external purposes in accordance with generally accepted accounting principles. A company’s internal control over financial reporting includes those policies and procedures that (i) pertain to the maintenance of records that, in reasonable detail, accurately and fairly reflect the transactions and dispositions of the assets of the company; (ii) provide reasonable assurance that transactions are recorded as necessary to permit preparation of financial statements in accordance with generally accepted accounting principles, and that receipts and expenditures of the company are being made only in accordance with authorizations of management and directors of the company; and (iii) provide reasonable assurance regarding prevention or timely detection of unauthorized acquisition, use, or disposition of the company’s assets that could have a material effect on the financial statements.
Because of its inherent limitations, internal control over financial reporting may not prevent or detect misstatements. Also, projections of any evaluation of effectiveness to future periods are subject to the risk that controls may become inadequate because of changes in conditions, or that the degree of compliance with the policies or procedures may deteriorate.
/s/ PRICEWATERHOUSECOOPERS LLP
Chicago, Illinois
February 9, 2018
PRICEWATERHOUSECOOPERS LLP has served as the Company’s auditor since 2001.
62
Table of Contents
Mondelēz International, Inc. and Subsidiaries
Consolidated Statements of Earnings
For the Years Ended December 31
(in millions of U.S. dollars, except per share data)
| 2017 | 2016 | 2015 | ||||||||||
| Net revenues |
$ | 25,896 | $ | 25,923 | $ | 29,636 | ||||||
| Cost of sales |
15,831 | 15,795 | 18,124 | |||||||||
|
|
|
|
|
|
|
|||||||
| Gross profit |
10,065 | 10,128 | 11,512 | |||||||||
| Selling, general and administrative expenses |
5,911 | 6,540 | 7,577 | |||||||||
| Asset impairment and exit costs |
656 | 852 | 901 | |||||||||
| Net gain on divestitures |
(186 | ) | (9 | ) | (6,822 | ) | ||||||
| Loss on deconsolidation of Venezuela |
– | – | 778 | |||||||||
| Amortization of intangibles |
178 | 176 | 181 | |||||||||
|
|
|
|
|
|
|
|||||||
| Operating income |
3,506 | 2,569 | 8,897 | |||||||||
| Interest and other expense, net |
382 | 1,115 | 1,013 | |||||||||
|
|
|
|
|
|
|
|||||||
| Earnings before income taxes |
3,124 | 1,454 | 7,884 | |||||||||
| Provision for income taxes |
(688 | ) | (129 | ) | (593 | ) | ||||||
| Gain on equity method investment transactions |
40 | 43 | – | |||||||||
| Equity method investment net earnings |
460 | 301 | – | |||||||||
|
|
|
|
|
|
|
|||||||
| Net earnings |
2,936 | 1,669 | 7,291 | |||||||||
| Noncontrolling interest earnings |
(14 | ) | (10 | ) | (24 | ) | ||||||
|
|
|
|
|
|
|
|||||||
| Net earnings attributable to Mondelēz International |
$ | 2,922 | $ | 1,659 | $ | 7,267 | ||||||
|
|
|
|
|
|
|
|||||||
| Per share data: |
||||||||||||
| Basic earnings per share attributable to Mondelēz International |
$ | 1.93 | $ | 1.07 | $ | 4.49 | ||||||
|
|
|
|
|
|
|
|||||||
| Diluted earnings per share attributable to Mondelēz International |
$ | 1.91 | $ | 1.05 | $ | 4.44 | ||||||
|
|
|
|
|
|
|
|||||||
| Dividends declared |
$ | 0.82 | $ | 0.72 | $ | 0.64 | ||||||
|
|
|
|
|
|
|
|||||||
See accompanying notes to the consolidated financial statements.
63
Table of Contents
Mondelēz International, Inc. and Subsidiaries
Consolidated Statements of Comprehensive Earnings
For the Years Ended December 31
(in millions of U.S. dollars)
| 2017 | 2016 | 2015 | ||||||||||
| Net earnings |
$ | 2,936 | $ | 1,669 | $ | 7,291 | ||||||
| Other comprehensive earnings/(losses), net of tax: |
||||||||||||
| Currency translation adjustment |
1,201 | (925 | ) | (2,990 | ) | |||||||
| Pension and other benefit plans |
(57 | ) | (153 | ) | 340 | |||||||
| Derivative cash flow hedges |
8 | (75 | ) | (44 | ) | |||||||
|
|
|
|
|
|
|
|||||||
| Total other comprehensive earnings/(losses) |
1,152 | (1,153 | ) | (2,694 | ) | |||||||
| Comprehensive earnings |
4,088 | 516 | 4,597 | |||||||||
| less: Comprehensive earnings/(losses) attributable to noncontrolling interests |
42 | (7 | ) | (2 | ) | |||||||
|
|
|
|
|
|
|
|||||||
| Comprehensive earnings attributable to Mondelēz International |
$ | 4,046 | $ | 523 | $ | 4,599 | ||||||
|
|
|
|
|
|
|
|||||||
See accompanying notes to the consolidated financial statements.
64
Table of Contents
Mondelēz International, Inc. and Subsidiaries
Consolidated Balance Sheets, as of December 31
(in millions of U.S. dollars, except share data)
| 2017 | 2016 | |||||||
| ASSETS |
||||||||
| Cash and cash equivalents |
$ | 761 | $ | 1,741 | ||||
| Trade receivables (net of allowances of $50 at December 31, 2017 |
2,691 | 2,611 | ||||||
| Other receivables (net of allowances of $98 at December 31, 2017 |
835 | 859 | ||||||
| Inventories, net |
2,557 | 2,469 | ||||||
| Other current assets |
676 | 800 | ||||||
|
|
|
|
|
|||||
| Total current assets |
7,520 | 8,480 | ||||||
| Property, plant and equipment, net |
8,677 | 8,229 | ||||||
| Goodwill |
21,085 | 20,276 | ||||||
| Intangible assets, net |
18,639 | 18,101 | ||||||
| Prepaid pension assets |
158 | 159 | ||||||
| Deferred income taxes |
319 | 358 | ||||||
| Equity method investments |
6,345 | 5,585 | ||||||
| Other assets |
366 | 350 | ||||||
|
|
|
|
|
|||||
| TOTAL ASSETS |
$ | 63,109 | $ | 61,538 | ||||
|
|
|
|
|
|||||
| LIABILITIES |
||||||||
| Short-term borrowings |
$ | 3,517 | $ | 2,531 | ||||
| Current portion of long-term debt |
1,163 | 1,451 | ||||||
| Accounts payable |
5,705 | 5,318 | ||||||
| Accrued marketing |
1,728 | 1,745 | ||||||
| Accrued employment costs |
721 | 736 | ||||||
| Other current liabilities |
2,959 | 2,636 | ||||||
|
|
|
|
|
|||||
| Total current liabilities |
15,793 | 14,417 | ||||||
| Long-term debt |
12,972 | 13,217 | ||||||
| Deferred income taxes |
3,376 | 4,721 | ||||||
| Accrued pension costs |
1,669 | 2,014 | ||||||
| Accrued postretirement health care costs |
419 | 382 | ||||||
| Other liabilities |
2,689 | 1,572 | ||||||
|
|
|
|
|
|||||
| TOTAL LIABILITIES |
36,918 | 36,323 | ||||||
| Commitments and Contingencies (Note 12) |
||||||||
| EQUITY |
||||||||
| Common Stock, no par value (5,000,000,000 shares authorized and |
– | – | ||||||
| Additional paid-in capital |
31,915 | 31,847 | ||||||
| Retained earnings |
22,749 | 21,149 | ||||||
| Accumulated other comprehensive losses |
(9,998 | ) | (11,122 | ) | ||||
| Treasury stock, at cost (508,401,694 shares at December 31, 2017 and |
(18,555 | ) | (16,713 | ) | ||||
|
|
|
|
|
|||||
| Total Mondelēz International Shareholders’ Equity |
26,111 | 25,161 | ||||||
| Noncontrolling interest |
80 | 54 | ||||||
|
|
|
|
|
|||||
| TOTAL EQUITY |
26,191 | 25,215 | ||||||
|
|
|
|
|
|||||
| TOTAL LIABILITIES AND EQUITY |
$ | 63,109 | $ | 61,538 | ||||
|
|
|
|
|
|||||
See accompanying notes to the consolidated financial statements.
65
Table of Contents
Mondelēz International, Inc. and Subsidiaries
Consolidated Statements of Equity
(in millions of U.S. dollars, except per share data)
| Mondelēz International Shareholders’ Equity | ||||||||||||||||||||||||||||
| Accumulated | ||||||||||||||||||||||||||||
| Other | ||||||||||||||||||||||||||||
| Additional | Comprehensive | |||||||||||||||||||||||||||
| Common | Paid-in | Retained | Earnings/ | Treasury | Noncontrolling | Total | ||||||||||||||||||||||
| Stock | Capital | Earnings | (Losses) | Stock | Interest | Equity | ||||||||||||||||||||||
| Balances at January 1, 2015 |
$ | – | $ | 31,651 | $ | 14,529 | $ | (7,318 | ) | $ | (11,112 | ) | $ | 103 | $ | 27,853 | ||||||||||||
| Comprehensive earnings/(losses): |
||||||||||||||||||||||||||||
| Net earnings |
– | – | 7,267 | – | – | 24 | 7,291 | |||||||||||||||||||||
| Other comprehensive earnings/(losses), net of income taxes |
– | – | – | (2,668 | ) | – | (26 | ) | (2,694 | ) | ||||||||||||||||||
| Exercise of stock options and |
– | 109 | (70 | ) | – | 272 | – | 311 | ||||||||||||||||||||
| Common Stock repurchased |
– | – | – | – | (3,622 | ) | – | (3,622 | ) | |||||||||||||||||||
| Cash dividends declared |
– | – | (1,026 | ) | – | – | – | (1,026 | ) | |||||||||||||||||||
| Dividends paid on noncontrolling interest and other activities |
– | – | – | – | – | (13 | ) | (13 | ) | |||||||||||||||||||
|
|
|
|
|
|
|
|
|
|
|
|
|
|
|
|||||||||||||||
| Balances at December 31, 2015 |
$ | – | $ | 31,760 | $ | 20,700 | $ | (9,986 | ) | $ | (14,462 | ) | $ | 88 | $ | 28,100 | ||||||||||||
|
|
|
|
|
|
|
|
|
|
|
|
|
|
|
|||||||||||||||
| Comprehensive earnings/(losses): |
||||||||||||||||||||||||||||
| Net earnings |
– | – | 1,659 | – | – | 10 | 1,669 | |||||||||||||||||||||
| Other comprehensive earnings/(losses), net of income taxes |
– | – | – | (1,136 | ) | – | (17 | ) | (1,153 | ) | ||||||||||||||||||
| Exercise of stock options and |
– | 87 | (94 | ) | – | 350 | – | 343 | ||||||||||||||||||||
| Common Stock repurchased |
– | – | – | – | (2,601 | ) | – | (2,601 | ) | |||||||||||||||||||
| Cash dividends declared |
– | – | (1,116 | ) | – | – | – | (1,116 | ) | |||||||||||||||||||
| Dividends paid on noncontrolling interest and other activities |
– | – | – | – | – | (27 | ) | (27 | ) | |||||||||||||||||||
|
|
|
|
|
|
|
|
|
|
|
|
|
|
|
|||||||||||||||
| Balances at December 31, 2016 |
$ | – | $ | 31,847 | $ | 21,149 | $ | (11,122 | ) | $ | (16,713 | ) | $ | 54 | $ | 25,215 | ||||||||||||
|
|
|
|
|
|
|
|
|
|
|
|
|
|
|
|||||||||||||||
| Comprehensive earnings/(losses): |
||||||||||||||||||||||||||||
| Net earnings |
– | – | 2,922 | – | – | 14 | 2,936 | |||||||||||||||||||||
| Other comprehensive earnings/(losses), net of income taxes |
– | – | – | 1,124 | – | 28 | 1,152 | |||||||||||||||||||||
| Exercise of stock options and |
– | 68 | (83 | ) | – | 360 | – | 345 | ||||||||||||||||||||
| Common Stock repurchased |
– | – | – | – | (2,202 | ) | – | (2,202 | ) | |||||||||||||||||||
| Cash dividends declared |
– | – | (1,239 | ) | – | – | – | (1,239 | ) | |||||||||||||||||||
| Dividends paid on noncontrolling interest and other activities |
– | – | – | – | – | (16 | ) | (16 | ) | |||||||||||||||||||
|
|
|
|
|
|
|
|
|
|
|
|
|
|
|
|||||||||||||||
| Balances at December 31, 2017 |
$ | – | $ | 31,915 | $ | 22,749 | $ | (9,998 | ) | $ | (18,555 | ) | $ | 80 | $ | 26,191 | ||||||||||||
|
|
|
|
|
|
|
|
|
|
|
|
|
|
|
|||||||||||||||
See accompanying notes to the consolidated financial statements.
66
Table of Contents
Mondelēz International, Inc. and Subsidiaries
Consolidated Statements of Cash Flows
For the Years Ended December 31
(in millions of U.S. dollars)
| 2017 | 2016 | 2015 | ||||||||||
| CASH PROVIDED BY/(USED IN) OPERATING ACTIVITIES |
||||||||||||
| Net earnings |
$ | 2,936 | $ | 1,669 | $ | 7,291 | ||||||
| Adjustments to reconcile net earnings to operating cash flows: |
||||||||||||
| Depreciation and amortization |
816 | 823 | 894 | |||||||||
| Stock-based compensation expense |
137 | 140 | 136 | |||||||||
| U.S. tax reform transition tax |
1,317 | – | – | |||||||||
| Deferred income tax benefit |
(1,206 | ) | (141 | ) | (30 | ) | ||||||
| Asset impairments and accelerated depreciation |
334 | 446 | 345 | |||||||||
| Loss on early extinguishment of debt |
11 | 428 | 748 | |||||||||
| Loss on deconsolidation of Venezuela |
– | – | 778 | |||||||||
| Gains on divestitures and JDE coffee business transactions |
(186 | ) | (9 | ) | (6,822 | ) | ||||||
| JDE coffee business transactions currency-related net gains |
– | – | (436 | ) | ||||||||
| Gain on equity method investment transactions |
(40 | ) | (43 | ) | – | |||||||
| Equity method investment net earnings |
(460 | ) | (301 | ) | (56 | ) | ||||||
| Distributions from equity method investments |
152 | 75 | 58 | |||||||||
| Other non-cash items, net |
(225 | ) | (43 | ) | 199 | |||||||
| Change in assets and liabilities, net of acquisitions and divestitures: |
||||||||||||
| Receivables, net |
(24 | ) | 31 | 44 | ||||||||
| Inventories, net |
(18 | ) | 62 | (49 | ) | |||||||
| Accounts payable |
5 | 409 | 659 | |||||||||
| Other current assets |
14 | (176 | ) | 28 | ||||||||
| Other current liabilities |
(637 | ) | 60 | 152 | ||||||||
| Change in pension and postretirement assets and liabilities, net |
(333 | ) | (592 | ) | (211 | ) | ||||||
|
|
|
|
|
|
|
|||||||
| Net cash provided by operating activities |
2,593 | 2,838 | 3,728 | |||||||||
|
|
|
|
|
|
|
|||||||
| CASH PROVIDED BY/(USED IN) INVESTING ACTIVITIES |
||||||||||||
| Capital expenditures |
(1,014 | ) | (1,224 | ) | (1,514 | ) | ||||||
| Proceeds from JDE coffee business transactions |
– | – | 1,050 | |||||||||
| Acquisitions, net of cash received |
– | (246 | ) | (527 | ) | |||||||
| Proceeds from divestitures, net of disbursements |
604 | 303 | 4,735 | |||||||||
| Reduction of cash due to Venezuela deconsolidation |
– | – | (611 | ) | ||||||||
| Capital contribution to JDE |
– | – | (544 | ) | ||||||||
| Proceeds from sale of property, plant and equipment and other assets |
109 | 138 | 60 | |||||||||
|
|
|
|
|
|
|
|||||||
| Net cash (used in)/provided by investing activities |
(301 | ) | (1,029 | ) | 2,649 | |||||||
|
|
|
|
|
|
|
|||||||
| CASH PROVIDED BY/(USED IN) FINANCING ACTIVITIES |
||||||||||||
| Issuances of commercial paper, maturities greater than 90 days |
1,808 | 1,540 | 613 | |||||||||
| Repayments of commercial paper, maturities greater than 90 days |
(1,911 | ) | (1,031 | ) | (710 | ) | ||||||
| Net issuances/(repayments) of other short-term borrowings |
1,027 | 1,741 | (931 | ) | ||||||||
| Long-term debt proceeds |
350 | 5,640 | 4,624 | |||||||||
| Long-term debt repaid |
(1,470 | ) | (6,186 | ) | (4,975 | ) | ||||||
| Repurchase of Common Stock |
(2,174 | ) | (2,601 | ) | (3,622 | ) | ||||||
| Dividends paid |
(1,198 | ) | (1,094 | ) | (1,008 | ) | ||||||
| Other |
207 | 129 | 126 | |||||||||
|
|
|
|
|
|
|
|||||||
| Net cash used in financing activities |
(3,361 | ) | (1,862 | ) | (5,883 | ) | ||||||
|
|
|
|
|
|
|
|||||||
| Effect of exchange rate changes on cash and cash equivalents |
89 | (76 | ) | (255 | ) | |||||||
|
|
|
|
|
|
|
|||||||
| Cash and cash equivalents: |
||||||||||||
| (Decrease)/increase |
(980 | ) | (129 | ) | 239 | |||||||
| Balance at beginning of period |
1,741 | 1,870 | 1,631 | |||||||||
|
|
|
|
|
|
|
|||||||
| Balance at end of period |
$ | 761 | $ | 1,741 | $ | 1,870 | ||||||
|
|
|
|
|
|
|
|||||||
| Cash paid: |
||||||||||||
| Interest |
$ | 398 | $ | 630 | $ | 747 | ||||||
|
|
|
|
|
|
|
|||||||
| Income taxes |
$ | 848 | $ | 527 | $ | 745 | ||||||
|
|
|
|
|
|
|
|||||||
See accompanying notes to the consolidated financial statements.
67
Table of Contents
Mondelēz International, Inc. and Subsidiaries
Notes to Consolidated Financial Statements
Note 1. Summary of Significant Accounting Policies
Description of Business:
Mondelēz International, Inc. was incorporated in 2000 in the Commonwealth of Virginia. Mondelēz International, Inc., through its subsidiaries (collectively “Mondelēz International,” “we,” “us” and “our”), sells food and beverage products to consumers in approximately 160 countries.
Principles of Consolidation:
The consolidated financial statements include Mondelēz International, Inc. as well as our wholly owned and majority owned subsidiaries. All intercompany transactions are eliminated. The noncontrolling interest represents the noncontrolling investors’ interests in the results of subsidiaries that we control and consolidate. Through December 31, 2015, the operating results of our Venezuelan subsidiaries are included in our consolidated financial statements. As of the close of the fourth quarter of 2015, we deconsolidated our Venezuelan operations from our consolidated financial statements and recognized a loss on deconsolidation. See Currency Translation and Highly Inflationary Accounting: Venezuela below for more information.
We account for investments in which we exercise significant influence under the equity method of accounting. On July 2, 2015, we contributed our global coffee businesses to a new company, Jacobs Douwe Egberts (“JDE”), in which we now hold an equity interest (collectively, the “JDE coffee business transactions”). Historically, our coffee businesses and the income from equity method investments were recorded within our operating income as these businesses were part of our base business. While we retain an ongoing interest in coffee through equity method investments including JDE, Keurig Green Mountain Inc. (“Keurig”) and Dongsuh Foods Corporation (“DSF”), and we have significant influence with our equity method investments, we do not control these operations directly. As such, in the third quarter of 2015, we began to recognize equity method investment earnings, consisting primarily of investments in coffee businesses, outside of operating income and segment income. For periods prior to the third quarter of 2015, our historical coffee business and equity method investment earnings were included within our operating income and segment income. (For the six months ended December 31, 2015, after-tax equity method investment net earnings were less than $1 million on a combined basis and thus are not shown on our consolidated statement of earnings for this period.) Please see Note 2, Divestitures and Acquisitions – JDE Coffee Business Transactions, Keurig Transaction and Planned Keurig Dr Pepper Transaction, and Note 16, Segment Reporting, for more information on these transactions.
We use the cost method of accounting for investments in which we do not exercise significant influence or control. Under the cost method of accounting, earnings are recognized to the extent cash is received.
Use of Estimates:
We prepare our consolidated financial statements in accordance with accounting principles generally accepted in the United States of America (“U.S. GAAP”), which require us to make estimates and assumptions that affect a number of amounts in our consolidated financial statements. Significant accounting policy elections, estimates and assumptions include, among others, pension and benefit plan assumptions, valuation assumptions of goodwill and intangible assets, useful lives of long-lived assets, restructuring program liabilities, marketing program accruals, insurance and self-insurance reserves and income taxes. We base our estimates on historical experience and other assumptions that we believe are reasonable. If actual amounts differ from estimates, we include the revisions in our consolidated results of operations in the period the actual amounts become known. Historically, the aggregate differences, if any, between our estimates and actual amounts in any year have not had a material effect on our consolidated financial statements.
Segment Change:
On October 1, 2016, we integrated our Eastern Europe, Middle East, and Africa (“EEMEA”) operating segment into our Europe and Asia Pacific operating segments to further leverage and optimize the operating scale built within the Europe and Asia Pacific regions. Russia, Ukraine, Turkey, Belarus, Georgia and Kazakhstan were combined within our Europe region, while the remaining Middle East and African countries were combined within our Asia Pacific region to form a new Asia, Middle East and Africa (“AMEA”) operating segment. We have reflected the segment change as if it had occurred in all periods presented.
68
Table of Contents
As of October 1, 2016, our operations and management structure were organized into four reportable operating segments:
| • | Latin America |
| • | AMEA |
| • | Europe |
| • | North America |
See Note 16, Segment Reporting, for additional information on our segments.
Currency Translation and Highly Inflationary Accounting:
We translate the results of operations of our subsidiaries from multiple currencies using average exchange rates during each period and translate balance sheet accounts using exchange rates at the end of each period. We record currency translation adjustments as a component of equity (except for highly inflationary currencies) and realized exchange gains and losses on transactions in earnings.
Highly inflationary accounting is triggered when a country’s three-year cumulative inflation rate exceeds 100%. It requires the remeasurement of financial statements of subsidiaries in the country, from the functional currency of the subsidiary to our U.S. dollar reporting currency, with currency remeasurement gains or losses recorded in earnings. In 2017, none of our consolidated subsidiaries were accounted for as highly inflationary economies.
Argentina. We continue to closely monitor inflation and the potential for the economy to become highly inflationary for accounting purposes. As of December 31, 2017, the Argentinian economy was not designated as highly inflationary and we continued to record currency translation adjustments within equity and realized exchange gains and losses on transactions in earnings. Our Argentinian operations contributed $601 million, or 2.3% of consolidated net revenues in 2017. The net monetary liabilities of our Argentinian operations as of December 31, 2017 were not material.
Ukraine. Based on inflation data published by the National Bank of Ukraine, Ukraine’s three-year cumulative inflation rate dropped and remained below 100% by the end of 2017. As such, Ukraine is no longer highly inflationary and we continue to record currency translation adjustments within equity and realized exchange gains and losses on transactions in earnings. Our Ukrainian operations contributed $73 million, or 0.3%, of consolidated net revenues in 2017. The net monetary assets of our Ukrainian operations as of December 31, 2017 were not material.
Venezuela. From January 1, 2010 through December 31, 2015, we accounted for the results of our Venezuelan subsidiaries using the U.S. dollar as the functional currency as prescribed by U.S. GAAP for highly inflationary economies.
Effective as of the close of the 2015 fiscal year, we concluded that we no longer met the accounting criteria for consolidation of our Venezuelan subsidiaries due to a loss of control over our Venezuelan operations and an other-than-temporary lack of currency exchangeability. The economic and regulatory environment in Venezuela and the progressively limited access to dollars to import goods through the use of any of the available currency mechanisms impaired our ability to operate and control our Venezuelan businesses. As a result of these factors, we concluded that we no longer met the criteria for the consolidation of our Venezuelan subsidiaries.
As of the close of the 2015 fiscal year, we deconsolidated and changed to the cost method of accounting for our Venezuelan operations. We recorded a $778 million pre-tax loss on December 31, 2015 as we reduced the value of our cost method investment in Venezuela and all Venezuelan receivables held by our other subsidiaries to realizable fair value, resulting in full impairment. The recorded loss also included historical cumulative translation adjustments related to our Venezuelan operations that had previously been recorded in accumulated other comprehensive losses within equity. The fair value of our investments in our Venezuelan subsidiaries was estimated based on discounted cash flow projections of current and expected operating losses in the foreseeable future and our ability to operate the business on a sustainable basis. Our fair value estimate included U.S. dollar exchange and discount rate assumptions that reflected the inflation and economic uncertainty in Venezuela.
For 2015, the operating results of our Venezuela operations were included in our consolidated statements of earnings. During this time, we recognized a number of currency-related remeasurement losses resulting from devaluations of the Venezuela bolivar exchange rates we historically used to source U.S. dollars for purchases of imported raw materials, packaging and other goods and services. The following table sets forth the 2015 remeasurement losses, the deconsolidation loss and historical operating results and financial position of our Venezuelan subsidiaries for the period presented:
69
Table of Contents
| For the Year Ended December 31, 2015 |
||||
| (in millions) | ||||
| Net revenues |
$ | 1,217 | ||
| Operating income (excluding remeasurement and deconsolidation loss) |
266 | |||
| Remeasurement loss in Q1 2015: 11.50 to 12.00 bolivars to the U.S. dollar |
(11 | ) | ||
| Loss on deconsolidation |
(778 | ) | ||
| As of December 31, 2015 (1) |
||||
| (in millions) | ||||
| Cash |
$ | 611 | ||
| Net monetary assets |
405 | |||
| Net assets |
658 | |||
| (1) | Represents the financial position of our Venezuelan subsidiaries on December 31, 2015 prior to deconsolidation. |
Beginning in 2016, we no longer included net revenues, earnings or net assets of our Venezuelan subsidiaries within our consolidated financial statements. Under the cost method of accounting, earnings are only recognized to the extent cash is received. Given the current and ongoing difficult economic, regulatory and business environment in Venezuela, there continues to be significant uncertainty related to our operations in Venezuela. In early 2018, the profitability and cash flows of our local operations significantly deteriorated following the issuance of new government price controls. We are engaging with authorities on the pricing restrictions, however, if the situation is not resolved, it could significantly impede our ability to continue to operate in Venezuela.
Other Countries. Since we sell our products in approximately 160 countries and have operations in over 80 countries, we monitor economic and currency-related risks and seek to take protective measures in response to these exposures. Some of the countries in which we do business have recently experienced periods of significant economic uncertainty and exchange rate volatility, including Brazil, China, Mexico, Russia, United Kingdom (Brexit), Turkey, Egypt, Nigeria and South Africa. We continue to monitor operations, currencies and net monetary exposures in these countries. At this time, we do not anticipate a risk to our operating results from changing to highly inflationary accounting in these countries.
Cash and Cash Equivalents:
Cash and cash equivalents include demand deposits with banks and all highly liquid investments with original maturities of three months or less.
Transfers of Financial Assets:
We account for transfers of financial assets, such as uncommitted revolving non-recourse accounts receivable factoring arrangements, when we have surrendered control over the related assets. Determining whether control has transferred requires an evaluation of relevant legal considerations, an assessment of the nature and extent of our continuing involvement with the assets transferred and any other relevant considerations. We use receivable factoring arrangements periodically when circumstances are favorable to manage liquidity. We have a factoring arrangement with a major global bank for a maximum combined capacity of $1.0 billion. Under the program, we may sell eligible short-term trade receivables to the bank in exchange for cash. We then continue to collect the receivables sold, acting solely as a collecting agent on behalf of the bank. The outstanding principal amount of receivables under this arrangement amounted to $804 million as of December 31, 2017, $644 million as of December 31, 2016 and $570 million as of December 31, 2015. The incremental cost of factoring receivables under this arrangement were no more than $6 million in each of the years presented. The proceeds from the sales of receivables are included in cash from operating activities in the consolidated statements of cash flows.
Accounting Calendar Change:
In connection with moving toward a common consolidation date across the Company, in the first quarter of 2015, we changed the consolidation date for our North America segment from the last Saturday of each period to the last calendar day of each period. The change had a favorable impact of $76 million on net revenues and $36 million on operating income in 2015. As a result of this change, each of our operating subsidiaries now reports results as of the last calendar day of the period.
70
Table of Contents
Inventories:
We value our inventory using the average cost method. We also record inventory allowances for overstock and obsolete inventories due to ingredient and packaging changes.
Long-Lived Assets:
Property, plant and equipment are stated at historical cost and depreciated by the straight-line method over the estimated useful lives of the assets. Machinery and equipment are depreciated over periods ranging from 3 to 20 years and buildings and building improvements over periods up to 40 years.
We review long-lived assets, including amortizable intangible assets, for realizability on an ongoing basis. Changes in depreciation, generally accelerated depreciation, are determined and recorded when estimates of the remaining useful lives or residual values of long-term assets change. We also review for impairment when conditions exist that indicate the carrying amount of the assets may not be fully recoverable. In those circumstances, we perform undiscounted operating cash flow analyses to determine if an impairment exists. When testing for asset impairment, we group assets and liabilities at the lowest level for which cash flows are separately identifiable. Any impairment loss is calculated as the excess of the asset’s carrying value over its estimated fair value. Fair value is estimated based on the discounted cash flows for the asset group over the remaining useful life or based on the expected cash proceeds for the asset less costs of disposal. Any significant impairment losses would be recorded within asset impairment and exit costs in the consolidated statements of earnings.
Software Costs:
We capitalize certain computer software and software development costs incurred in connection with developing or obtaining computer software for internal use. Capitalized software costs are included in property, plant and equipment and amortized on a straight-line basis over the estimated useful lives of the software, which do not exceed seven years.
Goodwill and Non-Amortizable Intangible Assets:
We have historically annually tested goodwill and non-amortizable intangible assets for impairment as of October 1. In 2017, we voluntarily changed the annual impairment assessment date from October 1 to July 1. We believe this measurement date, which represents a change in the method of applying an accounting principle, is preferable because it better aligns with our strategic business planning process and financial forecasts, which are key components of the annual impairment tests. The change in the measurement date did not delay, accelerate or prevent an impairment charge. Each quarter, we have evaluated goodwill and intangible asset impairment risks and recognized any related impairments to date. As such, the change in the annual test date was applied on July 1, 2017.
We assess goodwill impairment risk throughout the year by performing a qualitative review of entity-specific, industry, market and general economic factors affecting our goodwill reporting units. We review our operating segment and reporting unit structure for goodwill testing annually or as significant changes in the organization occur. Annually, we may perform qualitative testing, or depending on factors such as prior-year test results, current year developments, current risk evaluations and other practical considerations, we may elect to do quantitative testing instead. In our quantitative testing, we compare a reporting unit’s estimated fair value with its carrying value. We estimate a reporting unit’s fair value using a discounted cash flow method that incorporates planned growth rates, market-based discount rates and estimates of residual value. This year, for our Europe and North America reporting units, we used a market-based, weighted-average cost of capital of 7.2% to discount the projected cash flows of those operations. For our Latin America and AMEA reporting units, we used a risk-rated discount rate of 10.2%. Estimating the fair value of individual reporting units requires us to make assumptions and estimates regarding our future plans, industry and economic conditions, and our actual results and conditions may differ over time. If the carrying value of a reporting unit’s net assets exceeds its fair value, we would recognize an impairment charge for the amount by which the carrying value exceeds the reporting unit’s fair value.
Annually we assess non-amortizable intangible assets for impairment by performing a qualitative review and assessing events and circumstances that could affect the fair value or carrying value of the indefinite-lived intangible assets. If significant potential impairment risk exists for a specific asset, we quantitatively test it for impairment by comparing its estimated fair value with its carrying value. We determine estimated fair value using planned growth rates, market-based discount rates and estimates of royalty rates. If the carrying value of the asset exceeds its fair value, we consider the asset impaired and reduce its carrying value to the estimated fair value. We amortize definite-lived intangible assets over their estimated useful lives and evaluate them for impairment as we do other long-lived assets.
71
Table of Contents
Insurance and Self-Insurance:
We use a combination of insurance and self-insurance for a number of risks, including workers’ compensation, general liability, automobile liability, product liability and our obligation for employee healthcare benefits. We estimate the liabilities associated with these risks on an undiscounted basis by evaluating and making judgments about historical claims experience and other actuarial assumptions and the estimated impact on future results.
Revenue Recognition:
We predominantly sell food and beverage products across several product categories and in all regions as disclosed in Note 16, Segment Reporting. We recognize revenue when control over the products transfers to our customers, which generally occurs upon delivery or shipment of the products. We account for product shipping, handling and insurance as fulfillment activities with revenues for these activities recorded within net revenue and costs recorded within cost of sales. Any taxes collected on behalf of government authorities are excluded from net revenues. A small percentage of our net revenues relates to the licensing of our intellectual property, predominantly brand and trade names, and we record these revenues over the license term.
Revenues are recorded net of trade and sales incentives and estimated product returns. Known or expected pricing or revenue adjustments, such as trade discounts, rebates or returns, are estimated at the time of sale. We base these estimates principally on historical utilization and redemption rates. Estimates that affect revenue, such as trade incentives and product returns, are monitored and adjusted each period until the incentives or product returns are realized.
Key sales terms, such as pricing and quantities ordered, are established on a very frequent basis such that most customer arrangements and related incentives have a one year or shorter duration. As such, we do not capitalize contract inception costs and we capitalize product fulfillment costs in accordance with U.S. GAAP and our inventory policies. We do not have any significant unbilled receivables at the end of any period. Deferred revenues are not material and primarily include customer advance payments typically collected a few days before product delivery, at which time, deferred revenues are reclassified and recorded as net revenues. We generally do not receive noncash consideration for the sale of goods nor do we grant payment financing terms greater than one year.
Marketing, Advertising and Research and Development:
We promote our products with marketing and advertising programs. These programs include, but are not limited to, cooperative advertising, in-store displays and consumer marketing promotions. For interim reporting purposes, advertising and consumer promotion expenses are charged to operations as a percentage of volume, based on estimated sales volume and estimated program spending. We do not defer costs on our year-end consolidated balance sheet and all marketing and advertising costs are recorded as an expense in the year incurred. Advertising expense was $1,248 million in 2017, $1,396 million in 2016 and $1,542 million in 2015. We expense product research and development costs as incurred. Research and development expense was $366 million in 2017, $376 million in 2016 and $409 million in 2015. We record marketing and advertising as well as research and development expenses within selling, general and administrative expenses.
Stock-based Compensation:
Stock-based compensation awarded to employees and non-employee directors is valued at fair value on the grant date. We record stock-based compensation expense over the vesting period, generally three years. Forfeitures are estimated on the grant date for all of our stock-based compensation awards.
Employee Benefit Plans:
We provide a range of benefits to our current and retired employees. These include pension benefits, postretirement health care benefits and postemployment benefits depending upon jurisdiction, tenure, job level and other factors. Local statutory requirements govern many of the benefit plans we provide around the world. Local government plans generally cover health care benefits for retirees outside the United States, Canada and United Kingdom. Our U.S., Canadian and U.K. subsidiaries provide health care and other benefits to most retired employees. Our postemployment benefit plans provide primarily severance benefits for eligible salaried and certain hourly employees. The cost for these plans is recognized in earnings primarily over the working life of the covered employee.
72
Table of Contents
Financial Instruments:
We use financial instruments to manage our currency exchange rate, commodity price and interest rate risks. We monitor and manage these exposures as part of our overall risk management program, which focuses on the unpredictability of financial markets and seeks to reduce the potentially adverse effects that the volatility of these markets may have on our operating results. A principal objective of our risk management strategies is to reduce significant, unanticipated earnings fluctuations that may arise from volatility in currency exchange rates, commodity prices and interest rates, principally through the use of derivative instruments.
We use a combination of primarily currency forward contracts, futures, options and swaps; commodity forward contracts, futures and options; and interest rate swaps to manage our exposure to cash flow variability, protect the value of our existing currency assets and liabilities and protect the value of our debt. See Note 8, Financial Instruments, for more information on the types of derivative instruments we use.
We record derivative financial instruments on a gross basis and at fair value in our consolidated balance sheets within other current assets or other current liabilities due to their relatively short-term duration. Cash flows from derivative instruments are classified in the consolidated statements of cash flows based on the nature of the derivative instrument. Changes in the fair value of a derivative that is designated as a cash flow hedge, to the extent that the hedge is effective, are recorded in accumulated other comprehensive earnings/(losses) and reclassified to earnings when the hedged item affects earnings. Changes in fair value of economic hedges and the ineffective portion of all hedges are recognized in current period earnings. Changes in the fair value of a derivative that is designated as a fair value hedge, along with the changes in the fair value of the related hedged asset or liability, are recorded in earnings in the same period. We use non-U.S. dollar denominated debt to hedge a portion of our net investment in non-U.S. operations against adverse movements in exchange rates, with currency movements related to the debt and net investment and the related deferred taxes recorded within currency translation adjustment in accumulated other comprehensive earnings/(losses).
In order to qualify for hedge accounting, a specified level of hedging effectiveness between the derivative instrument and the item being hedged must exist at inception and throughout the hedged period. We must also formally document the nature of and relationship between the derivative and the hedged item, as well as our risk management objectives, strategies for undertaking the hedge transaction and method of assessing hedge effectiveness. Additionally, for a hedge of a forecasted transaction, the significant characteristics and expected term of the forecasted transaction must be specifically identified, and it must be probable that the forecasted transaction will occur. If it is no longer probable that the hedged forecasted transaction will occur, we would recognize the gain or loss related to the derivative in earnings.
When we use derivatives, we are exposed to credit and market risks. Credit risk exists when a counterparty to a derivative contract might fail to fulfill its performance obligations under the contract. We reduce our credit risk by entering into transactions with counterparties with high quality, investment grade credit ratings, limiting the amount of exposure with each counterparty and monitoring the financial condition of our counterparties. We also maintain a policy of requiring that all significant, non-exchange traded derivative contracts with a duration of one year or longer are governed by an International Swaps and Derivatives Association master agreement. Market risk exists when the value of a derivative or other financial instrument might be adversely affected by changes in market conditions and commodity prices, currency exchange rates or interest rates. We manage derivative market risk by limiting the types of derivative instruments and derivative strategies we use and the degree of market risk that we plan to hedge through the use of derivative instruments.
Commodity derivatives. We are exposed to price risk related to forecasted purchases of certain commodities that we primarily use as raw materials. We enter into commodity forward contracts primarily for wheat, sugar and other sweeteners, soybean and vegetable oils and cocoa. Commodity forward contracts generally are not subject to the accounting requirements for derivative instruments and hedging activities under the normal purchases exception. We also use commodity futures and options to hedge the price of certain input costs, including cocoa, energy costs, sugar and other sweeteners, wheat, packaging, dairy, corn, and soybean and vegetable oils. We also sell commodity futures to unprice future purchase commitments, and we occasionally use related futures to cross-hedge a commodity exposure. We are not a party to leveraged derivatives and, by policy, do not use financial instruments for speculative purposes. During the third quarter of 2016, we discontinued designating commodity derivatives for hedge accounting treatment. Any unrealized gains or losses (mark-to-market impacts) and realized gains or losses are recorded in earnings.
73
Table of Contents
Currency exchange derivatives. We use various financial instruments to mitigate our exposure to changes in exchange rates from third-party and intercompany current and forecasted transactions. These instruments may include currency exchange forward contracts, futures, options and swaps. Based on the size and location of our businesses, we use these instruments to hedge our exposure to certain currencies, including the euro, pound sterling, Swiss franc, Canadian dollar and Mexican peso. During the third quarter of 2016, we discontinued designating currency exchange derivatives for hedge accounting treatment. Any unrealized gains or losses (mark-to-market impacts) and realized gains or losses are recorded in earnings (see Note 8, Financial Instruments, for additional information).
Interest rate cash flow and fair value hedges. We manage interest rate volatility by modifying the pricing or maturity characteristics of certain liabilities so that the net impact on expense is not, on a material basis, adversely affected by movements in interest rates. As a result of interest rate fluctuations, hedged fixed-rate liabilities appreciate or depreciate in market value. We expect the effect of this unrealized appreciation or depreciation to be substantially offset by our gains or losses on the derivative instruments that are linked to these hedged liabilities. We use derivative instruments, including interest rate swaps that have indices related to the pricing of specific liabilities as part of our interest rate risk management strategy. As a matter of policy, we do not use highly leveraged derivative instruments for interest rate risk management. We use interest rate swaps to economically convert a portion of our fixed-rate debt into variable-rate debt. Under the interest rate swap contracts, we agree with other parties to exchange, at specified intervals, the difference between fixed-rate and floating-rate interest amounts, which is calculated based on an agreed-upon notional amount. We use interest rate swaps to hedge the variability of interest payment cash flows on a portion of our future debt obligations. We also execute cross-currency interest rate swaps to hedge interest payments on newly issued debt denominated in a different currency than the functional currency of the borrowing entity. Substantially all of these derivative instruments are highly effective and qualify for hedge accounting treatment.
Hedges of net investments in non-U.S. operations. We have numerous investments outside the United States. The net assets of these subsidiaries are exposed to changes and volatility in currency exchange rates. We use local currency denominated debt to hedge our non-U.S. net investments against adverse movements in exchange rates. We designated our euro, pound sterling and Swiss franc denominated borrowings as a net investment hedge of a portion of our overall European operations. The gains and losses on our net investment in these designated European operations are economically offset by losses and gains on our euro, pound sterling and Swiss franc denominated borrowings. The change in the debt’s value, net of deferred taxes, is recorded in the currency translation adjustment component of accumulated other comprehensive earnings/(losses).
Income Taxes:
Our provision for income taxes includes amounts payable or refundable for the current year, the effects of deferred taxes and impacts from uncertain tax positions. We recognize deferred tax assets and liabilities for the expected future tax consequences of temporary differences between the financial statement and tax basis of our assets and liabilities, operating loss carryforwards and tax credit carryforwards. Deferred tax assets and liabilities are measured using enacted tax rates expected to apply in the years in which those differences are expected to reverse.
The realization of certain deferred tax assets is dependent on generating sufficient taxable income in the appropriate jurisdiction prior to the expiration of the carryforward periods. Deferred tax assets are reduced by a valuation allowance if it is more likely than not that some portion, or all, of the deferred tax assets will not be realized. When assessing the need for a valuation allowance, we consider any carryback potential, future reversals of existing taxable temporary differences (including liabilities for unrecognized tax benefits), future taxable income and tax planning strategies.
We recognize tax benefits in our financial statements from uncertain tax positions only if it is more likely than not that the tax position will be sustained based on the technical merits of the position. The amount we recognize is measured as the largest amount of benefit that is greater than 50 percent likely of being realized upon resolution. Future changes related to the expected resolution of uncertain tax positions could affect tax expense in the period when the change occurs.
74
Table of Contents
We monitor for changes in tax laws and reflect the impacts of tax law changes in the period of enactment. In response to the United States tax reform legislation enacted on December 22, 2017 (“U.S. tax reform”), the U.S. Securities and Exchange Commission (“SEC”) issued guidance that allows us to record provisional amounts for the impacts of U.S. tax reform if the full accounting cannot be completed before we file our 2017 financial statements. For provisions of the tax law where we are unable to make a reasonable estimate of the impact, the guidance allows us to continue to apply the historical tax provisions in computing our income tax liability and deferred tax assets and liabilities as of December 31, 2017. The guidance also allows us to finalize accounting for the U.S. tax reform changes within one year of the December 22, 2017 enactment date. See Note 14, Income Taxes, for additional information on how we recorded the impacts of the U.S. tax reform.
New Accounting Pronouncements:
In August 2017, the Financial Accounting Standards Board (“FASB”) issued an Accounting Standards Update (“ASU”) to simplify the application of hedge accounting and increase the transparency of hedge results. The updated standard changes how companies can assess the effectiveness of their hedging relationships. For cash flow and net investment hedges as of the adoption date, the ASU requires a modified retrospective transition approach. Presentation and disclosure requirements related to this ASU are required prospectively. The ASU is effective for fiscal years beginning after December 15, 2018, with early adoption permitted. We intend to early adopt this standard in the first quarter of 2018 and we do not expect it to have a significant impact on our consolidated financial statements, including the cumulative-effect adjustment required upon adoption.
In May 2017, the FASB issued an ASU to clarify when changes to the terms or conditions of a share-based payment award must be accounted for as modifications. The ASU is applied prospectively to awards that are modified on or after the adoption date. The ASU is effective for fiscal years beginning after December 15, 2017, with early adoption permitted. We will adopt the standard on January 1, 2018 and we do not expect a material impact to our consolidated financial statements.
In March 2017, the FASB issued an ASU to amend the amortization period for certain purchased callable debt securities held at a premium, shortening the period to the earliest call date instead of the maturity date. The standard does not impact securities held at a discount as the discount continues to be amortized to maturity. The ASU is applied on a modified retrospective basis through a cumulative-effect adjustment directly to retained earnings as of the beginning of the period of adoption. The ASU is effective for fiscal years beginning after December 15, 2018, with early adoption permitted. We will adopt the standard on January 1, 2019. We do not expect a material impact to our consolidated financial statements.
In March 2017, the FASB issued an ASU to improve the presentation of net periodic pension cost and net periodic postretirement benefit cost. The standard requires employers to disaggregate the service cost component from the other components of net benefit cost and disclose the amount and location where the net benefit cost is recorded in the income statement or capitalized in assets. The standard is to be applied on a retrospective basis for the change in presentation in the income statement and prospectively for the change in presentation on the balance sheet. The ASU is effective for fiscal years beginning after December 15, 2017, with early adoption permitted. We will adopt the standard on January 1, 2018. We will reclassify net benefit costs other than service costs below operating income, with no impact to our net earnings. For information on our service cost and other components of net periodic benefit cost for pension, postretirement benefit and postemployment plans, see Note 9, Benefit Plans.
In January 2017, the FASB issued an ASU that clarifies the definition of a business with the objective of adding guidance to assist companies with evaluating whether transactions should be accounted for as acquisitions or disposals of assets or businesses. The definition of a business may affect many areas of accounting including acquisitions, disposals, goodwill and consolidation. The ASU is applied on a prospective basis and is effective for fiscal years beginning after December 15, 2017, with early adoption permitted. We will adopt this standard on January 1, 2018 and we do not expect a material impact to our consolidated financial statements.
In November 2016, the FASB issued an ASU that requires the change in restricted cash or cash equivalents to be included with other changes in cash and cash equivalents in the statement of cash flows. The ASU is effective for fiscal years beginning after December 15, 2017, with early adoption permitted. We will adopt this standard on January 1, 2018 and we do not expect a material impact on our consolidated statements of cash flows.
75
Table of Contents
In October 2016, the FASB issued an ASU that requires the recognition of tax consequences of intercompany asset transfers other than inventory when the transfer occurs and removes the exception to postpone recognition until the asset has been sold to an outside party. The standard is to be applied on a modified retrospective basis through a cumulative-effect adjustment directly to retained earnings. The ASU is effective for fiscal years beginning after December 15, 2017, with early adoption permitted. We will adopt this standard on January 1, 2018 and we do not expect a material impact to our consolidated financial statements.
In August 2016, the FASB issued an ASU to provide guidance on eight specific cash flow classification issues and reduce diversity in practice in how some cash receipts and cash payments are presented and classified in the statement of cash flows. The ASU is effective for fiscal years beginning after December 15, 2017, with early adoption permitted. We will adopt this standard on January 1, 2018 and we do not expect a material impact to our consolidated financial statements.
In February 2016, the FASB issued an ASU on lease accounting. The ASU revises existing U.S. GAAP and outlines a new model for lessors and lessees to use in accounting for lease contracts. The guidance requires lessees to recognize a right-of-use asset and a lease liability on the balance sheet for all leases, with the exception of short-term leases. In the statement of earnings, lessees will classify leases as either operating (resulting in straight-line expense) or financing (resulting in a front-loaded expense pattern). The ASU is effective for fiscal years beginning after December 15, 2018, with early adoption permitted. We anticipate adopting the new standard on January 1, 2019. We continue to make progress in our due diligence and assess the impact of the new standard across our operations and on our consolidated financial statements, which will consist primarily of recording lease assets and liabilities on our balance sheet for our operating leases.
In January 2016, the FASB issued an ASU that provides updated guidance for the recognition, measurement, presentation and disclosure of financial assets and liabilities. The standard requires that equity investments (other than those accounted for under equity method of accounting or those that result in consolidation of the investee) be measured at fair value, with changes in fair value recognized in net income. The standard also impacts financial liabilities under the fair value option and the presentation and disclosure requirements for financial instruments. The ASU is effective for fiscal years beginning after December 15, 2017. We will adopt this standard on January 1, 2018 and we do not expect a material impact to our consolidated financial statements.
In May 2014, the FASB issued an ASU on revenue recognition from contracts with customers. The ASU outlines a new, single comprehensive model for companies to use in accounting for revenue. The core principle is that an entity should recognize revenue to depict the transfer of control over promised goods or services to a customer in an amount that reflects the consideration the entity expects to be entitled to receive in exchange for the goods or services. The ASU also requires additional disclosure about the nature, amount, timing and uncertainty of revenue and cash flows from customer contracts, including significant judgments made in recognizing revenue. In 2016 and 2017, the FASB issued several ASUs that clarified principal versus agent (gross versus net) revenue presentation considerations, confirmed the accounting for certain prepaid stored-value products and clarified the guidance for identifying performance obligations within a contract, the accounting for licenses and partial sales of nonfinancial assets. The FASB also issued two ASUs providing technical corrections, narrow scope exceptions and practical expedients to clarify and improve the implementation of the new revenue recognition guidance. The revenue guidance is effective for annual reporting periods beginning after December 15, 2017, with early adoption permitted as of the original effective date (annual reporting periods beginning after December 15, 2016). The ASU may be applied retrospectively to historical periods presented or as a cumulative-effect adjustment as of the date of adoption. We adopted the new standard on January 1, 2018 on a full retrospective basis. There was no material financial impact from adopting the new revenue standards.
Note 2. Divestitures and Acquisitions
JDE Coffee Business Transactions:
On July 2, 2015, we completed transactions to combine our wholly owned coffee businesses with those of D.E Master Blenders 1753 B.V. (“DEMB”) to create a new company, JDE. Through March 7, 2016, we held a 43.5% interest in JDE. Following the March 7, 2016 exchange of a portion of our investment in JDE for an interest in Keurig, we held a 26.5% equity interest in JDE. (See discussion under Keurig Transaction below.) The remaining 73.5% equity interest in JDE was held by a subsidiary of Acorn Holdings B.V. (“AHBV,” owner of DEMB prior to July 2, 2015). Following the transactions
76
Table of Contents
discussed under JDE Stock-Based Compensation Arrangements below, as of December 31, 2017, we hold a 26.5% voting interest, a 26.4% ownership interest and a 26.2% profit and dividend sharing interest in JDE. We recorded JDE equity earnings of $129 million in 2017 and $100 million in 2016 and equity losses of $58 million in 2015. We also recorded $49 million of cash dividends received during the first quarter of 2017.
The consideration we received in the JDE coffee business transactions completed on July 2, 2015 consisted of €3.8 billion of cash ($4.2 billion as of July 2, 2015), a 43.5% equity interest in JDE and $794 million in receivables (related to sales price adjustments and tax formation cost payments). During the third quarter of 2015, we also recorded $283 million of cash and receivables from JDE related to reimbursement of costs that we incurred in separating our coffee businesses. The cash and equity consideration we received at closing reflects our retaining our interest in our Korea-based joint venture, DSF. During the second quarter of 2015, we also completed the sale of our interest in a Japanese coffee joint venture, Ajinomoto General Foods, Inc. (“AGF”). In lieu of contributing our interest in the AGF joint venture to JDE, we contributed the net cash proceeds from this sale as part of the overall JDE coffee business transactions.
On July 5, 2016, we received an expected cash payment of $275 million from JDE to settle the receivable related to tax formation costs that were part of the initial sales price.
In connection with the contribution of our global coffee businesses to JDE on July 2, 2015, we recorded a final pre-tax gain of $6.8 billion (or $6.6 billion after-tax) in 2015 after final adjustments described below. As previously reported, we deconsolidated net assets totaling $2.9 billion and reduced accumulated other comprehensive losses for the transfer of coffee business-related pension obligations by $90 million. We also recorded approximately $1.0 billion of pre-tax net gains related to hedging the expected cash proceeds from the transactions as described further below. During the fourth quarter of 2015, we and JDE concluded negotiations of a sales price adjustment and completed the valuation of our investment in JDE. Primarily due to the negotiated resolution of the sales price adjustment in the fourth quarter of 2015, we recorded a $313 million reduction in the pre-tax gain on the coffee transaction, reducing the $7.1 billion estimated gain in the third quarter of 2015 to the $6.8 billion final gain for 2015. As part of our sales price negotiations, we retained the right to collect future cash payments if certain estimated pension liabilities are realized over an agreed amount in the future. As such, we may recognize additional income related to this negotiated term in the future.
The final value of our 43.5% investment in JDE on July 2, 2015 was €4.1 billion ($4.5 billion as of July 2, 2015). The fair value of the JDE investment was determined using both income-based and market-based valuation techniques. The discounted cash flow analysis reflected growth, discount and tax rates and other assumptions reflecting the underlying combined businesses and countries in which the combined coffee businesses operate. The fair value of the JDE investment also included the fair values of the Carte Noire and Merrild businesses, which JDE agreed to divest to comply with the conditioned approval by the European Commission related to the JDE coffee business transactions. As of the end of the first quarter of 2016, these businesses were sold by JDE. As the July 2, 2015 fair values for these businesses were recorded by JDE at their pending sales values, we did not record any gain or loss on the sales of these businesses in our share of JDE’s earnings.
In 2014 and 2015, in connection with the expected receipt of cash in euros at the time of closing, we entered into a number of consecutive currency exchange forward contracts to lock in an equivalent expected value in U.S. dollars as of the date the JDE coffee business transactions were first announced in May 2014. Cumulatively, we realized aggregate net gains and received cash of approximately $1.0 billion on these hedging contracts that increased the cash we received in connection with the JDE coffee business transactions from $4.2 billion in cash consideration received to $5.2 billion. In connection with these currency contracts and the transfer of the sale proceeds to our subsidiaries that deconsolidated net assets and shares, we recognized a net gain of $436 million in 2015 within interest and other expense, net.
We also incurred incremental expenses related to readying our global coffee businesses for the transactions that totaled $278 million for the year ended December 31, 2015. Of these total expenses, $123 million was recorded within asset impairment and exit costs in 2015 and the remainder was recorded within selling, general and administrative expenses of primarily our Europe segment, as well as within general corporate expenses.
JDE Capital Increase:
On December 18, 2015, AHBV and we agreed to provide JDE additional capital to pay down some of its debt with lenders. Our pro rata share of the capital increase was €499 million ($544 million as of December 18, 2015) and was made in return for a pro rata number of additional shares in JDE such that our ownership in JDE did not change following the capital increase. To fund our share of the capital increase, we contributed €460 million ($501 million) of JDE receivables and made a €39 million ($43 million) cash payment.
77
Table of Contents
JDE Stock-Based Compensation Arrangements:
On June 30, 2016, we entered into agreements with AHBV and its affiliates to establish a new stock-based compensation arrangement tied to the issuance of JDE equity compensation awards to JDE employees. This arrangement replaced a temporary equity compensation program tied to the issuance of AHBV equity compensation to JDE employees. New Class C, D and E JDE shares were authorized and issued for investments made by, and vested stock-based compensation awards granted to, JDE employees. Under these arrangements, share ownership dilution from the JDE Class C, D and E shareholders is limited to 2%. We retained our 26.5% voting rights and have a slightly lower portion of JDE’s profits and dividends than our shareholder ownership interest as certain employee shareholders receive a slightly larger share. Upon execution of the agreements and the creation of the Class C, D and E JDE shares, as a percentage of the total JDE issued shares, our Class B shares decreased from 26.5% to 26.4% and AHBV’s Class A shares decreased from 73.5% to 73.22%, while the Class C, D and E shares, held by AHBV and its affiliates until the JDE employee awards vest, comprised 0.38% of JDE’s shares. Additional Class C shares are available to be issued when planned long-term incentive plan (“JDE LTIP”) awards vest, generally over the next five years. When the JDE Class C shares are issued in connection with the vested JDE LTIP awards, the Class A and B relative ownership interests will decrease. Based on estimated achievement and forfeiture assumptions, we do not expect our JDE ownership interest to decrease below 26.27%.
JDE Tax Matter Resolution:
On July 19, 2016, the Supreme Court of Spain reached a final resolution on a challenged JDE tax position held by a predecessor DEMB company that resulted in an unfavorable tax expense of €114 million. As a result, our share of JDE’s equity earnings during the third quarter of 2016 was negatively affected by €30 million ($34 million).
Keurig Transaction:
On March 3, 2016, a subsidiary of AHBV completed a $13.9 billion acquisition of all of the outstanding common stock of Keurig through a merger transaction. On March 7, 2016, we exchanged with a subsidiary of AHBV a portion of our equity interest in JDE with a carrying value of €1.7 billion (approximately $2.0 billion as of March 7, 2016) for an interest in Keurig with a fair value of $2.0 billion based on the merger consideration per share for Keurig. We recorded the difference between the fair value of Keurig and our basis in JDE shares as a $43 million gain on the equity method investment exchange in March 2016. Immediately following the exchange, our ownership interest in JDE was 26.5% and our interest in Keurig was 24.2%. Both AHBV and we hold our investments in Keurig through a combination of equity and interests in a shareholder loan, with pro-rata ownership of each. Our initial $2.0 billion investment in Keurig includes a $1.6 billion Keurig equity interest and a $0.4 billion shareholder loan receivable, which are reported on a combined basis within equity method investments on our consolidated balance sheet as of December 31, 2017. The shareholder loan has a 5.5% interest rate and is payable at the end of a seven-year term on February 27, 2023. We recorded Keurig equity earnings of $208 million in 2017 (of which, approximately $119 million relates to the provisional tax benefit Keurig recorded as a result of U.S. tax reform), and $77 million in 2016. We recorded shareholder loan interest of $24 million in 2017 and $20 million in 2016. Additionally, we received shareholder loan interest payments of $30 million in 2017 and $14 million in 2016 and dividends of $14 million in 2017 and $4 million in 2016.
Planned Keurig Dr Pepper Transaction:
On January 29, 2018, we announced that we would exchange our ownership interest in Keurig for equity in Keurig Dr Pepper, which is contingent upon the successful completion of a planned merger of Keurig with Dr Pepper Snapple Group, Inc. Following the close of the merger in mid-2018, we expect our ownership in Keurig Dr Pepper to be 13-14%. We expect to account for this new investment under the equity method as we have for Keurig, resulting in our recognizing our share of their earnings within our earnings and our share of their dividends within our cash flows. We will have the right to nominate two directors to the board of Keurig Dr Pepper and will have certain governance rights over Keurig Dr Pepper following the transaction.
78
Table of Contents
Summary Financial Information for Equity Method Investments:
Summarized financial information for JDE, Keurig, DSF and our other equity method investments is reflected below.
| As of December 31, | ||||||||||||
| 2017 | 2016 | |||||||||||
| (in millions) | ||||||||||||
| Current assets |
$ | 4,732 | $ | 4,458 | ||||||||
| Noncurrent assets |
38,282 | 35,089 | ||||||||||
|
|
|
|
|
|||||||||
| Total assets |
$ | 43,014 | $ | 39,547 | ||||||||
| Current liabilities |
$ | 5,822 | $ | 4,148 | ||||||||
| Noncurrent liabilities |
15,424 | 16,472 | ||||||||||
|
|
|
|
|
|||||||||
| Total liabilities |
$ | 21,246 | $ | 20,620 | ||||||||
| Equity attributable to shareowners of investees |
$ | 21,685 | $ | 18,868 | ||||||||
| Equity attributable to noncontrolling interests |
83 | 59 | ||||||||||
|
|
|
|
|
|||||||||
| Total net equity of investees |
$ | 21,768 | $ | 18,927 | ||||||||
| Mondelēz International ownership interests |
24-50% | 24-50% | ||||||||||
|
|
|
|
|
|||||||||
| Mondelēz International share of investee net equity (1) |
$ | 5,905 | $ | 5,145 | ||||||||
| Keurig shareholder loan |
440 | 440 | ||||||||||
|
|
|
|
|
|||||||||
| Equity method investments |
$ | 6,345 | $ | 5,585 | ||||||||
|
|
|
|
|
|||||||||
| For the Years Ended December 31, | ||||||||||||
| 2017 | 2016 | 2015 | ||||||||||
| (in millions) | ||||||||||||
| Net revenues |
$ | 12,781 | $ | 10,923 | $ | 4,993 | ||||||
| Gross profit |
4,891 | 4,219 | 1,551 | |||||||||
| Income from continuing operations |
1,604 | 839 | 96 | |||||||||
| Net income |
1,604 | 839 | 97 | |||||||||
| Net income attributable to investees |
$ | 1,594 | $ | 838 | $ | 97 | ||||||
| Mondelēz International ownership interests |
24%-50% | 24%-50% | 40%-50% | |||||||||
|
|
|
|
|
|
|
|||||||
| Mondelēz International share of investee net income |
$ | 436 | $ | 281 | $ | 56 | ||||||
| Keurig shareholder loan interest income |
24 | 20 | – | |||||||||
|
|
|
|
|
|
|
|||||||
| Equity method investment net earnings (2) |
$ | 460 | $ | 301 | $ | 56 | ||||||
|
|
|
|
|
|
|
|||||||
| (1) | Includes approximately $360 million of basis differences between the U.S. GAAP accounting basis for our equity method investments and the U.S. GAAP accounting basis of our investees’ equity. |
| (2) | Historically, we have recorded income from equity method investments within our operating income as these investments operated as extensions of our base business. Beginning in the third quarter of 2015, to align with the accounting for JDE earnings, we began to record the earnings from our equity method investments in after-tax equity method investment earnings outside of operating income. For the six months ended December 31, 2015, after-tax equity method investment net earnings were less than $1 million on a combined basis. Earnings from equity method investments recorded within segment operating income were $56 million for the six months ended July 2, 2015. See Note 1, Summary of Significant Accounting Policies – Principles of Consolidation, for additional information. |
Other Divestitures and Acquisitions:
On December 28, 2017, we completed the sale of a confectionery business in Japan. We received cash proceeds of ¥2.8 billion Japanese Yen ($24 million as of December 28, 2017) and recorded an immaterial pre-tax loss on the divestiture within our AMEA segment.
On October 2, 2017, we completed the sale of one of our equity method investments and received cash proceeds of $65 million. We recorded a pre-tax gain of $40 million within the gain on equity method investment transactions and $15 million of tax expense.
79
Table of Contents
In connection with the 2012 spin-off of Kraft Foods Group, Inc. (now a part of The Kraft Heinz Company (“KHC”)), Kraft Foods Group and we each granted the other various licenses to use certain trademarks in connection with particular product categories in specified jurisdictions. On August 17, 2017, we entered into two agreements with KHC to terminate the licenses of certain KHC-owned brands used in our grocery business within our Europe region and to transfer to KHC inventory and certain other assets. On August 17, 2017, the first transaction closed and we received cash proceeds of €9 million ($11 million as of August 17, 2017) and on October 23, 2017, the second transaction closed and we received cash proceeds of €2 million ($3 million as of October 23, 2017). The gain on both transactions combined was immaterial.
On July 4, 2017, we completed the sale of most of our grocery business in Australia and New Zealand to Bega Cheese Limited for $456 million Australian dollars ($347 million as of July 4, 2017). We divested $27 million of current assets, $135 million of non-current assets and $4 million of current liabilities based on the July 4, 2017 exchange rate. We recorded a pre-tax gain of $247 million Australian dollars ($187 million as of July 4, 2017) on the sale. We also recorded divestiture-related costs of $2 million and a foreign currency hedge loss of $3 million during 2017. In the fourth quarter of 2017, we recorded a $3 million inventory-related working capital adjustment, increasing the pre-tax gain to $190 million in 2017.
On April 28, 2017, we completed the sale of several manufacturing facilities in France and the sale or license of several local confectionery brands. We received cash of approximately €157 million ($169 million as of April 28, 2017), net of cash divested with the businesses. On April 28, 2017, we divested $44 million of current assets, $155 million of non-current assets, $8 million of current liabilities and $22 million of non-current liabilities based on the April 28, 2017 exchange rate. We recorded a $3 million loss on the sale and divestiture-related costs of $27 million in 2017 and $84 million in 2016. These divestiture-related costs were recorded within cost of sales and selling, general and administrative expenses primarily within our Europe segment. In prior periods, we recorded a $5 million impairment charge in May 2016 for a candy trademark to reduce the overall net assets to the estimated net sales proceeds after transaction costs. On March 31, 2016, we recorded a $14 million impairment charge for another gum & candy trademark as a portion of its carrying value would not be recoverable based on future cash flows expected under a planned license agreement with the buyer.
During the year ended December 31, 2016, we also completed the following sale transactions:
| • | On December 31, 2016, we completed the sale of a chocolate factory in Belgium. In connection with this transaction, we recorded a pre-tax loss of €65 million ($68 million as of December 31, 2016), within asset impairment and exit costs in our Europe segment. The loss includes a fixed asset impairment charge of €30 million ($31 million as of December 31, 2016), a loss on disposal of €22 million ($23 million as of December 31, 2016) and incremental expenses we incurred and accrued of €13 million ($14 million as of December 31, 2016) related to selling the factory. |
| • | On December 1, 2016, we completed the sale of a confectionery business in Costa Rica represented by a local brand. The sales price was $28 million and we recorded a pre-tax gain of $9 million within gains on divestiture within our Latin America segment. We divested approximately $11 million of property, plant and equipment, $4 million of goodwill and $2 million of inventory. In connection with this transaction, we incurred $2 million of transaction costs and accrued expenses. |
| • | On August 26, 2016, we recorded a $7 million gain for the sale of a U.S.-owned biscuit trademark. The gain was recorded within selling, general and administrative expenses in 2016. |
| • | On May 2, 2016, we completed the sale of certain local biscuit brands in Finland as part of our strategic decisions to exit select small and local brands and shift investment towards our Power Brands. The sales price was €14 million ($16 million as of May 2, 2016) and we recorded a pre-tax gain of $6 million ($5 million after tax) within selling, general and administrative expenses of our Europe segment in the year ended December 31, 2016. We divested $8 million of indefinite-lived intangible assets and less than $1 million of other assets. We received cash proceeds of €12 million ($14 million as of May 2, 2016) upon closing and another €2 million ($2 million as of October 31, 2016) of consideration following the completion of post-closing requirements. The additional $2 million of consideration increased the pre-tax gain to $8 million ($6 million after tax) through December 31, 2016. |
80
Table of Contents
On November 2, 2016, we purchased from Burton’s Biscuit Company certain intangibles, which included the license to manufacture, market and sell Cadbury-branded biscuits in additional key markets around the world, including in the United Kingdom, France, Ireland, North America and Saudi Arabia. The transaction was accounted for as a business combination. Total cash paid for the acquired assets was £199 million ($245 million as of November 2, 2016). During the third quarter of 2017, we completed the valuation work and finalized the purchase price allocation of $66 million to definite-lived intangible assets, $173 million to goodwill, $2 million to property, plant and equipment and $4 million to inventory, reflecting a November 2, 2016 exchange rate. The acquisition added incremental net revenues of $59 million in 2017 and $16 million in 2016 and added incremental operating income of $8 million in 2017 and $1 million in 2016.
During the third quarter of 2016, we completed the acquisition of a Vietnamese biscuit operation within our AMEA segment. On July 15, 2015, we acquired an 80% interest in the biscuit operation and on August 22, 2016, we acquired the remaining 20% interest. Total cash paid for the biscuit operation, intellectual property, non-compete and consulting agreements less purchase price adjustments was 12,404 billion Vietnamese dong ($569 million using applicable exchange rates on July 15, 2015, November 27, 2015 and August 22, 2016). On August 22, 2016, in connection with acquiring the remaining 20% interest in the biscuit operation, escrowed funds of $70 million were released and we retained an agreed $20 million related to two outstanding acquisition-related matters. We subsequently released $5 million in 2016 and $9 million in 2017 to the sellers and expect to pay $4 million within five years as remaining indemnified obligations are resolved. On August 22, 2016, we also made a final payment of 759 billion Vietnamese dong ($35 million as of August 22, 2016) for the non-compete and consulting agreements. The non-compete and consulting agreements were recorded as prepaid contracts within other current and non-current assets and will be amortized into net earnings over the term of the agreements. During the third quarter of 2016, we also finalized the valuation and purchase price allocation of the acquired net assets of the business, which included $10 million of inventory, $49 million of property, plant and equipment, $86 million of intangible assets, $385 million of goodwill and $31 million of other net liabilities. In periods following the initial July 15, 2015 first closing date, the allocation of the net asset fair values had an immaterial impact on our operating results. The acquisition added incremental net revenues of $71 million in 2016 and $121 million in 2015 and added incremental operating income of $5 million in 2016 and $21 million in 2015. Within selling, general and administrative expenses, we recorded integration costs of $7 million in 2016 and $9 million in 2015 and acquisition costs of $7 million in 2015.
Sales of Property:
On November 9, 2016, we completed the sale of a manufacturing plant in Russia and recorded total expenses of $12 million, including a related fixed asset impairment charge of $4 million within asset impairments and exit costs. The sale of the land, buildings and equipment generated cash proceeds of $6 million.
In 2016, we also sold property within our North America segment and from our centrally held corporate assets. In the third quarter of 2016, we sold property in North America that generated cash proceeds of $10 million and a pre-tax gain of $6 million and we sold a corporate aircraft hangar that generated cash proceeds of $3 million and a pre-tax gain of $1 million. In the second quarter of 2016, we also sold property within our North America segment and from our centrally held corporate assets. The North America sale generated cash proceeds of $40 million and a pre-tax gain of $33 million. The corporate aircraft sale generated cash proceeds of $20 million and a pre-tax gain of $6 million. The gains were recorded within selling, general and administrative expenses and cash proceeds were recorded in cash flows from other investing activities in the year ended December 31, 2016.
Note 3. Inventories
Inventories consisted of the following:
| As of December 31, | ||||||||
| 2017 | 2016 | |||||||
| (in millions) | ||||||||
| Raw materials |
$ | 711 | $ | 722 | ||||
| Finished product |
1,975 | 1,865 | ||||||
|
|
|
|
|
|||||
| 2,686 | 2,587 | |||||||
| Inventory reserves |
(129 | ) | (118 | ) | ||||
|
|
|
|
|
|||||
| Inventories, net |
$ | 2,557 | $ | 2,469 | ||||
|
|
|
|
|
|||||
81
Table of Contents
Note 4. Property, Plant and Equipment
Property, plant and equipment consisted of the following:
| As of December 31, | ||||||||
| 2017 | 2016 | |||||||
| (in millions) | ||||||||
| Land and land improvements |
$ | 458 | $ | 471 | ||||
| Buildings and building improvements |
2,979 | 2,801 | ||||||
| Machinery and equipment |
11,195 | 10,302 | ||||||
| Construction in progress |
1,048 | 1,113 | ||||||
|
|
|
|
|
|||||
| 15,680 | 14,687 | |||||||
| Accumulated depreciation |
(7,003 | ) | (6,458 | ) | ||||
|
|
|
|
|
|||||
| Property, plant and equipment, net |
$ | 8,677 | $ | 8,229 | ||||
|
|
|
|
|
|||||
Capital expenditures as presented on the statement of cash flow were $1.0 billion, $1.2 billion and $1.5 billion for the years ending December 31, 2017, 2016 and 2015 and excluded $357 million, $343 million and $322 million for accrued capital expenditures not yet paid.
In connection with our restructuring program, we recorded non-cash property, plant and equipment write-downs (including accelerated depreciation and asset impairments) of $206 million in 2017, $301 million in 2016 and $264 million in 2015 (see Note 6, 2014-2018 Restructuring Program). These charges related to property, plant and equipment were recorded in the consolidated statements of earnings within asset impairment and exit costs and in the segment results as follows:
| For the Years Ended December 31, | ||||||||||||
| 2017 | 2016 | 2015 | ||||||||||
| (in millions) | ||||||||||||
| Latin America |
$ | 36 | $ | 22 | $ | 46 | ||||||
| AMEA |
81 | 44 | 88 | |||||||||
| Europe |
58 | 122 | 65 | |||||||||
| North America |
30 | 111 | 65 | |||||||||
| Corporate |
1 | 2 | – | |||||||||
|
|
|
|
|
|
|
|||||||
| Non-cash property, plant and equipment write-downs |
$ | 206 | $ | 301 | $ | 264 | ||||||
|
|
|
|
|
|
|
|||||||
Note 5. Goodwill and Intangible Assets
Goodwill by reportable operating segment was:
| As of December 31, | ||||||||
| 2017 | 2016 | |||||||
| (in millions) | ||||||||
| Latin America |
$ | 901 | $ | 897 | ||||
| AMEA |
3,371 | 3,324 | ||||||
| Europe |
7,880 | 7,170 | ||||||
| North America |
8,933 | 8,885 | ||||||
|
|
|
|
|
|||||
| Goodwill |
$ | 21,085 | $ | 20,276 | ||||
|
|
|
|
|
|||||
82
Table of Contents
Intangible assets consisted of the following:
| As of December 31, | ||||||||
| 2017 | 2016 | |||||||
| (in millions) | ||||||||
| Non-amortizable intangible assets |
$ | 17,671 | $ | 17,004 | ||||
| Amortizable intangible assets |
2,386 | 2,315 | ||||||
|
|
|
|
|
|||||
| 20,057 | 19,319 | |||||||
| Accumulated amortization |
(1,418 | ) | (1,218 | ) | ||||
|
|
|
|
|
|||||
| Intangible assets, net |
$ | 18,639 | $ | 18,101 | ||||
|
|
|
|
|
|||||
Non-amortizable intangible assets consist principally of brand names purchased through our acquisitions of Nabisco Holdings Corp., the Spanish and Portuguese operations of United Biscuits, the global LU biscuit business of Groupe Danone S.A. and Cadbury Limited. Amortizable intangible assets consist primarily of trademarks, customer-related intangibles, process technology, licenses and non-compete agreements.
Amortization expense for intangible assets was $178 million in 2017, $176 million in 2016 and $181 million in 2015. For the next five years, we estimate annual amortization expense of approximately $175 million for the next three years and approximately $85 million in years four and five, reflecting December 31, 2017 exchange rates.
Changes in goodwill and intangible assets consisted of:
| 2017 | 2016 | |||||||||||||||
| Goodwill | Intangible Assets, at cost |
Goodwill | Intangible Assets, at cost |
|||||||||||||
| (in millions) | ||||||||||||||||
| Balance at January 1 |
$ | 20,276 | $ | 19,319 | $ | 20,664 | $ | 19,847 | ||||||||
| Changes due to: |
||||||||||||||||
| Currency |
909 | 954 | (464 | ) | (540 | ) | ||||||||||
| Divestitures |
(114 | ) | (100 | ) | (4 | ) | (8 | ) | ||||||||
| Acquisitions |
15 | (7 | ) | 80 | 158 | |||||||||||
| Asset impairments |
– | (109 | ) | – | (137 | ) | ||||||||||
| Other |
(1 | ) | – | – | (1 | ) | ||||||||||
|
|
|
|
|
|
|
|
|
|||||||||
| Balance at December 31 |
$ | 21,085 | $ | 20,057 | $ | 20,276 | $ | 19,319 | ||||||||
|
|
|
|
|
|
|
|
|
|||||||||
Changes to goodwill and intangibles were:
| • | Divestitures – During 2017, in connection with the divestiture of several manufacturing facilities, primarily in France, we divested $23 million of goodwill and $62 million of amortizable and non-amortizable intangible assets. In 2017, we also completed a sale of most of our grocery business in Australia and New Zealand and divested $86 million of related goodwill. Furthermore, we completed a sale of a confectionery business in Japan and divested $5 million of goodwill and $24 million of definite lived intangible assets. Finally, we divested $14 million of definite lived intangible asset as part of our sale of one of our equity method investments. During 2016, we divested $4 million of goodwill related to the sale of a confectionery business in Costa Rica and we sold $8 million of non-amortizable intangible assets in Finland. See Note 2, Divestitures and Acquisitions, for additional information. |
| • | Acquisitions – During 2017, we recorded a $15 million adjustment to goodwill and a $7 million adjustment to indefinite lived assets in connection with finalizing the valuation and purchase price allocation for the Burton’s Biscuit Company purchase completed in the fourth quarter of 2016. In connection with the completion of the purchase of a Vietnam biscuit operation in 2016, we finalized the purchase price allocation of the consideration paid to the net assets acquired and recorded $25 million of amortizable intangible assets and $61 million of non-amortizable intangible assets related to acquired trademarks and customer-related intangible assets. A preliminary goodwill balance was recorded in 2015 and subsequently adjusted by $76 million to $385 million in 2016 to reflect finalized intangible asset and other asset fair valuations. See Note 2, Divestitures and Acquisitions, for additional information. |
83
Table of Contents
| • | Asset impairments – We recorded $109 million of intangible asset impairments in 2017, $137 million in 2016 and $83 million in 2015. Charges related to our annual testing of non-amortizable intangible assets were $70 million in 2017, $98 million in 2016 and $71 million in 2015. During 2017, we also recorded a $38 million intangible asset impairment charge resulting from a category decline and lower than expected product growth related to a gum trademark in our North America segment and a $1 million intangible asset impairment charge related to a transaction. In 2016, we also recorded $20 million of impairment charges within our Europe segment related to the planned sale of a confectionery business in France (see Note 2, Divestitures and Acquisitions – Other Divestitures and Acquisitions, for additional information) and we also recorded $19 million of charges in our Europe, North America and AMEA segments resulting from the discontinuation of four biscuit products and one candy product. In 2015, we recorded $12 million of impairment charges within the loss on deconsolidation of Venezuela related to a biscuit trademark. |
We have historically annually tested goodwill and non-amortizable intangible assets for impairment as of October 1. This year, we voluntarily changed the annual impairment assessment date from October 1 to July 1. We believe this measurement date, which represents a change in the method of applying an accounting principle, is preferable because it better aligns with our strategic business planning process and financial forecasts, which are key components of the annual impairment tests. The change in the measurement date did not delay, accelerate or prevent an impairment charge. Each quarter, we have evaluated goodwill and intangible asset impairment risks and recognized any related impairments to date. As such, the change in the annual test date was applied on July 1, 2017.
In 2017, 2016 and 2015, there were no goodwill impairments and each of our reporting units had sufficient fair value in excess of its carrying value. While all reporting units passed our annual impairment testing, if planned business performance expectations are not met or specific valuation factors outside of our control, such as discount rates, change significantly, then the estimated fair values of a reporting unit or reporting units might decline and lead to a goodwill impairment in the future.
During our 2017 annual testing of non-amortizable intangible assets, we recorded $70 million of impairment charges in the third quarter related to five trademarks. We also noted thirteen brands, including the five impaired trademarks, with $963 million of aggregate book value as of December 31, 2017 that each had a fair value in excess of book value of 10% or less. We believe our current plans for each of these brands will allow them to continue to not be impaired, but if the product line expectations are not met or specific valuation factors outside of our control, such as discount rates, change significantly, then a brand or brands could become impaired in the future.
Note 6. 2014-2018 Restructuring Program
On May 6, 2014, our Board of Directors approved a $3.5 billion restructuring program and up to $2.2 billion of capital expenditures. On August 31, 2016, our Board of Directors approved a $600 million reallocation between restructuring program cash costs and capital expenditures so that now the $5.7 billion program consists of approximately $4.1 billion of restructuring program costs ($3.1 billion cash costs and $1 billion non-cash costs) and up to $1.6 billion of capital expenditures. The primary objective of the 2014-2018 Restructuring Program is to reduce our operating cost structure in both our supply chain and overhead costs. The program is intended primarily to cover severance as well as asset disposals and other manufacturing-related one-time costs. Since inception, we have incurred total restructuring and related implementation charges of $3.3 billion related to the 2014-2018 Restructuring Program. We expect to incur the full $4.1 billion of program charges by year-end 2018.
84
Table of Contents
Restructuring Costs:
We recorded restructuring charges of $535 million in 2017, $714 million in 2016 and $711 million in 2015 within asset impairment and exit costs. The 2014-2018 Restructuring Program liability activity for the years ended December 31, 2017 and 2016 was:
| Severance | ||||||||||||
| and related | Asset | |||||||||||
| costs | Write-downs | Total | ||||||||||
| (in millions) | ||||||||||||
| Liability balance, January 1, 2016 |
$ | 395 | $ | – | $ | 395 | ||||||
| Charges |
402 | 312 | 714 | |||||||||
| Cash spent |
(315 | ) | – | (315 | ) | |||||||
| Non-cash settlements/adjustments |
(9 | ) | (312 | ) | (321 | ) | ||||||
| Currency |
(9 | ) | – | (9 | ) | |||||||
|
|
|
|
|
|
|
|||||||
| Liability balance, December 31, 2016 |
$ | 464 | $ | – | $ | 464 | ||||||
|
|
|
|
|
|
|
|||||||
| Charges |
323 | 212 | 535 | |||||||||
| Cash spent |
(347 | ) | – | (347 | ) | |||||||
| Non-cash settlements/adjustments |
(3 | ) | (212 | ) | (215 | ) | ||||||
| Currency |
27 | – | 27 | |||||||||
|
|
|
|
|
|
|
|||||||
| Liability balance, December 31, 2017 |
$ | 464 | $ | – | $ | 464 | ||||||
|
|
|
|
|
|
|
|||||||
We spent $347 million in 2017 and $315 million in 2016 in cash severance and related costs. We also recognized non-cash pension settlement losses (See Note 9, Benefit Plans), non-cash asset write-downs (including accelerated depreciation and asset impairments) and other non-cash adjustments totaling $215 million in 2017 and $321 million in 2016. At December 31, 2017, $412 million of our net restructuring liability was recorded within other current liabilities and $52 million was recorded within other long-term liabilities.
Implementation Costs:
Implementation costs are directly attributable to restructuring activities; however, they do not qualify for special accounting treatment as exit or disposal activities. We believe the disclosure of implementation costs provides readers of our financial statements with more information on the total costs of our 2014-2018 Restructuring Program. Implementation costs primarily relate to reorganizing our operations and facilities in connection with our supply chain reinvention program and other identified productivity and cost saving initiatives. The costs include incremental expenses related to the closure of facilities, costs to terminate certain contracts and the simplification of our information systems. Within our continuing results of operations, we recorded implementation costs of $257 million in 2017, $372 million in 2016 and $291 million in 2015. We recorded these costs within cost of sales and general corporate expense within selling, general and administrative expenses.
85
Table of Contents
Restructuring and Implementation Costs in Operating Income:
During 2017, 2016 and 2015, and since inception of the 2014-2018 Restructuring Program, we recorded restructuring and implementation costs within operating income by segment (as revised to reflect our current segment structure) as follows:
| Latin | North | |||||||||||||||||||||||
| America | AMEA | Europe | America (1) | Corporate (2) | Total | |||||||||||||||||||
| (in millions) | ||||||||||||||||||||||||
| For the Year Ended December 31, 2017 |
||||||||||||||||||||||||
| Restructuring Costs |
$ | 93 | $ | 141 | $ | 195 | $ | 94 | $ | 12 | $ | 535 | ||||||||||||
| Implementation Costs |
43 | 43 | 68 | 58 | 45 | 257 | ||||||||||||||||||
|
|
|
|
|
|
|
|
|
|
|
|
|
|||||||||||||
| Total |
$ | 136 | $ | 184 | $ | 263 | $ | 152 | $ | 57 | $ | 792 | ||||||||||||
|
|
|
|
|
|
|
|
|
|
|
|
|
|||||||||||||
| For the Year Ended December 31, 2016 |
||||||||||||||||||||||||
| Restructuring Costs |
$ | 111 | $ | 96 | $ | 310 | $ | 183 | $ | 14 | $ | 714 | ||||||||||||
| Implementation Costs |
54 | 48 | 88 | 121 | 61 | 372 | ||||||||||||||||||
|
|
|
|
|
|
|
|
|
|
|
|
|
|||||||||||||
| Total |
$ | 165 | $ | 144 | $ | 398 | $ | 304 | $ | 75 | $ | 1,086 | ||||||||||||
|
|
|
|
|
|
|
|
|
|
|
|
|
|||||||||||||
| For the Year Ended December 31, 2015 |
||||||||||||||||||||||||
| Restructuring Costs |
$ | 145 | $ | 181 | $ | 243 | $ | 114 | $ | 28 | $ | 711 | ||||||||||||
| Implementation Costs |
39 | 26 | 78 | 69 | 79 | 291 | ||||||||||||||||||
|
|
|
|
|
|
|
|
|
|
|
|
|
|||||||||||||
| Total |
$ | 184 | $ | 207 | $ | 321 | $ | 183 | $ | 107 | $ | 1,002 | ||||||||||||
|
|
|
|
|
|
|
|
|
|
|
|
|
|||||||||||||
| Total Project 2014-2017 (3) |
||||||||||||||||||||||||
| Restructuring Costs |
$ | 430 | $ | 448 | $ | 844 | $ | 448 | $ | 64 | $ | 2,234 | ||||||||||||
| Implementation Costs |
152 | 129 | 272 | 253 | 221 | 1,027 | ||||||||||||||||||
|
|
|
|
|
|
|
|
|
|
|
|
|
|||||||||||||
| Total |
$ | 582 | $ | 577 | $ | 1,116 | $ | 701 | $ | 285 | $ | 3,261 | ||||||||||||
|
|
|
|
|
|
|
|
|
|
|
|
|
|||||||||||||
| (1) | During 2017 and 2016, our North America region implementation costs included incremental costs that we incurred related to renegotiating collective bargaining agreements that expired at the end of February 2016 for eight U.S. facilities and related to executing business continuity plans for the North America business. |
| (2) | Includes adjustment for rounding. |
| (3) | Includes all charges recorded since program inception on May 6, 2014 through December 31, 2017. |
Note 7. Debt and Borrowing Arrangements
Short-Term Borrowings:
Our short-term borrowings and related weighted-average interest rates consisted of:
| As of December 31, | ||||||||||||||||
| 2017 | 2016 | |||||||||||||||
| Amount | Weighted- | Amount | Weighted- | |||||||||||||
| Outstanding | Average Rate | Outstanding | Average Rate | |||||||||||||
| (in millions) | (in millions) | |||||||||||||||
| Commercial paper |
$ | 3,410 | 1.7 | % | $ | 2,371 | 1.0 | % | ||||||||
| Bank loans |
107 | 11.5 | % | 160 | 10.6 | % | ||||||||||
|
|
|
|
|
|||||||||||||
| Total short-term borrowings |
$ | 3,517 | $ | 2,531 | ||||||||||||
|
|
|
|
|
|||||||||||||
As of December 31, 2017, commercial paper issued and outstanding had between 2 and 75 days remaining to maturity. Commercial paper borrowings increased since the 2016 year-end primarily as a result of issuances to finance the payment of long-term debt maturities, dividend payments and share repurchases during the year.
Bank loans include borrowings on primarily uncommitted credit lines maintained by some of our international subsidiaries to meet short-term working capital needs. Collectively, these credit lines amounted to $2.0 billion at December 31, 2017 and $1.8 billion at December 31, 2016. Borrowings on these lines were $107 million at December 31, 2017 and $160 million at December 31, 2016.
86
Table of Contents
Borrowing Arrangements:
On March 1, 2017, to supplement our commercial paper program, we entered into a $1.5 billion revolving credit agreement for a 364-day senior unsecured credit facility that is scheduled to expire on February 28, 2018. The agreement includes the same terms and conditions as our existing $4.5 billion multi-year credit facility discussed below. As of December 31, 2017, no amounts were drawn on the facility.
We also maintain a $4.5 billion multi-year senior unsecured revolving credit facility for general corporate purposes, including working capital needs, and to support our commercial paper program. On October 14, 2016, the revolving credit agreement, which was scheduled to expire on October 11, 2018, was extended through October 11, 2021. The revolving credit agreement includes a covenant that we maintain a minimum shareholders’ equity of at least $24.6 billion, excluding accumulated other comprehensive earnings/(losses) and the cumulative effects of any changes in accounting principles. At December 31, 2017, we complied with this covenant as our shareholders’ equity, as defined by the covenant, was $36.1 billion. The revolving credit facility agreement also contains customary representations, covenants and events of default. There are no credit rating triggers, provisions or other financial covenants that could require us to post collateral as security. As of December 31, 2017, no amounts were drawn on the facility.
Long-Term Debt:
Our long-term debt consisted of (interest rates are as of December 31, 2017):
| As of December 31, | ||||||||
| 2017 | 2016 | |||||||
| (in millions) | ||||||||
| U.S. dollar notes, 1.385% to 7.000% (weighted-average effective rate 3.414%), |
$ | 8,327 | $ | 8,812 | ||||
| Euro notes, 1.000% to 2.375% (weighted-average effective rate 1.930%), |
3,653 | 3,980 | ||||||
| Pound sterling notes, 3.875% to 7.250% (weighted-average effective rate 4.441%), |
456 | 418 | ||||||
| Swiss franc notes, 0.050% to 1.125% (weighted-average effective rate 0.627%), |
1,694 | 1,449 | ||||||
| Capital leases and other obligations |
5 | 9 | ||||||
|
|
|
|
|
|||||
| Total |
14,135 | 14,668 | ||||||
| Less current portion of long-term debt |
(1,163 | ) | (1,451 | ) | ||||
|
|
|
|
|
|||||
| Long-term debt |
$ | 12,972 | $ | 13,217 | ||||
|
|
|
|
|
|||||
Deferred debt issuance costs of $33 million as of December 31, 2017 and $40 million as of December 31, 2016 are netted against the related debt in the table above. Deferred financing costs related to our revolving credit facility are classified in long-term other assets and were immaterial for all periods presented.
As of December 31, 2017, aggregate maturities of our debt and capital leases based on stated contractual maturities, excluding unamortized non-cash bond premiums, discounts, bank fees and mark-to-market adjustments of $(64) million, were (in millions):
| 2018 |
2019 |
2020 |
2021 |
2022 |
Thereafter |
Total | ||||||
| $1,163 | $2,651 | $896 | $3,373 | $754 | $5,362 | $14,199 |
On April 12, 2017, we discharged $488 million of our 6.500% U.S. dollar-denominated debt. We paid $504 million, representing principal as well as past and future interest accruals from February 2017 through the August 2017 maturity date. We recorded an $11 million loss on debt extinguishment within interest expense and a $5 million reduction in accrued interest.
On March 30, 2017, fr.175 million (approximately $175 million) of our 0.000% Swiss franc-denominated notes matured. The notes and accrued interest to date were paid with net proceeds from the fr.350 million Swiss franc-denominated notes issued on March 13, 2017.
87
Table of Contents
On March 13, 2017, we launched an offering of fr.350 million of Swiss franc-denominated notes, or $349 million in U.S. dollars as of March 31, 2017, consisting of:
| • | fr.225 million (or $224 million) of 0.050% fixed rate notes that mature on March 30, 2020 |
| • | fr.125 million (or $125 million) of 0.617% fixed rate notes that mature on September 30, 2024 |
On March 30, 2017, we received net proceeds of fr.349 million (or $349 million) that were used for general corporate purposes.
On January 26, 2017, €750 million (approximately $801 million) of our 1.125% euro-denominated notes matured. The notes and accrued interest to date were paid with the issuance of commercial paper and cash on hand.
On December 16, 2016, we redeemed $850 million of 2.250% fixed rate notes, maturing on February 1, 2019, that were issued on January 16, 2014. The notes were redeemed at a redemption cost equal to $866 million, plus accrued and unpaid interest of $7 million. In connection with this redemption, during the three months ended December 31, 2016, we recorded a $19 million loss on debt extinguishment within interest and other expense, net.
On October 31, 2016, we completed a cash tender offer and retired $3.18 billion of U.S. dollar, euro and British pound sterling-denominated notes. We financed the repurchase of the notes, including the payment of accrued interest and other costs incurred, from net proceeds received on October 28, 2016 from the $3.75 billion note issuance and the term loans described below. In connection with retiring this debt, during the three months ended December 31, 2016, we recorded a $409 million loss on debt extinguishment within interest expense related to the amount we paid to retire the debt in excess of its carrying value and from recognizing unamortized premiums and deferred financing costs in earnings at the time of the debt extinguishment. Cash costs related to tendering the debt are included in long-term debt repayments in the consolidated statement of cash flows for the year ended December 31, 2016. We also recognized $1 million in interest income related to the partial settlement of fair value hedges due to the tender.
On October 19, 2016, Mondelez International Holdings Netherlands B.V. (“MIHN”), a wholly owned subsidiary of Mondelēz International, Inc., launched an offering of $3.75 billion of notes, guaranteed by Mondelēz International, Inc. The $1.75 billion of 1.625% notes and the $500 million of floating rate notes will mature on October 28, 2019 and the $1.5 billion of 2.0% notes will mature on October 28, 2021. On October 28, 2016, we received proceeds, net of discounts and associated financing costs, of $3.73 billion. Proceeds from the notes issuance were used for general corporate purposes, including to grant loans or make distributions to Mondelēz International, Inc. or its subsidiaries to fund the October 2016 cash tender offer and near-term debt maturities. We recorded approximately $20 million of deferred financing costs and discounts, which will be amortized into interest expense over the life of the notes. We entered into cross-currency swaps, serving as cash flow hedges, so that the U.S. dollar-denominated debt payments will effectively be paid in euros over the life of the debt.
On October 14, 2016, MIHN executed a $1.5 billion bank term loan facility. The loan facility consists of two $750 million loans, one with a three-year maturity and the other with a five-year maturity. The term loans can be drawn at any time for 60 days after signing. On October 25, 2016, we gave notice of our intent to fully draw on the loan with a five-year maturity, and funding occurred on October 28, 2016. Proceeds from the $750 million term loan may be used for general corporate purposes, including funding of the tender offer or other debt. On October 25, 2016, we also gave notice of our intent to terminate the $750 million loan with the three-year maturity.
On February 9, 2016, $1,750 million of our 4.125% U.S. dollar notes matured. The notes and accrued interest to date were paid with net proceeds from the fr.400 million Swiss franc-denominated notes issued on January 26, 2016 and the €700 million euro-denominated notes issued on January 21, 2016, as well as cash on hand and the issuance of commercial paper. As we refinanced $1,150 million of the matured notes with net proceeds from the long-term debt issued in January 2016, we reflected this amount within long-term debt as of December 31, 2015.
On January 26, 2016, we issued fr.400 million of Swiss franc-denominated notes, or $399 million in U.S. dollars locked in with a forward currency contract on January 12, 2016, consisting of:
| • | fr.250 million (or $249 million) of 0.080% fixed rate notes that mature on January 26, 2018 |
| • | fr.150 million (or $150 million) of 0.650% fixed rate notes that mature on July 26, 2022 |
88
Table of Contents
We received proceeds, net of premiums and deferred financing costs, of $398 million that were used to partially fund the February 2016 note maturity and for other general corporate purposes. We recorded approximately $1 million of premiums and deferred financing costs, which will be amortized into interest expense over the life of the notes.
On January 21, 2016, we issued €700 million of euro-denominated 1.625% notes, or $760 million in U.S. dollars locked in with a forward currency contract on January 13, 2016. The euro-denominated notes will mature on January 20, 2023. We received proceeds, net of discounts and deferred financing costs, of $752 million that were used to partially fund the February 2016 note maturity and for other general corporate purposes. We recorded approximately $8 million of discounts and deferred financing costs, which will be amortized into interest expense over the life of the notes.
Our weighted-average interest rate on our total debt was 2.1% as of December 31, 2017, 2.2% as of December 31, 2016 and 3.7% as of December 31, 2015.
Fair Value of Our Debt:
The fair value of our short-term borrowings at December 31, 2017 and December 31, 2016 reflects current market interest rates and approximates the amounts we have recorded on our consolidated balance sheets. The fair value of our long-term debt was determined using quoted prices in active markets (Level 1 valuation data) for the publicly traded debt obligations. At December 31, 2017, the aggregate fair value of our total debt was $18,354 million and its carrying value was $17,652 million. At December 31, 2016, the aggregate fair value of our total debt was $17,882 million and its carrying value was $17,199 million.
Interest and Other Expense, net:
Interest and other expense, net within our results of continuing operations consisted of:
| For the Years Ended December 31, | ||||||||||||
| 2017 | 2016 | 2015 | ||||||||||
| (in millions) | ||||||||||||
| Interest expense, debt |
$ | 396 | $ | 515 | $ | 609 | ||||||
| Loss on debt extinguishment and related expenses |
11 | 427 | 753 | |||||||||
|
JDE coffee business transactions currency-related net gains |
– | – | (436 | ) | ||||||||
| Loss related to interest rate swaps |
– | 97 | 34 | |||||||||
| Other (income)/expense, net |
(25 | ) | 76 | 53 | ||||||||
|
|
|
|
|
|
|
|||||||
| Interest and other expense, net |
$ | 382 | $ | 1,115 | $ | 1,013 | ||||||
|
|
|
|
|
|
|
|||||||
See Note 2, Divestitures and Acquisitions, and Note 8, Financial Instruments, for information on the currency exchange forward contracts associated with the JDE coffee business transactions. See Note 8, Financial Instruments, for information on the loss related to U.S. dollar interest rate swaps no longer designated as accounting cash flow hedges during 2016 and 2015. Also see Note 12, Commitments and Contingencies, for information on the $59 million of other income recorded in 2017 in connection with the resolution of a Brazilian indirect tax matter and the reversal of related accrued interest.
89
Table of Contents
Note 8. Financial Instruments
Fair Value of Derivative Instruments:
Derivative instruments were recorded at fair value in the consolidated balance sheets as follows:
| As of December 31, | ||||||||||||||||
| 2017 | 2016 | |||||||||||||||
| Asset | Liability | Asset | Liability | |||||||||||||
| Derivatives | Derivatives | Derivatives | Derivatives | |||||||||||||
| (in millions) | ||||||||||||||||
| Derivatives designated as |
||||||||||||||||
| Currency exchange contracts |
$ | – | $ | – | $ | 19 | $ | 8 | ||||||||
| Commodity contracts |
– | – | 17 | 22 | ||||||||||||
| Interest rate contracts |
15 | 509 | 108 | 19 | ||||||||||||
|
|
|
|
|
|
|
|
|
|||||||||
| $ | 15 | $ | 509 | $ | 144 | $ | 49 | |||||||||
|
|
|
|
|
|
|
|
|
|||||||||
| Derivatives not designated as |
||||||||||||||||
| Currency exchange contracts |
$ | 65 | $ | 76 | $ | 29 | $ | 43 | ||||||||
| Commodity contracts |
84 | 229 | 112 | 167 | ||||||||||||
| Interest rate contracts |
15 | 11 | 27 | 19 | ||||||||||||
|
|
|
|
|
|
|
|
|
|||||||||
| $ | 164 | $ | 316 | $ | 168 | $ | 229 | |||||||||
|
|
|
|
|
|
|
|
|
|||||||||
| Total fair value |
$ | 179 | $ | 825 | $ | 312 | $ | 278 | ||||||||
|
|
|
|
|
|
|
|
|
|||||||||
Derivatives designated as accounting hedges include cash flow and fair value hedges and derivatives not designated as accounting hedges include economic hedges. Non-U.S. dollar denominated debt, designated as a hedge of our net investments in non-U.S. operations, is not reflected in the table above, but is included in long-term debt summarized in Note 7, Debt and Borrowing Arrangements. We record derivative assets and liabilities on a gross basis on our consolidated balance sheets. The fair value of our asset derivatives is recorded within other current assets and the fair value of our liability derivatives is recorded within other current liabilities.
The fair values (asset/(liability)) of our derivative instruments were determined using:
| As of December 31, 2017 | ||||||||||||||||
| Quoted Prices in | ||||||||||||||||
| Active Markets | Significant | Significant | ||||||||||||||
| Total | for Identical | Other Observable | Unobservable | |||||||||||||
| Fair Value of Net | Assets | Inputs | Inputs | |||||||||||||
| Asset/(Liability) | (Level 1) | (Level 2) | (Level 3) | |||||||||||||
| (in millions) | ||||||||||||||||
| Currency exchange contracts |
$ | (11 | ) | $ | – | $ | (11 | ) | $ | – | ||||||
| Commodity contracts |
(145 | ) | (138 | ) | (7 | ) | – | |||||||||
| Interest rate contracts |
(490 | ) | – | (490 | ) | – | ||||||||||
|
|
|
|
|
|
|
|
|
|||||||||
| Total derivatives |
$ | (646 | ) | $ | (138 | ) | $ | (508 | ) | $ | – | |||||
|
|
|
|
|
|
|
|
|
|||||||||
| As of December 31, 2016 | ||||||||||||||||
| Quoted Prices in | ||||||||||||||||
| Active Markets | Significant | Significant | ||||||||||||||
| Total | for Identical | Other Observable | Unobservable | |||||||||||||
| Fair Value of Net | Assets | Inputs | Inputs | |||||||||||||
| Asset/(Liability) | (Level 1) | (Level 2) | (Level 3) | |||||||||||||
| (in millions) | ||||||||||||||||
| Currency exchange contracts |
$ | (3 | ) | $ | – | $ | (3 | ) | $ | – | ||||||
| Commodity contracts |
(60 | ) | (86 | ) | 26 | – | ||||||||||
| Interest rate contracts |
97 | – | 97 | – | ||||||||||||
|
|
|
|
|
|
|
|
|
|||||||||
| Total derivatives |
$ | 34 | $ | (86 | ) | $ | 120 | $ | – | |||||||
|
|
|
|
|
|
|
|
|
|||||||||
90
Table of Contents
Level 1 financial assets and liabilities consist of exchange-traded commodity futures and listed options. The fair value of these instruments is determined based on quoted market prices on commodity exchanges. Our exchange-traded derivatives are generally subject to master netting arrangements that permit net settlement of transactions with the same counterparty when certain criteria are met, such as in the event of default. We also are required to maintain cash margin accounts in connection with funding the settlement of our open positions, and the margin requirements generally fluctuate daily based on market conditions. We have recorded margin deposits related to our exchange-traded derivatives of $171 million as of December 31, 2017 and $133 million as of December 31, 2016 within other current assets. Based on our net asset or liability positions with individual counterparties, in the event of default and immediate net settlement of all of our open positions, for derivatives we have in a net asset position, our counterparties would owe us a total of $34 million as of December 31, 2017 and $48 million as of December 31, 2016. As of December 31, 2017, we have no Level 1 derivatives in a net liability position, and as of December 31, 2016 we would have owed $2 million for derivatives in a net liability position.
Level 2 financial assets and liabilities consist primarily of over-the-counter (“OTC”) currency exchange forwards, options and swaps; commodity forwards and options; and interest rate swaps. Our currency exchange contracts are valued using an income approach based on observable market forward rates less the contract rate multiplied by the notional amount. Commodity derivatives are valued using an income approach based on the observable market commodity index prices less the contract rate multiplied by the notional amount or based on pricing models that rely on market observable inputs such as commodity prices. Our calculation of the fair value of interest rate swaps is derived from a discounted cash flow analysis based on the terms of the contract and the observable market interest rate curve. Our calculation of the fair value of financial instruments takes into consideration the risk of nonperformance, including counterparty credit risk. Our OTC derivative transactions are governed by International Swap Dealers Association agreements and other standard industry contracts. Under these agreements, we do not post nor require collateral from our counterparties. The majority of our commodity and currency exchange OTC derivatives do not have a legal right of set-off. In connection with our OTC derivatives that could be net-settled in the event of default, assuming all parties were to fail to comply with the terms of the agreements, for Level 2 derivatives we have in a net liability position, we would owe $523 million as of December 31, 2017 and $40 million as of December 31, 2016, and for Level 2 derivatives we have in a net asset position, our counterparties would owe us a total of $26 million as of December 31, 2017 and $162 million as of December 31, 2016. We manage the credit risk in connection with these and all our derivatives by entering into transactions with counterparties with investment grade credit ratings, limiting the amount of exposure with each counterparty and monitoring the financial condition of our counterparties.
Derivative Volume:
The net notional values of our derivative instruments were:
| Notional Amount | ||||||||
| As of December 31, | ||||||||
| 2017 | 2016 | |||||||
| (in millions) | ||||||||
| Currency exchange contracts: |
||||||||
| Intercompany loans and forecasted interest payments |
$ | 7,089 | $ | 3,343 | ||||
| Forecasted transactions |
2,213 | 1,452 | ||||||
| Commodity contracts |
1,204 | 837 | ||||||
| Interest rate contracts |
6,532 | 6,365 | ||||||
| Net investment hedge – euro notes |
3,679 | 4,012 | ||||||
| Net investment hedge – pound sterling notes |
459 | 419 | ||||||
| Net investment hedge – Swiss franc notes |
1,694 | 1,447 | ||||||
91
Table of Contents
Cash Flow Hedges:
Cash flow hedge activity, net of taxes, within accumulated other comprehensive earnings/(losses) included:
| For the Years Ended December 31, | ||||||||||||
| 2017 | 2016 | 2015 | ||||||||||
| (in millions) | ||||||||||||
| Accumulated (loss)/gain at beginning of period |
$ | (121 | ) | $ | (45 | ) | $ | (2 | ) | |||
| Transfer of realized (gains)/losses in fair value to earnings |
27 | 53 | – | |||||||||
| Unrealized gain/(loss) in fair value |
(19 | ) | (129 | ) | (43 | ) | ||||||
|
|
|
|
|
|
|
|||||||
| Accumulated (loss)/gain at end of period |
$ | (113 | ) | $ | (121 | ) | $ | (45 | ) | |||
|
|
|
|
|
|
|
|||||||
After-tax gains/(losses) reclassified from accumulated other comprehensive earnings/(losses) into net earnings were:
| For the Years Ended December 31, | ||||||||||||
| 2017 | 2016 | 2015 | ||||||||||
| (in millions) | ||||||||||||
| Currency exchange contracts – forecasted transactions |
$ | (3 | ) | $ | (1 | ) | $ | 83 | ||||
| Commodity contracts |
(24 | ) | (4 | ) | (52 | ) | ||||||
| Interest rate contracts |
– | (48 | ) | (31 | ) | |||||||
|
|
|
|
|
|
|
|||||||
| Total |
$ | (27 | ) | $ | (53 | ) | $ | – | ||||
|
|
|
|
|
|
|
|||||||
After-tax gains/(losses) recognized in other comprehensive earnings/(losses) were:
| For the Years Ended December 31, | ||||||||||||
| 2017 | 2016 | 2015 | ||||||||||
| (in millions) | ||||||||||||
| Currency exchange contracts – forecasted transactions |
$ | (38 | ) | $ | 8 | $ | 40 | |||||
| Commodity contracts |
7 | (34 | ) | (35 | ) | |||||||
| Interest rate contracts |
12 | (103 | ) | (48 | ) | |||||||
|
|
|
|
|
|
|
|||||||
| Total |
$ | (19 | ) | $ | (129 | ) | $ | (43 | ) | |||
|
|
|
|
|
|
|
|||||||
Cash flow hedge ineffectiveness was not material for all periods presented.
Within interest and other expense, net, we recorded pre-tax losses of $97 million in the first quarter of 2016 and $34 million in the first quarter of 2015 related to amounts excluded from effectiveness testing. These amounts relate to interest rate swaps no longer designated as cash flow hedges due to changes in financing plans. Due to lower overall costs and our decision to hedge a greater portion of our net investments in operations that use currencies other than the U.S. dollar as their functional currencies, we changed our plans to issue U.S. dollar-denominated debt and instead issued euro and Swiss franc-denominated notes in 2016 and euro, British pound sterling and Swiss franc-denominated notes in 2015. Amounts excluded from effectiveness testing were not material for all other periods presented.
We record pre-tax (i) gains or losses reclassified from accumulated other comprehensive earnings/(losses) into earnings, (ii) gains or losses on ineffectiveness and (iii) gains or losses on amounts excluded from effectiveness testing in:
| • | cost of sales for commodity contracts; |
| • | cost of sales for currency exchange contracts related to forecasted transactions; and |
| • | interest and other expense, net for interest rate contracts and currency exchange contracts related to intercompany loans. |
Based on current market conditions, we would expect to transfer unrealized losses of $1 million (net of taxes) for interest rate cash flow hedges to earnings during the next 12 months.
Cash Flow Hedge Coverage:
As of December 31, 2017, our longest dated cash flow hedges are interest rate swaps that hedge forecasted interest rate payments over the next 5 years and 10 months.
92
Table of Contents
Fair Value Hedges:
Pre-tax gains/(losses) due to changes in fair value of our interest rate swaps and related hedged long-term debt were recorded in interest and other expense, net:
| For the Years Ended December 31, | ||||||||||||
| 2017 | 2016 | 2015 | ||||||||||
| (in millions) | ||||||||||||
| Derivatives |
$ | (4 | ) | $ | (6 | ) | $ | (1 | ) | |||
| Borrowings |
4 | 6 | 1 | |||||||||
Fair value hedge ineffectiveness and amounts excluded from effectiveness testing were not material for all periods presented.
Economic Hedges:
Pre-tax gains/(losses) recorded in net earnings for economic hedges were:
| For the Years Ended December 31, | Recognized | |||||||||||||||
| 2017 | 2016 | 2015 | in Earnings | |||||||||||||
| (in millions) | ||||||||||||||||
| Currency exchange contracts: |
||||||||||||||||
| Intercompany loans and |
$ | 13 | $ | 21 | $ | 29 | |
Interest and other expense, net |
| |||||||
| Forecasted transactions |
(37 | ) | (76 | ) | 29 | Cost of sales | ||||||||||
| Forecasted transactions |
(2 | ) | 11 | 435 | |
Interest and other expense, net |
| |||||||||
| Forecasted transactions |
3 | 7 | (12 | ) | |
Selling, general and administrative expenses |
| |||||||||
| Commodity contracts |
(218 | ) | (101 | ) | (38 | ) | Cost of sales | |||||||||
|
|
|
|
|
|
|
|||||||||||
| Total |
$ | (241 | ) | $ | (138 | ) | $ | 443 | ||||||||
|
|
|
|
|
|
|
|||||||||||
In connection with the coffee business transactions, we entered into a number of consecutive euro to U.S. dollar currency exchange forward contracts in 2015 to lock in an equivalent expected value in U.S. dollars. The mark-to-market gains and losses on the derivatives were recorded in earnings. We recorded net gains of $436 million for the year ended December 31, 2015 within interest and other expense, net in connection with the forward contracts and the transferring of proceeds to our subsidiaries where coffee net assets and shares were deconsolidated. The currency hedge and related gains and losses were recorded within interest and other expense, net. See Note 2, Divestitures and Acquisitions — JDE Coffee Business Transactions, for additional information.
Hedges of Net Investments in International Operations:
After-tax gains/(losses) related to hedges of net investments in international operations in the form of euro, pound sterling and Swiss franc-denominated debt were:
| Location of | ||||||||||||||
| For the Years Ended December 31, | Gain/(Loss) | |||||||||||||
| 2017 | 2016 | 2015 | Recognized in AOCI | |||||||||||
| (in millions) | ||||||||||||||
| Euro notes |
$ | (323 | ) | $ | 73 | $ | 268 | Currency | ||||||
| Pound sterling notes |
(26 | ) | 148 | 42 | Translation | |||||||||
| Swiss franc notes |
(49 | ) | 12 | 9 | Adjustment | |||||||||
Through February 8, 2018, we entered into cross-currency interest rate swaps and forwards with an aggregate notional value of $3.2 billion to hedge our non-U.S. net investments against adverse movements in exchange rates. We designated these swaps and forwards as net investment hedges related to our operations in our Europe and AMEA regions.
93
Table of Contents
Note 9. Benefit Plans
Pension Plans
Obligations and Funded Status:
The projected benefit obligations, plan assets and funded status of our pension plans were:
| U.S. Plans | Non-U.S. Plans | |||||||||||||||
| 2017 | 2016 | 2017 | 2016 | |||||||||||||
| (in millions) | ||||||||||||||||
| Projected benefit obligation at January 1 |
$ | 1,614 | $ | 1,566 | $ | 9,814 | $ | 9,547 | ||||||||
| Service cost |
46 | 57 | 156 | 147 | ||||||||||||
| Interest cost |
62 | 61 | 199 | 229 | ||||||||||||
| Benefits paid |
(32 | ) | (32 | ) | (471 | ) | (425 | ) | ||||||||
| Settlements paid |
(111 | ) | (91 | ) | – | – | ||||||||||
| Actuarial losses |
179 | 52 | 180 | 1,284 | ||||||||||||
| Divestiture |
– | – | (14 | ) | (5 | ) | ||||||||||
| Currency |
– | – | 976 | (979 | ) | |||||||||||
| Other |
4 | 1 | 12 | 16 | ||||||||||||
|
|
|
|
|
|
|
|
|
|||||||||
| Projected benefit obligation at December 31 |
1,762 | 1,614 | 10,852 | 9,814 | ||||||||||||
|
|
|
|
|
|
|
|
|
|||||||||
| Fair value of plan assets at January 1 |
1,620 | 1,247 | 7,926 | 7,721 | ||||||||||||
| Actual return on plan assets |
217 | 118 | 592 | 1,079 | ||||||||||||
| Contributions |
23 | 378 | 482 | 419 | ||||||||||||
| Benefits paid |
(32 | ) | (32 | ) | (471 | ) | (425 | ) | ||||||||
| Settlements paid |
(111 | ) | (91 | ) | – | – | ||||||||||
| Divestiture |
– | – | – | (4 | ) | |||||||||||
| Currency |
– | – | 798 | (863 | ) | |||||||||||
| Other |
– | – | – | (1 | ) | |||||||||||
|
|
|
|
|
|
|
|
|
|||||||||
| Fair value of plan assets at December 31 |
1,717 | 1,620 | 9,327 | 7,926 | ||||||||||||
|
|
|
|
|
|
|
|
|
|||||||||
| Net pension (liabilities)/assets at December 31 |
$ | (45 | ) | $ | 6 | $ | (1,525 | ) | $ | (1,888 | ) | |||||
|
|
|
|
|
|
|
|
|
|||||||||
The accumulated benefit obligation, which represents benefits earned to the measurement date, was $1,715 million at December 31, 2017 and $1,540 million at December 31, 2016 for the U.S. pension plans. The accumulated benefit obligation for the non-U.S. pension plans was $10,610 million at December 31, 2017 and $9,531 million at December 31, 2016.
Salaried and non-union hourly employees hired after January 1, 2009 in the U.S. and after January 1, 2011 in Canada (or earlier for certain legacy Cadbury employees) are no longer eligible to participate in the defined benefit pension plans. These employees are given an enhanced Company contribution to our employee defined contribution plans. For those salaried and non-union hourly employees who are currently participating in the defined benefit pension plans in the U.S. and Canada, benefit accruals will cease December 31, 2019.
The combined U.S. and non-U.S. pension plans resulted in a net pension liability of $1,570 million at December 31, 2017 and $1,882 million at December 31, 2016. We recognized these amounts in our consolidated balance sheets as follows:
| As of December 31, | ||||||||
| 2017 | 2016 | |||||||
| (in millions) | ||||||||
| Prepaid pension assets |
$ | 158 | $ | 159 | ||||
| Other current liabilities |
(59 | ) | (27 | ) | ||||
| Accrued pension costs |
(1,669 | ) | (2,014 | ) | ||||
|
|
|
|
|
|||||
| $ | (1,570 | ) | $ | (1,882 | ) | |||
|
|
|
|
|
|||||
94
Table of Contents
Certain of our U.S. and non-U.S. plans are underfunded with an accumulated benefit obligations in excess of plan assets. For these plans, the projected benefit obligations, accumulated benefit obligations and the fair value of plan assets were:
| U.S. Plans | Non-U.S. Plans | |||||||||||||||
| As of December 31, | As of December 31, | |||||||||||||||
| 2017 | 2016 | 2017 | 2016 | |||||||||||||
| (in millions) | ||||||||||||||||
| Projected benefit obligation |
$ | 94 | $ | 96 | $ | 9,345 | $ | 8,386 | ||||||||
| Accumulated benefit obligation |
90 | 88 | 9,138 | 8,168 | ||||||||||||
| Fair value of plan assets |
2 | 2 | 7,709 | 6,451 | ||||||||||||
We used the following weighted-average assumptions to determine our benefit obligations under the pension plans:
| U.S. Plans | Non-U.S. Plans | |||||||||||||||
| As of December 31, | As of December 31, | |||||||||||||||
| 2017 | 2016 | 2017 | 2016 | |||||||||||||
| (in millions) | ||||||||||||||||
| Discount rate |
3.68% | 4.19% | 2.20% | 2.31% | ||||||||||||
| Expected rate of return on plan assets |
5.50% | 6.25% | 4.90% | 5.14% | ||||||||||||
| Rate of compensation increase |
4.00% | 4.00% | 3.31% | 3.29% | ||||||||||||
Year-end discount rates for our U.S., Canadian, Eurozone and U.K. plans were developed from a model portfolio of high quality, fixed-income debt instruments with durations that match the expected future cash flows of the benefit obligations. Year-end discount rates for our remaining non-U.S. plans were developed from local bond indices that match local benefit obligations as closely as possible. Changes in our discount rates were primarily the result of changes in bond yields year-over-year. We determine our expected rate of return on plan assets from the plan assets’ historical long-term investment performance, current asset allocation and estimates of future long-term returns by asset class.
At the end of 2015, we changed the approach used to measure service and interest costs for pension benefits. For 2015, we measured service and interest costs utilizing a single weighted-average discount rate derived from the yield curve used to measure the plan obligations. For 2016, we measured service and interest costs by applying the specific spot rates along that yield curve to the plans’ liability cash flows. We believe the new approach provided a more precise measurement of service and interest costs by aligning the timing of the plans’ liability cash flows to the corresponding spot rates on the yield curve. The impact of this change was a decrease in net periodic pension cost of approximately $64 million for the year ended December 31, 2016. This change did not affect the measurement of our plan obligations. We accounted for this change as a change in accounting estimate and, accordingly, accounted for it on a prospective basis.
Components of Net Periodic Pension Cost:
Net periodic pension cost consisted of the following:
| U.S. Plans | Non-U.S. Plans | |||||||||||||||||||||||
| For the Years Ended December 31, | For the Years Ended December 31, | |||||||||||||||||||||||
| 2017 | 2016 | 2015 | 2017 | 2016 | 2015 | |||||||||||||||||||
| (in millions) | ||||||||||||||||||||||||
| Service cost |
$ | 46 | $ | 57 | $ | 64 | $ | 156 | $ | 147 | $ | 188 | ||||||||||||
| Interest cost |
62 | 61 | 67 | 199 | 229 | 307 | ||||||||||||||||||
| Expected return on plan assets |
(101 | ) | (97 | ) | (93 | ) | (434 | ) | (418 | ) | (478 | ) | ||||||||||||
| Amortization: |
||||||||||||||||||||||||
| Net loss from experience differences |
37 | 42 | 43 | 167 | 120 | 141 | ||||||||||||||||||
| Prior service cost/(benefit) (1) |
2 | 2 | 2 | (3 | ) | (3 | ) | 15 | ||||||||||||||||
| Settlement losses and other expenses (2) |
35 | 30 | 19 | 6 | 6 | 2 | ||||||||||||||||||
|
|
|
|
|
|
|
|
|
|
|
|
|
|||||||||||||
| Net periodic pension cost |
$ | 81 | $ | 95 | $ | 102 | $ | 91 | $ | 81 | $ | 175 | ||||||||||||
|
|
|
|
|
|
|
|
|
|
|
|
|
|||||||||||||
| (1) | For the year ended December 31, 2015, amortization of prior service cost includes $17 million of pension curtailment losses related to employees who transitioned to JDE upon the contribution of our global coffee business. Refer to Note 2, Divestitures and Acquisitions – JDE Coffee Business Transactions, for more information. |
95
Table of Contents
| (2) | Settlement losses include $11 million for the year ended December 31, 2017, $15 million for the year ended December 31, 2016 and $9 million for the year ended December 31, 2015 of pension settlement losses for employees who elected lump-sum payments in connection with our 2014-2018 Restructuring Program. Retired employees who elected lump-sum payments resulted in net settlement losses of $21 million for our U.S. plans and $6 million for our non-U.S. plans in 2017, $15 million for our U.S. plans and $6 million for our non-U.S. plans in 2016 and $10 million for our U.S. plans and $2 million for our non-U.S. plans in 2015. See Note 6, 2014-2018 Restructuring Program, for more information. |
For the U.S. plans, we determine the expected return on plan assets component of net periodic benefit cost using a calculated market return value that recognizes the cost over a four year period. For our non-U.S. plans, we utilize a similar approach with varying cost recognition periods for some plans, and with others, we determine the expected return on plan assets based on asset fair values as of the measurement date.
As of December 31, 2017, for the combined U.S. and non-U.S. pension plans, we expected to amortize from accumulated other comprehensive earnings/(losses) into net periodic pension cost during 2018:
| • | an estimated $209 million of net loss from experience differences; and |
| • | less than $1 million of estimated prior service credit. |
We used the following weighted-average assumptions to determine our net periodic pension cost:
| U.S. Plans | Non-U.S. Plans | |||||||||||||||||||||||
| For the Years Ended December 31, | For the Years Ended December 31, | |||||||||||||||||||||||
| 2017 | 2016 | 2015 | 2017 | 2016 | 2015 | |||||||||||||||||||
| Discount rate | 4.19% | 4.50% | 4.20% | 2.31% | 3.11% | 2.99% | ||||||||||||||||||
| Expected rate of return |
6.25% | 6.75% | 7.25% | 5.14% | 5.87% | 5.96% | ||||||||||||||||||
| Rate of compensation increase |
4.00% | 4.00% | 4.00% | 3.29% | 3.18% | 3.26% | ||||||||||||||||||
Plan Assets:
The fair value of pension plan assets was determined using the following fair value measurements:
| As of December 31, 2017 | ||||||||||||||||
| Quoted Prices | Significant | |||||||||||||||
| in Active Markets | Other | Significant | ||||||||||||||
| for Identical | Observable | Unobservable | ||||||||||||||
| Total Fair | Assets | Inputs | Inputs | |||||||||||||
| Asset Category |
Value | (Level 1) | (Level 2) | (Level 3) | ||||||||||||
| (in millions) | ||||||||||||||||
| U.S. equity securities |
$ | 2 | $ | 2 | $ | – | $ | – | ||||||||
| Non-U.S. equity securities |
5 | 5 | – | – | ||||||||||||
| Pooled funds - equity securities |
2,340 | 848 | 1,492 | – | ||||||||||||
|
|
|
|
|
|
|
|
|
|||||||||
| Total equity securities |
2,347 | 855 | 1,492 | – | ||||||||||||
| Government bonds |
3,237 | 34 | 3,203 | – | ||||||||||||
| Pooled funds - fixed-income securities |
602 | 449 | 153 | – | ||||||||||||
| Corporate bonds and other |
2,102 | 133 | 1,179 | 790 | ||||||||||||
|
|
|
|
|
|
|
|
|
|||||||||
| Total fixed-income securities |
5,941 | 616 | 4,535 | 790 | ||||||||||||
| Real estate |
156 | 120 | 13 | 23 | ||||||||||||
| Private equity |
2 | – | – | 2 | ||||||||||||
| Cash |
86 | 66 | 20 | – | ||||||||||||
| Other |
2 | 1 | – | 1 | ||||||||||||
|
|
|
|
|
|
|
|
|
|||||||||
| Total assets in the fair value hierarchy |
$ | 8,534 | $ | 1,658 | $ | 6,060 | $ | 816 | ||||||||
|
|
|
|
|
|
|
|
|
|||||||||
| Investments measured at net asset value |
2,439 | |||||||||||||||
|
|
|
|||||||||||||||
| Total investments at fair value |
$ | 10,973 | ||||||||||||||
|
|
|
|||||||||||||||
96
Table of Contents
| As of December 31, 2016 | ||||||||||||||||
| Quoted Prices | Significant | |||||||||||||||
| in Active Markets | Other | Significant | ||||||||||||||
| for Identical | Observable | Unobservable | ||||||||||||||
| Total Fair | Assets | Inputs | Inputs | |||||||||||||
| Asset Category |
Value | (Level 1) | (Level 2) | (Level 3) | ||||||||||||
| (in millions) | ||||||||||||||||
| U.S. equity securities |
$ | 1 | $ | 1 | $ | – | $ | – | ||||||||
| Non-U.S. equity securities |
427 | 427 | – | – | ||||||||||||
| Pooled funds - equity securities |
1,524 | 286 | 1,235 | 3 | ||||||||||||
|
|
|
|
|
|
|
|
|
|||||||||
| Total equity securities |
1,952 | 714 | 1,235 | 3 | ||||||||||||
| Government bonds |
3,009 | 37 | 2,972 | – | ||||||||||||
| Pooled funds - fixed-income securities |
756 | 103 | 618 | 35 | ||||||||||||
| Corporate bonds and other |
852 | 357 | (43 | ) | 538 | |||||||||||
|
|
|
|
|
|
|
|
|
|||||||||
| Total fixed-income securities |
4,617 | 497 | 3,547 | 573 | ||||||||||||
| Real estate |
170 | 98 | 50 | 22 | ||||||||||||
| Private equity |
2 | – | – | 2 | ||||||||||||
| Cash |
73 | 72 | 1 | – | ||||||||||||
| Other |
3 | 1 | – | 2 | ||||||||||||
|
|
|
|
|
|
|
|
|
|||||||||
| Total assets in the fair value hierarchy |
$ | 6,817 | $ | 1,382 | $ | 4,833 | $ | 602 | ||||||||
|
|
|
|
|
|
|
|
|
|||||||||
| Investments measured at net asset value |
2,667 | |||||||||||||||
|
|
|
|||||||||||||||
| Total investments at fair value |
$ | 9,484 | ||||||||||||||
|
|
|
|||||||||||||||
We excluded plan assets of $71 million at December 31, 2017 and $62 million at December 31, 2016 from the above tables related to certain insurance contracts as they are reported at contract value, in accordance with authoritative guidance.
Fair value measurements:
| • | Level 1 – includes primarily U.S and non-U.S. equity securities and government bonds valued using quoted prices in active markets. |
| • | Level 2 – includes primarily pooled funds, including assets in real estate pooled funds, valued using net asset values of participation units held in common collective trusts, as reported by the managers of the trusts and as supported by the unit prices of actual purchase and sale transactions. Level 2 plan assets also include corporate bonds and other fixed-income securities, valued using independent observable market inputs, such as matrix pricing, yield curves and indices. |
| • | Level 3 – includes investments valued using unobservable inputs that reflect the plans’ assumptions that market participants would use in pricing the assets, based on the best information available. |
| • | Fair value estimates for pooled funds are calculated by the investment advisor when reliable quotations or pricing services are not readily available for certain underlying securities. The estimated value is based on either cost or last sale price for most of the securities valued in this fashion. |
| • | Fair value estimates for private equity investments are calculated by the general partners using the market approach to estimate the fair value of private investments. The market approach utilizes prices and other relevant information generated by market transactions, type of security, degree of liquidity, restrictions on the disposition, latest round of financing data, company financial statements, relevant valuation multiples and discounted cash flow analyses. |
| • | Fair value estimates for private debt placements are calculated using standardized valuation methods, including but not limited to income-based techniques such as discounted cash flow projections or market-based techniques utilizing public and private transaction multiples as comparables. |
| • | Fair value estimates for real estate investments are calculated by the investment managers using the present value of future cash flows expected to be received from the investments, based on valuation methodologies such as appraisals, local market conditions, and current and projected operating performance. |
| • | Fair value estimates for certain fixed-income securities such as insurance contracts are calculated based on the future stream of benefit payments discounted using prevailing interest rates based on the valuation date. |
| • | Net asset value – primarily includes equity funds, fixed income funds, real estate funds, hedge funds and private equity investments for which net asset values are normally used. |
97
Table of Contents
Changes in our Level 3 plan assets, which are recorded in other comprehensive earnings/(losses), included:
| Asset Category |
January 1, 2017 Balance |
Net Realized and Unrealized Gains/ (Losses) |
Net Purchases, Issuances and Settlements |
Net Transfers Into/(Out of) Level 3 |
Currency Impact |
December 31, 2017 Balance |
||||||||||||||||||
| (in millions) | ||||||||||||||||||||||||
| Non-U.S. equity |
$ | 3 | $ | – | $ | – | $ | (3 | ) | $ | – | $ | – | |||||||||||
| Pooled funds- |
35 | – | (16 | ) | (21 | ) | 2 | – | ||||||||||||||||
| Corporate bond and other |
538 | 10 | 182 | – | 60 | 790 | ||||||||||||||||||
| Real estate |
22 | 1 | – | – | – | 23 | ||||||||||||||||||
| Private equity and other |
4 | – | – | (1 | ) | – | 3 | |||||||||||||||||
|
|
|
|
|
|
|
|
|
|
|
|
|
|||||||||||||
| Total Level 3 investments |
$ | 602 | $ | 11 | $ | 166 | $ | (25 | ) | $ | 62 | $ | 816 | |||||||||||
|
|
|
|
|
|
|
|
|
|
|
|
|
|||||||||||||
| Asset Category |
January 1, 2016 Balance |
Net Realized and Unrealized Gains/ (Losses) |
Net Purchases, Issuances and Settlements |
Net Transfers Into/(Out of) Level 3 |
Currency Impact |
December 31, 2016 Balance |
||||||||||||||||||
| (in millions) | ||||||||||||||||||||||||
| Non-U.S. equity |
$ | – | $ | – | $ | – | $ | 3 | $ | – | $ | 3 | ||||||||||||
| Pooled funds- |
26 | 6 | 15 | (7 | ) | (5 | ) | 35 | ||||||||||||||||
| Corporate bond and other |
665 | 21 | (41 | ) | – | (107 | ) | 538 | ||||||||||||||||
| Real estate |
230 | – | (184 | ) | (3 | ) | (21 | ) | 22 | |||||||||||||||
| Private equity and other |
3 | – | – | 1 | – | 4 | ||||||||||||||||||
|
|
|
|
|
|
|
|
|
|
|
|
|
|||||||||||||
| Total Level 3 investments |
$ | 924 | $ | 27 | $ | (210 | ) | $ | (6 | ) | $ | (133 | ) | $ | 602 | |||||||||
|
|
|
|
|
|
|
|
|
|
|
|
|
|||||||||||||
The increases in Level 3 pension plan investments during 2017 were primarily due to net purchases in corporate bonds and other fixed income securities, which includes private debt placements, and the effects of currency. The decreases in Level 3 pension plan investments during 2016 were primarily due to net settlements in real estate funds and the effects of currency.
The percentage of fair value of pension plan assets was:
| U.S. Plans | Non-U.S. Plans | |||||||||||||||
| As of December 31, | As of December 31, | |||||||||||||||
| Asset Category |
2017 | 2016 | 2017 | 2016 | ||||||||||||
| Equity securities |
15% | 33% | 28% | 29% | ||||||||||||
| Fixed-income securities |
85% | 63% | 60% | 57% | ||||||||||||
| Real estate |
– | 4% | 6% | 5% | ||||||||||||
| Hedge funds |
– | – | 4% | 6% | ||||||||||||
| Private equity |
– | – | 1% | 2% | ||||||||||||
| Cash |
– | – | 1% | 1% | ||||||||||||
|
|
|
|
|
|
|
|
|
|||||||||
| Total |
100% | 100% | 100% | 100% | ||||||||||||
|
|
|
|
|
|
|
|
|
|||||||||
For our U.S. plans, our investment strategy is to reduce the risk of underfunded plans in part through appropriate asset allocation within our plan assets. We attempt to maintain our target asset allocation by rebalancing between asset classes as we make contributions and monthly benefit payments. The strategy involves using indexed U.S. equity and international equity securities and actively managed U.S. investment grade fixed-income securities (which constitute 95% or more of fixed-income securities) with smaller allocations to high yield fixed-income securities.
98
Table of Contents
For our non-U.S. plans, the investment strategy is subject to local regulations and the asset/liability profiles of the plans in each individual country. In aggregate, the asset allocation targets of our non-U.S. plans are broadly characterized as a mix of approximately 32% equity securities (including investments in real estate), approximately 66% fixed-income securities and approximately 2% for other types of securities. Our investment strategy for our largest non-U.S. plan, which comprises 63% of our non-U.S. pension assets, is designed to balance risk and return by diversifying across a wide range of return-seeking and liability matching assets, invested in a range of both active and passive mandates. We target an allocation of approximately 23% in equity securities, 20% credit, and 57% liability matching assets. The strategy uses indexed global developed equities, actively managed global investment grade and alternative credit, real estate and other liability matching assets including a buy-in annuity policy.
Employer Contributions:
In 2017, we contributed $23 million to our U.S. pension plans and $470 million to our non-U.S. pension plans. The non-U.S. amount included a non-recurring $250 million contribution made in connection with a new funding agreement for a Company plan in the United Kingdom. In addition, employees contributed $12 million to our non-U.S. plans. We make contributions to our pension plans in accordance with local funding arrangements and statutory minimum funding requirements. Discretionary contributions are made to the extent that they are tax deductible and do not generate an excise tax liability.
In 2018, we estimate that our pension contributions will be $39 million to our U.S. plans and $250 million to our non-U.S. plans based on current tax laws. Our actual contributions may be different due to many factors, including changes in tax and other benefit laws, significant differences between expected and actual pension asset performance or interest rates.
Future Benefit Payments:
The estimated future benefit payments from our pension plans at December 31, 2017 were (in millions):
| 2018 | 2019 | 2020 | 2021 | 2022 | 2023-2027 | |||||||||||||||||||
| U.S. Plans | $ | 120 | $ | 83 | $ | 89 | $ | 93 | $ | 93 | $ | 498 | ||||||||||||
| Non-U.S. Plans | 375 | 375 | 387 | 409 | 409 | 2,196 | ||||||||||||||||||
Multiemployer Pension Plans:
In accordance with obligations we have under collective bargaining agreements, we made contributions to multiemployer pension plans of $26 million in 2017, $25 million in 2016 and $31 million in 2015. There are risks of participating in multiemployer pension plans that are different from single employer plans. Contributions made by a participating employer are not segregated to be used to provide benefits for participants related to that participating employer. If a participating employer stops contributing to the plan, the unfunded vested obligations of the plan are borne by the remaining participating employers.
The only individually significant multiemployer plan we participate in as of December 31, 2017 is the Bakery and Confectionery Union and Industry International Pension Fund (the “Fund”). Our contributions to the Fund exceeded 5% of total contributions to the Fund for fiscal years 2017, 2016 and 2015. Our contributions to the Fund were $22 million in 2017, $21 million in 2016 and $27 million in 2015. Our contributions to other multiemployer pension plans that were not individually significant were $4 million in 2017, $4 million in 2016 and $4 million in 2015. Our contributions are based on our contribution rates under our collective bargaining agreements, the number of our eligible employees and Fund surcharges.
| Expiration Date | ||||||||||||||||
| Pension | FIP / RP | of Collective- | ||||||||||||||
| EIN / Pension | Protection Act | Status Pending / | Surcharge | Bargaining | ||||||||||||
| Pension Fund |
Plan Number | Zone Status | Implemented | Imposed | Agreements | |||||||||||
| Bakery and Confectionery Union and Industry International Pension Fund |
526118572 | Red | Implemented | Yes | 2/29/2016 | |||||||||||
Effective January 1, 2012, the Fund’s zone status changed to “Red”. As a result of this certification, beginning in July 2012, we were charged a 10% surcharge on our contribution rates. The Fund subsequently adopted a rehabilitation plan on November 7, 2012 that required contribution increases and reductions to benefit provisions. As of August 28, 2016, the 10% surcharge was no longer applicable and we were required to pay higher contributions under the Fund’s rehabilitation plan. Although our collective bargaining agreements with the Fund expired during 2016 and while we continue to renegotiate the agreements, we continue to make contributions to the Fund.
99
Table of Contents
Other Costs:
We sponsor and contribute to employee defined contribution plans. These plans cover eligible salaried, non-union and union employees. Our contributions and costs are determined by the matching of employee contributions, as defined by the plans. Amounts charged to expense in continuing operations for defined contribution plans totaled $43 million in 2017, $44 million in 2016 and $45 million in 2015.
Postretirement Benefit Plans
Obligations:
Our postretirement health care plans are not funded. The changes in and the amount of the accrued benefit obligation were:
| As of December 31, | ||||||||
| 2017 | 2016 | |||||||
| (in millions) | ||||||||
| Accrued benefit obligation at January 1 |
$ | 394 | $ | 511 | ||||
| Service cost |
7 | 12 | ||||||
| Interest cost |
15 | 20 | ||||||
| Benefits paid |
(15 | ) | (14 | ) | ||||
| Plan amendments (1) |
– | (149 | ) | |||||
| Currency |
8 | 3 | ||||||
| Assumption changes |
30 | 34 | ||||||
| Actuarial losses/(gains) |
(4 | ) | (23 | ) | ||||
|
|
|
|
|
|||||
| Accrued benefit obligation at December 31 |
$ | 435 | $ | 394 | ||||
|
|
|
|
|
|||||
| (1) | Plan amendments in 2016 included a change in eligibility requirements related to medical and life insurance benefits and a change in benefits for Medicare-eligible participants. |
The current portion of our accrued postretirement benefit obligation of $16 million at December 31, 2017 and $12 million at December 31, 2016 was included in other current liabilities.
We used the following weighted-average assumptions to determine our postretirement benefit obligations:
| U.S. Plans | Non-U.S. Plans | |||||||||||||||
| As of December 31, | As of December 31, | |||||||||||||||
| 2017 | 2016 | 2017 | 2016 | |||||||||||||
| Discount rate |
3.66% | 4.14% | 4.24% | 4.55% | ||||||||||||
| Health care cost trend rate assumed for next year |
6.25% | 6.50% | 5.56% | 5.50% | ||||||||||||
| Ultimate trend rate |
4.81% | 5.00% | 5.56% | 5.68% | ||||||||||||
| Year that the rate reaches the ultimate trend rate |
2024 | 2020 | 2018 | 2018 | ||||||||||||
Year-end discount rates for our U.S., Canadian and U.K. plans were developed from a model portfolio of high quality, fixed-income debt instruments with durations that match the expected future cash flows of the benefit obligations. Year-end discount rates for our remaining non-U.S. plans were developed from local bond indices that match local benefit obligations as closely as possible. Changes in our discount rates were primarily the result of changes in bond yields year-over-year. Our expected health care cost trend rate is based on historical costs.
At the end of 2015, we changed the approach used to measure service and interest costs for other postretirement benefits. For 2015, we measured service and interest costs utilizing a single weighted-average discount rate derived from the yield curve used to measure the plan obligations. For 2016, we measured service and interest costs by applying the specific spot rates along that yield curve to the plans’ liability cash flows. We believe the new approach provided a more precise measurement of service and interest costs by aligning the timing of the plans’ liability cash flows to the corresponding spot
100
Table of Contents
rates on the yield curve. The impact of this change was a decrease in net periodic postretirement cost of approximately $4 million for the year ended December 31, 2016. This change does not affect the measurement of our plan obligations. We accounted for this change as a change in accounting estimate and, accordingly, accounted for it on a prospective basis.
Assumed health care cost trend rates have a significant impact on the amounts reported for the health care plans. A one-percentage-point change in assumed health care cost trend rates would have the following effects:
| As of December 31, 2017 | ||||||||||||
| One-Percentage-Point | ||||||||||||
| Increase | Decrease | |||||||||||
| (in millions) | ||||||||||||
| Effect on postretirement benefit obligation |
$ | 49 | $ | (40 | ) | |||||||
| Effect on annual service and interest cost |
3 | (2 | ) | |||||||||
Components of Net Periodic Postretirement Health Care Costs:
Net periodic postretirement health care costs consisted of the following:
| For the Years Ended December 31, | ||||||||||||
| 2017 | 2016 | 2015 | ||||||||||
| (in millions) | ||||||||||||
| Service cost |
$ | 7 | $ | 12 | $ | 15 | ||||||
| Interest cost |
15 | 20 | 22 | |||||||||
| Amortization: |
||||||||||||
| Net loss from experience differences |
14 | 10 | 13 | |||||||||
| Prior service credit (1) |
(40 | ) | (20 | ) | (7 | ) | ||||||
|
|
|
|
|
|
|
|||||||
| Net periodic postretirement health care costs |
$ | (4 | ) | $ | 22 | $ | 43 | |||||
|
|
|
|
|
|
|
|||||||
| (1) | In the fourth quarter of 2016, the prior service credit included a one-time $9 million curtailment gain related to a change in the eligibility requirement resulting in ongoing amortization of $10 million. In 2017, we continue to amortize prior service credit and recorded $40 million on a full year basis. |
As of December 31, 2017, we expected to amortize from accumulated other comprehensive earnings/(losses) into pre-tax net periodic postretirement health care costs during 2018:
| • | an estimated $18 million of net loss from experience differences, and |
| • | an estimated $39 million of prior service credit. |
We used the following weighted-average assumptions to determine our net periodic postretirement health care cost:
| U.S. Plans | Non-U.S. Plans | |||||||||||
| For the Years Ended December 31, | For the Years Ended December 31, | |||||||||||
| 2017 | 2016 | 2015 | 2017 | 2016 | 2015 | |||||||
| Discount rate |
4.14% | 4.60% | 4.20% | 4.55% | 4.77% | 4.52% | ||||||
| Health care cost trend rate |
6.50% | 6.50% | 6.50% | 5.50% | 5.50% | 5.18% | ||||||
Future Benefit Payments:
Our estimated future benefit payments for our postretirement health care plans at December 31, 2017 were (in millions):
| 2018 | 2019 | 2020 | 2021 | 2022 | 2023-2027 | |||||||||||||||||||
| U.S. Plans |
$ | 11 | $ | 12 | $ | 13 | $ | 15 | $ | 16 | $ | 85 | ||||||||||||
| Non-U.S. Plans |
5 | 5 | 6 | 6 | 6 | 55 | ||||||||||||||||||
Other Costs:
We made contributions to multiemployer medical plans totaling $18 million in 2017, $19 million in 2016 and $20 million in 2015. These plans provide medical benefits to active employees and retirees under certain collective bargaining agreements.
101
Table of Contents
Postemployment Benefit Plans
Obligations:
Our postemployment plans are primarily not funded. The changes in and the amount of the accrued benefit obligation at December 31, 2017 and 2016 were:
| As of December 31, | ||||||||
| 2017 | 2016 | |||||||
| (in millions) | ||||||||
| Accrued benefit obligation at January 1 |
$ | 71 | $ | 95 | ||||
| Service cost |
5 | 7 | ||||||
| Interest cost |
4 | 6 | ||||||
| Benefits paid |
(6 | ) | (9 | ) | ||||
| Assumption changes |
– | (21 | ) | |||||
| Actuarial losses/(gains) |
2 | (7 | ) | |||||
|
|
|
|
|
|||||
| Accrued benefit obligation at December 31 |
$ | 76 | $ | 71 | ||||
|
|
|
|
|
|||||
The accrued benefit obligation was determined using a weighted-average discount rate of 6.5% in 2017 and 6.2% in 2016, an assumed weighted-average ultimate annual turnover rate of 0.3% in 2017 and 2016, assumed compensation cost increases of 4.0% in 2017 and 2016 and assumed benefits as defined in the respective plans.
Postemployment costs arising from actions that offer employees benefits in excess of those specified in the respective plans are charged to expense when incurred.
Components of Net Periodic Postemployment Costs:
Net periodic postemployment costs consisted of the following:
| For the Years Ended December 31, | ||||||||||||
| 2017 | 2016 | 2015 | ||||||||||
| (in millions) | ||||||||||||
| Service cost |
$ | 5 | $ | 7 | $ | 7 | ||||||
| Interest cost |
4 | 6 | 5 | |||||||||
| Amortization of net gains |
(3 | ) | (1 | ) | – | |||||||
|
|
|
|
|
|
|
|||||||
| Net periodic postemployment costs |
$ | 6 | $ | 12 | $ | 12 | ||||||
|
|
|
|
|
|
|
|||||||
As of December 31, 2017, the estimated net gain for the postemployment benefit plans that we expected to amortize from accumulated other comprehensive earnings/(losses) into net periodic postemployment costs during 2018 was approximately $3 million.
Note 10. Stock Plans
Under our Amended and Restated 2005 Performance Incentive Plan (the “Plan”), we are authorized through May 21, 2024 to issue a maximum of 243.7 million shares of our Common Stock to employees and non-employee directors. As of December 31, 2017, there were 67.2 million shares available to be granted under the Plan.
Stock Options:
Stock options (including stock appreciation rights) are granted at an exercise price equal to the market value of the underlying stock on the grant date, generally become exercisable in three annual installments beginning on the first anniversary of the grant date and have a maximum term of ten years.
We account for our employee stock options under the fair value method of accounting using a Black-Scholes methodology to measure stock option expense at the date of grant. The fair value of the stock options at the date of grant is amortized to expense over the vesting period. We recorded compensation expense related to stock options held by our employees of $50 million in 2017, $57 million in 2016 and $50 million in 2015 in our results from continuing operations. The deferred tax benefit recorded related to this compensation expense was $12 million in 2017, $15 million in 2016 and $13 million in 2015. The unamortized compensation expense related to our employee stock options was $44 million at December 31, 2017 and is expected to be recognized over a weighted-average period of 1.2 years.
102
Table of Contents
Our weighted-average Black-Scholes fair value assumptions were:
| Risk-Free Interest Rate |
Expected Life | Expected Volatility |
Expected Dividend Yield |
Fair Value at Grant Date |
||||||||||||||||
| 2017 |
2.04 | % | 6 years | 22.75 | % | 1.74 | % | $ | 8.57 | |||||||||||
| 2016 |
1.40 | % | 6 years | 23.11 | % | 1.61 | % | $ | 7.86 | |||||||||||
| 2015 |
1.70 | % | 6 years | 18.51 | % | 1.61 | % | $ | 6.12 | |||||||||||
The risk-free interest rate represents the constant maturity U.S. government treasuries rate with a remaining term equal to the expected life of the options. The expected life is the period over which our employees are expected to hold their options. Volatility reflects historical movements in our stock price for a period commensurate with the expected life of the options. The dividend yield reflects the dividend yield in place at the time of the historical grants.
Stock option activity is reflected below:
| Weighted- | ||||||||||||||||
| Average | Average | |||||||||||||||
| Exercise or | Remaining | Aggregate | ||||||||||||||
| Shares Subject | Grant Price | Contractual | Intrinsic | |||||||||||||
| to Option | Per Share | Term | Value | |||||||||||||
| Balance at January 1, 2015 |
56,431,551 | $ | 24.19 | $ | 685 million | |||||||||||
|
|
|
|||||||||||||||
| Annual grant to eligible employees |
8,899,530 | 36.94 | ||||||||||||||
| Additional options issued |
901,340 | 35.84 | ||||||||||||||
|
|
|
|||||||||||||||
| Total options granted |
9,800,870 | 36.84 | ||||||||||||||
| Options exercised (1) |
(6,444,515 | ) | 22.94 | $ | 108 million | |||||||||||
| Options cancelled |
(2,753,798 | ) | 32.35 | |||||||||||||
|
|
|
|||||||||||||||
| Balance at December 31, 2015 |
57,034,108 | 26.12 | $ | 1,068 million | ||||||||||||
|
|
|
|||||||||||||||
| Annual grant to eligible employees |
7,517,290 | 39.70 | ||||||||||||||
| Additional options issued |
115,800 | 42.26 | ||||||||||||||
|
|
|
|||||||||||||||
| Total options granted |
7,633,090 | 39.74 | ||||||||||||||
| Options exercised (1) |
(8,883,101 | ) | 24.09 | $ | 174 million | |||||||||||
| Options cancelled |
(2,182,485 | ) | 35.23 | |||||||||||||
|
|
|
|||||||||||||||
| Balance at December 31, 2016 |
53,601,612 | 28.02 | $ | 874 million | ||||||||||||
|
|
|
|||||||||||||||
| Annual grant to eligible employees |
6,012,140 | 43.20 | ||||||||||||||
| Additional options issued |
162,880 | 42.54 | ||||||||||||||
|
|
|
|||||||||||||||
| Total options granted |
6,175,020 | 43.18 | ||||||||||||||
| Options exercised (1) |
(9,431,009 | ) | 26.17 | $ | 170 million | |||||||||||
| Options cancelled |
(1,910,968 | ) | 38.10 | |||||||||||||
|
|
|
|||||||||||||||
| Balance at December 31, 2017 |
48,434,655 | 29.92 | 5 years | $ | 626 million | |||||||||||
|
|
|
|||||||||||||||
| Exercisable at December 31, 2017 |
37,240,858 | 26.58 | 4 years | $ | 604 million | |||||||||||
|
|
|
|||||||||||||||
| (1) | Cash received from options exercised was $257 million in 2017, $221 million in 2016 and $148 million in 2015. The actual tax benefit realized for the tax deductions from the option exercises totaled $31 million in 2017, $31 million in 2016 and $58 million in 2015. |
Deferred Stock Units, Performance Share Units and Restricted Stock:
Historically we have made grants of deferred stock units, performance share units and restricted stock. Beginning in 2016, we only grant deferred stock units and performance share units and no longer grant restricted stock. We may grant shares of deferred stock units to eligible employees, giving them, in most instances, all of the rights of shareholders, except that they may not sell, assign, pledge or otherwise encumber the shares and our deferred stock units do not have voting rights until vested. Shares of deferred stock units are subject to forfeiture if certain employment conditions are not met. Deferred stock units generally vest on the third anniversary of the grant date. Performance share units granted under our 2005 Plan vest based on varying performance, market and service conditions. The unvested performance share units have no voting rights and do not pay dividends. Dividend equivalents accumulated over the vesting period are paid only after the performance share units vest.
103
Table of Contents
The fair value of the deferred stock units, performance share units and restricted stock at the date of grant is amortized to earnings over the vesting period. The fair value of our deferred stock units and restricted stock is measured at the market price of our Common Stock on the grant date. Performance share unit awards generally have targets tied to both performance and market-based conditions. For market condition components, market volatility and other factors are taken into consideration in determining the grant date fair value and the related compensation expense is recognized regardless of whether the market condition is satisfied, provided that the requisite service has been provided. For performance condition components, we estimate the probability that the performance conditions will be achieved each quarter and adjust compensation expenses accordingly. The grant date fair value of performance share units is determined based on the Monte Carlo simulation model for the market-based total shareholder return component and the market price of our Common Stock on the grant date for performance-based components. The number of performance share units that ultimately vest ranges from 0-200 percent of the number granted, based on the achievement of the performance and market-based components. We recorded compensation expense related to deferred stock units, performance share units and restricted stock of $87 million in 2017, $83 million in 2016 and $86 million in 2015 in our results from continuing operations. The deferred tax benefit recorded related to this compensation expense was $23 million in 2017, $22 million in 2016 and $24 million in 2015. The unamortized compensation expense related to our deferred stock units, performance share units and restricted stock was $138 million at December 31, 2017 and is expected to be recognized over a weighted-average period of 1.8 years.
Our performance share unit, deferred stock unit and restricted stock activity is reflected below:
| Weighted-Average | Weighted-Average | |||||||||||||||
| Number | Fair Value | Aggregate | ||||||||||||||
| of Shares | Grant Date | Per Share (4) | Fair Value (4) | |||||||||||||
| Balance at January 1, 2015 |
10,582,640 | $ | 28.86 | |||||||||||||
|
|
|
|||||||||||||||
| Annual grant to eligible employees: |
Feb. 18, 2015 | |||||||||||||||
| Performance share units |
1,598,290 | 38.81 | ||||||||||||||
| Restricted stock |
386,910 | 36.94 | ||||||||||||||
| Deferred stock units |
866,640 | 36.94 | ||||||||||||||
| Additional shares granted (1) |
1,087,322 | Various | 36.00 | |||||||||||||
|
|
|
|||||||||||||||
| Total shares granted |
3,939,162 | 37.44 | $ | 147 million | ||||||||||||
| Vested (2) |
(3,905,745 | ) | 24.66 | $ | 96 million | |||||||||||
| Forfeited (2) |
(1,197,841 | ) | 32.63 | |||||||||||||
|
|
|
|||||||||||||||
| Balance at December 31, 2015 |
9,418,216 | 33.71 | ||||||||||||||
|
|
|
|||||||||||||||
| Annual grant to eligible employees: |
Feb. 22, 2016 | |||||||||||||||
| Performance share units |
1,406,500 | 34.35 | ||||||||||||||
| Deferred stock units |
1,040,790 | 39.70 | ||||||||||||||
| Additional shares granted (3) |
864,851 | Various | 32.90 | |||||||||||||
|
|
|
|||||||||||||||
| Total shares granted |
3,312,141 | 35.65 | $ | 118 million | ||||||||||||
| Vested (2) |
(3,992,902 | ) | 28.15 | $ | 112 million | |||||||||||
| Forfeited (2) |
(1,143,828 | ) | 37.58 | |||||||||||||
|
|
|
|||||||||||||||
| Balance at December 31, 2016 |
7,593,627 | 36.90 | ||||||||||||||
|
|
|
|||||||||||||||
| Annual grant to eligible employees: |
Feb. 16, 2017 | |||||||||||||||
| Performance share units |
1,087,010 | 43.14 | ||||||||||||||
| Deferred stock units |
845,550 | 43.20 | ||||||||||||||
| Additional shares granted (3) |
1,537,763 | Various | 42.22 | |||||||||||||
|
|
|
|||||||||||||||
| Total shares granted |
3,470,323 | 42.75 | $ | 148 million | ||||||||||||
| Vested (2) |
(2,622,807 | ) | 35.78 | $ | 94 million | |||||||||||
| Forfeited (2) |
(771,438 | ) | 38.69 | |||||||||||||
|
|
|
|||||||||||||||
| Balance at December 31, 2017 |
7,669,705 | 39.74 | ||||||||||||||
|
|
|
|||||||||||||||
| (1) | Includes performance share units, deferred stock units and restricted stock. |
| (2) | Includes performance share units, deferred stock units and restricted stock. The actual tax benefit realized for the tax deductions from the shares vested totaled $7 million in 2017, $18 million in 2016 and $18 million in 2015. |
| (3) | Includes performance share units and deferred stock units. |
| (4) | Performance share units reflect grant date fair values. Prior-year weighted average fair value per share has been revised. |
104
Table of Contents
Note 11. Capital Stock
Our amended and restated articles of incorporation authorize 5.0 billion shares of Class A common stock (“Common Stock”) and 500 million shares of preferred stock. There were no preferred shares issued and outstanding at December 31, 2017, 2016 and 2015. Shares of Common Stock issued, in treasury and outstanding were:
| Shares | ||||||||||||
| Shares Issued | Treasury Shares | Outstanding | ||||||||||
| Balance at January 1, 2015 |
1,996,537,778 | (332,896,779 | ) | 1,663,640,999 | ||||||||
| Shares repurchased |
– | (91,875,878 | ) | (91,875,878 | ) | |||||||
| Exercise of stock options and issuance of |
– | 8,268,033 | 8,268,033 | |||||||||
|
|
|
|
|
|
|
|||||||
| Balance at December 31, 2015 |
1,996,537,778 | (416,504,624 | ) | 1,580,033,154 | ||||||||
|
|
|
|
|
|
|
|||||||
| Shares repurchased |
– | (61,972,713 | ) | (61,972,713 | ) | |||||||
| Exercise of stock options and issuance of |
– | 10,305,100 | 10,305,100 | |||||||||
|
|
|
|
|
|
|
|||||||
| Balance at December 31, 2016 |
1,996,537,778 | (468,172,237 | ) | 1,528,365,541 | ||||||||
|
|
|
|
|
|
|
|||||||
| Shares repurchased |
– | (50,598,902 | ) | (50,598,902 | ) | |||||||
| Exercise of stock options and issuance of |
– | 10,369,445 | 10,369,445 | |||||||||
|
|
|
|
|
|
|
|||||||
| Balance at December 31, 2017 |
1,996,537,778 | (508,401,694 | ) | 1,488,136,084 | ||||||||
|
|
|
|
|
|
|
|||||||
Stock plan awards to employees and non-employee directors are issued from treasury shares. At December 31, 2017, 123 million shares of Common Stock held in treasury were reserved for stock options and other stock awards.
Share Repurchase Program:
Between 2013 and 2017, our Board of Directors authorized the repurchase of a total of $13.7 billion of our Common Stock through December 31, 2018. On January 31, 2018, our Finance Committee, with authorization delegated from our Board of Directors, approved an increase of $6.0 billion in the share repurchase program, raising the authorization to $19.7 billion of Common Stock repurchases, and extended the program through December 31, 2020. Repurchases under the program are determined by management and are wholly discretionary. Prior to January 1, 2017, we had repurchased approximately $10.8 billion of Common Stock pursuant to this authorization. During 2017, we repurchased approximately 50.6 million shares of Common Stock at an average cost of $43.51 per share, or an aggregate cost of approximately $2.2 billion, all of which was paid during the period except for approximately $28 million settled in January 2018. All share repurchases were funded through available cash and commercial paper issuances. As of December 31, 2017, we have approximately $0.6 billion in remaining share repurchase capacity. As of January 31, 2018, subsequent to approximately $0.1 billion of share repurchases in January, our remaining share repurchase capacity was $6.5 billion.
105
Table of Contents
Note 12. Commitments and Contingencies
Legal Proceedings:
We are subject to legal proceedings, claims and governmental inspections or investigations incidental to our business, including those specified below.
In February 2013 and March 2014, Cadbury India Limited (now known as Mondelez India Foods Private Limited), a subsidiary of Mondelēz International, and other parties received show cause notices from the Indian Central Excise Authority (the “Excise Authority”) calling upon the parties to demonstrate why the Excise Authority should not collect a total of 3.7 billion Indian rupees ($59 million as of December 31, 2017) of unpaid excise tax and an equivalent amount of penalties, as well as interest, related to production at the same Indian facility. We contested these demands for unpaid excise taxes, penalties and interest. On March 27, 2015, after several hearings, the Commissioner of the Excise Authority issued an order denying the excise exemption that we claimed for the Indian facility and confirming the Excise Authority’s demands for total taxes and penalties in the amount of 5.8 billion Indian rupees ($91 million as of December 31, 2017). We have appealed this order. In addition, the Excise Authority issued additional show cause notices in February 2015, December 2015 and October 2017 on the same issue but covering the periods January to October 2014, November 2014 to September 2015 and October 2015 to June 2017, respectively. These notices added a total of 4.9 billion Indian rupees ($77 million as of December 31, 2017) of unpaid excise taxes as well as penalties to be determined up to an amount equivalent to that claimed by the Excise Authority plus interest. With the implementation of the new Goods and Services Tax in India in July 2017, we will not receive any further show cause notices for additional amounts on this issue. We believe that the decision to claim the excise tax benefit is valid and we are continuing to contest the show cause notices through the administrative and judicial process.
In April 2013, the staff of the U.S. Commodity Futures Trading Commission (“CFTC”) advised us and Kraft Foods Group that it was investigating activities related to the trading of December 2011 wheat futures contracts that occurred prior to the Spin-Off of Kraft Foods Group. We cooperated with the staff in its investigation. On April 1, 2015, the CFTC filed a complaint against Kraft Foods Group and Mondelēz Global LLC (“Mondelēz Global”) in the U.S. District Court for the Northern District of Illinois, Eastern Division (the “CFTC action”). The complaint alleges that Kraft Foods Group and Mondelēz Global (1) manipulated or attempted to manipulate the wheat markets during the fall of 2011; (2) violated position limit levels for wheat futures and (3) engaged in non-competitive trades by trading both sides of exchange-for-physical Chicago Board of Trade wheat contracts. The CFTC seeks civil monetary penalties of either triple the monetary gain for each violation of the Commodity Exchange Act (the “Act”) or $1 million for each violation of Section 6(c)(1), 6(c)(3) or 9(a)(2) of the Act and $140,000 for each additional violation of the Act, plus post-judgment interest; an order of permanent injunction prohibiting Kraft Foods Group and Mondelēz Global from violating specified provisions of the Act; disgorgement of profits; and costs and fees. In December 2015, the court denied Mondelēz Global and Kraft Foods Group’s motion to dismiss the CFTC’s claims of market manipulation and attempted manipulation, and the parties are now in discovery. Additionally, several class action complaints were filed against Kraft Foods Group and Mondelēz Global in the U.S. District Court for the Northern District of Illinois by investors in wheat futures and options on behalf of themselves and others similarly situated. The complaints make similar allegations as those made in the CFTC action and seek class action certification; an unspecified amount for damages, interest and unjust enrichment; costs and fees; and injunctive, declaratory and other unspecified relief. In June 2015, these suits were consolidated in the Northern District of Illinois. In June 2016, the court denied Mondelēz Global and Kraft Foods Group’s motion to dismiss, and the parties are now in discovery. It is not possible to predict the outcome of these matters; however, based on our Separation and Distribution Agreement with Kraft Foods Group dated as of September 27, 2012, we expect to bear any monetary penalties or other payments in connection with the CFTC action.
We are a party to various legal proceedings incidental to our business, including those noted above in this section. At present we believe that the ultimate outcome of these proceedings, individually and in the aggregate, will not materially harm our financial position, results of operations or cash flows. However, legal proceedings and government investigations are subject to inherent uncertainties, and unfavorable rulings or other events could occur. Unfavorable resolutions could involve substantial monetary damages. In addition, in matters for which conduct remedies are sought, unfavorable resolutions could include an injunction or other order prohibiting us from selling one or more products at all or in particular ways, precluding particular business practices or requiring other remedies. An unfavorable outcome might result in a material adverse impact on our business, results of operations or financial position.
106
Table of Contents
Third-Party Guarantees:
We enter into third-party guarantees primarily to cover long-term obligations of our vendors. As part of these transactions, we guarantee that third parties will make contractual payments or achieve performance measures. At December 31, 2017, we had no material third-party guarantees recorded on our consolidated balance sheet.
Tax Matters:
As part of our 2010 Cadbury acquisition, we became the responsible party for tax matters under a February 2, 2006 dated Deed of Tax Covenant between the Cadbury Schweppes PLC and related entities (“Schweppes”) and Black Lion Beverages and related entities. The tax matters included an ongoing transfer pricing case with the Spanish tax authorities related to the Schweppes businesses Cadbury divested prior to our acquisition of Cadbury. During the first quarter of 2017, the Spanish Supreme Court decided the case in our favor. As a result of the final ruling, during the first quarter of 2017, we recorded a favorable earnings impact of $46 million in selling, general and administrative expenses and $12 million in interest and other expense, net, for a total pre-tax impact of $58 million due to the non-cash reversal of Cadbury-related accrued liabilities related to this matter. In 2017, we recorded additional income of $4 million related to bank guarantee releases within selling, general and administrative expenses and interest and other expense, net.
During the first quarter of 2017, the Brazilian Supreme Court (the “Court”) ruled against the Brazilian tax authorities in a leading case related to the computation of certain indirect taxes. The Court ruled that the indirect tax base should not include a value-added tax known as “ICMS”. By removing the ICMS from the tax base, the Court effectively eliminated a “tax on a tax.” Our Brazilian subsidiary had received an injunction against making payments for the “tax on a tax” in 2008 and since that time until December 2016, had accrued this portion of the tax each quarter in the event that the tax was reaffirmed by the Brazilian courts. On September 30, 2017, based on legal advice and the publication of the Court’s decision related to this case, we determined that the likelihood that the increased tax base would be reinstated and assessed against us was remote. Accordingly, we reversed our accrual of 667 million Brazilian reais, or $212 million as of September 30, 2017, of which, $153 million was recorded within selling, general and administrative expenses and $59 million was recorded within interest and other expense, net. The Brazilian tax authority is seeking potential clarification or adjustment of the terms of enforcement with the Court. We continue to monitor developments in this matter and currently do not expect a material future impact on our financial statements.
Leases:
Rental expenses recorded in continuing operations were $284 million in 2017, $317 million in 2016 and $331 million in 2015. As of December 31, 2017, minimum rental commitments under non-cancelable operating leases in effect at year-end were (in millions):
| 2018 |
2019 | 2020 | 2021 | 2022 | Thereafter | Total | ||||||||||||||||||
|
$ 245 |
$ | 202 | $ | 150 | $ | 102 | $ | 67 | $ | 154 | $ | 920 | ||||||||||||
107
Table of Contents
Note 13. Reclassifications from Accumulated Other Comprehensive Income
The following table summarizes the changes in the accumulated balances of each component of accumulated other comprehensive earnings/(losses) attributable to Mondelēz International. Amounts reclassified from accumulated other comprehensive earnings/(losses) to net earnings (net of tax) were net losses of $174 million in 2017, $250 million in 2016 and $350 million in 2015.
| For the Years Ended December 31, | ||||||||||||
| 2017 | 2016 | 2015 | ||||||||||
| (in millions) | ||||||||||||
| Currency Translation Adjustments: |
||||||||||||
| Balance at beginning of period |
$ | (8,914 | ) | $ | (8,006 | ) | $ | (5,042 | ) | |||
| Currency translation adjustments |
987 | (847 | ) | (2,905 | ) | |||||||
| Reclassification to earnings related to: |
||||||||||||
| Venezuela deconsolidation |
– | – | 99 | |||||||||
| Equity method investment transactions |
– | 57 | – | |||||||||
| Tax (expense)/benefit |
214 | (135 | ) | (184 | ) | |||||||
|
|
|
|
|
|
|
|||||||
| Other comprehensive earnings/(losses) |
1,201 | (925 | ) | (2,990 | ) | |||||||
| Less: (earnings)/loss attributable to noncontrolling interests |
(28 | ) | 17 | 26 | ||||||||
|
|
|
|
|
|
|
|||||||
| Balance at end of period |
(7,741 | ) | (8,914 | ) | (8,006 | ) | ||||||
|
|
|
|
|
|
|
|||||||
| Pension and Other Benefit Plans: |
||||||||||||
| Balance at beginning of period |
$ | (2,087 | ) | $ | (1,934 | ) | $ | (2,274 | ) | |||
| Net actuarial gain/(loss) arising during period |
(71 | ) | (491 | ) | (60 | ) | ||||||
| Tax (expense)/benefit on net actuarial gain/(loss) |
50 | 70 | 3 | |||||||||
| Losses/(gains) reclassified into net earnings: |
||||||||||||
| Amortization of experience losses and |
174 | 150 | 207 | |||||||||
| Settlement losses (1) |
38 | 36 | 111 | |||||||||
| Venezuela deconsolidation |
– | – | 2 | |||||||||
| Tax (expense)/benefit on reclassifications (2) |
(65 | ) | (46 | ) | (69 | ) | ||||||
| Currency impact |
(183 | ) | 128 | 146 | ||||||||
|
|
|
|
|
|
|
|||||||
| Other comprehensive earnings/(losses) |
(57 | ) | (153 | ) | 340 | |||||||
|
|
|
|
|
|
|
|||||||
| Balance at end of period |
(2,144 | ) | (2,087 | ) | (1,934 | ) | ||||||
|
|
|
|
|
|
|
|||||||
| Derivative Cash Flow Hedges: |
||||||||||||
| Balance at beginning of period |
$ | (121 | ) | $ | (46 | ) | $ | (2 | ) | |||
| Net derivative gains/(losses) |
(17 | ) | (151 | ) | (75 | ) | ||||||
| Tax (expense)/benefit on net derivative gain/(loss) |
9 | 20 | 30 | |||||||||
| Losses/(gains) reclassified into net earnings: |
||||||||||||
| Currency exchange contracts - |
4 | 3 | (90 | ) | ||||||||
| Commodity contracts (3) |
29 | 9 | 64 | |||||||||
| Interest rate contracts (4) |
– | 83 | 47 | |||||||||
| Tax (expense)/benefit on reclassifications (2) |
(6 | ) | (42 | ) | (21 | ) | ||||||
| Currency impact |
(11 | ) | 3 | 1 | ||||||||
|
|
|
|
|
|
|
|||||||
| Other comprehensive earnings/(losses) |
8 | (75 | ) | (44 | ) | |||||||
|
|
|
|
|
|
|
|||||||
| Balance at end of period |
(113 | ) | (121 | ) | (46 | ) | ||||||
|
|
|
|
|
|
|
|||||||
| Accumulated other comprehensive income attributable |
||||||||||||
| Balance at beginning of period |
$ | (11,122 | ) | $ | (9,986 | ) | $ | (7,318 | ) | |||
| Total other comprehensive earnings/(losses) |
1,152 | (1,153 | ) | (2,694 | ) | |||||||
| Less: (earnings)/loss attributable to noncontrolling interests |
(28 | ) | 17 | 26 | ||||||||
|
|
|
|
|
|
|
|||||||
| Other comprehensive earnings/(losses) |
1,124 | (1,136 | ) | (2,668 | ) | |||||||
|
|
|
|
|
|
|
|||||||
| Balance at end of period |
$ | (9,998 | ) | $ | (11,122 | ) | $ | (9,986 | ) | |||
|
|
|
|
|
|
|
|||||||
108
Table of Contents
| (1) | These reclassified losses are included in the components of net periodic benefit costs disclosed in Note 9, Benefit Plans. Settlement losses include the transfer of coffee business-related pension obligations in the amount of $90 million in 2015. |
| (2) | Taxes reclassified to earnings are recorded within the provision for income taxes. |
| (3) | These reclassified gains or losses are recorded within cost of sales. |
| (4) | These reclassified losses are recorded within interest and other expense, net. |
Note 14. Income Taxes
On December 22, 2017, new U.S. tax reform legislation was enacted that included a broad range of complex provisions impacting the taxation of businesses. Certain impacts of the new legislation would generally require accounting to be completed in the period of enactment, however in response to the complexities of this new legislation, the SEC issued guidance to provide companies with relief. Specifically, when the initial accounting for items under the new legislation is incomplete, the guidance allows us to recognize provisional amounts when reasonable estimates can be made or to continue to apply the prior tax law if a reasonable estimate of the impact cannot be made. The SEC has provided up to a one-year window for companies to finalize the accounting for the impacts of this new legislation and we anticipate finalizing our accounting during 2018.
While our accounting for the new U.S. tax legislation is not complete, we have made reasonable estimates for some provisions and recognized a $59 million discrete net tax benefit in our 2017 financial statements. This net benefit is primarily comprised of a $1,311 million provisional deferred tax benefit from revaluing our net U.S. deferred tax liabilities to reflect the new U.S. corporate tax rate as well as an additional $61 million provisional deferred tax benefit related to changes in our indefinite reinvestment assertion, partially offset by a $1,317 million provisional charge for the estimated transition tax.
In general, the transition tax is as a result of the deemed repatriation imposed by the new legislation that results in the taxation of our accumulated foreign earnings and profits (“E&P”) at a 15.5% rate on liquid assets (i.e. cash and other specified assets) and 8% on the remaining unremitted foreign E&P, both net of foreign tax credits. At this time, we have not yet gathered, prepared and analyzed the necessary information in sufficient detail to complete the complex calculations necessary to finalize the amount of our transition tax. We believe that our provisional calculations result in a reasonable estimate of the transition tax and related foreign tax credit, and as such have included those amounts in our year-end income tax provision. We do not believe that it is more likely than not that we will realize the benefit of the estimated excess foreign tax credit carryforward created by the deemed repatriation and have thus recognized a full valuation allowance against this deferred tax asset. As we complete the analysis of accumulated foreign E&P and related foreign taxes paid on an entity by entity basis and finalize the amounts held in cash or other specified assets, we will update our provisional estimate of the transition tax and related foreign tax credit, including any excess credit carryforward and the corresponding valuation allowance.
Our estimate of the deferred tax benefit due to the revaluation of our net U.S. deferred tax liabilities is also a provisional amount under the SEC’s guidance. Due to the newly enacted U.S. tax rate change, timing differences that are estimated balances as of the date of enactment and year-end will result in changes to our estimate of the deferred rate change when those estimates are finalized with the filing of the 2017 income tax return. This is a result of the different federal income tax rates in effect for 2017 (35%) and 2018 (21%). Since many of the year-end deferred tax balances include estimates of events that have not yet occurred such as payments expected to be made during 2018 but which are deductible on the 2017 tax return, these amounts cannot yet be known to finalize the impact of the tax rate change.
As a result of U.S. tax reform, we have changed our indefinite reinvestment assertion for most companies owned directly by our U.S. subsidiaries, and as such, we may need to accrue deferred taxes. As of year end, we have calculated the impact to accrue the deferred tax assets related to two entities where the deferred tax benefits are now expected to be realized in the foreseeable future. However, we do not have the necessary information gathered, prepared and analyzed to make a reasonable estimate of the impact of any remaining outside basis differences inherent in the rest of our foreign subsidiaries. We will gather the information necessary and compute the outside basis differences for those subsidiaries where we are no longer indefinitely reinvested and record any new deferred taxes as reasonable estimates are available. We estimate that the unremitted earnings as of December 31, 2017 in those subsidiaries where we expect to continue to be indefinitely reinvested is approximately $2 billion. It is impracticable for us to determine the amount of unrecognized deferred tax liabilities on these indefinitely reinvested earnings. Future tax law changes or changes in the needs of our non-U.S. subsidiaries could require us to recognize deferred tax liabilities on a portion, or all, of our accumulated earnings that were previously expected to be indefinitely reinvested.
109
Table of Contents
The legislation also establishes new provisions that will affect our 2018 results, including but not limited to, a reduction in the U.S. corporate tax rate on domestic operations; the creation of a new minimum tax called the base erosion anti-abuse tax (BEAT); a new provision that taxes U.S. allocated expenses (e.g. interest and general administrative expenses) as well as currently taxes certain income from foreign operations (Global Intangible Low-Tax Income, or “GILTI”); a general elimination of U.S. federal income taxes on dividends from foreign subsidiaries; a new limitation on deductible interest expense; the repeal of the domestic manufacturing deduction; and limitations on the deductibility of certain employee compensation.
While the new legislation generally eliminates U.S. federal income tax on dividends from foreign subsidiaries going forward, certain income earned by certain subsidiaries must be included currently in our U.S. taxable income under the new GILTI inclusion rules (as a result of U.S. expense allocation rules). Because of the complexity of the new GILTI tax rules, we are continuing to evaluate this provision of the legislation and the application of U.S. GAAP. Under U.S. GAAP, we are allowed to make an accounting policy election and either treat taxes due from GILTI as a current-period expense when they are incurred or factor such amounts into our measurement of deferred taxes. Our selection of an accounting policy with respect to the new GILTI rules will depend in part on analyzing our global income to determine whether we expect to have future U.S. inclusions in taxable income related to GILTI, and if so, what the impact is expected to be. We have not yet computed a reasonable estimate of the effect of this provision, and therefore, we have not made a policy decision regarding whether to record deferred taxes related to GILTI nor have we made any adjustments related to GILTI tax in our year-end financial statements.
Earnings/(losses) from continuing operations before income taxes and the provision for income taxes consisted of:
| For the Years Ended December 31, | ||||||||||||
| 2017 | 2016 | 2015 | ||||||||||
| (in millions) | ||||||||||||
| Earnings/(losses) from continuing operations |
||||||||||||
| United States |
$ | 354 | $ | (364 | ) | $ | 43 | |||||
| Outside United States |
2,770 | 1,818 | 7,841 | |||||||||
|
|
|
|
|
|
|
|||||||
| Total |
$ | 3,124 | $ | 1,454 | $ | 7,884 | ||||||
|
|
|
|
|
|
|
|||||||
| Provision for income taxes: |
||||||||||||
| United States federal: |
||||||||||||
| Current |
$ | 1,322 | $ | (227 | ) | $ | (90 | ) | ||||
| Deferred |
(1,256 | ) | 141 | 136 | ||||||||
|
|
|
|
|
|
|
|||||||
| 66 | (86 | ) | 46 | |||||||||
| State and local: |
||||||||||||
| Current |
33 | 7 | 6 | |||||||||
| Deferred |
33 | 8 | (3 | ) | ||||||||
|
|
|
|
|
|
|
|||||||
| 66 | 15 | 3 | ||||||||||
|
|
|
|
|
|
|
|||||||
| Total United States |
132 | (71 | ) | 49 | ||||||||
|
|
|
|
|
|
|
|||||||
| Outside United States: |
||||||||||||
| Current |
541 | 490 | 707 | |||||||||
| Deferred |
15 | (290 | ) | (163 | ) | |||||||
|
|
|
|
|
|
|
|||||||
| Total outside United States |
556 | 200 | 544 | |||||||||
|
|
|
|
|
|
|
|||||||
| Total provision for income taxes |
$ | 688 | $ | 129 | $ | 593 | ||||||
|
|
|
|
|
|
|
|||||||
We recorded an out-of-period adjustment of $14 million net expense in 2015 that had an immaterial impact on the annual provision for income taxes.
110
Table of Contents
The effective income tax rate on pre-tax earnings differed from the U.S. federal statutory rate for the following reasons:
| For the Years Ended December 31, | ||||||||||||
| 2017 | 2016 | 2015 | ||||||||||
| U.S. federal statutory rate |
35.0% | 35.0% | 35.0% | |||||||||
| Increase/(decrease) resulting from: |
||||||||||||
| State and local income taxes, net of federal tax benefit |
0.8% | 0.8% | (0.1)% | |||||||||
| Foreign rate differences |
(10.8)% | (18.6)% | (2.5)% | |||||||||
| Changes in judgment on realizability of deferred tax assets |
3.2% | – | – | |||||||||
| Reversal of other tax accruals no longer required |
(1.7)% | (7.7)% | (1.4)% | |||||||||
| Tax accrual on investment in Keurig |
2.7% | 2.3% | – | |||||||||
| Excess tax benefits from equity compensation |
(1.2)% | – | – | |||||||||
| Tax legislation (non-U.S. tax reform) |
(2.7)% | (4.0)% | (0.5)% | |||||||||
| U.S. tax reform - deferred benefit from tax rate change |
(42.0)% | – | – | |||||||||
| U.S. tax reform - transition tax |
42.2% | – | – | |||||||||
| U.S. tax reform - changes in indefinite reinvestment assertion |
(2.0)% | – | – | |||||||||
| Gains on coffee business transactions and divestitures |
– | – | (26.9)% | |||||||||
| Business sales |
(0.9)% | – | – | |||||||||
| Loss on deconsolidation of Venezuela |
– | – | 3.5% | |||||||||
| Non-deductible expenses |
0.4% | 0.9% | 0.3% | |||||||||
| Other |
(1.0)% | 0.2% | 0.1% | |||||||||
|
|
|
|
|
|
|
|||||||
| Effective tax rate |
22.0% | 8.9% | 7.5% | |||||||||
|
|
|
|
|
|
|
|||||||
Our 2017 effective tax rate of 22.0% was favorably impacted by the mix of pre-tax income in various non-U.S. tax jurisdictions and net tax benefits from $117 million of discrete one-time events, partially offset by an increase in domestic earnings as compared to the prior year. The discrete net tax benefits included the provisional net impact from U.S. tax reform discussed previously, favorable audit settlements and statutes of limitations in various jurisdictions, and the net reduction of our French and Belgian deferred tax liabilities resulting from tax legislation enacted during 2017 that reduced the corporate income tax rates in each country, partially offset by the addition of a valuation allowance in one of our Chinese entities.
Our 2016 effective tax rate of 8.9% was favorably impacted by the mix of pre-tax income in various non-U.S. tax jurisdictions and net tax benefits from $161 million of discrete one-time events. The discrete net tax benefits related to favorable audit settlements and statutes of limitations in various jurisdictions and the net reduction of our U.K. and French deferred tax liabilities resulting from tax legislation enacted during 2016 that reduced the corporate income tax rates in each country.
Our 2015 effective tax rate of 7.5% was favorably impacted by the one-time third quarter sale of our coffee business that resulted in a pre-tax gain of $6,809 million and $184 million of related tax expense, as well as $27 million of tax costs incurred to remit proceeds up from lower-tier foreign subsidiaries to allow cash to be redeployed within our retained foreign operations. The benefit of the third quarter transaction was partially offset by the tax costs associated with the sale of our interest in AGF in the first half of the year and the impact of deconsolidating our Venezuelan operations on December 31, 2015. Excluding the impacts of these transactions, our effective tax rate would have been 17.8%, reflecting favorable impacts from the mix of pre-tax income in various non-U.S. tax jurisdictions and net tax benefits from $119 million of discrete one-time events. The remaining discrete one-time events primarily related to favorable tax audit settlements and expirations of statutes of limitations in several jurisdictions and the net reduction of U.K. deferred tax liabilities resulting from tax legislation enacted during 2015 that reduced the U.K. corporate income tax rate.
111
Table of Contents
The tax effects of temporary differences that gave rise to deferred income tax assets and liabilities consisted of the following:
| As of December 31, | ||||||||
| 2017 | 2016 | |||||||
| (in millions) | ||||||||
| Deferred income tax assets: |
||||||||
| Accrued postretirement and postemployment benefits |
$ | 191 | $ | 214 | ||||
| Accrued pension costs |
313 | 370 | ||||||
| Other employee benefits |
155 | 237 | ||||||
| Accrued expenses |
269 | 379 | ||||||
| Loss carryforwards |
773 | 619 | ||||||
| Tax credit carryforwards |
370 | — | ||||||
| Other |
342 | 331 | ||||||
|
|
|
|
|
|||||
| Total deferred income tax assets |
2,413 | 2,150 | ||||||
|
|
|
|
|
|||||
| Valuation allowance |
(853 | ) | (310 | ) | ||||
|
|
|
|
|
|||||
| Net deferred income tax assets |
$ | 1,560 | $ | 1,840 | ||||
|
|
|
|
|
|||||
| Deferred income tax liabilities: |
||||||||
| Intangible assets |
$ | (3,977 | ) | $ | (5,174 | ) | ||
| Property, plant and equipment |
(452 | ) | (557 | ) | ||||
| Other |
(188 | ) | (472 | ) | ||||
|
|
|
|
|
|||||
| Total deferred income tax liabilities |
(4,617 | ) | (6,203 | ) | ||||
|
|
|
|
|
|||||
| Net deferred income tax liabilities |
$ | (3,057 | ) | $ | (4,363 | ) | ||
|
|
|
|
|
|||||
Our significant valuation allowances are in the U.S., Mexico, China and Ireland. The U.S. valuation allowance relates to excess foreign tax credits generated by the deemed repatriation under U.S. tax reform. The valuation allowance in China results from a change in judgment as to the realizability of one of our Chinese entity’s deferred tax assets. The Mexico and Ireland valuation allowances relate to loss carryforwards where we do not currently expect to generate gains of the proper character to utilize the carryforwards in the future.
At December 31, 2017, the Company has pre-tax loss carryforwards of $4,060 million, of which $1,105 million will expire at various dates between 2018 and 2037 and the remaining $2,955 million can be carried forward indefinitely.
The changes in our unrecognized tax benefits were:
| For the Years Ended December 31, | ||||||||||||
| 2017 | 2016 | 2015 | ||||||||||
| (in millions) | ||||||||||||
| January 1 |
$ | 610 | $ | 756 | $ | 852 | ||||||
| Increases from positions taken during prior periods |
33 | 18 | 34 | |||||||||
| Decreases from positions taken during prior periods |
(93 | ) | (123 | ) | (74 | ) | ||||||
| Increases from positions taken during the current period |
64 | 90 | 84 | |||||||||
| Decreases relating to settlements with taxing authorities |
(54 | ) | (75 | ) | (13 | ) | ||||||
| Reductions resulting from the lapse of the applicable |
(29 | ) | (43 | ) | (41 | ) | ||||||
| Currency/other |
48 | (13 | ) | (86 | ) | |||||||
|
|
|
|
|
|
|
|||||||
| December 31 |
$ | 579 | $ | 610 | $ | 756 | ||||||
|
|
|
|
|
|
|
|||||||
112
Table of Contents
As of January 1, 2017, our unrecognized tax benefits were $610 million. If we had recognized all of these benefits, the net impact on our income tax provision would have been $549 million. Our unrecognized tax benefits were $579 million at December 31, 2017, and if we had recognized all of these benefits, the net impact on our income tax provision would have been $524 million. Within the next 12 months, our unrecognized tax benefits could increase by approximately $40 million due to unfavorable audit developments or decrease by approximately $150 million due to audit settlements and the expiration of statutes of limitations in various jurisdictions. We include accrued interest and penalties related to uncertain tax positions in our tax provision. We had accrued interest and penalties of $189 million as of January 1, 2017 and $212 million as of December 31, 2017. Our 2017 provision for income taxes included $26 million for interest and penalties.
Our income tax filings are regularly examined by federal, state and non-U.S. tax authorities. Our 2013-2015 U.S. federal income tax filings are currently under examination by the IRS. U.S. state and non-U.S. jurisdictions have statutes of limitations generally ranging from three to five years; however, these statutes are often extended by mutual agreement with the tax authorities. Years still open to examination by non-U.S. tax authorities in major jurisdictions include (earliest open tax year in parentheses): Brazil (2012), China (2007), France (2014), India (2005), Italy (2012) and the United Kingdom (2015).
Note 15. Earnings Per Share
Basic and diluted earnings per share (“EPS”) were calculated as follows:
| For the Years Ended December 31, | ||||||||||||
| 2017 | 2016 | 2015 | ||||||||||
| (in millions, except per share data) | ||||||||||||
| Net earnings |
$ | 2,936 | $ | 1,669 | $ | 7,291 | ||||||
| Noncontrolling interest (earnings) |
(14 | ) | (10 | ) | (24 | ) | ||||||
|
|
|
|
|
|
|
|||||||
| Net earnings attributable to Mondelēz International |
$ | 2,922 | $ | 1,659 | $ | 7,267 | ||||||
|
|
|
|
|
|
|
|||||||
| Weighted-average shares for basic EPS |
1,513 | 1,556 | 1,618 | |||||||||
| Plus incremental shares from assumed conversions of |
18 | 17 | 19 | |||||||||
|
|
|
|
|
|
|
|||||||
| Weighted-average shares for diluted EPS |
1,531 | 1,573 | 1,637 | |||||||||
|
|
|
|
|
|
|
|||||||
| Basic earnings per share attributable to |
$ | 1.93 | $ | 1.07 | $ | 4.49 | ||||||
|
|
|
|
|
|
|
|||||||
| Diluted earnings per share attributable to |
$ | 1.91 | $ | 1.05 | $ | 4.44 | ||||||
|
|
|
|
|
|
|
|||||||
We exclude antidilutive Mondelēz International stock options from our calculation of weighted-average shares for diluted EPS. We excluded antidilutive stock options of 8.5 million for the year ended December 31, 2017, 7.8 million for the year ended December 31, 2016 and 5.1 million for the year ended December 31, 2015.
Note 16. Segment Reporting
We manufacture and market primarily snack food products, including biscuits (cookies, crackers and salted snacks), chocolate, gum & candy and various cheese & grocery products, as well as powdered beverage products. We manage our global business and report operating results through geographic units.
Our operations and management structure are organized into four reportable operating segments:
| • | Latin America |
| • | AMEA |
| • | Europe |
| • | North America |
113
Table of Contents
On October 1, 2016, we integrated our EEMEA operating segment into our Europe and Asia Pacific operating segments to further leverage and optimize the operating scale built within the Europe and Asia Pacific regions. Russia, Ukraine, Turkey, Belarus, Georgia and Kazakhstan were combined within our Europe operating segment, while the remaining Middle East and African countries were combined within our Asia Pacific region to form the AMEA operating segment. We have reflected the segment change as if it had occurred in all periods presented.
We manage our operations by region to leverage regional operating scale, manage different and changing business environments more effectively and pursue growth opportunities as they arise in our key markets. Our regional management teams have responsibility for the business, product categories and financial results in the regions.
Historically, we have recorded income from equity method investments within our operating income as these investments were part of our base business. Beginning in the third quarter of 2015, to align with the accounting for our new coffee equity method investment in JDE, we began to record the earnings from our equity method investments in equity method investment earnings outside of segment operating income. For the six months ended December 31, 2015, after-tax equity method investment net earnings were less than $1 million on a combined basis. Earnings from equity method investments through July 2, 2015 recorded within segment operating income were $52 million in AMEA and $4 million in North America. See Note 1, Summary of Significant Accounting Policies – Principles of Consolidation, and Note 2, Divestitures and Acquisitions, for additional information.
In 2015, we also began to report stock-based compensation for our corporate employees within general corporate expenses that were reported within our North America region. We reclassified $32 million of corporate stock-based compensation expense in 2015 from the North America segment to general corporate expenses.
We use segment operating income to evaluate segment performance and allocate resources. We believe it is appropriate to disclose this measure to help investors analyze segment performance and trends. Segment operating income excludes unrealized gains and losses on hedging activities (which are a component of cost of sales), general corporate expenses (which are a component of selling, general and administrative expenses), amortization of intangibles, gains and losses on divestitures, loss on deconsolidation of Venezuela and acquisition-related costs (which are a component of selling, general and administrative expenses) in all periods presented. We exclude these items from segment operating income in order to provide better transparency of our segment operating results. Furthermore, we centrally manage interest and other expense, net. Accordingly, we do not present these items by segment because they are excluded from the segment profitability measure that management reviews.
Our segment net revenues and earnings, reflecting our current segment structure for all periods presented, were:
| For the Years Ended December 31, | ||||||||||||
| 2017 | 2016 | 2015 | ||||||||||
| (in millions) | ||||||||||||
| Net revenues: |
||||||||||||
| Latin America (1) |
$ | 3,566 | $ | 3,392 | $ | 4,988 | ||||||
| AMEA (2) |
5,739 | 5,816 | 6,002 | |||||||||
| Europe (2) |
9,794 | 9,755 | 11,672 | |||||||||
| North America |
6,797 | 6,960 | 6,974 | |||||||||
|
|
|
|
|
|
|
|||||||
| Net revenues |
$ | 25,896 | $ | 25,923 | $ | 29,636 | ||||||
|
|
|
|
|
|
|
|||||||
| (1) | Net revenues of $1,217 million for 2015 from our Venezuelan subsidiaries are included in our consolidated financial statements. Beginning in 2016, we account for our Venezuelan subsidiaries using the cost method of accounting and no longer include net revenues of our Venezuelan subsidiaries within our consolidated financial statements. Refer to Note 1, Summary of Significant Accounting Policies – Currency Translation and Highly Inflationary Accounting: Venezuela, for more information. |
| (2) | On July 2, 2015, we contributed our global coffee businesses primarily from our Europe and AMEA segments. Net revenues of our global coffee business were $1,561 million in Europe and $66 million in AMEA for the year ended December 31, 2015. Refer to Note 2, Divestitures and Acquisitions – JDE Coffee Business Transactions, for more information. |
114
Table of Contents
| For the Years Ended December 31, | ||||||||||||
| 2017 | 2016 | 2015 | ||||||||||
| (in millions) | ||||||||||||
| Earnings before income taxes: |
||||||||||||
| Operating income: |
||||||||||||
| Latin America |
$ | 565 | $ | 271 | $ | 485 | ||||||
| AMEA |
516 | 506 | 389 | |||||||||
| Europe |
1,680 | 1,267 | 1,350 | |||||||||
| North America |
1,120 | 1,078 | 1,105 | |||||||||
| Unrealized (losses)/gains on hedging activities |
(96 | ) | (94 | ) | 96 | |||||||
| General corporate expenses |
(287 | ) | (291 | ) | (383 | ) | ||||||
| Amortization of intangibles |
(178 | ) | (176 | ) | (181 | ) | ||||||
| Net gain on divestitures |
186 | 9 | 6,822 | |||||||||
| Loss on deconsolidation of Venezuela |
– | – | (778 | ) | ||||||||
| Acquisition-related costs |
– | (1 | ) | (8 | ) | |||||||
|
|
|
|
|
|
|
|||||||
| Operating income |
3,506 | 2,569 | 8,897 | |||||||||
| Interest and other expense, net |
(382 | ) | (1,115 | ) | (1,013 | ) | ||||||
|
|
|
|
|
|
|
|||||||
| Earnings before income taxes |
$ | 3,124 | $ | 1,454 | $ | 7,884 | ||||||
|
|
|
|
|
|
|
|||||||
No single customer accounted for 10% or more of our net revenues from continuing operations in 2017. Our five largest customers accounted for 15.6% and our ten largest customers accounted for 21.4% of net revenues from continuing operations in 2017.
Items impacting our segment operating results are discussed in Note 1, Summary of Significant Accounting Policies, including the Venezuela deconsolidation and currency devaluation, Note 2, Divestitures and Acquisitions, Note 4, Property, Plant and Equipment, Note 5, Goodwill and Intangible Assets, Note 6, 2014-2018 Restructuring Program and Note 12, Commitments and Contingencies. Also see Note 7, Debt and Borrowing Arrangements, and Note 8, Financial Instruments, for more information on our interest and other expense, net for each period.
Total assets, depreciation expense and capital expenditures by segment, reflecting our current segment structure for all periods presented, were:
| For the Years Ended December 31, | ||||||||||||
| 2017 | 2016 | 2015 | ||||||||||
| (in millions) |
||||||||||||
| Total assets: |
||||||||||||
| Latin America |
$ | 4,948 | $ | 5,156 | $ | 4,673 | ||||||
| AMEA |
9,883 | 10,031 | 10,460 | |||||||||
| Europe |
21,611 | 19,934 | 21,026 | |||||||||
| North America |
20,709 | 20,694 | 21,175 | |||||||||
| Equity method investments |
6,345 | 5,585 | 5,387 | |||||||||
| Unallocated assets and adjustments (1) |
(387 | ) | 138 | 122 | ||||||||
|
|
|
|
|
|
|
|||||||
| Total assets |
$ | 63,109 | $ | 61,538 | $ | 62,843 | ||||||
|
|
|
|
|
|
|
|||||||
| (1) | Unallocated assets consist primarily of cash and cash equivalents, deferred income taxes, centrally held property, plant and equipment, prepaid pension assets and derivative financial instrument balances. Final adjustments for jurisdictional netting of deferred tax assets and liabilities is done at a consolidated level. |
115
Table of Contents
| For the Years Ended December 31, | ||||||||||||
| 2017 | 2016 | 2015 | ||||||||||
| (in millions) |
||||||||||||
| Depreciation expense: |
||||||||||||
| Latin America |
$ | 107 | $ | 92 | $ | 94 | ||||||
| AMEA |
157 | 161 | 155 | |||||||||
| Europe |
239 | 253 | 299 | |||||||||
| North America |
135 | 141 | 165 | |||||||||
|
|
|
|
|
|
|
|||||||
| Total depreciation expense |
$ | 638 | $ | 647 | $ | 713 | ||||||
|
|
|
|
|
|
|
|||||||
| For the Years Ended December 31, | ||||||||||||
| 2017 | 2016 | 2015 | ||||||||||
| (in millions) |
||||||||||||
| Capital expenditures: |
||||||||||||
| Latin America |
$ | 226 | $ | 321 | $ | 354 | ||||||
| AMEA |
280 | 349 | 381 | |||||||||
| Europe |
278 | 294 | 517 | |||||||||
| North America |
230 | 260 | 262 | |||||||||
|
|
|
|
|
|
|
|||||||
| Total capital expenditures |
$ | 1,014 | $ | 1,224 | $ | 1,514 | ||||||
|
|
|
|
|
|
|
|||||||
Geographic data for net revenues (recognized in the countries where products are sold) and long-lived assets, excluding deferred tax, goodwill, intangible assets and equity method investments, were:
| For the Years Ended December 31, | ||||||||||||
| 2017 | 2016 | 2015 | ||||||||||
| (in millions) | ||||||||||||
| Net revenues: |
||||||||||||
| United States |
$ | 6,275 | $ | 6,329 | $ | 6,302 | ||||||
| Other |
19,621 | 19,594 | 23,334 | |||||||||
|
|
|
|
|
|
|
|||||||
| Total net revenues |
$ | 25,896 | $ | 25,923 | $ | 29,636 | ||||||
|
|
|
|
|
|
|
|||||||
| As of December 31, | ||||||||||||
| 2017 | 2016 | 2015 | ||||||||||
| (in millions) | ||||||||||||
| Long-lived assets: |
||||||||||||
| United States |
$ | 1,468 | $ | 1,508 | $ | 1,551 | ||||||
| Other |
7,733 | 7,229 | 7,238 | |||||||||
|
|
|
|
|
|
|
|||||||
| Total long-lived assets |
$ | 9,201 | $ | 8,737 | $ | 8,789 | ||||||
|
|
|
|
|
|
|
|||||||
No individual country within Other exceeded 10% of our net revenues or long-lived assets for all periods presented.
Net revenues by product category, reflecting our current segment structure for all periods presented, were:
| For the Year Ended December 31, 2017 | ||||||||||||||||||||
| Latin America (1) |
AMEA | Europe | North America |
Total (1) | ||||||||||||||||
| (in millions) | ||||||||||||||||||||
| Biscuits |
$ | 779 | $ | 1,634 | $ | 2,880 | $ | 5,479 | $ | 10,772 | ||||||||||
| Chocolate |
862 | 2,011 | 4,933 | 293 | 8,099 | |||||||||||||||
| Gum & Candy |
919 | 919 | 775 | 1,025 | 3,638 | |||||||||||||||
| Beverages |
665 | 569 | 121 | – | 1,355 | |||||||||||||||
| Cheese & Grocery |
341 | 606 | 1,085 | – | 2,032 | |||||||||||||||
|
|
|
|
|
|
|
|
|
|
|
|||||||||||
| Total net revenues |
$ | 3,566 | $ | 5,739 | $ | 9,794 | $ | 6,797 | $ | 25,896 | ||||||||||
|
|
|
|
|
|
|
|
|
|
|
|||||||||||
116
Table of Contents
| For the Year Ended December 31, 2016 | ||||||||||||||||||||
| Latin America (1) |
AMEA | Europe | North America |
Total (1) | ||||||||||||||||
| (in millions) | ||||||||||||||||||||
| Biscuits |
$ | 734 | $ | 1,588 | $ | 2,703 | $ | 5,565 | $ | 10,590 | ||||||||||
| Chocolate |
743 | 1,901 | 4,840 | 255 | 7,739 | |||||||||||||||
| Gum & Candy |
938 | 953 | 916 | 1,140 | 3,947 | |||||||||||||||
| Beverages |
657 | 611 | 177 | – | 1,445 | |||||||||||||||
| Cheese & Grocery |
320 | 763 | 1,119 | – | 2,202 | |||||||||||||||
|
|
|
|
|
|
|
|
|
|
|
|||||||||||
| Total net revenues |
$ | 3,392 | $ | 5,816 | $ | 9,755 | $ | 6,960 | $ | 25,923 | ||||||||||
|
|
|
|
|
|
|
|
|
|
|
|||||||||||
| For the Year Ended December 31, 2015 | ||||||||||||||||||||
| Latin America (1) |
AMEA | Europe (3) | North America |
Total (1) | ||||||||||||||||
| (in millions) | ||||||||||||||||||||
| Biscuits |
$ | 1,605 | $ | 1,539 | $ | 2,680 | $ | 5,569 | $ | 11,393 | ||||||||||
| Chocolate |
840 | 1,928 | 5,050 | 256 | 8,074 | |||||||||||||||
| Gum & Candy |
1,091 | 1,003 | 1,015 | 1,149 | 4,258 | |||||||||||||||
| Beverages (2) |
767 | 730 | 1,763 | – | 3,260 | |||||||||||||||
| Cheese & Grocery |
685 | 802 | 1,164 | – | 2,651 | |||||||||||||||
|
|
|
|
|
|
|
|
|
|
|
|||||||||||
| Total net revenues |
$ | 4,988 | $ | 6,002 | $ | 11,672 | $ | 6,974 | $ | 29,636 | ||||||||||
|
|
|
|
|
|
|
|
|
|
|
|||||||||||
| (1) | In 2015, our consolidated net revenues included Venezuela net revenues of $763 million in biscuits, $340 million in cheese & grocery, $66 million in gum & candy and $48 million in beverages. Following the deconsolidation of our Venezuela operations at the end of 2015, our 2016 and 2017 consolidated net revenues no longer include the net revenues of our Venezuelan subsidiaries. Refer to Note 1, Summary of Significant Accounting Policies – Currency Translation and Highly Inflationary Accounting: Venezuela, for more information. |
| (2) | On July 2, 2015, we contributed our global coffee businesses primarily from our Europe and AMEA segment beverage categories. Net revenues of our global coffee business were $1,561 million in Europe and $66 million in AMEA for the year ended December 31, 2015. Refer to Note 2, Divestitures and Acquisitions – JDE Coffee Business Transactions, for more information. |
| (3) | During 2016, we realigned some of our products across product categories primarily within our Europe segment and as such, we reclassified the product category net revenues on a basis consistent with the 2016 presentation. |
Note 17. Quarterly Financial Data (Unaudited)
Our summarized operating results by quarter are detailed below.
| 2017 Quarters | ||||||||||||||||
| First | Second | Third | Fourth | |||||||||||||
| (in millions, except per share data) | ||||||||||||||||
| Net revenues |
$ | 6,414 | $ | 5,986 | $ | 6,530 | $ | 6,966 | ||||||||
| Gross profit |
2,525 | 2,324 | 2,552 | 2,664 | ||||||||||||
| Provision for income taxes |
(154 | ) | (84 | ) | (272 | ) | (178 | ) | ||||||||
| Gain on equity method investment transactions |
– | – | – | 40 | ||||||||||||
| Equity method investment net earnings |
66 | 67 | 103 | 224 | ||||||||||||
| Net earnings (1) |
$ | 633 | $ | 500 | $ | 993 | $ | 810 | ||||||||
| Noncontrolling interest |
(3 | ) | (2 | ) | (1 | ) | (8 | ) | ||||||||
|
|
|
|
|
|
|
|
|
|||||||||
| Net earnings attributable to Mondelēz International |
$ | 630 | $ | 498 | $ | 992 | $ | 802 | ||||||||
|
|
|
|
|
|
|
|
|
|||||||||
| Weighted-average shares for basic EPS |
1,529 | 1,519 | 1,507 | 1,497 | ||||||||||||
| Plus incremental shares from assumed conversions of |
21 | 20 | 17 | 16 | ||||||||||||
|
|
|
|
|
|
|
|
|
|||||||||
| Weighted-average shares for diluted EPS |
1,550 | 1,539 | 1,524 | 1,513 | ||||||||||||
|
|
|
|
|
|
|
|
|
|||||||||
| Per share data: |
||||||||||||||||
| Basic EPS attributable to Mondelēz International: |
$ | 0.41 | $ | 0.33 | $ | 0.66 | $ | 0.54 | ||||||||
|
|
|
|
|
|
|
|
|
|||||||||
| Diluted EPS attributable to Mondelēz International: |
$ | 0.41 | $ | 0.32 | $ | 0.65 | $ | 0.53 | ||||||||
|
|
|
|
|
|
|
|
|
|||||||||
| Dividends declared |
$ | 0.19 | $ | 0.19 | $ | 0.22 | $ | 0.22 | ||||||||
| Market price - high |
$ | 45.48 | $ | 47.23 | $ | 44.48 | $ | 43.98 | ||||||||
| - low |
$ | 41.30 | $ | 42.92 | $ | 40.04 | $ | 39.19 | ||||||||
117
Table of Contents
| 2016 Quarters | ||||||||||||||||
| First | Second | Third | Fourth | |||||||||||||
| (in millions, except per share data) | ||||||||||||||||
| Net revenues |
$ | 6,455 | $ | 6,302 | $ | 6,396 | $ | 6,770 | ||||||||
| Gross profit |
2,535 | 2,516 | 2,488 | 2,589 | ||||||||||||
| Provision for income taxes |
(49 | ) | (118 | ) | (40 | ) | 78 | |||||||||
| Gain on equity method investment transactions |
43 | – | – | – | ||||||||||||
| Equity method investment net earnings |
85 | 102 | 31 | 83 | ||||||||||||
| Net earnings (1) |
$ | 557 | $ | 471 | $ | 548 | $ | 93 | ||||||||
| Noncontrolling interest |
(3 | ) | (7 | ) | – | – | ||||||||||
|
|
|
|
|
|
|
|
|
|||||||||
| Net earnings attributable to Mondelēz International |
$ | 554 | $ | 464 | $ | 548 | $ | 93 | ||||||||
|
|
|
|
|
|
|
|
|
|||||||||
| Weighted-average shares for basic EPS |
1,569 | 1,557 | 1,557 | 1,540 | ||||||||||||
| Plus incremental shares from assumed conversions of |
18 | 19 | 19 | 19 | ||||||||||||
|
|
|
|
|
|
|
|
|
|||||||||
| Weighted-average shares for diluted EPS |
1,587 | 1,576 | 1,576 | 1,559 | ||||||||||||
|
|
|
|
|
|
|
|
|
|||||||||
| Per share data: |
||||||||||||||||
| Basic EPS attributable to Mondelēz International: |
$ | 0.35 | $ | 0.30 | $ | 0.35 | $ | 0.06 | ||||||||
|
|
|
|
|
|
|
|
|
|||||||||
| Diluted EPS attributable to Mondelēz International: |
$ | 0.35 | $ | 0.29 | $ | 0.35 | $ | 0.06 | ||||||||
|
|
|
|
|
|
|
|
|
|||||||||
| Dividends declared |
$ | 0.17 | $ | 0.17 | $ | 0.19 | $ | 0.19 | ||||||||
| Market price - high |
$ | 44.45 | $ | 45.75 | $ | 46.36 | $ | 46.40 | ||||||||
| - low |
$ | 35.88 | $ | 39.53 | $ | 41.96 | $ | 40.50 | ||||||||
| (1) | See the following table for significant items that affected the comparability of earnings each quarter. |
Basic and diluted EPS are computed independently for each of the periods presented. Accordingly, the sum of the quarterly EPS amounts may not equal the total for the year.
During 2017 and 2016, we recorded the following pre-tax (charges)/gains in earnings from continuing operations:
| 2017 Quarters | ||||||||||||||||
| First | Second | Third | Fourth | |||||||||||||
| (in millions) | ||||||||||||||||
| Asset impairment and exit costs |
$ | (166 | ) | $ | (187 | ) | $ | (183 | ) | $ | (120 | ) | ||||
| Net gain on divestitures |
– | (3 | ) | 187 | 2 | |||||||||||
| Divestiture-related costs |
(19 | ) | (9 | ) | 2 | (8 | ) | |||||||||
| Loss on early extinguishment of |
– | (11 | ) | – | – | |||||||||||
| Benefits from the resolution of tax matters |
58 | – | 215 | 8 | ||||||||||||
|
|
|
|
|
|
|
|
|
|||||||||
| $ | (127 | ) | $ | (210 | ) | $ | 221 | $ | (118 | ) | ||||||
|
|
|
|
|
|
|
|
|
|||||||||
| 2016 Quarters | ||||||||||||||||
| First | Second | Third | Fourth | |||||||||||||
| (in millions) | ||||||||||||||||
| Asset impairment and exit costs |
$ | (154 | ) | $ | (166 | ) | $ | (190 | ) | $ | (342 | ) | ||||
| Divestiture-related costs |
– | (84 | ) | – | (2 | ) | ||||||||||
| Loss related to interest rate swaps |
(97 | ) | – | – | – | |||||||||||
| Loss on early extinguishment of |
– | – | – | (427 | ) | |||||||||||
|
|
|
|
|
|
|
|
|
|||||||||
| $ | (251 | ) | $ | (250 | ) | $ | (190 | ) | $ | (771 | ) | |||||
|
|
|
|
|
|
|
|
|
|||||||||
Items impacting our operating results are discussed in Note 1, Summary of Significant Accounting Policies, including the Venezuela deconsolidation and currency devaluations, Note 2, Divestitures and Acquisitions, Note 5, Goodwill and Intangible Assets, Note 6, 2014-2018 Restructuring Program, and Note 7, Debt and Borrowing Arrangements.
118
Table of Contents
Item 9. Changes in and Disagreements with Accountants on Accounting and Financial Disclosure.
None.
Item 9A. Controls and Procedures.
Evaluation of Disclosure Controls and Procedures
We have established disclosure controls and procedures that are designed to ensure that information required to be disclosed in our reports filed or submitted under the Exchange Act is recorded, processed, summarized and reported within the time periods specified in the rules and forms of the SEC, and such information is accumulated and communicated to our management, including our Chief Executive Officer (“CEO”) and Chief Financial Officer (“CFO”), as appropriate to allow timely decisions regarding required disclosure. Management, together with our CEO and CFO, evaluated the effectiveness of the Company’s disclosure controls and procedures as of December 31, 2017. Based on this evaluation, the CEO and CFO concluded that our disclosure controls and procedures were effective as of December 31, 2017.
Report of Management on Internal Control Over Financial Reporting
Management is responsible for establishing and maintaining adequate internal control over financial reporting as defined in Rules 13a-15(f) and 15d-15(f) under the Exchange Act. Our internal control over financial reporting is a process designed by, or under the supervision of, our CEO and CFO, or persons performing similar functions, and effected by the Company’s Board of Directors, management and other personnel to provide reasonable assurance regarding the reliability of financial reporting and the preparation of financial statements for external purposes in accordance with generally accepted accounting principles. Our internal control over financial reporting includes those written policies and procedures that:
| • | pertain to the maintenance of records that, in reasonable detail, accurately and fairly reflect the transactions and dispositions of assets; |
| • | provide reasonable assurance that transactions are recorded as necessary to permit preparation of financial statements in accordance with generally accepted accounting principles; |
| • | provide reasonable assurance that receipts and expenditures are being made only in accordance with management and director authorization; and |
| • | provide reasonable assurance regarding prevention or timely detection of unauthorized acquisition, use or disposition of assets that could have a material effect on the consolidated financial statements. |
Because of its inherent limitations, internal control over financial reporting may not prevent or detect misstatements. Also, projections of any evaluation of effectiveness to future periods are subject to the risk that controls may become inadequate because of changes in conditions, or that the degree of compliance with the policies or procedures may deteriorate.
Management assessed the effectiveness of our internal control over financial reporting as of December 31, 2017. Management based this assessment on criteria for effective internal control over financial reporting described in Internal Control Integrated Framework (2013) issued by the Committee of Sponsoring Organizations of the Treadway Commission (“COSO”).
Based on this assessment, management concluded that the Company’s internal control over financial reporting is effective as of December 31, 2017, based on the criteria in Internal Control Integrated Framework issued by the COSO.
PricewaterhouseCoopers LLP, an independent registered public accounting firm, has audited the effectiveness of our internal control over financial reporting as of December 31, 2017, as stated in their report that appears under Item 8.
February 9, 2018
119
Table of Contents
Changes in Internal Control Over Financial Reporting
Management, together with our CEO and CFO, evaluated the changes in our internal control over financial reporting during the quarter ended December 31, 2017. During the fourth quarter of 2017, due to the malware incident, we continued to add supplemental information technology and internal controls over financial reporting. Additionally, we continued to work with outsourced partners to further simplify and standardize processes and focus on scalable, transactional processes across all regions. We continued to transition some of our transactional data processing as well as financial and employee services for a number of countries across Europe and AMEA to three outsourced partners and/or internal service centers. Pursuant to our service agreements, the controls previously established around these accounting functions will be maintained by our outsourced partners or by us, and they are subject to management’s internal control testing. There were no other changes in our internal control over financial reporting during the quarter ended December 31, 2017, that have materially affected, or are reasonably likely to materially affect, our internal control over financial reporting.
None.
120
Table of Contents
Item 10. Directors, Executive Officers and Corporate Governance.
Information required by this Item 10 is included under the heading “Executive Officers of the Registrant” in Part I, Item 1 of this Form 10-K, as well as under the headings “Election of Directors,” “Corporate Governance – Governance Guidelines,” “Corporate Governance – Codes of Conduct,” “Board Committees and Membership – Audit Committee” and “Ownership of Equity Securities – Section 16(a) Beneficial Ownership Reporting Compliance” in our definitive Proxy Statement for our Annual Meeting of Shareholders scheduled to be held on May 16, 2018 (“2018 Proxy Statement”). All of this information from the 2018 Proxy Statement is incorporated by reference into this Annual Report.
The information on our web site is not, and shall not be deemed to be, a part of this Annual Report or incorporated into any other filings we make with the SEC.
Item 11. Executive Compensation.
Information required by this Item 11 is included under the headings “Board Committees and Membership – Human Resources and Compensation Committee,” “Compensation of Non-Employee Directors,” “Compensation Discussion and Analysis,” “Executive Compensation Tables” and “Human Resources and Compensation Committee Report for the Year Ended December 31, 2017” in our 2018 Proxy Statement. All of this information is incorporated by reference into this Annual Report.
Item 12. Security Ownership of Certain Beneficial Owners and Management and Related Stockholder Matters.
The number of shares to be issued upon exercise or vesting of grants issued under, and the number of shares remaining available for future issuance under, our equity compensation plans at December 31, 2017 were:
Equity Compensation Plan Information
| Number of Securities | ||||||||||||
| Remaining Available for | ||||||||||||
| Number of Securities to | Future Issuance under | |||||||||||
| be Issued Upon Exercise | Weighted Average | Equity Compensation | ||||||||||
| of Outstanding | Exercise Price of | Plans (excluding | ||||||||||
| Options, Warrants | Outstanding Options, | securities reflected | ||||||||||
| and Rights (1) | Warrants and Rights (2) | in column (a)) (3) | ||||||||||
| (a) | (b) | (c) | ||||||||||
| Equity compensation plans |
55,850,812 | $ | 29.92 | 67,170,082 | ||||||||
|
|
|
|
|
|
|
|||||||
| (1) | Includes outstanding options, deferred stock and performance share units and excludes restricted stock. |
| (2) | Weighted average exercise price of outstanding options only. |
| (3) | Shares available for grant under our Amended and Restated 2005 Performance Incentive Plan. |
Information related to the security ownership of certain beneficial owners and management is included in our 2018 Proxy Statement under the heading “Ownership of Equity Securities” and is incorporated by reference into this Annual Report.
Item 13. Certain Relationships and Related Transactions, and Director Independence.
Information required by this Item 13 is included under the headings “Corporate Governance – Director Independence” and “Corporate Governance – Review of Transactions with Related Persons” in our 2018 Proxy Statement. All of this information is incorporated by reference into this Annual Report.
Item 14. Principal Accountant Fees and Services.
Information required by this Item 14 is included under the heading “Board Committees and Membership – Audit Committee” in our 2018 Proxy Statement. All of this information is incorporated by reference into this Annual Report.
121
Table of Contents
Item 15. Exhibits and Financial Statement Schedules.
| (a) | Index to Consolidated Financial Statements and Schedules |
Schedules other than those listed above have been omitted either because such schedules are not required or are not applicable.
| (b) | The following exhibits are filed as part of, or incorporated by reference into, this Annual Report: |
122
Table of Contents
123
Table of Contents
124
Table of Contents
125
Table of Contents
| * | Upon request, Mondelēz International, Inc. agrees to furnish to the U.S. Securities and Exchange Commission, on a supplemental basis, a copy of any omitted schedule or exhibit to such agreement. |
| ** | Portions of this exhibit (indicated by asterisks) have been omitted pursuant to a request for confidential treatment and have been separately filed with the SEC. |
| + | Indicates a management contract or compensatory plan or arrangement. |
Not applicable.
126
Table of Contents
Pursuant to the requirements of Section 13 or 15(d) of the Securities Exchange Act of 1934, the registrant has duly caused this report to be signed on its behalf by the undersigned, thereunto duly authorized.
| MONDELĒZ INTERNATIONAL, INC. | ||
| By: | /s/ BRIAN T. GLADDEN | |
| (Brian T. Gladden | ||
| Executive Vice President | ||
| and Chief Financial Officer) | ||
Date: February 9, 2018
Pursuant to the requirements of the Securities Exchange Act of 1934, this report has been signed below by the following persons on behalf of the registrant and in the capacities and on the dates indicated:
| Signature |
Title |
Date | ||
| /s/ DIRK VAN DE PUT (Dirk Van de Put) |
Director and |
February 9, 2018 | ||
| /s/ BRIAN T. GLADDEN (Brian T. Gladden) |
Executive Vice President and Chief Financial Officer |
February 9, 2018 | ||
| /s/ NELSON URDANETA (Nelson Urdaneta) |
Vice President, Corporate Controller and Chief Accounting Officer |
February 9, 2018 | ||
| /s/ IRENE B. ROSENFELD |
Chairman of the Board of Directors |
February 9, 2018 | ||
| (Irene B. Rosenfeld) | ||||
| /s/ LEWIS W.K. BOOTH (Lewis W.K. Booth) |
Director |
February 9, 2018 | ||
| /s/ CHARLES E. BUNCH (Charles E. Bunch) |
Director |
February 9, 2018 | ||
| /s/ LOIS D. JULIBER (Lois D. Juliber) |
Director |
February 9, 2018 | ||
| /s/ MARK D. KETCHUM (Mark D. Ketchum) |
Director |
February 9, 2018 | ||
| /s/ JORGE S. MESQUITA (Jorge S. Mesquita) |
Director |
February 9, 2018 | ||
| /s/ JOSEPH NEUBAUER (Joseph Neubauer) |
Director |
February 9, 2018 | ||
| /s/ NELSON PELTZ (Nelson Peltz) |
Director |
February 9, 2018 | ||
| /s/ FREDRIC G. REYNOLDS (Fredric G. Reynolds) |
Director |
February 9, 2018 | ||
| /s/ CHRISTIANA S. SHI (Christiana S. Shi) |
Director |
February 9, 2018 | ||
| /s/ PATRICK T. SIEWERT (Patrick T. Siewert) |
Director |
February 9, 2018 | ||
| /s/ JEAN-FRANÇOIS M. L. VAN BOXMEER (Jean-François M. L. van Boxmeer) |
Director |
February 9, 2018 | ||
127
Table of Contents
Mondelēz International, Inc. and Subsidiaries
Valuation and Qualifying Accounts
For the Years Ended December 31, 2017, 2016 and 2015
(in millions)
| Col. A |
Col. B | Col. C | Col. D | Col. E | ||||||||||||||||
| Additions | ||||||||||||||||||||
| Balance at | Charged to | Charged to | Balance at | |||||||||||||||||
| Beginning | Costs and | Other | End of | |||||||||||||||||
| Description |
of Period | Expenses | Accounts | Deductions | Period | |||||||||||||||
| (a) | (b) | |||||||||||||||||||
| 2017: |
||||||||||||||||||||
| Allowance for trade receivables |
$ | 58 | $ | 21 | $ | (8 | ) | $ | 21 | $ | 50 | |||||||||
| Allowance for other current receivables |
93 | 6 | 6 | 7 | 98 | |||||||||||||||
| Allowance for long-term receivables |
20 | (1 | ) | 3 | 1 | 21 | ||||||||||||||
| Allowance for deferred taxes |
310 | 549 | 25 | 31 | 853 | |||||||||||||||
|
|
|
|
|
|
|
|
|
|
|
|||||||||||
| $ | 481 | $ | 575 | $ | 26 | $ | 60 | $ | 1,022 | |||||||||||
|
|
|
|
|
|
|
|
|
|
|
|||||||||||
| 2016: |
||||||||||||||||||||
| Allowance for trade receivables |
$ | 54 | $ | 18 | $ | (1 | ) | $ | 13 | $ | 58 | |||||||||
| Allowance for other current receivables |
109 | (2 | ) | (13 | ) | 1 | 93 | |||||||||||||
| Allowance for long-term receivables |
16 | 1 | 3 | – | 20 | |||||||||||||||
| Allowance for deferred taxes |
303 | 67 | (28 | ) | 32 | 310 | ||||||||||||||
|
|
|
|
|
|
|
|
|
|
|
|||||||||||
| $ | 482 | $ | 84 | $ | (39 | ) | $ | 46 | $ | 481 | ||||||||||
|
|
|
|
|
|
|
|
|
|
|
|||||||||||
| 2015: |
||||||||||||||||||||
| Allowance for trade receivables |
$ | 66 | $ | 14 | $ | (11 | ) | $ | 15 | $ | 54 | |||||||||
| Allowance for other current receivables |
91 | 12 | 7 | 1 | 109 | |||||||||||||||
| Allowance for long-term receivables |
14 | 5 | (3 | ) | – | 16 | ||||||||||||||
| Allowance for deferred taxes |
345 | 46 | (35 | ) | 53 | 303 | ||||||||||||||
|
|
|
|
|
|
|
|
|
|
|
|||||||||||
| $ | 516 | $ | 77 | $ | (42 | ) | $ | 69 | $ | 482 | ||||||||||
|
|
|
|
|
|
|
|
|
|
|
|||||||||||
Notes:
| (a) | Primarily related to divestitures, acquisitions and currency translation. |
| (b) | Represents charges for which allowances were created. |
S-1