Attached files
| file | filename |
|---|---|
| 8-K - FORM 8-K - KLONDEX MINES LTD | form8k.htm |
![]()
| Page 2 | Summary | Klondex Mines Ltd. |
This page intentionally left blank.
| Practical Mining LLC | February 5, 2018 |
| Klondex Mines Ltd | Technical Report for the Fire Creek Project, | Page 3 |
| Lander County, Nevada |
Date and Signature Page
The undersigned prepared this Technical Report (Technical Report) report, titled: Technical Report for the Fire Creek Project, Lander County, Nevada, dated the 5th day of February 2018, with an effective date of November 30, 2017, in support of the public disclosure of Mineral Resource and Mineral Reserve estimates for the Fire Creek Project. The format and content of the Technical Report have been prepared in accordance with Form 43-101F1 of National Instrument 43-101 – Standards of Disclosure for Mineral Projects of the Canadian Securities Administrators.
Dated this 5th day of February 2018
| Signed “Mark Odell” | No. 13708, Nevada |
| Mark Odell, P.E | SME No. 2402150 |
| Practical Mining LLC | (Sealed) |
| 495 Idaho Street, Suite 205 | |
| Elko, Nevada 89815, USA | |
| (775) 345-3718 ext. 101 | |
| Email: markodell@practicalmining.com | |
| Signed “Laura Symmes” | SME No. 4196936 |
| Laura Symmes | (Sealed) |
| Practical Mining LLC | |
| 495 Idaho Street, Suite 205 | |
| Elko, Nevada 89815, USA | |
| (775) 345-3718 ext. 102 | |
| Email: laurasymmes@practicalmining.com | |
| Signed “Sarah Bull” | No. 22797, Nevada |
| Sarah Bull, P.E | (Sealed) |
| Practical Mining LLC | |
| 495 Idaho Street, Suite 205 | |
| Elko, Nevada 89815, USA | |
| 775-345-3718 ext. 502 | |
| Email: sarahbull@practicalmining.com | |
| Signed “Adam Knight” | No. 15796, Nevada |
| Adam Knight, P.E | (Sealed) |
| Practical Mining LLC | |
| 495 Idaho Street, Suite 205 | |
| Elko, Nevada 89815, USA | |
| 775-345-3718 ext. 503 | |
| Email: adamknight@practicalmining.com |
| Practical Mining LLC | February 5, 2018 |
| Page 4 | Summary | Klondex Mines Ltd. |
Table of Contents
| Date and Signature Page | 3 | ||
| List of Tables | 10 | ||
| List of Figures | 12 | ||
| List of Abbreviations | 16 | ||
| 1. | Summary | 17 | |
| 1.1. | Property Description | 17 | |
| 1.2. | Geology | 17 | |
| 1.3. | History | 18 | |
| 1.4. | Mineral Resource Estimate | 18 | |
| 1.5. | Mineral Reserve Estimate | 26 | |
| 1.6. | Cash Flow Analysis and Economics | 27 | |
| 1.7. | Conclusions | 28 | |
| 1.8. | Recommendations | 29 | |
| 2. | Introduction | 30 | |
| 2.1. | Terms of Reference and Purpose of this Technical Report | 30 | |
| 2.2. | Qualification of the Authors | 30 | |
| 2.3. | Sources of Information | 31 | |
| 2.4. | Units of Measure | 31 | |
| 2.5. | Coordinate Datum | 32 | |
| 3. | Reliance on Other Experts | 33 | |
| 4. | Property Description and Location | 34 | |
| 4.1. | Property Description | 34 | |
| 4.2. | Property Location | 34 | |
| 4.3. | Status of Mineral Titles | 36 | |
| 4.4. | Location of Mineralization | 44 | |
| 5. | Accessibility, Climate, Vegetation, Physiography, Local Resources and Infrastructure | 47 | |
| 5.1. | Access to Project | 47 | |
| 5.2. | Climate | 47 | |
| 5.3. | Vegetation | 47 | |
| Practical Mining LLC | February 5, 2018 |
| Klondex Mines Ltd | Technical Report for the Fire Creek Project, | Page 5 |
| Lander County, Nevada |
| 5.4. | Physiography | 47 | ||
| 5.5. | Local Resources and Infrastructure | 48 | ||
| 6. | History | 49 | ||
| 6.1. | Exploration History | 49 | ||
| 6.2. | Historical Mining | 50 | ||
| 7. | Geological Setting and Mineralization | 51 | ||
| 7.1. | Regional Geology | 51 | ||
| 7.2. | Local Geology | 58 | ||
| 7.2.1. | Rock Units | 58 | ||
| 7.2.2. | Structure | 63 | ||
| 7.2.3. | Veins | 66 | ||
| 7.2.4. | Alteration | 68 | ||
| 7.2.5. | Mineralization | 70 | ||
| 8. | Deposit Types | 73 | ||
| 9. | Exploration | 75 | ||
| 9.1. | Historical Exploration | 75 | ||
| 9.2. | 2011 Drilling | 75 | ||
| 9.3. | 2012 Drilling | 77 | ||
| 9.4. | 2013 Drilling | 77 | ||
| 9.5. | 2014 Drilling | 77 | ||
| 9.6. | 2015 Drilling | 82 | ||
| 9.7. | 2016 Drilling | 82 | ||
| 9.8. | 2017 Drilling | 85 | ||
| 10. | Drilling and Sampling Methodology | 87 | ||
| 10.1. | Drilling Procedures | 89 | ||
| 10.1.1. | Drilling Procedures from 2004 through 2010 | 89 | ||
| 10.1.2. | Current Drilling Procedures | 90 | ||
| 10.2. | Collar Surveying | 91 | ||
| 10.2.1. | Surveying Surface Drill Collar Locations | 92 | ||
| Practical Mining LLC | February 5, 2018 |
| Page 6 | Summary | Klondex Mines Ltd. |
| 10.2.2. | Surveying Underground Drill Collar Locations | 93 | ||
| 10.3. | Downhole Surveying | 94 | ||
| 10.4. | Core Recovery | 94 | ||
| 10.5. | Logging Drilled Core Observations | 95 | ||
| 10.5.1. | Current Logging Protocol | 95 | ||
| 10.5.2. | Historic Logging Protocol | 95 | ||
| 10.5.3. | Re-logging Protocol for 2012-2013 | 96 | ||
| 10.6. | Core Sampling Methodology | 98 | ||
| 10.7. | RC Sampling Methodology | 99 | ||
| 10.8. | Channel Sampling Procedures | 99 | ||
| 10.8.1. | Channel Sampling | 100 | ||
| 10.8.2. | Procedures for Accurately Locating Channel Samples | 101 | ||
| 10.9. | Security Procedures | 103 | ||
| 11. | Sample Preparation, Analysis, and Security | 105 | ||
| 11.1. | Historic Sample Preparation | 105 | ||
| 11.2. | Current Sample Preparation | 106 | ||
| 11.2.1. | Core Sample Preparation | 106 | ||
| 11.2.2. | Channel Sample Preparation | 106 | ||
| 11.3. | Sample Analysis Protocol | 107 | ||
| 11.3.1. | Historic Drill Sample Analysis | 107 | ||
| 11.3.2. | Drill Sample Analysis from 2012 through April 30, 2014 | 108 | ||
| 11.3.3. | Current Drill Sample Analysis | 108 | ||
| 11.3.4. | Channel Sample Analysis | 109 | ||
| 11.3.5. | Handling Analyses Results | 111 | ||
| 11.4. | Sample Security Measures | 112 | ||
| 11.5. | Quality Control Measures | 112 | ||
| 11.5.1. | QAQC Prior to 2012 | 113 | ||
| 11.5.2. | Current QAQC Procedures | 116 | ||
| 11.6. | QAQC Analysis | 118 | ||
| 11.6.1. | Duplicate Performance- Accuracy | 118 | ||
| Practical Mining LLC | February 5, 2018 |
| Klondex Mines Ltd | Technical Report for the Fire Creek Project, | Page 7 |
| Lander County, Nevada |
| 11.6.2. | Duplicate Performance - Precision | 118 | ||
| 11.6.3. | Blank Assay Performance | 120 | ||
| 11.6.4. | Standards Performance | 122 | ||
| 11.7. | Opinion on the Adequacy of the Sampling Methodologies | 125 | ||
| 11.7.1. | Sampling Protocol Issues | 125 | ||
| 11.7.2. | Standards and Blanks Performance Issues | 126 | ||
| 12. | Data Verification | 127 | ||
| 12.1. | Results of Drill Data Review | 127 | ||
| 12.1.1. | Downhole Survey Checks | 128 | ||
| 12.1.2. | Geology Checks | 129 | ||
| 12.1.3. | Assay Checks | 129 | ||
| 12.2. | Results of Channel Sample Data Review | 129 | ||
| 12.2.1. | Location Measurement Check | 129 | ||
| 12.2.2. | Geology Check | 130 | ||
| 12.2.3. | Assay Check | 130 | ||
| 12.3. | Summary of Database Verification | 130 | ||
| 13. | Mineral Processing and Metallurgical Testing | 132 | ||
| 13.1. | Early Test Work | 132 | ||
| 13.2. | 2013 Test Work | 132 | ||
| 13.3. | 2014 Test Work | 133 | ||
| 13.4. | 2017 Test Work | 136 | ||
| 14. | Mineral Resource Estimates | 138 | ||
| 14.1. | Introduction | 138 | ||
| 14.2. | Database and Compositing | 138 | ||
| 14.2.1. | Assays | 139 | ||
| 14.2.2. | Lithology | 142 | ||
| 14.2.3. | Compositing | 143 | ||
| 14.3. | Geology and Modelling | 143 | ||
| 14.4. | Density | 153 | ||
| Practical Mining LLC | February 5, 2018 |
| Page 8 | Summary | Klondex Mines Ltd. |
| 14.5. | Statistics | 154 | ||
| 14.6. | Grade Capping | 162 | ||
| 14.7. | Variography | 169 | ||
| 14.8. | Block Model | 174 | ||
| 14.9. | Grade Estimation | 178 | ||
| 14.9.1. | Void Percentage | 180 | ||
| 14.9.2. | Minability Index | 181 | ||
| 14.10. | Mined Depletion and Sterilization | 185 | ||
| 14.11. | Model Validation | 187 | ||
| 14.11.1. | Model Smoothing Checks – Grade Tonnage Curves | 207 | ||
| 14.12. | Mineral Resource Statement | 210 | ||
| 14.12.1. | Underground Mineral Resources | 210 | ||
| 14.12.2. | Open Pit Mineral Resources | 215 | ||
| 15. | Mineral Reserve Estimates | 217 | ||
| 16. | Mining Methods | 221 | ||
| 16.1. | Mine Development | 221 | ||
| 16.1.1. | Access Development | 221 | ||
| 16.1.2. | Ground Support | 221 | ||
| 16.1.3. | Ventilation and Secondary Egress | 222 | ||
| 16.2. | Mining Methods | 222 | ||
| 16.2.1. | End Slice Stoping | 222 | ||
| 16.2.2. | Drift and Fill Stoping | 224 | ||
| 16.2.3. | Cut-and-Fill Stoping | 225 | ||
| 16.2.4. | Backstoping | 225 | ||
| 16.3. | Underground Labor | 226 | ||
| 16.4. | Mobile Equipment Fleet | 226 | ||
| 16.5. | Mine Plan | 227 | ||
| 17. | Recovery Methods | 231 | ||
| 17.1. | Mill Capacity and Process Facility Flow Diagram | 231 | ||
| 17.2. | Physical Mill Equipment | 235 | ||
| Practical Mining LLC | February 5, 2018 |
| Klondex Mines Ltd | Technical Report for the Fire Creek Project, | Page 9 |
| Lander County, Nevada |
| 17.3. | Operation and Recoveries | 238 | |
| 17.4. | Tailings Storage Capacity | 238 | |
| 17.5. | Processing Costs | 239 | |
| 17.6. | Production | 239 | |
| 17.7. | Midas Mill Operating Permits | 240 | |
| 18. | Project Infrastructure | 241 | |
| 18.1. | Road Access | 241 | |
| 18.2. | Power and Electrical Infrastructure | 241 | |
| 18.3. | Water Management and Water Treatment | 241 | |
| 18.4. | Communication Infrastructure | 242 | |
| 18.5. | Site Infrastructure | 242 | |
| 19. | Market Studies and Contracts | 244 | |
| 19.1. | Precious Metal Markets | 244 | |
| 19.2. | Contracts | 244 | |
| 19.3. | Project Financing | 245 | |
| 20. | Environmental Studies, Permitting and Social or Community Impact | 246 | |
| 20.1. | Environmental Compliance and Monitoring | 246 | |
| 20.2. | Reclamation Bond Estimate | 246 | |
| 20.3. | Major Permitting and Approvals | 247 | |
| 21. | Capital and Operating Costs | 248 | |
| 21.1. | Capital Costs | 248 | |
| 21.2. | Operating Costs and Cutoff Grade | 248 | |
| 22. | Economic Analysis | 251 | |
| 22.1. | Life of Mine Plan and Economics | 251 | |
| 22.2. | Sensitivity Analysis | 253 | |
| 23. | Other Relevant Data and Information | 255 | |
| 24. | Interpretation and Conclusions | 256 | |
| 24.1. | Conclusions | 256 | |
| 24.2. | Project Risks | 256 | |
| Practical Mining LLC | February 5, 2018 |
| Page 10 | Summary | Klondex Mines Ltd. |
| 25. | Recommendations | 258 |
| 26. | Bibliography | 259 |
| 27. | Glossary | 263 |
| 28. | Appendix A: Certification of Authors and Consent Forms | 270 |
List of Tables
| Table 1-1 Chronology of Ownership of the Fire Creek Project | 18 |
| Table 1-2 Underground Mineral Resources as of November 30, 2017 | 21 |
| Table 1-3 Open Pit Mineral Resources as of November 30, 2017 | 25 |
| Table 1-4 Mineral Reserves as of November 30. 2017 | 26 |
| Table 1-5 Key Operating and After Tax Financial Statistics | 28 |
| Table 2-1 Qualified Professionals | 30 |
| Table 2-2 Klondex Contributors | 31 |
| Table 2-3 Units of Measure | 31 |
| Table 4-1 Summary of Klondex Owned Unpatented Mining Claims (US Department of the Interior 2018) | 38 |
| Table 4-2 Summary of Owned Fee Land Holdings T30N R47E (Lander County 2018) | 39 |
| Table 4-3 Summary of Leased Fee Land Holdings | 41 |
| Table 4-4 Summary of Fire Creek Project Holding Costs | 43 |
| Table 6-1 Exploration History | 49 |
| Table 11-1 ALS In-house QAQC Datasets Reviewed | 113 |
| Table 11-2 Blanks | 117 |
| Table 11-3 Standards | 117 |
| Table 11-4 Pulp Checks | 118 |
| Table 11-5 Channel Blank Assay Set Performance | 120 |
| Table 11-6 Drill Hole Standard Assay Performance | 122 |
| Table 11-7 Channel Standard Assay Performance | 124 |
| Table 12-1 Data Review Summary Drilled Material | 128 |
| Table 12-2 Data Review Summary Channel Sampled Material | 130 |
| Table 13-1 Summary of Cyanidation Test Results from 2011 Technical Report | 132 |
| Table 13-2 Combined Metallurgical Results, Gravity/Cyanidation Tests, 80% -212 um Feed (Grav.), Reground to 80% -75 um (CN) | 133 |
| Table 13-3 Summary Metallurgical Results, Bottle Roll Tests, Fire Creek West Zone Drill Core Composites | 134 |
| Table 13-4 Gold Metallurgical Results, Whole Mineralized Material Gravity Concentration with Cyanidation of the Gravity Cleaner and Rougher Tailings | 135 |
| Practical Mining LLC | February 5, 2018 |
| Klondex Mines Ltd | Technical Report for the Fire Creek Project, | Page 11 |
| Lander County, Nevada |
| Table 13-5 Silver Metallurgical Results, Whole Mineralized Material Gravity Concentration with Cyanidation of the Gravity Cleaner and Rougher Tailings | 135 |
| Table 13-6 Summary Metallurgical Results, Bottle Roll Tests, Fire Creek Mars Pit Drill Oxide Core Composites | 136 |
| Table 13-7 Summary Metallurgical Results, Bottle Roll Tests, Fire Creek Mars Pit Drill Mixed Oxide/Sulfide Core Composites | 136 |
| Table 13-8 Summary Metallurgical Results, Bottle Roll Tests, Fire Creek Mars Pit Drill Sulfide Core Composites | 137 |
| Table 14-1 Summary of Drill Hole and Channel Samples | 139 |
| Table 14-2 Lithology Codes | 142 |
| Table 14-3 Vein Orientation and Clipping Priorities | 148 |
| Table 14-4 Low-grade Open Pit Domains | 152 |
| Table 14-5 Lithologic Unit Densities | 153 |
| Table 14-6 Vein Gold Drill Hole Composite Statistics | 154 |
| Table 14-7 Vein Gold Channel Composite Statistics | 157 |
| Table 14-8 Vein Silver Drill Hole Composite Statistics | 157 |
| Table 14-9 Vein Silver Channel Composite Statistics | 160 |
| Table 14-10 Capping Methods | 163 |
| Table 14-11 Grade Capping Values for Ore shoots | 165 |
| Table 14-12 Top Cutting – Low-grade - Gold | 168 |
| Table 14-13 Top Cutting – Low-grade - Silver | 169 |
| Table 14-14 Variograms by Lithological Domain | 174 |
| Table 14-15 Block Model Variables | 177 |
| Table 14-16 Estimation Search Parameters by Resource Category | 179 |
| Table 14-17 Estimate Comparison for Gold versus a Nearest Neighbor at 0 Cutoff | 188 |
| Table 14-18 Estimate Comparison for Silver Versus a Nearest Neighbor at 0 Cutoff | 190 |
| Table 14-19 Grade Estimation comparison OK vs NN at 0 Cutoff – Gold | 205 |
| Table 14-20 Grade Estimation comparison OK vs NN at 0 Cutoff – Silver | 205 |
| Table 14-21 Underground Mineral Resource Cutoff Grade Parameters | 210 |
| Table 14-22 Underground Mineral Resources as of November 30, 2017 | 211 |
| Table 14-23 Open Pit Optimization Parameters | 215 |
| Table 14-24 Open Pit Mineral Resources as of November 30, 2017 | 216 |
| Table 15-1 Mineral Reserves Cut Off Grade Calculation | 217 |
| Table 15-2 Mineral Reserves as of November 30, 2017 | 218 |
| Table 16-1 Underground Workforce 2018 | 226 |
| Table 16-2 Underground Mobile Equipment | 226 |
| Table 16-3 Heading Productivity | 227 |
| Table 16-4 Annual Production and Development Plan | 230 |
| Practical Mining LLC | February 5, 2018 |
| Page 12 | Summary | Klondex Mines Ltd. |
| Table 17-1 Process Equipment Itemization by Area | 235 |
| Table 17-2 Midas Mill Operating Costs | 239 |
| Table 17-3 Fire Creek Mineralized Material Processed at the Midas Mill | 239 |
| Table 19-1 FNC Gold Delivery Schedule | 245 |
| Table 20-1 Fire Creek Project Significant Permits | 247 |
| Table 21-1 Capital Costs | 248 |
| Table 21-2 Underground Development Unit Costs | 248 |
| Table 21-3 Operating Costs | 248 |
| Table 21-4 Cut-off Grade Calculation | 249 |
| Table 22-1 Income Statement 2017 – 2020 ($000’s) | 252 |
| Table 22-2 Cash Flow Statement 2017 – 2021 ($000’s) | 252 |
| Table 22-3 Key Operating and After Tax Financial Statistics | 253 |
| Table 24-1 Potential Project Risks | 257 |
List of Figures
| Figure 1-1 Fire Creek Project Overview Showing Underground Workings and Resource Zones | 20 |
| Figure 4-1 Project Location Map | 35 |
| Figure 4-2 Klondex Land Holdings | 37 |
| Figure 4-3 Location of Fire Creek Project Relative to the Northern Nevada Rift System | 45 |
| Figure 7-1 Northern Nevada Rift in North-Central Nevada | 53 |
| Figure 7-2 Regional Geologic Map of the Northern Shoshone Range | 54 |
| Figure 7-3 Stratigraphic Sections for the Project and the Mule Canyon Mine with Tie Lines for Volcanic Packages | 55 |
| Figure 7-4 Geologic Map of the Fire Creek District | 56 |
| Figure 7-5 Schematic Structural Model for the Fire Creek Deposit | 57 |
| Figure 7-6 Example of Tbeq Basalt | 60 |
| Figure 7-7 Examples of different Tlat textures | 61 |
| Figure 7-8 Example of Tim Lithology | 63 |
| Figure 7-9 Fault Locations | 65 |
| Figure 7-10 Fault Block Model | 66 |
| Figure 7-11 Alteration Progression | 69 |
| Figure 7-12 Typical Argillic to Propylitic Alteration Progression Adjacent to the Karen Vein | 70 |
| Figure 7-13 Banded Vein Sample from the Vonnie Vein that Contains Large Clots of Electrum Gold | 71 |
| Figure 7-14 Picture of Split Core Sample Containing Dendritic Electrum | 72 |
| Figure 8-1 Schematic Diagram of Low-Sulfidation Au, Ag Solutions in Relationship with Magma at Depth | 74 |
| Practical Mining LLC | February 5, 2018 |
| Klondex Mines Ltd | Technical Report for the Fire Creek Project, | Page 13 |
| Lander County, Nevada |
| Figure 9-1 Surface and Underground Holes Completed in 2011 | 76 |
| Figure 9-2 Surface and Underground Holes Completed in 2012 | 78 |
| Figure 9-3 Surface and Underground Holes Completed in 2013 | 79 |
| Figure 9-4 Locations for Surface Holes Completed in 2014. | 80 |
| Figure 9-5 Underground Drill Holes Completed During 2014 | 81 |
| Figure 9-6 Drill Holes Completed in 2015 | 83 |
| Figure 9-7 Drill Holes Completed in 2016 | 84 |
| Figure 9-8 Drill Holes Completed in 2017 | 86 |
| Figure 10-1 Fire Creek Drill Hole Traces | 88 |
| Figure 10-2 Underground Core Hole Traces | 89 |
| Figure 10-3 Placing Core (January 2013) | 91 |
| Figure 10-4 Channel Sample Locations | 100 |
| Figure 10-5 Typical Cross Section with Drill Holes and Channel Samples | 102 |
| Figure 11-1 Drill Hole Pulp Au Duplicates | 119 |
| Figure 11-2 Channel Pulp Au Duplicates Klondex and ALS | 119 |
| Figure 11-3 ALS FCBLANK16 Au | 121 |
| Figure 11-4 KIL FCBLANK22 Au | 121 |
| Figure 11-5 AAL SN70 | 123 |
| Figure 11-6 ALS SN60 | 123 |
| Figure 11-7 KIL SN75 | 125 |
| Figure 14-1 Drill Hole and Vein Locations | 140 |
| Figure 14-2 Channel Sample Locations Relative to the Underground Workings | 141 |
| Figure 14-3 Long Section with Lithology | 143 |
| Figure 14-4 Structural Framework | 144 |
| Figure 14-5 Vein Modelling Workflow | 145 |
| Figure 14-6 HW (Red) and FW (Yellow) Data Points Extracted from Sample and Survey Data Sets | 146 |
| Figure 14-7 Triangulated HW and FW Surfaces | 147 |
| Figure 14-8 HW and FW Surfaces are Combined to Generate a Valid Solid Triangulation | 148 |
| Figure 14-9 low-grade mineralization indicator model (z=5550) | 151 |
| Figure 14-10 Low-grade Disseminated Domains | 152 |
| Figure 14-11 Section A-A’ through Low-grade Disseminated Domains | 153 |
| Figure 14-12 Gold Boxplot for Low-grade Dissemination Sample Composites | 161 |
| Figure 14-13 Silver Boxplot for Low-grade Dissemination Sample Composites | 162 |
| Figure 14-14 Example Ore shoot Indicator Model on the Joyce Vein | 164 |
| Figure 14-15 Vonnie Vein Gold Grade Distribution Curve | 166 |
| Figure 14-16 Vonnie Vein Gold Grade Distribution Curve | 166 |
| Figure 14-17 Vonnie Vein Silver Grade Distribution Curve | 167 |
| Practical Mining LLC | February 5, 2018 |
| Page 14 | Summary | Klondex Mines Ltd. |
| Figure 14-18 Vonnie Vein Silver Grade Distribution Curve | 167 |
| Figure 14-19 Gold probability plot in Basalt – Low-grade mineralization | 168 |
| Figure 14-20 Vonnie Vein Major and Semi-major Experimental Variogram and Modelled Variogram for Gold Grade | 170 |
| Figure 14-21 Karen Vein Major and Semi-major Experimental Variogram and Modelled Variogram for Gold Grade | 170 |
| Figure 14-22 Joyce Vein Major and Semi-major Experimental Variogram and Modelled Variogram for Gold Grade | 170 |
| Figure 14-23 Dikes Domain - Major and Semi-major Experimental Variogram and Modelled Variogram for Gold Grade | 171 |
| Figure 14-24 Andesite Domain - Major and Semi-major Experimental Variogram and Modelled Variogram for Gold Grade | 172 |
| Figure 14-25 Upper Tuff Domain - Major and Semi-major Experimental Variogram and Modelled Variogram for Gold Grade | 172 |
| Figure 14-26 Basalt Domain - Major and Semi-major Experimental Variogram and Modelled Variogram for Gold Grade | 173 |
| Figure 14-27 Lower Tuff Domain - Major and Semi-major Experimental Variogram and Modelled Variogram for Gold Grade | 173 |
| Figure 14-28 Spatial Location Fire Creek Resource Block Models – Main and Zeus | 176 |
| Figure 14-29 Void Percentage on the Joyce Vein | 181 |
| Figure 14-30 Minability Code Overview | 182 |
| Figure 14-31 Minability Index Legend for Gold and Silver Grade | 183 |
| Figure 14-32 Vonnie Vein Assigned Minability Index | 183 |
| Figure 14-33 Joyce Vein Assigned Minability Index | 184 |
| Figure 14-34 Karen Vein Assigned Minability Index | 184 |
| Figure 14-35 Vonnie Vein Mining Extent | 185 |
| Figure 14-36 Joyce Vein Mining Extent | 186 |
| Figure 14-37 Karen Vein Mining Extent | 186 |
| Figure 14-38 Mine Depletion of Veins for Open Pit | 187 |
| Figure 14-39 Legend Gold or Silver Grade | 193 |
| Figure 14-40 Vonnie Vein Comparison of Composite and Estimated Block Gold Grades | 194 |
| Figure 14-41 Vonnie Vein Comparison of Composite and Estimated Block Silver Grades | 194 |
| Figure 14-42 Joyce Vein Comparison of Composite and Estimated Block Gold Grades | 195 |
| Figure 14-43 Joyce Vein Comparison of Composite and Estimated Block Silver Grades | 195 |
| Figure 14-44 Karen Vein Comparison of Composite and Estimated Block Gold Grades | 196 |
| Figure 14-45 Karen Vein Comparison of Composite and Estimated Block Silver Grades | 196 |
| Figure 14-46 Example Gold estimation – Low-grade (z=5550) | 197 |
| Figure 14-47 Example Gold estimation – Low-grade (z=5550) – Cross Section A-A’ | 198 |
| Figure 14-48 Gold Swath Plot of the Vonnie Vein along the North Axis | 199 |
| Practical Mining LLC | February 5, 2018 |
| Klondex Mines Ltd | Technical Report for the Fire Creek Project, | Page 15 |
| Lander County, Nevada |
| Figure 14-49 Gold Swath Plot of the Vonnie Vein along the Z Axis | 199 |
| Figure 14-50 Silver Swath Plot of the Vonnie Vein along the North Axis | 200 |
| Figure 14-51 Silver Swath Plot of the Vonnie Vein along the Z Axis | 200 |
| Figure 14-52 Gold Swath Plot of the Joyce Vein along the North Axis | 201 |
| Figure 14-53 Gold Swath Plot of the Joyce Vein along the Z Axis | 201 |
| Figure 14-54 Silver Swath Plot of the Joyce Vein along the North Axis | 202 |
| Figure 14-55 Silver Swath Plot of the Joyce Vein along the Z Axis | 202 |
| Figure 14-56 Gold Swath Plot of the Karen Vein along the North Axis | 203 |
| Figure 14-57 Gold Swath Plot of the Karen Vein along the Z Axis | 203 |
| Figure 14-58 Silver Swath Plot of the Karen Vein along the North Axis | 204 |
| Figure 14-59 Silver Swath Plot of the Karen Vein along the Z Axis | 204 |
| Figure 14-60 Gold Swath Plot of the Basalt domain along the North Axis | 206 |
| Figure 14-61 Gold Swath Plot of the Basalt domain along the East Axis | 206 |
| Figure 14-62 Gold Swath Plot of the Basalt domain along the Z Axis | 207 |
| Figure 14-63 Smoothing Checks for the Vonnie Vein | 208 |
| Figure 14-64 Smoothing Checks for the Joyce Vein | 209 |
| Figure 14-65 Smoothing Checks for the Karen Vein | 209 |
| Figure 14-66 Smoothing Checks for Gold - Low-grade at Basalt domain | 210 |
| Figure 15-1 Existing Workings, Reserve Excavations Long Section Looking East | 220 |
| Figure 16-1 Existing Development and Vein Traces at the 5400 Elevation | 221 |
| Figure 16-2 Long Section View of a Typical End Slice Stope | 223 |
| Figure 16-3 Cross Section Looking North Through the Joyce Vein and Vonnie Vein Showing Drift-and Fill-Mining, Stope Development Drifting and Designed Stopes | 224 |
| Figure 16-4 Joyce Vein Long Section Looking West Showing Existing Mine Workings and Reserves Mine Plan | 228 |
| Figure 16-5 Vonnie Vein Long Section Looking West Showing Existing Mine Workings and Reserves Mine Plan | 228 |
| Figure 16-6 Karen Vein Long Section Looking West Showing Existing Mine Workings and Reserves Mine Plan | 229 |
| Figure 16-7 Vein 20 Long Section Looking West Showing Existing Mine Workings and Reserves Mine Plan | 229 |
| Figure 17-1 Process Facility Flow Sheet (Klondex, 2015) | 234 |
| Figure 18-1 Site Facilities | 243 |
| Figure 19-1 Historical Monthly Average Gold and Silver Prices and 36 Month Trailing Average | 244 |
| Figure 21-1 Cutoff Grade Sensitivity to Gold Price | 250 |
| Figure 22-1 8% NPV Sensitivity | 254 |
| Figure 22-2 Profitability Index Sensitivity | 254 |
| Practical Mining LLC | February 5, 2018 |
| Page 16 | Summary | Klondex Mines Ltd. |
List of Abbreviations
| A | Ampere | kA | kiloamperes |
| AA | atomic absorption | kCFM | thousand cubic feet per minute |
| A/m2 | amperes per square meter | Kg | Kilograms |
| AGP | Acid Generation Potential | km | kilometer |
| Ag | Silver | km2 | square kilometer |
| ANFO | ammonium nitrate fuel oil | kWh/t | kilowatt-hour per ton |
| ANP | Acid Neutralization Potential | LOI | Loss On Ignition |
| Au | Gold | LoM | Life-of-Mine |
| AuEq | gold equivalent | m | meter |
| btu | British Thermal Unit | m2 | square meter |
| °C | degrees Celsius | m3 | cubic meter |
| CCD | counter-current decantation | masl | meters above sea level |
| CIL | carbon-in-leach | mg/L | milligrams/liter |
| CoG | cut-off grade | mm | millimeter |
| cm | centimeter | mm2 | square millimeter |
| cm2 | square centimeter | mm3 | cubic millimeter |
| cm3 | cubic centimeter | MME | Mine & Mill Engineering |
| cfm | cubic feet per minute | Moz | million troy ounces |
| ConfC | confidence code | Mt | million tonnes |
| CRec | core recovery | MTW | measured true width |
| CSS | closed-side setting | MW | million watts |
| CTW | calculated true width | m.y. | million years |
| ° | degree (degrees) | NGO | non-governmental organization |
| dia. | diameter | NI 43-101 | Canadian National Instrument 43-101 |
| EIS | Environmental Impact Statement | oz | Troy Ounce |
| EMP | Environmental Management Plan | opt | Troy Ounce per short ton |
| FA | fire assay | % | percent |
| Ft | Foot | PLC | Programmable Logic Controller |
| Ft2 | Square foot | PLS | Pregnant Leach Solution |
| Ft3 | Cubic foot | PMF | probable maximum flood |
| g | Gram | POO | Plan of Operations |
| g/L | gram per liter | ppb | parts per billion |
| g-mol | gram-mole | ppm | parts per million |
| g/t | grams per tonne | QAQC | Quality Assurance/Quality Control |
| ha | hectares | RC | reverse circulation drilling |
| HDPE | Height Density Polyethylene | ROM | Run-of-Mine |
| HTW | horizontal true width | RQD | Rock Quality Description |
| ICP | induced couple plasma | SEC | U.S. Securities & Exchange Commission |
| ID2 | inverse-distance squared | Sec | second |
| ID3 | inverse-distance cubed | SG | specific gravity |
| ILS | Intermediate Leach Solution | SPT | Standard penetration test |
| Practical Mining LLC | February 5, 2018 |
| Klondex Mines Ltd | Technical Report for the Fire Creek Project, | Page 17 |
| Lander County, Nevada |
| 1. |
Summary |
Practical Mining LLC was engaged by Klondex Gold & Silver Mining Company (KGS or Klondex), U.S. subsidiary of Canadian based Klondex Mines Ltd. (Klondex or the Company), to prepare an updated Technical Report (TR) in accordance with National Instrument 43-101 (NI 43-101) of the Canadian Securities Administrators. Practical Mining’s evaluation of the Fire Creek Project (Fire Creek or the Project), located in Lander County, Nevada, is presented herein. This TR, dated the 5th day of February 2018, with an effective date of November 30, 2017, updates the previous underground mineral resource and mineral reserve estimates and presents an initial open pit mineral resource estimate.
| 1.1. |
Property Description |
The Project is located primarily in Lander County, Nevada with a small portion of the Project boundary in Eureka County, Nevada, approximately 63 miles west of Elko, Nevada. The Project comprises private fee lands (both leased and owned) and unpatented lode mining claims. The land position includes approximately 18,400 acres of unpatented federal lode mining claims, 3,208 acres of private fee land and 429 acres of mineral leases. Overall, the Fire Creek land package is approximately 22,000 acres.
| 1.2. |
Geology |
The deposit is an epithermal deposit vertically-zoned within high-angle northwest striking structures, low-sulfidation, hosted in a mid-Miocene basalt package. Gold mineralization occurs in two habits: shallow structurally-controlled gold in variably altered Tertiary basalt and primarily native gold in steeply dipping quartz-calcite veins or structures. A package of middle-Miocene basalt and basaltic andesite flows has been cut by high-angle normal faults related to both Northern Nevada Rift (NNR) and Basin and Range extension that form grabens and half-grabens which are the structural controls in the district.
High-grade gold mineralization has been delineated between approximately 4,900 feet and 5,700 feet above mean sea level (AMSL) and is open up and down dip as well as on strike. Lower-grade gold mineralization occurs from the surface. Vein textures, gangue minerals, and alteration are typical of low-sulfidation systems. Widespread propylitic alteration grades to argillic alteration proximal to veins and/or other structural fluid conduits. Elevated mineralization is often spatially associated with the argillic alteration zone. Gold mineralization often occurs along discrete horizons within veins. An opaline silica cap is discontinuously preserved above the deeper mineralization. Mineralized faults near the opaline silica were targeted by early prospecting and later shallow drilling by previous operators in the 1980’s.
| Practical Mining LLC | February 5, 2018 |
| Page 18 | Summary | Klondex Mines Ltd. |
| 1.3. |
History |
Table 1-1 Chronology of Ownership of the Fire Creek Project
| Dates | Company | Details |
| 1967 | Union Pacific Resources | Drilled two core holes. |
| 1974 to 1975 | Placer Development Ltd. | Drilled 22 rotary holes. |
| 1975 | Klondex Mines Ltd. | Acquired the property. 1980-1983 drilled 64 rotary holes. 1981 gold test production. |
| 1984 | Minex Resources, Inc. | Leased the property from Klondex, drilled 13 rotary holes. |
| 1986 to 1987 | Alma American Mining Company (“Alma”) | Leased the property from Klondex, drilled 64 rotary holes. |
| 1988 | Aurenco Joint Venture (“Aurenco JV”) | Aurenco JV formed between Black Beauty Mining and Covenanter Mining. |
| 1988 to 1990 | Aurenco JV | Leased the property from Klondex. |
| 1990 to 1995 | Klondex Mines Ltd. | No activity. |
| 1995 to 1996 | North Mining Inc. (“North Mining”) | Leased the property from Klondex. Drilled 67 holes, performed IP and HEM surveys. |
| 1996 to 2004 | Klondex Mines Ltd. | No activity. |
| 2004 to 2012 | Klondex Mines Ltd. | Began a deep exploration program. Development commenced in 2011. |
| 2012 to 2015 | Klondex Mines Ltd. | New Management and Board of Directors in 2012, ongoing exploration, development and bulk sampling |
| 2016 to Present | Klondex Mines Ltd. | Received Record of Decision for the Environmental Assessment from the Bureau of Land Management in February 2016, began commercial production |
Drill programs conducted by Klondex have extended the known strike length of the high-grade veins to the east and west and identified a large zone of disseminated mineralization proximal to the veins.
This TR updates the Project mineral resource estimate and mineral reserves estimate. The TR incorporates the technical information available through November 30, 2017, which is the effective date of the TR.
| 1.4. |
Mineral Resource Estimate |
The mineral resource estimate is based on data from 1,474 surface and underground drill holes totaling 1,022,230 feet and completed through November 30, 2017. This estimate also includes 6,398 channel samples from underground drifting.
| Practical Mining LLC | February 5, 2018 |
| Klondex Mines Ltd | Technical Report for the Fire Creek Project, | Page 19 |
| Lander County, Nevada |
Wire frame models were constructed for 56 vein sets that strike approximately N15°W and dip steeply to both the east and west. The vein models were constructed by digitally contouring surfaces along planes of data points defined by drill hole intercepts and underground channel samples. Each data point is identified as a particular side of a particular vein (hanging wall or footwall), and software is used to contour surfaces between corresponding points. Hanging wall and footwall surfaces are then combined to form a solid wire frame. Assay values were composited into 10-foot lengths and truncated at the vein hanging wall and footwall. Only composites flagged as representing vein material were used in the grade estimation. A grade capping scheme based on resource category and vein was employed. Grades were assigned to individual blocks using the Inverse Distance Cubed method (ID3).
Low-grade disseminated mineralization was modelled based on lithological controls and a low-grade shell to determine potentially mineralized host rock from un-mineralized host rock. Assay values were composited into ten-foot lengths and truncated at the vein contacts. Only composites flagged as being outside the veins were used in the grade estimation. A grade capping scheme based on resource category and lithology based domain was employed. Grades were assigned to individual blocks using the Ordinary Kriging method (OK).
Each domain was assigned a specific search orientation based on their respective approximate dip and dip direction. Measured blocks require a minimum of four channel samples within an average anisotropic search radius of 40 feet. Indicated blocks required three drill hole intercepts within 100 feet. Inferred blocks required two drill intercepts within 300 feet. Grades were estimated only for blocks contained within the modeled veins. Vein block extents were created five feet along strike and five-feet vertically down dip. Perpendicular to strike, the block extents were limited to the width of the vein with 0.2 to five-foot resolution. This method allows veins as narrow as 0.2 foot to be modeled precisely. Block sizes in the low grade disseminated material were defined at 20x20x20ft and sub-blocked to the vein and lithological contacts.
| Practical Mining LLC | February 5, 2018 |
| Page 20 | Summary | Klondex Mines Ltd. |

Mineral resources for veins were estimated for only blocks within the modeled vein wireframes. Low-grade mineralization immediately adjacent to the veins was also modeled from the vein contact out to the margin of the low-grade shell. In all cases, the vein boundary with the low-grade mineralization was treated as a “hard” boundary, and composite assay data from the vein was not used to estimate the low-grade breccia mineralization.
| Practical Mining LLC | February 5, 2018 |
| Klondex Mines Ltd | Technical Report for the Fire Creek Project, | Page 21 |
| Lander County, Nevada |
The mineralized vein arrays extend over 5,000 feet along strike and from near surface to 1,000 feet in depth. These vein arrays are open both along strike and in some areas up and down dip.
A density of 0.0774 tons per cubic foot was used for all veins. This value was derived from 15 samples collected from the Joyce Vein and Vonnie Vein and analyzed by SGS North America, Inc. (SGS) of Elko, Nevada; an independent laboratory. The SGS (Elko) laboratory forms part of the SGS Minerals' global group of laboratories. The SGS (Elko) laboratory is not independently certified by a standards association but is associated with the SGS (Vancouver) laboratory, which is an ISO 9001:2008 accredited facility. For the low grade disseminated material the densities were defined from average densities for each lithological unit, based on 10,569 density core samples. Densities vary between 0.0571 (upper tuff) to 0.0716 (basalt).
Table 1-2 Underground Mineral Resources as of November 30, 2017
| AuEq | AuEq | ||||||
| Vein Name | kton | Au opt | Ag opt | opt | Au koz | Ag koz | koz |
| Measured | |||||||
| Joyce | 65 | 1.260 | 1.152 | 1.276 | 82 | 75 | 83 |
| Karen | 57 | 1.389 | 1.334 | 1.407 | 79 | 76 | 80 |
| Vonnie | 14 | 1.177 | 1.074 | 1.192 | 16 | 15 | 16 |
| Honey Runner | 5.4 | 0.675 | 0.418 | 0.680 | 3.6 | 2.2 | 3.6 |
| Hui Wu | 2.0 | 0.352 | 0.205 | 0.355 | 0.7 | 0.4 | 0.7 |
| 05 | 0.1 | 0.976 | 0.053 | 0.977 | 0.1 | 0.0 | 0.1 |
| 06 | 0.4 | 0.400 | 1.255 | 0.417 | 0.2 | 0.5 | 0.2 |
| 07 | 0.2 | 0.284 | 1.090 | 0.299 | 0.1 | 0.3 | 0.1 |
| 12 | 1.4 | 0.482 | 0.256 | 0.485 | 0.7 | 0.4 | 0.7 |
| 13 | 2.4 | 0.676 | 0.393 | 0.681 | 1.7 | 1.0 | 1.7 |
| 16 | 0.5 | 0.457 | 0.331 | 0.462 | 0.2 | 0.2 | 0.2 |
| 18 | 0.6 | 0.509 | 0.151 | 0.511 | 0.3 | 0.1 | 0.3 |
| 21 | 0.2 | 0.259 | 0.059 | 0.259 | 0.1 | 0.0 | 0.1 |
| 31 | 1.3 | 0.516 | 0.416 | 0.522 | 0.7 | 0.6 | 0.7 |
| 37 | 1.2 | 0.611 | 0.248 | 0.614 | 0.7 | 0.3 | 0.7 |
| 39 | 0.3 | 0.381 | 0.142 | 0.383 | 0.1 | 0.0 | 0.1 |
| 45 | 0.8 | 0.533 | 0.339 | 0.538 | 0.4 | 0.3 | 0.5 |
| 55 | 0.8 | 0.537 | 0.487 | 0.544 | 0.5 | 0.4 | 0.5 |
| 58 | 0.4 | 0.273 | 0.405 | 0.279 | 0.1 | 0.2 | 0.1 |
| 59 | 0.1 | 0.487 | 0.505 | 0.494 | 0.1 | 0.1 | 0.1 |
| Practical Mining LLC | February 5, 2018 |
| Page 22 | Summary | Klondex Mines Ltd. |
| AuEq | AuEq | ||||||
| Vein Name | kton | Au opt | Ag opt | opt | Au koz | Ag koz | koz |
| 60 | 0.1 | 0.499 | 0.280 | 0.503 | 0.1 | 0.0 | 0.1 |
| 63 | 0.1 | 0.482 | 0.481 | 0.488 | 0.0 | 0.0 | 0.0 |
| Total Measured | 154 | 1.215 | 1.118 | 1.230 | 187 | 172 | 189 |
| Indicated | |||||||
| Joyce | 79 | 0.742 | 0.941 | 0.755 | 59 | 74 | 60 |
| Karen | 92 | 0.495 | 0.449 | 0.501 | 46 | 42 | 46 |
| Vonnie | 52 | 0.538 | 0.664 | 0.547 | 28 | 34 | 28 |
| Honey Runner | 73 | 0.455 | 0.354 | 0.460 | 33 | 26 | 34 |
| Hui Wu | 11 | 0.481 | 0.275 | 0.485 | 5 | 3 | 5 |
| 05 | 2.8 | 0.446 | 0.192 | 0.448 | 1.2 | 0.5 | 1.3 |
| 06 | 15 | 0.407 | 1.133 | 0.423 | 6.1 | 17 | 6.3 |
| 07 | 9.5 | 0.622 | 0.509 | 0.629 | 5.9 | 4.8 | 6.0 |
| 08 | 6.0 | 0.822 | 0.531 | 0.829 | 5.0 | 3.2 | 5.0 |
| 09 | 6.8 | 0.886 | 0.247 | 0.889 | 6.0 | 1.7 | 6.0 |
| 12 | 4.1 | 0.558 | 0.240 | 0.561 | 2.3 | 1.0 | 2.3 |
| 13 | 3.7 | 0.481 | 0.377 | 0.486 | 1.8 | 1.4 | 1.8 |
| 14 | 3.1 | 0.286 | 0.393 | 0.292 | 0.9 | 1.2 | 0.9 |
| 16 | 23 | 0.512 | 0.458 | 0.518 | 12 | 11 | 12 |
| 18 | 2.3 | 0.313 | 0.242 | 0.316 | 0.7 | 0.6 | 0.7 |
| 21 | 17 | 0.387 | 0.537 | 0.394 | 6.5 | 9.0 | 6.6 |
| 22 | 4.2 | 0.472 | 0.411 | 0.478 | 2.0 | 1.7 | 2.0 |
| 24 | 0.1 | 0.549 | 0.658 | 0.558 | 0.1 | 0.1 | 0.1 |
| 27 | 9 | 0.364 | 0.270 | 0.368 | 3.3 | 2.4 | 3.3 |
| 30 | 6.1 | 0.464 | 0.300 | 0.468 | 2.8 | 1.8 | 2.8 |
| 31 | 23 | 0.481 | 0.331 | 0.486 | 11 | 7.5 | 11 |
| 37 | 1.2 | 0.469 | 0.196 | 0.472 | 0.6 | 0.2 | 0.6 |
| 39 | 13 | 0.666 | 0.533 | 0.674 | 8.8 | 7.0 | 8.9 |
| 41 | 0.9 | 0.236 | 0.232 | 0.239 | 0.2 | 0.2 | 0.2 |
| 45 | 2.5 | 0.281 | 0.256 | 0.284 | 0.7 | 0.6 | 0.7 |
| 46 | 1.0 | 0.235 | 0.768 | 0.246 | 0.2 | 0.8 | 0.3 |
| 55 | 1.2 | 0.738 | 0.473 | 0.745 | 0.9 | 0.6 | 0.9 |
| 58 | 4.1 | 0.441 | 0.498 | 0.448 | 1.8 | 2.0 | 1.8 |
| 59 | 3.8 | 0.652 | 0.380 | 0.657 | 2.5 | 1.4 | 2.5 |
| 60 | 5.9 | 0.378 | 0.416 | 0.384 | 2.2 | 2.5 | 2.3 |
| 61 | 19 | 0.430 | 0.690 | 0.439 | 8.3 | 13 | 8.5 |
| 63 | 14 | 0.541 | 0.623 | 0.550 | 7.6 | 8.7 | 7.7 |
| 64 | 4.8 | 0.449 | 0.933 | 0.462 | 2.2 | 4.5 | 2.2 |
| 68 | 3.1 | 0.351 | 0.702 | 0.361 | 1.1 | 2.2 | 1.1 |
| 69 | 12 | 0.371 | 0.478 | 0.377 | 4.5 | 5.8 | 4.6 |
| 70 | 2.6 | 0.234 | 0.487 | 0.241 | 0.6 | 1.2 | 0.6 |
| Total Indicated | 532 | 0.526 | 0.554 | 0.534 | 280 | 295 | 284 |
| Practical Mining LLC | February 5, 2018 |
| Klondex Mines Ltd | Technical Report for the Fire Creek Project, | Page 23 |
| Lander County, Nevada |
| AuEq | AuEq | ||||||
| Vein Name | kton | Au opt | Ag opt | opt | Au koz | Ag koz | koz |
| Measured and Indicated | |||||||
| Joyce | 144 | 0.976 | 1.036 | 0.990 | 141 | 149 | 143 |
| Karen | 149 | 0.834 | 0.785 | 0.845 | 124 | 117 | 126 |
| Vonnie | 65 | 0.672 | 0.750 | 0.682 | 44 | 49 | 45 |
| Honey Runner | 79 | 0.470 | 0.358 | 0.475 | 37 | 28 | 37 |
| Hui Wu | 13 | 0.461 | 0.264 | 0.464 | 6.0 | 3.4 | 6.0 |
| 05 | 2.9 | 0.469 | 0.186 | 0.472 | 1.4 | 0.5 | 1.4 |
| 06 | 15 | 0.407 | 1.137 | 0.423 | 6.2 | 17 | 6.5 |
| 07 | 10 | 0.614 | 0.524 | 0.621 | 6.0 | 5.1 | 6.0 |
| 08 | 6.0 | 0.822 | 0.531 | 0.829 | 5.0 | 3.2 | 5.0 |
| 09 | 6.8 | 0.884 | 0.247 | 0.887 | 6.0 | 1.7 | 6.0 |
| 12 | 5.5 | 0.539 | 0.244 | 0.542 | 3.0 | 1.3 | 3.0 |
| 13 | 6.1 | 0.559 | 0.383 | 0.564 | 3.4 | 2.3 | 3.4 |
| 14 | 3.1 | 0.286 | 0.393 | 0.292 | 0.9 | 1.2 | 0.9 |
| 16 | 24 | 0.511 | 0.455 | 0.517 | 12 | 11 | 12 |
| 18 | 2.9 | 0.352 | 0.224 | 0.355 | 1.0 | 0.7 | 1.0 |
| 21 | 17 | 0.385 | 0.530 | 0.392 | 6.5 | 9.0 | 6.7 |
| 22 | 4.2 | 0.472 | 0.411 | 0.478 | 2.0 | 1.7 | 2.0 |
| 24 | 0.1 | 0.549 | 0.658 | 0.558 | 0.1 | 0.1 | 0.1 |
| 27 | 9.1 | 0.364 | 0.270 | 0.368 | 3.3 | 2.4 | 3.3 |
| 30 | 6.1 | 0.464 | 0.300 | 0.468 | 2.8 | 1.8 | 2.8 |
| 31 | 24 | 0.483 | 0.336 | 0.488 | 12 | 8.0 | 12 |
| 37 | 2.4 | 0.539 | 0.222 | 0.543 | 1.3 | 0.5 | 1.3 |
| 39 | 13 | 0.661 | 0.525 | 0.668 | 8.9 | 7.1 | 9.0 |
| 41 | 1.0 | 0.236 | 0.228 | 0.239 | 0.2 | 0.2 | 0.2 |
| 45 | 3.4 | 0.344 | 0.277 | 0.347 | 1.2 | 0.9 | 1.2 |
| 46 | 1.0 | 0.235 | 0.768 | 0.246 | 0.2 | 0.8 | 0.3 |
| 55 | 2.0 | 0.654 | 0.479 | 0.660 | 1.3 | 1.0 | 1.3 |
| 58 | 4.5 | 0.425 | 0.489 | 0.432 | 1.9 | 2.2 | 1.9 |
| 59 | 3.9 | 0.647 | 0.384 | 0.652 | 2.5 | 1.5 | 2.6 |
| 60 | 6.0 | 0.381 | 0.414 | 0.386 | 2.3 | 2.5 | 2.3 |
| 61 | 19 | 0.430 | 0.690 | 0.439 | 8.3 | 13 | 8.5 |
| 63 | 14 | 0.541 | 0.623 | 0.550 | 7.6 | 8.8 | 7.7 |
| 64 | 4.8 | 0.449 | 0.932 | 0.462 | 2.2 | 4.5 | 2.2 |
| 68 | 3.1 | 0.351 | 0.702 | 0.361 | 1.1 | 2.2 | 1.1 |
| 69 | 12 | 0.371 | 0.478 | 0.377 | 4.5 | 5.8 | 4.6 |
| 70 | 2.6 | 0.234 | 0.487 | 0.241 | 0.6 | 1.2 | 0.6 |
| Total Meas. and Ind. | 686 | 0.681 | 0.680 | 0.690 | 467 | 467 | 474 |
| Inferred | |||||||
| Practical Mining LLC | February 5, 2018 |
| Page 24 | Summary | Klondex Mines Ltd. |
| AuEq | AuEq | ||||||
| Vein Name | kton | Au opt | Ag opt | opt | Au koz | Ag koz | koz |
| Joyce | 49 | 0.354 | 0.881 | 0.366 | 17 | 43 | 18 |
| Karen | 41 | 0.343 | 0.479 | 0.350 | 14 | 20 | 14 |
| Vonnie | 25 | 0.792 | 0.394 | 0.797 | 20 | 10 | 20 |
| Honey Runner | 29 | 0.386 | 0.400 | 0.391 | 11 | 12 | 11 |
| Hui Wu | 0.2 | 0.348 | 0.066 | 0.349 | 0.1 | 0.0 | 0.1 |
| 05 | 1.0 | 0.361 | 0.183 | 0.363 | 0.3 | 0.2 | 0.3 |
| 06 | 27 | 0.460 | 0.490 | 0.467 | 12 | 13 | 12 |
| 08 | 4.4 | 0.257 | 0.158 | 0.259 | 1.1 | 0.7 | 1.1 |
| 09 | 60 | 0.438 | 0.166 | 0.441 | 27 | 10 | 27 |
| 14 | 0.3 | 0.358 | 0.368 | 0.363 | 0.1 | 0.1 | 0.1 |
| 16 | 62 | 0.412 | 0.259 | 0.415 | 26 | 16 | 26 |
| 18 | 17 | 0.478 | 0.169 | 0.481 | 8.1 | 2.9 | 8.2 |
| 19 | 0.3 | 0.219 | 0.300 | 0.223 | 0.1 | 0.1 | 0.1 |
| 21 | 6.1 | 0.287 | 0.503 | 0.294 | 1.7 | 3.1 | 1.8 |
| 22 | 23 | 0.530 | 0.425 | 0.536 | 12 | 10 | 12 |
| 23 | 36 | 0.444 | 0.131 | 0.446 | 16 | 4.7 | 16 |
| 24 | 148 | 0.534 | 0.675 | 0.544 | 79 | 100 | 81 |
| 25 | 54 | 0.558 | 0.295 | 0.562 | 30 | 16 | 30 |
| 26 | 50 | 0.319 | 0.159 | 0.321 | 16 | 8.0 | 16 |
| 27 | 5.6 | 0.331 | 0.198 | 0.334 | 1.8 | 1.1 | 1.9 |
| 28 | 11 | 0.311 | 0.588 | 0.319 | 3.3 | 6.2 | 3.4 |
| 30 | 107 | 0.422 | 0.368 | 0.427 | 45 | 39 | 46 |
| 31 | 2.0 | 0.421 | 0.153 | 0.423 | 0.8 | 0.3 | 0.8 |
| 39 | 1.5 | 0.873 | 0.734 | 0.884 | 1.3 | 1.1 | 1.3 |
| 41 | 21 | 0.272 | 0.728 | 0.282 | 5.8 | 16 | 6.0 |
| 45 | 22 | 0.274 | 0.319 | 0.279 | 6.0 | 6.9 | 6.1 |
| 58 | 26 | 0.551 | 0.429 | 0.557 | 14 | 11 | 15 |
| 59 | 2.7 | 0.490 | 0.236 | 0.493 | 1.3 | 0.6 | 1.3 |
| 60 | 25 | 0.340 | 0.447 | 0.346 | 8.4 | 11 | 8.6 |
| 61 | 31 | 0.371 | 0.571 | 0.379 | 11 | 18 | 12 |
| 63 | 3.1 | 0.313 | 0.298 | 0.317 | 1.0 | 0.9 | 1.0 |
| 64 | 2.5 | 0.599 | 1.908 | 0.625 | 1.5 | 4.8 | 1.6 |
| 66 | 43 | 0.337 | 1.192 | 0.354 | 15 | 51 | 15 |
| 67 | 49 | 0.319 | 0.333 | 0.324 | 15 | 16 | 16 |
| 68 | 28 | 0.238 | 0.291 | 0.242 | 6.7 | 8.1 | 6.8 |
| 69 | 18 | 0.360 | 0.190 | 0.362 | 6.6 | 3.5 | 6.6 |
| 70 | 9.3 | 0.253 | 0.392 | 0.258 | 2.3 | 3.6 | 2.4 |
| 72 | 26 | 0.388 | 0.092 | 0.389 | 10 | 2 | 10 |
| 73 | 74 | 0.967 | 0.260 | 0.971 | 72 | 19 | 72 |
| Total Inferred | 1,142 | 0.457 | 0.430 | 0.463 | 522 | 491 | 529 |
| Practical Mining LLC | February 5, 2018 |
| Klondex Mines Ltd | Technical Report for the Fire Creek Project, | Page 25 |
| Lander County, Nevada |
| Notes: | ||
| 1. |
Mineral resources have been calculated at a gold price of $1,400/troy ounce and a silver price of $19.83 per troy ounce; | |
| 2. |
Mineral resources are calculated at a grade thickness cut-off grade of 0.974 Au equivalent opt-feet and a diluted Au equivalent cut-off grade of 0.228 opt; | |
| 3. |
Mineral Resources have been calculated using metallurgical recoveries for gold and silver of 94% and 92% respectively; | |
| 4. |
Gold equivalent ounces were calculated based on one ounce of gold being equivalent to 72.12 ounces of silver; | |
| 5. |
The minimum mining width is defined as four-feet or the vein true thickness plus two-foot, whichever is greater; | |
| 6. |
Mineral resources include dilution to achieve mining widths and an additional 7% unplanned dilution. | |
| 7. |
Mineral resources include allowance for 5% mining losses; | |
| 8. |
Mineral resources are inclusive of mineral reserves; | |
| 9. |
Underground Mineral Resources are Exclusive of Open Pit Mineral Resources; | |
| 10. |
Mineral resources, which are not mineral reserves, do not have demonstrated economic viability. The estimate of mineral resources may be materially affected by environmental, permitting, legal, title, socio-political, marketing, or other relevant factors; and | |
| 11. |
The quantity and grade of reported inferred mineral resources in this estimation are uncertain in nature and there is insufficient exploration to define these inferred mineral resources as an indicated or measured mineral resource and it is uncertain if further exploration will result in upgrading them to an indicated or measured mineral resource category. | |
Table 1-3 Open Pit Mineral Resources as of November 30, 2017
| Cut Off | Material | |||||||
| AuEq opt | Type | kton | Au opt | Ag opt | AuEq opt | Au koz | Ag koz | AuEq koz |
| Indicated | ||||||||
| Oxide | 10,023 | 0.023 | 0.038 | 0.023 | 229 | 386 | 231 | |
| 0.012 | Mixed | 27,085 | 0.030 | 0.065 | 0.030 | 807 | 1,769 | 818 |
| Total | 37,109 | 0.028 | 0.058 | 0.028 | 1,036 | 2,155 | 1,049 | |
| Oxide | 12,241 | 0.021 | 0.036 | 0.021 | 251 | 490 | 253 | |
| 0.010 | Mixed | 30,637 | 0.027 | 0.062 | 0.027 | 842 | 1,909 | 854 |
| Total | 42,877 | 0.025 | 0.055 | 0.025 | 1,093 | 2,350 | 1,108 | |
| Oxide | 21,476 | 0.014 | 0.029 | 0.015 | 310 | 617 | 314 | |
| 0.005 | Mixed | 42,980 | 0.022 | 0.055 | 0.022 | 925 | 2,350 | 941 |
| Total | 64,457 | 0.019 | 0.046 | 0.019 | 1,236 | 2,967 | 1,255 | |
| Inferred | ||||||||
| Oxide | 2,249 | 0.027 | 0.038 | 0.027 | 60 | 86 | 61 | |
| 0.012 | Mixed | 25,313 | 0.039 | 0.101 | 0.040 | 983 | 2,557 | 1,000 |
| Total | 27,561 | 0.038 | 0.096 | 0.038 | 1,043 | 2,643 | 1,060 | |
| Oxide | 2,872 | 0.023 | 0.035 | 0.023 | 66 | 100 | 67 | |
| 0.010 | Mixed | 28,835 | 0.035 | .096 | 0.035 | 1019 | 2,782 | 1,037 |
| Total | 31,707 | 0.034 | 0.091 | 0.035 | 1,085 | 2,882 | 1,104 | |
| Oxide | 5,792 | 0.015 | 0.027 | 0.015 | 84 | 154 | 85 | |
| 0.005 | Mixed | 41,053 | 0.027 | 0.085 | 0.027 | 1,101 | 3,482 | 1,123 |
| Total | 46,845 | 0.025 | 0.078 | 0.026 | 1,185 | 3,637 | 1,209 | |
| Practical Mining LLC | February 5, 2018 |
| Page 26 | Summary | Klondex Mines Ltd. |
| Notes: | ||
| 1. |
Mineral resources are calculated at a gold price of US$1,400 per ounce and a silver price of US$19.83 per ounce; | |
| 2. |
Metallurgical recoveries for gold and silver are 65% and 30%, respectively for oxide mineralization and 60% and 25% respectively for mixed mineralization; | |
| 3. |
One ounce of gold is equivalent to 152.94 ounces of silver; | |
| 4. |
Mineral Resources include 10% dilution and 5% mining losses; | |
| 5. |
Cut off grades for the Mineral Resources are 0.01opt AuEq opt.; | |
| 6. |
The effective date for the Mineral Resource is November 30, 2017; | |
| 7. |
Open Pit Mineral Resources are Exclusive of Underground Mineral Resources; | |
| 8. |
Mineral Resources which are not Mineral Reserves have not yet demonstrated economic viability. The estimate of mineral resources may be materially affected by environmental, permitting, legal, title, taxation, sociopolitical, marketing, or other relevant issues, and; | |
| 9. |
The quantity and grade of reported Inferred Resources in this estimation are uncertain in nature and there has been insufficient exploration to define these Inferred Resources as an Indicated or Measured Mineral Resource and it is uncertain if further exploration will result in upgrading them to an Indicated or Measured Mineral Resource category. | |
| 1.5. |
Mineral Reserve Estimate |
Excavation designs for stopes, stope development drifting, and access development were created using Vulcan software. Stope designs were aided by the Vulcan Stope Optimizer Module. The stope optimizer produces the stope cross section which maximizes value within given geometric engineering and geotechnical constraints.
Design constraints included a four-foot minimum mining width for long-hole stopes with development drifts spaced at 40-foot vertical intervals. Stope development drift dimensions are planned 12 feet high with a minimum width of six feet. Drift and fill dimensions are the same as those for stope development.
Table 1-4 Mineral Reserves as of November 30. 2017
| Au | Ag | Au Equiv. | |||||
| Tons | Au Eq | Ounces | Ounces | Ounces | |||
| Vein Designation | (000's) | Au opt | Ag opt | opt | (000's) | (000's) | (000's) |
| Proven Reserves | |||||||
| Joyce | 52 | 1.089 | 1.005 | 1.102 | 57.0 | 52.6 | 57.7 |
| Karen | 45 | 1.105 | 1.151 | 1.120 | 49.6 | 51.7 | 50.3 |
| Vonnie | 6 | 1.298 | 0.952 | 1.311 | 8.2 | 6.0 | 8.3 |
| 20 | 3 | 0.441 | 0.304 | 0.445 | 1.2 | 0.8 | 1.2 |
| 6 | 0.5 | 0.330 | 1.045 | 0.344 | 0.2 | 0.5 | 0.2 |
| 14 | 0.7 | 0.535 | 0.179 | 0.537 | 0.4 | 0.1 | 0.4 |
| 13 | 0.4 | 0.256 | 0.126 | 0.258 | 0.1 | - | 0.1 |
| 37 | 0.4 | 0.430 | 0.187 | 0.432 | 0.2 | 0.1 | 0.2 |
| Proven Reserves | 108 | 1.079 | 1.033 | 1.092 | 116.8 | 111.9 | 118.3 |
| Probable Reserves | |||||||
| Joyce | 37 | 0.808 | 0.873 | 0.819 | 30.0 | 32.4 | 30.4 |
| Karen | 59 | 0.380 | 0.363 | 0.385 | 22.4 | 21.4 | 22.7 |
| Vonnie | 9 | 0.980 | 0.709 | 0.990 | 8.7 | 6.3 | 8.7 |
| 20 | 41 | 0.375 | 0.327 | 0.380 | 15.2 | 13.3 | 15.4 |
| 12 | 6 | 0.888 | 0.250 | 0.891 | 5.1 | 1.4 | 5.1 |
| 63 | 9 | 0.469 | 0.643 | 0.478 | 4.2 | 5.8 | 4.3 |
| 61 | 9 | 0.438 | 0.440 | 0.444 | 4.0 | 4.0 | 4.0 |
| 6 | 9 | 0.391 | 1.205 | 0.407 | 3.6 | 11.1 | 3.8 |
| 18 | 8 | 0.424 | 0.381 | 0.429 | 3.5 | 3.1 | 3.5 |
| 8 | 4 | 0.910 | 0.598 | 0.918 | 3.4 | 2.3 | 3.5 |
| Practical Mining LLC | February 5, 2018 |
| Klondex Mines Ltd | Technical Report for the Fire Creek Project, | Page 27 |
| Lander County, Nevada |
| Au | Ag | Au Equiv. | |||||
| Tons | Au Eq | Ounces | Ounces | Ounces | |||
| Vein Designation | (000's) | Au opt | Ag opt | opt | (000's) | (000's) | (000's) |
| 36 | 5 | 0.501 | 0.255 | 0.505 | 2.3 | 1.1 | 2.3 |
| 14 | 4 | 0.338 | 0.284 | 0.341 | 1.2 | 1.0 | 1.2 |
| 59 | 2 | 0.632 | 0.332 | 0.637 | 1.1 | 0.6 | 1.2 |
| 55 | 3 | 0.352 | 0.279 | 0.356 | 1.0 | 0.8 | 1.0 |
| 13 | 1 | 0.709 | 0.213 | 0.711 | 0.9 | 0.3 | 0.9 |
| 31 | 2 | 0.391 | 0.191 | 0.394 | 0.8 | 0.4 | 0.8 |
| 64 | 2 | 0.432 | 1.415 | 0.451 | 0.7 | 2.4 | 0.8 |
| 5 | 1 | 0.404 | 0.183 | 0.407 | 0.6 | 0.3 | 0.6 |
| 7 | 1 | 0.409 | 0.327 | 0.414 | 0.5 | 0.4 | 0.5 |
| Probable Reserves | 211 | 0.517 | 0.514 | 0.524 | 109.1 | 108.3 | 110.6 |
| Proven & Probable Reserves | |||||||
| Joyce | 89 | 0.972 | 0.950 | 0.985 | 86.9 | 85.0 | 88.1 |
| Karen | 104 | 0.694 | 0.704 | 0.703 | 72.1 | 73.2 | 73.1 |
| Vonnie | 15 | 1.113 | 0.810 | 1.124 | 16.9 | 12.3 | 17.0 |
| 20 | 43 | 0.379 | 0.326 | 0.384 | 16.4 | 14.1 | 16.6 |
| 12 | 6 | 0.888 | 0.250 | 0.891 | 5.1 | 1.4 | 5.1 |
| 63 | 9 | 0.469 | 0.643 | 0.477 | 4.2 | 5.8 | 4.3 |
| 61 | 9 | 0.438 | 0.440 | 0.444 | 4.0 | 4.0 | 4.0 |
| 6 | 10 | 0.388 | 1.197 | 0.404 | 3.8 | 11.6 | 3.9 |
| 18 | 8 | 0.423 | 0.381 | 0.428 | 3.5 | 3.1 | 3.5 |
| 8 | 4 | 0.910 | 0.598 | 0.918 | 3.4 | 2.3 | 3.5 |
| 36 | 5 | 0.501 | 0.255 | 0.505 | 2.3 | 1.1 | 2.3 |
| 14 | 4 | 0.370 | 0.267 | 0.374 | 1.6 | 1.1 | 1.6 |
| 59 | 2 | 0.632 | 0.332 | 0.637 | 1.1 | 0.6 | 1.2 |
| 55 | 3 | 0.352 | 0.279 | 0.356 | 1.0 | 0.8 | 1.0 |
| 13 | 2 | 0.603 | 0.192 | 0.605 | 1.0 | 0.3 | 1.0 |
| 31 | 2 | 0.391 | 0.191 | 0.394 | 0.8 | 0.4 | 0.8 |
| 64 | 2 | 0.431 | 1.412 | 0.450 | 0.7 | 2.4 | 0.8 |
| 5 | 1 | 0.404 | 0.183 | 0.407 | 0.6 | 0.3 | 0.6 |
| 7 | 1 | 0.409 | 0.327 | 0.414 | 0.5 | 0.4 | 0.5 |
| 37 | 0.6 | 0.327 | 0.163 | 0.330 | 0.2 | 0.1 | 0.2 |
| Proven & Probable Reserves | 319 | 0.708 | 0.690 | 0.717 | 226.0 | 220.2 | 228.9 |
| Notes: | |
| 1. |
Mineral reserves have been estimated with a gold price of $1,200/ounce and a silver price of $17.00/ounce; |
| 2. |
Metallurgical recoveries for gold and silver are 93% and 88% respectively; |
| 3. |
Gold equivalent ounces are calculated on the basis of one ounce of gold being equivalent to 74.60 ounces of silver; |
| 4. |
Mineral reserves are estimated at a cutoff grade of 0.288 Au opt and an incremental cutoff grade of 0.090 Au opt, and; |
| 5. |
Mine losses of 5% and unplanned mining dilution of 10% have been applied to the designed mine excavations. |
| 1.6. |
Cash Flow Analysis and Economics |
The reserves mine plan was evaluated using constant dollar cash flow analysis, and the results are summarized in Table 1-5. The high-grade of the Mineral Reserves and the low capital requirements produce a 3.9 profitability index (PI) calculated at an 8% discount rate with an Net Present Value (NPV) of $73M.
| Practical Mining LLC | February 5, 2018 |
| Page 28 | Summary | Klondex Mines Ltd. |
Table 1-5 Key Operating and After Tax Financial Statistics
| Material Mined and Processed (kt) | 319 |
| Avg. Gold Grade (opt) | 0.71 |
| Avg. Silver Grade (opt) | 0.69 |
| Contained Gold (koz) | 226 |
| Contained Silver (koz) | 220 |
| Avg. Gold Metallurgical Recovery | 93% |
| Avg. Silver Metallurgical Recovery | 88% |
| Recovered Gold (koz) | 210 |
| Recovered Silver (koz) | 194 |
| Reserve Life (years) | 3.1 |
| Operating Cost ($/ton) | $351 |
| Cash Cost ($/oz) 1. | $582 |
| Total Cost ($/oz) 1. | $716 |
| Gold Price ($/oz) | $1,200.00 |
| Silver Price ($/oz) | $17.00 |
| Capital Costs ($ Millions) | $28.2 |
| Payback Period (Years) | NA |
| Cash Flow ($ Millions) | $88 |
| 5% Discounted Cash Flow ($ Millions) | $78 |
| 8% Discounted Cash Flow ($ Millions) | $73 |
| Profitability Index (8%) 2. | 3.9 |
| Internal Rate of Return | NA |
| Notes: | ||
| 1. |
Net of Byproduct Sales, and; | |
| 2. |
Profitability index (PI), is the ratio of payoff to investment of a proposed project. It is a useful tool for ranking projects because it allows you to quantify the amount of value created per unit of investment. A profitability index of 1 indicates break even. | |
| 1.7. |
Conclusions |
Fire Creek is a modern, mechanized narrow vein mine. Mining is executed with a high degree of care and precision. The workforce is well trained and organized. Management and technical staff are dedicated to producing ore of the highest possible quality at the lowest cost.
The data density required to classify mineral resources as measured or indicated is only achievable by sill development and closely spaced underground drilling. This limits mineral reserves to only those veins in or immediately adjacent to the mine workings. In the opinion of the authors of this TR, additional potential exists to extend mineral reserves along strike in both directions as underground access is developed. As the footprint of the mine grows and the number of available mining areas grows with it, the mining rate can be increased, and cost reductions may be realized through economies of scale.
| Practical Mining LLC | February 5, 2018 |
| Klondex Mines Ltd | Technical Report for the Fire Creek Project, | Page 29 |
| Lander County, Nevada |
The conventional Merrill Crowe mill facility of the Midas Mine is an efficient well maintained modern mineral processing plant capable of processing 1,200 tons per day (tpd). The plant operates with a minimum crew which results in cost reductions when operated at capacity. The underutilized processing capacity can accept increased mine production from the Fire Creek, Midas and Hollister Mines as well as third party processing agreements.
Capital requirements for the Project are minimal. Ongoing mine development comprises the majority of capital costs, and the ability to access multiple veins from common development greatly reduces the unit cost per ounce.
In the opinion of the authors of this TR, the high-grade reserves in the mine plan provide a high return and will sustain profitable operations with up to 40% adverse variations in metal prices, operating or capital costs. The total cost per ounce, including capital expenditures and net of byproduct sales, is $716 per ounce.
The addition of a disseminated open pit mineral resource adds long term potential to the Project once underground mining is completed in the vicinity of the open pit.
| 1.8. |
Recommendations |
Exploration: Underground drilling should continue in the veins identified near the current development workings to increase the level of confidence in these veins to an indicated classification. Underground exploration development is key to providing the platform to expand mineral resources and mineral reserves. Exploration development should be accelerated to provide the strike length necessary to define five to seven years of underground mine life.
Mine Planning: Expanding the reserve base through the previous comment will allow the development of additional work areas and the potential for increasing the mines production rate. Mine support and overhead costs are relatively fixed and are a large percentage of the total operating cost. A higher production rate can result in economies of scale and lower total cost per ounce.
Ore and Waste Density: A large quantity of density data is being collected and is available to be incorporated into the resource model. This data should be reviewed and interpreted with the same emphasis as is given assay data.
| Practical Mining LLC | February 5, 2018 |
| Page 30 | Introduction | Klondex Mines Ltd. |
| 2. |
Introduction |
| 2.1. |
Terms of Reference and Purpose of this Technical Report |
This TR provides a statement of Mineral Resources and Mineral Reserves for the Project. This evaluation includes measured, indicated, and inferred mineral resources, as well as proven and probable mineral reserves. This TR was prepared in accordance with the requirements of NI 43-101 and Form 43-101F1 (43-101F1) for technical reports.
Mineral resource and mineral reserve definitions are set forth in Section 27 of this TR in accordance with the companion policy to NI 43-101 (43-101CP) of the Canadian Securities Administrators and “Canadian Institute of Mining, Metallurgy and Petroleum (CIM) – Definition Standards for Mineral Resources and Mineral Reserves adopted by CIM Council on May 10, 2014.”
| 2.2. |
Qualification of the Authors |
This TR includes technical evaluations from four independent consultants. The consultants are specialists in the fields of geology, exploration, and open pit and underground mining.
None of the authors has any beneficial interest in Klondex or any of its subsidiaries or in the assets of Klondex or any of its subsidiaries. The authors will be paid a fee for this work in accordance with normal professional consulting practices.
Mr. Odell is the qualified person (QP) for this TR and is cited as “primary author.” All independent QP’s contributing to this report toured the mine and facilities on January 9, 2018.
The QP’s contributing to this report are listed in Table 2-1. The Certificate and Consent Forms are provided in Appendix A: Certification of Authors and Consent Forms.
Table 2-1 Qualified Professionals
| Responsible | ||||
| Company | Name | Title | Discipline | Sections |
| Practical Mining, LLC | Mark Odell | Manager | Mining and mineral resources | All |
| Practical Mining, LLC | Laura Symmes | Sr. Geologist | Geology | 7-12 |
| Practical Mining, LLC | Sarah Bull | Mining Engineer | Mining | 15-16 |
| Practical Mining LLC | Adam Knight | Mining Engineer | Mining | 15-16 |
| Practical Mining LLC | February 5, 2018 |
| Klondex Mines Ltd | Technical Report for the Fire Creek Project, | Page 31 |
| Lander County, Nevada |
| 2.3. |
Sources of Information |
The Klondex staff listed in Table 2-2 contributed to the sections of this report in their area of expertise and have reviewed this TR for accuracy.
Table 2-2 Klondex Contributors
| Name | Title | Discipline |
| Mr. Brian Morris | Exploration VP | Geology |
| Mr. Sid Tolbert | General Manager | Mining |
| Mr. Anthony Botrill | Corporate Resource Manager | Resource Modelling |
| Mr. Agapito Orozco | Sr. Resource Geologist | Resource Modelling |
| Mr. John Marma | Director of Exploration and Geology | Geology |
| Mr. John Spring | Chief Geologist | Geology |
| Ms. Lucy Hill | Director of Environmental Services and Community Relations | Environmental |
| Mr. John Rust | Director of Metallurgy | Metallurgy |
Information sources are documented either within the text and cited in references, or are cited in references only. The primary author believes the information provided by Klondex staff to be accurate based on their work at the Project. The authors asked detailed questions of specific Klondex staff to help verify contributions included in this document.
| 2.4. |
Units of Measure |
The units of measure used in this report are shown in Table 2-2 below. U.S. Imperial units of measure are used throughout this document unless otherwise noted. The glossary of geological and mining related terms is also provided in Section 27 of this TR. Currency is expressed as United States Dollars unless otherwise noted.
Table 2-3 Units of Measure
| US Imperial to Metric conversions |
| Linear Measure |
| 1 inch = 2.54 cm |
| 1 foot = 0.3048 m |
| 1 yard = 0.9144 m |
| 1 mile = 1.6 km |
| Area Measure |
| 1 acre = 0.4047 ha |
| 1 square mile = 640 acres = 259 ha |
| Weight |
| 1 short ton (st) = 2,000 lbs = 0.9071 metric tons |
| 1 lb = 0.454 kg = 14.5833 troy oz |
| Assay Values |
| 1 oz per short ton = 34.2857 g/t |
| 1 troy oz = 31.1036 g |
| 1 part per billion = 0.0000292 oz/ton |
| 1 part per million = 0.0292 oz/ton = 1g/t |
| Practical Mining LLC | February 5, 2018 |
| Page 32 | Introduction | Klondex Mines Ltd. |
| 2.5. |
Coordinate Datum |
Spatial data utilized in analysis presented in this TR are projected to Nevada State Plane Central Zone North American Datum 1983 (NV SPCS) feet truncated to the last six digits. All spatial measurement units used in the mineral resource estimate are U.S. Survey feet.
Historical survey data was collected and reported using several coordinate systems. Survey data was originally collected in North American Datum of 1983 (NAD83) meters as a default in the instrumentation settings, and then the data was converted to NAD83 feet for reports as requested by Klondex staff in Nevada. Klondex’s Nevada staff further converted the data from NAD83 feet to UTM NAD27 Zone 11N feet. Early in 2014, all the Project data was again converted to NV SPCS NAD83 coordinates.
In addition, downhole surveys were collected without compensating for magnetic declination. Klondex staff applied corrections to raw downhole survey data to compensate for the local declination at the Project, which is 12.86 degrees according to the National Oceanic and Atmospheric Administration (NOAA) calculator.
| Practical Mining LLC | February 5, 2018 |
| Klondex Mines Ltd. | Technical Report for the Fire Creek Project, | Page 33 |
| Lander County, Nevada |
| 3. |
Reliance on Other Experts |
The technical status for the claims and land holding is reliant on information provided by The US Bureau of Land Management and the Lander County Assessors Office. The status of the Klondex environmental program and the permitting process were provided by Ms. Lucy Hill, Director of Environmental Services. The geologic model and block model were completed by Mr. Anthony Bottrill, Klondex Corporate Resource Manager, and Mr Agapito Orozco, Klondex Senior Resource Geologist. Mr. John Rust, Klondex Director of Metallurgy, provided information regarding metallurgical testing and process operating statistics. These contributions have been reviewed by the Authors and they are accurate portrayals of the Project at the time of writing this TR.
Observations made at the Project by the authors included stope mining, development mining, backfill operations, conditions of the underground work areas, mine ventilation system and the water handling system.
The authors reviewed land tenure to verify the nature of the good standing with the Bureau of Land Management (BLM) regarding Klondex’s unpatented lode mining claims. Fee land ownership and fee land leases were reviewed in a title opinion report dated July 30, 2014, written by Erwin & Thompson LLP. This information was supplemented by a review of records from the Lander County Assessor’s Office. The legal status or ownership of the fee properties and/or any agreements that pertain to the Fire Creek mineral deposit as described in Section 4 were provided by Klondex legal counsel for all relevant mining claims. Assumptions made as to accuracy of land tenure are based on the Erwin & Thompson LLP legal opinion.
The opinions expressed in this TR are based on the authors’ field observations and assessment of the technical data supplied by Klondex.
| Practical Mining LLC | February 5, 2018 |
| Page 34 | Property Description and Location | Klondex Mines Ltd. |
| 4. |
Property Description and Location |
| 4.1. |
Property Description |
The Project is located primarily in Lander County, Nevada with a small portion of the Project boundary in Eureka County, Nevada. The Project lies approximately 63 miles west of the major city of Elko, Nevada, USA in a sage and grass covered weathered basalt hillside overlooking Crescent Valley. There are multiple small towns along paved highways within a short commute of the Project, and the northern edge of the residential area of the town of Crescent Valley abuts the mine access road. The Project’s land coverage is approximately 22,000 acres.
| 4.2. |
Property Location |
The Project is located in Lander County, Nevada, approximately 34 miles west of Carlin (63 miles west of Elko) and 16 miles south of Interstate Highway I-80. Figure 4-1 shows the location of the Project. The closest town to the Project is Crescent Valley on Nevada State Highway 306. Access from Elko takes approximately one hour.
| Practical Mining LLC | February 5, 2018 |
| Klondex Mines Ltd. | Technical Report for the Fire Creek Project, | Page 35 |
| Lander County, Nevada |

| Practical Mining LLC | February 5, 2018 |
| Page 36 | Property Description and Location | Klondex Mines Ltd. |
| 4.3. |
Status of Mineral Titles |
The Project comprises private fee lands (both leased and owned) and unpatented lode mining claims. Figure 4-2 depicts the current land status. The land position shown on Figure 4-2 includes approximately 18,400 acres of unpatented federal lode mining claims, 3,208 acres of private fee land, and 409 acres of mineral leases. Overall, the Fire Creek land package is approximately 22,000 acres.
| Practical Mining LLC | February 5, 2018 |
| Klondex Mines Ltd. | Technical Report for the Fire Creek Project, | Page 37 |
| Lander County, Nevada |

Table 4-1 lists the 890 unpatented lode mining claims held by Klondex for the Project. Table 4-2 itemizes fee lands owned by KGS, and Table 4-3 itemizes fee lands leased by KGS. Unpatented claims are in current good standing through September 1, 2018. Leases are in good standing until the lease payment is due.
| Practical Mining LLC | February 5, 2018 |
| Page 38 | Property Description and Location | Klondex Mines Ltd. |
Table 4-1 Summary of Klondex Owned Unpatented Mining Claims (US Department of the Interior 2018)
| Claim Name | Section | Township | Range | Location Date | Number of |
| Claims | |||||
| Wood Tick 2, 4, 6, 8, 10, 12, 14, 16, 18, 20, 22 | 2 | 30N | 47E | 18-Jul-87 | 13 |
| Wood Tick 24, 26, 28, 30, 32, 34, 36 | 2 | 30N | 47E | 18-Jul-87 | 5 |
| Wood Tick 38, 40, 42, 44, 46, 48, 50, 52 | 36 | 31N | 47E | 21-Jul-87 | 8 |
| G 1-16 | 26 | 30N | 47E | 23-Jan-90 | 16 |
| Deb 2, 4 | 34 | 30N | 47E | 13-Dec-91 | 2 |
| Revenge 2, 20 | 34 | 30N | 47E | 16-Dec-91 | 2 |
| Revenge 4, 6 | 34 | 30N | 47E | 17-Dec-91 | 2 |
| Revenge 10, 12, 14 | 34 | 30N | 47E | 18-Dec-91 | 3 |
| Revenge 22 | 34 | 30N | 47E | 9-Jan-92 | 1 |
| Revenge 8, 28 | 34 | 30N | 47E | 26-Jan-92 | 2 |
| Revenge 16, 18 | 34 | 30N | 47E | 6-Feb-92 | 2 |
| Revenge 24, 26 | 34 | 30N | 47E | 13-Feb-92 | 2 |
| K 1 - 20 1 | 16 | 30N | 47E | 25-Jun-92 | 20 |
| K 21 - 27 2 | 16 | 30N | 47E | 26-Jun-92 | 7 |
| Alan 1-14 | 31 | 30N | 47E | 15-Feb-93 | 14 |
| HS 2, 4, 6, 8, 10, 12, 14, 16, 18, 20, 22, 24, 66 | 12 | 29N | 48E | 23-Oct-93 | 13 |
| HS 48, 50, 52, 54, 56, 58, 60, 62, 64 | 14 | 29N | 48E | 29-Oct-93 | 9 |
| TL, 2, 4, 6 | 20 | 30N | 47E | 10-Nov-93 | 3 |
| TL 8, 10, 12, 14, 16, 18 | 20 | 30N | 47E | 10-Nov-93 | 6 |
| N 2, 4, 6, 8, 10, 12, 14, 16, 18 | 32 | 30N | 47E | 17-Nov-93 | 9 |
| N 20, 22, 24, 26, 28, 30 | 32 | 30N | 47E | 18-Nov-93 | 6 |
| HS 68, 70, 72, 71, 76, 78 | 14 | 29N | 47E | 7-Dec-93 | 6 |
| TL 20, 22, 24, 26 | 20 | 30N | 47E | 21-Jun-94 | 4 |
| FCRA 1- 20 | 26 | 30N | 47E | 28-Sep-95 | 20 |
| T 1 - 10 | 14 | 30N | 47E | 13-Oct-99 | 10 |
| Hondo 1, 3, 5, 7, 9, 11, 13, 15, 18, 20, 22, 24, 26, 28, 30, 32, 157, 158 | 24 | 30N | 47E | 20-Sep-03 | 18 |
| FC 1-18, 38-46 3 | 25, 35, 36 | 30N | 47E | 21-Sep-03 | 27 |
| What If 29-37 | 35, 36 | 30N | 47E | 21-Sep-03 | 9 |
| Deb 1, 3, 5 | 34 | 30N | 47E | 22-Sep-03 | 3 |
| Revenge 1, 11, 13, 15, 17, 19, 21, 23, 25, 27 | 34 | 30N | 47E | 22-Sep-03 | 10 |
| Revenge 3, 5, 7, 9, 29, -31 | 34 | 30N | 47E | 23-Sep-03 | 7 |
| T 19-26 | 10, 11, 14 | 30N | 47E | 23-Sep-03 | 8 |
| T 11-18, 27-36 | 11, 14 | 30N | 47E | 24-Sep-03 | 18 |
| T 38-60 | 3, 10 | 30N | 47E | 05-Oct-03 | 23 |
| T 61-72 | 2, 3, 10 | 30N | 47E | 6-Oct-03 | 12 |
| FCXX 1-40 | 15, 22 | 30N | 47E | 24-Nov-04 | 40 |
| N 1, 3, 11, 13, 19, 21, 23, 25, 27 | 32 | 30N | 47E | 11-Sep-06 | 9 |
| N 5, 7, 9, 15, 17, 29, 31 | 32 | 30N | 47E | 12-Sep-06 | 7 |
| TL 1, 3, 5, 7, 9, 11, 13, 15, 17 | 20 | 30N | 47E | 13-Sep-06 | 9 |
| Practical Mining LLC | February 5, 2018 |
| Klondex Mines Ltd. | Technical Report for the Fire Creek Project, | Page 39 |
| Lander County, Nevada |
| Claim Name | Section | Township | Range | Location Date | Number of |
| Claims | |||||
| TL 19, 21, 23, 25, 27-31 | 20 | 30N | 47E | 14-Sep-06 | 9 |
| CH 1-18 | 30 | 30N | 47E | 19-Sep-06 | 18 |
| TWE 18, 20-36 | 27, 28 | 30N | 47E | 20-Sep-06 | 18 |
| Hondo 2, 4, 6, 8, 10, 12, 14, 16, 17, 19, 21, | |||||
| 23, 25, 27, 29, 31 | 24 | 30N | 47E | 4-Oct-06 | 18 |
| TWE 1-18 | 21, 27, 28 | 30N | 47E | 10-Oct-06 | 18 |
| WT 1, 3, 5, 7, 9, 11, 13, 15, 17, 29, 31, 33, | 2 | 30N | 47E | 31-Oct-06 | 13 |
| 35 | |||||
| WT 37, 39, 41, 43, 45, 47, 49, 51, 53 - 55 | 36 | 31N | 47E | 1-Nov-06 | 11 |
| WT 19, 21, 23, 25, 27 | 2 | 31N | 47E | 7-Nov-06 | 5 |
| WT 56 - 72 | 25, 36 | 31N | 47E | 8-Nov-06 | 17 |
| HS 1, 3, 5, 7, 9, 11, 13, 15, 17, 19, 21, 25, 49, 51, 53, 55, 57, 59, 61, 63, 65 | 11, 12, 14 | 29N | 48E | 3-Sep-09 | 22 |
| HS 67,69, 71, 73, 75, 77, 79, 81, 83 | 14 | 29N | 48E | 24-Nov-09 | 9 |
| Malpais 1-30,265 | 3, 4, 15, 16 | 29N | 47E | 4-Oct-14 | 31 |
| Malpais 221, 223, 225, 227, 229, 231, 233, 235, 237 | 24, 25 | 30N | 46E | 4-Oct-14 | 9 |
| Malpais 210-222, 224, 226, 228, 230, 232 234, 236, 238-264 | 7, 17, 18, 19, 30, 31 | 30N | 47E | 4-Oct-14 | 46 |
| Malpais 31-48, 87-92, 111-164, 201-209, 346, 347 | 3, 4, 5, 6, 7, 8, 16 | 30N | 47E | 5-Oct-14 | 89 |
| Malpais 316- 345 | 28, 29, 31, 32 | 31N | 47E | 5-Oct-14 | 30 |
| Malpais 67, 68, 93, 94 | 1 | 30N | 46E | 6-Oct-14 | 4 |
| Malpais 49-66, 69-86, 95-110, | 3, 4, 6 | 30N | 47E | 6-Oct-14 | 52 |
| Malpais 302-315 | 7, 17, 18 | 31N | 47E | 6-Oct-14 | 14 |
| Malpais 165, 200 | 16 | 30N | 47E | 7-Oct-14 | 36 |
| Malpais 266-301 | 8, 9, 15, 16 | 31N | 48E | 7-Oct-14 | 36 |
| Unpatented Mining Claims | 890 | ||||
| Notes | |||||
| 1. Amended K17 17-Aug-1992, K 18, K20 14-Aug-1992 | |||||
| 2. Amended K22, K 24, K25, K26, K 27 17-Aug-1992 | |||||
| 3. Amended map 8/31/2006 | |||||
Table 4-2 Summary of Owned Fee Land Holdings T30N R47E (Lander County 2018)
| APN | Section | Legal Description | Royalty | Acres |
| 007-090-03 | 1 | NW4SW4SW4 | N/A | 10 |
| 007-070-09 | 5 | NE4NW4/NW4SE4NW4 | N/A | 55.8 |
| 007-070-13 | 5 | LOT 4 | N/A | 46 |
| 007-070-18 | 5 | S2SW4NW4 | N/A | 20 |
| 007-110-01 | 9 | NW4 | N/A | 160 |
| 007-110-10 | 9 | W2NW4SW4 | N/A | 20 |
| 007-110-13 | 9 | E2NE4NE4/SE4NE4/SE4SW4NE4 | N/A | 70 |
| 007-110-22 | 9 | NE4SE4SW4 | N/A | 10 |
| Practical Mining LLC | February 5, 2018 |
| Page 40 | Property Description and Location | Klondex Mines Ltd. |
| APN | Section | Legal Description | Royalty | Acres |
| 007-110-23 | 9 | SE4NE4/SW4 | N/A | 10 |
| 007-120-06 | 11 | SE4SW4 | N/A | 40 |
| 007-120-15 | 11 | S2SE4NW4/N2NE4SW4/N2NW4SE4 | N/A | 60 |
| 007-120-18 | 11 | SW4SW4NW4 | N/A | 10 |
| 007-120-29 | 11 | N2NW4NW4 | N/A | 20 |
| 007-140-01 | 15 | N1/2 NW1/4 | N/A | 80 |
| 007-140-03 | 15 | SW1/4 NW1/4 | N/A | 40 |
| 007-140-05 | 15 | SW1/4 NE1/4 | N/A | 40 |
| 007-140-12 | 15 | SE1/4 SW1/4 | N/A | 40 |
| 007-140-14 | 15 | Lots 1 & 2 | N/A | 65.39 |
| 007-140-15 | 15 | SE1/4 NE1/4 SW1/4 | N/A | 10 |
| 007-140-17 | 15 | SE4NE4NE4 | N/A | 10 |
| 007-140-18 | 15 | SW4NE4NE4 | N/A | 10 |
| 007-140-19 | 15 | S1/2 NW1/4 NE 1/4 | N/A | 20 |
| 007-140-20 | 15 | N1/2 NW1/4 NE1/4 | N/A | 20 |
| 007-140-21 | 15 | NW1/4 NE1/4 SW1/4 | N/A | 10 |
| 007-140-22 | 15 | NE1/4 NE 1/4 SW1/4 | N/A | 10 |
| 007-140-23 | 15 | SW1/4 NE1/4 SW1/4 | N/A | 10 |
| 007-140-25 | 15 | NW1/4 NE1/4 NE1/4 | N/A | 10 |
| 007-140-26 | 15 | NE4NE4NE4 | N/A | 10 |
| 007-060-11 | 17 | SE4/SW4/NE4 | N/A | 480 |
| 007-150-02 | 19 | W2 OF LOT 4 | N/A | 20 |
| 007-150-10 | 19 | E2NE4NE4 | N/A | 20 |
| 007-150-13 | 19 | LOT 8, E2 OF LOT 7 | N/A | 60 |
| 007-150-14 | 19 | LOTS 9,10 & W2 OF LOT 1 | N/A | 100 |
| 007-150-16 | 19 | E2SE4NE4 | N/A | 20 |
| 007-150-17 | 19 | E2 OF LOT 16/LOTS 14,15 & 17 | N/A | 140.96 |
| 007-150-18 | 19 | W2 OF LOT 13 | N/A | 20 |
| 007-150-19 | 19 | E2 OF LOT 13 | N/A | 20 |
| 007-150-24 | 19 | E2 OF LOT 18 | N/A | 20 |
| 007-610-01 | 21 | NW4 | N/A | 160 |
| 007-610-03 | 21 | N2NW4NE4/W2NE4NE4 | N/A | 40 |
| 007-610-07 | 21 | E2SE4NE4 | N/A | 20 |
| 007-610-10 | 21 | SE4 | N/A | 160 |
| 007-160-01 | 23 | NW4NE4 | N/A | 40 |
| 007-160-02 | 23 | NE ¼ NE ¼ | N/A | 40 |
| 007-160-05 | 23 | W2SE4NE4 | N/A | 20 |
| 007-160-06 | 23 | E1/2 SE1/4 NE1/2 | N/A | 20 |
| 007-160-08 | 23 | N1/2 NE1/4 SE1/4 | N/A | 20 |
| 007-160-09 | 23 | SE1/4 NE1/4 SE1/4 | N/A | 10 |
| 007-160-16 | 23 | N1/2 SE1/4 NW1/4 | 5% NSR | 20 |
| 007-160-17 | 23 | N1/2 NW1/4 SW1/4 | N/A | 20 |
| 007-160-18 | 23 | NW1/4 NW1/4 | N/A | 40 |
| Practical Mining LLC | February 5, 2018 |
| Klondex Mines Ltd. | Technical Report for the Fire Creek Project, | Page 41 |
| Lander County, Nevada |
| APN | Section | Legal Description | Royalty | Acres |
| 007-160-19 | 23 | NE1/4 NW1/4 | N/A | 40 |
| 007-160-20 | 23 | NE1/4 SW1/4 NW1/4 | N/A | 10 |
| 007-160-21 | 23 | S1/2 SE1/4 NW1/4 | N/A | 20 |
| 007-160-22 | 23 | NE1/4 NE/1/4 SW1/4 | N/A | 10 |
| 007-160-23 | 23 | E2SE4SE4 | N/A | 20 |
| 007-160-25 | 23 | W1/2 SW1/4 NW1/4, SE1/4 SW1/4 NW1/4 | 5% NSR | 20 |
| 007-160-26 | 23 | NW1/4 NE1/4 SW1/4 | N/A | 10 |
| 007-160-27 | 23 | NE1/4, SW1/4 SE1/4, SE1/4 NW1/4SE1/4 | N/A | 20 |
| 007-160-28 | 23 | SW1/4 NE1/4 SE1/4, NW1/4 SE1/4 SE1/4 | N/A | 20 |
| 007-180-09 | 25 | N2NW4SE4/N2NE4SE4 | N/A | 40 |
| 007-180-20 | 25 | S2NW4NW4/W2NE4NW4 | N/A | 40 |
| 007-180-22 | 25 | E2SW4NE4/S2NW4NE4/SW4NE4NE4 | N/A | 50 |
| 007-180-28 | 25 | N2SE4NE4 | N/A | 20 |
| 007-620-03 | 27 | NE4NE4 | N/A | 40 |
| 007-620-05 | 27 | NW4SE4 | N/A | 40 |
| 007-620-06 | 27 | SW4SE4 | N/A | 40 |
| 007-170-07 | 29 | NE4 | N/A | 160 |
| 007-170-06 | 29 | NW4SW4NW4/E2SW4NW4/SE4NW4 | N/A | 70 |
| 007-170-10 | 29 | S2NE4NW4 | N/A | 20 |
| 007-640-06 | 33 | S1/2 NW1/4 | N/A | 80 |
| 71 | Fee Parcels | 3,208.15 |
Table 4-3 Summary of Leased Fee Land Holdings
| APN | Legal Description | Lessor | Royalty | Expiration | Acres |
| Section 9 T30N R47E MDB&M | |||||
| 007-110-07 | SE1/4 | Fire Creek Lands LLC | 3% NSR | 01-May-36 | 160 |
| Section 15 T30N R47E MDB&M | |||||
| 007-140-04 | SE1/4 NW1/4 | McCarthy | 4% NSR | (2) | 40 |
| 007-140-06 | SE1/4 NE1/4 | York | 4% NSR | (2) | 40 |
| 007-140-10 | NE1/4 SE1/4, E1/2 NW1/4 SE1/4 | Pittington | 2.5% NSR | (2) | 60 |
| 007-140-07 | N2NW4SW4 | Fire Creek Lands LLC | 3% NSR & 0.5% wheelage royalty (1) | 31-July-33 | 20 |
| 007-140-09 | W2NW4SE4 | Fire Creek Lands LLC | 3% NSR & 0.5% wheelage royalty (1) | 31-July-33 | 20 |
| Section 23 T30N R47E MDB&M | |||||
| Practical Mining LLC | February 5, 2018 |
| Page 42 | Property Description and Location | Klondex Mines Ltd. |
| APN | Legal Description | Lessor | Royalty | Expiration | Acres |
| 007-160-04 | SW4NE4 | Fire Creek Lands LLC | 3% NSR & 0.5% wheelage royalty (1) | 31-July-33 | 40 |
| 007-160-13 | S2SW4SW4 | Fire Creek Lands LLC | 3% NSR | 01-May-36 | 20 |
| 007-160-24 | NE4NW4SE4 | Fire Creek Lands LLC | 3% NSR & 0.5% wheelage royalty (1) | 31-July-33 | 10 |
| Section 19 T30N R48E MDB&M | |||||
| 007-060-69 | Parcel 1 of the Sharp Hospital Map recorded in the Office of the Lander County Recorder in Book 375, Official Records, Page 170 | Third Party Lessor | 3% NSR & 0.5% wheelage royalty (1) | 31-July-33 | 9 |
| Section 27 T30N R48E MDB&M | |||||
| 005-230-38 | NW4NW4NW4 | Fire Creek Lands LLC | 5% NSR | 01-May-35 | 10 |
| 11 Leased Fee Parcels | 429 | ||||
| Notes: | ||
| 1. |
Wheelage royalty is calculated on mineralization mined from other properties which is transported underground through the leased property, and; | |
| 2. |
The lease agreement remains in full force and effect for so long as any mining operations (as defined in the lease agreement) are being conducted on the relevant property on a continuing basis. | |
Unpatented lode mining claims grant mineral rights and access to the surface within the boundaries of the claim. These rights are maintained by paying a maintenance fee of $155 per claim to the BLM prior to September 1st of each year. Failure to pay the maintenance fees on timewill deem the claims “closed” by the BLM. The unpatented lode mining claims held by Klondex are currently in good standing through September 1, 2018. In addition to BLM maintenance fees, Klondex must record a Notice of Intent to Hold and pay a fee of $12.50 per claim to the county in which the unpatented lode mining claims are situated. The claims held by Klondex in Lander and Eureka counties are currently in good standing with the counties through November 1, 2018.
The private fee lands and leases are subject to differing cash payments, net smelter return royalties (NSR), and wheelage royalties.
Royalties affect the following parcels owned and / or leased by Klondex, as listed in Table 4-2 and Table 4-3. Property agreement obligations are listed in Table 4-4.
| Practical Mining LLC | February 5, 2018 |
| Klondex Mines Ltd. | Technical Report for the Fire Creek Project, | Page 43 |
| Lander County, Nevada |
Table 4-4 Summary of Fire Creek Project Holding Costs
| Due Date | Commitment/Obligation | $ Obligation | Payable/Due to | Notes | ||||||||
| 9/1/2005 | 3 Leased Parcels - Extended Term | Third Party Lessors | 1. 1987 Leases extended for 10 years from 9/1/2005 | |||||||||
| 8/18/2015 | Property Taxes - 3 Leased Parcels | $ | 146.78 | Lander County Treasurer | Lessee to pay property taxes | |||||||
| 8/18/2018 | Property Taxes 71 - Klondex Owned Parcels | $ | 67,803.33 | Lander County Treasurer | Real Property Taxes Due 3rd Monday of August annually | |||||||
| 8/18/2018 | Property Taxes 2 - Klondex Owned Parcels | $ | 84.08 | Eureka County Treasurer | Real Property Taxes Due 3rd Monday of August annually | |||||||
| 8/31/2018 | BLM Claim Fees - 890 Claims | $ | 137.950.00 | Bureau of Land Management | 890 Klondex Owned Claims x $155/Claim | |||||||
| 9/1/2018 | 3 Leased Parcels - Annual AMR Payment | $ | 24,000.00 | 7 Third Party Lessors | Annual AMR payment due on lease anniversary | |||||||
| 9/1/2018 | Insurance Certificates | 7 Third Party Lessors | Insurance certificates required under terms of leases | |||||||||
| 11/1/2018 | County NOI to hold – 890 Claims | $ | 11,125.00 | Lander County Recorder | 890 Klondex Owned Claims x $12.50/claim | |||||||
| 9/1/2018 | 3 Leased Parcels - Expire | 7 Third Party Lessors | Leases expire - Renew | |||||||||
| Total | $ | 240,962.41 |
| Notes: | ||
| 1. | The lease agreement remains in full force and effect for so long as any mining operations (as defined in the lease agreement) are being conducted on the relevant property on a continuing basis. | |
Source: Erwin and Thompson Title Report
In addition, pursuant to a mining lease agreement effective July 31, 2013, with respect to five leased fee parcels, Klondex is required to pay minimum rental payments of $50,000 per year for the first ten years of the lease, which increase by $10,000 for each subsequent ten-year period (including any renewal period). This lease also includes provisions that subject Klondex to an additional increase under certain circumstances.
In addition, pursuant to a mining lease agreement effective May 1, 2016, with respect to three leased fee parcels, Klondex is required to pay minimum advance royalty payments of $95,000 per year for the first five years of the lease, which increase by $9,500 for each subsequent five year period (including any renewal period). This lease also includes provisions that subject Klondex to an additional increase under certain circumstances.
On February 12, 2014, the Company entered into a royalty agreement (the “FC Royalty Agreement”) between Franco-Nevada US, a subsidiary of Franco Nevada Corporation (FNC), and KGS. Pursuant to the FC Royalty Agreement, KGS raised proceeds of US $1,018,050 from the grant to Franco-Nevada US of a 2.5% NSR royalty for Fire Creek. The royalty applies to all production from Fire Creek beginning in 2019.
| Practical Mining LLC | February 5, 2018 |
| Page 44 | Property Description and Location | Klondex Mines Ltd. |
KGS entered into a gold supply agreement with Waterton Global Value, L.P. (Waterton) dated March 31, 2011, as amended and restated October 4, 2011 (the Gold Supply Agreement). Pursuant to the Gold Supply Agreement, the Company granted Waterton the right to purchase refined bullion (as defined in the Gold Supply Agreement) produced from the Project for the period commencing February 28, 2013 and ending February 28, 2018, subject to adjustment (the Term). If the Company has not delivered an aggregate minimum of 150,000 ounces of refined bullion during the first four years prior to the end of the Term, the Term will be extended until an aggregate of 185,000 ounces of refined bullion has been delivered (including any refined bullion delivered during the original Term) to Waterton. Under the Gold Supply Agreement, in the event that Waterton exercised its right to purchase refined bullion during the period of February 28, 2013 to May 31, 2013, the purchase price per ounce payable by Waterton was to be the purchase price per ounce of the last settlement price of gold on the London Bullion Market Association (the LMBA) PM Fix on the last trading day prior to the date Waterton provides notice to the Company that it intended to exercise its purchase right (the Pricing Date) less a 1% discount (which discount is only applicable if such price is more than US$900 per ounce). In the event Waterton exercises its right to purchase refined bullion during the period following May 31, 2013 and before February 28, 2016, the purchase price per ounce payable by Waterton is the average settlement price of gold on the LMBA PM Fix for the 30 trading days immediately preceding the applicable Pricing Date (the Average Price) less a 1% discount; provided that in each case, if such price per ounce is less than US$900 the discount will be nil. In addition, in the event Waterton exercises its right to purchase refined bullion after February 28, 2016, the purchase price per ounce will be the Average Price immediately preceding the applicable Pricing Date, without any discount.
Land information regarding fee lands and mining claims was provided by Klondex. The authors are not aware of any conflicting surface rights in this area. Mining claims are staked by physically placing visible location monuments and corner markers on-location in the field. Location maps of the claims are filed with the BLM and Lander County Recorder’s office.
Klondex’s claims are active and uncontested. To the authors’ knowledge there are no environmental or social factors that would affect access. Grazing rights may exist in the area, but conflicts with local ranchers are not common in this region. Protected habitat for sage grouse has not been defined in this area. There are archaeological considerations in the immediate area of the Project; however, all new surface disturbance proposed by KGS is reviewed and permitted by the BLM prior to construction.
| 4.4. |
Location of Mineralization |
Gold mineralization at the Project occurs in steeply dipping epithermal veins within Tertiary basalt flows and intrusive rocks. The mineralized basalt rocks are a suite of mafic, extrusive rocks associated with the regional north-northwest-trending NNR structural zone. The NNR system has been documented in multiple geophysical and geological studies (e.g. John et al., 2000; Ponce, D.A. et al., 2008; Watt, J.T. et al., 2007) and is distinguished as a linear magnetic anomaly approximately 30 miles wide that extends 190 miles south-southeast from the Oregon-Nevada border to central Nevada. The NNR originates from the McDermitt Caldera in northwest Nevada and is likely related to impingement of the Yellowstone hot-spot on continental crust (Zoback et al., 1994). Figure 4-3 shows the location of the Project relative to the NNR.
| Practical Mining LLC | February 5, 2018 |
| Klondex Mines Ltd. | Technical Report for the Fire Creek Project, | Page 45 |
| Lander County, Nevada |

| Practical Mining LLC | February 5, 2018 |
| Page 46 | Property Description and Location | Klondex Mines Ltd. |
Klondex has an approved plan of operations with the BLM covering the current exploration and mining activities at the Project. There are no environmental permitting issues known to the authors which are related to proposed Project activities.
| Practical Mining LLC | February 5, 2018 |
| Klondex Mines Ltd. | Technical Report for the Fire Creek Project, | Page 47 |
| Lander County, Nevada |
| 5. |
Accessibility, Climate, Vegetation, Physiography, Local Resources and Infrastructure |
| 5.1. |
Access to Project |
The Project is easily reached from the town of Elko by driving west on Highway I-80 for 40 miles to the Beowawe and Crescent Valley Exit #261. From Exit #261, proceed south on Nevada State Highway 306 for 16 miles (passing through Beowawe) to 10th Street (there is a sign on the right). On 10th Street, there is a Company sign at the turn that indicates, “Klondex Gold & Silver Mines, Limited”. 10th Street is the Project access road. The Project is located five miles west on 10th Street in Lander County, Nevada.
The state and county roads leading to the Project are mostly paved and maintained to service ranches and mines in Crescent Valley; such as Barrick Gold Corporation’s Cortez Mine. In this part of Nevada, it is common practice for mine staff to commute long distances for work on a daily basis. The average commute for Klondex staff is one hour each way.
| 5.2. |
Climate |
Project climate is typical for northern Nevada with hot, dry summers and cold winters. Average daily summer temperatures range from 80° Fahrenheit (°F) to 90°F, and average winter low temperatures range from the low 40s°F to 20°F. Summer temperature extremes may reach 100°F for short periods, and winter extreme temperatures may drop below 0°F for short periods. Fieldwork, including exploration drilling, is commonly conducted throughout the year in this area. Mines in the Crescent Valley typically operate all year without experiencing any major weather-related problems.
| 5.3. |
Vegetation |
Fire Creek vegetation is mainly limited to sagebrush, other species of low vegetation and some grasses. There are no trees at the Project. Due to the low amount of rainfall, the vegetation is low and sparse. There is a small marsh associated with the Fire Creek drainage that provides some wetland vegetation.
| 5.4. |
Physiography |
The Project lies in elevation between 4,900 feet and 7,200 feet. The United States Geological Survey (USGS) published a base-relief map, which covers the Project area titled, “Mud Spring Gulch Quadrangle Nevada-Lander Co. 7.5 Minute Series (Topographic)”. The topographic relief is moderate with mature topography consisting mostly of rounded hills with steeper grades along more competent strata. The streams down-gradient from the Project are ephemeral and are sourced by up-gradient springs.
| Practical Mining LLC | February 5, 2018 |
| Page 48 | Accessibility, Climate, Vegetation, Physiography, | Klondex Mines Ltd. |
| Local Resources and Infrastructure |
| 5.5. |
Local Resources and Infrastructure |
The nearest rail siding is at the town of Beowawe, a small community of about 50 people, approximately 15 miles north of the Project. Crescent Valley, a small town with a population of approximately 200 people, is about seven miles south of the Project.
The towns of Battle Mountain and Elko, about 52 miles northwest and 63 miles northeast of the Project, respectively, are the nearest larger towns and supply most of the labor force. These towns are the only locations with amenities and services such as motels, fuel, grocery stores, and restaurants. The nearest commercial retail stores for fuel and groceries are in Battle Mountain, 52 miles to the northwest.
Klondex’s land holdings at Fire Creek have adequate acreage to support future exploration and mining activities. Fire Creek mineralization will be transported to the Company’s Midas Mill for processing.
Electrical power is provided to the Project by NV Energy, Inc. through a transmission line and substation located near the eastern Project boundary. The substation was connected to the NV Energy electrical grid in 2013.
| Practical Mining LLC | February 5, 2018 |
| Klondex Mines Ltd. | Technical Report for the Fire Creek Project, | Page 49 |
| Lander County, Nevada |
| 6. |
History |
| 6.1. |
Exploration History |
The first recorded lode claim dates to 1933, but no other activity is known prior to 1967. Table 6-1 below itemizes exploration performed since 1967.
Table 6-1 Exploration History
| Dates | Company | Details |
| 1967 | Union Pacific Resources | Drilled two core holes. |
| 1974 to 1975 | Placer Development Ltd. | Drilled 22 rotary holes. |
| 1975 | Klondex Mines Ltd. | Acquired the Project. 1980-1983 drilled 64 rotary holes. 1981 gold test production. |
| 1984 | Minex Resources, Inc. | Leased the Project from Klondex, drilled 13 rotary holes. |
| 1986 to 1987 | Alma American Mining Company (“Alma”) | Leased the Project from Klondex, drilled 64 rotary holes. |
| 1988 | Aurenco Joint Venture (“Aurenco JV”) | Aurenco JV formed between Black Beauty Mining and Covenanter Mining. |
| 1988 to 1990 | Aurenco JV | Leased the Project from Klondex. |
| 1990 to 1995 | Klondex Mines Ltd. | No activity. |
| 1995 to 1996 | North Mining Inc. (“North Mining”) | Leased the Project from Klondex. Drilled 67 holes, performed IP and HEM surveys. |
| 1996 to 2004 | Klondex Mines Ltd. | No activity. |
| 2004 to 2012 | Klondex Mines Ltd. | Began a deep exploration program. Development commenced in 2011. |
| 2012 to2015 | Klondex Mines Ltd. | New Management and Board of Directors in 2012, ongoing exploration, development and bulk sampling. |
| 2016 to Present | Klondex Mines Ltd. | Received Record of Decision for the Environmental Assessment from the Bureau of Land Management in February 2016, began commercial production |
Prior to 1994, exploration focused on near-surface oxide mineralization, most likely for bulk-mineable targets. Klondex acquired Fire Creek in 1975 and subsequently performed rotary drilling and a small test heap leach operation that produced 67 oz Au. Minex leased the Project in 1984-1985, performed a small amount of drilling and conducted a larger test heap leach operation using approximately 30,000 tons of material. The material tested was chosen based only on exploration drilling without grade control, was primarily waste, and ultimately produced less than 1,000 oz Au. Alma American Mining Company, a division of Coors Brewery, leased the Project from 1986-1987 and performed rotary drilling and other exploration work. The Aurenco Joint Venture, formed between Black Beauty Mining and Covenanter Mining, leased the Project from 1988-1999. From 1988 to 1990, the Aurenco JV completed 51,476 feet of rotary drilling, 500 soil samples, and 750 surface rock chip samples. The Project was ventured with Coeur Mining from 1993 to 1994. The Fire Creek Joint Venture was formed between Aurenco and North Mining in 1995. During 1995 and 1996, North Mining commenced the first technical exploration drilling program to examine deeper targets. North Mining drilled 67 rotary and core holes for a total of 39,570 feet. This program successfully drilled the first high-grade gold intercept at depth at Fire Creek. In 1995, North Mining conducted an IP-Resistivity survey along ten east-west lines. Much of North Mining’s drill locations from 1995 and 1996 targeted results from these geophysical tests; however, the wide point and line spacing did not detect the narrow vein anomalies. Details of this earlier geophysical survey were itemized in the Fritz Geophysics report for Klondex (Fritz, 2006) and in an unpublished report for North Mining (Edmondo, 1996). North Mining dropped the Project in 1996 after determining that the Project was not likely to meet their minimum contained gold requirement for continued exploration. Aurenco dropped the Project in 1999 without conducting further work, and the Project reverted to 100% Klondex control.
| Practical Mining LLC | February 5, 2018 |
| Page 50 | History | Klondex Mines Ltd. |
No work took place until 2004, when Klondex began systematically and aggressively drilling deep targets to define the mineralization potential recognized by North Mining. In 2004, Klondex based its initial drilling targets on the results of North Mining’s drilling program carried out from 1995 to 1996 in combination with information including integrated geologic mapping, surface geochemistry, airborne helicopter electromagnetic (HEM) surveys and IP dipole-dipole surveys. Klondex focused its exploration drilling on targets ranging from 500 to 1,700 feet below the surface, yielding grades up to 1.0 opt.
Klondex conducted another IP survey in 2004 that used tighter line spacing and dipole points, which identified north-northwest trending alteration zones, coincident with the general strike of veins identified by Klondex drilling and coincident with the general trend of NNR faults (see Regional Geology, Section 7.1 of this Report). From 2004 to 2010, Klondex drilled 231 surface holes for a total of 297,586 feet.
| 6.2. |
Historical Mining |
Historic production, as itemized previously (Raven et al., 2011), is limited to marginal mining of oxidized siliceous cap material from a pit and the construction of a small test heap leach operation from 1988 to 1990. A summary of the Raven report follows:
With the exception of current operations, there has been no other production at the Project since 1990.
| Practical Mining LLC | February 5, 2018 |
| Klondex Mines Ltd. | Technical Report for the Fire Creek Project, | Page 51 |
| Lander County, Nevada |
| 7. |
Geological Setting and Mineralization |
| 7.1. |
Regional Geology |
The Project is located on the northeast flank of the Shoshone Range in Lander County Nevada, and in the western half of the NNR (Figure 7-1). The surface and near-surface NNR is composed of an alignment of middle-Miocene basaltic (and lesser rhyolitic) dikes and up to 4,200 feet of basin-filling lava flows, pyroclastic units and lacustrine sedimentary units (Zoback et al., 1994; John et al., 2000) that are distinguishable regionally as a prominent, north-northwest trending aeromagnetic anomaly that extends some 300 miles south-southeastward from the Oregon-Nevada border. The NNR is likely related to a pre-Cenozoic, deep-crustal fault reactivated between 16.5 and 14.7 million annum (Ma) (Zoback et al., 1994; Theodore et al., 1998; John et al., 2000) and reflects west-southwest – east-northeast regional extension (Wallace & John, 1998; John & Wallace, 2000). Some workers (Zoback & Thompson, 1978; Pierce & Morgan, 1992) postulate that impingement of the Yellowstone hot spot on this area at approximately 17 Ma is related to Cenozoic NNR activity.
Basement rocks of the northern Shoshone Range are comprised of lower Paleozoic primarily siliciclastic sedimentary units of the Roberts Mountain Allochthon upper plate (John & Wrucke, 2003Figure 7-2 and Figure 7-3). In this area, the upper plate is 1,000 to 2,000 feet thick, and the Roberts Mountain Thrust dips west-northwest (Kiska Metals Corp., 2014). The primary upper plate units in the Fire Creek area are imbricate thrust stacks of Ordovician Valmy Formation, which is comprised of sandstone, shale, chert, and quartzite and the Devonian Slaven Chert (Gilluly & Gates, 1965; John & Wrucke, 2003).
Overlying the Paleozoic sedimentary rocks is a discontinuous tuff layer. John et al. (2003) and John & Wrucke (2003) assigned this unit as the Caetano Tuff (33.87 Ma) in the vicinity of Mule Canyon. However, Colgan et al. (2014) documents the tuff of Cove Mine (34.4 Ma) and the Nine Hill Tuff (25.4 Ma) in the northern Shoshone Range in this stratigraphic position. The origin and continuity of this unit remains enigmatic.
A middle-Miocene package of intercalated basalt and basaltic andesite flows and associated pyroclastic units intrudes and unconformably overlies the lower sedimentary and tuffaceous rocks. As these rocks represent local paleotopography, their presence and thickness are highly variable. Competent flow units and intrusives in this package form the dominant host for gold mineralization both at Fire Creek and the nearby Mule Canyon Mine. As such, local expressions of this package have been informally named the Mule Canyon Sequence (John et al., 2003 and references therein) and the Fire Creek Sequence (McMillin & Milliard, 2013, Figure 7-4 and Figure 7-5).
| Practical Mining LLC | February 5, 2018 |
| Page 52 | Geological Setting and Mineralization | Klondex Mines Ltd. |
The Andesite of Horse Heaven, a sparsely porphyritic andesite to basaltic andesite, conformably overlies the basalt flow package (John & Wrucke, 2003). This unit covers an extensive area of the Northern Shoshone Range (Gilluly & Gates, 1965) and ranges from less than 130 feet to greater than 800 feet thick (John & Wrucke, 2003). Samples from this unit collected near the Mule Canyon Mine yielded whole-rock ages of 15.86±0.12 Ma and 15.2±0.8 Ma (John & Wrucke, 2003). Another sample collected near Corral Canyon, south of the Project, yielded a whole-rock age of 15.76±0.80 Ma (John et al., 2000). The Andesite of Horse Heaven is currently recognized as the youngest unit preserved at the Project.
Thick flows of dacite and trachydacite unconformably overly younger mafic units. John & Wrucke (2003) describe these as occurring mainly to the east of the Muleshoe Fault and represent rift-filling lavas that were sourced from the Sheep Creek Range. They report 40Ar/39Ar plagioclase age dates of 15.33±0.09 Ma and 15.34±0.10 Ma for samples collected near the Mule Canyon Mine and in the Sheep Creek Range, respectively.
Numerous steeply dipping, north-northwest- to north-striking mafic dikes are evident at the Project from drill data and mining operations (Edmondo, 1996; McMillin & Milliard, 2013) and are exposed in the open pits at the Mule Canyon Mine (John et al., 2003 and references therein), however, few mafic dikes have been mapped at the surface. These are interpreted as feeder dikes for the upper Mule Canyon Sequence and lower Andesite of Horse Heaven (Edmondo, 1996; John & Wrucke, 2003). Field and core observations at the Project support this interpretation.
The western margin of the NNR in the Northern Shoshone Range is marked by two high-angle fault sets. The dominant set is parallel to the rift axis striking north-northwest (N15-30°W) and exhibits dip-slip movement. The most prominent of these is the Muleshoe Fault, which is less than a mile east of both the Mule Canyon Mine and the Fire Creek Project (John et al., 2003). Faults in this orientation commonly host mafic dikes and provided structural control on eruption and volcanic rock deposition. A second high-angle fault set oriented east-northeast (N60-80°E) was active during NNR formation, most notably the Malpais and Argenta Faults (John et al., 2000; John et al., 2003). These faults display left-lateral oblique-slip, however, some of these were reactivated in the late Miocene after a clockwise rotation of extension direction (Zoback et al., 1981, 1994).
| Practical Mining LLC | February 5, 2018 |
| Klondex Mines Ltd. | Technical Report for the Fire Creek Project, | Page 53 |
| Lander County, Nevada |

| Practical Mining LLC | February 5, 2018 |
| Page 54 | Geological Setting and Mineralization | Klondex Mines Ltd. |

| Practical Mining LLC | February 5, 2018 |
| Klondex Mines Ltd. | Technical Report for the Fire Creek Project, | Page 55 |
| Lander County, Nevada |

| Practical Mining LLC | February 5, 2018 |
| Page 56 | Geological Setting and Mineralization | Klondex Mines Ltd. |

| Practical Mining LLC | February 5, 2018 |
| Klondex Mines Ltd. | Technical Report for the Fire Creek Project, | Page 57 |
| Lander County, Nevada |

| Practical Mining LLC | February 5, 2018 |
| Page 58 | Geological Setting and Mineralization | Klondex Mines Ltd. |
Numerous steeply dipping, north-northwest- to north-striking mafic dikes are evident at the Project from drill data and mining operations (Edmondo, 1996; McMillin & Milliard, 2013) and are exposed in the open pits at the Mule Canyon Mine (John et al., 2003 and references therein), however, few mafic dikes have been mapped at the surface. These are interpreted as feeder dikes for the upper Mule Canyon Sequence and lower Andesite of Horse Heaven (Edmondo, 1996; John & Wrucke, 2003). Field and core observations at the Project support this interpretation.
The western margin of the NNR in the Northern Shoshone Range is marked by two high-angle fault sets. The dominant set is parallel to the rift axis striking north-northwest (N15-30°W) and exhibits dip-slip movement. The most prominent of these is the Muleshoe Fault, which is less than a mile east of both the Mule Canyon Mine and the Fire Creek Mine (John et al., 2003). Faults in this orientation commonly host mafic dikes and provided structural control on eruption and volcanic rock deposition. A second high-angle fault set oriented east-northeast (N60-80°E) was active during NNR formation, most notably the Malpais and Argenta Faults (John et al., 2000; John et al., 2003). These display left-lateral oblique-slip, however, some of these were reactivated in the late Miocene after a clockwise rotation of extension direction (Zoback et al., 1981, 1994).
| 7.2. |
Local Geology |
| 7.2.1. |
Rock Units |
Basement rocks beneath the Fire Creek deposit have not been drilled sufficiently for positive unit identification. Imbricate stacks of Ordovician Valmy Fm. and Devonian Slaven Chert, part of the Roberts Mountain Thrust upper plate, are mapped to the west of the deposit and have been intercepted in deeper drilling beneath the local Miocene volcanic package. Thickness of the upper plate rocks in this region is unconstrained. Lower plate rocks are thought to be Roberts Mountain Formation, but this has not been drill-tested, and no outcrops of this unit occur nearby.
Overlying the Paleozoic sedimentary package is a 0 to 300-foot thick, discontinuous tuff unit, tentatively identified as the tuff of Cove Mine (C. Henry, pers. comm., 2013; D. John, pers. comm., 2014). The discontinuous nature of this unit is thought to be a function of paleo-topography.
Progressing upwards, unconformably overlying the tuff of Cove Mine, is approximately 500-foot thick section of interbedded lithic tuff beds, basalt flows and sills, and thin, laminated lacustrine sedimentary beds. These are grouped together under the Ttb (Tertiary tuff and basalt) moniker and are presented in ascending order.
Ttb1 is a variably welded lithic-scoria-lapilli tuff with only trace lithic fragments of Tertiary basalts andesites and possibly Tuff of Cove Mine. Distinct feature are intervals of large pumice fragments and more frequent ash-rich intervals (air-fall?) than Ttb2 and Ttb3. Basal organic-rich lacustrine beds. Variable basalt-andesite intervals that make up ~50% of unit that depending on contact characteristics (refer to Ttb2) maybe interpreted as sills or flows. Similar “sill” units at Mule Canyon dated ~16.4 - 16.1 Ma and Dunphy Pass ~16.5 -17 Ma. Country rock of tuff breccias and lacustrine sediments is >~35 Ma based on dated cross-cutting granodiorite dike.
| Practical Mining LLC | February 5, 2018 |
| Klondex Mines Ltd. | Technical Report for the Fire Creek Project, | Page 59 |
| Lander County, Nevada |
Ttb2 is a non-welded tuff that includes abundant lithic fragments including Pz basement, sparse Tuff of Cove Mine fragments in a pumice-ash matrix. Basal organic-rich lacustrine beds. Variable basalt-andesite intervals, vesicular amygdaloidal ± autobrecciated ± oxidized flow tops, coarsening downwards phenocrysts, and variably porphyritic near base. Amygdules are present throughout and display irregular amoeboidal morphology. Typically can be interpreted as flows but can also exhibit sharp, chilled-baked upper and lower margins suggesting interpretation as sills.
Ttb3 is not always present in mine area. This is a moderately mafic tuff, variably welded, contains only lithic fragments of Tertiary basalt and basaltic andesite, with abundant pumice fragments. Basal contact of flow is marked by an interpreted andesite flow and epiclastic horizon. Upper contact marked by gradation into palagonite-rich autobrecciayed base of Tbeq. Unit can also contain areas of abundant hyaloclastite.
The informal Fire Creek Sequence comprises three volcanic/volcaniclastic units that overlie the Ttb series. These are presented in ascending order. Descriptions are after Edmondo (1996), Anderson (2013), and Milliard et al. (in prep).
Tbeq (Tertiary basalt equigranular; Figure 7-6) is a 400- to 700-foot thick, black to dark green, aphanitic and equigranular basalt flow package linked to volumetrically significant intrusive feeder dikes below. The dominant textural characteristics of this unit are randomly oriented, curvilinear, interconnected hackly or tortoise-shell joints that develop in response to cooling and are thus a primary textural feature (McPhie et al., 1993). Hyaloclastite is common at the unit base. Thin, discontinuous, and volumetrically minor tuff layers can be present and are interpreted to be entrained xenoliths from the underlying Ttb that were emplaced during intrusion of the feeder dikes for the Tbeq. This unit is the primary ore host. It is thought that Tbeq possessed the bulk strength to hold open space during faulting/fracturing and was present at the correct elevation with respect to the paleo-water table to allow fluid boiling and vein deposition. In the vicinity of the Fire Creek deposit, a large percentage of this unit is altered. Propylitic alteration volumetrically dominates the alteration package and ranges from thin selvages along tortoise-shell joints to pervasive. Argillic alteration is proximal to veins and dikes.
| Practical Mining LLC | February 5, 2018 |
| Page 60 | Geological Setting and Mineralization | Klondex Mines Ltd. |
Silicification is intermittent and, when present, is immediately adjacent to veins and dikes.

Tbma discontinuously overlies Tbeq and is a 0 - 500-foot thick series of black, aphanitic, vitreous, and peperitic basalt flows that may be intercalated with thin tuff layers of the overlying Tlat. No gold mineralization is known in this unit. Alteration is non-existent to weakly propylitic.
| Practical Mining LLC | February 5, 2018 |
| Klondex Mines Ltd. | Technical Report for the Fire Creek Project, | Page 61 |
| Lander County, Nevada |
![]()
Tlat (Tertiary lapilli ash tuff; Figure 7-7) also overlies Tbeq, at the same or higher stratigraphic level as Tbma. Tlat is a 0 - 200-foot thick, tan to buff, non-welded lithic lapilli tuff with 10 to 40% heterolithic basalt and scoria fragments. Groundmass comprises shard and pumice fragments with 10 to 15% lapilli component. This uni is regionally extensive. In the vicinity of the Fire Creek deposit, this unit is commonly intensely argillized.
The Andesite of Horse Heaven is the youngest package preserved at the Project and is characterized by regionally extensive tabular lava flows, characteristic spheroidally spalling interiors, and make up the majority of local exposures at Fire Creek. Locally, this package is broken into five units. Tb1, Tb2, and Tb3 directly overlie the Fire Creek Sequence and the Fire Creek deposit. Tb4 and Tb5 are only present to the east and northeast of the current mine area and may reflect compartmentalized lava fill into a fault-bounded basin. Descriptions are after Edmondo (1996) and Milliard & Gates (2017).
Tb1 is a black, aphanitic to sugary, weakly glassy basalt with trace to 10% plagioclase phenocrysts. However, instead of magnetite needles this unit can be distinguished by the presence of three to five percent magnetite as crystals. The sugary groundmass is slightly coarser grained than Tb2. Flow textures are the same as Tb2. Tb1, and Tb2 are commonly separated by a thin volcaniclastic unit and, in outcrop, may be marked by an angular flow foliation discordance of less than 10 degrees. Hypogene alteration in this unit has been observed as localized opaline silica outflow horizons and argillized high-angle structures with weak mineralization.
| Practical Mining LLC | February 5, 2018 |
| Page 62 | Geological Setting and Mineralization | Klondex Mines Ltd. |
Tb2 shares similarities to Tb1, specifically that it is a black, aphanitic to sugary, weakly glassy basalt that contains trace to 10% plagioclase phenocrysts and five to seven percent magnetite as needles. Emplacement as subaerial flows, similar to Tb3, is indicated by autobrecciation along flow tops and bottoms, dense flow interiors, and strong vesiculation. Thicker flows may weather spheroidally. The base of Tb2 is weakly altered, and localized opaline silica outflow horizons are visible within this unit.
Tb3 is the youngest unit present within the Fire Creek deposit. It consists of interbedded andesite and basalt flows. Typically, very fine grained with rare plagioclase and biotite phenocrysts up to 0.1 millimeters in diameter. Individual flows display features characteristic of subaerial emplacement including autobreccia at flow tops and bases, pahoehoe textures, dense flow interiors and increasing vesiculation density near flow tops. This unit often possesses paleosols, lapilli tuffs, air-fall tuffs, and opaline outflow and is highest stratigraphic level affected by the Fire Creek hydrothermal system.
Tb4 is light red-grey to grey, platy to massive andesite interbedded with black, glassy, perlitic, porphyritic andesite. Phenocrysts of plagioclase and pyroxene volumetrically compose up to 25% and range from two to five millimeters in length. This unit is laterally extensive and displays pahoehoe textures with flow-banded interiors and heavily vesiculated tops and bottoms. Within the Project area, it is often observed as a prominent group of cliff bands.
Tb5 is a series of fine grained to aphanitic, brown to black basalt flows with one to three percent magnetite and pyroxene phenocrysts. Individual flows have flaggy to platy bases and highly vesicular tops. It appears to underlie Tb4 although exposure is limited to the northeast corner of the Project area.
Units underlying Tb3 are cut by numerous black to dark green mafic dikes referred to as Tim (Figure 7-8). Textures include aphanitic, fine-grained phaneritic, amygdaloidal, and weakly porphyritic. Dikes generally strike north-northeast and many exploited north-northeast-striking faults. Contacts between dikes and wall rocks range from knife-edge sharp to brecciated zones up to one foot. Volumetrically major dikes observed at the base of the Tbeq are theorized to be feeder structures for this unit. Dikes acted as conduits for mineralizing fluids, and vein emplacement occurred along these contacts (e.g. Vonnie Vein). Dikes can be altered along with wall rock, but often comparatively pristine dikes cut through intensely argillized wall rock, suggesting dikes were emplaced late relative to the bulk of fluid migration.
| Practical Mining LLC | February 5, 2018 |
| Klondex Mines Ltd. | Technical Report for the Fire Creek Project, | Page 63 |
| Lander County, Nevada |

| 7.2.2. |
Structure |
The greater Fire Creek structural domain is fault-bounded on all sides but the south. To the north, the volcanic stratigraphy is truncated by the NE-striking, steeply dipping, down-to-the-north Malpais Rim normal fault (John et al., 2000). To the east and west, the Fire Creek fault block is bounded by the NNW-striking, steeply East-dipping Muleshoe and Windgap faults, respectively. However, to the south and southeast, the volcanic stratigraphy gently dips below Quaternary valley fill Figure 7-4).
The actively mined, main Fire Creek deposit is fault-bounded to the north, east, and south. The west remains structurally open, although data for this area is sparse. Surface and underground drilling as well as underground development have roughly defined the Alimak Fault, a north-northwest striking, west-dipping structure that intersects the westernmost extent of the underground workings in several locations. While significant, it is not believed that this is a system-bounding fault. However, ground conditions change sharply across it. The bounding structures are described below (Figure 7-9).
| Practical Mining LLC | February 5, 2018 |
| Page 64 | Geological Setting and Mineralization | Klondex Mines Ltd. |
North: As discussed below, there is evidence for sets of NE-striking, steeply north-dipping normal faults bounding a series of NW-trending en echelon fault blocks within the larger Fire Creek structural domain. Geophysical and drill data (including drastic grade changes) indicate that these post-mineral faults truncate and may offset the Fire Creek deposit to the north.
East: The Fire Creek deposit is bound to the east by a NW-striking, steeply west-dipping normal fault interpreted as a paleo-scarp (Note: this is Vein 9). Modeling of drilling and underground mapping show that west-down displacement on this structure accommodated syntectonic filling of the resulting basin by Tbeq lavas fed by feeder dikes. This structure is delineated underground by the abrupt transition between Tbeq to Ttb and the presence of a volumetrically significant dike. However, it should be noted that grade-carrying structures have been intercepted in drillcore to the east of this boundary.
South: Fire Creek itself runs east-west and lies just south of the known deposit. Surface mapping indicates that the Tb2 unit on the south side of the creek is significantly thicker than Tb2 on the north side. This relationship suggests that Fire Creek follows the surface trace of a south-block-down normal fault (the Fire Creek Fault) that either predated emplacement of Tb2 or was synchronous with Tb2 emplacement, forming a volcanic growth fault. Geophysics and limited drill data support the hypothesis that volcanic stratigraphy is displaced across the Fire Creek Fault.
Within the Fire Creek deposit, there are currently three major fault sets that control grade and vein orientations. The most recent set is the “070” fault set. These faults are northeast-striking and dip steeply to the north, sub-parallel to the Malpais Rim and its subsidiary structures. The 070 fault set represents breached relay ramps (Crider, 2001; Trudgill & Cartwright, 1994; Figure 7-9) and formed subsequent to Muleshoe-parallel faults. Both fault sets are thought to result from NNR development.
| Practical Mining LLC | February 5, 2018 |
| Klondex Mines Ltd. | Technical Report for the Fire Creek Project, | Page 65 |
| Lander County, Nevada |

The other two fault sets are cut by and thus predate the 070 faults. The “330” set comprises the vertical to steeply east-dipping Muleshoe Fault and west-dipping Alimak Fault and several other parallel, smaller-displacement faults (not shown for clarity) that dip steeply to the east and west. All show apparent normal displacement. Displacement across the Muleshoe Fault is east-block-down based on offset volcanic stratigraphy, while displacement is west-block-down on the Alimak fault. Direct evidence for an oblique component does not exist, but these are thought to contain a subordinate right-lateral component based on overall NNR development patterns. North of Fire Creek proper, where Tb2 is very thin and Tb1 is either thin or eroded, the 330 fault orientation is strongly reflected in current topography. South of Fire Creek, Tb2 is significantly thicker, and the 330 fault set is not topographically expressed. This implies that the relative age of Muleshoe-parallel faulting can be bracketed between Tb1 and Tb2 emplacement. The “010” fault set formed antithetically to the 330 fault set, and is less prominently displayed in the topography (Figure 7-10.
| Practical Mining LLC | February 5, 2018 |
| Page 66 | Geological Setting and Mineralization | Klondex Mines Ltd. |

| 7.2.3. |
Veins |
The vein system reflects self-similar extensional structural fabrics generated during NNR development. Veins were emplaced primarily along faults and dike contacts, both striking approximately 330° and with variable but steep dips, and north-south-striking, moderately east-dipping extensional structures. North-northwest-striking veins are typically thin, less than three feet, sub-vertical and are subparallel to the Muleshoe Fault set. Host rocks are usually restricted to the more competent members of the volcanic sequence; in the known deposit this is primarily Tbeq and Ttb basalts. Tuffaceous units are less favorable for vein formation due to poor fracturing characteristics.
| Practical Mining LLC | February 5, 2018 |
| Klondex Mines Ltd. | Technical Report for the Fire Creek Project, | Page 67 |
| Lander County, Nevada |
The following description of Fire Creek veins is abstracted from Raven et al. (2011) and includes relevant updates.
The veins consist of colloidal silica, crystallize chalcedony and coarser crystallize quartz, calcite, pyrite, chlorite, arsenopyrite, adularia, and clays including kaolinite, smectite and illite. Crustiform/colloform-banded and brecciated quartz, stockwork texture and calcite-replacement textures including bladed quartz are common. Drusy and cockscomb calcite and quartz often coat open spaces. Vein composition ranges from quartz-dominant to calcite-dominant, even within the same vein.
As of this writing, more than 70 individual veins or mineralized structures have been identified. Of these, five have been sufficiently characterized to warrant individual descriptions.
Joyce Vein
The Joyce Vein has been defined for 1,750 feet along strike and 1,135 feet of dip extent. It is dominated by coarse, bladed calcite (60 to 70%) with quartz as the remainder. The Joyce Vein commonly has large open-space voids that may extend to several feet wide by multiple tens of feet tall. These voids are often lined by bladed calcite replaced by fine-grained quartz. It is interpreted that the Joyce Vein exploited an extensional relay structure between the Vonnie Vein and Karen Vein and is believed to be the youngest of the three.
Vonnie Vein
The Vonnie Vein has been defined for 1,910 feet along strike and 550 feet of dip extent. Textures are dominantly crustiform/colloform quartz banding with lesser carbonate. This vein formed predominately along a dike contact and is generally narrower than the other production veins.
Karen Vein
The Karen Vein has been defined for 1,035 feet along strike and 450 feet of dip extent. Average vein width is approximately 0.5 foot although mineralized widths can reach up to approximately 12 feet and can include fault-related breccias and discrete veins. The vein is predominately calcite with lesser quartz and rarely has open space vugs. The Karen Vein exploited a north-south striking structure rather than a dike contact.
Hui Wu Vein
The Hui Wu (pronounced Way-Woo) structure has been defined for 650 feet along strike and 500 feet of dip extent. This structure is primarily mineralized tectonic breccia that is punctuated by a moderately developed discrete vein system. This vein is now recognized to be an extension of the Karen Vein system.
| Practical Mining LLC | February 5, 2018 |
| Page 68 | Geological Setting and Mineralization | Klondex Mines Ltd. |
Honeyrunner Structure
The Honeyrunner structure has been defined for 1,515 feet along strike and 525 feet of dip extent. Geologic data suggest this structure may be a locally important fault parallel to the Muleshoe Fault system. Honeyrunner varies in character from a well-developed quartz-calcite vein to an unmineralized clay gouge/tectonic breccia or basalt dike contact.
| 7.2.4. |
Alteration |
Alteration is zoned laterally and vertically with respect to paleo-fluid conduits and is dependent on rock type. Conduits include high-angle structures such as faults (either with or without vein fill) and dike contacts and to a lesser extent low-angle structures such as lithologic contacts and highly vesiculated flow tops. Zonation is well-developed in Tbeq basalt. Alteration in tuffaceous units tends to be pervasive rather than zoned.
Idealized lateral distal-to-proximal alteration zonation around a single fluid conduit or vein within Tbeq or Ttb basalt typically follows the progression outlined below (Figure 7-11 and Figure 7-12). Not all stages may be present and overprinting is common.
| 1. |
Distal, widespread, propylitic alteration characterized by pyritiferous and chloritic selvages along hackly or tortoise-shell joints; | |
| 2. |
Pervasive propylitic alteration characterized by chlorite ± calcite replacement of plagioclase and pyroxene and abundant formation of both disseminated and selvage pyrite; | |
| 3. |
Pervasive argillic alteration characterized by montmorillonite ± nontronite ± illite replacement of plagioclase and pyroxene (or their chloritized equivalents); | |
| 4. |
Selvage and/or pervasive silicification through addition of silica, and; | |
| 5. |
Acid-leach silicification resulting from preferential removal of mobile, non-silica constituents. This alteration style is more common in the upper portion of the hydrothermal system. |
Argillic alteration in tuffaceous units and interbeds is characterized by near-complete replacement by illite ± kaolinite ± smectite ± montmorillonite ± nontronite. It is widespread and is not zoned. The typical propylitic outer halo is either non-existent or has been completely overprinted.
Alteration in Ttb basalt units is generally weak to moderate, pervasive propylitic alteration characterized by chlorite replacement of plagioclase and pyroxene.
| Practical Mining LLC | February 5, 2018 |
| Klondex Mines Ltd. | Technical Report for the Fire Creek Project, | Page 69 |
| Lander County, Nevada |
A discontinuous, 15 to 65 feet thick, white to reddish-brown, amorphous to opaline silica cap is present between Tb1 and Tb2. Although specific fluid pathways have not been identified in Tb1, an elongate zone of moderate to intense, vertically zoned argillic alteration directly overlies the Joyce Vein in Tb1 and is exposed in historically active surface workings. This alteration is characterized by alunite + kaolinite beneath the silica cap and gives way to smectite + kaolinite with depth. Nontronite-alteration as vein, vug-fill and pervasive basalt alteration appears to overprint other alteration events.

| Practical Mining LLC | February 5, 2018 |
| Page 70 | Geological Setting and Mineralization | Klondex Mines Ltd. |

| 7.2.5. |
Mineralization |
Electrun is primarily present in its native state along discrete layers within veins. Native electrum can occur as large clots or bands (Figure 7-13), dendritic growths (Figure 7-14), and fine-grained disseminations. Other less common habits include encapsulations in quartz, pyrite replacements and coatings on pyrite or arsenopyrite (Thompson, 2014). Silver occurs encapsulated in quartz and locally in naumannite or ruby silver encapsulations in quartz (Thompson, 2014). Dark grey ginguro bands of an unidentified silver-bearing mineral are present along vein banding as well. The silver gold ratio is approximately one to one.
| Practical Mining LLC | February 5, 2018 |
| Klondex Mines Ltd. | Technical Report for the Fire Creek Project, | Page 71 |
| Lander County, Nevada |
![]()
| Practical Mining LLC | February 5, 2018 |
| Page 72 | Geological Setting and Mineralization | Klondex Mines Ltd. |

| Practical Mining LLC | February 5, 2018 |
| Klondex Mines Ltd. | Technical Report for the Fire Creek Project, | Page 73 |
| Lander County, Nevada |
| 8. |
Deposit Types |
The Fire Creek deposit is considered to be a low-sulfidation, epithermal deposit.
A composite description for low-sulfidation epithermal deposits, abstracted from Simmons et al. (2005), Cooke & Simmons (2000), White & Hedenquist (1995), Kamenov et al. (2007), and Hedenquist et al. (2000) is shown below in Figure 8-1.
Low-sulfidation epithermal systems are also referred to as quartz ± calcite ± adularia ± illite or adularia-sericite epithermal systems. These nomenclatures refer to the oxidation state of the ore fluid sulfur component, gangue mineralogy and hydrothermal fluid pH, respectively. Ore-fluids in a low-sulfidation hydrothermal system are reduced, have a near-neutral pH and are dominated by deeply-circulated meteoric water. These deposits form in the shallow crust, 0.5 to 1.5 miles at temperatures of greater than 300°C in subaerial volcanic settings. Steeply-dipping, open-space veins are common. Quartz is the principal gangue mineral and can be accompanied by chalcedony, adularia, illite, pyrite, calcite, and rhodochrosite. Boiling is the dominant metal deposition mechanism and commonly results in vein textures including crustiform-colloform bands and platy calcite and/or quartz-after-calcite pseudomorphs. Ore metals are usually Au-Ag, Ag-Au or Ag-Pb-Zn and, contrary to the ore-fluid source, metals in NNR-related epithermal deposits are sourced from mantle-derived basaltic magmas (Kamenov et al., 2007).
Zoned hydrothermal alteration comprises widespread and deep propylitization that grades upwards to clay, carbonate and zeolite formation. Proximal alteration comprises quartz, adularia, and pyrite. High-level advanced argillic alteration characterized by clay-carbonate-pyrite or kaolinite-alunite-opal ± pyrite alteration can be present above the ore-grade zone and is the result of steam-heated, acidic, ascending fluids generated during boiling.
Features that classify the Project as a low-sulfidation epithermal deposit include:
| • |
Precious metal mineralization occurs primarily within steeply dipping veins; | |
| • |
Extensional, open-space forming tectonic environment active during vein emplacement; | |
| • |
Vein gangue is composed of quartz and calcite and exhibits boiling textures; | |
| • |
Mineralization is gold-silver; | |
| • |
Alteration halo comprises distal propylitization that grades to argillic and proximal silicification; | |
| • |
Presence of a high-level, advanced argillic alteration zone capped with opaline silica; and | |
| • |
Altered host rock indicates a reduced ore fluid. |
| Practical Mining LLC | February 5, 2018 |
| Page 74 | Deposit Types | Klondex Mines Ltd. |

| Practical Mining LLC | February 5, 2018 |
| Klondex Mines Ltd. | Technical Report for the Fire Creek Project, | Page 75 |
| Lander County, Nevada |
| 9. |
Exploration |
| 9.1. |
Historical Exploration |
An itemized summary of exploration activities at the Project is below.
| • |
1933: First recorded lode claim at Fire Creek; | |
| • |
1967: Union Pacific drilled two diamond holes; | |
| • |
1974 – 1975: Placer Development Ltd. acquired an exploration lease and drilled 22 rotary holes; | |
| • |
1980: Klondex acquired the Project from Placer Development, Ltd; | |
| • |
1981/1982: Klondex conducted a 2,000-ton test heap leach that produced 67 ounces of gold; | |
| • |
1980 – 1983: Klondex drilled 64 rotary holes; | |
| • |
1984: Klondex leased the Project to Minex Resources, Inc. who drilled 13 holes and heap leached approximately 30,000 tons of mixed ore and waste which produced approximately 1,000 ounces of gold; | |
| • |
1986 – 1987: Klondex leased the Project to Alma American Mining Co. who drilled 64 holes; | |
| • |
1988 – 1999: Klondex leased the Project to the Aurenco Joint Venture which was composed of Black Beauty Gold Co. and Covenanter Mining, who drilled 51,463 feet of reverse circulation; | |
| • |
1993 – 1994: The Aurenco JV ventured the Project with Coeur Exploration. Coeur conducted a gradient-array resistivity survey and drilled seven reverse circulation and two diamond holes; | |
| • |
1995 – 1996: The Aurenco JV and North Mining form the Fire Creek Joint Venture. North Mining conducted a dipole-dipole IP/Resistivity survey and drilled 39,593 feet of reverse circulation and diamond core; | |
| • |
1999: The Aurenco JV relinquished their lease; | |
| • |
2004: Klondex began an exploration program for deep vein-hosted gold mineralization; | |
| • |
2005: Newmont Mining Corp. performed a gravity survey; | |
| • |
2006: Klondex conducted a gradient-array IP/Resistivity survey; and | |
| • |
2004 – 2010: Klondex drilled 231 holes, primarily core with RC pre-collars, for a total length of 297,586 feet. |
| 9.2. |
2011 Drilling |
Fifty-five drill holes comprising 37 surface holes and 18 underground holes with a length of 65,225 feet were completed (Figure 9-11). Surface drilling focused on identifying mineralization on the north end of defined veins. Underground drilling focused on identifying mineralization on the southern extent.
| Practical Mining LLC | February 5, 2018 |
| Page 76 | Exploration | Klondex Mines Ltd. |

| Practical Mining LLC | February 5, 2018 |
| Klondex Mines Ltd. | Technical Report for the Fire Creek Project, | Page 77 |
| Lander County, Nevada |
| 9.3. |
2012 Drilling |
Sixty-one drill holes comprising of 25 surface holes and 36 underground holes with a total length of 54,969 feet were completed (Figure 9-2). Four of the surface holes were geotechnical holes drilled to gather data near the planned vent raise. Three holes were drilled to test IP anomalies south of the Project. These did not encounter significant gold mineralization; however, the holes were terminated prior to encountering the target horizon and may have been located too far to the east. The remainder were drilled to define a bulk sample area that encompassed the Joyce Vein and the Vonnie Vein between the 5370 and 5400 crosscuts. One of these holes (FC1211) returned a result of 2,910 parts per million (ppm) Au (85 opt Au) assay from the Vonnie Vein.
| 9.4. |
2013 Drilling |
Sixty-one drill holes comprising five surface holes and 56 underground holes with a total length of 33,501 feet were completed in 2013 (Figure 9-3.). This drilling identified several new veins west of the decline and identified probable southern extensions of the Joyce Vein and the Vonnie Vein.
| 9.5. |
2014 Drilling |
Two hundred eighty-three holes comprising nine reverse-circulation surface holes with a total length of 2,385 feet, two HQ diamond surface holes with a total length of 2,943 feet (Figure 9-4) and 272 AQ, BQ and HQ diamond underground holes with a total length of 73,339 feet (Figure 9-5) were completed in 2014. Five of the surface reverse circulation (RC) holes were converted into groundwater monitoring wells GW-4 through GW-8. The remaining five surface RC holes had piezometers installed. Two HQ diamond holes were drilled for condemnation purposes. Underground drilling in 2014 primarily focused on infilling and extending the Joyce Vein, Vonnie Vein, Karen Vein, and Hui Wu Vein. Underground exploration targeted zones to the east and west of the decline and yielded positive results including discovery of the ore-grade Honeyrunner structure.
| Practical Mining LLC | February 5, 2018 |
| Page 78 | Exploration | Klondex Mines Ltd. |

| Practical Mining LLC | February 5, 2018 |
| Klondex Mines Ltd. | Technical Report for the Fire Creek Project, | Page 79 |
| Lander County, Nevada |

| Practical Mining LLC | February 5, 2018 |
| Page 80 | Exploration | Klondex Mines Ltd. |

| Practical Mining LLC | February 5, 2018 |
| Klondex Mines Ltd. | Technical Report for the Fire Creek Project, | Page 81 |
| Lander County, Nevada |
![]()
| Practical Mining LLC | February 5, 2018 |
| Page 82 | Exploration | Klondex Mines Ltd. |
| 9.6. |
2015 Drilling |
Two hundred sixty-two drill holes were completed in 2015 (Figure 9-6). Twenty-Seven surface holes were completed for 34,564 feet of PQ and HQ core drilling. Surface drilling tested the following: up-dip extensions of the Joyce Vein and Vonnie Vein; southern extensions of the Joyce Vein and Vonnie Vein; western extents of known mineralization; and eastern exploration of known structures. Two hundred thirty-five underground holes were completed for 89,708 feet of AQ, BQ, NQ and HQ core drilling. Underground drilling tested the following: new veins west of the decline identified by 2014 drilling; and extensions of the Karen Vein, the Joyce Vein, the Vonnie Vein, and the Hui Wu Vein in all directions.
| 9.7. |
2016 Drilling |
Two hundred eighty-eight drill holes were completed in 2016 (Figure 9-7). Forty-one surface holes were completed for 57,306 feet of PQ and HQ core drilling. One surface RC hole was completed for 237 feet of drilling and instrumented with vibrating wire piezometers. One surface RC monitoring well was completed for 250 feet of drilling. Surface core drilling tested the following: extensions of structures to the east of the Vonnie Vein discovered in 2015; extensions of the Joyce Vein and Vonnie Vein to the south; and extensions of known veins and structures to the west. Two hundred forty-five underground holes were completed for 149,721 feet of BQ, NQ and HQ core drilling. Underground drilling tested the following: veins west of the decline; veins to the northeast of the Vonnie Vein; and extensions of the Karen Vein, the Joyce Vein, the Vonnie Vein, the Hui Wu Vein, and the Honeyrunner Structure in all directions.
| Practical Mining LLC | February 5, 2018 |
| Klondex Mines Ltd. | Technical Report for the Fire Creek Project, | Page 83 |
| Lander County, Nevada |

| Practical Mining LLC | February 5, 2018 |
| Page 84 | Exploration | Klondex Mines Ltd. |

| Practical Mining LLC | February 5, 2018 |
| Klondex Mines Ltd. | Technical Report for the Fire Creek Project, | Page 85 |
| 9.8. |
2017 Drilling |
Two hundred sixty-two drill holes were completed in 2017 (Figure 9-8). Twenty-nine surface holes were completed for 17,800 feet of PQ and HQ core drilling. Six surface RC holes were completed for 5,835 feet of drilling and instrumented with vibrating wire piezometers. Surface core drilling tested the following: up-dip extensions of veins and structures above the current mine workings for open pit analysis; and extensions in all directions of the Zeus structural zone to the northwest following up on 2015 and 2016 drilling. Two hundred twenty-seven underground holes were completed for 156,494 feet of NQ and HQ core drilling. Underground drilling tested the following: up-dip extensions of veins and structures above the current mine workings for open pit analysis; veins west of the decline; and extensions of the Karen Vein, Joyce Vein, Vonnie Vein, Hui Wu Vein, and Honeyrunner Vein in all directions.
Of the 262 drill holes completed in 2017, 34 holes were completed for the open pit analysis. Twenty-one surface PQ and HQ core holes were completed for 6,692 feet, ten underground HQ core holes were completed for 8,066 feet, and three surface RC holes were completed with vibrating wire piezometers for 2,760 feet.
| Practical Mining LLC | February 5, 2018 |
| Page 86 | Exploration | Klondex Mines Ltd. |

| Practical Mining LLC | February 5, 2018 |
| Klondex Mines Ltd. | Technical Report for the Fire Creek Project, | Page 87 |
| Lander County, Nevada |
| 10. |
Drilling and Sampling Methodology |
The Fire Creek drill hole database contains 1,474 drill holes which were drilled by Klondex from 2004 through October 2017. Coring has been the predominant drilling method employed throughout the history of the Project, with 1,220 core holes totaling 698,340 feet of drilling. 202 surface holes were pre-collared with RC to the depth of interest and finished with core. Pre-collared holes total 268,690 feet. There are 52 RC holes in the database totaling 55,200 feet of drilling. Klondex has determined that RC drilling does not provide sufficient resolution for vein modeling or resource estimation. While RC drilling was sampled on 5-foot intervals and the database contains assay values and geology data, the values are considered diluted, so only core samples contribute to the current resource estimate. Figure 10-1 shows the type and extent of drilling at Fire Creek.
| Practical Mining LLC | February 5, 2018 |
| Page 88 | Drilling and Sampling Methodology | Klondex Mines Ltd. |
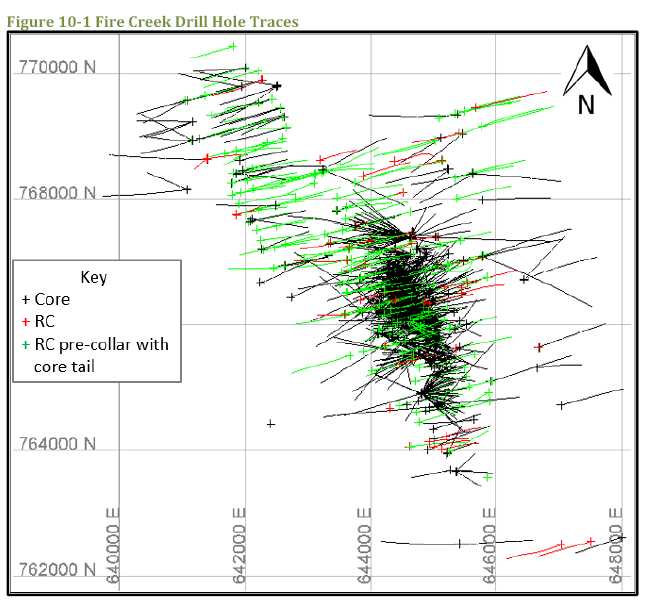
All of the holes drilled from underground are core holes. Figure 10-2 shows the underground holes, which account for 1,060 of the 1,220 property-wide core holes totaling 522,320 feet of the 698,340 feet of core drilling.
| Practical Mining LLC | February 5, 2018 |
| Klondex Mines Ltd. | Technical Report for the Fire Creek Project, | Page 89 |
| Lander County, Nevada |

| 10.1. |
Drilling Procedures |
| 10.1.1. |
Drilling Procedures from 2004 through 2010 |
Drilling protocols from 2004 through 2010 are documented in Raven et al. (2011):
“Most core holes were pre-collared with a reverse circulation rotary (RC) drill that advanced to a planned depth well short of the intended target intercept. The RC holes were then cased and core drilled to completion with HQ (2.5 inch diameter core)-sized core. Two of the borings, 410 and 411, were only rotary holes drilled to completion. RC drilling was done by O’Keefe Drilling of Butte, Montana. Core drilling was carried out primarily by Boart-Longyear out of their Salt Lake office, Ruen Drilling from Clark Fork, Idaho and Major Drilling from Salt Lake City.”
| Practical Mining LLC | February 5, 2018 |
| Page 90 | Drilling and Sampling Methodology | Klondex Mines Ltd. |
“The directions and angles of the drill holes were spotted to intercept the veins as close to perpendicular as practicable within the limitations of the equipment. Most holes were drilled at azimuths of 75° or 255° and located as close as practical on the surveyed grid lines with azimuths of 75° … The line spacings are 50 metres. The deep holes have established that veins or vein systems have a general azimuth strike of 345° with varying dips ranging from steep westward dips of about 75° to steep eastward dips of about 80°. Most holes were inclined at an angle of -45°. Holes were drilled both ENE and WSW; sometimes the ideal direction/declination had to be compromised because of drill location setup problems.”
“The Klondex holes are all surveyed for vertical and horizontal deviation by International Directional Services LLC, whose local office is in Elko, Nevada. Plotting the boring deviations permit accurate vein and other gold anomaly intercept locations leading to reliable geologic mineralization locations, interpretations of vein trends, structure dips, zone widths, reserve estimates, and polygon locations.” (Page 21)
| 10.1.2. |
Current Drilling Procedures |
RC drilling was employed from 2010 through 2013 to pre-collar the first 600 feet of 15 surface core holes. The pre-collars were sampled, but RC drilling for sample collection was discontinued in favor of core after 2013, when increased interest in the near-surface geology led to a desire for high sample resolution in the shallower intervals.
Klondex contracted Rimrock Drilling Services from Elko, Nevada to drill the pre-collar holes. The hole locations were laid out on the drill pads by geologists using a Brunton compass to measure azimuth. The azimuth was marked with lathe. Hole ID, dip and azimuth were written on the lathe. The driller aligned the drill with the lath and a geologist checked the mast for correct azimuth and dip prior to drilling. Five-inch surface casing was installed for the upper 20 feet. Samples were collected on 5-foot intervals by the driller, with pauses at the end of each sample run to flush out the cuttings. Upon completion of the 600-foot pre-collar hole, International Directional Services (IDS) of Elko performed a downhole deviation survey using a gyroscopic downhole survey tool. The completed RC hole was cased to 600-foot with five-inch casing and cemented in preparation for the core rig.
Core is drilled PQ (3.34 -inch diameter), HQ (2.5 -inch diameter), NQ (1.88 -inch diameter) and BQ (1.43 inch diameter) depending on sample requirements. Larger diameters are used for exploration and metallurgical sample holes while smaller diameter is generally reserved for infill drilling. Drilled core is placed in wax impregnated cardboard boxes which contain five two-foot-long divisions (each box contains up to 10 feet of core). (PQ boxes typically have two divisions and contain four feet of core due to weight constraints.) A wooden block marked with the hole depth is placed at the end of each core run. Both the box bottom and box top are marked with Hole ID, footage contained and box number. Full boxes are set aside to await transport to the core shed. Boxes of core are transported to the logging facility in Beowawe by the Klondex personnel to be photographed, logged and sampled.
| Practical Mining LLC | February 5, 2018 |
| Klondex Mines Ltd. | Technical Report for the Fire Creek Project, | Page 91 |
| Lander County, Nevada |
When the hole reaches its planned depth, it receives a downhole survey prior to abandonment. All surface holes drilled since 2015 are monumented with a brass tag bearing the hole ID embedded in the hole collar. Underground hole collars are labelled with Hole ID written on plastic tags. The collar labels are used to confirm the hole identity for the collar location survey.
In 2014, the hole naming convention was changed. The final surface hole with the old naming convention was FC1328, and the first surface hole with the new naming convention was FCC-0001. The final underground hole with the old naming convention was FC14125U, and first underground hole with the new naming convention was FCU-0001.
The authors observed an underground core drill in operation in January 2013 (Figure 10-3).
![]()
| 10.2. |
Collar Surveying |
All drill holes receive a collar location survey. Currently, surface hole collars are surveyed by Wallace Morris Orban Surveying of Elko, NV and underground hole collars are surveyed by the Klondex mine surveyor.
| Practical Mining LLC | February 5, 2018 |
| Page 92 | Drilling and Sampling Methodology | Klondex Mines Ltd. |
| 10.2.1. |
Surveying Surface Drill Collar Locations |
Historic surface drill collar survey data was kept in Reno, Nevada by Mr. Richard Kern of MinQuest, Inc. (“MinQuest”), as he was the Project Manager and responsible person for the database on behalf of Klondex. Klondex received the historic data in spreadsheets from Mr. Kern in May 2012. All collar northings and eastings drilled prior to 2012 came from MinQuest at that time. The elevation of the drill hole locations in the MinQuest dataset were adjusted by Mr. Steve McMillin, former Chief Geologist for Klondex, by assigning elevations from topographic contours generated from 2012 photogrammetry.
Methods used to locate collars drilled from March 2004 through December 2010 were inadequately documented, and raw data were not archived. The (non-documented) method for locating early collars was to locate the drill pad along a surveyed grid of lines (lines spaced 50 feet apart) to intercept veins as close to perpendicular as possible within the limitations of the equipment and topography.
In August of 2008, Alidade surveyed and located some of the drill pads and collars for Small Mine Development, LLC. (“SMD”). Historical survey reports for that period have not survived though Alidade’s methodology for groundsurvey control is documented in a Company memo from Alidade (Klondex, 2006):
“On our first day on the project we set a 5/8 rebar with a plastic “Alidade Control” cap on a hillside above and about 1,000 feet north of the Project. We set up our GPS receiver on this point called “AL1”, and recorded two plus hours of static GPS data at one second intervals. This data was subsequently sent to the National Geodetic Survey (NGS) Online User Positioning Service (OPUS) and processed”.
“OPUS provided both the NAD83 Nevada Central Zone and UTM Zone 11 North coordinate values for the new point. The grid coordinates provided were expressed in meters for both systems as is standard for OPUS. We (Alidade) converted the NAD83 coordinates from meters to US Survey feet and established a coordinate system and projection for our GPS software”.
From 2010 to the beginning 2012 (up to drill hole FC1207S), surface collar survey information was recorded by the site geologist reading a hand-held GPS device on the drill rig. Using a hand held device requires the geologist to allow the device to sit for approximately 20 minutes before a reading can be taken. The coordinates were hand-entered on a log form. The original datum is unknown. It is also not known if any conversion between datum was made as a part of this process.
| Practical Mining LLC | February 5, 2018 |
| Klondex Mines Ltd. | Technical Report for the Fire Creek Project, | Page 93 |
| Lander County, Nevada |
In June 2013, Klondex undertook to re-survey all locatable surface collar locations drilled prior to January 2012. Mr. McMillin located historically drilled holes using a ground magnetometer and a track excavator to search for buried collar casing. A total of 29 surface holes (approximately 10% of the surface drill hole population from that era) were located and resurveyed by Alidade using the current protocols. Average northing and easting errors were 5.39 and 5.71 feet, respectively. Table 10-1 contains the collar location data obtained in the re-survey.
In summary, the collar locations of holes drilled prior to 2012 have been substantiated by a resurvey of 10% of the holes. Additionally, current drilling and underground mining continue to confirm the data generated from the pre-2012 holes. The authors consider the hole locations reasonable for use.
Surface holes drilled between January 2012 and January 2015 were surveyed by Alidade with a Trimble Real Time Kinematic (“RTK”) unit in conjunction with Global Positioning System (GPS) with a base station of a known survey point and rover unit.
Beginning in 2015, surface holes are surveyed by Wallace Morris Orban Surveying of Elko, NV using Trimble GPS equipment. The base unit is a Trimble R8-2 receiver/radio or back-up Trimble Zephyr antenna with a Trimble 5700 receiver and Trimmark3 radio. The data collectors are Trimble TSC3's. Survey data is reported in the KDX mine grid coordinate system (Truncated NV State Plane) as a .csv file. Receipt of survey data is tracked by geologists in the drilling Access database. Once approved by the drilling geologist, the survey data is imported to the AcQuire database by the database administrator. The drilling geologist then makes a final check of the location by viewing in Vulcan.
| 10.2.2. |
Surveying Underground Drill Collar Locations |
Underground drill hole collars are surveyed by the mine surveyor. The first phase of underground drilling began in September 2011 and continued into August 2012. Fifty-two holes were drilled during this period, all but two of from Drill Station 1. Drill collar locations were originally derived from drill station planned coordinates. Collar surveys for phase one holes were finalized in August 2012 when the drill was moved and collars were accessible to the surveyor. SMD engineer Paul Joggerst surveyed the collars (2012 Joggerst), utilizing North American Datum (NAD) 27 UTM US feet. A geologist assisted in locating each collar and identifying the borehole ID.
The 2012 Joggerst methodology included use of a robotic total station set by plumb-bob using a known survey location as datum. A survey prism was used to define each drill collar location to be recorded by the total station. 2012 Joggerst provided survey reports to Klondex in the form of electronic spreadsheets. All underground surveys were conducted in NAD 27 UTM, US feet.
| Practical Mining LLC | February 5, 2018 |
| Page 94 | Drilling and Sampling Methodology | Klondex Mines Ltd. |
Since drilling resumed in 2013, collar locations have been surveyed by the Klondex mine surveyor using Company-owned survey equipment. The Project survey equipment is a Trimble S6 DR Plus total station device used in conjunction with Leica prisms. The 2013 surveys were in NAD27 UTM US feet, and in 2014 Klondex began using Nevada State Plane Central Zone NAD83 US Survey feet (NV SPCS).
| 10.3. |
Downhole Surveying |
All downhole surveys of surface holes since the beginning of the project have been performed by IDS, a reputable borehole survey company with a well-established history of performing downhole surveys in accordance with industry standards.
When underground drilling began at the Project in the fourth quarter of 2011, Klondex leased a PeeWee downhole survey tool from Minex in Minnesota. The PeeWee has the option of being manually set for local declination or collecting data relative to magnetic north. Klondex collected raw uncorrected data and then applied corrections to compensate for the local declination of 13.35 degrees according to the NOAA calculator. Readings were taken by the PeeWee every 50 feet. Occasionally the raw data reflected excessive fluctuation between adjacent points, and the unreasonable point was deleted before finalizing the survey. In that case, reliable points above and below the erroneous point are used for projecting the drill hole, which is acceptable industry practice. Occasionally, the surveyor will collect “collar and quill” surveys by positioning the survey rod in the collar and recording multiple survey shots along the survey rod to measure azimuth and dip. The results can be compared to the data collected by the downhole survey tool as a rough check of the tool’s accuracy.
Since the beginning of 2014, all underground downhole surveys have been performed by International Directional Services (IDS) using a Maxibor or MEME Gyro tool. When a hole is shorter than 300 feet, the recorded data from the apparatus (Reflex TN14 Gyrocompass or Minnovare Azimuth Aligner) used to set up the drill rig are entered in the downhole survey database.
| 10.4. |
Core Recovery |
Core recovery has previously been described (Raven et al., 2011) and is summarized below:
“Core recovery was excellent; 100% in most instances. The high-grade intervals were logged as having near or 100% recovery in nearly all cases, whether the intercept was a vein or a breccia zone. Core recovery was typically very good throughout the Klondex program.” (Page 21)
Since 2012, the percent core recovery has been calculated by measuring the material between blocks per drilled interval, then dividing the measured recovery by the run footage and multiplying that value by one hundred. The average current recovery for underground core at the Project is 95%.
| Practical Mining LLC | February 5, 2018 |
| Klondex Mines Ltd. | Technical Report for the Fire Creek Project, | Page 95 |
| Lander County, Nevada |
| 10.5. |
Logging Drilled Core Observations |
Drill sample logging codes at the Project have evolved over time with an increased understanding of the geology. Interpretive codes were updated, most recently in early 2014, to more accurately describe the lithology, veins, and particularly the alteration typical of an epithermal system. The new codes were adapted from similar observations at the Company’s Midas Mine and exemplify direct observations of the Project’s geology. The new codes allow for Company uniformity at similar deposits.
| 10.5.1. |
Current Logging Protocol |
Beginning June 2013, Klondex geologists began a quick log assessment prior to the detailed logging in order to quickly identify important contacts and to verify intersections or expected horizons in the core. The advantage of this additional step is an updated geologic model as soon as the core is available for preliminary review as opposed to waiting until all the logged data is collected. The quick update to the geologic model allows for modifying the drill plan in order to better intersect mineralization and to refine the mine plan.
Core is logged in the Project’s logging facility in Beowawe. The drilling geologist transports the core from the Project to the core facility. Core is categorized as Production or Exploration.
| • | Production core only receives gold-silver assay analysis; and | |
| • | 48-element ICP analysis is performed on each Exploration core sample. |
Core boxes are laid out in order on the logging table. Core is washed and blocks are checked for continuity and correctness. A log file is generated for the hole. Data is entered directly into AcQuire by the geologist using standardized interpretive codes. RQD data is collected for all exploration holes and for even-numbered production holes. Geologic data is collected for all holes. Sample intervals are marked. Core photographs are taken when logging is complete, and the boxes are stacked to await sampling. A cut sheet is generated for the samplers.
| 10.5.2. |
Historic Logging Protocol |
Klondex’s historical lithology database, acquired from MinQuest in 2012, contained simplified data hand-entered into RockWare LogPlot software from detailed paper drill hole data logs. The digital version of the logs lumped the tuffs and basalts into two generalized unit codes, which comprised the lithology portion of the database. The RC pre-collar and core-tail portions of the holes had separate logs.
| Practical Mining LLC | February 5, 2018 |
| Page 96 | Drilling and Sampling Methodology | Klondex Mines Ltd. |
Klondex’s logging format was revised in 2012 with a new code system. The new codes allowed tuff and basalt lithologies to be separated into specific units to allow more detailed modeling. The 2013 re-logging program mentioned in Section 10.4 captured the new codes for historically drilled holes. Klondex re-logged approximately 240,000 feet of core to document the details of tuff and basalt units according to the new coding system and to obtain better assay resolution on mineralized intervals. Previous sampling was based strictly on five-foot sample intervals regardless of geology. This was an issue at the Project because mineralized veins typically occur within a restricted portion of a five-foot interval, and samples did not accurately reflect either the size of the vein or the distribution of gold. On occasion, veins were also misrepresented during core splitting, and the result was loss of assay opportunity. In 2013, re-logging included re-sampling of several mineralized intervals that were diluted by either being divided across intervals or represented a fraction of a five-foot interval. New sample interval footages were selected to blend into the previous sample numbering sequence without gaps or overlaps. The new sampling intervals were determined using geological observations. Better density information, multi-element analytical data and core photos were also collected.
The lithological units at the Project which contain the mineralized veins include interbedded basalt and tuff units and dikes. Klondex’s lithology database used for the resource model utilizes the new, more detailed 2014 interpretive lithological codes for these units. The unit codes used in the model were derived from current logging procedures, data converted from 2013 codes, and interpretation of the older RC Log Plot descriptive data for holes which could not be re-logged in 2013.
A direct correlation between the original logs and the current Klondex geology database is complex since the data evolves over time. The current database was converted from the 2013 codes to the 2014 codes. The 2013 codes were either logged directly as part of the re-logging program, converted from historic logging codes or derived from reading the geologists’ detailed descriptions in the comments field rather than from the lithological code.
Each of these geological logging systems was reviewed by the authors, and the results validate the geology in the Klondex database. Lithological source data for a subset of channel samples were also reviewed by the authors and found to correlate well with the database.
| 10.5.3. |
Re-logging Protocol for 2012-2013 |
In January 2012, inadequacies in historic logging procedures became apparent. Specifically, sampling intervals were strictly five-foot regardless of interval of mineralization, observations of lithology and alteration were broadly generalized, and no core had been photographed.
| Practical Mining LLC | February 5, 2018 |
| Klondex Mines Ltd. | Technical Report for the Fire Creek Project, | Page 97 |
| Lander County, Nevada |
Until April 2012, core was logged at the Project and then shipped to Sparks, Nevada for processing. Split core was shelved in 23 storage units at Secure Storage in Sparks, Nevada.
In October 2012, Klondex began to re-log the core stored in Sparks before relocating it to the Project, the objectives being to:
| • |
Improve grade definition on veins that were diluted within a five-foot interval or divided by overlapping intervals; and | |
| • |
Improve detailed observations of alteration, lithology, and the stratigraphic sequence at Fire Creek. |
Two new 4,500-square foot warehouse units were rented within two miles of Secure Storage. One unit was equipped with eight roller-conveyor tables 70-foot long and two camera stands. Suspended fluorescent lighting was added to provide better lighting to compensate for ceilings 20-foot in height. The other unit was used to store the core in progress.
Twelve contract geologists and eight geotechnicians worked the re-logging program to complete the following tasks:
| • |
Moving core; | |
| • |
Washing core; | |
| • |
Photographing core; | |
| • |
Logging core; | |
| • |
Sampling core; | |
| • |
Measuring density and magnetic susceptibility of the core; and | |
| • |
Palletizing core for long-term storage. |
Logging core included collection of geotechnical data, such as strength, approximate Rock Quality Data (RQD) from split core, lithology, alteration, structure, mineralization, and vein density. Density measurements were taken using a water-immersion densiometer after sealing samples in wax.
Core selection for re-sampling focused on localized alteration and vein material which were originally poorly represented by the five-foot sampling, as discussed previously. Intervals selected for re-assay were sampled by removing the remainder of the historically split core sample from the core box to be submitted for assay. Lathes marked with the interval information were left in the core box.
Additionally, composite chip samples were collected for 48-element Inductively Coupled Plasma (ICP) analysis throughout the core on 20-foot intervals. Samples were sent to ALS in Reno and Inspectorate in Sparks for analysis.
| Practical Mining LLC | February 5, 2018 |
| Page 98 | Drilling and Sampling Methodology | Klondex Mines Ltd. |
In total, 228,814 feet of core was re-logged out of an estimated 240,000 feet. The estimated footage was based on the footage totals in the Klondex database. The difference in footages is a result of discarding core from the upper portions of the holes drilled in unaltered basalt. A Micon International Limited inventory list indicates 14,400 feet of core from 29 holes was discarded. Some of this discarded material was used for blank reference material. There are no surviving records citing how much core was used for this purpose.
| 10.6. |
Core Sampling Methodology |
Once geotechnical and geological data has been logged, sample intervals are determined based on geology. Minimum sample interval is approximately one foot, dependent on core diameter and whether the core is split or whole core samples. Maximum sample interval is five feet. Alteration and lithologic boundaries are not crossed. Sample breaks are marked on the core, tagged on the core boxes and entered into the log.
After completion of all logging activities, the core is sampled as follows:
| 1) |
The geologist provides a cut-sheet with the sample intervals and QAQC insertions to the sampler. | |
| 2) |
The sampler ques the core according to priority and begins sampling the intervals indicated on the cut-sheet. |
| a. |
Small diameter holes are whole-core sampled due to limited material. Larger diameter core may also be whole-core sampled, depending on the purpose of the hole. | |
| b. |
Holes that require splitting are palletized and queued near the splitter; | |
| c. |
The sampler moves the core box into the splitting facility and splits the core in half. One half is returned to the core box, and the other half is placed in a sample bag according to the sample interval specified by the geologist; | |
| d. |
The core boxes are palletized, shrink-wrapped and transported to the core storage area. In the case of whole-core sampling, the empty boxes are discarded, and; | |
| e. |
The sampled core is prepared for shipment to the assay lab. QAQC inserts are selected by the geologist. The geologist selects the appropriate number of sample IDs from a list. Core samples are assigned sample ID of type FCD123456. The sample bags and QAQC inserts are labeled with the sample IDs and stored until they can be transferred to the assay lab. |
| 3) |
A lab submittal form is filled out by the geologist. When enough samples have accumulated for a shipment, the assay lab driver is summoned to site. Samples are loaded on the lab truck, and the submittal and QAQC samples are handed to the driver. |
| Practical Mining LLC | February 5, 2018 |
| Klondex Mines Ltd. | Technical Report for the Fire Creek Project, | Page 99 |
| Lander County, Nevada |
| 10.7. |
RC Sampling Methodology |
RC sampling has been discontinued in favor of core. Prior to 2014, RC samples were collected by the driller on five-foot intervals using a rotating wet splitter. Water-flow and sample size were controlled by adding or removing splitter slot covers. The optimum sample size collected was approximately one quarter to one half of a 17-inch by 22-inch sample bag (about 20 to 30 pounds.) The number of splitter slot covers was tracked for each sample.
Sample bags were placed in a five-gallon bucket under the wet splitter. The sample buckets were placed inside a 20-inch diameter by six-inch deep rubber pan to catch overflow in case of a poorly adjusted splitter. If the sample overflowed into the pan, the run-off was re-poured into the sample bucket to recover any fine material. A population of reference chips were collected in a sieve from each sample run and placed in 20-compartment sample trays for geology logging. Buckets and pans were washed after each run, and the wet splitter was washed after each rod change. A sample cut-sheet was populated with sample ID numbers and intervals, including sample IDs for QAQC samples.
| 10.8. |
Channel Sampling Procedures |
Channel sampling began in 2013 as underground development progressed. The dataset used for the current mineral resource estimate contains 6,398 channels. The channels consist of 27,682 samples which total 48,650 feet of sample length. The channel samples are shown in black on Figure 10-4.
| Practical Mining LLC | February 5, 2018 |
| Page 100 | Drilling and Sampling Methodology | Klondex Mines Ltd. |
| 10.8.1. | Channel Sampling |
An ore control geologist checks the face at each round of advancement. The geologist measures the distance to the face along the left rib from a known reference point. This distance is recorded on a daily face sheet along with the geologist’s name, date and time, location, and heading dimensions. The geologist then sketches the face and records sample ID numbers in a column on the face sheet. Each sample ID has a row where sample length, rock type, unit, alteration and vein characteristics can be recorded.
| Practical Mining LLC | February 5, 2018 |
| Klondex Mines Ltd. | Technical Report for the Fire Creek Project, | Page 101 |
| Lander County, Nevada |
To collect the samples, the geologist puts a sample bag labeled with the first sample ID in a container. Material is chipped from the face into the bag, working at chest height. The channel is collected across the face from left to right. Material is collected with the goal of realistically representing mineralogy, alteration, and width of the vein. Typically, the first sample starts in waste at the intersection of the left rib and the face, then progresses from left to right towards the vein. The first sample ends near the vein margin, the sample bag is tied closed with a double knot and set aside, and the second sample bag is placed in the container. The second sample is taken from the vein material. The third sample is collected from beyond the right margin of the vein to the right rib. In the case of multiple veins or otherwise complex geology, the geologist collects as many samples as necessary to characterize the face. A blank QAQC sample is inserted after the vein. Channel sample IDs have a three-letter prefix followed by a six-digit number, such as FCF000001.
Once the channel samples have been collected, the geologist marks the vein margins, structures, heading ID and distance with spray paint on the rock, then takes a photograph. The geologist takes the bagged samples to the staging area outside the geology office, placing them in order on a covered rack. High-grade samples are marked with paint. All bags are secured with colored plastic zip ties; the zip tie color is changed each 24-hour period. Channel samples are transported to the Midas lab once per day by Klondex warehouse staff. QAQC samples are included in the sample stream.
| 10.8.2. | Procedures for Accurately Locating Channel Samples |
The coordinates of the channel samples are calculated using the distance measurement from the geologist’s daily face sheet. For each mining face, the geologist measures the distance along the left rib from a known reference point to the face. The channel sample is collected across the face from left to right, so the measured distance corresponds with the start of the channel. The distance recorded on the face sheet is measured on the mine survey asbuilt to find the easting and northing of the sample. Because the channel samples are collected at chest height, the elevation of the channel is calculated by adding five feet to the sill elevation of the asbuilt. This data is comparable to a drill hole collar survey.
The orientation of the face channel is defined as perpendicular to the mine heading. The channel is assigned an azimuth in the direction of the right rib (because samples are collected from left to right.) The assigned dip is 0 (because the channels are collected horizontally). This data is comparable to the downhole survey of a drill hole.
| Practical Mining LLC | February 5, 2018 |
| Page 102 | Drilling and Sampling Methodology | Klondex Mines Ltd. |
The geologist hand-enters the face sheet data into a central Excel spreadsheet. Face sheets are scanned and filed. The sample intervals and sample IDs are loaded into the AcQuire database by the Klondex Database Administrator, where they can be associated with assay values once the assay certificates are complete. The channels can then be imported into a Vulcan ISIS channel database, including header, survey and sample data.
Project staff demonstrate adequate knowledge of sampling procedures and the corresponding handling of digital data. Data handling methods implemented at the Project to manage sample data are adequate; the authors have reviewed the data and find that it is sufficiently accurate to be used in the mineral resource estimate (Figure 10-5).

| Practical Mining LLC | February 5, 2018 |
| Klondex Mines Ltd. | Technical Report for the Fire Creek Project, | Page 103 |
| Lander County, Nevada |
| 10.9. | Security Procedures |
From early 2004 until March 2012, material from split core, rejects, RC chips, and pulps were stored in multiple storage units at the business of Security Storage, 355 East Greg Street, Sparks, Nevada. RC chip and rejects were transported directly to these storage units either from the Project or from the ALS Minerals (ALS) Lab in Sparks, Nevada. Core material was first logged at the Project by a MinQuest geologist and then transported to Sparks for cutting and sampling by a MinQuest geotechnician. After cutting and sampling, the remaining core was archived in one of the storage units.
For the 2013 core re-logging program, core was retrieved from storage units in the Sparks warehouse and moved down the street to a rented logging warehouse. Once the re-logging was complete, the core was palletized, banded, wrapped, and transported back to the Project. All rejects, RC chips, and pulps were also removed from the storage units and transported to the Project. Since March 2012, sampled materials have been handled and stored on site. Rejects and pulps are periodically returned to the Project from assay labs.
Currently, all archived sampled material is stored at the Project in a fenced area at the Rapid Infiltration Basin (RIB) yard.
Channel sample security is maintained by keeping the samples in the possession of the ore control geologist until they are transferred to the staging area. Samples are double-knotted, then further secured by plastic zip ties. This makes potential sample tampering more evident because the zip tie must be destroyed in order to remove it, or the bag must be damaged in order to remove a sample.
Two sample submittals are generated. A Klondex warehouse employee receives the samples from the ore control geologist and confirms that the samples match the submittal. The samples are placed in a lockable box on the warehouse truck. When the warehouse employee exits the property, the security guard takes one submittal form and checks that the samples match the submittal, and that no samples show signs of tampering. The sample box is then locked and sealed, and the security guard files their copy of the submittal.
The lab employee receiving the samples removes the seal, checks that the samples match the submittal, and checks for tampering. Any signs of tampering are reported to the lab manager and security.
High-grade samples are marked with paint to alert the sample prep employee that extra cleaning will be necessary. When a sample dispatch contains a high-grade sample, the ore control geologist alerts the lab manager and the senior geologist with an email. All parties involved in the chain of custody take extra care when checking marked samples against the sample submittal and inspecting for tampering.
| Practical Mining LLC | February 5, 2018 |
| Page 104 | Drilling and Sampling Methodology | Klondex Mines Ltd. |
Channel sample pulps and rejects are stored at the Midas lab facility for six months to be maintained for QAQC. They are then returned to the Project site and transferred to the ore pad for processing.
| Practical Mining LLC | February 5, 2018 |
| Klondex Mines Ltd. | Technical Report for the Fire Creek Project, | Page 105 |
| Lander County, Nevada |
| 11. |
Sample Preparation, Analysis, and Security |
| 11.1. | Historic Sample Preparation |
Historical sampling methodology was previously documented (Raven et al., 2011), and is summarized below.
“Rotary cuttings are analyzed in 10-foot (3.05 meters) increments over the entire drilled interval including unmineralized rock above the vein zones. Samples in the rotary holes are collected at 5-foot (1.52 meters) intervals but assayed as 10-foot (3.05 meters) composites. The hole was blown clean between the sample intervals to avoid sample contamination. During the 2004 drilling period, cuttings were collected via a cyclone that dumped into a rotating splitter mounted on the drill. The baffles were adjusted to recover a one-quarter split of the total recovered sample. More recently, the 10-foot (3.05 meters) runs of cuttings have been caught in a large bucket and thoroughly mixed by hand before collecting a sample. The approximately 20-pound (9.1 kilograms) samples are placed in canvas bags and labeled with the hole number and footage. A backup sample remains at the Project until assaying is complete and is then discarded. The samples are picked up by ALS/Chemex for preparation at their Elko facility.”
“Below the RC precollar boring, HQ size core is drilled and collected in 10-foot (3.05 meters) paper core boxes. Intervals are marked with wooden blocks every two to three feet (0.6 to 0.9 meters). The core is logged on site by a MinQuest geologist who marks sample intervals not to exceed five feet (1.52 meters). In some vein areas, where possible visible gold is observed, the sample interval is reduced to two feet (0.6 meter). The logged and marked core is transported from the Project by the geologist, to secure storage in Battle Mountain. Under the supervision of a Project geologist, the core is transported to Elko and split in half using a core saw by Klondex employees. One-half of the core is sampled on the intervals marked by the geologist, placed in canvas bags, labeled with the hole number and footage and sent to the lab for preparation and analysis as described below. The remaining one-half core is transported to Klondex’s secure storage in Reno. The sample intervals are listed on the drill logs and assay sheets. Author Raven observed numerous intervals of split core, all of which were cleanly sawn in half and appear to evenly represent the vein systems and the sample intervals are clearly marked within the core boxes. The sample quality is of industry standard, and the methods should not introduce any bias into the results. The sampling intervals are determined mainly by the presence/absence of quartz-calcite-pyrite veins or vein stockworks. The barren, upper portions of many holes are not sampled. When veining is encountered a broad interval above and below the veins is sampled and the vein zone itself is sampled at intervals of two to five feet (0.6 -1.52 meters); discrete veins of reasonable size are sampled over the length of the vein while stockwork zones are generally sampled at five-foot (1.52 meters) core lengths” (Page 23).
| Practical Mining LLC | February 5, 2018 |
| Page 106 | Sample Preparation, Analysis, and Security | Klondex Mines Ltd. |
| 11.2. | Current Sample Preparation |
| 11.2.1. | Core Sample Preparation |
The core sampling facility is set up in a shipping container adjacent to the core logging facility. It is furnished with industry typical sampling apparatus including roller tables and a hydraulic splitter. The following outlines core sample preparation:
1) A geotechnician positions the pallet containing the core to be sampled near the shipping container and obtains a copy of the sample intervals from the geologist. The geotechnician labels cloth sample bags according to the sample interval sheet;
2) The
core boxes are lifted onto a rolling counter to the left of the splitter. A
sample bag is placed on the floor at the feet of the geotechnician to hold the
sample material;
NOTE: It is possible for empty pre-labeled sample bags to be
out of order prior to being filled or a numeric value to be omitted during
hand-writing.
3) The geotechnician splits core to approximate 50% of the sample bisecting veins equally. Geologists supervise the splitting of samples that contain visible gold (VG);
4) The left half of the split is returned to the core box, the right is placed into the sample bag;
5) When the sample interval has been bagged, the sample bag is stacked in numeric order on the floor by the door;
6) QAQC samples are bagged and labeled by geologists from standards kept in a locked cabinet in the Geology office. The geologists assemble the standards and blanks into corresponding sample bags which are hand-labeled according to the cut sheet;
7) When an entire drill hole has been completely split, the bags of sample are stacked inside a large, open, plastic bin outside the core facility;
8) The geotechnician notifies the geologist when a hole is ready to be sent to AAL (as defined below). An electronic sample submittal sheet is entered into the computer. Two copies are made, one is the original hand-entered submittal, and the other is a scan of the completed submittal. One copy is filed in a core library, and the other is given to the truck driver for AAL;
9) The entire bin of samples is picked up and delivered to AAL by the AAL driver; When the driver from AAL arrives at the core logging facility, he is given the QAQC samples to accompany the samples from the corresponding drill hole; and 10) The reserved halves of core are returned to their core boxes and are stored outside on shrink wrapped pallets in a fenced lay down area referred to as the ‘RIB Yard’.
| 11.2.2. | Channel Sample Preparation |
The following outlines the channel and sample preparation methodology.
| Practical Mining LLC | February 5, 2018 |
| Klondex Mines Ltd. | Technical Report for the Fire Creek Project, | Page 107 |
| Lander County, Nevada |
| 1) | Channel samples are bagged on site at the face as described in Section 10.8; |
| 2) | Bags are brought to the Geology office; |
| 3) | QAQC materials are inserted into the channel sample stream; and |
| 4) | Channel samples are delivered to the Klondex assay lab every 12-hour shift. |
| 11.3. | Sample Analysis Protocol |
| 11.3.1. | Historic Drill Sample Analysis |
The sample analysis methods used from 2004 through 2011, as previously described in Raven et al., 2011:
“ALS/Chemex does all sample preparation, including crushing, grinding and preparation of the assay pulps, at the Elko facility. The pulp samples are then shipped to the ALS/Chemex facility in Reno for analysis. The samples are never left unattended or insecure by geologic, drilling, or laboratory staff nor are they handled by officers, directors or associates of Klondex. For the RC pre-collar holes ALS/Chemex picks up the samples at the Project and delivers them to Elko for sample prep and to Reno for analysis. After the core samples are cut and labeled for analysis they are delivered to the lab by Klondex employees” (Page 25).
“Sample preparation involves crushing the entire sample to minus 10 mesh, splitting, then pulverizing 1,000 grams to 80% passing minus 200 mesh (75 microns). These pulps are shipped to the Reno facility of ALS/Chemex for analysis. Analyses for gold were done using a 50-gram charge through to the end of 2009. In 2010 Klondex changed to a 30-gram charge for gold analysis after reviewing the data. Both gold and silver analyses are determined by fire assay with an AA finish. The ALS/Chemex analyses codes are AA23 for gold values under 10 grams per ton (g/t) and GRA (gravimetric) for gold assays over 10 g/t; silver codes are AA61 with over limits run using AA62” (Page 25).
“The assay laboratory automatically repeated all gold assays that by fire assay with AA finishing reported under one g/t, using 50 grams prior to late 2010, then 30 grams fire assaying subsequently. Any samples reporting under 10 g/t gold by fire assay with AA finish are automatically subjected to gravimetric analysis” (Page 25).
“When the lab work is complete, the pulps are stored briefly at the lab then transferred to Klondex’s secure storage facility, the same facility that houses the drill core. Coarse rejects that reported significant gold are stored with the pulps, those reporting minimal gold are stored until check assays can be completed and are then discarded and those reporting insignificant gold are discarded.”
| Practical Mining LLC | February 5, 2018 |
| Page 108 | Sample Preparation, Analysis, and Security | Klondex Mines Ltd. |
| 11.3.2. | Drill Sample Analysis from 2012 through April 30, 2014 |
From 2012 until April 30, 2014 Klondex specified that ALS follow sets of assay procedures based on ranges of assay values. For samples with visible gold, Klondex submitted samples to ALS for a metallic screen fire assay. All other samples were initially run with Atomic Absorption fire assay fusion analytical method (AA23). Samples with AA23 results between one ppm Au and 10 ppm Au were re-run as an AA23 duplicate. Samples with an initial result greater than 10 ppm Au up to 20 ppm Au were re-assayed with gravimetric finish. If the assay results were very high-grade (greater than 20 ppm Au), then ALS would re-assay the coarse rejects of the high-grade sample and the two samples on either side by metallic screen fire assay.
| 11.3.3. | Current Drill Sample Analysis |
Drill samples are submitted to American Assay Laboratories Inc. (AAL) of Sparks, Nevada. AAL is an ISO/IEC 17025:2005 accredited laboratory which is independent of Klondex. Assay procedures have been established based on sample type (core or RC). Assay procedures for core samples are further determined according to the designated purpose of the drill hole (exploration or production) and grade of the sample. The drill sample analysis protocols are as follows:
RC sample analysis procedure:
Samples are received and dried in-bag at 85° C. The dry sample is crushed to 70% passing minus 10 mesh. The crusher is cleaned with compressed air between each sample. A 1,000 gram pulp is collected from the crushed sample using a rotary splitter. The remainder of the sample is stored and returned to Klondex. The pulp is then pulverized to 85% passing minus 200 mesh. The pulverizer is cleaned with compressed air between each sample. Thirty grams (g) of pulverized sample is used to perform fire assay with ICP finish for gold, and 0.5 g of sample is used to perform analysis for silver with ICP finish. If the result is greater than 10 ppm Au or greater than 100 ppm Ag, then 50 grams of the pulverized pulp is used to run a fire assay for Au and Ag with gravimetric finish. If the gravimetric result is greater than 10 opt Au, then the remaining pulp is screened at 150 mesh for a metallic screen fire assay for Ag and Au with a gravimetric finish. Pulps are stored and returned to Klondex.
Core sample analysis procedure:
All core samples are received and dried in-bag at 85° C. Samples are crushed to 80% passing minus 10 mesh with a crusher clean-out between each sample. A 1,000 g pulp is taken from the crushed sample using a rotary splitter. The pulp is pulverized to 85% passing minus 200 mesh with a pulverizer clean-out between each sample. The pulps are then assayed according to the designated purpose of the drill hole (exploration or production) and whether a high grade result (Au greater than 10 opt) is anticipated. All pulps and rejects are returned to Klondex.
| Practical Mining LLC | February 5, 2018 |
| Klondex Mines Ltd. | Technical Report for the Fire Creek Project, | Page 109 |
| Lander County, Nevada |
Production core samples:
For production hole samples which are not anticipated to be high grade, 50 g of the pulp is used for a fire assay for silver and gold with a gravimetric finish. For any sample with a result less than 10 opt Au or Ag, the remaining pulp is re-run as metallic screen fire assay for silver and gold with a gravimetric finish.
Production core samples, high grade:
For production hole samples with visible gold or other high grade characteristics, the entire pulp is screened at 150 mesh and analyzed with metallic screen fire assay for silver and gold with gravimetric finish.
Exploration core samples:
For exploration hole samples which are not anticipated to be high grade, 50 g of the pulp is used for a fire assay for gold with ICP finish, and 0.5 g of sample is used to perform analysis for silver with ICP finish. Any sample with a result of less than 10 ppm Au or less than 100 ppm Ag is rerun using 50 g of pulp with fire assay for silver and gold with a gravimetric finish. For a gravimetric result of less than 10 opt Au, the remaining pulp is used for a metallic screen fire assay for silver and gold with gravimetric finish.
For any sample with a result less than 10 opt Au, the remaining pulp is re-run as metallic screen fire assay for silver and gold with a gravimetric finish.
Exploration core samples, high grade:
The procedure for high grade exploration samples is similar to the procedure for other exploration samples, except when more than trace amounts of gold and silver are expected, the fire assay with ICP finish is skipped and the process starts with a 50 g fire assay for gold and silver.
| 11.3.4. | Channel Sample Analysis |
Channel samples were sent to SGS North America, Inc. in Elko, Nevada from June 16, 2013 to April 30, 2014. Analysis followed the following protocol:
| • | Sample material is dried. Samples weighing more than three kilograms (kg) are split down to three kg then crushed to 75% passing through a 2mm screen. Material is split down to 250 g, pulverized to 85% passing through a 75 micron screen; |
| Practical Mining LLC | February 5, 2018 |
| Page 110 | Sample Preparation, Analysis, and Security | Klondex Mines Ltd. |
| • | QC is performed at the crush and pulverization stages; | |
| • | Silver is analyzed by AA methods after a multi-acid digest at a weight of two grams; | |
| • | Gold is analyzed by FA with gravimetric finish at a weight of 30 g (the reported code is F 152); and | |
| • | Gold is analyzed by FA and gravimetric finish at a weight of 50 g (the reported code is F 133). |
In June 2013, the split was increased to 1,000 g, and the initial fire assay aliquot was increased to 500 g. Rejects for April through June 2013 were sent to SGS’s Vancouver office for metallic screen assays. Results for these assays were incomplete and are not used in the mineral resource model.
Between May 1, 2014 and July 16, 2014, samples were sent to Dave Francisco lab in Fallon, Nevada. Between July 17, 2014, and February 1, 2015, samples were sent to the Klondex lab at Pinson. Dave Francisco lab and Klondex lab followed the same procedures. Both labs followed the 17025 Standard, but neither had official lab certifications. QAQC samples support the results from both labs. Analysis followed the following protocol:
Samples were dried in pans at 250° F. The dried samples were crushed to 80% passing 10 mesh, with a crusher clean-out between each sample. The crusher was cleaned twice following high grade samples. The crushed sample was homogenized. 500 g was collected with a riffle splitter then pulverized to 85% passing 200 mesh. The pulverizer was cleaned after every sample, twice after high-grade samples. For 10% of samples, a second pulp was prepared as a preparation duplicate. Remaining coarse rejects were retained and stored by Klondex.
Fifty grams of the pulverized pulp was used to run a fire assay for gold and silver with gravimetric finish. In each batch of assays, the lab inserted a standard and blank. The lab also ran five percent of samples as analytical duplicates. Samples with result more than 2.92 opt Au were run with metallic screen fire assay with gravimetric finish.
Between July 17, 2014 and September 2016, samples were sent to ALS in Elko, NV, an ISO 17025:2005 accredited independent lab. Samples were dried, crushed to >80% passing 10 mesh, split to 1,000 g using a rotary splitter, and pulverized to >85% passing 200 mesh. The crusher and splitter were cleaned with barren material between each sample. 30 g of the pulp was used for fire assay with gravimetric finish (ALS code ME-GRA21) for Au and Ag. If the Au assay result was >10 opt, 30 g of the pulp was screened to 100 microns and fire assay was performed separately on the undersize and oversize fractions (ALS code Me-SCR21). High grade samples were flagged by geologists and received extra cleaning in the prep circuit. Rejects and pulps were returned to Klondex.
| Practical Mining LLC | February 5, 2018 |
| Klondex Mines Ltd. | Technical Report for the Fire Creek Project, | Page 111 |
| Lander County, Nevada |
Currently, Fire Creek channel samples are analyzed at Klondex’s assay lab facility at Midas. The channel sample analysis protocol is as follows:
Sample Preparation:
| • | Sample received, inventoried, panned, and dried at 250° F; |
| • | Sample crushed to 80% passing 10 mesh; |
| • | Crusher cleanout rock/air after every sample, high grade cleanout twice; |
| • | Sample homogenized, 300 gram riffle split taken; |
| • | 300 gram split pulverized to 85% passing 200 mesh; and |
| • | Pulverizer cleanout sand/air after every sample, high grade cleanout twice. |
Fire Assay:
| • | 30 gram prepared sample weighed in 40 gram crucible for fire assay gold/silver; |
| • | Sample custom fluxed for oxide/sulfide matrix; |
| • | Quality Control (QC), Certified Reference Material (CRM), blank, and 5% analytical |
duplicates inserted and reported by batch;
| • | Sample are fused, poured, cupelled, and finished gravimetrically; and |
| • | Gold/silver grades calculated. |
| 11.3.5. | Handling Analyses Results |
| 1) | AAL sends the assay results and certificates by email to three people: Chief Geologist, Senior Geologist, and Geology Database Administrator. For channel samples, the Klondex lab emails results to these people as well as the ore control geologists; |
|
| 2) | Assay results are stored as portable document formats (PDF) and MS Excel files on the Klondex server in a hierarchy of folders with a naming convention based on designation of sampled material. Folders include channel samples, UG core, surface core, surface RC, screen filter sampling, truck load samples, rib sampling, muck piles, waste piles, and resamples of these same sources. This folder system is rudimentary and not user- protected; |
| Practical Mining LLC | February 5, 2018 |
| Page 112 | Sample Preparation, Analysis, and Security | Klondex Mines Ltd. |
| 3) | The PDF and Excel files from AAL are renamed to add the BHID for identification and for ease in referencing, and; |
|
| 4) | The Database Administrator imports the data into AcQuire. For use in the Project modeling software, the Database Administrator occasionally exports the AcQuire data as CSV files and provides them to the Resource Geologist. |
| 11.4. | Sample Security Measures |
Drilled materials are stored under a moderate level of security during the multiple stages of sample handling. Core is handled and stored at the Project, which is staffed by security personnel. Core is transported to the Beowawe core shed as needed by Klondex personnel where it is stored outside in a locked, fenced yard until moved inside for logging and sampling. The core shed is randomly visited by security personnel. When geology staff are not present, the core shed is locked. Sampling of core with visible gold is supervised by geologists. When sampling is complete, retained core samples are returned to boxes, stacked on pallets and shrink wrapped. The wrapped pallets are moved to a fenced facility at the “RIB yard”. Coarse rejects and pulps returned by the laboratories are also shrink wrapped on pallets and stored at the RIB yard. The authors conclude that sample security measures at the Project are adequate.
| 11.5. | Quality Control Measures |
Historically, QAQC measures used to check the consistency in assay reporting were either lacking or not included in any surviving reports. Beginning in March 2004 through the second quarter of 2012, Klondex samples were submitted to ALS and were reliant solely on the laboratory’s in-house QAQC to monitor the sampling results. The current practice of inserting blanks and standards and specifying prep duplicates began in the second quarter of 2013 when Klondex began processing core on site. Prior to this time, core was transported to Reno for cutting and sampling, and any QAQC measures were directed by MinQuest in Reno.
From March 2004 through February 2012, ALS’s QAQC checks on the Project samples included 12,465 in-house standard samples inserted into the Klondex sample runs and 11,201 re-assays of the immediately previous sample as part of their protocols. Also, beginning in August 2010 through February 2013, ALS completed 1,264 in-house check duplicates derived from pulp of the sample prepared for Project sample runs. Recently, ALS sent a summary of their in-house QAQC sample results to Klondex as part of recording QAQC documentation. Their report combines sample results from both surface and underground drilling.
The populations of datasets for ALS in-house QAQC sampling are itemized in Table 11-1 below.
| Practical Mining LLC | February 5, 2018 |
| Klondex Mines Ltd. | Technical Report for the Fire Creek Project, | Page 113 |
| Lander County, Nevada |
Table 11-1 ALS In-house QAQC Datasets Reviewed
|
Datasets: |
ALS internal QC standards (March 2004 - Feb. 2013) |
ALS internal QC dups (March 2004 - Feb. 2013) |
ALS internal QC prep- dups (Aug. 2010 - Feb. 2013) |
SRM Au and Ag standards (Nov. 2010) |
Klondex standards*1 |
Klondex duplicates*2 |
| UG Core | mixed surf+ug |
mixed surf+ug |
mixed surf+ug |
0 | 193 | 77 |
| Surface RC/core | mixed surf+ug |
mixed surf+ug |
mixed surf+ug |
94 | 152 | 39 |
| Totals | 12465 | 11201 | 1264 | 94 | 345 | 116 |
| *Surface standards and dups dates: June 2012 - Jan. 2013 | ||||||
| *UG standards and dups dates: August 2012 - May 2013 |
11.5.1. QAQC Prior to 2012
Historic data validation has previously been addressed (Raven et al., 2011). A summary of their work includes:
“…Until late 2010 Klondex did not employ any submitted sample based QAQC program. Prior to that time, the only QA reporting was derived from the commercial laboratory’s internal QA programs that included internal blanks and standards, and automatic re-assays of pulps in which the gold grades exceeded one g/t. In addition a significant number of samples were sent to a different laboratory for check analysis. Subsequently Klondex has initiated its own internal quality control procedures. Presently (2011) Klondex has prepared blank samples using post-mineral basalt core from well above the mineralized zones. In addition two standards were prepared (low and medium grade) by ALS from Fire Creek assay rejects and there have now been enough analyses of the standards to determine their average grade and standard deviation.” (Page 25)
“…A blank and two standards are now included in each drill hole as standard practice.” (Page 25)
“… A review of the data from the 2010 drilling campaign that made use of the new QAQC procedures did not outline any difficulties with the new standards and blanks that would indicate an error at the lab. The check assays performed on drill core samples that assayed under one g/t gold show good agreement between the original assay and the check assay.” (Page 27)
| Practical Mining LLC | February 5, 2018 |
| Page 114 | Sample Preparation, Analysis, and Security | Klondex Mines Ltd. |
“…The ALS/Chemex facility at Elko is certified to ISO 9001:2008 standards and only handles sample receiving and preparation. The ALS/Chemex facility in Reno provides a broader range of analytical services and is also certified to ISO 9001:2008 Standards; in addition it has received accreditation to ISO/IEC 17025:2005 from the Standards Council of Canada (SSC) for Fire Assay gold by Atomic Absorption, which is the analytical method Klondex utilizes for its gold analyses.” (Page 27)
“…All gold assays in excess of one g/t are rerun at least once. A large number of gold reruns are also carried out where values are less than one g/t. These were either on samples adjacent to intervals with elevated gold assays, on samples with elevated silver values and low gold, or at the discretion of the geologist when lithologic characteristics were suspect.” (Page 29)
“…samples with greater than 10 g/t gold were rerun using a 50 g fire assay with gravimetric finish (ALS-Chemex Au-GRA22 procedure) to late 2010 then a 30 g charge subsequently.” (Page 29)
Historic data validation has previously been addressed (Raven et al., 2011). A summary of their work includes:
“…Until late 2010 Klondex did not employ any submitted sample based QAQC program. Prior to that time, the only QA reporting was derived from the commercial laboratory’s internal QA programs that included internal blanks and standards, and automatic re-assays of pulps in which the gold grades exceeded one g/t. In addition a significant number of samples were sent to a different laboratory for check analysis. Subsequently Klondex has initiated its own internal quality control procedures. Presently (2011) Klondex has prepared blank samples using post-mineral basalt core from well above the mineralized zones. In addition two standards were prepared (low and medium grade) by ALS from Fire Creek assay rejects and there have now been enough analyses of the standards to determine their average grade and standard deviation.” (Page 25)
“…A blank and two standards are now included in each drill hole as standard practice.” (Page 25)
“… A review of the data from the 2010 drilling campaign that made use of the new QAQC procedures did not outline any difficulties with the new standards and blanks that would indicate an error at the lab. The check assays performed on drill core samples that assayed under one g/t gold show good agreement between the original assay and the check assay.” (Page 27)
| Practical Mining LLC | February 5, 2018 |
| Klondex Mines Ltd. | Technical Report for the Fire Creek Project, | Page 115 |
| Lander County, Nevada |
“…The ALS/Chemex facility at Elko is certified to ISO 9001:2008 standards and only handles sample receiving and preparation. The ALS/Chemex facility in Reno provides a broader range of analytical services and is also certified to ISO 9001:2008 Standards; in addition it has received accreditation to ISO/IEC 17025:2005 from the Standards Council of Canada (SSC) for Fire Assay gold by Atomic Absorption, which is the analytical method Klondex utilizes for its gold analyses.” (Page 27)
“…All gold assays in excess of one g/t are rerun at least once. A large number of gold reruns are also carried out where values are less than one g/t. These were either on samples adjacent to intervals with elevated gold assays, on samples with elevated silver values and low gold, or at the discretion of the geologist when lithologic characteristics were suspect.” (Page 29)
“…samples with greater than 10 g/t gold were rerun using a 50 g fire assay with gravimetric finish (ALS-Chemex Au-GRA22 procedure) to late 2010 then a 30 g charge subsequently.” (Page 29)
“…The checked assays are usually in good agreement with the original assay indicating no significant nugget effect.” (Page 29)
“…Additional check assays have been received from the 2009 and 2010 drilling campaigns and they show a similarly good correlation between the original assay and the duplicate, or check assays.” (Page 29)
“…There have been approximately 4,000 duplicate samples submitted for check analyses as part of the QAQC program.” (Page 31)
“…Klondex undertook some umpire assays at different laboratories to verify a portion of the higher grade results and compared analytical methods for gold by fire assay with an AA finish vs. a gravimetric finish. Silver was also included in the analysis between the two labs.” (Page 32)
“…The authors (Raven et al., 2011) verified a portion of the drill core data by re-assaying sample pulps sent to SGS Mineral Services in Vancouver, British Columbia. The SGS laboratory is an ISO 9001:2008 accredited facility. Coarse reject material for all the samples selected was not available so sample pulps were chosen over splitting the remaining core. The samples selected for verification were from a broad range of drill holes and designed to test various grades of mineralization from low- to high-grade.” (Page 34)
“…There is a good agreement between the original values vs. the check assays as noted in the charts above for nearly 4,000 check samples and it is felt that this correlation is sufficient and demonstrates that while there are spurious values indicating some nugget effect, in most cases the nugget effect is minimal.” (Page 36)
| Practical Mining LLC | February 5, 2018 |
| Page 116 | Sample Preparation, Analysis, and Security | Klondex Mines Ltd. |
“…Author Raven did note in the drill core and corresponding assay results for those intervals that the better gold grades are confined to intervals containing quartz +/- carbonate veining, either larger (less than 1.5 feet) discrete veins or stockwork systems of veining. Klondex has assayed numerous intervals of visually barren mafic volcanics (no veining, fracturing or faulting) and those intervals do not return anomalous gold assay.” (Page 36)
| 11.5.2. | Current QAQC Procedures |
From 2012 through March 2014, Klondex’s QAQC protocol at the Project was to submit a blank as the first sample of each drill hole, followed by a standard, blank or duplicate every 20th sample in the sample stream. Beginning April 2014, geologists insert QAQC standards as five percent of the sample stream. The type and location of each standard is at the geologist’s discretion. A blank is inserted after each vein, with a minimum of one blank per batch and at least one blank every 20 samples. At least one standard is inserted for every 20 samples with a minimum of one blank per batch. Sample preparation duplicates are requested at a rate of one in 100 samples. Pulps are pulled and checked at a secondary laboratory for five percent of the sample stream.
The QAQC requirements for channel samples are similar to the requirements for drill holes. A blank and a standard are inserted every 20 samples with a minimum of one standard and one blank per batch. A blank is inserted after most veins. For high grade veins, a blank is inserted after the vein and at the end of the channel. This results in a high percentage of QAQC samples in the sample stream. From July 2015 through October 2017, 23 percent of the sample stream were QAQC samples, with blanks totaling 19% and stds 4%. Duplicates are to be run once per 100 samples. Pulps are pulled and checked at a secondary laboratory for five percent of the sample stream.
Geologists review QAQC results as assay certificates are received. The geologist must approve the QAQC results in AcQuire before the sample batch is accepted as final. If a QAQC sample fails, the geologist identifies the most likely reason for the failure and requests a re-run if necessary. The Database Administrator generates a detailed report of standard and blank results monthly and quarterly which is distributed to the geology department. The report includes graphs for each standard and blank. A separate graph is generated for every analytical method used to analyze the standard. Statics are also compiled, including number of standards and blanks submitted and percent of the sample stream composed of standards and blanks.
The types of QAQC samples used at Fire Creek are listed below in the order of 1) blank, 2) standard, and 3) duplicate.
| Practical Mining LLC | February 5, 2018 |
| Klondex Mines Ltd. | Technical Report for the Fire Creek Project, | Page 117 |
| Lander County, Nevada |
| 1) | Blanks are composed of homogenous barren material. Their assay values are expected to be below detection. The FCBLANKXX series is locally sourced material. Blanks are listed in Table 11-2. |
Table 11-2 Blanks
| Standard | notes | Expected Value | Expected Value |
| Au ppm | Ag ppm | ||
| FCRDBLNK01 | reduced | < detection | < detection |
| FCOXBLNK01 | oxidized | < detection | < detection |
| AUBLANK54 | < detection | < detection | |
| FCBLANK01 through FCBLANK28 |
locally sourced |
< detection |
< detection |
| 2) | Klondex uses several QAQC standards. Some were produced in-house from locally derived low-grade basalt. Most were purchased from ROCKLABS, a reputable supplier of reference material. Standard IDs and values are listed in Table 11-3. |
Table 11-3 Standards
| Reported Value | Reported Value | |
| Standard | Au ppm | Ag ppm |
| FCRDLOW01 | 1.246 | |
| OXQ90 | 24.88 | |
| OXP91 | 14.82 | |
| OXN92 | 7.643 | |
| SG56 | 1.027 | |
| SN60 | 8.596 | |
| SP59 | 18.12 | |
| SQ48 | 30.25 | |
| SQ83 | 30.64 | |
| SQ70 | 39.62 | 159.5 |
| SP72 | 18.16 | 83 |
| SQ88 | 39.72 | 160.8 |
| OXQ114 | 35.2 | 127.1 |
| SN74 | 8.981 | 51.5 |
| SN75 | 8.671 |
| 3) | For duplicate sampling to test the precision of the lab, Klondex submits an empty bag labeled with the required sample ID in the sample sequence. The lab takes a split from the pulp of the previous sample to run as a duplicate. To test the accuracy of the lab, pulps from five percent of the sample stream are tested at a secondary lab. |
| Practical Mining LLC | February 5, 2018 |
| Page 118 | Sample Preparation, Analysis, and Security | Klondex Mines Ltd. |
| 11.6. | QAQC Analysis |
| 11.6.1. | Duplicate Performance- Accuracy |
Several sets of pulp check data have been compiled. For drill holes, a selection of pulps run at AAL were submitted to ALS, and pulps run at ALS were submitted to AAL. For channels, samples from ALS were sent to AAL, samples from ALS were sent to KIL (Klondex Internal Lab), and samples from KIL were sent to ALS and AAL. The datasets are listed in Table 11-4
Table 11-4 Pulp Checks
| Sample | Original | Check | Assay | Sample |
Type |
Lab | Lab | Type | Count |
| drill | ALS | AAL | AU & AG | 328 |
| drill | AAL | ALS | AU & AG | 37 |
| channel | ALS | AAL | Au | 306 |
| channel | KIL | ALS | AU & AG | 125 |
| channel | KIL | AAL | AU & AG | 49 |
| channel | ALS | KIL | AU & AG | 213 |
11.6.2. Duplicate Performance - Precision
325 drill hole assay pairs are shown in Figure 11-1. Regression analysis at the 95% confidence interval indicates a small tendency for the duplicate assay to be higher than the original. This tendency is the result of high grade outlier values.
The results of 125 duplicate checks made between Klondex and ALS are shown in Figure 11-2. There is good agreement between both labs as evidenced by the ideal trend line plotting between the upper and lower 95% confidence limits.
| Practical Mining LLC | February 5, 2018 |
| Klondex Mines Ltd. | Technical Report for the Fire Creek Project, | Page 119 |
| Lander County, Nevada |


| Practical Mining LLC | February 5, 2018 |
| Page 120 | Sample Preparation, Analysis, and Security | Klondex Mines Ltd. |
| 11.6.3. | Blank Assay Performance |
Table 11-5 shows the results from both ALS and KIL of blank samples submitted with channel samples. Examples of these results are displayed graphically in Figure 11-3 and Figure 11-4. Most of the values reported are at one half the detection limit for the method used, and sample contamination or assay errors at either lab occur infrequently.
Table 11-5 Channel Blank Assay Set Performance
| Designation | Count | Mean g/t | Std. dev. |
| KIL FCBLANK20 Au | 419 | 0.20 | 0.22 |
| KIL FCBLANK20 Ag | 421 | 4.21 | 3.63 |
| KIL FCBLANK22 Au | 173 | 0.26 | 0.57 |
| KIL FCBLANK22 Ag | 173 | 3.88 | 2.22 |
| KIL FCBLANK24 Au | 337 | 0.23 | 0.99 |
| KIL FCBLANK24 Ag | 337 | 3.48 | 0.50 |
| KIL FCBLANK26 Au | 876 | 0.42 | 4.10 |
| KIL FCBLANK26 Ag | 876 | 4.63 | 21.77 |
| ALS FCBLANK10 Au | 459 | 0.18 | 1.17 |
| ALS FCBLANK10 Ag | 459 | 5.10 | 0.59 |
| ALS FCBLANK14 Au | 462 | 0.09 | 0.53 |
| ALS FCBLANK14 Ag | 462 | 5.08 | 1.40 |
| ALS FCBLANK16 Au | 429 | 0.27 | 2.94 |
| ALS FCBLANK16 Ag | 430 | 6.83 | 35.11 |
| ALS FCBLANK18 Au | 279 | 0.08 | 0.13 |
| ALS FCBLANK18 Ag | 279 | 5.22 | 2.67 |
| Practical Mining LLC | February 5, 2018 |
| Klondex Mines Ltd. | Technical Report for the Fire Creek Project, | Page 121 |
| Lander County, Nevada |

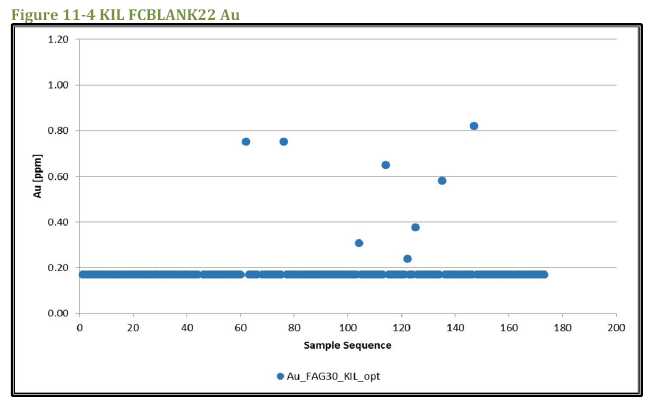
| Practical Mining LLC | February 5, 2018 |
| Page 122 | Sample Preparation, Analysis, and Security | Klondex Mines Ltd. |
| 11.6.4. | Standards Performance |
Table 11-6 shows the results of 26 standard assay sets analyzed by AAL and ALS. These show generally good results whole the four sets with the least precision are attributed to ALS. Results from both labs for standard SN60 are shown in Figure 11-5 and Figure 11-6.
Table 11-6 Drill Hole Standard Assay Performance
Standard |
Standard Value g/t |
Count | Mean g/t | Std. dev. |
| ALS-OXN92 | 7.64 | 96 | 7.54 | 0.22 |
| AAL-OXN92 | 7.64 | 61 | 7.64 | 0.19 |
| AAL-OXP91 | 14.82 | 11 | 15.19 | 0.36 |
| ALS-OXQ90 | 24.88 | 46 | 24.68 | 0.32 |
| AAL OXQ90 | 24.88 | 29 | 24.73 | 0.76 |
| ALS-SN60 | 8.60 | 250 | 8.31 | 0.28 |
| AAL-SN60 | 8.60 | 479 | 8.56 | 0.46 |
| AAL-SP59 | 18.12 | 13 | 18.10 | 0.41 |
| ALS-SQ70 Au | 39.62 | 181 | 36.93 | 7.98 |
| ALS-SQ70 Ag | 159.50 | 183 | 154.14 | 6.87 |
| AAL-SQ70 Au | 39.62 | 52 | 39.22 | 1.58 |
| AAL-SQ70 Ag | 159.5 | 44 | 160.13 | 4.02 |
| AAL-SP72 Au | 18.16 | 379 | 18.19 | 0.37 |
| AAL-SP72 Ag | 83.01 | 313 | 82.82 | 1.84 |
| ALS-SP72 Au | 18.16 | 462 | 16.60 | 2.91 |
| ALS-SP72 Ag | 83.01 | 469 | 78.70 | 11.29 |
| AAL-SQ83 | 30.62 | 8 | 29.72 | 0.62 |
| AAL-SN75 | 8.67 | 180 | 8.45 | 0.39 |
| ALS-SN75 | 8.67 | 858 | 8.36 | 0.55 |
| AAL-SQ88 Au | 39.72 | 76 | 39.13 | 0.75 |
| AAL-SQ88 Ag | 160.80 | 64 | 159.91 | 3.42 |
| ALS-SQ88 Au | 39.72 | 73 | 39.06 | 1.05 |
| ALS-SQ88 Ag | 160.80 | 78 | 156.69 | 10.71 |
| ALS-OXQ114 Au | 35.20 | 25 | 34.76 | 0.49 |
| ALS-OXQ114 Ag | 127.10 | 49 | 117.43 | 10.39 |
| ALS-SQ83 | 30.64 | 25 | 29.10 | 4.37 |
| Practical Mining LLC | February 5, 2018 |
| Klondex Mines Ltd. | Technical Report for the Fire Creek Project, | Page 123 |
| Lander County, Nevada |
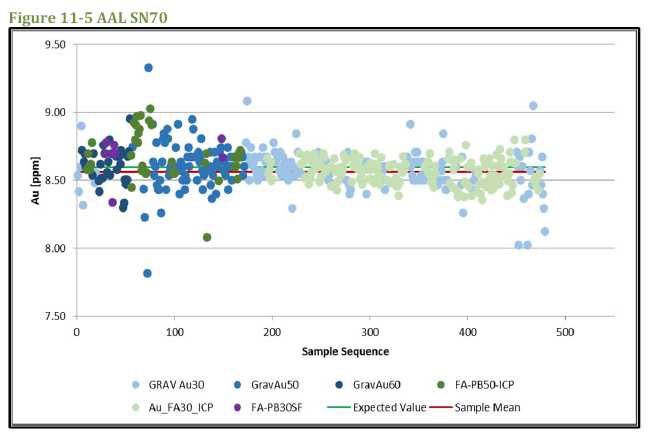

| Practical Mining LLC | February 5, 2018 |
| Page 124 | Sample Preparation, Analysis, and Security | Klondex Mines Ltd. |
Standard assay sets submitted with channel samples are listed in Table 11-7 and the results from KIL-SN75 shown om Figure 11-7. All sample sets show good accuracy, however the precision of the KIL sample sets is lower than ALS.
Table 11-7 Channel Standard Assay Performance
| Standard | Standard Value g/t |
Count | Mean g/t | Std. dev. |
| ALS-OXN92 | 7.64 | 42 | 7.40 | 1.65 |
| KIL-OXN92 | 7.64 | 17 | 8.46 | 0.49 |
| ALS-SN60 | 8.60 | 118 | 8.34 | 1.33 |
| ALS-SN75 | 8.67 | 31 | 8.38 | 0.12 |
| KIL-SN75 | 8.67 | 149 | 8.76 | 1.55 |
| ALS-SP72 Au | 18.16 | 93 | 17.82 | 0.35 |
| ALS-SP72 Ag | 83.00 | 91 | 80.74 | 5.34 |
| KIL-SP72 Au | 18.16 | 93 | 18.67 | 6.46 |
| KIL-SP72 Ag | 83.00 | 94 | 82.77 | 11.03 |
| ALS-SQ70 Au | 39.62 | 28 | 38.44 | 1.01 |
| ALS-SQ70 Ag | 159.50 | 28 | 152.33 | 7.01 |
| KIL-SQ70 Au | 39.62 | 57 | 41.39 | 13.17 |
| KIL-SQ70 Ag | 159.50 | 57 | 161.36 | 8.05 |
| ALS-SQ83 | 30.64 | 30 | 29.78 | 0.94 |
| KIL-SQ88 Au | 39.72 | 63 | 38.91 | 5.13 |
| KIL-SQ88 Ag | 160.80 | 63 | 157.30 | 28.23 |
| Practical Mining LLC | February 5, 2018 |
| Klondex Mines Ltd. | Technical Report for the Fire Creek Project, | Page 125 |
| Lander County, Nevada |

| 11.7. | Opinion on the Adequacy of the Sampling Methodologies |
Project staff have shown a solid understanding with regard of the management of the sampled material and associated digital data. The methods of handling the drilled material, both physically and electronically, are acceptable for use in an analysis of the potential mineral resource.
| 11.7.1. | Sampling Protocol Issues |
Beginning in 2015, AcQuire database software was implemented for data management. AcQuire is less susceptible to human error, contains robust data validation capabilities, and maintains the data in a more archival format. Klondex has completed importation of historic data into AcQuire so that all data is maintained through the same interface. The Authors have verified the AcQuire data as described in Section 12 and found it to be acceptable.
Blanks duplicates and standards account for 5% of the samples submitted for assay. Project staff has implemented good QA/QC procedures and the results are updated and reviewed monthly.
| Practical Mining LLC | February 5, 2018 |
| Page 126 | Sample Preparation, Analysis, and Security | Klondex Mines Ltd. |
| 11.7.2. | Standards and Blanks Performance Issues |
All labs produced good accuracy over the range of QA/QC samples analyzed. AAL has the highest degree of precision of the three labs.
The blank data collected and used by Klondex does not present any underlying problems with sample handling, assay methods or laboratories. As a matter of routine, whenever a blank assay outside of acceptable limits is received, the entire assay set should be re-assayed, and the initial results replaced with the succeeding results.
The authors’ opinion is that Klondex’s current QAQC program, for sampling protocols, is managed in an acceptable manner. QAQC verification does not indicate any underlying deficiencies in the database.
| Practical Mining LLC | February 5, 2018 |
| Klondex Mines Ltd. | Technical Report for the Fire Creek Project, | Page 127 |
| Lander County, Nevada |
| 12. |
Data Verification |
The authors analyzed the sample data used in the mineral resource estimation to verify its suitability for use in this TR. The dataset includes records of drilled and channel-sampled material collected from 2004 through October 2017. Mr. Jesse Gauthier, Klondex Database Administrator, manages the data using AcQuire software. Mr. Gauthier exports the data as csv files for import into Maptek Vulcan ISIS databases by Mr. Anthony Bottrill, Klondex Corporate Resource Manager. Mr. Bottrill provided the authors with a copy of the ISIS databases for drill samples and channel samples. The authors chose a representative subset of at least five percent of the ISIS data, and requested the corresponding raw data source files from Klondex. The accuracy of the data was verified by comparing the values in the ISIS databases to the values in the original source files. The raw assay data contained in the source files has been determined adequate for use in the mineral resource estimation as discussed in Section 11.5.
Two ISIS databases were used to estimate the mineral resource: one database was compiled from drilled material and the other from channel-sampled material. The drilled material dataset contains data from surface holes drilled from March 2004 through October 2017 and from underground holes drilled from September 2011 through October 2017. The channel sample dataset contains data collected from April 2013 through October 2017.
| 12.1. | Results of Drill Data Review |
The four categories of data reviewed for the drill dataset are collar location surveys, down-hole surveys, assays and geology.
| • | Collar location surveys reviewed: 76 surveys of underground hole collars and one surface collar survey were reviewed, representing about five percent of the holes in the dataset; |
| • | Downhole surveys reviewed: 81 downhole surveys of underground holes, 46 downhole surveys of surface core holes and one downhole survey of a surface RC hole were reviewed, representing about eight percent of the holes in the dataset; |
| • | Geology reviewed: vein intercepts were checked for 121 underground holes, 235 surface core holes and two surface RC holes, representing about 24% of the holes in the dataset; and |
| • | Assays reviewed: original assay result certificates were reviewed for 150 underground holes, 172 surface core holes and two surface RC holes, representing about 21% of the holes in the dataset. |
| Practical Mining LLC | February 5, 2018 |
| Page 128 | Data Verification | Klondex Mines Ltd. |
Table 12-1 Data Review Summary Drilled Material
Dataset |
Total Drill | Collar | Downhole | Vein | Assay |
| Holes | Surveys | Surveys | Intercepts | Certificates | |
| Reviewed | Reviewed | Reviewed | Reviewed | ||
| UG Core | 1,060 | 76 | 81 | 121 | 150 |
| Surface Core | 362 | 1 | 46 | 235 | 172 |
| Surface RC | 52 | 1 | 2 | 2 | |
| Totals | 1,474 | 77 | 128 | 358 | 324 |
| Percent of Population Reviewed: |
5% | 8% | 24% | 21% |
The authors compared 76 underground collar survey reports to collar easting, northing, elevation and TD values in the database and found 100% correlation for holes drilled since August 2012. Collar locations of underground holes drilled prior to August 2012 are considered reliable as discussed in Section 10.1.2.
The authors compared one surface collar survey report to the collar easting, northing, elevation, and TD values in the database and found 100% correlation for holes drilled since 2012. Surface collar locations for holes drilled before 2012 are considered reliable as discussed in Section 10.1.1. Collar survey reports were unavailable for holes drilled from July 2015 through October 2017. Collar surveys were informally emailed by contract surveyors to geologists who entered the easting, northing and elevation into the database. Generating a formal archive of each collar survey report has now been added to the standard operating procedure. The authors performed a collar check by observing that each collar coincides with a surface drill pad or an underground drill station, and that downhole geology data corresponds reasonably with adjacent holes. The authors recommend that the informal collar survey reports be retrieved and archived.
| 12.1.1. | Downhole Survey Checks |
The authors compared 81 downhole survey reports for underground holes with the depth, azimuth and dip values in the database. Some data mismatches exist between the raw azimuth data and the azimuth column of the database because the downhole survey apparatus used prior to 2014 did not automatically adjust for local declination. Geologists adjusted the declination before entering the data in the master spreadsheet. Declination was adjusted correctly for all reviewed holes, yielding a 100% correlation.
| Practical Mining LLC | February 5, 2018 |
| Klondex Mines Ltd. | Technical Report for the Fire Creek Project, | Page 129 |
| Lander County, Nevada |
The authors compared 46 downhole survey reports for surface core holes and one surface RC hole survey with the depth, azimuth and dip values in the database. Two holes had one survey interval omitted from the database due to an excessive deviation reading. The authors consider the data to be reliable.
| 12.1.2. | Geology Checks |
The authors compared geology logs for 88 underground holes and 212 surface holes to the database. A direct correlation between the original logs and the current Klondex database is complex because geology codes were updated in 2014 and codes for holes logged prior to 2014 were updated in multiple ways. Some codes were converted through data correlation, some were re-assigned new codes based on the geologists’ detailed descriptions in the comments field, and some holes were manually re-logged using the new codes. Each of these geological logging systems was reviewed by the authors, and the results validate the geology in the Klondex database. The vein flag, which is the component of the database which directly affects the resource model, was found to have 100% correlation for holes reviewed.
| 12.1.3. | Assay Checks |
The authors compared assay values in the ISIS database with values reported in assay certificates. The assay values show 100% correlation. The authors noted duplicate sample identification numbers where sample intervals exceed five feet. Klondex has a maximum sample length of five-feet, so intervals exceeding five feet in holes drilled early in the project were divided during import into acQuire. The original sample ID and assay results are duplicated in the resultant divided intervals, which maintains accurate assay representation of the sampled interval while allowing import into acQuire.
| 12.2. | Results of Channel Sample Data Review |
The authors reviewed 436 channels, representing about 6% of the 6,398 channels in the ISIS channel sample database. The channels were chosen at random while generally attempting to select a representative subset. The authors requested the raw data, which is in the form of the geologist’s daily face sheets, for the 436 selected channel samples. Mr. Christian Rathkopf, Klondex Geoscience Data Analyst, provided scans of the face sheets. The three categories of data reviewed for the channel sample dataset are location, assays, and geology (Table 12-2).
| 12.2.1. | Location Measurement Check |
The authors compared the location of the channel in Vulcan software with the distance measured by the geologist in the mine heading and recorded on the face sheet. No channels were found out of place. The authors also viewed all channels relative to the asbuilt in 3-D in Vulcan as described in Section 10.1.3 to check for consistency. The authors consider the channel locations to be acceptable for use in the mineral resource estimation.
| Practical Mining LLC | February 5, 2018 |
| Page 130 | Data Verification | Klondex Mines Ltd. |
| 12.2.2. | Geology Check |
The authors compared geology data recorded on the face sheets to geology data in the ISIS database and found the data to be congruent. No errors were found in the vein flag portion of the data. The authors consider the geology data in the channel database to be acceptable for use in the mineral resource estimation.
| 12.2.3. | Assay Check |
Sample intervals and sample identification numbers from the face sheets were compared with the ISIS database, and the authors observed good correlation. The sample identification numbers were correlated with assay certificates and results were compared to values contained in the ISIS database. Excellent correlation was observed.
Table 12-2 Data Review Summary Channel Sampled Material
| Location | Assay | |||
| Total | Measurements | Geology | Certificates | |
| Dataset | Channels | Reviewed | Reviewed | Reviewed |
| Channels | 6,398 | 436 | 436 | 436 |
| Percent of population | ||||
| reviewed: | 6% | 6% | 6% |
The authors consider the assay data in the channel database to be acceptable for use in the mineral resource estimation.
| 12.3. | Summary of Database Verification |
For each data set used in the mineral resource estimation, at least five percent of the data was verified against original source data. The data review verified that historic and current drill, channel and control samples are acceptable. In particular, the accuracy of the assay data has been quantified by independent review of 21% of drill holes and 6% of channels by direct correlation with assay certificates from accredited laboratories (drill samples) and accredited and local production laboratories (channel samples).
| Practical Mining LLC | February 5, 2018 |
| Klondex Mines Ltd. | Technical Report for the Fire Creek Project, | Page 131 |
| Lander County, Nevada |
The drilling (fc_resource_20171020.dhd.isis) and channel (fc_resource_20171023.chn.isis) ISIS databases, which contain data compiled by Klondex from March 2004 through October 2017, comply with standards prescribed by CIM protocol for use in mineral reserve estimates.
| Practical Mining LLC | February 5, 2018 |
| Page 132 | Mineral Processing and Metallurgical Testing | Klondex Mines Ltd. |
| 13. |
Mineral Processing and Metallurgical Testing |
| 13.1. | Early Test Work |
A summary of the cyanidation test work conducted on twelve samples discussed in the 2011 NI 43-101 Technical Report by W. Raven, E. Ullmer, and G. Hawthorn is shown below in Table 13-1.
Table 13-1 Summary of Cyanidation Test Results from 2011 Technical Report
| Sample | Drill | Head Grade | Test | Duration | Au | ||||
| ID | Zone | Hole | Interval | Au (g/t) | Au (opt) | Type | Grind Size | (hrs) | Recovery |
| 1 | North Main | FC0401 | 2.0 | 0.058 | CIL | 75.9% | |||
| 2 | North Main | FC0403 | 14.5 | 0.423 | CIL | 80.0% | |||
| 3 | North Main | FC0405 | 34.6 | 1.009 | CIL | 60.1% | |||
| 5 | North Main | FC0402 | 905-910 | 37.1 | 1.082 | STD | 25%-200M | 33.2% | |
| 5 | North Main | FC0402 | 905-910 | 37.1 | 1.082 | STD | 90%-200M | 81.6% | |
| C4 | North Main | FC0528 | 1450-1470 | 7.8 | 0.227 | STD | 80%-60M | 48 | 72.6% |
| 7 | Main | FC0413 | 850-855 | 109.0 | 3.178 | STD | 25%-200M | 74.4% | |
| 7 | Main | FC0413 | 850-855 | 109.0 | 3.178 | STD | 90%-200M | 98.7% | |
| C1 | Main | FC0419 | 777-780 | 37.4 | 1.091 | STD | 80%-70M | 48 | 88.2% |
| C3 | West Main | FC0515 | 925-935 | 116.4 | 3.394 | STD | 80%-65M | 48 | 86.8% |
| 4 | Far North-New North | FC0415 | 850-855 | 10.0 | 0.292 | STD | 25%-200M | 14.0% | |
| 4 | Far North-New North | FC0415 | 850-855 | 10.0 | 0.292 | STD | 90%-200M | 15.8% | |
| 6 | Far North-New North | FC0415 | 830-835 | 10.8 | 0.315 | STD | 25%-200M | 29.5% | |
| 6 | Far North-New North | FC0415 | 830-835 | 10.8 | 0.315 | STD | 90%-200M | 54.5% | |
| C5 | Far North-New North | FC0418 | 895-915 | 6.1 | 0.178 | STD | 80%-65M | 48 | 45.4% |
| C6 | Far North-New North | FC0522 | 1040-1050 | 20.1 | 0.586 | STD | 80%-80M | 48 | 77.2% |
| 13.2. | 2013 Test Work |
Metallurgical test work was conducted by McClelland Laboratories (MLI Job #3834) on two samples taken from the underground development to determine the amenability of the Project material to gravity and/or cyanidation treatment. Composite sample FCM1 was taken from material stockpiled during the development of the 5400 and 5370 crosscuts. Sample 3834-01 was generated by compositing coarse assay rejects from the face sampling on the Joyce 5400 N.
Each sample was milled to 80% minus 212 micrometers (µm) and processed through a laboratory Knelson concentrator to determine precious metal recovery via gravity concentration. The tailings from the Knelson concentrator were reground to 80% minus 75µm. Direct cyanidation tests (96-hour bottle roll tests) were then conducted on the gravity tailings to determine precious metal recovery and reagent consumption. Results of the test work are shown in the Table 13-2 below.
| Practical Mining LLC | February 5, 2018 |
| Klondex Mines Ltd. | Technical Report for the Fire Creek Project, | Page 133 |
| Lander County, Nevada |
Table 13-2 Combined Metallurgical Results, Gravity/Cyanidation Tests, 80% -212 um Feed (Grav.), Reground to 80% -75 um (CN)
| g/tonne | Reagent Consumption | ||||||||||
| Recovery % of Total | Extracted | Head Grade | kg / tonne | ||||||||
| Grav. | CN (Grav. | Grav. | CN | ||||||||
| Composite | Conc. | Tail) | Combined | Conc. | Leach | Tail | Calculated | Assayed | NaCN | Lime | |
| 3771 Composite FCM1 | Au | 19.6% | 75.3% | 94.8% | 2.24 | 8.61 | 0.59 | 11.44 | 15.00 | 0.16 | 5.0 |
| Sample 3834-91 | Au | 54.4% | 44.7% | 99.0% | 80.80 | 66.33 | 1.42 | 148.55 | 157.07 | 0.24 | 3.1 |
| 3771 Composite FCM1 | Ag | 14.4% | 67.8% | 82.2% | 1.30 | 6.10 | 1.60 | 9.00 | 6.00 | ||
| Sample 3834-91 | Ag | 44.6% | 44.8% | 89.4% | 44.40 | 44.60 | 10.5 | 99.50 | 115.00 | ||
Results indicate that both samples were readily amenable to gravity and/or cyanidation treatment. Gold and silver recoveries achieved from composite sample FCM1 were 94.8% and 82.2%, respectively. Gold and silver recoveries achieved from sample 3834-01 were 99.0% and 89.4%, respectively. Cyanide consumptions were low, averaging 0.20 kg/million tons (Mt) material.
| 13.3. | 2014 Test Work |
In early 2014, nine drill core composite samples from the West Zone were submitted to McClelland Laboratories (MLI Job #3870) for metallurgical testing to determine the amenability of the Fire Creek West Zone material to direct cyanidation and gravity/cyanidation treatment.
Each composite was milled to 80% minus 75µm, and direct cyanidation tests (bottle roll tests) were then conducted to determine precious metal recovery and reagent consumption. Results from the test work are shown in the Table 13-3 below.
| Practical Mining LLC | February 5, 2018 |
| Page 134 | Mineral Processing and Metallurgical Testing | Klondex Mines Ltd. |
Table 13-3 Summary Metallurgical Results, Bottle Roll Tests, Fire Creek West Zone Drill Core Composites
| Au | g Au/mt ore | Ag | g Ag/mt ore | Reagent Requirements | |||||||||
| Test | Recovery, | Calculated | Head | Recovery, | Calculated | Head | kg/mt mineralized material | ||||||
| Number | Composite | % | Extracted | Tail | Head | Assay | % | Extracted | Tail | Head | Assay . | NaCN Cons | Lime Added |
| CY-1 | 3870-1 | 96.0 | 34.88 | 1.46 | 36.34 | 46.10 | 94.1 | 17.4 | 1.1 | 18.5 | 30.3 | 0.17 | 0.8 |
| CY-2 | 3870-2 | 94.9 | 20.23 | 1.08 | 21.31 | 26.18 | 74.9 | 12.8 | 4.3 | 17.1 | 26.2 | 0.39 | 5.6 |
| CY-3 | 3870-3 | 89.8 | 6.66 | 0.76 | 7.42 | 10.28 | 67.4 | 6.4 | 3.1 | 9.5 | 15.3 | 0.33 | 6.9 |
| CY-4 | 3870-4 | 96.9 | 14.51 | 0.46 | 14.97 | 12.51 | 76.9 | 1.0 | 0.3 | 1.3 | 1.9 | 0.17 | 7.6 |
| CY-5 | 3870-5 | 93.2 | 38.28 | 2.80 | 41.08 | 30.30 | 56.3 | 57.4 | 44.6 | 102.0 | 92.5 | 0.28 | 3.7 |
| CY-6 | 3870-61) | 66.9 | 3.92 | 1.94 | 5.86 | 7.67 | 81.2 | 22.9 | 5.3 | 28.2 | 36.8 | 12.16 | 20.5 |
| CY-7 | 3870-7 | 84.0 | 22.32 | 4.24 | 26.56 | 30.33 | 57.8 | 17.0 | 12.4 | 29.4 | 35.7 | 0.38 | 3.6 |
| CY-8 | 3870-8 | 82.1 | 60.94 | 13.30 | 74.24 | 63.33 | 71.7 | 34.0 | 13.4 | 47.4 | 36.9 | 0.31 | 2.4 |
| CY-9 | 3870-9 | 98.7 | 48.41 | 0.62 | 49.03 | 73.87 | 83.5 | 27.8 | 5.5 | 33.3 | 50.3 | 0.34 | 4.2 |
| Notes: | |
| 1. | Problems encountered with high viscosity, low D.O. and low free cyanide levels. Switched to mechanically agitated leach @ 2.0 g NaCN/L, 25% Solids at 20 hours, initiated are sparge at 24 hours. |
Results indicate that all but one (Composite #3870-6) of the samples were readily amenable to direct cyanidation treatment. Gold recoveries achieved from the eight composite samples ranged from 82.1% to 98.7% . Silver recoveries achieved from the eight composite samples ranged from 56.3% to 94.1% . Cyanide consumptions were low, averaging 0.30 kg/Mt material.
Problems were encountered during direct cyanidation testing of composite #3870-6 due to high viscosity, low dissolved oxygen content and low free cyanide levels. This composite was transferred to a mechanically agitated leach apparatus to complete the test. Gold and silver recoveries achieved from composite #3870-6 were 66.9% and 81.2%, respectively. Cyanide and lime requirements for this sample were very high.
After direct cyanidation testing was complete, two master composites were prepared for gravity/cyanidation testing. A high-grade master composite (HG master comp) was prepared by combining the coarse rejects from Composites 3870-5 and 3879-6. A mid-grade master composite (MG master comp) was prepared by combining coarse rejects from Composites 3870-2, 3870-3 and 3870-4.
Each master composite was milled to 80% minus 300µm and processed through a laboratory Knelson concentrator to determine precious metal recovery via gravity concentration. The tailings from the Knelson concentrator were reground to 80% minus 75µm. Direct cyanidation tests (96-hour bottle roll tests), with and without lead nitrate addition, were then conducted on the gravity tailings to determine precious metal recovery and reagent consumption. Results of the test work are shown in Table 13-4 and Table 13-5 below.
| Practical Mining LLC | February 5, 2018 |
| Klondex Mines Ltd. | Technical Report for the Fire Creek Project, | Page 135 |
| Lander County, Nevada |
Table 13-4 Gold Metallurgical Results, Whole Mineralized Material Gravity Concentration with Cyanidation of the Gravity Cleaner and Rougher Tailings
| Weight , % of Total | g Au/mt mineralized material | |||||||||
| Lead | Combined | |||||||||
| Nitrate | Gravity | Cl. & Ro. | Ball Mill | Gravity | Extracted | Calc. | Predicted | |||
| Composite | Added | Cl. Conc | Tail | Total | Clean Out | Cl. Conc | (CN) | Tail | Head | Head |
| 3870-29 (HG Master Comp.) | No | 0.21 | 99.79 | 100.0 | 0.14 | 10.416 | 19.79 | 2.70 | 33.05 | 30.32. |
| Yes | 0.21 | 99.79 | 100.0 | 0.14 | 10.416 | 17.60 | 2.54 | 30.70 | ||
| 3879-30 (MG Master Comp.) | No | 0.26 | 99.74 | 100.0 | 0.02 | 4.68 | 10.45 | 0.69 | 15.84 | 12.54 |
| Yes | 0.26 | 99.74 | 100.0 | 0.02 | 4.68 | 8.50 | 0.73 | 13.93 | ||
| Au Distribution % of Total | kg/mt ore | |||||||||
| Ball Mill | Cl. | Extracted | NaCN | Lime | ||||||
| Composite | Clean Out | Conc | (CN) | Combined | Tail | Total | Cons. | Added | ||
| 3870-29 (HG Master Comp.) | 0.4 | 31.5 | 59.9 | 91.4 | 8.2 | 100.0 | 0.31 | 3.5 | ||
| 0.5 | 33.9 | 57.3 | 91.2 | 8.3 | 100.0 | 0.31 | 3.5 | |||
| 3879-30 (MG Master Comp.) | 0.1 | 29.5 | 66.0 | 95.5 | 4.4 | 100.0 | 0.09 | 6.5 | ||
| 0.1 | 33.6 | 61.0 | 94.6 | 5.3 | 100.0 | 0.15 | 6.7 | |||
Table 13-5 Silver Metallurgical Results, Whole Mineralized Material Gravity Concentration with Cyanidation of the Gravity Cleaner and Rougher Tailings
| Weight , % of Total | g Ag/mt mineralized material | |||||||||
| Lead | Combined | |||||||||
| Nitrate . | Gravity | Cl. & Ro | Ball Mill | Gravity Cl. | Extracted | Calc. | Predicted | |||
| Composite | Added | Cl. Conc | Tail | Total | Clean Out | Conc | (CN) | Tail | Head | Head |
| 3870-29 (HG Master Comp.) | No | 0.21 | 99.79 | 100.0 | 0.12 | 7.056 | 31.43 | 25.45 | 64.06 | |
| Yes | 0.21 | 99.79 | 100.0 | 0.12 | 7.056 | 48.00 | 11.28 | 66.45 | ||
| 3879-30 (MG Master Comp.) | No | 0.26 | 99.74 | 100.0 | 0.06 | 2.184 | 7.48 | 3.29 | 13.02 | |
| Yes | 0.26 | 99.74 | 100.0 | 0.06 | 2.184 | 6.48 | 3.39 | 12.12 | ||
| Au Distribution % of Total | ||||||||||
| Ball Mill | Cl. | Extracted | ||||||||
| Composite | Clean Out | Conc | (CN) | Combined | Tail | Total | ||||
| 3870-29 (HG Master Comp.) | 0.2 | 11.0 | 49.1 | 60.1 | 39.7 | 100.0 | ||||
| 0.2 | 10.6 | 72.2 | 82.8 | 17.0 | 100.0 | |||||
| 3879-30 (MG Master Comp.) | 0.5 | 16.8 | 57.5 | 74.3 | 25.3 | 100.0 | ||||
| 0.5 | 18.0 | 53.5 | 71.5 | 28.0 | 100.0 | |||||
Results indicate that both master composites were readily amenable to gravity/cyanidation treatment. Gold and silver recoveries achieved from the HG master composite were 91.4% and 60.0%, respectively, without lead nitrate, and 91.2% and 82.8% with lead nitrate addition. Gold and silver recoveries achieved from the MG master composite were 95.5% and 74.3%, respectively, without lead nitrate, and 94.6% and 71.3% with lead nitrate addition.
| Practical Mining LLC | February 5, 2018 |
| Page 136 | Mineral Processing and Metallurgical Testing | Klondex Mines Ltd. |
| 13.4. | 2017 Test Work |
In 2017 drill core composite samples from the Mars pit drilling program were submitted to McClelland Laboratories for metallurgical testing to determine the amenability of the Fire Creek Mars pit material to cyanidation. Samples classified as oxide, mixed oxide/sulfide and sulfide were all tested. Ninety-six-hour coarse bottle rolls, at 100% passing ½ inch crush, were completed on all composite samples to understand the potential amenability to heap leaching. In addition, 72-hour grind/leach tests, ground to 75% passing 200 mesh, to understand the sensitivity to crush size. (Table 13-6 through Table 13-8)
Table 13-6 Summary Metallurgical Results, Bottle Roll Tests, Fire Creek Mars Pit Drill Oxide Core Composites
| Au g/mt | Ag g/mt | Reagent Addition | |||||||||||
| Au | Ag | Grind | |||||||||||
| Compo | Rec | Extra | Calc. | Head | Rec | Extra | size | ||||||
| site ID | % | cted | Tail | Head | Assay | % | cted | Tail | Head | Assay | NaCN | Lime | mm |
| 4252-1 | 76.6 | 1.44 | 0.44 | 1.88 | 1.63 | 66.7 | 0.4 | 0.2 | 0.6 | 1.0 | 0.67 | 4.5 | 12.5 |
| 4252-1 | 84.4 | 1.41 | 0.26 | 1.67 | 1.63 | 71.4 | 0.5 | 0.2 | 0.7 | 1.0 | 0.65 | 9.0 | 0.075 |
| 4252-4 | 24.6 | 0.16 | 0.49 | 0.65 | 0.67 | 20.0 | 0.3 | 1.2 | 1.5 | 1.0 | 0.15 | 2.5 | 12.5 |
| 4252-4 | 69.2 | 0.45 | 0.20 | 0.65 | 0.67 | 25.0 | 0.3 | 0.9 | 1.2 | 1.0 | 0.41 | 4.4 | 0.075 |
| FCC- 0075 |
78.9 | 0.60 | 0.16 | 0.76 | 0.74 | 50.0 | 0.1 | 0.1 | 0.2 | 0.2 | 0.08 | 8.2 | 12.5 |
| FCC- 0082 |
86.4 | 0.19 | 0.03 | 0.22 | 0.20 | 66.7 | 0.2 | 0.1 | 0.3 | 0.3 | 0.46 | 19.7 | 12.5 |
| FCC- 0083 |
85.0 | 0.34 | 0.06 | 0.40 | 0.41 | 75.0 | 0.3 | 0.1 | 0.4 | 0.3 | 0.45 | 4.7 | 12.5 |
| FCC- 0085 |
82.2 | 0.37 | 0.08 | 0.45 | 0.35 | 92.9 | 1.3 | 0.1 | 1.4 | 1.1 | 1.28 | 12.0 | 12.5 |
Table 13-7 Summary Metallurgical Results, Bottle Roll Tests, Fire Creek Mars Pit Drill Mixed Oxide/Sulfide Core Composites
| Au g/mt | Ag g/mt | Reagent Addition | |||||||||||
| Au | Ag | Grind | |||||||||||
| Compo | Rec | Extra | Calc. | Head | Rec | Extra | size | ||||||
| site ID | % | cted | Tail | Head | Assay | % | cted | Tail | Head | Assay | NaCN | Lime | mm |
| FCC- 0075 |
72.8 | 1.26 | 0.47 | 1.73 | 1.80 | N/A | 0.1 | 0.1 | 0.2 | 0.1 | 1.80 | 10.7 | 12.5 |
| FCC- 0085 |
61.3 | 0.57 | 0.36 | 0.93 | 0.70 | 66.7 | 0.2 | 0.1 | 0.3 | 0.2 | 3.00 | 18.4 | 12.5 |
| FCC- 0086 |
21.6 | 6.60 | 23.90 | 30.50 | 28.60 | 24.2 | 1.5 | 4.7 | 6.2 | 6.3 | 1.05 | 5.7 | 12.5 |
| FCC- 0086 |
80.1 | 22.60 | 5.60 | 28.20 | 28.60 | 79.2 | 5.7 | 1.5 | 7.2 | 6.3 | 1.41 | 3.4 | 0.075 |
| FCC- 0087 |
77.3 | 0.51 | 0.15 | 0.66 | 0.59 | 66.7 | 0.2 | 0.1 | 0.3 | 0.2 | 1.35 | 12.0 | 12.5 |
| FCC- 0075 |
72.8 | 1.26 | 0.47 | 1.73 | 1.80 | N/A | 0.1 | 0.1 | 0.2 | 0.1 | 1.80 | 10.7 | 12.5 |
| Practical Mining LLC | February 5, 2018 |
| Klondex Mines Ltd. | Technical Report for the Fire Creek Project, | Page 137 |
| Lander County, Nevada |
Table 13-8 Summary Metallurgical Results, Bottle Roll Tests, Fire Creek Mars Pit Drill Sulfide Core Composites
| Au g/mt | Ag g/mt | Reagent Addition | |||||||||||
| Au | Ag | Grind | |||||||||||
Compo |
Rec | Extra | Calc. | Head | Rec | Extra | size | ||||||
site ID |
% | cted | Tail | Head | Assay | % | cted | Tail | Head | Assay | NaCN | Lime | mm |
4252-2 |
39.8 | 0.33 | 0.50 | 0.83 | 0.88 | 33.3 | 0.1 | 0.2 | 0.3 | 1.0 | 2.25 | 15.5 | 12.5 |
4252-2 |
41.4 | 0.36 | 0.51 | 0.87 | 0.88 | 50.0 | 0.2 | 0.2 | 0.4 | 1.0 | 2.96 | 6.8 | 0.075 |
4252-3 |
52.4 | 0.55 | 0.50 | 1.05 | 1.27 | 56.4 | 2.2 | 1.7 | 3.9 | 3.0 | 2.85 | 15.7 | 12.5 |
4252-3 |
64.0 | 0.73 | 0.41 | 1.14 | 1.27 | 68.3 | 2.8 | 1.3 | 4.1 | 3.0 | 2.80 | 11.8 | 0.075 |
FCC- |
30.2 | 0.26 | 0.60 | 0.86 | 0.83 | 75.0 | 0.3 | 0.1 | 0.4 | 0.3 | 0.82 | 11.0 | 12.5 |
FCC- |
24.5 | 0.26 | 0.80 | 1.06 | 0.98 | 33.3 | 0.1 | 0.2 | 0.3 | 0.3 | 4.28 | 35.0 | 12.5 |
FCC- |
13.3 | 0.11 | 0.72 | 0.83 | 1.07 | 20.0 | 0.1 | 0.4 | 0.5 | 0.9 | 1.57 | 9.9 | 12.5 |
FCC- |
4.4 | 0.03 | 0.65 | 0.68 | 0.62 | 66.7 | 0.2 | 0.1 | 0.3 | 0.3 | 0.53 | 3.4 | 12.5 |
Results indicate that all three ore types tested were amenable to cyanidation at a coarse crush size. The recoveries ranged from 20% to 92.9% for oxide, 21.6% to 80.1% on mixed and from 4.4% to 52.4% for sulfide. Further test work is required to understand the variable recoveries, especially for the mixed and sulfide ores. In addition, optimization work is required to optimize the reagent consumptions for each of the ore types tested.
| Practical Mining LLC | February 5, 2018 |
| Page 138 | Mineral Resource Estimates | Klondex Mines Ltd. |
| 14. |
Mineral Resource Estimates |
| 14.1. | Introduction |
The Fire Creek mineral resource was estimated in accordance with The Canadian Institute of Mining, Metallurgy and Petroleum’s CIM Definitions Standards for Mineral Resources and Mineral Reserves, adopted by CIM Council on May 10, 2014 (CIM 2014). This estimate updates the previous Mineral Resource Estimate effective June 30, 2016 and includes all of new drilling, channel sampling, and underground geological mapping completed since that date. This estimate and depletion is effective November 30, 2017.
All data coordinates are measured in the Nevada State Plane Central Zone, NAD83 feet truncated to the last six whole digits. All quantities are given in imperial units unless indicated otherwise.
The gold and silver mineralization at the Project was estimated using the Vulcan modeling software. The vein estimates were performed by Anthony Bottrill, Corporate Resource Manager for Klondex, and reviewed by the authors of this TR. The low-grade dissemination estimates, which combined with vein estimates outside of the underground resource formed the basis of the open pit resource, were performed by Agapito Orozco, Senior Resource Geologist for Klondex and reviewed by the authors of this TR.
The vein solid models were interpreted from core photo review, assay data, underground mapping, and lithology logging from drilling and channel samples. No strict grade cutoff was honored, but care was taken to ensure that only vein material was modeled regardless of the grade. The low-grade disseminated mineralization was modelled using a 0.003 opt grade indicator to discern potentially mineralized host rocks adjacent to the vein system from unmineralized host rocks.
Vulcan Version 10.1.2 software was used in all aspects of the modeling process. The Inverse Distance Cubed (ID3) estimation method was used for the vein estimates while Ordinary Kriging was used for the low-grade disseminated estimates. Validations made use of the Nearest Neighbor (polygonal) method and Discrete Gaussian change of support method for comparison purposes.
| 14.2. | Database and Compositing |
The Fire Creek drill hole and channel databases are managed in AcQuire software. CSV format files were exported from the AcQuire database for collar, survey, lithology, and assay tables. These were imported into a Vulcan ISIS database using a LAVA script. The Lava script ensured the database was loaded consistently each time. The gold and silver assays are converted from g/t to opt in the AcQuire database by multiplying by 34.2857.
| Practical Mining LLC | February 5, 2018 |
| Klondex Mines Ltd. | Technical Report for the Fire Creek Project, | Page 139 |
| Lander County, Nevada |
Assay intervals were “flagged” to their interpreted vein using a coding system in the assay table. These vein codes were used in both building the initial vein solids, and in subsequent grade estimation. Samples were composited into a single weighted average value spanning the width of the vein or ten feet, whichever was less. Ten-foot composites were generally only created when a drill hole was drilled sub-parallel to the vein orientation. Where possible, holes are drilled perpendicular to the vein orientation.
| 14.2.1. | Assays |
This analysis used 1,474 surface and underground drill holes and 6,398 channel sample sets. The composites of all flagged assays were used for statistical analysis and estimation. No channels were eliminated for any reason. Drill hole intercepts were only ignored in the case where a drill hole intersecting a vein proximal to subsequent silled channel samples was shown to be inaccurate. In this case, the vein coding of the drill hole sample was prefixed by “IG_” so that the vein intercept was acknowledged as existing for that vein, but designated to be ignored due to its replacement by underground channel data (for example VK1 would become IG_VK1). Table 14-1 summarizes the overall quantity of data available by type and the quantity flagged that could be used in the estimation. No vein intercepts or channels were used to estimate the low-grade disseminated mineralization.
Table 14-1 Summary of Drill Hole and Channel Samples
| Total | |||
| No. | Length | Length | |
Type |
Holes | Drilled | Sampled |
Drill |
1,474 | 1,022,230 | 1,003,298 |
Channel |
6,398 | 49,963.4 | 49,945.5 |
Drill hole and channel sample locations relative to the vein models are shown in Figure 14-1 and Figure 14-2.
| Practical Mining LLC | February 5, 2018 |
| Page 140 | Mineral Resource Estimates | Klondex Mines Ltd. |
![]()
| Practical Mining LLC | February 5, 2018 |
| Klondex Mines Ltd. | Technical Report for the Fire Creek Project, | Page 141 |
| Lander County, Nevada |
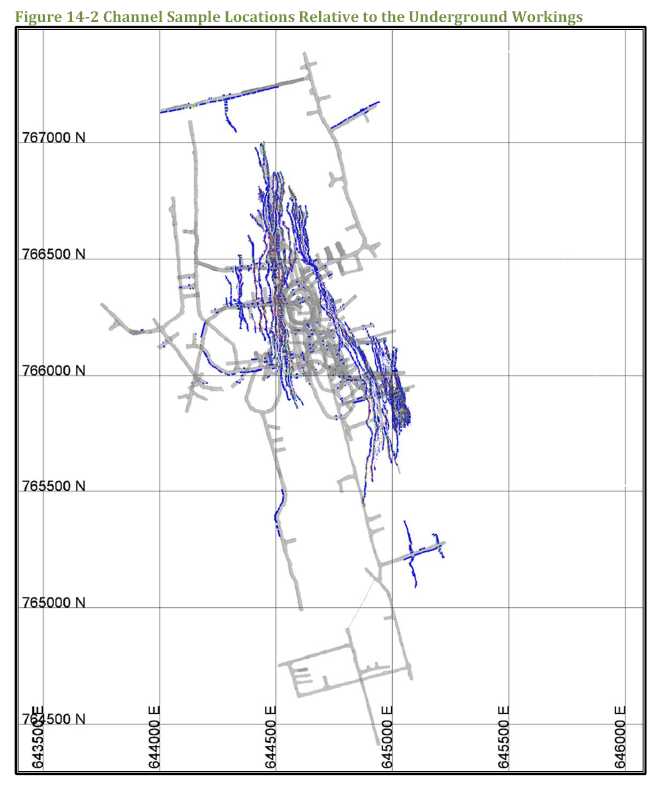
| Practical Mining LLC | February 5, 2018 |
| Page 142 | Mineral Resource Estimates | Klondex Mines Ltd. |
| 14.2.2. | Lithology |
The rock types identified in the lithology logging are shown in Table 14-2. In addition to core photos, intervals logged as vein or structure along with assay values were used to identify veins.
Table 14-2 Lithology Codes
| Lithology Code | Description |
| OVB | overburden |
| SEDS | sedimentary |
| OPAL | opalized sinter |
| INT | intrusive |
| STR | structure |
| FLT | fault |
| VN | vein |
| BAS | basalt |
| BX | breccia |
| TUFF | tuff |
| ND | no data |
In the Fire Creek stratigraphy, basalt provides the best host unit to vein development and mineralization. It is encompassed by upper and lower tuff units. Overlying the upper tuff unit is a cover sequence of andesite. Figure 14-3 is a long section through the deposit showing the stratigraphy of the main lithological units within the mine section. Within the epithermal system, there is generally an increasing grade with depth with the basalt and lower tuff showing higher gold grades than the andesite and upper tuff. Crosscutting the stratigraphy, and occupying the same structures as the epithermal veins are sub-vertical mafic Dikes.
| Practical Mining LLC | February 5, 2018 |
| Klondex Mines Ltd. | Technical Report for the Fire Creek Project, | Page 143 |
| Lander County, Nevada |

| 14.2.3. | Compositing |
For the vein estimates, assays were composited on ten-foot downhole interval lengths honoring the vein intersections. Therefore, assays within the veins were separated from the lower grade values outside of the veins. This compositing method usually calculated a single composite across the vein interval as most vein intercepts are less than ten feet in length. Where the interval within the vein was longer than ten feet, more than one composite was created.
For the disseminated mineralization, located outside of the veins, assays were composited on ten-foot downhole interval lengths. These honored the vein intersections so vein material was not available to the estimation of the low-grade disseminated mineralization.
| 14.3. | Geology and Modelling |
Fifty-six vein sets were modeled on three main northwest linear trends. Figure 14-4 shows the simplified structural framework relating to the major orientations seen in the mine. These orientations and the overall structural setting guide the vein interpretations and understanding of the controls on ore shoot formation. A number of the vein sets are defined by numerous (two or three) splay veins that split and merge along strike. They were modelled to reflect this resulting in cymoid looping of the veins. The main vein orientations recognized represent extension and shear orientations of the overall structural framework for the area. These include:
| Practical Mining LLC | February 5, 2018 |
| Page 144 | Mineral Resource Estimates | Klondex Mines Ltd. |
| • | 330° type structures, which include the Joyce Vein and have dominant extension components, and; | |
| • | 010° type structures, which include the Karen Vein and Vonnie Vein and have dominant shear orientations. |
This structural fabric represents fractals that are seen on all scales from the mining face to regional structures. Mining and channel sampling has occurred on the Joyce Vein, Vonnie Vein, Karen Vein, Honeyrunner Vein, and Hui Wu Vein at the center of the east trend.
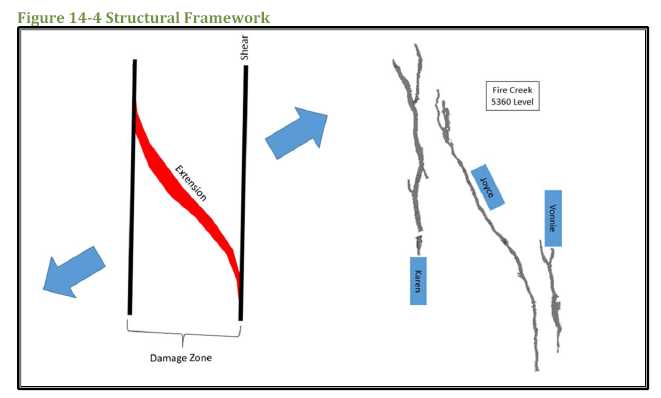
A LAVA scripted grid modelling workflow was used to model the Fire Creek vein sets. Grid modelling is applicable to modelling narrow, continuous geological features such as precious metal veins and coal seams. Grid modelling creates a surface by interpolating a regular grid of points over a modelling area. These grid points are combined with the input intercepts to create output triangulation models that represent the vein hanging wall and footwall contacts. The contacts are combined to create a valid solid triangulation. Vein solids are then clipped to the topography and other terminating structures prior to building the resource block model. Figure 14-5 outlines the vein modelling process.
| Practical Mining LLC | February 5, 2018 |
| Klondex Mines Ltd. | Technical Report for the Fire Creek Project, | Page 145 |
| Lander County, Nevada |

The data processing steps automated by the scripted process can be summarized as follows:
| 1. | Set the vein to be modelled, its overall dip and dip direction, and the drill hole and channel databases to be used; |
|
| 2. | Extract the hanging wall (HW) and footwall (FW) vein intercepts from the drill hole and channel databases; |
|
| 3. | Combine interpreted or surveyed HW and FW points to control the vein model interpretation where required. Figure 14-6 shows HW points in red and FW points in yellow; |
| Practical Mining LLC | February 5, 2018 |
| Page 146 | Mineral Resource Estimates | Klondex Mines Ltd. |

| 4. | Use the dip and dip direction settings to rotate the intercepts to a semi-flat plane (grid modelling works in plan view); |
|
| 5. | Use inverse distance to model HW and FW grid surfaces from the input data and perform grid mathematics to ensure HW grid points are always above FW grid points (i.e. there are no overlaps); |
|
| 6. | Create a triangulation of the HW contact that combines the grid model points with the input intercepts to ensure the final surface is snapped to the input data. Repeat this process for the FW contact. Modelling specific settings are attached as attributes to the triangulations and also written to a text file for future auditing. Figure 14-7 shows the triangulated HW and FW surfaces; |
| Practical Mining LLC | February 5, 2018 |
| Klondex Mines Ltd. | Technical Report for the Fire Creek Project, | Page 147 |
| Lander County, Nevada |

| 7. | Produce boundary polygons of the vein contact surfaces to create a boundary triangulation that can then be appended to the vein contacts to create a valid solid triangulation. In Figure 14-8, the surfaces have been combined to form a solid; |
| Practical Mining LLC | February 5, 2018 |
| Page 148 | Mineral Resource Estimates | Klondex Mines Ltd. |

| 8. | Un-rotate the triangulations and intercepts back to their true spatial location; and |
|
| 9. | Clip the solid vein triangulation to the topography and other terminating surfaces as required. |
Clipping priorities and overall orientations for all veins are listed in Table 14-3.
Table 14-3 Vein Orientation and Clipping Priorities
| Vein Nomenclature | Orientation | Clipping Surfaces |
||
| Dip | ||||
Vein Name |
Vein Code | Direction | Dip | |
| Vonnie | VV1,VV2,VV3 | 263 | 80 | topo+v15a.fw |
| Joyce | VJ1,VJ2,VJ3 | 65 | 86 | topo |
| Karen | VK1,VK2,VK3 | 85 | 80 | topo+Vj1.fw+vv1.hw |
| Hui Wu | V36A,V36B | 79 | 73 | topo+vk3.hw+vj1.fw+vv1.hw |
| Honeyrunner | V20A,V20B,V20C | 85 | 85 | topo+vk1.fw+v21b.hw |
| Vein05 | V05A,V05B | 85 | 80 | topo+v18a.fw+v20c.hw |
| Vein06 | V06A,V06B | 247 | 80 | topo+vj1.fw+vv3.fw |
| Vein07 | V07 | 256 | 80 | topo+vj3.hw+v56.fw |
| Practical Mining LLC | February 5, 2018 |
| Klondex Mines Ltd. | Technical Report for the Fire Creek Project, | Page 149 |
| Lander County, Nevada |
| Vein Nomenclature | Orientation | Clipping Surfaces |
||
| Dip | ||||
| Vein Name | Vein Code | Direction | Dip | |
| Vein08 | V08A,V08B | 253 | 80 | topo+vv3.fw+vj3.hw |
| Vein09 | V09A,V09B | 60 | 84 | topo |
| Vein12 | V12 | 255 | 85 | topo+vj1.fw+v36b.hw+v39a.hw |
| Vein13 | V13A/V13B | 70 | 90 | topo+vj1.fw+v40b.hw |
| Vein14 | V14A,V14B | 61 | 90 | topo+vj1.fw+vk3.hw |
| Vein15 | V15A,V15B | 60 | 84 | topo |
| Vein16 | V16A,V16B | 72 | 78 | topo+v09.hw |
| Vein18 | V18A,V18B | 75 | 75 | topo+vk1.fw+v20c.hw |
| Vein19 | V19 | 70 | 90 | topo+vk3.hw |
| Vein21 | V21A,V21B | 75 | 85 | topo |
| Vein22 | V22A,V22B | 65 | 86 | v61a.hw+v60b.hw |
| Vein23 | V23 | 260 | 80 | topo |
| Vein24 | V24 | 258 | 80 | topo |
| Vein25 | V25 | 248 | 77 | topo |
| Vein26 | V26 | 253 | 75 | topo+v27.hw |
| Vein27 | V27 | 253 | 81 | topo+v26.fw |
| Vein28 | V28 | 65 | 74 | topo+v30.fw |
| Vein29 | V29 | 75 | 70 | topo+v30.hw+v32.hw |
| Vein30 | V30 | 70 | 72 | topo |
| Vein32 | V32 | 96 | 90 | topo+v30.hw |
| Vein31 | V31A,V31B | 75 | 80 | topo+v21b.hw |
| Vein37 | V37A,V37B | 85 | 80 | topo+vk1.fw+v18b.hw+vj1.fw |
| Vein38 | V38A,V38B | 264 | 85 | topo+vk3.hw+v36a.fw |
| Vein39 | V39A,V39B | 257 | 87 | topo+vj1.fw+v14a.fw+v36b.hw+vk3.hw |
| Vein40 | V40A,V40B | 79 | 77 | topo+vj1.fw+v39B.fw+vv1.hw |
| Vein41 | V41A,V41B | 75 | 85 | topo |
| Vein42 | V42 | 89 | 84 | topo+v18a.fw+v05a.hw+vk1.fw |
| Vein44 | V44A,V44B | 271 | 80 | topo+vv1.hw+vj3.hw |
| Vein45 | V45A,V45B | 73 | 75 | topo+v58b.hw+v61 |
| Vein46 | V46 | 270 | 85 | topo+v18a.fw+v05a.hw+vk1.fw+v42 |
| Vein51 | V51A,V51B | 267 | 80 | topo+v22b.hw+v60+v41 |
| Vein55 | V55 | 78 | 81 | topo+vk1.hw+vk2.fw |
| Vein56 | V56 | 257 | 89 | topo+vj3.hw+vv1.hw |
| Vein58 | V58A, V58B | 83 | 87 | topo+v41a.fw |
| Vein59 | V59A, V59B | 85 | 80 | topo+v31b.hw+v20a.fw |
| Vein60 | V60A, V60B | 83 | 79 | topo |
| Vein61 | V61A,V61B | 264 | 79 | topo+v41a.fw+v60b.hw |
| Vein63 | V63A,V63B | 80 | 88 | topo+vv3.fw+v08a.hw |
| Practical Mining LLC | February 5, 2018 |
| Page 150 | Mineral Resource Estimates | Klondex Mines Ltd. |
| Vein Nomenclature | Orientation | Clipping Surfaces | ||
| Dip | ||||
Vein Name |
Vein Code | Directio | Dip | |
| n | ||||
| Vein64 | V64A,V64B | 80 | 88 | topo+vj3.fw+v08a.hw+v63B.hw+vv3.fw |
| Vein65 | V65 | 63 | 80 | topo+v16a.fw+v09b.hw |
| Vein66 | V66A,V66B | 65 | 84 | topo+v16b.hw |
| Vein67 | V67A,V67B | 255 | 77 | |
| Vein68 | V68A,V68B | 85 | 77 | topo+v41a.fw +v45b.hw+v61b.fw |
| Vein69 | V69A,V69B | 65 | 82 | topo+v45a.fw+v61b.fw+v58.hw |
| Vein70 | V70A,V70B | 65 | 82 | topo+v45a.fw+v58b.hw+v61b.fw |
| Vein72 | V72A,V72B | 260 | 85 | |
| Vein73 | V73A,V73B,V73 C |
255 | 77 | v67b.fw |
| Vein74 | V74A,V74B | 89 | 87 | v67a.hw |
Where channel samples are present, channel samples may replace drill hole samples in generating the vein models as drill hole intercepts may be found to be locally inaccurate. In this way, for the vein estimates, channel samples generally take precedence over drilling samples in the estimation of the measured areas. There are two methods that drill hole vein intercepts may be handled in this case;
| • | Drill holes to be ignored entirely for the estimation of a vein have a vein code assigned with an “IG_” prefix (ie IG_VK1). The drill hole in this case will not be used in the building of the vein model or the estimation of the vein blocks, and; |
|
| • | Drill holes to be ignored partially for the estimation of a vein have a vein code assigned with an “EST_” prefix (ie EST_VK1). The drill hole in this case will not be used in the building of the vein model but will be used in the estimation of the vein blocks. This sample will typically then continue to have influence in the estimation of adjacent Indicated or Inferred areas. |
In this way, for the vein estimates, channel samples generally take precedence over drilling samples in the estimation of the measured areas.
The five main lithological units were modeled and used in the definition of the estimation domains for the low-grade disseminated mineralization. Mineralization within the four volcanic stratigraphic units represents a dissemination of the mineralizing epithermal fluids into the host rocks adjacent to the veins. This material is usually represented as a stock work of quartz veining, breccia, or silicification of porous host rock.
| Practical Mining LLC | February 5, 2018 |
| Klondex Mines Ltd. | Technical Report for the Fire Creek Project, | Page 151 |
| Lander County, Nevada |
The dikes are planar intrusive units that intruded the same structural pathways as the veins. Due to this, they may encapsulate the veins and contain higher grade disseminated mineralization than the volcanic stratigraphic units. This is supported by Q-Q plots and contact analysis plots. Separate domains were established according to the four lithologies and the dike zones within them.
To discriminate potentially mineralized disseminated material emplaced by the epithermal system from unmineralized host rock, a low-grade indicator was used. A threshold of 0.003 opt Au was applied and blocks with a probability greater than 30% were defined as being potentially mineralized. Estimation domains for the low-grade dissemination were created as a combination of the lithological units and the low-grade indicator. No vein composites or channel samples were included in the disseminated domains and therefore these intercepts were not used in the estimation of the disseminated material (Figure 14-9 through Figure 14-11 and Table 14-4).

| Notes: | ||
| 1. | Blocks within the low-grade indicator shell are red, blocks outside of the defined mineralized system are blue. | |
| Practical Mining LLC | February 5, 2018 |
| Page 152 | Mineral Resource Estimates | Klondex Mines Ltd. |
A triangulation was constructed to define the boundary between oxide and transitional ore types. This was used in the classification of mineralization types at the reporting stage.
Table 14-4 Low-grade Open Pit Domains
| Low-grade Domain | Orientation | ||||
| Oreshoot Extent | |||||
| Lithology | Code | Bearing | Plunge | Dip | |
| Andesite | AND | 0 | 60 | 90 | Au 0.003 indicator |
| Upper Tuff | TFUP | 150 | 0 | -27 | Au 0.003 indicator |
| Basalt | BST | 0 | -75 | -75 | Au 0.003 indicator |
| Lower Tuff | TFLO | 0 | 0 | 45 | Au 0.003 indicator |
| Dike Andesite | DKAND | 0 | -75 | -46 | Au 0.003 indicator |
| Dike Upper Tuff | DKTFUP | 0 | -75 | -46 | Au 0.003 indicator |
| Dike Basalt | DKBST | 0 | -75 | -46 | Au 0.003 indicator |
| Dike Lower Tuff | DKTFLO | 0 | -75 | -46 | Au 0.003 indicator |

| Practical Mining LLC | February 5, 2018 |
| Klondex Mines Ltd. | Technical Report for the Fire Creek Project, | Page 153 |
| Lander County, Nevada |

| 14.4. | Density |
A density value of 0.0774 tons per cubic foot was assigned to all vein mineralization. This value is supported by 15 samples collected on the Joyce Vein and Vonnie Vein and analyzed by SGS Laboratories in Elko, Nevada. Density sampling continues to be routinely undertaken as part and supports these densities.
For the estimation of the disseminated mineralization, densities were defined based on average densities for each lithological unit as per the table below, using 10,569 density core samples. (Table 14-5).
Table 14-5 Lithologic Unit Densities
| Low-grade Domain | Density | Core Samples | |
| Lithology | Code | Ton/CuFt | (total 10,569 samples) |
| Andesite | AND | 0.0715 | Fresh rock, non argillic |
| Upper Tuff | TFUP | 0.0571 | Fresh rock, non argillic |
| Basalt | BST | 0.0716 | Fresh rock, non argillic |
| Lower Tuff | TFLO | 0.0618 | Fresh rock, non argillic |
| Dike Andesite | DKAND | 0.0663 | Dike samples |
| Dike Upper Tuff | DKTFUP | 0.0616 | Dike samples |
| Dike Basalt | DKBST | 0.0706 | Dike samples |
| Practical Mining LLC | February 5, 2018 |
| Page 154 | Mineral Resource Estimates | Klondex Mines Ltd. |
| Low-grade Domain | Density | Core Samples | |
| Lithology | Code | Ton/CuFt | (total 10,569 samples) |
| Dike Lower Tuff | DKTFLO | 0.0639 | Dike samples |
| 14.5. | Statistics |
For the vein estimation domains, drill hole and channel composite samples were grouped according to vein and univariate statistics calculated for each sample type and group. The summary statistics are shown in Table 14-6 through Table 14-9.
Table 14-6 Vein Gold Drill Hole Composite Statistics
| Min | Q1 | Q3 | Mean | |||||
| (Au | (Au | Median | (Au | Max | (Au | St | No. | |
| Vein | opt) | opt) | (Au opt) | opt) | (Au opt) | opt) | Dev. | Samples |
| VJ1 | 0.000 | 0.002 | 0.014 | 0.113 | 93.919 | 0.475 | 3.972 | 755 |
| VJ2 | 0.000 | 0.002 | 0.018 | 0.103 | 38.560 | 0.205 | 1.342 | 345 |
| VJ3 | 0.000 | 0.001 | 0.011 | 0.102 | 70.008 | 0.130 | 1.532 | 194 |
| VK1 | 0.000 | 0.004 | 0.020 | 0.179 | 15.524 | 0.264 | 0.754 | 502 |
| VK2 | 0.000 | 0.002 | 0.019 | 0.129 | 63.984 | 0.170 | 1.276 | 350 |
| VK3 | 0.000 | 0.001 | 0.015 | 0.171 | 197.481 | 0.466 | 4.855 | 183 |
| VV1 | 0.000 | 0.002 | 0.009 | 0.072 | 41.117 | 0.164 | 0.917 | 521 |
| VV2 | 0.000 | 0.001 | 0.006 | 0.056 | 8.401 | 0.078 | 0.363 | 204 |
| VV3 | 0.000 | 0.001 | 0.010 | 0.057 | 5.309 | 0.106 | 0.408 | 79 |
| V05A | 0.000 | 0.002 | 0.005 | 0.013 | 16.099 | 0.043 | 0.470 | 420 |
| V05B | 0.000 | 0.001 | 0.002 | 0.006 | 0.026 | 0.004 | 0.006 | 61 |
| V06A | 0.000 | 0.002 | 0.023 | 0.102 | 1.598 | 0.159 | 0.343 | 76 |
| V06B | 0.000 | 0.000 | 0.003 | 0.017 | 1.507 | 0.105 | 0.363 | 19 |
| V07 | 0.000 | 0.002 | 0.002 | 0.009 | 2.633 | 0.034 | 0.199 | 119 |
| V08A | 0.000 | 0.001 | 0.003 | 0.024 | 2.668 | 0.048 | 0.218 | 378 |
| V08B | 0.000 | 0.001 | 0.002 | 0.007 | 1.082 | 0.025 | 0.104 | 132 |
| V09A | 0.000 | 0.000 | 0.001 | 0.041 | 6.184 | 0.138 | 0.720 | 121 |
| V09B | 0.000 | 0.000 | 0.000 | 0.003 | 0.846 | 0.068 | 0.178 | 41 |
| V12 | 0.000 | 0.002 | 0.006 | 0.033 | 2.885 | 0.079 | 0.360 | 197 |
| V13A | 0.000 | 0.004 | 0.010 | 0.096 | 25.349 | 0.329 | 1.591 | 94 |
| V13B | 0.001 | 0.003 | 0.034 | 0.126 | 1.680 | 0.128 | 0.301 | 44 |
| V14A | 0.001 | 0.007 | 0.013 | 0.062 | 27.433 | 0.265 | 1.222 | 127 |
| V14B | 0.000 | 0.006 | 0.011 | 0.024 | 2.275 | 0.102 | 0.268 | 68 |
| V15A | 0.000 | 0.001 | 0.001 | 0.045 | 1.056 | 0.059 | 0.168 | 66 |
| V15B | 0.000 | 0.000 | 0.001 | 0.025 | 0.242 | 0.037 | 0.070 | 22 |
| V16A | 0.000 | 0.005 | 0.067 | 0.162 | 0.408 | 0.097 | 0.102 | 39 |
| V16B | 0.000 | 0.002 | 0.108 | 0.376 | 2.112 | 0.320 | 0.540 | 15 |
| V18A | 0.000 | 0.002 | 0.006 | 0.018 | 4.506 | 0.074 | 0.323 | 423 |
| Practical Mining LLC | February 5, 2018 |
| Klondex Mines Ltd. | Technical Report for the Fire Creek Project, | Page 155 |
| Lander County, Nevada |
| Min | Q1 | Q3 | Mean | |||||
| (Au | (Au | Median | (Au | Max | (Au | St | No. | |
| Vein | opt) | opt) | (Au opt) | opt) | (Au opt) | opt) | Dev. | Samples |
| V18B | 0.000 | 0.002 | 0.005 | 0.016 | 10.851 | 0.177 | 0.966 | 127 |
| V19 | 0.000 | 0.002 | 0.003 | 0.014 | 3.071 | 0.049 | 0.258 | 112 |
| V20A | 0.000 | 0.002 | 0.009 | 0.073 | 63.712 | 0.168 | 1.568 | 536 |
| V20B | 0.000 | 0.002 | 0.010 | 0.134 | 6.622 | 0.158 | 0.493 | 183 |
| V20C | 0.000 | 0.002 | 0.005 | 0.038 | 2.541 | 0.123 | 0.396 | 79 |
| V21A | 0.000 | 0.001 | 0.005 | 0.020 | 3.617 | 0.050 | 0.188 | 394 |
| V21B | 0.000 | 0.001 | 0.002 | 0.013 | 1.966 | 0.056 | 0.237 | 104 |
| V22A | 0.001 | 0.007 | 0.047 | 0.107 | 1.894 | 0.147 | 0.405 | 14 |
| V22B | 0.001 | 0.026 | 0.052 | 0.205 | 0.236 | 0.103 | 0.093 | 5 |
| V23 | 0.000 | 0.000 | 0.060 | 0.165 | 1.383 | 0.137 | 0.258 | 36 |
| V24 | 0.000 | 0.002 | 0.173 | 0.362 | 7.030 | 0.596 | 1.460 | 24 |
| V25 | 0.000 | 0.003 | 0.030 | 0.147 | 4.930 | 0.263 | 0.905 | 28 |
| V26 | 0.000 | 0.002 | 0.110 | 0.210 | 1.167 | 0.151 | 0.234 | 29 |
| V27 | 0.000 | 0.001 | 0.014 | 0.161 | 0.897 | 0.095 | 0.164 | 21 |
| V28 | 0.000 | 0.005 | 0.080 | 0.197 | 0.904 | 0.135 | 0.196 | 12 |
| V29 | 0.000 | 0.002 | 0.085 | 0.201 | 0.303 | 0.113 | 0.116 | 9 |
| V30 | 0.000 | 0.062 | 0.157 | 0.415 | 1.281 | 0.320 | 0.401 | 26 |
| V31A | 0.000 | 0.002 | 0.005 | 0.029 | 6.669 | 0.096 | 0.483 | 430 |
| V31B | 0.000 | 0.001 | 0.005 | 0.026 | 3.879 | 0.083 | 0.369 | 146 |
| V32 | 0.000 | 0.003 | 0.022 | 0.101 | 0.332 | 0.061 | 0.079 | 13 |
| V36A | 0.000 | 0.002 | 0.006 | 0.055 | 6.709 | 0.138 | 0.656 | 424 |
| V36B | 0.000 | 0.001 | 0.004 | 0.048 | 5.196 | 0.096 | 0.352 | 172 |
| V37A | 0.000 | 0.002 | 0.004 | 0.013 | 2.975 | 0.037 | 0.162 | 299 |
| V37B | 0.000 | 0.002 | 0.003 | 0.009 | 6.463 | 0.063 | 0.483 | 108 |
| V38A | 0.000 | 0.002 | 0.007 | 0.036 | 0.805 | 0.041 | 0.083 | 104 |
| V38B | 0.000 | 0.002 | 0.012 | 0.044 | 0.473 | 0.041 | 0.066 | 83 |
| V39A | 0.000 | 0.002 | 0.013 | 0.057 | 3.559 | 0.081 | 0.296 | 408 |
| V39B | 0.000 | 0.002 | 0.007 | 0.035 | 3.103 | 0.083 | 0.314 | 224 |
| V40A | 0.000 | 0.003 | 0.006 | 0.020 | 1.698 | 0.066 | 0.247 | 164 |
| V40B | 0.000 | 0.002 | 0.005 | 0.017 | 17.472 | 0.103 | 1.041 | 88 |
| V41A | 0.000 | 0.001 | 0.002 | 0.014 | 0.828 | 0.029 | 0.085 | 317 |
| V41B | 0.000 | 0.000 | 0.001 | 0.006 | 0.550 | 0.027 | 0.082 | 75 |
| V42 | 0.000 | 0.001 | 0.002 | 0.013 | 0.922 | 0.030 | 0.100 | 119 |
| V44A | 0.000 | 0.004 | 0.009 | 0.037 | 1.785 | 0.045 | 0.115 | 126 |
| V44B | 0.000 | 0.002 | 0.005 | 0.012 | 0.060 | 0.011 | 0.016 | 55 |
| V45A | 0.000 | 0.011 | 0.107 | 0.163 | 0.519 | 0.120 | 0.130 | 34 |
| V45B | 0.002 | 0.100 | 0.114 | 0.220 | 0.236 | 0.126 | 0.081 | 11 |
| V46 | 0.000 | 0.002 | 0.004 | 0.011 | 2.347 | 0.025 | 0.178 | 93 |
| Practical Mining LLC | February 5, 2018 |
| Page 156 | Mineral Resource Estimates | Klondex Mines Ltd. |
| Min | Q1 | Q3 | Mean | |||||
| (Au | (Au | Median | (Au | Max | (Au | St | No. | |
| Vein | opt) | opt) | (Au opt) | opt) | (Au opt) | opt) | Dev. | Samples |
| V51A | 0.000 | 0.000 | 0.003 | 0.029 | 1.122 | 0.068 | 0.190 | 28 |
| V51B | 0.000 | 0.001 | 0.004 | 0.036 | 1.665 | 0.116 | 0.327 | 20 |
| V55 | 0.000 | 0.004 | 0.016 | 0.116 | 1.838 | 0.161 | 0.345 | 83 |
| V56 | 0.000 | 0.001 | 0.002 | 0.007 | 5.003 | 0.046 | 0.366 | 239 |
| V58A | 0.000 | 0.002 | 0.004 | 0.018 | 4.054 | 0.108 | 0.512 | 98 |
| V58B | 0.001 | 0.010 | 0.093 | 0.201 | 1.779 | 0.186 | 0.259 | 99 |
| V59A | 0.000 | 0.001 | 0.007 | 0.044 | 5.621 | 0.074 | 0.384 | 152 |
| V59B | 0.000 | 0.002 | 0.009 | 0.046 | 4.186 | 0.148 | 0.638 | 26 |
| V60A | 0.000 | 0.001 | 0.003 | 0.090 | 1.137 | 0.092 | 0.208 | 61 |
| V60B | 0.000 | 0.001 | 0.002 | 0.101 | 0.547 | 0.072 | 0.126 | 17 |
| V61A | 0.000 | 0.001 | 0.010 | 0.081 | 2.269 | 0.102 | 0.271 | 114 |
| V61B | 0.000 | 0.001 | 0.010 | 0.115 | 0.901 | 0.096 | 0.204 | 31 |
| V63A | 0.000 | 0.001 | 0.005 | 0.064 | 1.806 | 0.113 | 0.350 | 131 |
| V63B | 0.000 | 0.001 | 0.004 | 0.063 | 0.683 | 0.045 | 0.096 | 84 |
| V64A | 0.000 | 0.002 | 0.013 | 0.046 | 1.084 | 0.053 | 0.137 | 98 |
| V64B | 0.000 | 0.000 | 0.012 | 0.050 | 1.247 | 0.081 | 0.246 | 48 |
| V65 | 0.001 | 0.005 | 0.009 | 0.044 | 0.296 | 0.063 | 0.105 | 10 |
| V66A | 0.002 | 0.077 | 0.127 | 0.225 | 0.966 | 0.217 | 0.270 | 11 |
| V66B | 0.106 | 0.146 | 0.236 | 0.327 | 0.368 | 0.236 | 0.099 | 4 |
| V67A | 0.000 | 0.091 | 0.173 | 0.258 | 0.466 | 0.183 | 0.138 | 12 |
| V67B | 0.000 | 0.033 | 0.167 | 0.649 | 2.150 | 0.431 | 0.622 | 11 |
| V68A | 0.000 | 0.002 | 0.030 | 0.150 | 1.281 | 0.117 | 0.233 | 71 |
| V68B | 0.000 | 0.002 | 0.032 | 0.178 | 0.735 | 0.140 | 0.214 | 14 |
| V69A | 0.000 | 0.001 | 0.029 | 0.186 | 1.604 | 0.209 | 0.406 | 23 |
| V69B | 0.001 | 0.002 | 0.049 | 0.194 | 0.960 | 0.175 | 0.271 | 10 |
| V70A | 0.001 | 0.032 | 0.144 | 0.335 | 0.494 | 0.193 | 0.165 | 12 |
| V70B | 0.000 | 0.001 | 0.110 | 0.171 | 0.249 | 0.095 | 0.091 | 9 |
| V72A | 0.000 | 0.000 | 0.031 | 0.084 | 0.948 | 0.149 | 0.304 | 11 |
| V72B | 0.000 | 0.000 | 0.032 | 0.138 | 0.228 | 0.072 | 0.086 | 6 |
| V73A | 0.000 | 0.000 | 0.033 | 0.154 | 4.955 | 0.386 | 1.135 | 12 |
| V73B | 0.000 | 0.000 | 0.011 | 0.226 | 2.025 | 0.351 | 0.689 | 8 |
| V73C | 0.000 | 0.000 | 0.017 | 0.155 | 0.616 | 0.120 | 0.198 | 9 |
| V74A | 0.000 | 0.026 | 0.064 | 0.106 | 0.118 | 0.064 | 0.043 | 5 |
| V74B | 0.001 | 0.019 | 0.072 | 0.153 | 0.179 | 0.084 | 0.073 | 3 |
| Totals | 0.137 | 12,397 |
| Practical Mining LLC | February 5, 2018 |
| Klondex Mines Ltd. | Technical Report for the Fire Creek Project, | Page 157 |
| Lander County, Nevada |
Table 14-7 Vein Gold Channel Composite Statistics
| Min | Q1 | Q3 | Mean | |||||
| (Au | (Au | Median | (Au | Max | (Au | St | No. | |
| Vein | opt) | opt) | (Au opt) | opt) | (Au opt) | opt) | Dev. | Samples |
| VJ1 | 0.001 | 0.073 | 0.551 | 3.121 | 843.026 | 5.334 | 31.755 | 2932 |
| VJ2 | 0.001 | 0.036 | 0.237 | 1.540 | 94.369 | 2.085 | 5.789 | 686 |
| VJ3 | 0.001 | 0.016 | 0.111 | 0.715 | 144.975 | 3.100 | 14.317 | 323 |
| VV1 | 0.001 | 0.025 | 0.263 | 7.468 | 653.408 | 14.047 | 44.091 | 1293 |
| VV2 | 0.001 | 0.021 | 0.076 | 1.824 | 186.688 | 4.160 | 15.613 | 242 |
| VV3 | 0.001 | 0.009 | 0.026 | 0.094 | 109.971 | 0.714 | 5.564 | 151 |
| VK1 | 0.001 | 0.053 | 0.505 | 2.495 | 226.359 | 3.575 | 13.392 | 1208 |
| VK2 | 0.001 | 0.040 | 0.318 | 2.071 | 125.723 | 2.798 | 8.648 | 612 |
| VK3 | 0.001 | 0.038 | 0.224 | 2.319 | 35.442 | 1.580 | 2.946 | 273 |
| V13A | 0.001 | 0.006 | 0.017 | 0.039 | 9.480 | 0.091 | 0.570 | 159 |
| V13B | 0.001 | 0.004 | 0.013 | 0.052 | 11.318 | 0.203 | 0.750 | 107 |
| V14A | 0.001 | 0.007 | 0.020 | 0.252 | 6.375 | 0.255 | 0.746 | 75 |
| V14B | 0.001 | 0.011 | 0.012 | 0.093 | 69.716 | 1.710 | 9.086 | 55 |
| V18A | 0.001 | 0.006 | 0.012 | 0.041 | 1.365 | 0.065 | 0.177 | 106 |
| V20A | 0.001 | 0.008 | 0.031 | 0.184 | 33.165 | 0.694 | 2.877 | 142 |
| V20B | 0.002 | 0.004 | 0.013 | 0.034 | 4.448 | 0.316 | 0.940 | 56 |
| V37A | 0.001 | 0.005 | 0.010 | 0.024 | 11.026 | 0.158 | 1.071 | 64 |
| V40A | 0.001 | 0.005 | 0.013 | 0.040 | 1.254 | 0.072 | 0.176 | 83 |
| V44A | 0.001 | 0.007 | 0.016 | 0.051 | 4.272 | 0.079 | 0.409 | 131 |
| V63A | 0.001 | 0.005 | 0.016 | 0.041 | 0.335 | 0.044 | 0.068 | 89 |
| V63B | 0.002 | 0.007 | 0.025 | 0.097 | 1.338 | 0.077 | 0.172 | 54 |
| Totals | 4.990 | 8,841 |
Table 14-8 Vein Silver Drill Hole Composite Statistics
| Min | Q1 | Q3 | Mean | |||||
| (Ag | (Ag | Median | (Ag | Max | (Ag | St | No. | |
| Vein | opt) | opt) | (Ag opt) | opt) | (Ag opt) | opt) | Dev. | Samples |
| VJ1 | 0.001 | 0.028 | 0.100 | 0.233 | 91.839 | 0.475 | 2.372 | 755 |
| VJ2 | 0.001 | 0.007 | 0.100 | 0.233 | 79.300 | 0.322 | 2.419 | 345 |
| VJ3 | 0.001 | 0.008 | 0.100 | 0.204 | 32.525 | 0.279 | 1.052 | 194 |
| VK1 | 0.001 | 0.073 | 0.100 | 0.283 | 34.908 | 0.466 | 2.077 | 502 |
| VK2 | 0.001 | 0.068 | 0.100 | 0.178 | 44.000 | 0.200 | 0.866 | 350 |
| VK3 | 0.001 | 0.008 | 0.073 | 0.233 | 132.140 | 0.374 | 3.158 | 183 |
| VV1 | 0.001 | 0.015 | 0.100 | 0.207 | 41.377 | 0.220 | 0.740 | 521 |
| VV2 | 0.001 | 0.007 | 0.073 | 0.175 | 6.651 | 0.164 | 0.343 | 204 |
| VV3 | 0.001 | 0.007 | 0.100 | 0.298 | 1.809 | 0.160 | 0.206 | 79 |
| Practical Mining LLC | February 5, 2018 |
| Page 158 | Mineral Resource Estimates | Klondex Mines Ltd. |
| Min | Q1 | Q3 | Mean | |||||
| (Ag | (Ag | Median | (Ag | Max | (Ag | St | No. | |
| Vein | opt) | opt) | (Ag opt) | opt) | (Ag opt) | opt) | Dev. | Samples |
| V05A | 0.001 | 0.073 | 0.100 | 0.100 | 1.561 | 0.111 | 0.158 | 420 |
| V05B | 0.001 | 0.023 | 0.073 | 0.100 | 0.200 | 0.069 | 0.042 | 61 |
| V06A | 0.003 | 0.007 | 0.066 | 0.569 | 6.359 | 0.472 | 1.110 | 76 |
| V06B | 0.007 | 0.007 | 0.007 | 0.044 | 1.240 | 0.113 | 0.301 | 19 |
| V07 | 0.001 | 0.007 | 0.100 | 0.100 | 2.217 | 0.087 | 0.192 | 119 |
| V08A | 0.001 | 0.007 | 0.073 | 0.100 | 6.155 | 0.125 | 0.330 | 378 |
| V08B | 0.001 | 0.007 | 0.073 | 0.100 | 1.809 | 0.104 | 0.194 | 132 |
| V09A | 0.001 | 0.007 | 0.015 | 0.100 | 2.479 | 0.135 | 0.384 | 121 |
| V09B | 0.001 | 0.003 | 0.007 | 0.092 | 0.846 | 0.089 | 0.180 | 41 |
| V12 | 0.001 | 0.020 | 0.100 | 0.115 | 3.500 | 0.135 | 0.239 | 197 |
| V13A | 0.007 | 0.073 | 0.100 | 0.254 | 5.571 | 0.187 | 0.353 | 94 |
| V13B | 0.001 | 0.067 | 0.096 | 0.201 | 1.718 | 0.202 | 0.321 | 44 |
| V14A | 0.001 | 0.100 | 0.100 | 0.300 | 14.860 | 0.327 | 0.807 | 127 |
| V14B | 0.007 | 0.100 | 0.100 | 0.200 | 6.400 | 0.310 | 0.950 | 68 |
| V15A | 0.003 | 0.007 | 0.073 | 0.094 | 0.875 | 0.084 | 0.130 | 66 |
| V15B | 0.003 | 0.007 | 0.025 | 0.073 | 0.338 | 0.055 | 0.080 | 22 |
| V16A | 0.001 | 0.055 | 0.093 | 0.204 | 0.459 | 0.143 | 0.132 | 39 |
| V16B | 0.003 | 0.007 | 0.200 | 0.321 | 0.992 | 0.236 | 0.243 | 15 |
| V18A | 0.001 | 0.073 | 0.100 | 0.100 | 11.300 | 0.186 | 0.694 | 423 |
| V18B | 0.001 | 0.073 | 0.080 | 0.100 | 3.705 | 0.144 | 0.352 | 127 |
| V19 | 0.001 | 0.007 | 0.045 | 0.100 | 0.645 | 0.066 | 0.089 | 112 |
| V20A | 0.001 | 0.073 | 0.100 | 0.172 | 14.800 | 0.211 | 0.885 | 536 |
| V20B | 0.001 | 0.038 | 0.100 | 0.181 | 3.821 | 0.172 | 0.331 | 183 |
| V20C | 0.001 | 0.022 | 0.099 | 0.102 | 1.750 | 0.132 | 0.202 | 79 |
| V21A | 0.000 | 0.008 | 0.073 | 0.100 | 1.229 | 0.115 | 0.185 | 394 |
| V21B | 0.001 | 0.007 | 0.073 | 0.100 | 3.792 | 0.130 | 0.448 | 104 |
| V22A | 0.007 | 0.045 | 0.116 | 0.300 | 1.397 | 0.216 | 0.298 | 14 |
| V22B | 0.007 | 0.144 | 0.233 | 0.274 | 0.300 | 0.199 | 0.103 | 5 |
| V23 | 0.003 | 0.007 | 0.031 | 0.198 | 0.894 | 0.124 | 0.192 | 36 |
| V24 | 0.003 | 0.007 | 0.379 | 0.890 | 3.996 | 0.641 | 0.924 | 24 |
| V25 | 0.007 | 0.007 | 0.066 | 0.197 | 1.587 | 0.180 | 0.319 | 28 |
| V26 | 0.007 | 0.007 | 0.012 | 0.116 | 0.560 | 0.095 | 0.145 | 29 |
| V27 | 0.003 | 0.007 | 0.007 | 0.040 | 0.671 | 0.061 | 0.127 | 21 |
| V28 | 0.007 | 0.007 | 0.096 | 0.181 | 1.750 | 0.190 | 0.369 | 12 |
| V29 | 0.003 | 0.007 | 0.228 | 0.429 | 0.578 | 0.247 | 0.206 | 9 |
| V30 | 0.007 | 0.036 | 0.105 | 0.334 | 1.535 | 0.284 | 0.392 | 26 |
| V31A | 0.001 | 0.073 | 0.095 | 0.100 | 19.536 | 0.245 | 1.306 | 430 |
| V31B | 0.001 | 0.023 | 0.073 | 0.100 | 1.202 | 0.118 | 0.163 | 146 |
| V32 | 0.006 | 0.007 | 0.007 | 0.125 | 0.828 | 0.093 | 0.197 | 13 |
| Practical Mining LLC | February 5, 2018 |
| Klondex Mines Ltd. | Technical Report for the Fire Creek Project, | Page 159 |
| Lander County, Nevada |
| Min | Q1 | Q3 | Mean | |||||
| (Ag | (Ag | Median | (Ag | Max | (Ag | St | No. | |
| Vein | opt) | opt) | (Ag opt) | opt) | (Ag opt) | opt) | Dev. | Samples |
| V36A | 0.001 | 0.024 | 0.082 | 0.100 | 3.675 | 0.137 | 0.308 | 424 |
| V36B | 0.003 | 0.007 | 0.073 | 0.100 | 1.600 | 0.112 | 0.171 | 172 |
| V37A | 0.001 | 0.073 | 0.100 | 0.100 | 5.400 | 0.137 | 0.318 | 299 |
| V37B | 0.003 | 0.073 | 0.100 | 0.122 | 5.400 | 0.172 | 0.494 | 108 |
| V38A | 0.001 | 0.024 | 0.100 | 0.127 | 0.438 | 0.114 | 0.107 | 104 |
| V38B | 0.001 | 0.034 | 0.100 | 0.123 | 0.500 | 0.106 | 0.090 | 83 |
| V39A | 0.001 | 0.073 | 0.100 | 0.200 | 2.013 | 0.162 | 0.230 | 408 |
| V39B | 0.001 | 0.073 | 0.100 | 0.146 | 9.000 | 0.233 | 0.929 | 224 |
| V40A | 0.003 | 0.073 | 0.100 | 0.204 | 2.636 | 0.181 | 0.215 | 164 |
| V40B | 0.001 | 0.073 | 0.100 | 0.102 | 7.563 | 0.340 | 1.205 | 88 |
| V41A | 0.001 | 0.007 | 0.073 | 0.100 | 1.400 | 0.106 | 0.201 | 317 |
| V41B | 0.001 | 0.007 | 0.073 | 0.100 | 0.817 | 0.091 | 0.148 | 75 |
| V42 | 0.001 | 0.007 | 0.073 | 0.100 | 0.408 | 0.071 | 0.065 | 119 |
| V44A | 0.003 | 0.007 | 0.078 | 0.154 | 1.500 | 0.134 | 0.194 | 126 |
| V44B | 0.001 | 0.007 | 0.073 | 0.100 | 0.700 | 0.111 | 0.151 | 55 |
| V45A | 0.003 | 0.073 | 0.206 | 0.352 | 1.550 | 0.282 | 0.305 | 34 |
| V45B | 0.073 | 0.100 | 0.328 | 0.467 | 1.050 | 0.341 | 0.248 | 11 |
| V46 | 0.001 | 0.073 | 0.100 | 0.100 | 1.500 | 0.094 | 0.115 | 93 |
| V51A | 0.001 | 0.007 | 0.016 | 0.100 | 5.163 | 0.209 | 0.802 | 28 |
| V51B | 0.001 | 0.007 | 0.039 | 0.120 | 1.033 | 0.132 | 0.233 | 20 |
| V55 | 0.001 | 0.073 | 0.100 | 0.400 | 1.400 | 0.245 | 0.285 | 83 |
| V56 | 0.001 | 0.016 | 0.073 | 0.100 | 3.800 | 0.121 | 0.281 | 239 |
| V58A | 0.001 | 0.037 | 0.073 | 0.159 | 2.437 | 0.183 | 0.346 | 98 |
| V58B | 0.001 | 0.100 | 0.282 | 0.606 | 1.167 | 0.349 | 0.277 | 99 |
| V59A | 0.001 | 0.073 | 0.100 | 0.176 | 18.900 | 0.261 | 1.326 | 152 |
| V59B | 0.006 | 0.016 | 0.073 | 0.110 | 1.634 | 0.131 | 0.251 | 26 |
| V60A | 0.001 | 0.023 | 0.073 | 0.100 | 1.744 | 0.146 | 0.282 | 61 |
| V60B | 0.007 | 0.019 | 0.073 | 0.200 | 0.363 | 0.115 | 0.111 | 17 |
| V61A | 0.001 | 0.016 | 0.074 | 0.245 | 4.189 | 0.261 | 0.563 | 114 |
| V61B | 0.003 | 0.008 | 0.076 | 0.200 | 1.254 | 0.202 | 0.297 | 31 |
| V63A | 0.001 | 0.007 | 0.073 | 0.146 | 2.360 | 0.195 | 0.406 | 131 |
| V63B | 0.005 | 0.007 | 0.077 | 0.172 | 0.772 | 0.129 | 0.145 | 84 |
| V64A | 0.003 | 0.007 | 0.093 | 0.184 | 1.329 | 0.138 | 0.184 | 98 |
| V64B | 0.007 | 0.007 | 0.091 | 0.118 | 17.619 | 0.660 | 3.028 | 48 |
| V65 | 0.013 | 0.073 | 0.073 | 0.222 | 0.551 | 0.171 | 0.180 | 10 |
| V66A | 0.009 | 0.073 | 0.125 | 0.412 | 4.288 | 0.631 | 1.240 | 11 |
| V66B | 0.204 | 0.219 | 0.248 | 0.394 | 0.525 | 0.306 | 0.128 | 4 |
| V67A | 0.003 | 0.042 | 0.093 | 0.210 | 0.614 | 0.155 | 0.171 | 12 |
| Practical Mining LLC | February 5, 2018 |
| Page 160 | Mineral Resource Estimates | Klondex Mines Ltd. |
| Min | Q1 | Q3 | Mean | |||||
| (Ag | (Ag | Median | (Ag | Max | (Ag | St | No. | |
| Vein | opt) | opt) | (Ag opt) | opt) | (Ag opt) | opt) | Dev. | Samples |
| V67B | 0.003 | 0.035 | 0.100 | 0.298 | 5.805 | 0.663 | 1.633 | 11 |
| V68A | 0.001 | 0.007 | 0.100 | 0.462 | 6.622 | 0.509 | 1.214 | 71 |
| V68B | 0.001 | 0.007 | 0.067 | 0.430 | 0.817 | 0.212 | 0.271 | 14 |
| V69A | 0.003 | 0.073 | 0.097 | 0.248 | 1.502 | 0.263 | 0.371 | 23 |
| V69B | 0.064 | 0.073 | 0.086 | 0.230 | 1.050 | 0.222 | 0.279 | 10 |
| V70A | 0.003 | 0.125 | 0.293 | 0.655 | 1.225 | 0.424 | 0.382 | 12 |
| V70B | 0.003 | 0.073 | 0.224 | 0.399 | 3.048 | 0.550 | 0.954 | 9 |
| V72A | 0.003 | 0.006 | 0.030 | 0.115 | 0.224 | 0.067 | 0.076 | 11 |
| V72B | 0.003 | 0.003 | 0.032 | 0.053 | 0.067 | 0.032 | 0.024 | 6 |
| V73A | 0.003 | 0.005 | 0.012 | 0.084 | 1.179 | 0.112 | 0.268 | 12 |
| V73B | 0.001 | 0.004 | 0.032 | 0.058 | 0.500 | 0.094 | 0.167 | 8 |
| V73C | 0.001 | 0.003 | 0.011 | 0.038 | 0.100 | 0.026 | 0.031 | 9 |
| V74A | 0.003 | 0.014 | 0.031 | 0.103 | 0.110 | 0.053 | 0.044 | 5 |
| V74B | 0.003 | 0.003 | 0.004 | 0.139 | 0.184 | 0.064 | 0.085 | 3 |
| Totals | 0.213 | 12,397 |
Table 14-9 Vein Silver Channel Composite Statistics
| Min | Q1 | Q3 | Mean | |||||
| (Ag | (Ag | Median | (Ag | Max | (Ag | St | No. | |
| Vein | opt) | opt) | (Ag opt) | opt) | (Ag opt) | opt) | Dev. | Samples |
| VJ1 | 0.001 | 0.232 | 0.593 | 2.217 | 303.509 | 3.774 | 15.121 | 2932 |
| VJ2 | 0.001 | 0.175 | 0.386 | 1.295 | 94.802 | 1.929 | 5.801 | 686 |
| VJ3 | 0.001 | 0.121 | 0.321 | 0.729 | 67.091 | 2.420 | 8.874 | 323 |
| VV1 | 0.001 | 0.146 | 0.408 | 5.133 | 822.594 | 11.635 | 40.840 | 1293 |
| VV2 | 0.004 | 0.073 | 0.244 | 1.404 | 238.902 | 4.560 | 20.798 | 242 |
| VV3 | 0.001 | 0.073 | 0.114 | 0.267 | 291.700 | 1.678 | 16.464 | 151 |
| VK1 | 0.001 | 0.146 | 0.418 | 1.746 | 617.935 | 4.121 | 25.413 | 1208 |
| VK2 | 0.001 | 0.143 | 0.332 | 1.411 | 291.700 | 2.902 | 13.424 | 612 |
| VK3 | 0.050 | 0.073 | 0.371 | 1.713 | 69.133 | 1.970 | 5.232 | 273 |
| V13A | 0.026 | 0.050 | 0.114 | 0.249 | 6.505 | 0.242 | 0.528 | 159 |
| V13B | 0.050 | 0.073 | 0.159 | 0.356 | 5.513 | 0.320 | 0.467 | 107 |
| V14A | 0.050 | 0.073 | 0.221 | 0.468 | 3.441 | 0.315 | 0.414 | 75 |
| V14B | 0.050 | 0.073 | 0.141 | 0.325 | 33.983 | 1.049 | 4.467 | 55 |
| V18A | 0.050 | 0.073 | 0.173 | 0.249 | 0.979 | 0.182 | 0.139 | 106 |
| V20A | 0.050 | 0.073 | 0.226 | 0.568 | 108.151 | 1.391 | 7.909 | 142 |
| V20B | 0.050 | 0.073 | 0.139 | 0.253 | 6.282 | 0.372 | 0.848 | 56 |
| V37A | 0.050 | 0.050 | 0.146 | 0.273 | 14.504 | 0.324 | 1.389 | 64 |
| Practical Mining LLC | February 5, 2018 |
| Klondex Mines Ltd. | Technical Report for the Fire Creek Project, | Page 161 |
| Lander County, Nevada |
| Min | Q1 | Q3 | Mean | |||||
| (Ag | (Ag | Median | (Ag | Max | (Ag | St | No. | |
| Vein | opt) | opt) | (Ag opt) | opt) | (Ag opt) | opt) | Dev. | Samples |
| V40A | 0.001 | 0.073 | 0.166 | 0.397 | 0.772 | 0.228 | 0.191 | 83 |
| V44A | 0.050 | 0.073 | 0.073 | 0.233 | 2.571 | 0.199 | 0.297 | 131 |
| V63A | 0.050 | 0.073 | 0.073 | 0.232 | 1.102 | 0.149 | 0.142 | 89 |
| V63B | 0.050 | 0.073 | 0.103 | 0.221 | 2.053 | 0.182 | 0.239 | 54 |
| Totals | 4.224 | 8,841 |
For the low-grade dissemination, drill hole composites were grouped according to lithology based estimation domains and declustered univariate statistics calculated. Boxplots reporting summary statistics are shown in Figure 14-12 and Figure 14-13.

| Practical Mining LLC | February 5, 2018 |
| Page 162 | Mineral Resource Estimates | Klondex Mines Ltd. |

| 14.6. | Grade Capping |
Grade capping for gold and silver was determined individually for the main veins using grade distribution curves and the spatial configuration of high-grades within the vein (i.e. where high-grades are distributed within cohesive ore shoots, the metal at risk is considered lower, versus high-grades located randomly throughout the vein where the metal at risk resulting from an isolated high-grade sample is considered to be higher). Ongoing effectiveness of grade capping is measured through ongoing reconciliation programs.
Grade capping was applied through two methods, dependent on the data spacing and type of sample being used in the estimate. The methods, high yield and top cut, are listed in Table 14-10.
| 1. | In Measured spacing, both drill hole and channel composites were used in the estimation. A combination of both the high yield and the top cut method were used. Composites that had a grade above a specified threshold were only used in the estimation if they were within a restricted distance of the block to be estimated. If that grade was above a subsequent higher threshold (applicable to the channels grade population), the grade was capped at that level. This maintains the grade profile locally (typically in silled areas), but restricts the potential of smearing of metal away from the local area and limits unreasonable metal coming from significant grade outliers; and |
| Practical Mining LLC | February 5, 2018 |
| Klondex Mines Ltd. | Technical Report for the Fire Creek Project, | Page 163 |
| Lander County, Nevada |
| 2. | In Indicated and Inferred spacings, only drill hole composites were used in the estimation. The capping method applied was the topcut method. The topcut was determined as applicable to the drill hole grade population. If composites that had a grade above a specified threshold, they were capped at that threshold but used in estimation to the full extents of the search ellipse. This removes metal from the grade profile locally, but enables the use of that sample in wider spaced drilling to represent the metal of the broader ore shoot. The local metal profile will be refined as infill drilling and eventual silling are undertaken. |
Table 14-10 Capping Methods
| Estimation | |||
| Pass | Data Used | Capping Method | Extent of Influence |
| Measured | Drill holes + Channels | High Yield +Top Cut | 25x25 |
| Indicated | Drill holes Only | Top Cut | Search Ellipse |
| Inferred | Drill holes Only | Top Cut | Search Ellipse |
A final diluted topcut was applied to vein blocks to ensure that no vein block could create a diluted minable grade greater than 7.5 opt AuEq. Diluted grades were calculated based on a four-foot minimum mining width and two-foot external dilution. Where the calculated diluted AuEq grade of a block was greater than 7.5 opt, the diluted grade was cut to 7.5 opt AuEq. The final undiluted gold and silver vein block grades were then downgraded to suit the diluted topcut by keeping the Au:Ag ratio intact.
In addition to grade capping, the influence of high-grades was restricted by the identification of ore shoots on the vein prior to estimation (using on-vein domains). Within the vein, high-grade ore shoots often have sharp structural contacts with adjacent poorly mineralized parts of the vein. An indicator estimation method was used to assign the ore shoot extents to the block model so that these could be estimated separately from the poorly mineralized parts of the vein. Figure 14-14 the Joyce Vein is shown color coded according to its ore shoot indicator estimation. Blocks defined by the estimation as part of an ore shoot are colored red, unmineralized areas are colored blue. The estimation is based on composite grades, which are displayed as dots on Figure 14-18 for reference. Composites are colored red if their gold value is above 0.08 opt, blue if their value is below.
| Practical Mining LLC | February 5, 2018 |
| Page 164 | Mineral Resource Estimates | Klondex Mines Ltd. |

Ore shoots on the Joyce Vein (as defined by the ore shoot indicator estimation method) are shown in red, weakly mineralized areas of the vein are shown in blue. Black lies above the topographic surface and is defined as air.
The ore shoot indicator method was assigned to the block model as follows:
| 1. | For gold, a mineralized composite for underground mining purposes was defined as a sample having a grade greater than 0.08 opt. The threshold for silver was also set at 0.08 opt; |
|
| 2. | Each vein composite was assigned a “1” if its grade was above the specified threshold, or a “0” if its grade was below; |
|
| 3. | These one and zero values were estimated into the vein blocks, resulting in an estimated value between “0” and “1” being assigned to the block – this value represents the probability that the block is part of an ore shoot; |
|
| 4. | If a block had a probability of greater than 40% (or 0.4) then it was determined to be part of an ore shoot. If the value was less than 0.4, the block was assigned as an unmineralized block; and |
|
| 5. | Blocks defined as part of the ore shoot were estimated for grade separately from blocks defined as unmineralized, using a separate set of composites (the ore shoot estimate may use any sample within the vein, the unmineralized estimate may only use samples within the unmineralized zone). This ensured high-grades from an ore shoot could not be used to estimate adjacent unmineralized areas. |
| Practical Mining LLC | February 5, 2018 |
| Klondex Mines Ltd. | Technical Report for the Fire Creek Project, | Page 165 |
| Lander County, Nevada |
The use of an ore shoot indicator complements the capping thresholds used in the grade estimation since high-grades are only used to estimate mineralized ore shoot areas of the vein.
Grade capping values used for the grade estimates of the ore shoots are outlined below in Table 14-11.
Table 14-11 Grade Capping Values for Ore shoots
| Gold Thresholds | Silver Thresholds | |||||
| Measured | Measured | Ind/Inf | Measured | Measured | Ind/Inf | |
| Vein | High Yield | Topcut | Topcut | High Yield | Topcut | Topcut |
| VJ1 | 60 | 200 | 20 | 60 | 100 | 20 |
| VJ2 | 20 | 40 | 5 | 20 | 50 | 10 |
| VJ3 | 7.5 | 10 | 1.5 | 5 | 10 | 1.5 |
| VV1 | 100 | 300 | 15 | 100 | 300 | 7.5 |
| VV2 | 20 | 80 | 1.5 | 40 | 90 | 2 |
| VV3 | 15 | 40 | 1 | 10 | 40 | 1 |
| VK1 | 50 | 90 | 8 | 50 | 90 | 6 |
| VK2 | 30 | 60 | 12 | 30 | 60 | 10 |
| VK3 | 10 | 15 | 2 | 10 | 15 | 2 |
| V14A | 7.5 | 15 | 5 | 5 | 10 | 2.5 |
| V14B | 7.5 | 10 | 1 | 2 | 2 | 1.5 |
| V19 | 2 | 2 | 2 | 2 | 2 | 2 |
| V20A | 5 | 10 | 7.5 | 2 | 4 | 4 |
| V20B | 1 | 4 | 1 | 1 | 4 | 1 |
| V20C | 1 | 4 | 1 | 1 | 4 | 1 |
| V36A | 2 | 4 | 2 | 1 | 4 | 1 |
| V36B | 2 | 4 | 1 | 1 | 4 | 1 |
| V36C | 2 | 4 | 1 | 1 | 4 | 1 |
| All Other | ||||||
| Veins | 4 | 4 | 4 | 4 | 4 | 4 |
Figure 14-15 through Figure 14-18 are example grade distribution curves for the Vonnie Vein (VV1) as an example of the capping thresholds chosen.
| Practical Mining LLC | February 5, 2018 |
| Page 166 | Mineral Resource Estimates | Klondex Mines Ltd. |


| Practical Mining LLC | February 5, 2018 |
| Klondex Mines Ltd. | Technical Report for the Fire Creek Project, | Page 167 |
| Lander County, Nevada |
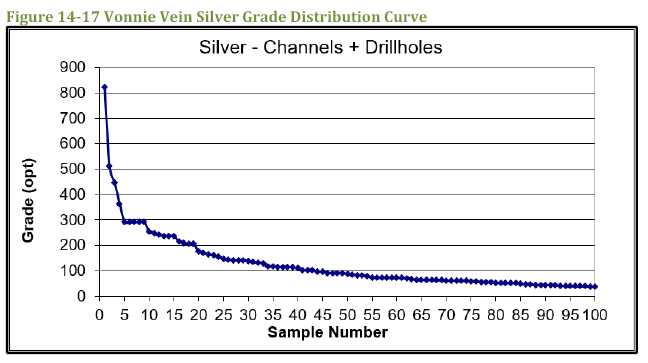
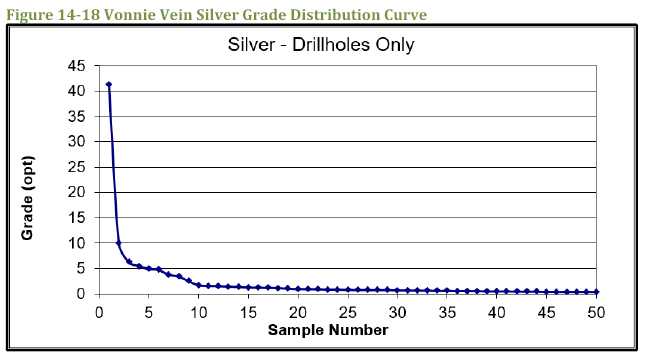
For the low-grade disseminated mineralization, a similar approach of grade capping based on high yield and top cut was applied. Probability plots indicated a topcut of 4.0 opt for Au was appropriate.as shown in Figure 14-19 for basalt. As there is a 1:1 Ag:Au relationship, silver used the same topcut.. The top cut affects less than 0.1% of the low-grade samples as specified below in Table 14-12 and Table 14-13. The capping strategy was implemented similar to the estimation of vein resources, using a high yield of 2 opt for Au and ellipsoid of 30 feet by 30 feet by 30 feet. This ensured that high-grade was not extended further than was supported by the data. For the indicated and inferred passes the top cut applied was 4 opt for Au.
| Practical Mining LLC | February 5, 2018 |
| Page 168 | Mineral Resource Estimates | Klondex Mines Ltd. |

Table 14-12 Top Cutting – Low-grade - Gold
| Top Cut 4.0 Au opt | ||||||||||
| Gold - Low Grade Mineralization - Au opt | Samples over | % | ||||||||
| Domain | Min | Q1 | Median | Q3 | Max | Mean | Std.Dev | N Samples | TopCut | Samples |
| AND | 0.000 | 0.000 | 0.000 | 0.000 | 1.393 | 0.001 | 0.010 | 13,381 | ||
| TFUP | 0.000 | 0.000 | 0.000 | 0.000 | 1.307 | 0.002 | 0.011 | 9,624 | ||
| BST | 0.000 | 0.000 | 0.000 | 0.002 | 10.000 | 0.006 | 0.050 | 48,001 | 46 | 0.10% |
| TFLO | 0.000 | 0.000 | 0.000 | 0.002 | 1.734 | 0.003 | 0.024 | 11,452 | ||
| DKAND | 0.000 | 0.000 | 0.000 | 0.001 | 0.311 | 0.002 | 0.013 | 1,989 | ||
| DKTFUP | 0.000 | 0.000 | 0.000 | 0.002 | 0.873 | 0.007 | 0.028 | 1,627 | ||
| DKBST | 0.000 | 0.000 | 0.001 | 0.004 | 10.000 | 0.009 | 0.058 | 20,520 | 16 | 0.08% |
| DKTFLO | 0.000 | 0.000 | 0.001 | 0.002 | 0.639 | 0.005 | 0.019 | 3,190 | ||
| Practical Mining LLC | February 5, 2018 |
| Klondex Mines Ltd. | Technical Report for the Fire Creek Project, | Page 169 |
| Lander County, Nevada |
Table 14-13 Top Cutting – Low-grade - Silver
| Top Cut 4.0 Ag opt | ||||||||||
Silver - Low Grade Mineralization - Ag opt |
Samples over | % | ||||||||
| Domain | Min | Q1 | Median | Q3 | Max | Mean | Std.Dev | N Samples | TopCut | Samples |
| AND | 0.000 | 0.007 | 0.007 | 0.007 | 0.660 | 0.010 | 0.017 | 13,381 | ||
| TFUP | 0.000 | 0.004 | 0.007 | 0.007 | 4.650 | 0.016 | 0.047 | 9,624 | 1 | 0.01% |
| BST | 0.000 | 0.007 | 0.007 | 0.073 | 10.000 | 0.038 | 0.104 | 48,001 | 53 | 0.11% |
| TFLO | 0.000 | 0.007 | 0.007 | 0.073 | 5.122 | 0.038 | 0.072 | 11,452 | 1 | 0.01% |
| DKAND | 0.000 | 0.006 | 0.007 | 0.007 | 4.084 | 0.015 | 0.109 | 1,989 | 1 | 0.05% |
| DKTFUP | 0.000 | 0.007 | 0.007 | 0.011 | 1.323 | 0.030 | 0.065 | 1,627 | ||
| DKBST | 0.000 | 0.007 | 0.011 | 0.073 | 5.309 | 0.053 | 0.118 | 20,520 | 18 | 0.09% |
| DKTFLO | 0.000 | 0.007 | 0.028 | 0.074 | 1.502 | 0.050 | 0.054 | 3,190 | 0.00% | |
| 14.7. | Variography |
Variograms were calculated previously using Vulcan software for the gold composites within each of the Vonnie Vein, Joyce Vein, and Karen Vein. The closely spaced underground channel samples allow for construction of a meaningful variogram which gives an indication of the continuity and characteristics of grade within each vein. For each vein, the major direction was modelled as the strike direction, whilst the semi-major direction was modelled as the down dip direction. The minor direction was across the thickness of the vein where one composite exists and therefore the minor direction is not displayed. The final major and semi-major variogram distances modelled in the results support this approach.
The Karen variogram indicates greater continuity than the Joyce and Vonnie variograms. In addition, the Joyce variogram shows a higher nugget than both the Karen and Vonnie variograms. This is consistent with the results of mining seen to date. The Karen Vein ore shoot has been noticeably more continuous along strike for high-grade mineralization. The Joyce Vein, whilst having a significant ore shoot along strike, to date has shown higher variability of grade rapidly changing between high and low-grades (Figure 14-20 through Figure 14-22).
| Practical Mining LLC | February 5, 2018 |
| Page 170 | Mineral Resource Estimates | Klondex Mines Ltd. |


| Practical Mining LLC | February 5, 2018 |
| Klondex Mines Ltd. | Technical Report for the Fire Creek Project, | Page 171 |
| Lander County, Nevada |
For the low-grade disseminated mineralization, variograms were calculated by each lithological domain. The abundance of underground drill hole data aided in the definition of the nugget. In most cases, the variograms supported a N-NW orientation of mineralization. In the definition of the variograms, the major direction was modelled following the general strike direction of the vein system, while the semi-major and minor directions were oriented to the lateral dissemination of mineralization around the veins. The defined variogram models were used in the estimation of the low-grade disseminated mineralization. For variography and estimation, the dikes were grouped as one domain. (Figure 14-23 through Figure 14-27)

| Practical Mining LLC | February 5, 2018 |
| Page 172 | Mineral Resource Estimates | Klondex Mines Ltd. |


| Practical Mining LLC | February 5, 2018 |
| Klondex Mines Ltd. | Technical Report for the Fire Creek Project, | Page 173 |
| Lander County, Nevada |

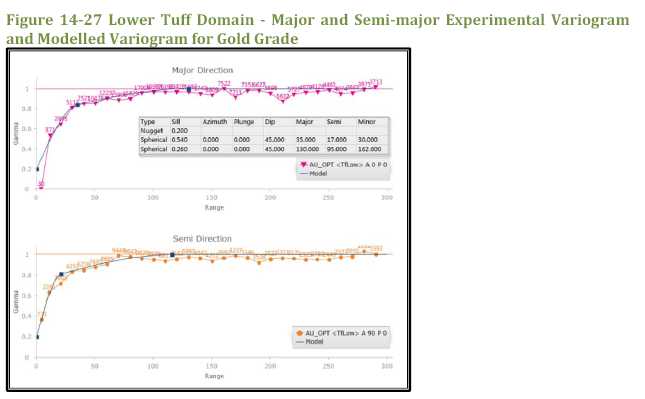
| Practical Mining LLC | February 5, 2018 |
| Page 174 | Mineral Resource Estimates | Klondex Mines Ltd. |
Variogram parameters to be used in the OK estimation of the low-grade dissemination domains are reported in Table 14-14.
Table 14-14 Variograms by Lithological Domain
| CORRELOGRAMS | DIKE | ANDEST | TF_UP | BASALT | TF_LOW |
| NUGGET | 0.20 | 0.30 | 0.30 | 0.30 | 0.20 |
| NUM_STRUCT | 2 | 2 | 2 | 2 | 2 |
| VAR_TYPE_1 | sph | sph | sph | sph | sph |
| STR_1_DIFF_SILL | 0.69 | 0.49 | 0.55 | 0.56 | 0.54 |
| MJ_STR_1_RANGE | 37 | 16 | 30 | 29 | 35 |
| SM_STR_1_RANGE | 17 | 17 | 18 | 17 | 17 |
| MN_STR_1_RANGE | 35 | 13 | 14 | 18 | 30 |
| STR_1_ROT_ALPHA | 0 | 0 | 150 | 0 | 0 |
| STR_1_ROT_ZETA | -75 | 60 | 0 | -75 | 0 |
| STR_1_ROT_BETA | -46 | 90 | -27 | -75 | 45 |
| VAR_TYPE_2 | sph | sph | sph | sph | sph |
| STR_2_DIFF_SILL | 0.11 | 0.21 | 0.15 | 0.14 | 0.26 |
| MJ_STR_2_RANGE | 174 | 30 | 202 | 108 | 130 |
| SM_STR_2_RANGE | 124 | 35 | 122 | 81 | 95 |
| MN_STR_2_RANGE | 92 | 36 | 130 | 96 | 162 |
| STR_2_ROT_ALPHA | 0 | 0 | 150 | 0 | 0 |
| STR_2_ROT_ZETA | -75 | 60 | 0 | -75 | 0 |
| STR_2_ROT_BETA | -46 | 90 | -27 | -75 | 45 |
| 14.8. | Block Model |
The main block model was constructed using a 3,500-foot by five-foot by five-foot parent block size (XYZ), with sub-blocking in the veins as small as 0.2 feet by five feet by five feet. This block modeling method creates a single block across the vein thickness with a tolerance of 0.2 feet (the block model is rotated such that the thickness of the vein represents the Z direction). Therefore, the block width across the vein is within 0.2 feet of the actual width of the vein solid. Blocks outside of the vein models were created to a parent block size of 20-foot by 20-foot by 20-foot to support the estimation of the disseminated mineralization.
| Practical Mining LLC | February 5, 2018 |
| Klondex Mines Ltd. | Technical Report for the Fire Creek Project, | Page 175 |
| Lander County, Nevada |
The model was rotated with a bearing/dip/plunge of 75/0/270. The block model origin (lower left corner) was 643129.386E, 762717.123N, 6500EL. The X length was 1,900 feet, Y length was 8,000 feet and the Z length was 3,500 feet.
In addition to the main block model, a second block model was constructed for the vein mineralization defining the Zeus trend. This block model had the same definition settings as the main block model however had a block model origin of 640767.729E, 766121.797N, 6500EL with an X length of 1,900 feet, Y length of 4,100 feet and the Z length of 1,400 feet (Figure 14-28).
| Practical Mining LLC | February 5, 2018 |
| Page 176 | Mineral Resource Estimates | Klondex Mines Ltd. |

Each unique vein name was assigned to a block variable called “structure”. During creation of each block model, the dip direction and dip relative to each veins hanging wall and footwall contact was assigned to each vein block.
| Practical Mining LLC | February 5, 2018 |
| Klondex Mines Ltd. | Technical Report for the Fire Creek Project, | Page 177 |
| Lander County, Nevada |
The block model variables are defined in Table 14-15.
Table 14-15 Block Model Variables
| Variables | Default | Type | Description |
| structure | none | name | structure name |
| thickness | 0 | float | thickness |
| density | 0 | float | density (Ton/ft3) |
| dip_direction | -99 | float | Dip Direction of vein (0 to 360) |
| dip | -99 | float | Dip of vein (0 to -90) |
| plunge | -99 | float | Plunge of vein (0) |
| au_opt | -99 | float | Gold - Grade Estimate (Ounces per Ton) |
| au_flag | 0 | byte | Gold - Estimation Flag |
| au_ndh | 0 | byte | Gold - Number Drill Holes |
| au_dist | 0 | float | Gold - Average Distance to Samples |
| au_ns | 0 | byte | Gold - Number of Samples |
| au_opt_nn | -99 | float | Gold - Nearest Neighbor (Ounces per Ton) |
| au_nn_dist | 0 | float | Distance to nearest sample |
| ag_opt | -99 | float | Silver - Grade Estimate (Ounces per Ton) |
| ag_flag | 0 | byte | Silver - Estimation Flag |
| ag_ndh | 0 | byte | Silver - Number Drill Holes |
| ag_dist | 0 | float | Silver - Average Distance to Samples |
| ag_ns | 0 | byte | Silver - Number of Samples |
| ag_opt_nn | -99 | float | Silver - Nearest Neighbor (Ounces per Ton) |
| ag_nn_dist | 0 | float | Distance to nearest sample |
| aueq | -99 | double | Gold Equivalence (Ounces per Ton) |
| agau | -99 | double | Silver:Gold Ratio |
| au_ind | -99 | float | Gold Indicator (Probability) |
| au_ind_flag | 0 | byte | Gold Indicator - Estimation Flag |
| au_ore shoot | waste | name | Gold Ore shoot (ore/waste) |
| ag_ind | -99 | float | Silver Indicator (Probability) |
| ag_ind_flag | 0 | byte | Silver Indicator - Estimation Flag |
| ag_ore shoot | waste | name | Silver Ore shoot (ore/waste) |
| mindex | -99 | float | Minability Index (3,2,1,0) |
| void_pct | -99 | float | Estimated Percentage of Void (0-100%) |
| density_void_adj | -99 | float | Density Adjusted for Voids |
| aueng | 0 | float | Au Engineering |
| ageng | 0 | float | Ag Engineering |
| aueqeng | 0 | float | AuEq Engineering |
| thick | 0 | float | Vein Thickness |
| mine_thick | 0 | float | Mining Thickness |
| gradethick | 0 | float | Grade Thickness |
| aueqgt | -99 | float | AuEq Grade Thickness (opt per ft) |
| mine_tons | 0 | float | Mined Tons |
| Practical Mining LLC | February 5, 2018 |
| Page 178 | Mineral Resource Estimates | Klondex Mines Ltd. |
| Variables | Default | Type | Description |
| plan_dil | 0 | float | Planned Dilution |
| aueq_dil | 0 | float | Diluted AuEq |
| matl | none | name | Material Type |
| classname | none | name | Classification (meas, ind, inf) |
| depth | 0 | float | Depth from Topography Surface (ft) |
| litho | 0 | byte | Lithology (1=and,2=tfup,3=bst,4=tflo) |
| dike | 0 | byte | Dike domain flag (1=dike,0=none) |
| domain | none | name | Low-grade domain (and,tfup,bst,tflo,dikes,vein) |
| mined_ug | insitu | name | Mined UG veins (insitu,sterile,mined,mplan) |
| mined | 0 | float | Mined Out Pit by topo surface and UG |
| rqdpct | -99 | float | RQD percentage - ID5 estimated |
| oretype | 0 | byte | Ore type (1=oxide,2=tran,3=sulf) |
For the open pit optimization, a second block model was created where the original main sub-blocked model was regularized to a regular parent block size of 20-foot by 10-foot by 20-foot. Prior to the regularization process, metal associated with the underground reported resource was removed entirely so that the pit optimization process would only run on material not reported in the underground resource.
| 14.9. | Grade Estimation |
For the modelled veins, Gold and silver values were estimated using the Inverse Distance Cubed (ID3) method. Due to the nature of the low-grade disseminated material, the Ordinary Kriging (OK) method was chosen. The estimation methods were both applied in multiple passes, defining the extents and parameters specific to estimating measured, indicated and inferred classifications.
For vein estimates, channel composites were only used in the estimation of the measured pass, which used a search ellipsoid of 40 feet by 40 feet by 20 feet. Due to the use of ID3, cell declustering was run on the composites and this weighting was used in the estimate so that individual closely spaced channel data would be weighted lower relative to individual drill hole intercepts that supported larger volumes. These techniques, along with the capping strategy, limit the range of influence of the high-grade channel sample composites.
Anisotropic search parameters for gold and silver were aligned to the local dip direction and dip of each vein block as assigned during the creation of the block model. Search distances were tailored to the expected spacing of sample composites intercepting the vein models for each estimation pass. The vein’s gold and silver grades were estimated only using composites from within the vein model. The boundary separating the veins and low-grade blocks is regarded as a hard contact with the data in each isolated from the other.
| Practical Mining LLC | February 5, 2018 |
| Klondex Mines Ltd. | Technical Report for the Fire Creek Project, | Page 179 |
| Lander County, Nevada |
For disseminated mineralization estimates, only drill hole composites outside of the veins were used. The size of the search ellipsoid for the measured pass was 40 feet by 40 feet by 40 feet. For the indicated and inferred passes, anisotropic search parameters for gold were set to the average orientation of the mineralization in each lithological domain, The major directions were set as 100 feet for indicated and 300 feet for inferred. Semi and Minor ellipsoid dimensions were set in proportion to the anisotropy of each domain.
Based on the results of contact analysis, boundaries separating lithological domains were regarded as firm contacts but with a soft contact to samples within 40 feet of the block to be estimated. Dikes were treated with hard contacts to all other lithologies.
The estimation search parameters for both the vein and disseminated mineralization are shown in Table 14-16. The search ellipse orientations were orientated to the vein orientations outlined in Table 14-3.
Table 14-16 Estimation Search Parameters by Resource Category
| Parent | Major | Semi | Minor | Min | Max | Sample Spacing | ||||
| Pass | X | Y | Z | (ft) | (ft) | (ft) | Samp | Samp | ||
| Veins Disseminated |
Measured |
10 | 5 | 5 | 40 | 40 | 20 | 4 | 9 | Underground channels typically 10’ x 50’ |
| Indicated | 25 | 25 | 25 | 100 | 100 | 50 | 3 | 7 | Infill Drilling typically 50’ x 50’ | |
| Inferred | 50 | 50 | 50 | 300 | 300 | 150 | 2 | 7 | Exploration Drilling typically 150’ x 150’ | |
| Measured | 5 | 20 | 20 | 40 | 40 | 40 | 8 | 12 | Underground Infill Drilling within 40’ | |
| Indicated | 20 | 20 | 20 | 100 | 71 | 53 | 6 | 12 | Infill Drilling typically 50’ x 50’ | |
| Inferred | 20 | 20 | 20 | 300 | 213 | 159 | 5 | 12 | Exploration Drilling typically 150’ x 150’ |
Significant parameters used in the gold and silver estimations included:
| 1. | Assignment of parent block values to sub-blocks. This ensured the grade tonnage curve of the material estimated matched the support of the drill spacing informing the estimate; |
|
| 2. | Only composites with a value greater than zero were used; |
|
| 3. | A minimum of four and maximum of 12 samples were used to estimate measured blocks, a minimum of three and maximum of 12 to estimate indicated blocks, and minimum of two and maximum of 12 to estimate inferred blocks; |
|
| 4. | Composites were selected using anisotropic distances; |
| Practical Mining LLC | February 5, 2018 |
| Page 180 | Mineral Resource Estimates | Klondex Mines Ltd. |
| 5. | Only composites within the veins were used to estimate blocks within the veins. Estimation of ore shoot identified blocks could use samples on the vein both within the ore shoot and outside of the ore shoot. Estimation of the blocks identified as being outside an ore shoot could only use samples identified as outside the ore shoot. |
|
|
||
| 6. | Grades were capped (channel defined high yield search restriction and top cut) for measured material; |
|
|
||
| 7. | Grades were capped with a drill hole defined top cut for indicated and inferred material; and |
|
|
||
| 8. | Gold and silver for blocks outside vein solids were estimated separately to model low-grade mineralization. |
| 14.9.1. | Void Percentage |
A number of veins encountered within the mine contain open voids within the modelled vein volume. Of most note is the Joyce Vein. Due to it being an extensional vein, locally there can be significant void space. Voids within the veins are generally highly irregular, and the tonnage and metal must be adjusted as a geological loss. To account for the available information, void percentage has been assigned to the block model by two methods;
| 1. | In measured areas (those areas supported by underground channels), direct measurement of the percentage of void in the vein has been measured from the underground face mapping. The percentage of void is assigned to each vein channel sample by the underground ore control geologist. This percentage is estimated into the vein blocks to model the expected loss to voids of the vein material (see image below), and; |
|
|
||
| 2. | In indicated and inferred areas (those areas supported by drilling only) the percentage of void is not measureable numerically or spatially. To account for the expected void loss, the average void percentage of mined areas for each of the active veins is assigned. This accounts for the expected tonnage and metal adjustments as a global factor. Future silling will define the spatial component of the voids and their impact on local areas. |
A void adjusted density variable was calculated by using the following calculation –
| • | density_void_adj = density * (100 - void_pct) / 100 |
The void adjusted density variable is used for all resource and reserve tonnage and metal calculations to ensure voids are accounted for in reporting (Figure 14-29).
| Practical Mining LLC | February 5, 2018 |
| Klondex Mines Ltd. | Technical Report for the Fire Creek Project, | Page 181 |
| Lander County, Nevada |

| 14.9.2. | Minability Index |
To aid mine grade control, a “minability index” was assigned to vein intercepts in core holes. The minability index represents a vein quality designation to identify better quality vein intersections that represent reduced risk for mining. The actual grade of the intercepts do not impact the assignment of the minability index value, only vein quality as determined from the core photos define the index value assigned. No minability index was assigned to channel samples. Quality ranks between “0” and “3”, with a 3 being the highest quality designation. In addition to these designations, the code “-99” represents core holes for which no core photos exist. In this situation no minability index was definable. A code of “RC” is applied for samples drilled using the reverse circulation method as only sample chips are recovered and therefore vein quality cannot be determined. The minability index was assigned for each vein to the block model through a simple nearest neighbor designation (Figure 14-30).
| Practical Mining LLC | February 5, 2018 |
| Page 182 | Mineral Resource Estimates | Klondex Mines Ltd. |

Where minability indices are similar, the drill holes indicate that most likely the vein development is consistent. Where the minability indices vary between holes, the drill holes indicate that the vein thickness most likely varies significantly along strike and ore shoot development may be highly variable.
The minability indices for the main veins are shown in Figure 14-31 through Figure 14-34. The Vonnie Vein dominantly displays index values of 1 and 2. The minability index indicates a vein thickness that is typically narrow but continuous. This matches mining that has occurred on the vein to date – Vonnie Vein is a narrow but continuous and high-grade vein in which narrow mining techniques are required to maximize the grade mined. Joyce Vein typically displays index values between one and three. The vein thickness varies significantly and rapidly along the vein length. This is consistent with mining to date where the vein varies rapidly coming in and out of high-grade ore shoots. Karen Veins main ore shoot represents the best developed vein with index values typically between two and three. This is consistent with mining of that shoot where the vein has generally been relatively wide and continuous.
| Practical Mining LLC | February 5, 2018 |
| Klondex Mines Ltd. | Technical Report for the Fire Creek Project, | Page 183 |
| Lander County, Nevada |

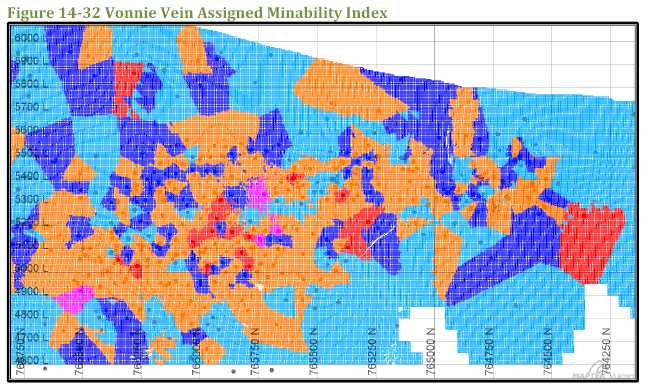
| Practical Mining LLC | February 5, 2018 |
| Page 184 | Mineral Resource Estimates | Klondex Mines Ltd. |


| Practical Mining LLC | February 5, 2018 |
| Klondex Mines Ltd. | Technical Report for the Fire Creek Project, | Page 185 |
| Lander County, Nevada |
| 14.10. | Mined Depletion and Sterilization |
The vein blocks were depleted by the as-built survey of the underground workings. Blocks within the survey were flagged as “mined”. The grades and the density within the flagged blocks remain intact in order to reconcile with mining.
The Joyce Vein, Vonnie Vein, Karen Vein, and Hui Wu Vein are the main veins that have been mined as of the effective date of this report. In Figure 14-35 through Figure 14-37 the estimated grade blocks are shown in blue, depleted blocks are shown in red, and sterilized blocks are shown in orange for each vein.

| Practical Mining LLC | February 5, 2018 |
| Page 186 | Mineral Resource Estimates | Klondex Mines Ltd. |

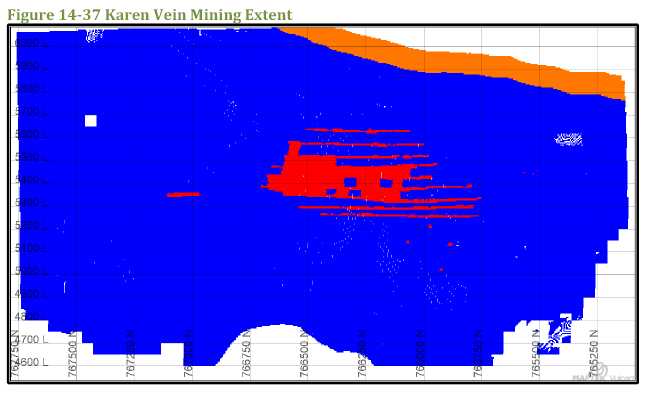
The low-grade disseminated mineralization is considered potentially economic as open pit mineral resources outside of the reported underground mineral resources. Therefore, for reporting of the open pit resource, additional depletion was undertaken to remove all vein material reported to the underground mineral resource. However, where vein was not reported to the underground resources, it was considered available for potential open pit resources. Figure 14-38 shows the Joyce Vein flagged as mined out, in red color for blocks reported to the underground resource. The blue vein blocks remain available for open pit resources. The arrow identifies the 100-foot “sterile” zone defined for the underground resource that also is available for open pit resources.
| Practical Mining LLC | February 5, 2018 |
| Klondex Mines Ltd. | Technical Report for the Fire Creek Project, | Page 187 |
| Lander County, Nevada |

| 14.11. | Model Validation |
The mean gold grades for each vein were compared against a nearest neighbor (representing declustered composites) in Table 14-17. Individual vein comparisons vary depending on sample support and grade variability. The main contributing veins (Vonnie, Joyce, Karen, and Hui Wu) all contain a slightly lower mean grade in the ID3 estimate, this is consistent with the overall result of the estimates which combined are 6.9% lower in grade than the nearest neighbor at 0.151 opt vs 0.163 opt. This lower overall grade is expected, due to grade capping and the effect of the sample sharing at the ore shoot contacts. Most major differences are seen in low-grade veins. Table 14-18 represents the same data for silver which shows the same general relationships with a combined 3.8% lower overall grade at 0.213 opt vs 0.222 opt.
| Practical Mining LLC | February 5, 2018 |
| Page 188 | Mineral Resource Estimates | Klondex Mines Ltd. |
Table 14-17 Estimate Comparison for Gold versus a Nearest Neighbor at 0 Cutoff
Vein |
ID3 Estimate | Nearest Neighbor | Mean Diff |
||||||||||
| Min | Q1 | Q3 | Max | Mean | St.Dev | Min | Q1 | Q3 | Max | Mean | St.Dev | ||
| VJ1 | 0.001 | 0.003 | 0.122 | 178.233 | 0.490 | 3.082 | 0.001 | 0.001 | 0.111 | 200.000 | 0.512 | 4.793 | -4.4% |
| VJ2 | 0.001 | 0.002 | 0.075 | 30.581 | 0.178 | 0.785 | 0.001 | 0.001 | 0.075 | 40.000 | 0.208 | 1.268 | -14.2% |
| VJ3 | 0.001 | 0.002 | 0.054 | 9.719 | 0.092 | 0.384 | 0.001 | 0.001 | 0.043 | 10.000 | 0.102 | 0.521 | -10.1% |
| VK1 | 0.001 | 0.004 | 0.174 | 69.459 | 0.444 | 2.025 | 0.001 | 0.002 | 0.129 | 90.000 | 0.469 | 2.749 | -5.3% |
| VK2 | 0.001 | 0.004 | 0.117 | 47.007 | 0.311 | 1.808 | 0.001 | 0.001 | 0.127 | 60.000 | 0.340 | 2.609 | -8.5% |
| VK3 | 0.001 | 0.002 | 0.148 | 13.314 | 0.169 | 0.564 | 0.001 | 0.001 | 0.108 | 15.000 | 0.174 | 0.777 | -2.8% |
| VV1 | 0.001 | 0.001 | 0.044 | 228.109 | 0.585 | 5.513 | 0.001 | 0.001 | 0.035 | 300.000 | 0.621 | 7.892 | -5.8% |
| VV2 | 0.001 | 0.002 | 0.042 | 73.903 | 0.125 | 1.439 | 0.001 | 0.001 | 0.038 | 80.000 | 0.130 | 1.952 | -4.1% |
| VV3 | 0.001 | 0.015 | 0.079 | 22.669 | 0.116 | 0.686 | 0.001 | 0.002 | 0.056 | 40.000 | 0.138 | 1.363 | -15.5% |
| V05A | 0.001 | 0.002 | 0.012 | 2.815 | 0.019 | 0.078 | 0.001 | 0.001 | 0.011 | 4.000 | 0.024 | 0.143 | -21.1% |
| V05B | 0.001 | 0.002 | 0.003 | 0.026 | 0.003 | 0.003 | 0.001 | 0.001 | 0.001 | 0.026 | 0.002 | 0.004 | 22.8% |
| V06A | 0.001 | 0.004 | 0.068 | 1.563 | 0.102 | 0.229 | 0.001 | 0.001 | 0.089 | 1.598 | 0.107 | 0.293 | -5.0% |
| V06B | 0.001 | 0.004 | 0.039 | 1.494 | 0.224 | 0.446 | 0.001 | 0.001 | 0.045 | 1.507 | 0.297 | 0.587 | -24.6% |
| V07 | 0.001 | 0.002 | 0.015 | 2.298 | 0.026 | 0.125 | 0.001 | 0.001 | 0.009 | 2.633 | 0.034 | 0.211 | -24.5% |
| V08A | 0.001 | 0.001 | 0.031 | 2.545 | 0.033 | 0.113 | 0.001 | 0.001 | 0.018 | 2.668 | 0.035 | 0.140 | -4.0% |
| V08B | 0.001 | 0.001 | 0.013 | 0.969 | 0.028 | 0.078 | 0.001 | 0.001 | 0.011 | 1.082 | 0.034 | 0.113 | -18.0% |
| V09A | 0.001 | 0.001 | 0.026 | 3.988 | 0.065 | 0.264 | 0.001 | 0.001 | 0.008 | 4.000 | 0.069 | 0.323 | -6.6% |
| V09B | 0.001 | 0.001 | 0.136 | 0.610 | 0.085 | 0.124 | 0.001 | 0.001 | 0.145 | 0.846 | 0.098 | 0.164 | -13.6% |
| V12 | 0.001 | 0.005 | 0.047 | 2.769 | 0.061 | 0.210 | 0.001 | 0.002 | 0.041 | 2.885 | 0.065 | 0.277 | -6.1% |
| V13A | 0.001 | 0.006 | 0.092 | 2.722 | 0.134 | 0.343 | 0.001 | 0.004 | 0.082 | 4.000 | 0.144 | 0.482 | -6.8% |
| V13B | 0.002 | 0.021 | 0.168 | 1.576 | 0.131 | 0.183 | 0.001 | 0.006 | 0.159 | 4.000 | 0.145 | 0.338 | -9.9% |
| V14A | 0.002 | 0.011 | 0.030 | 10.141 | 0.170 | 0.594 | 0.001 | 0.010 | 0.026 | 15.000 | 0.236 | 1.029 | -28.3% |
| V14B | 0.002 | 0.008 | 0.022 | 3.848 | 0.071 | 0.173 | 0.001 | 0.006 | 0.024 | 10.000 | 0.082 | 0.233 | -13.8% |
| V15A | 0.001 | 0.001 | 0.011 | 1.044 | 0.027 | 0.084 | 0.001 | 0.001 | 0.003 | 1.056 | 0.029 | 0.109 | -7.4% |
| V15B | 0.001 | 0.001 | 0.066 | 0.242 | 0.041 | 0.052 | 0.001 | 0.001 | 0.013 | 0.242 | 0.027 | 0.054 | 48.4% |
| V16A | 0.001 | 0.029 | 0.160 | 0.407 | 0.100 | 0.077 | 0.001 | 0.015 | 0.162 | 0.408 | 0.103 | 0.092 | -2.9% |
| V16B | 0.001 | 0.121 | 0.401 | 2.111 | 0.380 | 0.436 | 0.001 | 0.107 | 0.566 | 2.112 | 0.394 | 0.536 | -3.6% |
| V18A | 0.001 | 0.004 | 0.039 | 3.475 | 0.078 | 0.238 | 0.001 | 0.002 | 0.021 | 4.000 | 0.092 | 0.374 | -15.1% |
| V18B | 0.001 | 0.004 | 0.022 | 3.770 | 0.119 | 0.380 | 0.001 | 0.003 | 0.017 | 4.000 | 0.167 | 0.561 | -28.7% |
| V19 | 0.001 | 0.003 | 0.024 | 1.755 | 0.041 | 0.110 | 0.001 | 0.001 | 0.023 | 2.000 | 0.040 | 0.126 | 2.3% |
| V20A | 0.001 | 0.002 | 0.042 | 8.632 | 0.088 | 0.280 | 0.001 | 0.001 | 0.027 | 10.000 | 0.102 | 0.426 | -13.3% |
| V20B | 0.001 | 0.002 | 0.093 | 3.754 | 0.093 | 0.183 | 0.001 | 0.002 | 0.048 | 4.000 | 0.103 | 0.245 | -10.4% |
| V20C | 0.001 | 0.003 | 0.148 | 0.974 | 0.105 | 0.187 | 0.001 | 0.001 | 0.126 | 2.353 | 0.125 | 0.258 | -16.6% |
| V21A | 0.001 | 0.002 | 0.025 | 2.240 | 0.033 | 0.083 | 0.001 | 0.001 | 0.015 | 3.617 | 0.036 | 0.123 | -9.0% |
| V21B | 0.001 | 0.002 | 0.040 | 1.504 | 0.046 | 0.127 | 0.001 | 0.001 | 0.025 | 1.966 | 0.033 | 0.101 | 39.7% |
| V22A | 0.003 | 0.023 | 0.072 | 1.346 | 0.164 | 0.288 | 0.001 | 0.007 | 0.071 | 1.894 | 0.143 | 0.409 | 14.9% |
| V22B | 0.001 | 0.039 | 0.197 | 0.236 | 0.120 | 0.082 | 0.001 | 0.034 | 0.194 | 0.236 | 0.126 | 0.092 | -4.8% |
| V23 | 0.001 | 0.007 | 0.150 | 1.382 | 0.133 | 0.239 | 0.001 | 0.001 | 0.158 | 1.383 | 0.140 | 0.286 | -5.4% |
| V24 | 0.001 | 0.016 | 0.559 | 3.912 | 0.441 | 0.638 | 0.001 | 0.001 | 0.315 | 4.000 | 0.442 | 0.858 | -0.3% |
| Practical Mining LLC | February 5, 2018 |
| Klondex Mines Ltd. | Technical Report for the Fire Creek Project, | Page 189 |
| Lander County, Nevada |
Vein |
ID3 Estimate | Nearest Neighbor | Mean Diff |
||||||||||
| Min | Q1 | Q3 | Max | Mean | St.Dev | Min | Q1 | Q3 | Max | Mean | St.Dev | ||
| V25 | 0.001 | 0.013 | 0.213 | 3.889 | 0.229 | 0.536 | 0.001 | 0.001 | 0.179 | 4.000 | 0.223 | 0.719 | 2.7% |
| V26 | 0.001 | 0.009 | 0.191 | 1.150 | 0.145 | 0.186 | 0.001 | 0.002 | 0.201 | 1.167 | 0.149 | 0.239 | -2.2% |
| V27 | 0.001 | 0.007 | 0.121 | 0.845 | 0.075 | 0.111 | 0.001 | 0.001 | 0.152 | 0.897 | 0.082 | 0.157 | -8.6% |
| V28 | 0.001 | 0.035 | 0.188 | 0.888 | 0.139 | 0.172 | 0.001 | 0.005 | 0.217 | 0.904 | 0.169 | 0.255 | -17.9% |
| V29 | 0.001 | 0.005 | 0.140 | 0.303 | 0.079 | 0.088 | 0.001 | 0.001 | 0.147 | 0.303 | 0.090 | 0.117 | -11.7% |
| V30 | 0.001 | 0.095 | 0.335 | 1.255 | 0.259 | 0.261 | 0.001 | 0.073 | 0.363 | 1.281 | 0.261 | 0.334 | -1.0% |
| V31A | 0.001 | 0.002 | 0.023 | 3.365 | 0.048 | 0.174 | 0.001 | 0.001 | 0.016 | 4.000 | 0.057 | 0.284 | -16.2% |
| V31B | 0.001 | 0.003 | 0.036 | 3.743 | 0.067 | 0.231 | 0.001 | 0.001 | 0.022 | 3.879 | 0.077 | 0.333 | -13.4% |
| V32 | 0.001 | 0.025 | 0.116 | 0.326 | 0.087 | 0.075 | 0.001 | 0.009 | 0.118 | 0.332 | 0.112 | 0.128 | -22.7% |
| V36A | 0.001 | 0.002 | 0.026 | 1.890 | 0.048 | 0.140 | 0.001 | 0.001 | 0.022 | 3.442 | 0.052 | 0.182 | -8.5% |
| V36B | 0.001 | 0.003 | 0.052 | 3.112 | 0.061 | 0.141 | 0.001 | 0.001 | 0.040 | 4.000 | 0.067 | 0.183 | -8.6% |
| V37A | 0.001 | 0.002 | 0.019 | 2.637 | 0.026 | 0.101 | 0.001 | 0.002 | 0.012 | 4.000 | 0.034 | 0.165 | -22.3% |
| V37B | 0.001 | 0.003 | 0.015 | 3.701 | 0.061 | 0.268 | 0.001 | 0.002 | 0.010 | 4.000 | 0.095 | 0.500 | -35.3% |
| V38A | 0.001 | 0.004 | 0.035 | 0.270 | 0.031 | 0.046 | 0.001 | 0.002 | 0.030 | 0.805 | 0.033 | 0.068 | -5.4% |
| V38B | 0.001 | 0.008 | 0.049 | 0.281 | 0.046 | 0.057 | 0.001 | 0.002 | 0.057 | 0.473 | 0.044 | 0.067 | 3.8% |
| V39A | 0.001 | 0.006 | 0.052 | 3.421 | 0.065 | 0.221 | 0.001 | 0.002 | 0.050 | 3.559 | 0.078 | 0.316 | -16.6% |
| V39B | 0.001 | 0.005 | 0.031 | 3.088 | 0.057 | 0.208 | 0.001 | 0.002 | 0.023 | 3.103 | 0.060 | 0.254 | -4.0% |
| V40A | 0.001 | 0.004 | 0.020 | 1.661 | 0.035 | 0.119 | 0.001 | 0.003 | 0.019 | 1.698 | 0.040 | 0.161 | -11.3% |
| V40B | 0.001 | 0.004 | 0.021 | 1.647 | 0.040 | 0.123 | 0.001 | 0.002 | 0.017 | 4.000 | 0.053 | 0.255 | -23.9% |
| V41A | 0.001 | 0.001 | 0.016 | 0.534 | 0.025 | 0.067 | 0.001 | 0.001 | 0.008 | 0.828 | 0.028 | 0.084 | -10.1% |
| V41B | 0.001 | 0.001 | 0.036 | 0.518 | 0.027 | 0.050 | 0.001 | 0.001 | 0.020 | 0.550 | 0.028 | 0.066 | -4.0% |
| V42 | 0.001 | 0.001 | 0.017 | 0.915 | 0.022 | 0.061 | 0.001 | 0.001 | 0.016 | 0.922 | 0.025 | 0.077 | -11.1% |
| V44A | 0.001 | 0.008 | 0.060 | 1.528 | 0.048 | 0.088 | 0.001 | 0.004 | 0.060 | 4.000 | 0.062 | 0.158 | -22.2% |
| V44B | 0.001 | 0.005 | 0.022 | 0.064 | 0.018 | 0.017 | 0.001 | 0.003 | 0.023 | 0.066 | 0.018 | 0.021 | 0.6% |
| V45A | 0.001 | 0.025 | 0.140 | 0.495 | 0.100 | 0.088 | 0.001 | 0.012 | 0.142 | 0.519 | 0.101 | 0.112 | -1.4% |
| V45B | 0.012 | 0.107 | 0.170 | 0.234 | 0.133 | 0.052 | 0.001 | 0.100 | 0.221 | 0.236 | 0.133 | 0.069 | 0.2% |
| V46 | 0.001 | 0.002 | 0.017 | 1.978 | 0.022 | 0.105 | 0.001 | 0.002 | 0.011 | 2.347 | 0.028 | 0.178 | -18.9% |
| V51A | 0.001 | 0.004 | 0.043 | 0.812 | 0.055 | 0.114 | 0.001 | 0.001 | 0.090 | 1.122 | 0.065 | 0.173 | -15.2% |
| V51B | 0.001 | 0.004 | 0.025 | 1.251 | 0.089 | 0.223 | 0.001 | 0.001 | 0.033 | 1.665 | 0.114 | 0.321 | -21.9% |
| V55 | 0.001 | 0.009 | 0.057 | 1.324 | 0.120 | 0.263 | 0.001 | 0.001 | 0.057 | 1.838 | 0.133 | 0.318 | -10.0% |
| V56 | 0.001 | 0.001 | 0.008 | 3.848 | 0.024 | 0.178 | 0.001 | 0.001 | 0.007 | 4.000 | 0.032 | 0.246 | -23.9% |
| V58A | 0.001 | 0.002 | 0.021 | 3.961 | 0.070 | 0.320 | 0.001 | 0.002 | 0.014 | 4.000 | 0.080 | 0.422 | -12.7% |
| V58B | 0.006 | 0.036 | 0.191 | 0.931 | 0.186 | 0.196 | 0.001 | 0.036 | 0.197 | 0.934 | 0.193 | 0.261 | -3.6% |
| V59A | 0.001 | 0.002 | 0.028 | 3.873 | 0.041 | 0.142 | 0.001 | 0.001 | 0.015 | 4.000 | 0.044 | 0.180 | -8.0% |
| V59B | 0.001 | 0.019 | 0.401 | 3.976 | 0.327 | 0.584 | 0.001 | 0.009 | 0.299 | 4.000 | 0.348 | 0.918 | -5.9% |
| V60A | 0.001 | 0.003 | 0.127 | 0.984 | 0.087 | 0.145 | 0.001 | 0.001 | 0.122 | 1.137 | 0.093 | 0.184 | -7.2% |
| V60B | 0.001 | 0.005 | 0.138 | 0.499 | 0.077 | 0.089 | 0.001 | 0.001 | 0.157 | 0.547 | 0.084 | 0.126 | -8.0% |
| V61A | 0.001 | 0.003 | 0.073 | 1.963 | 0.066 | 0.154 | 0.001 | 0.001 | 0.064 | 2.269 | 0.069 | 0.217 | -4.8% |
| V61B | 0.001 | 0.008 | 0.132 | 0.897 | 0.096 | 0.148 | 0.001 | 0.002 | 0.130 | 0.901 | 0.100 | 0.194 | -3.8% |
| V63A | 0.001 | 0.005 | 0.075 | 1.790 | 0.088 | 0.220 | 0.001 | 0.001 | 0.101 | 1.806 | 0.082 | 0.252 | 7.5% |
| Practical Mining LLC | February 5, 2018 |
| Page 190 | Mineral Resource Estimates | Klondex Mines Ltd. |
Vein |
ID3 Estimate | Nearest Neighbor | Mean Diff |
||||||||||
| Min | Q1 | Q3 | Max | Mean | St.Dev | Min | Q1 | Q3 | Max | Mean | St.Dev | ||
| V63B | 0.001 | 0.004 | 0.059 | 0.607 | 0.048 | 0.076 | 0.001 | 0.001 | 0.069 | 1.338 | 0.049 | 0.107 | -2.8% |
| V64A | 0.001 | 0.003 | 0.033 | 1.022 | 0.035 | 0.078 | 0.001 | 0.002 | 0.041 | 1.084 | 0.037 | 0.093 | -6.8% |
| V64B | 0.001 | 0.002 | 0.031 | 1.200 | 0.040 | 0.123 | 0.001 | 0.001 | 0.026 | 1.247 | 0.045 | 0.168 | -10.6% |
| V65 | 0.001 | 0.006 | 0.122 | 0.294 | 0.069 | 0.090 | 0.001 | 0.003 | 0.042 | 0.296 | 0.079 | 0.117 | -12.9% |
| V66A | 0.002 | 0.087 | 0.292 | 0.960 | 0.234 | 0.196 | 0.001 | 0.092 | 0.263 | 0.966 | 0.248 | 0.280 | -5.6% |
| V66B | 0.125 | 0.235 | 0.341 | 0.368 | 0.282 | 0.074 | 0.001 | 0.186 | 0.368 | 0.368 | 0.283 | 0.094 | -0.3% |
| V67A | 0.001 | 0.127 | 0.252 | 0.47 | 0.188 | 0.105 | 0.001 | 0.098 | 0.281 | 0.47 | 0.190 | 0.138 | -1.2% |
| V67B | 0.001 | 0.027 | 0.680 | 2.15 | 0.479 | 0.499 | 0.001 | 0.027 | 0.752 | 2.15 | 0.528 | 0.658 | -9.5% |
| V68A | 0.001 | 0.012 | 0.154 | 1.152 | 0.096 | 0.116 | 0.001 | 0.002 | 0.173 | 1.281 | 0.094 | 0.144 | 2.4% |
| V68B | 0.001 | 0.032 | 0.236 | 0.706 | 0.165 | 0.159 | 0.001 | 0.003 | 0.186 | 0.735 | 0.161 | 0.212 | 2.5% |
| V69A | 0.001 | 0.016 | 0.353 | 1.599 | 0.269 | 0.380 | 0.001 | 0.007 | 0.282 | 1.604 | 0.339 | 0.567 | -20.5% |
| V69B | 0.001 | 0.049 | 0.205 | 0.904 | 0.135 | 0.119 | 0.001 | 0.049 | 0.162 | 0.960 | 0.112 | 0.126 | 20.1% |
| V70A | 0.001 | 0.021 | 0.258 | 0.481 | 0.185 | 0.130 | 0.001 | 0.001 | 0.369 | 0.494 | 0.203 | 0.174 | -9.0% |
| V70B | 0.001 | 0.035 | 0.155 | 0.245 | 0.105 | 0.066 | 0.001 | 0.001 | 0.174 | 0.249 | 0.105 | 0.088 | -0.5% |
| V72A | 0.001 | 0.005 | 0.089 | 0.93 | 0.139 | 0.234 | 0.001 | 0.002 | 0.095 | 0.95 | 0.174 | 0.324 | -20.1% |
| V72B | 0.001 | 0.018 | 0.159 | 0.23 | 0.092 | 0.076 | 0.001 | 0.001 | 0.228 | 0.23 | 0.107 | 0.101 | -13.6% |
| V73A | 0.001 | 0.025 | 0.249 | 3.02 | 0.467 | 0.833 | 0.001 | 0.001 | 0.189 | 4.00 | 0.499 | 1.133 | -6.4% |
| V73B | 0.001 | 0.009 | 0.610 | 2.02 | 0.413 | 0.580 | 0.001 | 0.001 | 0.240 | 2.03 | 0.447 | 0.761 | -7.7% |
| V73C | 0.001 | 0.014 | 0.160 | 0.62 | 0.130 | 0.169 | 0.001 | 0.001 | 0.171 | 0.62 | 0.136 | 0.203 | -4.5% |
| V74A | 0.001 | 0.041 | 0.087 | 0.12 | 0.063 | 0.031 | 0.001 | 0.035 | 0.102 | 0.12 | 0.063 | 0.044 | -0.7% |
| V74B | 0.001 | 0.031 | 0.153 | 0.18 | 0.091 | 0.061 | 0.001 | 0.001 | 0.179 | 0.18 | 0.094 | 0.073 | -2.4% |
| All Veins | 0.151 | 0.163 | -6.9% | ||||||||||
Table 14-18 Estimate Comparison for Silver Versus a Nearest Neighbor at 0 Cutoff
Vein |
ID3 Estimate | Nearest Neighbor | Mean Diff |
||||||||||
| Min | Q1 | Q3 | Max | Mean | St.Dev | Min | Q1 | Q3 | Max | Mean | St.Dev | ||
| VJ1 | 0.001 | 0.011 | 0.312 | 91.437 | 0.582 | 2.218 | 0.001 | 0.007 | 0.222 | 100.000 | 0.626 | 3.414 | -6.9% |
| VJ2 | 0.002 | 0.010 | 0.216 | 39.724 | 0.240 | 0.747 | 0.001 | 0.007 | 0.155 | 50.000 | 0.276 | 1.367 | -12.9% |
| VJ3 | 0.001 | 0.010 | 0.170 | 9.499 | 0.179 | 0.431 | 0.001 | 0.007 | 0.146 | 10.000 | 0.191 | 0.594 | -6.3% |
| VK1 | 0.001 | 0.013 | 0.174 | 238.668 | 0.588 | 4.882 | 0.001 | 0.007 | 0.125 | 300.000 | 0.607 | 7.475 | -3.0% |
| VK2 | 0.002 | 0.007 | 0.157 | 78.430 | 0.210 | 1.575 | 0.001 | 0.007 | 0.100 | 90.000 | 0.215 | 2.470 | -2.2% |
| VK3 | 0.001 | 0.035 | 0.239 | 22.154 | 0.197 | 0.706 | 0.001 | 0.016 | 0.298 | 40.000 | 0.219 | 1.389 | -9.9% |
| VV1 | 0.001 | 0.051 | 0.288 | 85.760 | 0.519 | 2.068 | 0.001 | 0.020 | 0.204 | 90.000 | 0.504 | 2.759 | 3.0% |
| VV2 | 0.002 | 0.028 | 0.178 | 55.377 | 0.354 | 1.737 | 0.001 | 0.007 | 0.146 | 60.000 | 0.364 | 2.375 | -2.9% |
| VV3 | 0.001 | 0.010 | 0.233 | 14.937 | 0.255 | 0.623 | 0.001 | 0.007 | 0.175 | 15.000 | 0.279 | 0.941 | -8.7% |
| V05A | 0.003 | 0.063 | 0.103 | 1.055 | 0.094 | 0.075 | 0.001 | 0.026 | 0.100 | 1.561 | 0.094 | 0.107 | 0.3% |
| V05B | 0.003 | 0.057 | 0.073 | 0.159 | 0.063 | 0.020 | 0.001 | 0.009 | 0.073 | 0.200 | 0.049 | 0.042 | 30.0% |
| V06A | 0.003 | 0.009 | 0.326 | 3.383 | 0.220 | 0.398 | 0.001 | 0.007 | 0.241 | 4.000 | 0.226 | 0.491 | -2.9% |
| Practical Mining LLC | February 5, 2018 |
| Klondex Mines Ltd. | Technical Report for the Fire Creek Project, | Page 191 |
| Lander County, Nevada |
Vein |
ID3 Estimate | Nearest Neighbor | Mean Diff |
||||||||||
| Min | Q1 | Q3 | Max | Mean | St.Dev | Min | Q1 | Q3 | Max | Mean | St.Dev | ||
| V06B | 0.007 | 0.012 | 0.132 | 1.229 | 0.204 | 0.363 | 0.007 | 0.007 | 0.134 | 1.240 | 0.265 | 0.478 | -22.9% |
| V07 | 0.001 | 0.012 | 0.095 | 1.680 | 0.073 | 0.118 | 0.001 | 0.007 | 0.100 | 2.217 | 0.078 | 0.209 | -6.9% |
| V08A | 0.001 | 0.010 | 0.099 | 3.417 | 0.096 | 0.190 | 0.001 | 0.007 | 0.100 | 4.000 | 0.101 | 0.258 | -4.3% |
| V08B | 0.001 | 0.028 | 0.135 | 1.622 | 0.111 | 0.150 | 0.001 | 0.007 | 0.129 | 1.809 | 0.120 | 0.217 | -7.6% |
| V09A | 0.001 | 0.007 | 0.069 | 2.472 | 0.078 | 0.199 | 0.001 | 0.003 | 0.073 | 2.479 | 0.072 | 0.220 | 7.5% |
| V09B | 0.001 | 0.006 | 0.203 | 0.843 | 0.127 | 0.169 | 0.001 | 0.007 | 0.152 | 0.846 | 0.129 | 0.218 | -1.8% |
| V12 | 0.003 | 0.048 | 0.145 | 1.232 | 0.122 | 0.131 | 0.001 | 0.015 | 0.200 | 3.500 | 0.135 | 0.191 | -10.1% |
| V13A | 0.007 | 0.080 | 0.210 | 2.001 | 0.175 | 0.161 | 0.007 | 0.073 | 0.204 | 4.000 | 0.206 | 0.418 | -15.1% |
| V13B | 0.008 | 0.073 | 0.283 | 1.313 | 0.213 | 0.202 | 0.001 | 0.058 | 0.300 | 4.000 | 0.233 | 0.356 | -8.3% |
| V14A | 0.002 | 0.052 | 0.224 | 6.293 | 0.239 | 0.438 | 0.001 | 0.047 | 0.200 | 10.000 | 0.280 | 0.762 | -14.6% |
| V14B | 0.028 | 0.091 | 0.203 | 1.646 | 0.181 | 0.171 | 0.001 | 0.073 | 0.151 | 2.000 | 0.179 | 0.234 | 0.7% |
| V15A | 0.003 | 0.012 | 0.074 | 0.788 | 0.058 | 0.066 | 0.001 | 0.007 | 0.073 | 0.875 | 0.058 | 0.090 | 0.8% |
| V15B | 0.003 | 0.007 | 0.060 | 0.338 | 0.044 | 0.050 | 0.001 | 0.003 | 0.073 | 0.338 | 0.035 | 0.055 | 23.5% |
| V16A | 0.003 | 0.065 | 0.212 | 0.459 | 0.154 | 0.114 | 0.001 | 0.073 | 0.204 | 0.459 | 0.165 | 0.143 | -6.7% |
| V16B | 0.007 | 0.190 | 0.414 | 0.904 | 0.306 | 0.185 | 0.001 | 0.137 | 0.445 | 0.992 | 0.306 | 0.244 | 0.0% |
| V18A | 0.003 | 0.072 | 0.147 | 3.875 | 0.151 | 0.258 | 0.001 | 0.073 | 0.100 | 4.000 | 0.152 | 0.375 | -0.7% |
| V18B | 0.003 | 0.067 | 0.112 | 3.494 | 0.138 | 0.216 | 0.001 | 0.058 | 0.136 | 3.705 | 0.165 | 0.364 | -16.6% |
| V19 | 0.003 | 0.015 | 0.090 | 0.636 | 0.063 | 0.071 | 0.001 | 0.007 | 0.100 | 0.645 | 0.068 | 0.105 | -6.8% |
| V20A | 0.001 | 0.040 | 0.142 | 3.976 | 0.144 | 0.256 | 0.001 | 0.009 | 0.111 | 4.000 | 0.155 | 0.373 | -7.5% |
| V20B | 0.001 | 0.029 | 0.169 | 2.109 | 0.130 | 0.149 | 0.001 | 0.012 | 0.102 | 4.000 | 0.136 | 0.200 | -4.7% |
| V20C | 0.005 | 0.017 | 0.187 | 1.374 | 0.143 | 0.172 | 0.001 | 0.007 | 0.200 | 4.000 | 0.163 | 0.244 | -12.2% |
| V21A | 0.002 | 0.012 | 0.099 | 1.190 | 0.086 | 0.113 | 0.001 | 0.007 | 0.100 | 1.229 | 0.087 | 0.143 | -1.4% |
| V21B | 0.001 | 0.022 | 0.096 | 2.901 | 0.124 | 0.259 | 0.001 | 0.007 | 0.100 | 3.792 | 0.099 | 0.224 | 26.3% |
| V22A | 0.007 | 0.060 | 0.296 | 0.988 | 0.222 | 0.210 | 0.007 | 0.035 | 0.228 | 1.397 | 0.197 | 0.307 | 12.7% |
| V22B | 0.007 | 0.195 | 0.254 | 0.300 | 0.212 | 0.067 | 0.007 | 0.190 | 0.265 | 0.300 | 0.218 | 0.082 | -2.6% |
| V23 | 0.001 | 0.041 | 0.110 | 3.854 | 0.135 | 0.274 | 0.001 | 0.015 | 0.100 | 4.000 | 0.140 | 0.395 | -3.2% |
| V24 | 0.001 | 0.040 | 0.131 | 2.253 | 0.130 | 0.161 | 0.001 | 0.010 | 0.100 | 4.000 | 0.148 | 0.243 | -12.5% |
| V25 | 0.002 | 0.026 | 0.100 | 1.237 | 0.090 | 0.096 | 0.001 | 0.007 | 0.100 | 3.675 | 0.095 | 0.123 | -4.4% |
| V26 | 0.003 | 0.018 | 0.100 | 1.298 | 0.101 | 0.125 | 0.001 | 0.007 | 0.100 | 1.896 | 0.098 | 0.152 | 3.4% |
| V27 | 0.005 | 0.075 | 0.145 | 1.893 | 0.134 | 0.134 | 0.001 | 0.073 | 0.100 | 4.000 | 0.141 | 0.295 | -5.4% |
| V28 | 0.004 | 0.079 | 0.203 | 3.267 | 0.198 | 0.307 | 0.001 | 0.073 | 0.199 | 4.000 | 0.248 | 0.614 | -19.9% |
| V29 | 0.001 | 0.047 | 0.148 | 0.437 | 0.103 | 0.078 | 0.001 | 0.035 | 0.100 | 0.438 | 0.104 | 0.096 | -1.2% |
| V30 | 0.003 | 0.068 | 0.131 | 0.293 | 0.105 | 0.061 | 0.001 | 0.073 | 0.120 | 0.500 | 0.106 | 0.089 | -1.2% |
| V31A | 0.003 | 0.071 | 0.168 | 1.956 | 0.157 | 0.192 | 0.001 | 0.073 | 0.154 | 2.013 | 0.165 | 0.250 | -4.7% |
| V31B | 0.003 | 0.073 | 0.154 | 3.970 | 0.155 | 0.272 | 0.001 | 0.073 | 0.127 | 4.000 | 0.141 | 0.287 | 9.7% |
| V32 | 0.007 | 0.075 | 0.214 | 2.478 | 0.181 | 0.193 | 0.001 | 0.073 | 0.233 | 2.636 | 0.190 | 0.252 | -4.6% |
| V36A | 0.009 | 0.074 | 0.185 | 3.978 | 0.271 | 0.517 | 0.001 | 0.073 | 0.105 | 4.000 | 0.218 | 0.577 | 24.2% |
| V36B | 0.003 | 0.009 | 0.087 | 1.397 | 0.108 | 0.219 | 0.001 | 0.007 | 0.083 | 1.400 | 0.114 | 0.259 | -4.6% |
| V37A | 0.003 | 0.016 | 0.085 | 0.798 | 0.091 | 0.124 | 0.001 | 0.007 | 0.100 | 0.817 | 0.093 | 0.148 | -1.5% |
| V37B | 0.002 | 0.036 | 0.096 | 0.406 | 0.071 | 0.053 | 0.001 | 0.007 | 0.100 | 0.408 | 0.072 | 0.075 | -1.1% |
| Practical Mining LLC | February 5, 2018 |
| Page 192 | Mineral Resource Estimates | Klondex Mines Ltd. |
Vein |
ID3 Estimate | Nearest Neighbor | Mean Diff |
||||||||||
| Min | Q1 | Q3 | Max | Mean | St.Dev | Min | Q1 | Q3 | Max | Mean | St.Dev | ||
| V38A | 0.003 | 0.013 | 0.134 | 1.231 | 0.110 | 0.146 | 0.001 | 0.007 | 0.134 | 2.571 | 0.113 | 0.173 | -2.6% |
| V38B | 0.007 | 0.009 | 0.100 | 0.683 | 0.077 | 0.091 | 0.001 | 0.007 | 0.100 | 0.700 | 0.080 | 0.104 | -4.2% |
| V39A | 0.003 | 0.103 | 0.382 | 1.121 | 0.266 | 0.192 | 0.001 | 0.100 | 0.350 | 1.550 | 0.250 | 0.237 | 6.1% |
| V39B | 0.073 | 0.313 | 0.479 | 1.040 | 0.424 | 0.208 | 0.001 | 0.260 | 0.700 | 1.050 | 0.443 | 0.293 | -4.2% |
| V40A | 0.010 | 0.073 | 0.102 | 1.280 | 0.096 | 0.075 | 0.001 | 0.073 | 0.100 | 1.500 | 0.096 | 0.119 | -0.1% |
| V40B | 0.003 | 0.017 | 0.084 | 2.887 | 0.147 | 0.381 | 0.001 | 0.007 | 0.149 | 4.000 | 0.168 | 0.587 | -12.7% |
| V41A | 0.003 | 0.009 | 0.159 | 0.756 | 0.119 | 0.172 | 0.001 | 0.007 | 0.117 | 1.033 | 0.132 | 0.237 | -9.8% |
| V41B | 0.004 | 0.049 | 0.323 | 1.101 | 0.205 | 0.226 | 0.001 | 0.073 | 0.261 | 1.400 | 0.198 | 0.259 | 4.0% |
| V42 | 0.003 | 0.030 | 0.101 | 3.442 | 0.112 | 0.217 | 0.001 | 0.007 | 0.100 | 4.000 | 0.118 | 0.296 | -4.7% |
| V44A | 0.003 | 0.043 | 0.136 | 2.415 | 0.146 | 0.233 | 0.001 | 0.035 | 0.100 | 2.437 | 0.159 | 0.305 | -7.7% |
| V44B | 0.035 | 0.262 | 0.545 | 0.889 | 0.359 | 0.195 | 0.001 | 0.121 | 0.589 | 0.890 | 0.350 | 0.242 | 2.6% |
| V45A | 0.003 | 0.042 | 0.139 | 3.938 | 0.132 | 0.200 | 0.001 | 0.015 | 0.100 | 4.000 | 0.134 | 0.261 | -1.5% |
| V45B | 0.007 | 0.076 | 0.327 | 1.625 | 0.230 | 0.247 | 0.001 | 0.100 | 0.300 | 1.634 | 0.244 | 0.361 | -5.7% |
| V46 | 0.003 | 0.042 | 0.133 | 1.730 | 0.127 | 0.183 | 0.001 | 0.023 | 0.100 | 1.744 | 0.130 | 0.224 | -2.6% |
| V51A | 0.007 | 0.032 | 0.210 | 0.356 | 0.125 | 0.099 | 0.007 | 0.015 | 0.296 | 0.363 | 0.138 | 0.129 | -9.5% |
| V51B | 0.001 | 0.043 | 0.233 | 3.892 | 0.192 | 0.303 | 0.001 | 0.007 | 0.146 | 4.000 | 0.188 | 0.385 | 2.6% |
| V55 | 0.003 | 0.036 | 0.302 | 1.249 | 0.190 | 0.224 | 0.001 | 0.007 | 0.200 | 1.254 | 0.191 | 0.285 | -0.1% |
| V56 | 0.003 | 0.027 | 0.164 | 2.340 | 0.159 | 0.273 | 0.001 | 0.007 | 0.146 | 2.360 | 0.150 | 0.307 | 6.1% |
| V58A | 0.005 | 0.039 | 0.163 | 0.726 | 0.123 | 0.116 | 0.001 | 0.007 | 0.175 | 2.053 | 0.121 | 0.138 | 1.8% |
| V58B | 0.004 | 0.011 | 0.138 | 1.226 | 0.096 | 0.118 | 0.001 | 0.007 | 0.100 | 1.329 | 0.096 | 0.136 | -0.1% |
| V59A | 0.007 | 0.008 | 0.100 | 3.844 | 0.159 | 0.403 | 0.001 | 0.007 | 0.100 | 4.000 | 0.149 | 0.512 | 7.0% |
| V59B | 0.022 | 0.073 | 0.268 | 0.547 | 0.191 | 0.149 | 0.013 | 0.073 | 0.222 | 0.551 | 0.214 | 0.191 | -11.1% |
| V60A | 0.009 | 0.079 | 0.706 | 3.976 | 0.639 | 0.825 | 0.001 | 0.073 | 0.412 | 4.000 | 0.681 | 1.218 | -6.2% |
| V60B | 0.211 | 0.276 | 0.454 | 0.525 | 0.362 | 0.098 | 0.001 | 0.233 | 0.525 | 0.525 | 0.362 | 0.142 | -0.2% |
| V61A | 0.004 | 0.032 | 0.601 | 3.960 | 0.412 | 0.581 | 0.001 | 0.007 | 0.350 | 4.000 | 0.397 | 0.742 | 3.7% |
| V61B | 0.007 | 0.015 | 0.435 | 0.812 | 0.264 | 0.237 | 0.001 | 0.007 | 0.467 | 0.817 | 0.275 | 0.288 | -3.9% |
| V63A | 0.004 | 0.077 | 0.332 | 1.451 | 0.251 | 0.216 | 0.001 | 0.073 | 0.499 | 1.502 | 0.280 | 0.354 | -10.2% |
| V63B | 0.064 | 0.076 | 0.189 | 0.895 | 0.143 | 0.112 | 0.001 | 0.073 | 0.168 | 1.050 | 0.147 | 0.135 | -2.2% |
| V64A | 0.010 | 0.166 | 0.640 | 1.199 | 0.444 | 0.267 | 0.001 | 0.125 | 1.000 | 1.225 | 0.509 | 0.451 | -12.7% |
| V64B | 0.003 | 0.074 | 0.924 | 2.959 | 0.609 | 0.632 | 0.001 | 0.073 | 0.400 | 3.048 | 0.615 | 1.017 | -1.0% |
| V65 | 0.003 | 0.012 | 0.171 | 0.890 | 0.103 | 0.133 | 0.001 | 0.007 | 0.180 | 0.894 | 0.110 | 0.164 | -5.7% |
| V66A | 0.003 | 0.024 | 0.837 | 3.910 | 0.580 | 0.645 | 0.001 | 0.007 | 0.840 | 3.996 | 0.585 | 0.845 | -0.8% |
| V66B | 0.007 | 0.018 | 0.255 | 1.550 | 0.181 | 0.252 | 0.001 | 0.007 | 0.201 | 1.587 | 0.182 | 0.319 | -0.3% |
| V67A | 0.007 | 0.008 | 0.138 | 0.556 | 0.088 | 0.121 | 0.001 | 0.007 | 0.122 | 0.560 | 0.094 | 0.141 | -6.3% |
| V67B | 0.004 | 0.007 | 0.017 | 0.589 | 0.041 | 0.087 | 0.001 | 0.007 | 0.015 | 0.671 | 0.042 | 0.095 | -0.1% |
| V68A | 0.007 | 0.038 | 0.283 | 1.718 | 0.238 | 0.331 | 0.001 | 0.007 | 0.190 | 1.750 | 0.292 | 0.521 | -18.5% |
| V68B | 0.003 | 0.027 | 0.351 | 0.577 | 0.209 | 0.167 | 0.003 | 0.007 | 0.405 | 0.578 | 0.223 | 0.220 | -6.4% |
| V69A | 0.007 | 0.054 | 0.309 | 1.503 | 0.233 | 0.261 | 0.001 | 0.044 | 0.309 | 1.535 | 0.244 | 0.353 | -4.6% |
| V69B | 0.006 | 0.007 | 0.156 | 0.812 | 0.115 | 0.188 | 0.001 | 0.007 | 0.149 | 0.828 | 0.164 | 0.291 | -30.2% |
| V70A | 0.003 | 0.054 | 0.210 | 0.613 | 0.145 | 0.133 | 0.001 | 0.055 | 0.202 | 0.614 | 0.153 | 0.171 | -5.3% |
| Practical Mining LLC | February 5, 2018 |
| Klondex Mines Ltd. | Technical Report for the Fire Creek Project, | Page 193 |
| Lander County, Nevada |
Vein |
ID3 Estimate | Nearest Neighbor | Mean Diff |
||||||||||
| Min | Q1 | Q3 | Max | Mean | St.Dev | Min | Q1 | Q3 | Max | Mean | St.Dev | ||
| V70B | 0.003 | 0.039 | 0.359 | 3.991 | 0.530 | 0.933 | 0.001 | 0.032 | 0.315 | 4.000 | 0.599 | 1.219 | -11.5% |
| V72A | 0.003 | 0.021 | 0.118 | 0.221 | 0.072 | 0.057 | 0.001 | 0.020 | 0.154 | 0.224 | 0.082 | 0.078 | -11.3% |
| V72B | 0.003 | 0.032 | 0.052 | 0.067 | 0.040 | 0.016 | 0.001 | 0.032 | 0.067 | 0.067 | 0.044 | 0.022 | -8.7% |
| V73A | 0.003 | 0.012 | 0.086 | 0.883 | 0.141 | 0.237 | 0.003 | 0.006 | 0.113 | 1.179 | 0.157 | 0.323 | -10.2% |
| V73B | 0.003 | 0.016 | 0.058 | 0.500 | 0.095 | 0.139 | 0.001 | 0.011 | 0.060 | 0.500 | 0.115 | 0.181 | -16.8% |
| V73C | 0.003 | 0.007 | 0.040 | 0.100 | 0.029 | 0.027 | 0.001 | 0.003 | 0.041 | 0.100 | 0.029 | 0.032 | -2.2% |
| V74A | 0.003 | 0.019 | 0.074 | 0.110 | 0.045 | 0.034 | 0.003 | 0.018 | 0.101 | 0.110 | 0.045 | 0.042 | -0.6% |
| V74B | 0.003 | 0.003 | 0.141 | 0.184 | 0.069 | 0.068 | 0.001 | 0.003 | 0.184 | 0.184 | 0.072 | 0.088 | -4.6% |
| All Veins | 0.213 | 0.222 | -3.8% | ||||||||||
On a local scale, model validation can be confirmed by the visual comparison of block grades to composite grades. A long section of each main vein showing composites superimposed as dots on block grades is shown in Figure 14-39 through Figure 14-45. The color legend of Figure 14-43 is applied to all block and composite grade values for comparative purposes. The legend applies to both gold and silver. Examination indicates good agreement of block grade estimates with the composite grades.

| Practical Mining LLC | February 5, 2018 |
| Page 194 | Mineral Resource Estimates | Klondex Mines Ltd. |


| Practical Mining LLC | February 5, 2018 |
| Klondex Mines Ltd. | Technical Report for the Fire Creek Project, | Page 195 |
| Lander County, Nevada |


| Practical Mining LLC | February 5, 2018 |
| Page 196 | Mineral Resource Estimates | Klondex Mines Ltd. |

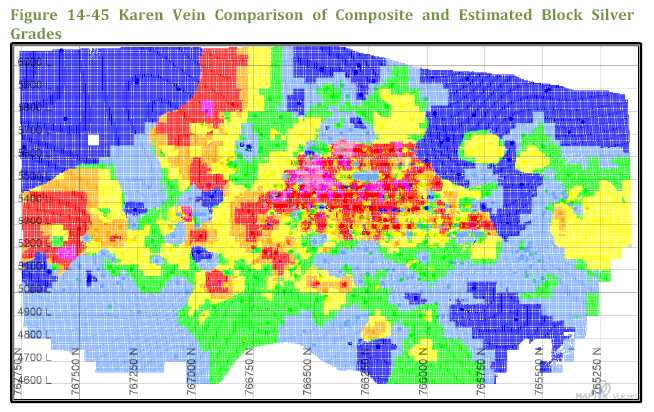
| Practical Mining LLC | February 5, 2018 |
| Klondex Mines Ltd. | Technical Report for the Fire Creek Project, | Page 197 |
| Lander County, Nevada |
The low-grade mineralization blocks are shown below in both plan and cross section view in Figure 14-46 and Figure 14-47

| Practical Mining LLC | February 5, 2018 |
| Page 198 | Mineral Resource Estimates | Klondex Mines Ltd. |
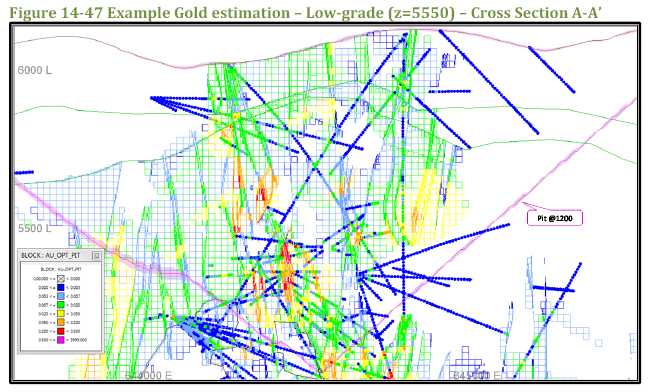
Spatial model validation is further provided by the swath plots of individual veins. Vonnie, Joyce, and Karen swath plots are presented in Figure 14-48 through Figure 14-59. These plots compare the average grade from ID3 estimations to the NN from within regularly spaced swaths or slices through the vein (both along strike and down dip). Examination of the swath plots shows a reasonable agreement among the gold and silver estimation values.
| Practical Mining LLC | February 5, 2018 |
| Klondex Mines Ltd. | Technical Report for the Fire Creek Project, | Page 199 |
| Lander County, Nevada |


| Practical Mining LLC | February 5, 2018 |
| Page 200 | Mineral Resource Estimates | Klondex Mines Ltd. |
![]()

| Practical Mining LLC | February 5, 2018 |
| Klondex Mines Ltd. | Technical Report for the Fire Creek Project, | Page 201 |
| Lander County, Nevada |
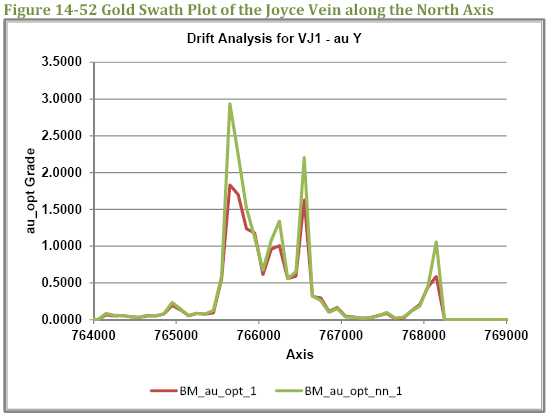
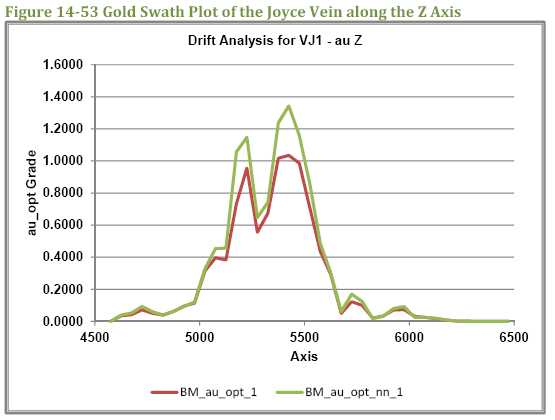
| Practical Mining LLC | February 5, 2018 |
| Page 202 | Mineral Resource Estimates | Klondex Mines Ltd. |


| Practical Mining LLC | February 5, 2018 |
| Klondex Mines Ltd. | Technical Report for the Fire Creek Project, | Page 203 |
| Lander County, Nevada |


| Practical Mining LLC | February 5, 2018 |
| Page 204 | Mineral Resource Estimates | Klondex Mines Ltd. |


| Practical Mining LLC | February 5, 2018 |
| Klondex Mines Ltd. | Technical Report for the Fire Creek Project, | Page 205 |
| Lander County, Nevada |
For the low-grade disseminated mineralization, model validations were also undertaken visually, statistically, and via swath plots in Table 14-19, Table 14-20 and Figure 14-60 through Figure 14-62 show an example for the Basalt domain.
Table 14-19 Grade Estimation comparison OK vs NN at 0 Cutoff – Gold
| OK Estimate | Nearest Neighbor | Mean | |||||||||||
| Domain | Min | Q1 | Q3 | Max | Mean | St.Dev | Min | Q1 | Q3 | Max | Mean | St.Dev | Diff |
| AND | 0.001 | 0.001 | 0.001 | 0.306 | 0.0031 | 0.014 | 0.001 | 0.001 | 0.001 | 1.393 | 0.0031 | 0.031 | 1% |
| TFUP | 0.001 | 0.001 | 0.002 | 0.396 | 0.0043 | 0.010 | 0.001 | 0.001 | 0.002 | 1.307 | 0.0045 | 0.016 | -4% |
| BST | 0.001 | 0.001 | 0.010 | 1.665 | 0.0119 | 0.034 | 0.001 | 0.001 | 0.005 | 4.000 | 0.0131 | 0.085 | -9% |
| TFLO | 0.001 | 0.001 | 0.002 | 0.505 | 0.0043 | 0.013 | 0.001 | 0.001 | 0.002 | 1.734 | 0.0045 | 0.028 | -6% |
| DKAND | 0.001 | 0.001 | 0.004 | 0.123 | 0.0050 | 0.011 | 0.001 | 0.001 | 0.001 | 0.311 | 0.0056 | 0.023 | -11% |
| DKTFUP | 0.001 | 0.001 | 0.009 | 0.309 | 0.0083 | 0.017 | 0.001 | 0.001 | 0.002 | 0.873 | 0.0083 | 0.029 | 0% |
| DKBST | 0.001 | 0.001 | 0.012 | 1.328 | 0.0137 | 0.037 | 0.001 | 0.001 | 0.006 | 4.000 | 0.0140 | 0.079 | -2% |
| DKTFLO | 0.001 | 0.001 | 0.005 | 0.225 | 0.0066 | 0.016 | 0.001 | 0.001 | 0.003 | 0.639 | 0.0064 | 0.026 | 3% |
| All Domains | 0.0096 | 0.0102 | -6% | ||||||||||
Table 14-20 Grade Estimation comparison OK vs NN at 0 Cutoff – Silver
| OK Estimate | Nearest Neighbor | Mean | |||||||||||
| Domain | Min | Q1 | Q3 | Max | Mean | St.Dev | Min | Q1 | Q3 | Max | Mean | St.Dev | Diff |
| AND | 0.001 | 0.006 | 0.007 | 0.256 | 0.0100 | 0.013 | 0.001 | 0.007 | 0.007 | 0.660 | 0.0098 | 0.018 | 2% |
| TFUP | 0.001 | 0.007 | 0.017 | 1.046 | 0.0201 | 0.035 | 0.001 | 0.007 | 0.007 | 4.000 | 0.0208 | 0.047 | -3% |
| BST | 0.001 | 0.008 | 0.072 | 1.841 | 0.0493 | 0.065 | 0.001 | 0.007 | 0.073 | 4.000 | 0.0534 | 0.115 | -8% |
| TFLO | 0.001 | 0.012 | 0.073 | 1.020 | 0.0471 | 0.038 | 0.001 | 0.007 | 0.073 | 4.000 | 0.0483 | 0.055 | -2% |
| DKAND | 0.001 | 0.007 | 0.011 | 1.120 | 0.0155 | 0.022 | 0.001 | 0.007 | 0.007 | 4.000 | 0.0162 | 0.038 | -5% |
| DKTFUP | 0.001 | 0.007 | 0.028 | 0.559 | 0.0269 | 0.041 | 0.001 | 0.007 | 0.012 | 1.323 | 0.0274 | 0.058 | -2% |
| DKBST | 0.001 | 0.012 | 0.074 | 1.952 | 0.0517 | 0.051 | 0.001 | 0.007 | 0.073 | 4.000 | 0.0538 | 0.082 | -4% |
| DKTFLO | 0.001 | 0.017 | 0.074 | 0.599 | 0.0509 | 0.033 | 0.001 | 0.007 | 0.075 | 1.502 | 0.0517 | 0.042 | -2% |
| All Domains | 0.0415 | 0.0438 | -5% | ||||||||||
| Practical Mining LLC | February 5, 2018 |
| Page 206 | Mineral Resource Estimates | Klondex Mines Ltd. |


| Practical Mining LLC | February 5, 2018 |
| Klondex Mines Ltd. | Technical Report for the Fire Creek Project, | Page 207 |
| Lander County, Nevada |

| 14.11.1. | Model Smoothing Checks – Grade Tonnage Curves |
The validations discussed above represent comparisons at a 0 grade cutoff. In reality, mining occurs above a cutoff. The grade tonnage curve is used to describe the tons and grade that may be present above a cutoff for mining. Smoothing in the estimate, the spacing of the informing samples, and the continuity of grades within the vein all affect the shape of the estimated grade tonnage curve. The validations presented below in Figure 14-63 through Figure 14-65represent smoothing checks to understand how the estimates compare to a theoretical global estimate of the grade tonnage curve (grade tonnage curves are applied to the undiluted insitu vein grades). Note that the theoretical estimates are aspatial in nature and hence the estimates and theoretical are not expected to match exactly – differences however may indicate where significant under or over smoothing is present. The Discrete Gaussian change of support method was used in conjunction with variograms and the nearest neighbor data to derive the theoretical grade tonnage curves. The variograms shown in section 14.7 Variography were used for Vonnie Vein, Joyce Vein, and Karen Vein.
The Vonnie Vein estimates have a very similar volume to the theoretical estimates, with a 10-15% higher grade and hence higher metal above most cutoffs. The Joyce Vein estimates are similar in nature to the Vonnie Vein with similar volumes, however the grades and hence metal above cutoff are consistently 10-15% lower. The Karen Vein estimates are consistently higher grade but lower volume above cutoff. This evens out to similar metal but indicates additional smoothing may be warranted in future estimates. All vein estimates display a consistent grade tonnage curve shape with respect to the theoretical estimates.
| Practical Mining LLC | February 5, 2018 |
| Page 208 | Mineral Resource Estimates | Klondex Mines Ltd. |

| Practical Mining LLC | February 5, 2018 |
| Klondex Mines Ltd. | Technical Report for the Fire Creek Project, | Page 209 |
| Lander County, Nevada |


| Practical Mining LLC | February 5, 2018 |
| Page 210 | Mineral Resource Estimates | Klondex Mines Ltd. |
The low-grade dissemination mineralization estimate of the basalt domain shows 20% higher volume with 4% lower grade than the theoretical 20-foot by 20-foot by 20 foot support estimate at a 0.01opt Au cutoff grade.
![]()
| 14.12. | Mineral Resource Statement |
| 14.12.1. | Underground Mineral Resources |
The narrow vein mining methods practiced at the Project require a minimum stope width of four feet. The veins can vary in thickness from a few inches to over ten feet. Potentially economic mineralization must meet standard cut-off grade criteria as well as a grade thickness criterion before it is included in a mineral resource estimate. Grade thickness is calculated by multiplying the block true width by its equivalent grade. The parameters used in determining the cut-off grade and grade thickness cut-off are listed in Table 14-21.
Table 14-21 Underground Mineral Resource Cutoff Grade Parameters
| Gold | Silver | ||
| Sales Price | $/Ounce | $1,400 | $19.83 |
| Included in | |||
| Refining and Sales Expense | $/Ounce | Milling |
| Practical Mining LLC | February 5, 2018 |
| Klondex Mines Ltd. | Technical Report for the Fire Creek Project, | Page 211 |
| Lander County, Nevada |
| Royalty | 2.5% | ||
| Metallurgical Recovery | 94% | 92% | |
| Operating Costs | |||
| Ore Haulage (Portal to Mill) | $/ton | $ 54 | |
| Direct Processing | $/ton | $ 43 | |
| Administration and Overhead | $/ton | $ 68 | |
| Mining | $/ton | $ 132 | |
| Total | $/ton | $ 296 | |
| Gold Equivalent | 1 | 72.12 | |
| Unplanned Dilution | 10% | ||
| Cut-off Grade | Eq. opt | 0.228 | |
| Minimum Mining Width | feet | 4 | |
| Grade Thickness cut-off | Eq. opt-ft. | 0.974 | |
Mineral resources meeting the dual constraints of cut-off grade and grade-thickness cut-off for each vein are listed in Table 14-22 below.
Table 14-22 Underground Mineral Resources as of November 30, 2017
| AuEq | AuEq | ||||||
| Vein Name | kton | Au opt | Ag opt | opt | Au koz | Ag koz | koz |
| Measured | |||||||
| Joyce | 65 | 1.260 | 1.152 | 1.276 | 82 | 75 | 83 |
| Karen | 57 | 1.389 | 1.334 | 1.407 | 79 | 76 | 80 |
| Vonnie | 14 | 1.177 | 1.074 | 1.192 | 16 | 15 | 16 |
| Honey Runner | 5.4 | 0.675 | 0.418 | 0.680 | 3.6 | 2.2 | 3.6 |
| Hui Wu | 2.0 | 0.352 | 0.205 | 0.355 | 0.7 | 0.4 | 0.7 |
| 05 | 0.1 | 0.976 | 0.053 | 0.977 | 0.1 | 0.0 | 0.1 |
| 06 | 0.4 | 0.400 | 1.255 | 0.417 | 0.2 | 0.5 | 0.2 |
| 07 | 0.2 | 0.284 | 1.090 | 0.299 | 0.1 | 0.3 | 0.1 |
| 12 | 1.4 | 0.482 | 0.256 | 0.485 | 0.7 | 0.4 | 0.7 |
| 13 | 2.4 | 0.676 | 0.393 | 0.681 | 1.7 | 1.0 | 1.7 |
| 16 | 0.5 | 0.457 | 0.331 | 0.462 | 0.2 | 0.2 | 0.2 |
| 18 | 0.6 | 0.509 | 0.151 | 0.511 | 0.3 | 0.1 | 0.3 |
| 21 | 0.2 | 0.259 | 0.059 | 0.259 | 0.1 | 0.0 | 0.1 |
| 31 | 1.3 | 0.516 | 0.416 | 0.522 | 0.7 | 0.6 | 0.7 |
| 37 | 1.2 | 0.611 | 0.248 | 0.614 | 0.7 | 0.3 | 0.7 |
| 39 | 0.3 | 0.381 | 0.142 | 0.383 | 0.1 | 0.0 | 0.1 |
| 45 | 0.8 | 0.533 | 0.339 | 0.538 | 0.4 | 0.3 | 0.5 |
| 55 | 0.8 | 0.537 | 0.487 | 0.544 | 0.5 | 0.4 | 0.5 |
| 58 | 0.4 | 0.273 | 0.405 | 0.279 | 0.1 | 0.2 | 0.1 |
| 59 | 0.1 | 0.487 | 0.505 | 0.494 | 0.1 | 0.1 | 0.1 |
| Practical Mining LLC | February 5, 2018 |
| Page 212 | Mineral Resource Estimates | Klondex Mines Ltd. |
| AuEq | AuEq | ||||||
| Vein Name | kton | Au opt | Ag opt | opt | Au koz | Ag koz | koz |
| 60 | 0.1 | 0.499 | 0.280 | 0.503 | 0.1 | 0.0 | 0.1 |
| 63 | 0.1 | 0.482 | 0.481 | 0.488 | 0.0 | 0.0 | 0.0 |
| Total Measured | 154 | 1.215 | 1.118 | 1.230 | 187 | 172 | 189 |
| Indicated | |||||||
| Joyce | 79 | 0.742 | 0.941 | 0.755 | 59 | 74 | 60 |
| Karen | 92 | 0.495 | 0.449 | 0.501 | 46 | 42 | 46 |
| Vonnie | 52 | 0.538 | 0.664 | 0.547 | 28 | 34 | 28 |
| Honey Runner | 73 | 0.455 | 0.354 | 0.460 | 33 | 26 | 34 |
| Hui Wu | 11 | 0.481 | 0.275 | 0.485 | 5 | 3 | 5 |
| 05 | 2.8 | 0.446 | 0.192 | 0.448 | 1.2 | 0.5 | 1.3 |
| 06 | 15 | 0.407 | 1.133 | 0.423 | 6.1 | 17 | 6.3 |
| 07 | 9.5 | 0.622 | 0.509 | 0.629 | 5.9 | 4.8 | 6.0 |
| 08 | 6.0 | 0.822 | 0.531 | 0.829 | 5.0 | 3.2 | 5.0 |
| 09 | 6.8 | 0.886 | 0.247 | 0.889 | 6.0 | 1.7 | 6.0 |
| 12 | 4.1 | 0.558 | 0.240 | 0.561 | 2.3 | 1.0 | 2.3 |
| 13 | 3.7 | 0.481 | 0.377 | 0.486 | 1.8 | 1.4 | 1.8 |
| 14 | 3.1 | 0.286 | 0.393 | 0.292 | 0.9 | 1.2 | 0.9 |
| 16 | 23 | 0.512 | 0.458 | 0.518 | 12 | 11 | 12 |
| 18 | 2.3 | 0.313 | 0.242 | 0.316 | 0.7 | 0.6 | 0.7 |
| 21 | 17 | 0.387 | 0.537 | 0.394 | 6.5 | 9.0 | 6.6 |
| 22 | 4.2 | 0.472 | 0.411 | 0.478 | 2.0 | 1.7 | 2.0 |
| 24 | 0.1 | 0.549 | 0.658 | 0.558 | 0.1 | 0.1 | 0.1 |
| 27 | 9 | 0.364 | 0.270 | 0.368 | 3.3 | 2.4 | 3.3 |
| 30 | 6.1 | 0.464 | 0.300 | 0.468 | 2.8 | 1.8 | 2.8 |
| 31 | 23 | 0.481 | 0.331 | 0.486 | 11 | 7.5 | 11 |
| 37 | 1.2 | 0.469 | 0.196 | 0.472 | 0.6 | 0.2 | 0.6 |
| 39 | 13 | 0.666 | 0.533 | 0.674 | 8.8 | 7.0 | 8.9 |
| 41 | 0.9 | 0.236 | 0.232 | 0.239 | 0.2 | 0.2 | 0.2 |
| 45 | 2.5 | 0.281 | 0.256 | 0.284 | 0.7 | 0.6 | 0.7 |
| 46 | 1.0 | 0.235 | 0.768 | 0.246 | 0.2 | 0.8 | 0.3 |
| 55 | 1.2 | 0.738 | 0.473 | 0.745 | 0.9 | 0.6 | 0.9 |
| 58 | 4.1 | 0.441 | 0.498 | 0.448 | 1.8 | 2.0 | 1.8 |
| 59 | 3.8 | 0.652 | 0.380 | 0.657 | 2.5 | 1.4 | 2.5 |
| 60 | 5.9 | 0.378 | 0.416 | 0.384 | 2.2 | 2.5 | 2.3 |
| 61 | 19 | 0.430 | 0.690 | 0.439 | 8.3 | 13 | 8.5 |
| 63 | 14 | 0.541 | 0.623 | 0.550 | 7.6 | 8.7 | 7.7 |
| 64 | 4.8 | 0.449 | 0.933 | 0.462 | 2.2 | 4.5 | 2.2 |
| 68 | 3.1 | 0.351 | 0.702 | 0.361 | 1.1 | 2.2 | 1.1 |
| 69 | 12 | 0.371 | 0.478 | 0.377 | 4.5 | 5.8 | 4.6 |
| 70 | 2.6 | 0.234 | 0.487 | 0.241 | 0.6 | 1.2 | 0.6 |
| Total Indicated | 532 | 0.526 | 0.554 | 0.534 | 280 | 295 | 284 |
| Practical Mining LLC | February 5, 2018 |
| Klondex Mines Ltd. | Technical Report for the Fire Creek Project, | Page 213 |
| Lander County, Nevada |
| AuEq | AuEq | ||||||
| Vein Name | kton | Au opt | Ag opt | opt | Au koz | Ag koz | koz |
| Measured and Indicated | |||||||
| Joyce | 144 | 0.976 | 1.036 | 0.990 | 141 | 149 | 143 |
| Karen | 149 | 0.834 | 0.785 | 0.845 | 124 | 117 | 126 |
| Vonnie | 65 | 0.672 | 0.750 | 0.682 | 44 | 49 | 45 |
| Honey Runner | 79 | 0.470 | 0.358 | 0.475 | 37 | 28 | 37 |
| Hui Wu | 13 | 0.461 | 0.264 | 0.464 | 6.0 | 3.4 | 6.0 |
| 05 | 2.9 | 0.469 | 0.186 | 0.472 | 1.4 | 0.5 | 1.4 |
| 06 | 15 | 0.407 | 1.137 | 0.423 | 6.2 | 17 | 6.5 |
| 07 | 10 | 0.614 | 0.524 | 0.621 | 6.0 | 5.1 | 6.0 |
| 08 | 6.0 | 0.822 | 0.531 | 0.829 | 5.0 | 3.2 | 5.0 |
| 09 | 6.8 | 0.884 | 0.247 | 0.887 | 6.0 | 1.7 | 6.0 |
| 12 | 5.5 | 0.539 | 0.244 | 0.542 | 3.0 | 1.3 | 3.0 |
| 13 | 6.1 | 0.559 | 0.383 | 0.564 | 3.4 | 2.3 | 3.4 |
| 14 | 3.1 | 0.286 | 0.393 | 0.292 | 0.9 | 1.2 | 0.9 |
| 16 | 24 | 0.511 | 0.455 | 0.517 | 12 | 11 | 12 |
| 18 | 2.9 | 0.352 | 0.224 | 0.355 | 1.0 | 0.7 | 1.0 |
| 21 | 17 | 0.385 | 0.530 | 0.392 | 6.5 | 9.0 | 6.7 |
| 22 | 4.2 | 0.472 | 0.411 | 0.478 | 2.0 | 1.7 | 2.0 |
| 24 | 0.1 | 0.549 | 0.658 | 0.558 | 0.1 | 0.1 | 0.1 |
| 27 | 9.1 | 0.364 | 0.270 | 0.368 | 3.3 | 2.4 | 3.3 |
| 30 | 6.1 | 0.464 | 0.300 | 0.468 | 2.8 | 1.8 | 2.8 |
| 31 | 24 | 0.483 | 0.336 | 0.488 | 12 | 8.0 | 12 |
| 37 | 2.4 | 0.539 | 0.222 | 0.543 | 1.3 | 0.5 | 1.3 |
| 39 | 13 | 0.661 | 0.525 | 0.668 | 8.9 | 7.1 | 9.0 |
| 41 | 1.0 | 0.236 | 0.228 | 0.239 | 0.2 | 0.2 | 0.2 |
| 45 | 3.4 | 0.344 | 0.277 | 0.347 | 1.2 | 0.9 | 1.2 |
| 46 | 1.0 | 0.235 | 0.768 | 0.246 | 0.2 | 0.8 | 0.3 |
| 55 | 2.0 | 0.654 | 0.479 | 0.660 | 1.3 | 1.0 | 1.3 |
| 58 | 4.5 | 0.425 | 0.489 | 0.432 | 1.9 | 2.2 | 1.9 |
| 59 | 3.9 | 0.647 | 0.384 | 0.652 | 2.5 | 1.5 | 2.6 |
| 60 | 6.0 | 0.381 | 0.414 | 0.386 | 2.3 | 2.5 | 2.3 |
| 61 | 19 | 0.430 | 0.690 | 0.439 | 8.3 | 13 | 8.5 |
| 63 | 14 | 0.541 | 0.623 | 0.550 | 7.6 | 8.8 | 7.7 |
| 64 | 4.8 | 0.449 | 0.932 | 0.462 | 2.2 | 4.5 | 2.2 |
| 68 | 3.1 | 0.351 | 0.702 | 0.361 | 1.1 | 2.2 | 1.1 |
| 69 | 12 | 0.371 | 0.478 | 0.377 | 4.5 | 5.8 | 4.6 |
| 70 | 2.6 | 0.234 | 0.487 | 0.241 | 0.6 | 1.2 | 0.6 |
| Total Meas. and Ind. | 686 | 0.681 | 0.680 | 0.690 | 467 | 467 | 474 |
| Inferred | |||||||
| Practical Mining LLC | February 5, 2018 |
| Page 214 | Mineral Resource Estimates | Klondex Mines Ltd. |
| AuEq | AuEq | ||||||
| Vein Name | kton | Au opt | Ag opt | opt | Au koz | Ag koz | koz |
| Joyce | 49 | 0.354 | 0.881 | 0.366 | 17 | 43 | 18 |
| Karen | 41 | 0.343 | 0.479 | 0.350 | 14 | 20 | 14 |
| Vonnie | 25 | 0.792 | 0.394 | 0.797 | 20 | 10 | 20 |
| Honey Runner | 29 | 0.386 | 0.400 | 0.391 | 11 | 12 | 11 |
| Hui Wu | 0.2 | 0.348 | 0.066 | 0.349 | 0.1 | 0.0 | 0.1 |
| 05 | 1.0 | 0.361 | 0.183 | 0.363 | 0.3 | 0.2 | 0.3 |
| 06 | 27 | 0.460 | 0.490 | 0.467 | 12 | 13 | 12 |
| 08 | 4.4 | 0.257 | 0.158 | 0.259 | 1.1 | 0.7 | 1.1 |
| 09 | 60 | 0.438 | 0.166 | 0.441 | 27 | 10 | 27 |
| 14 | 0.3 | 0.358 | 0.368 | 0.363 | 0.1 | 0.1 | 0.1 |
| 16 | 62 | 0.412 | 0.259 | 0.415 | 26 | 16 | 26 |
| 18 | 17 | 0.478 | 0.169 | 0.481 | 8.1 | 2.9 | 8.2 |
| 19 | 0.3 | 0.219 | 0.300 | 0.223 | 0.1 | 0.1 | 0.1 |
| 21 | 6.1 | 0.287 | 0.503 | 0.294 | 1.7 | 3.1 | 1.8 |
| 22 | 23 | 0.530 | 0.425 | 0.536 | 12 | 10 | 12 |
| 23 | 36 | 0.444 | 0.131 | 0.446 | 16 | 4.7 | 16 |
| 24 | 148 | 0.534 | 0.675 | 0.544 | 79 | 100 | 81 |
| 25 | 54 | 0.558 | 0.295 | 0.562 | 30 | 16 | 30 |
| 26 | 50 | 0.319 | 0.159 | 0.321 | 16 | 8.0 | 16 |
| 27 | 5.6 | 0.331 | 0.198 | 0.334 | 1.8 | 1.1 | 1.9 |
| 28 | 11 | 0.311 | 0.588 | 0.319 | 3.3 | 6.2 | 3.4 |
| 30 | 107 | 0.422 | 0.368 | 0.427 | 45 | 39 | 46 |
| 31 | 2.0 | 0.421 | 0.153 | 0.423 | 0.8 | 0.3 | 0.8 |
| 39 | 1.5 | 0.873 | 0.734 | 0.884 | 1.3 | 1.1 | 1.3 |
| 41 | 21 | 0.272 | 0.728 | 0.282 | 5.8 | 16 | 6.0 |
| 45 | 22 | 0.274 | 0.319 | 0.279 | 6.0 | 6.9 | 6.1 |
| 58 | 26 | 0.551 | 0.429 | 0.557 | 14 | 11 | 15 |
| 59 | 2.7 | 0.490 | 0.236 | 0.493 | 1.3 | 0.6 | 1.3 |
| 60 | 25 | 0.340 | 0.447 | 0.346 | 8.4 | 11 | 8.6 |
| 61 | 31 | 0.371 | 0.571 | 0.379 | 11 | 18 | 12 |
| 63 | 3.1 | 0.313 | 0.298 | 0.317 | 1.0 | 0.9 | 1.0 |
| 64 | 2.5 | 0.599 | 1.908 | 0.625 | 1.5 | 4.8 | 1.6 |
| 66 | 43 | 0.337 | 1.192 | 0.354 | 15 | 51 | 15 |
| 67 | 49 | 0.319 | 0.333 | 0.324 | 15 | 16 | 16 |
| 68 | 28 | 0.238 | 0.291 | 0.242 | 6.7 | 8.1 | 6.8 |
| 69 | 18 | 0.360 | 0.190 | 0.362 | 6.6 | 3.5 | 6.6 |
| 70 | 9.3 | 0.253 | 0.392 | 0.258 | 2.3 | 3.6 | 2.4 |
| 72 | 26 | 0.388 | 0.092 | 0.389 | 10 | 2 | 10 |
| 73 | 74 | 0.967 | 0.260 | 0.971 | 72 | 19 | 72 |
| Total Inferred | 1,142 | 0.457 | 0.430 | 0.463 | 522 | 491 | 529 |
Notes:
| Practical Mining LLC | February 5, 2018 |
| Klondex Mines Ltd. | Technical Report for the Fire Creek Project, | Page 215 |
| Lander County, Nevada |
| 1. | Mineral resources have been calculated at a gold price of $1,400/troy ounce and a silver price of $19.83 per troy ounce; |
|
| 2. | Mineral resources are calculated at a grade thickness cut-off grade of 0.974 Au equivalent opt-feet and a diluted Au equivalent cut-off grade of 0.228opt; |
|
| 3. | Mineral Resources have been calculated using metallurgical recoveries for gold and silver of 94% and 92% respectively; |
|
| 4. | Gold equivalent ounces were calculated based on one ounce of gold being equivalent to 72.12 ounces of silver; |
|
| 5. | The minimum mining width is defined as four-feet or the vein true thickness plus two-foot, whichever is greater; |
|
| 6. | Mineral resources include dilution to achieve mining widths and an additional 7% unplanned dilution; |
|
| 7. | Mineral resources include allowance for 5% mining losses; |
|
| 8. | Mineral resources are inclusive of mineral reserves; |
|
| 9. | Underground Mineral Resources are exclusive of Open Pit Mineral Resources; |
|
| 10. | Mineral resources, which are not mineral reserves, do not have demonstrated economic viability. The estimate of mineral resources may be materially affected by environmental, permitting, legal, title, socio-political, marketing, or other relevant factors, and; |
|
| 11. | The quantity and grade of reported inferred mineral resources in this estimation are uncertain in nature and there is insufficient exploration to define these inferred mineral resources as an indicated or measured mineral resource and it is uncertain if further exploration will result in upgrading them to an indicated or measured mineral resource category. |
| 14.12.2. | Open Pit Mineral Resources |
Underground vein mineralization and any low-grade mineralization contained within the underground asbuilt surveys or within the underground Mineral Resource was removed from the disseminated resource model. The modified disseminated model was then regularized to 20 x 10 x 20-foot (length x width x height) blocks.
Open Pit Mineral Resources are contained within an optimized pit shell generated with a Lerchs Grossman algorithm and Vulcan Software 10.1.1. The algorithm was executed using the parameters listed in Table 14-23. Open pit mineral resources are listed in Table 14-24.
Table 14-23 Open Pit Optimization Parameters
| Gold | Silver | ||
| Sales Price | $/Ounce | $1,400 | $19.83 |
| Refining and Sales Expense | $/Ounce | $5.00 | - |
| Royalty | 2.5% | ||
| Metallurgical Recovery | |||
| Oxide | 65% | 30% | |
| Mixed | 60% | 25% | |
| Operating Costs | |||
| Heap Leach | $ 4.00 | ||
| Oxide | $/ton | $3.50 | |
| Mixed | $/ton | $4.00 | |
| Administration and Overhead | $/ton | $ 0.50 | |
| Mining | $/ton | $ 2.25 | |
| Practical Mining LLC | February 5, 2018 |
| Page 216 | Mineral Resource Estimates | Klondex Mines Ltd. |
| Total | $/ton | $ 6.75 | |
| Gold Equivalent | 1 | 152.9 | |
| Unplanned Dilution | 10% | ||
| Mining Losses | 5% | ||
| Pit Slope | 45° | ||
Table 14-24 Open Pit Mineral Resources as of November 30, 2017
| Cut Off | Material | |||||||
| AuEq opt | Type | kton | Au opt | Ag opt | AuEq opt | Au koz | Ag koz | AuEq koz |
| Indicated | ||||||||
0.012 |
Oxide | 10,023 | 0.023 | 0.038 | 0.023 | 229 | 386 | 231 |
| Mixed | 27,085 | 0.030 | 0.065 | 0.030 | 807 | 1,769 | 818 | |
| Total | 37,109 | 0.028 | 0.058 | 0.028 | 1,036 | 2,155 | 1,049 | |
0.010 |
Oxide | 12,241 | 0.021 | 0.036 | 0.021 | 251 | 490 | 253 |
| Mixed | 30,637 | 0.027 | 0.062 | 0.027 | 842 | 1,909 | 854 | |
| Total | 42,877 | 0.025 | 0.055 | 0.025 | 1,093 | 2,350 | 1,108 | |
0.005 |
Oxide | 21,476 | 0.014 | 0.029 | 0.015 | 310 | 617 | 314 |
| Mixed | 42,980 | 0.022 | 0.055 | 0.022 | 925 | 2,350 | 941 | |
| Total | 64,457 | 0.019 | 0.046 | 0.019 | 1,236 | 2,967 | 1,255 | |
| Inferred | ||||||||
0.012 |
Oxide | 2,249 | 0.027 | 0.038 | 0.027 | 60 | 86 | 61 |
| Mixed | 25,313 | 0.039 | 0.101 | 0.040 | 983 | 2,557 | 1,000 | |
| Total | 27,561 | 0.038 | 0.096 | 0.038 | 1,043 | 2,643 | 1,060 | |
0.010 |
Oxide | 2,872 | 0.023 | 0.035 | 0.023 | 66 | 100 | 67 |
| Mixed | 28,835 | 0.035 | .096 | 0.035 | 1019 | 2,782 | 1,037 | |
| Total | 31,707 | 0.034 | 0.091 | 0.035 | 1,085 | 2,882 | 1,104 | |
0.005 |
Oxide | 5,792 | 0.015 | 0.027 | 0.015 | 84 | 154 | 85 |
| Mixed | 41,053 | 0.027 | 0.085 | 0.027 | 1,101 | 3,482 | 1,123 | |
| Total | 46,845 | 0.025 | 0.078 | 0.026 | 1,185 | 3,637 | 1,209 | |
| Notes: | ||
| 1. | Mineral resources are calculated at a gold price of US$1,400 per ounce and a silver price of US$19.83 per ounce; |
|
| 2. | Metallurgical recoveries for gold and silver are 65% and 30%, respectively for oxide mineralization and 60% and 25% respectively for mixed mineralization; |
|
| 3. | One ounce of gold is equivalent to 152.94 ounces of silver; |
|
| 4. | Mineral Resources include 10% dilution and 5% mining losses; |
|
| 5. | Cut off grades for the Mineral Resources are 0.01opt AuEq opt.; |
|
| 6. | The effective date for the Mineral Resource is November 30, 2017; |
|
| 7. | Open Pit Mineral resources are Exclusive of Underground Mineral Resources; |
|
| 8. | Mineral Resources which are not Mineral Reserves have not yet demonstrated economic viability. The estimate of mineral resources may be materially affected by environmental, permitting, legal, title, taxation, sociopolitical, marketing, or other relevant issues, and; |
|
| 9. | The quantity and grade of reported Inferred Resources in this estimation are uncertain in nature and there has been insufficient exploration to define these Inferred Resources as an Indicated or Measured Mineral Resource and it is uncertain if further exploration will result in upgrading them to an Indicated or Measured Mineral Resource category. |
|
| Practical Mining LLC | February 5, 2018 |
| Klondex Mines Ltd. | Technical Report for the Fire Creek Project, | Page 217 |
| Lander County, Nevada |
| 15. | Mineral Reserve Estimates |
Excavation designs for stopes, stope development drifting and access development were created using Vulcan software. Stope designs were aided by the Vulcan Stope Optimizer Module. The stope optimizer produces the stope cross section which maximizes value within given geometric and design constraints.
Design constraints are for minimum cut-and-fill geometries of six feet wide and ten feet high drifts along strike of the vein, with attack ramps breasting down in waste to access each level of development.
Mining and backfill tasks were created from all designed excavations. These tasks were assigned costs and productivities specific to the excavation or backfill task type. Additionally, the undiscounted cash flow for each task was calculated. All tasks were then ordered in the correct sequence for mining and backfilling. Any task sequence or subsequence that did not achieve a positive cumulative undiscounted cash flow was removed from consideration for mineral reserves. Stope development, necessary to reach reserve excavations and exceeding the incremental cut-off grade shown in Table 15-1, are also included in mineral reserves listed in Table 15-2..
Table 15-1 Mineral Reserves Cut Off Grade Calculation
| Gold | Silver | ||
| Sales Price | $/Ounce | $1,200 | $17.00 |
| Refining and Sales Expense | $/Ounce | Included in Milling | |
| Royalty | 2.5% | ||
| Metallurgical Recovery | 93% | 88% | |
| Operating Costs | |||
| Ore Haulage (Portal to Mill) | $/ton | $44.08 | |
| Direct Processing | $/ton | $43.94 | |
| Administration and Overhead | $/ton | $78.22 | |
| Sustaining Capital | $/ton | $19.31 | |
| Mining | $/ton | $128.32 | |
| Total | $/ton | $313.87 | |
| Gold Equivalent | 1 | 74.60 | |
| Unplanned Dilution | 10% | ||
| Mine Losses | 5% | ||
| Incremental Cut Off Grade | 0.090 | ||
| Cut-off Grade | Eq. opt | 0.288 | |
| Minimum Mining Width | feet | 4 | |
| Grade Thickness cut-off | Eq. opt-ft | 1.269 | |
| Practical Mining LLC | February 5, 2018 |
| Page 218 | Mineral Reserve Estimates | Klondex Mines Ltd. |
Table 15-2 Mineral Reserves as of November 30, 2017
| Au | Ag | Au Equiv. | |||||
| Tons | Au Eq | Ounces | Ounces | Ounces | |||
| Vein Designation | (000's) | Au opt | Ag opt | opt | (000's) | (000's) | (000's) |
| Proven Reserves | |||||||
| Joyce | 52 | 1.089 | 1.005 | 1.102 | 57.0 | 52.6 | 57.7 |
| Karen | 45 | 1.105 | 1.151 | 1.120 | 49.6 | 51.7 | 50.3 |
| Vonnie | 6 | 1.298 | 0.952 | 1.311 | 8.2 | 6.0 | 8.3 |
| 20 | 3 | 0.441 | 0.304 | 0.445 | 1.2 | 0.8 | 1.2 |
| 6 | 0.5 | 0.330 | 1.045 | 0.344 | 0.2 | 0.5 | 0.2 |
| 14 | 0.7 | 0.535 | 0.179 | 0.537 | 0.4 | 0.1 | 0.4 |
| 13 | 0.4 | 0.256 | 0.126 | 0.258 | 0.1 | - | 0.1 |
| 37 | 0.4 | 0.430 | 0.187 | 0.432 | 0.2 | 0.1 | 0.2 |
| Proven Reserves | 108 | 1.079 | 1.033 | 1.092 | 116.8 | 111.9 | 118.3 |
| Probable Reserves | |||||||
| Joyce | 37 | 0.808 | 0.873 | 0.819 | 30.0 | 32.4 | 30.4 |
| Karen | 59 | 0.380 | 0.363 | 0.385 | 22.4 | 21.4 | 22.7 |
| Vonnie | 9 | 0.980 | 0.709 | 0.990 | 8.7 | 6.3 | 8.7 |
| 20 | 41 | 0.375 | 0.327 | 0.380 | 15.2 | 13.3 | 15.4 |
| 12 | 6 | 0.888 | 0.250 | 0.891 | 5.1 | 1.4 | 5.1 |
| 63 | 9 | 0.469 | 0.643 | 0.478 | 4.2 | 5.8 | 4.3 |
| 61 | 9 | 0.438 | 0.440 | 0.444 | 4.0 | 4.0 | 4.0 |
| 6 | 9 | 0.391 | 1.205 | 0.407 | 3.6 | 11.1 | 3.8 |
| 18 | 8 | 0.424 | 0.381 | 0.429 | 3.5 | 3.1 | 3.5 |
| 8 | 4 | 0.910 | 0.598 | 0.918 | 3.4 | 2.3 | 3.5 |
| 36 | 5 | 0.501 | 0.255 | 0.505 | 2.3 | 1.1 | 2.3 |
| 14 | 4 | 0.338 | 0.284 | 0.341 | 1.2 | 1.0 | 1.2 |
| 59 | 2 | 0.632 | 0.332 | 0.637 | 1.1 | 0.6 | 1.2 |
| 55 | 3 | 0.352 | 0.279 | 0.356 | 1.0 | 0.8 | 1.0 |
| 13 | 1 | 0.709 | 0.213 | 0.711 | 0.9 | 0.3 | 0.9 |
| 31 | 2 | 0.391 | 0.191 | 0.394 | 0.8 | 0.4 | 0.8 |
| 64 | 2 | 0.432 | 1.415 | 0.451 | 0.7 | 2.4 | 0.8 |
| 5 | 1 | 0.404 | 0.183 | 0.407 | 0.6 | 0.3 | 0.6 |
| 7 | 1 | 0.409 | 0.327 | 0.414 | 0.5 | 0.4 | 0.5 |
| Probable Reserves | 211 | 0.517 | 0.514 | 0.524 | 109.1 | 108.3 | 110.6 |
| Proven & Probable Reserves | |||||||
| Joyce | 89 | 0.972 | 0.950 | 0.985 | 86.9 | 85.0 | 88.1 |
| Karen | 104 | 0.694 | 0.704 | 0.703 | 72.1 | 73.2 | 73.1 |
| Vonnie | 15 | 1.113 | 0.810 | 1.124 | 16.9 | 12.3 | 17.0 |
| 20 | 43 | 0.379 | 0.326 | 0.384 | 16.4 | 14.1 | 16.6 |
| 12 | 6 | 0.888 | 0.250 | 0.891 | 5.1 | 1.4 | 5.1 |
| 63 | 9 | 0.469 | 0.643 | 0.477 | 4.2 | 5.8 | 4.3 |
| 61 | 9 | 0.438 | 0.440 | 0.444 | 4.0 | 4.0 | 4.0 |
| 6 | 10 | 0.388 | 1.197 | 0.404 | 3.8 | 11.6 | 3.9 |
| 18 | 8 | 0.423 | 0.381 | 0.428 | 3.5 | 3.1 | 3.5 |
| 8 | 4 | 0.910 | 0.598 | 0.918 | 3.4 | 2.3 | 3.5 |
| 36 | 5 | 0.501 | 0.255 | 0.505 | 2.3 | 1.1 | 2.3 |
| 14 | 4 | 0.370 | 0.267 | 0.374 | 1.6 | 1.1 | 1.6 |
| 59 | 2 | 0.632 | 0.332 | 0.637 | 1.1 | 0.6 | 1.2 |
| 55 | 3 | 0.352 | 0.279 | 0.356 | 1.0 | 0.8 | 1.0 |
| Practical Mining LLC | February 5, 2018 |
| Klondex Mines Ltd. | Technical Report for the Fire Creek Project, | Page 219 |
| Lander County, Nevada |
| Au | Ag | Au Equiv. | |||||
| Tons | Au Eq | Ounces | Ounces | Ounces | |||
| Vein Designation | (000's) | Au opt | Ag opt | opt | (000's) | (000's) | (000's) |
| 13 | 2 | 0.603 | 0.192 | 0.605 | 1.0 | 0.3 | 1.0 |
| 31 | 2 | 0.391 | 0.191 | 0.394 | 0.8 | 0.4 | 0.8 |
| 64 | 2 | 0.431 | 1.412 | 0.450 | 0.7 | 2.4 | 0.8 |
| 5 | 1 | 0.404 | 0.183 | 0.407 | 0.6 | 0.3 | 0.6 |
| 7 | 1 | 0.409 | 0.327 | 0.414 | 0.5 | 0.4 | 0.5 |
| 37 | 0.6 | 0.327 | 0.163 | 0.330 | 0.2 | 0.1 | 0.2 |
| Proven & Probable Reserves | 319 | 0.708 | 0.690 | 0.717 | 226.0 | 220.2 | 228.9 |
| Notes: | ||
| 1. | Mineral reserves have been estimated with a gold price of $1,200/ounce and a silver price of $17.00/ounce; |
|
| 2. | Metallurgical recoveries for gold and silver are 93% and 88% respectively; |
|
| 3. | Gold equivalent ounces are calculated on the basis of one ounce of gold being equivalent to 74.60 ounces of silver; |
|
| 4. | Mineral reserves are estimated at a cutoff grade of 0.288 Au opt and an incremental cutoff grade of 0.090 Au opt, and; |
|
| 5. | Mine losses of 5% and unplanned mining dilution of 10% have been applied to the designed mine excavations. |
|
Fire Creek mineral reserves could be materially affected by economic, geotechnical, permitting, metallurgical or other relevant factors. Mining and processing costs are sensitive to production rates. A decline in the production rate can cause an increase in costs and cutoff grades resulting in a reduction in mineral reserves. Geotechnical conditions requiring additional ground support or more expensive mining methods will also result in higher cutoff grades and reduced mineral reserves.
The Project has the necessary permits to continue exploration and current operations. Failure to maintain permit requirements may result in the loss of critical permits necessary for continued operations.
The proximity of designed reserve excavations and existing mine workings is illustrated in Figure 15-1.
| Practical Mining LLC | February 5, 2018 |
| Page 220 | Mineral Reserve Estimates | Klondex Mines Ltd. |
![]()
| Practical Mining LLC | February 5, 2018 |
| Klondex Mines Ltd. | Technical Report for the Fire Creek Project, | Page 221 |
| Lander County, Nevada |
| 16. | Mining Methods |
| 16.1. | Mine Development |
| 16.1.1. | Access Development |
Access to the mining areas is by haulage drifts, up to 15 feet wide and between 15 to 17 feet high. Drift gradients vary from – 15% to + 15% to reach the desired elevation. Secondary drifts, spiral ramps and vertical raises connect the haulage drifts to provide a pathway for ventilation to the surface and serve as a secondary escape way (Figure 16-1).

| 16.1.2. | Ground Support |
The ground conditions at the Project are typical of the northern Nevada extensional tectonic environment. Joint spacing varies from a few inches to a foot or more. To date, split sets and Swellex rock bolts along with welded wire mesh have been successfully employed to control all conditions encountered during decline development and stoping. Shotcrete has also been liberally applied to prevent long-term deterioration of the rock mass.
| Practical Mining LLC | February 5, 2018 |
| Page 222 | Mining Methods | Klondex Mines Ltd. |
All major access drifts require a minimum of wire mesh and rock bolts for support. Under more extreme conditions, resin anchor bolts, cable bolts, and shotcrete can be used to supplement the primary support. Steel sets and spiling may also be used to support areas with the most severe ground conditions.
| 16.1.3. | Ventilation and Secondary Egress |
Underground mining relies heavily on diesel equipment to extract the mineralized material and waste rock and to transport backfill to the stopes. Diesel combustion emissions require large amounts of fresh ventilation air to remove the diesel exhaust and maintain a healthy working environment. A combination of the main access drifts and vertical raises to the surface are arranged in a manner to provide a complete ventilation circuit. The mine portal can be used as either an intake or an exhaust. Air movement is be facilitated by primary ventilation fans placed at the surface or underground in strategic locations. Small auxiliary fans and ducting draw primary ventilation air directly into the working faces.
The ventilation raise connecting the main decline to the surface is approximately 690 feet in length and is entirely lined with corrugated metal pipe to support the ribs and maintain a uniform cross sectional area. Since the vertical extent of the raise exceeds the maximum 300 feet permitted for a continuous ladder way, it has been equipped with an automatic hoist and personnel capsule for evacuating the mine in the event of an emergency.
| 16.2. | Mining Methods |
Mining methods include several different techniques such as end slice stoping with delayed backfill, also referred to as longhole stoping, and drift and fill stoping. The final choice of mining method will depend upon the geometry of the stope block, proximity to main access ramps, ventilation and escape routes, the relative strength or weakness of the mineralized material and adjacent wall rock, and finally the value or grade of the mineralized material. The choice of mining method will not be made until after the stope delineation and definition drilling is completed. Each method will be discussed briefly in the following paragraphs.
| 16.2.1. | End Slice Stoping |
End slice, or longhole, stoping has the highest degree of mechanization of the three expected mining methods at the Project, is the lowest cost method and generally provides the lowest total cost per ounce. End slice stoping requires the greatest amount of waste development and can be mined to a minimum width of four feet. The potential for unplanned wall dilution with this method is the greatest. Figure 16-2 shows a typical end slice stoping arrangement.
| Practical Mining LLC | February 5, 2018 |
| Klondex Mines Ltd. | Technical Report for the Fire Creek Project, | Page 223 |
| Lander County, Nevada |

To prepare an area for end slicing, access for the mobile equipment must be developed to each level. Mine utilities for communication, water, electrical power, and compressed air must also be provided through the access development. Level spacing is limited to 40 feet to control dilution and may be increased if vein geometry, ground conditions, and vein thickness are favorable. The minimum level spacing achievable with this method is 30 to 35 feet and is limited by the stability of the intervening pillar between levels. Mining will progress upwards from the lowest level of the stope block. Drilling and blasting will be carried out from the drift above the active stope while the broken mineralized material will be removed from the bottom drift. The loader used for excavation is equipped with line of sight remote control to allow the removal of all blasted rock without exposing the operator to the open stope and the potential risk of ground falls.
The amount of mineralization that can be removed prior to backfilling is constrained by the strength of the gangue material and jointing present immediately adjacent to the stope. Backfill, consisting of either waste rock or cemented rock fill, is transported from the surface using the same haulage equipment used to remove mineralized material and waste rock from the mine. Where possible, waste rock is retained within the mine and placed directly into a stope requiring backfill. The stope is backfilled from the drift used for drilling and blasting.
Cemented rock fill (CRF), which consists of screened mine waste, fly ash, and cement is mixed on the surface and transported underground in the same trucks used to haul blasted rock to the surface. CRF is placed to create an artificial pillar where additional mining is planned adjacent to or underneath the stope being filled. Normal backfill unconfined compressive strengths (UCS) of 400 to 600 pounds per square inch (psi) are achieved by blending a mixture containing up to four percent cement and fly ash. When mining is anticipated to occur below the backfilled stope, the UCS of the fill will be increased up to 1,000 psi by adding up to eight percent cementitious binder.
| Practical Mining LLC | February 5, 2018 |
| Page 224 | Mining Methods | Klondex Mines Ltd. |
| 16.2.2. | Drift and Fill Stoping |
This method can be employed where the wall rock is too weak for end slice stoping, the vein dip is less than 50° or where there is variable vein geometry. Drift-and-fill stoping is the highest cost mining method of the two considered. A typical drift-and-fill stope arrangement is shown in Figure 16-3.

A drift and fill stope is initiated by driving a waste crosscut from the access ramp to the vein. The cross cut is driven at a negative gradient up to minus 15% in order to reach the lowest elevation of the stope. Drifting along the vein strike progresses in both directions from the cross cut. Drift dimensions are a minimum of six feet in width and 10 feet high. The width can be increased to accommodate wider sections of the vein.
| Practical Mining LLC | February 5, 2018 |
| Klondex Mines Ltd. | Technical Report for the Fire Creek Project, | Page 225 |
| Lander County, Nevada |
Once the end of the stope is reached, the drift is backfilled with CRF if there is unmined ore below or with unconsolidated waste backfill (GOB) if mining below is not planned. Once filled, breasting down the waste above the back of the cross cut begins at a gradient sufficient that the sill of the crosscut is now at the same elevation as the back of the preceding drift. This process will be repeated until all the vein within reach from the cross cut has been mined out, and mining will proceed from the next level above.
| 16.2.3. | Cut-and-Fill Stoping |
Cut-and-fill stoping is an option where mineralization extends above the uppermost waste development accesses. A cut and fill stope is initiated by driving a waste crosscut from the access ramp to the vein. The access is then prepared for a timbered raise to advance upward on the vein. The raise consists of segmented compartments which house an ore chute, a manway with ladders, and a small hoist for supplying the stope with necessary supplies. Cut dimensions are a nominal fur feet in width and ten feet high. The width can be increased to accommodate wider sections of the vein. As the cuts are developed, the ore is slushed back to the timbered raise and loaded into trucks at the bottom of the ore chute. Cellular grout is pumped up the raise for backfill prior to breasting down the next cut.
One major advantage of the cut-and-fill method is the reduced need for waste development to access every vertical sublevel. Instead, the ladderways can be driven up to 300 feet vertically without additional level accesses. One major drawback, however, is the cost of cellular fill and timber, as well as slower ore production compared to longhole stoping. The Company has employed cut and fill stoping via timbered raises at its other properties and has developed safe and efficient procedures that can be utilized here as well.
| 16.2.4. | Backstoping |
An alternative to cut and fill stoping, in areas where mineralization extends above the uppermost waste development access, is backstoping. Backstoping eliminates the requirement for a timbered raise to be driven up from the level. It is safer and more productive than cut and fill.
After accessing the vein via a cross-cut, a sill drift is driven in the vein, up to 200 feet long. Blast holes are then drilled up into the mineralized vein, usually on an angle and charged from the bottom. The stope material is then blasted down into the void created by the drift and removed with a remotely operated loader. The height of the backstope is limited by ground conditions and consistency of vein dip angle – and not likely to exceed 60 feet. Some initially mining by backstope is underway.
| Practical Mining LLC | February 5, 2018 |
| Page 226 | Mining Methods | Klondex Mines Ltd. |
Cut and fill stoping is more selective than backstoping. Additionally, mining a backstope eliminates the possibility of developing further sublevels above the stope without more waste development. Backstopes are also difficult to fill.
| 16.3. | Underground Labor |
Klondex 2018 budget work force requirements for the Mine are presented in Table 16-1. This estimate was prepared using current mining and development plans and historical Fire Creek productivities. The Mine will operate 24 hours per day seven days per week. The Mine workforce will be divided into four crews scheduled to work 14 out of every 28 days.
Table 16-1 Underground Workforce 2018
| Job Classification | Count |
| Miners | 54 |
| Nin-Miner Hourly | 42 |
| Supervision/Technical | 29 |
| Total | 125 |
| 16.4. | Mobile Equipment Fleet |
Table 16-2 lists the Fire Creek current mining fleet. This fleet is along with replacements and additions planned and budgeted in 2018 are sufficient to meet the mine demands. The mining fleet is maintained under contract with a major mining equipment distributor. The maintenance labor requirements are not included in Table 16-1.
Table 16-2 Underground Mobile Equipment
| Units on | |
| Description | Site |
| Sandvik Jumbo Drill | 4 |
| Sandvik Bolter | 2 |
| Tamrock 2 Yard LHD | 4 |
| Sandvik 2 Yard LHD | 1 |
| MTI 2 Yard LHD | 1 |
| Joy 2 Yard LHD | 1 |
| Aramine 1 Yard LHD | 2 |
| Toro 4 Yard LHD | 1 |
| CAT 4 Yard LHD | 1 |
| Sandvik 6 Yard LHD | 3 |
| CAT 30 Ton Truck | 2 |
| Practical Mining LLC | February 5, 2018 |
| Klondex Mines Ltd. | Technical Report for the Fire Creek Project, | Page 227 |
| Lander County, Nevada |
| Units on | |
| Description | Site |
| Sandvik 30 Ton Truck | 1 |
| Kubota Tractor | 3 |
| Minecat Tractor | 1 |
| Cement pump | 1 |
| Champion Grader | 1 |
| CAT Dozer | 1 |
| John Deere Backhoe | 1 |
| Bobcat Skidsteer | 1 |
| JS Boomtruck | 1 |
| JS Scissor Lift | 1 |
| International Water Truck | 1 |
| Kubota Buggy | 1 |
| John Deere Buggy | 2 |
| Minecat Lube Truck | 1 |
| CAT Forklift | 2 |
| 16.5. | Mine Plan |
Historical Fire Creek productivities are listed in Table 16-3. These productivities were used to develop the production plan shown in Figure 16-4 through Figure 16-7 and Table 16-4.
The production plan is premised on proven and probable as of the effective date of this TR and does not take into account development of additional non reserve stoping areas proximal to the active mine area. Development of additional work areas and resource conversion to reserves would allow increasing the mining rate and/or the mine life.
Table 16-3 Heading Productivity
| Heading Type | Units | Daily Rate |
| Capital Development Drift | Feet/day | 16 |
| Drop Raise | Feet/Day | 5 |
| Stope Development (6 x 10) | Feet/day | 21 |
| End Slice (Longhole) Stoping | Ton/day | 160 |
| Drift and Fill Stoping | Ton/Day | 100 |
| Backfill | Ton/Day | 200 |
| Practical Mining LLC | February 5, 2018 |
| Page 228 | Mining Methods | Klondex Mines Ltd. |


| Practical Mining LLC | February 5, 2018 |
| Klondex Mines Ltd. | Technical Report for the Fire Creek Project, | Page 229 |
| Lander County, Nevada |


| Practical Mining LLC | February 5, 2018 |
| Page 230 | Mining Methods | Klondex Mines Ltd. |
Table 16-4 Annual Production and Development Plan
| Calendar Year | 20171 | 2018 | 2019 | 2020 | Total |
| Reserves Mined | |||||
| Proven Ore Mined (000's Tons) | 5.4 | 43.2 | 37.8 | 21.9 | 108.3 |
| Gold Grade (Ounce/Ton) | 0.983 | 1.014 | 1.203 | 1.015 | 1.079 |
| Silver Grade (Ounce/Ton) | 1.276 | 0.872 | 1.021 | 1.312 | 1.033 |
| Contained Gold (000's Ounces) | 5.4 | 43.8 | 45.5 | 22.2 | 116.8 |
| Contained Silver (000's Ounces) | 7.0 | 37.7 | 38.6 | 28.7 | 111.9 |
| Probable Ore Mined (000's Tons) | 3.3 | 55.1 | 59.5 | 92.9 | 210.9 |
| Gold Grade (Ounce/Ton) | 0.244 | 0.357 | 0.424 | 0.683 | 0.518 |
| Silver Grade (Ounce/Ton) | 0.231 | 0.339 | 0.411 | 0.693 | 0.514 |
| Contained Gold (000's Ounces) | 0.8 | 19.6 | 25.3 | 63.4 | 109.1 |
| Contained Silver (000's Ounces) | 0.7 | 18.7 | 24.5 | 64.4 | 108.3 |
| Total Reserves Mined (000's Tons) | 8.8 | 98.3 | 97.3 | 115.8 | 319.2 |
| Gold Grade (Ounce/Ton) | 0.702 | 0.645 | 0.727 | 0.746 | 0.708 |
| Silver Grade (Ounce/Ton) | 0.879 | 0.573 | 0.648 | 0.811 | 0.690 |
| Contained Gold (000's Ounces) | 6.2 | 63.4 | 70.7 | 85.6 | 226.0 |
| Contained Silver (000's Ounces) | 7.7 | 56.4 | 63.0 | 93.1 | 220.2 |
| Contained Gold Equiv. (000's Ounces) | 6.3 | 64.2 | 71.6 | 86.9 | 228.9 |
| Production Mining | |||||
| Stope Development and Cut and Fill Mining (000's Tons) | 2.2 | 39.9 | 16.8 | 27.5 | 86.3 |
| Longhole Stope Mining (000's Tons) | 6.6 | 58.4 | 80.6 | 87.3 | 232.9 |
| Backfill (000's Tons) | 4.6 | 63.1 | 52.8 | 64.3 | 184.8 |
| Waste Mining | |||||
| Expensed Drift Waste (Feet) | 293 | 1,803 | 727 | 2,937 | 5,758 |
| Expensed Waste (000's Tons) | 1.8 | 11.8 | 4.6 | 20.1 | 38.3 |
| Primary Capital Drifting (Feet) | 359 | 3,196 | 1,165 | 2,021 | 6,741 |
| Secondary Capital Drifting (Feet) | - | 1,204 | 144 | 317 | 1,664 |
| Capital Raising (Feet) | - | 168 | - | 246 | 414 |
| Capitalized Mining (000's Tons) | 5.9 | 68.4 | 24.6 | 39.7 | 138.5 |
| Total Tons Mined (000's Tons) | 16.5 | 178.5 | 126.5 | 175.6 | 496.0 |
| Ore and Waste Mining Rate (tpd) | 532 | 489 | 347 | 481 | 441 |
| 1. | The mine plan for 2017 includes only the month of December |
| Practical Mining LLC | February 5, 2018 |
| Klondex Mines Ltd. | Technical Report for the Fire Creek Project, | Page 231 |
| Lander County, Nevada |
| 17. | Recovery Methods |
A local contractor transports mineralized material from Fire Creek to the Midas Mill on public roadways which is a distance of approximately 131 miles. Mineralized material from several Klondex mines is processed through the crushing circuit. The mill has two 500-ton fine ore bins located between the secondary crusher and the ball mill and one bin is dedicated to each mine. Head samples are taken on each reclaim conveyor at regular intervals, and tonnage measured by a belt scale prior to comingling the mineralization streams.
The Midas Mill was constructed in 1997 and has a nameplate capacity of 1,200 tpd. The mill uses conventional grind-leach technology with Counter Current Decantation (CCD) followed by Merrill Crowe precipitation. A CIL circuit was added in 2017. Doré refining is finalized by Asahi refineries in Salt Lake City, Utah. Midas has performed toll milling periodically since 2008.
| 17.1. | Mill Capacity and Process Facility Flow Diagram |
A process facility flow sheet is shown in Figure 17-1. Underground mineralized material is extracted and delivered from Fire Creek and the Midas Mine to the run of mine (ROM) pad where it is placed on short term ROM mineralized material stockpiles. Typical mineralized material classifications are: low-grade less than 0.3 opt Au or less than six opt silver; high-grade (0.3 to 0.5 opt gold or six to 20 opt silver); and ultra-high-grade (more than 0.5 opt gold or more than 20 opt silver). Separate stockpiles are maintained for each mine. Underground mineralized material is hand-picked on the pad for scrap wire mesh and rock bolts before being fed to the crusher.
Mineralized material is crushed in two stages through a 30-inch by 40-inch primary jaw crusher and 53-inch secondary cone crusher. Both jaw and secondary crusher products are fed to a six feet by 20 feet Nordberg double deck vibrating screen fitted with two-inch top deck and one-half inch bottom deck screen panels to produce a 95% passing one-half inch product. Magnetic material is removed from the crusher screen feed by a continuous self-cleaning belt magnet to protect the cone crusher from damage. Screen undersize is conveyed to one of two 500-ton fine mineralized material bins.
Crushed and screened material is transported from the fine material bins by individual belt feeders into the 10.5 feet by 15 feet rubber lined Nordberg ball mill. The ball mill is charged with a blend of three-inch and two-inch grinding balls to maintain an operating power draw of 800 horse power (HP). Mill discharge pulp is pumped to a nest of four ten-inch Krebs cyclones (three duty and one standby) for classification. Cyclone overflow, at 80% passing 200 mesh, reports to the trash screen. Cyclone underflow reports to a two millimeters (mm) aperture scalping screen, with the screen undersize being distributed by three-way splitter to the ball mill, verti-mill, and gravity circuit. Lead nitrate solution is added to the ball mill feed chute to enhance silver leach kinetics.
| Practical Mining LLC | February 5, 2018 |
| Page 232 | Recovery Methods | Klondex Mines Ltd. |
A split of the screened cyclone underflow reports to the 250 HP verti-mill for open circuit grinding with the verti-mill discharge overflowing back to the primary ball mill discharge pump box. The verti-mill is charged with one inch grinding balls. A split of the screened cyclone underflow also reports to the 20-inch Knelson concentrator for gravity gold recovery. The Knelson operates on a 30-minute cycle providing concentrate for cyanidation in the CS500 Acacia Leach Reactor which conducts three 750 to 1,000 kg batch leaches each week. Pregnant solution from the leach reactor reports to the CCD circuit pregnant solution tank.
Cyclone overflow is screened to remove any plastic debris before reporting to a 42.5 feet diameter pre-leach thickener. Thickener underflow at 50% solids is pumped to the leach circuit consisting of eight 28 feet by 30 feet air sparged leach tanks, providing a leach residence time of approximately 90 hours at 600 tons per hour (tph) feed rate. The pH in the first leach tank is maintained at 10.4 to 11.0 through the addition of hydrated lime, produced from the on-site slaking of pebble lime. Sodium cyanide concentration in the second leach tank is maintained at 1.25 grams per liter (gpl).
The leach circuit discharge is pumped to the first of five 42.5 feet diameter CCD thickeners, where the pulp is counter-current washed with barren Merrill Crowe liquor at a wash ratio of approximately 3.2:1. CCD thickener underflow at each stage is maintained at between 50 and 54% solids to maximize wash efficiency.
Pregnant CCD solution at a pH of 11.0 and 400 gallons per minute (gpm) flow rate is fed to one of two disc filters operating in duty/standby mode utilizing diatomaceous earth for clarification. The clarified pregnant solution is then pumped to a packed bed vacuum de-aeration tower, prior to the addition of zinc dust and lead nitrate to precipitate precious metals from solution. The Merrill Crowe solution is then pumped to one of two plate and frame filter presses for sludge recovery. The sludge is collected from a filter press weekly and smelted to produce 5,500 ounce silver and gold doré bars.
Tailings pulp from the last CCD thickener is pumped to the Inco SO2/Air circuit for cyanide destruction. Cyanide destruction is performed in a single 20 feet by 20 feet agitated, air sparged tank providing approximately one hour reaction time. Ammonium bi-sulphite, lime, and copper sulphate as a catalyst are added to the tank on a ratio control basis to achieve target weak acid dissociable (WAD) cyanide permitted levels. Routine picric acid analyses are used by operating personnel to maintain WAD cyanide in the INCO cyanide destruction tank discharge pulp at target levels.
| Practical Mining LLC | February 5, 2018 |
| Klondex Mines Ltd. | Technical Report for the Fire Creek Project, | Page 233 |
| Lander County, Nevada |
Following cyanide destruction, the plant tailings pulp is thickened before discharged to one of two lined tailings storage facility (TSF) for consolidation and water recovery. Clarified decant pond solution is evaporated or returned to the mill process water tank for reuse in the plant.
| Practical Mining LLC | February 5, 2018 |
| Page 234 | Recovery Methods | Klondex Mines Ltd. |
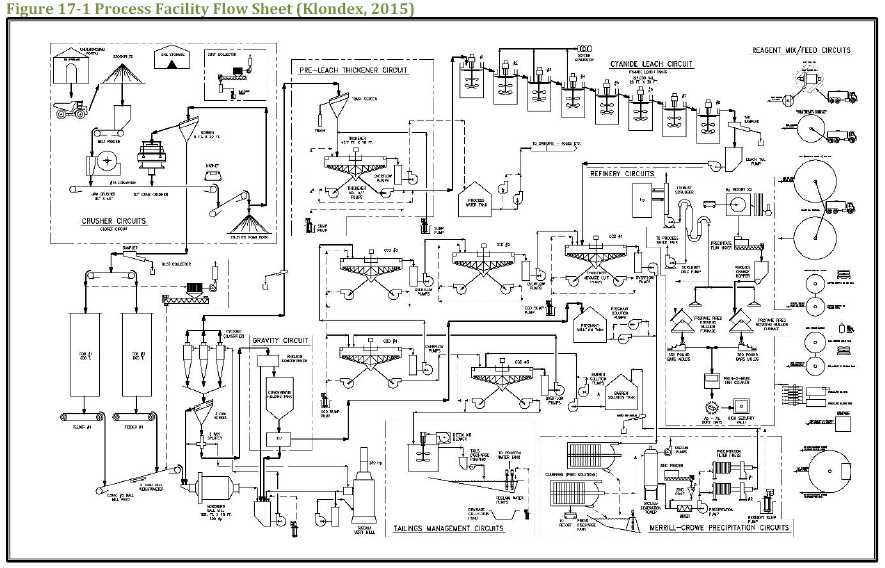
| Practical Mining LLC | February 5, 2018 |
| Klondex Mines Ltd | Technical Report for the Fire Creek Project, | Page 235 |
| Lander County, Nevada |
| 17.2. | Physical Mill Equipment |
The Midas Mill equipment list is shown in Table 17-1.
Table 17-1 Process Equipment Itemization by Area
| Description | Number | Spare | Note | Description | Number | Spare | Note |
| AREA 350 GRINDING | |||||||
| BIN, MILL TROMMEL | 1 | HEATER, MILL FEED | 1 | 5 kW | |||
| REJECTS | CONVEYOR GALLERY | ||||||
| CS Construction, w/lift | w/fan | ||||||
| lugs, 6.5' x 6.5' x 4' | |||||||
| CHUTE, BALL | 1 | LAUNDER, MILL | 1 | ||||
| TRANSFER | DISCHARGE | ||||||
| CS, Rubber Lined | |||||||
| CHUTE, FINE ORE BIN | 1 | PUMP BOX, CYCLONE FEED | 1 | ||||
| DISCHARGE | 6' x 6' x 6', 1200 gal, CS, Rubber | ||||||
| CS Plate Construction, | Lined | ||||||
| AR Plate Lined | |||||||
| CHUTE, FINE ORE | 1 | PUMP, CYLCONE FEED | 1 | 1 | 50 HP | ||
| FEEDER DISCHARGE | 550 gpm, 4 x 3, Centrifugal | ||||||
| CS Plate Construction, | Slurry, VFD, Rubber Lined CS | ||||||
| AR Lined | |||||||
| CHUTE, MILL FEED | 1 | SAMPLER, CYCLONE | 1 | 0.5 HP | |||
| Includes ball charge | OVERFLOW | ||||||
| attachment, CS | 223 gpm, single stage slurry | ||||||
| Construction, AR Lined | cutter, CS Rubber Lined | ||||||
| CHUTE, BALL | 1 | BELT SCALE, MILL FEED | 1 | ||||
| DISCHARGE | 30 tph, 24", 4 idler weigh bridge | ||||||
| CS Plate Construction, | |||||||
| AR Plate Lined | |||||||
| CHUTE, MILL | 1 | CYCLONE PACKAGE | 2 | ||||
| TROMMEL COVER | 2 - DS15LB-1826 Cyclones, | ||||||
| CS Plate Construction | radial manifold, w/ launders | ||||||
| CHUTE, MILL | 1 | DUST COLLECTOR | 1 | 20 HP | |||
| TROMMEL REJECTS | PACKAGE | ||||||
| CS Plate Construction | PULSE Air, induction, 5000 | ||||||
| cfm, 0.5 psi | |||||||
| CONVEYOR, MILL | 1 | 7.5 HP | FEEDER, FINE ORE | 1 | 5 HP | ||
| FEED | DISCHARGE | ||||||
| 30 tph, troughed rubber | Rotary Valve | ||||||
| type, 36" width, 116' | |||||||
| Length, 12' lift, 50 fpm | |||||||
| FAN, FINE ORE | 2 | 1.0 HP | LUBE SYSTEM, BALL MILL | 2 | 5 kW | ||
| LOWER BUILDING | Air operated, w/heater | ||||||
| VENT 4000 cfm, | |||||||
| Wall exhaust | |||||||
| FEEDER, FINE ORE | 1 | 5.0 HP | MILL, BALL | 1 | 800 HP | ||
| 30 tph, 30" width, 29' | 10.5' Diameter, 14' Length, | ||||||
| length, VFD | Rubber Lined |
| Practical Mining LLC | February 5, 2018 |
| Page 236 | Recovery Methods | Klondex Mines Ltd. |
| Description | Number | Spare | Note | Description | Number | Spare | Note |
| AREA 410 LEACH | |||||||
| Knelson gravity | CS 500 Acacia leach reactor | ||||||
| concentrator, 20 inch | |||||||
| AGITATOR, LEACH | 8 | 40 HP | SAMPLER, LEACH TAILS | 1 | 0.5 HP | ||
| 109" Diam., Dual | 330 gpm, Slurry Cutter | ||||||
| Impellers, 8' sch 80 Shaft, | |||||||
| 292" Length, CS | |||||||
| Construction, Rubber | |||||||
| Lined | |||||||
| FAN, PRE-LEACH | 1 | 0.5 HP | SCREEN, TRASH | 2 | 2.5 HP | ||
| THICKENER VENT | 4' X 5', Vibrating | ||||||
| 3000 CFM @ 0.25 WG | |||||||
| HEATER, PRE-LEACH | 1 | 35 HP | STANDPIPE, PRE-LEACH | 1 | |||
| THICKENER VENT | THICKENER O/F 2.5' | ||||||
| 40,000 BTU, propane | Diam., 20' high, Open Top, CS | ||||||
| Construction | |||||||
| LAUNDER, LEACH, | 8 | PUMP BOX, CCD FEED | 1 | ||||
| INTERTANK | SPLIT TO #1 AND #2 600 | ||||||
| CS Construction, w/Gate | gal, 4X4X6' w/weirs, CS | ||||||
| Construction, Rubber Lined | |||||||
| LAUNDER, LEACH, | 7 | PUMP, PRE-LEACH | 1 | 7.5 HP | |||
| INTERTANK bypass | THICKENER AREA SUMP | ||||||
| CS Construction, w/Gate | 200 gpm, 2.5" Diam. Vertical | ||||||
| Slurry, Rubber Lined | |||||||
| PUMP BOX, LEACH | 1 | PUMP, LEACH THICKENER | 1 | 7.5 HP | |||
| TAILS | AREA SUMP 200 gpm, 2.5" | ||||||
| 6' x 6' x 6', 1200 gal, CS, | Diam. Vertical Slurry, Rubber | ||||||
| Rubber Lined | Lined | ||||||
| PUMP, LEACH TAILS | 2 | 1 | 7.5 HP | TANK, LEACH | 8 | ||
| 327 gpm, 4X3, | 28' x 30', Open top, CS | ||||||
| Centrifugal, CS Rubber | Construction | ||||||
| Lined | |||||||
| PUMP, PRE-LEACH | 1 | 1 | 15 HP | THICKENER, PRE-LEACH | 1 | 15 HP | |
| THICKENER O/F | 59.5' Diameter, 19.5' Height, | ||||||
| 533 gpm, 3X4, | Feed well, All Gear, CS | ||||||
| Centrifugal, CS | Construction | ||||||
| Construction, Packed Seal | |||||||
| PUMP, PRE-LEACH | 1 | 10 HP | |||||
| THICKENER U/F | |||||||
| 330 gpm, 3X4, | |||||||
| Centrifugal, CS | |||||||
| Construction, Rubber | |||||||
| Lined | |||||||
| AREA 430 CCD THICKENING | |||||||
| FAN, CCD ARE VENT | 4 | 1 HP | PUMP, CCD THICKENER U/F | 5 | 5 | 4.5 HP | |
| 6000 cfm, Wall Exhaust | ADVANCE | ||||||
| 160 gpm, 3X4, Centrifugal, CS | |||||||
| Construction, Packed Seal | |||||||
| Practical Mining LLC | February 5, 2018 |
| Klondex Mines Ltd | Technical Report for the Fire Creek Project, | Page 237 |
| Lander County, Nevada |
| Description | Number | Spare | Note | Description | Number | Spare | Note |
| HEATER, CCD ARE | 4 | 1 HP | SAMPLER, LEACH TAILS | 1 | 0.5 HP | ||
| VENT | 330 gpm, Slurry Cutter | ||||||
| 20 MBH, Propane | |||||||
| w/motor | |||||||
| PUMP, LEACH CCD | 1 | 7.5 HP | STANDPIPE, CCD thickener | 5 | |||
| AREA SUMP | 2.5' Diam., 20' high, Open Top, | ||||||
| 200 gpm, 2.5" Diam. | CS Construction | ||||||
| Vertical Slurry, Rubber | |||||||
| Lined | |||||||
| PUMP, CCD | 5 | 1 | 7.5 HP | THICKENER, CCD | 5 | ||
| THICKENER O/F | 42.5' Diam. 19.5' high, feed | ||||||
| ADVANCE | well, all gear | ||||||
| 300 gpm, 3X4, | |||||||
| Centrifugal, CS | |||||||
| Construction, Packed Seal | |||||||
| AREA 450 CYANIDE DESTRUCTION | |||||||
| AGITATOR, CYANIDE | 1 | 125 HP | TANK, CYANIDE | 1 | |||
| DESTRUCTION | DESTRUCTION | ||||||
| 121" Diam., Dual | 20' X 20', Open Top, CS | ||||||
| Impellers, 10' sch 160 | Construction | ||||||
| Shaft, 292" Length, CS | |||||||
| Const., Rubber Lined | |||||||
| SAMPLER, CYANIDE | 1 | 0.5 HP | |||||
| DESTRUCTION | |||||||
| 200 gpm, Slurry Cutter | |||||||
| AREA 470 TAILING HANDLING | |||||||
| PUMP, TAILINGS | 1 | 10 HP | PIPE, TAILINGS | 800 ft | |||
| DISTRUBUTION | 8" HDPE, SDR 11 | ||||||
| 420 gpm, 3X4, | |||||||
| Centrifugal, CS | |||||||
| Construction, Rubber | |||||||
| Lined | |||||||
| PUMP, CCD | 5 | 1 | 7.5 HP | PIPE, TAILINGS | 800 ft | ||
| THICKENER U/F | 12" HDPE, SDR 11 | ||||||
| ADVANCE | |||||||
| 160 gpm, 3X4, | |||||||
| Centrifugal, CS | |||||||
| Construction, Rubber | |||||||
| Lined | |||||||
| AREA 510 MERRILL CROWE | |||||||
| FILTER, CLARIFYING | 1 | 1 HP | PUMP, PREGNANT | 1 | 1 | 30 HP | |
| 400 ft2, 210 gpm, 25 ppm | SOLUTION | ||||||
| solids, 54" diam. X 8', | 600 gpm, 3X4, CS Construction | ||||||
| flushing | |||||||
| PUMP, BARREN | 1 | 1 | 15 HP | PUMP, FILTER FEED | 1 | 1 | 15 HP |
| SOLUTION | 600 gpm, 3X4, CS Construction, | ||||||
| 600 gpm, 4X8, | flooded mechanical seal | ||||||
| Centrifugal, CS | |||||||
| Construction | |||||||
| Practical Mining LLC | February 5, 2018 |
| Page 238 | Recovery Methods | Klondex Mines Ltd. |
| Description | Number | Spare | Note | Description | Number | Spare | Note |
| FEEDER, ZINC | 1 | TANK, DEAERATION | 1 | ||||
| 50 lb./hr | 3' Diam. X 20' high, 22 in. water | ||||||
| vacuum | |||||||
| AREA 550 REAGENTS | |||||||
| PUMP, FLOCCULANT | 1 | 1.5 HP | PUMP, ABS METERING | 1 | 1 | ||
| METERING | 75 gpm, Metering Type, | ||||||
| 2 gpm, Progressive Cavity | Mechanical Seal | ||||||
| PUMP, FLOCCULANT | 5 | 1 HP | TANK, COPPER SULFATE | 1 | |||
| METERING | STORAGE 2900 | ||||||
| 0.5 gpm, Progressive | gal, 8' Diameter X 9' high, | ||||||
| Cavity | closed, SS Construction | ||||||
| PUMP, REAGENT | 3 | 1 | 1 HP | FLOCCULANT PACKAGE, | 1 | 3 HP | |
| METERING | SELF CONTAINED Includes | ||||||
| 25 gpm, Metering Type | Agitator, Blower, Bin Feeder, | ||||||
| Mixer, Tanks, SS Construction | |||||||
| AREA 650 UTILITIES | |||||||
| PUMP, PROCESS | 1 | 125 HP | BLOWER, CYANIDE | 1 | 75 HP | ||
| WATER | DETOXIFICATION | ||||||
| 1200 gpm, 6X8, CS | 1000 cfm, Rotary, Two Stage, | ||||||
| Construction, Packed Seal | Intercooler, Filter Intake | ||||||
| BLOWER, LEACH | 1 | 30 HP | |||||
| TANK | |||||||
| 320 cfm @ 20 psig, | |||||||
| Rotary, Two Stage, | |||||||
| Intercooler, Filter Intake |
| 17.3. | Operation and Recoveries |
Fire Creek mineralization performs quite well under direct cyanidation with daily recoveries as high as 95.1% for gold and up to 95% for silver. The process performance is consistent with gold recovery having a standard deviation of less than two percent. Variances in gold recovery are due to the head grade and grind size, and do not appear to be associated with mineralized material type. The standard deviation of silver recovery is less than four percent with variance due to head grade, grind size, and clay content. Clay enriched mineralization often has higher silver to gold ratios and tend to present recovery difficulties. Recoveries occasionally fall outside the expected distribution because of plant or operating issues. The current grind is 80% passing 200 mesh.
| 17.4. | Tailings Storage Capacity |
Klondex completed an expansion of the current TSF in late 2015 by raising the existing embankment approximately four feet using an engineered retaining wall. This expansion option had the advantage of staying inside the existing TSF footprint and was permitted with a minor modification to the existing plan of operations. Engineering and permitting for a new TSF is underway.
| Practical Mining LLC | February 5, 2018 |
| Klondex Mines Ltd | Technical Report for the Fire Creek Project, | Page 239 |
| Lander County, Nevada |
| 17.5. | Processing Costs |
Midas Mill operating costs from 2012 to 2016 are summarized in Table 17-2.
Table 17-2 Midas Mill Operating Costs
| $/ton | Total Tonnage | |||||
| Year | Budget | Actual | Variance | Budget | Actual | Variance |
| 2012 | $33.12 | $35.02 | $1.90 | 373,000 | 330,000 | -43,000 |
| 2013 | $35.49 | $39.05 | $3.56 | 255,600 | 207,600 | -48,000 |
| 2014 1 | $62.53 | $57.49 | -$5.04 | 174,425 | 171,818 | -2,607 |
| 2015 | $56.83 | $48.06 | -$8.77 | 215,870 | 261,290 | 45,420 |
| 2016 | $49.88 | $44.36 | $5.52 | 279,912 | 311,534 | 31,622 |
| Note: | ||
| 1. | Klondex became the operator of the Midas Mill on February 11, 2014. Newmont was the prior operator. | |
Future processing cost projections reflect 2017 consumption rates and pricing levels for reagents, and electrical power. Adequate water is available from onsite supply wells and the Midas Mine.
| 17.6. | Production |
Doré is shipped to the refinery as 5,500-ounce bars that average approximately 3.94% gold and 90.1% silver plus minor constituents, including less than two percent selenium. Table 17-3 provides an annual summary of the processing at the Midas Mill of mineralized material extracted at Fire Creek.
Table 17-3 Fire Creek Mineralized Material Processed at the Midas Mill
| Project to | |||||
| 2014. 1 | 2015 | 2016 | 2017 | Date | |
| Tons (000's) | 55.0 | 86.5 | 120.4 | 134.2 | 396.1 |
| Au grade | 1.252 | 0.948 | 0.899 | 0.870 | 0.95 |
| Ag grade | 1.21 | 1.16 | 0.77 | 0.66 | 0.88 |
| feed Au oz (000's) | 68.8 | 82.0 | 108.2 | 116.7 | 375.7 |
| feed Ag oz (000's) | 66.7 | 100.4 | 93.0 | 88.3 | 348.4 |
| % Au Rec. | 94.1% | 93.9% | 93.8% | 92.0% | 93.3% |
| % Ag Rec | 95.4% | 91.7% | 86.6% | 81.8% | 88.5% |
| Au oz Rec (000's) | 64.7 | 77.0 | 101.5 | 107.4 | 350.6 |
| Ag oz Rec (000's) | 63.7 | 92.1 | 80.5 | 72.2 | 308.5 |
| Note: | ||
| 1. | Includes only production following the completion of the Midas purchase from Newmont on February 11, 2014. | |
| Practical Mining LLC | February 5, 2018 |
| Page 240 | Recovery Methods | Klondex Mines Ltd. |
| 17.7. | Midas Mill Operating Permits |
The Midas Mill is currently operating under three Air Quality Operating Permits administered by the Nevada Department of Environmental Protection (NDEP) Bureau of Air Pollution Control and two Water Pollution Control Permit administered by the Nevada NDEP Bureau Mining Regulation and Reclamation. The permits are discussed in detail in Section 20.
| Practical Mining LLC | February 5, 2018 |
| Klondex Mines Ltd | Technical Report for the Fire Creek Project, | Page 241 |
| Lander County, Nevada |
| 18. | Project Infrastructure |
| 18.1. | Road Access |
The Project is easily accessible from paved state highways and from a graded gravel mine access road. The main access passes through a small residential area for about two miles where the speed limit is reduced to minimize any potential impacts on the community. The gravel road can be occasionally impeded by mud in wet or snowy weather.
The state and county roads are well maintained in order to service the ranches and mines in Crescent Valley. Klondex provides some road maintenance assistance to Lander County.
| 18.2. | Power and Electrical Infrastructure |
A regional electrical transmission line runs two miles east of the Project. A substation was constructed in 2012 to service the Project. The power line joining the Fire Creek Project to the substation was completed in August 2013, eliminating the need to use generators to supply power for mine operation.
| 18.3. | Water Management and Water Treatment |
Klondex manages surface and underground water using a pond system, drainage ditches, and a water treatment plant (WTP). Surface water from precipitation events is diverted away from the Project infrastructure with a series of drainage ditches. Surface water within the disturbance areas is diverted to one of four ponds: Stormwater Pond 1, Stormwater Pond 2, Dewatering Storage Pond 1 and Dewatering Storage Pond 2. Klondex has commissioned two Rapid Infiltration Basins (RIBs), which are included in the water management system.
Water from underground mining operations that does not meet NDEP Profile I standards (Profile I) is pumped to the Dewatering Storage Pond before being treated through the Water Treatment Plant (WTP) to meet the Profile I requirement. Brine reject solution from the WTP is stored in the Stormwater Pond, where it is evaporated. Treated water from the WTP and water from underground that meets the Profile I standard can be managed in several ways: used for dust suppression on roads and during construction events; infiltrated in the RIBs; or used underground for mining activities. Klondex is currently permitting a discharge point.
Klondex has permitted and constructed an artesian well, PW-1, which provides fresh water to the Project. Klondex currently holds annual water rights for 283 acre-feet of water. A fire water tank is located above the facilities and gravity flows to hydrants located near the Project buildings.
| Practical Mining LLC | February 5, 2018 |
| Page 242 | Project Infrastructure | Klondex Mines Ltd. |
| 18.4. | Communication Infrastructure |
Internet connectivity is provided by WesNet, via 11 GigaHertz (GHz) licensed Microwave frequency, with a 20Mbps Direct Internet Access (DIA) connection. Cell phone coverage is provided by Verizon Wireless, and the signal is boosted by a Klondex provided network extender.
| 18.5. | Site Infrastructure |
Project infrastructure is comprised of three large tented structures, heavy equipment parking areas, several mobile office units, several Conex mobile containers, and lay-down areas. The three-tented structures are used for production equipment and mobile fleet maintenance. The two easterly bays are designated the mechanical and mobile maintenance shops. The west bay is divided into an area for lubrication and a wash bay. Several Conex containers and outbuildings are used for storing parts and tools near the maintenance buildings. The electric storage area and diesel storage area are also located near the maintenance building Figure 18-1.
The engineering and geology offices, line out, and staff dry area are in mobile office units with light vehicle parking areas in front. These buildings are connected to potable water pipelines and septic system
In addition to the offices, there are areas designated for septic leach field, two waste rock dumps, WTP, sediment control ditches, ore storage, and re-vegetated stockpiles.
| Practical Mining LLC | February 5, 2018 |
| Klondex Mines Ltd | Technical Report for the Fire Creek Project, | Page 243 |
| Lander County, Nevada |

| Practical Mining LLC | February 5, 2018 |
| Page 244 | Market Studies and Contracts | Klondex Mines Ltd. |
| 19. | Market Studies and Contracts |
| 19.1. | Precious Metal Markets |
Gold and silver markets are mature with reputable smelters and refiners located throughout the world. Following several years of increases, gold and silver prices declined from 2012 through 2015 but have been increasing since. As of January 2018, the 36-month trailing average gold price was $1,221 per ounce while the average price during December 2017 was $1,261 per ounce. The silver price trend shows similar behavior with the 36-month trailing average of $16.62. Historical prices for both are shown in Figure 19-1.

| 19.2. | Contracts |
As part of normal mining activities, Klondex has entered into contracts with several mining industry suppliers and contractors.
| Practical Mining LLC | February 5, 2018 |
| Klondex Mines Ltd | Technical Report for the Fire Creek Project, | Page 245 |
| Lander County, Nevada |
| 19.3. | Project Financing |
On February 11, 2014, the Company entered into the Gold Purchase Agreement with Franco-Nevada GLW Holdings Corp., a subsidiary of FNC, pursuant to which the Company raised proceeds of US$33,763,640 in consideration for the delivery of an aggregate of 38,250 ounces of gold on a monthly basis over a five-year period ending on December 31, 2018. Under the terms of the Gold Purchase Agreement, the Company is required to make gold deliveries at the end of each month, with the first delivery due on June 30, 2014. Gold deliveries will cease when the delivery of 38,250 ounces of gold is completed on December 31, 2018. The annualized delivery schedule is shown in Table 19-1.
Table 19-1 FNC Gold Delivery Schedule
| Year | Gold Ounces |
| 2014 | 6,750 |
| 2015 | 7,500 |
| 2016 | 8,000 |
| 2017 | 8,000 |
| 2018 | 8,000 |
| Total | 38,250 |
The Company's obligations under the Gold Purchase Arrangement and the Company’s $25.0 million secured revolving facility with Investec Bank PLC (the “2016 Debt Financing”) are secured against all of the assets and property of the Company and its subsidiaries. The security granted for the performance of the Company's obligations under the 2016 Debt Financing and the Gold Purchase Arrangement rank pari-passu.
On February 12, 2014, the Company entered into a royalty agreement (the FC Royalty Agreement) with Franco-Nevada US, a subsidiary of FNC, and KGS, pursuant to which KGS raised proceeds of US$1,018,050 from the grant to Franco-Nevada US of a 2.5% NSR royalty for all Fire Creek production beginning January 1, 2019.
| Practical Mining LLC | February 5, 2018 |
| Page 246 | Environmental Studies, Permitting and Social or | Klondex Mines Ltd. |
| Community Impact |
| 20. | Environmental Studies, Permitting and Social or Community Impact |
Klondex conducts mining activities in compliance with all applicable environmental protection legislation. Klondex is unaware of any existing environmental issues or compliance problems that have the potential to impede production at the Project. Klondex has a strong cultural resource preservation program, which allows a third-party archeologist time to review potential areas of new disturbance. Currently, there are no community or social impact issues regarding work being completed at the Project.
| 20.1. | Environmental Compliance and Monitoring |
As required by the environmental operational permits (see Table 19-1), Klondex prepares quarterly and annual reports which are submitted to regulators. Compliance information included in these reports is based primarily on permit requirements and limitations. Permit limits and associated monitoring requirements are specified as a part of each permit.
At this time, Klondex does not anticipate construction or operation of any processing facilities. Heap leaching, open pit mining, tailings management, or other processing components are not included as part of the permitting strategy and not part of the resource.
Design and permitting of future open pit mine, heap leach pads and waste rock disposal facilities required for the open pit resource will be included in future studies as advancement of the resource to production progresses.
| 20.2. | Reclamation Bond Estimate |
Klondex’s last amendment to the Reclamation Bond Estimate (RCE) to include construction and operation of the RIBs was received in March 2016. The total of the RCE is calculated using the Standard Reclamation Cost Estimator (SRCE), which is adjusted annually for inflation. The SRCE was developed in a cooperative effort between the NDEP, Bureau of Mining Regulation and Reclamation, BLM, and the Nevada Mining Association to facilitate accuracy, completeness, and consistency in the calculation of costs for mine site reclamation. Klondex is required to update the total RCE for Fire Creek every three years.
RCE costs for reclamation currently include the following categories: roads; exploration roads and drill pads; waste rock repository; RIBs; ponds; electrical infrastructure; building and equipment; adit and vent raise plugging; re-vegetation; and contractor management. The total RCE was approved by BLM and NDEP in the first quarter of 2014 for a total cost to construct of approximately $3.4 million dollars.
| Practical Mining LLC | February 5, 2018 |
| Klondex Mines Ltd | Technical Report for the Fire Creek Project, | Page 247 |
| Lander County, Nevada |
| 20.3. | Major Permitting and Approvals |
The major operational permits and a brief summary of the requirement for each permit are outlined in Table 19-1 below.
Table 20-1 Fire Creek Project Significant Permits
| Permit | Permit Number |
Agency | Permit Type and Explanation |
| Environmental Assessment and Plan of Operations |
NVN-079769 | BLM | Plan of Operations is required for all mining and processing activities and exploration exceeding 5 acres of disturbance. BLM approves plan and determines the required environmental studies, usually an environmental assessment or an environmental impact study based on the requirements outline in the National Environmental Policy Act. |
| Record of Decision |
BLM | A Record of Decision (ROD) in the United States is the formal decision document which is recorded for the public. |
|
| Water Pollution Control Permit (Operations) |
NEV2007104 | NDEP, BMRR |
Mines operating in the State of Nevada are generally required to meet a zero discharge performance standard. A WPCP is required for the extraction of mineralized material. A separate permit may be issued for certain activities at a specific facility, such as rapid infiltration. |
| Water Pollution Control Permit (Infiltration) |
NEV2013102 | NDEP, BMRR | Water Pollution Control Permit for infiltration of water from the underground mine operations. This permit is still in the approval process. |
| Water Rights | 28637, 77002, 77003, 75129 |
NDWR | Water rights are issued by the Nevada Division of Water Resources based on Nevada water law which issues permits based on prior appropriation and beneficial use. Prior appropriation (also known as "first in time, first in right") allows for the orderly use of the state's water resources by granting priority to parties with senior water rights. This concept ensures the senior uses are protected, even as new uses for water are allocated. |
| Reclamation Permit |
#0241 | NDEP, BMRR |
Summarizes reclamation activities and associated costs. Ensures land disturbed by mining activities are reclaimed to safe and stable conditions to promote safe and stable post-mining land use. A permit is required for any disturbance over 5 acres. The RCE is financially secured with a posted security. The posted surety amount provides assurance that reclamation will be pursuant to the approved reclamation plan. |
| Air Quality Permit |
AP1041-2774 | NDEP, BAPC |
An owner or operator of any proposed stationary source must submit an application for and obtain an appropriate operating permit before commencing construction or operation. Class II Air Permit - Typically for facilities that emit less than 100 tons per year for any one regulated pollutant and emit less than 25 tons per year total HAP and emit less than 10 tons per year of any one HAP. |
| Storm Water Permit |
NVR300000 | NDEP, BWPC |
General storm water discharges associated with activities from metal mining activities. Regulates storm water runoff from waste rock storage piles, roads, and cleared areas. Typical pollutants include suspended solids and minerals eroded from exposed surfaces. |
| Practical Mining LLC | February 5, 2018 |
| Page 248 | Capital and Operating Costs | Klondex Mines Ltd. |
| 21. | Capital and Operating Costs |
| 21.1. | Capital Costs |
Life of Mine (LOM) constant dollar capital expenditures are detailed in Table 21-1. Development mining comprises 51% of total capital requirements; sustaining capital 21%; drilling 18%; mine equipment seven percent, and environmental projects two percent. Mine development unit costs, are shown in Table 21-2.
Table 21-1 Capital Costs
| Cost (000's) | |||||
| 20171 | 2018 | 2019 | 2020 | Total | |
| Mine Development | $574 | $7,351 | $2,059 | 4,277 | $14,260 |
| Mining Equipment | $1,890 | $1,890 | |||
| Drilling | $5,193 | $5,193 | |||
| Environmental | $683 | $683 | |||
| Sustaining Capital Mine | $87 | $976 | $967 | $1,140 | $3,170 |
| Sustaining Capital Mill | $83 | $922 | $913 | $1,076 | $2,994 |
| Total | $744 | $17,015 | $3,938 | $6,493 | $28,190 |
| 1. | 2017 includes only December. |
Table 21-2 Underground Development Unit Costs
| Unit | |||
| Width | Height | Cost | |
| Description | (ft) | (ft) | ($/ft) |
| Primary Capital Drifting | 14 - 15 | 15 - 17 | $1,600 |
| Secondary Capital Drifting | 14 | 14 | $1,350 |
| Raising | 10 | 10 | $2,500 |
| 21.2. | Operating Costs and Cutoff Grade |
LOM operating costs are presented in Table 21-3 below. Fire Creek unit mining costs are from the mines 2018 budget. The Company’s budget is estimated using the latest mine plan along with historical productivities, commodity and labor rates. The weighted average mining cost is based on the LOM quantities by mining method. Haulage costs to Midas are based from actual costs incurred by the Company and paid to a local contractor through December 2017.
Table 21-3 Operating Costs
| Description | Unit Cost | Unit |
| Mining | ||
| Production Stoping | $105 | /ton |
| Practical Mining LLC | February 5, 2018 |
| Klondex Mines Ltd | Technical Report for the Fire Creek Project, | Page 249 |
| Lander County, Nevada |
| Description | Unit Cost | Unit |
| 6 x 12 Stope Development Drift | $113 | /ton |
| Backfill | $30 | /ton |
| Waste | $10 | /ton |
| Cemented Rock Fill | $30 | /ton |
| Cellular (Pumped) Fill | $190 | /ton |
| Average Mining Cost | $192 | /ton |
| Mine Sustaining Capital | $10 | /ton |
| Transportation, Processing and G&A | ||
| Haulage Fire Creek to Midas | $44 | /ton |
| Processing | $44 | /ton |
| Mill Sustaining Capital & Tailings Impoundment | $9 | /ton |
| Nevada Operations Allocation | $14 | /ton |
| Total | $314 | /ton |
Using the operating costs and parameters above, cut-off grades were calculated at varying gold prices. These are shown in Table 21-4 and Figure 21-1. The incremental cut-off represents the required minimum grade of mineralization to be profitable to process after it has been mined and transported to the surface. Mineralization from development excavations is included in the LOM plan if it exceeds the incremental cut off since processing the incremental material improves the Project cash flow over the alternative of sending this material to the waste dump.
Table 21-4 Cut-off Grade Calculation
| Gold | Silver | ||
| Metal Sales Price | $/Ounce | $1,200 | $17.00 |
| Refining and Sales Expense | $/Ounce | Included in Milling | |
| Royalty | 2.5% | ||
| Metallurgical Recovery | 93% | 88% | |
| Total Operating Cost | $/ton | $314 | |
| Gold Equivalent | 1 | 74.60 | |
| Unplanned Dilution | 10% | ||
| Incremental Cut Off Grade | 0.090 | ||
| Cut-off Grade | Au Eq. opt | 0.288 | |
| Minimum Mining Width | feet | 4 | |
| Grade Thickness cut-off | Au Eq. opt-ft. | 1.269 | |
| Practical Mining LLC | February 5, 2018 |
| Page 250 | Capital and Operating Costs | Klondex Mines Ltd. |
![]()
| Practical Mining LLC | February 5, 2018 |
| Klondex Mines Ltd | Technical Report for the Fire Creek Project, | Page 251 |
| Lander County, Nevada |
| 22. | Economic Analysis |
The LOM plan and technical and economic projections in the LOM plan model include forward looking statements that are not historical facts and are required in accordance with the reporting requirements of the Canadian Securities Administrators. These forward-looking statements are estimates and involve risks and uncertainties that could cause actual results to differ materially.
The estimates of capital and operating costs have been developed specifically for the Project and are summarized in Section 1. These costs are derived from actual mine and process operating experience for the Project from 2014 through 2017, and where appropriate include adjustments applicable to the planned production rates.
The cash flow estimate includes only costs, taxes and other factors applicable to the Project and corporate obligations, financing costs, and taxes are excluded. The cash flow estimate includes 21% Federal income tax after appropriate deductions for depreciation and depletion. No consideration has been given for carry forward losses. Nevada does not impose an income tax but does levy a net proceeds tax equal to five percent of the net operating income with some allowances for depreciation of property plant and equipment. The net proceeds tax does not allow a depletion deduction.
Future reclamation costs have been prepaid through reclamation bonding requirements of the BLM and NDEP. The bond is considered adequate to fund future reclamation liabilities.
| 22.1. | Life of Mine Plan and Economics |
Constant dollar cash flow analysis of the reserves production and development plan shown in Table 16-4 is presented in the income and cash flow statements of Table 22-1 and Table 22-2, respectively. Table 22-3 lists the LOM key operating and financial indicators. The grade of the Fire Creek reserves and the low capital requirements produce a high 3.9 profitability index (PI) calculated with an 8% discount rate and a 5% NPV of $78M. PI is the ratio of payoff to investment of a proposed project. It is a useful tool for ranking projects because it allows you to quantify the amount of value created per unit of investment. A profitability index of one indicates break even. Calculation of an internal rate of return (IRR) is indeterminate due to the positive cash flow projected to be achieved in each year of the Project.
Royalties incurred during the LOM from 2017 to 2020 include the advance minimum royalty payments to third party lessors and the 2 ½% royalty specified in the FC Royalty Agreement with Franco-Nevada US. None of the planned production is from individual parcel holdings subject to additional NSR royalties nor will it transit through holdings subject to wheelage royalties.
| Practical Mining LLC | February 5, 2018 |
| Page 252 | Economic Analysis | Klondex Mines Ltd. |
Table 22-1 Income Statement 2017 – 2020 ($000’s)
| Year | 20171 | 2018 | 2019 | 2020 | Total |
| Income Statement (000's) | |||||
| Revenue | |||||
| Gold Sales | $6,893 | $70,802 | $78,947 | $95,533 | $252,174 |
| Silver Sales | $116 | $843 | $943 | $1,393 | $3,295 |
| Total Revenue | $7,009 | $71,645 | $79,890 | $96,925 | $255,469 |
| Operating Costs | |||||
| Mining | ($1,731) | ($17,915) | ($17,777) | ($22,068) | ($59,491) |
| Surface Ore Haulage Portal to Mill | ($388) | ($4,333) | ($4,290) | ($5,059) | ($14,070) |
| Processing | ($378) | ($4,227) | ($4,185) | ($4,935) | ($13,725) |
| Site General Administration & | |||||
| Overhead | ($686) | ($7,668) | ($7,592) | ($8,951) | ($24,897) |
| Total Operating | ($3,183) | ($34,143) | ($33,845) | ($41,012) | ($112,183) |
| General & Administrative | |||||
| Refining & Sales (Included with | $0.0 | $0.0 | $0.0 | $0.0 | $0.0 |
| Processing Costs) | |||||
| Royalty | ($250) | ($1,866) | ($2,072) | ($2,498) | ($6,687) |
| Nevada Net Proceeds Tax | ($177) | ($1,737) | ($2,144) | ($2,600) | ($6,659) |
| Total Cash Cost | ($3,610) | ($37,747) | ($38,061) | ($46,111) | ($125,529) |
| EBITA | $3,398 | $33,898 | $41,828 | $50,815 | $129,940 |
| Reclamation Accrual | $0.0 | $0.0 | $0.0 | $0.0 | $0.0 |
| Depreciation | ($20) | ($5,120) | ($7,491) | ($15,558) | ($28,190) |
| Total Cost | ($3,631) | ($42,867) | ($45,553) | ($61,668) | ($153,719) |
| Pre-Tax Income | $3,378 | $28,778 | $34,337 | $35,257 | $101,750 |
| Income Tax | ($500) | ($3,872) | ($4,789) | ($4,473) | ($13,635) |
| Net Income | $2,878 | $24,906 | $29,548 | $30,7873 | $88,115 |
| 1. | 2017 includes only December estimates. |
Table 22-2 Cash Flow Statement 2017 – 2021 ($000’s)
| Year | 20171 | 2018 | 2019 | 2020 | 2021 | Total |
| Net Income | $2,878 | $24,906 | $29,548 | $30,7873 | $0 | $88,115 |
| Depreciation | $20 | $5,120 | $7,491 | $15,558 | $0 | $28,190 |
| Reclamation | $0 | $0 | $0 | $0 | $0 | $0 |
| Working Capital (6 weeks) | ($417) | ($3,939) | ($36) | ($929) | $5,320 | $0 |
| Operating Cash Flow | $2,482 | $26,087 | $37,003 | $45,413 | $5,320 | $116,305 |
| Capital Costs | ($744) | ($17,015) | ($3,938) | ($6,493) | $0 | $28,190 |
| Net Cash Flow | $1,740 | $9,072 | $33,065 | $38,920 | $5,320 | $88,115 |
| Cumulative Cash Flow | $1,740 | $10,810 | $43,875 | $82,795 | $88,115 |
| Practical Mining LLC | February 5, 2018 |
| Klondex Mines Ltd | Technical Report for the Fire Creek Project, | Page 253 |
| Lander County, Nevada |
| 1. | 2015 includes only July through December estimates. |
Table 22-3 Key Operating and After Tax Financial Statistics
| Material Mined and Processed (kt) | 319 |
| Avg. Gold Grade (opt) | 0.71 |
| Avg. Silver Grade (opt) | 0.69 |
| Contained Gold (koz) | 226 |
| Contained Silver (koz) | 220 |
| Avg. Gold Metallurgical Recovery | 93% |
| Avg. Silver Metallurgical Recovery | 88% |
| Recovered Gold (koz) | 210 |
| Recovered Silver (koz) | 194 |
| Reserve Life (years) | 3.1 |
| Operating Cost ($/ton) | $351 |
| Cash Cost ($/oz) 1. | $582 |
| Total Cost ($/oz) 1. | $716 |
| Gold Price ($/oz) | $1,200.00 |
| Silver Price ($/oz) | $17.00 |
| Capital Costs ($ Millions) | $28.2 |
| Payback Period (Years) | NA |
| Cash Flow ($ Millions) | $88 |
| 5% Discounted Cash Flow ($ Millions) | $78 |
| 8% Discounted Cash Flow ($ Millions) | $73 |
| Profitability Index (8%) 2. | 3.9 |
| Internal Rate of Return | NA |
| Notes: | ||
| 1. | Net of byproduct credits; | |
| 2. | Profitability index (PI) is the ratio of payoff to investment of a proposed project. It is useful for ranking project as a measure of the amount of value created per unit of investment. A PI of 1 indicates break even. | |
| 22.2. | Sensitivity Analysis |
The Project’s net present value at five percent and eight percent (NPV) and profitability index from the cash flow model presented above were analyzed for sensitivity to variations in revenue, operating and capital cost assumptions. This analysis is presented graphically in Figure 22-1. through Figure 22-2. These graphs demonstrate the economic resilience of the Project by maintaining profitability with up to 40% unfavorable variances of any one of the three categories.
| Practical Mining LLC | February 5, 2018 |
| Page 254 | Economic Analysis | Klondex Mines Ltd. |


| Practical Mining LLC | February 5, 2018 |
| Klondex Mines Ltd | Technical Report for the Fire Creek Project, | Page 255 |
| Lander County, Nevada |
| 23. | Other Relevant Data and Information |
The authors are not aware of any other relevant data and information having bearing on the Fire Creek mineral resource estimate or mineral reserve estimate or ongoing exploration or operations.
| Practical Mining LLC | February 5, 2018 |
| Page 256 | Interpretation and Conclusions | Klondex Mines Ltd. |
| 24. | Interpretation and Conclusions |
| 24.1. | Conclusions |
Fire Creek is a modern, mechanized narrow vein mine. Mining is executed with a high degree of care and precision. The workforce is well trained and organized. Management and technical staff are dedicated to producing ore of the highest possible quality.
The data density required to classify mineral resources as measured or indicated is only achievable by sill development and closely spaced underground drilling. This limits mineral reserves to only those veins in or immediately adjacent to the mine workings. In the opinion of the authors of this TR, additional potential exists to extend mineral reserves along strike in both directions as underground access is developed. As the footprint of the mine grows and the number of available mining areas grows with it, the mining rate can be increased, and cost reductions may be realized through economies of scale.
The Midas Mill is an efficient, well-maintained modern mineral processing plant capable of processing 1,200 tpd. The plant is capable of operating with a minimum crew compliment resulting in cost reductions when operated at capacity. The underutilized capacity can accept increased mine production from Fire Creek or the Midas Mine as well as third party processing agreements.
Capital requirements for the Project are minimal. Ongoing mine development comprises the majority of capital costs and the ability to access multiple veins from common development greatly reduces the unit cost per ounce.
Based on the assumptions described herein, and in the opinion of the authors of this TR, the high-grade reserves in the Project mine plan are expected to provide a high return and sustain profitable operations with up to 40% adverse variations in metal prices, operating or capital costs. The total cost per ounce including capital expenditures and net of byproduct sales is expected to be $716 per ounce.
| 24.2. | Project Risks |
Table 24-1 presents the significant risks identified by the Qualified Person that have potential to impact Fire Creek.
| Practical Mining LLC | February 5, 2018 |
| Klondex Mines Ltd | Technical Report for the Fire Creek Project, | Page 257 |
| Lander County, Nevada |
Table 24-1 Potential Project Risks
| Risk | Potential Impact | Mitigating Measures | Opportunities | |
| Mine and/or mill operating costs greater than planned |
Lower cash flow | Convert Inferred Mineral Resource to Measured or Indicated Mineral Resources near planned mining areas |
Additional work areas allow an increase in production rate and achieves economies of scale |
|
| Stope dilution greater than anticipated |
Production cost increase and loss of resource |
Employ technological advances in blast initiation and/or reduce longhole stope dimensions to control hanging wall dilution |
Reduced dilution will reduce labor and equipment requirements and lower unit cost per ounce. |
| Practical Mining LLC | February 5, 2018 |
| Page 258 | Recommendations | Klondex Mines Ltd. |
| 25. | Recommendations |
Exploration: Underground drilling should continue in the veins identified near the current development workings to increase the level of confidence in these veins to an indicated classification. Underground exploration development is key to providing the necessary data to expand mineral resources and mineral reserves. Exploration development should be accelerated to provide the strike length necessary to define five to seven years of underground mine life.
Mine Planning: Expanding the reserve base through the previous comment will allow the development of additional work areas and the potential for increasing the mines production rate. Mine support and overhead costs are relatively fixed and are a large percentage of the total operating cost. A higher production rate can result in economies of scale and lower total cost per ounce.
Ore and Waste Density: A large quantity of density data is being collected and is available to be incorporated into the resource model. This data should be reviewed and interpreted with the same emphasis as assay data.
| Practical Mining LLC | February 5, 2018 |
| Klondex Mines Ltd | Technical Report for the Fire Creek Project, | Page 259 |
| Lander County, Nevada |
| 26. | Bibliography |
Anderson, R., 2013, Stratigraphy of the Fire Creek low sulfidation Au deposit Preliminary Report: Klondex Gold and Silver Mining Company internal document, 39 p.
Canadian Institute of Mining, Metallurgy and Petroleum, May 10, 2014, “CIM Definition Standards – For Mineral Resources and Mineral Reserves”, 9 p.
Colgan, J., Henry, C. & John, D., 2014, Evidence for large-magnitude, post-Eocene extension in the northern Shoshone Range, Nevada, and its implications for the structural setting of Carlin-Type gold deposits in the lower plate of the Roberts Mountains allochthon: Economic Geology, v. 109, p. 1843-1862.
Cooke, D. & Simmons, S., 2000, Characteristics and genesis of epithermal gold deposits: Society of Economic Geologists Reviews, v. 13, p. 221-244.
Crider J., 2001, Oblique slip and the geometry of normal-fault linkage: mechanics and a case study from the Basin and Range in Oregon: Journal of Structural Geology, v. 23, p. 1997-2009.
Crowl, W. J. (2011, May 31). NI 43-101 Technical Report, Pinson Project, Humboldt County, Nevada. Edmondo, G., 1996, Fire Creek Project: North Mining, Inc. internal report, 30 p.
Erwin, T. P. (2013, November 27). Mineral Status Report for Klondex Gold and Silver Mining Company - Project King, File NO. 52591.004.
Gilluly, J. & Gates, O., 1965, Tectonic and igneous geology of the northern Shoshone Range, Nevada: Geological Survey Professional Paper 465, 153 p.
Graf, G. (2013, January 13). Midas 2011 - 2012 Surface Exploration Report. Newmont Internal Memorandum. Hedenquist, J., Arribas, A. & Gonzalez-Urien, E., 2000, Exploration for epithermal gold deposits: Society of Economic Geologists Reviews, v. 13, p. 245-277.
Henry, C., 2013, email to R. Anderson.
Hodenquist, J.W., and Lowenstern, J.B., “The Role of Magmas in the Formation of Hydrothermal Ore Deposits” Nature, v 370, p 519-527.
John, D., 2014, discussion with J. Milliard
John, D. A. (2003). Geologic Setting and Genesis of the Mule Canyon Low-Sulfidation Epithermal Gold-Silver Deposit, North-Central Nevada. Economic Geology, 98, 424-463.
John, D. & Wallace, A., 2000, Epithermal gold-silver deposits related to the Northern Nevada Rift, in: Cluer, J., Price, J., Struhsacker, E., Hardyman, R. & Morris, C., eds., Geology and Ore Deposits 2000: The Great Basin and Beyond: Geological Society of Nevada Symposium Proceedings, May 15-18, 2000, p. 155-175.
John, D., Brunner, J., Saderholm, E. & Fleck, R., 2000a, Geology of the Mule Canyon gold-silver deposit, Lander County, Nevada, in: Cluer, J., Price, J., Struhsacker, E., Hardyman, R. & Morris, C., eds., Geology and Ore Deposits 2000: The Great Basin and Beyond: Geological Society of Nevada Symposium Proceedings, May 15-18, 2000, p. 119-134.
| Practical Mining LLC | February 5, 2018 |
| Page 260 | Bibliography | Klondex Mines Ltd. |
John, D., Wallace, A., Ponce, D., Fleck, R. & Conrad, J., 2000b, New perspectives on the geology and origin of the Northern Nevada Rift, in: Cluer, J., Price, J., Struhsacker, E., Hardyman, R. & Morris, C., eds., Geology and Ore Deposits 2000: The Great Basin and Beyond: Geological Society of Nevada Symposium Proceedings, May 15-18, 2000, p. 127-154.
John, D. & Wrucke, C., 2003, Geologic map of the Mule Canyon Quadrangle, Lander County, Nevada, Nevada Bureau of Mines and Geology Map 144.
Kamenov, G., Saunders, J., Hames, W. & Unger, D., 2007, Mafic magmas as sources for gold in middle Miocene epithermal deposits of the northern Great Basin, United States: Evidence from Pb isotope compositions of native gold: Economic Geology, v. 102, n. 7, p. 1191-1195.
Kassos, G. & Marma, J., in prep., Fire Creek: Nevada’s next high-grade gold project: Geological Society of Nevada 2015 Symposium Program with Abstracts.
Kiska Metals Corporation, 2014, The Colorback and Hilltop Properties: Carlin-style systems in the Battle Mountain-Eureka Trend, Nevada: Executive Summary Report, 19 p.
Klondex Mines Ltd. (2013, December 4). Final Disclosure Schedules to Stock Purchase Agreement.
Leavitt, E. D., Spell, T. L., Goldstrand, P. M., & Arehart, G. B. (2004, December 1). Geochronology of the Midas Low-Sulfidation Epithermal Gold-Silver Deposit, Elko County, Nevada. Economic Geology, 99(8), 1665-1686.
Lander County Accessors Office, landercounty.org:8080/profoundui/start?pgm=aspgm/asr840cl. Accessed January11, 2018
Martini, Josepph, SRK Consulting (2014, February). Midas Mine and Mill Reclamation Cost Adequacy, Report for Klondex Mines Ltd.
McPhie, J., Doyle, M. & Allen, R., 1993, Volcanic Textures: A guide to the interpretation of textures in volcanic rocks: University of Tasmania Center for Ore Deposit and Exploration Studies, 196 p.
McMillin, S. & Milliard, J., 2013, Exploration and geology of the Fire Creek deposit, Lander County, Nevada, presented at the November, 2013 Geological Society of Nevada Elko/Winnemucca joint meeting.
Milliard, J., Marma, J. & Kassos, G., in prep., A field trip guide for the Fire Creek Deposit - Nevada’s new high-grade gold project, in: 2015 Geological Society of Nevada Symposium Pre-Meeting Field Trip: Epithermal deposits of northern Nevada.
Newmont Mining Corporation. (2010). Internal Test Parameters
Memorandum.
Newmont Mining Corporation. (2013, December).
http://www.newmont.com/our-investors/reserves-and-resources.
Odell, M. A., Symmes, L., Bull, S., and Swanson, K., July 24, 2014, “Preliminary Economic Assessment of the Fire Creek Project, Lander County, Nevada, Amended”, NI 43-101 Technical Report, 218 p.
| Practical Mining LLC | February 5, 2018 |
| Klondex Mines Ltd | Technical Report for the Fire Creek Project, | Page 261 |
| Lander County, Nevada |
Odell, M. A. (2013). NI 43-101 Technical Report, Fire Creek Exploration Project, Lander County, Nevada. NI 43-101 Technical Report.
Pierce, K. & Morgan, L., 1992, The track of the Yellowstone hotspot: Volcanism, faulting and uplift, in: Link, P., Kuntz, M. & Platt, L., eds., Regional geology of eastern Idaho and western Wyoming: Geological Society of America Memoir 179, p. 1-53.
Ponce, D. A. (2008, February). A Prominent Geophysical Feature Along the Northern Nevada Rift and its Geologic Implications, North-Central Nevada. Geosphere, 4(1), 207-217.
Postlethwaite, C. (2011, December 19). Progress Report of the 2011 Midas District Mapping and Structural Analysis. Newmont Internal Report.
Raven, W., Ullmer, E. & Hawthorn, G., 2011, Updated technical report and resource estimation on the Fire Creek gold property, Lander Co., Nevada: NI 43-101 technical report filed on SEDAR Sept. 12, 2011.
Rott, E. H. (1931). Ore Deposits of the Gold Circle Mining District, Elko County, Nevada. Bulletin of the Nevada Bureau of Mines and Mackay School of Mines.
Saunders, J. A. (2006). Geochronology of Volcanic-Hosted Low-Sulfidation Au-Ag Deposits, Winnemucca-Sleeper Mine Area, Northern Great Basin, USA. US Geological Survey.
Simmons, S., White, N. & John, D., 2005, Geological characteristics of epithermal precious and base metal deposits: Economic Geology 100th Anniversary Volume, p. 485-522.
Theodore, T., Armstrong, A., Harris, A., Stevens, C. & Tosdal, R., 1998, Geology of the terminus of the northern Carlin Trend, in: Tosdal, R., ed., 1998, Contributions to the gold metallogeny of northern Nevada: United States Geological Survey Open-File Report 98-338, p. 69-105.
Thompson, T., 2014, Mineralogy of the MLI3870 composites, Fire Creek, Nevada: McClelland Laboratories, Inc. internal report, 44 p.
Trudgill, B. & Cartwright, J., 1994, Relay-ramp forms and normal-fault linkages, Canyonlands national Park, Utah: Geological Society of America Bulletin, v. 106, p. 1143-1157.
U.S. Department of Interior, Bureau of Land Management, Land and Mineral System Reports, reports.blm.gov/reports/lr2000/. Accessed January 3, 2018.,
US Department of the Interior (DOI) Bureau of Land Management (BLM). (2013, March). Midas Underground Support Facilities Newmont Mining Corporation, Environmental Assessment.
Wallace, A. & John, D., 1998, New Studies of Tertiary volcanic rocks and mineral deposits, Northern Nevada Rift, in: Tosdal, R., ed., 1998, Contributions to the gold metallogeny of northern Nevada: United States Geological Survey Open-File Report 98-338, p. 264-278.
Watt, J. T., Glen, J. M., John, D. A., & Ponce, D. A. (2007, December). Three-dimensional Geologic Model of the Northern Nevada Rift and the Beowawe Geothermal System, North-Central Nevada. Geosphere, 3(6), 667-682.
| Practical Mining LLC | February 5, 2018 |
| Page 262 | Bibliography | Klondex Mines Ltd. |
White, N. & Hedenquist, J., 1995, Epithermal gold deposits: Styles, characteristics and exploration: Society of Economic Geologists Newsletter, n. 23.
Zoback, M. & Thompson, G., 1978, Basin and Range rifting in northern Nevada: Clues from a mid-Miocene rift and its subsequent offsets: Geology, v. 6, p. 111-116.
Zoback, M., McKee, E., Blakely, R. & Thompson, G., 1994, The northern Nevada rift: Regional tectono-magmatic relations and middle Miocene stress directions: Geological Society of America Bulletin, v. 106, p. 371-382.
Zoback, M., Anderson, R. & Thompson, G., 1981, Cainozoic evolution of the state of stress and style of tectonism of the Basin and Range Province of the western United States: Philosophical Transactions of the Royal Society of London, v. 300, p. 407-434.
| Practical Mining LLC | February 5, 2018 |
| Klondex Mines Ltd | Technical Report for the Fire Creek Project, | Page 263 |
| Lander County, Nevada |
| 27. | Glossary |
Assay: The chemical analysis of mineral samples to determine the metal content.
Asbuilt: (plural asbuilts), a field survey, construction drawing, 3D model, or other descriptive representation of an engineered design for underground workings.
Composite: Combining more than one sample result to give an average result over a larger distance.
Concentrate: A metal-rich product resulting from a mineral enrichment process such as gravity concentration or flotation, in which most of the desired mineral has been separated from the waste material in the ore.
Crushing: Initial process of reducing material size to render it more amenable for further processing.
Cut-off Grade (CoG): The grade of mineralized rock, which determines as to whether or not it is economic to recover its gold content by further concentration.
Dilution: Waste, which is unavoidably mined with ore.
Dip: Angle of inclination of a geological feature/rock from the horizontal.
Fault: The surface of a fracture along which movement has occurred.
Footwall: The underlying side of a mineralized body or stope.
Gangue: Non-valuable components of the ore.
Grade: The measure of concentration of valuable minerals within mineralized rock.
Hanging wall: The overlying side of a mineralized body or stope.
Haulage: A horizontal underground excavation which is used to transport mined rock.
Igneous: Primary crystalline rock formed by the solidification of magma.
Kriging: A weighted, moving average interpolation method in which the set of weights assigned to samples minimizes the estimation variance.
Level: A main underground roadway or passage driven along a level course to afford access to stopes or workings and to provide ventilation and a haulage way for the removal of broken rock.
| Practical Mining LLC | February 5, 2018 |
| Page 264 | Glossary | Klondex Mines Ltd. |
Lithological: Geological description pertaining to different rock types.
Milling: A general term used to describe the process in which the ore is crushed, ground and subjected to physical or chemical treatment to extract the valuable minerals in a concentrate or finished product.
Mineral/Mining Lease: A lease area for which mineral rights are held.
Mining Assets: The Material Properties and Significant Exploration Properties.
Sedimentary: Pertaining to rocks formed by the accumulation of sediments, formed by the erosion of other rocks.
Sill1: A thin, tabular, horizontal to sub-horizontal body of igneous rock formed by the injection of magma into planar zones of weakness.
Sill2: The floor of a mine passage way.
Stope: An underground excavation from which ore has been removed.
Stratigraphy: The study of stratified rocks in terms of time and space.
Strike: Direction of line formed by the intersection of strata surfaces with the horizontal plane, always perpendicular to the dip direction.
Sulfide: A sulfur bearing mineral.
Tailings: Finely ground waste rock from which valuable minerals or metals have been extracted.
Thickening: The process of concentrating solid particles in suspension.
Total Expenditure: All expenditures including those of an operating and capital nature.
Variogram: A plot of the variance of paired sample measurements as a function of distance and/or direction.
Mineral Resources
Mineral Resources are sub-divided, in order of increasing geological confidence, into Inferred, Indicated and Measured categories. An Inferred Mineral Resource has a lower level of confidence than that applied to an Indicated Mineral Resource. An Indicated Mineral Resource has a higher level of confidence than an Inferred Mineral Resource but has a lower level of confidence than a Measured Mineral Resource.
| Practical Mining LLC | February 5, 2018 |
| Klondex Mines Ltd | Technical Report for the Fire Creek Project, | Page 265 |
| Lander County, Nevada |
A Mineral Resource is a concentration or occurrence of solid material of economic interest in or on the Earth’s crust in such form, grade or quality and quantity that there are reasonable prospects for eventual economic extraction.
The location, quantity, grade or quality, continuity and other geological characteristics of a Mineral Resource are known, estimated or interpreted from specific geological evidence and knowledge, including sampling.
Material of economic interest refers to diamonds, natural solid inorganic material, or natural solid fossilized organic material including base and precious metals, coal, and industrial minerals.
The term Mineral Resource covers mineralization and natural material of intrinsic economic interest which has been identified and estimated through exploration and sampling and within which Mineral Reserves may subsequently be defined by the consideration and application of Modifying Factors. The phrase ‘reasonable prospects for eventual economic extraction’ implies a judgment by the Qualified Person in respect of the technical and economic factors likely to influence the prospect of economic extraction. The Qualified Person should consider and clearly state the basis for determining that the material has reasonable prospects for eventual economic extraction. Assumptions should include estimates of cutoff grade and geological continuity at the selected cut-off, metallurgical recovery, smelter payments, commodity price or product value, mining and processing method and mining, processing and general and administrative costs. The Qualified Person should state if the assessment is based on any direct evidence and testing.
Interpretation of the word ‘eventual’ in this context may vary depending on the commodity or mineral involved. For example, for some coal, iron, potash deposits and other bulk minerals or commodities, it may be reasonable to envisage ‘eventual economic extraction’ as covering time periods in excess of 50 years. However, for many gold deposits, application of the concept would normally be restricted to perhaps 10 to 15 years, and frequently to much shorter periods of time.
Inferred Mineral Resource
An Inferred Mineral Resource is that part of a Mineral Resource for which quantity and grade or quality are estimated on the basis of limited geological evidence and sampling. Geological evidence is sufficient to imply but not verify geological and grade or quality continuity.
An Inferred Mineral Resource has a lower level of confidence than that applying to an Indicated Mineral Resource and must not be converted to a Mineral Reserve. It is reasonably expected that the majority of Inferred Mineral Resources could be upgraded to Indicated Mineral Resources with continued exploration.
| Practical Mining LLC | February 5, 2018 |
| Page 266 | Glossary | Klondex Mines Ltd. |
An Inferred Mineral Resource is based on limited information and sampling gathered through appropriate sampling techniques from locations such as outcrops, trenches, pits, workings and drill holes. Inferred Mineral Resources must not be included in the economic analysis, production schedules, or estimated mine life in publicly disclosed Pre-Feasibility or Feasibility Studies, or in the Life of Mine plans and cash flow models of developed mines. Inferred Mineral Resources can only be used in economic studies as provided under NI 43-101.
There may be circumstances, where appropriate sampling, testing, and other measurements are sufficient to demonstrate data integrity, geological and grade/quality continuity of a Measured or Indicated Mineral Resource, however, quality assurance and quality control, or other information may not meet all industry norms for the disclosure of an Indicated or Measured Mineral Resource. Under these circumstances, it may be reasonable for the Qualified Person to report an Inferred Mineral Resource if the Qualified Person has taken steps to verify the information meets the requirements of an Inferred Mineral Resource
Indicated Mineral Resource
An Indicated Mineral Resource is that part of a Mineral Resource for which quantity, grade or quality, densities, shape and physical characteristics are estimated with sufficient confidence to allow the application of Modifying Factors in sufficient detail to support mine planning and evaluation of the economic viability of the deposit.
Geological evidence is derived from adequately detailed and reliable exploration, sampling and testing and is sufficient to assume geological and grade or quality continuity between points of observation.
An Indicated Mineral Resource has a lower level of confidence than that applying to a Measured Mineral Resource and may only be converted to a Probable Mineral Reserve.
Mineralization may be classified as an Indicated Mineral Resource by the Qualified Person when the nature, quality, quantity and distribution of data are such as to allow confident interpretation of the geological framework and to reasonably assume the continuity of mineralization. The Qualified Person must recognize the importance of the Indicated Mineral Resource category to the advancement of the feasibility of the project. An Indicated Mineral Resource estimate is of sufficient quality to support a Pre-Feasibility Study which can serve as the basis for major development decisions.
Measured Mineral Resource
A Measured Mineral Resource is that part of a Mineral Resource for which quantity, grade or quality, densities, shape, and physical characteristics are estimated with confidence sufficient to allow the application of Modifying Factors to support detailed mine planning and final evaluation of the economic viability of the deposit.
| Practical Mining LLC | February 5, 2018 |
| Klondex Mines Ltd | Technical Report for the Fire Creek Project, | Page 267 |
| Lander County, Nevada |
Geological evidence is derived from detailed and reliable exploration, sampling and testing and is sufficient to confirm geological and grade or quality continuity between points of observation.
A Measured Mineral Resource has a higher level of confidence than that applying to either an Indicated Mineral Resource or an Inferred Mineral Resource. It may be converted to a Proven Mineral Reserve or to a Probable Mineral Reserve.
Mineralization or other natural material of economic interest may be classified as a Measured Mineral Resource by the Qualified Person when the nature, quality, quantity and distribution of data are such that the tonnage and grade or quality of the mineralization can be estimated to within close limits and that variation from the estimate would not significantly affect potential economic viability of the deposit. This category requires a high level of confidence in, and understanding of, the geology and controls of the mineral deposit.
‘Modifying Factors’ are considerations used to convert Mineral Resources to Mineral Reserves. These include, but are not restricted to, mining, processing, metallurgical, infrastructure, economic, marketing, legal, environmental, social and governmental factors.
Mineral Reserve
Mineral Reserves are sub-divided in order of increasing confidence into Probable Mineral Reserves and Proven Mineral Reserves. A Probable Mineral Reserve has a lower level of confidence than a Proven Mineral Reserve.
A Mineral Reserve is the economically mineable part of a Measured and/or Indicated Mineral Resource. It includes diluting materials and allowances for losses, which may occur when the material is mined or extracted and is defined by studies at Pre-Feasibility or Feasibility level as appropriate that include application of Modifying Factors. Such studies demonstrate that, at the time of reporting, extraction could reasonably be justified.
The reference point at which Mineral Reserves are defined, usually the point where the ore is delivered to the processing plant, must be stated. It is important that, in all situations where the reference point is different, such as for a saleable product, a clarifying statement is included to ensure that the reader is fully informed as to what is being reported.
The public disclosure of a Mineral Reserve must be demonstrated by a Pre-Feasibility Study or Feasibility Study.
| Practical Mining LLC | February 5, 2018 |
| Page 268 | Glossary | Klondex Mines Ltd. |
Mineral Reserves are those parts of Mineral Resources which, after the application of all mining factors, result in an estimated tonnage and grade which, in the opinion of the Qualified Person(s) making the estimates, is the basis of an economically viable project after taking account of all relevant Modifying Factors. Mineral Reserves are inclusive of diluting material that will be mined in conjunction with the Mineral Reserves and delivered to the treatment plant or equivalent facility. The term ‘Mineral Reserve’ need not necessarily signify that extraction facilities are in place or operative or that all governmental approvals have been received. It does signify that there are reasonable expectations of such approvals.
‘Reference point’ refers to the mining or process point at which the Qualified Person prepares a Mineral Reserve. For example, most metal deposits disclose mineral reserves with a “mill feed” reference point. In these cases, reserves are reported as mined ore delivered to the plant and do not include reductions attributed to anticipated plant losses. In contrast, coal reserves have traditionally been reported as tonnes of “clean coal”. In this coal example, reserves are reported as a “saleable product” reference point and include reductions for plant yield (recovery). The Qualified Person must clearly state the ‘reference point’ used in the Mineral Reserve estimate.
Probable Mineral Reserve
A Probable Mineral Reserve is the economically mineable part of an Indicated, and in some circumstances, a Measured Mineral Resource. The confidence in the Modifying Factors applying to a Probable Mineral Reserve is lower than that applying to a Proven Mineral Reserve.
The Qualified Person(s) may elect, to convert Measured Mineral Resources to Probable Mineral Reserves if the confidence in the Modifying Factors is lower than that applied to a Proven Mineral Reserve. Probable Mineral Reserve estimates must be demonstrated to be economic, at the time of reporting, by at least a Pre-Feasibility Study.
Proven Mineral Reserve (Proved Mineral Reserve)
A Proven Mineral Reserve is the economically mineable part of a Measured Mineral Resource. A Proven Mineral Reserve implies a high degree of confidence in the Modifying Factors.
Application of the Proven Mineral Reserve category implies that the Qualified Person has the highest degree of confidence in the estimate with the consequent expectation in the minds of the readers of the report. The term should be restricted to that part of the deposit where production planning is taking place and for which any variation in the estimate would not significantly affect the potential economic viability of the deposit. Proven Mineral Reserve estimates must be demonstrated to be economic, at the time of reporting, by at least a Pre-Feasibility Study. Within the CIM Definition standards the term Proved Mineral Reserve is an equivalent term to a Proven Mineral Reserve.
| Practical Mining LLC | February 5, 2018 |
| Klondex Mines Ltd | Technical Report for the Fire Creek Project, | Page 269 |
| Lander County, Nevada |
Pre-Feasibility Study (Preliminary Feasibility Study)
The CIM Definition Standards requires the completion of a Pre-Feasibility Study as the minimum prerequisite for the conversion of Mineral Resources to Mineral Reserves.
A Pre-Feasibility Study is a comprehensive study of a range of options for the technical and economic viability of a mineral project that has advanced to a stage where a preferred mining method, in the case of underground mining, or the pit configuration, in the case of an open pit, is established and an effective method of mineral processing is determined. It includes a financial analysis based on reasonable assumptions on the Modifying Factors and the evaluation of any other relevant factors which are sufficient for a Qualified Person, acting reasonably, to determine if all or part of the Mineral Resource may be converted to a Mineral Reserve at the time of reporting. A Pre-Feasibility Study is at a lower confidence level than a Feasibility Study.
Feasibility Study
A Feasibility Study is a comprehensive technical and economic study of the selected development option for a mineral project that includes appropriately detailed assessments of applicable Modifying Factors together with any other relevant operational factors and detailed financial analysis that are necessary to demonstrate, at the time of reporting, that extraction is reasonably justified (economically mineable). The results of the study may reasonably serve as the basis for a final decision by a proponent or financial institution to proceed with, or finance, the development of the project. The confidence level of the study will be higher than that of a Pre-Feasibility Study.
The term proponent captures issuers who may finance a project without using traditional financial institutions. In these cases, the technical and economic confidence of the Feasibility Study is equivalent to that required by a financial institution.
| Practical Mining LLC | February 5, 2018 |
| Page 270 | Appendix A: Certification of Authors and | Klondex Mines Ltd. |
| Consent Forms |
| 28. | Appendix A: Certification of Authors and Consent Forms |
| Practical Mining LLC | February 5, 2018 |
 |
 |
CERTIFICATE of QUALIFIED PERSON
Re: Technical Report for the Fire Creek Project, Lander County, Nevada, dated the 5th day of February 2018, with an effective date of November 30, 2017 (the "Technical Report"):
I, Mark A. Odell, P.E., do hereby certify that:
| As of February 5, 2018, I am a consulting mining engineer at: | |
| Practical Mining LLC | |
| 495 Idaho Street, Suite 205 | |
| Elko, Nevada 89801 | |
| 775-345-3718 |
| 1) | I am a Registered Professional Mining Engineer in the State of Nevada (# 13708), and a Registered Member (#2402150) of the Society for Mining, Metallurgy and Exploration (SME). |
|
|
||
| 2) | I graduated from The Colorado School of Mines, Golden, Colorado with a Bachelor of Science Degree in Mining Engineering in 1985. I have practiced my profession continuously since 1985. |
|
|
||
| 3) | Since 1985, I have held the positions of mine engineer, chief engineer, mine superintendent, technical services manager and mine manager at underground and surface metal and coal mines in the western United States. The past 13 years, I have worked as a self-employed mining consultant with clients located in North America, Asia and Africa. My responsibilities have included the preparation of detailed mine plans, geotechnical engineering, reserve and resource estimation, preparation of capital and operating budgets and the economic evaluation of mineral deposits. |
|
|
||
| 4) | I have read the definition of "qualified person" set out in National Instrument 43-101 ("NI 43- 101") and certify that by reason of my experience and qualifications and good standing with proper designation within a recognized professional organization fully meet the criteria as a Qualified Person as defined under NI 43-101. |
|
|
||
| 5) | I am a contract consulting engineer for the issuer and project owner, Klondex Mines Ltd. (the "Issuer"), and last inspected the Fire Creek Project on January 9, 2018. |
|
|
||
| 6) | I am responsible for preparation of all sections of the Technical Report. |
|
|
||
| 7) | I am independent of the Issuer within the meaning of Section 1.5 of NI 43-101. |
|
|
||
| 8) | I was paid a daily rate for consulting services performed in evaluation of the Fire Creek Project for the Issuer and do not have any other interests relating to the Fire Creek Project. I do not have any interest in adjoining properties in the Fire Creek area. |
|
|
||
| 9) | I have read NI 43-101 and Form 43-101F1, and the sections of the Technical Report for which I am responsible have been prepared in accordance with that instrument and form. |
 |
 |
| Practical Mining LLC | February 5, 2018 |
|
|
|
10) |
I consent to the filing of the Technical Report with any stock exchange and other regulatory authority and any publication by them for regulatory purposes, including electronic publication in the public company files on their websites accessible by the public, of the Technical Report. |
|
|
|
|
11) |
As at the effective date of the Technical Report, to the best of my knowledge, information and belief, the Technical Report contains all the scientific and technical information that is required to be disclosed to make the Technical Report not misleading. |
| Dated this 5th day of February 2018. |
| “Signed” Mark A. Odell |
| Mark A. Odell, P.E. |
| Practical Mining LLC |
| markodell@practicalmining.com |
|
|
|
| Practical Mining LLC | February 5, 2018 |
|
|
|
CERTIFICATE OF AUTHOR
Re: Technical Report for the Fire Creek Project, Lander County, Nevada, dated the 5th day of February 2018, with an effective date of November 30, 2017 (the "Technical Report").
I, Laura M. Symmes, SME, do hereby certify that:
| As of February 5, 2018, I am a geologist at: |
| Practical Mining, LLC |
| 495 Idaho Street, Suite 205 |
| Elko, NV 89801 |
| 1) | I graduated with a Bachelor of Science degree in Geology from Utah State University in 2003. |
|
|
||
| 2) | I am a registered member of the Society for Mining, Metallurgy & Exploration (SME) #4196936. |
|
|
||
| 3) | I have worked as a geologist for a total of 12 years since my 2003 graduation from university. My experience has been focused on exploration and production of gold deposits, including planning and supervision of drill projects, generating data from drilled materials and making geologic interpretations, data organization, geologic mapping, building digital models of geologic features and mineral resources, and grade control of deposits in production. |
|
|
||
| 4) | I have read the definition of "qualified person" set out in National Instrument 43-101 ("NI 43- 101") and certify that by reason of my education, affiliation with a professional association (as defined in NI 43-101) and past relevant work experience, I fulfill the requirements to be a "qualified person" for the purposes of NI 43-101. |
|
|
||
| 5) | I am responsible for sections 10 -12 of the Technical Report. |
|
|
||
| 6) | I last visited the Fire Creek Project on January 9, 2017. |
|
|
||
| 7) | I have not had prior involvement with the property that is the subject of the Technical Report. |
|
|
||
| 8) | I am independent of Klondex Mines Ltd. within the meaning of Section 1.5 of NI 43-101. |
|
|
||
| 9) | I was paid a daily rate for consulting services performed in evaluation of the Fire Creek Project and do not have any other interests relating to the Fire Creek Project. I do not have any interest in adjoining properties in the Fire Creek area. |
|
|
||
| 10) | I have read NI 43-101 and Form 43-101F1, and the Technical Report has been prepared in compliance with that instrument and form. |
|
|
||
| 11) | I consent to the filing of the Technical Report with any stock exchange and other regulatory authority and any publication by them for regulatory purposes, including electronic publication in the public company files on their websites accessible by the public, of the Technical Report. |
|
|
|
| Practical Mining LLC | February 5, 2018 |
|
|
|
| 12) | As of the effective date of the Technical Report, to the best of my knowledge, information and belief, the Technical Report contains all the scientific and technical information that is required to be disclosed to make the Technical Report not misleading. |
| Dated this 5th day of February 2018. |
| “Signed” Laura M. Symmes |
| Laura M. Symmes, SME |
| SME No. 4196936 |
| Practical Mining LLC |
| 495 Idaho Street, Suite 205 |
| Elko, NV 89801 |
| laurasymmes@practicalmining.com |
|
|
|
| Practical Mining LLC | February 5, 2018 |
|
|
|
CERTIFICATE OF AUTHOR
Re: Technical Report for the Fire Creek Project, Lander County, Nevada, dated the 5th day of February 2018, with an effective date of November 30, 2017 (the "Technical Report").
I, Sarah M Bull, P.E., do hereby certify that:
| As of February 5, 2018, I am a consulting mining engineer at: | |
| Practical Mining LLC | |
| 495 Idaho Street, Suite 205 | |
| Elko, Nevada 89801 | |
| 775-345-3718 |
| 1) | I am a Registered Professional Mining Engineer in the State of Nevada (# 22797). |
|
|
||
| 2) | I am a graduate of The University of Alaska Fairbanks, Fairbanks, Alaska with a Bachelor of Science Degree in Mining Engineering in 2006. |
|
|
||
| 3) | Since my graduation from university I have been employed as a Mine Engineer at an underground gold mining operation and as Senior Mine Engineer for a consulting engineering firm. My responsibilities have included mine ventilation engineering, stope design and mine planning. |
|
|
||
| 4) | I have read the definition of "qualified person" set out in National Instrument 43-101 ("NI 43- 101") and certify that by reason of my experience and qualifications and good standing with proper designation within a recognized professional organization I fully meet the criteria as a Qualified Person as defined under NI 43-101. |
|
|
||
| 5) | I am a contract consulting engineer for the issuer and project owner: Klondex Mines Ltd. |
|
|
||
| 6) | I am responsible for preparation of section 15 and 16 of the Technical Report. |
|
|
||
| 7) | I last visited the Fire Creek Project on January 9, 2018. |
|
|
||
| 8) | I am independent of Klondex Mines Ltd. within the meaning of Section 1.5 of NI 43-101. |
|
|
||
| 9) | I was paid a daily rate for engineering consulting services performed in evaluation of the Fire Creek Project for Klondex Mines Ltd. and do not have any other interests relating to the Fire Creek Project. I do not have any interest in adjoining properties in the Fire Creek Project area. |
|
|
||
| 10) | I have read NI 43-101 and Form 43-101F1, and the sections of the Technical Report for which I am responsible have been prepared in accordance with that instrument and form. |
|
|
|
| Practical Mining LLC | February 5, 2018 |
|
|
|
11) |
I consent to the filing of the Technical Report with any stock exchange and other regulatory authority and any publication by them for regulatory purposes, including electronic publication in the public company files on their websites accessible by the public, of the Technical Report. |
|
|
|
|
12) |
As at the effective date of the Technical Report, to the best of my knowledge, information and belief, the Technical Report contains all the scientific and technical information that is required to be disclosed to make the Technical Report not misleading. |
Dated this 5th day of February 2018.
| “Signed” Sarah Bull |
| Sarah M Bull, P.E. |
| Practical Mining LLC |
| 495 Idaho Street, Suite 205 |
| Elko, Nevada 89801 |
| sarahbull@practicalmining.com |
|
|
|
| Practical Mining LLC | February 5, 2018 |
|
|
|
CERTIFICATE OF AUTHOR
Re: Technical Report for the Fire Creek Project, Lander County, Nevada, dated the 5th day of February 2018, with an effective date of November 30, 2017 (the "Technical Report").
I, Adam S Knight, P.E., do hereby certify that:
| As of February 5, 2018, I am a consulting mining engineer at: | |
| Practical Mining LLC | |
| 495 Idaho Street, Suite 205 | |
| Elko, Nevada 89801 | |
| 775-345-3718 |
| 1) | I am a Registered Professional Mining Engineer in the State of Nevada (# 15796). |
|
|
||
| 2) | I graduated with a Bachelor of Science degree in Mining Engineering from University of Nevada Reno |
|
|
||
| 3) | Since 1993, I have worked as Mine Surveyor, Mine Engineer, Mine Manager, Consulting Engineer, and Mining and Milling General Manager. Positions have been held in the US and Africa. Commodities worked include gold, silver, molybdenum and tungsten. Nine total years’ experience was obtained in gold mines and seven years’ supervising and managing mineral processing operations. |
|
|
||
| 4) | I have read the definition of "qualified person" set out in National Instrument 43-101 ("NI 43- 101") and certify that by reason of my experience and qualifications and good standing with proper designation within a recognized professional organization I fully meet the criteria as a Qualified Person as defined under NI 43-101. |
|
|
||
| 5) | I am a contract consulting engineer for the issuer and project owner: Klondex Mines Ltd. |
|
|
||
| 6) | I am responsible for preparation of section 15 and 16 of the Technical Report. |
|
|
||
| 7) | I last visited the Fire Creek Project on January 9, 2018. |
|
|
||
| 8) | I am independent of Klondex Mines Ltd. within the meaning of Section 1.5 of NI 43-101. |
|
|
||
| 9) | I was paid a daily rate for engineering consulting services performed in evaluation of the Fire Creek Project for Klondex Mines Ltd. and do not have any other interests relating to the Fire Creek Project. I do not have any interest in adjoining properties in the Fire Creek Project area. |
|
|
||
| 10) | I have read NI 43-101 and Form 43-101F1, and the sections of the Technical Report for which I am responsible have been prepared in accordance with that instrument and form. |
|
|
|
| Practical Mining LLC | February 5, 2018 |
|
|
|
11) |
I consent to the filing of the Technical Report with any stock exchange and other regulatory authority and any publication by them for regulatory purposes, including electronic publication in the public company files on their websites accessible by the public, of the Technical Report. |
|
|
|
|
12) |
As at the effective date of the Technical Report, to the best of my knowledge, information and belief, the Technical Report contains all the scientific and technical information that is required to be disclosed to make the Technical Report not misleading. |
Dated this 5th day of February 2018.
| “Signed” Adam Knight |
| Adam S Knight, P.E. |
| Practical Mining LLC |
| 495 Idaho Street, Suite 205 |
| Elko, Nevada 89801 |
| 775-304-5836 |
| adamknight@practicalmining.com |
|
|
|
| Practical Mining LLC | February 5, 2018 |