Attached files
UNITED STATES
SECURITIES AND EXCHANGE COMMISSION
Washington, D.C. 20549
FORM 10-K
(Mark One)
ý | ANNUAL REPORT PURSUANT TO SECTION 13 OR 15(d) OF THE SECURITIES EXCHANGE ACT OF 1934 |
For the fiscal year ended December 31, 2016
OR
o | TRANSITION REPORT PURSUANT TO SECTION 13 OR 15(d) OF THE SECURITIES EXCHANGE ACT OF 1934 |
For the transition period from ________ to
Commission file number: 001-37563
KLONDEX MINES LTD.
(Exact name of registrant as specified in its charter)
British Columbia | 98-1153397 | |
(State or other jurisdiction of incorporation or organization) | (IRS Employer Identification No.) | |
6110 Plumas Street Suite A Reno, Nevada | 89519 | |
(Address of principal executive offices) | (Zip Code) | |
(775) 284-5757
(Registrant’s telephone number, including area code)
Securities registered pursuant to Section 12(b) of the Act: | ||
Title of each class | Name of exchange on which registered | |
Common Shares, no par value | NYSE MKT LLC | |
Securities registered pursuant to Section 12(g) of the Act: None | ||
Indicate by check mark if the registrant is a well-known seasoned issuer, as defined in Rule 405 of the Securities Act. Yes o No ý
Indicate by check mark if the registrant is not required to file reports pursuant to Section 13 or Section 15(d) of the Act. Yes o No ý
Indicate by check mark whether the registrant (1) has filed all reports required to be filed by Section 13 or 15(d) of the Securities Exchange Act of 1934 during the preceding 12 months (or for such shorter period that the registrant was required to file such reports), and (2) has been subject to such filing requirements for the past 90 days. Yes ý No o
Indicate by check mark whether the registrant has submitted electronically and posted on its corporate Web site, if any, every Interactive Data File required to be submitted and posted pursuant to Rule 405 of Regulation S-T (§232.405 of this chapter) during the preceding 12 months (or for such shorter period that the registrant was required to submit and post such files). Yes ý No o
Indicate by check mark if disclosure of delinquent filers pursuant to Item 405 of Regulation S-K (§229.405) is not contained herein, and will not be contained, to the best of registrant’s knowledge, in definitive proxy or information statements incorporated by reference in Part III of this Form 10-K or any amendment to this Form 10-K. ý
Indicate by check mark whether the registrant is a large accelerated filer, an accelerated filer, a non-accelerated filer, or a smaller reporting company. See the definitions of “large accelerated filer,” “accelerated filer,” and “smaller reporting company” in Rule 12b-2 of the Exchange Act.
Large accelerated filer | o | Accelerated filer | ý | |||
Non-accelerated filer | o (Do not check if a smaller reporting company) | Smaller reporting company | o | |||
Indicate by check mark whether the registrant is a shell company (as defined in Rule 12b-2 of the Act). Yes o No ý
The aggregate market value of common stock held by non-affiliates of the registrant was approximately $509.4 million on June 30, 2016 (the last business day of the registrant's most recently completed second fiscal quarter). On March 21, 2017, there were 177,312,560 shares of the registrant’s common stock with no par value per share, outstanding.
Documents Incorporated by Reference
To the extent specifically referenced in Part III, portions of the registrant’s definitive Proxy Statement on Schedule 14A to be filed with the Securities and Exchange Commission (the "SEC") in connection with the registrant's 2017 Annual Meeting of Stockholders are hereby incorporated by reference into this report.
KLONDEX MINES LTD.
FORM 10-K
For the Year Ended December 31, 2016
TABLE OF CONTENTS
Page | ||||
Cautionary statement regarding forward-looking statements
This Annual Report on Form 10-K contains forward-looking statements or information within the meaning of Canadian securities laws and the United States Private Securities Litigation Reform Act of 1995, Section 27A of the Securities Act of 1933, as amended (the "Securities Act") and Section 21E of the Securities Exchange Act of 1934, as amended (the "Exchange Act"), and are intended to be covered by the safe harbors provided by these regulations. Any statements that express or involve discussions with respect to predictions, expectations, beliefs, plans, projections, objectives, assumptions or future events or performance (often, but not always, identified by words or phrases such as “expects”, “is expected”, “anticipates”, “believes”, “plans”, “projects”, “estimates”, “assumes”, “intends”, “strategy”, “goals”, “objectives”, “potential”, “possible” or variations thereof or stating that certain actions, events, conditions or results “may”, “could”, “would”, “should”, “might” or “will” be taken, occur or be achieved, or the negative of any of these terms and similar expressions) are not statements of historical fact and may be forward-looking statements. Our forward-looking statements may include, without limitation, statements with respect to:
• | estimates of future mineral production, mining activities and sales; |
• | estimates of future production costs and other expenses for specific operations and on a consolidated basis; |
• | estimates of future capital expenditures, construction or production activities and other cash needs, for specific operations and on a consolidated basis, and expectations as to the funding or timing thereof; |
• | estimates as to the projected development of certain mineral projects, such as Hollister (as defined herein), including the timing of such development, the costs of such development and other capital costs, financing plans for these deposits and expected production commencement dates; |
• | estimates of mineral reserves and mineral resources, timing of updated studies and statements regarding future exploration; |
• | statements regarding the availability of, and, terms and costs related to, future borrowing and financing; |
• | estimates regarding future exploration expenditures, results and reserves; |
• | estimates regarding potential cost savings, productivity and operating performance; |
• | expectations regarding the start-up time, design, mine life, mill availability, production and costs applicable to sales and exploration potential of our mines and projects; |
• | statements regarding future transactions; and |
• | statements regarding the impacts of changes in the legal and regulatory environment in which we operate. |
Forward-looking statements and forward-looking information have been based upon our current business and operating plans, as approved by our Board of Directors (the “Board”); our cash and other funding requirements and timing and sources thereof; results of pre-feasibility and technical reports; mineral resource and reserve estimates; exploration activities; any required permitting processes; and current market conditions and project development plans. Forward-looking statements are subject to a variety of known and unknown risks, uncertainties and other factors that could cause actual events or results to differ from those reflected in the forward-looking statements, including, without limitation:
• | the price of gold, silver and other metal prices and commodities; |
• | the cost of operations; |
• | currency fluctuations; |
• | inflation or deflation; |
• | geological and metallurgical assumptions; |
• | risks and uncertainties relating to the interpretation of drill results, the geology, grade and continuity of our mineral deposits; |
• | operating performance of equipment, processes and facilities; |
• | timing of receipt of necessary governmental permits or approvals; |
• | domestic and foreign laws or regulations, particularly relating to the environment, mining and processing; |
• | changes in tax laws; |
• | domestic and international economic and political conditions; |
• | our ability to obtain or maintain necessary financing; |
• | other risks and hazards associated with mining operations. uncertainty of estimates of capital costs, operating costs, production and economic returns; |
• | uncertainty related to inferred mineral resources; |
• | labor relations and our need to attract and retain qualified management and technical personnel; and |
i
• | increased regulatory compliance costs relating to the Dodd-Frank Wall Street Reform and Consumer Protection Act (the "Dodd-Frank Act"). |
This list is not exhaustive of the factors that may affect any of our forward-looking statements. Forward-looking statements are statements about the future and are inherently uncertain, and our actual achievements or other future events or conditions may differ materially from those reflected in the forward-looking statements due to a variety of risks, uncertainties and other factors, including, without limitation, those referred to in this Annual Report on Form 10-K under the heading “Risk Factors” and elsewhere.
Our forward-looking statements contained in this Annual Report on Form 10-K are based on the beliefs, expectations and opinions of management as of the date of this report. We do not assume any obligation to update forward-looking statements if circumstances or management’s beliefs, expectations or opinions should change, except as required by law. For the reasons set forth above, investors should not place undue reliance on forward-looking statements.
Currency information
All dollar amounts included in this Annual Report on Form 10-K are expressed in thousands of United States dollars unless otherwise noted. References to CDN$ refer to Canadian dollars.
Cautionary note to U.S. investors regarding estimates of measured, indicated and inferred resources and proven and probable reserves
As used in this Annual Report on Form 10-K, the terms “mineral reserve”, “proven mineral reserve” and “probable mineral reserve” are Canadian mining terms as defined in accordance with Canadian National Instrument 43-101-Standards of Disclosure for Mineral Projects (“NI 43-101”) and the Canadian Institute of Mining, Metallurgy and Petroleum (CIM)-CIM Definition Standards on Mineral Resources and Mineral Reserves, adopted by the CIM Council, as amended (“CIM Definition Standards”).
These definitions differ from the definitions in the SEC Industry Guide 7 (“SEC Industry Guide 7”) under the Securities Act. However, despite the differences in the definition between NI 43-101 and SEC Industry Guide 7:
• | P&E Mining Consultants Inc. has stated that with respect to the proven and probable reserves reported in the amended and restated technical report titled “Technical Report and Pre-Feasibility Study on the True North Gold Mine, Bissett, Manitoba, Canada” dated November 22, 2016, effective June 30, 2016, such proven and probable reserves are equivalent to those determined under SEC Industry Guide 7 and the study meets SEC Industry Guide 7 standards for estimating and reporting reserves; |
• | Practical Mining LLC has stated that the proven and probable reserves reported in the amended and restated technical report titled "Preliminary Feasibility Study for the Midas Mine, Elko County, Nevada", dated April 2, 2015, effective as of August 31, 2014 and the Mineral Reserve and Mineral Resource update for Midas effective as of May 31, 2016 are equal to the proven and probable reserves which would have been reported had the reports been prepared pursuant to SEC Industry Guide 7 standards, and in such disclosures, the procedures and definitions employed in the estimation of proven and probable reserves is also consistent with SEC Industry Guide 7 definitions; and |
• | Practical Mining LLC has stated that the proven and probable reserves reported in the technical report titled "Technical Report for the Fire Creek Project, Lander County, Nevada" dated March 28, 2016, effective June 30, 2015, and the Mineral Reserve and Mineral Resource update for Fire Creek effective as of June 30, 2016 are equal to the proven and probable reserves which would have been reported had the reports been prepared pursuant to SEC Industry Guide 7 standards and in such disclosures the procedures and definitions employed in the estimation of proven and probable reserves is also consistent with SEC Industry Guide 7 definitions. |
The terms “mineral resource”, “measured mineral resource”, “indicated mineral resource” and “inferred mineral resource” are defined in, and required to be disclosed by NI 43-101; however, these terms are not defined terms under SEC Industry Guide 7 and are normally not permitted to be used in reports and registration statements filed with the SEC. Investors are cautioned not to assume that all or any part of a mineral deposit in these categories will ever be converted into reserves. “Inferred mineral resources” have a great amount of uncertainty as to their existence, and great uncertainty as to their economic and legal feasibility. It cannot be assumed that all, or any part, of an inferred mineral resource will ever be upgraded to a higher category. Under Canadian rules, estimates of inferred mineral resources may not form the basis of feasibility or pre-feasibility studies, except in rare cases. Investors are cautioned not to assume that all or any part of an inferred mineral resource exists or is economically or legally mineable.
Disclosure of “contained ounces” in a resource is permitted disclosure under Canadian regulations; however, the SEC normally only permits issuers to report in place tonnage and grade without reference to unit measures for mineralization that does not constitute “reserves” by SEC standards. Accordingly, information contained in this report and the documents incorporated by reference herein contain descriptions of our mineral deposits that may not be comparable to similar information made public by U.S. companies subject to the reporting and disclosure requirements under the United States federal securities laws and the rules and regulations thereunder.
The term “mineralized material” as used in this Annual Report on Form 10-K, although permissible under SEC Industry Guide 7, does not indicate “reserves” by SEC Industry Guide 7 standards. We cannot be certain that any part of the mineralized material will ever be confirmed or converted into SEC Industry Guide 7 compliant “reserves”. Investors are cautioned not to assume that all or any part of
ii
the mineralized material will ever be confirmed or converted into reserves or that mineralized material can be economically or legally extracted.
The scientific and technical information contained in this Annual Report on Form 10-K relating to the Company's Fire Creek mine up to June 30, 2015 is derived from the technical report titled "Technical Report for the Fire Creek Project, Lander County, Nevada", dated as of and filed on SEDAR on March 28, 2016 (with an effective date of June 30, 2015) (the "Fire Creek Technical Report"). The Fire Creek Technical Report was prepared by Mark Odell, P.E., Laura Symmes, SME and Sarah Bull, P.E. of Practical Mining LLC.
The scientific and technical information contained in this Annual Report on Form 10-K relating to the Company's Midas mine up to August 31, 2014 is derived from the technical report titled "Preliminary Feasibility Study for the Midas Mine, Elko County, Nevada", as amended and re-filed on SEDAR on April 2, 2015 (with an effective date of August 31, 2014) (the "Midas Technical Report"). The Midas Technical Report was prepared by Mark Odell, P.E., Laura Symmes, SME, Sarah Bull, P.E. of Practical Mining LLC and Karl Swanson, M.Eng., SME, AusIMM, Independent Mining & Geological Consultant.
The scientific and technical information contained in this Annual Report on Form 10-K relating to the Company's True North mine up to June 30, 2016 is derived from the technical report titled "Technical Report and Pre-Feasibility Study on the True North Gold Mine, Bissett, Manitoba, Canada", as amended and re-filed on SEDAR on November 28, 2016 (with an effective date of June 30, 2016) (the "True North Technical Report"). The True North Technical Report was prepared by Eugene Puritch, P.Eng., Alexandru Veresezan, P.Eng., Fred Brown, P.Geo., William Stone, P.Geo., Alfred Hayden, P.Eng., David Orava, P.Eng., and Kirk Rodgers, P.Eng. of P&E Mining Consultants Inc.
The scientific and technical information contained in this Annual Report on Form 10-K relating to the Company's Hollister mine up to May 30, 2016 is derived from the technical report titled "Independent Technical Report for the Hollister Gold Project, Nevada, USA", dated as of October 25, 2016 (with an effective date of May 30, 2016) (the "Hollister Technical Report"). The Hollister Technical Report was prepared by Marek Nowak, Peng., of SRK Consulting (Canada) Inc.
The technical reports mentioned above are subject to certain assumptions, qualifications and procedures described therein. Reference should be made to the full text of the technical reports, which have been filed with Canadian securities regulatory authorities pursuant to NI 43-101 and are available for review under the Corporation's profile on SEDAR at www.sedar.com. The technical reports are not, and shall not be deemed to be, incorporated by reference in this Annual Report on Form 10-K. Where appropriate, certain information contained in this Annual Report on Form 10-K updates information derived from such technical reports.
All scientific or technical information relating to the Fire Creek mine subsequent to June 30, 2015, all scientific or technical information relating to the Midas mine subsequent to August 31, 2014, all scientific or technical information relating to the True North mine subsequent to June 30, 2016 and all scientific or technical information relating to Hollister subsequent to May 30, 2016 have been prepared by or under the supervision of Brian Morris, who is a "qualified person" for purposes of NI 43-101. Brian Morris has approved the disclosure of all such scientific and technical information contained in this Annual Report on Form 10-K.
iii
PART I
Item 1. Business
About the Company
Klondex Mines Ltd. is a well–capitalized, junior–tier gold and silver mining company focused on mining, exploration, development, and production in a safe, environmentally responsible, and cost–effective manner. As of December 31, 2016, Klondex Mines Ltd. had 100% interests in three producing mines: (1) the Fire Creek mine ("Fire Creek") and (2) the Midas mine and ore milling facility ("Midas"), both of which are located in the state of Nevada, USA, and (3) the True North gold mine and mill in Manitoba, Canada ("True North", formerly known as the Rice Lake mine). The Company also has 100% interests in two recently acquired projects: (1) the Hollister mine ("Hollister"), and (2) the Aurora mine and ore milling facility ("Aurora", formerly known as Esmeralda), both of which are also located in Nevada, USA.
Klondex Mines Ltd. was incorporated on August 25, 1971 under the laws of British Columbia, Canada and its common shares are listed on the Toronto Stock Exchange ("TSX") under the symbol "KDX" and on the NYSE MKT LLC ("NYSE MKT") under the symbol "KLDX".
Klondex Mines Ltd.'s registered office is located at 1055 West Hastings Street, Suite 2200, Vancouver, British Columbia, Canada V6E 2E9 and its corporate headquarters is located at 6110 Plumas St, Suite A, Reno, NV 89519.
In this report, “we”, “us”, “our”, the “Company”, "its", and “Klondex” refer to Klondex Mines Ltd. and its subsidiaries.
Business development and strategy
Prior to February 2014, our only mine was Fire Creek and since that time we have experienced growth in our annual gold and silver production, total assets, and workforce largely due to the acquisitions outlined below:
Acquisitions:(1) | Midas | True North | Hollister and Aurora | Total | ||||||||||||
Date acquired: | February 11, 2014 | January 22, 2016 | October 3, 2016 | |||||||||||||
Purchase consideration (thousands): | $ | 63,645 | $ | 31,100 | $ | 109,568 | $ | 204,313 | ||||||||
(1) Refer to Note 4. Business Combinations to the Notes to Consolidated Financial Statements for additional detail. | ||||||||||||||||
The acquisition of Midas allowed us to begin processing Fire Creek's ore, together with Midas' ore, at the Midas mill, which is located approximately 120 miles away from Fire Creek. True North has a mill and processes its ore on-site. It is currently anticipated that mineralized material from Hollister, which does not have a mill and is an exploration and development stage mineral property, will be processed at the nearby Midas mill (approximately 17 miles away) or, in the case of mineral-bearing concentrate, at the Aurora mill.
During 2016, our producing mines were Fire Creek, Midas, and True North, and in 2017 we expect to produce from these same mines in addition to the mining activities at the Hollister Project under a bulk sampling program. Refer to the 2017 Full Year Outlook section of Part II, Item 7 - Management's Discussion and Analysis of Financial Condition and Results of Operations ("MDA") for a summary of our expected 2017 production volumes, costs, capital, development, and exploration expenditures.
Gold and silver sales represent 100% of our revenues and the market prices of gold and silver significantly impact our financial position, operating results, and cash flows. Our primary strategy is to increase shareholder value by responsibly achieving our production, cost, and capital targets while attempting to extend our mine lives through development and exploration programs. We also consider acquisitions or other arrangements in the normal course which strategically fit our future growth objectives. We have an experienced management team, a strong financial position, a low-cost production profile, and high-quality assets located in mining-friendly jurisdictions.
Segment information
Our segments include Fire Creek, Midas, True North, Hollister, Aurora, and Corporate and other. The Fire Creek, Midas, True North, Hollister, and Aurora segments include the operations, development, and exploration activities of each respective segment. The Corporate and other segment includes general and administrative costs of the Company. Our segments generally have revenues, earnings or losses, or assets exceeding 10% of the respective consolidated totals, and each segment is individually reviewed by our Chief Executive Officer to make decisions about resources to be allocated to the segments and to assess their performance. See Note 20. Segment information to the Notes to Consolidated Financial Statements for additional information on our segments.
1
Principal products and market overview
Principal products and revenues
During 2016, our principal products were produced at Fire Creek, Midas, and True North and consisted of gold and silver doré bars which were sent to a third-party refiner to produce bullion that met the required market standards of 99.95% pure gold and 99.90% pure silver before being sold to financial institutions and precious metals traders. Under the terms of our refining agreements, doré bars are refined for a fee, and the separately-recovered gold and silver ounces are credited to our account or, at our instruction, delivered to our buyers' accounts.
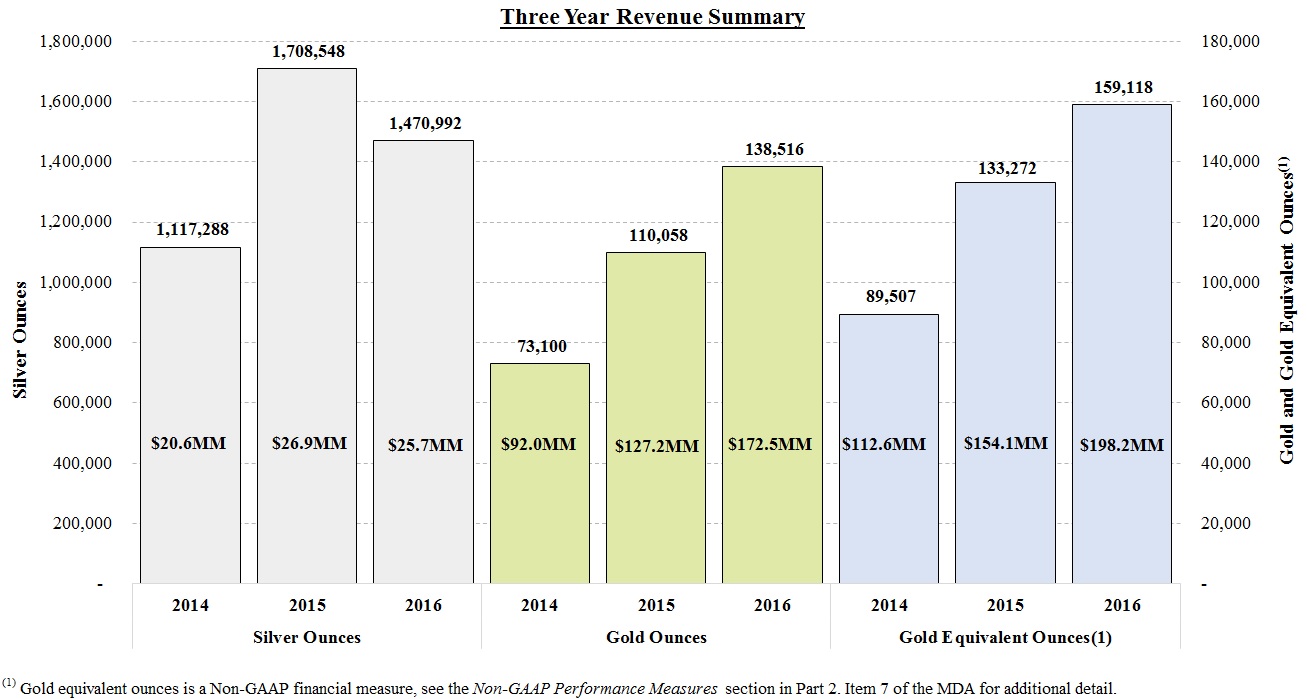
In 2016, 2015, and 2014, revenues from gold and silver made up 87.1% and 12.9%, 82.6% and 17.4%, and 81.7% and 18.3%, respectively, of our total revenue and, as such, we currently consider gold to be our principal product. We expect gold and silver sales to be our only source of future revenues. The following charts provide details about our ounces sold and associated revenues for the last three years (revenue labels within bars in millions):
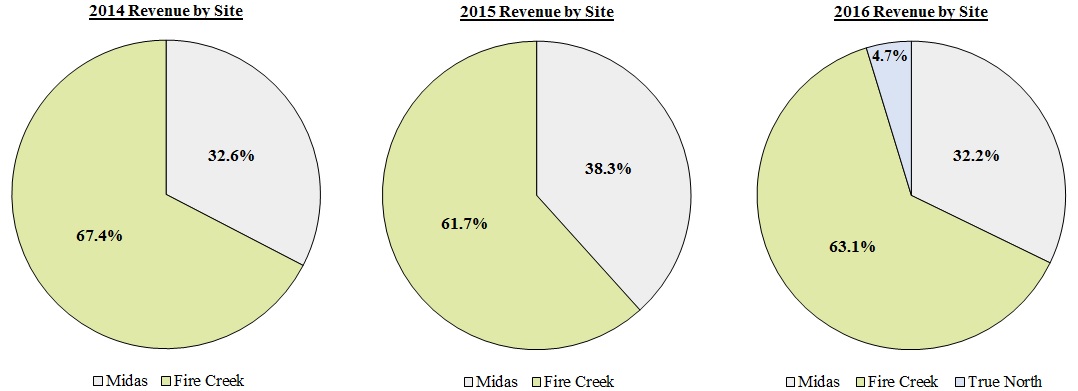
The following charts provide details about the percentage of revenue by site for the last three years:
2
Principal product uses and prices
Generally, gold and silver have two main categories of use: fabrication and investment. Fabricated precious metals have a variety of end uses, including jewelry, electronics, dentistry, industrial and decorative uses, medals, medallions, and coins. Investors buy gold and silver bullion, coins, and jewelry as investments. Gold prices and silver prices are volatile and are affected by many factors beyond our control, such as sales or purchases by central banks and financial institutions, inflation or deflation and monetary policies, fluctuation in the value of the US dollar and foreign currencies, global and regional demand, and political and economic conditions of countries throughout the world.
The following table presents the annual high, low, and average afternoon fixing prices for gold and silver over the past three years on the London Bullion Market ("LBMA") compared to our average realized sales prices (in U.S. dollars per ounce):
Gold | Silver | |||||||||||||||||||||||
Year | High | Low | Average | High | Low | Average | ||||||||||||||||||
2014 LBMA | $ | 1,385 | $ | 1,142 | $ | 1,266 | $ | 22.05 | $ | 15.28 | $ | 19.08 | ||||||||||||
2014 Klondex Average | 1,258 | 18.47 | ||||||||||||||||||||||
2015 LBMA | 1,296 | 1,049 | 1,160 | 18.23 | 13.71 | 15.68 | ||||||||||||||||||
2015 Klondex Average | 1,156 | 15.72 | ||||||||||||||||||||||
2016 LBMA | 1,366 | 1,077 | 1,251 | 20.71 | 13.58 | 17.14 | ||||||||||||||||||
2016 Klondex Average | 1,245 | 17.44 | ||||||||||||||||||||||
On March 21, 2017, the afternoon fixing prices for gold and silver on the London Bullion Market were $1,242 per ounce and $17.31 per ounce, respectively.
Major customers
We have historically sold our metal to five customers. Because our metal is refined to produce bullion that meets the required market standards, we believe the loss of any one of our customers would not adversely affect our ability to sell due to the liquidity of gold and silver markets and the availability of alternative trading counterparties. See Note 20. Segment information to the Notes to Consolidated Financial Statements for a listing of revenues by customer.
Employees and contractors
None of our employees are represented by unions. The estimated number of employees and contractors employed by us as at December 31, 2016 was as follows:
Segment | Employees | Contractors | Total | ||||||
Fire Creek | 70 | 116 | 186 | ||||||
Midas | 138 | 124 | 262 | ||||||
True North | 139 | 135 | 274 | ||||||
Hollister | 8 | 39 | 47 | ||||||
Aurora | 5 | — | 5 | ||||||
Corporate and other | 40 | — | 40 | ||||||
Total | 400 | 414 | 814 | ||||||
Competition
We compete with other mining companies that operate in a general proximity to our mines, some of which are larger and better capitalized, for skilled employees and contractors residing in small communities like Winnemucca, Nevada, Elko, Nevada, and Bissett, Manitoba, Canada. Although we have not historically experienced such, material shortages of skilled employees could lead to production inefficiencies and/or additional costs.
From time-to-time certain production inputs have been in short supply. Shortages of production supplies and raw materials rarely lead to operational issues, but would require us to either substitute with lower quality supplies or to ship these supplies from longer distances. These substitutions and changes could result in production inefficiencies and/or additional costs. To date, we have not experienced any material shortages in production inputs.
3
Mine safety and health
Despite high-levels of health and safety performance, our philosophy is one of "continuous improvement" combined with a belief that "the miner is the most important thing to come out of a mine." We have mandatory mine safety and health programs that include employee and contractor training, risk management, workplace inspection, emergency response, accident investigation and program auditing. We consider these programs to be essential at all levels to ensure that our employees, contractors, and visitors operate safely.
During 2016, we had no lost-time injuries at our properties and as of December 31, 2016, had operated 1,539 days (~4.0 years) at Fire Creek, 815 days (~2.0 years) at Midas, 344 days (~0.7 years) at True North, and 89 days (~0.3 years) at Hollister and Aurora, without a lost-time injury.
Our United States operations and exploration properties are subject to regulation by the Federal Mine Safety and Health Administration (“MSHA”) under the Federal Mine Safety and Health Act of 1977 (the “Mine Act”). MSHA inspects our mines on a regular basis and issues various citations and orders when it believes a violation has occurred under the Mine Act. The Dodd-Frank Act requires us to provide a mine safety disclosure, which we have done in Part I-Item 4. Mine Safety Disclosure of this Form 10-K.
Government regulation of mining-related activities
Government and environmental regulation
Our exploration and development activities are subject to various national, state, provincial and local laws and regulations in the United States and Canada, which govern prospecting, development, mining, production, exports, taxes, labor standards, occupational health, waste disposal, protection of the environment, mine safety, hazardous substances and other matters. We have obtained or have pending applications for those licenses, permits or other authorizations currently required to conduct our exploration and development programs. We believe that we are in compliance in all material respects with applicable mining, health, safety and environmental statutes and regulations in the United States and Canada. For a more detailed discussion of the various government laws and regulations applicable to our operations and potential negative effects of these laws and regulations, see section Item 1A. Risk Factors - Environmental and Regulatory Risks, below.
Available information
We maintain an internet website at www.klondexmines.com. Through the "Investors" section of the website, we make available, free of charge, any previously filed annual and quarterly reports on Forms 10-K and 10-Q and current reports on Form 8-K, and all amendments to those reports, as soon as reasonably practical after such material is electronically filed or furnished with the SEC. We do not currently make available our Current Reports on Form 8-K on our website, but we will provide you with electronic or paper copies of such reports free of charge (not including any exhibits thereto) upon written request to Klondex Mines Ltd., 6110 Plumas Street, Suite A, Reno, Nevada 89519 Attn: Investor Relations. Our website does not currently contain Interactive Data Files filed or furnished pursuant to Rule 405 of Regulation S-T as we will begin, and be subject to, such filings with the Quarterly Report on Form 10-Q for the three months ended March 31, 2017. In addition, our "Code of Ethics, Trading Restrictions, and Whistleblowing" policy as well as the charters of key committees of our Board are also available on our web site. Our website and the information contained therein or connected thereto are not intended to be, and are not incorporated into this Annual Report on Form 10-K.
You may also read and copy any materials we file with the SEC at the SEC’s Public Reference Room at 100 F Street, NE, Washington, D.C. 20549. Copies of such materials also can be obtained free of charge at the SEC’s website, www.sec.gov, or by mail from the Public Reference Room of the SEC, at prescribed rates. Please call the SEC at 1-800-SEC-0330 for further information on the operation of the Public Reference Room.
Item 1A. Risk Factors
Any investment in Klondex involves a high degree of risk. You should carefully consider the risks described below and the other information contained in this Annual Report on Form 10-K when making an investment decision related to the Company. Our operations and financial results are subject to various risks and uncertainties, including those described below, that could materially adversely affect our business, financial condition, results of operations, cash flows and the trading price of our securities. The risks described below are not the only ones we face and additional risks and uncertainties not presently known to us or that we currently deem immaterial may also affect our business.
The risk factors described below are grouped into the following categories: Financial, Operational, Environmental and Regulatory, and Other.
Financial Risks
Extended declines in the prices of gold and silver would have a material adverse effect on our earnings and cash flows and our ability to repay our outstanding debt as it comes due. Fluctuations in the prices of gold and silver can cause significant volatility in our financial performance and materially and adversely affect the trading prices of our securities.
4
Our core business is dependent on the prices of gold and silver, which are highly volatile and are affected by numerous factors beyond our control. During the year ended December 31, 2016, the low-high prices per ounce of gold and silver ranged from $1,077-$1,366 and $13.58-$20.71, respectively. Factors tending to influence such metals prices include the following:
• | the rates of global economic growth; |
• | industrial and retail demand, including worldwide demand for products containing gold and silver; |
• | short-term changes in supply and demand because of speculative hedging activities; |
• | worldwide supply of these metals including the expected near-term supply from new mine sources; |
• | the availability and cost of substitute materials; |
• | inventory levels; |
• | the industry production cost curve and the expected cost to develop new sources of supply; |
• | expectations with respect to the rate of inflation; |
• | the relative strength of the US dollar (the currency in which the prices of gold and silver are generally quoted), the Canadian dollar and certain other currencies; |
• | interest rates; |
• | global or regional political conditions, including terrorism and war; |
• | global or regional economic conditions, including interest rates, central bank lending and currency values; and |
• | sales by central banks and other holders, speculators and producers in response to any of the above factors. |
The Company historically has not entered into material, long-term hedging arrangements for gold and silver prices longer than 12 months and even if such hedging transactions were entered into, there can be no assurance that the intent to reduce the risk associated with fluctuations in metal prices will be successful.
Any decline in the prices of gold or silver adversely impacts our revenues, net earnings (loss), cash flows, and credit quality and could affect our ability to make necessary capital investments, repay our debt and meet our debt service and other fixed obligations, and depress the trading prices of our securities. Sustained declines in prices could also:
• | cause us to revise our operating plans, resulting in reduced output, the placement of our mines on care and maintenance or closure of one or more of our mines or other facilities; |
• | further reduce revenues through production declines due to cessation of mining of deposits that have become uneconomic; |
• | reduce funds available for capital expenditures; |
• | delay or prevent our ability to make accretive acquisitions or conduct exploration work; |
• | reduce existing reserves due to economic viability; and |
• | cause us to write down assets and accelerate depletion, reclamation and closure charges. |
Substantial leverage and debt service obligations may adversely affect our cash flows, liquidity and operations.
As of December 31, 2016, the aggregate consolidated carrying value of our indebtedness totaled approximately $30.2 million, consisting of $18.0 million for the Gold Purchase Agreement (as defined herein), $11.2 million outstanding under our Revolver (as defined in Note 8. Debt to the Notes to Consolidated Financial Statements), and $1.1 million for capital lease obligations. During the year ended December 31, 2016, we recorded $5.3 million of interest expense, net to service our indebtedness. Our ability to make scheduled payments of the principal of, to pay interest on, or to refinance our indebtedness depends on our future performance, which is subject to economic, financial, competitive and other factors many of which are not under our control. Liquidity risk is the risk that we will not be able to meet our financial obligations as they become due, including, among others, debt repayments, interest payments and contractual commitments. We may not continue to generate cash flow from operations in the future sufficient to service the debt and make necessary capital expenditures. If we are unable to generate such cash flow, we may be required to adopt one or more alternatives, such as selling assets, restructuring debt or obtaining additional equity capital on terms that may be onerous or highly dilutive. Our ability to refinance our indebtedness will depend on the capital markets and our financial condition at such time. We may not be able to engage in any of these activities or engage in these activities on desirable terms, which could result in a default on our debt obligations. In addition, much of our debt is secured by our subsidiaries or operating assets, and a default would result in the right of our lenders to enforce that security.
From time to time, debt instruments to which we are or may become party may require us to satisfy various affirmative and negative covenants and to meet certain financial ratios and tests, as further described in Note 8. Debt to the Notes to Consolidated Financial Statements. These covenants may limit, among other things, our ability to incur further indebtedness, create certain liens on assets or engage in certain types of transactions. There are no assurances that, in the future, we will not, as a result of such covenants, be limited in our ability to respond to changes in business or competitive activities or be restricted in our ability to engage in mergers, acquisitions
5
or dispositions of assets. Furthermore, a failure to comply with such covenants could result in an event of default under the debt instruments and may allow the lenders thereunder to accelerate repayment obligations or enforce security (if any).
An extended decline in prices of gold and silver, an increase in operating or capital costs, or a reduction in mineral resource or mineral reserve estimates, among other things, may cause us to record write-downs to long-lived assets or asset groups or production-related inventories, which could negatively impact our results of operations.
When events and circumstances indicate that the carrying amount of our long-lived assets or production-related inventories may not be recoverable or realizable, we evaluate such pursuant to our United States generally accepted accounting principles ("U.S. GAAP") accounting policies which are described in Note 2. Summary of significant accounting policies to the Notes to Consolidated Financial Statements. The economic environment, gold and silver prices, operating margins, projections of future results and costs, and our share price may be used when considering impairment indicators or net realizable value thresholds for purposes of applying our accounting policies. We may incur write-downs in the future if commodity prices experience a sustained decline, if there are significant downward adjustments to estimates of recoverable quantities to be produced from estimated proven and probable mineral reserves or production quantities and if there are upward adjustments to estimated operating costs and capital expenditures and/or changes in CDN$ to USD$ foreign exchange rates, all based on life-of-mine plans and projections. Asset impairments and production-related inventory write-downs have an adverse impact on our results of operations and may negatively limit our ability to obtain any additional financing and could decrease the outlook of our share price performance.
As discussed in Note 5. Inventories to the Notes to Consolidated Financial Statements, the application of our lower of average cost or net realizable value accounting policy resulted in write-downs to production inventories of $2.9 million, $1.2 million, and nil during the years ended December 31, 2016, 2015, and 2014, respectively. We did not experience any impairments of long-lived assets during the years ended December 31, 2016, 2015, and 2014.
Mine closure and reclamation costs for environmental liabilities may exceed the provisions we have made and our inability to provide reclamation bonding or maintain insurance could adversely affect our operating results and financial condition.
As of December 31, 2016, our asset retirement obligations totaled $25.4 million, the amount of which represents a discounted cash flow estimate of future expenditures required to reclaim disturbed areas. We are required by United States federal and state laws and Canadian federal and provincial laws to provide financial assurance sufficient to allow a third party to implement approved closure and reclamation plans if we are unable to do so. These laws are complex and vary from jurisdiction to jurisdiction. The laws govern the determination of the scope and cost of the closure and reclamation obligations and the amount and forms of financial assurance. The amount and nature of the financial assurances are dependent upon a number of factors, including our financial condition and reclamation cost estimates.
As of December 31, 2016, we had in place surety bonds totaling $48.2 million, which were partially collateralized by restricted cash totaling $10.0 million. As our operations expand or reclamation expenses increase, our reclamation obligations and the financial assurances that we are required to provide may increase accordingly. In addition, any perceived challenges to our liquidity may cause our surety bond holders to increase the amount of cash collateral required or refuse to provide the same level of surety bonding going forward. On December 1, 2016, the United States Environmental Protection Agency proposed the Comprehensive Environmental Response, Compensation, and Liability Act ("CERCLA") regulations requiring mining companies to obtain supplemental financial assurance beyond the current bonding requirements administered by federal and state agencies. Increases in our reclamation obligations and financial assurances, as well as the nature of the security to be provided, could significantly increase our costs, making the maintenance and development of existing and new mines less economically feasible. To the extent that the value of the security provided to the regulatory authorities is or becomes insufficient to cover the amount of financial assurance we are required to post, we may be required to replace or supplement the existing security with more expensive forms of security, which might include cash deposits, which would reduce our cash available for operations and financing activities.
In addition, the costs of surety bonds and financial assurance have fluctuated in recent years while the market terms of such bonds and financial assurance have generally become less favorable to mine operators. These changes in the terms of the bonds and financial assurance have been accompanied at times by a decrease in the number of companies willing to issue surety bonds and financial assurance. Increased costs related to surety bonds and financial assurance could have a material adverse effect on our financial condition and liquidity.
Our operations may require further capital, and current global financial conditions and volatility may negatively impact our ability to obtain such further capital.
During the year ended December 31, 2016, our cash expenditures for plant, equipment and mine development totaled $61.7 million and during 2017 we expect to spend $57 - $62 million on capital expenditures, $7 - $9 million on Hollister development, and $3 - $5 million on regional exploration. The mining, processing, development and exploration of our properties may require substantial additional financing above and beyond what we currently expect in 2017 and later years. Current global financial conditions have been subject to significant volatility, and access to public financing, particularly for resource companies, has been negatively impacted in recent years. These factors may impact our ability to obtain equity or debt financing in the future and additional financing may not be available if needed or, if available, the terms of such financing may be unfavorable to us. Failure to obtain sufficient financing may
6
result in the delay or indefinite postponement of exploration, development or production on any or all of our properties, or even a loss of property interest.
Our operations are subject to currency fluctuations, which could adversely affect our results of operations and financial condition.
Exchange rate fluctuations may affect the costs that we incur in our operations. Gold and silver are typically sold throughout the world based principally on the U.S. dollar price, but a portion of our metal sales and operating expenses incurred at True North and our corporate headquarters are principally in Canadian dollars. As a result, we are subject to foreign exchange risks relating to the relative value of the U.S. dollar as compared to the Canadian dollar. The appreciation of the Canadian dollar against the US dollar can increase the cost of our production and capital expenditures in US dollars, and our results of operations and financial condition could be materially adversely affected.
We may engage in certain gold, silver and commodity hedging activities which may reduce the realized prices we receive for our gold and silver and may involve credit risk, market liquidity risk and unrealized mark-to-market risk.
From time to time, we may use certain derivative products to hedge or manage the risks associated with changes in gold prices, silver prices or consumable prices. There is no assurance that any hedging program or transactions which we may adopt or utilize in order to reduce the risk associated with changes in gold prices, silver prices or consumable prices will be successful. Although hedging may protect us from an adverse price change, it may also prevent us from benefiting fully from a positive price change. Our hedging activities or similar transactions could impact our earnings in various ways, including recognition of certain mark-to-market gains and losses on derivative instruments. The fair value of our derivative instruments could fluctuate significantly between periods. During the year ended December 31, 2016, we recorded losses on forward metal sales of $3.7 million.
We entered into a Gold Purchase Agreement with Franco-Nevada GLW Holdings Corp., a subsidiary of Franco-Nevada Corporation, on February 11, 2014 (the "Gold Purchase Agreement"), pursuant to which we have agreed to deliver an aggregate of 38,250 ounces of gold on a monthly basis over a five-year period ending on December 31, 2018. Under the terms of the Gold Purchase Agreement, we are required to deliver an annual amount of 8,000 ounces of gold in each of 2017 and 2018. In addition, we entered into a Gold Offering Agreement with Waterton Global Value, L.P. (“Waterton”), dated March 31, 2011, as amended and restated October 4, 2011 (the "Gold Supply Agreement"), in which we granted Waterton the right to purchase refined bullion (as defined therein) produced from Fire Creek, on a monthly basis, for a five-year period ending February 28, 2018. In the event that Waterton exercises its purchase right, the purchase price is calculated as the average afternoon settlement price per gold ounce on the LBMA for the 30 days immediately preceding the relevant pricing date. Our obligations relating to delivery of gold ounces under each of the Gold Purchase Agreement and the Gold Supply Agreement may require us to engage in hedging activities from time to time. During the year ended December 31, 2016, we recorded losses on the Gold Purchase Agreement and Gold Offering Agreement of $2.2 million and $1.1 million, respectively.
Generally, the use of derivative instruments involves certain inherent risks, including, among other things:
• | credit risk - the risk of an unexpected loss arising if a counterparty with which we have entered into transactions fails to meet its contractual obligations; |
• | market liquidity risk - the risk that we have entered into a derivative position that cannot be closed out quickly, by either liquidating such derivative instrument or by establishing an offsetting position; and |
• | unrealized mark-to-market risk - the risk that, in respect of certain derivative products, an adverse change in market prices for commodities, currencies or interest rates will result in our incurring an unrealized mark-to-market loss in respect of such derivative products. |
Forecasts of future production are estimates and actual production may be less than estimated.
Forecasts of future production are estimates based on interpretation and assumptions and actual production may be less than estimated. We prepare estimates of future production for our operating mines. Our ability to achieve and maintain the production rates on which such estimates are based is subject to a number of risks and uncertainties. Our production estimates are dependent on, among other things, the accuracy of mineral reserve estimates, the accuracy of assumptions regarding ore grades and recovery rates, ground conditions, physical characteristics of ores, such as hardness and the presence or absence of particular metallurgical characteristics, and the accuracy of estimated rates and costs of mining and processing. Our actual production may vary from our estimates for a variety of reasons. Any possible failure to achieve our production estimates could have a material adverse effect on our results of operations and financial condition.
There is no guarantee that anticipated production costs will be achieved at our mineral projects. Failure to achieve anticipated production costs may have a material adverse impact on our ability to repay certain loans and generate revenue and cash flow to fund operations and future profitability.
Operational Risks
Our business is subject to production and operational risks that could adversely affect our business and our insurance may not cover these risks and hazards adequately or at all.
7
Mining and metals processing involve significant production and operational risks normally encountered in the exploration, development and production of gold and other base or precious metals, some of which are outside of our control, including, without limitation, the following:
• | unanticipated ground and water conditions; |
• | adverse claims to water rights and shortages of water to which we have rights; |
• | adjacent or adverse land or mineral ownership that results in constraints on current or future mine operations; |
• | geological problems, including seismic activity, earthquakes and other natural disasters; |
• | metallurgical and other processing problems; |
• | unusual or unexpected mineralogy or rock formations; |
• | ground or slope failures; |
• | tailings design or operational issues, including dam breaches or failures; |
• | structural cave-ins, wall failures or rock-slides; |
• | flooding or fires; |
• | equipment failures; |
• | periodic interruptions due to inclement or hazardous weather conditions or operating conditions and other force majeure events; |
• | lower than expected ore grades or recovery rates; |
• | accidents; |
• | delays in the receipt of or failure to receive necessary government permits; |
• | the results of litigation, including appeals of agency decisions; |
• | delays in transportation; |
• | interruption of energy supply; |
• | labor disputes; |
• | inability to obtain satisfactory insurance coverage; |
• | the availability of drilling and related equipment in the area where mining operations will be conducted; and |
• | the failure of equipment or processes to operate in accordance with specifications or expectations. |
These risks could result in damage to, or destruction of, our mines and milling facilities, resulting in partial or complete shutdowns, personal injury or death, environmental or other damage to our properties or the properties of others, delays in mining, reduced production, monetary losses and potential legal liability. Milling operations are subject to hazards, such as equipment failure or failure of retaining dams around tailings disposal areas that may result in personal injury or death, environmental pollution and consequential liabilities.
In addition, we rely on a few key vendors for our operations. A breach of the applicable contract by any of these vendors, a significant dispute with any of these vendors, a force majeure event or other operational or financial issues affecting one or more of these vendors, including labor strikes or work stoppages, or any other event that would significantly impede the ability of these vendors to perform their contractual obligations to us or that would have a significant negative impact on our contractual relationship with them would adversely affect our ability to produce our primary products, which could have a material impact on our financial condition and results of operations.
Our insurance will not cover all the potential risks associated with our operations. In addition, although certain risks are insurable, we may be unable to maintain insurance to cover these risks at economically feasible premiums. Insurance coverage may not continue to be available or, if available, may not be adequate to cover any resulting liability. Moreover, insurance against risks such as environmental pollution or other hazards as a result of exploration, development and production may be prohibitively expensive to obtain for a company of our size and financial means. We might also become subject to liability for pollution or other hazards against which we may not be insured or against which we may elect not to insure because of premium costs or other reasons. Losses from these events may cause us to incur significant costs that could have a material adverse effect upon our business, financial condition and results of operations. Furthermore, should we be unable to fund fully the cost of remedying an environmental problem, we might be required to suspend operations or enter into interim compliance measures pending completion of the required remedy.
We are dependent on the success of the Fire Creek Mine, the Midas Mine and mill and the True North Mine and mill.
Our principal operations are the Fire Creek Mine and the Midas Mine, both in Nevada, and the True North Mine in Canada. We are primarily dependent upon the success of these mines and continual operation of their mills as sources of future revenue and profits. The continued development or expansion of mining operations at these mines may require the commitment of substantial additional
8
resources for operating expenses and capital expenditures, which may increase in subsequent years as needed, and for consultants, personnel and equipment associated with additional development and commercial production of such properties.
The development of Hollister may require substantial investment.
The exploration, development and anticipated commercial production at Hollister will require substantial additional financing. During 2017, we expect to spend between $7 - $9 million in development at Hollister. Failure to obtain sufficient financing may result in the delay or indefinite postponement of exploration, development or production at Hollister. Additional capital or other types of financing may not be available if needed or, if available, the terms of such financing may be unfavorable to us.
Our exploration activities may not be commercially successful.
Our long-term success depends on our ability to identify additional mineral deposits that we can develop into commercially viable mining operations. Mineral exploration is highly speculative in nature, involves many risks and is frequently non-productive. These risks include unusual or unexpected geologic formations and the inability to obtain suitable or adequate machinery, equipment or labor. The success of gold exploration is determined in part by the following factors:
• | the identification of potential gold mineralization; |
• | the availability of government-granted exploration permits; |
• | the quality of management and geological and technical expertise; and |
• | the capital available for exploration. |
Substantial expenditures are required, but not guaranteed, to establish mineral proven and probable reserves through drilling and analysis, to develop metallurgical processes to extract metal, and to develop the mining and processing facilities and infrastructure at any site chosen for mining. Whether a mineral deposit will be commercially viable depends on a number of factors, which include, without limitation, the particular attributes of the deposit, such as size, grade and proximity to infrastructure; metal prices, which may fluctuate widely; and government regulations, including, without limitation, regulations relating to prices, taxes, royalties, land tenure, land use, importing and exporting of minerals and environmental protection. There is no certainty that we will discover or acquire any mineralized material in sufficient quantities to justify continued commercial operations at Fire Creek, Midas or True North or to justify operations at any of our other properties.
Increased operating costs could affect our profitability.
Costs at any particular mining location are subject to variation due to a number of factors, such as changing ore grade, changing metallurgy and revisions to mine plans in response to the physical shape and location of the ore body. In addition, costs at our mining locations may be affected by the price of input commodities, such as fuel, electricity, labor, chemical reagents, grinding media, mill liners, explosives, steel and concrete. The costs of our operating consumables are, at times, subject to volatile price movements, including increases that could make production at certain operations less profitable and changes in laws and regulations affecting their price, use and transport. Reported costs may also be affected by changes in accounting standards. A material increase in costs at any particular mining location could have a significant effect on our profitability and operating cash flow.
Our mining production depends on the availability of sufficient water supplies.
Our operations require significant quantities of water for mining, ore processing and related support facilities. Continuous production at our mines depends on our ability to maintain our water rights and claims. Although our current operations have sufficient water rights and claims to cover current operational demands, we cannot predict the potential outcome of future legal proceedings affecting our water rights, claims and uses. The failure to obtain needed water permits, the loss of some or all water rights for any of our mines, in whole or in part, or shortages of water to which we have rights due to weather, equipment issues or other factors could require us to curtail or close mining production and could prevent us from pursuing expansion opportunities.
A temporary or extended shutdown of any of our operations could expose us to significant costs and adversely affect our access to skilled labor.
From time to time, we may have to temporarily shut down one or more of our operating sites or place one or more of our operating sites on care and maintenance or permanent shutdown, if they are not commercially viable due to factors such as declines in metal prices, increased costs or adverse changes in interest rates or currency exchange rates. During temporary shutdowns or while a site is on care and maintenance, we will have to continue to expend capital to maintain the site or facility and equipment. In addition, reductions in workforce, advance notice requirements under collective labor agreements or applicable law, and severance obligations arising from such suspension or shutdown could cause us to incur significant labor costs. Furthermore, temporary or extended shutdowns may adversely affect our future access to skilled labor, as employees who are laid off may seek employment elsewhere.
In addition, if our operations are shut down for an extended period of time, we may be required to engage in environmental remediation of the plant sites or accelerated reclamation of our mines, which would require us to incur additional costs. The costs of ramping up production at one of our operations following a temporary shutdown could be significant. Given the costs involved in a temporary
9
shutdown of our operations, we may instead choose to continue to operate those operations at a loss. Such a decision could have a material adverse effect on our results of operations and financial condition.
We are subject to substantial government regulation. Changes to regulation or more stringent implementation could have a material adverse effect on our results of operations and financial condition.
Our mining, processing, development and mineral exploration activities are subject to various laws governing prospecting, development, production, taxes, labor standards and occupational health, mine safety, toxic substances, land use, water use, land claims of local people and other matters. Mining and exploration activities are also subject to various laws and regulations relating to the protection of the environment, such as the federal Clean Water Act and the Nevada Water Pollution Control Law. Although we currently believe that we are in compliance with existing environmental and mining laws and regulations and that our proposed exploration programs will also meet those standards, no assurance can be given that we will remain in compliance with applicable regulations or that new rules and regulations will not be enacted or that existing rules and regulations will not be applied in a manner that could limit or curtail production or development of our properties.
At present, there is no royalty payable to the United States or to the province of Manitoba on production from unpatented mining claims, although legislative attempts to impose a royalty have occurred in recent years. Amendments to current laws and regulations governing our operations and activities of exploration, development mining and milling or more stringent implementation thereof could have a material adverse effect on our business, financial condition and results of operations and cause increases in exploration expenses, capital expenditures or production costs or reduction in levels of production or require delays or abandonment in the development of new mining properties.
In addition, we are required to expend significant resources to comply with numerous corporate governance and disclosure regulations and requirements adopted by U.S. federal and state and Canadian federal and provincial governments, as well as the TSX and NYSE MKT. These additional compliance costs and related diversion of the attention of management and key personnel could have a material adverse effect on our business, financial condition and results of operations.
Reform of the General Mining Law could adversely impact our results of operations.
A portion of our U.S. mining properties are on unpatented mining claims on federal lands. Legislation has been introduced regularly in the U.S. Congress over the last decade to change the General Mining Law of 1872, as amended (the "Mining Law"), under which we hold these unpatented mining claims. It is possible that the Mining Law may be amended or replaced by less favorable legislation in the future. Previously proposed legislation contained a production royalty obligation, new environmental standards and conditions, additional reclamation requirements and extensive new procedural steps which would likely result in delays in permitting. The ultimate content of future proposed legislation, if enacted, is uncertain. If a royalty on unpatented mining claims were imposed, the profitability of our U.S. operations could be materially adversely affected.
Any such reform of the Mining Law could increase the costs of mining activities on unpatented mining claims, or could materially impair our ability to develop or continue operations which derive ore from federal lands, and as a result, could have an adverse effect on us and our results of operations.
Mineral reserves are only estimates which may be unreliable.
Although mineralization may not be classified as a “reserve” unless the mineralization can be economically and legally extracted or produced at the time the “reserve” determination is made, “mineral reserves” are estimates only, and no assurance can be given that the anticipated tonnages and grades will be achieved, that the indicated level of recovery will be realized or that mineral reserves can be mined or processed profitably. Mineral reserve and mineral resource estimates may be materially affected by environmental, permitting, legal, title, taxation, socio-political, marketing and other relevant issues. There are numerous uncertainties inherent in estimating mineral reserves and mineral resources, including many factors beyond our control. Such estimation is a subjective process, and the accuracy of any mineral reserve or mineral resource estimate is a function of the quantity and quality of available data, the nature of the ore body and of the assumptions made and judgments used in engineering and geological interpretation. These estimates may require adjustments or downward revisions based upon further exploration or development work or actual production experience.
Fluctuations in gold or silver prices, results of drilling, metallurgical testing and production, the evaluation of mine plans after the date of any estimate, permitting requirements or unforeseen technical or operational difficulties may require revision of mineral reserve estimates. Prolonged declines in the market price of gold or silver may render mineral reserves containing relatively lower grades of mineralization uneconomical to recover and could materially reduce our mineral reserves. Should reductions in mineral reserves occur, we may be required to take a material write-down of our investment in mining properties, reduce the carrying value of one or more of our assets or delay or discontinue production or the development of new projects, resulting in increased net losses and reduced cash flow. Mineral reserves should not be interpreted as assurances of mine life or of the profitability of current or future operations. There is a degree of uncertainty attributable to the calculation and estimation of mineral reserves and corresponding grades being mined and, as a result, the volume and grade of mineral reserves mined and processed and recovery rates may not be the same as currently anticipated. Any material reductions in estimates of mineral reserves, or of our ability to extract these mineral reserves, could have a material adverse effect on our results of operations and financial condition.
10
Estimates of mineral reserves, mineral resources and projected cash flows may prove to be inaccurate, which could negatively impact our results of operations and financial condition.
There are numerous uncertainties inherent in estimating mineral reserves and mineral resources and the future cash flows that might be derived from production of mineral reserves. Accordingly, any figures for mineral reserves and future cash flows contained in this Annual Report on Form 10-K are estimates only, including for Hollister which has no mineral reserves. Although we believe that the estimated mineral reserves and mineral resources at Fire Creek, Midas and True North have been delineated with appropriately spaced drilling, inherent variability exists between duplicate samples taken adjacent to each other and between sampling points that cannot be reasonably eliminated. There also may be unknown geologic details that have not been identified or correctly appreciated at the current level of delineation. This results in uncertainties that cannot be reasonably eliminated from the estimation process. Some of the resulting variances may have a positive effect and others may have a negative effect on mining and processing operations. In respect of mineral reserve and mineral resource estimates, no assurance can be given that the anticipated tonnages and grades will be achieved, that the indicated level of recovery will be realized or that mineral reserves can be mined or processed profitably. The ore grade actually recovered may differ from the estimated grades of the mineral reserves.
In addition, actual future cash flows may differ materially from estimates. Estimates of mineral reserves and future cash flows to be derived from the production of such mineral reserves necessarily depend upon a number of variable factors and assumptions, including, among others, geological and mining conditions that may not be fully identified by available exploration data or that may differ from experience in current operations; historical production from the area compared with production from other producing areas; the assumed effects of regulation by governmental agencies and assumptions concerning metal prices; exchange rates; interest rates; inflation; operating costs; development and maintenance costs; reclamation and post-reclamation costs; and the availability and cost of labor, equipment, raw materials and other services required to mine and refine the ore. Market price fluctuations of gold and silver, as well as increased production costs or reduced recovery rates, may render mineral reserves containing relatively lower grades of mineralization uneconomical to recover and may ultimately result in a restatement of mineral reserves. We may be required to make significant downward revisions to estimates of mineral reserves and future cash flows to be derived from the production of such mineral reserves, if commodity prices experience a sustained decline. In addition, there can be no assurance that mineral recoveries in small scale laboratory tests will be duplicated in larger scale tests under on-site conditions or during production.
For these reasons, estimates of our mineral reserves contained in this Annual Report on Form 10-K, including classifications thereof based on probability of recovery, and any estimates of future cash flows expected from the production of those mineral reserves, prepared by different engineers or by the same engineers at different times may vary substantially. The actual volume and grade of mineral reserves mined and processed, and the actual cash flows derived from that production, may not be as currently anticipated in such estimates. If our actual mineral reserves or cash flows are less than our estimates, our results of operations and financial condition may be materially impaired.
Future growth depends on our ability to replenish our mineral reserves, which involves extending our mine lives through development and exploration and acquiring quality mining assets.
Our ability to replenish our mineral reserves is important to our long-term viability. Depleted mineral reserves can be replaced in several ways, including by expanding known ore bodies, locating new deposits or acquiring new mineral reserves from third parties. Exploration projects involve many risks, require substantial expenditures and may not result in the discovery of sufficient additional mineral deposits that can be mined profitably. Once a site with mineralization is discovered, it may take several years from the initial phases of drilling until production is possible, if ever, during which time the economic feasibility of production may change. As a result, there is no assurance that current or future exploration programs, and additional drilling at our existing operating mines, will be successful.
We also intend to grow our business by acquiring quality mining assets. However, our capital available for new exploration projects and acquisitions may be constrained. In addition, there can be no assurance that suitable acquisition opportunities will be identified or, if identified, that acquisitions will be consummated on favorable terms or at all. Our ability to identify, consummate and to integrate effectively any future acquisitions on terms that are favorable to us may be limited by the number of attractive acquisition targets, internal demands on our resources, competition from other mining companies and, to the extent necessary, our ability to obtain financing on satisfactory terms, or at all. In addition, we compete for attractive acquisition targets with other potential buyers that have more financial and other resources. There is a risk that depletion of reserves will not be offset by discoveries or acquisitions. As a result, we cannot provide assurance that our exploration, development or acquisition efforts will result in any new commercial mining operations or yield new mineral reserves to replace or expand current mineral reserves. If we are not able to replace depleted reserves, it could have a material adverse effect on our business, prospects, results of operations and financial position.
Certain of our mines and exploration properties are located on land that is or may become subject to traditional territory, title claims and/or claims of cultural significance by certain Native American tribes or Aboriginal communities and stakeholders, and such claims and the attendant obligations of the provincial and federal governments to those tribal or Aboriginal communities and stakeholders may affect our current and future operations.
Native American and Aboriginal interests and rights as well as related consultation issues may impact our ability to pursue exploration, development and mining at our U.S. and Canadian properties. There is no assurance that claims or other assertion of rights by tribal
11
or Aboriginal communities and stakeholders or consultation issues will not arise on or with respect to our properties or activities. These could result in significant costs and delays or materially restrict our activities. Opposition by Native American tribes or Aboriginal communities and stakeholders to our presence, operations or development on land subject to their traditional territory or title claims or in areas of cultural significance could negatively impact us in terms of public perception, costly legal proceedings, potential blockades or other interference by third parties in our operations, or court-ordered relief impacting our operations. In addition, we may be required to, or may voluntarily, enter into certain agreements with such Native American tribes or Aboriginal communities and stakeholders in order to facilitate development of our properties, which could reduce the expected earnings or income from any future production.
Shortages of critical parts, equipment and skilled labor may adversely affect our operations and development projects.
The mining industry has been impacted, from time to time, by increased demand for critical resources such as input commodities, drilling equipment, milling equipment, tires and skilled labor. These shortages have, at times, impacted the efficiency of our operations and resulted in cost increases and delays. Any such shortages, cost increases and delays in the future may adversely affect operating costs, capital expenditures and production and construction schedules.
We are required to obtain government approvals and permits in order to conduct operations.
Government approvals and permits are currently required in connection with all of our operations, and further approvals and permits may be required in the future. We must obtain and maintain a variety of licenses and permits, which include or cover without limitation, air quality, water quality, water rights, dam safety, fire safety, emergency preparedness, hazardous materials, mercury control, waste rock management, solid waste disposal, storm water runoff, water pollution control, water treatment, rights of way and tailings operations. Such licenses and permits are subject to change in regulations and in various operating circumstances. The duration and success of our efforts to obtain permits are contingent upon many variables outside of our control. Obtaining governmental approvals and permits may increase costs and cause delays depending on the nature of the activity to be permitted and the applicable requirements implemented by the permitting authority. There can be no assurance that all necessary approvals and permits will be obtained or timely obtained or that they would remain in effect if we were forced into a reorganization, bankruptcy or insolvency proceeding. In addition, there can be no assurance that, if obtained, the costs of the approvals and permits will not exceed our estimates or that we will be able to maintain such approvals and permits. To the extent such approvals or permits are required and not obtained or maintained, our operations may be curtailed, or we may be prohibited from proceeding with planned exploration, development or operation of our mineral properties.
Title to some of our mineral properties may be subject to other claims. Any impairment or defect in title could have a negative impact on our results of operations and financial condition.
Although we believe we have exercised commercially reasonable due diligence with respect to determining title to the properties we own or control, including obtaining title reports with respect to Fire Creek, Midas, True North and Hollister, there is no guarantee that title to such properties will not be challenged or impugned. Our properties may be subject to prior unrecorded agreements or transfers; native land claims; prior unregistered liens; or undetected defects, each of which may affect our title to such properties or otherwise give rise to valid challenges to the title of our properties and which could impair development and/or operations. This is particularly the case in respect of those portions of our properties in which we hold our interest solely through a lease with the claim holders (as opposed to a direct interest in the property), as such interest is substantially based on contract and may have been subject to a number of assignments. As a result, we may be constrained in our ability to operate our properties or unable to enforce our rights with respect to our properties. An impairment to, or defect in, title to our properties could have a material adverse effect on our business, financial condition or results of operations.
Major network failures could have an adverse effect on our business.
Major equipment failures, natural disasters including severe weather, terrorist acts, acts of war, cyber-attacks or other breaches of network systems or security that affect computer systems within our network could disrupt our business functions, including our production activities. Our mines and mills are automated and networked such that a cyber-incident involving our information systems and related infrastructure could negatively impact our operations. A corruption of our financial or operational data or an operational disruption of our production infrastructure could, among other potential impacts, result in: (i) loss of production or accidental discharge; (ii) expensive remediation efforts; (iii) distraction of management; (iv) damage to our reputation or our relationship with customers; or (v) events of noncompliance, which events could lead to regulatory fines or penalties. Any of the foregoing could have a material adverse effect on our business, results of operations and financial condition.
Environmental and Regulatory Risks
We must comply with comprehensive environmental statutes, regulations and other governmental controls, and we face significant environmental risks.
All phases of our operations are subject to environmental regulation. In Canada and the United States, environmental laws provide for, among other things, restrictions and prohibitions on spills, releases, emissions and discharges of various substances produced in association with, or resulting from, our operations. These laws also require that facility sites and mines be operated, maintained and reclaimed to the satisfaction of applicable regulatory authorities, including long-term obligations. Compliance with such laws, including
12
without limitation, detailed monitoring and reporting requirements, requires significant expenditures. An exceedance of a permit limitation or failure to comply with a permit requirement may result in the imposition of fines and penalties, some of which may be material. As a result of our exploration, development and operation of mineral properties, we may experience increased costs and delays as a result of compliance with applicable laws, regulations and permits and this may adversely affect our business, financial condition or results of operations.
Our operations are also subject to laws and regulations governing the protection of endangered and other specified species. In May 2015, the U.S. Department of the Interior released a plan to protect the greater sage grouse, a species whose natural habitat is found across much of the western United States, including Nevada. The U.S. Department of the Interior’s plan is intended to guide conservation efforts on approximately 70 million acres of national public lands. No assurances can be made that restrictions relating to conservation will not have an adverse impact on our operations in impacted areas.
Environmental regulation is evolving in a manner that may require stricter standards and enforcement, increased fines and penalties for noncompliance, more stringent environmental assessments of proposed projects, and a heightened degree of training and responsibility for our officers, directors and employees. Existing or future environmental regulation could have a material adverse effect on our business, financial condition and results of operations. We own or have owned, manage or have been in care or control of properties that may result in a requirement to environmentally remediate such properties that could involve material costs. In addition, environmental conditions or hazards may exist on the properties in which we hold interests, such as Fire Creek, Midas, True North, Hollister, Aurora, and on our other properties that are unknown to us at present or that have been caused by previous or existing owners or operators of the properties for which we may be liable. We may also acquire properties with environmental risks, and the indemnification proceeds we receive from the entity we acquire such properties from, if any, may not be adequate to pay all the fines, penalties and costs (including costs of remediation or removal and related response costs) incurred at or related to such properties.
Failure to comply with applicable laws, regulations and permitting requirements may result in enforcement actions, including compliance and other orders issued by regulatory or judicial authorities causing operations to cease or be curtailed, and may include corrective measures requiring capital expenditures, installation of additional equipment, operation or administration costs or other remedial actions. Due to our engagement in mining operations or in the exploration or development of mineral properties, we may also be required to compensate those suffering loss or damage by reason of such mining activities and may have civil or criminal fines or penalties imposed for violations of applicable laws or regulations. Amendments to current laws, regulations and permits governing operations and activities of mining companies, or more stringent implementation or enforcement thereof, could have a material adverse impact on us and cause increases in exploration expenses, remedial and reclamation obligations, capital expenditures or production costs, reduction in levels of production at producing properties, or abandonment of or delays in development of new mining properties.
Regulation of greenhouse gas emissions effects and climate change issues may adversely affect our operations and markets.
Global climate change continues to attract considerable public, scientific and regulatory attention, and greenhouse gas emission regulation is becoming more commonplace and stringent. As energy, including energy produced from the combustion of carbon-based fuels, is a significant input to our mining and processing operations, we must also comply with emerging climate change regulatory requirements, including programs to reduce greenhouse gas emissions. Our principal energy sources are electricity, purchased petroleum products, propane, and natural gas. In addition, our milling operations and mobile mining equipment emit carbon dioxide.
The Canadian federal and provincial governments may enact an emission trading, carbon tax or similar program to reduce greenhouse gases, which may have a material impact on our business, financial condition or results of operations. Specifically, representatives in the Canadian federal government have announced intentions of instituting a national carbon pricing scheme based on greenhouse gas emissions. Meanwhile, the Province of Manitoba, where our True North mining complex is situated, continues to develop its own plan to reduce greenhouse gas emissions. Any regulation of greenhouse gas emissions by the Canadian federal government or the provincial government of Manitoba may have a material impact on our energy and compliance costs.
The United States federal and state governments may also enact an emission trading, carbon tax or similar program for greenhouse gas emissions, which could significantly increase our energy and regulatory compliance costs. For example, the United States federal government has considered legislation to reduce greenhouse gas emissions through a cap-and-trade system of allowances and credits, among other provisions. In addition, the United States Environmental Protection Agency has developed final rules requiring certain emitters of greenhouse gases to collect and report data with respect to their greenhouse gas emissions.
We are in the process of evaluating the potential impacts on our operations of these new and potential regulations. Either a carbon tax or a cap-and-trade program will likely result in increased future energy costs. The regulations will also likely increase our compliance costs. For example, we may be required to install new equipment to reduce emissions from our processing facilities in order to comply with new regulatory standards or to mitigate the financial impact of a new climate change program. We also may be subject to additional and extensive monitoring and reporting requirements. It is uncertain at this time how provincial and regional initiatives will interact with any federal climate change regulations.
The potential physical impacts of climate change on our operations are highly uncertain and may be particular to the unique geographic circumstances associated with each of our facilities. These may include changes in weather and rainfall patterns, water shortages, changing storm patterns and intensities and changing temperatures. These physical impacts could require us to curtail or close mining
13
production and could prevent us from pursuing expansion opportunities. These effects may adversely impact the cost, production and financial performance of our operations.
We must remove and reduce impurities and toxic substances naturally occurring in mining and processing ore and comply with applicable laws relating thereto, which could result in remedial action and other costs.
Mineral ores and mineral products, including gold and silver ore and products, contain naturally occurring impurities and toxic substances. Although we have implemented procedures that are designed to identify, isolate and safely remove or reduce such impurities and substances, such procedures require strict adherence and no assurance can be given that employees, contractors or others will not be exposed to or be affected by such impurities and toxic substances, which may subject us to liability. Standard operating procedures may not identify, isolate and safely remove or reduce such substances. Even with careful monitoring and effective control, there is still a risk that the presence of impurities or toxic substances in our products may result in such products being rejected by our customers, penalties being imposed due to such impurities or the products being barred from certain markets. Such incidents could require remedial action and could result in curtailment of operations. Legislation requiring manufacturers, importers and downstream users of chemical substances, including metals and minerals, to establish that the substances can be handled and used without negatively affecting health or the environment may impact our operations and markets. These potential compliance costs, litigation expenses, regulatory delays, remediation expenses and operational costs could negatively affect our financial results.
Our internal control over financial reporting was not effective for the year ended December 31, 2016. We may fail to achieve and maintain the adequacy of our internal control over financial reporting in future periods as per the requirements of the Sarbanes-Oxley Act ("SOX").
We are required to document and test our internal control procedures in order to satisfy the requirements of Section 404 of SOX. It requires an annual assessment by management of the effectiveness of our internal control over financial reporting. Our internal control over financial reporting was not effective for the year ended December 31, 2016 based on the material weakness relating to the calculation and presentation of our deferred tax assets and liabilities arising from the transition of the Company’s financial statements from International Financial Reporting Standards to US generally accepted accounting principles described in Item 9A.
We may in the future fail to achieve and maintain the adequacy of our internal control over financial reporting, as such standards are modified, supplemented or amended from time to time, and we may not be able to ensure that we can conclude on an ongoing basis that we have effective internal control over financial reporting in accordance with Section 404 of SOX. Our failure to satisfy the requirements of Section 404 of SOX on an ongoing, timely basis could result in the loss of investor confidence in the reliability of our financial statements, which in turn could harm our business and negatively impact the trading price of our common shares. In addition, any failure to implement required new or improved controls, or difficulties encountered in their implementation, could harm our operating results or cause us to fail to meet our reporting obligations. Future acquisitions of companies may provide us with challenges in implementing the required processes, procedures and controls in our acquired operations. Acquired companies may not have disclosure control and procedures or internal control over financial reporting that are as thorough or effective as those required by securities laws currently applicable to us. For more information regarding management's assessment of the effectiveness of our internal control over financial reporting for the year ended December 31, 2016, see Item 9A of this Annual Report on Form 10-K.
Other Risks
We compete with larger, better capitalized competitors in the mining industry and intense competition could reduce our market share or harm our financial performance.
The mining industry is intensely competitive, and we compete with many companies that have more financial and technical resources than we do. Our competitive position is based on the quality and grade of our mineral reserves, our operating performance, our ability to manage our costs compared to other producers throughout the world, our ability to maintain our financial integrity through the lows of the metal price cycles and our ability to manage our vendor and customer relationships. Our costs are governed to a large extent by the location, grade and nature of our mineral reserves; our input costs including energy, labor and equipment; and our operating and management skills. The metals markets are cyclical, and our ability to maintain our competitive position over the long term is based on our ability to manage our costs, acquire and develop quality deposits and hire and retain a skilled workforce. We intend to continue to grow our business through our exploration program and through future acquisitions. Our competitors may have an advantageous market position and have greater financial and other resources, operational experience and technical capabilities than we do and may, therefore, be able to better withstand poor and volatile market conditions, obtain financing on better terms and attract better or more qualified employees, any of which may have an adverse impact on our business, financial condition and results of operations.
We are dependent upon key management personnel and executives.
We are dependent upon the services of a number of key management personnel, employees and consultants. Our ability to manage our financial, operating, legal, development and exploration activities, and hence our success, depend in large part on the efforts of these individuals. We face intense competition for qualified personnel, and there can be no assurance that we will be able to attract and retain such personnel. We have recently implemented formal programs for succession and training of management. We also maintain "key person" life insurance for only certain, but not all such individuals, which insurance would provide us with proceeds in the event of
14
their death. If such an event were to occur, without “key person” life insurance, we may not have the financial resources to develop or maintain our business until we replace the individual. Accordingly, the loss of the services of one or more of such key management personnel could have a material adverse effect on our business, results of operations and financial condition.
We may from time to time be involved in or subject to legal proceedings, and unfavorable outcomes of such legal proceedings may adversely affect our business and financial condition.
We may from time to time be involved in or subject to legal proceedings related to our business. Such legal proceedings can be complex, costly, and highly disruptive to business operations by diverting the attention and energies of management and other key personnel. There is no guarantee that we will not become subject to such proceedings in the future, and there can be no guarantee of the outcome of any claim. The assessment of the outcome of legal proceedings, including our potential liability, if any, is a highly subjective process that requires judgments about future events that are not within our control. The outcome of litigation, arbitration or other legal proceedings, including amounts ultimately received or paid upon judgment or settlement, may differ materially from management's outlook or estimates, including any amounts accrued in the financial statements. In addition, defense and settlement costs for any legal proceeding can be substantial, even with respect to claims that have no merit. Due to the inherent uncertainty of the litigation process, there can be no assurance that the resolution of any particular legal proceeding will not have a material adverse effect on our financial position or results of operations, and actual outcomes, including judgments, awards, settlements or orders, could have a material adverse effect on our business, financial condition, operating results, or cash flows.
Our securities may be subject to price volatility, and our outstanding shares could be subject to dilution, in which case your investment in our securities could suffer a decline in value.
Securities of mineral resource and mining companies, including our securities, have experienced substantial volatility in the past, often based on factors unrelated to the financial performance or prospects of the companies involved. These factors include macroeconomic developments in North America and globally, and market perceptions of the attractiveness of particular industries. Our securities are also likely to be significantly affected by short-term changes in commodity prices and currency exchange fluctuation. As a result of any of these factors, the market price of our securities at any given point in time may not accurately reflect our long-term value. There can be no assurance that continued fluctuations in price will not occur, which may result in losses to investors.
Broad market and industry factors may adversely affect the price of our securities, regardless of our actual operating performance. Factors that could cause fluctuation in the price of our securities may include, among other things:
• | increases in production or capital costs or lower gold and silver prices; |
• | changes in financial estimates by us or by any securities analysts who might cover our stock; |
• | speculation about our business in the press or the investment community; |
• | conditions or trends in our industry, the market or the economy generally; |
• | changes in the prices of gold or silver; |
• | stock market price and volume fluctuations of other publicly traded companies and, in particular, those that are in the mining industry; |
• | the inability to service or restructure our debt; |
• | changes in our credit rating or future prospects; |
• | announcements by us or our competitors of significant acquisitions, strategic partnerships or divestitures; |
• | capital commitments; |
• | failure to meet the conditions necessary to remain listed for trading on the TSX, NYSE MKT, or other similar markets; |
• | additions or departures of key personnel; |
• | changes in accounting standards, policies, guidance, interpretations or principles, or the failure to comply with accounting standards applicable to us or to maintain effective internal control over financial reporting; and |
• | sales of our common stock, including sales by our directors, officers or significant stockholders. |
In the past, securities class action litigation has often been instituted against companies following periods of volatility in their stock price. This type of litigation could result in substantial costs to us and divert our management’s attention and resources.
In addition, the exercise of stock options and warrants we have already issued, or the issuance of additional stock options, warrants, or equity securities in the future, could result in dilution to our current shareholders.
The purchase of our securities involves a high degree of risk and should be undertaken only by investors whose financial resources are sufficient to enable them to assume such risks. Our securities should not be purchased by persons who cannot afford to lose their entire investment.
We do not anticipate paying any dividends on our common shares in the foreseeable future.
15
We have not declared a dividend since incorporation and we do not anticipate doing so in the foreseeable future as such action is restricted pursuant to our existing debt agreements. Any future determination as to the payment of dividends will be at the discretion of the Board and will depend on the availability of profit, operating results, our financial position, future capital requirements and general business and other factors considered relevant by the Board. No assurances in relation to the payment of dividends can be given.
Our directors and officers may have conflicts of interest.
Certain of our directors and officers also serve as directors and/or officers of other companies involved in natural resource exploration, development and mining operations. Consequently, there exists the possibility for such directors and officers to be in a position of conflict of interest. The directors are required by law to act honestly and in good faith with a view to the best interests of the Company and to disclose any interest they may have in any project or opportunity of the Company. In addition, each of the directors is required by law to declare his or her interest in and refrain from voting on any matter in which he or she may have a conflict of interest, in accordance with applicable laws. However, to the extent certain of our directors and officers have conflicts of interest and fail to act in accordance with such laws, our business, financial condition and results of operations could be materially adversely affected.
Item 1B. Unresolved Staff Comments
None
Item 2. Properties
Overview of terms
Cautionary Note to U.S. Investors: This section and other sections of this Annual Report on Form 10-K contain the terms “measured mineral resources,” “indicated mineral resources,” “inferred mineral resources,” “proven mineral reserves,” and “probable mineral reserves” as defined in accordance with NI 43-101. Please note the following regarding these terms:
“Proven mineral reserves” and “probable mineral reserves” - The definitions of proven and probable mineral reserves used in NI 43-101 differ from the definitions for “proven reserves” and “probable reserves” as found in SEC Industry Guide 7. However, based on statements from P&E Mining Consultants Inc. and Practical Mining LLC we have determined that the proven and probable reserves reflected in this Annual Report on Form 10-K are equivalent to the proven and probable reserves under SEC Industry Guide 7.
“Measured mineral resources” and “indicated mineral resources” - We advise U.S. investors that although these terms are recognized and required by Canadian regulations, these terms are not defined in SEC Industry Guide 7 and the SEC does not normally permit such terms to be used in reports and registration statements filed with the SEC. U.S. investors are cautioned not to assume that any part or all of the mineral deposits in these categories will ever be converted into reserves.
“Inferred mineral resources” - we advise U.S. investors that although this term is recognized by Canadian regulations, the SEC does not recognize it. “Inferred mineral resources” have a great amount of uncertainty as to their existence, and great uncertainty as to their economic and legal feasibility. It cannot be assumed that all or any part of an inferred mineral resource will ever be upgraded to a higher category. Under Canadian rules, estimates of inferred mineral resources may not form the basis of a feasibility study or prefeasibility study, except in rare cases. The SEC normally only permits an issuer to report mineralization that does not constitute “reserves” as in-place tonnage and grade without reference to unit measures. U.S. investors are cautioned not to assume that any part or all of an inferred mineral resource exists or is economically or legally minable.
See “Cautionary note to U.S. investors regarding estimates of measured, indicated and inferred resources and proven and probable reserves.”
General overview
We classify our mineral properties into three categories: Operating, Development, and Exploration. Operating properties are those in which we operate a producing mine with proven and probable reserves. Development properties, sometimes referred to as “projects”, are properties which are: 1) producing mineralized material but lack proven and probable reserves, 2) undergoing activities to determine if a positive mineral production decision can be made, or 3) incurring capital development expenditures, development and projects costs, and expenses to increase, define, or establish mineral reserves or estimates of mineralized material. Exploration properties are those not in the operation or development stage where we retain a significant or controlling interest or joint venture. Our exploration properties are located in Nevada, USA and Manitoba, Canada and over the last three years we have not completed any significant exploration or drilling work at such exploration properties, nor do we currently intend to do so in 2017, with the exception of Hollister.
The following table provides a summary of our properties as of and for the year ended December 31, 2016, each of which comprises its own reportable segment (see Note 20. Segment information to the Notes to Consolidated Financial Statements):
16
Ownership Interest | 2016 Production | ||||||||||||||
Name | Location | Classification | Gold Oz. | Silver Oz. | GEOs(1) | ||||||||||
Fire Creek | 100% | Nevada, USA | Operating | 101,286 | 80,593 | 102,383 | |||||||||
Midas | 100% | Nevada, USA | Operating | 29,824 | 1,345,989 | 48,623 | |||||||||
True North | 100% | Manitoba, Canada | Operating | 10,187 | 853 | 10,199 | |||||||||
Hollister | 100% | Nevada, USA | Exploration and Development(2) | — | — | — | |||||||||
Aurora | 100% | Nevada, USA | Development | — | — | — | |||||||||
141,297 | 1,427,435 | 161,289 | |||||||||||||
(1) This is a non-GAAP measure; refer to the Non-GAAP Performance Measures section of the MD&A (as defined herein) for additional detail. | |||||||||||||||
(2) Hollister is an exploration and development stage mineral property and as such, future production refers to the estimated quantities resulting from the process of extracting mineralized materials from the earth and treating that material in a mill. Hollister, which has not reported proven and probable reserves, is expected to produce between 30,000 - 35,000 GEOs in 2017; refer to the 2017 Full Year Outlook section of the MD&A for additional detail. | |||||||||||||||
The locations of our mineral properties are shown below:
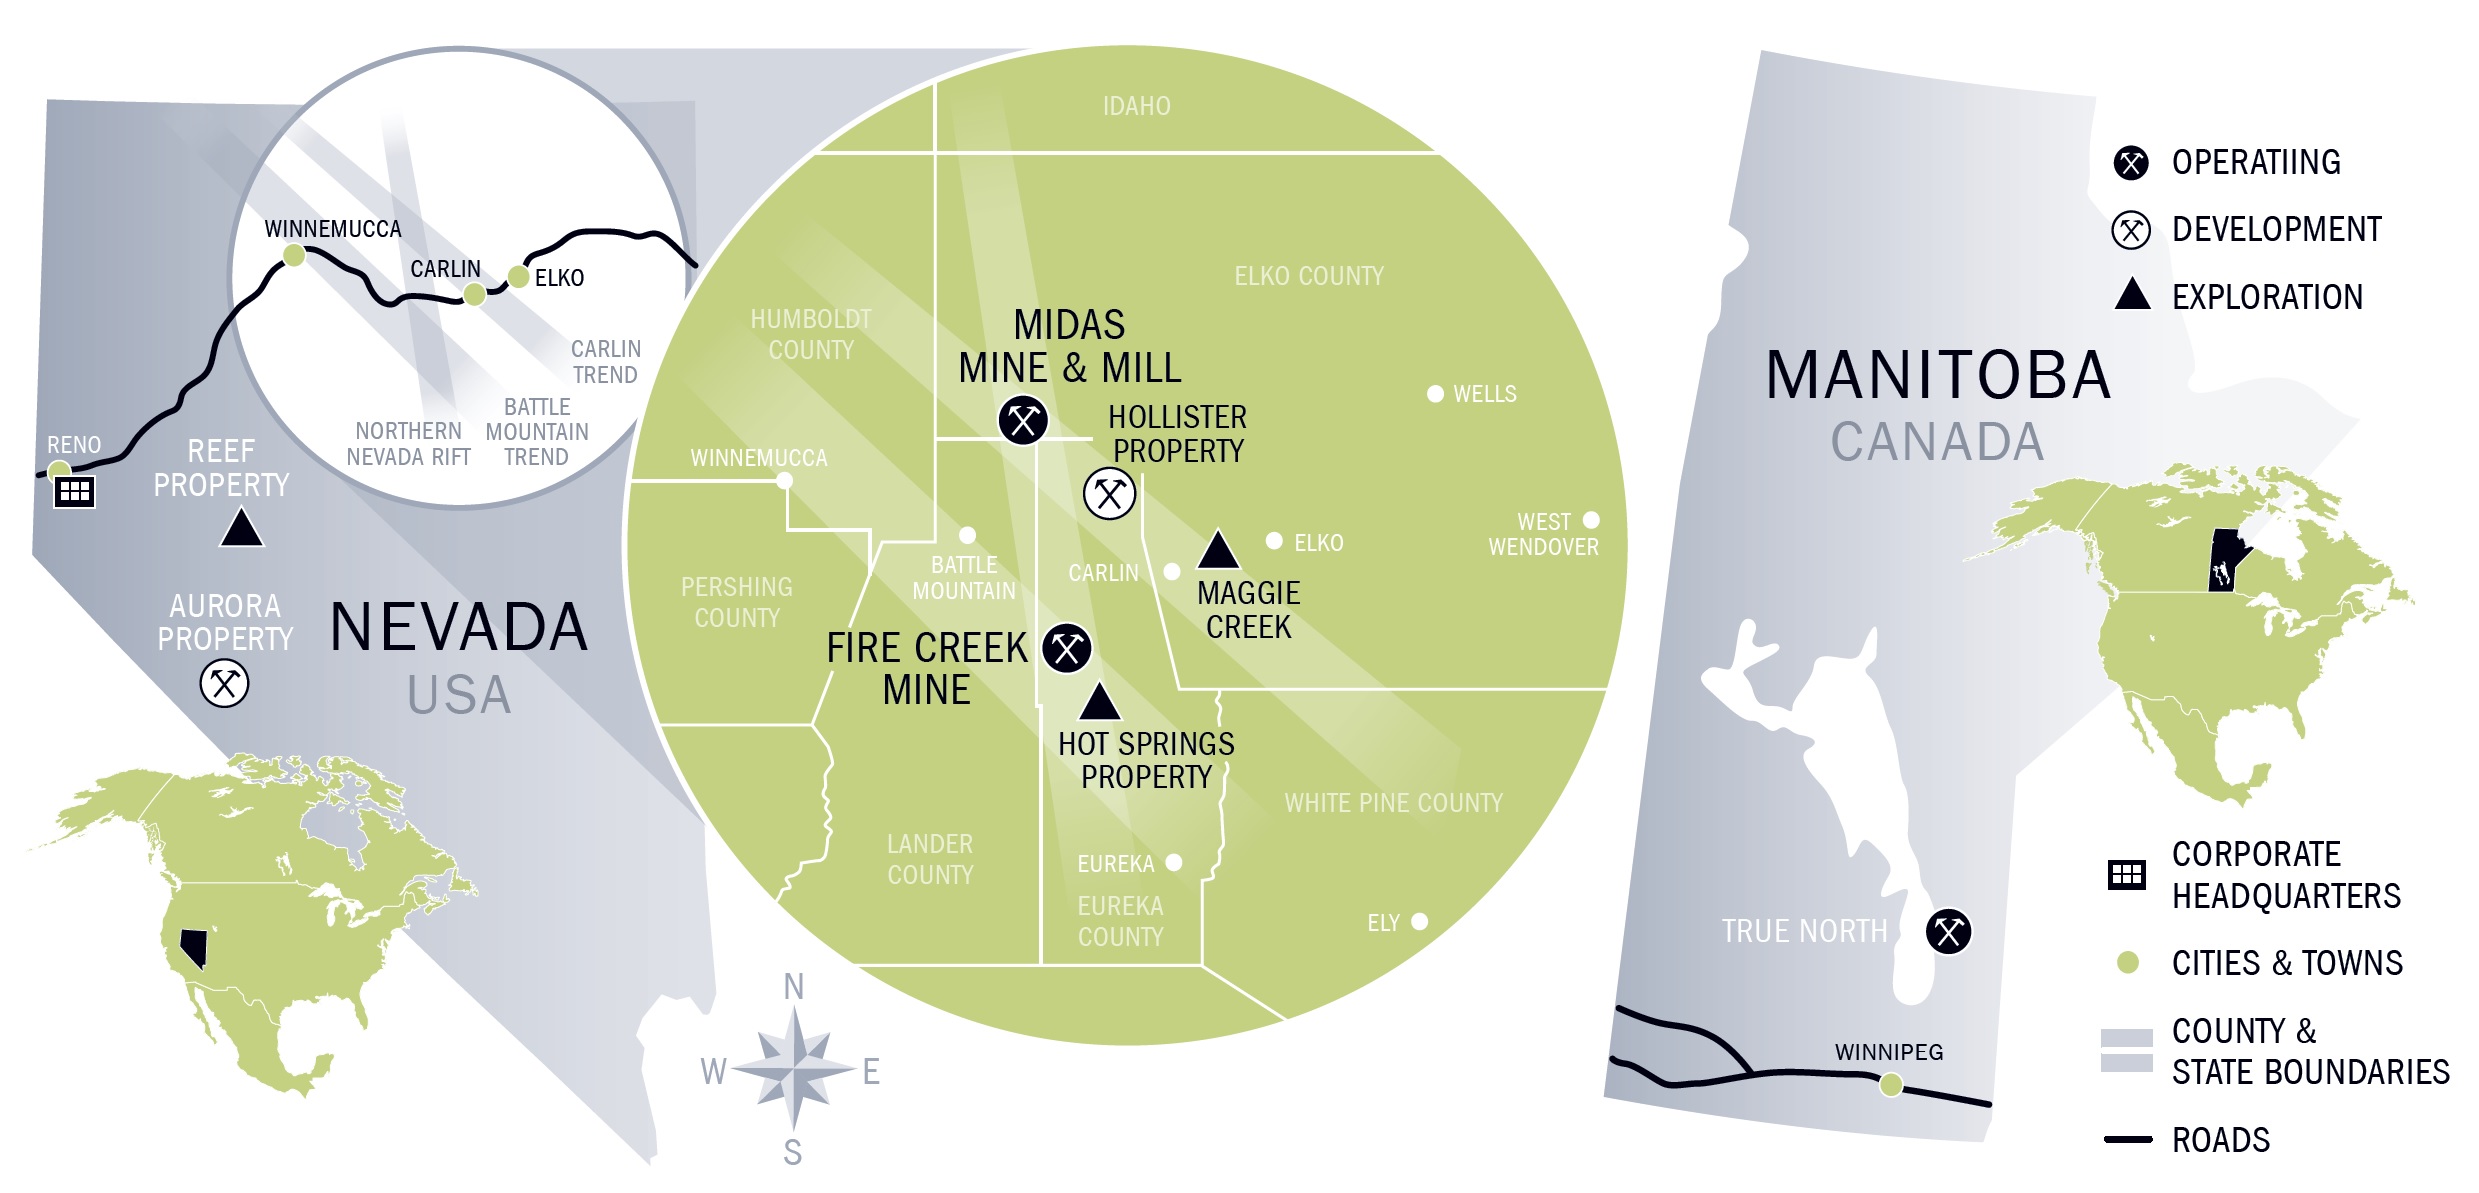
Operating properties
For a detailed discussion of our operating results and production data for Operating properties, see the Fire Creek, Midas, and True North sections included in Part II - Item 7 Management’s Discussion and Analysis of Financial Condition and Results of Operations.
17
Fire Creek
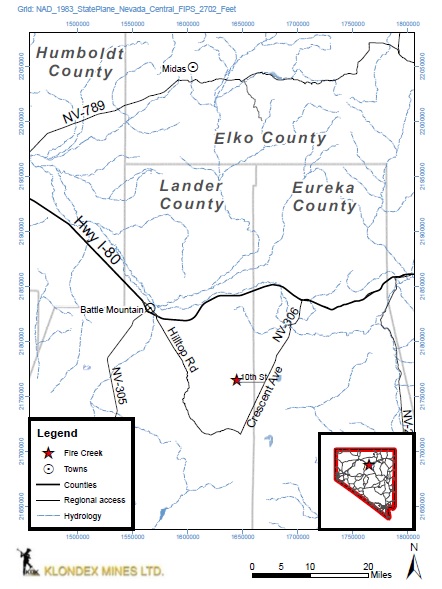
General description
Fire Creek is a 100% owned, fully-permitted, underground gold mine and was acquired by Klondex in 1975. Fire Creek is located in north-central Nevada in Lander County approximately 16 miles south of a major highway (Interstate-80) near other large gold deposits and mines which are owned and operated by major mining companies. Fire Creek’s workforce is largely drawn from Elko, Nevada and Winnemucca, Nevada, both of which are served by a transcontinental railroad and have airports. Access to Fire Creek from Interstate-80 is by State Road 306, a good-quality road. Company-maintained mine and exploration roads provide access throughout the property. Fire Creek receives electrical power provided by NV Energy, a major Nevada power company. Ore mined at Fire Creek is trucked daily to the Midas milling facility for processing.
Fire Creek is a high-grade, epithermal vein deposit, and the land package covers approximately 19,000 acres (~31.5 square miles), consisting of approximately nil private patented claims and 347 unpatented mining claims. Our unpatented claims occupy public lands, administered by the United States Bureau of Land Management ("BLM"). Unpatented claims are governed by the laws and regulations of the U.S. federal government and the state of Nevada. Property taxes are paid annually to the county in which they are held. To maintain our unpatented claims, we must file a notice of intent to maintain the claims within the county they are located and pay the annual mineral claim maintenance fees to the BLM. Some of Fire Creek's claims are subject to royalties, including: Fire Creek Lands LLC 3.0% Net Smelter Return ("NSR"), McCarthy 4.0% NSR, and Pittington 2.5% NSR, some of which have been previously prepaid or advanced and are expected to be reduced for 2017 mining activities. Additionally, the Company may
incur royalty payments that have not been prepaid or advanced in 2017. There is no expiration date on the aforementioned royalties. The Company will also be subject to a 2.5% NSR to Franco-Nevada Corporation from all production commencing in 2019. There is no expiration date on the aforementioned royalty.
Infrastructure, development, and exploration
Fire Creek possesses an underground mine, related mine support infrastructure, mining equipment, and administrative buildings, all of which are in well-maintained, operating condition. During the year ended December 31, 2016, capital expenditures at Fire Creek totaled $23.8 million and 2017 capital expenditures are currently expected to approximate between $27 - $29 million. At December 31, 2016, the gross book cost of the Fire Creek’s mineral properties, plant and equipment totaled $51.4 million.
In 2016, we drilled approximately 280 surface and underground holes in support of exploration and production efforts, representing approximately 202,490 feet, with a focus on converting mineralized material to reserves, mineralized material growth, and discovering new mineralization. The drilling results obtained were also used to identify 2017 anticipated exploration drilling targets.
Geology
Fire Creek is located in Lander County, Nevada, and in the western half of the Northern Nevada Rift ("NNR") which is a mid-Miocene aged rifting event delineated by bimodal volcanic strata and distinguished by a prominent north-northwest trending aeromagnetic anomaly that extends approximately 300 miles south-southeastward from the Oregon-Nevada border.
The deposit is an epithermal deposit vertically-zoned within high-angle northwest striking structures and consists of low-sulfidation mineralization hosted in a mid-Miocene basalt package. Mineralization occurs in two habits: shallow structurally-controlled mineralization in variably altered Tertiary basalt and primarily native gold mineralization hosted in steeply dipping quartz-calcite veins or structures. A package of middle-Miocene basalt and basaltic andesite flows has been cut by high-angle normal faults related to both NNR and Basin and Range extension that form grabens and half-grabens which are the structural controls for mineralization in the district.
18
Midas
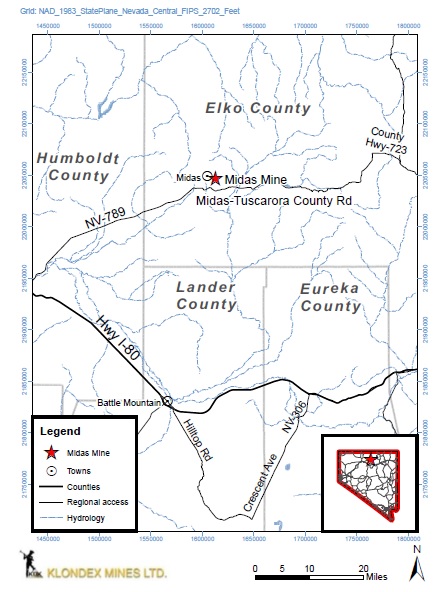
General description
We acquired the fully-permitted Midas mine and ore milling facility on February 11, 2014. It is located in Elko County in north-central Nevada, one mile from the town of Midas, Nevada. It lies about 58 miles east of Winnemucca on Nevada State Highway 789 from Interstate Highway I-80, and 80 miles from Battle Mountain driving west then north. Midas receives electrical power provided by NV Energy, a major Nevada power company.
Midas is a high-grade, epithermal vein deposit, and the land package covers approximately 30,000 acres (~46 square miles), which includes fee lands, federal unpatented mining claims, seven mining leases, BLM rights-of-way, general agreements, easements, and surface use agreements. Within the land package, there are 1,489 federal unpatented mining claims, of which 1,456 are owned and 33 are leased. Fee lands comprise approximately 2,985 acres of the land package which is a mix of surface-mineral rights and surface rights only. Our unpatented claims occupy public lands, administered by the BLM. Unpatented claims are governed by the laws and regulations of the U.S. federal government and the state of Nevada. Property taxes on fee lands are paid annually to the county in which they are held. To maintain our unpatented claims, we must file a notice of intent to maintain the claims within the county they are located and pay the annual mineral claim maintenance fees to the BLM. Certain of the Midas claims are subject to a royalty. Midas is also subject to a 2.5% NSR to Franco-Nevada Corporation from all production commencing in 2019.
Infrastructure, development, and exploration
Midas includes an underground mine, related mine support infrastructure, mining equipment, a Merrill-Crowe refining
facility, a milling circuit, and administrative buildings, all of which are in well-maintained, operating condition. During the year ended December 31, 2016, capital expenditures at Midas totaled $23.8 million and 2017 capital expenditures are currently expected to approximate between $15 - $17 million, which includes expected capital related to the mill. At December 31, 2016, the gross book cost of Midas’s mineral properties, plant and equipment totaled $115.0 million.
In 2016, we drilled approximately 148 surface and underground holes in support of exploration and production efforts, representing approximately 80,803 feet, with a focus on converting mineralized material to reserves, mineralized material growth, and discovering new mineralization. The drilling results obtained were also used to identify 2017 anticipated exploration drilling targets.
Processing facility
Ore from Fire Creek and Midas are processed at the Midas mill, which has a design capacity of 1,200 tons per day. Run-of-mine ore is crushed to 100% passing ½” in a conventional two-stage crushing circuit which utilizes a primary jaw crusher and a secondary cone crusher with the circuit closed by a double deck vibrating screen. The crushed product reports to the grinding circuit consisting of an 800 horsepower overflow ball mill and a 250 horsepower vert-mill. The circuit is closed using a bank of four (three operating, one standby) 10-inch cyclones. A portion of the cyclone underflow is sent to a gravity concentrator to remove coarse gold. The gravity concentrate is leached using an Acacia intense cyanidation unit with the gravity tail returned to the grinding circuit for further grinding. The ground product is thickened before being leached with cyanide for 72 hours in a series of eight leach tanks. The leached slurry reports to a conventional five-stage counter current decantation circuit with the overflow solution from the first thickener, together with the pregnant solution from the Acacia reactor, reporting to the Merrill-Crowe circuit where zinc dust is used to precipitate the precious metal from solution. The underflow from the fifth thickener is treated to eliminate the remaining cyanide and pumped to the tailings storage facility. Mercury is removed from the precipitate in a retort oven before being smelted and poured into doré bars. The bars are shipped off site for further refining by a third party.
Geology
Midas is located on the southeast flank of the Snowstorm Mountain range near the eastern margin of the NNR structural domain, and is hosted by a bimodal suite of volcanic rocks.
The Midas deposit consists of a series of steeply dipping, quartz-calcite-adularia mineralized veins hosted by volcanic and volcanoclastic rocks. Mineralization occurs as electrum and is intimately associated with selenide and sulfide minerals. It belongs to a suite of middle Miocene low-sulfidation epithermal mineralization systems associated with magmatism and faulting along the NNR. The mineralization model at Midas is a shallow, low-sulfidation, vertically- and laterally-zoned, epithermal gold-silver system. Rocks in the Midas district are
19
primarily ash flow, air-fall and lithic tuffs, felsic plugs, volcanoclastic sediments and gabbroic sills and dikes.
True North
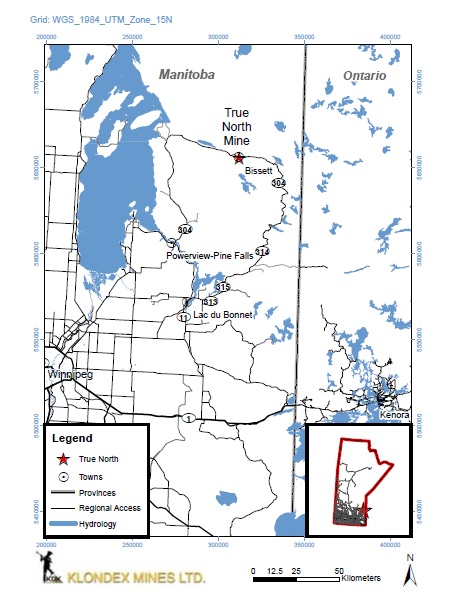
General description
We acquired True North, which is our only material property located outside of Nevada, USA, in January 2016. True North is located adjacent to the township of Bissett, Canada on the north shore of Rice Lake in southeastern Manitoba, Canada, 190 miles northeast of the city of Winnipeg, Canada. Bissett can be accessed from Winnipeg via all-weather provincial highways. A small emergency gravel airstrip is located 12 miles east of Bissett. The adjacent Rice Lake serves as a base for float-equipped aircraft during the ice free months.
The True North land package covers approximately 40,257 hectares, and consists of claims, patents and a mineral lease. We hold 18 patented mining claims covering 296 hectares and 300 mining claims covering 39,195 hectares. We own 100% of 273 of the mining claims and own a mineral lease which covers 766 hectares and, subject to annual payments, expires April 1, 2034. We own 50% of the remaining 27 mining claims through a joint venture agreement with Greenbelt Gold Mines Inc.
Infrastructure, development, and exploration
True North includes an underground mine, related mine support infrastructure, housing camps, mining equipment, a flotation and carbon in pulp ("CIP") refining facility, a milling circuit, tailings facilities, and administrative buildings, all of which are in well-maintained, operating condition. During the year ended December 31, 2016, capital expenditures and Development and projects costs at True North totaled $11.2 million and $5.5 million, respectively, and 2017 capital expenditures are currently expected to approximate between $15 - $16 million, which includes expected capital related to the mill. At
December 31, 2016, the gross book cost of True North’s mineral properties, plant and equipment totaled $43.5 million.
In 2016, we drilled approximately 167 underground holes in support of exploration and production efforts, representing approximately 25,857 meters, with a focus on converting mineralized material to reserves, mineralized material growth, and discovering new mineralization. The drilling results obtained were also used to identify 2017 anticipated exploration drilling targets.
Processing facility
Ore from True North is processed at its mill, which has a design capacity of 2,500 tons per day. Run-of-mine ore is crushed to 100% passing ½” in a conventional two-stage crushing circuit which utilizes a primary jaw crusher and a secondary cone crusher with the circuit closed by a double deck vibrating screen. The crushed product is ground using an overflow ball mill and cyclone bank with a large portion of the cyclone underflow routed to two gravity concentrators to remove the coarse gold. The gravity concentrate is further concentrated using a gravity table in the refinery. The final gravity concentrate is smelted into doré bars and shipped off site for further refining.
The cyclone overflow reports to a flotation circuit where the gold-bearing material is collected in the flotation concentrate for further processing and the flotation tails are collected in the tailings pump box and pumped to the tailings storage facility. The flotation concentrate is reground before being leached in a cyanide solution for approximately100 hours. The leached slurry then flows through a series of six CIP tanks where the precious metals are adsorbed onto the carbon. The remaining slurry is treated to remove remaining cyanide and combined with the flotation tails slurry and pumped to the tailings storage facility. Carbon is removed from the CIP circuit, acid washed, and stripped to remove the precious metal. The carbon is then returned to the CIP circuit for reuse. The precious metal is recovered from solution in the stripping process using electrowinning cells. The precipitate from the cells is smelted to produce doré bars that are shipped off site for further refining.
Geology
True North lies within the Archean Rice Lake greenstone belt located at the west end of the Uchi Volcanic-Plutonic Subprovince of the Superior Province. The Rice Lake greenstone belt is bound to the north and south by the Wanipigow Shear Zone and the Manigotagan Shear Zone, respectively.
All the major mineralization occurrences in the True North area occur as quartz veins or quartz vein systems formed during structural deformation of the host rocks. At True North, mineralization is controlled by quartz-carbonate veins and vein systems in brittle-ductile structures with related hydrothermal alteration halos within or at the margin of particular host rock units. The mineralized veins show a high degree of structural control and are best developed in competent host rock units, particularly in the gabbro sill known as the San Antonio Unit.
20
All of the mineralized zones at True North are hosted in rocks of the Bidou Lake Assemblage, which forms a north-facing stratigraphic sequence of tholeiitic basalt to intermediate volcanic flows, dacite crystal tuffs and breccias overlain by well stratified felsic epiclastic rock interpreted to be of pyroclastic and sedimentary origin. The stratigraphic sequence is intruded by tholeiitic gabbro sills, and by dikes and felsic porphyry dikes.
The best-known gabbro sill is the San Antonio Unit, host rock of the mineralization at the True North deposit. The Bidou Lake Assemblage is unconformably overlain by feldspathic sandstone of the San Antonio Assemblage. The mineralized veins show a high degree of structural control and are best developed in competent host rock units.
Proven and probable reserves
Our reserve estimates are calculated in accordance with CIM Definition Standards and NI 43-101, which differ from the definitions for "proven reserves" and "probable reserves" as found in SEC Industry Guide 7. However, based on statements from P&E Mining Consultants Inc. and Practical Mining LLC we have determined that our proven and probable reserves calculated in accordance with CIM Definition Standards and NI 43-101, and reflected in this Annual Report on Form 10-K, are equivalent to proven and probable reserves as defined under SEC Industry Guide 7. Our reserve estimates are calculated using prices of $1,200 per ounce for gold and $17.00 per ounce for silver, both of which are less than the LBMA average metal prices for the past three years of approximately $1,226 per ounce for gold and $17.30 per ounce for silver. The table below summarizes the most recent reserve estimates, all of which were released during the third quarter of 2016 with the following effective dates: Fire Creek - June 30, 2016, Midas - May 31, 2016, and True North - June 30, 2016.
Ounces per ton | Ounces (thousands) | ||||||||||||||||||||
Mineral reserves(1)(2)(3) | Ore tons (thousands) | Gold | Silver | Gold equivalent(3) | Gold | Silver | Gold equivalent(4) | ||||||||||||||
Fire Creek | |||||||||||||||||||||
Proven | 121 | 1.703 | 1.37 | 1.722 | 206 | 166 | 208 | ||||||||||||||
Probable | 119 | 0.715 | 0.50 | 0.722 | 85 | 59 | 86 | ||||||||||||||
Proven & probable | 240 | 1.213 | 0.94 | 1.226 | 291 | 225 | 294 | ||||||||||||||
Midas | |||||||||||||||||||||
Proven | 141 | 0.261 | 9.18 | 0.388 | 37 | 1,295 | 55 | ||||||||||||||
Probable | 307 | 0.335 | 3.84 | 0.388 | 103 | 1,180 | 119 | ||||||||||||||
Proven & probable | 449 | 0.311 | 5.52 | 0.388 | 140 | 2,475 | 174 | ||||||||||||||
True North | |||||||||||||||||||||
Proven | 153 | 0.241 | — | 0.241 | 37 | — | 37 | ||||||||||||||
Probable | 199 | 0.245 | — | 0.245 | 49 | — | 49 | ||||||||||||||
Proven & probable | 352 | 0.243 | — | 0.243 | 86 | — | 86 | ||||||||||||||
True North tailings | |||||||||||||||||||||
Probable | 1,170 | 0.028 | — | 0.028 | 32 | — | 32 | ||||||||||||||
Total | |||||||||||||||||||||
Proven | 415 | 280 | 1,461 | 300 | |||||||||||||||||
Probable | 1,795 | 269 | 1,239 | 286 | |||||||||||||||||
Proven & probable | 2,210 | 549 | 2,700 | 586 | |||||||||||||||||
(1) Mineral reserves at Fire Creek and Midas have been estimated using gold and silver prices of $1,200/oz. and $17.00/oz., respectively, and at True North were estimated using a gold price of CDN$1,500/oz and a CDN$:USD$ exchange rate of 0.80:1.0 (or US$1,200/oz.). | |||||||||||||||||||||
(2) For Fire Creek and Midas, metallurgical recoveries for gold and silver are 94% and 92%, respectively, and at True North 94% for gold. | |||||||||||||||||||||
(3) Cut off grades for mineral reserves at Fire Creek and Midas are 0.343 and 0.305 opt GEO, respectively, 0.13 opt gold at True North, and 0.026 opt gold for True North tailings. | |||||||||||||||||||||
(4) Gold equivalent grades and ounces were calculated using a silver to gold ratio of 72.1:1 at Fire Creek and Midas. This is a non-GAAP measure; refer to the Non-GAAP Performance Measures section of the MD&A for additional detail. | |||||||||||||||||||||
Mineral resources
Pursuant to applicable Canadian securities laws, we are required to disclose the following mineral resource estimates. We advise U.S. investors that although these terms are recognized and required by Canadian regulations, these terms are not defined in SEC Industry Guide 7 and the SEC does not normally permit such terms to be used in reports and registration statements filed with the SEC. U.S. investors are cautioned not to assume that any part or all of the mineral deposits in these categories will ever be converted into reserves. Our mineral resource estimates are calculated in accordance with National Instrument 43-101 Standards of Disclosure for Mineral Projects. The table below summarizes the most recent resource estimates, all of which were released during the third quarter of 2016 with the following effective dates: Fire Creek - June 30, 2016, Midas - May 31, 2016, and True North - June 30, 2016:
21
Ounces per ton | Ounces (thousands) | ||||||||||||||||||||
Mineral resources(1)(2)(3)(4)(5) | Tons (thousands) | Gold | Silver | Gold equivalent(4) | Gold | Silver | Gold equivalent(6) | ||||||||||||||
Fire Creek | |||||||||||||||||||||
Measured | 180 | 1.637 | 1.30 | 1.655 | 294 | 234 | 298 | ||||||||||||||
Indicated | 346 | 0.591 | 0.51 | 0.598 | 205 | 176 | 207 | ||||||||||||||
Measured & indicated | 526 | 0.948 | 0.78 | 0.959 | 499 | 411 | 505 | ||||||||||||||
Inferred | 931 | 0.538 | 0.48 | 0.544 | 501 | 446 | 507 | ||||||||||||||
Midas | |||||||||||||||||||||
Measured | 417 | 0.400 | 7.97 | 0.511 | 167 | 3,325 | 213 | ||||||||||||||
Indicated | 697 | 0.362 | 4.73 | 0.428 | 252 | 3,295 | 298 | ||||||||||||||
Measured & indicated | 1,114 | 0.376 | 5.94 | 0.459 | 419 | 6,620 | 511 | ||||||||||||||
Inferred | 671 | 0.303 | 2.93 | 0.344 | 203 | 1,966 | 231 | ||||||||||||||
True North | |||||||||||||||||||||
Measured | 455 | 0.232 | — | 0.232 | 106 | — | 106 | ||||||||||||||
Indicated | 931 | 0.202 | — | 0.202 | 188 | — | 188 | ||||||||||||||
Measured & indicated | 1,386 | 0.212 | — | 0.212 | 294 | — | 294 | ||||||||||||||
Inferred | 2,793 | 0.165 | — | 0.165 | 460 | — | 460 | ||||||||||||||
True North tailings | |||||||||||||||||||||
Indicated | 2,138 | 0.024 | — | 0.024 | 51 | — | 51 | ||||||||||||||
Inferred | 47 | 0.022 | — | 0.022 | 1 | — | 1 | ||||||||||||||
Total | |||||||||||||||||||||
Measured | 1,052 | 567 | 3,559 | 617 | |||||||||||||||||
Indicated | 4,112 | 696 | 3,471 | 744 | |||||||||||||||||
Measured & indicated | 5,164 | 1,263 | 7,030 | 1,361 | |||||||||||||||||
Inferred | 4,442 | 1,165 | 2,412 | 1,199 | |||||||||||||||||
(1) Mineral resources which are not mineral reserves do not have demonstrated economic viability. The estimate of mineral resources may be materially affected by environmental, permitting, legal, title, taxation, sociopolitical, marketing, or other relevant issues. The quantity and grade of reported inferred resources in this estimation are uncertain in nature and there has been insufficient exploration to define these inferred resources as an indicated or measured mineral resource and it is uncertain if further exploration will result in upgrading them to an indicated or measured mineral resource category. | |||||||||||||||||||||
(2) Mineral resources at Fire Creek and Midas have been estimated using gold and silver prices of $1,400/oz. and $19.83/oz., respectively, and at True North were estimated using a gold price of CDN$1,750/oz and a CDN$:USD$ exchange rate of 0.80:1.0 (or US$1,400/oz.). | |||||||||||||||||||||
(3) For Fire Creek and Midas, metallurgical recoveries for gold and silver are 94% and 92%, respectively, and at True North 94% for gold. | |||||||||||||||||||||
(4) Cut off grades for mineral resources at Fire Creek and Midas are 0.228 and 0.196 opt GEO, respectively, 0.09 opt gold at True North, and 0.015 opt gold for True North tailings. | |||||||||||||||||||||
(5) Mineral resource estimates are inclusive of proven and probable mineral reserves. | |||||||||||||||||||||
(6) Gold equivalent grades and ounces were calculated using a silver to gold ratio of 72.1:1 at Fire Creek and Midas. This is a non-GAAP measure; refer to the Non-GAAP Performance Measures section of the MD&A for additional detail. | |||||||||||||||||||||
22
Development properties
Hollister
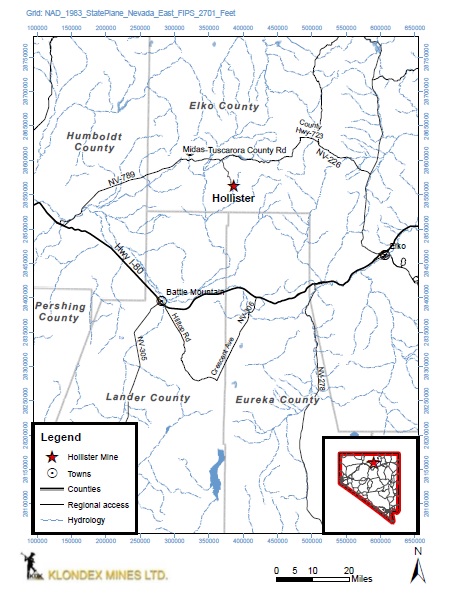
General description
The Hollister exploration and development project is a fully-permitted past producing underground and open pit operation, located in north-central Nevada in Lander County, which we acquired in October 2016. Hollister is located approximately 61.5 miles east-northeast of Winnemucca, Nevada. Hollister receives electrical power provided by NV Energy, a major Nevada power company. We classify the Hollister Project as both exploration and development, as each activity has been concurrently performed following our acquisition.
Hollister comprises 1,005 unpatented lode claims and 11 unpatented mill site claims that cover an area in excess of 18,000 acres. Patented claims occupy private lands and our unpatented claims occupy public lands, administered by the BLM. Unpatented claims are governed by the laws and regulations of the U.S. federal government and the state of Nevada. To maintain our patented claims in good standing, we must pay the annual property tax payments to the county in which the claims are held. To maintain our unpatented claims in good standing, we must file a notice of intent to maintain the claims within the county and pay the annual mineral claim filing fees to the BLM. Certain claims and areas of Hollister are subject to royalties, including: 5% and 3% NSR to Franco Nevada Corporation, 5% to Newmont, 1% to Hillcrest Mining Corporation, 1% to Finley River Company L.L.C., 2% to Hi-Tech, 2% to Finley, and 1% to Waterton after 500,000 ounces of gold production. The Company is expected to incur royalty payments of approximately 5% of revenue from Hollister in 2017. There is no expiration date on the aforementioned royalties.
Infrastructure, development, and exploration
Hollister includes an underground mine, former open pit mines, related mine support infrastructure, mining equipment, and administrative buildings, all of which are in well-maintained, operating condition. It is currently anticipated that ore from Hollister, which does not have a mill, will be processed at the nearby Midas mill (approximately 17 miles away) or the Aurora mill (approximately 277 miles away), or at a combination of both. During the year ended December 31, 2016, capital expenditures and Development and projects costs at Hollister totaled $0.8 million and $3.4 million, respectively, and 2017 capital expenditures are currently expected to approximate between $7 - $9 million. At December 31, 2016, the gross book cost of Hollister's mineral properties, plant and equipment totaled $111.2 million.
Geology
Hollister is located at the northwestern end of the Carlin Trend, that is approximately five miles wide by 40 miles long. It forms a portion of the eastern edge of the larger NNR, a major, north-northwest trending structural feature that extends for at least 298 miles, from south-central Nevada to the Oregon-Nevada border. The NNR is distinguishable on regional-scale magnetic maps as a prominent north-northwest-trending lineament of magnetic highs. This distinctive positive magnetic anomaly is caused by Miocene-age syn-rift which is associated with the deposition of bimodal volcanic rocks ranging from basaltic to rhyolitic in composition.
The geologic setting at Hollister includes Ordovician Vinini Formation at the base of the sequence consisting of basinal sedimentary quartzite, siltite, and argillite rocks. The unconformity surface is a fanglomerate conglomerate/breccia with angular and sub-angular Vinini clasts within a silt, sand and tuffaceous matrix. Ordovician rocks are intruded and overlain by late Eocene intrusive, welded tuff, and mafic rocks.
Disseminated mineralization occurs in altered Miocene volcanic units in the Hollister open pits. Other zones of volcanic-hosted, disseminated mineralization are also known to exist beneath near-surface mineralization at Clementine, Velvet, and Butte, north of the Hollister pits.
Veins at Hollister contain the bulk of the high-grade mineralization known within the property. The principal veins, Clementine and Gwenivere, comprise semi-continuous vein systems with internal mineralization shoots, and local en echelon steps or splays. The veins in mineralized areas typically range from 0.5 to 2.0 ft in width, but locally can be more than 5.0 ft in width. The veins are mostly hosted below the Tertiary-Ordovician contact.
23
Aurora
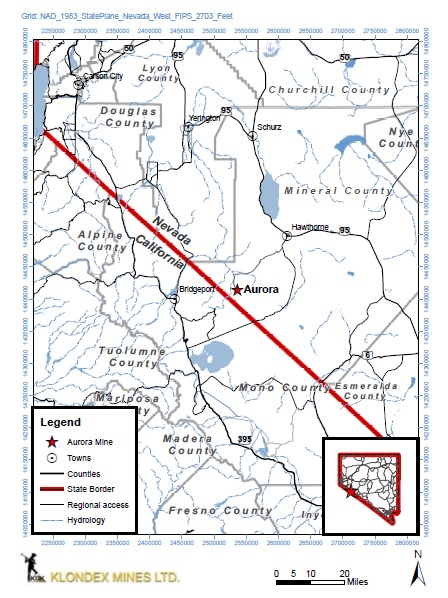
General description
The Aurora project is a fully-permitted past producing underground and open pit operation, located in west-central Nevada in Mineral County, which we acquired in October 2016.
Infrastructure, development, and exploration
Aurora includes an underground mine, former open pit mines, related mine support infrastructure, mining equipment, a milling circuit, and administrative buildings, all of which are in a well-maintained condition. During the year ended December 31, 2016, capital expenditures and Development and projects costs at Aurora totaled $0.6 million and nil, respectively. At December 31, 2016, the gross book cost of the Aurora's mineral properties, plant and equipment totaled $13.6 million.
Aurora consists of 93 patented mining claims, 160 acres of fee lands, and 287 unpatented lode-mining claims, totaling over 5,004 contiguous acres that encompass the entire district. Patented claims occupy private lands and our unpatented claims occupy public lands, administered by the BLM. Unpatented claims are governed by the laws and regulations of the U.S. federal government and the state of Nevada. To maintain our
patented claims in good standing, we must pay the annual property tax payments to the county in which the claims are held. To maintain our unpatented claims in good standing, we must file a notice of intent to maintain the claims within the county and pay the annual mineral claim filing fees to the BLM. A portion of the patented and unpatented claims owned or leased by Klondex and the leased fee lands are subject to underlying royalties, such as a 3% royalty to Waterton.
Processing facility
We do not currently operate the Aurora mill, but are considering opportunities to process Hollister concentrates or toll-milling. The Aurora mill uses a jaw crusher to crush the run-of-mine ore. The crushed product is ground using a SAG mill and two over flow ball mills with the circuit closed by a bank of cyclones. The cyclone overflow reports to a series of 8 carbon in leach ("CIL") tanks where cyanide is added and precious metal is leached from the ore and adsorbed onto the carbon. The remaining slurry is treated to remove remaining cyanide and pumped to the tailings storage facility. Carbon is removed from the CIL circuit, acid washed, and stripped to remove the precious metal. The carbon is then returned to the CIL circuit for reuse. The precious metal is recovered from solution in the stripping process using electrowinning cells. The precipitate from the cells is smelted to produce doré bars that are shipped off site for further refining. Maintenance activities were in process in the fourth quarter of 2016.
Geology
Aurora is located within the Walker Lane structural belt of western Nevada. The Walker Lane is characterized by northwest-trending en echelon right-lateral strike slip faults that have tilted and rotated structural blocks since mid-Miocene through the Quaternary. Mineralized veins typically occur along northeasterly orientations. Northeast structures mostly host post-date vein mineralization in the district.
Mineralization at Aurora occurs as low-sulfidation epithermal veins, breccias, and stockwork zones in Miocene intermediate to felsic composition volcanic rocks. The Prospectus and Humboldt areas are underlain by a complex series of andesitic flows, conglomerates, and lahars. The Martinez area is underlain by a more “porphyritic” volcanic/subvolcanic rock of andesitic to dacitic composition. Mineralized veins are typically composed of several generations of silica accompanied by variable amounts of adularia, sericite, pyrite, base metal sulfides, sulfosalts and electrum.
Exploration properties
We currently have exploration properties in Manitoba, Canada and in Nevada, USA, which include the following: Maggie Creek, Reef, and Hot Springs. None of these properties currently have proven or probable reserves as defined by SEC Industry Guide 7 of the Exchange Act or NI 43-101 or mineral resource estimates calculated in accordance with NI 43-101. At the end of 2016, these properties covered approximately 2,831 acres. Over the past three years, we have not performed any significant exploration campaigns at these properties and do not currently have any plans to perform significant exploration activities at these properties in 2017. We continually evaluate these properties to determine how to best advance them by improving or increasing the identified mineralized materials and/or selling them or entering into joint venture or royalty agreements.
24
Item 3. Legal Proceedings
From time to time we are involved in legal actions related to our business; however, management does not believe, based on currently available information, that contingencies related to any pending or threatened legal matter will have a material adverse effect on the Company’s financial position, although a contingency could be material to the Company’s results of operations or cash flows for a particular period depending on the results of operations and cash flows for such period. Regardless of the outcome, litigation can have an adverse impact on the Company because of defense costs, diversion of management resources, and other factors. Refer to Note 24. Commitments and contingencies to the Notes to Consolidated Financial Statements for additional detail.
Item 4. Mine Safety Disclosure
The information concerning mine safety or other regulatory matters required by Section 1503(a) of the Dodd-Frank Wall Street Reform and Consumer Protection Act and Item 104 of Regulation S-K is included in Exhibit 95.1 to this Annual Report on Form 10-K.
25
PART II
Item 5. Market for Registrant's Common Equity, Related Stockholder Matters and Issuer Purchases of Equity Securities
Our common shares are listed on the NYSE MKT and the TSX under the symbols "KLDX" and "KDX", respectively. The following table represents the reported quarterly high and low sale prices for the two most recent years:
NYSE MKT ($) | TSX (CDN$) | |||||||||||||||||
High | Low | High | Low | |||||||||||||||
2016 | 4th quarter | $ | 5.94 | $ | 3.91 | $ | 7.95 | $ | 5.29 | |||||||||
3rd quarter | 6.03 | 3.75 | 7.84 | 4.85 | ||||||||||||||
2nd quarter | 3.87 | 2.60 | 4.93 | 3.40 | ||||||||||||||
1st quarter | 3.49 | 1.76 | 4.04 | 2.57 | ||||||||||||||
2015 | 4th quarter | 2.77 | 1.90 | 3.54 | 2.56 | |||||||||||||
3rd quarter | n/a(1) | n/a(1) | 3.87 | 2.84 | ||||||||||||||
2nd quarter | n/a(1) | n/a(1) | 3.50 | 2.55 | ||||||||||||||
1st quarter | n/a(1) | n/a(1) | 2.80 | 1.89 | ||||||||||||||
(1) Following our approval to list on the NYSE MKT we commenced trading on October 7, 2015. | ||||||||||||||||||
As of March 21, 2017, there were 177,312,560 common shares issued and outstanding and we had approximately 11,000 beneficial owners of our common shares.
Dividends
We have never paid dividends or repurchased shares of our common stock and currently have no intention to do so as our Revolver agreement contains provisions that restrict our ability to do such.
Stock performance graph
The following graph and table compares the performance of our common shares to the S&P 500 and to the GDXJ Junior Gold Miners ETF, assuming reinvestment of dividends and a $100 investment at the per share closing price on the TSX in Klondex and each of the indices on January 1, 2012. Klondex share prices use year-end CDN$:USD$ exchange rates during periods prior to our shares trading on the NYSE MKT. The following performance graph and table is furnished and shall not be deemed "filed" for purposes of Section 18 of the Exchange Act, nor shall it be deemed incorporated by reference in any filing under the Securities Act or Exchange Act.
Comparison of 5 Year Cumulative Total Return
Among Klondex Mines Ltd., the S&P500 Index, and the GDXJ Junior Miners ETF Index
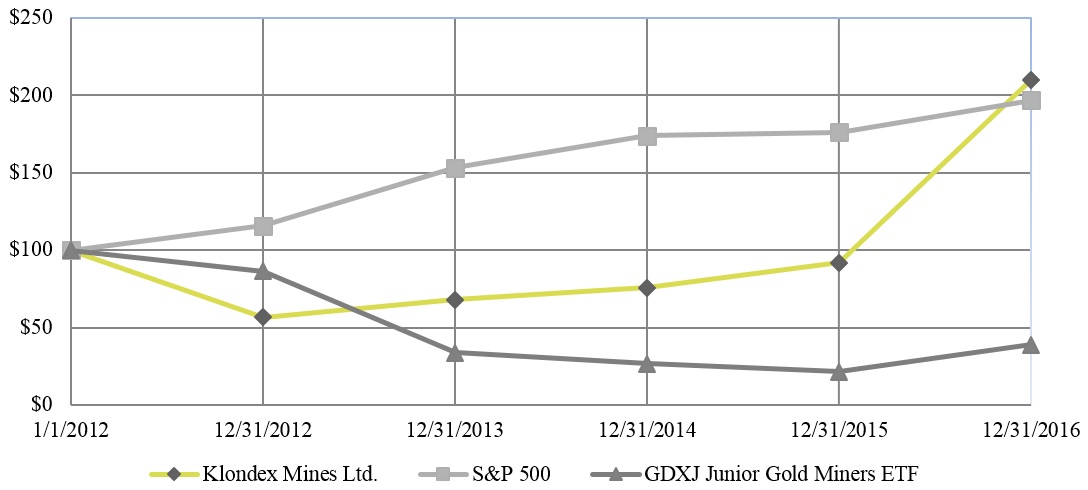
26
January 1, | December 31, | ||||||||||||||||||||||
2012 | 2012 | 2013 | 2014 | 2015 | 2016 | ||||||||||||||||||
Klondex Mines Ltd. | $ | 100.00 | $ | 56.76 | $ | 68.02 | $ | 75.68 | $ | 91.89 | $ | 209.91 | |||||||||||
S&P 500 | 100.00 | 115.82 | 153.05 | 173.75 | 176.13 | 196.80 | |||||||||||||||||
GDXJ Junior Gold Miners ETF | 100.00 | 86.20 | 33.81 | 26.43 | 21.51 | 38.71 | |||||||||||||||||
Recent Sales of Unregistered Securities
On October 3, 2016, as part of the consideration for the Hollister Acquisition (as defined herein), we issued 2,600,000 common shares and 5,000,000 common share purchase warrants to Waterton Nevada Splitter, LLC. The warrants (i) become exercisable on April 3, 2017, (ii) expire 15 ½ years from April 3, 2017, (iii) have an exercise price of CDN$6.00, and (iii) include a forced conversion provision that requires the holder to convert the warrants if our common shares trade at a 100% premium to the CDN$6.00 exercise price of the warrants for 60 consecutive trading days on the market on which our common shares primarily trade. The common shares and warrants were issued pursuant to the exemption provided by Section 4(a)(2) of the Securities Act, on the basis of the fact that it was a private placement to a sophisticated investor.
On August 18, 2016, we issued 25,900,000 subscription receipts, in a brokered private placement conducted through a syndicate of underwriters led by GMP Securities L.P. and BMO Nesbitt Burns Inc., to purchasers in Canada and to accredited investors in the United States. Each subscription receipt converted, without the payment of additional consideration or further action by the holder thereof, into one special warrant which subsequently converted into one common share of the Company. The aggregate offering price for the subscription receipts was CDN$129.5 million and the Company paid the underwriters a commission of CDN$6.4 million, being 5% of the gross proceeds of the offering. The issuance of the subscription receipts was made pursuant to the exemption from the registration requirements of the Securities Act provided by Rule 506(b) of Regulation D under the Securities Act and Rule 903 of Regulation S under the Securities Act, and the conversion of the subscription receipts into special warrants and the conversion of special warrants into common shares were made pursuant to the exemption provided by Section 3(a)(9) of the Securities Act. The subscription receipts offered and sold in the United States were offered and sold to accredited investors, as defined in the Securities Act. The offers and sales in Canada satisfied the requirements of Rule 903 of Regulation S of the Securities Act. No commission or other remuneration was given in connection with the conversions, thereby making available the exemption provided by Section 3(a)(9) of the Securities Act.
In 2016, we issued (i) 109,166 common shares upon the exercise (at an exercise price of CDN$1.55) of compensation options granted to the agents in connection with the February 2014 Private Placement (see Note 13. Share Capital), (ii) 1,981,400 common shares upon the exercise (at an exercise price of CDN$1.95) of warrants granted to the lenders in connection with the private offering of the Senior Notes (see Note 8. Debt), and (iii) 133,000 common shares upon the exercise (at an exercise price of CDN$2.25) of compensation options granted to the underwriters in connection with the July 2014 Public Offering (see Note 13. Share Capital). The issuances in (i), (ii) and (iii) were made pursuant to the exemption from the registration requirements of the Securities Act provided by Rule 903 of Regulation S as it involved sales outside the United States and complied with the other requirements of Rule 903 of Regulation S.
In 2016, we issued (i) 5,037,369 common shares pursuant to the exercise of options granted under the Legacy SIP (as defined herein), at share exercise prices ranging from CDN$1.20 to CDN$3.47, (ii) 35,000 common shares as share awards pursuant to the Legacy SIP with a grant date value of CDN$2.90; and (iii) 1,000 common shares pursuant to the vesting of restricted share units granted under the New Share Plan (as defined herein) with a vesting date value of CDN$6.37. The Company also granted (i) 430,000 options to purchase common shares under the Legacy SIP with share exercise prices ranging from CDN$2.72 to CDN$3.47, (ii) 300,000 options to purchase common shares under the New Share Plan with a share exercise price of CDN$6.60, and (iii) 796,047 restricted share units that will vest upon certain conditions pursuant to the Company’s New Share Plan with an estimated grant date value of CDN$6.60 for 793,047 restricted share units and CDN$7.54 for 3,000 restricted share units. The issuances and grants described in this paragraph were made or granted, as applicable, pursuant to the exemption from the registration requirements of the Securities provided by Section 4(a)(2) of the Securities Act and Rule 903 of Regulation S, as it involved transactions by an issuer not involving a public offering with respect to sales to persons in the United States and sales to persons outside the United States complied with the requirements of Rule 903 of Regulation S.
Item 6. Selected Financial Data
The following table summarizes selected consolidated financial data and is derived from our audited Consolidated Financial Statements and should be read in conjunction with Part II - Item 7. Management's Discussion and Analysis of Financial Condition and Results of Operations and Part II - Item 8. Financial Statements and Supplementary Data (in thousands except per share amounts):
27
Years ended December 31, | ||||||||||||||||||||
Results of operations | 2016 | 2015 | 2014 | 2013 | 2012 | |||||||||||||||
Revenue | $ | 198,175 | $ | 154,081 | $ | 112,622 | $ | — | $ | — | ||||||||||
Total cost of sales | 137,500 | 106,971 | 61,236 | — | — | |||||||||||||||
Net (loss) income | (1,700 | ) | 44,253 | 26,884 | (25,089 | ) | (28,443 | ) | ||||||||||||
Basic net (loss) income per share | (0.01 | ) | 0.33 | 0.23 | (0.38 | ) | (0.58 | ) | ||||||||||||
December 31, | ||||||||||||||||||||
Financial position | 2016 | 2015 | 2014 | 2013 | 2012 | |||||||||||||||
Cash and cash equivalents | $ | 47,636 | $ | 59,097 | $ | 45,488 | $ | 12,127 | $ | 18,142 | ||||||||||
Inventories | 21,310 | 16,070 | 18,601 | — | — | |||||||||||||||
Mineral properties, plant and equipment, net | 276,223 | 86,582 | 71,307 | 2,459 | 1,491 | |||||||||||||||
Total assets | 379,978 | 202,823 | 165,251 | 15,350 | 21,445 | |||||||||||||||
Debt, current | 8,502 | 6,930 | 7,290 | 6,447 | 8,977 | |||||||||||||||
Debt, non-current | 21,689 | 18,887 | 41,131 | — | 3,276 | |||||||||||||||
Asset retirement obligation | 25,436 | 12,387 | 12,032 | 1,010 | 529 | |||||||||||||||
Total liabilities | 101,924 | 59,717 | 79,366 | 15,510 | 10,913 | |||||||||||||||
Total shareholders' equity | 278,054 | 143,106 | 85,885 | (160 | ) | 10,532 | ||||||||||||||
Item 7. Management's Discussion and Analysis of Financial Condition and Results of Operations
This Management's Discussion & Analysis of Financial Condition and Results of Operations ("MD&A") contains forward-looking statements which are subject to numerous risks and uncertainties, as more fully described in the Cautionary statement regarding forward-looking statements section at the beginning of this Annual Report on Form 10-K. This MD&A provides a discussion and analysis of the financial condition and results of operations of the Company and includes the Company's subsidiaries. This MD&A should be read in conjunction with our Consolidated Financial Statements and notes thereto included in this Annual Report on Form 10-K. The following discussion has been prepared based on information available to us as of March 23, 2017. All dollar amounts included in this MD&A are expressed in thousands of United States dollars (USD$) unless otherwise noted. References to CDN$ refer to Canadian dollars. References to "Notes" refer to the notes to Consolidated Financial Statements.
As discussed in the Transition from IFRS to US GAAP section of Note 2. Summary of significant accounting policies to the Consolidated Financial Statements, we previously prepared our financial statements in accordance with International Financial Reporting Standards ("IFRS") and now prepare such in accordance with US GAAP. Due to differences in accounting treatments between IFRS and US GAAP, amounts historically reported for our financial position, operating results, and cash flows under IFRS changed from those which are currently reported under US GAAP and presented in this MD&A.
In this MD&A we use the non-GAAP performance measures "Production cash costs per gold equivalent ounce sold" and "All-in costs per gold ounce sold", which should not be considered in isolation or as a substitute for measures of performance prepared in accordance with GAAP. See the Non-GAAP performance measures section of this MD&A for additional detail.
Overview
Our discussion and analysis consists of the following subsections:
• | Introduction and strategy which provides a brief discussion of our current operations and business strategies and goals; |
• | Executive summary which lists significant matters related to 2016; |
• | Corporate developments provides details on 2016 acquisitions and equity offerings. |
• | 2017 full year outlook which summarizes our estimates for 2017 production volumes, costs, and capital, development, and exploration spending. |
• | Critical accounting estimates which provides a discussion of accounting estimates that we believe are critical in understanding and evaluating our reported financial results because they affect reported amounts and require significant management judgment and assumptions about highly uncertain matters; |
• | Results of operations which provides a discussion and analysis of our operating results for the last three years. |
• | Mining operations review which provides a discussion of our mine operations and production statistics for the last three years. |
28
• | Hollister and Aurora updates which provides a discussion of our two most significant exploration and development projects. |
• | Financial position, liquidity, and capital resources which provides a discussion of our cash flows (last three years), liquidity, available sources of liquidity, capital requirements, and debt covenants; and |
• | Non-GAAP performance measures which includes a description of our three non-GAAP financial measures: production cash costs per gold equivalent ounce ("GEO") sold and all-in costs per gold ounce sold, the reasons for our use of such measures, and a three year reconciliation to our nearest GAAP measures. |
Introduction and strategy
We are a well–capitalized, junior–tier gold and silver mining company focused on exploration, development, and production in a safe, environmentally responsible, and cost–effective manner. As of December 31, 2016, we had 100% interests in three producing mines: (1) the Fire Creek mine ("Fire Creek") and (2) the Midas mine and ore milling facility ("Midas"), both of which are located in the state of Nevada, USA, and (3) the True North gold mine and mill in Manitoba, Canada ("True North", formerly known as the Rice Lake mine). The Company also has 100% interests in two recently acquired projects: (1) the Hollister mine ("Hollister") and (2) the Aurora mine and ore milling facility ("Aurora", formerly known as Esmeralda), also located in Nevada, USA.
Prior to February 2014, our only mine was Fire Creek and since that time we have experienced growth in our annual gold and silver production, total assets, and workforce largely due to the acquisitions of Midas (February 2014), True North (January 2016), and Hollister and Aurora (October 2016).
Gold and silver sales represent 100% of our revenues and the market prices of gold and silver significantly impact our financial position, operating results, and cash flows. Our primary strategy is to increase shareholder value by responsibly achieving our production, cost, and capital targets while attempting to extend our mine lives through development and exploration programs. We also consider acquisitions or other arrangements in the normal course which strategically fit our future growth objectives. We have an experienced management team, a strong financial position, a low-cost production profile, and high-quality assets located in mining-friendly jurisdictions.
Executive summary
Our 2016 highlights included the following, which are discussed in further detail throughout this MD&A or elsewhere in this Annual Report on Form 10-K:
• | Health, safety, and environmental - We remained committed to our most important core values by operating in an environmentally-responsible manner while protecting the health and safety of our employees and contractors. No lost-time injuries at our properties and as of December 31, 2016, had operated 1,539 days (~4.0 years) at Fire Creek, 815 days (~2.0 years) at Midas, 344 days (~0.9 years) at True North, and 89 days (~0.3 years) at Hollister and Aurora, without a lost-time injury. |
• | Hollister acquisition and private placement - On October 3, 2016, we completed the acquisition of the Hollister and Aurora projects, located in Nevada, USA, using the proceeds received from a CDN$129.5 million "bought deal" private placement. We believe the Hollister and Aurora projects create synergies with our Nevada Operations and provide significant future operational and exploration potential. During 2017, we expect to produce 30,000 - 35,000 GEOs from bulk sampling mineralized material during Hollister's exploration and development activities. |
• | True North - Following its January 22, 2016 acquisition, we made a positive production decision at True North, which represents our third producing property. We poured our first gold during the year and produced a total of 10,199 GEOs. During 2017, we expect to produce 41,000 - 45,000 GEOs at True North. |
• | Ounces sold and financial results - We sold a record 159,118 gold equivalent ounces ("GEOs"), consisting of 138,516 gold ounces and 1,470,992 silver ounces. Revenue was an all-time high totaling $198.2 million from average selling prices per gold and silver ounce of $1,245 and $17.44, respectively. Net loss was $1.7 million (or $0.01 per share - basic). |
• | Cash flows and liquidity - Maintained our strong financial position and liquidity. Our ending cash balance was $47.6 million after $45.3 million of operating cash flows, $159.7 million used in investing activities, and $104.6 million provided by financing activities. Ending working capital was $33.2 million (ratio of 1.80:1) and total liquidity was $56.2 million when including the $23.0 million of Revolver availability. |
• | Nevada performance - We produced a record 151,007 GEOs, in-line with management expectations which saw GEO production and grades progressively increasing from the first half of the year to the second half of the year. Average key operating metrics for our Nevada Operations were: 854 ore tons milled per day, 0.45 oz/ton gold mill head grade, 5.28 oz/ton silver mill head grade, 0.52 oz/ton GEO mill head grade. Production cash costs per gold equivalent ounce sold at Nevada was $637 and within our 2016 expected range of $600 to $650. |
• | Spending - Capital, exploration, and development spending totaled $32.5 million at Fire Creek, $27.8 million at Midas, $16.8 million at True North, $4.2 million at Hollister, $0.6 million Aurora, and $1.4 million at corporate for total capital spending of $83.4 million. |
29
Corporate developments
Subscription receipt offering
In conjunction with the Hollister Acquisition (discussed below), during the third quarter of 2016, after deducting general offering costs and underwriting fees (CDN$6.4 million), we raised net proceeds of $95.7 million as part of a "bought deal" private placement equity financing (the "Offering"). The release of the proceeds to us was dependent on the conditions precedent to closing the Hollister Acquisition, which were satisfied on September 29, 2016 (other than the payment of the purchase price). The net proceeds of $95.7 million provided additional liquidity to us as the net amount received exceeded the $80.0 million cash portion of the total consideration for the Hollister Acquisition.
For a more detailed discussion of the Offering, see Note 13. Share capital to the Notes to Consolidated Financial Statements.
Hollister and Aurora acquisitions
On October 3, 2016, we completed the acquisition of the Hollister mine and the Aurora mine and ore milling complex, both of which are located in Nevada (the "Hollister Acquisition"). The Hollister Acquisition was completed in consideration for: (i) the payment of $80.0 million in cash; (ii) the issuance of 5,000,000 common share purchase warrants and (iii) the issuance of 2,600,000 common shares.
Hollister is an important exploration and development project in our future plans for growth in Nevada, refer to the Hollister and Aurora updates section of this MD&A for additional information on these projects.
For a more detailed discussion of the aforementioned transaction, see Note 4. Business combinations and Note 13. Share capital to the Notes to Consolidated Financial Statements.
True North acquisition
On January 22, 2016, we acquired the True North (formerly known as Rice Lake) mine and mill complex located near Bissett, Manitoba, Canada for $32.0 million (the "True North Acquisition")
True North was placed into production during fiscal 2016, refer to the Mining operations review section of this MD&A for a discussion of its 2016 results.
For a more detailed discussion of the True North Acquisition, see Note 4. Business combinations to the Notes to Consolidated Financial Statements.
2017 full year outlook
The following statements are based on our current expectations for fiscal year 2017 results. The statements are forward-looking and actual results may differ materially.
We expect to produce between 210,000 and 225,000 gold equivalent ounces (GEOs) during 2017 at an expected production cash cost per GEO sold of $680 to $710 per GEO sold. This represents an increase in GEOs sold of approximately 37% from the prior year as we benefit from bulk sampling production at Hollister in Nevada as well as higher production from True North mine in Canada as ramp-up continues. Fire Creek and Midas’ 2017 production is expected to be in line with the prior year.
We also expect our 2017 capital expenditures to be between $57 - $62 million with an additional $3 - $5 million to be spent on exploration. The majority of capital is expected to be spent at Fire Creek as we continue underground expansion in the form of primary access development and advancement of a second portal. We also expect to spend $7 - $9 million at our newly acquired Hollister mine in Nevada as it commences a bulk sampling mining program and underground definition drilling in the Gloria zone.
Below are tables summarizing key 2017 operating guidance.
30
Gold Equivalent Ounces Produced(1) | Production Cash Costs per Gold Equivalent Ounce Sold(1) | Capital Expenditures (thousands) | ||||||||||||||||||||||
2017 full year outlook | Low | High | Low | High | Low | High | ||||||||||||||||||
Midas | 42,000 | 45,000 | $ | 925 | $ | 950 | $ | 11,000 | $ | 12,000 | ||||||||||||||
Midas Mill | — | — | — | — | 4,000 | 5,000 | ||||||||||||||||||
Fire Creek | 97,000 | 100,000 | 475 | 500 | 27,000 | 29,000 | ||||||||||||||||||
Hollister(2) | 30,000 | 35,000 | 935 | 960 | — | — | ||||||||||||||||||
Nevada Total | 169,000 | 180,000 | 670 | 700 | 42,000 | 46,000 | ||||||||||||||||||
True North(3) | 41,000 | 45,000 | 725 | 750 | 15,000 | 16,000 | ||||||||||||||||||
210,000 | 225,000 | $ | 680 | $ | 710 | $ | 57,000 | $ | 62,000 | |||||||||||||||
Low | High | |||||||||||||||||||||||
Corporate general and administrative (thousands) | $ | 15,000 | $ | 17,000 | ||||||||||||||||||||
Hollister development and project costs (thousands) | $ | 7,000 | $ | 9,000 | ||||||||||||||||||||
Regional exploration (thousands) | $ | 3,000 | $ | 5,000 | ||||||||||||||||||||
All-in costs per gold ounce sold(1) | $ | 1,070 | $ | 1,130 | ||||||||||||||||||||
(1) This is a non-GAAP measure; refer to the Non-GAAP Performance Measures section of the MD&A for additional detail. | ||||||||||||||||||||||||
(2) Hollister is an exploration stage mineral property and as such, production refers to the estimated quantities resulting from the process of extracting mineralized materials from the earth and treating that material in a mill. | ||||||||||||||||||||||||
(3) Based on an estimated CDN:US dollar exchange rate of 0.75:1. | ||||||||||||||||||||||||
We have not reconciled forward-looking 2017 full year non-GAAP performance measures contained in this Annual Report on Form 10-K to their most directly comparable GAAP measures, as permitted by Item 10(e)(1)(i)(B) of Regulation S-K. Such reconciliations would require unreasonable efforts at this time to estimate and quantify with a reasonable degree of certainty various necessary GAAP components, including for example those related to future production costs, realized sales prices and the timing of such sales, timing and amounts of capital expenditures, metal recoveries, and corporate general and administrative amounts and timing, or others that may arise during the year. These components and other factors could materially impact the amount of the future directly comparable GAAP measures, which may differ significantly from their non-GAAP counterparts.
Critical accounting estimates
This MD&A is based on our Consolidated Financial Statements, which have been prepared in accordance with generally accepted accounting principles (“GAAP”) in the United States. The preparation of these statements requires us to make assumptions, estimates, and judgments that affect the amounts of assets, liabilities, revenues, and expenses. We base our assumptions, estimates, and judgments on historical experience, current trends and other factors that are considered to be relevant at the time our Consolidated Financial Statements are prepared. On a regular basis, we review our accounting policies, assumptions, estimates and judgments to ensure that our financial statements are presented fairly and in accordance with GAAP. However, because future events and their effects cannot be determined with certainty, actual results could differ, and such differences could be material.
We consider an accounting estimate to be critical if it requires significant management judgments and assumptions about matters that are highly uncertain at the time the estimate is made and if changes in the estimate that are reasonably possible could materially impact our financial statements. Although other estimates are used in preparing our financial statements, we believe that the following accounting estimates are the most critical to understanding and evaluating our reported financial results. For information on all of our significant accounting policies and additional estimates, see Note 2. Summary of significant accounting policies and Note 3. Recent accounting pronouncements to the Notes to Consolidated Financial Statements.
Net realizable value of production-related inventories
Estimate required: Our production-related inventories include stockpiles, in-process, and doré finished goods, all of which are measured and carried at the lower of average cost or net realizable value. Net realizable value is calculated as the estimated future sales price of production-related inventories in the ordinary course of business using period-end metal prices less the estimated costs to convert the inventories into a saleable product (less estimated selling costs). A change in metal price levels or estimated future costs of completion from those which were used in our year-end net realizable value calculations could result in, or contribute to, additional future write-downs of production-related inventories.
Impact of change in estimate: We incorporated year-end metal prices for gold and silver of $1,159 and $16.24 per ounce, respectively, into our net realizable value calculations. At Midas and True North, lower metal prices and/or increases in estimated costs to complete would have a corresponding increase on the amount of write-downs recorded during the year ended December 31, 2016. As of December 31, 2016, the estimated net realizable value of production-related inventories at Fire Creek exceeded its cost by approximately 131%.
31
As discussed in Note 5. Inventories to the Notes to Consolidated Financial Statements the application of our lower of average cost or net realizable value accounting policy resulted in write-downs of production inventories at Midas and True North.
Impairment of long-lived assets
Estimate required: Our long-lived assets, which consist of mineral properties, plant and equipment, are evaluated for recoverability annually and at interim periods as needed. We review and evaluate long-lived assets for recoverability annually and at interim periods if triggering events or changes in circumstances indicate that the related carrying amounts may not be recoverable. Events that may trigger a test for recoverability include significant adverse changes to projected revenues, increases in costs and capital expenditures, or future plans that may adversely impact our current or future operations and cash flows. In estimating future cash flows, assets are grouped at the lowest level of identifiable cash flows that are largely independent of future cash flows from other asset groups. Existing proven and probable reserves, value beyond proven and probable reserves, and mineralization other than proven and probable reserves are included in estimates of future cash flows. An impairment is determined to exist if the total projected future cash flows on an undiscounted pretax basis are less than the carrying amount of a long-lived asset or asset group. An impairment loss is measured using discounted cash flows and recorded based on the excess carrying value of the impaired long-lived asset over its estimated fair value. The assumptions, projections, and probabilities used to determine estimates of future cash flows are consistent or reasonable in relation to internal budgets, projections, and life-of-mine plans. Any change in the assumptions, projections, or probabilities used in our impairment calculations could materially impact our financial statements.
Impact of change in estimate: The most significant assumptions used in our 2016 impairment tests include estimates of future gold and silver ounces sold and long-term future average gold and silver selling prices. As of December 31, 2016, our projected future cash flows on an undiscounted basis using average long-term gold and silver prices of $1,250 and $17.51 per ounce, respectively, exceeded the carrying values of the related long-lived asset groups by approximately 1,211% for Fire Creek, 10% for Midas, 484% for True North, and 86% for Hollister.
We did not experience any impairments of long-lived assets during the years ended December 31, 2016, 2015, and 2014.
Business combinations
Estimate required: When accounting for business combinations, we allocate the purchase consideration transferred to the estimated fair values of identifiable assets acquired and liabilities assumed on the acquisition date. The fair values of identifiable assets and liabilities assumed, as well as the consideration transferred, requires us to make estimates about future cash flows from long-lived assets, valuation of deferred taxes, and asset retirement obligations using models and inputs, as of the acquisition date, which are comparable to our long-lived asset impairment analysis and estimates relating to valuation of common shares and warrants. Any change in the assumptions, projections, or probabilities used in our fair value calculations could materially impact our financial statements, including during a measurement period up to one year from the acquisition date, if new information is obtained about facts and circumstances that existed as of the acquisition date that, if known, would have resulted in the recognition of those assets and liabilities as of that date.
Impact of change in estimate: If we were to change inputs, assumptions, projections, or probabilities used in business combinations that determine the fair values of consideration transferred, assets acquired, or liabilities assumed, the amounts recorded in our financial statements could change.
As discussed in Note 4. Business combinations to the Notes to Consolidated Financial Statements we completed three acquisitions over the last three years which were accounted for as business combinations.
Income taxes
Estimate required: Our annual tax rate is based on income, statutory tax rates in effect, and tax planning opportunities available to us in the United States and Canada. Our deferred income taxes reflect the impact of temporary differences between the reported amounts of assets and liabilities for financial reporting purposes and such amounts measured by tax laws and regulations. In evaluating the realizability of deferred tax assets, we consider both positive and negative evidence that may exist, such as earnings history, reversal of taxable temporary differences, forecast operating earnings, and available tax planning strategies in each tax jurisdiction. A valuation allowance may be established to reduce our deferred tax assets to the amount that is considered more likely than not to be realized through the generation of future taxable income and other tax planning strategies. Changes in valuation allowances are reflected as increases or decreases to income tax expense in the period which they are determined.
Impact of change in estimate: As of December 31, 2016, we had recorded deferred tax assets of $5.3 million (net of a valuation allowance of $62.4 million for deferred tax assets). Our estimate of future taxable earnings is the most significant estimate that impacts deferred taxes, and if such estimate was changed, would result in a corresponding increase or decrease to the valuation allowance against deferred tax assets.
See Note 17. Income taxes to the Notes to Consolidated Financial Statements for additional information on income taxes.
32
Results of operations
Revenues | 2016 | 2015 | 2014 | 2016 vs. 2015 | 2015 vs. 2014 | |||||||||||||||
Gold revenue | ||||||||||||||||||||
Fire Creek | $ | 123,403 | $ | 93,739 | $ | 74,864 | $ | 29,664 | $ | 18,875 | ||||||||||
Midas | 39,783 | 33,492 | 17,119 | 6,291 | 16,373 | |||||||||||||||
True North | 9,329 | — | — | 9,329 | — | |||||||||||||||
172,515 | 127,231 | 91,983 | 45,284 | 35,248 | ||||||||||||||||
Silver revenue | ||||||||||||||||||||
Fire Creek | 1,623 | 1,284 | 1,026 | 339 | 258 | |||||||||||||||
Midas | 24,023 | 25,566 | 19,613 | (1,543 | ) | 5,953 | ||||||||||||||
True North | 14 | — | — | 14 | — | |||||||||||||||
25,660 | 26,850 | 20,639 | (1,190 | ) | 6,211 | |||||||||||||||
$ | 198,175 | $ | 154,081 | $ | 112,622 | $ | 44,094 | $ | 41,459 | |||||||||||
Revenues increased from 2014 to 2016 due to increases in the number of gold ounces sold from higher tons mined at Fire Creek and Midas and commencing production at True North during the second half of 2016, the volumes of which were impacted by changes in average realized prices. Consolidated ore tons milled during 2016, 2015, and 2014 were 407,245, 261,288, and 171,844, respectively. See the Mining operations review section of this MD&A for additional discussion on our operating results at each mine.
Gold Revenue - The table below summarizes changes in gold revenue, ounces sold, and average realized prices (in thousands, except ounces sold and per ounce amounts):
2016 | 2015 | 2014 | ||||||||||
Total gold revenue (thousands) | $ | 172,515 | $ | 127,231 | $ | 91,983 | ||||||
Gold ounces sold | 138,516 | 110,058 | 73,100 | |||||||||
Average realized price (per ounce) | $ | 1,245 | $ | 1,156 | $ | 1,258 | ||||||
The change in gold revenue was attributable to: | 2016 vs. 2015 | 2015 vs. 2014 | ||||||||||
Increase in ounces sold | $ | 32,956 | $ | 46,474 | ||||||||
Change in average realized price | 9,795 | (7,456 | ) | |||||||||
Effect of average realized price change on ounces sold increase | 2,533 | (3,770 | ) | |||||||||
$ | 45,284 | $ | 35,248 | |||||||||
Gold revenues increased during 2016 and 2015 largely due to increases of 28,458 ounces and 36,958 ounces, respectively, from the preceding year due to increased ore tonnage mined and milled. During 2016, gold revenues further benefited from commencing production at True North and from an increase of $65 (or 5.6%) in the average realized price per ounce sold compared to 2015, whereas 2015 was negatively impacted by a decrease of $102 (or 8.1%) in the average realized price per ounce sold compared to 2014.
Silver Revenue - The table below summarizes changes in silver revenue, ounces sold, and average realized prices (in thousands, except ounces sold and per ounce amounts):
2016 | 2015 | 2014 | ||||||||||
Total silver revenue (thousands) | $ | 25,660 | $ | 26,850 | $ | 20,639 | ||||||
Silver ounces sold | 1,470,992 | 1,708,548 | 1,117,288 | |||||||||
Average realized price (per ounce) | 17.44 | $ | 15.72 | $ | 18.47 | |||||||
The change in silver revenue was attributable to: | 2016 vs. 2015 | 2015 vs. 2014 | ||||||||||
Change in ounces sold | $ | (3,720 | ) | $ | 10,910 | |||||||
Change in average realized price | 2,939 | (3,073 | ) | |||||||||
Effect of average realized price change on ounces sold change | (409 | ) | (1,626 | ) | ||||||||
$ | (1,190 | ) | $ | 6,211 | ||||||||
Silver revenues decreased during 2016 as we sold 237,556 less ounces than in 2015 which was partially offset by an increase of $1.72 (or 10.9%) in the average realized price per ounce sold. Despite increased ore tons in 2016 the average silver mill head grade decreased to 4.04 oz/ton from 6.66 oz/ton. Silver revenues increased year-over-year in 2015, as we sold 591,260 more ounces than in 2014,
33
which was partially offset by a decrease of $2.75 (or 14.9%) in the average realized price per ounce sold. Increased ore tons mined in 2015 helped to compensate for lower silver grades compared to 2014.
Cost of sales | 2016 | 2015 | 2014 | 2016 vs. 2015 | 2015 vs. 2014 | |||||||||||||||
Production costs | $ | 106,389 | $ | 83,318 | $ | 54,430 | $ | 23,071 | $ | 28,888 | ||||||||||
Depreciation and depletion | 28,242 | 22,452 | 6,806 | 5,790 | 15,646 | |||||||||||||||
Write-down of production inventories | 2,869 | 1,201 | — | 1,668 | 1,201 | |||||||||||||||
$ | 137,500 | $ | 106,971 | $ | 61,236 | $ | 30,529 | $ | 45,735 | |||||||||||
Cost of sales by mine | ||||||||||||||||||||
Fire Creek | $ | 57,858 | $ | 45,218 | $ | 27,716 | $ | 12,640 | $ | 17,502 | ||||||||||
Midas | 63,345 | 61,753 | 33,520 | 1,592 | 28,233 | |||||||||||||||
True North | 16,297 | — | — | 16,297 | — | |||||||||||||||
$ | 137,500 | $ | 106,971 | $ | 61,236 | $ | 30,529 | $ | 45,735 | |||||||||||
Production costs - For the reasons discussed in the above Revenues section, higher ounce sales largely contributed to increased production costs in 2016 and 2015 compared to the preceding years with additional impacts from average mill head grades. See the Mining operations reviewsection of this MD&A for a discussion of production costs at each mine.
Depreciation and depletion - Although the cost basis of our Mineral properties, plant and equipment, net in service generally increases period over period due to recurring capital expenditures, increases in mineral reserves at both Fire Creek and Midas, which are used in depletion and depreciation calculations, have extended our mine lives and resulted in comparable depreciation and depletion per ounce sold in 2016 and 2015. Increase in total depreciation and depletion are due to higher sales volumes.
Write-down of production inventories - Due to lower period-end metal price levels and increases in production costs, the application of our lower of average cost or net realizable value accounting policy resulted in write-downs of production inventories in 2016 at Midas and True North and in 2015 at Midas. See Note 5. Inventories to the Notes to Consolidated Financial Statements for additional detail.
2016 | 2015 | 2014 | 2016 vs. 2015 | 2015 vs. 2014 | ||||||||||||||||
General and administrative | $ | 15,804 | $ | 12,375 | $ | 8,818 | $ | 3,429 | $ | 3,557 | ||||||||||
The 27.7% increase during 2016 over 2015 is due to higher compensation and benefit costs from increased staff levels at the corporate office and higher legal and professional fees, both of which are due to our growth, $0.8 million recorded for deferred share units (see Note 10. Deferred share units liability), and $0.4 million of first quarter severance costs. The 40.3% increase during 2015 over 2014 is due to higher compensation and benefit costs from increased staff levels at the corporate office and higher legal and professional fees, both of which are due to our growth.
2016 | 2015 | 2014 | 2016 vs. 2015 | 2015 vs. 2014 | ||||||||||||||||
Exploration | $ | 12,765 | $ | 9,813 | $ | 3,415 | $ | 2,952 | $ | 6,398 | ||||||||||
Exploration expenditures during 2016, 2015, and 2014 at Fire Creek was $8.8 million, $3.2 million, and nil, respectively, and at Midas was $4.0 million, $6.6 million, and $3.4 million, respectively. Exploration increased 30.1% during 2016 and 187.3% during 2015, compared to the preceding years, as consistent with our strategy we performed drilling related to identifying new mineralization and converting mineralization to reserves.
2016 | 2015 | 2014 | 2016 vs. 2015 | 2015 vs. 2014 | ||||||||||||||||
Development and projects costs | $ | 8,953 | $ | — | $ | 15,467 | $ | 8,953 | $ | (15,467 | ) | |||||||||
Development and project costs during 2016 were $5.5 million at True North and $3.4 million at Hollister and during 2014 were $7.8 million at Fire Creek and $7.5 million at Midas and are attributable to costs incurred at properties before mineralization was classified as proven and probable reserves. Such costs are generally for building or constructing shafts, drifts, and ramps which enable us to physically access the underground and drilling, engineering, metallurgical, and other related costs to delineate or expand mineralization.
2016 | 2015 | 2014 | 2016 vs. 2015 | 2015 vs. 2014 | ||||||||||||||||
Asset retirement and accretion | $ | 2,653 | $ | 871 | $ | 628 | $ | 1,782 | $ | 243 | ||||||||||
34
These amounts relate to the accretion expense from existing asset retirement obligations and asset retirement increases at properties where mineralization is not classified as proven and probable reserves. Asset retirement and accretion have increased over the last three years as the number of properties and disturbances at such properties has increased. See Note 9. Asset retirement obligations to the Notes to Consolidated Financial Statements for additional detail.
2016 | 2015 | 2014 | 2016 vs. 2015 | 2015 vs. 2014 | ||||||||||||||||
Business acquisition costs | $ | 2,253 | $ | 328 | $ | 2,042 | $ | 1,925 | $ | (1,714 | ) | |||||||||
These amounts relate to costs and expenses associated with the acquisitions of Midas (February 2014), True North (January 2016), and Hollister and Aurora (October 2016). See Note 4. Business combinations to the Notes to Consolidated Financial Statements for additional detail.
2016 | 2015 | 2014 | 2016 vs. 2015 | 2015 vs. 2014 | ||||||||||||||||
Provision for legal settlement | $ | 3,000 | $ | — | $ | — | $ | 3,000 | $ | — | ||||||||||
This amount relates to a provision recorded for the expected settlement of litigation with a former employee. See Note 24. Commitments and contingencies to the Notes to Consolidated Financial Statements for additional detail.
2016 | 2015 | 2014 | 2016 vs. 2015 | 2015 vs. 2014 | ||||||||||||||||
(Loss) gain on derivatives, net | $ | (7,646 | ) | $ | 3,367 | $ | 7,088 | $ | (11,013 | ) | $ | (3,721 | ) | |||||||
Amounts recorded for derivatives are attributable to changes in the fair value of derivative instruments and gains or losses on derivative settlements and transactions, both of which are generally impacted by increases and decreases in gold and silver prices. See Note 11. Derivatives to the Notes to Consolidated Financial Statements for additional detail.
2016 | 2015 | 2014 | 2016 vs. 2015 | 2015 vs. 2014 | ||||||||||||||||
Interest expense, net | $ | 5,339 | $ | 7,298 | $ | 8,344 | $ | (1,959 | ) | $ | (1,046 | ) | ||||||||
Amounts recorded for interest expense have generally decreased over the past three years as our existing debt continues to amortize resulting in increases to amounts applied to principal balances and because our financial position has improved resulting in more favorable terms on new debt. In all years, the largest component of total interest expense was for the February 2014 gold purchase agreement with a subsidiary of Franco-Nevada Corporation (the "Gold Purchase Agreement"), which represented 74.7%, 66.9%, and 63.5% of recorded interest expense during 2016, 2015, and 2014, respectively. See Note 8. Debt to the Notes to Consolidated Financial Statements for additional detail.
2016 | 2015 | 2014 | 2016 vs. 2015 | 2015 vs. 2014 | ||||||||||||||||
Foreign currency gain, net | $ | 651 | $ | 15,059 | $ | 10,874 | $ | (14,408 | ) | $ | 4,185 | |||||||||
Amounts recorded for foreign exchange gains primarily relate to unrealized amounts on intercompany loan balances which we expect to settle in the foreseeable future which were partially offset by losses on U.S. dollar debt held in our Canadian companies.
2016 | 2015 | 2014 | 2016 vs. 2015 | 2015 vs. 2014 | ||||||||||||||||
Loss on debt extinguishment | $ | 519 | $ | 2,103 | $ | — | $ | (1,584 | ) | $ | 2,103 | |||||||||
We recorded losses for the 2016 repayment of the $12.0 million promissory note to the vendor we acquired True North from and for the 2015 repayment of the CDN$25.0 million 11.0% senior secured notes due August 11, 2017. See Note 8. Debt to the Notes to Consolidated Financial Statements for additional detail.
2016 | 2015 | 2014 | 2016 vs. 2015 | 2015 vs. 2014 | ||||||||||||||||
Income tax (expense)/benefit | $ | (3,724 | ) | $ | 11,738 | $ | (2,955 | ) | $ | (15,462 | ) | $ | 14,693 | |||||||
See Note 17. Income taxes to the Notes to Consolidated Financial Statements for a reconciliation of taxes.
2016 | 2015 | 2014 | 2016 vs. 2015 | 2015 vs. 2014 | ||||||||||||||||
Net (loss) income | $ | (1,700 | ) | $ | 44,253 | $ | 26,884 | $ | (45,953 | ) | $ | 17,369 | ||||||||
For the reasons discussed above and elsewhere in this MD&A, we reported the above amounts for 2016, 2015, and 2014.
35
Mining operations review
Actual vs. modeled resource grades
Our average gold and gold equivalent mill head grades, on both a consolidated and individual mine site basis, can vary from the average grades of the mineral reserve estimates for each site. During our mining activities, we may encounter mineralization not included in the mineral reserve estimate that, in the opinion of management, can be processed economically. Often-times, rather than leaving such mineralization for future extraction, we mine the area when encountered so as not to potentially sterilize or incur additional costs to re-access and mine the mineralization at a later date. In other instances, additional design work, rehabilitation, and/or underground development may be required to enable access to mineralization included in the mineral resource estimate. Due to the above, actual mined gold and gold equivalent grades can differ from those which are stated in the current mineral reserve estimate.
Consolidated
The following table provides a summary of consolidated operating results for our producing properties which include our two Nevada operations, Fire Creek and Midas, and our Canadian asset, True North, which was placed into production during the end of the third quarter of 2016.
Years ended December 31, | ||||||||||||||||||||
2016 | 2015 | 2014 | ||||||||||||||||||
Mine operations - consolidated | Nevada Total(1) | True North | Total | Nevada Total(1) | Nevada Total(1) | |||||||||||||||
Ore tons milled | 311,535 | 95,710 | 407,245 | 261,288 | 171,844 | |||||||||||||||
Average gold equivalent mill head grade (oz/ton)(2) | 0.52 | 0.11 | 0.43 | 0.52 | 0.63 | |||||||||||||||
Average gold mill head grade (oz/ton) | 0.45 | 0.11 | 0.37 | 0.43 | 0.51 | |||||||||||||||
Average silver mill head grade (oz/ton) | 5.28 | — | (4) | 4.04 | 6.66 | 8.34 | ||||||||||||||
Average gold recovery rate (%) | 93.7 | % | 92.7 | % | 93.6 | % | 93.4 | % | 94.0 | % | ||||||||||
Average silver recovery rate (%) | 86.7 | % | — | % | (4) | 86.7 | % | 92.3 | % | 95.2 | % | |||||||||
Gold equivalent produced (oz)(2) | 151,007 | 10,199 | 161,289 | 127,703 | 106,292 | |||||||||||||||
Gold produced (oz) | 131,110 | 10,187 | 141,297 | 105,893 | 86,239 | |||||||||||||||
Silver produced (oz) | 1,426,582 | 853 | 1,427,435 | 1,605,226 | 1,365,586 | |||||||||||||||
Gold equivalent sold (oz)(2)(3) | 151,004 | 8,028 | 159,118 | 133,272 | 89,507 | |||||||||||||||
Gold sold (oz) | 130,500 | 8,016 | 138,516 | 110,058 | 73,100 | |||||||||||||||
Silver sold (oz) | 1,470,139 | 853 | 1,470,992 | 1,708,548 | 1,117,288 | |||||||||||||||
Revenues and realized prices | ||||||||||||||||||||
Gold revenue (000s) | $ | 163,186 | $ | 9,329 | $ | 172,515 | $ | 127,231 | $ | 91,983 | ||||||||||
Silver revenue (000s) | 25,646 | 14 | 25,660 | 26,850 | 20,639 | |||||||||||||||
Total revenues (000s) | $ | 188,832 | $ | 9,343 | $ | 198,175 | $ | 154,081 | $ | 112,622 | ||||||||||
Average realized gold price ($/oz) | $ | 1,250 | $ | 1,164 | $ | 1,245 | $ | 1,156 | $ | 1,258 | ||||||||||
Average realized silver price ($/oz) | $ | 17.44 | $ | 16.41 | $ | 17.44 | $ | 15.72 | $ | 18.47 | ||||||||||
Non-GAAP Measures | ||||||||||||||||||||
Production cash costs per GEO sold(2)(3) | $ | 637 | $ | 1,552 | $ | 683 | $ | 633 | $ | 608 | ||||||||||
All-in costs per gold ounce sold(3) | n/a | n/a | $ | 1,335 | $ | 1,064 | $ | 958 | ||||||||||||
(1) Nevada Total includes Fire Creek and Midas, which during 2015 and 2014, were our two producing mines. | ||||||||||||||||||||
(2) Gold equivalent measures are the gold measure plus the silver measure divided by a GEO ratio. GEO ratios are computed by dividing the average realized gold price per ounce by the average realized silver price per ounce received by us in the respective period and match the ratios used to determine the production cash costs per GEO sold. Refer to the Non-GAAP Performance Measures section of this MD&A for additional detail. | ||||||||||||||||||||
(3) This is a non-GAAP measure; refer to the Non-GAAP Performance Measures section of this MD&A for additional detail. | ||||||||||||||||||||
(4) The Company does not track this silver statistic at True North due to silver being immaterial to that operation. | ||||||||||||||||||||
Nevada operations
We achieved the full-year 2016 plan which entailed production growing from the first half to the second half of the year, as planned sequencing and ore development activities performed throughout the year contributed to quarter over quarter grade increases. As a result, consolidated gold equivalent mill head grades increased quarter over quarter in 2016 and were: 0.44 oz/ton in the first, 0.52 oz/ton in the second, 0.55 oz/ton in the third, and 0.57 oz/ton in the fourth. Production increased in 2016 to a record 151,007 GEOs as ore tons milled increased to an average of 854 tons per day, 19.3% higher than the 2015 daily average of 716 tons per day. Full-year gold equivalent grades of 0.52 oz/ton in both 2016 and 2015 contributed to consistently low production cash costs per GEO of $637 and
36
$633, respectively, resulting in margins of $613 (or 49.0%) and $523 (or 45.2%) per ounce using average realized gold prices in 2016 and 2015, respectively. 2016 spending at Fire Creek and Midas totaled $47.6 million for capital and $12.8 million for exploration (total of $60.4 million) and slightly exceeded our annual expectation of $60.0 million due to increased development spending at Midas. For the reasons discussed above and as shown in the table below, we achieved the following 2016 consolidated guidance relative to our full-year expectations:
Year ended December 31, 2016 | ||||||||||||
Guidance | ||||||||||||
Mine operations - Nevada | Low | High | Actual | |||||||||
Gold equivalent produced (oz)(1) | 145,000 | 150,000 | 151,007 | |||||||||
Non-GAAP Measures | ||||||||||||
Production cash costs per GEO sold(1)(2) | $ | 600 | $ | 650 | $ | 637 | ||||||
(1) Gold equivalent measures are the gold measure plus the silver measure divided by a GEO ratio. GEO ratios are computed by dividing the average realized gold price per ounce by the average realized silver price per ounce received by us in the respective period and match the ratios used to determine the production cash costs per GEO sold. Refer to the Non-GAAP Performance Measures section of this MD&A for additional detail. | ||||||||||||
(2) This is a non-GAAP measure; refer to the Non-GAAP Performance Measures section of this MD&A for additional detail. | ||||||||||||
Canadian operations
We achieved True North's full-year 2016 plan which entailed production commencing in the third quarter from reprocessing tailings and increasing in the fourth quarter when stockpile processing began. Actual production of 10,187 gold ounces was in the middle of our expected range of 8,000 - 12,000 gold ounces. 2016 spending at True North totaled $11.2 million for capital and $5.5 million for development and project costs (total of $16.8 million) and was within our expectation of $14 - $16 million.
37
Fire Creek (Nevada Operations)
Fire Creek is 100% owned, fully-permitted, and was acquired by Klondex in 1975. Production began in 2014 under the bulk sample permit. Fire Creek is located in north-central Nevada in Lander County approximately 16 miles south of a major highway (Interstate-80) near other large gold deposits and mines which are owned and operated by major mining companies. Fire Creek is a high-grade, epithermal vein deposit, and the land package covers approximately 17,000 acres (~26.5 square miles). Ore mined from Fire Creek is trucked to Midas for processing in the milling facility. The following table provides a summary of Fire Creek operating results and year-over-year changes.
Years ended December 31, | ||||||||||||||||||||
Mine Operations - Fire Creek | 2016 | 2015 | 2014 | 2016 vs. 2015 | 2015 vs. 2014 | |||||||||||||||
Ore tons milled | 120,553 | 86,574 | 54,955 | 33,979 | 31,619 | |||||||||||||||
Average gold equivalent mill head grade (oz/ton)(1) | 0.91 | 0.97 | 1.27 | (0.06 | ) | (0.30 | ) | |||||||||||||
Average gold mill head grade (oz/ton) | 0.90 | 0.95 | 1.25 | (0.05 | ) | (0.30 | ) | |||||||||||||
Average silver mill head grade (oz/ton) | 0.77 | 1.16 | 1.21 | (0.39 | ) | (0.05 | ) | |||||||||||||
Average gold recovery rate (%) | 93.6 | % | 93.5 | % | 94.1 | % | 0.1 | % | (0.6 | )% | ||||||||||
Average silver recovery rate (%) | 86.6 | % | 92.0 | % | 95.4 | % | (5.4 | )% | (3.4 | )% | ||||||||||
Gold equivalent produced (oz)(1) | 102,383 | 78,312 | 68,106 | 24,071 | 10,206 | |||||||||||||||
Gold produced (oz) | 101,286 | 77,055 | 67,181 | 24,231 | 9,874 | |||||||||||||||
Silver produced (oz) | 80,593 | 92,114 | 63,656 | (11,521 | ) | 28,458 | ||||||||||||||
Gold equivalent sold (oz)(1)(2) | 100,022 | 82,191 | 60,166 | 17,831 | 22,025 | |||||||||||||||
Gold sold (oz) | 98,723 | 81,080 | 59,352 | 17,643 | 21,728 | |||||||||||||||
Silver sold (oz) | 95,454 | 81,441 | 56,015 | 14,013 | 25,426 | |||||||||||||||
Revenues and realized prices | ||||||||||||||||||||
Gold revenue (000s) | $ | 123,403 | $ | 93,739 | $ | 74,864 | $ | 29,664 | $ | 18,875 | ||||||||||
Silver revenue (000s) | 1,623 | 1,284 | 1,026 | 339 | 258 | |||||||||||||||
Total revenues (000s) | $ | 125,026 | $ | 95,023 | $ | 75,890 | $ | 30,003 | $ | 19,133 | ||||||||||
Average realized gold price ($/oz) | $ | 1,250 | $ | 1,156 | $ | 1,261 | $ | 94 | $ | (105 | ) | |||||||||
Average realized silver price ($/oz) | $ | 17.00 | $ | 15.77 | $ | 18.32 | $ | 1.23 | $ | (2.55 | ) | |||||||||
Non-GAAP Measures | ||||||||||||||||||||
Production cash costs per GEO sold(1)(2) | $ | 462 | $ | 455 | $ | 418 | $ | 7 | $ | 37 | ||||||||||
(1) Gold equivalent measures are the gold measure plus the silver measure divided by a GEO ratio. GEO ratios are computed by dividing the average realized gold price per ounce by the average realized silver price per ounce received by us in the respective period and match the ratios used to determine the production cash costs per GEO sold. Refer to the Non-GAAP Performance Measures section of this MD&A for additional detail. | ||||||||||||||||||||
(2) This is a non-GAAP measure; refer to the Non-GAAP Performance Measures section of this MD&A for additional detail. | ||||||||||||||||||||
Operations and costs - GEOs produced at Fire Creek increased by 30.7% and 15.0% in 2016 and 2015, respectively, from the preceding year due to increased ore tonnage mined and milled with consistently high grades. Over the past three years we have focused on completing the required development and drilling to responsibly increase Fire Creek's annual production through increased tonnage as it has the lowest cost structure in our portfolio due to its high grades. We have been able to increase and sustain the mining rate through a combination of additional underground equipment and employees and engaging contractors as needed. Gold equivalent mill head grades increased quarter over quarter in 2016, consistent with our annual mine plan, and were: 0.70 oz/ton in the first, 0.91 oz/ton in the second, 0.98 oz/ton in the third, and 1.07 oz/ton in the fourth. Average mill head grades were slightly lower year over year from 2014 due to mining lower grade areas of the reserve and within mineralization not included in the reserve. Due largely to the grades at Fire Creek, we have been able to maintain a mid-$400 production cash costs per GEO structure, which in 2016 totaled $462, slightly above the high end of our annual expectation of $450.
Spending - 2016 spending was $23.8 million for capital and $8.8 million for exploration (total of $32.5 million) and near the low end of our annual expectation of $34.7 - 36.7 million. For details of capital expenditures and the classification between sustaining and non-sustaining (growth) refer to the Investing cash flows part of the Financial position, liquidity, and capital resources section of this MD&A.
38
Midas Mine and Mill (Nevada Operations)
Midas is 100% owned, fully-permitted, and was acquired by Klondex in February 2014. Midas is located in north-central Nevada in Elko County approximately 58 miles east of a major highway (Interstate-80) near other large gold deposits and mines which are owned and operated by major mining companies. Midas is a low-sulphidation, epithermal vein, deposit and the land package covers approximately 30,000 acres. Midas has a 1,200 ton per day milling facility which processes ore mined from both Midas and Fire Creek. The following table provides a summary of Midas operating results and year-over-year changes.
Years ended December 31, | ||||||||||||||||||||
Mine operations - Midas | 2016 | 2015 | 2014 | 2016 vs. 2015 | 2015 vs. 2014 | |||||||||||||||
Ore tons milled | 190,982 | 174,714 | 116,889 | 16,268 | 57,825 | |||||||||||||||
Average gold equivalent mill head grade (oz/ton)(1) | 0.28 | 0.31 | 0.33 | (0.03 | ) | (0.02 | ) | |||||||||||||
Average gold mill head grade (oz/ton) | 0.17 | 0.18 | 0.16 | (0.01 | ) | 0.02 | ||||||||||||||
Average silver mill head grade (oz/ton) | 8.13 | 9.39 | 11.69 | (1.26 | ) | (2.30 | ) | |||||||||||||
Average gold recovery rate (%) | 93.9 | % | 93.1 | % | 93.6 | % | 0.8 | % | (0.5 | %) | ||||||||||
Average silver recovery rate (%) | 86.7 | % | 92.3 | % | 95.2 | % | (5.6 | %) | (2.9 | %) | ||||||||||
Gold equivalent produced (oz)(1) | 48,623 | 49,397 | 38,374 | (774 | ) | 11,023 | ||||||||||||||
Gold produced (oz) | 29,824 | 28,838 | 19,058 | 986 | 9,780 | |||||||||||||||
Silver produced (oz) | 1,345,989 | 1,513,112 | 1,301,930 | (167,123 | ) | 211,182 | ||||||||||||||
Gold equivalent sold (oz)(1)(2) | 50,977 | 51,085 | 29,494 | (108 | ) | 21,591 | ||||||||||||||
Gold sold (oz) | 31,777 | 28,978 | 13,748 | 2,799 | 15,230 | |||||||||||||||
Silver sold (oz) | 1,374,685 | 1,627,107 | 1,061,273 | (252,422 | ) | 565,834 | ||||||||||||||
Revenues and realized prices | — | — | ||||||||||||||||||
Gold revenue (000s) | $ | 39,783 | $ | 33,492 | $ | 17,119 | $ | 6,291 | $ | 16,373 | ||||||||||
Silver revenue (000s) | 24,023 | 25,566 | 19,613 | (1,543 | ) | 5,953 | ||||||||||||||
Total revenues (000s) | $ | 63,806 | $ | 59,058 | $ | 36,732 | $ | 4,748 | $ | 22,326 | ||||||||||
Average realized gold price ($/oz) | $ | 1,252 | $ | 1,156 | $ | 1,245 | $ | 96 | $ | (89 | ) | |||||||||
Average realized silver price ($/oz) | $ | 17.48 | $ | 15.71 | $ | 18.48 | $ | 2 | $ | (2.77 | ) | |||||||||
Non-GAAP Measures | ||||||||||||||||||||
Production cash costs per GEO sold(1)(2) | $ | 981 | $ | 919 | $ | 993 | $ | 62 | $ | (74 | ) | |||||||||
(1) Gold equivalent measures are the gold measure plus the silver measure divided by a GEO ratio. GEO ratios are computed by dividing the average realized gold price per ounce by the average realized silver price per ounce received by us in the respective period and match the ratios used to determine the production cash costs per GEO sold. Refer to the Non-GAAP Performance Measures section of this MD&A for additional detail. | ||||||||||||||||||||
(2) This is a non-GAAP measure; refer to the Non-GAAP Performance Measures section of this MD&A for additional detail. | ||||||||||||||||||||
Operations and costs - GEOs produced at Midas were comparable over the last two years as an increase in ore tons milled accommodated slightly lower grades. Gold equivalent mill head grades increased quarter over quarter in 2016, consistent with our annual mine plan, and were: 0.22 oz/ton in the first, 0.26 oz/ton in the second, 0.28 oz/ton in the third, and 0.32 oz/ton in the fourth. Average mill head grades were slightly lower year over year from 2014 due to mining lower grade areas of the reserve and within mineralization not included in the reserve. We experience cost and recovery rate synergies from processing ore from Fire Creek at Midas; however, during 2016 and 2015, Midas's decreasing grades together with increased mineral properties, plant and equipment in service, resulted in write-downs to production inventories of $0.5 million and $1.2 million, respectively (see Note 5. Inventories to the Notes to Consolidated Financial Statements for additional detail). We have been able to maintain a sub-$1,000 production cash costs per GEO structure, which in 2016 totaled $981, and approximated the high end of our annual guidance of $950.
Spending - 2016 spending was $23.8 million for capital and $4.0 million for exploration (total of $27.8 million) and exceeded the high end of our annual expectation of $20.3 - 23.3 million. During 2016, actual spending exceeded our plans as additional underground development was required in the second half of the year to support the 2016 and 2017 mine plans. For details of capital expenditures and the classification between sustaining and non-sustaining (growth) refer to the Investing cash flows part of the Financial position, liquidity, and capital resources section of this MD&A.
True North (Manitoba, Canada)
True North (formerly Rice Lake), located in Manitoba, Canada, is 100% owned, fully-permitted, and was acquired on January 22, 2016. True North is a past producing underground gold mining operation consisting of three underground deposits with a modern, fully-permitted 2,500 ton per day mill. Under previous ownership, mining took place at True North continuously from 2007 until May
39
2015, when the operation was placed on care and maintenance. True North was placed into production towards the end of the third quarter of 2016 following the release of an updated mineral reserve and resource estimate.
Year ended December 31, | ||||
Mine operations - True North | 2016 | |||
Ore tons milled | 95,710 | |||
Average gold equivalent mill head grade (oz/ton)(1) | 0.11 | |||
Average gold mill head grade (oz/ton) | 0.11 | |||
Average silver mill head grade (oz/ton)(3) | — | |||
Average gold recovery rate (%) | 92.7 | % | ||
Average silver recovery rate (%)(3) | — | % | ||
Gold equivalent produced (oz)(1) | 10,199 | |||
Gold produced (oz) | 10,187 | |||
Silver produced (oz) | 853 | |||
Gold equivalent sold (oz)(1)(2) | 8,028 | |||
Gold sold (oz) | 8,016 | |||
Silver sold (oz) | 853 | |||
Revenues and realized prices | ||||
Gold revenue (000s) | $ | 9,329 | ||
Silver revenue (000s) | 14 | |||
Total revenues (000s) | $ | 9,343 | ||
Average realized gold price ($/oz) | $ | 1,164 | ||
Average realized silver price ($/oz) | $ | 16.41 | ||
Non-GAAP Measures | ||||
Production cash costs per GEO sold(1)(2) | $ | 1,552 | ||
(1) Gold equivalent measures are the gold measure plus the silver measure divided by a GEO ratio. GEO ratios are computed by dividing the average realized gold price per ounce by the average realized silver price per ounce received by us in the respective period and match the ratios used to determine the production cash costs per GEO sold. Refer to the Non-GAAP Performance Measures section of this MD&A for additional detail. | ||||
(2) This is a non-GAAP measure; refer to the Non-GAAP Performance Measures section of this MD&A for additional detail. | ||||
(3)The Company does not track this silver statistic at True North due to silver being immaterial to that operation. | ||||
Operations and costs - We achieved True North's full-year 2016 plan which entailed performing rehab work after the acquisition and commencing production in the third quarter from reprocessing tailings and increasing in the fourth quarter when stockpile processing began. Actual production of 10,187 gold ounces was in the middle of our expected range of 8,000 - 12,000 gold ounces. As we were ramping up production, which entailed processing low grade stockpiled ore, we recorded write-downs to production inventories of $2.4 million in 2016 (see Note 5. Inventories to the Notes to Consolidated Financial Statements for additional detail). True North's grades and throughput are expected to continue to increase in 2017 as it operates at a steady-state capacity.
Spending - 2016 spending was $11.2 million for capital and $5.5 million for development and project costs (total of $16.8 million) and in line with our annual expectation of $14 - 16 million. For details of capital expenditures and the classification between sustaining and non-sustaining (growth) refer to the Investing cash flows part of the Financial position, liquidity, and capital resources section of this MD&A.
40
Hollister and Aurora updates
Hollister project overview
The Hollister project is a fully-permitted past producing underground and open pit operation, located in north-central Nevada in Lander County. Hollister has no milling or processing facilities but is located approximately 17 miles from Midas, which currently has capacity to process additional tons through its 1,200 ton per day mill. Hollister is an important asset to us since we believe there may be significant synergies and cost savings with our Nevada operations through low haulage costs, reduced per ton milling costs, and shared general and administrative costs. Further, certain of our executives and management previously operated the historical underground operations and exploration programs at Hollister and believe that exploration targets with significant potential exist within the property boundary. We believe Hollister provides us with an opportunity to strategically and responsibly grow our business in Nevada, a mining friendly jurisdiction, while leveraging our technical expertise in narrow-vein underground mining and past experience with the project.
Hollister updates
• | Gloria vein system bulk sampling - During the fourth quarter of 2016 we commenced a small-scale, selective exploration campaign to improve our understanding of mineralization in the Gloria vein system. Using drill results from the prior owner together with our fourth quarter work, we created a 2017 plan which we believe may result in the extraction from mineralized material of 30,000 - 35,000 GEOs under a bulk sampling program, as Hollister is an exploration and development stage property. |
• | Hatter Graben - A historic drilling program was conducted in 2008 by a prior owner which discovered the Hatter Graben vein system, an east-west trending structural zone containing several sub-parallel high grade veins. Results of this program indicate the system is approximately 1,800 ft (~550 m) in strike and approximately 1,200 ft (365 m) vertical extent and open in all directions. Beginning in mid-2017, we intend to commence infilling the widely spaced drill holes from surface in high-priority exploration targets (Hatter Graben vein system). No new drilling occurred in the Hatter Graben during the fourth quarter of 2016 due to additional time required to design the exploration plan. |
• | Mineralization update- We expect to be able to provide an update on the 2017 drilling program and exploration work during the second half of 2017. |
• | Site infrastructure and equipment - Following an assessment of site facilities, infrastructure, and underground workings, 2016 spending was $0.8 million for capital and $3.4 million for development and project costs (total of $4.2 million) and was lower than the fourth quarter expectation of $7.5 - 9.5 million due to no drilling occurring in the Hatter Graben and lower than planned underground development. For details of capital expenditures and the classification between sustaining and non-sustaining (growth) refer to the Investing cash flows part of the Financial position, liquidity, and capital resources section of this MD&A. |
Aurora project overview
The Aurora project is a fully-permitted past producing underground and open pit operation, located in west-central Nevada in Mineral County. Aurora has a 350 ton per day milling and processing facility, which we believe may provide us an opportunity to consider toll milling services. Further, certain of our executives and management previously operated Aurora and believe that exploration targets with significant potential exist within the property boundary. We believe Aurora provides us with an opportunity to strategically and responsibly grow our business in Nevada.
During the fourth quarter of 2016 we performed rehab work on the mill. Our near term objective for Aurora will be focused largely on assessing the economic feasibility of toll milling services to third parties.
Financial position, liquidity, and capital resources
General strategy
To maintain sufficient liquid assets and access to capital resources we regularly perform short and long-term cash flow forecasts using current assumptions of future gold and silver prices, foreign exchange rates, production volumes, and operating and capital costs. Our liquidity and capital resources management strategy entails a disciplined approach by monitoring the timing and amount of any investment in our mines, projects, or exploration properties, while continually remaining in a position which we believe will allow us to respond to changes in our business environment, such as a decrease in metal prices, or other factors beyond our control.
Our capital structure consists of a mixture of debt and shareholders' equity. We regularly review our capital structure and evaluate various financing options and strategies that: (1) may improve our current liquidity and financial condition, (2) are attainable on favorable and reasonable terms, (3) and are permissible under our existing debt arrangements and other obligations. Such financing options may include, but are not limited to, additional or increases in revolving borrowing facilities, equipment financing, term loan facilities, refinancing existing obligations, and/or the issuance of equity securities, warrants, or other instruments.
41
Risk management contracts
In order to increase the certainty of expected future cash flows, from time to time we may enter into fixed forward spot trades for a portion of our projected gold and silver sales over the next one to twelve months. As of December 31, 2016, we had no outstanding fixed forward contracts but during fiscal year 2016 had entered into, and settled through physical delivery, such instruments covering 109,140 gold ounces and 1,468,516 silver ounces at average prices of $1,244 and $16.54 per ounce, respectively (see Note 11. Derivatives for additional detail). Other than the aforementioned, we have not entered into any other significant contracts to hedge or manage market risks arising from changes in metal prices, diesel and propane costs, and currency and interest rates. We will continually and actively monitor applicable markets and quotes and may consider entering into additional hedging agreements and contracts if determined to be advantageous by management and the board of directors, and if such transactions are permissible under our existing debt agreements.
Liquidity and capital resources
As discussed below in the Sources and uses of cash section, at December 31, 2016, our Cash and cash equivalents balance totaled $47.6 million, decreasing $11.5 million from the December 31, 2015 balance of $59.1 million largely due to $95.7 million of net proceeds received from the Offering and $45.3 million provided by operating activities being more than offset by $100.0 million paid for acquisitions and $61.7 million of capital expenditures on mineral properties, plant and equipment.
Due to the nature of our operations and the composition of our balance sheet assets, as of December 31, 2016, our current assets, which included Cash and cash equivalents of $47.6 million and Inventories of $21.3 million, represented substantially all of our liquid assets on hand. We have access to additional liquidity under our $35.0 million Revolver, of which $23.0 million was available as of December 31, 2016. As of December 31, 2016, we had working capital of $33.2 million. The following chart provides a summary of our working capital, Revolver availability, and estimated liquidity for the last three years (in thousands):
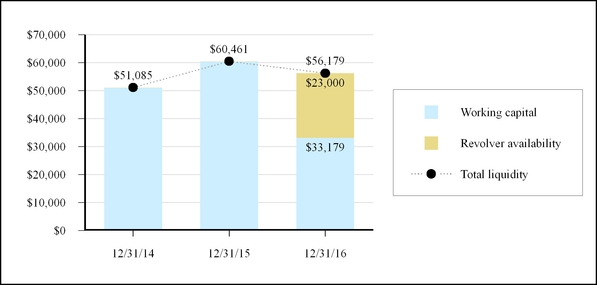
Our working capital decreased $27.3 million (approximately 45.1%) during fiscal 2016, while our working capital ratio decreased to 1.80 (in thousands, except working capital ratio):
December 31, 2016 | December 31, 2015 | Change | ||||||||||
Total current assets | $ | 74,871 | $ | 83,725 | $ | (8,854 | ) | |||||
Total current liabilities | 41,692 | 23,264 | 18,428 | |||||||||
Working capital | $ | 33,179 | $ | 60,461 | $ | (27,282 | ) | |||||
Working capital ratio(1) | 1.80 | 3.60 | ||||||||||
(1) Current assets divided by current liabilities. | ||||||||||||
Working capital changes were primarily attributable to an $11.5 million decrease in Cash and cash equivalents (discussed below in the Sources and uses of cash section), an $11.1 million increase in Accounts payable from having additional operations (True North and Hollister), and a $3.0 million increase in Provision for legal settlement.
Included in working capital are Inventories, which include production-related inventories that can provide us with additional cash liquidity in excess of their December 31, 2016 carrying value of $15.8 million due to a cash margin we expect to realize at the time of
42
sale. The following table summarizes the estimated recoverable gold and silver ounces contained in our Inventories and the underlying amount of revenue which may be generated from their sale using December 31, 2016 period-end prices, which would be further reduced for any remaining processing and refining costs:
December 31, 2016 | ||||||||||||
Gold | Silver | Total | ||||||||||
Estimated ounces in Inventories | 20,729 | 136,132 | ||||||||||
Period-end prices | $ | 1,159 | $ | 16.24 | ||||||||
$ | 24,025 | $ | 2,211 | $ | 26,236 | |||||||
Our December 31, 2016 working capital, available sources of liquidity, and future operating cash flows will be used, in part, to fund recurring operating and production costs, deliver gold ounces under the Gold Purchase Agreement (8,000 ounces over the next 12 months), make principal and interest payments on debt, and to fund capital expenditures and exploration and development costs at our mines and projects. At current gold and silver price levels, and when using our estimates of future production and costs, we believe our cash flows from operating activities together with our working capital and Revolver, will be sufficient to fund our business for at least the next 12 months. See the Contractual obligations section for additional detail on the timing and amounts of our future cash requirements.
Sources and uses of cash
Years ended December 31, | ||||||||||||
2016 | 2015 | 2014 | ||||||||||
Net (loss) income | $ | (1,700 | ) | $ | 44,253 | $ | 26,884 | |||||
Net non-cash adjustments | 36,003 | (10,312 | ) | (8,576 | ) | |||||||
Net change in non-cash working capital | 10,967 | 7,306 | (13,919 | ) | ||||||||
Net cash provided by operating activities | 45,270 | 41,247 | 4,389 | |||||||||
Net cash used in investing activities | (159,693 | ) | (29,878 | ) | (84,010 | ) | ||||||
Net cash provided by financing activities | 104,608 | 5,272 | 113,394 | |||||||||
Effect of foreign exchange on cash balances | (1,646 | ) | (3,032 | ) | (986 | ) | ||||||
Net (decrease) increase in cash | (11,461 | ) | 13,609 | 32,787 | ||||||||
Cash, beginning of period | 59,097 | 45,488 | 12,701 | |||||||||
Cash, end of period | $ | 47,636 | $ | 59,097 | $ | 45,488 | ||||||
Operating Cash Flows - Our cash flows from operations are largely impacted by the number of ounces sold, average realized prices, and production costs. As shown in the table below, during 2016 and 2015, operating cash flows were positively impacted by higher production levels which increased the total cash margin from operations (in thousands except ounces):
Years ended December 31, | ||||||||||||
Cash revenue from operations | 2016 | 2015 | 2014 | |||||||||
Consolidated gold equivalent ounces sold(1) | 159,118 | 133,272 | 89,507 | |||||||||
Less: ounces delivered under Gold Purchase Agreement(2) | (8,000 | ) | (7,500 | ) | (6,750 | ) | ||||||
151,118 | 125,772 | 82,757 | ||||||||||
Average realized gold price ($/oz) | $ | 1,245 | $ | 1,156 | $ | 1,258 | ||||||
$ | 188,142 | $ | 145,392 | $ | 104,108 | |||||||
Cash production costs from operations | ||||||||||||
Production costs | $ | 106,389 | $ | 83,318 | $ | 54,430 | ||||||
Add: Write-down of production inventories (cash portion) (see Note 5 - Inventories) | 2,323 | 1,016 | — | |||||||||
$ | 108,712 | $ | 84,334 | $ | 54,430 | |||||||
Cash margin from operations | ||||||||||||
$ | 79,430 | 61,058 | 49,678 | |||||||||
(1) This is a non-GAAP measure; refer to the Non-GAAP Performance Measures section of this MD&A for additional detail. | ||||||||||||
(2) Ounces delivered under the Gold Purchase Agreement do not result in cash revenue. | ||||||||||||
43
The above increases from 2014 to 2016 were offset by higher General and administrative, Exploration, and Development and projects costs (discussed in the Results of operations section). Net non-cash adjustments increased during 2016 and 2015 by $46.3 million and $(1.7) million, respectively, from the preceding years largely due to higher depreciation and depletion from increased long-lived assets in service and higher ounce sales. Cash impacts from working capital changes vary based on the timing of our accruals and sales of our production-related inventories.
Investing cash flows - The largest cash use in investing activities occurred during 2016 and 2014, in which cash outflows for acquisitions totaled $100.0 million and $57.7 million, respectively (see the Corporate developments section of this MD&A for detail). Expenditures on mineral properties, plant and equipment totaled $61.7 million, $36.6 million, and $7.9 million during 2016, 2015, and 2014, respectively. The following table summarizes our capital expenditures for 2016 (in thousands):
Year ended December 31, 2016 | |||||||||||||||||||||||||||
Fire Creek | Midas | True North | Hollister | Aurora | Corporate and other | Total | |||||||||||||||||||||
Mineral properties | $ | 777 | $ | 99 | $ | — | $ | — | $ | — | $ | — | $ | 876 | |||||||||||||
Land | 451 | — | 47 | — | — | — | 498 | ||||||||||||||||||||
Facilities and equipment | 1,304 | 4,888 | 5,581 | 808 | 615 | 1,433 | 14,629 | ||||||||||||||||||||
Mine development | 21,247 | 18,848 | 5,618 | — | — | — | 45,713 | ||||||||||||||||||||
$ | 23,779 | $ | 23,835 | $ | 11,246 | $ | 808 | $ | 615 | $ | 1,433 | $ | 61,716 | ||||||||||||||
Financing Cash Flows - Proceeds from the issuance of share capital, which generally included bought deal financings and option and warrant exercises, benefited our cash balances by $105.9 million, $24.5 million, and $65.0 million during 2016, 2015, and 2014, respectively, the proceeds of which were largely used to fund acquisitions (Hollister Acquisition in 2016 and Midas Acquisition in 2014) and retire existing debt (Senior Notes in 2015). Other financing cash flows are attributable to borrowings and repayments of debt agreements, except the Gold Purchase Agreement, which other than the cash proceeds received on the borrowing date does not result in subsequent cash outflows as repayments are made in gold ounce deliveries (see Note 8. Debt to the Notes to Consolidated Financial Statements for additional detail).
Foreign Currency Effect on Cash - A portion of our Cash and cash equivalents is held in bank accounts denominated in Canadian dollars. Generally speaking, when the US dollar strengthens against the Canadian dollar, we experience negative foreign currency translation adjustments on our Canadian dollar cash balances (the opposite is true when the Canadian dollar strengthens against the U.S. dollar). Changes in exchange rates resulted in decreases to our cash balances of $1.6 million, $3.0 million, and $1.0 million during 2016, 2015, and 2014, respectively.
44
Contractual obligations
The following table provides a listing of our significant contractual obligations as of December 31, 2016 (in thousands):
Payments due by period | ||||||||||||||||||||
Less than 1 year | 1-3 years | 3-5 years | More than 5 years | Total | ||||||||||||||||
Long-term debt obligations | ||||||||||||||||||||
Gold Purchase Agreement(1) | $ | 10,660 | $ | 10,949 | $ | — | $ | — | $ | 21,609 | ||||||||||
Interest on Gold Purchase Agreement(1) | 2,637 | 1,014 | — | — | 3,651 | |||||||||||||||
Revolver(2) | — | 12,000 | — | — | 12,000 | |||||||||||||||
Interest on Revolver(2) | 481 | 108 | — | — | 589 | |||||||||||||||
13,778 | 24,071 | — | — | 37,849 | ||||||||||||||||
Capital lease obligations | ||||||||||||||||||||
Capital lease obligations(3) | 479 | 589 | — | — | 1,068 | |||||||||||||||
Interest on capital lease obligations(3) | 30 | 17 | — | — | 47 | |||||||||||||||
509 | 606 | — | — | 1,115 | ||||||||||||||||
Other long-term liabilities | ||||||||||||||||||||
Asset retirement obligations(4) | — | — | — | 43,212 | 43,212 | |||||||||||||||
Total | $ | 14,287 | $ | 24,677 | $ | — | $ | 43,212 | $ | 82,176 | ||||||||||
(1) The Gold Purchase Agreement requires the physical delivery of gold ounces to satisfy principal and interest due, amounts are based on an amortization schedule established on the transaction date. See Note 8 - Debt for additional detail. | ||||||||||||||||||||
(2) Amounts reflect the repayment of principal drawn and related cash interest on the Revolver through its current maturity date of March 23, 2018. See Note 8 - Debt for additional detail. | ||||||||||||||||||||
(3) Represents cash principal and interest. See Note 8 - Debt for additional detail. | ||||||||||||||||||||
(4) Asset retirement obligations are related to our mining operations, projects, and exploration activities. Classification of such amounts is based on our current estimates of when reclamation work will be performed. Amounts represent undiscounted estimates and are not reflective of inflation or third-party profits which may be incurred if reclamation work is performed externally. See Note 9 - Asset retirement obligations for additional detail. | ||||||||||||||||||||
As of December 31, 2016, we did not have significant operating lease obligations or firm purchase obligations. In addition to the above, our mines and projects are subject to certain royalty commitments as disclosed in Note 24. Commitments and contingencies.
Debt covenants
Our debt agreements contain certain representations and warranties, restrictions, events of default, and covenants, for agreements of these types. Additionally, the Revolver contains financial covenants which require us to maintain a Tangible Net Worth not less than $100.0 million, a Gearing Ratio (a measure of debt to EBITDA) not greater than 4.00:1, a Cash Balance not less than $10.0 million, and a Current Ratio not less than 1.10:1 (as such terms are defined in the Revolver). The Company was in compliance with all debt covenants as of December 31, 2016 and 2015.
Off-Balance Sheet Arrangements
As of December 31, 2016, there were no significant off-balance sheet arrangements.
Non-GAAP performance measures
We have included the non-GAAP measures "Production cash costs per gold equivalent ounce sold" and "All-in costs per gold ounce sold" in this MD&A (collectively, the "Non-GAAP Measures"). These Non-GAAP Measures are used internally to assess our operating and economic performance and to provide key performance information to management. We believe that these Non-GAAP Measures, in addition to conventional measures prepared in accordance with GAAP, provide investors with an improved ability to evaluate our performance and ability to generate cash flows required to fund and sustain our business. These Non-GAAP Measures are intended to provide additional information and should not be considered in isolation or as a substitute for measures of performance prepared in accordance with GAAP. These Non-GAAP Measures do not have any standardized meaning prescribed under GAAP, and therefore may not be comparable to or consistent with measures used by other issuers or with amounts presented in our financial statements.
Our primary business is gold production and our current and future operations, development, exploration, and life-of-mine plans primarily focus on maximizing returns from such gold production. As a result, our Non-GAAP Measures are calculated and disclosed on a per gold or gold equivalent ounce basis.
45
Production cash costs per gold equivalent ounce sold
Production cash costs per gold equivalent ounce sold presents our cash costs associated with the production of gold equivalent ounces and, as such, non-cash depreciation and depletion charges are excluded. Production cash costs per gold equivalent ounce sold is calculated on a per gold equivalent ounce sold basis, and includes all direct and indirect operating costs related to the physical activities of producing gold, including mining, processing, third-party refining expenses, on-site administrative and support costs, royalties, and cash portions of net realizable value write-downs on production-related inventories (State of Nevada net proceeds and other such taxes are excluded). We believe that converting the benefits from selling silver ounces into gold ounces is helpful to analysts and investors as it best represents the way we operate, which is to maximize returns from gold production. Gold equivalent ounces are computed as the number of silver ounces required to generate the revenue derived from the sale of one gold ounce, using average realized selling prices (in thousands, except ounces sold and per ounce amounts):
Years ended December 31, | ||||||||||||||||||||
2016 | 2015 | 2014 | ||||||||||||||||||
Consolidated | Nevada Total(1) | True North | Total | Nevada Total(1) | Nevada Total(1) | |||||||||||||||
Average realized price per gold ounce sold | $ | 1,250 | $ | 1,164 | $ | 1,245 | $ | 1,156 | $ | 1,258 | ||||||||||
Average realized price per silver ounce sold | $ | 17.44 | $ | 16.41 | $ | 17.44 | $ | 15.72 | $ | 18.47 | ||||||||||
Silver ounces equivalent to revenue from one gold ounce | 71.7 | 70.9 | 71.4 | 73.6 | 68.1 | |||||||||||||||
Silver ounces sold | 1,470,139 | 853 | 1,470,992 | 1,708,548 | 1,117,288 | |||||||||||||||
GEOs from silver ounces sold | 20,504 | 12 | 20,602 | 23,214 | 16,407 | |||||||||||||||
Gold ounces sold | 130,500 | 8,016 | 138,516 | 110,058 | 73,100 | |||||||||||||||
Gold equivalent ounces | 151,004 | 8,028 | 159,118 | 133,272 | 89,507 | |||||||||||||||
Production costs | $ | 95,845 | $ | 10,544 | $ | 106,389 | $ | 83,318 | $ | 54,430 | ||||||||||
Add: Write-down of production inventories (cash portion) (see Note 5 - Inventories) | 405 | 1,918 | 2,323 | 1,016 | — | |||||||||||||||
$ | 96,250 | $ | 12,462 | $ | 108,712 | $ | 84,334 | $ | 54,430 | |||||||||||
Production cash costs per GEO sold | $ | 637 | $ | 1,552 | $ | 683 | $ | 633 | $ | 608 | ||||||||||
(1) During 2015 and 2014, production was only from Fire Creek and Midas. Details for Nevada are presented in the following table. | ||||||||||||||||||||
The following table presents a reconciliation of Fire Creek and Midas to the "Nevada Total" for the years 2016, 2015, and 2014 (in thousands, except ounces sold and per ounce amounts):
Years ended December 31, | ||||||||||||||||||||||||||||||||||||
2016 | 2015 | 2014 | ||||||||||||||||||||||||||||||||||
Nevada Total | Fire Creek | Midas | Nevada Total(1) | Fire Creek | Midas | Nevada Total(1) | Fire Creek | Midas | Nevada Total(1) | |||||||||||||||||||||||||||
Average realized price per gold ounce sold | $ | 1,250 | $ | 1,252 | $ | 1,250 | $ | 1,156 | $ | 1,156 | $ | 1,156 | $ | 1,261 | $ | 1,245 | $ | 1,258 | ||||||||||||||||||
Average realized price per silver ounce sold | $ | 17.00 | $ | 17.48 | $ | 17.44 | $ | 15.77 | $ | 15.71 | $ | 15.72 | $ | 18.32 | $ | 18.48 | $ | 18.47 | ||||||||||||||||||
Silver ounces equivalent to revenue from one gold ounce | 73.5 | 71.6 | 71.7 | 73.3 | 73.6 | 73.6 | 68.8 | 67.4 | 68.1 | |||||||||||||||||||||||||||
Silver ounces sold | 95,454 | 1,374,685 | 1,470,139 | 81,441 | 1,627,107 | 1,708,548 | 56,015 | 1,061,273 | 1,117,288 | |||||||||||||||||||||||||||
GEOs from silver ounces sold | 1,299 | 19,200 | 20,504 | 1,111 | 22,107 | 23,214 | 814 | 15,746 | 16,407 | |||||||||||||||||||||||||||
Gold ounces sold | 98,723 | 31,777 | 130,500 | 81,080 | 28,978 | 110,058 | 59,352 | 13,748 | 73,100 | |||||||||||||||||||||||||||
Gold equivalent ounces | $ | 100,022 | $ | 50,977 | $ | 151,004 | $ | 82,191 | $ | 51,085 | $ | 133,272 | $ | 60,166 | $ | 29,494 | $ | 89,507 | ||||||||||||||||||
Production costs | $ | 46,246 | $ | 49,599 | $ | 95,845 | $ | 37,394 | $ | 45,924 | $ | 83,318 | $ | 25,156 | $ | 29,274 | $ | 54,430 | ||||||||||||||||||
Add: Write-down of production inventories (cash portion) (see Note 5 - Inventories) | — | 405 | 405 | — | 1,016 | 1,016 | — | — | — | |||||||||||||||||||||||||||
$ | 46,246 | $ | 50,004 | $ | 96,250 | $ | 37,394 | $ | 46,940 | $ | 84,334 | $ | 25,156 | $ | 29,274 | $ | 54,430 | |||||||||||||||||||
Production cash costs per GEO sold | $ | 462 | $ | 981 | $ | 637 | $ | 455 | $ | 919 | $ | 633 | $ | 418 | $ | 993 | $ | 608 | ||||||||||||||||||
46
All-in costs per gold ounce sold
Our calculation of all-in costs per gold ounce sold is consistent with the June 2013 guidance released by the World Gold Council, a non-regulatory, non-profit market development organization for the gold industry. All-in costs per gold ounce sold reflect the varying costs of producing gold over the life-cycle of a mine or project, including costs required to discover and develop new sources of production; therefore, capital amounts related to expansion and growth projects are included.
All-in costs per gold ounce sold includes all: (1) direct and indirect operating cash costs related to the physical activities of producing gold, including mining, processing, third-party refining expenses, on-site administrative and support costs, royalties, and cash portions of net realizable value write-downs on production-related inventories (2) general and administrative expenses, (3) asset retirement and accretion expenses, and (4) capital expenditures, the total of which is reduced for revenues earned from silver sales. Certain cash expenditures, including State of Nevada net proceeds and other related taxes, federal tax payments, and financing costs are excluded (in thousands, except ounces sold and per ounce amounts):
Years ended December 31, | |||||||||||||||||||||||
2016 | 2015 | 2014 | |||||||||||||||||||||
Nevada Total(1) | True North | Hollister, Aurora, and Corporate | Total | Nevada Total(1) | Nevada Total(1) | ||||||||||||||||||
Production costs | $ | 95,845 | $ | 10,544 | $ | — | $ | 106,389 | $ | 83,318 | $ | 54,430 | |||||||||||
Add: Write-down of production inventories (cash portion) (see Note 5 - Inventories) | 405 | 1,918 | — | 2,323 | 1,016 | — | |||||||||||||||||
96,250 | 12,462 | — | 108,712 | 84,334 | 54,430 | ||||||||||||||||||
General and administrative | 15,804 | 12,375 | 8,818 | ||||||||||||||||||||
Exploration | 12,765 | 9,813 | 3,415 | ||||||||||||||||||||
Development and projects costs | 8,953 | — | 15,467 | ||||||||||||||||||||
Asset retirement and accretion | 2,653 | 871 | 628 | ||||||||||||||||||||
Expenditures on mineral properties, plant and equipment | 61,716 | 36,598 | 7,882 | ||||||||||||||||||||
Less: silver revenue | (25,660 | ) | (26,850 | ) | (20,639 | ) | |||||||||||||||||
All-in costs | 184,943 | 117,141 | 70,001 | ||||||||||||||||||||
Gold ounces sold | 130,500 | 8,016 | — | 138,516 | 110,058 | 73,100 | |||||||||||||||||
All-in costs per gold ounce sold | $ | 1,335 | $ | 1,064 | $ | 958 | |||||||||||||||||
(1) Nevada Total includes Fire Creek and Midas. During 2015 and 2014, production was only from Nevada. | |||||||||||||||||||||||
For a listing of our total capital expenditures see the Investing cash flows part of the Financial position, liquidity, and capital resources section.
Item 7A. Quantitative and Qualitative Disclosures About Market Risk
Metal price risk
During 2016, 2015, and 2014, 100% of our revenues were from the sale of gold and silver. Our financial results can vary significantly as a result of fluctuations in gold and silver prices. The price of gold and silver is volatile and is affected by many factors beyond our control, such as interest rates, inflation rates and expectations, speculation, currency values, central bank activities, governmental decisions regarding the disposal of precious metals stockpiles, global and regional demand and production, political and economic conditions, and other factors.
In order to increase the certainty of expected future cash flows, from time to time we may enter into fixed forward spot trades for a portion of our projected gold and silver sales. During the year ended December 31, 2016, we entered into forward trades which covered 109,140 gold ounces and 1,468,516 silver ounces at average prices of $1,244 and $16.54 per ounce, respectively, and outside of such, have not entered into any other significant forward trades. See Note 11. Derivatives to the Notes to Consolidated Financial Statements for additional detail.
As of December 31, 2016, we had no outstanding contracts in place to mitigate the risk of fluctuations in metal prices and therefore a substantial or extended decline in gold or silver prices would adversely impact our financial position, operating results, and cash flows.
In addition, as discussed in Note 8. Debt to the Notes to Consolidated Financial Statements, our Gold Purchase Agreement repayments are based on forward gold prices that existed at its transaction date (ranging from $1,290 to $1,388). Historically we have not entered into any financial instruments to manage differences in gold spot prices for physically delivered metal to the counterparty and; therefore, are subject to changes in spot gold prices relative to the transaction date forward gold prices encompassed in the Gold Purchase Agreement.
47
Interest rate risk
As discussed in Note 8. Debt to the Notes to Consolidated Financial Statements, our Revolver bears interest at LIBOR plus Margin plus Risk Premium, as such terms are defined in our secured revolving facility. LIBOR is a variable interest rate that is subject to change. We have not entered into any financial instruments to mitigate the risk of fluctuations in LIBOR or interest rates and; therefore, a substantial or extended increase to LIBOR could adversely impact our financial position, operating results, and cash flows.
Foreign currency exchange rate risk
We operate or have mining interests in Canada, which exposes us to risks associated with fluctuations in the exchange rates between the U.S. dollar and the Canadian dollar. Because the functional currency of our Canadian subsidiaries is Canadian dollars, we generate and use Canadian dollars and, as such, have not entered into any financial instruments to mitigate the risk of fluctuations in the foreign currency exchange rates. A substantial or extended fluctuation in the foreign currency exchange rate would adversely impact our financial position, operating results, and cash flows.
48
Item 8. Financial Statements and Supplementary Data
INDEX TO FINANCIAL STATEMENTS
Consolidated Financial Statements: | Page |
Report of Independent Registered Public Accounting Firm | |
Management’s Report on Internal Control over Financial Reporting | |
Consolidated Balance Sheets at December 31, 2016 and 2015 | |
Consolidated Statements of (Loss) Income for the Years Ended December 31, 2016, 2015, and 2014 | |
Consolidated Statements of Comprehensive (Loss) Income for the Years Ended December 31, 2016, 2015, and 2014 | |
Consolidated Statements of Cash Flows for the Years Ended December 31, 2016, 2015, and 2014 | |
Consolidated Statements of Shareholders’ Equity for the Years Ended December 31, 2016, 2015, and 2014 | |
Notes to Consolidated Financial Statements | |
49
Report of Independent Registered Public Accounting Firm
To the Shareholders of Klondex Mines Ltd.
We have audited the accompanying consolidated financial statements of Klondex Mines Ltd. which comprise the consolidated balance sheets as of December 31, 2016 and December 31, 2015 and the related consolidated statements of (loss) income, comprehensive (loss) income, cash flows and changes in shareholders’ equity for each of the years in the three-year period ended December 31, 2016, and the related notes, which comprise a summary of significant accounting policies and other explanatory information. Management is responsible for these consolidated financial statements. Our responsibility is to express an opinion on these consolidated financial statements based on our audits.
We conducted our audits in accordance with the standards of the Public Company Accounting Oversight Board (United States). Those standards require that we plan and perform the audit to obtain reasonable assurance about whether the consolidated financial statements are free of material misstatement. Our audits of the consolidated financial statements included examining, on a test basis, evidence supporting the amounts and disclosures in the consolidated financial statements, assessing the accounting principles used and significant estimates made by management, and evaluating the overall consolidated financial statement presentation. We were not engaged to perform an audit of the company’s internal control over financial reporting. Our audits included consideration of internal control over financial reporting as a basis for designing audit procedures that are appropriate in the circumstances, but not for the purpose of expressing an opinion on the effectiveness of the company’s internal control over financial reporting. Accordingly, we express no such opinion. Our audits also included performing such other procedures as we considered necessary in the circumstances. We believe that our audits provide a reasonable basis for our opinions.
In our opinion, the consolidated financial statements referred to above present fairly, in all material respects, the financial position of Klondex Mines Ltd. as of December 31, 2016 and December 31, 2015 and the results of its operations and its cash flows for each of the years in the three-year period ended December 31, 2016 in conformity with accounting principles generally accepted in the United States of America.
/s/ PricewaterhouseCoopers LLP
Chartered Professional Accountants
Vancouver, BC, Canada
March 23, 2017
50
Management’s Responsibility for Internal Control over Financial Reporting
The Company's management is responsible for establishing and maintaining adequate internal control over financial reporting as defined in Rule 13a - 15(f) and 15d - 15(f) of the Exchange Act and National Instrument 52-109 Certification of Disclosure on Issuers' Annual and Interim filings. Any system of internal control over financial reporting, no matter how well designed, has inherent limitations. Therefore, even those systems determined to be effective can provide only reasonable assurance with respect to financial statement preparation and presentation. Management has used the Committee of Sponsoring Organizations of the Treadway Commission in Internal Control - Integrated Framework (2013) to evaluate the effectiveness of the Company's internal control over financial reporting. Based on this assessment, management has concluded that as at December 31, 2016, the Company's internal control over financial reporting was not effective based on the material weakness relating to the calculation and presentation of our deferred tax assets and liabilities arising from the transition of the Company’s financial statements from International Financial Reporting Standards to US generally accepted accounting principles described in Item 9A.
/s/ Paul Andre Huet | /s/ Barry Dahl | |
Paul Andre Huet | Barry Dahl | |
President and Chief Executive Officer (Principal Executive Officer) | Chief Financial Officer (Principal Financial Officer) | |
51
Table of Contents
KLONDEX MINES LTD. CONSOLIDATED BALANCE SHEETS (US dollars in thousands) |
December 31, | ||||||||||
Note | 2016 | 2015 | ||||||||
Assets | ||||||||||
Current assets | ||||||||||
Cash and cash equivalents | $ | 47,636 | $ | 59,097 | ||||||
Trade receivables | — | 37 | ||||||||
Inventories | 5 | 21,310 | 16,070 | |||||||
Prepaid expenses and other | 6 | 4,678 | 7,055 | |||||||
Derivative assets | 11 | 1,247 | 1,466 | |||||||
Total current assets | 74,871 | 83,725 | ||||||||
Mineral properties, plant and equipment, net | 7 | 276,223 | 86,582 | |||||||
Derivative assets | 11 | 1,545 | 4,048 | |||||||
Restricted cash | 9 | 10,055 | 12,078 | |||||||
Deferred tax assets | 17 | 17,284 | 16,390 | |||||||
Total assets | $ | 379,978 | $ | 202,823 | ||||||
Liabilities | ||||||||||
Current liabilities | ||||||||||
Accounts payable | $ | 23,774 | $ | 12,635 | ||||||
Accrued compensation and benefits | 4,672 | 2,508 | ||||||||
Derivative liabilities | 11 | 1,721 | 1,176 | |||||||
Debt | 8 | 8,502 | 6,930 | |||||||
Interest payable | 23 | — | ||||||||
Provision for legal settlement | 24 | 3,000 | — | |||||||
Income taxes payable | — | 15 | ||||||||
Total current liabilities | 41,692 | 23,264 | ||||||||
Derivative liabilities | 11 | 331 | 1,599 | |||||||
Debt | 8 | 21,689 | 18,887 | |||||||
Deferred share units liability | 10 | 812 | — | |||||||
Asset retirement obligation | 9 | 25,436 | 12,387 | |||||||
Deferred tax liabilities | 17 | 11,964 | 3,580 | |||||||
Total liabilities | 101,924 | 59,717 | ||||||||
Shareholders' Equity | ||||||||||
Unlimited common shares authorized, no par value; 175,251,538 and 139,440,413 issued and outstanding at December 31, 2016 and 2015, respectively | — | — | ||||||||
Additional paid-in capital | 363,899 | 225,763 | ||||||||
Accumulated deficit | (58,280 | ) | (56,580 | ) | ||||||
Accumulated other comprehensive loss | (27,565 | ) | (26,077 | ) | ||||||
Total shareholders' equity | 278,054 | 143,106 | ||||||||
Total liabilities and shareholders' equity | $ | 379,978 | $ | 202,823 | ||||||
The accompanying notes are an integral part of the consolidated financial statements.
52
Table of Contents
KLONDEX MINES LTD. CONSOLIDATED STATEMENTS OF (LOSS) INCOME (US dollars in thousands, except per share amounts) |
Years ended December 31, | ||||||||||||||
Note | 2016 | 2015 | 2014 | |||||||||||
Revenues | 15 | $ | 198,175 | $ | 154,081 | $ | 112,622 | |||||||
Cost of sales | ||||||||||||||
Production costs | 106,389 | 83,318 | 54,430 | |||||||||||
Depreciation and depletion | 28,242 | 22,452 | 6,806 | |||||||||||
Write-down of production inventories | 5 | 2,869 | 1,201 | — | ||||||||||
60,675 | 47,110 | 51,386 | ||||||||||||
Other operating expenses | ||||||||||||||
General and administrative | 15,804 | 12,375 | 8,818 | |||||||||||
Exploration | 12,765 | 9,813 | 3,415 | |||||||||||
Development and projects costs | 8,953 | — | 15,467 | |||||||||||
Asset retirement and accretion | 2,653 | 871 | 628 | |||||||||||
Business acquisition costs | 4 | 2,253 | 328 | 2,042 | ||||||||||
Provision for legal settlement | 24 | 3,000 | — | — | ||||||||||
Loss on equipment disposal | 126 | 352 | — | |||||||||||
Income from operations | 15,121 | 23,371 | 21,016 | |||||||||||
Other income (expense) | ||||||||||||||
(Loss) gain on derivatives, net | 11 | (7,646 | ) | 3,367 | 7,088 | |||||||||
Interest expense, net | 8 | (5,339 | ) | (7,298 | ) | (8,344 | ) | |||||||
Foreign currency gain, net | 651 | 15,059 | 10,874 | |||||||||||
Loss on debt extinguishment | 8 | (519 | ) | (2,103 | ) | — | ||||||||
Interest income and other, net | 16 | (244 | ) | 119 | (795 | ) | ||||||||
Income before tax | 2,024 | 32,515 | 29,839 | |||||||||||
Income tax (expense)/benefit | 17 | (3,724 | ) | 11,738 | (2,955 | ) | ||||||||
Net (loss) income | $ | (1,700 | ) | $ | 44,253 | $ | 26,884 | |||||||
Net (loss) income per share | ||||||||||||||
Basic | 18 | $ | (0.01 | ) | $ | 0.33 | $ | 0.23 | ||||||
Diluted | 18 | $ | (0.01 | ) | $ | 0.32 | $ | 0.23 | ||||||
The accompanying notes are an integral part of the consolidated financial statements.
53
Table of Contents
KLONDEX MINES LTD. CONSOLIDATED STATEMENTS OF COMPREHENSIVE (LOSS) INCOME (US dollars in thousands) |
Years ended December 31, | ||||||||||||
2016 | 2015 | 2014 | ||||||||||
Net (loss) income | $ | (1,700 | ) | $ | 44,253 | $ | 26,884 | |||||
Other comprehensive (loss) income, net of tax | ||||||||||||
Foreign currency translation adjustments, net of tax benefits of $523, $5,129, and $2,826 for the years ended December 31, 2016, 2015, and 2014, respectively | (1,488 | ) | (14,598 | ) | (8,044 | ) | ||||||
Comprehensive (loss) income | $ | (3,188 | ) | $ | 29,655 | $ | 18,840 | |||||
The accompanying notes are an integral part of the consolidated financial statements.
54
Table of Contents
KLONDEX MINES LTD. CONSOLIDATED STATEMENTS OF CASH FLOWS (US dollars in thousands) |
Years ended December 31, | ||||||||||||||
Note | 2016 | 2015 | 2014 | |||||||||||
Operating activities | ||||||||||||||
Net (loss) income | $ | (1,700 | ) | $ | 44,253 | $ | 26,884 | |||||||
Significant items not involving cash | ||||||||||||||
Depreciation and depletion | 28,909 | 20,350 | 9,264 | |||||||||||
Asset retirement and accretion | 2,653 | 871 | 628 | |||||||||||
Derivative fair value adjustments | 2,155 | (4,427 | ) | (7,420 | ) | |||||||||
Write-down of production inventories | 5 | 546 | 185 | — | ||||||||||
Foreign exchange, net | (18 | ) | (13,617 | ) | (11,753 | ) | ||||||||
Deferred tax expense (benefit) | 17 | 251 | (14,905 | ) | 900 | |||||||||
Share-based compensation | 14 | 2,678 | 3,098 | 2,830 | ||||||||||
Deliveries under Gold Purchase Agreement(1) | (5,992 | ) | (3,752 | ) | (3,025 | ) | ||||||||
Loss on equipment disposal | 126 | 352 | — | |||||||||||
Write-off of unamortized debt issuance costs | 519 | 1,533 | — | |||||||||||
Deferred share unit expense | 10 | 839 | — | — | ||||||||||
Non-cash interest expense | 337 | — | — | |||||||||||
Provision for legal settlement | 24 | 3,000 | — | — | ||||||||||
34,303 | 33,941 | 18,308 | ||||||||||||
Changes in non-cash working capital | ||||||||||||||
Trade receivables | 37 | (37 | ) | — | ||||||||||
Inventories | (5,419 | ) | 3,822 | (16,191 | ) | |||||||||
Prepaid expenses and other | 3,006 | 26 | (4,052 | ) | ||||||||||
Accounts payable | 11,152 | 2,703 | 5,210 | |||||||||||
Accrued compensation and benefits | 2,183 | 792 | 1,114 | |||||||||||
Interest payable | 23 | — | — | |||||||||||
Income taxes payable | (15 | ) | — | — | ||||||||||
Net cash provided by operating activities | 45,270 | 41,247 | 4,389 | |||||||||||
Investing activities | ||||||||||||||
Expenditures on mineral properties, plant and equipment | (61,716 | ) | (36,598 | ) | (7,882 | ) | ||||||||
Change in restricted cash, net | 2,023 | 6,720 | (18,379 | ) | ||||||||||
Cash paid for acquisitions | 4 | (100,000 | ) | — | (57,749 | ) | ||||||||
Net cash used in investing activities | (159,693 | ) | (29,878 | ) | (84,010 | ) | ||||||||
Financing activities | ||||||||||||||
Issuance of share capital, net of costs | 13 | 105,890 | 24,468 | 64,973 | ||||||||||
Proceeds from Revolver draw | 8 | 12,000 | — | — | ||||||||||
Repayment of Secured Promissory Note | 8 | (12,000 | ) | — | — | |||||||||
Repayment of capital lease obligations | (450 | ) | — | — | ||||||||||
Payment of debt issuance costs | (832 | ) | — | (1,713 | ) | |||||||||
Repayment of Senior Notes | — | (19,196 | ) | — | ||||||||||
Proceeds from Gold Purchase Agreement | — | — | 32,592 | |||||||||||
Proceeds from Senior Notes | — | — | 22,645 | |||||||||||
Proceeds from gold royalty advance | — | — | 1,238 | |||||||||||
Repayment of other debt | — | — | (6,341 | ) | ||||||||||
Net cash provided by financing activities | 104,608 | 5,272 | 113,394 | |||||||||||
Effect of foreign exchange on cash balances | (1,646 | ) | (3,032 | ) | (986 | ) | ||||||||
Net (decrease) increase in cash | (11,461 | ) | 13,609 | 32,787 | ||||||||||
Cash, beginning of period | 59,097 | 45,488 | 12,701 | |||||||||||
Cash, end of period | $ | 47,636 | $ | 59,097 | $ | 45,488 | ||||||||
(1) Represents Revenue less Interest Expense attributable to the Gold Purchase Agreement. | ||||||||||||||
See Note 21. Supplemental cash flow information for additional details.
The accompanying notes are an integral part of the consolidated financial statements.
55
Table of Contents
KLONDEX MINES LTD. CONSOLIDATED STATEMENTS OF SHAREHOLDERS' EQUITY (US dollars in thousands, except shares) |
Note | Common shares | Additional paid-in capital | Accumulated deficit | Accumulated other comprehensive loss | Total | ||||||||||||||||
Balance at January 1, 2014 | 79,746,291 | $ | 122,448 | $ | (127,717 | ) | $ | (3,435 | ) | $ | (8,704 | ) | |||||||||
Share-based compensation expense | 14 | — | 2,830 | — | — | 2,830 | |||||||||||||||
Option exercises | 525,768 | 592 | — | — | 592 | ||||||||||||||||
Warrant exercises | 13 | 9,124,116 | 13,984 | — | — | 13,984 | |||||||||||||||
Common share awards granted | 483,025 | — | — | — | — | ||||||||||||||||
Warrants issued in Midas Acquisition | — | 5,896 | — | — | 5,896 | ||||||||||||||||
Warrants issued with Senior Notes | — | 2,050 | — | — | 2,050 | ||||||||||||||||
Common shares issued net of issuance costs | 13 | 37,450,000 | 50,397 | — | — | 50,397 | |||||||||||||||
Net income | — | — | 26,884 | — | 26,884 | ||||||||||||||||
Foreign currency translation adjustments | — | — | — | (8,044 | ) | (8,044 | ) | ||||||||||||||
Balance at December 31, 2014 | 127,329,200 | $ | 198,197 | $ | (100,833 | ) | $ | (11,479 | ) | $ | 85,885 | ||||||||||
Share-based compensation expense | 14 | — | 3,098 | — | — | 3,098 | |||||||||||||||
Option exercises | 2,707,703 | 3,173 | — | — | 3,173 | ||||||||||||||||
Warrant exercises | 13 | 1,990,760 | 2,656 | — | — | 2,656 | |||||||||||||||
Restricted share unit vestings | 12,750 | — | — | — | — | ||||||||||||||||
Common shares issued net of issuance costs | 13 | 7,400,000 | 18,639 | — | — | 18,639 | |||||||||||||||
Net income | — | — | 44,253 | — | 44,253 | ||||||||||||||||
Foreign currency translation adjustments | — | — | — | (14,598 | ) | (14,598 | ) | ||||||||||||||
Balance at December 31, 2015 | 139,440,413 | $ | 225,763 | $ | (56,580 | ) | $ | (26,077 | ) | $ | 143,106 | ||||||||||
Share-based compensation expense | 14 | — | 2,678 | — | — | 2,678 | |||||||||||||||
Option exercises | 14 | 5,037,369 | 6,840 | — | — | 6,840 | |||||||||||||||
Warrant exercises | 13 | 2,223,566 | 3,328 | — | — | 3,328 | |||||||||||||||
Common share awards forfeited | 14 | (62,499 | ) | — | — | — | — | ||||||||||||||
Restricted share unit vestings | 14 | 112,689 | — | — | — | — | |||||||||||||||
Common shares issued net of issuance costs | 13 | 25,900,000 | 95,722 | — | — | 95,722 | |||||||||||||||
Common shares and warrants issued in Hollister Acquisition | 13 | 2,600,000 | 29,568 | — | — | 29,568 | |||||||||||||||
Net (loss) | — | — | (1,700 | ) | — | (1,700 | ) | ||||||||||||||
Foreign currency translation adjustments | — | — | — | (1,488 | ) | (1,488 | ) | ||||||||||||||
Balance at December 31, 2016 | 175,251,538 | $ | 363,899 | $ | (58,280 | ) | $ | (27,565 | ) | $ | 278,054 | ||||||||||
The accompanying notes are an integral part of the consolidated financial statements.
56
Klondex Mines Ltd.
Notes to Consolidated Financial Statements
1. Company overview
Klondex Mines Ltd. (the "Company" or "Klondex") is a gold and silver mining company focused on mining, exploration, development, and production in a safe, environmentally-responsible, and cost-effective manner. The Company was incorporated on August 25, 1971 under the laws of British Columbia, Canada. Gold and silver sales represent 100% of the Company's revenues and the market prices of gold and silver significantly impact its financial position, operating results, and cash flows. The Company principally operates in Nevada, USA and Manitoba, Canada.
2. Summary of significant accounting policies
Basis of presentation
The Company's Consolidated Financial Statements have been prepared in accordance with generally accepted accounting principles in the United States ("US GAAP") and the following accounting policies have been consistently applied in such preparation. All amounts are expressed and presented in thousands of United States dollars (unless otherwise noted) and references to "CDN$" refer to Canadian dollars.
Transition from IFRS to US GAAP
In previous years, the Company prepared its financial statements in accordance with International Financial Reporting Standards ("IFRS") as permitted by securities regulators in Canada, as well as in the United States under the status of a Foreign Private Issuer as defined by the United States Securities and Exchange Commission (“SEC”). At the end of the second quarter of 2016, the Company determined that it no longer qualified as a Foreign Private Issuer under the SEC rules. As a result, beginning January 1, 2017, among other things, the Company is required to: (1) report to the SEC on domestic forms and comply with domestic company rules in the United States and (2) prepare its Consolidated Financial Statements in accordance with US GAAP, which requires the retrospective application of such accounting principles to the Company's records since inception, beginning with these Consolidated Financial Statements. Due to differences in accounting treatments between IFRS and US GAAP, amounts historically reported for the Company's financial position, operating results, and cash flows under IFRS changed from those which are currently reported under US GAAP in these Consolidated Financial Statements.
Principles of consolidation
The Consolidated Financial Statements include the accounts of Klondex Mines Ltd. and its wholly-owned subsidiaries. All intercompany balances and transactions have been eliminated.
Use of estimates
The preparation of the Consolidated Financial Statements requires management to make assumptions, estimates, and judgments that affect the amounts reported in these Consolidated Financial Statements and accompanying notes. The more significant areas requiring the use of management estimates and assumptions relate to estimates of mineral reserves that are the basis for future cash flow estimates utilized in impairment calculations and units of production amortization and depletion calculations; inputs related to impairment calculations; estimates of recoverable gold and silver ounces in production-related inventories; the net realizable value of production-related inventories; the useful lives of long-lived assets; asset retirement obligations and closure costs; deferred taxes and related valuation allowances; fair values of identifiable assets and liabilities in business combination allocations; and fair values of derivative financial instruments. The Company bases its estimates on historical experience and various assumptions that are believed to be reasonable at the time the estimate was made. Accordingly, actual results may differ from amounts estimated in these Consolidated Financial Statements and such differences could be material. The amounts presented in these Consolidated Financial Statements are not necessarily indicative of the results that may be expected for future years.
Foreign currency
The functional currency of Klondex Mines Ltd. and its Canadian subsidiaries is the Canadian dollar and the functional currency of its U.S. subsidiaries is the US dollar. Gains or losses resulting from measuring foreign currency transactions and balances into an entity's functional currency are recorded to profit or loss.
The Company's Consolidated Financial Statements are presented in U.S. dollars, which requires the translation of non-U.S. dollar amounts using period end exchange rates for assets and liabilities, weighted average exchange rates for income statement accounts, and historical exchange rates for equity accounts, with the resultant gain or loss from translation recorded to Foreign currency translation adjustments, which is a component of Accumulated other comprehensive loss.
57
Business combinations
The Company accounts for business combinations by allocating the purchase consideration transferred to the estimated fair values of identifiable assets acquired and liabilities assumed. During a measurement period, which is up to one year from the acquisition date, the Company may record adjustments to assets acquired and liabilities assumed if new information is obtained about facts and circumstances that existed as of the acquisition date that, if known, would have resulted in the recognition of those assets and liabilities as of that date. The Company did not experience any significant adjustments to assets acquired and liabilities assumed in business combinations during the years ended December 31, 2016, 2015, and 2014.
Cash and cash equivalents
Cash and cash equivalents are unrestricted as to use and consist of deposits and short term interest bearing accounts with original maturities of three months or less. The Company has not experienced any losses on cash balances and believes that no significant risk of loss exists with respect to its cash and cash equivalents as deposits are held with high-quality financial institutions. Restricted cash is excluded from Cash and cash equivalents and represents cash deposits which collateralize surety bonds associated with asset retirement obligations.
Trade receivables
Trade receivables consist of amounts due from customers for gold and silver sales and are collected within 12 months from the origination date.
Inventories
The Company's inventories include supplies inventory and the following production-related inventories: stockpiles, in-process, and doré finished goods, all of which are measured and carried at the lower of average cost or net realizable value. For production-related inventories, cost includes all mining, processing, and refining costs incurred during production stages, including allocations for mine site overhead, depreciation and depletion, and ore transport costs. Net realizable value is calculated as the estimated future sales price in the ordinary course of business using period-end metal prices less the estimated costs to convert the production-related inventories into a saleable product less estimated selling costs.
• | Stockpiles represent ore that has been brought to the surface from underground which requires further processing through a mill. Costs are transferred from Stockpiles to In-process at an average cost per unit. |
• | In-process inventory consists of ore being processed through the milling circuit in preparation for refining. Costs are transferred from In-process to Doré finished goods at an average cost per unit. |
• | Doré finished goods inventory consists of gold and silver bullion held at the refiner as well as Doré bars awaiting shipment to the refiner. Refined bullion meets the required market standards of 99.95% pure gold and 99.90% pure silver. Costs are transferred from Doré finished goods to Cost of sales at an average cost per unit as gold and silver is sold to customers. |
• | Supplies inventory consists of supplies and commodity consumables used in the mining, milling, and refining processes. |
As discussed in Note 5. Inventories, the Company's application of its lower of average cost or net realizable value accounting policy resulted in write-downs of production inventories. Write-downs decrease the carrying value of production-related inventories and the adjusted carry value is prospectively incorporated into inventory costing.
Mineral properties, plant and equipment, net
• | Facilities and equipment expenditures are capitalized and recorded at cost. Such costs are depreciated using either the straight-line method over the estimated productive lives of such assets or using the units-of-production method at rates sufficient to depreciate such costs over the estimated proven and probable reserves as gold and silver ounces are recovered. |
• | Mine development includes costs to build or construct shafts, drifts, and ramps which enable the Company to physically access ore, as well as drilling, engineering, metallurgical, and other related costs incurred to delineate or expand existing proven and probable reserves. Activities which are directed at converting non-reserve mineralization to proven and probable reserves, obtaining additional information on an ore body, or for infrastructure planning or condemnation activities are capitalized to mine development. Any of the above costs incurred at properties before mineralization is classified as proven and probable reserves are expensed as incurred to Development and projects costs. Drilling costs, such as exploration drilling, which do not occur within, or proximal to, an ore body where proven and probable reserves exist or support the metal production process are expensed as incurred to Exploration. |
Mine development costs are charged to cost of sales using the units-of-production depletion method based upon estimated recoverable ounces in proven and probable reserves. To the extent such capitalized costs benefit an entire ore body, they are amortized over the estimated recoverable ounces of that ore body. Capitalized costs that benefit specific ore structures or areas are depleted over the estimated recoverable ounces of that specific ore structure or area. Recoverable ounces are based upon proven and probable reserves and estimated metal recoveries associated with those reserves.
58
• | Mineral properties are recorded at cost and include payments related to the acquisition of mineral interests and the rights to extract minerals from properties, which are offset by any royalty obligations associated with the mineral property. Depending on the nature of the agreement, recurring cash royalty payments are expensed as incurred or recorded as prepaid or advanced minimum royalty payments. Mineral properties are generally the result of an acquisition or business combination and include value beyond proven and probable reserves, which represents the economic value that exists in a mining asset beyond the value attributable to proven and probable reserves. Mineral property costs associated with producing ore bodies are depleted using the units-of-production method based upon the estimated recoverable gold and silver ounces in such ore body's proven and probable reserves. In accordance with the Company's impairment policy, if a mineable ore body is not discovered or an ore body cannot be economically or legally developed, such capitalized costs are written off in the period in which it is determined the property has no future economic value. |
• | Asset retirement cost assets are the result of asset retirement obligations and are capitalized where mineralization is classified as proven and probable reserves and amortized or depleted on the same basis as the asset to which it relates. |
• | Construction in progress expenditures are capitalized and recorded at cost. Such assets are not depreciated or depleted until they are placed into service. |
Impairment of long-lived assets
The Company’s long-lived assets consist of mineral properties, plant and equipment. The Company reviews and evaluates its long-lived assets for recoverability annually and at interim periods if triggering events or changes in circumstances indicate that the related carrying amounts may not be recoverable. Events that may trigger a test for recoverability include significant adverse changes to projected revenues, increases in costs and capital expenditures, or future plans that may adversely impact the Company’s current or future operations and cash flows. In estimating future cash flows, assets are grouped at the lowest level of identifiable cash flows that are largely independent of future cash flows from other asset groups. Existing proven and probable reserves and value beyond proven and probable reserves, including mineralization other than proven and probable reserves are included in estimates of future cash flows. An impairment is determined to exist if the total projected future cash flows on an undiscounted pretax basis are less than the carrying amount of a long-lived asset or asset group. An impairment loss is measured using discounted cash flows and recorded based on the excess carrying value of the impaired long-lived asset over its estimated fair value.
The Company did not experience any impairments of long-lived assets during the years ended December 31, 2016, 2015, and 2014.
Asset retirement obligations
The Company’s mining and exploration activities are subject to various federal and state laws and regulations governing the protection of the environment. The Company’s asset retirement obligations (“AROs”), consist of estimated future mine reclamation and closure costs and may increase or decrease in the future as a result of changes in regulations, life of mine plans, estimates, or other factors. An ARO, which is initially estimated at fair value based on discounted cash flow estimates, is accreted to full value over time through charges to Accretion expense. Resultant ARO cost assets are depreciated or depleted in accordance with the Company's long-lived asset policies. ARO capital assets at properties where mineralization is not classified as proven and probable reserves are expensed to Asset retirement and accretion. The Company’s AROs are adjusted annually, or more frequently at interim periods if necessary, to reflect changes in estimates, circumstances, disturbances, timing, and inputs used to compute the underlying liability.
Derivative financial instruments
The Company recognizes all derivatives as either assets or liabilities and measures those instruments at fair value. Changes in the fair value of derivative instruments, together with gains or losses on derivative settlements and transactions, are recorded to (Loss) gain on derivatives, net. In estimating the fair value of derivative instruments, the Company applies judgments that are sensitive to assumptions regarding commodity prices, market volatilities, and gold production (see Note 11. Derivatives and Note 12. Fair value measurements).
Revenue recognition
Revenue from the sale of gold and silver is recognized when persuasive evidence of an arrangement exists, delivery has occurred, the price is fixed or determinable, no obligations remain, and collection is probable.
Revenue from the Company's Gold Purchase Agreement and Gold Offering Agreement (as both are later defined) is recognized at spot gold prices (see Note 8. Debt and Note 11. Derivatives). Revenue is only recognized for the aforementioned agreements when the Company delivers its own gold production to the counterparty.
Share-based compensation
The fair value of the estimated number of share-based awards expected to vest is recognized as share-based compensation expense within General and administrative over the applicable vesting period, with a corresponding increase to Additional paid-in capital. Share-based compensation expense related to awards with performance conditions is recognized over the performance period of the award while all other awards are recognized utilizing the graded vesting method. Share-based compensation awards that are forfeited before vesting result in the reversal of previously recognized expenses.
59
The fair value of stock options is determined using the Black-Scholes option pricing model with market related inputs as of the date of grant. The fair value of restricted share units and common share awards is the market value of the underlying shares on the date of grant. The fair value of restricted share units with performance-based vesting is determined using a Monte Carlo simulation model.
Income taxes
The Company uses an asset and liability approach which results in the recognition of deferred tax liabilities and assets for the expected future tax consequences or benefits of temporary differences between the financial reporting basis and the tax basis of assets and liabilities, as well as operating loss and tax credit carryforwards, using enacted tax rates in effect in the years in which the differences are expected to reverse.
In assessing the realizability of deferred tax assets, management considers whether it is more likely than not that some portion or all of its deferred tax assets will not be realized. Management considers the scheduled reversal of deferred tax liabilities, projected future taxable income and tax planning strategies in making this assessment. A valuation allowance has been provided for the portion of the Company’s net deferred tax assets for which it is more likely than not that they will not be realized.
3. Recent accounting pronouncements
Recently adopted
In April 2015, the Financial Accounting Standards Board ("FASB") issued ASU No. 2015-03, "Interest - Imputation of Interest - Simplifying the Presentation of Debt Issuance Costs." ASU No. 2015-03 simplifies the presentation of debt issuance costs and requires that debt issuance costs related to a recognized debt liability be presented in the balance sheet as a direct deduction from the carrying amount of that debt liability, which is consistent with the treatment of debt discounts. ASU No. 2015-03 is effective for fiscal years, and interim periods within those fiscal years, beginning on or after December 15, 2015, which for the Company meant the first quarter of the year ending December 31, 2016. In August 2015, the FASB issued ASU No. 2015-15, "Interest - Imputation of Interest", which allows for debt issuance costs associated with line-of-credit arrangements to be presented as an asset with the debt issuance costs being amortized ratably over the term of the line-of-credit arrangement, regardless of whether there are any outstanding borrowings on the line-of-credit. The Company has adopted ASU No. 2015-03 and ASU No. 2015-15, which other than presentation and disclosure changes, did not have a material impact on its Consolidated Financial Statements.
In September 2015, the FASB issued ASU No. 2015-16, "Simplifying the Accounting for Measurement-Period Adjustments." ASU No. 2015-16 requires that an acquirer recognize adjustments to provisional amounts identified during the measurement-period in the reporting period in which the adjustments are determined. This eliminates the requirement for an acquirer to retrospectively adjust financial statements for measurement-period adjustments determined in periods after a business combination is consummated. ASU No. 2015-16 was effective for fiscal years, including interim periods within those years, beginning after December 15, 2015, which for the Company meant the first quarter of the year ending December 31, 2016. The Company has adopted ASU No. 2015-16, which other than presentation and disclosure changes, did not have a material impact on its Consolidated Financial Statements.
In November 2015, the FASB issued ASU No. 2015-17 "Balance Sheet Classification of Deferred Taxes". ASU No. 2015-17 requires entities with classified balance sheets to report deferred tax assets and deferred tax liabilities as non-current. ASU No. 2015-17 is effective for fiscal years, and interim periods within those fiscal years, beginning after December 15, 2016, which for the Company means the first quarter of the year ending December 31, 2017. The Company has early adopted ASU No. 2015-17, which other than presentation and disclosure changes, did not have a material impact on its Consolidated Financial Statements.
Recently issued
In May 2014, the FASB issued ASU No. 2014-09, “Revenue from Contracts with Customers”, which has been amended several times. The new standard provides a five-step approach to be applied to all contracts with customers and also requires expanded disclosures surrounding revenue recognition. ASU No. 2014-09 is effective for fiscal years, and interim periods within those years, beginning on or after December 15, 2017, which for the Company means the first quarter of the year ending December 31, 2018. The Company has evaluated the impacts of ASU No. 2014-09 and does not expect it will have a material impact on its Consolidated Financial Statements.
In February 2016, the FASB issued ASU No. 2016-02, "Leases." ASU No. 2016-02 requires lessees to recognize assets and liabilities on the balance sheet for the rights and obligations resulting from leases. ASU No. 2016-02 is effective for fiscal years beginning after December 15, 2019 and for interim periods within fiscal years beginning after December 15, 2020. The Company is currently evaluating the impact that ASU No. 2016-02 will have on its Consolidated Financial Statements.
In March 2016, the FASB issued ASU No. 2016-09, "Compensation - Stock Compensation - Improvements to Employee Share-Based Payment Accounting." ASU No. 2016-09 simplifies several aspects of the accounting for share-based payment transactions, including the income tax consequences, classification of awards as either equity or liabilities, an accounting policy election for forfeitures, and classification on the statement of cash flows. ASU No. 2016-09 is effective for fiscal years, and interim periods within those fiscal years, beginning after December 15, 2016, which for the Company means the first quarter of the year ending December 31, 2017. The Company is currently evaluating the impact that ASU No. 2016-09 will have on its Consolidated Financial Statements.
60
In August 2016, the FASB issued ASU No. 2016-15, "Statement of Cash Flows - Classification of Certain Cash Receipts and Cash Payments." ASU No. 2016-15 addresses eight specific cash flow issues with the objective of reducing the diversity in practice in how certain cash receipts and cash payments are presented and classified in the statement of cash flows. ASU No. 2016-15 is effective for fiscal years, and interim periods within those fiscal years, beginning after December 15, 2017, which for the Company means the first quarter of the year ending December 31, 2018. The Company is currently evaluating the impact that ASU No. 2016-15 will have on its Consolidated Financial Statements.
In November 2016, the FASB issued ASU No. 2016-18, "Statement of Cash Flows - Restricted Cash." ASU No. 2016-18 requires that restricted cash or restricted cash equivalents be included with cash and cash equivalents when reconciling the beginning-of-period and end-of-period total amounts shown on the statement of cash flows. ASU No. 2016-18 is effective for fiscal years, and interim periods within those fiscal years, beginning after December 15, 2017, which for the Company means the first quarter of the year ending December 31, 2018. The Company is currently evaluating the impact that ASU No. 2016-18 will have on its Consolidated Financial Statements.
4. Business combinations
Hollister and Aurora acquisition
On October 3, 2016, the Company acquired all of the membership interests of Carlin Resources, LLC, the entity that owned, among other assets, the Hollister mine and the Aurora mine and ore milling complex (formerly known as the Esmeralda mine and ore milling complex) located in Nevada (the "Hollister Acquisition"). The Hollister Acquisition was carried out pursuant to the terms of a membership interest purchase agreement dated July 25, 2016, among Klondex, Klondex Holdings (USA) Inc., an indirect wholly-owned subsidiary of the Company, Waterton Nevada Splitter, LLC ("Waterton Splitter") and Waterton Precious Metals Fund II Cayman, LP, as assigned by Klondex USA to Klondex Schuma Holdings LLC ("Klondex Schuma"), an indirect wholly-owned subsidiary of the Company.
The Hollister Acquisition consideration included: (i) the payment by Klondex Schuma to Waterton Splitter of $80.0 million in cash; (ii) the issuance by the Company to Waterton Splitter of 5,000,000 common share purchase warrants (the "Consideration Warrants"), which Consideration Warrants have a 15 ½ year term, are exercisable commencing on April 3, 2017, have an exercise price equal to CDN$6.00 and include a forced conversion provision that requires the holder to convert the Consideration Warrants if the common shares trade at or above a 100% premium to the CDN$6.00 exercise price of the Consideration Warrants for 60 consecutive trading days on the market on which the common shares primarily trade; and (iii) the issuance by the Company to Waterton Splitter of 2,600,000 common shares.
The $80.0 million cash portion of the Hollister Acquisition was financed with the net proceeds from an equity offering (see Note 13. Share capital).
The Company accounted for the Hollister Acquisition as a business combination and allocated the purchase consideration transferred to the fair value of identifiable assets and liabilities acquired, as shown below (in thousands):
Purchase consideration: | Note | Amount | ||||
Cash | $ | 80,000 | ||||
Warrants(1) | 13 | 17,774 | ||||
Common shares(2) | 11,794 | |||||
$ | 109,568 | |||||
Assets and liabilities acquired: | ||||||
Mineral properties | $ | 111,256 | ||||
Facilities and equipment | 11,686 | |||||
Land | 416 | |||||
Supplies inventories | 349 | |||||
Prepaid expenses and other | 258 | |||||
Asset retirement obligation | 9 | (7,158 | ) | |||
Deferred tax liability | (7,239 | ) | ||||
$ | 109,568 | |||||
(1) Fair value was determined using a Monte Carlo methodology. Refer to Note 13. Share Capital. | ||||||
(2) Fair value is inclusive of a $2.9 million marketability discount for a 23 month restriction period on disposal of the common shares. | ||||||
61
True North acquisition
On January 22, 2016, the Company acquired the True North (formerly known as Rice Lake) mine and mill complex located near Bissett, Manitoba, Canada for $32.0 million (the "True North Acquisition"), which was carried out pursuant to the terms of an asset purchase agreement dated December 16, 2015 among Klondex Mines Ltd., its wholly-owned subsidiary, Klondex Canada Ltd. ("Klondex Canada") and the vendor, 7097914 Manitoba Ltd. (formerly Shoreline Gold Inc.). The purchase price of $32.0 million was satisfied by $20.0 million in cash paid at closing and $12.0 million in deferred payments in the form of a promissory note to the vendor with an annual interest rate of 4.0% (the "Promissory Note") (see Note 8. Debt).
The Company accounted for the True North Acquisition as a business combination and allocated the purchase consideration transferred to the fair value of identifiable assets and liabilities acquired, as shown below (in thousands):
Purchase consideration: | Note | Amount | ||||
Cash | $ | 20,000 | ||||
Promissory note(1) | 8 | 11,100 | ||||
$ | 31,100 | |||||
Assets and liabilities acquired: | ||||||
Mineral properties | $ | 15,721 | ||||
Facilities and equipment | 16,870 | |||||
Prepaid expenses and other | 302 | |||||
Asset retirement obligation | 9 | (1,793 | ) | |||
$ | 31,100 | |||||
(1) The fair value of the $12.0 million Promissory Note (purchase consideration) was calculated at $11.1 million, resulting in a $0.9 million issuance discount. | ||||||
Midas acquisition
On February 11, 2014, the Company acquired all of the outstanding shares of Newmont Midas Holdings Limited, which indirectly owned Midas, from Newmont USA Limited, a subsidiary of Newmont Mining Corporation (the “Midas Acquisition”). The aggregate purchase consideration transferred totaled approximately $63.6 million, comprised of $57.7 million of cash and 5,000,000 common share purchase warrants which were valued at $5.9 million. In addition, the Company was required to deposit $28.6 million of Restricted cash to collateralize surety bonds for Midas's asset retirement obligation.
The $57.7 million cash portion of the purchase consideration for the Midas Acquisition was financed with the net proceeds from a private placement (see Note 13. Share capital), a Gold Purchase Agreement (see Note 8. Debt), a net smelter royalty agreement (see Note 24. Commitments and contingencies), and the issuance of senior notes (see Note 8. Debt).
The Company accounted for the Midas Acquisition as a business combination and allocated the purchase consideration transferred to the fair value of identifiable assets and liabilities acquired, as shown below (in thousands):
Purchase price: | Note | Amount | ||||
Cash | $ | 57,749 | ||||
Warrants | 13 | 5,896 | ||||
$ | 63,645 | |||||
Net assets acquired: | ||||||
Facilities and equipment | $ | 47,546 | ||||
Mineral properties | 23,151 | |||||
Prepaid expenses and other | 2,743 | |||||
Supplies inventories | 1,941 | |||||
Asset retirement obligation | (10,541 | ) | ||||
Deferred tax liability | (1,195 | ) | ||||
$ | 63,645 | |||||
62
Pro-Forma financial information
Other than for Revenues, it was impracticable for the Company to present certain pro-forma disclosures for the aforementioned business combinations as: 1) the historical information was not available for the requisite periods, 2) the historical information, when available, was prepared on a basis other than US GAAP, and 3) the Company would have been required to make significant assumptions and estimates around historical adjustments which could not be independently substantiated. Generally speaking, revenue recognition in the gold mining industry is consistent between US GAAP and IFRS and, as such, the Company was able to reasonably estimate pro-forma disclosures for this line item using the available information. The following table presents an unaudited pro-forma summary of the Company's Revenues for the years ended December 31, 2016, 2015, and 2014 as if the respective acquisitions had occurred on January 1, 2014 (in thousands):
Years ended December 31, | ||||||||||||
2016 | 2015 | 2014 | ||||||||||
Revenues | $ | 198,175 | $ | 154,081 | $ | 112,622 | ||||||
Pro-forma adjustments: | ||||||||||||
Hollister Acquisition | — | — | 2,995 | |||||||||
True North Acquisition | — | 11,345 | 53,466 | |||||||||
Midas Acquisition | — | — | — | |||||||||
$ | 198,175 | $ | 165,426 | $ | 169,083 | |||||||
The above unaudited pro-forma Revenues are presented for informational purposes only and are not indicative of the actual amounts had the transaction occurred on the assumed date, nor are they an indication of trends in future results for a number of reasons, including, but not limited to, differences between the assumptions used to prepare the pro-forma information.
5. Inventories
The following table provides the components of Inventories (in thousands):
December 31, | ||||||||
2016 | 2015 | |||||||
Supplies | $ | 5,541 | $ | 3,290 | ||||
Production related inventories: | ||||||||
Stockpiles | 6,604 | 5,745 | ||||||
In-process | 7,316 | 3,826 | ||||||
Doré finished goods | 1,849 | 3,209 | ||||||
$ | 21,310 | $ | 16,070 | |||||
As of December 31, 2016 and 2015, the Company's stockpiles, in-process, and doré finished goods inventories included approximately $2.0 million and $1.8 million, respectively, of capitalized non-cash depreciation and depletion costs.
Write-down of production inventories
As discussed in Note 2. Summary of significant accounting policies, the period-end market value of the Company's production-related inventories is determined in part by using the period-end prices per gold and silver ounce and is sensitive to these inputs. Due to lower period-end metal price levels and increases in production costs, the Company's application of its lower of average cost or net realizable value resulted in write-downs of production inventories. Write-downs have resulted solely from the Company's application of its lower of average cost or net realizable value accounting policy and were unrelated to any ounce adjustments or changes to recovery rates. Write-downs for the year ended December 31, 2016 were related to Midas and True North, while write-downs for the year ended December 31, 2015 were related to Midas.
63
The following table provides information about the Company's write-downs (in thousands, except per ounce amounts):
Years ended December 31, | ||||||||||||
Type of previously incurred cost | 2016 | 2015 | 2014 | |||||||||
Cash production costs | $ | 2,323 | $ | 1,016 | $ | — | ||||||
Allocated depreciation and depletion | 546 | 185 | — | |||||||||
Write-down of production inventories | $ | 2,869 | $ | 1,201 | $ | — | ||||||
Period-end prices used in write-down calculation | ||||||||||||
Price per gold ounce | $ | 1,159 | $ | 1,062 | $ | 1,199 | ||||||
Price per silver ounce | $ | 16.24 | $ | 13.82 | $ | 15.97 | ||||||
Further declines from December 31, 2016 metal price levels and/or future production costs greater than the December 31, 2016 carrying value included in Inventories could result in, or contribute to, additional future write-downs of production-related inventories.
6. Prepaid expenses and other
The following table provides the components of Prepaid expenses and other (in thousands):
December 31, | ||||||||
2016 | 2015 | |||||||
Prepaid taxes | $ | 1,390 | $ | 5,085 | ||||
Prepaid claim maintenance and land holding costs | 1,012 | 589 | ||||||
Prepaid insurance | 497 | 389 | ||||||
Utilities, rent, and service deposits | 178 | — | ||||||
Other | 1,601 | 992 | ||||||
$ | 4,678 | $ | 7,055 | |||||
7. Mineral properties, plant and equipment, net
The following table provides the components of Mineral properties, plant and equipment, net (in thousands):
December 31, | ||||||||
2016 | 2015 | |||||||
Mineral properties | $ | 163,012 | $ | 27,444 | ||||
Facilities and equipment | 97,054 | 57,439 | ||||||
Mine development | 54,070 | 24,241 | ||||||
Land | 3,828 | 2,253 | ||||||
Asset retirement cost assets(1) | 2,887 | 1,551 | ||||||
Construction in progress | 16,472 | 5,632 | ||||||
337,323 | 118,560 | |||||||
Less: accumulated depreciation and depletion | (61,100 | ) | (31,978 | ) | ||||
$ | 276,223 | $ | 86,582 | |||||
(1)Asset retirement cost assets relate to increases in asset retirement obligations at sites with proven and probable reserves. | ||||||||
Facilities and equipment included $1.5 million and $1.4 million at December 31, 2016 and 2015, respectively, for the gross amount of mobile mine equipment acquired under capital lease obligations. Accumulated depreciation on such mobile mine equipment totaled $0.5 million and nil at December 31, 2016 and 2015, respectively.
At December 31, 2016, construction in progress of $16.5 million included $9.1 million of mine development, $6.4 million related to facilities and equipment, and $1.0 million of other.
64
8. Debt
The following table summarizes the components of Debt (in thousands):
December 31, | ||||||||
2016 | 2015 | |||||||
Debt, current: | ||||||||
Gold Purchase Agreement | $ | 8,023 | $ | 6,490 | ||||
Capital lease obligations | 479 | 440 | ||||||
$ | 8,502 | $ | 6,930 | |||||
Debt, non-current: | ||||||||
Revolver(1) | $ | 11,165 | $ | — | ||||
Gold Purchase Agreement | 9,935 | 17,958 | ||||||
Capital lease obligations | 589 | 929 | ||||||
$ | 21,689 | $ | 18,887 | |||||
(1) Net of unamortized issuance costs of $0.8 million. | ||||||||
The following table summarizes the components of Interest expense, net (in thousands):
Years ended December 31, | ||||||||||||
2016 | 2015 | 2014 | ||||||||||
Gold Purchase Agreement | $ | 3,989 | $ | 4,884 | $ | 5,302 | ||||||
Promissory Note | 824 | — | — | |||||||||
Revolver interest and stand-by fees | 577 | — | — | |||||||||
Capital lease obligations | 47 | — | — | |||||||||
Senior Notes | — | 2,296 | 3,111 | |||||||||
Other | 175 | 118 | (69 | ) | ||||||||
Less: capitalized interest | (273 | ) | — | — | ||||||||
$ | 5,339 | $ | 7,298 | $ | 8,344 | |||||||
Revolver
On March 23, 2016, the Company, as borrower, entered into a $25.0 million secured revolving facility agreement (the "Revolver") with Investec Bank PLC ("Investec"), as lender and security agent, which was amended on October 27, 2016 to increase the borrowing capacity by $10.0 million to $35.0 million. During the year ended December 31, 2016, the Company drew $12.0 million from the Revolver to retire the Promissory Notes. Borrowings under the Revolver bear interest per annum at LIBOR plus Margin plus Risk Premium, as such terms are defined in the Revolver. Margin is determined by the Company's Gearing Ratio (a measure of debt to EBITDA) and ranges from 2.75%-4.00% per annum and the Risk Premium is 0.35% per annum, until the Gold Purchase Agreement balance is less than $10.0 million, at which time the Risk Premium is no longer applicable (as such terms are defined in the Revolver). Revolver borrowings may be utilized by the Company for working capital requirements, general corporate purposes, and capital investments and expenditures.
The Revolver's maturity date is March 23, 2018, unless otherwise extended by the Company and Investec, and is secured by all of the Company's assets on a pari passu basis with the Gold Purchase Agreement.
Gold Purchase Agreement
The Company's February 2014 gold purchase agreement with a subsidiary of Franco-Nevada Corporation (the "Gold Purchase Agreement") requires physical gold deliveries to be made at the end of each month, each of which reduces the Gold Purchase Agreement balance and accrued interest. The repayment amortization schedule was established on the transaction date and incorporates then current forward gold prices (ranging from $1,290 to $1,388) and an effective interest rate of approximately 18.3%. Gold deliveries will cease on December 31, 2018 following the delivery of 38,250 gold ounces. The Gold Purchase Agreement is secured by all the Company's assets on a pari passu basis with the Revolver.
During the years ended ended December 31, 2016 and 2015, the Company delivered 8,000 and 7,500 gold ounces, respectively, under the Gold Purchase Agreement. The Company is required to deliver 2,000 gold ounces per quarter (8,000 gold ounces per year) during fiscal years 2017 and 2018.
65
Capital lease obligations
The Company's capital lease obligations are for the purchase of mobile mine equipment and passenger vehicles, bear interest at approximately 4.0% per annum, and carry 36-month terms. The Company's capital lease obligations are secured by the underlying assets financed.
Secured Promissory Note
In conjunction with its January 22, 2016 acquisition of True North (see Note 4. Business combinations), the Company entered into a $12.0 million promissory note to the vendor with an annual interest rate of 4.0% (previously defined as the "Promissory Note"). The Promissory Note required principal repayments of $4.0 million in each of the next three years on the anniversary of the closing date. Interest payments were due monthly. In the fourth quarter of 2016, the Company repaid the entire principal amount of the Promissory Note without penalty and recorded a $0.5 million Loss on debt extinguishment for the unamortized issuance discount.
Senior Notes
In conjunction with the Midas Acquisition, the Company issued CDN$25.0 million of 11.0% senior secured notes due August 11, 2017 (the "Senior Notes"). During the third quarter of 2015, following a September 2015 public offering (as discussed in Note 13. Share capital) and pursuant to an option of the Company, the $16.8 million outstanding principal balance of the Senior Notes was repaid and a Loss on debt extinguishment of $2.1 million was recorded for a 4% prepayment penalty and the write off of unamortized issuance costs.
Debt covenants
The Company's debt agreements contain certain representations and warranties, restrictions, events of default, and covenants that are customary for agreements of these types. Additionally, the Revolver contains financial covenants which require the Company to maintain a Tangible Net Worth not less than $100.0 million, a Gearing Ratio (a measure of debt to EBITDA) not greater than 4.00:1, a Cash Balance not less than $10.0 million, and a Current Ratio not less than 1.10:1 (as such terms are defined in the Revolver). The Company was in compliance with all debt covenants as of December 31, 2016 and 2015.
Future debt repayments
The following table provides a summary by year of the remaining future scheduled debt repayments (in thousands):
Fiscal Year: | Capital leases | Gold Purchase Agreement | Revolver | Total | ||||||||||||
2017 | $ | 510 | $ | 10,660 | $ | — | $ | 11,170 | ||||||||
2018 | 524 | 10,949 | 12,589 | 24,062 | ||||||||||||
2019 | 39 | — | — | 39 | ||||||||||||
2020 | 39 | — | — | 39 | ||||||||||||
2021 | 3 | — | — | 3 | ||||||||||||
Less: Interest and amortization of issuance costs | (47 | ) | (3,651 | ) | (1,424 | ) | (5,122 | ) | ||||||||
Principal portion of payments | $ | 1,068 | $ | 17,958 | $ | 11,165 | $ | 30,191 | ||||||||
66
9. Asset retirement obligations
The Company’s asset retirement obligations are related to its mining operations, projects, and exploration activities. The Company's asset retirement obligations are estimated based upon present value techniques using market participant assumptions of expected cash flows, estimates of inflation, and a credit adjusted risk-free discount rate. Year-end carrying values incorporate a weighted-average discount rate of 6.9% for 2016 and 2.3% for 2015 as well as an inflation rate of approximately 2.0% for both years. The following table provides a summary of changes in the asset retirement obligation (in thousands):
December 31, | ||||||||||
Note | 2016 | 2015 | ||||||||
Balance, beginning of year | $ | 12,387 | $ | 12,032 | ||||||
Changes in estimates | 2,866 | (516 | ) | |||||||
Accretion expense | 1,122 | 871 | ||||||||
Additions resulting from Hollister Acquisition - Hollister | 4 | 4,481 | — | |||||||
Additions resulting from Hollister Acquisition - Aurora | 4 | 2,677 | — | |||||||
Additions resulting from True North Acquisition | 4 | 1,793 | — | |||||||
Effect of foreign currency | 110 | — | ||||||||
Balance, end of year | $ | 25,436 | $ | 12,387 | ||||||
As of December 31, 2016, the Company's asset retirement obligations were secured by surety bonds totaling $48.2 million, which were partially collateralized by Restricted cash totaling $10.0 million. During the years ended December 31, 2016, 2015, and 2014, the Company reduced (increased) the amounts of restricted cash collateralizing the surety bonds by $2.0 million, $6.7 million, and $(18.4) million, respectively.
The following table provides a listing of the Company's asset retirement obligations by property (in thousands):
December 31, | ||||||||
2016 | 2015 | |||||||
Midas | $ | 12,616 | $ | 9,748 | ||||
Hollister | 6,110 | — | ||||||
Aurora | 2,741 | — | ||||||
Fire Creek | 2,303 | 2,639 | ||||||
True North | 1,666 | — | ||||||
$ | 25,436 | $ | 12,387 | |||||
10. Deferred share units liability
In May 2016, the Board of Directors adopted the Deferred Share Unit Plan (the "DSU Plan") to: (1) assist the Company in the recruitment and retention of qualified non-employee directors and (2) further align the interests of directors with shareholders. The DSU Plan is administered by the Compensation and Governance Committee of the Board of Directors of the Company. Under the DSU Plan, non-employee directors may receive a portion of their annual compensation in the form of Deferred Share Units ("DSUs"). The value of a DSU is determined as the weighted average closing price of the Company's common shares for the five days preceding such valuation date (the "DSU Value"). DSUs are fully vested at the time of grant and are retained until a director is separated or terminated from the Board of Directors of the Company, at which time the number of DSUs credited to such director's account multiplied by the DSU Value is to be paid out in cash. In the event the Company pays cash dividends additional DSUs are to be credited to each director's account in an amount equal to the cash value that would have been received by the directors had the DSUs been held as common shares of the Company divided by the DSU Value. DSUs have no voting rights.
The fair value of DSUs granted each year, together with the change in fair value of all outstanding DSUs, is recorded within General and administrative and totaled $0.8 million during the year ended December 31, 2016.
67
The following table provides a summary of the Company's outstanding DSUs:
Year ended December 31, 2016 | |||
Outstanding at beginning of year | — | ||
Granted | 180,183 | ||
Redeemed | — | ||
Outstanding at end of period | 180,183 | ||
11. Derivatives
The following table provides a listing of the Company's derivative instruments (in thousands):
December 31, | ||||||||||
Description | Recorded Within | 2016 | 2015 | |||||||
Gold Purchase Agreement embedded derivative | Derivative assets, current | $ | 1,247 | $ | 1,466 | |||||
Gold Purchase Agreement embedded derivative | Derivative assets, non-current | 1,545 | 4,048 | |||||||
$ | 2,792 | $ | 5,514 | |||||||
Gold Offering Agreement | Derivative liabilities, current | $ | 1,721 | $ | 1,176 | |||||
Gold Offering Agreement | Derivative liabilities, non-current | 331 | 1,599 | |||||||
$ | 2,052 | $ | 2,775 | |||||||
The following table lists the net amounts recorded for (Loss) gain on derivatives, net (in thousands):
Years ended December 31, | ||||||||||||
2016 | 2015 | 2014 | ||||||||||
Gold Purchase Agreement embedded derivative | $ | (2,167 | ) | $ | 3,243 | $ | 3,789 | |||||
Gold Offering Agreement | (1,115 | ) | 124 | 3,299 | ||||||||
Forward metal sales | (3,682 | ) | — | — | ||||||||
Currency swap | (682 | ) | — | — | ||||||||
$ | (7,646 | ) | $ | 3,367 | $ | 7,088 | ||||||
Gold Purchase Agreement embedded derivative
The Company's Gold Purchase Agreement (as defined and discussed in Note 8. Debt) contains an embedded compound derivative for the: 1) prepayment option, which is at the discretion of the Company, and 2) the forward sales component, which was established on the transaction date and incorporates the then current forward gold prices. In addition to recurring fair value adjustments, gains and losses on the Gold Purchase Agreement's embedded derivative relate to the difference in the forward gold price received by the Company and the spot price of gold on each delivery date. The following table summarizes information about past and future gold deliveries under the Gold Purchase Agreement:
Outstanding Future Deliveries | Years ended December 31, | |||||||||||||||||||
2018 | 2017 | 2016 | 2015 | 2014 | ||||||||||||||||
Gold ounces delivered | 8,000 | 8,000 | 8,000 | 7,500 | 6,750 | |||||||||||||||
Average forward gold price received | $ | 1,369 | $ | 1,333 | $ | 1,308 | $ | 1,296 | $ | 1,291 | ||||||||||
Average gold spot price on delivery date | n/a | n/a | $ | 1,248 | $ | 1,152 | $ | 1,234 | ||||||||||||
Gold Offering Agreement
In March 2011, the Company entered into a gold offering agreement, as amended in October 2011, (the "Gold Offering Agreement") which granted the counterparty the right to purchase, on a monthly basis, the refined gold produced from the Fire Creek mine for a five-year period which began in February 2013 and ends in February 2018. When/if the counterparty elects to purchase the refined gold, the purchase price is calculated as the average PM settlement price per gold ounce on the London Bullion Market Association for the 30 trading days immediately preceding the relevant purchase election date. A 1.0% discount was applicable through February
68
29, 2016 and no longer exists. In addition to recurring fair value adjustments, gains and losses on the Gold Offering Agreement relate to: 1) the difference in the gold price paid to the Company from the counterparty and the spot price of gold on the applicable delivery date and 2) losses incurred by the Company to net cash settle any obligations arising from the Gold Offering Agreement. The following table summarizes information about gold purchased under the Gold Offering Agreement:
Years ended December 31, | ||||||||||||
2016 | 2015 | 2014 | ||||||||||
Gold ounces purchased by counterparty | 48,957 | 36,066 | 27,528 | |||||||||
Average gold price paid to the Company | $ | 1,214 | $ | 1,146 | $ | 1,266 | ||||||
Average gold spot price on delivery date | $ | 1,247 | $ | 1,187 | $ | 1,293 | ||||||
Forward metal sales
In order to increase the certainty of expected future cash flows, from time to time the Company enters into fixed forward spot trades for a portion of its projected gold and silver sales. During the year ended December 31, 2016, the Company entered into forward trades which covered 109,140 gold ounces and 1,468,516 silver ounces at average prices of $1,244 and $16.54 per ounce, respectively. These agreements are considered derivative financial instruments and during the year ended December 31, 2016, the Company recorded a $3.7 million loss on the settlement of such instruments, which was determined by the difference in the fixed forward price received by the Company and the spot price on the applicable delivery date.
Currency swap
Because a portion of the total consideration for the Hollister Acquisition included an $80.0 million cash payment, the Company entered into forward currency exchange contracts (the "Exchange Contracts") to fix the exchange rate on approximately CDN$112.6 million of the offering proceeds (as discussed in Note 13. Share capital) at an average exchange rate of 0.76:1.0. The Exchange Contracts were considered derivative financial instruments and during the year ended December 31, 2016, the Company recorded a $0.7 million loss on the settlement of the Exchange Contracts.
12. Fair value measurements
Fair value is the price that would be received to sell an asset or paid to transfer a liability in an orderly transaction between market participants at the measurement date. Financial assets and liabilities recorded at fair value in the Consolidated Financial Statements are classified using a fair value hierarchy that reflects the significance of the inputs used in making the fair value measurements. The fair value hierarchy has the following levels:
Level 1 – Unadjusted quoted prices in active markets for identical assets or liabilities at the measurement date;
Level 2 – Quoted prices in markets that are not active, or inputs that are observable, either directly or indirectly, for the full term of the asset or liability; and
Level 3 – Prices or valuation techniques that require inputs that are both significant to the fair value measurement and are not observable.
Financial assets and liabilities are classified in their entirety based upon the lowest level of input that is significant to the fair value measurement. There were no transfers between fair value hierarchy levels during the year ended December 31, 2016. The following table provides a listing (by level) of the Company's financial assets and liabilities which are measured at fair value on a recurring basis (in thousands):
December 31, 2016 | December 31, 2015 | |||||||||||||||||||||||||
Assets: | Note | Level 1 | Level 2 | Level 3 | Level 1 | Level 2 | Level 3 | |||||||||||||||||||
Gold Purchase Agreement embedded derivative | 8 | $ | — | $ | 2,792 | $ | — | $ | — | $ | 5,514 | $ | — | |||||||||||||
$ | — | $ | 2,792 | $ | — | $ | — | $ | 5,514 | $ | — | |||||||||||||||
Liabilities: | ||||||||||||||||||||||||||
Deferred share units liability | 10 | $ | — | $ | 812 | $ | — | $ | — | $ | — | $ | — | |||||||||||||
Gold Offering Agreement | — | — | 2,052 | — | — | 2,775 | ||||||||||||||||||||
$ | — | $ | 812 | $ | 2,052 | $ | — | $ | — | $ | 2,775 | |||||||||||||||
Gold Purchase Agreement embedded derivative - This asset was valued by a third-party consultant (and reviewed by the Company) using observable inputs, including period-end forward gold prices and historic forward gold prices from the Gold Purchase Agreement's February 2014 transaction date and, as such, is classified within Level 2 of the fair value hierarchy.
69
Deferred share unit liability - This liability was valued using the number of outstanding DSUs and quoted closing prices of the Company’s common shares, which are traded in active markets, and as such is classified within Level 2 of the fair value hierarchy. The fair value was calculated as the number of DSUs outstanding multiplied by the period end DSU Value.
Gold Offering Agreement - This liability was valued by a third-party consultant (and reviewed by the Company) using a simulation-based pricing model and is classified within level 3 of the fair value hierarchy as it incorporates an estimate of the Company's future gold production from Fire Creek, which is not an observable input, as well as quoted prices from active markets and certain observable inputs, such as, forward gold prices and the volatility of such prices. The Company's 2017 gold production from Fire Creek is estimated to range from 96,000 - 100,000 ounces, the amounts of which were incorporated into the December 31, 2016 valuation.
Items disclosed at fair value - Other than the above, the carrying values of financial assets and liabilities approximate their fair values, other than Debt, which is carried at amortized cost. As of December 31, 2016, the fair value of the Gold Purchase Agreement, including the embedded features, was approximately $17.8 million.
Level 3 information
The following table provides additional detail for the Company's Level 3 financial liability (in thousands):
Years ended December 31, | ||||||||
Gold Offering Agreement liability: | 2016 | 2015 | ||||||
Balance at beginning of the period | $ | 2,775 | $ | 4,373 | ||||
Gain from change in fair value | (723 | ) | (1,598 | ) | ||||
Balance at end of the period | $ | 2,052 | $ | 2,775 | ||||
(Loss) gain on derivative, net: | ||||||||
Settlement losses | $ | (1,838 | ) | $ | (1,474 | ) | ||
Gain from change in fair value | 723 | 1,598 | ||||||
$ | (1,115 | ) | $ | 124 | ||||
13. Share capital
Common shares
The authorized share capital of the Company is comprised of an unlimited number of common shares with no par value. Common shares are typically issued in conjunction with corporate financing efforts, the exercise of warrants (discussed below), and pursuant to share-based compensation arrangements (see Note 14. Share-based compensation).
August 2016 subscription receipt offering
In connection with the Hollister Acquisition (discussed in Note 4. Business combinations), on July 25, 2016, the Company entered into an agreement, as amended on July 26, 2016, (the "Offering") with a syndicate of underwriters (the “Underwriters”), who agreed to purchase for resale, on a "bought deal" private placement basis, 25,900,000 subscription receipts of the Company ("Subscription Receipts"), at a price of CDN$5.00 per Subscription Receipt for aggregate gross proceeds of CDN$129.5 million.
The Offering closed on August 18, 2016, and the gross proceeds from the sale of Subscription Receipts, less costs and expenses of the Underwriters, including an underwriters' fee of 5% of the gross proceeds, were placed into escrow. On September 29, 2016 the conditions precedent to the Hollister Acquisition (other than the payment of the purchase price) were satisfied and the proceeds which were previously placed into escrow were released to the Company. Each holder of a Subscription Receipt received, without the payment of additional consideration or further action on the part of the holder, one special warrant (a "Special Warrant") of the Company. Each Special Warrant entitled the holder thereof to receive upon exercise or deemed exercise, without the payment of additional consideration, one common share of the Company. The Special Warrants were exercised and converted into common shares during the fourth quarter 2016.
After deducting general offering costs and underwriting fees (CDN$6.4 million), the net proceeds to the Company totaled $95.7 million.
September 2015 public offering
On September 10, 2015, the Company completed a bought deal offering in which 7,400,000 common shares were issued at a price of CDN$3.55 per common share, resulting in gross proceeds of CDN$26.3 million. After general offering costs and a 5% underwriting fee, the net proceeds to the Company totaled $18.6 million. The Company used the net proceeds from the offering to repay the Senior Notes (see Note 8. Debt).
70
July 2014 public offering
On July 30, 2014, the Company completed a bought deal public offering for aggregate gross proceeds of CDN$16.1 million in which 8,050,000 common shares were issued. After offering costs and underwriters' commission, the net proceeds to the Company totaled $13.7 million. Additionally, the underwriters were granted 266,000 compensation warrants which were exercisable at CDN$2.25 per warrant during a period of 24 months following the closing date.
February 2014 Private Placement
In connection with the Midas Acquisition (see Note 4. Business combinations), in February 2014 the Company completed a private placement offering of subscription receipts for 29,400,000 common shares at an issue price of CDN$1.45 per common share for total gross proceeds of CDN$42.6 million. Net proceeds to the Company totaled $36.7 million after issuance costs and underwriters' commissions.
Share Purchase Warrants
The Company has previously issued share purchase warrants in conjunction with the Hollister Acquisition and Midas Acquisition (see Note 4. Business combinations) and other past debt and equity financing transactions. The following table summarizes activity of the Company's warrants activity:
Years ended December 31, | |||||||||||||||||||||
2016 | 2015 | 2014 | |||||||||||||||||||
Warrants | Number of Warrants | Weighted Average Exercise Price - CDN$ | Number of Warrants | Weighted Average Exercise Price - CDN$ | Number of Warrants | Weighted Average Exercise Price - CDN$ | |||||||||||||||
Outstanding, beginning of year | 8,364,366 | $ | 2.07 | 11,755,126 | $ | 2.24 | 12,304,065 | $ | 1.80 | ||||||||||||
Issued pursuant to February 2014 private placement | — | — | — | — | 1,176,000 | (1) | 1.55 | ||||||||||||||
Issued with Senior Notes | — | — | — | — | 3,100,000 | (1) | 1.95 | ||||||||||||||
Issued with Midas Acquisition | — | — | — | — | 5,000,000 | (1) | 2.15 | ||||||||||||||
Issued with July 2014 public offering | — | — | — | — | 266,000 | (1) | 2.25 | ||||||||||||||
Issued with Hollister Acquisition | 5,000,000 | (2) | 6.00 | — | — | — | — | ||||||||||||||
Exercised | (2,223,566 | ) | 1.96 | (1,990,760 | ) | 1.69 | (9,124,116 | ) | 1.69 | ||||||||||||
Expired | — | — | (1,400,000 | ) | 3.99 | (966,823 | ) | 1.75 | |||||||||||||
Outstanding, end of year | 11,140,800 | $ | 3.86 | 8,364,366 | $ | 2.07 | 11,755,126 | $ | 2.24 | ||||||||||||
Exercisable, end of year | 6,140,800 | $ | 2.11 | 8,364,366 | $ | 2.07 | 11,755,126 | $ | 2.24 | ||||||||||||
(1) Weighted average inputs to the Black-Scholes model used in determining the fair value of the warrants granted include a risk-free interest rate of 1.98%, volatility of 45.5%, dividend yield of 0.0%, and an estimated life of 9.14 years. | |||||||||||||||||||||
(2) Input assumptions to the Monte Carlo model used in determining the fair value of the warrants granted include a risk-free interest rate of 1.34%, volatility of 66.0%, a dividend yield of 0.0%, and an estimated life of 15.5 years. | |||||||||||||||||||||
The following table provides a summary of the Company's outstanding warrants:
December 31, 2016 | December 31, 2015 | December 31, 2014 | |||||||||||||||||||||||||||
Exercise price per share - CDN$ | Number outstanding | Weighted average remaining life (years) | Weighted average exercise price - CDN$ | Number outstanding | Weighted average remaining life (years) | Weighted average exercise price - CDN$ | Number outstanding | Weighted average remaining life (years) | Weighted average exercise price - CDN$ | ||||||||||||||||||||
$0.00 - $1.49 | — | — | — | — | — | $ | — | 525,826 | 0.8 | 1.43 | |||||||||||||||||||
$1.50 - $1.99 | 1,140,800 | 0.11 | 1.95 | 3,178,166 | 1.61 | 1.94 | 4,263,300 | 1.69 | 1.84 | ||||||||||||||||||||
$2.00 - $2.49 | 5,000,000 | 12.11 | 2.15 | 5,186,200 | 12.68 | 2.15 | 5,566,000 | 12.98 | 2.17 | ||||||||||||||||||||
$2.50 - $3.00 | — | — | — | — | — | — | 1,400,000 | 0.27 | 2.76 | ||||||||||||||||||||
$6.00 | 5,000,000 | 15.26 | 6.00 | — | — | — | — | — | — | ||||||||||||||||||||
11,140,800 | 12.30 | $ | 3.86 | 8,364,366 | 8.45 | $ | 2.07 | 11,755,126 | 6.83 | 2.24 | |||||||||||||||||||
71
14. Share-based compensation
The Company has a Share Option and Restricted Share Unit Plan ("New Share Plan") to compensate eligible participants, which can include directors, officers, employees, and service providers to the Company. The New Share Plan is administered by the Board of Directors of the Company and subject to conditions and restrictions over award terms, grant limits, and grant prices. The New Share Plan was approved at the June 15, 2016 annual and special meeting of shareholders. Subject to certain adjustments, the maximum number of common shares available for grant under the New Share Plan is equal to 8.9% of the common shares then outstanding less the aggregate number of common shares reserved for issuance under all current and legacy share-based compensation plans. Additionally, the maximum number of common shares available for issuance pursuant to grants under the restricted share unit plan is subject to a sub-cap and cannot exceed 4.0% of the total number of common shares outstanding at the time of grant of the applicable award.
The New Share Plan replaced the Company's Share Incentive Plan (the "Legacy SIP"), which permitted the granting of share options and common share awards. Awards outstanding under the Legacy SIP will continue to vest in accordance with their grant terms and reduce the number of shares available for issuance under the New Share Plan (discussed above).
The following table summarizes the common shares authorized for issuance and available for future issuance under the New Share Plan as of December 31, 2016:
December 31, 2016 | |||
Common shares authorized for issuance under New Share Plan | 15,597,387 | ||
Common shares reserved for issuance under all plans | (6,393,386 | ) | |
Common shares available for future grants | 9,204,001 | ||
Share-based compensation costs
The fair value of share-based compensation costs are recognized within General and administrative over the applicable vesting period, which generally ranges from one to three years, with a corresponding increase to Additional paid-in capital. Share-based compensation awards that are forfeited before vesting result in previously recognized expenses being reversed. The following table summarizes the Company's share-based compensation cost and unrecognized share-based compensation cost by award type (in thousands):
Years ended December 31, | ||||||||||||
Share-based compensation cost by award | 2016 | 2015 | 2014 | |||||||||
Share options | $ | 1,431 | $ | 2,501 | $ | 2,459 | ||||||
Restricted share units - time vesting criteria | 1,083 | 283 | — | |||||||||
Restricted share units - performance vesting criteria | 144 | — | — | |||||||||
Common share awards | 20 | 314 | 371 | |||||||||
$ | 2,678 | $ | 3,098 | $ | 2,830 | |||||||
Capitalized as part of an asset cost | $ | 123 | $ | 81 | $ | 50 | ||||||
Recognized tax benefit | $ | 983 | $ | 286 | $ | 50 | ||||||
Unrecognized share-based compensation cost by award | December 31, 2016 | |||
Restricted share units - time vesting criteria | $ | 2,001 | ||
Restricted share units - performance vesting criteria | 901 | |||
Share options | 564 | |||
Common share awards | 16 | |||
$ | 3,482 | |||
72
Restricted share units - time-based
The following table summarizes activity of the Company's restricted share units (“RSUs”) with time-based vesting criteria:
Year ended December 31, 2016 | ||||||||||||||
Restricted share units - time based vesting | Number of RSUs | Weighted Average Grant-Date Fair Value - CDN$ | Weighted Average Remaining Vesting Period of Unvested RSUs (years) | Aggregate Intrinsic Value of RSUs Outstanding (thousands) | ||||||||||
Outstanding, beginning of year(1) | 569,469 | $ | 3.04 | |||||||||||
Granted | 618,804 | 6.40 | ||||||||||||
Vested and issued | (112,689 | ) | 3.05 | |||||||||||
Forfeited | (127,546 | ) | 3.22 | |||||||||||
Outstanding and unvested, end of year | 948,038 | $ | 5.20 | 2.22 | $ | 4,413 | ||||||||
(1) Includes awards with comparable terms and characteristics of RSUs, even if such awards are not called "RSUs" under the plan they were granted. | ||||||||||||||
No RSUs were granted during 2014. The following table provides additional detail for RSUs with time-based vesting:
December 31, | ||||||||
Restricted share units - time based vesting | 2016 | 2015 | ||||||
Weighted-average estimated forfeiture rate of RSUs granted | 14.21 | % | 0.04 | % | ||||
Fair value of RSUs vested (thousands) | $ | 262 | $ | 26 | ||||
Intrinsic value of RSUs vested (thousands) | $ | 495 | $ | 26 | ||||
Weighted-average grant date fair value - CDN$ (per award) | $ | 6.40 | $ | 3.03 | ||||
Restricted share units - performance-based
Performance vesting criteria is based upon the total return of the common shares of the Company relative to the return of the S&P TSX Global Gold Index. The actual number of performance-based RSUs that vest will be determined at the end of a three year performance period. The following table summarizes activity of the Company's RSUs with performance-based vesting criteria:
Year ended December 31, 2016 | ||||||||||||||
Restricted share units - performance-based vesting | Number of RSUs | Weighted Average Grant-Date Fair Value - CDN$ | Weighted Average Remaining Vesting Period of Unvested RSUs (years) | Aggregate Intrinsic Value of RSUs Outstanding (thousands) | ||||||||||
Outstanding, beginning of year | — | — | ||||||||||||
Granted | 212,243 | 6.60 | ||||||||||||
Vested and issued | — | — | ||||||||||||
Forfeited | — | — | ||||||||||||
Outstanding and unvested, end of year | 212,243 | $ | 6.60 | 2.87 | $ | 988 | ||||||||
No RSUs with performance-based vesting were granted in 2015 or 2014. The following table provides additional detail for RSUs with performance-based vesting:
December 31, | ||||
Restricted share units - performance-based vesting | 2016 | |||
Weighted-average estimated forfeiture rate of RSUs granted | — | % | ||
Fair value of RSUs vested (thousands) | $ | 1,072 | ||
Intrinsic value of RSUs vested (thousands) | $ | 988 | ||
Weighted-average grant date fair value - CDN$ (per award) | $ | 6.60 | ||
73
Common share awards
A portion of the Company's common share awards have been granted with voting rights and increased the number of common shares outstanding at the time of grant. Such common shares are issued for the benefit of, and will be transferred to, the grantee upon the vesting date of the grant. The following table summarizes activity of the Company's common share awards:
Year ended December 31, 2016 | ||||||||||||||
Common share awards | Number of Common Share Awards | Weighted Average Grant-Date Fair Value - CDN$ | Weighted-Average Remaining Vesting Period of Unvested Common Shares (years) | Aggregate Intrinsic Value of Common Shares Outstanding | ||||||||||
Issued and outstanding, beginning of year | 316,838 | $ | 2.05 | |||||||||||
Granted | — | — | ||||||||||||
Vested and released | (197,674 | ) | 2.03 | |||||||||||
Forfeited | (62,499 | ) | (1) | 2.07 | ||||||||||
Issued and outstanding, end of year | 56,665 | $ | 2.09 | 0.70 | $ | 264 | ||||||||
(1) Common share awards forfeited decreased the number of issued and outstanding shares. | ||||||||||||||
No common share awards were granted in 2016 or 2015. The following table provides additional detail for common share awards:
December 31, | ||||||||||||
Common share awards | 2016 | 2015 | 2014 | |||||||||
Weighted-average estimated forfeiture rate of common share awards granted | — | % | — | % | — | % | ||||||
Fair value of common share awards vested (thousands) | $ | 333 | $ | 255 | $ | 8 | ||||||
Intrinsic value of common share awards vested (thousands) | $ | 666 | $ | 371 | $ | 8 | ||||||
Weighted-average grant date fair value - CDN$ (per award) | $ | — | $ | — | $ | 2.04 | ||||||
Share options
The following table summarizes activity of the Company's share options:
Year ended December 31, 2016 | ||||||||||||||
Share options | Number of Share Options | Weighted Average Exercise Price - CDN$ | Weighted Average Remaining Contractual Period of Outstanding Options (years) | Aggregate Intrinsic Value of Options Outstanding (thousands) | ||||||||||
Outstanding, beginning of year | 10,193,318 | $ | 2.10 | |||||||||||
Granted | 730,000 | 4.45 | ||||||||||||
Forfeited | (625,557 | ) | 2.48 | |||||||||||
Exercised | (5,037,369 | ) | 1.79 | |||||||||||
Expired | (27,287 | ) | 2.50 | |||||||||||
Outstanding, end of year | 5,233,105 | $ | 2.68 | 3.16 | $ | 14,008 | ||||||||
Vested and exercisable, end of year | 3,759,603 | $ | 2.32 | 2.90 | $ | 11,017 | ||||||||
The following table provides additional detail for the above awards:
December 31, | ||||||||||||
Share options | 2016 | 2015 | 2014 | |||||||||
Intrinsic value of options exercised (in thousands) | $ | 12,277 | $ | 2,741 | $ | 358 | ||||||
Fair value of options vested (in thousands) | 2,779 | 3,446 | 3,150 | |||||||||
The fair value of the share options granted during the years ended December 31, 2016, 2015, and 2014 was determined using the following weighted average inputs in the Black-Scholes model:
74
Years ended December 31, | ||||||||||||
Share options | 2016 | 2015 | 2014 | |||||||||
Risk-free interest rate | 0.59 | % | 0.85 | % | 1.31 | % | ||||||
Forfeiture rate | 13.99 | % | 12.07 | % | — | % | ||||||
Volatility | 46.08 | % | 47.31 | % | 48.24 | % | ||||||
Dividend yield | — | % | — | % | — | % | ||||||
Expected option life | 5.0 years | 5.0 years | 3.4 years | |||||||||
Weighted average grant-date fair value - CDN$ | $ | 1.77 | $ | 1.19 | $ | 0.77 | ||||||
15. Revenues
The following tables summarize the components of the Company's revenues (in thousands except gold and silver ounces sold):
Years ended December 31, | |||||||||||||||||||||
2016 | 2015 | 2014 | |||||||||||||||||||
Amount | Ounces Sold | Amount | Ounces Sold | Amount | Ounces Sold | ||||||||||||||||
Fire Creek | |||||||||||||||||||||
Gold revenue(1) | $ | 123,403 | 98,723 | $ | 93,739 | 81,080 | $ | 74,864 | 59,352 | ||||||||||||
Silver revenue | 1,623 | 95,454 | 1,284 | 81,441 | 1,026 | 56,015 | |||||||||||||||
125,026 | 95,023 | 75,890 | |||||||||||||||||||
Midas | |||||||||||||||||||||
Gold revenue(2) | 39,783 | 31,777 | 33,492 | 28,978 | 17,119 | 13,748 | |||||||||||||||
Silver revenue | 24,023 | 1,374,685 | 25,566 | 1,627,107 | 19,613 | 1,061,273 | |||||||||||||||
63,806 | 59,058 | 36,732 | |||||||||||||||||||
True North | |||||||||||||||||||||
Gold revenue | 9,329 | 8,016 | — | — | — | — | |||||||||||||||
Silver revenue | 14 | 853 | — | — | — | — | |||||||||||||||
9,343 | — | — | |||||||||||||||||||
$ | 198,175 | $ | 154,081 | $ | 112,622 | ||||||||||||||||
(1) Includes ounces sold (if any) under the Gold Offering Agreement which were satisfied by the Company's gold production. See Note 20. Segment information for the amount of revenue recorded from Waterton Global Value, L.P. | |||||||||||||||||||||
(2) Includes 8,000, 7,500, and 6,750 gold ounces delivered under the Gold Purchase Agreement during 2016, 2015, and 2014, respectively. See Note 20. Segment information for the amount of revenue recorded from Franco-Nevada GLW Holdings Corp. | |||||||||||||||||||||
16. Interest income and other, net
The following table provides a summary of the Company's Interest income and other, net (in thousands):
Years ended December 31, | ||||||||||||
2016 | 2015 | 2014 | ||||||||||
Interest income | $ | 71 | $ | 78 | $ | 89 | ||||||
Other income | 22 | 15 | — | |||||||||
Other expenses | (337 | ) | 26 | (884 | ) | |||||||
$ | (244 | ) | $ | 119 | $ | (795 | ) | |||||
17. Income taxes
Major components of our income tax (expense) / benefit for the years ended December 31, 2016, 2015, and 2014 are as follows (in thousands):
75
Years ended December 31, | ||||||||||||
2016 | 2015 | 2014 | ||||||||||
Current: | ||||||||||||
Canada | $ | — | $ | — | $ | — | ||||||
United States | (3,477 | ) | (3,167 | ) | (2,049 | ) | ||||||
Total current income tax (expense) / benefit | (3,477 | ) | (3,167 | ) | (2,049 | ) | ||||||
Deferred: | ||||||||||||
Canada | — | — | — | |||||||||
United States | (247 | ) | 14,905 | (906 | ) | |||||||
Total deferred income tax (expense) / benefit | (247 | ) | 14,905 | (906 | ) | |||||||
Total income tax (expense) / benefit | $ | (3,724 | ) | $ | 11,738 | $ | (2,955 | ) | ||||
Canada and United States components of (loss) / income before income taxes for the years ended December 31, 2016, 2015, and 2014 are as follows (in thousands):
Years ended December 31, | ||||||||||||
2016 | 2015 | 2014 | ||||||||||
Canada | $ | (25,139 | ) | $ | (1,180 | ) | $ | (2,413 | ) | |||
United States | 27,163 | 33,695 | 32,252 | |||||||||
Total | $ | 2,024 | $ | 32,515 | $ | 29,839 | ||||||
The annual tax (expense) / benefit is different than the amount that would be provided by applying the statutory federal income tax rate to our pretax (loss) / income. A reconciliation of the Company's effective tax rate with the statutory tax rate for the years indicated is below (in thousands):
Years ended December 31, | ||||||||||||
2016 | 2015 | 2014 | ||||||||||
Amount | Amount | Amount | ||||||||||
Income and mining tax (expense) / benefit at statutory rate | $ | (601 | ) | $ | (8,454 | ) | $ | (7,758 | ) | |||
Effects of Canada to United States statutory rates on earnings of subsidiaries | (2,445 | ) | (3,033 | ) | (2,903 | ) | ||||||
State income tax expense | (2,515 | ) | (2,342 | ) | (1,822 | ) | ||||||
Share-based compensation expense | 1,395 | 130 | (257 | ) | ||||||||
Percentage depletion | 5,993 | 309 | — | |||||||||
Foreign exchange rate gain / (loss) | 127 | (1,174 | ) | (1,482 | ) | |||||||
Deferred tax asset (recognized) / not recognized | (5,627 | ) | 26,428 | 12,889 | ||||||||
Other | (51 | ) | (126 | ) | (1,622 | ) | ||||||
Income tax (expense) / benefit | $ | (3,724 | ) | $ | 11,738 | $ | (2,955 | ) | ||||
At December 31, 2016 and 2015, the significant components of the Company’s deferred tax assets and liabilities are below (in thousands):
76
December 31, | ||||||||
2016 | 2015 | |||||||
Deferred tax assets: | ||||||||
Mineral properties, plant and equipment | $ | 41,340 | $ | 13,933 | ||||
Net operating losses | 14,341 | 11,641 | ||||||
Asset retirement obligation | 4,729 | 3,792 | ||||||
Inventory | 1,479 | 1,783 | ||||||
Tax credits | 1,402 | 713 | ||||||
Derivatives | 971 | 971 | ||||||
Share-based compensation | — | 286 | ||||||
Other | 6,580 | 3,862 | ||||||
Deferred tax assets | 70,842 | 36,981 | ||||||
Valuation allowances | (62,381 | ) | (20,217 | ) | ||||
Net deferred tax assets | 8,461 | 16,764 | ||||||
Deferred tax liabilities: | ||||||||
Share-based compensation | (396 | ) | — | |||||
Property, plant and equipment and inventory | (1,494 | ) | (791 | ) | ||||
Foreign exchange and other | (1,251 | ) | (3,163 | ) | ||||
Deferred tax liabilities | (3,141 | ) | (3,954 | ) | ||||
Net deferred tax asset | $ | 5,320 | $ | 12,810 | ||||
The Company evaluated evidence available to determine the amount of valuation allowance required on its deferred tax assets. At December 31, 2016 and 2015, the balances of our valuation allowances were approximately $62.4 million and $20.2 million, respectively. These balances were primarily related to Canadian exploration and development expense pools obtained through the purchase of True North in 2016 and exploration and development costs with tax basis in excess of book. If it is determined that the Company will ultimately be more likely than not to realize all or a portion of the related benefits for which a valuation allowance has been provided, all or a portion of the related valuation allowance will be reduced.
The net change in the Company's valuation allowance for the years ended December 31, 2016, 2015, and 2014 are as follows (in thousands):
Years ended December 31, | ||||||||||||
2016 | 2015 | 2014 | ||||||||||
Balance, beginning of year | $ | (20,217 | ) | $ | (39,895 | ) | $ | (41,165 | ) | |||
U.S. built-in loss not recognized | 1,142 | 1,142 | (10,612 | ) | ||||||||
AMT credits not recognized | (689 | ) | (410 | ) | (303 | ) | ||||||
Recognition of US deferred tax assets | — | 17,530 | 10,588 | |||||||||
Canadian exploration and development expense pools | (36,538 | ) | — | — | ||||||||
Canadian net operating losses | (6,079 | ) | 1,416 | 1,597 | ||||||||
Balance, end of year | $ | (62,381 | ) | $ | (20,217 | ) | $ | (39,895 | ) | |||
As of December 31, 2016, the Company had Canadian net operating loss carryforwards of $40.9 million which expire between 2026 and 2036. The Company also had U.S. net operating loss carryforwards of $8.3 million which expire in 2033.
The Company files income tax returns in Canada and the U.S. The statute of limitations remains open from 2011 - 2016.
The Company classifies interest and penalties as a component of Interest income and other, net in its Consolidated Statements of (Loss) Income. The amount of interest and penalties recognized in the Consolidated Statements of (Loss) Income were nil, nil, and $0.7 million for the years ended December 31, 2016, 2015, and 2014, respectively.
77
18. Net (loss) income per share
Basic net income (loss) per share is calculated by dividing net income by the weighted average number of shares outstanding for the period. Diluted net income (loss) per share reflects the potential dilution that would occur if outstanding share-based instruments were executed. The following table provides computations of the Company's basic and diluted net income (loss) per share (in thousands, except per share amounts):
Years ended December 31, | ||||||||||||||
Note | 2016 | 2015 | 2014 | |||||||||||
Net (loss) income | $ | (1,700 | ) | $ | 44,253 | $ | 26,884 | |||||||
Weighted average common shares: | ||||||||||||||
Basic | 146,295,998 | 132,279,526 | 115,481,622 | |||||||||||
Effect of: | ||||||||||||||
Share options | 14 | — | 3,682,637 | 1,422,539 | ||||||||||
Warrants | 13 | — | 2,792,283 | 1,005,310 | ||||||||||
Common share awards | 14 | — | 244,512 | — | ||||||||||
Diluted | 146,295,998 | 138,998,958 | 117,909,471 | |||||||||||
Net (loss) income per share | ||||||||||||||
Basic | $ | (0.01 | ) | $ | 0.33 | $ | 0.23 | |||||||
Diluted | $ | (0.01 | ) | $ | 0.32 | $ | 0.23 | |||||||
For the years ended December 31, 2016, 2015, and 2014, the impact of dilutive common share-based instruments was determined using the Company’s average share price, which was CDN$5.21, CDN$2.99, and CDN$1.91, respectively.
Diluted net income per share excludes common share-based instruments in periods where inclusion would be anti-dilutive. During the year ended December 31, 2016, the Company's basic weighted average common shares and diluted weighted average common shares were the same because the effects of potential execution was anti-dilutive due to the Company's net loss. Had the Company generated net income, during the year ended December 31, 2016, the effects from executing 4,864,803 warrants, 3,292,032 share options, and 722,852 RSUs would have been included in the diluted weighted average common shares calculation.
19. Quarterly financial information (unaudited)
Summarized quarterly results for the years ended December 31, 2016, and 2015 are as follows (in thousands, except per share amounts):
Quarters | ||||||||||||||||||||
2016 | First | Second | Third | Fourth | Year | |||||||||||||||
Revenues | $ | 36,441 | $ | 49,993 | $ | 55,641 | $ | 56,100 | $ | 198,175 | ||||||||||
Cost of sales | 26,134 | 29,002 | 34,659 | 47,705 | 137,500 | |||||||||||||||
Gross profit | 10,307 | 20,991 | 20,982 | 8,395 | 60,675 | |||||||||||||||
Net (loss) income | (6,663 | ) | (4,484 | ) | 7,269 | 2,178 | (1,700 | ) | ||||||||||||
Basic net (loss) income per share | (0.05 | ) | (0.03 | ) | 0.05 | 0.02 | (0.01 | ) | ||||||||||||
Diluted net (loss) income per share | (0.05 | ) | (0.03 | ) | 0.05 | 0.02 | (0.01 | ) | ||||||||||||
2015 | ||||||||||||||||||||
Revenues | $ | 37,924 | $ | 41,253 | $ | 38,139 | $ | 36,765 | $ | 154,081 | ||||||||||
Cost of sales | 26,845 | 26,557 | 26,845 | 26,724 | 106,971 | |||||||||||||||
Gross profit | 11,079 | 14,696 | 11,294 | 10,041 | 47,110 | |||||||||||||||
Net income | 9,490 | 8,006 | 8,432 | 18,325 | 44,253 | |||||||||||||||
Basic net income per share | 0.07 | 0.06 | 0.06 | 0.14 | 0.33 | |||||||||||||||
Diluted income per share | 0.07 | 0.06 | 0.06 | 0.13 | 0.32 | |||||||||||||||
78
20. Segment information
The Company's reportable segments are comprised of operating units which have revenues, earnings or losses, or assets exceeding 10% of the respective consolidated totals, each of which is reviewed by the Company’s Chief Executive Officer to make decisions about resources to be allocated to the segments and to assess their performance. The table below summarizes segment information:
Year ended December 31, 2016 | Fire Creek | Midas | True North | Hollister | Aurora | Corporate and other | Total | ||||||||||||||||||||
Revenues | $ | 125,026 | $ | 63,806 | $ | 9,343 | $ | — | $ | — | $ | — | $ | 198,175 | |||||||||||||
Cost of sales | |||||||||||||||||||||||||||
Production costs | 46,246 | 49,599 | 10,544 | — | — | — | 106,389 | ||||||||||||||||||||
Depreciation and depletion | 11,612 | 13,272 | 3,358 | — | — | — | 28,242 | ||||||||||||||||||||
Write-down of production inventories | — | 474 | 2,395 | — | — | — | 2,869 | ||||||||||||||||||||
67,168 | 461 | (6,954 | ) | — | — | — | 60,675 | ||||||||||||||||||||
Other operating expenses | |||||||||||||||||||||||||||
General and administrative | 835 | 835 | 126 | — | — | 14,008 | 15,804 | ||||||||||||||||||||
Exploration | 8,754 | 4,011 | — | — | — | — | 12,765 | ||||||||||||||||||||
Development and projects costs | — | — | 5,531 | 3,406 | 16 | — | 8,953 | ||||||||||||||||||||
Asset retirement and accretion | 168 | 725 | 68 | 1,629 | 63 | — | 2,653 | ||||||||||||||||||||
Business acquisition costs | — | — | 1,159 | 1,094 | — | — | 2,253 | ||||||||||||||||||||
Provision for legal settlement | 2,850 | — | — | — | — | 150 | 3,000 | ||||||||||||||||||||
Loss on equipment disposal | — | — | 17 | — | — | 109 | 126 | ||||||||||||||||||||
Income (loss) from operations | $ | 54,561 | $ | (5,110 | ) | $ | (13,855 | ) | $ | (6,129 | ) | $ | (79 | ) | $ | (14,267 | ) | $ | 15,121 | ||||||||
Capital expenditures | $ | 23,779 | $ | 23,835 | $ | 11,246 | $ | 808 | $ | 615 | $ | 1,433 | $ | 61,716 | |||||||||||||
Total assets | $ | 47,606 | $ | 99,141 | $ | 50,171 | $ | 113,990 | $ | 15,164 | $ | 53,906 | $ | 379,978 | |||||||||||||
Year ended December 31, 2015 | Fire Creek | Midas | True North | Hollister | Aurora | Corporate and other | Total | ||||||||||||||||||||
Revenues | $ | 95,023 | $ | 59,058 | $ | — | $ | — | $ | — | $ | — | $ | 154,081 | |||||||||||||
Cost of sales | |||||||||||||||||||||||||||
Production costs | 37,394 | 45,924 | — | — | — | — | 83,318 | ||||||||||||||||||||
Depreciation and depletion | 7,824 | 14,628 | — | — | — | — | 22,452 | ||||||||||||||||||||
Write-down of production inventories | — | 1,201 | — | — | — | — | 1,201 | ||||||||||||||||||||
49,805 | (2,695 | ) | — | — | — | — | 47,110 | ||||||||||||||||||||
Other operating expenses | |||||||||||||||||||||||||||
General and administrative | 515 | 515 | — | — | — | 11,345 | 12,375 | ||||||||||||||||||||
Exploration | 3,166 | 6,647 | — | — | — | — | 9,813 | ||||||||||||||||||||
Asset retirement and accretion | 55 | 816 | — | — | — | — | 871 | ||||||||||||||||||||
Business acquisition costs | — | — | — | — | — | 328 | 328 | ||||||||||||||||||||
Loss on equipment disposal | — | 352 | — | — | — | — | 352 | ||||||||||||||||||||
Income (loss) from operations | $ | 46,069 | $ | (11,025 | ) | $ | — | $ | — | $ | — | $ | (11,673 | ) | $ | 23,371 | |||||||||||
Capital expenditures | $ | 18,749 | $ | 16,395 | $ | — | $ | — | $ | — | $ | 1,454 | $ | 36,598 | |||||||||||||
Total assets | $ | 39,453 | $ | 124,191 | $ | — | $ | — | $ | — | $ | 39,179 | $ | 202,823 | |||||||||||||
79
Year ended December 31, 2014 | Fire Creek | Midas | True North | Hollister | Aurora | Corporate and other | Total | ||||||||||||||||||||
Revenues | $ | 75,890 | $ | 36,732 | $ | — | $ | — | $ | — | $ | — | $ | 112,622 | |||||||||||||
Cost of sales | |||||||||||||||||||||||||||
Production costs | 25,156 | 29,274 | — | — | — | — | 54,430 | ||||||||||||||||||||
Depreciation and depletion | 2,560 | 4,246 | — | — | — | — | 6,806 | ||||||||||||||||||||
Write-down of production inventories | — | — | — | — | — | — | — | ||||||||||||||||||||
48,174 | 3,212 | — | — | — | — | 51,386 | |||||||||||||||||||||
Other operating expenses | |||||||||||||||||||||||||||
General and administrative | — | — | — | — | — | 8,818 | 8,818 | ||||||||||||||||||||
Exploration | — | 3,415 | — | — | — | — | 3,415 | ||||||||||||||||||||
Development and projects costs | 7,820 | 7,522 | — | — | — | 125 | 15,467 | ||||||||||||||||||||
Asset retirement and accretion | 47 | 581 | — | — | — | — | 628 | ||||||||||||||||||||
Business acquisition costs | — | 2,042 | — | — | — | — | 2,042 | ||||||||||||||||||||
Income (loss) from operations | $ | 40,307 | $ | (10,348 | ) | $ | — | $ | — | $ | — | $ | (8,943 | ) | $ | 21,016 | |||||||||||
Capital expenditures | $ | 5,903 | $ | 1,210 | $ | — | $ | — | $ | — | $ | 769 | $ | 7,882 | |||||||||||||
Total assets | $ | 23,057 | $ | 114,273 | $ | — | $ | — | $ | — | $ | 27,921 | $ | 165,251 | |||||||||||||
Geographic Information
The following table provides a summary of long-lived assets by location (in thousands):
December 31, | |||||||
Long-lived assets, net: | 2016 | 2015 | |||||
Nevada (Fire Creek, Midas, Hollister, Aurora, and Corporate and other) | $ | 237,105 | $ | 86,582 | |||
Canada (True North) | 39,118 | — | |||||
Total | $ | 276,223 | $ | 86,582 | |||
Significant customers
The Company has historically sold its metal to five customers. Because the Company's metal is refined to produce bullion that meets the required market standards, the loss of any one of the Company's customers would not adversely affect the Company due to the liquidity of gold and silver markets and the availability of alternative trading counterparties. The following table provides a summary of revenues by significant customer (in thousands):
Years ended December 31, | ||||||||||||||
Customer | Segments reporting revenue | 2016 | 2015 | 2014 | ||||||||||
Auramet International, LLC | Fire Creek, Midas, True North | $ | 80,368 | $ | 97,585 | $ | 56,480 | |||||||
Investec Bank Plc | Fire Creek, Midas | 94,550 | — | — | ||||||||||
Franco-Nevada GLW Holdings Corp. | Midas | 9,981 | 8,636 | 8,327 | ||||||||||
Waterton Global Value, L.P. | Fire Creek | 13,276 | 42,780 | 26,076 | ||||||||||
Asahi Refining, Inc. (formerly Johnson Matthey Inc.) | Fire Creek, Midas | — | 5,080 | 21,739 | ||||||||||
$ | 198,175 | $ | 154,081 | $ | 112,622 | |||||||||
80
21. Supplemental cash flow information
The following table provides a summary of significant supplemental cash flow information:
Years ended December 31, | ||||||||||||||
Note | 2016 | 2015 | 2014 | |||||||||||
Cash paid for federal and state income taxes | $ | 1,915 | $ | 8,177 | $ | 1,750 | ||||||||
Mobile equipment acquired through capital lease obligations | 145 | 1,371 | — | |||||||||||
Common shares and warrants issued for Hollister Acquisition | 4 | 29,568 | — | — | ||||||||||
Mineral properties, plant and equipment acquired through Promissory Note | 12,000 | — | — | |||||||||||
Warrants issued on Midas acquisition and financings | 4 | — | — | 5,896 | ||||||||||
22. Employee benefit plan
401(k) Plan
The Klondex Mines Gold & Silver Mining Company 401(k) Plan (the “401(k) Plan”) is a defined contribution plan that is available to all U.S. based employees of the Company and is sponsored by the Company. The 401(k) Plan is subject to the provisions of the Employee Retirement Income Security Act of 1974, as amended, and Section 401(k) of the Internal Revenue Code. Administrative fees of the 401(k) Plan can be paid by the Company or participants. Participants in the 401(k) Plan exercise control and direct the investment of their contributions and account balances among various investment alternatives. The Company matches 100% of employee salary deferrals up to 3% of eligible compensation plus an additional match of 50% on salary deferrals from 3% to 5% of eligible compensation. For the years ended December 31, 2016, 2015, and 2014, Company’s matching contributions totaled $0.8 million, $0.7 million, and $0.3 million, respectively.
Canada Registered Retirement Savings Plan
The Klondex Canada Ltd.'s Group Registered Retirement Savings Plan (the "Group RRSP") is available to all Canadian employees and is sponsored by the Company. The Group RRSP is subject to the provisions of the Income Tax Act and guided by the Capital Accumulation Plan Guidelines. There are no administrative fees for the Group RRSP. Participants in the Group RRSP exercise control and direct the investment of their contributions and account balances among various investments offered and may receive advice from a registered investment adviser. The Company matches employee contributions to the plan up to 3% of eligible compensation. For the year ended December 31, 2016, the Company's matching contribution totaled nil as the Group RRSP was established at the end of 2016.
23. Related party transactions
During the third quarter of 2016, the Company purchased a truck and skid steer from its CEO for $86.7 thousand for use at its Nevada operations. As of December 31, 2016 and December 31, 2015, no amounts were due to the Company from related parties.
24. Commitments and contingencies
Provision for legal settlement
In 2012, three former directors and/or employees of the Company resigned or were terminated for cause and because the Company believed that each individual breached certain duties, no amounts for severance benefits and/or the receipt of previously granted share-based compensation awards were initially accrued, including as of the beginning of the year. The individuals filed claims against the Company for such compensation benefits and other claims and as of the date of these Consolidated Financial Statements, two of the three individuals had entered into agreements with the Company to dismiss such claims without the ability to refile a claim in the future.
Through a mediation process, during the first quarter of 2017 the Company reached what it believes is a final settlement regarding the case for the remaining third individual which calls for a $3.0 million cash payment and, accordingly, during the year ended December 31, 2016, the Company accrued a Provision for legal settlement for this amount in its Consolidated Financial Statements.
Royalty commitments
Certain patented and unpatented mining claims at all mine sites are subject to lease and royalty agreements that require payments to holders based on minimum annual payment schedules and/or a percentage of the mineral values produced from, or transported through, the royalty claims. Amounts due pursuant to royalty agreements are not recorded in the consolidated financial statements until such time when the amounts are actually payable. The primary type of royalty agreement applicable to the mine sites is a net smelter return ("NSR") royalty. Under a NSR royalty, the amount paid by the Company to the royalty holder is generally calculated as the royalty percentage multiplied by the market value of the minerals produced less charges and costs for milling, smelting, refining, and
81
transportation. During the years ended December 31, 2016, 2015, and 2014, the Company paid $0.2 million, $0.1 million, and $0.1 million, respectively, all of which were related to minimum and advance royalty payments.
25. Subsequent events
Provision for legal settlement
As discussed in Note 24. Commitments and contingencies, the Company reached what it believes is a final settlement on litigation with a former director during the first quarter of 2017. This was previously accrued under a Provision for legal settlement in our Consolidated Financial Statements.
Item 9. Changes in and Disagreements with Accountants on Accounting and Financial Disclosures
None
Item 9A. Controls and Procedures
Disclosure Controls and Procedures
Disclosure controls and procedures are designed to ensure that information required to be disclosed in reports filed or submitted by the Company under U.S. and Canadian securities legislation is recorded, processed, summarized and reported within the time periods specified in those rules, including providing reasonable assurance that material information is gathered and reported to senior management, including the Chief Executive Officer (“CEO”) and Chief Financial Officer (“CFO”), as appropriate, to permit timely decisions regarding public disclosure. Management, including the CEO and CFO, has evaluated the effectiveness of the design and operation of the Company’s disclosure controls and procedures, as defined in Rule 13a‑15(e) and15d-15(e) of the Exchange Act and the rules of the Canadian Securities Administration, as at December 31, 2016. Based on this evaluation, the CEO and CFO have concluded that the Company’s disclosure controls and procedures were not effective based on the material weakness relating to the calculation and presentation of our deferred tax assets and liabilities arising from the transition of the Company’s financial statements from International Financial Reporting Standards to US generally accepted accounting principles described in Internal Control over Financial Reporting below.
Internal Control over Financial Reporting
Management is responsible for establishing and maintaining adequate internal control over financial reporting as defined in Rule 13a‑15(f) and 15d‑15(f) of the Exchange Act and National Instrument 52‑109 Certification of Disclosure in Issuers' Annual and Interim filings. Any system of internal control over financial reporting, no matter how well designed, has inherent limitations. Therefore, even those systems determined to be effective can provide only reasonable assurance with respect to financial statement preparation and presentation. Management has used the Committee of Sponsoring Organizations of the Treadway Commission in Internal Control - Integrated Framework (2013) to evaluate the effectiveness of the Company’s internal control over financial reporting. Based on this assessment, management has concluded that as at December 31, 2016, the Company’s internal control over financial reporting was not effective based on the material weakness described below.
A material weakness is a deficiency, or a combination of deficiencies, in internal control over financial reporting, such that there is a reasonable possibility that a material misstatement of our annual or interim financial statements will not be prevented or detected on a timely basis. In connection with the preparation of our financial statements for the year ended December 31, 2016 management identified a material weakness in our internal control over financial reporting relating to the calculation and presentation of our deferred tax assets and liabilities arising from the transition of the Company’s financial statements from International Financial Reporting Standards to US generally accepted accounting principles.
We did not maintain effective controls over the calculation and presentation of our deferred tax assets and liabilities arising from the transition of the Company’s financial statements from International Financial Reporting Standards to US generally accepted accounting principles. The deferred tax assets and liabilities and associated income tax expense were properly stated in this Annual Report on Form 10-K for the year ended December 31, 2016. Previously filed financial statements were not impacted. The Company is reviewing its staffing relating to complex accounting issues. The Company is considering engaging additional internal or external personnel with technical accounting expertise, as needed, to ensure that accounting personnel with adequate experience, skills and knowledge relating to complex transactions are directly involved in the review and accounting evaluation of our complex transactions.
Attestation Report of the Registered Public Accounting Firm
This annual report does not include an attestation report of the company’s registered public accounting firm regarding internal control over financial reporting. As an emerging growth company, management’s report was not subject to attestation by the company’s registered public accounting firm pursuant to the Jumpstart Our Business Startups (JOBS) Act, which exempts emerging growth companies from complying with Section 404(b) of SOX.
Changes in Internal Controls
There has been no change in our internal control over financial reporting during the year ended December 31, 2016 that has materially affected, or is reasonably likely to materially affect, our internal control over financial reporting.
82
Inherent Limitations on Effectiveness of Controls
Our management, including the CEO and CFO, does not expect that our disclosure controls and procedures or our internal control over financial reporting will prevent or detect all errors and all fraud. A control system, no matter how well-designed and operated, can provide only reasonable, not absolute, assurance that the control system’s objectives will be met. The design of a control system must reflect the fact that there are resource constraints, and the benefits of controls must be considered relative to their costs. Further, because of the inherent limitations in all control systems, no evaluation of controls can provide absolute assurance that misstatements due to error or fraud will not occur or that all control issues and instances of fraud, if any, have been detected. The design of any system of controls is based in part on certain assumptions about the likelihood of future events, and there can be no assurance that any design will succeed in achieving its stated goals under all potential future conditions. Projections of any evaluation of the effectiveness of controls to future periods are subject to risks. Over time, controls may become inadequate because of changes in conditions or deterioration in the degree of compliance with policies or procedures.
Item 9B. Other Information
None
83
PART III
Item 10. Directors, Executive Officers and Corporate Governance
The information required by Items 401, 405, 406, and 407(c)(3), (d)(4) and (d)(5) of Regulation S-K will be contained in the Company's definitive 2016 Proxy Statement, to be filed with the SEC within 120 days following the end of the Company's fiscal year ended December 31, 2016 (the "2016 Proxy Statement") and is hereby incorporated by reference thereto.
The Company has adopted a Code of Ethics, Trading Restrictions, and Whistleblowing that applies to all directors, officers, and employees of the Company, including our CEO and CFO and other finance professionals. The Code of Ethics, Trading Restrictions, and Whistleblowing reaffirms the Company's conduct of business in accordance with the highest ethical and legal standards. The Code of Ethics, Trading Restrictions, and Whistleblowing is located under the "Investor" section of Company's website at www.klondexmines.com. The Company is not including the information contained on or available through its website as a part of, or incorporating such information by reference into, this report. If we make an amendment to the code of ethics or grant any waiver that the SEC requires us to disclose, we will disclose the nature of such amendment or waiver on our website and through any other means required by the securities exchanges on which our securities are listed.
As required by applicable U.S. federal securities laws, all senior financial officers are subject to the Code of Ethics, Trading Restrictions, and Whistleblowing setting forth various restrictions and obligations for our senior financial officers.
Item 11. Executive Compensation
The information required by Item 402 and paragraph (e)(4) and (e)(5) of Item 407 of Regulation S-K will be contained in the Company's 2016 Proxy Statement, to be filed with the SEC within 120 days following the end of the Company's fiscal year ended December 31, 2016 and is hereby incorporated by reference thereto.
Item 12. Security Ownership of Certain Beneficial Owners and Management and Related Stockholder Matters
The information required by Item 201(d) and Item 403 of Regulation S-K will be contained in the Company's 2016 Proxy Statement, to be filed with the SEC within 120 days following the end of the Company's fiscal year ended December 31, 2016 and is hereby incorporated by reference thereto.
The following table provides information as of December 31, 2016, regarding compensation plans under which equity securities of the Company are authorized for issuance.
December 31, 2016 | |||||||||||
(a) | (b) | (c) | |||||||||
Plan Category | Number of securities to be issued upon exercise of outstanding options, warrants, and rights (#) | Weighted average exercise price or grant date fair value of outstanding options, warrants, and rights (CDN$) | Number of securities remaining available for future issuance under equity compensation plans (excluding securities reflected in column (a)) | ||||||||
Equity compensation plans approved by security holders: | |||||||||||
Share Option and Restricted Share Unit Plan (the "New Share Plan") | |||||||||||
Restricted share units(1) | 824,727 | n/a | 9,204,001 | (2) | |||||||
Share options | 300,000 | $ | 6.60 | 9,204,001 | (2) | ||||||
Share Incentive Plan (the "Legacy SIP") | |||||||||||
Restricted share units | 335,554 | n/a | — | ||||||||
Share options | 4,933,105 | $ | 2.44 | — | |||||||
Equity compensation plans not approved by security holders: | — | — | — | ||||||||
Total | 6,393,386 | $ | 2.68 | 9,204,001 | (2) | ||||||
(1) Includes awards subject to time-based vesting and performance-based vesting. | |||||||||||
(2) The maximum number of common shares available for grant under the New Share Plan is equal to 8.9% of the common shares then outstanding less the aggregate number of common shares reserved for issuance under all current and legacy share-based compensation plans. Additionally, the maximum number of common shares available for issuance pursuant to grants under the restricted share unit plan is subject to a sub-cap and cannot exceed 4.0% of the total number of common shares outstanding at the time of grant of the applicable award. | |||||||||||
See Note 14. Share-based compensation to the Notes to Consolidated Financial Statements for additional information on our equity compensation plans.
Item 13. Certain Relationships and Related Transactions, and Director Independence
84
The information required by Item 404 and Item 407(a) of Regulation S-K will be contained in the Company's 2016 Proxy Statement, to be filed with the SEC within 120 days following the end of the Company's fiscal year ended December 31, 2016 and is hereby incorporated by reference thereto.
Item 14. Principal Accountant Fees and Services
The information required by Item 9(e) of Schedule 14A will be contained in the Company's 2016 Proxy Statement, to be filed with the SEC within 120 days following the end of the Company's fiscal year ended December 31, 2016 and is hereby incorporated by reference thereto.
PART IV
Item 15. Exhibits and Financial Statement Schedules
(a) Documents filed as a part of this report:
(1) Financial Statements - Included in Part II, Item 8. Financial Statements and Supplementary Data
Page | |
Report of Independent Registered Public Accounting Firm | |
Management’s Report on Internal Control over Financial Reporting | |
Consolidated Balance Sheets at December 31, 2016 and 2015 | |
Consolidated Statements of (Loss) Income for the Years Ended December 31, 2016, 2015, and 2014 | |
Consolidated Statements of Comprehensive (Loss) Income for the Years Ended December 31, 2016, 2015, and 2014 | |
Consolidated Statements of Cash Flows for the Years Ended December 31, 2016, 2015, and 2014 | |
Consolidated Statements of Shareholders’ Equity for the Years Ended December 31, 2016, 2015, and 2014 | |
Notes to Consolidated Financial Statements | |
(2) Financial Statement Schedules - Not applicable
(3) Exhibits - Set forth on the Exhibit Index that follows the signatures page of this report.
Item 16. Form 10-K Summary
None
85
SIGNATURES
Pursuant to the requirements of Section 13 or 15(d) of the Securities Exchange Act of 1934, the registrant has duly caused this report to be signed on its behalf by the undersigned, thereunto duly authorized.
KLONDEX MINES LTD. | ||||
Registrant | ||||
Date: | March 23, 2017 | By: | /s/ Paul Andre Huet | |
Chief Executive Officer | ||||
Pursuant to the requirements of the Securities Exchange Act of 1934, this report has been signed below by the following persons on behalf of the registrant and in the capacities and on the dates indicated.
Signature | Title | Date | ||
/s/ Paul Andre Huet | President, Chief Executive Officer and Director (Principal Executive Officer) | March 23, 2017 | ||
Paul Andre Huet | ||||
/s/ Barry Dahl | Chief Financial Officer and Authorized U.S. Representative (Principal Financial Officer and Principal Accounting Officer) | March 23, 2017 | ||
Barry Dahl | ||||
/s/ Richard J. Hall | Chairman of the Board and Director | March 23, 2017 | ||
Richard J. Hall | ||||
/s/ Blair Schultz | Director | March 23, 2017 | ||
Blair Schultz | ||||
/s/ Rodney Cooper | Director | March 23, 2017 | ||
Rodney Cooper | ||||
/s/ Mark Daniel | Director | March 23, 2017 | ||
Mark Daniel | ||||
/s/ Jamie Haggarty | Director | March 23, 2017 | ||
Jamie Haggarty | ||||
/s/ William Matlack | Director | March 23, 2017 | ||
William Matlack | ||||
/s/ Charles Oliver | Director | March 23, 2017 | ||
Charles Oliver | ||||
86
EXHIBIT INDEX
Exhibit | Filed with this | Incorporated by Reference | |||||
Number | Exhibit Title | Form 10-K | Form | File No. | Exhibit | Date Filed | |
2.1 | Stock Purchase Agreement dated December 4, 2013, between Newmont USA Limited, Klondex Holdings (USA) Inc., and Klondex Mines Ltd. | 8-K | 001-37563 | 2.1 | 3/15/2017 | ||
2.2 | Membership Interest Purchase Agreement dated July 25, 2016, among Waterton Precious Metals Fund II Cayman, LP, Waterton Nevada Splitter, LLC, Klondex Holdings (USA) Inc., and Klondex Mines Ltd. | 6-K | 001-37563 | 99.2 | 08/05/2016 | ||
2.3 | Asset Purchase Agreement dated December 16, 2015, among Klondex Canada Ltd., Klondex Mines Ltd. and Shoreline Gold Inc. | 6-K | 001-37563 | 99.1 | 4/13/2016 | ||
3.1 | Notice of Articles of Klondex Mines Ltd. | S-8 | 333-215156 | 4.1 | 12/16/2016 | ||
3.2 | Articles of Klondex Mines Ltd. | S-8 | 333-215156 | 4.1 | 12/16/2016 | ||
10.1** | Klondex Mines Ltd. Share Incentive Plan | S-8 | 333-215156 | 4.2 | 12/16/2016 | ||
10.2 | Gold Purchase Agreement dated February 11, 2014, between Klondex Mines Ltd. and Franco-Nevada GLW Holdings Corp. | 40-F/A | 001-37563 | 99.129 | 9/21/2015 | ||
10.3** | Employment Agreement - Paul Huet | 8-K | 001-37563 | 10.2 | 3/15/2017 | ||
10.4** | Employment Agreement - Barry Dahl | 8-K | 001-37563 | 10.1 | 3/15/2017 | ||
10.5** | Employment Agreement - John Seaberg | 8-K | 001-37563 | 10.3 | 3/15/2017 | ||
10.6** | Employment Agreement - Michael Doolin | 8-K | 001-37563 | 10.5 | 3/15/2017 | ||
10.7** | Employment Agreement - Brian Morris | 8-K | 001-37563 | 10.4 | 3/15/2017 | ||
10.8** | Employment Agreement - John Antwi | 8-K | 001-37563 | 10.7 | 3/15/2017 | ||
10.9** | Employment Agreement - Brent Kristof | 8-K | 001-37563 | 10.6 | 3/15/2017 | ||
10.10 | Secured Revolving Facility Agreement dated March 23, 2016, between Klondex Mines Ltd. and Investec Bank PLC | 6-K | 001-37563 | 99.5 | 11/18/2016 | ||
10.11** | Klondex Mines Ltd. Share Option and Restricted Share Unit Plan | 6-K | 001-37563 | Schedule B of Exhibit 99.2 | 5/19/2016 | ||
10.12** | Klondex Mines Ltd. Deferred Share Unit Plan | X | |||||
10.13 | Amendment to Secured Revolving Facility Agreement between Klondex Mines Ltd. and Investec Bank PLC dated October 28, 2016 | 6-K | 001-37563 | 99.6 | 11/18/2016 | ||
21.1 | Subsidiaries of Klondex Mines Ltd. | X | |||||
23.1 | Consent of PricewaterhouseCoopers LLP | X | |||||
23.2 | Consent of Practical Mining LLC | X | |||||
23.3 | Consent of Mark Odell | X | |||||
23.4 | Consent of Laura Symmes | X | |||||
23.5 | Consent of Sarah Bull | X | |||||
23.6 | Consent of Karl Swanson | X | |||||
23.7 | Consent of Marek Nowak | X | |||||
23.8 | Consent of P&E Mining Consultants Inc. | X | |||||
23.9 | Consent of Eugene Puritch | X | |||||
87
23.10 | Consent of Alexandru Veresezan | X | |||||
23.11 | Consent of Fred Brown | X | |||||
23.12 | Consent of William Stone | X | |||||
23.13 | Consent of Alfred Hayden | X | |||||
23.14 | Consent of David Orava | X | |||||
23.15 | Consent of Kirk Rodgers | X | |||||
23.16 | Consent of Brian Morris | X | |||||
31.1 | Certification of Principal Executive Officer pursuant to Rule 13a-14(a)/ 15d-14(a) | X | |||||
31.2 | Certification of Principal Financial Officer pursuant to Rule 13a-14(a)/ 15d-14(a) | X | |||||
32.1 | Certification of Principal Executive Officer and Principal Financial Officer Pursuant to 18 U.S.C. 1350 | X | |||||
95.1 | Mine Safety Disclosure | X | |||||
99.1 | Amended and Restated Technical Report titled “Preliminary Feasibility Study for the Midas Mine, Elko County, Nevada” dated April 2, 2015, effective August 31, 2014 | 40-F | 001-37563 | 99.115 | 9/21/2015 | ||
99.2 | Technical Report titled “Technical Report for the Fire Creek Project, Lander County, Nevada” dated March 28, 2016, effective June 30, 2015 | 8-K | 001-37563 | 99.1 | 3/15/2017 | ||
99.3 | Technical Report titled “Independent Technical Report for the Hollister Gold Project, Nevada, USA” dated October 25, 2016, effective May 30, 2016 | 6-K | 001-37563 | 99.2 | 11/18/2016 | ||
99.4 | Amended and Restated Technical Report titled “Technical Report and Pre-Feasibility Study on the True North Gold Mine, Bissett, Manitoba, Canada” dated November 22, 2016, effective June 30, 2016 | 8-K | 001-37563 | 99.2 | 3/15/2017 | ||
** | Management contracts or compensation plans or arrangements in which directors or executive officers are eligible to participate. | ||||||
88