Attached files
| file | filename |
|---|---|
| 8-K - 8-K - U.S. SILICA HOLDINGS, INC. | d468235d8k.htm |
Barclays ISP Call February 8, 2018 Exhibit 99.1
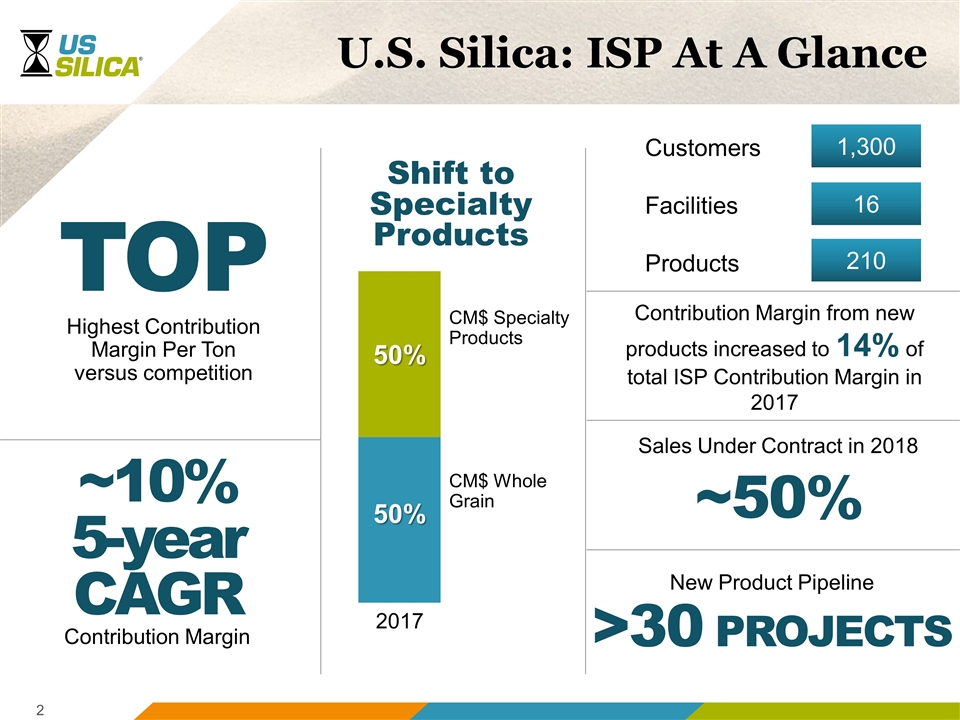
U.S. Silica: ISP At A Glance CM$ Specialty Products CM$ Whole Grain 2017 Contribution Margin from new products increased to 14% of total ISP Contribution Margin in 2017 ~10% 5-year CAGR Contribution Margin >30 PROJECTS New Product Pipeline ~50% Sales Under Contract in 2018 Shift to Specialty Products TOP Highest Contribution Margin Per Ton versus competition Customers Facilities Products 1,300 16 210
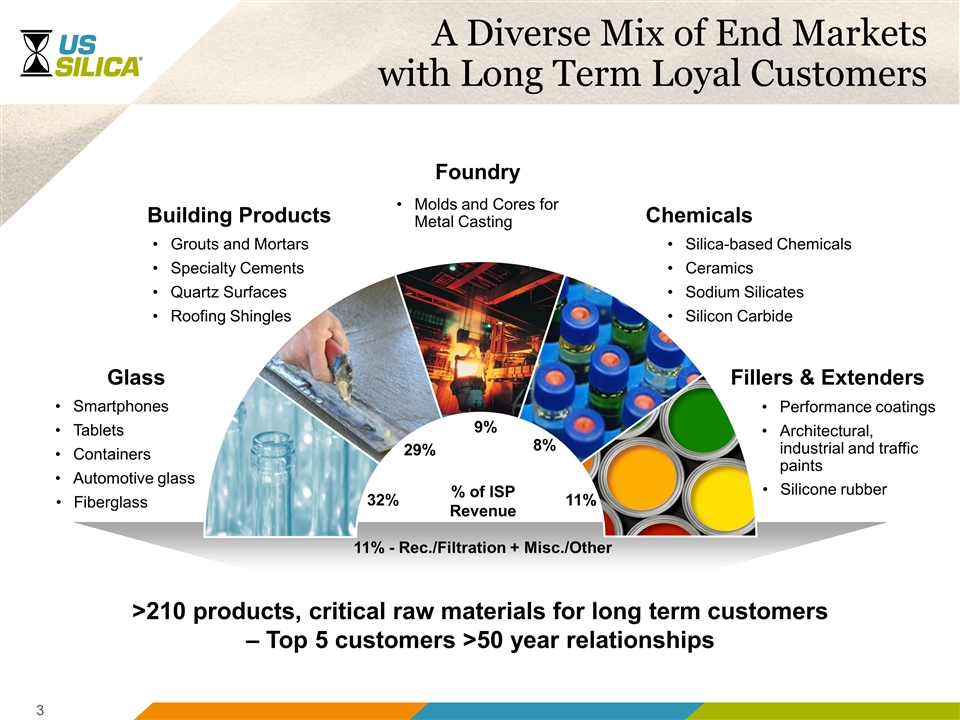
A Diverse Mix of End Markets with Long Term Loyal Customers >210 products, critical raw materials for long term customers – Top 5 customers >50 year relationships Glass Building Products Foundry Chemicals Fillers & Extenders Smartphones Tablets Containers Automotive glass Fiberglass Performance coatings Architectural, industrial and traffic paints Silicone rubber Silica-based Chemicals Ceramics Sodium Silicates Silicon Carbide Grouts and Mortars Specialty Cements Quartz Surfaces Roofing Shingles Molds and Cores for Metal Casting % of ISP Revenue 32% 29% 9% 8% 11% 11% - Rec./Filtration + Misc./Other
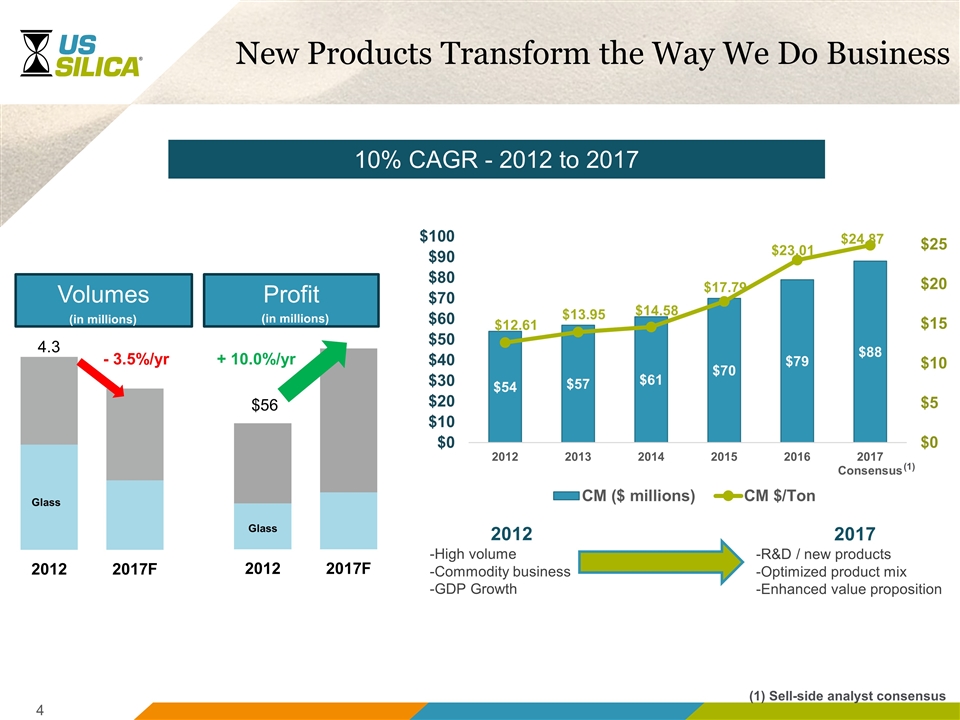
New Products Transform the Way We Do Business 2012 -High volume -Commodity business -GDP Growth 2017 -R&D / new products -Optimized product mix -Enhanced value proposition 10% CAGR - 2012 to 2017 (1) Sell-side analyst consensus (1) Glass Volumes - 3.5%/yr + 10.0%/yr Profit (in millions) (in millions)
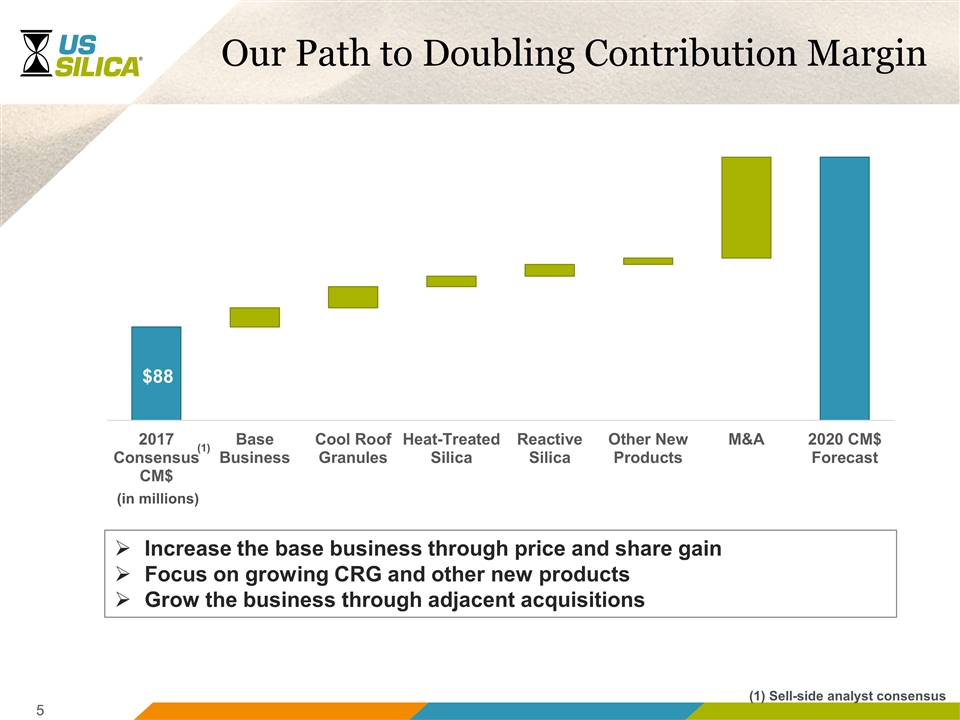
Our Path to Doubling Contribution Margin Increase the base business through price and share gain Focus on growing CRG and other new products Grow the business through adjacent acquisitions $88 (in millions) (1) Sell-side analyst consensus (1)
Questions?
