Attached files
| file | filename |
|---|---|
| 8-K - FORM 8-K - REX ENERGY CORP | d508630d8k.htm |
| EX-99.4 - EX-99.4 - REX ENERGY CORP | d508630dex994.htm |
| EX-99.3 - EX-99.3 - REX ENERGY CORP | d508630dex993.htm |
| EX-99.2 - EX-99.2 - REX ENERGY CORP | d508630dex992.htm |
 CORPORATE PRESENTATION January 2018 Exhibit 99.1 DRAFT FRE 408 Settlement Communication; Not admissible for any purpose; For discussion purposes only
|
 Disclosures 2 Forward Looking Statements Statements in this presentation that are not historical facts are “forward-looking statements” within the
meaning of Section 27A of the Securities Act of 1933, as amended, and Section 21E of the Securities Exchange Act of 1934, as amended. We believe these statements and the assumptions and estimates contained in this presentation are reasonable based
on information that is currently available to us. However, management’s assumptions and the company’s future performance are subject to a wide range of business risks and uncertainties, both known and unknown, and we cannot assure
that the company can or will meet the goals, expectations and projections included in this presentation. Any number of factors could cause our actual results to be materially different from those expressed or implied in our forward
looking statements, including (without limitation): economic conditions in the United States and globally; domestic and global supply and demand for oil, natural gas liquids (“NGLs”) and natural gas; realized prices for oil,
natural gas and NGLs and volatility of those prices; the adequacy and availability of capital resources, credit and liquidity, including, but not limited to, access to additional borrowing capacity and our inability to generate sufficient cash flow from
operations to fund our capital expenditures and meet working capital needs; our ability to comply with restrictions imposed by our term loan credit agreement, secured and unsecured indentures, and other existing and future financing arrangements;
our ability to service our outstanding indebtedness; impairments of our natural gas, NGL and condensate asset values due to declines in commodity prices; conditions in the domestic and global capital and credit markets and their
effects on us; new or changing government regulations, including those relating to environmental matters, permitting or other aspects of our operations; the willingness and ability of the Organization of Petroleum Exporting Countries
to set and maintain oil price and production controls; the geologic quality of our properties with regard to, among other things, the existence of hydrocarbons in economic quantities; uncertainties inherent in the estimates of our natural
gas, NGL and condensate reserves; our ability to increase natural gas, NGL and condensate production and income through exploration and development; drilling and operating risks; counterparty credit risks; the success of our drilling
techniques in both conventional and unconventional reservoirs; the success of the secondary and tertiary recovery methods we utilize or plan to employ in the future; the number of potential well locations to be drilled, the cost to
drill, and the time frame within which they will be drilled; the ability of contractors to timely and adequately perform their drilling, construction, well stimulation, completion and production services; the availability of equipment, such as
drilling rigs, and infrastructure, such as transportation pipelines, processing and midstream services; the effects of adverse weather or other natural disasters on our operations; competition in the oil and gas industry in general, and specifically
in our areas of operation; changes in our drilling plans and related budgets; the success of prospect development and property acquisition; the success of our business and financial strategies and hedging strategies; uncertainties related to
the legal and regulatory environment for our industry, and our own legal proceeding and their outcome; and our ability to maintain the listing of our securities on the NASDAQ Capital Market or any other exchange on which our securities trade.
Further information on the risks and uncertainties that may affect our business is available in the company’s filings with the SEC, and we strongly encourage readers to review and understand those risks. We do not assume or undertake
any obligation to publicly update or revise any forward-looking statements, whether as a result of new information, future events, or otherwise. Presentation of Information The estimates of reserves in this presentation are based on a reserve report of our independent external reserve engineers
as of December 31, 2017. We believe the data we prepared and supplied to our external reservoir engineers in connection with their preparation of the December 31, 2017 reserve report, and the assumptions, forecasts, and estimates
contained therein, are reasonable; however we cannot assure that they will prove to have been correct. Estimates of reserves can be affected by inaccurate assumptions or by known or unknown risks and uncertainties. In this presentation,
references to Rex Energy, Rex, REXX, the Company, we, our and us refer to Rex Energy Corporation and its subsidiaries. Unless otherwise noted, all references to acreage holdings are as of December 01, 2017 and are rounded to the
nearest hundred. All financial information excludes discontinued operations unless otherwise noted. All estimates of internal rate of return (IRR) are before tax. Hydrocarbon Volumes The SEC permits publicly-reporting oil and gas companies to disclose “proved reserves” in their filings with
the SEC. “Proved reserves” are estimates that geological and engineering data demonstrate with reasonable certainty to be recoverable in future years from known reservoirs under existing economic and operating conditions. SEC rules also permit
the disclosure of “probable” and “possible” reserves. Rex Energy discloses proved reserves but does not disclose probable or possible reserves. We may use certain broader terms such as “resource potential,” “EUR”
(estimated ultimate recovery of resources, defined below) and other descriptions of volumes of potentially recoverable hydrocarbons throughout this presentation. These broader classifications do not constitute “reserves” as defined by the SEC
and we do not attempt to distinguish these classifications from probable or possible reserves as defined by SEC guidelines. In addition, we are prohibited from disclosing hydrocarbon quantities that do not constitute reserves in documents filed with
the SEC. The company defines EUR as the cumulative oil and gas production expected to be economically recovered from a reservoir or individual well from initial production until the end of its useful life. Our estimates of
EURs and resource potential have been prepared internally by our engineers and management without review by independent engineers. These estimates are by their nature more speculative than estimates of proved, probable and possible
reserves and accordingly are subject to substantially greater uncertainty of being actually realized. We include these estimates to demonstrate what we believe to be the potential for future drilling and production by the company.
Ultimate recoveries will be dependent upon numerous factors including actual encountered geological conditions, the impact of future oil and gas pricing, exploration and development costs, and our future drilling decisions and budgets
based upon our future evaluation of risk, returns and the availability of capital and, in many areas, the outcome of negotiation of drilling arrangements with holders of adjacent or fractional interest leases. Estimates of resource
potential and other figures may change significantly as development of our resource plays provide additional data and therefore quantities that may ultimately be recovered will likely differ materially from these estimates.
Potential Drilling Locations
Our estimates of potential drilling locations are prepared
internally by our engineers and management and are based upon a number of assumptions inherent in the estimating process. Management, with the assistance of engineers and other professionals, as necessary, conducts a topographical analysts of our unproved prospective acreage to identify
potential well pad locations using operationally approved designs and considering several factors, which may include but are not limited to access roads, terrain, well azimuths, and well pad sizes. For our operations in Pennsylvania, we then
calculate the number of horizontal well bores for which the company appears to control sufficient acreage to drill the lateral wells from each potential well pad location to arrive at an estimated number of net potential drilling locations.
For our operations in Ohio, we calculate the number of horizontal well bores that may be drilled from the potential well pad and multiply this by the company’s net working interest percentage of the proposed unit and arrive at an estimate
number of net potential drilling locations. In both cases, we then divide the unproved prospective acreage by the number of net potential drilling locations to arrive at an average well spacing. Management uses these estimates to, among
other things, evaluate our acreage holdings and formulate plans for drilling. Any number of factors could cause the number of wells we actually drill to vary significantly form these estimates, including, without limitation, the
availability of capital, drilling and production costs, commodity prices, availability of drilling services and equipment, lease expirations and regulatory approvals. DRAFT FRE 408 Settlement Communication; Not admissible for any purpose; For discussion purposes only
|
 Executive Summary DRAFT FRE 408 Settlement Communication; Not admissible for any purpose; For discussion purposes only
|
 DRAFT FRE 408 Settlement Communication; Not admissible for any purpose; For discussion purposes only
Company Overview
4
Appalachian Basin
Net
Acreage
~98,000
Warrior North
Net
Acreage
~11,800
Butler Operated
Net
Acreage
~76,000
Non-Operated
Net
Acreage
~10,200
Production
(1)
3Q17A
182.0 Mmcfe/d
4Q17E
~205.1
Mmcfe/d
4Q17E Exit Rate
~215.2 Mmcfe/d
2017E
~184.1 Mmcfe/d
2018E
250.0 –
260.0 Mmcfe/d
2019E
285.0 –
295.0 Mmcfe/d
Capital
Expenditures
(1)
2017 Net Operational
Capex
~$133.5 million
2018 Net Operational Capex
$105.0 -
$125.0 million
Estimated Production Growth Rate
35% -
45%
2019 Net Operational Capex
$60.0
-
$75.0
million
Estimated Production Growth Rate
10% -
20%
Total
Proved Reserves
2017 Base Proved Reserves/$PV10
3,848 Bcfe/$892.4 MM
2017 PDP Reserves/$PV10
969 Bcfe/$504.6
MM
Rex Energy is a pure-play Appalachian Basin focused company
targeting wet- gas windows in the Pennsylvania
Marcellus and Ohio Utica Shales (1)
Estimates based on Growth Plan
|
 Investment Highlights 5 Best in Class Human Capital Safety is Rex Energy’s #1 priority Core team has been together for six years Rex’s success is directly correlated to its employees’ success
Focused on developing and retaining our existing
talent Ability to run 2-3 rig program with
current team High Quality Acreage
Position Highly contiguous acreage position in the
Appalachian Basin Large multi-year inventory of
~900+ gross/690 net liquids-rich drilling locations Average Working Interest: 74%; Average NRI: 63% 99% of acreage held by production Ready for multi-well pad development Multiple horizons: Upper Devonian, Marcellus and Utica formations
Current HBP holds all depths –
Marcellus, Upper Devonian Burkett, Dry Gas Utica and
Rhinestreet formations
Prolific
Resource
Proven formations: Marcellus, Upper Devonian and
Utica Derisked
existing acreage with over 200 gross wells placed into sales as
of 12/31/2017 Year-End 2017 PDP Reserves: 969
Bcfe; PV10: $504.6 million Year-End 2017 Base
Proved Reserves: 3,848 Bcfe; PV10: $892.4 million
Cost and Capital Efficiency Improvements
HBP acreage allows for flexibility in choosing future locations
to drill and complete Capital spend is focused on
best areas of the assets to maximize returns
Enhanced completion design and longer laterals results in
maximized financial returns Established supply
chain program that ensures Rex is getting the best value possible from its service providers Drilling and Completion Enhancements Average drilling days reduced to 11.1 days in 2017 vs. 16.6 days in 2014 while increasing lateral length by ~2,600’
during same period
Increased completion stages per day: 5.5 stages/day in 2017 vs.
4.1 stages/day in 2016; more recent jobs 7-10 stages / day Conducted a comprehensive performance analysis with third party engineering firm on over 160 wells to produce a more
optimal completion design
Comprehensive water management plans
Marketing and Processing Strategy
Recent NGL marketing agreement with BP allows for consistent
liquids cash flow and eliminates seasonality
Diversified marketing strategy and active hedging minimizes
exposure to large fluctuations in commodity prices and gas basis differentials Anchor/shipper with MarkWest facilities in Butler County Extensive Geology and Reservoir Insight Drilled over 220 wells in the Appalachian Basin Large inventory of logs and cores performed over the past six years
Developed best practices for optimal drilling performance and
completion techniques Minimal science required to
unlock optimal value DRAFT
FRE 408 Settlement Communication; Not admissible for any purpose;
For discussion purposes only |
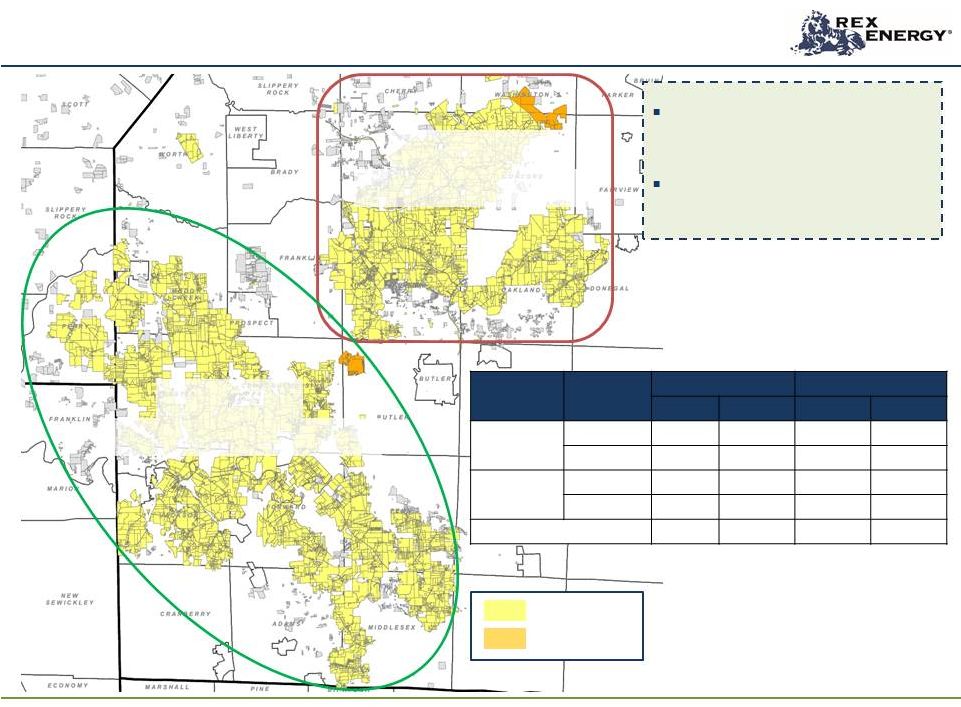
 Rex has secured ~928 gross/ ~690 net “wet gas” locations
Leasing additional infill acres in Moraine East potentially adds
~160 locations In addition to the “wet gas”
locations identified above, Rex has secured
approximately 400 dry gas Utica locations in the Butler Legacy and
Moraine East areas
Current HBP holds all depths –
Marcellus, Upper Devonian, Utica & Rhinestreet
“Wet Gas” Acreage and Well Counts
Area
Formation
Acres
Well Count
Gross
Net
Gross
Net
Legacy
Marcellus
63,000
44,300
251
177
Burkett
63,000
44,300
318
222
Moraine
East
Marcellus
36,000
31,700
175
141
Burkett
36,000
31,700
154
125
Warrior North
Utica
13,000
11,800
30
25
Total
211,000
163,800
928
690
“Stacked Pay” Effect
6
DRAFT
FRE 408 Settlement Communication; Not admissible for any purpose;
For discussion purposes only |
 DRAFT FRE 408 Settlement Communication; Not admissible for any purpose; For discussion purposes only
Management Profiles
Tom Stabley –
President & Chief Executive Officer
Co-founder of Rex Energy in 2003 –
managed various partnerships
that eventually were consolidated into Rex Energy
Guided the company through reorganization and consolidation that
resulted in Rex Energy’s IPO in 2007 Over 20
years of expertise in capital markets, financial reporting, corporate finance and strategic planning Robert Ovitz – Chief Operating Officer Joined Rex Energy in 2014 Over 30 years of extensive technical experience in drilling, completions and HSE as well as leading and managing business
organizations within the E&P
space Prior to joining Rex, he was a Senior
Operations Manager for Noble Energy in the Appalachian Basin where he built Noble Energy’s operational team and presence in the basin
Curt Walker –
Chief Financial Officer
Joined Rex Energy in 2007
Over 15 years experience in accounting, financial reporting,
corporate finance and strategic planning Previous
experience with YRC Worldwide, a Fortune 500 company
Dave
Pratt –
Senior Vice President & Exploration Manager
Joined Rex Energy in 2008
Over 30 years experience as a senior geologist working on
projects located throughout the United States
Previous experience in geology with Cabot Oil & Gas, Texaco,
Sohio Petroleum and Ensource & Enstar Mike Eck
– Senior Vice President, Risk
Management Joined Rex Energy in 2010
Over 18 years experience in risk management, process
re-engineering and audit Responsible for the
oversight of Rex Energy’s HSE function, Procurement department and Internal Audit group F. Scott Hodges – Senior Vice President, Land & Business Development Joined Rex Energy in 2010 Over 20 years experience in acquisition and management of mineral and surface rights and business development
Previous experience as Regional Land Manager for Consol Energy
from 1997 - 2010
Mike
Endler –
Vice President, Basin Manager
Joined Rex Energy in 2011
Over 15 years experience in engineering and
operations Previous experience in consulting for
the oil and gas industry, specializing in surface facilities and water management Registered Professional Engineer Darren Springinatic – Senior Director, Marketing Joined Rex Energy in 2012 Over 15 years experience in oil and gas marketing in the U.S. and Canada
Previous experience in oil and gas marketing with Bonavista
Petroleum and Hunt Oil Abhinav Sharma
–
Director, Reservoir Engineering
Joined Rex Energy in 2010
Over 10 years experience in reservoir engineering
Masters in Petroleum Engineering from University of Texas,
Austin 7 |
 DRAFT FRE 408 Settlement Communication; Not admissible for any purpose; For discussion purposes only
8
Production (Mmcfe/d)
(1)
LOE ($/Mcfe)
Key Metrics: 2014 –
2020E
Cash G&A ($/Mcfe)
154.4
183.8
195.3
180.0 –
190.0
250.0 –
260.0
280.0 –
300.0
290.0 –
310.0
0.0
50.0
100.0
150.0
200.0
250.0
300.0
350.0
2014
2015
2016
2017E
2018E
2019E
2020E
$1.94
$1.84
$1.78
$1.77 -
$1.82
$1.55 -
$1.60
$1.52 -
$1.57
$1.51 -
$1.56
$0.00
$0.50
$1.00
$1.50
$2.00
$2.50
2014
2015
2016
2017E
2018E
2019E
2020E
$0.82
$0.75
$0.54
$0.23 -
$0.28
$0.15 -
$0.20
$0.14 -
$0.19
$0.14 -
$0.19
$0.00
$0.20
$0.40
$0.60
$0.80
$1.00
2014
2015
2016
2017E
2018E
2019E
2020E
(1)
Estimates based on Growth Plan
|
 Joint Ventures DRAFT FRE 408 Settlement Communication; Not admissible for any purpose; For discussion purposes only
|
 Joint Venture Summary 10 Benefit Street Partners (BSP) $175.0 million in initial consideration with $134.0 million committed and funded to date BSP’s initial capital and well commitment has ended BSP has elected into an additional seven JV AMI wells to date at a working interest of 15% - 20% ArcLight All 32 wells have been drilled and placed into service $67.6 million contributed 17.5% reverts to Rex upon ArcLight achieving hurdle rate Sumitomo Through JV, Sumitomo has 30% interest in Legacy Butler AMI Other interests in non-operated areas Joint Venture Summary ($ in millions) Benefit Street Partners ArcLight Sumitomo Date March 2016 March 2015 August 2010 Type Joint Exp./Dev. Agreement Drilling Participation & Exploration Area Moraine East/Warrior North Legacy Butler/Moraine East Legacy Butler AMI Yes Wellbore Only Yes # of wells participated 47 32 139 Acres (Gross/Net) Warrior North: 6,679/1,336 ME: 36,668/5,985 -- Butler Legacy: 63,000/18,700 Partners WI% Initial Wells – 65% 35.0% 30.0% Consideration $175.0 -- -- Commitment $134.0 -- -- Contributed to Date $134.0 $67.6 -- Int. Reversion N/A IRR/ROI hurdle rates N/A Other BSP earned assigned of 15%-20% in acreage located within each unit -- -- DRAFT FRE 408 Settlement Communication; Not admissible for any purpose; For discussion purposes only
|
 Appalachia Benchmarking DRAFT FRE 408 Settlement Communication; Not admissible for any purpose; For discussion purposes only
|
 Marcellus Performance Benchmarking 12 EUR (Bcfe) / 1,000 ft. 3.18 3.25 2.15 2.40 2.71 2.46 2.16 2.00 2.95 2.40 2.52 4.40 2.66 1.60 Butler Central Butler South Moraine East Core Highly Rich Gas/Cond. Highly Rich Gas Rich Gas Dry Gas SW PA Wet SW PA Rich SW PA Dry Lower SW PA Condensate Source: Company presentations and filings, TPH Research, Wall Street consensus estimates as compiled by
FaceSet as of 12/14/2017
Note: Rex calculations based on November 2017 IR presentation.
Peers based on most recently disclosed Marcellus estimates Peers include AR, CNX, COG, ECR, EQT, and RRC REXX Peer 1 Peer 2 Peer 3 Peer 4 Peer 5 Peer 6 D&C ($MM) / 1,000 ft. $0.89 $0.87 $0.92 $0.93 $0.93 $0.93 $0.93 $0.82 $0.86 $0.69 $0.94 $0.84 $0.86 Butler Legacy Moraine East Core Highly Rich Gas/Cond. Highly Rich Gas Rich Gas Dry Gas SW PA Wet SW PA Rich SW PA Dry Lower SW PA Condensate Median: $0.92 Median: 2.49 DRAFT FRE 408 Settlement Communication; Not admissible for any purpose; For discussion purposes only
|
 DRAFT FRE 408 Settlement Communication; Not admissible for any purpose; For discussion purposes only
Operational & Financial Benchmarking
(1)
13
2017E-2018E Production Growth
39%
17%
21%
14%
18%
28%
31%
18%
REXX
Peer 1
Peer 2
Peer 3
Peer 4
Peer 5
Peer 6
Peer 7
Median:
18%
% Liquids (Reserve Based)
43%
7%
39%
35%
3%
7%
15%
18%
REXX
Peer 1
Peer 2
Peer 3
Peer 4
Peer 5
Peer 6
Peer 7
Median:
15%
Production Investment Rate ($/Mcfed)
(2)
Inventory Life –
Years
(3)
$647
$2,203
$1,314
$1,586
$1,530
$1,366
$1,765
$2,475
REXX
Peer 1
Peer 2
Peer 3
Peer 4
Peer 5
Peer 6
Peer 7
Median:
$1,586
37
23
18
19
29
6
15
12
REXX
Peer 1
Peer 2
Peer 3
Peer 4
Peer 5
Peer 6
Peer 7
Median:
18
Source: TPH Research, Wall Street consensus estimates as compiled
by FactSet of 12/14/2017
Note: Rex forecasts and inventory calculations based on November
2017 IR Presentation Peers include AR, CNX, COG,
ECR, EQT, GPOR and RRC (1)
Based on Growth Plan projections
(2)
2018E
Capex spend/(2018E production less 2017E declined production).
Assumes 20% base decline for 2017E (3)
For Rex, based on 25 wells per year.
|
 DRAFT FRE 408 Settlement Communication; Not admissible for any purpose; For discussion purposes only
Operational & Financial Benchmarking
(1)
14
Hedge Profile (% of 2018E Production)
(2)
56%
38%
73%
39%
1%
63%
74%
47%
REXX
Peer 1
Peer 2
Peer 3
Peer 4
Peer 5
Peer 6
Peer 7
2018E PDP
Hedge Profile:
64%
Median:
47%
In-Basin Sales Exposure (% of 2018E NG Production)
54%
48%
26%
54%
77%
REXX
Peer 1
Peer 2
Peer 3
Peer 4
Median:
51%
G&A Burden (2018E G&A/Mcfe)
$0.17
$0.14
$0.13
$0.19
$0.07
$0.12
$0.12
$0.29
REXX
Peer 1
Peer 2
Peer 3
Peer 4
Peer 5
Peer 6
Peer 7
Median:
$0.13
Source: Company presentations and filings, TPH Research, Wall
Street consensus estimates as compiled by FactSet
as of 12/14/2017
Peers include AR, CNX, COG, ECR, EQT, GPOR and RRC
(1)
Based on Growth Plan projections
(2)
Includes volumes from all derivatives
|
 Butler Operated Area DRAFT FRE 408 Settlement Communication; Not admissible for any purpose; For discussion purposes only
|
 Legacy Area Moraine East Rex 70%/Sumitomo 30% Rex ~85%/BSP ~15% Area Lease Status Acres Well Count Gross Net Gross Net Legacy HBP/HBO 62,500 43,950 564 395 Pending 500 350 5 4 Moraine East HBP/HBO 35,000 30,700 329 266 Pending 1,000 1,000 -- -- Total: 99,000 76,000 898 665 Butler Operated Area Currently control 898 potential “wet gas” locations in the Butler Operated Area ~99% of these locations are held by production/operations HBP/HBO Pending 16 DRAFT FRE 408 Settlement Communication; Not admissible for any purpose; For discussion purposes only
|
 Gas pipeline from Moraine East Field Rex Energy Regional Office MarkWest Gas Processing Facilities Fresh Water Impoundment
Legacy Butler Operated Area
17
Contiguous acreage position of ~63,000 gross/44,300
net acres
Average working interest: 70%
Sumitomo JV: 30% WI in all wells
ArcLight: 35% WI in 16 wells (will revert to 17.5%)
Gross/Net Potential Locations: 569/399 based on 800’
spacing
Currently have 139 wells placed into sales:
127 Marcellus
10 Upper Devonian Burkett
2 Utica
Recent 5-day average wellhead inlet of 180
MMcf/d MarkWest
provides gas gathering and processing services
Total capacity: 410 MMcf/d
Capacity dedicated to Rex: 285 MMcf/d (inclusive
of JV partners); currently at 267 MMcf/d
Gas from Moraine East field flows into MarkWest
processing facility via Stonehenge pipeline
Four-Well Wilson Pad
Three extended laterals produced
at an average 5-day sales rate of
11.3 Mmcfe/d and 30-day sales
rate of 11.0 Mmcfe/d
Wells are still exhibiting strong
pressures
Legend:
DRAFT
FRE 408 Settlement Communication; Not admissible for any purpose;
For discussion purposes only |
 Enhanced Performance – Butler Legacy (1) Central 9.7 Bcfe EUR (80% ethane) 11.7 Bcfe EUR (80% ethane) 15.6 Bcfe EUR (80% ethane) 15.7 Bcfe EUR (80% ethane) 17.0 Bcfe EUR (80% ethane) 8.9 Bcfe EUR (55% ethane) 10.7 Bcfe EUR (55% ethane) 14.4 Bcfe EUR (55% ethane) 14.5 Bcfe EUR (55% ethane) 15.9 Bcfe EUR (55% ethane) 2013 2014 2015 2016 2017 Completion Reduced Cluster Spacing Reduced Cluster Spacing Reduced Cluster Spacing Reduced Cluster Spacing Reduced Cluster Spacing Gross Avg. 30- Day Wellhead Gas IP (Mcf/d) 3,175 3,683 4,736 4,458 4,234 1 Yr. Decline 50% 48% 44% 40% 33% Lateral Length 4,000’ 4,000’ 5,000’ 5,000’ 5,000 Stages / Spacing 27 / 150’ 33 / 150’ 33 / 150’ 33 / 150’ 33 / 150’ Frac Sand (#/ft) 1,800 2,000-2,200 2,200-2,500 2,200-2,500 2,200-2,500 All-In Cost $5.9 million $5.7 million $4.8 million $4.8 million $5.2 million WH EUR (bcf)/1,000’ 1.43 1.44 1.86 1.88 2.71 (1) See note on Hydrocarbon Volumes and disclaimers at beginning of presentation
18
17.3 Bcfe
EUR
(80% ethane)
16.2 Bcfe
EUR
(55% ethane)
2017
Reduced
Cluster
Spacing
5,535
36%
5,000
33 / 150’
2,200-2,500
$5.2 million
3.01
South
st
DRAFT
FRE 408 Settlement Communication; Not admissible for any purpose;
For discussion purposes only |
 Legacy Butler Marcellus Economics (1) Marcellus Economics (55% Ethane Recovery) (2) (1) See note on Hydrocarbon Volumes and disclaimers at beginning of presentation.
(2)
Economics reflect
55% ethane recovery.
(3)
Average 5-year C3+ differential approx. 52% of Oil, C2
differential approx. is 19% of Oil. (4)
Historical price differentials applied to Condensate. Gas price
differential dependent on future development plans and futures price differentials to Rex markets. (5) Strip Pricing as of 11.13.2017 – Oil: 2018: $56.63, 2019: $54.04, 2020: $52.47, 2021: $51.81 , 2022: $51.75 // Gas: 2018: $3.02, 2019: $2.92, 2020: $2.86, 2021: $2.87, 2022: $2.88 (6) 2016 EUR adjusted for net reserves 19 Butler Central 3rd Party YE16 Butler Central 3rd Party YE17 Butler South 3rd Party YE16 Butler South 3rd Party YE17 All-in Well Cost $6.0 million $6.0 million $6.0 million $6.0 million Lateral Length 6,700 ft 6,700 ft 6,700 ft 6,700 ft BCFE/1000ft (6) (55% C2) 2.21 3.18 2.12 3.25 % Liquids (55% C2) 35% 35% 28% 28% EUR (Bcfe) (6) 80% / 55% C2 15.8 14.8 22.8 21.3 15.1 14.2 23.1 21.7 IRR (3,4,5) $3.00 NYMEX Oil Price: 2017+: $60 34% 38% 25% 34% $3.00 NYMEX Oil Price: 2017+: $55 30% 33% 23% 30% $3.25 NYMEX Oil Price: 2017+: $55 36% 39% 29% 38% Strip Pricing 28% 31% 20% 28% Avg. 30-day sales rate (MMcfe/d) 8.0 – 11.0 8.0 – 11.0 8.0 – 11.0 8.0 – 11.0 0.0 2.0 4.0 6.0 8.0 10.0 12.0 14.0 0 2,000 4,000 6,000 8,000 10,000 12,000 0 10 20 30 40 50 60 Production Month Butler South -3rd Party YE16 Butler South -3rd Party YE17 DRAFT FRE 408 Settlement Communication; Not admissible for any purpose; For discussion purposes only
Butler Central -3rd Party YE16
Butler Central -3rd Party YE17
|
 Production linearly adjusted to 5,000ft equivalent lateral
Plotted above are 28 representative wells in Butler
Central with RCS completions Butler Central Type Curve
Evolution- Adjusted
20
100
1,000
10,000
0
5
10
15
20
25
30
35
40
45
50
55
60
65
70
75
80
Months
DRAFT
FRE 408 Settlement Communication; Not admissible for any purpose;
For discussion purposes only |
 Production linearly adjusted to 5,000ft equivalent lateral
Plotted above are 17 representative wells in Butler
South with RCS completions Butler
South
Type
Curve
Evolution-
Adjusted
21
100
1,000
10,000
0
5
10
15
20
25
30
35
40
45
50
55
60
65
70
75
80
Months
DRAFT
FRE 408 Settlement Communication; Not admissible for any purpose;
For discussion purposes only |
 Moraine East DRAFT FRE 408 Settlement Communication; Not admissible for any purpose; For discussion purposes only
|
 Legend: Gas Pipeline (Stonehenge) Perm. In-Ground Waterline Stonehenge - high pressure discharge line to MarkWest processing facility Renick Impoundment Fleeger-2 Impoundment Oakland Twp. Impoundment Stonehenge – Renick Compressor Station Lake Oneida – primary water source Estimated current total to MarkWest: Legacy Butler - 180 MMcfd Moraine East - 87 MMcfd 267 MMcfd Moraine East Area 23 Contiguous acreage position of ~36,000 gross/31,700 net acres Average working interest: 85% Gross/Net Potential Locations: 329/266 based on 800’
spacing
Leasing additional acreage adds ~160 potential gross
locations
Currently have 37 wells placed into sales:
30 Marcellus
7 Upper Devonian Burkett
Recent 5-day average wellhead inlet of 87
MMcf/d Gas gathering and field compression by
provided by Stonehenge
Gas from Moraine East field flows into MarkWest
processing facility via Stonehenge pipeline
DRAFT
FRE 408 Settlement Communication; Not admissible for any purpose;
For discussion purposes only |
 Moraine East Area – Recent Developments 24 Three-well Manuel pad Drilled to an average lateral length of ~6,750 feet Placed into sales in 4Q17 Two-well Frye pad Drilled to an average lateral length of ~6,300 feet 24-hour sales rate per well of 9.4 Mmcfe/d On a per lateral foot basis, highest rates achieved in Moraine
East
30-day sales rate per well of 8.5 Mmcfe/d
Six-well Shields pad
24-hour sales rate per well of 9.2 Mmcfe/d
30-day sales rate per well of 7.9 Mmcfe/d
In-line with economic projections for 2017 Moraine East
program
Four-well Mackrell
pad
Drilled to an average lateral length of ~7,630
24-hour sales rate per well of 8.4 Mmcfe/d
Four-well Baird pad
24-hour sales rate of 10.1 Mmcfe/d
Two Marcellus wells produced at an average 24-hour sales
rate per well of 12.1 Mmcfe/d
Baird 4H produced 213 bbls/d of condensate, representing the
highest condensate rate achieved in the Butler
Operated Area 30-day sales rate of 7.3
Mmcfe/d Upcoming
developments
Fourth compressor station expected to be in service in early
January 2018
Four-well Kern pad expected to be placed into sales in March
2018 Average lateral length of
8,500’ 100% working interest
DRAFT
FRE 408 Settlement Communication; Not admissible for any purpose;
For discussion purposes only |
 Moraine East Sample Unit Development 25 Initial Development 2 nd Wave of Development 3 rd Wave of Development Future Development 3 wave of development will require new pad site Focus on one of the units (ie: southwest unit) Drill 8-12 wells with avg lateral length 6,000 - 7,000 feet Repeat process for next unit (ie: southeast unit) Initial development of 4 PDP Wells ~4,000 acres are held by production (HBP) within the units Initial wells hold all depths and formation Infrastructure designed to support future development Future development of the remaining ~20-40 wells will follow a similar process Using existing pads and infrastructure will provide strong capital efficiencies Anticipate developing 8 – 12 wells at a time 2 wave of development will focus on one of the units (ie: northeast unit) Use existing pad sites Drill 8-12 wells with avg lateral length 6,000 - 7,000 feet Repeat process for next unit (ie: southeast unit) nd rd DRAFT FRE 408 Settlement Communication; Not admissible for any purpose; For discussion purposes only
|
 Achievable Performance Improvements in ME 26 After analyzing the production data from existing
Moraine East wells the latest 2017 wells have been
completed with optimized completion
techniques. Proppant loading, stage size,
water ratio, treatment rates, and other
variables have been optimized to improve
performance of latest wells. These latest
wells have been placed at optimized lateral
spacing of ~800 ft. In the past, the Moraine East
adjacent wells were spaced between 600 to
750 ft. Performance of longer
laterals is being tested in the Shields
and Mackrell pads. One of the wells is
greater than 10,000 ft.
Frye wells, which were the last set of wells to be
completed in Moraine East, suggest that
the casing pressure is holding steady for
longer and the productivity of these
wells is superior to wells completed with
previous generation techniques.
Peak monthly production rates on per foot basis for
2017 ME wells are higher than earlier
generation completion wells at lower
choke size. With these optimized
techniques, Rex hopes to unlock more
reserves in the future wells in ME. 8 Gray
wells in the planning phase to be D&C in 2018.
Optimized Completions
Earlier Gen. Completions
0.48
0.45
0.49
0.55
0.46
0.46
0.70
0
10
20
30
40
50
60
0
0.1
0.2
0.3
0.4
0.5
0.6
0.7
Fleeger
Gray
Renick
Fleeger-2
Shields
Mackrell
Frye
DRAFT
FRE 408 Settlement Communication; Not admissible for any purpose;
For discussion purposes only |
 Moraine East Economics (1) Marcellus Economics (55% Ethane Recovery) (2) (1) See note on Hydrocarbon Volumes and disclaimers at beginning of presentation.
(2)
Economics reflect
55% ethane recovery.
(3)
Average 5-year C3+ differential approx. 52% of Oil, C2
differential approx. is 19% of Oil. (4)
Historical price differentials applied to Condensate. Gas price
differential dependent on future development plans and futures price differentials to Rex markets. (5) Strip Pricing as of 11.13.2017 – Oil: 2018: $56.63, 2019: $54.04, 2020: $52.47, 2021: $51.81 , 2022: $51.75 // Gas: 2018: $3.02, 2019: $2.92, 2020: $2.86, 2021: $2.87 , 2022: $2.88 (6) 2016 EUR adjusted for net reserves 27 0.0 2.0 4.0 6.0 8.0 10.0 12.0 14.0 0 1,000 2,000 3,000 4,000 5,000 6,000 7,000 8,000 9,000 0 10 20 30 40 50 60 Production Month ME 3rd Party YE16 ME 3rd Party YE17 REX ME 2017 Program ME 3rd Party YE16 ME 3rd Party YE17 Rex ME 2017 Program All-in Well Cost $6.5 million $6.5 million $6.5 million Lateral Length 7,500 ft 7,500 ft. 7,500 ft. BCFE/1000ft (6) (55% C2) 1.34 1.74 2.15 % Liquids (55% C2) 39% 40% 39% EUR (Bcfe) (6) 80% / 55% C2 10.7 10.0 13.9 13.0 17.3 16.1 IRR (3,4,5) $3.00 NYMEX Oil Price: 2017+: $60 20% 21% 26% $3.00 NYMEX Oil Price: 2017+: $55 17% 18% 23% $3.25 NYMEX Oil Price: 2017+: $55 20% 21% 26% Strip Pricing 15% 16% 21% Avg. 30-day sales rate (MMcfe/d ) 6.5 - 9.5 5.0 – 8.0 5.0 – 8.0 DRAFT FRE 408 Settlement Communication; Not admissible for any purpose; For discussion purposes only
|
 Production linearly adjusted to a 6,000ft equivalent lateral and adjusted for downtime
Average lateral length of existing wells is 6,600 ft.
Average lateral length for 2017 wells is 7,500 ft Wells production flattening since the onset of compression. New production behavior since
compression. PDP
Wells
(North
ME)
are
currently
tracking
1.94
bcfe/1000ft
type
curve.
More
data
needed
to
define
EUR
with
certainty.
Moraine East vs. Type Curve
Compression commencement
month for first 12 wells
28
0 500 1,000 1,500 2,000 2,500 3,000 3,500 4,000 4,500 5,000 1 2 3 4 5 6 7 8 9 10 11 12 13 14 15 16 17 18 19 20 21 22 23 24 25 26 27 28 29 30 Month DRAFT FRE 408 Settlement Communication; Not admissible for any purpose; For discussion purposes only
|
 Warrior North DRAFT FRE 408 Settlement Communication; Not admissible for any purpose; For discussion purposes only
|
 Warrior North Area 30 Contiguous acreage position of ~13,000 gross/11,800 net acres Average working interest: 95% Gross/Net Potential Locations: 30/25 based on 800’ spacing Currently have 25 wells placed into sales Gas gathering and field compression by provided by BlueRacer; gas processed at Natrium facility NGLs marketed by BlueRacer Wells average ~70% liquids production Strong optionality to condensate production TPL-7 BlueRacer gathering pipeline Three-well Jenkins pad placed into sales on 12/26/2017; 100% WI Seven-well Goebeler pad expected to be placed into sales in April 2018; 71% WI DRAFT FRE 408 Settlement Communication; Not admissible for any purpose; For discussion purposes only
|
 (1) See note on Hydrocarbon Volumes and disclaimers at beginning of presentation.
(2)
Economics reflect
55% ethane recovery.
(3)
Historical price differentials applied to Condensate. Futures
differentials applied for gas production for all scenarios. (4) Average 5-year C3+ differential approx. 56% of Oil, C2 differential approx. is 15% of Oil.
(5)
Strip
Pricing
as
of
11.13.2017
–
Oil:
2018:
$56.63,
2019:
$54.04,
2020:
$52.47,
2021:
$51.81
,
2022:
$51.75
//
Gas:
2018:
$3.02,
2019:
$2.92,
2020:
$2.86,
2021:
$2.87
,
2022:
$2.88.
(6)
2016 EUR adjusted for net reserves
Warrior North Economics
(1)
3rd Party
YE16
3rd Party
YE17
Life Yield=54
3rd Party
YE17
Life Yield=60
Rex Upside
Case 2017
All-in Well Cost
$6.8 million
$6.8 million
$6.8 million
$6.8 million
Lateral Length
6,500 ft
6,500 ft
6,500 ft
6,500 ft
BCFE/1000ft
(6)
1.03
1.05
1.07
1.42
%
Liquids
51%
49%
50%
51%
EUR (MMBOE)
(6)
1.11
1.14
1.16
1.53
IRR
(3,4,5)
$60
52%
35%
43%
55%
40%
27%
33%
44%
43%
29%
35%
46%
40%
26%
32%
43%
Avg. 30-day sales rate (MBOE/d)
1.3 –
1.7
1.2 –
1.6
1.2 –
1.6
1.2 –
1.6
Warrior North Economics (55% Ethane Recovery)
(2)
31
0.0
200.0
400.0
600.0
800.0
1000.0
1200.0
0 200 400 600 800 1,000 1,200 1,400 1,600 1,800 0 10 20 30 40 50 60 Production Month 3rd Party YE16 Rex Upside Case 2017 DRAFT FRE 408 Settlement Communication; Not admissible for any purpose; For discussion purposes only
3rd Party YE17 LY=54 |
 Transportation & Marketing DRAFT FRE 408 Settlement Communication; Not admissible for any purpose; For discussion purposes only
|
 Appalachian Basin Takeaway 33 Natural Gas Currently selling natural gas in the Gulf Coast and Northeast local
markets (DOMSP & TETCO)
Natural Gas Liquids (NGLs)
NGL’s are currently being sold in domestic markets
Upon Mariner East 2 commencement, a portion of Rex
NGL’s will be sold into international
markets Ethane
Rex sells ethane into international and domestic ethane
markets Canada (Mariner West), Europe (Mariner East)
and Mt. Belview (ATEX)
Marcus
Hook
Mont Belvieu
Perryville, LA
Freeport LNG
DOMSP
LNG Exports
& Mont Belvieu
Ethane Sales
Ethane &
NGL
Exports
Sarnia, Canada
Ethane Exports
Ethane Markets
NGL Markets
Gas Markets
DRAFT
FRE 408 Settlement Communication; Not admissible for any purpose;
For discussion purposes only |
 Marketing Summary 34 Warrior North Acreage dedication to BlueRacer for gathering and processing Gas is currently being sold into Dominion South (Dominion) and to M2 (TETCO) Rex will have access to Rockies Express, Rover, Leech Express and NEXUS on an interruptible basis Condensate purchased by Marathon Butler (Legacy) Acreage dedication to MarkWest for gathering/processing/compression 285mcf/d of priority capacity rights Gas sold into Dominion South (Dominion) and to the Gulf Coast (Dominion/Texas Gas) 3 ethane markets – Canada (Mariner West), Europe (Mariner East), Gulf Coast (ATEX) Condensate purchased by Marathon Moraine East Acreage dedication to Stonehenge for gathering & compression Gathering, compression can be expanded to over 400mcf/d Tiered volume pricing structure & Tiered minimum volume commitment (MVC) Ability to bank vols to use towards MVC Acreage dedication to MarkWest for processing Gas sold into Dominion South (Dominion) and to the Gulf Coast (Dominion/Texas Gas) 3 ethane markets – Canada (Mariner West), Europe (Mariner East), Gulf Coast (ATEX) Condensate purchased by Marathon DRAFT FRE 408 Settlement Communication; Not admissible for any purpose; For discussion purposes only
|
 Butler/Moraine East Map 35 8” MarkWest Ethane Pipeline connecting to Mariner West Mariner West Ethane Pipeline ATEX Ethane Pipeline Mariner East Ethane Pipeline Dominion Transmission Residue Pipeline DRAFT FRE 408 Settlement Communication; Not admissible for any purpose; For discussion purposes only
|
 Warrior North Map 36 Berne Plant Rex Energy Acreage Natrium Plant TPL-7 DRAFT FRE 408 Settlement Communication; Not admissible for any purpose; For discussion purposes only
|
 Natural Gas LOE vs. Revenue Deduct 37 Dom South vs. Gulf Coast ($0.65) ($0.14) ($0.05) ($0.67) Basis (Variable) Transport (LOE) Basis (Fixed) Transport (LOE) NYMEX $3.00 NYMEX $3.00 $2.21 Net Realized Price $2.28 Net Realized Price Rex residue gas is split 50/50 between two primary markets:
Gulf Coast
130,000 Firm Transportation
$0.67 Average Rate
100,000 Gulf Coast transportation began 11/1/2016, remaining
30,000 came online 4/1/2017. Increase in
LOE’s/decrease in basis began at the end of 2016, incremental increase in LOE/decrease in basis in 04/2017 Full year of Gulf Coast transport LOE/reduced basis will be realized in 2018
2016 Differential ($0.92)/LOE ($1.58). 2017 Differential
(~$0.30)/LOE (~$1.79). Dom South
158,000 Firm Transportation
$0.14 Rate
DRAFT
FRE 408 Settlement Communication; Not admissible for any purpose;
For discussion purposes only |
 Rex/BP NGL Deal Summary Bluestone C3+ NGL Sale • Rex Energy to sell all C3+ NGL products (less ME2 INEOS commitments) out of the Mark
West Bluestone Facility to BP at improved net back pricing. Term
of the deal is January 2018 – March
2021. •
Based on historic NGL price fluctuations, the new improved NGL
fixed differentials should result in increased
revenue over the term of the deal. •
Fixed NGL differentials, eliminate the seasonality out of
pricing, while mitigating the timing of wells being
placed into sales. •
Opportunity to enhance net back pricing with a barrel exchange
agreement. Other Enhancements
• BP assumed credit requirements to Texas Gas Transmission on behalf of Rex Energy.
38
DRAFT
FRE 408 Settlement Communication; Not admissible for any purpose;
For discussion purposes only |
 Reserve Summary DRAFT FRE 408 Settlement Communication; Not admissible for any purpose; For discussion purposes only
|
 DRAFT FRE 408 Settlement Communication; Not admissible for any purpose; For discussion purposes only
Projected Reserves YE17 –
Aries Strip Runs
(1,2)
40
(1)
Strip Pricing as of 11.27.2017 –
Oil: 2018: $57.11, 2019: $53.93, 2020: $51.94, 2021: $50.72,
2022: $50.21// Gas: 2018: $2.95, 2019: $2.91, 2020: $2.87, 2021: $2.87, 2022: $2.88 (2) PV10 estimates do not include hedges NPV10 (MM$) Net Reserves (Bcfe) YE17 YE17 PDP $504,584 969 PNP $19,482 32 PUD $365,709 2,765 PROB $2,657 82 Total $892,432 3,848 YE17 Aries Strip Run contains Growth Plan development program along with ~$100MM net capital spend per year
program
until
2029.
Well
count
from
2021
–
2029
varies
from
18-26.
Most
wells
in
the
development
program
from
2021
–
2029
are
infills
that
are
already
proven
from
a
performance
standpoint. |
 DRAFT FRE 408 Settlement Communication; Not admissible for any purpose; For discussion purposes only
$307
$9
$98
$71
$-
$20
$0
Butler
West Lawr
Moraine East
Warrior North
Westmoreland
$503
$9
$229
$131
[CELLRANGE]
$20
[CELLRANGE]
Butler
West Lawr
Moraine East
Warrior North
Westmoreland
(1)
Strip Pricing as of 11.27.2017 –
Oil: 2018: $57.11, 2019: $53.93, 2020: $51.94, 2021: $50.72,
2022: $50.21// Gas: 2018: $2.95, 2019: $2.91, 2020: $2.87, 2021: $2.87, 2022: $2.88 Growth Plan NPV10 Strip (1) by Area ($MM) YE17 PDP Only Growth Plan Run (1) YE17 Total Growth Plan Run (1) 41 892 $MM 505 $MM |
 DRAFT FRE 408 Settlement Communication; Not admissible for any purpose; For discussion purposes only
(1)
Strip Pricing as of 11.27.2017 –
Oil: 2018: $57.11, 2019: $53.93, 2020: $51.94, 2021: $50.72,
2022: $50.21// Gas: 2018: $2.95, 2019: $2.91, 2020: $2.87, 2021: $2.87, 2022: $2.88 YE17 PDP Only Growth Plan Run (1) YE17 Total Growth Plan Run (1) 42 3,848 Bcfe Growth Plan Net Strip (1) Reserves by Area (Bcfe) 969 Bcfe 2,508 Bcfe 11 Bcfe 1,099 Bcfe 196 Bcfe 34 Bcfe Butler West Lawr Moraine East Warrior North Westmoreland 677 Bcfe 11 Bcfe 164 Bcfe 83 Bcfe 34 Bcfe [CELLRANGE] Butler West Lawr Moraine East Warrior North Westmoreland |
 DRAFT FRE 408 Settlement Communication; Not admissible for any purpose; For discussion purposes only
Growth Plan Reserves Data Sheet
43
Butler Legacy
Central
Butler Legacy
South
Moraine East
Warrior North
EUR (Bcfe)
21.3
21.7
13.0
6.8
EUR
(Mmboe)
3.6
3.6
2.2
1.1
%
Liquids
35%
28%
40%
49%
Lateral Length (ft.)
6,700
6,700
7,500
6,500
Well Cost ($MM)
$6.0
$6.0
$6.5
$6.8
Bcfe/1,000’
3.18
3.25
1.74
1.05
IRR @ Strip Pricing
31%
28%
21%
26%
IRR @ $3.00
gas / $60 oil
38%
34%
26%
35% |
 Reserves – Key Takeaways 44 Rex continues to unlock more potential in Legacy Butler, Moraine East and Warrior North
Performed completion study with third party engineering firm to
optimize frac designs for
improvement in IPs and EURs
Currently completing wells with next generation frac
designs in Moraine East and Legacy
Butler
Frye wells, which were completed using optimized design, present
a possibility of upside to current type curves;
Frye’s are currently producing at a higher gas rate on a per foot basis at lower chokes in comparison to other wells Warrior North completion study is currently ongoing As presented in production performance slides, there is possible upside to 2017 type curves in
the near future; many wells in Legacy Butler are above 2017 type
curves Longer laterals in the 2018 drilling program
present the opportunity to improve economics
Currently, Rex’s core assets are nearly fully delineated and
HBP’d, providing the opportunity to
concentrate drilling on the best performing locations to maximize
NPV. DRAFT
FRE 408 Settlement Communication; Not admissible for any purpose;
For discussion purposes only |
 Financial Strategy & Development Plan DRAFT FRE 408 Settlement Communication; Not admissible for any purpose; For discussion purposes only
|
 Financial Strategy 46 Increase cash flow in 2018 to achieve cash flow neutrality in 2019 and 2020 while still
achieving moderate growth (5% -
15%)
Utilize existing rig and completion contracts through current
terms while maintaining efficiencies and minimizing
termination fees Select highest return locations
while continuing to prove and exploit Moraine East
value
Optimize pad density, completion design and lateral length to
achieve strongest return Continue to optimize
existing production Continue strategy to improve key
operational matrix for the company Ability to access
capital markets DRAFT
FRE 408 Settlement Communication; Not admissible for any purpose;
For discussion purposes only |
 DRAFT FRE 408 Settlement Communication; Not admissible for any purpose; For discussion purposes only
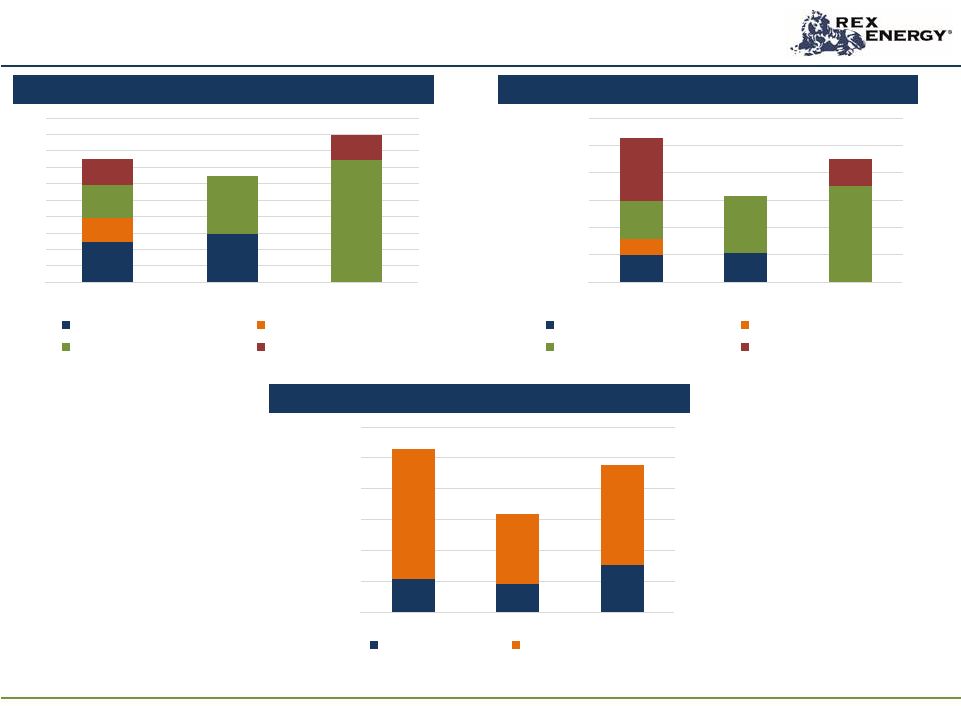
Growth Plan –
Well Activity
47
Well Count Breakdown by Asset Area
Drilling & Completion Capex Breakdown
Capex Breakdown by Asset Area
0 2 4 6 8 10 12 14 16 18 20 2018 2019 2020 Butler Legacy South Butler Legacy Central Moraine East Warrior North $0 $20,000,000 $40,000,000 $60,000,000 $80,000,000 $100,000,000 $120,000,000 2018 2019 2020 Butler Legacy South Butler Legacy Central Moraine East Warrior North $0 $20,000,000 $40,000,000 $60,000,000 $80,000,000 $100,000,000 $120,000,000 2018 2019 2020 Drilling Completions |
 DRAFT FRE 408 Settlement Communication; Not admissible for any purpose; For discussion purposes only
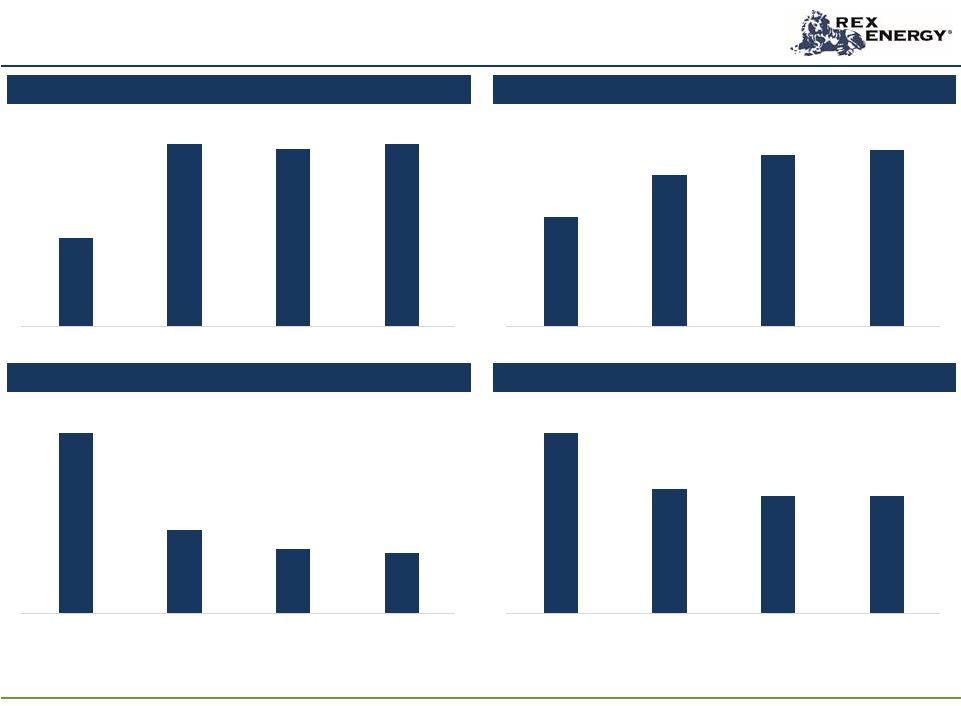
Growth Plan Key Metrics: 2017 –
2020
48
EBITDAX Growth ($MM)
LOE/Mcfe
184.1
255.2
288.5
297.3
2017
2018
2019
2020
$1.79
$1.58
$1.54
$1.53
2017
2018
2019
2020
$0.26
$0.18
$0.17
$0.17
2017
2018
2019
2020
$59.2
$123.0
$119.4
$123.0
2017
2018
2019
2020
Production Growth (Mmcfe/d)
Cash G&A/Mcfe |
 Financial Projections – Growth Plan 49 2017A 2018E 2019E 2020E Average Daily Production (Mmcfe/d) 184.1 255.2 288.5 297.3 % Liquids Production 38% 45% 46% 46% Key Metrics EBITDAX (000s) $59,176 $122,994 $119,350 $122,968 LOE/Mcfe $1.79 $1.58 $1.54 $1.53 G&A/Mcfe $0.26 $0.18 $0.17 $0.17 Development Plan CAPEX (000s) $133,484 $114,741 $68,469 $95,383 Commodity Price Assumptions Oil $49.97 $56.25 $54.25 $54.00 Natural Gas $3.11 $2.88 $2.80 $2.80 Dominion South Basis Differential ($0.88) ($0.58) ($0.53) ($0.55) C3+ NGLs (% of NYMEX) 62% 58% 52% 52% Cash balance as of December 31, 2017 is $15.2 million. Assumes sale of Westmoreland Non-Op Assets in 2018; estimated annual EBITDAX contribution of $3.5 million.
Term Loan balance as of December 31, 2017 totaled approximately
$189.5 million. Assumes deleveraging
transaction. DRAFT
FRE 408 Settlement Communication; Not admissible for any purpose;
For discussion purposes only |
 Financial Projections – Reduced Plan 2017A 2018E 2019E 2020E Average Daily Production (Mmcfe/d) 184.1 259.6 255.1 264.8 % Liquids Production 38% 44% 44% 44% Key Metrics EBITDAX (000s) $59,176 $124,841 $96,719 $107,087 LOE/Mcfe $1.79 $1.56 $1.60 $1.56 G&A/Mcfe $0.26 $0.18 $0.19 $0.19 Development Plan CAPEX (000s) $133,484 $69,590 $67,250 $69,953 Commodity Price Assumptions Oil $49.97 $56.25 $54.25 $54.00 Natural Gas $3.11 $2.88 $2.80 $2.80 Dominion South Basis Differential ($0.88) ($0.58) ($0.53) ($0.55) 50 Cash balance as of December 31, 2017 is $15.2 million. Term Loan balance as of December 31, 2017 totaled approximately $189.5 million.
Assumes deleveraging transaction.
DRAFT
FRE 408 Settlement Communication; Not admissible for any purpose;
For discussion purposes only |
 Opportunities and Risks 51 Opportunities and Risks to Plan Achievement Opportunities Risks Most recent base production has exceeded production profile Recent well performance has exceeded current type- curves Continue to drive procurement efficiencies by bundling services and driving competition Maximize efforts to mitigate legacy production declines Continue to employ efficient and lean overhead operations Financial flexibility allows for acceleration while HBP status allows for maximum capital efficiency Commodity prices, ability to participate in improved price environment Ability to access capital markets Availability and consistency of service crews when not running a full 12-month development program Performance and efficiency of processing and midstream operations Commodity prices and ability to hedge at attractive levels
Access to capital markets/ability to refinance delayed
draw term loan
Retaining technical staff and continuity of internal
resources
DRAFT
FRE 408 Settlement Communication; Not admissible for any purpose;
For discussion purposes only |
 Appendix: Hedge Positioning DRAFT FRE 408 Settlement Communication; Not admissible for any purpose; For discussion purposes only
|
 Hedge Position (1) 0% 10% 20% 30% 40% 50% 60% 70% 80% 90% 100% Natural Gas Oil & Condensate C2 C3+ NGLs Consolidated 2018 2019 2020 Avg. Floor: $2.97 Avg. Floor: $2.73 Avg. Floor: $47.68 Avg. Floor: $47.15 Avg. Floor: $12.93 Avg. Floor: $12.90 Avg. Floor: $33.30 Avg. Floor: $26.15 Avg. Floor: $2.70 Avg. Floor: $52.88 Avg. Floor: $12.79 Avg. Floor: $31.16 (1) Hedging position as of 1/1/2018; percent hedged based on PDP
53
64%
60%
37%
DRAFT
FRE 408 Settlement Communication; Not admissible for any purpose;
For discussion purposes only |